Attached files
| file | filename |
|---|---|
| 8-K - FORM 8-K - Knight-Swift Transportation Holdings Inc. | d337378d8k.htm |
Exhibit 99

April 19, 2012
Dear Fellow Stockholders,
A summary of our key results for the first quarter is shown below:
| Three Months Ended March 31, | ||||||||||||
| 2012 | 2011 | 2010 | ||||||||||
| Unaudited | ||||||||||||
| ($ in millions, except per share data) | ||||||||||||
| Operating Revenue |
$ | 826.9 | $ | 758.9 | $ | 654.8 | ||||||
| Net Revenue1 |
$ | 664.2 | $ | 621.1 | $ | 566.0 | ||||||
| Operating Ratio |
93.0 | % | 93.8 | % | 96.5 | % | ||||||
| Adjusted Operating Ratio2 |
90.5 | % | 91.8 | % | 93.5 | % | ||||||
| EBITDA |
$ | 92.3 | $ | 102.3 | $ | 89.1 | ||||||
| Adjusted EBITDA2 |
$ | 115.5 | $ | 104.7 | $ | 90.3 | ||||||
| Diluted EPS |
$ | 0.04 | $ | 0.02 | $ | (0.88 | ) | |||||
| Adjusted EPS2 |
$ | 0.14 | $ | 0.06 | $ | (0.38 | ) | |||||
| 1 | Net Revenue is operating revenue, excluding fuel surcharge revenue |
| 2 | See GAAP to Non-GAAP reconciliation in the schedules following this letter |
Q1 2012 Highlights (discussed in more detail below, including GAAP to non-GAAP reconciliations):
| • | Adjusted EPS of $0.14 versus $0.06 in the first quarter of 2011 |
| • | Revenue growth of 9.0% year over year (6.9% excluding fuel surcharges) |
| • | Intermodal revenue growth of 44.8% year over year (excluding dray revenue) |
| • | Planned Q1 temporary fleet reduction of 4% yielding expected results of improved utilization and deadhead |
| • | Pricing improvements of 3.5% year over year in trucking services in-line with our previous guidance of 3 – 4% for full year 2012 |
| • | Weekly Trucking Revenue per Tractor improved 6.7% year over year |
| • | Adjusted Operating Ratio (“OR”) improved year over year in nine of the last ten quarters |
| • | Realized first quarter Adjusted EBITDA of $115.5 million |
| • | Higher expenses associated with preparation of trucks for trade-in or sale and adverse prior year claims development offset by gain relating to a contractual settlement and gains on the disposal of equipment |
| • | Debt repayments and multiple changes to debt structure yielding interest savings of $17.5 million on annualized basis, with $14.9 million expected to be realized in 2012 |
| • | Net leverage ratio reduced to 3.05:1.00 at March 31, 2012 from 3.17:1.00 at December 31, 2012 |

|
Guidance Contained within Stockholder Letter
| • | Truckload pricing expected to improve 3 – 4% for the full year of 2012 |
| • | Sequentially, average total operating fleet expected to grow by approximately 100-200 units in the second quarter, with similar growth in the third quarter, and the fourth quarter remaining relatively flat to the third quarter |
| • | Gains on disposal of equipment expected to be in the range of $3.0 million for each quarter for the remainder of the year |
| • | Full year 2012 net cash capital expenditures may vary from the previous guidance of $250 million due to various factors, as detailed in the “Cash Flow and Capital Expenditures” section |
| • | Interest expense, excluding derivative interest expense, projected to be $122.1 million for fiscal year 2012 (based on Pro Forma March 31, 2012 debt balances and LIBOR rates) |
| • | Net leverage ratio target of 2.80 – 2.90 by December 31, 2012 |
Earnings Overview
We are proud to announce that Swift Transportation Company (NYSE: SWFT) realized adjusted diluted earnings per share, or Adjusted EPS, of $0.14 for the first quarter ended March 31, 2012, compared to $0.06 per share in the same quarter of 2011. GAAP diluted earnings per share for the first quarter of 2012 and 2011 was $0.04 and $0.02, respectively.
A reconciliation of GAAP results to non-GAAP results, as adjusted to exclude certain non-cash or special items, is provided in the schedules following this letter. For the first quarter of 2012, GAAP results include a loss on debt extinguishment of $20.9 million, before tax, resulting from the replacement of our $874.0 million term loan with a new $200.0 million term loan B-1 tranche and a $674.0 million term loan B-2 tranche on March 6, 2012. This charge represents the write-off of the remaining unamortized portion of original issue discount and deferred financing fees associated with the original term loan.
We are also pleased to announce that on April 18, 2012 we completed the first amendment to our Amended and Restated Credit Agreement which reduced the pricing and extended the maturity of the revolving credit facility. Additionally, on April 17th, we made voluntary prepayments of $26.3 million on the B-1 tranche and $23.9 million on the B-2 tranche of our term loan with proceeds from our accounts receivables facility and a $10 million expansion of the B-1 tranche. More information about the amendment, prepayment and the replacement of the first lien term loan announced earlier in March is included below in the Interest Expense and Debt Balance section.
During the first quarter of 2012, total revenue increased 9.0% to $826.9 million and Net Revenue increased 6.9% to $664.2 million compared to the same quarter of 2011. As explained in more detail below, expansion in intermodal and pricing improvements in the trucking business were the primary growth drivers year over year.
Our Adjusted Operating Ratio for the first quarter of 2012 improved 130 bps to 90.5% for the first quarter of 2012 from 91.8% for the first quarter of 2011. Our ongoing focus on discipline, safety, service, and execution has enabled us to realize year over year improvements in Adjusted Operating Ratio for nine of the past ten quarters. Additionally, this improvement is somewhat diluted considering the high growth of our asset light business, which carries a higher operating ratio, although a better return on net assets.
|
|
2 |
In the first quarter of 2012, we achieved Adjusted EBITDA of $115.5 million, which is a $10.8 million improvement over the first quarter of 2011. These encouraging results were primarily driven by year over year improvements in several of our key operating metrics; pricing, loaded utilization and deadhead percentage. In addition to these operational improvements, we had a $4.4 million gain on the disposal of equipment and a $5.2 million gain from the favorable settlement with the Port of Los Angeles in the quarter. These positive items were partially offset by a $1.8 million increase in the cost to prepare tractors for trade-in or sale and a $6.7 million charge due to adverse development of prior year claims, primarily from 2006 and 2007. These trends and others are explained throughout the remainder of this letter.
Trucking Revenue and Metrics
A summary of our year over year trends for the first quarter associated with our truckload service offerings are as follows:
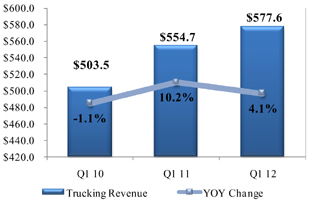
| Trucking Revenue ($ millions)
|
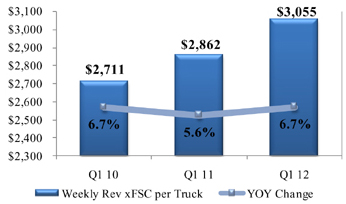
Weekly Trucking Revenue per Tractor | |
|
|
Trucking Revenue, which excludes fuel surcharge revenue, increased 4.1% to $577.6 million in the first quarter of 2012 compared to the same quarter in 2011, but more importantly, our Weekly Trucking Revenue per Tractor of $3,055 improved 6.7% year over year. This improvement was driven by a 3.5% increase in our trucking revenue per loaded mile, excluding fuel surcharges and a 3.1% increase in our loaded miles per truck per week. The consolidated utilization improvement is encouraging, given the continued shift in business mix from over-the-road linehaul service to dedicated regional service (which generally results in fewer loaded miles per truck on a weekly basis).
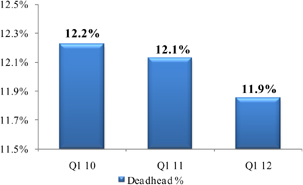
Deadhead Percentage
Another key statistic that directly impacts profitability is deadhead percentage, which represents the percent of total miles driven without revenue generating freight being transported. The adjacent chart illustrates our continued improvement in this measure. We achieved 11.9% deadhead for the first quarter of 2012, which represents 20 and 30 bps reductions from the first quarter of 2011 and 2010, respectively. These improvements are due to our reduced truck count in the quarter as well as proactively managing our network. As discussed in previous quarters, we have appointed network engineers that focus their teams on loading trucks where they land and minimizing unpaid repositioning. Our network engineers are continuing to develop tools to further streamline our processes.
|
|
3 |
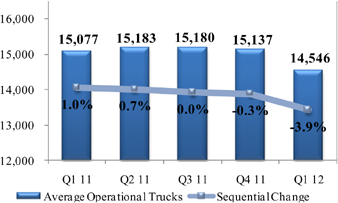
Finally, the sequential trend of our average operational truck count is shown below:
Average Operational Truck Count
Our average operational truck count was reduced by 3.9% to 14,546 during the first quarter 2012 compared to 15,137 during the fourth quarter of 2011. As discussed in our fourth quarter letter to stockholders, this was a planned reduction to coincide with the soft seasonal demand patterns we traditionally experience in the first quarter. This reduction was achieved by continuing our normal trade cycle, but delaying the purchase of new equipment and the hiring of drivers. Our loaded utilization (loaded miles per truck per week) in our over-the-road linehaul service offering improved in the first quarter of 2012 by 116 miles per week when compared to the first quarter of 2011. In addition, the deadhead percent in our over-the-road linehaul service offering improved 40 basis points from the first quarter of 2011 to 2012. We believe the planned fleet reduction played a significant role in both of these improvements.
We will continue to closely monitor the size of both our company and owner-operator fleet, and plan to grow them in conjunction with increases in customer demand. It is our goal to continue to improve the utilization of our current assets. As discussed last quarter, we anticipate continued growth in our Mexican subsidiary for the remainder of the year. For the second quarter, we anticipate our average total operational fleet to increase between 100 and 200 units, with similar growth in the third quarter. The fourth quarter should remain relatively flat to the third quarter.
Other Revenue
($ in millions)
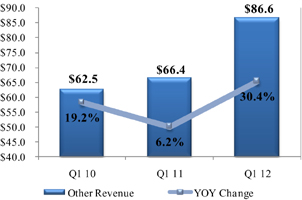
Other Revenue includes revenue generated by our intermodal and brokerage services, excluding the revenue associated with dray or other truck moves performed by Swift (which are recorded in our trucking revenue), as well as revenue generated by our subsidiaries offering services to customers and owner-operators, including shop maintenance, equipment leasing, and insurance. In the first quarter of 2012, Other Revenue increased 30.4% compared to the same quarter in 2011 driven primarily by growth in intermodal.
|
|
4 |
Our intermodal business is a combination of two different service offerings, container on flat car (“COFC”) and trailer on flat car (“TOFC”). These two service offerings combine to represent approximately 60% of our Other Revenue line item. In the first quarter of 2012, our COFC revenue has continued its positive growth trends, with 36.1% growth in revenue over the first quarter of 2011. As we discussed in previous earnings releases, we made a conscious decision to reduce our TOFC business during the first half of 2011, in order to remove underperforming lanes, with the intent to add more profitable TOFC business throughout the year. As a result of our efforts we are pleased to report that TOFC revenue increased 130.8% this quarter when compared to the first quarter of 2011. Despite this significant growth, our TOFC offering still remains a very small portion of our Other Revenue.
Finally, we were successful in providing additional ancillary services to our customers and owner-operators to meet their first quarter demands. Revenue from these services increased approximately 12% in the first quarter of 2012 compared to the first quarter of 2011.
Operating Expenses
The table below highlights some of our cost categories for the first quarter of 2012 compared to the first quarter of 2011 and the fourth quarter of 2011, showing each as a percent of Net Revenue, which excludes fuel surcharge revenue. Fuel surcharge revenue can be volatile and is primarily dependent upon the cost of fuel and not specifically related to our non-fuel operational expenses. Therefore, we believe that Net Revenue is a better measure for analyzing our expenses and operating metrics.
| YOY | QOQ | |||||||||||||||||||||||
| Q1 ‘12 |
Q1 ‘11 | Variance1 | ($ in millions) | Q1 ‘12 | Q4 ‘11 | Variance1 | ||||||||||||||||||
| $ | 826.9 | $ | 758.9 | 9.0 | % | Total Revenue | $ | 826.9 | $ | 860.7 | -3.9 | % | ||||||||||||
| (162.7 | ) | (137.8 | ) | 18.1 | % | Less: Fuel Surcharge Revenue | (162.7 | ) | (165.4 | ) | -1.7 | % | ||||||||||||
|
|
|
|
|
|
|
|
|
|||||||||||||||||
| $ | 664.2 | $ | 621.1 | 6.9 | % | Net Revenue | $ | 664.2 | $ | 695.3 | -4.5 | % | ||||||||||||
|
|
|
|
|
|
|
|
|
|
|
|
|
|||||||||||||
| $ | 200.1 | $ | 195.5 | -2.4 | % | Salaries, Wages & Benefits | $ | 200.1 | $ | 194.8 | -2.7 | % | ||||||||||||
| 30.1 | % | 31.5 | % | 140 | bps | % of Net Revenue | 30.1 | % | 28.0 | % | -210 | bps | ||||||||||||
| $ | 55.0 | $ | 57.1 | 3.6 | % | Operating Supplies & Expenses | $ | 55.0 | $ | 60.5 | 9.1 | % | ||||||||||||
| 8.3 | % | 9.2 | % | 90 | bps | % of Net Revenue | 8.3 | % | 8.7 | % | 40 | bps | ||||||||||||
| $ | 30.6 | $ | 22.7 | -34.6 | % | Insurance & Claims | $ | 30.6 | $ | 23.2 | -31.7 | % | ||||||||||||
| 4.6 | % | 3.7 | % | -90 | bps | % of Net Revenue | 4.6 | % | 3.3 | % | -130 | bps | ||||||||||||
| $ | 6.2 | $ | 6.5 | 3.3 | % | Communication & Utilities | $ | 6.2 | $ | 6.4 | 2.2 | % | ||||||||||||
| 0.9 | % | 1.0 | % | 10 | bps | % of Net Revenue | 0.9 | % | 0.9 | % | 0 | bps | ||||||||||||
| $ | 15.9 | $ | 15.3 | -4.2 | % | Operating Taxes & Licenses | $ | 15.9 | $ | 14.8 | -7.6 | % | ||||||||||||
| 2.4 | % | 2.5 | % | 10 | bps | % of Net Revenue | 2.4 | % | 2.1 | % | -30 | bps | ||||||||||||
| 1 | Positive numbers represent favorable variances, negative numbers represent unfavorable variances |
Salaries wages and benefits increased $4.6 million, or 2.4%, to $200.1 million during the first quarter ending March 31, 2012 compared to $195.5 million for the first quarter ending March 31, 2011. The year over year increase in expense was primarily driven by increases in our health care costs and the number of non-driving employees. As a percent of Net Revenue, salaries, wages and benefits decreased 140 basis points due to growth in our intermodal business and the percentage of miles driven by owner-operators, for which the costs are included in purchased transportation. Sequentially, salaries, wages and benefits increased $5.3 million from $194.8 million primarily triggered by favorable actuarial adjustments in workers compensation expense in the fourth quarter of 2011.
|
|
5 |
Operating supplies and expenses decreased year over year by $2.1 million, and sequentially by $5.5 million. These improvements were primarily driven by the previously mentioned settlement with the Port of Los Angeles (“Port”), partially offset by the increase in maintenance expense associated with the preparation of trucks for trade or sale. In 2008, we and several other carriers entered into incentive agreements with the Port to provide trucks meeting 2007 EPA standards to service the Port in exchange for certain performance incentives designed to help offset the ongoing expense associated with operating at the Port. Due to the claw-back provisions contained in the incentive agreement, in 2008 we recorded the incentives received as a deferred revenue liability on the balance sheet and recognized revenue over the term of the agreement as the performance incentives were earned. In March of 2012, we settled various contractual disputes with the Port which required us to repay $4.0 million of the remaining $9.2 million liability in exchange for terminating the agreements and releasing us from future incentive requirements, including the remaining claw-back provisions. This resulted in a gain of $5.2 million in the first quarter of 2012.
Insurance and claims expense in the first quarter of 2012 increased $7.9 million compared to the first quarter of 2011 and was 4.6% of Net Revenue. This increase was largely due to an increase in reserves associated with unfavorable development on our prior year loss layers based on new information received on these prior year claims, the majority of which related to two claims from 2006 and 2007. Sequentially, insurance and claims expense increased $7.4 million from the fourth quarter of 2011 driven by the unfavorable developments of prior year claims in this quarter compared to favorable developments on prior years claims experienced in the fourth quarter. Additionally, as we have previously discussed, our insurance and claims expense has two primary components; 1) accruals for claims incurred in the current year and 2) adjustments to accruals made for prior year claims based on the development of those claims, which could be favorable or unfavorable. The accruals for the current year loss layer are based on actuarial models developed using our claims experience over many years. As claims are reported and develop over the course of a year, our current year loss layer is adjusted based on both our historical claims experience and our current year claims experience. In years where our actual current year claims development is better than the actuarial assumptions used to develop the current year loss layer at the beginning of the year, we typically incur higher expense in the first part of the year and lower expense in the second part as the actuarial models incorporate our actual current year development toward the end of the year. In years where actual current year claims development is worse than the actuarial assumptions, the opposite is true.
Fuel Expense
Fuel expense for the first quarter 2012 was $153.0 million or an increase of 1.8% over the first quarter of 2011. We collect fuel surcharge revenue from our customers to help mitigate the increases in fuel prices, as measured through the Department of Energy (D.O.E.) Diesel Fuel Index. We utilize a portion of our fuel surcharge revenue to reimburse owner-operators and other third parties, such as the railroads, who also must pay for fuel. To evaluate the effectiveness of our fuel surcharges, we deduct the portion we pay to third parties, and then subtract the remaining company-related fuel surcharge revenue from our fuel expense. This calculation is shown below:
|
|
6 |
| Q1 ‘12 |
Q1 ‘11 | ($ in millions, except D.O.E Diesel Fuel Index) | Q1 ‘12 | Q4 ‘11 | ||||||||||||
| $ | 153.0 | $ | 150.3 | Fuel Expense | $ | 153.0 | $ | 153.0 | ||||||||
| 18.5 | % | 19.8 | % | % of Total Revenue | 18.5 | % | 17.8 | % | ||||||||
| $ | 162.7 | $ | 137.8 | Fuel Surcharge Revenue (FSR) | $ | 162.7 | $ | 165.4 | ||||||||
| (67.1 | ) | (50.8 | ) | Less: FSR Reimbursed to Third Parties | (67.1 | ) | (67.0 | ) | ||||||||
|
|
|
|
|
|
|
|
|
|||||||||
| $ | 95.6 | $ | 87.0 | Company Fuel Surcharge Revenue | $ | 95.6 | $ | 98.5 | ||||||||
|
|
|
|
|
|
|
|
|
|||||||||
| $ | 153.0 | $ | 150.3 | Fuel Expense | $ | 153.0 | $ | 153.0 | ||||||||
| (95.6 | ) | (87.0 | ) | Less: Company FSR | (95.6 | ) | (98.5 | ) | ||||||||
|
|
|
|
|
|
|
|
|
|||||||||
| $ | 57.4 | $ | 63.3 | Net Fuel Expense | $ | 57.4 | $ | 54.6 | ||||||||
|
|
|
|
|
|
|
|
|
|||||||||
| 8.6 | % | 10.2 | % | % of Net Revenue | 8.6 | % | 7.8 | % | ||||||||
| $ | 3.960 | $ | 3.607 | Average D.O.E. Diesel Fuel Index | $ | 3.960 | $ | 3.868 | ||||||||
| 9.8 | % | 26.4 | % | Year over Year % Change | 9.8 | % | 23.0 | % | ||||||||
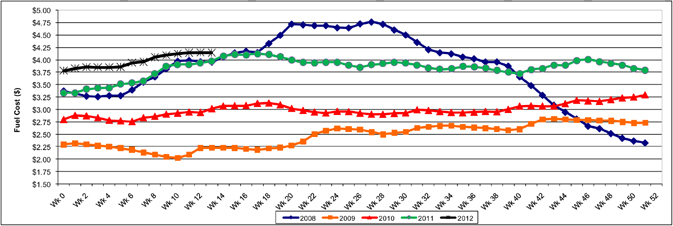
Net Fuel Expense decreased $5.9 million for the first quarter of 2011 to $57.4 million from the first quarter of 2012. This decrease was primarily due to the steeper increase in fuel prices throughout the first quarter of 2011 when compared with 2012. The Average DOE Diesel Fuel Index, which is set each week based on retail prices at various truck stops around the country and is the basis for our fuel surcharges, increased 18.0% within the first quarter of 2011, from $3.33 to $3.93, but only 9.5% within the first quarter of 2012, from $3.78 to $4.14. As we have discussed previously, in periods of rising prices, we are negatively impacted due to the structural lag in billing fuel surcharges. We bill based on the DOE average for the prior week but we pay on current day prices. Another contributing factor to the year over year improvement in Net Fuel Expense was improved weather this year versus last year resulting in less engine idle time.
Sequentially, Net Fuel Expense increased $2.8 million from $54.6 million in the fourth quarter of 2011 to $57.4 million in the first quarter of 2012 despite a reduction in miles driven by our company fleet. This increase was primarily due to the increase in fuel prices in the first quarter of 2012 discussed above. Historical fuel prices are shown in the graph below:
Department of Energy Diesel Fuel Index
|
|
7 |
Purchased Transportation
Purchased transportation includes payments to owner-operators, railroads and other third parties we use for intermodal drayage and other brokered business. In the first quarter of 2012, this expense increased $39.2 million over the first quarter of 2011. A portion of the payments made to our partners is for fuel reimbursements; this portion represents $16.3 million of the year over year increase reflecting the increase in diesel prices discussed above.
| Q1 ‘12 |
Q1 ‘11 | ($ in millions) | Q1 ‘12 | Q4 ‘11 | ||||||||||||
| $ | 233.2 | $ | 194.0 | Purchased Transportation | $ | 233.2 | $ | 237.0 | ||||||||
| 28.2 | % | 25.6 | % | % of Total Revenue | 28.2 | % | 27.5 | % | ||||||||
| (67.1 | ) | (50.8 | ) | Less: FSR Reimbursed to Third Parties | (67.1 | ) | (67.0 | ) | ||||||||
| $ | 166.1 | $ | 143.3 | Net Purchased Transportation | $ | 166.1 | $ | 170.0 | ||||||||
| 25.0 | % | 23.1 | % | % of Net Revenue | 25.0 | % | 24.4 | % | ||||||||
Excluding fuel reimbursements, Net Purchased Transportation increased $22.8 million year over year as a result of an increase in miles driven by owner-operators and an increase in intermodal volumes. As a percent of Net Revenue, Net Purchased Transportation increased by 190 bps year over year. This was due to an increase in owner-operator and intermodal miles, partially offset by the 3.5% increase in trucking revenue per loaded mile. Sequentially, Net Purchased Transportation decreased $3.9 million due to seasonal trends.
Rental Expense and Depreciation & Amortization of Property and Equipment
Due to fluctuations in the amount of tractors leased versus owned, we combine our rental expense with depreciation and amortization of property and equipment for analytical purposes as shown in the table below:
| Q1 ‘12 |
Q1 ‘11 | ($ in millions) | Q1 ‘12 | Q4 ‘11 | ||||||||||||
| $ | 23.5 | $ | 18.0 | Rental Expense | $ | 23.5 | $ | 20.9 | ||||||||
| 3.5 | % | 2.9 | % | % of Net Revenue | 3.5 | % | 3.0 | % | ||||||||
| $ | 50.4 | $ | 50.4 | Depreciation & Amortization of Property and Equipment | $ | 50.4 | $ | 51.2 | ||||||||
| 7.6 | % | 8.1 | % | % of Net Revenue | 7.6 | % | 7.4 | % | ||||||||
| $ | 73.9 | $ | 68.3 | Combined Rental Expense and Depreciation | $ | 73.9 | $ | 72.1 | ||||||||
| 11.1 | % | 11.0 | % | % of Net Revenue | 11.1 | % | 10.4 | % | ||||||||
|
|
8 |
Combined rental and depreciation expense in the first quarter of 2012 increased $5.6 million to $73.9 million from the first quarter of 2011, but has remained relatively flat as a percent of Net Revenue. The increased cost is due to the rising costs of new equipment, the growth in the number of units leased to owner-operators through our Interstate Equipment Leasing (“IEL”) subsidiary, and growth in trailers and intermodal containers.
As mentioned earlier, total truck count has decreased slightly from the fourth quarter of 2012 due to the planned reduction of trucks to match the traditionally soft seasonal first quarter freight demand. Total equipment counts are shown below:
| 3/31/2012 | 12/31/2011 | 3/31/2011 | ||||||||||
| Tractors: |
||||||||||||
| Company |
||||||||||||
| Owned |
6,198 | 6,799 | 6,683 | |||||||||
| Leased — operating leases |
2,890 | 2,611 | 2,378 | |||||||||
| Leased — capital leases |
2,582 | 2,457 | 3,050 | |||||||||
|
|
|
|
|
|
|
|||||||
| Total company tractors |
11,670 | 11,867 | 12,111 | |||||||||
|
|
|
|
|
|
|
|||||||
| Owner-operator |
||||||||||||
| Financed through the Company |
2,939 | 3,016 | 2,768 | |||||||||
| Other |
1,027 | 1,019 | 1,197 | |||||||||
|
|
|
|
|
|
|
|||||||
| Total owner-operator tractors |
3,966 | 4,035 | 3,965 | |||||||||
|
|
|
|
|
|
|
|||||||
| Total tractors |
15,636 | 15,902 | 16,076 | |||||||||
|
|
|
|
|
|
|
|||||||
| Trailers |
51,031 | 50,555 | 49,366 | |||||||||
|
|
|
|
|
|
|
|||||||
| Containers |
6,424 | 6,210 | 5,042 | |||||||||
|
|
|
|
|
|
|
|||||||
Gain on Disposal of Property and Equipment
Gain on disposal of property and equipment was $4.4 million in the first quarter of 2012 compared to $2.3 million in the first quarter of 2011. In executing our goal of downsizing the fleet in the first quarter in conjunction with seasonal demand, we disposed of over 900 company tractors in the first quarter of 2012, four times the number processed in the first quarter of 2011. A large number of these trucks were covered by trade agreements with the manufacturers and would typically yield minimal gains. However, due to the strength of the used truck market, we sold a portion of these trucks through other channels, resulting in larger than expected gains. Future gains and losses will depend on the used truck market, our contracts with manufacturers, and our disposition volumes for tractors and trailers, both of which can vary depending on freight demand. Although this line item is difficult to predict, based on our current expectations for the method and number of dispositions this year, which are currently expected to remain heavy, we expect gains to remain elevated and could be in the range of $3.0 million each quarter for the remainder of the year.
|
|
9 |
Interest Expense and Debt Balances
Interest expense, comprised of cash interest expense and the amortization of deferred financing costs and original issue discount, decreased $4.7 million in the first quarter of 2012 to $32.8 million, compared to the first quarter of 2011. The decrease was largely due to the continued reduction in debt balances throughout 2011 and our $60.0 million voluntary prepayment on our first lien term loan, made in January 2012. In addition, on March 6, 2012 we entered into an Amended and Restated Credit Agreement, which replaced our remaining $874.0 million face value first lien term loan, priced at L + 450bps with a 1.50% LIBOR floor, with a $200.0 million term loan B-1, priced at L+375 bps with no LIBOR floor, and a $674.0 million term loan B-2, priced at L + 375 bps with a 1.25% LIBOR floor. Further, on April 18, we completed the first amendment to our Amended and Restated Credit Agreement (“First Amendment”) which reduced the pricing and extended the maturity of our revolving credit facility. The rate for borrowings and letters of credit on the revolving credit facility has been reduced from L + 450 bps to L + 325 bps, and the commitment fee has been reduced from 62.5 bps to 50 bps.
Also in April, we exercised a $10.0 million accordion to increase the term loan B-1 tranche and increased the amount borrowed on the A/R securitization facility by $42.0 million. These proceeds were used to make a $26.3 million voluntary prepayment on the term loan B-1 tranche and a $23.9 million voluntary prepayment on the term loan B-2 tranche. The net result of these transactions is a reduced effective borrowing cost and the elimination of the scheduled prepayments on the term loan B-1 tranche through June 2013 and on the B-2 tranche through September 2015. A table of the face value of our debt balances as of December 31, 2011, March 31, 2012 actual and pro forma for the changes in April discussed above is shown below (in millions).
| Dec. 31, | Mar. 31, | Apr. | ||||||||||||||||||||||||||
| 2011 | Q1 2012 | Other Q1 | 2012 | 2012 | ||||||||||||||||||||||||
| Rates | Maturity | Actual | Payments | Changes | Actual | Changes | Pro Forma | |||||||||||||||||||||
| A/R Securitization |
CP + 125 | Jun 2014 | $ | 180.0 | $ | (17.0 | ) | $ | — | $ | 163.0 | $ | 42.0 | $ | 205.0 | |||||||||||||
| Revolver ($400mm)(1) |
Libor + 325, 50 unused | Sep 2016 | — | — | — | — | — | — | ||||||||||||||||||||
| Old Term Loan B |
Libor + 450, 150 Floor | Dec 2016 | 934.4 | (60.4 | ) | (874.0 | ) | — | — | — | ||||||||||||||||||
| New Term Loan B-1 |
Libor + 375 | Dec 2016 | — | — | 200.0 | 200.0 | (16.3 | ) | 183.7 | |||||||||||||||||||
| New Term Loan B-2 |
Libor + 375, 125 Floor | Dec 2017 | — | — | 674.0 | 674.0 | (23.9 | ) | 650.1 | |||||||||||||||||||
| Senior Secured 2nd Lien Notes |
10.00% | Nov 2018 | 500.0 | — | — | 500.0 | 500.0 | |||||||||||||||||||||
| Capital Leases & Other Debt |
Various | Various | 157.0 | — | 7.3 | 164.3 | 164.3 | |||||||||||||||||||||
|
|
|
|
|
|
|
|
|
|
|
|
|
|||||||||||||||||
| Total Secured Debt |
$ | 1,771.4 | $ | (77.4 | ) | $ | 7.3 | $ | 1,701.3 | $ | 1.8 | $ | 1,703.1 | |||||||||||||||
| Fixed Rate Notes |
12.50% | May 2017 | 15.6 | (0.4 | ) | — | 15.2 | 15.2 | ||||||||||||||||||||
|
|
|
|
|
|
|
|
|
|
|
|
|
|||||||||||||||||
| Total Debt |
$ | 1,787.0 | $ | (77.8 | ) | $ | 7.3 | $ | 1,716.6 | $ | 1.8 | $ | 1,718.4 | |||||||||||||||
| Letters of Credit(1) |
3.25% | 167.5 | — | (5.3 | ) | 162.2 | 162.2 | |||||||||||||||||||||
| Annualized cash interest expense based on period end debt balances(2) |
$ | 131.5 | $ | 117.7 | $ | 114.0 | ||||||||||||||||||||||
| 2012 cash interest expense based on 3/31/12 Pro Forma balances |
$ | 116.6 | ||||||||||||||||||||||||||
| 2012 non-cash interest expense as of each respective period end(3) |
$ | 7.6 | $ | 5.5 | ||||||||||||||||||||||||
| (1) | Pricing on the revolving credit facilit6y prior to April 18, 2012 was Libor + 450 bps with an unused fee of 62.5 bps and letter of credit fees of 450 bps |
| (2) | Assumes LIBOR and commercial paper (CP) rates of 50bps |
| (3) | Includes amortization of deferred financing costs and original issue discount; does not include amortization associated with terminated interest rate swaps |
The combination of the January 2012 prepayment, the term loan replacement transaction, the First Amendment, and the April debt changes described above is expected to reduce our annualized cash interest expense by approximately $17.5 million of which $14.9 million is expected to be realized during fiscal year 2012, assuming LIBOR rates and debt balances remain constant.
The replacement of the first lien term loan caused a loss on debt extinguishment of $20.9 million in the first quarter of 2012 resulting from the write-off of the unamortized original issue discount (OID) and deferred financing costs associated with the original term loan in December 2010. We incurred new OID and deferred financing costs associated with the new term loan B-1, term loan B-2, and First Amendment totaling approximately $9.0 million. These new costs will be amortized over the new maturities of the respective term loan B-1, term loan B-2, and revolving credit facility, but the net result is expected to be a reduction of non-cash interest expense of approximately $2.1 million in 2012.
|
|
10 |
Income Taxes
Income tax in accordance with GAAP for the first quarter of 2012 was a benefit of $3.5 million. As discussed in the fourth quarter earnings release, we realized a tax benefit in the first quarter of 2012 due to an internal corporate restructuring of our subsidiaries that was a part of the recapitalization and IPO transactions. This corporate restructuring was completed in the first quarter of 2012. As previously discussed, we expect the full year effective tax rate in accordance with GAAP to be approximately 37%, but should be approximately 39% for the remaining three quarters of 2012. For Adjusted EPS calculation purposes we will continue to use a normalized tax rate of 39% for each quarter and the full year.
Cash Flow and Capital Expenditures
Swift continues to generate healthy cash flows from operations. We generated $70.2 million of cash from operations in the first quarter of 2012 compared with $59.9 million in the first quarter of 2011. Our net cash capital expenditures in the current quarter were relatively light at $10.4 million due to the planned first quarter reduction in our fleet. Therefore, operating cash flows were used primarily to repay debt as cash used in financing activities totaled $93.3 million. A portion of these debt repayments were also funded with cash on hand as of December 31, 2011 reducing our unrestricted cash balance to $47.7 million as of March 31, 2012.
Capital Expenditures
| ($ Millions) | Q1 2012 | Q1 2011 | FY 2011 | |||||||||
| Net Cash Capital Expenditures |
10.4 | 33.7 | 172.5 | |||||||||
| Addback: Proceeds from Sales |
33.9 | 5.9 | 67.1 | |||||||||
|
|
|
|
|
|
|
|||||||
| Gross Cash Capital Expenditures |
$ | 44.3 | $ | 39.5 | $ | 239.6 | ||||||
| Capital Leases |
17.1 | 0.7 | 10.6 | |||||||||
| Operating Leases |
58.1 | 10.8 | 264.9 | |||||||||
|
|
|
|
|
|
|
|||||||
| Capital & Operating Lease Total |
$ | 75.2 | $ | 11.5 | $ | 275.5 | ||||||
|
|
|
|
|
|
|
|||||||
| Gross Investment in Equipment & Facilities |
$ | 119.5 | $ | 51.0 | $ | 515.1 | ||||||
|
|
|
|
|
|
|
|||||||
Original Value of Expired Leases
| ($ Millions) | Q1 2012 | Q1 2011 | FY 2011 | |||||||||
| Capital Leases |
0.2 | 28.9 | 69.0 | |||||||||
| Operating Leases |
10.6 | 14.7 | 159.7 | |||||||||
|
|
|
|
|
|
|
|||||||
| Total |
$ | 10.8 | $ | 43.7 | $ | 228.7 | ||||||
|
|
|
|
|
|
|
|||||||
|
|
11 |
Net cash capital expenditures were $10.4 million in the first quarter of 2012, reflecting gross cash capital expenditures of $44.3 million and $33.9 million of proceeds from the sale of equipment. Additionally, we acquired $75.2 million of equipment with capital and operating leases, of which approximately $12.7 million was equipment for owner-operators financed through our IEL subsidiary. In the quarter, we terminated equipment under operating and capital leases with original values of $10.8 million.
As discussed previously, we are expecting to have a heavier replacement cycle for both tractors and trailers in 2012. In our last earnings call, we provided guidance of approximately $250 million for net cash capital expenditures in 2012. We are currently in the process of updating our expected mileage readings for our equipment and evaluating the economics associated with purchasing equipment compared to acquiring equipment with operating or capital leases. In the analysis, consideration is being given to the following factors; our current federal tax position, bonus depreciation tax benefits in 2012, our like-kind exchange program, effective interest rates implied in lease proposals, our leverage ratio, liquidity impacts, etc. Given the outcome of this analysis, it is possible we may acquire less equipment than originally planned, lease more equipment than originally planned, reduce the expected net cash capital expenditures and repay additional debt. In addition, as we have discussed previously, we believe we have ample flexibility with our trade cycle and purchase agreements to alter our current plans if economic or other conditions warrant. Therefore, our net cash capital expenditures could vary from the $250 million previously discussed.
Liquidity and Debt Summaries
Liquidity Summary
| ($ millions) | 3/31/2012 | 12/31/2011 | 12/31/2010 | |||||||||
| Unrestricted Cash |
$ | 47.7 | $ | 82.1 | $ | 47.5 | ||||||
| Total Revolver Commitment |
$ | 400.0 | $ | 400.0 | $ | 400.0 | ||||||
| Less: Amount Drawn |
$ | — | $ | — | $ | — | ||||||
| Amounts under LOC |
$ | (162.2 | ) | $ | (167.5 | ) | $ | (153.2 | ) | |||
|
|
|
|
|
|
|
|||||||
| Available Under Revolver |
$ | 237.8 | $ | 232.5 | $ | 246.8 | ||||||
|
|
|
|
|
|
|
|||||||
| Total Available under AR Facility |
$ | 252.3 | $ | 249.8 | $ | 174.0 | ||||||
| Less: Amount Drawn |
$ | (163.0 | ) | $ | (180.0 | ) | $ | (171.5 | ) | |||
|
|
|
|
|
|
|
|||||||
| Available Under AR Facility |
$ | 89.3 | $ | 69.8 | $ | 2.5 | ||||||
|
|
|
|
|
|
|
|||||||
| Total Liquidity |
$ | 374.8 | $ | 384.4 | $ | 296.8 | ||||||
|
|
|
|
|
|
|
|||||||
| Restricted Cash and Investments |
$ | 72.1 | $ | 71.7 | $ | 84.6 | ||||||
|
|
|
|
|
|
|
|||||||
| Total Liquidity Including Restricted Cash and Investments |
$ | 446.9 | $ | 456.1 | $ | 381.4 | ||||||
|
|
|
|
|
|
|
|||||||
|
|
12 |
Our liquidity position at March 31, 2012 remains healthy with a total of $446.9 million available to us including $47.7 million of unrestricted cash and $72.1 million of restricted cash and investments in our captive insurance companies that are reserved for the future payment of outstanding claims. Our $400.0 million revolving credit facility remains undrawn, and we had $162.2 million of letters of credit outstanding primarily for insurance collateral purposes, leaving $237.8 million available. We also had $89.3 million available on our accounts receivable securitization facility.
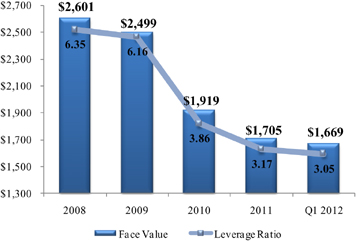
Net Debt and Leverage Ratio
As we have stated previously, our goal is to continue to reduce our leverage ratio through EBITDA growth and debt repayments. In the first quarter of 2012 we reduced our net debt by an additional $36 million to $1.67 billion. This combined with the growth in EBITDA has resulted in a leverage ratio of 3.05:1.00 at March 31, 2012, which represents a 21.0% improvement from our December 31, 2010 ratio, and a 52.0% improvement from 2008 levels. Our current goal is to reduce our leverage ratio to a range of 2.80—2.90 by December 31, 2012. Furthermore, we continue to maintain compliance with the financial covenants in our credit agreement as of March 31, 2012.
($ in millions)
Summary
In summary, given the overall economic environment, we are pleased with the results thus far in 2012. We are cautiously optimistic about the trends in our industry and encouraged at the progress we continue to make on our goals. We have continued to improve several of our key operational metrics, including deadhead percent, rate per mile and utilization per truck. Our Intermodal TOFC and COFC business both experienced solid revenue growth in the first quarter and we continue to grow our logistics and brokerage businesses. Above all, our profitability continues to yield year over year improvements and we remain focused on reducing our leverage. We want to recognize and thank each of the hardworking employees here at Swift for their commitment to excellence. As an organization, it is our goal to remain keenly focused on exercising discipline in all that we do, in order to generate returns for you, our stockholders.
Sincerely,
| Jerry Moyes | Richard Stocking | Ginnie Henkels | ||
| Chief Executive Officer | Chief Operating Officer | Chief Financial Officer |
|
|
13 |
Conference Call Q&A Session
Swift Transportation management will host a Q&A session at 1:00 p.m. Eastern Daylight Time on Friday, April 20th to answer questions about the Company’s financial results. Please email your questions to Investor_Relations@swifttrans.com prior to 1:00 p.m. Eastern Daylight Time on Thursday, April 19th.
Participants may access the call using the following dial-in numbers:
U.S./Canada: (866) 379-9391
International/Local: (706) 634-0901
Conference ID: 70186040
The live webcast, letter to stockholders, transcript of the Q&A, and the replay of the earnings Q&A session can be accessed via our investor relations website at ir.swifttrans.com.
IR Contact:
Jason Bates
Vice President Finance &
Investor Relations Officer
623.907.7335
|
|
14 |
Forward Looking Statements & Use of Non-GAAP Measures
This letter contains statements that may constitute forward-looking statements, which are based on information currently available, usually identified by words such as “anticipates,” “believes,” “estimates”, “plans,” “projects,” “expects,” “hopes,” “intends,” “will,” “could,” “may,” or similar expressions which speak only as of the date the statement was made. Such forward-looking statements are made pursuant to the safe harbor provisions of the Private Securities Litigation Reform Act of 1995. Such statements include, but are not limited to, statements concerning: trends relating to our operations, leverage, revenue, expenses, effective tax rate for the full year 2012, fleet size and composition between company and owner-operator trucks, profitability and related metrics; improvements in pricing and deadhead percentage; the timing and level of fleet growth and truck count; seasonal demand patterns; insurance and claims trends and actuarial assumptions; expectations of property and equipment dispositions and anticipated gains relative thereto; expected reductions in cash and non-cash interest expense, and leverage ratio; estimated capital expenditures and related average age of our fleet; our plans to expand our Mexico fleet; our plans to grow our intermodal fleet; and our intentions to use excess cash flows to repay debt. Such forward-looking statements are inherently uncertain, are based upon the current beliefs, assumptions and expectations of Company management and current market conditions, which are subject to significant risks and uncertainties as set forth in the Risk Factor Section of our Annual Report Form 10-K for the year ended December 31, 2011. As to the Company’s business and financial performance, the following factors, among others, could cause actual results to differ materially from those in forward-looking statements: the amount and velocity of changes in fuel prices and our ability to recover fuel prices through our fuel surcharge program; the direction and duration of any trends, in pricing and volumes; assumptions regarding demand; any future recessionary economic cycles and downturns in customers’ business cycles, particularly in market segments and industries in which we have a significant concentration of customers; increasing competition from trucking, rail, intermodal, and brokerage competitors; a significant reduction in, or termination of, our trucking services by a key customer; our ability to achieve our strategy of growing our revenue; volatility in the price or availability of fuel; increases in new equipment prices or replacement costs; our significant ongoing capital requirements; the regulatory environment in which we operate, including existing regulations and changes in existing regulations, or violations by us of existing or future regulations; the costs of environmental and safety compliance and/or the imposition of liabilities under environmental and safety laws and regulations; difficulties in driver recruitment and retention; increases in driver compensation to the extent not offset by increases in freight rates; changes in rules or legislation by the National Labor Relations Board or Congress and/or union organizing efforts; potential volatility or decrease in the amount of earnings as a result of our claims exposure through our wholly-owned captive insurance companies; risks relating to our captive insurance companies; uncertainties associated with our operations in Mexico; our ability to attract and maintain relationships with owner-operators; the possible re-classification of our owner-operators as employees; adverse results from litigation; our ability to retain or replace key personnel; conflicts of interest or potential litigation that may arise from other businesses owned by Jerry Moyes, including pledges of Swift stock by Jerry Moyes; our dependence on third parties for intermodal and brokerage business; potential failure in computer or communications systems; our ability to execute or integrate any future acquisitions successfully; seasonal factors such as harsh weather conditions that increase operating costs; our ability to sustain cost savings realized as part of recent cost reduction initiatives; our history of net losses; goodwill impairment; our level of indebtedness; and our ability to service our outstanding indebtedness, including compliance with our indebtedness covenants, and the impact such indebtedness may have on the way we operate our business. You should understand that many important factors, in addition to those listed above and in our filings with the SEC, could impact us financially. As a result of these and other factors, actual results may differ from those set forth in the forward-looking statements and the prices of the Company’s securities may fluctuate dramatically. The Company makes no commitment, and disclaims any duty, to update or revise any forward-looking statements to reflect future events, new information or changes in these expectations. In addition to our GAAP results, this presentation also includes certain non-GAAP financial measures as defined by the SEC. The calculation of each measure, including a reconciliation to the most closely related GAAP measure and the reasons management believes each non-GAAP measure is useful, are included in the attached schedules.
|
|
15 |
CONSOLIDATED STATEMENTS OF OPERATIONS (UNAUDITED)
THREE MONTHS ENDED MARCH 31, 2012 AND 2011
| Three Months Ended March 31, | ||||||||
| 2012 | 2011 | |||||||
| (Amounts in thousands, except per share data) |
||||||||
| Operating revenue |
$ | 826,885 | $ | 758,889 | ||||
|
|
|
|
|
|||||
| Operating expenses: |
||||||||
| Salaries, wages and employee benefits |
200,135 | 195,476 | ||||||
| Operating supplies and expenses |
55,042 | 57,104 | ||||||
| Fuel |
153,003 | 150,281 | ||||||
| Purchased transportation |
233,202 | 194,037 | ||||||
| Rental expense |
23,499 | 17,989 | ||||||
| Insurance and claims |
30,580 | 22,725 | ||||||
| Depreciation and amortization of property and equipment |
50,394 | 50,358 | ||||||
| Amortization of intangibles |
4,303 | 4,727 | ||||||
| Impairments |
1,065 | — | ||||||
| Gain on disposal of property and equipment |
(4,390 | ) | (2,255 | ) | ||||
| Communication and utilities |
6,246 | 6,460 | ||||||
| Operating taxes and licenses |
15,904 | 15,258 | ||||||
|
|
|
|
|
|||||
| Total operating expenses |
768,983 | 712,160 | ||||||
|
|
|
|
|
|||||
| Operating income |
57,902 | 46,729 | ||||||
|
|
|
|
|
|||||
| Other (income) expenses: |
||||||||
| Interest expense |
32,776 | 37,501 | ||||||
| Derivative interest expense |
2,545 | 4,680 | ||||||
| Interest income |
(397 | ) | (467 | ) | ||||
| Loss on debt extinguishment |
20,940 | — | ||||||
| Other |
(602 | ) | (511 | ) | ||||
|
|
|
|
|
|||||
| Total other (income) expenses, net |
55,262 | 41,203 | ||||||
|
|
|
|
|
|||||
| Income before income taxes |
2,640 | 5,526 | ||||||
| Income tax (benefit) expense |
(3,548 | ) | 2,321 | |||||
|
|
|
|
|
|||||
| Net income |
$ | 6,188 | $ | 3,205 | ||||
|
|
|
|
|
|||||
| Basic earnings per share |
$ | 0.04 | $ | 0.02 | ||||
|
|
|
|
|
|||||
| Diluted earnings per share |
$ | 0.04 | $ | 0.02 | ||||
|
|
|
|
|
|||||
| Shares used in per share calculations |
||||||||
| Basic |
139,509 | 138,127 | ||||||
|
|
|
|
|
|||||
| Diluted |
140,392 | 138,900 | ||||||
|
|
|
|
|
|||||
|
|
16 |
ADJUSTED EPS RECONCILIATION (UNAUDITED) (a)
THREE MONTHS ENDED MARCH 31, 2012, 2011 AND 2010
| Three Months Ended March 31, | ||||||||||||
| 2012 | 2011 | 2010 | ||||||||||
| Diluted earnings (loss) per share |
$ | 0.04 | $ | 0.02 | $ | (0.88 | ) | |||||
| Adjusted for: |
||||||||||||
| Income tax (benefit) expense |
(0.03 | ) | 0.02 | (0.16 | ) | |||||||
|
|
|
|
|
|
|
|||||||
| Income (loss) before income taxes |
0.02 | 0.04 | (1.04 | ) | ||||||||
|
|
|
|
|
|
|
|||||||
| Non-cash impairments (b) |
0.01 | — | 0.02 | |||||||||
| Loss on debt extinguishment (c) |
0.15 | — | — | |||||||||
| Other special non-cash items (d) |
— | — | 0.12 | |||||||||
| Amortization of certain intangibles (e) |
0.03 | 0.03 | 0.09 | |||||||||
| Mark-to-market adjustment of interest rate swaps(f) |
— | — | 0.19 | |||||||||
| Amortization of unrealized losses on interest rate swaps (g) |
0.02 | 0.03 | — | |||||||||
|
|
|
|
|
|
|
|||||||
| Adjusted income (loss) before income taxes |
0.22 | 0.10 | (0.62 | ) | ||||||||
| Provision for income tax expense (benefit) at normalized effective rate |
0.09 | 0.04 | (0.24 | ) | ||||||||
|
|
|
|
|
|
|
|||||||
| Adjusted EPS |
$ | 0.14 | $ | 0.06 | $ | (0.38 | ) | |||||
|
|
|
|
|
|
|
|||||||
| (a) | We define Adjusted EPS as (1) income (loss) before income taxes plus (i) amortization of the intangibles from our 2007 going-private transaction, (ii) non-cash impairments, (iii) other special non-cash items, (iv) excludable transaction costs, (v) the mark-to-market adjustment on our interest rate swaps that is recognized in the statement of operations in a given period, and (vi) the amortization of previous losses recorded in accumulated other comprehensive income (loss) (“OCI”) related to the interest rate swaps we terminated upon our IPO and refinancing transactions in December 2010; (2) reduced by income taxes at 39%, our normalized effective tax rate; (3) divided by weighted average diluted shares outstanding. We believe the presentation of financial results excluding the impact of the items noted above provides a consistent basis for comparing our results from period to period and to those of our peers due to the non-comparable nature of the intangibles from our going-private transaction, the historical volatility of the interest rate derivative agreements and the non-operating nature of the impairment charges, transaction costs and other adjustment items. Adjusted EPS is not presented in accordance with GAAP and should be considered in addition to, not as a substitute for, or superior to, measures of financial performance in accordance with GAAP. The numbers reflected in the above table are calculated on a per share basis and may not foot due to rounding. |
| (b) | Real property with a carrying amount of $1.7 million was written down to its fair value of $0.6 million, resulting in a pre-tax impairment charge of $1.1 million in the first quarter of 2012. In the first quarter of 2010, revenue equipment with a carrying value of $3.6 million was written down to its fair value of $2.3 million, resulting in an impairment charge of $1.3 million. |
| (c) | On March 6, 2012, the Company entered into an Amended and Restated Credit Agreement (“New Agreement”). The New Agreement replaced the then-existing, remaining $874 million face value first lien term loan, which matured in December 2016. The replacement of the then-existing first lien term loan resulted in a loss on debt extinguishment of $20.9 million in the first quarter of 2012, representing the write-off of the unamortized original issue discount and deferred financing fees associated with the original term loan. |
| (d) | Incremental pre-tax depreciation expense reflecting management’s revised estimates regarding salvage value and useful lives for approximately 7,000 dry van trailers, which management decided during the first quarter of 2010 to scrap over the next few years. |
| (e) | Amortization of certain intangibles reflects the non-cash amortization expense of $4.0 million, $4.4 million and $5.2 million for the three months ended March 31, 2012, 2011 and 2010, respectively, relating to intangible assets identified in the 2007 going-private transaction through which Swift Corporation acquired Swift Transportation Co. |
| (f) | Mark-to-market adjustment of interest rate swaps of $11.1 million reflects the portion of the change in fair value of these financial instruments which was recorded in earnings in the first quarter of 2010 and excludes the portion recorded in accumulated other comprehensive income under cash flow hedge accounting. |
| (g) | Amortization of unrealized losses on interest rate swaps reflects the non-cash amortization expense of $2.5 million and $4.7 million for the three months ended March 31, 2012 and 2011, respectively, included in derivative interest expense in the consolidated statements of operations and is comprised of previous losses recorded in accumulated other comprehensive income related to the interest rate swaps we terminated upon our IPO and concurrent refinancing transactions in December 2010. Such losses were incurred in prior periods when hedge accounting applied to the swaps and are being expensed in relation to the hedged interest payments through the original maturity of the swaps in August 2012. |
|
|
17 |
ADJUSTED OPERATING INCOME AND OPERATING RATIO RECONCILIATION (UNAUDITED) (a)
THREE MONTHS ENDED MARCH 31, 2012, 2011 AND 2010
| Three Months Ended March 31, | ||||||||||||
| 2012 | 2011 | 2010 | ||||||||||
| Operating revenue |
$ | 826,885 | $ | 758,889 | $ | 654,830 | ||||||
| Less: Fuel surcharge revenue |
162,714 | 137,817 | 88,816 | |||||||||
|
|
|
|
|
|
|
|||||||
| Net Revenue |
664,171 | 621,072 | 566,014 | |||||||||
|
|
|
|
|
|
|
|||||||
| Operating expense |
768,983 | 712,160 | 631,637 | |||||||||
| Adjusted for: |
||||||||||||
| Fuel surcharge revenue |
(162,714 | ) | (137,817 | ) | (88,816 | ) | ||||||
| Amortization of certain intangibles (b) |
(4,011 | ) | (4,435 | ) | (5,187 | ) | ||||||
| Non-cash impairments (c) |
(1,065 | ) | — | (1,274 | ) | |||||||
| Other special non-cash items (d) |
— | — | (7,382 | ) | ||||||||
|
|
|
|
|
|
|
|||||||
| Adjusted operating expense |
601,193 | 569,908 | 528,978 | |||||||||
|
|
|
|
|
|
|
|||||||
| Adjusted operating income |
$ | 62,978 | $ | 51,164 | $ | 37,036 | ||||||
|
|
|
|
|
|
|
|||||||
| Adjusted Operating Ratio |
90.5 | % | 91.8 | % | 93.5 | % | ||||||
| Operating Ratio |
93.0 | % | 93.8 | % | 96.5 | % | ||||||
| (a) | We define Adjusted Operating Ratio as (a) total operating expenses, less (i) fuel surcharges, (ii) amortization of the intangibles from our 2007 going-private transaction, (iii) non-cash impairment charges, (iv) other special non-cash items, and (v) excludable transaction costs, as a percentage of (b) total revenue excluding fuel surcharge revenue. For the year ended December 31, 2011, we revised the calculation of Adjusted Operation Ratio to eliminate the impact of the non-cash amortization of the intangibles from our 2007 going-private transaction to be consistent with the calculation of our Adjusted EPS. The three months ended March 31, 2011 and 2010 presented above has been revised to reflect the revised definition. We believe fuel surcharge is sometimes volatile and eliminating the impact of this source of revenue (by netting fuel surcharge revenue against fuel expense) affords a more consistent basis for comparing our results of operations. We also believe excluding impairments, non-comparable nature of the intangibles from our going-private transaction and other special items enhances the comparability of our performance from period to period. Adjusted Operating Ratio is not a recognized measure under GAAP. Adjusted Operating Ratio should be considered in addition to, not as a substitute for, or superior to, measures of financial performance in accordance with GAAP. |
| (b) | Amortization of certain intangibles reflects the non-cash amortization expense of $4.0 million, $4.4 million and $5.2 million for the three months ended March 31, 2012, 2011 and 2010, respectively, relating to intangible assets identified in the 2007 going-private transaction through which Swift Corporation acquired Swift Transportation Co. |
| (c) | Real property with a carrying amount of $1.7 million was written down to its fair value of $0.6 million, resulting in a pre-tax impairment charge of $1.1 million in the first quarter of 2012. In the first quarter of 2010, revenue equipment with a carrying value of $3.6 million was written down to its fair value of $2.3 million, resulting in an impairment charge of $1.3 million. |
| (d) | Incremental pre-tax depreciation expense reflecting management’s revised estimates regarding salvage value and useful lives for approximately 7,000 dry van trailers, which management decided during the first quarter of 2010 to scrap over the next few years. |
|
|
18 |
ADJUSTED EARNINGS BEFORE INTEREST, TAXES, DEPRECIATION AND AMORTIZATION (UNAUDITED) (a) THREE MONTHS ENDED MARCH 31, 2012, 2011 AND 2010
| Three Months Ended March 31, | ||||||||||||
| 2012 | 2011 | 2010 | ||||||||||
| Net income (loss) |
$ | 6,188 | $ | 3,205 | $ | (53,001 | ) | |||||
| Adjusted for: |
||||||||||||
| Depreciation and amortization of property and equipment |
50,394 | 50,358 | 60,019 | |||||||||
| Amortization of intangibles |
4,303 | 4,727 | 5,478 | |||||||||
| Interest expense |
32,776 | 37,501 | 62,596 | |||||||||
| Derivative interest expense |
2,545 | 4,680 | 23,714 | |||||||||
| Interest income |
(397 | ) | (467 | ) | (220 | ) | ||||||
| Income tax (benefit) expense |
(3,548 | ) | 2,321 | (9,525 | ) | |||||||
|
|
|
|
|
|
|
|||||||
| Earnings before interest, taxes, depreciation and amortization (EBITDA) |
$ | 92,261 | $ | 102,325 | $ | 89,061 | ||||||
|
|
|
|
|
|
|
|||||||
| Non-cash equity compensation (b) |
1,267 | 2,424 | — | |||||||||
| Loss on debt extinguishment (c) |
20,940 | — | — | |||||||||
| Non-cash impairments (d) |
1,065 | — | 1,274 | |||||||||
|
|
|
|
|
|
|
|||||||
| Adjusted EBITDA |
$ | 115,533 | $ | 104,749 | $ | 90,335 | ||||||
|
|
|
|
|
|
|
|||||||
| (a) | We define Adjusted EBITDA as net income (loss) plus (i) depreciation and amortization, (ii) interest and derivative interest expense, including other fees and charges associated with indebtedness, net of interest income, (iii) income taxes, (iv) non-cash equity compensation expense, (v) non-cash impairments, (vi) other special non-cash items, and (vii) excludable transaction costs. We believe that Adjusted EBITDA is a relevant measure for estimating the cash generated by our operations that would be available to cover capital expenditures, taxes, interest and other investments and that it enhances an investor’s understanding of our financial performance. We use Adjusted EBITDA for business planning purposes and in measuring our performance relative to that of our competitors. Our method of computing Adjusted EBITDA is consistent with that used in our senior secured credit agreement for covenant compliance purposes and may differ from similarly titled measures of other companies. Adjusted EBITDA is not a recognized measure under GAAP. Adjusted EBITDA should be considered in addition to, not as a substitute for or superior to, net income, cash flow from operations, operating income or any other performance measures derived in accordance with GAAP as measures of operating performance or operating cash flows as a measure of liquidity. |
| (b) | Represents recurring non-cash equity compensation expense following our IPO, on a pre-tax basis. In accordance with the terms of our senior credit agreement, this expense is added back in the calculation of Adjusted EBITDA for covenant compliance purposes. |
| (c) | On March 6, 2012, the Company entered into an Amended and Restated Credit Agreement (“New Agreement”). The New Agreement replaced the then-existing $874 million face value first lien term loan, which matured in December 2016. The replacement of the then-existing first lien term loan resulted in a loss on debt extinguishment of $20.9 million in the first quarter of 2012, representing the write-off of the unamortized original issue discount and deferred financing fees associated with the original term loan. |
| (d) | Real property with a carrying amount of $1.7 million was written down to its fair value of $0.6 million, resulting in a pre-tax impairment charge of $1.1 million in the first quarter of 2012. In the first quarter of 2010, revenue equipment with a carrying value of $3.6 million was written down to its fair value of $2.3 million, resulting in an impairment charge of $1.3 million. |
|
|
19 |
OPERATING STATISTICS (UNAUDITED)
| Three Months Ended March 31, | ||||||||
| 2012 | 2011 | |||||||
| Trucking revenue (1,2) |
$ | 577,616 | $ | 554,721 | ||||
| Weekly trucking revenue per tractor (2) |
$ | 3,055 | $ | 2,862 | ||||
| Deadhead miles percentage |
11.85 | % | 12.13 | % | ||||
| Average loaded length of haul (miles) |
425 | 430 | ||||||
| Average tractors available for dispatch |
||||||||
| Company |
10,524 | 11,105 | ||||||
| Owner Operator |
4,022 | 3,972 | ||||||
|
|
|
|
|
|||||
| Total |
14,546 | 15,077 | ||||||
|
|
|
|
|
|||||
Notes to Operating Statistics:
| (1) | In thousands. |
| (2) | Excludes fuel surcharge, rail, third party carrier, leasing, and other shop and miscellaneous revenue. |
|
|
20 |
SELECTED CONSOLIDATED BALANCE SHEET DATA (UNAUDITED)
AS OF MARCH 31, 2012 AND DECEMBER 31, 2011
| March 31, 2012 | December 31, 2011 | |||||||
| (Amounts in thousands) | ||||||||
| Cash and cash equivalents |
$ | 47,684 | $ | 82,084 | ||||
| Restricted cash |
61,006 | 71,724 | ||||||
| Fixed maturity securities, held to maturity, amortized cost—restricted |
11,086 | — | ||||||
| Accounts receivable, net |
339,191 | 324,035 | ||||||
| Property and equipment, net |
1,287,695 | 1,299,997 | ||||||
| Intangible assets, net |
346,183 | 350,486 | ||||||
| Goodwill |
253,256 | 253,256 | ||||||
| Other assets |
253,391 | 257,083 | ||||||
|
|
|
|
|
|||||
| Total assets |
$ | 2,599,492 | $ | 2,638,665 | ||||
|
|
|
|
|
|||||
| Total debt and capital lease obligations (1) |
1,543,038 | 1,589,443 | ||||||
| Securitization of accounts receivable |
163,000 | 180,000 | ||||||
| Other liabilities |
797,688 | 783,033 | ||||||
|
|
|
|
|
|||||
| Total liabilities |
2,503,726 | 2,552,476 | ||||||
|
|
|
|
|
|||||
| Stockholders’ equity |
95,766 | 86,189 | ||||||
|
|
|
|
|
|||||
| Total liabilities and stockholders’ equity |
$ | 2,599,492 | $ | 2,638,665 | ||||
|
|
|
|
|
|||||
Notes to Selected Consolidated Balance Sheet Data:
| (1) | On March 6, 2012, the Company entered into an Amended and Restated Credit Agreement (“New Agreement”). The New Agreement replaced the then-existing $874 million face value first lien term loan, which matured in December 2016 and accrued interest at the LIBOR rate plus 4.50%, including a minimum LIBOR rate of 1.50%, with a $200 million face value first lien term loan B-1 tranche and a $674 million face value first lien term loan B-2 tranche. The $200 million first lien term Loan B-1 tranche accrues interest at the LIBOR rate plus 3.75% with no LIBOR rate minimum and includes scheduled quarterly principal payments beginning June 30, 2012 of $5.0 million per quarter through December 2013 and generally $10.0 million per quarter thereafter until maturity in December 2016. The $674 million first lien term Loan B-2 tranche accrues interest at the LIBOR rate plus 3.75%, including a minimum LIBOR rate of 1.25%, and includes scheduled quarterly principal payments of 0.25% of the original loan amount until maturity in December 2017. The replacement of the then-existing first lien term loan resulted in a loss on debt extinguishment of $20.9 million in the first quarter of 2012, representing the write-off of the unamortized original issue discount and deferred financing fees associated with the original term loan. Total debt and capital lease obligations as of March 31, 2012 includes $199.5 million net carrying value of first lien term loan B-1 tranche, $672.3 million net carrying value of first lien term loan B-2 tranche, $491.6 million net carrying value of senior second priority secured notes, $15.2 million of unsecured fixed rate notes, and $164.4 million of other secured indebtedness and capital lease obligations. Total debt and capital lease obligations as of December 31, 2011 includes $925.5 million net carrying value of senior secured first lien term loan, $491.3 million net carrying value of senior second priority secured notes, $15.6 million of unsecured fixed rate notes, and $157.0 million of other secured indebtedness and capital lease obligations. |
|
|
21 |
SELECTED CONSOLIDATED CASH FLOW DATA (UNAUDITED)
YEARS ENDED MARCH 31, 2012 AND 2011
| Year Ended March 31, | ||||||||
| 2012 | 2011 | |||||||
| (Amounts in thousands) | ||||||||
| Net income |
$ | 6,188 | $ | 3,205 | ||||
| Adjustments to reconcile net income to net cash provided by operating activities |
72,453 | 64,139 | ||||||
| Decrease in cash resulting from changes in Accounts receivable, inventories, other assets, accounts payable, accrued liabilities and other liabilities |
(8,469 | ) | (7,469 | ) | ||||
|
|
|
|
|
|||||
| Net cash provided by operating activities |
$ | 70,172 | $ | 59,875 | ||||
|
|
|
|
|
|||||
| Capital expenditures, net of disposal proceeds |
$ | (10,388 | ) | $ | (33,654 | ) | ||
| Increase in restricted cash and fixed maturity securities |
(368 | ) | (510 | ) | ||||
| Other investing activities |
(513 | ) | 2,615 | |||||
|
|
|
|
|
|||||
| Net cash used in investing activities |
$ | (11,269 | ) | $ | (31,549 | ) | ||
|
|
|
|
|
|||||
| Proceeds from issuance of common stock, net of fees and costs of issuance(1) |
$ | — | $ | 62,994 | ||||
| Repayment of long term debt and capital lease obligations |
(70,524 | ) | (81,765 | ) | ||||
| Net change in accounts receivable securitization obligation |
(17,000 | ) | (35,500 | ) | ||||
| Other financing activities |
(5,779 | ) | — | |||||
|
|
|
|
|
|||||
| Net cash used in financing activities |
$ | (93,303 | ) | $ | (54,271 | ) | ||
|
|
|
|
|
|||||
| Net decrease in cash and cash equivalents |
(34,400 | ) | (25,945 | ) | ||||
|
|
|
|
|
|||||
| Cash and cash equivalents at beginning of year |
82,084 | 47,494 | ||||||
| Cash and cash equivalents at end of year |
$ | 47,684 | $ | 21,549 | ||||
|
|
|
|
|
|||||
Notes to Selected Consolidated Cash Flow Data:
| (1) | On January 20, 2011, we issued an additional 6,050,000 shares of our Class A common stock to the underwriters of our IPO at the IPO price of $11.00 per share, less the underwriters’ discount, and received proceeds of $63.2 million in cash, prior to expenses of such issuance, pursuant to the over-allotment option in the underwriting agreement. Of these proceeds, $60.0 million were used in January 2011 to pay down the first lien term loan and $3.2 million were used in February 2011 to pay down our prior accounts receivable securitization facility. |
|
|
22 |