Attached files
UNITED STATES
SECURITIES AND EXCHANGE COMMISSION
Washington, D.C. 20549
ý ANNUAL REPORT PURSUANT TO SECTION 13 OR 15(d) OF THE SECURITIES EXCHANGE ACT OF 1934
For the fiscal year ended December 31, 2015
OR
¨ TRANSITION REPORT PURSUANT TO SECTION 13 OR 15(d) OF THE SECURITIES EXCHANGE ACT OF 1934
For the transition period from to
Commission file number 001-35007

Swift Transportation Company
(Exact name of registrant as specified in its charter)
Delaware | 20-5589597 | |
(State or other jurisdiction of incorporation or organization) | (I.R.S. Employer Identification No.) | |
2200 South 75th Avenue
Phoenix, AZ 85043
(Address of principal executive offices and Zip Code)
(602) 269-9700
(Registrant’s telephone number, including area code)
Securities registered pursuant to Section 12(b) of the Act:
Title of each class | Name of each exchange on which registered |
Class A Common Stock, par value $0.01 per share | New York Stock Exchange |
Securities registered pursuant to section 12(g) of the Act: None
Indicate by check mark if the registrant is a well-known seasoned issuer, as defined in Rule 405 of the Securities Act. Yes ý No ¨
Indicate by check mark if the registrant is not required to file reports pursuant to Section 13 or Section 15(d) of the Act. Yes ¨ No ý
Indicate by check mark whether the registrant (1) has filed all reports required to be filed by Section 13 or 15(d) of the Securities Exchange Act of 1934 during the preceding 12 months (or for such shorter period that the registrant was required to file such reports), and (2) has been subject to such filing requirements for the past 90 days. Yes ý No ¨
Indicate by check mark whether the registrant has submitted electronically and posted on its corporate Web site, if any, every Interactive Data File required to be submitted and posted pursuant to Rule 405 of Regulation S-T (§ 232.405 of this chapter) during the preceding 12 months (or for such shorter period that the registrant was required to submit and post such files). Yes ý No ¨
Indicate by check mark if disclosure of delinquent filers pursuant to Item 405 of Regulation S-K (§ 229.405 of this chapter) is not contained herein, and will not be contained, to the best of registrant’s knowledge, in definitive proxy or information statements incorporated by reference in Part III of this Form 10-K or any amendment to this Form 10-K. o
Indicate by check mark whether the registrant is a large accelerated filer, an accelerated filer, a non-accelerated filer, or a smaller reporting company. See the definitions of "large accelerated filer," "accelerated filer" and "smaller reporting company" in Rule 12b-2 of the Exchange Act:
Large accelerated filer | ý | Accelerated filer | ¨ | |||
Non-accelerated filer | ¨ (Do not check if a smaller reporting company) | Smaller reporting company | ¨ | |||
Indicate by check mark whether the registrant is a shell company (as defined in Rule 12b-2 of the Exchange Act). Yes ¨ No ý
As of June 30, 2015, the aggregate market value of our Class A common stock held by non-affiliates was $2,019,622,829, based on the closing price of our common stock as quoted on the NYSE as of such date.
There were 85,617,553 shares of the registrant’s Class A Common Stock and 50,991,938 shares of the registrant’s Class B Common Stock outstanding as of February 15, 2016.
DOCUMENTS INCORPORATED BY REFERENCE
Portions of the registrant’s definitive proxy statement for its 2016 Annual Meeting of Stockholders to be filed with the Securities and Exchange Commission (the "SEC") are incorporated by reference into Part III of this report.
SWIFT TRANSPORTATION COMPANY
2015 ANNUAL REPORT ON FORM 10-K |
TABLE OF CONTENTS | |
PAGE | |
1
2015 ANNUAL REPORT ON FORM 10-K | ||
GLOSSARY OF TERMS | ||
The following glossary provides definitions for certain acronyms and terms used in this Annual Report on Form 10-K. These acronyms and terms are specific to our company, commonly used in our industry, or are otherwise frequently used throughout our document. | ||
Term | Definition | |
Swift/the Company/Management/We/Us/Our | Unless otherwise indicated or the context otherwise requires, these terms represent Swift Transportation Company and its subsidiaries. Swift Transportation Company is the holding company for Swift Transportation Co., LLC (a Delaware limited liability company) and Interstate Equipment Leasing, LLC. | |
2007 Stock Plan | The Company's 2007 Omnibus Incentive Plan, as amended and restated | |
2007 Transactions | In April 2007, Jerry Moyes and his wife contributed their ownership of all of the issued and outstanding shares of IEL to Swift Corporation in exchange for additional Swift Corporation shares. In May 2007, the Moyes Affiliates, contributed their shares of Swift Transportation Co., Inc. common stock to Swift Corporation in exchange for additional Swift Corporation shares. Swift Corporation then completed its acquisition of Swift Transportation Co., Inc. through a merger on May 10, 2007, thereby acquiring the remaining outstanding shares of Swift Transportation Co., Inc. common stock. Upon completion of the 2007 Transactions, Swift Transportation Co., Inc. became a wholly-owned subsidiary of Swift Corporation. At the close of the market on May 10, 2007, the common stock of Swift Transportation Co., Inc. ceased trading on NASDAQ. | |
2010 METS | Mandatory Common Exchange Securities issued by Jerry Moyes and the Moyes Affiliates in 2010 | |
2011 RSA | The Company's previous Receivables Sale Agreement, entered into in 2011, with unrelated financial entities | |
2012 Agreement | The Company's previous credit agreement, replaced by the 2013 Agreement | |
2012 ESPP | Employee Stock Purchase Plan, effective beginning in 2012 | |
2013 Agreement | The Company's Second Amended and Restated Credit Agreement, replaced by the 2014 Agreement | |
2013 RSA | Amended and Restated Receivables Sale Agreement, entered into in 2013 by SRCII, with unrelated financial entities, "The Purchasers" | |
2014 Agreement | The Company's Third Amended and Restated Credit Agreement, replaced by the 2015 Agreement | |
2014 Stock Plan | The Company's 2014 Omnibus Incentive Plan | |
2015 Agreement | The Company's Fourth Amended and Restated Credit Agreement | |
2015 RSA | Third Amendment to Amended and Restated Receivables Sale Agreement, entered into in 2015 by SRCII, with unrelated financial entities, "The Purchasers" | |
AOCI | Accumulated Other Comprehensive Income (Loss) | |
ASC | Accounting Standards Codification | |
ASU | Accounting Standards Update | |
BASICs | Behavioral Analysis and Safety Improvement Categories - part of the new enforcement and compliance model introduced by the FMCSA | |
Board | Swift Transportation Board of Directors | |
C-TPAT | Customs-Trade Partnership Against Terrorism | |
CDL | Commercial Drivers' License | |
Central | Central Refrigerated Transportation, LLC (formerly Central Refrigerated Transportation, Inc.) | |
Central Acquisition | Swift's acquisition of all of the outstanding capital stock of Central | |
CEO | Chief Executive Officer, Jerry Moyes | |
CFO | Chief Financial Officer, Virginia Henkels | |
CMV | Commercial Motor Vehicle | |
CODM | Chief Operating Decision Makers, which includes our CEO, CFO, and COO and President | |
COFC | Container on Flat Car | |
COO | Chief Operating Officer, Richard Stocking | |
CSA | Compliance Safety Accountability | |
Deadhead | Tractor movement without hauling freight (unpaid miles driven) | |
2
2015 ANNUAL REPORT ON FORM 10-K | ||
GLOSSARY OF TERMS — CONTINUED | ||
Term | Definition | |
DHS | United States Department of Homeland Security | |
DOE | United States Department of Energy | |
DOT | United States Department of Transportation | |
EBITDA | Earnings Before Interest, Taxes, Depreciation and Amortization | |
ELD | Electronic Logging Device | |
EPA | United States Environmental Protection Agency | |
EPS | Earnings per Share | |
FASB | Financial Accounting Standards Board | |
FMCSA | Federal Motor Carrier Safety Administration | |
GHG | Green House Gas | |
IEL | Interstate Equipment Leasing, LLC (formerly Interstate Equipment Leasing, Inc.) | |
IPO | Initial Public Offering | |
LIBOR | London InterBank Offered Rate | |
LTL | Less-than-truckload | |
Mohave | Mohave Transportation Insurance Company, a Swift wholly-owned captive insurance subsidiary | |
Moyes Affiliates | Jerry Moyes, The Jerry and Vickie Moyes Family Trust dated December 11, 1987, and various Moyes children’s trusts | |
NASDAQ | National Association of Securities Dealers Automated Quotations | |
New Revolver | Revolving line of credit under the 2015 Agreement | |
New Term Loan A | The Company's first lien term loan A under the 2015 Agreement | |
NLRB | National Labor Relations Board | |
NYSE | New York Stock Exchange | |
OID | Original Issue Discount | |
Old Revolver | Revolving line of credit under the 2014 Agreement | |
Old Term Loan A | The Company's first lien term loan A under the 2014 Agreement | |
Red Rock | Red Rock Risk Retention Group, Inc., a Swift captive insurance subsidiary | |
Revenue xFSR | Revenue, Excluding Fuel Surcharge Revenue | |
RSU | Restricted Stock Unit: represents a right to receive a share of Class A common stock, when it vests - awarded to employees of the Company | |
SafeStat | Safety Status measurement system | |
SEC | Securities and Exchange Commission | |
Senior Notes | The Company's senior secured second priority notes | |
SRCII | Swift Receivables Company II, LLC | |
Swift Refrigerated | Swift Refrigerated Service, LLC (formerly Central Refrigerated Transportation, LLC) | |
The Purchasers | Unrelated financial entities in the 2015 and 2013 RSA, which was entered into by SRCII | |
Term Loan B | The Company's first lien term loan B under the 2014 Agreement | |
TOFC | Trailer on Flat Car | |
TSA | United States Transportation Security Administration | |
US-GAAP (or GAAP) | United States Generally Accepted Accounting Principles | |
VPF | Variable Prepaid Forward (contract) | |
3
PART I | ||||
CAUTIONARY NOTE REGARDING FORWARD-LOOKING STATEMENTS |
This report contains "forward-looking statements" within the meaning of the federal securities laws that involve risks and uncertainties. Forward-looking statements include statements we make concerning:
• | our plans, objectives, goals, strategies (including our growth strategies and the benefits and advantages to us compared to others in the trucking industry), future events, future revenues or performance and financing needs; |
• | our compliance with, and the impact on Swift of, proposed, established or new environmental, transportation, safety, tax, accounting, labor and other laws and regulations; |
• | the benefits of our business model, operations and strategies in light of changing trends in the trucking industry; |
• | the benefits of our driver academies and driver development programs; |
• | our opportunities in the temperature-controlled market; |
• | our addition of intermodal containers as volumes grow; |
• | the benefits of our C-TPAT status; |
• | our expectations to pursue acquisitions and integrate such acquisitions quickly; |
• | our compliance with environmental, transportation and other laws and regulations; |
• | adjustments to income tax assessments as the result of ongoing and future audits; |
• | the outcome of pending claims, litigation and actions in respect thereof; |
• | trucking industry supply, demand, pricing and cost trends; |
• | our expectation of increasing driver wages and hiring expenses, as well as the contracted pay rates for owner-operators; |
• | trends in the age of our tractor and trailer fleet; |
• | consistency of intangible asset amortization through 2017; |
• | our ability to grow Adjusted EPS and return on assets and generate free cash flow to reduce debt; |
• | the benefits of a shorter tractor trade-in cycle; |
• | the benefits of our fuel surcharge program and our ability to recover increasing fuel costs through surcharges; |
• | the impact of the lag effect relating to our fuel surcharges; |
• | the sources and sufficiency of our liquidity and financial resources to pay debt, make capital expenditures and operate our business; |
• | the value of equipment under operating leases relating to our residual value guarantees; |
• | our intentions concerning the potential use of derivative financial instruments to hedge fuel price increases; |
• | our expectations regarding the use of the NYSE's "controlled company" exemption concerning certain corporate governance requirements; |
• | our ability to alter our trade cycle and purchase agreements; |
• | the sufficiency and condition of our facilities; |
• | our intention to reinvest foreign earnings outside the United States; |
• | our intentions concerning the payment of dividends; and |
• | the timing and amount of future acquisitions of trucking equipment and other capital expenditures, as well as the use and availability of cash, cash flow from operations, leases and debt to finance such acquisitions. |
Such statements appear under the headings entitled "Risk Factors," "Management’s Discussion and Analysis of Financial Condition and Results of Operations," and "Business." When used in this report, the words "estimates," "expects," "anticipates," "projects," "forecasts," "plans," "intends," "believes," "foresees," "seeks," "likely," "may," "will," "should," "goal," "target," and variations of these words or similar expressions (or the negative versions of any such words) are intended to identify forward-looking statements. In addition, we, through our senior management, from time to time make forward-looking public statements concerning our expected future operations and performance and other developments. These forward-looking statements are subject to risks and uncertainties that may change at any time, and therefore, our actual results may differ materially from those that we expected. Accordingly, undue reliance should not be placed on our forward-looking statements. We derive many of our forward-looking statements from our operating budgets and forecasts, which are based upon many detailed assumptions. While we believe that our assumptions are reasonable, we caution that it is very difficult to predict the impact of known factors, and of course, it is impossible for us to anticipate all factors that could affect our actual results. All forward-looking statements are based upon information available to us on the date of this report. We undertake no obligation to publicly update or revise forward-looking statements to reflect events or circumstances after the date made or to reflect the occurrence of unanticipated events, except as required by law.
Important factors that could cause actual results to differ materially from our expectations ("cautionary statements") are disclosed under "Risk Factors" and elsewhere in this report. All forward-looking statements in this report and subsequent written and oral forward-looking statements attributable to us, or persons acting on our behalf, are expressly qualified in their entirety by the cautionary statements.
4
ITEM 1. | BUSINESS |
Certain acronyms and terms used throughout this Annual Report on Form 10-K are specific to our company, commonly used in our industry, or are otherwise frequently used throughout our document. Definitions for these acronyms and terms are provided in the "Glossary of Terms," available in the front of this document.
Company Overview |
Swift is a multi-faceted transportation services company, operating one of the largest fleets of truckload equipment in North America from over 40 terminals near key freight centers and traffic lanes. We principally operate in short- to medium-haul traffic lanes around our terminals and dedicated customer locations. During 2015, our consolidated average operational truck count was 17,915, which covered 2.2 billion miles for shippers throughout North America, contributing to consolidated operating revenue of $4.2 billion and consolidated operating income of $370.1 million. As of December 31, 2015, our fleet was comprised of 15,211 company tractors and 4,653 owner-operator tractors, as well as 65,233 trailers and 9,150 intermodal containers. Our customers have the opportunity to "one-stop-shop" for their truckload transportation needs with our extensive suite of service offerings, which include line-haul services, dedicated customer contracts, temperature-controlled units, intermodal freight solutions, cross-border United States/Mexico and United States/Canada freight, flatbed hauling, freight brokerage and logistics, and others.
Company Background |
Jerry Moyes, along with his father and brother, founded Swift Transportation Co., Inc. ("Swift Transportation") in 1966 with only one truck. In 1990, Swift Transportation went public on the NASDAQ stock market.
• | The 2007 Transactions — In April 2007, Mr. Moyes and his wife contributed their ownership of all of the issued and outstanding shares of IEL to Swift Corporation in exchange for additional Swift Corporation shares. In May 2007, the Moyes Affiliates, contributed their shares of Swift Transportation common stock to Swift Corporation in exchange for additional Swift Corporation shares. Swift Corporation then completed its acquisition of Swift Transportation through a merger on May 10, 2007, thereby acquiring the remaining outstanding shares of Swift Transportation common stock. Upon completion of the 2007 Transactions, Swift Transportation became a wholly-owned subsidiary of Swift Corporation. At the close of market on May 10, 2007, the common stock of Swift Transportation ceased trading on NASDAQ. |
• | The IPO — On May 20, 2010, Swift Corporation formed Swift Transportation Company, a Delaware corporation. Swift Transportation Company did not engage in any business or other activities except in connection with its formation and the IPO and held no assets or subsidiaries prior to such offering. Immediately prior to the consummation of the IPO, Swift Corporation merged with and into Swift Transportation Company, with Swift Transportation Company surviving as a Delaware corporation. In the merger, all of the outstanding common stock of Swift Corporation was converted into shares of Swift Transportation Company Class B common stock on a one-for-one basis, and all outstanding stock options of Swift Corporation were converted into options to purchase shares of Class A common stock of Swift Transportation Company. All outstanding Class B shares are held by Mr. Moyes and the Moyes Affiliates. Swift Transportation Company went public on the NYSE in December 2010, at an initial trading price of $11.00 per share. |
• | Central Acquisition — On August 6, 2013, Swift acquired all of the outstanding capital stock of Central in a cash transaction. Jerry Moyes, our CEO and controlling stockholder, was the principal owner of Central. Given Mr. Moyes’ interests in the temperature-controlled truckload industry, our Board established a special committee comprised solely of independent and disinterested directors in May of 2011 to evaluate Swift’s expansion of its temperature-controlled operations. The special committee evaluated alternative business opportunities, including organic growth and various acquisition targets, and negotiated the transaction contemplated by the stock purchase agreement, with the assistance of its independent financial advisors. Upon the unanimous recommendation of the special committee, the Central Acquisition was approved by the Board (with Mr. Moyes not participating in the vote). |
Central is a premium service truckload carrier specializing in temperature-controlled freight transportation and was a large provider of temperature-controlled truckload services in the United States. With the addition of Central to its dedicated temperature-controlled business, Swift is one of the largest temperature-controlled truckload providers in the United States. Our accounting treatment of the Central Acquisition and other details are discussed in Note 1 in Part II, Item 8, Financial Statements and Supplementary Data.
5
Industry and Competition |
Truckload carriers represent the largest part of the transportation supply chain for most retail and manufactured goods in North America and typically transport a full trailer (or container) of freight for a single customer from origin to destination without intermediate sorting and handling. Generally, the truckload industry is compensated based on miles, whereas the LTL industry is compensated based on package size and/or weight. Overall, the United States trucking industry is large, fragmented, and highly competitive. We compete with thousands of truckload carriers, most of whom operate much smaller fleets than we do. To a lesser extent, our intermodal services, as well as our freight brokerage and logistics business, compete with railroads, LTL carriers, logistics providers, and other transportation companies.
Our industry has encountered the following major economic cycles since 2000:
Period | Economic Cycle |
2000 — 2001 | industry over-capacity and depressed freight volumes |
2002 — 2006 | economic expansion |
2007 — 2009 | freight slowdown, fuel price spike, economic recession, and credit crisis |
2010 — present | moderate recovery. The industry freight data began to show positive trends for both volume and pricing. The slow, steady growth is a result of moderate increases in gross domestic product, coupled with a tighter supply of available tractors. Trends in supply of available tractors were lower due to several years of below average truck builds, an increase in truckload fleet bankruptcies in 2009 and 2010, increasing equipment prices due to stringent EPA requirements, less available credit, and less driver availability. |
The principal means of competition in our industry are customer service, capacity, and price. In times of strong freight demand, customer service and capacity become increasingly important, and in times of weak freight demand, pricing becomes increasingly important. Most truckload contracts (other than dedicated contracts) do not guarantee truck availability or load levels. Pricing is influenced by supply and demand.
The trucking industry faces the following primary challenges, which we believe we are well-positioned to address, as discussed under "Our Competitive Strengths" and "Company Strategy," below:
• | uncertainty in the extent and duration of the current economic recovery; |
• | potential reduction in driver pool from recent regulatory initiatives such as hours-of-service limitations for drivers, ELDs, and the FMCSA's CSA; |
• | potential decreases in utilization from new or changing regulatory constraints on drivers that may further decrease the utilization of an already shrinking driver pool; |
• | significant increases and rapid fluctuations in fuel prices; |
• | increased prices for new revenue equipment, design changes of new engines, and volatility in the used equipment sales market; and |
• | changing supply chain and consumer spending patterns. |
Our Mission and Vision |
Our mission is to attract and retain customers by providing best in class transportation solutions and fostering a profitable, disciplined culture of safety, service and trust.
O U R V I S I O N | We are an efficient and nimble world class service organization that is focused on the customer. |
We are aligned and working together at all levels to achieve our common goals. | |
Our team enjoys our work and co-workers and this enthusiasm resonates both internally and externally. | |
We are on the leading edge of service, always innovating to add value to our customers. | |
Our information and resources can easily be adapted to analyze and monitor what is most important in a changing environment. | |
Our financial health is improved, generating excess operating cash flows and growing profitability year-after-year with a culture that is cost- and environmentally-conscious. | |
We train, build, and develop our employees through perpetual learning opportunities to enhance their skill sets, allowing us to maximize potential of our talented people. | |
6
Our Competitive Strengths |
We aspire to achieve the themes of our mission and vision and believe our competitive strengths and strategies will enable us to attain our desired level of service to customers and results for our shareholders. We believe the following competitive strengths provide a solid platform for pursuing our goals and strategies:
North American Truckload Leader with Broad Terminal Network and a Modern Fleet |
Our fleet size offers wide geographic coverage, while maintaining the efficiencies associated with significant traffic density within our operating regions. Our terminals are strategically located near key population centers, driver recruiting areas, and cross-border hubs, often in close proximity to our customers. This broad network offers benefits such as in-house maintenance, more frequent equipment inspections, localized driver recruiting, rapid customer response, and personalized marketing efforts. Our size allows us to achieve substantial economies of scale in purchasing items such as tractors, trailers, containers, fuel, and tires where pricing is volume-sensitive. We believe our scale also offers additional benefits in brand awareness and access to capital. Our company tractor fleet has an average age of 2.0 years for our approximately 11,200 core operating sleeper units. By maintaining a newer fleet than most of our industry competitors, we believe that we have the following advantages: • Newer tractors typically have fewer repairs and lower operating costs. • Newer tractors are available for dispatch more often. • Drivers are typically more attracted to newer tractors, which helps with driver recruiting and retention. • Many competitors that allowed their fleets to age excessively will likely face a deferred capital expenditure spike, accompanied by difficulty in replacing their tractors because new tractor prices have increased, the value received for the old tractors will be low, and financing sources have diminished. |
High Quality Customer Service and Extensive Suite of Services |
Our intense focus on customer satisfaction has helped us establish a strong platform for cross-selling our other services to our strong and diversified customer base. We believe customers continue to search for ways to better streamline their transportation management functions. We respond to this need by providing our customers with solutions that include a wide variety of shipping services, including general and specialized truckload, cross-border services, regional distribution, high-service dedicated operations, intermodal service, and surge capacity through fleet flexibility and brokerage and logistics operations. This breadth of service helps diversify our customer base and provides us with a competitive advantage, especially for customers with multiple needs and cross-border United States/Mexico and United States/Canada shipments. |
Strong Owner-operator Business |
We supplement our company tractor fleet with owner-operators, who own and operate their own tractors and are responsible for ownership and operating expenses. We believe that owner-operators provide significant advantages that primarily arise from the entrepreneurial motivation of business ownership. The owner-operators we contract with tend to be more experienced, have fewer accidents per million miles, and on average, produce higher weekly revenue per tractor than our company drivers. |
Leader in Driver Development |
Historically, driver recruiting and retention have been significant challenges for truckload carriers. To address these challenges, we employ nationwide recruiting efforts through our terminal network, operate eight driver academies, partner with third-party driver training facilities, provide drivers with modern tractors, and promote numerous driver satisfaction initiatives. |
Regional Operating Model |
Our short- and medium-haul regional operating model contributes to higher revenue per mile and takes advantage of shipping trends toward regional distribution. We also experience less competition in our short- and medium-haul regional business from railroads. In addition, our regional terminal network allows our drivers to be home more often, which assists with driver retention. |
Experienced Management, Aligned with Corporate Success |
Our management team has a proven track record of growth and cost control. Management focuses on disciplined execution and financial performance by measuring our progress through a combination of financial metrics. We align management’s priorities with our stockholders’ through equity incentive awards and an annual performance-based bonus plan. |
7
Company Strategy |
Our key financial goals include improving our asset utilization, controlling costs, growing Adjusted EPS (defined in "Non-GAAP Financial Measures" under Item 7. Management's Discussion and Analysis of Financial Condition and Results of Operations), improving return on net assets, and generating cash flow to reinvest in our business, repay debt and return capital to our stockholders. We align our company focus to attain these goals by implementing the following strategies, which we believe also serve to minimize the impact of challenges currently faced in the trucking industry.
Profitable Revenue Growth | |
To increase freight volumes and yield, we intend to further penetrate our existing customer base, cross-sell our services, pursue new customer opportunities by leveraging our outstanding customer service and extensive suite of truckload services, and effectively price fuel surcharges. In our pursuit to be best in class, we survey our customers and identify areas where we can accelerate the capture of new freight opportunities, improve our customers’ experience, and profit from enhancing the value our customers receive. We are continuously refining our freight management tools to allocate our equipment to more profitable loads and complementary lanes. In addition to growth in our core over-the-road dry van truckload business, we are targeting expansion in the following areas: | |
Dedicated Services and Private Fleet Outsourcing | Dedicated contracts are often used by our customers with high-service and high-priority freight, sometimes to replace private fleets previously operated by them. The size and scale of our fleet and terminal network allows us to provide the equipment availability and high service levels required for dedicated contracts. We believe these opportunities will increase in times of scarce capacity in the truckload industry. |
Temperature-controlled | With the acquisition of Central, we are now able to compete in the over-the-road temperature-controlled business to complement our dedicated temperature-controlled and our over-the-road dry van service offerings. Growth in the temperature-controlled market has kept pace with the dry van market over the past ten years, and many of our current customers have a need for this service. We believe the scale provided by the Central Acquisition and our ability to penetrate our existing customer base will provide us future opportunities in this growing market. |
Cross-border United States/Mexico and United States/Canada Freight | The combination of our United States, cross-border, customs brokerage, and Mexican operations enables us to provide efficient door-to-door service between the United States and Mexico, as well as Canada. We believe our sophisticated load security measures, as well as our DHS status as a C-TPAT carrier, allow us to offer more efficient service than most competitors and afford us substantial advantages with major cross-border United States/Mexico and United States/Canada shippers. |
Freight Brokerage and Logistics | We believe we have a substantial opportunity to continue to increase our non-asset-based freight brokerage and logistics services. We believe many customers increasingly seek transportation companies that offer both asset-based and non-asset-based services to ensure additional certainty that safe, secure and timely truckload service will be available on demand. We intend to continue growing our transportation management and freight brokerage capability to build market share, earn marginal revenue on more loads, and preserve our assets for the most attractive lanes and loads. |
Intermodal | We have favorable intermodal agreements with most major North American rail carriers, which have helped increase our volumes through more competitive pricing. Our intermodal presence, which expanded to service Mexico in 2013, complements our regional operating model and allows us to better serve customers in longer haul lanes and reduce our investment in fixed assets. Our intermodal fleet has more than doubled its size since its inception in 2005. In the latter half of 2014, we added over 400 containers. With these additions, our capacity totals 9,150 containers as of December 31, 2015. |
Increase Asset Productivity and Return on Capital | |
Because of our size and operating leverage, even small improvements in our asset productivity and yield can have a significant impact on our operating results. We believe we have substantial opportunity to improve the productivity and yield of our existing assets as follows: | |
Disciplined Tractor Fleet Growth | We will continue to focus on maintaining discipline regarding the timing and extent of company tractor fleet growth, based on availability of high-quality freight. |
Process Improvement and System Integration | Successful implementation of process improvements and effective systems integration will achieve more efficient utilization of our tractors, trailers, and drivers' available hours of service. For example, our entire tractor fleet is retrofitted with ELDs, which we believe can help us more efficiently utilize our drivers' available hours-of-service. |
Tractor Utilization | We use equipment pools, relays, team drivers and similar measures to improve company tractor utilization. |
Owner-operator Trucking Capacity | On average, owner-operators produce higher weekly revenue per tractor than company drivers. As such, we continue to work on increasing the percentage of our trucking capacity provided by owner-operators. |
Elimination of Unproductive Assets | Our return on capital improves as we successfully eliminate unproductive assets. |
8
Continue to Focus on Efficiency and Cost Control | |
To ensure that we respond appropriately to economic change, we closely manage our costs and capital resources and continually monitor the economic environment, as well as its potential impact on our customers and end-markets. We presently have ongoing efforts in the following areas that we expect will yield benefits in future periods: | |
Tractor Capacity | In order to balance freight flows and reduce deadhead miles, we manage the flow of our tractor capacity through our network. |
Driver Satisfaction | Improving driver satisfaction typically reduces turnover costs and improves performance. We believe our driver development programs, including our driver academies and nationwide recruiting, will become increasingly advantageous to us in countering attrition effects stemming from noncompliance with internal policies and procedures, as well as recent regulatory initiatives (discussed below). In addition, we believe that the negative impact of such regulations will be partially mitigated by our average length of haul, regional terminal network, and less mileage-intensive operations, such as intermodal, dedicated, brokerage, and cross-border operations. |
Waste Reduction | Reducing waste in shop methods and procedures and in other administrative processes remains important to us. |
Pursue Selected Acquisitions | |
From time to time, we take advantage of opportunities to add complementary operations to our company by pursuing acquisitions. Acquisitions can provide us an opportunity to expand our fleet with customer revenue and drivers already in place. In our history, we have completed 13 acquisitions, including Central in 2013, most of which were immediately integrated into our existing business. Given our size in relation to most competitors, we expect most future acquisitions to be integrated quickly. | |
We believe that by achieving profitable revenue growth, improving asset utilization, continuing to control costs, and streamlining our processes, we will be able to grow our Adjusted EPS and our return on net assets, while generating free cash flow to reinvest in our business, repay debt, reduce our leverage ratio and return capital to our stockholders. These goals are in part dependent on continued improvement in industry-wide truckload volumes and pricing. Although we expect the economic environment and capacity constraints in our industry to support achievement of our goals, we have limited ability to affect industry volumes and pricing and cannot provide assurance that this environment will sustain. Nevertheless, we believe our competitive strengths and the current supply and demand environment in the truckload industry are aligned to support the achievement of our goals through the strategies outlined above.
Information by Segment and Geography |
• | Segments — Our four reportable segments are Truckload, Dedicated, Swift Refrigerated (formerly Central Refrigerated) and Intermodal. Segment information is provided in Notes 2 and 25 to the consolidated financial statements, including accounting and reporting policy, segment definitions, and financial information. Supplementary segment information is available in Part II, Item 7, "Management's Discussion and Analysis of Financial Condition and Results of Operations." |
• | Geography — The required disclosures relating to revenue and long-lived assets by geography are included in Note 25 to the consolidated financial statements. Income tax information by geography is included in Note 20 to the consolidated financial statements. |
Customers and Marketing |
• | Customers — Our customers are typically large corporations in the retail (including discount and online retail), food and beverage, consumer products, paper products, transportation and logistics, housing and building, automotive, and manufacturing industries. Many of our customers have extensive operations, geographically distributed locations, and diverse shipping needs. Customer satisfaction is an important priority for us, which is demonstrated by the numerous "carrier of the year" or similar awards received from our customers over the past several years. Such achievements have helped us maintain a large and stable customer base featuring Fortune 500 and other leading companies from a number of different industries. Consistent with industry practice, our typical customer contracts (other than dedicated contracts) do not guarantee shipment volumes by our customers or truck availability by us. This affords us and our customers some flexibility to negotiate rates in response to changes in freight demand and industry-wide truck capacity. We believe our fleet capacity, terminal network, customer service and breadth of services offer a competitive advantage to major shippers, particularly in times of rising freight volumes when shippers must quickly access capacity across multiple facilities and regions. |
9
Customer Concentration | ||||||||||||||
(as a percentage of consolidated operating revenue) | ||||||||||||||
Largest (Wal-Mart) | Top 5 | Top 10 | Top 25 | Top 200 | ||||||||||
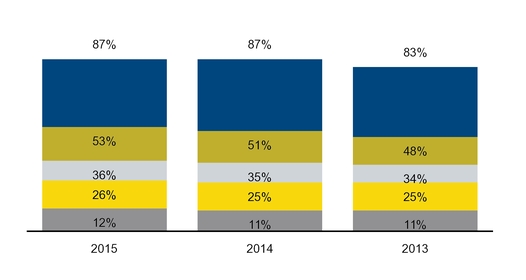
No customer, other than Wal-Mart, accounted for more than 10% of our operating revenue during 2015, 2014 or 2013.
• | Marketing — We concentrate our marketing efforts on cross-selling our extensive suite of services we provide to existing customers, as well as on establishing new customers with shipment needs that complement our terminal network and existing routes. At December 31, 2015, we had a sales staff of approximately 75 individuals across the United States, Mexico and Canada, who work closely with management to establish and expand accounts. |
Revenue Equipment |
We operate a modern company tractor fleet to help attract and retain drivers, promote safe operations, and reduce maintenance and repair costs. The following table shows the age of our owned and leased tractors and trailers as of December 31, 2015:
Model Year | Tractors (1) | Trailers | ||||
2016 | 3,546 | 4,512 | ||||
2015 | 3,085 | 6,669 | ||||
2014 | 4,084 | 4,595 | ||||
2013 | 2,078 | 4,557 | ||||
2012 | 1,318 | 3,755 | ||||
2011 | 107 | 3,191 | ||||
2010 | 17 | 111 | ||||
2009 | 352 | 4,810 | ||||
2008 | 214 | 1,934 | ||||
2007 | 104 | 154 | ||||
2006 | 98 | 5,496 | ||||
2005 and prior | 208 | 25,449 | ||||
Total | 15,211 | 65,233 | ||||
_______________
(1) Excludes 4,653 owner-operator tractors.
10
We typically purchase or lease tractors and trailers manufactured to our specifications. We follow a comprehensive maintenance program designed to reduce downtime and enhance the resale value of our equipment. We have major maintenance facilities in the following locations:
• | Phoenix, Arizona |
• | Memphis, Tennessee |
• | Greer, South Carolina |
• | West Valley City, Utah |
• | Columbus, Ohio |
• | Laredo, Texas |
In addition to these maintenance facilities, we perform routine servicing and maintenance of our revenue equipment at most of our regional terminal facilities, in an effort to avoid costly on-road repairs and deadhead miles. The contracts governing our equipment purchases typically contain specifications of equipment, projected delivery dates, warranty terms, and trade or return conditions, and are cancelable upon 60 to 90 days' notice without penalty.
In 2015, we accelerated our tractor trade-in cycle from an average of 48 to 72 months to an average of 36 to 48 months, depending on equipment type and usage. We believe that our newer equipment has enhanced features, which tend to lower the overall life cycle costs by reducing safety-related expenses, lowering repair and maintenance expenses, improving fuel economy and improving driver satisfaction. In 2016 and beyond, we will continue to monitor the appropriateness of this shorter tractor trade-in cycle against the lower capital expenditure and financing costs of a longer tractor trade-in cycle, based on current and future business needs.
Technology |
We equip virtually all of our trucks with certain OmniTRACStm technologies that enhance communication between the regional terminals and corporate headquarters, as well as the added benefits of ELDs, text-to-voice messaging, and turn-by-turn directions designed specifically for our industry. This allows us to alter driver routes rapidly, in case of urgent customer requests, adverse weather conditions, road closures or other potential delays. It also enables our drivers to timely communicate route status or the need for emergency repairs. These technologies have afforded us additional productivity, improved safety, and increased customer and driver satisfaction.
We reduce costs through programs that manage equipment maintenance, select fuel purchasing locations in our nationwide network of terminals and approved truck stops, and inform us of inefficient or undesirable driving behaviors that are monitored and reported through electronic engine sensors and cameras. We believe our technologies and systems are superior to those employed by most of our smaller competitors.
Our trailers and containers are equipped with tracking devices that monitor locations of empty and loaded equipment via satellite. Notification is sent to us if a unit is moved outside of the electronic geofence encasing on each piece of equipment. This enables us to identify unused or hijacked units, enhance our ability to charge for units detained by customers, and reduce theft.
Employees |
The strength of our company is our people, working together with common goals. There were approximately 20,800 full-time employees in our total headcount of approximately 21,000 employees as of December 31, 2015, which was comprised of:
Company drivers (including driver trainees) | 15,850 | |
Technicians and other equipment maintenance personnel | 1,200 | |
Support personnel (such as corporate managers, sales, and administrative personnel) | 3,950 | |
Total | 21,000 | |
As of December 31, 2015, our 819 Trans-Mex drivers in Mexico were our only employees represented by a union.
• | Company Drivers — All of our drivers must meet specific guidelines relating primarily to safety records, driving experience, and personal evaluations, including a physical examination and mandatory drug and alcohol testing. Upon hire, drivers are trained in our policies, operations, safety techniques, and fuel-efficient operation of the equipment. All new drivers must pass a safety test and have a current CDL. In addition, we have ongoing driver efficiency and safety programs to ensure that our drivers comply with our safety procedures. |
We have established eight driver academies across the United States. Our academies are strategically located in areas where external driver-training organizations were lacking. In other areas of the United States, we have contracted with driver-training schools, which are managed by third parties. There are certain minimum qualifications for candidates to be accepted into the
11
academy, including passing the DOT physical examination and drug/alcohol screening. Students are required to complete three weeks of instructor-led study/training and then spend a minimum of 200 behind-the-wheel hours, driving with an experienced trainer.
In order to attract and retain qualified drivers and promote safe operations, we purchase high quality tractors equipped with optional comfort and safety features. We base our drivers at terminals and monitor each driver’s location in order to schedule routing for our drivers so they can return home regularly. The majority of company drivers are compensated based on industry standard dispatched miles, loading/unloading, and number of stops or deliveries, plus bonuses. The driver’s base pay per mile increases with the driver’s length of experience. Our driver ranking system measures safety, compliance, customer service, and number of miles driven. Higher rankings provide drivers with additional benefits and/or privileges, such as special recognition, the ability to self-select freight, and the opportunity for increased pay.
Upon enrollment eligibility, drivers employed by us may participate in company-sponsored health, life and dental insurance plans and participate in our 401(k) and employee stock purchase plans.
• | Terminal Staff — Our larger terminals are staffed with terminal leaders, fleet leaders, driver leaders, planners, safety coordinators and customer service representatives. Our terminal leaders work with driver leaders, customer service representatives, and other operations personnel to coordinate the needs of both our customers and our drivers. Terminal leaders are also responsible for soliciting new customers and serving existing customers in their areas. Each fleet leader supervises approximately five driver leaders at our larger terminals. Each driver leader is responsible for the general operation of approximately 40 trucks and their drivers, focusing on driver retention, productivity per truck, routing, fuel consumption and efficiency, safety, and scheduled maintenance. Customer service representatives are assigned specific customers to ensure specialized, high-quality service and frequent customer contact. |
Owner-Operators |
In addition to Swift-employed company drivers, we enter into contractor agreements with third parties who own and operate tractors (or hire their own drivers to operate the tractors) that service our customers. We pay these owner-operators for their services, based on a contracted rate per mile. By operating safely and productively, owner-operators can improve their own profitability and ours. Owner-operators are responsible for most costs incurred for owning and operating their tractors. For convenience, we offer owner-operators maintenance services at our in-house shops and fuel at our terminals at competitive and attractive prices. As of December 31, 2015, owner-operators comprised approximately 23% of our total fleet, as measured by tractor count.
We offer tractor financing to independent owner-operators through our financing subsidiaries. Our financing subsidiaries generally lease premium equipment from the original equipment manufacturers and sublease the equipment to owner-operators. The owner-operators are qualified for financing, based on their driving and safety records. In the event of default, our financing subsidiaries have the option to repossess the tractor and sublease it to a replacement owner-operator.
Safety and Insurance |
Insurance | Limits |
Automobile Liability, General Liability, and Excess Liability | $350.0 million of coverage per occurrence ($250.0 million through October 31, 2015, subject to a $10.0 million per-occurrence, self-insured retention) |
Cargo Damage and Loss | $2.0 million limit per truck or trailer with a $10.0 million limit per occurrence; provided that there is a $250 thousand limit for tobacco loads and a $250 thousand deductible |
Property and Catastrophic Physical Damage | $150.0 million limit for property and $100.0 million limit for vehicle damage, excluding over the road exposures, subject to a $1.0 million deductible |
Workers' Compensation/Employers' Liability | Statutory coverage limits; employers' liability of $1.0 million bodily injury by accident and disease, subject to a $5.0 million self-insured retention for each accident or disease |
Employment Practices Liability | Primary policy with a $10.0 million limit subject to a $2.5 million self-insured retention, plus an excess liability policy that provides coverage for the next $17.5 million of liability for a total coverage limit of $27.5 million |
Health Care | As of January 1, 2015, we are fully insured on our medical benefits, subject to contributed premiums. Prior to January 1, 2015, we had a $500 thousand specific deductible with an aggregating individual deductible of $150 thousand beginning January 1, 2013, of each employee health care claim, as well as commercial insurance for the balance. |
12
We insure certain casualty risks through our wholly-owned captive insurance subsidiaries, Mohave and Red Rock. Mohave and Red Rock provide reinsurance associated with a share of our automobile liability risk. In addition to insuring a proportionate share of our corporate casualty risk, Mohave provides reinsurance coverage to third-party insurance companies associated with our affiliated companies’ owner-operators.
While under dispatch and our operating authority, the owner-operators we contract with are covered by our liability coverage and self-insurance retention limits. However, each is responsible for physical damage to his or her own equipment, occupational accident coverage and liability exposure while the truck is used for non-company purposes. Additionally, fleet operators are responsible for any applicable workers’ compensation requirements for their employees.
We regulate the speed of our company tractors to a maximum of 62 miles per hour and for safety reasons have contractually agreed with owner-operators to limit their speed to 68 miles per hour. These adopted speed limits are below the limits established by statute in many states. We believe our adopted speed limits for company drivers reduce the frequency and severity of accidents, enhance fuel efficiency, and reduce maintenance expense, when compared to operating without our imposed speed limits. Substantially all of our company tractors are equipped with electronically-controlled engines that are set to limit the speed of the vehicle.
Fuel |
We actively manage our fuel purchasing network in an effort to maintain adequate fuel supplies and reduce our fuel costs. Additionally, we utilize a fuel surcharge program to pass a majority of increases in fuel costs to our customers. In 2015, we purchased 17% of our fuel in bulk at 57 Swift and dedicated customer locations across the United States and Mexico. We purchased substantially all of the remainder through a network of retail truck stops with which we have negotiated volume purchasing discounts. The volumes we purchase at terminals and through the fuel network vary based on procurement costs and other factors. We seek to reduce our fuel costs by routing our drivers to truck stops when fuel prices at such stops are cheaper than the bulk rate paid for fuel at our terminals. We store fuel in underground storage tanks at two of our bulk fueling terminals and in above-ground storage tanks at our other bulk fueling terminals. We believe that we are sufficiently in compliance with applicable environmental laws and regulations relating to the storage and dispensing of fuel.
Seasonality |
In the truckload industry, results of operations generally show a seasonal pattern. As customers ramp up for the year-end holiday season, the late third and fourth quarters have historically been our strongest volume quarters. As customers reduce shipments after the winter holiday season, the first quarter has historically been a lower volume quarter for us than the other three quarters. In recent years, the macro consumer buying patterns combined with shippers’ supply chain management, which historically contributed to the fourth quarter "peak" season, continued to evolve. As a result, our fourth quarter 2015, 2014 and 2013 volumes were more evenly disbursed throughout the quarter rather than peaking early in the quarter. In the eastern and mid-western United States, and to a lesser extent in the western United States, during the winter season our equipment utilization typically declines and operating expenses generally increase, with fuel efficiency declining because of engine idling and severe weather sometimes creating higher accident frequency, increased claims, and more equipment repairs. Revenue may also be affected by holidays as a result of curtailed operations or vacation shutdowns, because our revenue is directly related to available working days of shippers. From time to time, we also suffer short-term impacts from severe weather and similar events, such as tornadoes, hurricanes, blizzards, ice storms, floods, fires, earthquakes, and explosions that could harm our results of operations or make our results of operations more volatile.
Environmental Regulation |
General — We have bulk fuel storage and fuel islands at many of our terminals, as well as vehicle maintenance, repair, and washing operations at some of our facilities, which exposes us to certain environmental risks. Soil and groundwater contamination have occurred at some of our facilities in prior years, for which we have been responsible for remediating the environmental contamination. Also, less than one percent of our total shipments contain hazardous materials, which are generally rated as low- to medium-risk. In the past, we have been responsible for the costs of clean-up of cargo and diesel fuel spills caused by traffic accidents or other events.
We have instituted programs to monitor and mitigate environmental risks and maintain compliance with applicable environmental laws dealing with the hauling, handling and disposal of hazardous materials, fuel spillage or seepage, emissions from our vehicles and facilities, engine-idling, discharge and retention of storm water, and other environmental matters. As part of our safety and risk management program, we periodically perform internal environmental reviews. We are a Charter Partner in the EPA’s SmartWay Transport Partnership, a voluntary program promoting energy efficiency and air quality. We believe that our operations are sufficiently in compliance with current laws and regulations and do not know of any existing environmental condition that would reasonably be expected to have a material adverse effect on our business or operating results.
13
If we are held responsible for the cleanup of any environmental incidents caused by our operations or business, or if we are found to be in violation of applicable laws or regulations, we could be subject to liabilities, including substantial fines or penalties or civil and criminal liability. We have paid penalties for spills and violations in the past.
Greenhouse Gas Emissions and Fuel Efficiency Standards — In 2008 the State of California's Air Resources Board ("ARB") approved the Heavy-Duty Vehicle GHG Emission Reduction Regulation in efforts to reduce GHG emissions from certain long-haul tractor-trailers that operate in California by requiring them to utilize technologies that improve fuel efficiency (regardless of where the vehicle is registered). The regulation required owners of long-haul tractors and 53-foot trailers to replace or retrofit their vehicles with aerodynamic technologies and low rolling resistance tires. The regulation also contained certain emissions and registration standards for refrigerated trailer operators.
Thereafter, the United States EPA and the National Highway Traffic Safety Administration ("NHTSA") began taking coordinated steps in support of a new generation of clean vehicles and engines through reduced GHG emissions and improved fuel efficiency at a national level.
• | Phase 1: In September 2011, the United States EPA finalized federal regulations for controlling GHG emissions, beginning with model-year 2014 medium- and heavy-duty engines and vehicles and increasing in stringency through model-year 2018. The federal regulations relate to efficient engines, use of auxiliary power units, mass reduction, low rolling resistance tires, improved aerodynamics, improved transmissions and reduced accessory loads. |
In December 2013, California's ARB approved regulations to align its GHG emission standards and test procedures, as well as its tractor-trailer GHG regulation, with the federal Phase 1 GHG regulation.
• | Phase 2: In June 2015, the EPA and NHTSA, working in concert with California's ARB, formally announced a proposed national program establishing Phase 2 of the GHG emissions and fuel efficiency standards for medium- and heavy-duty vehicles for model-year 2018 and beyond. Phase 2 builds upon Phase 1, and would apply to certain trailer types beginning with model-year 2018 for EPA standards (voluntary for NHTSA standards through model-year 2020). Tractors and certain trailer types would be subject to the Phase 2 standards beginning with model-year 2021, increasing in stringency through model-year 2024, and phasing in completely by model-year 2027. |
Current and proposed GHG regulations could impact us by increasing the cost of new tractors, impairing productivity, and increasing our operating expenses.
Climate-change Proposals — Federal and state lawmakers are considering a variety of climate-change proposals related to carbon emissions and GHG emissions. The proposals could potentially limit carbon emissions for certain states and municipalities, which continue to restrict the location and amount of time that diesel-powered tractors (like ours) may idle.
Industry Regulation |
Our operations are regulated and licensed by various federal, state and local government agencies in North America, including the DOT, the FMCSA, and the DHS, among others. Our company, as well as our drivers and contracted owner-operators, must comply with enacted governmental regulations regarding safety, equipment, environmental protection, and operating methods. Examples include regulation of equipment weight, equipment dimensions, fuel emissions, driver hours-of-service, driver eligibility requirements, on-board reporting of operations, and ergonomics. The following discussion presents recently enacted federal, state and local regulations that have an impact on our operations.
• | Hours-of-service — In December 2011, the FMCSA released its final rule on hours-of-service, which was effective on July 1, 2013. The key provisions included: |
◦ | retaining the current 11-hour daily driving time limit; |
◦ | reducing the maximum number of hours a truck driver can work within a week from 82 hours to 70 hours; and |
◦ | limiting the number of consecutive driving hours a truck driver can work to eight hours before requiring the driver to take a 30 minute break. |
Since 2004 the hours-of-service rules allowed drivers to restart their duty-cycle clocks every 34 hours to begin a new work week. From July 2013 through December 2014, the FMCSA required that drivers include 1:00 a.m. to 5:00 a.m. on consecutive days for applying the restart, which was also capped at once per week, or 168 hours. On December 13, 2014, Congress passed the fiscal year 2015 Omnibus Appropriations bill, which temporarily suspended enforcement of the 1:00 to 5:00 am provision and the 168-hour rule until September 30, 2015. The restart provision was again suspended on December 18, 2015, when Congress passed the fiscal year 2016 Omnibus Appropriations bill. All other provisions of the hours-of-service rules that went into effect on July 1, 2013 remained unchanged. A study on the effectiveness of the suspended restart provisions was recently completed. The FMCSA could move to reinstate these provisions or request that Congress remove the suspension.
14
• | BASICs — In December 2010, the FMCSA introduced a new enforcement and compliance model that ranks both fleets and individual drivers on seven categories of safety-related data, eventually replacing the current SafeStat model. The seven categories of safety-related data, known as BASICs, currently include Unsafe Driving, Fatigued Driving (hours-of-service), Driver Fitness, Controlled Substances/Alcohol, Vehicle Maintenance, Hazardous Materials Compliance, and Crash Indicator. |
Certain BASICs information was initially published and made available to carriers, as well as the general public. However, in December 2015, as part of the Fixing America's Surface Transportation ("FAST") Act, Congress mandated that the FMCSA remove all CSA scores from public view until a more comprehensive study regarding the effectiveness of BASICs improving truck safety can be completed. Swift scored within the acceptable level in the safety-related categories, based on our CSA rankings.
Implementation and effective dates are unclear, as there is currently no proposed rulemaking with respect to BASICs, leaving SafeStat the authoritative safety measurement system in effect. We currently have a satisfactory SafeStat DOT rating, which is the best available rating under the current safety rating scale.
• | Safety Fitness Determination — In January 2016, the FMCSA published a Notice of Proposed Rulemaking ("NPRM") in the Federal Register, regarding carrier safety fitness determination. The NPRM proposes new methodologies that would determine when a motor carrier is not fit to operate a CMV. Key proposed changes included in the NPRM are as follows: |
◦ | There would be only one safety rating of "unfit," as compared to the current rules, which have three safety ratings (satisfactory, conditional, and unsatisfactory). |
◦ | Carriers could be determined "unfit" by failing two or more BASICs, investigation results, or a combination of the two. |
◦ | Stricter standards would be used for BASICs with a higher correlation to crash risk (Unsafe Driving and Hours-of-Service Compliance). |
◦ | All investigation results would be used, not just results from comprehensive on-site reviews. |
◦ | Violations of a revised list of "critical" and "acute" safety regulations would result in failing a BASIC. |
◦ | Carriers would be assessed monthly. |
The FMCSA estimates that the proposed rule would increase the number of carriers determined to be "unfit" by more than two and a half times.
• | Moving Ahead for Progress in the 21st Century Bill — On July 6, 2012, Congress passed the Moving Ahead for Progress in the 21st Century bill into law. Included in the highway bill was a provision that mandates ELDs in commercial motor vehicles to record hours-of-service. During 2012, the FMCSA published a Supplemental NPRM, announcing its plan to proceed with the ELDs and hours-of-service supporting documents rulemaking. In December 2015, the ELD rule became final, as published in the Federal Register. Although the final ELD rule may have a large impact on the industry as a whole, we do not expect a significant impact on Swift, as we previously installed ELDs in our operational trucks in conjunction with our efforts to improve efficiency and communications with drivers and owner-operators. |
• | Prohibiting Coercion of Commercial Motor Vehicle Drivers — In November 2015, the Prohibiting Coercion of Commercial Motor Vehicle Drivers rule became final, as published in the Federal Register and adopted by the FMCSA. The rule explicitly prohibits motor carriers from coercing drivers to violate certain FMCSA regulations, including driver hours-of-service limits, CDL regulations, drug and alcohol testing rules, and hazardous materials regulations, among others. Under the new rule, drivers can report incidents of coercion to the FMCSA, who is authorized to issue penalties against the motor carrier. |
Other Regulation |
• | The TSA — In the aftermath of the September 11, 2001 terrorist attacks, federal, state and municipal authorities implemented and continue to implement various security measures on large trucks, including checkpoints and travel restrictions. The TSA adopted regulations that require drivers applying for or renewing a license for carrying hazardous materials to obtain a TSA determination that they are not a security threat. |
• | WOTC — In December 2014, United States President, Barack Obama, signed the Tax Increase Prevention Act of 2014 ("TIPA"). Among other things, TIPA extended 50% bonus depreciation and the Work Opportunity Tax Credit ("WOTC"). In December 2015, President Obama signed the Protecting Americans from Tax Hikes ("PATH") Act of 2015. Among other things, PATH further extended 50% bonus depreciation and WOTC. The financial impact of these regulations is discussed in Note 20 in Part II, Item 8. |
15
Available Information |
General information about Swift is provided, free of charge, on our website, www.swifttrans.com. This website also includes our annual reports on Form 10-K with accompanying XBRL documents, quarterly reports on Form 10-Q with accompanying XBRL documents, current reports on Form 8-K, and amendments to those reports that are filed or furnished pursuant to Section 13(a) or 15(d) of the Securities Exchange Act of 1934, as soon as reasonably practicable once the material is electronically filed or furnished to the SEC.
ITEM 1A. | RISK FACTORS |
When evaluating our company, the following risks should be considered in conjunction with the other information contained in this annual report on Form 10-K. If we are unable to mitigate and/or are exposed to any of the following risks in the future, then there could be a material, adverse effect on our business, results of operations, or financial condition.
Strategic Risk |
The truckload industry is affected by economic and business risks that are largely beyond our control.
The truckload industry is highly cyclical, and our business is dependent on a number of factors that may have a negative impact on our results of operations, many of which are beyond our control. We believe that some of the most significant of these factors are economic changes that affect supply and demand in transportation markets, such as:
• | recessionary economic cycles, such as the period from 2007 to 2009; |
• | changes in customers’ inventory levels, including shrinking product/package sizes, and in the availability of funding for their working capital; |
• | excess tractor capacity in comparison with shipping demand; and |
• | downturns in customers’ business cycles. |
The risks associated with these factors are heightened when the United States economy is weakened. Some of the principal risks during such times, which we experienced during the recent recession, are as follows:
• | low overall freight levels, which may impair our asset utilization; |
• | customers with credit issues and cash flow problems; |
• | changing freight patterns from redesigned supply chains, resulting in an imbalance between our capacity and customer demand; |
• | customers bidding out freight or selecting competitors that offer lower rates, in an attempt to lower their costs, forcing us to lower our rates or lose freight; and |
• | more deadhead miles incurred to obtain loads. |
We also are subject to cost increases outside our control that could materially reduce our profitability if we are unable to increase our rates sufficiently.
In addition, events outside our control, such as strikes or other work stoppages at our facilities or at customer, port, border, or other shipping locations, actual or threatened armed conflicts or terrorist attacks, efforts to combat terrorism, military action against a foreign state or group located in a foreign state, or heightened security requirements could lead to reduced economic demand, reduced availability of credit, or temporary closing of shipping locations or United States borders.
The truckload industry is highly competitive and fragmented, which subjects us to competitive pressures pertaining to pricing, capacity, and service.
Our operating segments compete with many truckload carriers, and some LTL carriers, railroads, logistics, brokerage, freight forwarding, and other transportation companies. Additionally, some of our customers may utilize their own private fleets rather than outsourcing loads to us. Some of our competitors may have greater access to equipment, a wider range of services, greater capital resources, less indebtedness, or other competitive advantages. Numerous competitive factors could impair our ability to maintain or improve our profitability. These factors include the following:
• | Many of our competitors periodically reduce their freight rates to gain business, especially during times of reduced growth in the economy. This may make it difficult for us to maintain or increase freight rates, or may require us to reduce our freight rates, or lose freight. Additionally, it may limit our ability to maintain or expand our business. |
• | Since some of our customers also operate their own private trucking fleets, they may decide to transport more of their own freight. |
• | Some shippers have selected core carriers for their shipping needs, for which we may not be selected. |
• | Many customers periodically solicit bids from multiple carriers for their shipping needs, which may depress freight rates or result in a loss of business to competitors. |
16
• | The continuing trend toward consolidation in the trucking industry may result in more large carriers with greater financial resources and other competitive advantages, with which we may have difficulty competing. |
• | Higher fuel prices and higher fuel surcharges to our customers may cause some of our customers to consider freight transportation alternatives, including rail transportation. |
• | Competition from freight logistics and brokerage companies may negatively impact our customer relationships and freight rates. |
• | Smaller carriers may build economies of scale with procurement aggregation providers, which may improve the smaller carriers’ abilities to compete with us. |
Our company strategy includes pursuing selected acquisitions; however, we may not be able to execute or integrate future acquisitions successfully.
Historically, a key component of our growth strategy has been to pursue acquisitions of complementary businesses, for example, the Central Acquisition. Although we currently do not have any additional acquisition plans, we expect to consider acquisitions in the future. Current or future acquisition and integration of target companies may negatively impact our business, financial condition, and results of operations because:
• | The business may not achieve anticipated revenue, earnings, or cash flows. |
• | We may assume liabilities beyond our estimates or what was disclosed to us. |
• | We may be unable to integrate successfully and realize the anticipated economic, operational, and other benefits in a timely manner, which could result in substantial costs and delays or other operational, technical, or financial problems. |
• | The acquisition could disrupt our ongoing business, distract our management, and divert our resources. |
• | We may have limited experience in the acquiree's market and may experience difficulties operating in its market. |
• | There is a potential for loss of customers, employees, and drivers of the acquired company. |
• | We may incur indebtedness or issue additional shares of stock. |
Operational Risk |
Consistent with industry trends, we face challenges with attracting and retaining qualified company drivers and owner-operators.
Recent driver shortages have required, and could continue to require, us to spend more for hiring, including recruiting and advertising. Our challenge with attracting and retaining qualified drivers stems from intense market competition, which subjects us to increased payments for driver compensation and owner-operator contracted rates. In 2014 and 2015, we increased these rates to better attract and retain drivers. To the extent that the economy improves, we expect that we would need to continue to increase driver compensation and owner-operator contracted rates in order to remain competitive. Our high driver turnover rate (especially within 90 days of hire) requires us to continually recruit a substantial number of drivers in order to operate existing revenue equipment. If we do not attract and retain enough drivers, we could be forced to operate with fewer trucks. This would likely erode our size and profitability.
Our contractual agreements with owner-operators expose us to risks that we do not face with our company drivers.
Our financing subsidiaries offer financing to some of the owner-operators we contract with to purchase tractors from us. If these owner-operators default or experience a lease termination in conjunction with these agreements and we cannot replace them, we may incur losses on amounts owed to us. Also, if liquidity constraints or other restrictions prevent us from providing financing to the owner-operators we contract with in the future, then we could experience a shortage of owner-operators. This would be detrimental to our efforts to maximize our capacity contracted out to owner-operators.
Pursuant to our fuel reimbursement program with owner-operators, when fuel prices increase above a certain level, we share the cost with the owner-operators we contract with in order to mute the impact that increasing fuel prices may have on their business operations. A significant increase or rapid fluctuation in fuel prices could cause our reimbursement costs under this program to be higher than the revenue we receive under our customer fuel surcharge programs.
Owner-operators are third-party service providers, as compared to company drivers, who are employed by Swift. As independent business owners, the owner-operators we contract with may make business or personal decisions that conflict with the best interests of Swift. For example, if a load is unprofitable, route distance is too far from home, personal scheduling conflicts arise, or for other reasons, owner-operators may deny loads of freight from time to time. In these circumstances, Swift must be able to timely deliver the freight in order to maintain relationships with customers.
17
We depend on key personnel to manage our business and operations.
Our success depends on our ability to retain our executive officers, including Jerry Moyes (our founder and CEO), Richard Stocking (our President and COO), and Virginia Henkels (our CFO). Inadequate succession planning or unexpected departure of key executive officers could cause substantial disruption to our business operations, deplete our institutional knowledge base and erode our competitive advantage. We do not currently have employment agreements with any of our management, including Mr. Moyes. We believe that the executive officers identified above possess valuable knowledge about the trucking industry and that their knowledge and relationships with our key customers and vendors would be very difficult to replicate. Although we believe we could replace key personnel, we may not be able to do so without incurring substantial costs.
Our ability to offer intermodal and brokerage services could be limited if we experience performance instability from third parties we use in those businesses.
Our intermodal business utilizes railroads and some third-party drayage carriers to transport freight for our customers. In most markets, rail service is limited to a few railroads or even a single railroad. Our ability to provide intermodal services in certain traffic lanes would be reduced or eliminated if the railroads' services became unstable. The cost of our rail-based services would likely increase, and the reliability, timeliness and overall attractiveness of these services would likely decrease. Furthermore, railroads increase shipping rates as market conditions permit. Price increases could result in higher costs to our customers and negatively impact the demand for our intermodal services. In addition, we may not be able to negotiate additional contracts with railroads to expand our capacity, add additional routes, or obtain multiple providers, which could limit our ability to provide this service.
Our brokerage business is dependent upon the services of third-party capacity providers, including other truckload carriers. These third-party providers seek other freight opportunities and may require increased compensation in times of improved freight demand or tight trucking capacity. Our inability to secure the services of these third parties, or increases in the prices we must pay to secure such services, could have an adverse effect on our operations and profitability.
We are dependent on computer and communications systems; and a systems failure or data breach could cause a significant disruption to our business.
Our business depends on the efficient and uninterrupted operation of our computer and communications hardware systems and infrastructure. We currently maintain our computer system at our Phoenix, Arizona headquarters, along with computer equipment at each of our terminals. Our operations and those of our technology and communications service providers are vulnerable to interruption by fire, earthquake, natural disasters, power loss, telecommunications failure, terrorist attacks, Internet failures, computer viruses, data breaches (including cyber-attacks or cyber intrusions over the Internet, malware and the like) and other events generally beyond our control. We mitigate the risk of business interruption by maintaining redundant computer systems, redundant networks, and backup systems at alternative locations. However, these alternative locations are subject to some of the same interruptions that may affect the Phoenix headquarters. In the event of a significant system failure, our business could experience significant disruption.
Seasonality, weather and other catastrophic events affect our operations and profitability.
We discuss seasonality and weather events that affect our business in Part I, Item 1, under "Seasonality." These events and other catastrophic events may disrupt fuel supplies, increase fuel costs, disrupt freight shipments or routes, affect regional economies, damage or destroy our assets, or adversely affect the business or financial condition of our customers, any of which could harm our results or make our results more volatile.
Compliance Risk |
Since our industry is highly regulated, we may inadvertently violate existing or future regulations or be adversely affected by changes to existing regulations.
We have the authority to operate in the continental United States (as granted by the DOT), Mexico (as granted by the Secretaría de Comunicaciones y Transportes), and various Canadian provinces (as granted by the Ministries of Transportation and Communications in such provinces). Our company, as well as our drivers and contracted owner-operators, must comply with enacted governmental regulations regarding safety, equipment, environmental protection, and operating methods. Examples include regulation of equipment weight, equipment dimensions, fuel emissions, driver hours-of-service, driver eligibility requirements, on-board reporting of operations, and ergonomics. We may also become subject to new or more restrictive regulations related to safety or operating methods. We discuss several proposed and pending regulations that could impact our operations in Part I, Item 1, under "Environmental Regulation," "Industry Regulation" and "Other Regulation."
Additionally, our lease contracts with owner-operators are governed by the federal leasing regulations, which impose specific requirements on us and the owner-operators. In the past, we have been the subject of lawsuits, alleging the violation of lease agreements or failure to follow the contractual terms. It is possible that we could be subjected to similar lawsuits in the future, which could result in added liability.
18
If current or future legislation deems that owner-operators are equivalent to employees, we would incur more employee-related expenses.
Tax, federal, and other regulatory authorities have argued that owner-operators in the trucking industry are employees, rather than independent contractors. In April 2010, federal legislation was proposed that increased the recordkeeping requirements for companies that engage independent contractors and heightened the penalties to employers that misclassified individuals and violated overtime and/or wage requirements. Some states have put initiatives in place to increase their revenues from items such as unemployment, workers’ compensation, and income taxes, and a reclassification of owner-operators as employees would help states achieve this objective. Further, class actions and other lawsuits have been filed against us and others in our industry seeking to reclassify owner-operators as employees for a variety of purposes, including workers’ compensation and health care coverage. Taxing and other regulatory authorities and courts apply a variety of standards in their determination of independent contractor status. If the owner-operators we contract with are deemed employees, we would incur additional exposure under laws for federal and state tax, workers’ compensation, unemployment benefits, labor, employment, and tort. The exposure could include prior period compensation, as well as potential liability for employee benefits and tax withholdings.
Changes in rules or legislation by the NLRB or Congress and/or organizing efforts by labor unions could result in litigation, divert management attention and have a material adverse effect on our operating results.
Although our only collective bargaining agreement exists at our Mexican subsidiary, Trans-Mex, we always face the risk that our employees will try to unionize. If the owner-operators we contract with were ever re-classified as employees, the magnitude of this risk would increase. The NLRB, Congress or states could impose rules or legislation significantly affecting our business and our relationship with our employees. On December 12, 2014, the NLRB implemented a final rule amending the agency's representation-case proceedings which govern the procedures for union representation. Pursuant to this amendment, union elections can now be held within 10-21 days after the union requests a vote. These new rules make it easier for unions to successfully organize all employers, in all industries. Any attempt to organize by our employees could result in increased legal and other associated costs. In addition, if we entered into a collective bargaining agreement, the terms could negatively affect our costs, efficiency, and ability to generate acceptable returns on the affected operations.
In May of 2015, the Supreme Court of the United States refused to grant certiorari to Appellees in the United States Court of Appeals for the Ninth Circuit case, Dilts, et al. v. Penske Logistics, LLC, et al. Consequently, the Appeals Court decision stands, holding that California state wage and hour laws are not preempted by federal law. As a result, the trucking industry has been confronted with a continuous patchwork of laws at the state and local levels, related to employee rest and meal breaks. Further, driver piece rate compensation, which is an industry standard, has been attacked as not being compliant with state minimum wage laws. Both of these issues are adversely impacting the Company and the motor carrier industry as a whole, with respect to the practical application of the laws; thereby resulting in additional cost. In its individual capacity, as well as participating with industry trade organizations, the Company supports and is actively pursuing legislative relief through Congress. The Company believes enacting legislation clarifying the preemptive scope of federal transportation law and regulations, as originally contemplated by Congress, would eliminate much of the current wage and hour confusion along with lessening the burden on interstate commerce. The passage of federal legislation involves the political process and is uncertain. Existing state and local laws, as well as new laws adopted in the future, which are not preempted by federal law, may result in increased labor costs, driver turnover, reduced operational efficiencies and amplified legal exposure.
CSA rulemaking could adversely affect us, including our ability to maintain or grow our fleet, as well as our customer relationships.
Under CSA, drivers and fleets are evaluated and ranked based on certain safety-related standards. The current methodology for determining a carrier’s DOT safety rating has been expanded, and as a result, certain current and potential drivers may no longer be eligible to drive for us. Additionally, our safety rating could be adversely affected. We recruit and retain a substantial number of first-time drivers. These drivers may have a higher likelihood of creating adverse safety events under CSA. A reduction in eligible drivers or a poor fleet ranking may result in difficulty attracting and retaining qualified drivers. This could cause our customers to transition to carriers with higher fleet rankings, and away from us.
Our captive insurance companies are subject to substantial government regulation.
Our captive insurance companies are regulated by state authorities. State regulations generally provide protection to policy holders, rather than stockholders, and generally involve:
• | approval of premium rates for insurance; |
• | standards of solvency; |
• | minimum amounts of statutory capital surplus that must be maintained; |
• | limitations on types and amounts of investments; |
• | regulation of dividend payments and other transactions between affiliates; |
• | regulation of reinsurance; |
19
• | regulation of underwriting and marketing practices; |
• | approval of policy forms; |
• | methods of accounting; and |
• | filing of annual and other reports with respect to financial condition and other matters. |
These regulations may increase our costs of regulatory compliance, limit our ability to change premiums, restrict our ability to access cash held in our captive insurance companies, and otherwise impede our ability to take actions we deem advisable.
We are subject to certain risks arising from doing business in Mexico.
We have a growing operation in Mexico, through our wholly-owned subsidiary, Trans-Mex, which subjects us to general international business risks, including:
• | foreign currency fluctuation; |
• | changes in the economic strength of Mexico; |
• | difficulties in enforcing contractual obligations and intellectual property rights; |
• | burdens of complying with a wide variety of international and Unites States export, import and business procurement laws; and |
• | social, political and economic instability. |
In addition, if we are unable to maintain our C-TPAT status, we may have significant border delays. This could cause our Mexican operations to be less efficient than those of competitor truckload carriers that have C-TPAT status and operate in Mexico. We also face additional risks associated with our foreign operations, including restrictive trade policies and imposition of duties, taxes, or government royalties imposed by the Mexican government, to the extent not preempted by the terms of the North American Free Trade Agreement.
Financial Risk |
A material portion of our revenue is concentrated in a group of major customers. As such, we would be adversely affected if we lost one or more of these major customers.
Our revenue is concentrated in a group of major customers, as discussed in Part I, Item 1, under "Customers and Marketing." Retail and discount retail customers account for a substantial portion of our freight, creating a dependency on consumer spending and retail sales for us. Given this, our results may be more susceptible to trends in unemployment and retail sales than carriers that do not have this concentration.
Economic conditions and capital markets may adversely affect our customers and their ability to remain solvent. Our customers’ financial difficulties can negatively impact our results of operations and financial condition if they were to curtail their operations or delay or default on their payments to us. Aside from our Dedicated segment, we generally do not have contractual relationships that guarantee any minimum volumes with our customers, and we cannot provide assurance that our customer relationships will continue. Our Dedicated segment is generally subject to longer-term written contracts than our Truckload segment business; however, certain of these contracts contain cancellation clauses. There is no assurance that any of our customers will continue to utilize our services, renew our existing contracts, or continue at the same volume levels.
We have significant ongoing capital requirements that necessitate sufficient cash flow from operations and/or obtaining financing on favorable terms.
The truckload industry is capital intensive. Historically, we have depended on cash from operations, borrowings from banks and finance companies, issuances of notes, and leasing activities to expand the size of our terminal network and upgrade and expand the size of our revenue equipment fleet.
Credit markets are likely to weaken again at some point in the future, which would make it difficult for us to access our current sources of credit and difficult for our lenders to find the capital to fund us. We may need to incur additional debt, or issue debt or equity securities in the future, to refinance existing debt, fund working capital requirements, make investments, or support other business activities. Declines in consumer confidence, decreases in domestic spending, economic contractions and other trends in the credit market may impair our future ability to secure financing on satisfactory terms, or at all.
In the future, we could face inabilities with generating sufficient cash from operations, obtaining sufficient financing on favorable terms, or maintaining compliance with financial and other covenants in our financing agreements. If any of these events occur, then we may face liquidity constraints, be forced to enter into less favorable financing arrangements, or operate our revenue equipment for longer periods of time. Additionally, such events could adversely impact our ability to provide services to our customers.
20
Because our operations are dependent upon diesel fuel, fluctuations in price or availability, volume and terms of purchase commitments, and surcharge collection could materially increase our costs of operation.
Although fuel prices have recently decreased, fuel is one of our largest operating expenses. Diesel fuel prices greatly fluctuate due to factors entirely beyond our control, such as political events, terrorist activities, armed conflicts, and depreciation of the dollar against other currencies. Hurricanes and other natural or man-made disasters, such as the oil spill in the Gulf of Mexico in 2010, tend to lead to an increase in the cost of fuel. Rising demand, matched with falling supply of fuel, adversely impacts the price. Examples include rising demand in developing countries like China, diminishing supply from less drilling activity, and sharing supply with industries using crude oil and oil reserves for other purposes. These events may lead to fuel shortages and disruptions in the fuel supply chain.
Fuel is also subject to regional pricing differences and often costs more on the West Coast and in the Northeast, where we have significant operations. Increases in fuel costs, to the extent not offset by rate-per-mile increases or fuel surcharges, have an adverse effect on our operations and profitability. We obtain some protection against fuel cost increases by maintaining a fuel-efficient fleet and compensatory fuel surcharge programs with the vast majority of our customers. These fuel surcharge programs have historically helped us offset the majority of any negative impacts of rising fuel prices associated with loaded or billed miles. Our fuel surcharge recovery lags behind changes in fuel prices. As such, it may not capture the increased costs we pay for fuel, especially when prices are rising. This leads to fluctuation in our levels of reimbursement, which has occurred in the past. During periods of low freight volumes, shippers can use their negotiating leverage to impose less robust fuel surcharge policies. We cannot ensure that such fuel surcharges will be indefinitely maintained or sufficiently effective. Additionally, there are certain fuel costs that we cannot recover, despite our fuel surcharge programs, such as those associated with deadhead miles and engine idling time.
We have not historically used derivatives to mitigate volatility in our fuel costs, but periodically evaluate the benefits of employing this strategy. To mitigate the impact of rising fuel costs, we contract with some of our fuel suppliers to buy fuel at a fixed price or within banded pricing for a specified period, usually not exceeding twelve months. However, these purchase commitments only cover a small portion of our fuel consumption. Accordingly, fuel price fluctuations may still negatively impact us.
We operate a modern fleet of tractors, some of which are leased or financed. This subjects us to costs associated with increasing equipment prices, new engine design changes, volatility in the used equipment sales market, and the failure of manufacturers to meet their sale or trade-back obligations.
Our modern fleet of tractors gives us a competitive advantage in many ways. However, there are also disadvantages we face from obtaining newer equipment. For example, engines used in tractors manufactured in 2010 and after are subject to more stringent emissions control regulations issued by the EPA. We have paid higher prices for new tractors over the past few years as a result of complying with these regulations, while the resale and residual values have not increased to the same extent. Accordingly, our equipment costs, including depreciation expense per tractor, are expected to increase in future periods. To comply with the EPA’s 2010 diesel engine emissions standards, many engine manufacturers are using special equipment that needs diesel exhaust fluid. If we purchase new tractors that have this special equipment, we will be exposed to additional costs associated with price and availability of diesel exhaust fluid, the weight of the equipment, maintenance, and training our drivers to use the equipment.
We have certain revenue equipment leases and financing arrangements with balloon payments at the end of the lease term equal to the residual value the Company is contracted to receive from certain equipment manufacturers upon sale or trade back to the manufacturers. If we do not purchase new equipment that triggers the trade-back obligation, or the equipment manufacturers do not pay the contracted value at the end of the lease term, we could be exposed to losses equal to the excess of the balloon payment owed to the lease or finance company over the proceeds from selling the equipment on the open market. In addition, if we purchase equipment subject to a buy-back agreement and the manufacturer refuses to honor the agreement, or we are unable to replace equipment at a reasonable price, we may be forced to sell the equipment at a loss.
Used equipment prices are subject to substantial fluctuations based on freight demand, supply of used trucks, availability of financing, presence of buyers for export to countries such as Russia and Brazil, and commodity prices for scrap metal. These and any impacts of a depressed market for used equipment could require us to trade our revenue equipment below the carrying value. This leads to losses on disposal or impairments of revenue equipment, when not otherwise protected by residual value arrangements. Deteriorations of resale prices or trades at depressed values could cause more losses on disposal or impairment charges in future periods.
Our substantial leverage could adversely affect our ability to raise additional capital to fund our operations, limit our ability to react to changes in the economy or our industry, and prevent us from meeting our debt obligations.
As of December 31, 2015, our total outstanding long-term debt, including outstanding borrowings on the New Revolver and 2015 RSA, but excluding capital lease obligations was $1.1 billion. Since we are substantially leveraged, we could be at a competitive disadvantage compared to our competitors that are less leveraged. This could have negative consequences that include:
• | increased vulnerability to adverse economic, industry, or competitive developments; |
• | cash flows from operations that are committed to payment of principal and interest, thereby reducing our ability to use cash for our operations, capital expenditures, and future business opportunities; |
21
• | increased interest rates that would affect our variable rate debt; |
• | noncompliance with restrictive covenants, borrowing conditions, and other debt obligations, which could result in an event of default; |
• | non-strategic divestitures or inability to make strategic acquisitions; |
• | lack of financing for working capital, capital expenditures, product development, debt service requirements, acquisitions, and general corporate or other purposes; and |
• | limits on our flexibility to plan for, or react to, changes in our business, market conditions, or in the economy. |
Our debt agreements contain restrictions that limit our flexibility in operating our business.
As detailed in Note 12 to the consolidated financial statements, our senior secured credit facility agreement requires compliance with various affirmative, negative, and financial covenants. A breach of any of these covenants could result in default or (when applicable) cross-default. Upon default under our senior secured credit facility, the lenders could elect to declare all outstanding amounts to be immediately due and payable, as well as terminate all commitments to extend further credit. Such actions by those lenders could cause cross defaults with our other debt agreements. If we were unable to repay those amounts, the lenders could secure the debt with the collateral granted to them. If the lenders accelerated our debt repayments, we might not have sufficient assets to repay all amounts borrowed.
In addition, our 2015 RSA includes certain restrictive covenants and cross default provisions with respect to our senior secured credit facility. Failure to comply with these covenants and provisions may jeopardize our ability to continue to sell receivables under the facility and could negatively impact our liquidity.
Insuring risk through our captive insurance companies could adversely impact our operations.
We insure a significant portion of our risk through our captive insurance companies, Mohave and Red Rock. In addition to insuring portions of our own risk, Mohave provides reinsurance coverage to third-party insurance companies associated with our affiliated companies' owner-operators. Red Rock insures a share of our automobile liability risk. The insurance and reinsurance markets are subject to market pressures. Our captive insurance companies’ abilities or needs to access the reinsurance markets may involve the retention of additional risk, which could expose us to volatility in claims expenses.
To comply with certain state insurance regulatory requirements, cash and cash equivalents must be paid to Red Rock and Mohave as capital investments and insurance premiums, to be restricted as collateral for anticipated losses. The restricted cash is used for payment of insured claims. In the future, we may continue to insure our automobile liability risk through our captive insurance subsidiaries, which will cause increases in the required amount of our restricted cash or other collateral, such as letters of credit. Significant increases in the amount of collateral required by third-party insurance carriers and regulators would reduce our liquidity.
We face risks related to self-insurance and third-party insurance that can be volatile to our earnings.
We self-insure a significant portion of our claims exposure and related expenses for cargo loss, bodily injury, workers’ compensation and property damage, and maintain insurance with insurance companies above our limits of self-insurance. Self-insurance retention and other limitations are detailed in Part I, Item 1, under "Safety and Insurance." Our large self-insured retention limits can make our insurance and claims expense higher or more volatile. Additionally, if our third-party insurance carriers or underwriters leave the trucking sector, it could materially increase our insurance costs or collateral requirements, or create difficulties in finding insurance in excess of our self-insured retention limits.
We accrue for the costs of the uninsured portion of pending claims, based on the nature and severity of individual claims and historical claims development trends. Estimating the number and severity of claims, as well as related judgment or settlement amounts is inherently difficult. This, along with legal expenses, incurred but not reported claims, and other uncertainties can cause unfavorable differences between actual self-insurance costs and our reserve estimates. We try to limit our exposure to claims that ultimately prove to be more severe than originally assessed. However, this may not be possible if carrier subcontractors under our brokerage operations are inadequately insured for any accident.
Although we believe our aggregate insurance limits are sufficient to cover reasonably expected claims, it is possible that one or more claims could exceed those limits. In this case, we would bear the excess expense, in addition to the amount of self-insurance. Our insurance and claims expense could increase, or we could find it necessary to raise our self-insured retention or decrease our aggregate coverage limits when our policies are renewed or replaced.
Our stock price has recently declined and could continue to decline due to the large number of outstanding shares of our common stock eligible for future sale.
Sales of substantial amounts of our common stock in the public market, or the perception that these sales could occur, could cause the market price of our Class A common stock to decline. These sales also could make it more difficult for us to sell equity or equity- related securities in the future at a time and price that we deem appropriate.
22
As of December 31, 2015, we have approximately 87.8 million outstanding shares of Class A common stock, assuming no exercise of options outstanding as of the date of this report and approximately 51.0 million outstanding shares of Class B common stock that are convertible into an equal number of shares of Class A common stock. All of the Class A shares are freely tradable, except that any shares owned by "affiliates" (as that term is defined in Rule 144 under the Securities Act) may only be sold in compliance with the limitations described in Rule 144 under the Securities Act.
In addition, we have an aggregate of 4.9 million shares and 1.8 million shares of Class A common stock reserved for issuances under our 2014 Omnibus Incentive Plan and our 2012 Employee Stock Purchase Plan, respectively. Issuances of Class A common stock to our directors, executive officers and employees through exercise of stock options under our stock plans, or purchases by our executive officers and employees through our 2012 ESPP, dilute a stockholder's interest in Swift.
We could determine that our goodwill and other indefinite-lived intangibles are impaired, thus recognizing a related loss.
As of December 31, 2015, we had goodwill of $253.3 million and indefinite-lived intangible assets of $181.0 million primarily from the 2007 Transactions. We evaluate goodwill and indefinite-lived intangible assets for impairment in accordance with the accounting policies discussed in Note 2 to the consolidated financial statements. Our evaluations in 2015, 2014 and 2013 produced no indication of impairment. We could recognize impairments in the future, and we may never realize the full value of our intangible assets. If these events occur, our profitability and financial condition will suffer.
We do not currently intend to pay dividends on our Class A common stock or Class B common stock.
We do not currently anticipate paying cash dividends on our Class A common stock or Class B common stock in the near future. We anticipate that we will retain all of our future earnings, if any, for use in the development and expansion of our business, the repayment of debt, our repurchase of our Class A common stock, and for general corporate purposes. Any determination to pay dividends and other distributions in cash, stock, or property by Swift in the future will be at the discretion of our Board and will be dependent on then-existing conditions, including our financial condition and results of operations, contractual restrictions, such as restrictive covenants contained in our senior secured credit facility, capital requirements, and other factors.
Conflict of Interest Risk |
Our controlling shareholder and CEO, along with the Moyes Affiliates, control a large portion of our stock and have substantial control over us, which could limit other stockholders’ ability to influence the outcome of key transactions, including changes of control.
Our CEO, Mr. Moyes, and the Moyes Affiliates beneficially own approximately 39% of our outstanding common stock. Mr. Moyes and the Moyes Affiliates beneficially own 100% of our Class B common stock and approximately 3% of our Class A common stock. On all matters with respect to which our stockholders have a right to vote, including the election of directors, the holders of our Class A common stock are entitled to one vote per share, and the holders of our Class B common stock are entitled to two votes per share. All outstanding shares of Class B common stock are convertible to Class A common stock on a one-for-one basis at the election of the holders thereof, or automatically upon transfer to someone other than Mr. Moyes or the Moyes Affiliates.
This voting structure gives Mr. Moyes and the Moyes Affiliates approximately 55% of the voting power of all of our outstanding stock as of December 31, 2015. Furthermore, due to our dual class structure, Mr. Moyes and the Moyes Affiliates are able to control all matters submitted to our stockholders for approval even though they own less than 50% of the total outstanding shares of our common stock. This significant concentration of share ownership may adversely affect the trading price for our Class A common stock because investors may perceive disadvantages in owning stock in companies with controlling stockholders. Also, these stockholders can exert significant influence over our management and affairs and matters requiring stockholder approval, including the election of directors and the approval of significant corporate transactions, such as mergers, consolidations, or the sale of substantially all of our assets. Consequently, this concentration of ownership may have the effect of delaying or preventing a change of control, including a merger, consolidation, or other business combination involving us, or discouraging a potential acquirer from making a tender offer or otherwise attempting to obtain control, even if other stockholders perceived that change of control to be beneficial.
Because Mr. Moyes and the Moyes Affiliates control a majority of the voting power of our common stock, we qualify as a "controlled company" as defined by the NYSE and as such, we may elect not to comply with certain corporate governance requirements of this stock exchange. We do not currently intend to utilize these exemptions, but may choose to do so in the future.
Mr. Moyes has borrowed against and pledged a portion of his Class B common stock, which may cause a conflict of interests between him and our other stockholders, and adversely affect the trading price of our Class A Common Stock.
Cactus II Pledging — In July 2011 and December 2011, Cactus Holding Company II, LLC ("Cactus II"), an entity controlled by Mr. Moyes, pledged 12,023,343 shares of Class B common stock on margin as collateral for personal loan arrangements entered into by Cactus II and relating to Mr. Moyes. In connection with these December 2011 transactions, Cactus II converted 6,553,253 of the 12,023,343 pledged shares of Class B common stock into shares of Class A common stock on a one-for-one basis. During
23
2012, the Moyes Affiliates converted an additional 1,068,224 shares of Class B common stock to Class A common stock and sold 4,831,878 of these pledged Class A shares to a counter-party pursuant to a sale and repurchase agreement with a full recourse obligation to repurchase the securities at the same price on the fourth anniversary of sale. As of December 31, 2015, the Moyes Affiliates had pledged on margin 9,140,167 shares, of which 6,550,090 were Class B and 2,590,077 were Class A common stock. These pledged shares could cause Mr. Moyes’ interest to conflict with the interests of our other stockholders and could result in the future sale of such shares. Such sales could adversely affect the trading price or otherwise disrupt the market for our Class A common stock.
M Capital II VPF — In addition to the shares that were allowed to be pledged on margin pursuant to our second amended and restated securities trading policy, on October 29, 2013, an affiliate of Mr. Moyes ("M Capital II") entered into a VPF contract with Citibank, N.A. that was intended to facilitate settlement of the 2010 METS, issued in 2010 by an unaffiliated trust concurrently with the Company’s IPO, which was required to be settled with shares of the Company’s Class A common stock, or cash, on December 31, 2013. This transaction effectively replaced the 2010 METS with the VPF contract and allowed the parties to the 2010 METS transaction to satisfy their obligations under the 2010 METS (as contemplated by their terms) without reducing the number of shares owned by these parties. The VPF transaction allowed Mr. Moyes and certain of his affiliates, through their ownership of M Capital II, to participate in future price appreciation of the Company’s Common Stock, and retain the voting power of the shares collateralized to secure the VPF contract. Under the VPF contract, M Capital II was obligated to deliver to Citibank a variable amount of stock or cash during two twenty trading day periods beginning on January 4, 2016, and July 5, 2016, respectively.
Amended M Capital II VPF and Cactus VPF — On October 30, 2015, M Capital II and another Moyes Affiliate, Cactus Holding I, entered into the Amended M Capital II VPF and the Cactus VPF, respectively. The purposes of these two VPF contracts were to (i) extend the maturity date of M Capital II’s then-existing VPF with Citibank N.A. (discussed above) and (ii) generate cash proceeds for the repayment of certain stock-secured obligations of Cactus Holding II, a Moyes Affiliate, and thereby effect the release of certain shares of Class B Common Stock pledged in connection with the same.
Cactus Holding I entered into the Cactus VPF contract in respect of 3,300,000 shares of the Company's Class B Common Stock, which were pledged by Cactus Holding I as security for its obligations under the Cactus VPF contract. Under the Cactus VPF contract, Cactus Holding I is required to deliver to Citigroup Global Markets Inc. ("CGMI") a variable amount of stock or cash during a three trading day period at the maturity of the contract on November 21, 2016 through November 24, 2016. In connection with the Cactus VPF contract, Cactus Holding I received $48.3 million from CGMI.
In connection with the Amended M Capital II VPF, M Capital II paid Citibank N.A $18.5 million. The source of these funds was a cash payment from CGMI in connection with the Cactus VPF Contract. Under the Amended M Capital II VPF contract, M Capital II is required to deliver to Citibank N.A. a variable amount of stock or cash during a three trading day period at the maturity of the contract on November 21, 2016 through November 24, 2016. The number of shares of the Company's Class B Common Stock subject to the Amended M Capital VPF remains unchanged at 13,700,000.
The Amended M Capital II VPF and the Cactus VPF contracts allow Mr. Moyes and the Moyes Affiliates to retain the same number of shares and voting percentage as they had prior to these VPF contracts. In addition, Mr. Moyes and the Moyes Affiliates are able to participate in any price appreciation of the Company’s common stock. The Amended M Capital II VPF Contract generally permits M Capital II to participate in any price appreciation in the Company’s common stock between $22.00 and $26.40 per share. Under the then-existing VPF, M Capital II was generally permitted to participate in any price appreciation in the Company's common stock between $22.54 and $34.00 per share. The Cactus VPF Contract generally permits Cactus Holding I to participate in any price appreciation in the Company's common stock between $22.00 and $26.40 per share.
In connection with the Amended M Capital II VPF transaction, 25,994,016 shares of Class B Common Stock are collateralized by Citibank, N.A. to secure M Capital II’s obligations under the VPF Contract. As these shares are not pledged to secure a loan on margin, they are not subject to the securities trading policy limitation discussed below. Although M Capital II may settle its obligations to Citibank N.A. in cash, any or all of the collateralized shares could be converted into Class A common stock and delivered on such dates to settle such obligations. Such transfers of our common stock, or the perception that they may occur, may have an adverse effect on the trading price of our Class A common stock and may create conflicts of interest for Mr. Moyes.
Margin Pledging Limitations — The Company has a securities trading policy ("STP") that includes, among other things, limitations on the pledging of Company stock on margin. As disclosed at the time of our IPO, under the STP, directors, senior executive officers (including the CEO) and compliance officers were not permitted to pledge more than 20% of their family stock holdings for margin loans. In July 2013, the Nominating and Governance Committee and the Board approved revisions to the STP to further limit pledging of stock on margin, under which, effective July 1, 2014, the limitation was reduced to 15% of family stock holdings and was scheduled to be reduced to 10% of family stock holdings as of July 1, 2015.
In June 2015, our CEO reported to the independent chairman of the board that he was in compliance with the limitation on pledging stock on margin and was working to reduce the amount pledged on margin to below the 10% limit scheduled to take effect, but needed until November 2015 to do so in an orderly fashion. Following Board discussion of these circumstances, the Board amended the STP so that the 15% limit would remain in effect through November 30, 2015 and the 10% limit would take effect on December 1, 2015.
24
In October 2015, our CEO informed the Company that due to the drop in the stock price he had pledged additional shares of Company stock on margin in August and September 2015, in contravention of the STP, and that the percentage of family stock holdings pledged on margin was in excess of the 15% limit. He was precluded from selling shares during this time since he was in possession of material non-public information.
The independent members of the Board met and considered these events in light of competing concerns. On the one hand, the policy and limitations on pledging stock on margin were intended to avoid the risks of stock being sold to satisfy a margin call at a time when Company insiders might have material nonpublic information. On the other hand, unwinding margin positions in significant amounts in a short period could generate adverse market perceptions concerning the Company and the stock. In addition, the Board sought additional information regarding the CEO’s plans to reduce the level of stock pledged on margin.
In response to these developments and the competing concerns identified, the Board directed the CEO to reduce the level of stock pledged on margin to 15% or less of family holdings no later than November 4, 2015 and determined to waive compliance with the 10% limit (but not the 15% limit) through December 31, 2016 so that the margin positions could be reduced in an orderly fashion. In addition, the Board formally reprimanded the CEO and imposed sanctions.
The Company's recent stock volatility has necessitated Mr. Moyes to increase the level of Company stock pledged on margin; thereby exceeding the 15% limit. Taking into account various competing concerns, on December 18, 2015, the Board determined to waive compliance with the 15% limit (but not the 20% limit) through December 31, 2016 to allow Mr. Moyes to reduce the margin position in an orderly manner.
We engage in transactions with other businesses controlled by our CEO, Jerry Moyes. This could create conflicts of interest between Mr. Moyes and our other stockholders.
We engage in various transactions with companies controlled by and/or affiliated with related parties. These transactions include freight services, facility leasing, air transportation, and other services provided by and/or received by Swift with entities affiliated with Mr. Moyes. Because certain entities controlled by Mr. Moyes and certain members of his family operate in the transportation industry, Mr. Moyes’ ownership may create conflicts of interest or require judgments that are disadvantageous to our stockholders in the event we compete for the same freight or other business opportunities. As a result, Mr. Moyes may have interests that conflict with our stockholders.
We have adopted a policy that requires prior approval of related party transactions. Additionally, our amended and restated certificate of incorporation contains provisions that specifically relate to prior approval of related party transactions with Mr. Moyes, the Moyes Affiliates, and any Moyes affiliated entities. However, we cannot provide assurance that the policy or these provisions will be successful in eliminating conflicts of interest. Our amended and restated certificate of incorporation also provides that in the event that any Swift officer or director is also an officer, director or employee of an entity owned by (or affiliated with) Mr. Moyes (or any Moyes Affiliate) and acquires knowledge of a potential transaction or other corporate opportunity not involving the transportation industry or involving refrigerated or LTL transportation, then, subject to certain exceptions, we shall not be entitled to such transaction or corporate opportunity and there should be no expectancy that such transaction or corporate opportunity will be available to us.
Mr. Moyes, our CEO, has substantial ownership interests in and guarantees related to several other businesses and real estate investments, which may expose Mr. Moyes to significant lawsuits or liabilities.
In addition to being our CEO and principal stockholder, Mr. Moyes is the principal stakeholder of, and serves as chairman of the board of directors of SME Industries, Inc., a steel erection and fabrication company, Southwest Premier Properties, LLC, a real estate management company, and is involved in other business endeavors in a variety of industries and has made substantial real estate investments. Although Mr. Moyes devotes the substantial majority of his time to his role as CEO of Swift, the breadth of Mr. Moyes’ other interests may place competing demands on his time and attention.
In addition, in one instance of litigation arising from another business owned by Mr. Moyes, Swift was named as a defendant even though Swift was not a party to the transactions that were the subject of the litigation. It is possible that litigation relating to other businesses owned by Mr. Moyes in the future may result in Swift being named as a defendant and, even if such claims are without merit, that we will be required to incur the expense of defending such matters. In many instances, Mr. Moyes has given personal guarantees to lenders to the various businesses and real estate investments in which he has an ownership interest and, in certain cases, the underlying loans are in default and are in the process of being restructured and/or settled. If Mr. Moyes is otherwise unable to settle or raise the necessary amount of proceeds to satisfy his obligations to such lenders, he may be subject to significant lawsuits, and expose his shares of stock to creditors.
ITEM 1B. | UNRESOLVED STAFF COMMENTS |
None.
25
ITEM 2. | PROPERTIES |
Our headquarters are owned by the Company and situated on approximately 118 acres in Phoenix, Arizona. Our headquarters consist of a three-story administration building with 126,000 square feet of office space; 106,000 square feet of repair and maintenance buildings; a 20,000 square-foot drivers’ center and restaurant; an 8,000 square-foot recruiting and training center; a 6,000 square-foot warehouse; a 300-space parking structure; a two-bay truck wash; and an eight-lane fueling facility.
We have over 40 locations in the United States and Mexico, including terminals, driver academies and certain other locations. Our terminals may include customer service, marketing, fuel, and/or repair facilities. We believe that substantially all of our property and equipment is in good condition and our facilities have sufficient capacity to meet our current needs. From time to time, we invest in additional facilities to meet the needs of our business as we pursue additional growth.
Description of Activities Performed at Each Location | ||||||||||||||||
Region | Location | Owned / Leased | Customer Service | Marketing | Admin | Fuel | Repair | Driver Academy | ||||||||
W E S T E R N | Arizona – Phoenix | ü | ü | ü | ü | ü | ü | ü | ||||||||
California – Fontana | ü | ü | ||||||||||||||
California – Fontana: Truck Sales/Leasing | ü | ü | ||||||||||||||
California – Jurupa Valley | ü | ü | ü | ü | ü | |||||||||||
California – Lathrop | ü | ü | ü | ü | ü | |||||||||||
California – Otay Mesa | ü | ü | ü | |||||||||||||
California – Willows | ü | ü | ü | ü | ||||||||||||
Colorado – Denver | ü | ü | ü | ü | ü | |||||||||||
Idaho – Lewiston | ü | ü | ü | ü | ü | ü | ü | |||||||||
Nevada – Sparks | ü | ü | ü | ü | ||||||||||||
New Mexico – Albuquerque | ü | ü | ü | ü | ||||||||||||
Oklahoma – Oklahoma City | ü | ü | ü | ü | ü | |||||||||||
Oregon – Troutdale | ü | ü | ü | ü | ||||||||||||
Texas – El Paso | ü | ü | ü | ü | ü | |||||||||||
Texas – Houston | ü | ü | ü | |||||||||||||
Texas – Lancaster | ü | ü | ü | ü | ü | |||||||||||
Texas – Laredo | ü | ü | ü | ü | ü | |||||||||||
Texas – Corsicana | ü | ü | ||||||||||||||
Utah – West Valley City (1) | ü | ü | ü | ü | ü | ü | ||||||||||
Utah – West Valley City: Body Shop | ü | ü | ||||||||||||||
Washington – Sumner | ü | ü | ü | ü | ü | |||||||||||
26
Description of Activities Performed at Each Location | ||||||||||||||||
Region | Location | Owned / Leased | Customer Service | Marketing | Admin | Fuel | Repair | Driver Academy | ||||||||
E A S T E R N | Florida – Ocala | ü | ü | ü | ü | ü | ||||||||||
Georgia – Decatur | ü | ü | ü | ü | ü | |||||||||||
Georgia – Decatur | ü | ü | ||||||||||||||
Illinois – Manteno | ü | ü | ü | ü | ||||||||||||
Illinois – Rochelle (1)(2) | ü | ü | ü | ü | ||||||||||||
Indiana – Gary | ü | ü | ü | ü | ||||||||||||
Kansas – Edwardsville | ü | ü | ü | ü | ü | |||||||||||
Michigan – New Boston | ü | ü | ü | ü | ü | |||||||||||
Minnesota – Inver Grove Heights | ü | ü | ü | ü | ü | |||||||||||
New Jersey – Avenel | ü | ü | ||||||||||||||
New York – Syracuse | ü | ü | ü | ü | ü | |||||||||||
Ohio – Columbus | ü | ü | ü | ü | ü | |||||||||||
Pennsylvania – Jonestown | ü | ü | ü | ü | ||||||||||||
South Carolina – Greer: Terminal | ü | ü | ü | ü | ü | |||||||||||
South Carolina – Greer: Body Shop | ü | ü | ||||||||||||||
Tennessee – Memphis: Body Shop | ü | ü | ||||||||||||||
Tennessee – Memphis: Terminal | ü | ü | ü | ü | ü | |||||||||||
Tennessee – Memphis | ü | ü | ||||||||||||||
Virginia – Richmond | ü | ü | ü | ü | ü | ü | ||||||||||
Wisconsin – Town of Menasha | ü | ü | ü | ü | ü | |||||||||||
M E X I C O | Tamaulipas – Nuevo Laredo | ü | ü | ü | ü | ü | ||||||||||
Sonora – Nogales | ü | ü | ü | ü | ||||||||||||
Nuevo Leon – Monterrey | ü | ü | ü | |||||||||||||
State of Mexico – Mexico City | ü | ü | ü | ü | ||||||||||||
____________
(1) | Acquired as part of the Central Acquisition. |
(2) | Includes a driver orientation building. |
In addition to the above, we own parcels of vacant land and several non-operating facilities in various locations around the United States. We also maintain various drop yards throughout the United States, Mexico and Canada. As of December 31, 2015, our aggregate monthly rent for all leased properties was approximately $0.5 million with varying terms expiring through December 2053. Substantially all of our owned properties are securing our senior secured credit facility.
ITEM 3. | LEGAL PROCEEDINGS |
We are party to certain lawsuits in the ordinary course of business. We do not believe that these proceedings, individually or in the aggregate, will have a material adverse effect on our financial position, results of operations or cash flows.
Information about our legal proceedings is included in Note 15 of the notes to the consolidated financial statements, included in Part II, Item 8, in this Annual Report on Form 10-K for the year ended December 31, 2015 and is incorporated by reference herein.
ITEM 4. | MINE SAFETY DISCLOSURES |
Not applicable.
27
PART II | ||||
ITEM 5. | MARKET FOR THE REGISTRANT'S COMMON EQUITY, RELATED STOCKHOLDER MATTERS AND ISSUER PURCHASES OF EQUITY SECURITIES |
Our Class A common stock trades on the NYSE under the symbol "SWFT". The following table sets forth the high and low sales prices per share of our Class A common stock as reported on the NYSE for the periods indicated.
Year Ended December 31, 2015: | High | Low | |||||
First quarter | $ | 29.01 | $ | 24.39 | |||
Second quarter | $ | 26.58 | $ | 22.10 | |||
Third quarter | $ | 24.76 | $ | 14.83 | |||
Fourth quarter | $ | 17.63 | $ | 12.76 | |||
Year Ended December 31, 2014: | High | Low | |||||
First quarter | $ | 26.71 | $ | 19.89 | |||
Second quarter | $ | 26.54 | $ | 21.49 | |||
Third quarter | $ | 26.15 | $ | 18.53 | |||
Fourth quarter | $ | 29.44 | $ | 20.01 | |||
As of December 31, 2015, we had 87,808,801 shares of Class A common stock, of which the Moyes Affiliates held 2,590,177 shares, of which 2,590,077 were pledged on margin with respect to Cactus II. The Moyes Affiliates also held all 50,991,938 shares of Class B common stock outstanding as of December 31, 2015.
On December 31, 2015, there were twenty holders of record of our Class A common stock and five holders of record of our Class B common stock. Because many of our shares of Class A common stock are held by brokers or other institutions on behalf of stockholders, we are unable to estimate the total number of individual stockholders represented by the record holders.
There is currently no established trading market for our Class B common stock. As of February 15, 2016, all of our Class B common stock was owned by Mr. Moyes and the Moyes Affiliates, of which 29,294,016 shares were collateralized with respect to the amended M Capital II VPF and Cactus VPF transactions, and 6,550,090 were pledged on margin with respect to Cactus II.
Dividend Policy |
We anticipate that we will use our future earnings, if any, for the development and expansion of our business, the repayment of debt and for general corporate purposes. Any determination to pay dividends and other distributions in cash, stock, or property by Swift in the future will be at the discretion of our Board. Such determinations will be dependent on then-existing conditions, including our financial condition and results of operations, contractual restrictions, including restrictive covenants contained in our debt agreements, capital requirements, and other factors. For further discussion about restrictions on our ability to pay dividends, see "Management’s Discussion and Analysis of Financial Condition and Results of Operations – Liquidity and Capital Resources – Material Debt Agreements" in this Annual Report on Form 10-K.
Purchases of Equity Securities by the Issuer and Affiliated Purchasers |
On September 25, 2015, the Company announced that the Board authorized a share repurchase program of up to $100.0 million of our outstanding Class A common stock. The following table shows our purchases of our common stock and the available funds to purchase additional common stock for each period in the three months ended December 31, 2015:
Period | Total Number of Shares Purchased | Average Price Paid per Share | Total Number of Shares Purchased as Part of Publicly Announced Plans or Programs | Value That May Yet be Purchased Under the Plans or Programs | |||||||||
October 1, 2015 to October 31, 2015 | — | $ | — | — | $ | 100,000,000 | |||||||
November 1, 2015 to November 30, 2015 | 4,175,810 | $ | 16.76 | 4,175,810 | $ | 30,000,000 | |||||||
December 1, 2015 to December 31, 2015 | — | $ | — | — | $ | 30,000,000 | |||||||
Total (1) | 4,175,810 | $ | 16.76 | 4,175,810 | $ | 30,000,000 | |||||||
(1) | In January 2016, the Company repurchased $30.0 million of its outstanding Class A common stock, thus completing the share repurchase program. |
28
Stockholders Return Performance Graph |
The following graph compares the cumulative annual total return of stockholders from December 31, 2010 to December 31, 2015 of our Class A common stock relative to the cumulative total returns of the S&P 500 index and an index of other companies within the trucking industry (Dow Jones U.S. Trucking Total Stock Market Index) over the same period. The graph assumes that the value of the investment in our Class A common stock and in each of the indexes (including reinvestment of dividends) was $100 on December 31, 2010, and tracks it through December 31, 2015. The stock price performance included in this graph is not necessarily indicative of future stock price performance.
December 31, | |||||||||||||||||||||||
2010 | 2011 | 2012 | 2013 | 2014 | 2015 | ||||||||||||||||||
Swift Transportation | $ | 100.00 | $ | 65.87 | $ | 72.90 | $ | 177.54 | $ | 228.86 | $ | 110.47 | |||||||||||
S&P 500 | $ | 100.00 | $ | 102.11 | $ | 118.45 | $ | 156.82 | $ | 178.29 | $ | 180.75 | |||||||||||
Dow Jones US Trucking | $ | 100.00 | $ | 93.33 | $ | 98.13 | $ | 123.38 | $ | 159.38 | $ | 122.59 | |||||||||||
29
ITEM 6. | SELECTED FINANCIAL DATA |
The information presented below is derived from our audited consolidated financial statements, included elsewhere in this report, except for 2011 and 2012, which were previously reported. In management's opinion, all necessary adjustments for the fair presentation of the information outlined in these financial statements have been applied. The selected financial data for 2015, 2014 and 2013 should be read alongside the consolidated financial statements and accompanying footnotes in Part II, Item 8.
Note: Factors that materially affect the comparability of the data for 2013 through 2015 are available in Management’s Discussion and Analysis of Financial Condition and Results of Operations in Part II, Item 7. Factors that materially affect the comparability of the selected financial data for 2011 and 2012 are set forth below the table.
The following table highlights key measures of the Company's financial condition and results of operations (dollars in thousands, except per share data):
Year Ended December 31, | |||||||||||||||||||
Consolidated income statement data (1): | 2015 | 2014 | 2013 | 2012 | 2011 | ||||||||||||||
Operating revenue | $ | 4,229,322 | $ | 4,298,724 | $ | 4,118,195 | $ | 3,976,085 | $ | 3,778,963 | |||||||||
Operating income | 370,104 | 370,070 | 356,959 | 351,816 | 322,036 | ||||||||||||||
Interest and derivative interest expense (2) | 42,322 | 86,559 | 103,386 | 127,150 | 165,038 | ||||||||||||||
Income before income taxes | 316,786 | 250,626 | 256,404 | 201,701 | 161,239 | ||||||||||||||
Net income | 197,577 | 161,152 | 155,422 | 140,087 | 102,747 | ||||||||||||||
Diluted earnings per share | 1.38 | 1.12 | 1.09 | 1.00 | 0.74 | ||||||||||||||
As of December 31, | |||||||||||||||||||
Consolidated balance sheet data (1): | 2015 | 2014 | 2013 | 2012 | 2011 | ||||||||||||||
Cash and cash equivalents, excluding restricted cash | $ | 107,590 | $ | 105,132 | $ | 59,178 | $ | 53,596 | $ | 80,452 | |||||||||
Net property and equipment | 1,651,100 | 1,542,130 | 1,447,807 | 1,397,536 | 1,404,031 | ||||||||||||||
Total assets (4) | 2,922,435 | 2,892,721 | 2,809,008 | 2,791,981 | 2,814,347 | ||||||||||||||
Debt: | |||||||||||||||||||
Accounts receivable securitization | 225,000 | 334,000 | 264,000 | 204,000 | 180,000 | ||||||||||||||
Revolving line of credit | 200,000 | 57,000 | 17,000 | 2,531 | 9,037 | ||||||||||||||
Long-term debt and obligations under capital leases | 962,667 | 1,104,066 | 1,321,820 | 1,430,598 | 1,673,036 | ||||||||||||||
Year Ended December 31, | |||||||||||||||||||
Non-GAAP financial data (1): | 2015 | 2014 | 2013 | 2012 | 2011 | ||||||||||||||
Adjusted EPS (3) | $ | 1.49 | $ | 1.38 | $ | 1.23 | $ | 1.11 | $ | 0.84 | |||||||||
Adjusted Operating Ratio (3) | 89.8 | % | 89.0 | % | 88.8 | % | 88.3 | % | 88.8 | % | |||||||||
Adjusted EBITDA (3) | $ | 642,703 | $ | 619,825 | $ | 615,236 | $ | 598,934 | $ | 567,637 | |||||||||
____________
(1) | Data for all periods includes the results of Central, which was acquired by Swift on August 6, 2013. See further details regarding the Central Acquisition in Note 1 to the consolidated financial statements in Part II, Item 8. |
(2) | Interest expense during 2012 is primarily related to outstanding balances of $157.1 million and $575.6 million net carrying value of the first lien term loan B-1 tranche and B-2 tranches of the 2012 Agreement, respectively, $492.6 million carrying value of our Senior Notes and $204.0 million of our accounts receivable securitization. |
Interest expense during 2011 primarily related to outstanding balances on the Company's previous first lien term loan, Senior Notes, accounts receivable securitization and capital lease obligations. In aggregate, the outstanding debt balance related to these facilities was $1.7 billion as of December 31, 2011.
(3) | Adjusted EPS, Adjusted Operating Ratio and Adjusted EBITDA are non-GAAP financial measures. These non-GAAP financial measures should not be considered alternatives to, or superior to, GAAP financial measures. However, management believes that presentation of these non-GAAP financial measures provides useful information to investors regarding the Company's results of operations. Adjusted EPS, Adjusted Operating Ratio and Adjusted EBITDA are reconciled to the most directly comparable GAAP financial measures in Part II, Item 7, Management’s Discussion and Analysis of Financial Condition and Results of Operations. |
(4) | Pursuant to the Company's early adoption of ASU 2015-17, "Total assets" as of December 31, 2015 and 2014 include the impact of reclassifying current deferred income taxes into the noncurrent portion on the consolidated balance sheets. "Total assets" as of December 31, 2013, 2012 and 2011 have not been retrospectively adjusted. ASU 2015-17 is discussed in Note 3 in the Notes to Consolidated Financial Statements, included in Part II, Item 8, Financial Statements and Supplementary Data. |
30
ITEM 7. | MANAGEMENT'S DISCUSSION AND ANALYSIS OF FINANCIAL CONDITION AND RESULTS OF OPERATIONS |
Certain acronyms and terms used throughout this Annual Report on Form 10-K are specific to our company, commonly used in our industry, or are otherwise frequently used throughout our document. Definitions for these acronyms and terms are provided in the "Glossary of Terms," available in the front of this document.
Management's discussion and analysis of financial condition and results of operations should be read together with the Description of Business in Part I, Item 1, as well as the consolidated financial statements and accompanying footnotes in Part II, Item 8, of this Annual Report on Form 10-K. This discussion contains forward-looking statements as a result of many factors, including those set forth under Part I, Item 1A. "Risk Factors," Part I "Cautionary Note Regarding Forward Looking Statements," and elsewhere in this report. These statements are based on current expectations and assumptions that are subject to risks and uncertainties. Actual results could differ materially from those discussed.
Executive Summary |
Company Overview — Swift is a multi-faceted transportation services company, operating one of the largest fleets of truckload equipment in North America from over 40 terminals near key freight centers and traffic lanes. We principally operate in short- to medium-haul traffic lanes around our terminals and dedicated customer locations. We concentrate on this length of haul because the majority of domestic truckload freight (as measured by revenue) moves in these lanes and our extensive terminal network affords us marketing, equipment control, supply chain, customer service, and driver retention advantages in local markets. Since our average length of haul is relatively short, it helps reduce competition from railroads and trucking companies that lack a regional presence.
Our four reportable segments are Truckload, Dedicated, Swift Refrigerated and Intermodal. Our extensive suite of service offerings (which includes line-haul services, dedicated customer contracts, temperature-controlled units, intermodal freight solutions, cross-border United States/Mexico and United States/Canada freight, flatbed hauling, freight brokerage and logistics, and others) provides our customers with the opportunity to "one-stop-shop" for their truckload transportation needs. In 2015, our tractor fleet (included in the total equipment schedule, below) covered 2.2 billion miles for shippers throughout North America.
Revenue — In 2015, we generated consolidated operating revenue of $4.2 billion. We primarily generate revenue by transporting freight for our customers, generally at a predetermined rate per mile. We supplement this revenue by charging for fuel surcharges, stop-off pay, loading and unloading activities, tractor and trailer detention, and other ancillary services. The main factors that affect our revenue from transporting freight are the rate per mile we receive from our customers and loaded miles. The main factors that affect fuel surcharge revenue are the price of diesel fuel and the number of loaded miles. Fuel surcharges are billed on a lagging basis, meaning that we typically bill customers in the current week based on a previous week's applicable index. Therefore, in times of increasing fuel prices, we do not recover as much as we are currently paying for fuel. In periods of declining prices, the opposite is true.
Revenue in our non-reportable segment is generated by our non-asset-based freight brokerage and logistics management service, tractor leasing revenue from our financing subsidiaries, premium revenue from our captive insurance companies, and revenue from third parties serviced by our repair and maintenance shops. Main factors affecting revenue in our non-reportable segment are demand for brokerage and logistics services, as well as the number of equipment leases by our financing subsidiaries to the owner-operators we contract with and other third parties.
Expenses — Our most significant expenses vary with miles traveled and include fuel, driver-related expenses (such as wages and benefits) and services purchased from owner-operators and other transportation providers (such as railroads, drayage providers, and other trucking companies). Maintenance and tire expenses, as well as cost of insurance and claims generally vary with the miles we travel, but also have a controllable component based on safety improvements, fleet age, efficiency, and other factors. Our primary fixed costs are depreciation and lease expense for revenue equipment and terminals, interest expense, and non-driver compensation.
Compared to changes in rate per mile and loaded miles, changes in deadhead miles percentage generally have the largest proportionate effect on our profitability because we still bear all of the expenses for each deadhead mile, but do not earn any revenue to offset those expenses. Changes in rate per mile have the next largest proportionate effect on profitability because incremental improvements in rate per mile are not offset by any additional expenses. Changes in loaded miles generally have a smaller effect on profitability because variable expenses fluctuate with changes in miles. However, changes in mileage are affected by driver satisfaction and network efficiency, which indirectly affect expenses.
31
SWIFT TRANSPORTATION COMPANY
MANAGEMENT'S DISCUSSION AND ANALYSIS OF FINANCIAL CONDITION AND RESULTS OF OPERATIONS — CONTINUED
Financial Overview
Year Ended December 31, | |||||||||||
2015 | 2014 | 2013 | |||||||||
(Dollars in thousands, except per share data) | |||||||||||
Operating revenue | $ | 4,229,322 | $ | 4,298,724 | $ | 4,118,195 | |||||
Revenue xFSR | $ | 3,781,976 | $ | 3,535,391 | $ | 3,326,714 | |||||
Net income | $ | 197,577 | $ | 161,152 | $ | 155,422 | |||||
Diluted earnings per share | $ | 1.38 | $ | 1.12 | $ | 1.09 | |||||
Operating Ratio | 91.2 | % | 91.4 | % | 91.3 | % | |||||
Non-GAAP financial data: | |||||||||||
Adjusted EPS (1) | $ | 1.49 | $ | 1.38 | $ | 1.23 | |||||
Adjusted Operating Ratio (1) | 89.8 | % | 89.0 | % | 88.8 | % | |||||
Adjusted EBITDA (1) | $ | 642,703 | $ | 619,825 | $ | 615,236 | |||||
____________
(1) | Adjusted EPS, Adjusted Operating Ratio and Adjusted EBITDA are non-GAAP financial measures. These non-GAAP financial measures should not be considered alternatives, or superior, to GAAP financial measures. However, management believes that presentation of these non-GAAP financial measures provides useful information to investors regarding the Company's results of operations. Adjusted EBITDA, Adjusted Operating Ratio and Adjusted EPS are reconciled to the most directly comparable GAAP financial measures under "Non-GAAP Financial Measures," below. |
Total Equipment — The following table summarizes our revenue equipment and supports the discussions and analyses, below:
As of December 31, | ||||||||
2015 | 2014 | 2013 | ||||||
Tractors: | ||||||||
Company: | ||||||||
Owned | 7,442 | 6,083 | 6,081 | |||||
Leased — capital leases | 2,170 | 1,700 | 1,851 | |||||
Leased — operating leases | 5,599 | 6,099 | 4,834 | |||||
Total company tractors | 15,211 | 13,882 | 12,766 | |||||
Owner-operator: | ||||||||
Financed through the Company | 3,767 | 4,204 | 4,473 | |||||
Other | 886 | 750 | 722 | |||||
Total owner-operator tractors | 4,653 | 4,954 | 5,195 | |||||
Total tractors | 19,864 | 18,836 | 17,961 | |||||
Trailers | 65,233 | 61,652 | 57,310 | |||||
Containers | 9,150 | 9,150 | 8,717 | |||||
Average Operational Truck Count — The following table summarizes average operational truck count, which is defined under "Results of Operations – Segment Review."
Year Ended | ||||||||
2015 | 2014 | 2013 | ||||||
Company | 13,316 | 12,146 | 11,656 | |||||
Owner-operator | 4,599 | 5,044 | 4,986 | |||||
Total (1) | 17,915 | 17,190 | 16,642 | |||||
____________
(1) | Includes trucks within our non-reportable segment. |
32
SWIFT TRANSPORTATION COMPANY
MANAGEMENT'S DISCUSSION AND ANALYSIS OF FINANCIAL CONDITION AND RESULTS OF OPERATIONS — CONTINUED
Factors Affecting Comparability Between Periods
Driver Wages and Owner-operator Pay Rates — We implemented increases in wages for our company drivers and contracted pay rates for the owner-operators we contract with in August 2014 and May 2015. These increases were tailored, and we believe successful, at improving driver retention and recruiting. However, the increases are having a short-term negative impact on profitability, given the immediate effect of driver wage and pay rate increases on expense, versus the more gradual effect of customer pricing increases on revenue. We refer to these increases in company driver wages and owner-operator contracted pay rates throughout the segment and operating expense reviews, below.
Results of Operations — Comparison Between the Years Ended December 31, 2015 and December 31, 2014
Net income in 2015 was $197.6 million, compared to $161.2 million in 2014. The following factors affected comparability between 2015 and 2014:
• | $41.7 million decrease in interest expense, primarily driven by the call of our Senior Notes in November 2014. |
• | $9.6 million loss on debt extinguishment in 2015 from replacing the 2014 Agreement with the 2015 Agreement, compared to $39.9 million loss on debt extinguishment in 2014 ($34.7 million from redeeming our Senior Notes and $5.2 million from replacing the 2013 Agreement with the 2014 Agreement). |
• | $29.7 million increase in income tax expense, driven by an increase in income before income taxes and an increase in the effective tax rate from 35.7% in 2014 to 37.6% in 2015. |
• | $20.3 million increase in insurance and claims expense, primarily due to the first three quarters in 2015, when we had adverse current-year development of certain prior-year claims, higher claims severity trends and higher claims frequency trends. However, our crash frequency and severity trends improved in the fourth quarter of 2015, partially driven by our investments in new equipment with enhanced safety features, as well as improved driver retention and other safety initiatives. |
• | $13.5 million additional depreciation, maintenance and staging expense, resulting from the backlog of trucks that were being processed for trade or sale in the latter half of 2015. |
• | $6.0 million non-operating expense for a lawsuit that was settled in June 2015. |
• | $5.1 million operating expense for settlement of a class action lawsuit and related items in 2015. |
• | $1.5 million pre-tax impairment of a non-operating note receivable in 2015. The note was due to the Company from an independent fleet contractor, transporting freight on behalf of Swift. |
• | $2.3 million impairment of certain operations software in 2014. |
Results of Operations — Comparison Between the Years Ended December 31, 2014 and December 31, 2013
Net income in 2014 was $161.2 million, compared to $155.4 million in 2013. The following factors affected comparability between 2014 and 2013:
• | $39.9 million loss on debt extinguishment in 2014, discussed above, compared to a $5.5 million loss on debt extinguishment in 2013 ($5.0 million from replacing the 2012 Agreement with the 2013 Agreement and $0.5 million from repaying certain outstanding Central debt in full at closing of the Central Acquisition). |
• | $19.5 million reduction in interest expense in 2014, compared to 2013, primarily due to redeeming our Senior Notes, lowering our debt balances, and replacing the 2013 Agreement with the 2014 Agreement. |
• | 280 basis point difference in the effective tax rate, which was 35.7% in 2014, compared to the expected effective tax rate of 38.5%, primarily due to the benefit of prior year federal income tax credits realized in the third quarter of 2014 and federal employment income tax credits realized in the fourth quarter of 2014. |
• | $3.0 million in pre-tax gain on disposal of redundant Central properties in 2014. |
• | $2.3 million pre-tax impairment of certain operations software in 2014. |
• | $6.9 million pre-tax gain on sale in 2013 of three properties classified as held for sale. |
• | $4.9 million in merger and acquisition expense in 2013 for financial advisory, severance and other professional fees related to the Central Acquisition. |
• | $0.9 million in a one-time non-cash equity compensation charge incurred by Central in 2013 for certain stock options that accelerated upon closing of the Central Acquisition. |
33
SWIFT TRANSPORTATION COMPANY
MANAGEMENT'S DISCUSSION AND ANALYSIS OF FINANCIAL CONDITION AND RESULTS OF OPERATIONS — CONTINUED
Non-GAAP Financial Measures |
The terms "Adjusted EPS," "Adjusted Operating Ratio," and "Adjusted EBITDA," as we define them, are not presented in accordance with GAAP. These financial measures supplement our GAAP results in evaluating certain aspects of our business. We believe that using these measures improves comparability in analyzing our performance because they remove the impact of items from our operating results that, in our opinion, do not reflect our core operating performance. Management and the Board focus on Adjusted EPS, Adjusted Operating Ratio and Adjusted EBITDA as key measures of our performance, all of which are reconciled to the most comparable GAAP financial measures and further discussed below. We believe our presentation of these non-GAAP financial measures is useful because it provides investors and securities analysts the same information that we use internally for purposes of assessing our core operating performance and compliance with debt covenants.
Adjusted EPS, Adjusted Operating Ratio and Adjusted EBITDA are not substitutes for their comparable GAAP financial measures, such as net income, cash flows from operating activities, operating margin, or other measures prescribed by GAAP. There are limitations to using non-GAAP financial measures. Although we believe that they improve comparability in analyzing our period to period performance, they could limit comparability to other companies in our industry if those companies define these measures differently. Because of these limitations, our non-GAAP financial measures should not be considered measures of income generated by our business or discretionary cash available to us to invest in the growth of our business. Management compensates for these limitations by primarily relying on GAAP results and using non-GAAP financial measures on a supplemental basis.
Note: In the GAAP to non-GAAP reconciliations below, 2012 and 2011 are included to support the five-year presentation in Part II, Item 6, "Selected Financial Data."
Adjusted EPS — Our definition of the non-GAAP measure, Adjusted EPS, starts with (a) income (loss) before income taxes, the most comparable GAAP measure. We add the following items back to (a) to arrive at (b) adjusted income (loss) before income taxes:
(i) | amortization of the intangibles from the 2007 Transactions, |
(ii) | non-cash impairments, |
(iii) | other special non-cash items, |
(iv) | excludable transaction costs, |
(v) | mark-to-market adjustments on our interest rate swaps, recognized in the income statement, and |
(vi) | amortization of previous losses recorded in AOCI related to the interest rate swaps we terminated upon our IPO and refinancing transactions in December 2010. |
We subtract income taxes, at the GAAP effective tax rate (except for 2011 – 2013, when we used the GAAP expected effective tax rate) from (b) to arrive at (c) adjusted earnings. Adjusted EPS is equal to (c) divided by weighted average diluted shares outstanding.
We believe that excluding the impact of derivatives provides for more transparency and comparability since these transactions have historically been volatile. Additionally, we believe that comparability of our performance is improved by excluding impairments that are unrelated to our core operations, as well as intangibles from the 2007 Transactions and other special items that are non-comparable in nature.
34
SWIFT TRANSPORTATION COMPANY
MANAGEMENT'S DISCUSSION AND ANALYSIS OF FINANCIAL CONDITION AND RESULTS OF OPERATIONS — CONTINUED
The following table is a GAAP to non-GAAP reconciliation for consolidated Adjusted EPS.
Note: Since the numbers reflected in the table below are calculated on a per share basis, they may not foot due to rounding.
Year Ended December 31, | |||||||||||||||||||
2015 | 2014 | 2013 | 2012 | 2011 | |||||||||||||||
Diluted earnings per share | $ | 1.38 | $ | 1.12 | $ | 1.09 | $ | 1.00 | $ | 0.74 | |||||||||
Adjusted for: | |||||||||||||||||||
Income tax expense | 0.83 | 0.62 | 0.71 | 0.44 | 0.42 | ||||||||||||||
Income before income taxes | 2.20 | 1.75 | 1.80 | 1.44 | 1.15 | ||||||||||||||
Non-cash impairments (1) | — | 0.02 | — | 0.02 | — | ||||||||||||||
Non-cash impairments of non-operating assets (2) | 0.01 | — | — | 0.04 | — | ||||||||||||||
Loss on debt extinguishment (3) | 0.07 | 0.28 | 0.04 | 0.16 | — | ||||||||||||||
Acceleration of non-cash equity compensation (4) | — | — | 0.01 | — | — | ||||||||||||||
Excludable transaction costs(5) | — | — | 0.03 | — | — | ||||||||||||||
Mark-to-market adjustment of interest rate swaps(6) | — | — | 0.01 | — | — | ||||||||||||||
Amortization of unrealized losses on interest rate swaps(7) | — | — | — | 0.04 | 0.11 | ||||||||||||||
Amortization of certain intangibles(8) | 0.11 | 0.11 | 0.11 | 0.11 | 0.12 | ||||||||||||||
Adjusted income before income taxes | 2.39 | 2.15 | 2.00 | 1.82 | 1.38 | ||||||||||||||
Provision for income tax expense at effective rate (9) | (0.90 | ) | (0.77 | ) | (0.77 | ) | (0.71 | ) | (0.54 | ) | |||||||||
Adjusted EPS | $ | 1.49 | $ | 1.38 | $ | 1.23 | $ | 1.11 | $ | 0.84 | |||||||||
____________
(1) | Pre-tax non-cash impairments included: |
• | 2014: $2.3 million related to the replacement and write-off of certain operations software; and |
• | 2012: $2.3 million lost deposit on fuel technology and related equipment because a supplier ceased operations and $1.1 million for impaired real property. |
(2) | For 2015, refer to "Non-cash impairments of non-operating assets" discussion under "Results of Operations — Consolidated Operating and Other Expenses," below. In 2012, non-cash impairments of non-operating assets pertained to Swift Power Services, LLC ("SPS"), an entity in which we owned a minority interest and held a secured promissory note. SPS failed to make its first scheduled principal payment to us on the secured promissory note, as well as a quarterly interest payment on December 31, 2012. This was due to a decline in its financial performance resulting from, among other things, a legal dispute with the former owners and its primary customer. This caused us to evaluate the secured promissory note due from SPS for impairment, which resulted in a $6.0 million pre-tax adjustment that was recorded in Impairments of non-operating assets in the fourth quarter of 2012. |
(3) | For 2013 through 2015, refer to "Loss on Debt Extinguishment" discussion under "Results of Operations — Consolidated Operating and Other Expenses," below. In 2012, we incurred $20.9 million in loss on debt extinguishment from replacing the previous first lien term loan with the 2012 Agreement and $1.3 million from redeeming the remaining fixed rate notes. |
(4) | In 2013, Central incurred a $0.9 million one-time non-cash equity compensation charge for certain options that accelerated upon the closing of the Central Acquisition. |
(5) | Excludable transaction costs in 2013 were from the Central Acquisition, in which Swift and Central incurred financial advisory, severance and other professional fees related to the transaction. |
(6) | Mark-to-market adjustment of interest rate swaps reflects the portion of the change in fair value of these financial instruments that was recorded in earnings in each period indicated and excludes the portion recorded in AOCI under cash flow hedge accounting. |
(7) | Amortization of unrealized losses on interest rate swaps reflects the non-cash amortization expense of $5.1 million in 2012 and $15.1 million in 2011, included in derivative interest expense in the consolidated income statements. Non-cash amortization expense is comprised of previous losses recorded in AOCI related to the interest rate swaps we terminated upon our IPO and concurrent refinancing transactions in December 2010. Such losses were incurred in prior periods when hedge accounting applied to the swaps and were expensed in relation to the hedged interest payments through the original maturity of the swaps in August 2012. |
35
SWIFT TRANSPORTATION COMPANY
MANAGEMENT'S DISCUSSION AND ANALYSIS OF FINANCIAL CONDITION AND RESULTS OF OPERATIONS — CONTINUED
(8) | "Amortization of certain intangibles" specifically reflects the non-cash amortization expense relating to certain intangible assets identified in the 2007 Transactions through which Swift Corporation acquired Swift Transportation Co. |
(9) | Provision for income tax expense at effective rate was based on the following: |
• | 2014 and 2015: GAAP effective tax rate. |
• | Prior to 2014: GAAP expected effective tax rate: |
◦ | In 2013, we used a 38.5% rate, as there were variations in the GAAP effective tax rate primarily due to a new tax rate in Mexico, Central's conversion to a C-Corporation from an S-Corporation, fixed asset basis differences and state tax rate changes, Central Acquisition-related costs, as well as the benefit realized from Central's designation as an S-corporation prior to the Central Acquisition. |
◦ | In 2011 and 2012, we used a 39.0% rate, due to amortization of deferred tax assets related to our pre-IPO interest rate swaps and other items causing fluctuations in the GAAP effective tax rate. |
Adjusted Operating Ratio — Our definition of the non-GAAP measure, Adjusted Operating Ratio, starts with (a) operating expense and (b) operating revenue, which are GAAP financial measures. We subtract the following items from (a) to arrive at (c) adjusted operating expense:
(i) fuel surcharge revenue,
(ii) amortization of the intangibles from the 2007 Transactions,
(iii) non-cash operating impairment charges,
(iv) other special non-cash items, and
(v) excludable transaction costs.
We then subtract fuel surcharge revenue from (b) to arrive at (d) Revenue xFSR. Adjusted Operating Ratio is equal to (c) adjusted operating expense as a percentage of (d) Revenue xFSR.
We net fuel surcharge revenue against fuel expense in the calculation of our Adjusted Operating Ratio, thereby excluding fuel surcharge revenue from operating revenue in the denominator. Because fuel surcharge revenue is so volatile, we believe excluding it provides for more transparency and comparability. Additionally, we believe that comparability of our performance is improved by excluding impairments, non-comparable intangibles from the 2007 Transactions and other special items.
The following table is a GAAP to non-GAAP reconciliation for consolidated Adjusted Operating Ratio:
Year Ended December 31, | |||||||||||||||||||
2015 | 2014 | 2013 | 2012 | 2011 | |||||||||||||||
(Dollars in thousands) | |||||||||||||||||||
Operating revenue | $ | 4,229,322 | $ | 4,298,724 | $ | 4,118,195 | $ | 3,976,085 | $ | 3,778,963 | |||||||||
Less: Fuel surcharge revenue | (447,346 | ) | (763,333 | ) | (791,481 | ) | (794,514 | ) | (750,203 | ) | |||||||||
Revenue xFSR | 3,781,976 | 3,535,391 | 3,326,714 | 3,181,571 | 3,028,760 | ||||||||||||||
Operating expense | 3,859,218 | 3,928,654 | 3,761,236 | 3,624,269 | 3,456,927 | ||||||||||||||
Adjusted for: | |||||||||||||||||||
Fuel surcharge revenue | (447,346 | ) | (763,333 | ) | (791,481 | ) | (794,514 | ) | (750,203 | ) | |||||||||
Amortization of certain intangibles (1) | (15,648 | ) | (15,648 | ) | (15,648 | ) | (15,758 | ) | (17,092 | ) | |||||||||
Non-cash impairments (2) | — | (2,308 | ) | — | (3,387 | ) | — | ||||||||||||
Acceleration of non-cash equity compensation (3) | — | — | (887 | ) | — | — | |||||||||||||
Adjusted operating expense | 3,396,224 | 3,147,365 | 2,953,220 | 2,810,610 | 2,689,632 | ||||||||||||||
Adjusted operating income | $ | 385,752 | $ | 388,026 | $ | 373,494 | $ | 370,961 | $ | 339,128 | |||||||||
Operating Ratio | 91.2 | % | 91.4 | % | 91.3 | % | 91.2 | % | 91.5 | % | |||||||||
Adjusted Operating Ratio | 89.8 | % | 89.0 | % | 88.8 | % | 88.3 | % | 88.8 | % | |||||||||
____________
(1) | Refer to footnote (8) to the Adjusted EPS reconciliation for a description of "Amortization of certain intangibles." |
(2) | Refer to footnote (1) to the Adjusted EPS reconciliation for a description of "Non-cash impairments." |
(3) | Refer to footnote (4) to the Adjusted EPS reconciliation for a description of "Acceleration of non-cash equity compensation." |
36
SWIFT TRANSPORTATION COMPANY
MANAGEMENT'S DISCUSSION AND ANALYSIS OF FINANCIAL CONDITION AND RESULTS OF OPERATIONS — CONTINUED
Adjusted EBITDA — Our definition of the non-GAAP measure, Adjusted EBITDA, starts with (a) net income (loss), the most comparable GAAP measure. We add the following items back to (a) to arrive at Adjusted EBITDA:
(i) depreciation and amortization,
(ii) interest and derivative interest expense, including fees and charges associated with indebtedness, net of interest income,
(iii) income taxes,
(iv) non-cash equity compensation expense,
(v) non-cash impairments,
(vi) other special non-cash items, and
(vii) excludable transaction costs.
We believe that Adjusted EBITDA is a relevant measure for estimating the cash generated by our operations that would be available to cover capital expenditures, taxes, interest and other investments and that it enhances an investor's understanding of our financial performance. We use Adjusted EBITDA for business planning purposes and in measuring our performance relative to that of our competitors. Our method of computing Adjusted EBITDA is consistent with that used in our debt covenants, specifically our leverage ratio, and is also routinely reviewed by management for that purpose.
The following table is a GAAP to non-GAAP reconciliation for consolidated Adjusted EBITDA:
Year Ended December 31, | |||||||||||||||||||
2015 | 2014 | 2013 | 2012 | 2011 | |||||||||||||||
(In thousands) | |||||||||||||||||||
Net income | $ | 197,577 | $ | 161,152 | $ | 155,422 | $ | 140,087 | $ | 102,747 | |||||||||
Adjusted for: | |||||||||||||||||||
Depreciation and amortization of property and equipment | 251,735 | 221,122 | 226,008 | 218,839 | 218,098 | ||||||||||||||
Amortization of intangibles | 16,814 | 16,814 | 16,814 | 16,925 | 18,258 | ||||||||||||||
Interest expense | 38,350 | 80,064 | 99,534 | 122,049 | 149,981 | ||||||||||||||
Derivative interest expense | 3,972 | 6,495 | 3,852 | 5,101 | 15,057 | ||||||||||||||
Interest income | (2,526 | ) | (2,909 | ) | (2,474 | ) | (2,156 | ) | (1,997 | ) | |||||||||
Income tax expense | 119,209 | 89,474 | 100,982 | 61,614 | 58,492 | ||||||||||||||
EBITDA | 625,131 | 572,212 | 600,138 | 562,459 | 560,636 | ||||||||||||||
Non-cash impairments (1) | — | 2,308 | — | 3,387 | — | ||||||||||||||
Non-cash equity compensation (2) | 6,525 | 5,396 | 4,645 | 4,890 | 7,001 | ||||||||||||||
Loss on debt extinguishment (3) | 9,567 | 39,909 | 5,540 | 22,219 | — | ||||||||||||||
Excludable transaction costs (4) | — | — | 4,913 | — | — | ||||||||||||||
Non-cash impairments of non-operating assets (5) | 1,480 | — | — | 5,979 | — | ||||||||||||||
Adjusted EBITDA | $ | 642,703 | $ | 619,825 | $ | 615,236 | $ | 598,934 | $ | 567,637 | |||||||||
(1) | Refer to footnote (1) to the Adjusted EPS reconciliation for a description of "Non-cash impairments." |
(2) | Represents recurring non-cash equity compensation expense, on a pre-tax basis. In accordance with the terms of the 2015 Agreement, this expense is added back in the calculation of Adjusted EBITDA for covenant compliance purposes. In addition to non-cash equity compensation in 2013, Central incurred a $0.9 million one-time charge for certain options that accelerated upon closing of the Central Acquisition. |
(3) | Refer to footnote (3) to the Adjusted EPS reconciliation for a description of "Loss on debt extinguishment." |
(4) | Refer to footnote (5) to the Adjusted EPS reconciliation for a description of "Excludable transaction costs." |
(5) | Refer to footnote (2) to the Adjusted EPS reconciliation for a description of "Non-cash impairments of non-operating assets." |
37
SWIFT TRANSPORTATION COMPANY
MANAGEMENT'S DISCUSSION AND ANALYSIS OF FINANCIAL CONDITION AND RESULTS OF OPERATIONS — CONTINUED
Results of Operations — Segment Review |
Descriptions of our four reportable segments: Truckload, Dedicated, Swift Refrigerated (formerly Central Refrigerated) and Intermodal are included in Note 25 to the consolidated financial statements, included in Part II Item 8 of this Annual Report on Form 10-K.
Consolidating tables for operating revenue and operating income are as follows:
Year Ended December 31, | ||||||||||||||||||||
2015 | 2014 | 2013 | ||||||||||||||||||
(Dollars in thousands) | ||||||||||||||||||||
Operating revenue: | ||||||||||||||||||||
Truckload | $ | 2,204,114 | 52.1 | % | $ | 2,301,010 | 53.5 | % | $ | 2,313,035 | 56.2 | % | ||||||||
Dedicated | 927,657 | 21.9 | % | 892,078 | 20.8 | % | 738,929 | 17.9 | % | |||||||||||
Swift Refrigerated | 380,251 | 9.0 | % | 417,980 | 9.7 | % | 452,531 | 11.0 | % | |||||||||||
Intermodal | 390,572 | 9.2 | % | 401,577 | 9.3 | % | 376,075 | 9.1 | % | |||||||||||
Subtotal | 3,902,594 | 92.2 | % | 4,012,645 | 93.3 | % | 3,880,570 | 94.2 | % | |||||||||||
Non-reportable segment | 407,781 | 9.6 | % | 342,969 | 8.0 | % | 287,853 | 7.0 | % | |||||||||||
Intersegment eliminations | (81,053 | ) | (1.8 | )% | (56,890 | ) | (1.3 | )% | (50,228 | ) | (1.2 | )% | ||||||||
Operating revenue | $ | 4,229,322 | 100.0 | % | $ | 4,298,724 | 100.0 | % | $ | 4,118,195 | 100.0 | % | ||||||||
Year Ended December 31, | ||||||||||||||||||||
2015 | 2014 | 2013 | ||||||||||||||||||
(Dollars in thousands) | ||||||||||||||||||||
Operating income: | ||||||||||||||||||||
Truckload | $ | 257,007 | 69.4 | % | $ | 258,072 | 69.7 | % | $ | 225,963 | 63.3 | % | ||||||||
Dedicated | 82,735 | 22.4 | % | 75,794 | 20.5 | % | 83,520 | 23.4 | % | |||||||||||
Swift Refrigerated | 17,080 | 4.6 | % | 14,035 | 3.8 | % | 17,682 | 5.0 | % | |||||||||||
Intermodal | 4,128 | 1.1 | % | 8,298 | 2.2 | % | 5,619 | 1.6 | % | |||||||||||
Subtotal | 360,950 | 97.5 | % | 356,199 | 96.3 | % | 332,784 | 93.2 | % | |||||||||||
Non-reportable segment | 9,154 | 2.5 | % | 13,871 | 3.7 | % | 24,175 | 6.8 | % | |||||||||||
Operating income | $ | 370,104 | 100.0 | % | $ | 370,070 | 100.0 | % | $ | 356,959 | 100.0 | % | ||||||||
____________
Our CODMs monitor the GAAP results of our reportable segments, as supplemented by certain non-GAAP information. Refer to "Non-GAAP Financial Measures" above for more details. Additionally, we use a number of primary indicators to monitor our revenue and expense performance and efficiency.
Weekly Trucking Revenue xFSR per Tractor (monitored monthly) — This is our primary measure of productivity for our Truckload, Dedicated and Swift Refrigerated segments. Weekly Revenue xFSR per tractor is affected by the following factors, which are typically monitored daily:
• | loaded miles (miles driven when hauling freight); |
• | fleet size (because available loads are spread over available tractors); |
• | rates received for our services; and |
• | network balance (number of loads accepted, compared to available trucks, by market). |
We strive to increase our revenue per tractor by improving freight rates with customers, hauling more loads with existing equipment, effectively moving freight and managing balance within our network, maintaining our tractors, and recruiting and retaining drivers and owner-operators.
38
SWIFT TRANSPORTATION COMPANY
MANAGEMENT'S DISCUSSION AND ANALYSIS OF FINANCIAL CONDITION AND RESULTS OF OPERATIONS — CONTINUED
Deadhead Miles Percentage (monitored daily) — This is calculated by dividing the number of unpaid miles by the total number of miles driven. We monitor deadhead miles percentage in Truckload and Swift Refrigerated, as we strive to reduce our number of deadhead miles within these segments. By balancing our freight flows and planning consecutive loads with shorter distances between the drop-off and pick-up locations, we are able to reduce the percentage of deadhead miles driven to allow for more revenue-generating miles during our drivers’ hours-of-service. This also enables us to reduce wage, fuel and other costs associated with deadhead miles.
Average Operational Truck Count (monitored daily) — We use this measure for all of our reportable segments. It includes tractors driven by company drivers as well as owner-operator units. This measure changes based on our ability to adjust our fleet size in response to changes in demand.
Load Count and Average Container Count (monitored daily) — Within Intermodal, we monitor load count and average container count. These metrics allow us to measure our utilization of our container fleet.
Adjusted Operating Ratio (monitored monthly) — We consider this ratio an important measure of our operating profitability for each of our reportable segments. We define and reconcile Adjusted Operating Ratio under "Non-GAAP Financial Measures," above. GAAP Operating Ratio is operating expenses as a percentage of revenue, or the inverse of operating margin, and produces an indication of operating efficiency. It is widely used in our industry as an assessment of management’s effectiveness in controlling all categories of operating expenses.
The following tables are GAAP to non-GAAP reconciliations for each segment's Adjusted Operating Ratio:
Truckload Segment
Year Ended December 31, | |||||||||||
2015 | 2014 | 2013 | |||||||||
(Dollars in thousands) | |||||||||||
Operating revenue | $ | 2,204,114 | $ | 2,301,010 | $ | 2,313,035 | |||||
Less: Fuel surcharge revenue | (257,150 | ) | (442,023 | ) | (473,139 | ) | |||||
Revenue xFSR | 1,946,964 | 1,858,987 | 1,839,896 | ||||||||
Operating expense | 1,947,107 | 2,042,938 | 2,087,072 | ||||||||
Adjusted for: Fuel surcharge revenue | (257,150 | ) | (442,023 | ) | (473,139 | ) | |||||
Adjusted operating expense | 1,689,957 | 1,600,915 | 1,613,933 | ||||||||
Adjusted operating income | $ | 257,007 | $ | 258,072 | $ | 225,963 | |||||
Operating Ratio | 88.3 | % | 88.8 | % | 90.2 | % | |||||
Adjusted Operating Ratio | 86.8 | % | 86.1 | % | 87.7 | % | |||||
Dedicated Segment
Year Ended December 31, | |||||||||||
2015 | 2014 | 2013 | |||||||||
(Dollars in thousands) | |||||||||||
Operating revenue | $ | 927,657 | $ | 892,078 | $ | 738,929 | |||||
Less: Fuel surcharge revenue | (79,360 | ) | (151,399 | ) | (138,063 | ) | |||||
Revenue xFSR | 848,297 | 740,679 | 600,866 | ||||||||
Operating expense | 844,922 | 816,284 | 655,409 | ||||||||
Adjusted for: Fuel surcharge revenue | (79,360 | ) | (151,399 | ) | (138,063 | ) | |||||
Adjusted operating expense | 765,562 | 664,885 | 517,346 | ||||||||
Adjusted operating income | $ | 82,735 | $ | 75,794 | $ | 83,520 | |||||
Operating Ratio | 91.1 | % | 91.5 | % | 88.7 | % | |||||
Adjusted Operating Ratio | 90.2 | % | 89.8 | % | 86.1 | % | |||||
39
SWIFT TRANSPORTATION COMPANY
MANAGEMENT'S DISCUSSION AND ANALYSIS OF FINANCIAL CONDITION AND RESULTS OF OPERATIONS — CONTINUED
Swift Refrigerated Segment
Year Ended December 31, | |||||||||||
2015 | 2014 | 2013 | |||||||||
(Dollars in thousands) | |||||||||||
Operating revenue | $ | 380,251 | $ | 417,980 | $ | 452,531 | |||||
Less: Fuel surcharge revenue | (52,211 | ) | (83,660 | ) | (95,312 | ) | |||||
Revenue xFSR | 328,040 | 334,320 | 357,219 | ||||||||
Operating expense | 363,171 | 403,945 | 434,849 | ||||||||
Adjusted for: Fuel surcharge revenue | (52,211 | ) | (83,660 | ) | (95,312 | ) | |||||
Adjusted operating expense | 310,960 | 320,285 | 339,537 | ||||||||
Adjusted operating income | $ | 17,080 | $ | 14,035 | $ | 17,682 | |||||
Operating Ratio | 95.5 | % | 96.6 | % | 96.1 | % | |||||
Adjusted Operating Ratio | 94.8 | % | 95.8 | % | 95.1 | % | |||||
Intermodal Segment
Year Ended December 31, | |||||||||||
2015 | 2014 | 2013 | |||||||||
(Dollars in thousands) | |||||||||||
Operating revenue | $ | 390,572 | $ | 401,577 | $ | 376,075 | |||||
Less: Fuel surcharge revenue | (50,441 | ) | (77,947 | ) | (77,594 | ) | |||||
Revenue xFSR | 340,131 | 323,630 | 298,481 | ||||||||
Operating expense | 386,444 | 393,279 | 370,456 | ||||||||
Adjusted for: Fuel surcharge revenue | (50,441 | ) | (77,947 | ) | (77,594 | ) | |||||
Adjusted operating expense | 336,003 | 315,332 | 292,862 | ||||||||
Adjusted operating income | $ | 4,128 | $ | 8,298 | $ | 5,619 | |||||
Operating Ratio | 98.9 | % | 97.9 | % | 98.5 | % | |||||
Adjusted Operating Ratio | 98.8 | % | 97.4 | % | 98.1 | % | |||||
40
SWIFT TRANSPORTATION COMPANY
MANAGEMENT'S DISCUSSION AND ANALYSIS OF FINANCIAL CONDITION AND RESULTS OF OPERATIONS — CONTINUED
Segment Review — Comparison Between the Years Ended December 31, 2015 and December 31, 2014
Truckload Segment
Year Ended December 31, | Increase (Decrease) | |||||||||||||
2015 | 2014 | Amount | Percentage | |||||||||||
(Dollars (except per tractor amounts) and miles in thousands) | ||||||||||||||
Operating revenue | $ | 2,204,114 | $ | 2,301,010 | $ | (96,896 | ) | (4.2 | )% | |||||
Revenue xFSR | $ | 1,946,964 | $ | 1,858,987 | $ | 87,977 | 4.7 | % | ||||||
Operating income | $ | 257,007 | $ | 258,072 | $ | (1,065 | ) | (0.4 | )% | |||||
Operating Ratio | 88.3 | % | 88.8 | % | (0.5 | )% | ||||||||
Adjusted Operating Ratio | 86.8 | % | 86.1 | % | 0.7 | % | ||||||||
Weekly Revenue xFSR per tractor | $ | 3,546 | $ | 3,450 | $ | 96 | 2.8 | % | ||||||
Total loaded miles | 1,037,636 | 1,030,443 | 7,193 | 0.7 | % | |||||||||
Deadhead miles percentage | 12.1 | % | 11.9 | % | 0.2 | % | ||||||||
Average operational truck count: | ||||||||||||||
Company | 7,508 | 6,975 | 533 | 7.6 | % | |||||||||
Owner-operator | 3,021 | 3,361 | (340 | ) | (10.1 | )% | ||||||||
Total | 10,529 | 10,336 | 193 | 1.9 | % | |||||||||
Truckload Revenue — Although operating revenue decreased, Revenue xFSR increased 4.7% from 2014 to 2015. The following factors contributed to the increase in Revenue xFSR:
• | 4.0% increase in Revenue xFSR per loaded mile, primarily driven by pricing increases and freight mix. |
• | 0.7% increase in total loaded miles. |
The following factors impacted the 2.8% increase in weekly Revenue xFSR per tractor:
• | 4.0% increase in Revenue xFSR per loaded mile. |
• | partially offset by a 1.2% decrease in loaded miles per tractor per week from disruption associated with trading and in-servicing more tractors in 2015, compared to 2014. This was the result of our acceleration of the average trade-in cycle for our tractors. |
Truckload Operating Income — Operating income decreased slightly from 2014 to 2015. This resulted in a 70 basis point increase in Adjusted Operating Ratio, primarily caused by the increases in wages for our company drivers and contracted pay rates for owner-operators, discussed above, as well as adverse development of prior-year insurance claims and corresponding increase in reserves. This was partially offset by increases in customer pricing, as well as reduced fuel expense associated with declining fuel prices and better fuel efficiency.
41
SWIFT TRANSPORTATION COMPANY
MANAGEMENT'S DISCUSSION AND ANALYSIS OF FINANCIAL CONDITION AND RESULTS OF OPERATIONS — CONTINUED
Dedicated Segment
Year Ended December 31, | Increase (Decrease) | |||||||||||||
2015 | 2014 | Amount | Percentage | |||||||||||
(Dollars in thousands, except per tractor amounts) | ||||||||||||||
Operating revenue | $ | 927,657 | $ | 892,078 | $ | 35,579 | 4.0 | % | ||||||
Revenue xFSR | $ | 848,297 | $ | 740,679 | $ | 107,618 | 14.5 | % | ||||||
Operating income | $ | 82,735 | $ | 75,794 | $ | 6,941 | 9.2 | % | ||||||
Operating Ratio | 91.1 | % | 91.5 | % | (0.4 | )% | ||||||||
Adjusted Operating Ratio | 90.2 | % | 89.8 | % | 0.4 | % | ||||||||
Weekly Revenue xFSR per tractor | $ | 3,326 | $ | 3,182 | $ | 144 | 4.5 | % | ||||||
Average operational truck count: | ||||||||||||||
Company | 4,006 | 3,609 | 397 | 11.0 | % | |||||||||
Owner-operator | 884 | 852 | 32 | 3.8 | % | |||||||||
Total | 4,890 | 4,461 | 429 | 9.6 | % | |||||||||
Dedicated Revenue — Operating revenue increased from 2014 to 2015. Additionally, Revenue xFSR increased 14.5%, driven by multiple new customer contracts entered into over the last twelve months, which also contributed to the increase in average operational truck count. Weekly Revenue xFSR per tractor increased due to improved pricing and customer mix.
Dedicated Operating Income — Operating income increased from 2014 to 2015. Despite the improvements in operating income, Adjusted Operating Ratio deteriorated by 40 basis points, due to an increase in insurance and claims expense from adverse development of prior-year claims and corresponding increase in reserves, as well as increases in company driver wages and owner-operator contracted pay rates. The impact of these increased expenses was largely offset by the improvement in pricing and customer mix, noted above, as well as declining fuel prices and improved fuel efficiency.
Swift Refrigerated Segment
Year Ended December 31, | Increase (Decrease) | |||||||||||||
2015 | 2014 | Amount | Percentage | |||||||||||
(Dollars (except per tractor amounts) and miles in thousands) | ||||||||||||||
Operating revenue | $ | 380,251 | $ | 417,980 | $ | (37,729 | ) | (9.0 | )% | |||||
Revenue xFSR | $ | 328,040 | $ | 334,320 | $ | (6,280 | ) | (1.9 | )% | |||||
Operating income | $ | 17,080 | $ | 14,035 | $ | 3,045 | 21.7 | % | ||||||
Operating Ratio | 95.5 | % | 96.6 | % | (1.1 | )% | ||||||||
Adjusted Operating Ratio | 94.8 | % | 95.8 | % | (1.0 | )% | ||||||||
Weekly Revenue xFSR per tractor | $ | 3,434 | $ | 3,461 | $ | (27 | ) | (0.8 | )% | |||||
Total loaded miles | 170,684 | 166,637 | 4,047 | 2.4 | % | |||||||||
Deadhead miles percentage | 14.2 | % | 15.2 | % | (1.0 | )% | ||||||||
Average operational truck count: | ||||||||||||||
Company | 1,242 | 1,102 | 140 | 12.7 | % | |||||||||
Owner-operator | 590 | 755 | (165 | ) | (21.9 | )% | ||||||||
Total | 1,832 | 1,857 | (25 | ) | (1.3 | )% | ||||||||
Swift Refrigerated Revenue — Operating revenue decreased from 2014 to 2015. Additionally, Revenue xFSR decreased by 1.9%, primarily driven by:
• | 4.3% reduction in Revenue xFSR per loaded mile. In the first quarter of 2015, we ceased servicing a large Swift Refrigerated specialty dedicated account. This dedicated account was not profitable and skewed our operational metrics since it operated with a much lower average length of haul, higher deadhead and much higher Revenue xFSR per loaded mile, as compared to other accounts. |
• | partially offset by a 2.4% increase in total loaded miles. |
42
SWIFT TRANSPORTATION COMPANY
MANAGEMENT'S DISCUSSION AND ANALYSIS OF FINANCIAL CONDITION AND RESULTS OF OPERATIONS — CONTINUED
Swift Refrigerated Operating Income — Operating income increased 21.7% from 2014 to 2015. Additionally, Adjusted Operating Ratio improved 100 basis points from 2014 to 2015. These improvements were driven by reduced fuel expense associated with declining fuel prices and improved fuel efficiency, as well as a decrease in deadhead. Increases in company driver wages and owner-operator contracted pay rates as well as increased insurance and claims expense, partially offset these items.
Intermodal Segment
Year Ended December 31, | Increase (Decrease) | |||||||||||||
2015 | 2014 | Amount | Percentage | |||||||||||
(Dollars in thousands) | ||||||||||||||
Operating revenue | $ | 390,572 | $ | 401,577 | $ | (11,005 | ) | (2.7 | )% | |||||
Revenue xFSR | $ | 340,131 | $ | 323,630 | $ | 16,501 | 5.1 | % | ||||||
Operating income | $ | 4,128 | $ | 8,298 | $ | (4,170 | ) | (50.3 | )% | |||||
Operating Ratio | 98.9 | % | 97.9 | % | 1.0 | % | ||||||||
Adjusted Operating Ratio | 98.8 | % | 97.4 | % | 1.4 | % | ||||||||
Average operational truck count: | ||||||||||||||
Company | 517 | 426 | 91 | 21.4 | % | |||||||||
Owner-operator | 102 | 77 | 25 | 32.5 | % | |||||||||
Total | 619 | 503 | 116 | 23.1 | % | |||||||||
Load count | 181,513 | 172,464 | 9,049 | 5.2 | % | |||||||||
Average container count | 9,150 | 8,841 | 309 | 3.5 | % | |||||||||
Intermodal Revenue — Although operating revenue decreased from 2014 to 2015, Revenue xFSR increased 5.1%, primarily due to a 5.2% increase in load counts. COFC loads increased 11.0%, while TOFC loads decreased 54.2%, as we shifted away from the unprofitable refrigerated TOFC business in 2014.
Intermodal Operating Income — Operating income decreased from 2014 to 2015, contributing to an increase in Adjusted Operating Ratio of 140 basis points. This was driven by year over year reductions in seasonal project business and repositioning charges, partially offset by an 11.0% increase in container turns.
Non-reportable Segment
Year Ended December 31, | Increase (Decrease) | |||||||||||||
2015 | 2014 | Amount | Percentage | |||||||||||
(Dollars in thousands) | ||||||||||||||
Operating revenue | $ | 407,781 | $ | 342,969 | $ | 64,812 | 18.9 | % | ||||||
Operating income | $ | 9,154 | $ | 13,871 | $ | (4,717 | ) | (34.0 | )% | |||||
Non-reportable Segment Revenue — Operating revenue within our non-reportable segment increased from 2014 to 2015, primarily driven by growth in the logistics business and increased services to owner-operators.
Non-reportable Segment Operating Income — Operating income within the non-reportable segment decreased from 2014 to 2015. Operating income in 2015 included a $5.1 million charge associated with the settlement of a class-action lawsuit and related costs. Operating income in 2014 included a $2.3 million impairment charge related to certain operations software.
43
SWIFT TRANSPORTATION COMPANY
MANAGEMENT'S DISCUSSION AND ANALYSIS OF FINANCIAL CONDITION AND RESULTS OF OPERATIONS — CONTINUED
Segment Review — Comparison Between the Years Ended December 31, 2014 and December 31, 2013
Truckload Segment
Year Ended December 31, | Increase (Decrease) | |||||||||||||
2014 | 2013 | Amount | Percentage | |||||||||||
(Dollars (except per tractor amounts) and miles in thousands) | ||||||||||||||
Operating revenue | $ | 2,301,010 | $ | 2,313,035 | $ | (12,025 | ) | (0.5 | )% | |||||
Revenue xFSR | $ | 1,858,987 | $ | 1,839,896 | $ | 19,091 | 1.0 | % | ||||||
Operating income | $ | 258,072 | $ | 225,963 | $ | 32,109 | 14.2 | % | ||||||
Operating Ratio | 88.8 | % | 90.2 | % | (1.4 | )% | ||||||||
Adjusted Operating Ratio | 86.1 | % | 87.7 | % | (1.6 | )% | ||||||||
Weekly Revenue xFSR per tractor | $ | 3,450 | $ | 3,257 | $ | 193 | 5.9 | % | ||||||
Total loaded miles | 1,030,443 | 1,067,141 | (36,698 | ) | (3.4 | )% | ||||||||
Deadhead miles percentage | 11.9 | % | 11.6 | % | 0.3 | % | ||||||||
Average operational truck count: | ||||||||||||||
Company | 6,975 | 7,500 | (525 | ) | (7.0 | )% | ||||||||
Owner-operator | 3,361 | 3,333 | 28 | 0.8 | % | |||||||||
Total | 10,336 | 10,833 | (497 | ) | (4.6 | )% | ||||||||
Truckload Revenue — Operating revenue decreased in 2014, compared to 2013. Compared to 2013, Revenue xFSR increased by 1.0% in 2014, impacted by:
• | a 5.9% increase in weekly Revenue xFSR per tractor, which was driven by a 4.6% increase in Revenue xFSR per loaded mile (from contractual rate increases, freight mix and an increase in paid repositioning) and a 1.2% improvement in loaded miles per truck per week in 2014; |
• | offset by a 4.6% decrease in average tractors available for dispatch, as equipment was shifted from our Truckload segment to facilitate the growth within our Dedicated segment. As a result of this shift of resources and severe weather during the first quarter of 2014, total loaded miles decreased by 3.4%. |
Truckload Operating Income — Operating income increased in 2014, compared to 2013. The increase in operating income contributed to an improvement in Adjusted Operating Ratio of 160 basis points in 2014, compared to 2013. The improvement in Adjusted Operating Ratio was primarily due to improvements in pricing, productivity and fuel expense, partially offset by increased costs of driver wages, insurance claims, workers' compensation, winter weather-related items and equipment. Improvements in fuel expense reflect a combination of declining diesel prices and better fuel efficiency.
Dedicated Segment
Year Ended December 31, | Increase (Decrease) | |||||||||||||
2014 | 2013 | Amount | Percentage | |||||||||||
(Dollars in thousands, except per tractor amounts) | ||||||||||||||
Operating revenue | $ | 892,078 | $ | 738,929 | $ | 153,149 | 20.7 | % | ||||||
Revenue xFSR | $ | 740,679 | $ | 600,866 | $ | 139,813 | 23.3 | % | ||||||
Operating income | $ | 75,794 | $ | 83,520 | $ | (7,726 | ) | (9.3 | )% | |||||
Operating Ratio | 91.5 | % | 88.7 | % | 2.8 | % | ||||||||
Adjusted Operating Ratio | 89.8 | % | 86.1 | % | 3.7 | % | ||||||||
Weekly Revenue xFSR per tractor | $ | 3,182 | $ | 3,339 | $ | (157 | ) | (4.7 | )% | |||||
Average operational truck count: | ||||||||||||||
Company | 3,609 | 2,791 | 818 | 29.3 | % | |||||||||
Owner-operator | 852 | 660 | 192 | 29.1 | % | |||||||||
Total | 4,461 | 3,451 | 1,010 | 29.3 | % | |||||||||
44
SWIFT TRANSPORTATION COMPANY
MANAGEMENT'S DISCUSSION AND ANALYSIS OF FINANCIAL CONDITION AND RESULTS OF OPERATIONS — CONTINUED
Dedicated Revenue — Operating revenue increased in 2014, compared to 2013. Revenue xFSR increased 23.3% over 2013. The addition of new customer accounts in the latter half of 2013 and throughout 2014 contributed to a 29.3% increase in average tractors available for dispatch. Revenue xFSR per tractor decreased due to the varying operational requirements of the new customer contracts.
Dedicated Operating Income — Operating income decreased in 2014, compared to 2013. The decrease in operating income resulted in an unfavorable change in Adjusted Operating Ratio of 370 basis points in 2014, compared to 2013. This deterioration in Dedicated Adjusted Operating Ratio was primarily due to higher driver wages, as well as increased costs associated with insurance and claims, starting up new customer accounts, and the severe winter weather experienced in the first quarter of 2014. This was partially offset by a favorable impact in fuel expense from declining fuel prices.
Swift Refrigerated Segment
Year Ended December 31, | Increase (Decrease) | |||||||||||||
2014 | 2013 | Amount | Percentage | |||||||||||
(Dollars (except per tractor amounts) and miles in thousands) | ||||||||||||||
Operating revenue | $ | 417,980 | $ | 452,531 | $ | (34,551 | ) | (7.6 | )% | |||||
Revenue xFSR | $ | 334,320 | $ | 357,219 | $ | (22,899 | ) | (6.4 | )% | |||||
Operating income | $ | 14,035 | $ | 17,682 | $ | (3,647 | ) | (20.6 | )% | |||||
Operating Ratio | 96.6 | % | 96.1 | % | 0.5 | % | ||||||||
Adjusted Operating Ratio | 95.8 | % | 95.1 | % | 0.7 | % | ||||||||
Weekly Revenue xFSR per tractor | $ | 3,461 | $ | 3,474 | $ | (13 | ) | (0.4 | )% | |||||
Total loaded miles | 166,637 | 193,559 | (26,922 | ) | (13.9 | )% | ||||||||
Deadhead miles percentage | 15.2 | % | 12.8 | % | 2.4 | % | ||||||||
Average operational truck count: | ||||||||||||||
Company | 1,102 | 1,018 | 84 | 8.3 | % | |||||||||
Owner-operator | 755 | 951 | (196 | ) | (20.6 | )% | ||||||||
Total | 1,857 | 1,970 | (113 | ) | (5.7 | )% | ||||||||
Swift Refrigerated Revenue — Operating revenue decreased in 2014, compared to 2013. Compared to 2013, Revenue xFSR decreased in 2014 by 6.4% impacted by:
• | a decrease in total loaded miles of 13.9%, which was the result of a 5.7% decrease in average tractors available for dispatch, severe winter weather in the first quarter of 2014, Central's conversion to Swift's system and process in February 2014, and challenges faced in the driver market. |
• | a decrease in weekly Revenue xFSR per tractor of 0.4% primarily from freight mix changes. The decrease in weekly Revenue xFSR per tractor reflects a decrease in loaded miles per tractor of 8.7%, offset by an increase in Revenue xFSR per loaded mile of 8.7%. Swift Refrigerated added several new dedicated locations which operated with a lower average length of haul, higher deadhead and a higher Revenue xFSR per loaded mile. |
Swift Refrigerated Operating Income — Operating income decreased in 2014, compared to 2013. The decrease in operating income resulted in an unfavorable change in Adjusted Operating Ratio of 70 basis points from 2013 to 2014. The deterioration in Adjusted Operating Ratio was primarily related to the severe weather experienced in the first quarter of 2014, higher equipment costs, higher deadhead percentage, higher driver wages, the challenges associated with Central's conversion to Swift's system in February 2014 and the driver market, as well as the continued challenges with the large unique dedicated customer added in June 2013. This was partially offset by the increase in Revenue xFSR per loaded mile of 8.7% in 2014, compared to 2013.
45
SWIFT TRANSPORTATION COMPANY
MANAGEMENT'S DISCUSSION AND ANALYSIS OF FINANCIAL CONDITION AND RESULTS OF OPERATIONS — CONTINUED
Intermodal Segment
Year Ended December 31, | Increase (Decrease) | |||||||||||||
2014 | 2013 | Amount | Percentage | |||||||||||
(Dollars in thousands) | ||||||||||||||
Operating revenue | $ | 401,577 | $ | 376,075 | $ | 25,502 | 6.8 | % | ||||||
Revenue xFSR | $ | 323,630 | $ | 298,481 | $ | 25,149 | 8.4 | % | ||||||
Operating income | $ | 8,298 | $ | 5,619 | $ | 2,679 | 47.7 | % | ||||||
Operating Ratio | 97.9 | % | 98.5 | % | (0.6 | )% | ||||||||
Adjusted Operating Ratio | 97.4 | % | 98.1 | % | (0.7 | )% | ||||||||
Average operational truck count: | ||||||||||||||
Company | 426 | 321 | 105 | 32.7 | % | |||||||||
Owner-operator | 77 | 41 | 36 | 87.8 | % | |||||||||
Total | 503 | 362 | 141 | 39.0 | % | |||||||||
Load count | 172,464 | 160,642 | 11,822 | 7.4 | % | |||||||||
Average container count | 8,841 | 8,717 | 124 | 1.4 | % | |||||||||
Intermodal Revenue — Operating revenue increased in 2014, compared to 2013. Compared to 2013, Revenue xFSR increased in 2014 by 8.4%, impacted by:
• | a 7.4% increase in load count. |
• | a 1.0% increase in Revenue xFSR per load. The number of COFC loads increased in 2014, while TOFC loads decreased, as we continued to shift our focus to more profitable freight. |
Intermodal Operating Income — Operating income increased in 2014, compared to 2013. The increase in operating income resulted in a favorable change in Adjusted Operating Ratio of 70 basis points from 2013 to 2014. The improved Adjusted Operating Ratio was primarily due to improvements in our network, utilization of our equipment and an increase in Revenue xFSR per load. This was partially offset by increased costs associated with shifting away from the unprofitable TOFC business, as well as severe weather conditions during the first quarter of 2014.
Non-reportable Segment
Year Ended December 31, | Increase (Decrease) | |||||||||||||
2014 | 2013 | Amount | Percentage | |||||||||||
(Dollars in thousands) | ||||||||||||||
Operating revenue | $ | 342,969 | $ | 287,853 | $ | 55,116 | 19.1 | % | ||||||
Operating income | $ | 13,871 | $ | 24,175 | $ | (10,304 | ) | (42.6 | )% | |||||
Other Non-reportable Segment Revenue — Operating revenue increased in 2014, compared to 2013. This was driven by an increase in our logistics business and services provided by us to owner-operators.
Other Non-reportable Segment Operating Income — Operating income decreased in 2014, compared to 2013. The decrease in operating income was primarily related to increases in expenses related to the services we provide to owner-operators, as well as a $2.3 million impairment of certain operations software, partially offset by the growth in revenue for the services noted above.
46
SWIFT TRANSPORTATION COMPANY
MANAGEMENT'S DISCUSSION AND ANALYSIS OF FINANCIAL CONDITION AND RESULTS OF OPERATIONS — CONTINUED
Results of Operations — Consolidated Operating and Other Expenses |
Operating Expenses — The following tables present certain operating expenses from our consolidated income statements, including each operating expense as a percentage of operating revenue and as a percentage of Revenue xFSR. Fuel surcharge revenue can be volatile and is primarily dependent upon the cost of fuel, rather than operation expenses unrelated to fuel. Therefore, we believe that Revenue xFSR is a better measure for analyzing our expenses and operating metrics.
Consolidated Expenses — Comparison Between the Years Ended December 31, 2015 and December 31, 2014
Year Ended December 31, | Increase (Decrease) | |||||||||||||
2015 | 2014 | Amount | Percentage | |||||||||||
(Dollars in thousands) | ||||||||||||||
Salaries, wages and employee benefits | $ | 1,111,946 | $ | 970,683 | $ | 141,263 | 14.6 | % | ||||||
% of operating revenue | 26.3 | % | 22.6 | % | 3.7 | % | ||||||||
% of Revenue xFSR | 29.4 | % | 27.5 | % | 1.9 | % | ||||||||
Salaries, wages and employee benefits are primarily affected by the total number of miles driven by company drivers, the rate per mile we pay our company drivers, and employee benefits, including health care, workers’ compensation and other benefits. To a lesser extent non-driver employee headcount, compensation and benefits affect the expense.
The increase in salaries, wages and employee benefits was due to a 10.3% increase in total miles driven by company drivers, higher company driver wage rates discussed above, an increase in non-driver headcount, and an increase in workers' compensation expense from adverse development of prior-year claims and corresponding increase in reserves. The compensation paid to our company drivers and other employees may increase further in future periods as the economy strengthens and other employment alternatives become more available.
Year Ended December 31, | Increase (Decrease) | |||||||||||||
2015 | 2014 | Amount | Percentage | |||||||||||
(Dollars in thousands) | ||||||||||||||
Operating supplies and expenses | $ | 387,735 | $ | 342,073 | $ | 45,662 | 13.3 | % | ||||||
% of operating revenue | 9.2 | % | 8.0 | % | 1.2 | % | ||||||||
% of Revenue xFSR | 10.3 | % | 9.7 | % | 0.6 | % | ||||||||
Operating supplies and expenses primarily consist of ordinary vehicle repairs and maintenance, costs associated with preparing tractors and trailers for sale or trade-in, driver expenses, driver recruiting costs, legal and professional services fees, general and administrative expenses, and other costs. Operating supplies and expenses are primarily affected by the age of our company-owned fleet of tractors and trailers, the number of miles driven in a period, driver turnover, and to a lesser extent by efficiency measures in our repair and maintenance shops.
The increase in operating supplies and expenses was primarily attributed to higher equipment maintenance costs, which were due to the increase in total miles driven by company drivers noted above, in-servicing new tractors, and processing used tractors for sale. A $5.1 million settlement of a class action lawsuit and related costs in 2015, as well as an increase in toll costs, compared to 2014, are also included in operating supplies and expenses.
We believe that the market for drivers remains tightened. As a result, hiring expenses, including recruiting and advertising, which are included in operating supplies and expenses, have increased and we expect will continue to increase in order to attract sufficient numbers of qualified drivers to operate our fleet.
Year Ended December 31, | Increase (Decrease) | |||||||||||||
2015 | 2014 | Amount | Percentage | |||||||||||
(Dollars in thousands) | ||||||||||||||
Fuel expense | $ | 416,782 | $ | 591,855 | $ | (175,073 | ) | (29.6 | )% | |||||
% of operating revenue | 9.9 | % | 13.8 | % | (3.9 | )% | ||||||||
% of Revenue xFSR | 11.0 | % | 16.7 | % | (5.7 | )% | ||||||||
Fuel expense consists primarily of diesel fuel expense for our company-owned tractors and fuel taxes. The primary factors affecting our fuel expense are the cost of diesel fuel, the fuel economy of our equipment, and the number of miles driven by company drivers.
47
SWIFT TRANSPORTATION COMPANY
MANAGEMENT'S DISCUSSION AND ANALYSIS OF FINANCIAL CONDITION AND RESULTS OF OPERATIONS — CONTINUED
We believe the most effective protections against fuel cost increases are maintaining a fuel-efficient fleet by incorporating fuel efficiency measures into our business, such as aerodynamic equipment, slower tractor speeds, engine idle limitations, and a reduction of deadhead miles; actively managing fuel procurement; and maintaining an effective fuel surcharge program. To mitigate unrecovered fuel exposure, we have worked to negotiate more robust surcharge programs with customers identified as having inadequate programs. We generally have not used derivatives to hedge against higher fuel costs in the past, but continue to evaluate this possibility. To mitigate the impact of rising fuel costs, we have contracted to purchase some fuel from certain fuel suppliers at a fixed price or within banded pricing for a specific period, usually not exceeding twelve months.
The decrease in fuel expense was the result of declining fuel prices and improved fuel efficiency, partially offset by the increase in total miles driven by company drivers, noted above.
Year Ended December 31, | Increase (Decrease) | |||||||||||||
2015 | 2014 | Amount | Percentage | |||||||||||
(Dollars in thousands) | ||||||||||||||
Purchased transportation expense | $ | 1,180,403 | $ | 1,321,268 | $ | (140,865 | ) | (10.7 | )% | |||||
% of operating revenue | 27.9 | % | 30.7 | % | (2.8 | )% | ||||||||
% of Revenue xFSR | 31.2 | % | 37.4 | % | (6.2 | )% | ||||||||
Purchased transportation expense includes payments made to owner-operators, rail partners and other third parties for their services. The decrease in the expense was attributed to reduced fuel reimbursements to the owner-operators we contract with and other third parties, as a result of declining fuel prices and a 5.4% decrease in miles driven by the owner-operators we contract with. This was partially offset by the increases in owner-operator contracted pay rates noted above, as well as growth in our logistics business.
Contracted pay rates for the owner-operators we contract with may increase further in future periods as the economy strengthens and other employment alternatives become more available.
Year Ended December 31, | Increase (Decrease) | |||||||||||||
2015 | 2014 | Amount | Percentage | |||||||||||
(Dollars in thousands) | ||||||||||||||
Insurance and claims | $ | 179,545 | $ | 159,246 | $ | 20,299 | 12.7 | % | ||||||
% of operating revenue | 4.2 | % | 3.7 | % | 0.5 | % | ||||||||
% of Revenue xFSR | 4.7 | % | 4.5 | % | 0.2 | % | ||||||||
Insurance and claims expense consists of insurance premiums and estimated payments and expenses for claims for bodily injury, property damage, cargo damage, and other casualty events. The primary factors affecting our insurance and claims are the number of miles driven by our drivers and owner-operators, the frequency and severity of accidents, trends in the development factors used in our actuarial accruals, and developments in large, prior-year claims. Furthermore, our self-insured retention of $10.0 million per occurrence for accident claims can cause volatility in this expense.
The increase in insurance and claims was primarily due to the first three quarters in 2015, when we had adverse current-year development of certain prior-year claims, higher claims severity trends and higher claims frequency trends. However, our crash frequency and severity trends improved in the fourth quarter of 2015, partially driven by our investments in new equipment with enhanced safety features, as well as improved driver retention and other safety initiatives.
Year Ended December 31, | Increase (Decrease) | |||||||||||||
2015 | 2014 | Amount | Percentage | |||||||||||
(Dollars in thousands) | ||||||||||||||
Rental expense and depreciation and amortization of property and equipment | $ | 492,236 | $ | 450,412 | $ | 41,824 | 9.3 | % | ||||||
% of operating revenue | 11.6 | % | 10.5 | % | 1.1 | % | ||||||||
% of Revenue xFSR | 13.0 | % | 12.7 | % | 0.3 | % | ||||||||
Rental expense consists primarily of payments for tractors and trailers financed with operating leases. Depreciation and amortization of property and equipment consists primarily of depreciation for owned tractors and trailers or amortization of those financed with capital leases. The primary factors affecting these expense items are the size and age of our revenue equipment fleet, the cost of new equipment, and the relative percentage of owned versus leased equipment. We believe it is appropriate to combine our rental expense with our depreciation and amortization of property and equipment for analytical purposes because the mix of our leased versus owned tractors varies from period to period.
48
SWIFT TRANSPORTATION COMPANY
MANAGEMENT'S DISCUSSION AND ANALYSIS OF FINANCIAL CONDITION AND RESULTS OF OPERATIONS — CONTINUED
The increase in the combined expense was primarily due to growth in tractors and trailers in our fleet from December 31, 2014 to December 31, 2015. See consolidated table of revenue equipment within "Executive Summary," above. Higher revenue equipment replacement costs additionally contributed to the increase in the expense. As a percentage of Revenue xFSR, rental expense and depreciation and amortization of property and equipment remained relatively consistent from 2014 to 2015.
Year Ended December 31, | Increase (Decrease) | |||||||||||
2015 | 2014 | Amount | Percentage | |||||||||
(Dollars in thousands) | ||||||||||||
Amortization of intangibles | 16,814 | 16,814 | $ | — | — | % | ||||||
% of operating revenue | 0.4 | % | 0.4 | % | — | % | ||||||
% of Revenue xFSR | 0.4 | % | 0.5 | % | (0.1 | )% | ||||||
In conjunction with the 2007 Transactions, definite-lived intangible assets with a gross carrying value of $261.2 million were recorded. The related amortization comprised $15.6 million of total amortization expense in both 2015 and 2014. Amortization of intangibles also included $1.2 million each year related to intangible assets existing prior to the 2007 Transactions.
We anticipate that the composition and amount of amortization associated with intangible assets as of December 31, 2015 will remain consistent at $16.8 million through 2017, and will decrease to $16.3 million in 2018, of which $0.7 million will represent the final amortization of the intangible assets existing prior to the 2007 Transactions. Amortization of intangible assets is expected to be $15.6 million in both 2019 and 2020. Actual amounts of amortization expense may differ from estimated amounts due to additional intangible asset acquisitions, impairment of intangible assets, accelerated amortization of intangible assets and other events.
Year Ended December 31, | Increase (Decrease) | |||||||||||||
2015 | 2014 | Amount | Percentage | |||||||||||
(Dollars in thousands) | ||||||||||||||
Impairments | $ | — | $ | 2,308 | $ | (2,308 | ) | (100.0 | )% | |||||
% of operating revenue | — | % | 0.1 | % | (0.1 | )% | ||||||||
% of Revenue xFSR | — | % | 0.1 | % | (0.1 | )% | ||||||||
In the third quarter of 2014, certain operations software was replaced and the carrying value was determined to be fully impaired. There were no impairments related to operating assets in 2015.
Year Ended December 31, | Increase (Decrease) | |||||||||||||
2015 | 2014 | Amount | Percentage | |||||||||||
(Dollars in thousands) | ||||||||||||||
Gain on disposal of property and equipment | $ | 32,453 | $ | 27,682 | $ | 4,771 | 17.2 | % | ||||||
% of operating revenue | 0.8 | % | 0.6 | % | 0.2 | % | ||||||||
% of Revenue xFSR | 0.9 | % | 0.8 | % | 0.1 | % | ||||||||
We previously announced plans to accelerate the average trade-in cycle for our tractors. As we added newer tractors to our fleet during 2015, we sold the older models (including a few large sales transactions in the fourth quarter of 2015), contributing to the increase in gain on disposal of revenue equipment, compared to 2014. We did not sell any facilities in 2015.
In the third quarter of 2014, we recognized gains on the sale of two redundant facilities associated with the Central Acquisition, resulting in a gain of $3.0 million.
49
SWIFT TRANSPORTATION COMPANY
MANAGEMENT'S DISCUSSION AND ANALYSIS OF FINANCIAL CONDITION AND RESULTS OF OPERATIONS — CONTINUED
Other Expenses — The following table summarizes fluctuations in certain non-operating expenses, included in our consolidated income statements, for the year ended December 31, 2015, as compared to the year ended December 31, 2014.
Year Ended December 31, | Increase (Decrease) | |||||||||||||
2015 | 2014 | Amount | Percentage | |||||||||||
(Dollars in thousands) | ||||||||||||||
Interest expense | $ | 38,350 | $ | 80,064 | $ | (41,714 | ) | (52.1 | )% | |||||
Derivative interest expense | $ | 3,972 | $ | 6,495 | $ | (2,523 | ) | (38.8 | )% | |||||
Loss on debt extinguishment | $ | 9,567 | $ | 39,909 | $ | (30,342 | ) | (76.0 | )% | |||||
Non-cash impairments of non-operating assets | $ | 1,480 | $ | — | $ | 1,480 | 100.0 | % | ||||||
Legal settlement | $ | 6,000 | $ | — | $ | 6,000 | 100.0 | % | ||||||
Income tax expense | $ | 119,209 | $ | 89,474 | $ | 29,735 | 33.2 | % | ||||||
Interest Expense — Interest expense is comprised of debt interest expense, as well as amortization of deferred financing costs and OID. The decrease in interest expense was primarily driven by our call of the Senior Notes in November 2014. Also contributing to the decrease in interest expense was the impact of replacing the 2014 Agreement with the 2015 Agreement, which had lower interest rates.
Derivative Interest Expense — Derivative interest expense reflects losses reclassified from AOCI into net income from the effective portion of cash flow hedges, as well as the income effect of mark-to-market adjustments and current settlements of interest rate swaps, which were de-designated in February 2013. The final settlement of our interest rate swaps occurred in July 2015. As such, there was no derivative interest expense thereafter, causing the decrease in the expense from 2014 to 2015.
Loss on Debt Extinguishment — In July 2015, we replaced the 2014 Agreement with the 2015 Agreement, which resulted in a loss on debt extinguishment of $9.6 million, reflecting the write-off of the unamortized OID and deferred financing fees related to the 2014 Agreement.
In November 2014, the Company redeemed, in full, the remaining $428.1 million face value of its Senior Notes. The Company paid 105% of face value, plus accrued and unpaid interest, to call the Senior Notes. The November 2014 redemption followed a series of refinancing transactions that occurred in the first nine months of 2014, in which the Company used cash on hand to repurchase $71.9 million in principal of the Senior Notes at an average price of 109.05%. In total, these transactions resulted in a loss on debt extinguishment of $34.7 million, reflecting the write-off of the unamortized OID.
Also, in June 2014, we replaced the 2013 Agreement with the 2014 Agreement, which resulted in a loss on debt extinguishment of $5.2 million, reflecting the write-off of the unamortized OID and deferred financing fees related to the 2013 Agreement and the previous revolving credit line.
Non-cash Impairments of Non-operating Assets — In September 2013, the Company agreed to advance up to $2.3 million, pursuant to an unsecured promissory note, to an independent fleet contractor that transported freight on Swift's behalf. In March 2015, management became aware that the independent contractor violated various covenants outlined in the unsecured promissory note, which created an event of default that made the principal and accrued interest immediately due and payable. As a result of this event of default, as well as an overall decline in the independent contractor's financial condition, management re-evaluated the fair value of the unsecured promissory note. At March 31, 2015, management determined that the remaining balance due from the independent contractor to the Company was not collectible, which resulted in a $1.5 million pre-tax adjustment that was recorded in "Non-cash impairments of non-operating assets" in the Company's consolidated income statements.
Legal Settlement — In June 2015, the Company settled a lawsuit relating to a contractual dispute with a company in the business of supplying ancillary fuel system equipment. As a result of this settlement, we incurred a $6.0 million expense.
Income Tax Expense — The effective tax rate in 2015 was 37.6%, which was lower than our expectation of 38.5%, primarily due to federal employment income tax credits realized in the fourth quarter of 2015 from tax legislation recently enacted, as well as the benefit of prior year federal employment income tax credits realized in the third quarter of 2015.
The effective tax rate in 2014 was 35.7%, which was lower than our expectation of 38.5%, primarily due to the benefit of prior year federal income tax credits realized in the third quarter of 2014 and federal employment income tax credits realized in the fourth quarter of 2014.
50
SWIFT TRANSPORTATION COMPANY
MANAGEMENT'S DISCUSSION AND ANALYSIS OF FINANCIAL CONDITION AND RESULTS OF OPERATIONS — CONTINUED
Consolidated Expenses — Comparison Between the Years Ended December 31, 2014 and December 31, 2013
Year Ended December 31, | Increase (Decrease) | |||||||||||||
2014 | 2013 | Amount | Percentage | |||||||||||
(Dollars in thousands) | ||||||||||||||
Salaries, wages and employee benefits | $ | 970,683 | $ | 903,990 | $ | 66,693 | 7.4 | % | ||||||
% of operating revenue | 22.6 | % | 22.0 | % | 0.6 | % | ||||||||
% of Revenue xFSR | 27.5 | % | 27.2 | % | 0.3 | % | ||||||||
The increase in salaries, wages and employee benefits was primarily due to an increase in the driver wage rate per mile, workers' compensation expense and growth in non-driver staff. This was partially offset by a 0.7% decrease in number of miles driven by company drivers in 2014, compared to 2013.
Year Ended December 31, | Increase (Decrease) | |||||||||||||
2014 | 2013 | Amount | Percentage | |||||||||||
(Dollars in thousands) | ||||||||||||||
Operating supplies and expenses | $ | 342,073 | $ | 319,023 | $ | 23,050 | 7.2 | % | ||||||
% of operating revenue | 8.0 | % | 7.7 | % | 0.3 | % | ||||||||
% of Revenue xFSR | 9.7 | % | 9.6 | % | 0.1 | % | ||||||||
The dollar increase in operating supplies and expenses was due to increases in hiring costs, professional fees and equipment maintenance. However, as a percentage of Revenue xFSR, operating supplies and expenses were relatively consistent year-over-year.
Year Ended December 31, | Increase (Decrease) | |||||||||||||
2014 | 2013 | Amount | Percentage | |||||||||||
(Dollars in thousands) | ||||||||||||||
Fuel expense | $ | 591,855 | $ | 640,000 | $ | (48,145 | ) | (7.5 | )% | |||||
% of operating revenue | 13.8 | % | 15.5 | % | (1.7 | )% | ||||||||
% of Revenue xFSR | 16.7 | % | 19.2 | % | (2.5 | )% | ||||||||
The decrease in fuel expense was primarily due to a decrease in miles driven by company drivers, as well as declining fuel prices. This was partially offset by an increase in idle fuel costs resulting from severe winter weather during the first quarter of 2014.
Year Ended December 31, | Increase (Decrease) | |||||||||||||
2014 | 2013 | Amount | Percentage | |||||||||||
(Dollars in thousands) | ||||||||||||||
Purchased transportation expense | $ | 1,321,268 | $ | 1,255,646 | $ | 65,622 | 5.2 | % | ||||||
% of operating revenue | 30.7 | % | 30.5 | % | 0.2 | % | ||||||||
% of Revenue xFSR | 37.4 | % | 37.7 | % | (0.3 | )% | ||||||||
The year over year dollar and percentage increases were primarily due to a 6.5% increase in the number miles driven by owner-operators and an increase in both intermodal and third-party logistics volume. As a percentage of operating revenue, purchased transportation expense was relatively flat.
Year Ended December 31, | Increase (Decrease) | |||||||||||||
2014 | 2013 | Amount | Percentage | |||||||||||
(Dollars in thousands) | ||||||||||||||
Insurance and claims | $ | 159,246 | $ | 142,179 | $ | 17,067 | 12.0 | % | ||||||
% of operating revenue | 3.7 | % | 3.5 | % | 0.2 | % | ||||||||
% of Revenue xFSR | 4.5 | % | 4.3 | % | 0.2 | % | ||||||||
51
SWIFT TRANSPORTATION COMPANY
MANAGEMENT'S DISCUSSION AND ANALYSIS OF FINANCIAL CONDITION AND RESULTS OF OPERATIONS — CONTINUED
The dollar increase in insurance and claims expense was primarily due to higher frequency and severity of claims, primarily related to the severe winter weather in 2014 and an increase in total exposure miles. As a percentage of Revenue xFSR, insurance and claims were relatively consistent year over year, increasing by 20 basis points from 2013 to 2014.
Year Ended December 31, | Increase (Decrease) | |||||||||||||
2014 | 2013 | Amount | Percentage | |||||||||||
(Dollars in thousands) | ||||||||||||||
Rental expense and depreciation and amortization of property and equipment | $ | 450,412 | $ | 406,336 | $ | 44,076 | 10.8 | % | ||||||
% of operating revenue | 10.5 | % | 9.9 | % | 0.6 | % | ||||||||
% of Revenue xFSR | 12.7 | % | 12.2 | % | 0.5 | % | ||||||||
For 2014, combined rental expense and depreciation and amortization of property and equipment increased compared to 2013. As a percentage of Revenue xFSR, these combined expenses increased by 50 basis points from 2013 to 2014. The increase was primarily due to growth in the number of tractors and trailers in our fleet, higher equipment replacement costs and a higher number of operating leases for revenue equipment, including financing costs. This was partially offset by a decrease in the number of owner-operator tractors that were financed through the Company.
Year Ended December 31, | Increase (Decrease) | |||||||||||
2014 | 2013 | Amount | Percentage | |||||||||
(Dollars in thousands) | ||||||||||||
Amortization of intangibles | 16,814 | 16,814 | $ | — | — | % | ||||||
% of operating revenue | 0.4 | % | 0.4 | % | — | % | ||||||
% of Revenue xFSR | 0.5 | % | 0.5 | % | — | % | ||||||
In conjunction with the 2007 Transactions, definite-lived intangible assets with a gross carrying value of $261.2 million were recorded. The related amortization comprised $15.6 million of total amortization expense in both 2014 and 2013. Amortization of intangibles also included $1.2 million each year related to intangible assets existing prior to the 2007 Transactions.
Year Ended December 31, | Increase (Decrease) | |||||||||||||
2014 | 2013 | Amount | Percentage | |||||||||||
(Dollars in thousands) | ||||||||||||||
Impairments | $ | 2,308 | $ | — | $ | 2,308 | 100.0 | % | ||||||
% of operating revenue | 0.1 | % | — | % | 0.1 | % | ||||||||
% of Revenue xFSR | 0.1 | % | — | % | 0.1 | % | ||||||||
During the year ended December 31, 2014, certain operations software was replaced and the carrying value was determined to be fully impaired. There were no impairments related to operating assets in the year ended December 31, 2013.
Year Ended December 31, | Increase (Decrease) | |||||||||||||
2014 | 2013 | Amount | Percentage | |||||||||||
(Dollars in thousands) | ||||||||||||||
Operating taxes and licenses | $ | 71,806 | $ | 74,319 | $ | (2,513 | ) | (3.4 | )% | |||||
% of operating revenue | 1.7 | % | 1.8 | % | (0.1 | )% | ||||||||
% of Revenue xFSR | 2.0 | % | 2.2 | % | (0.2 | )% | ||||||||
Operating taxes and licenses expense primarily represents the costs of taxes and licenses associated with our fleet of equipment and generating revenue in the states we operate in.
Operating taxes and licenses expense decreased $2.5 million, or 3.4%, for the year ended December 31, 2014, as compared to 2013. As a percentage of Revenue xFSR, operating taxes and licenses expense remained relatively flat.
52
SWIFT TRANSPORTATION COMPANY
MANAGEMENT'S DISCUSSION AND ANALYSIS OF FINANCIAL CONDITION AND RESULTS OF OPERATIONS — CONTINUED
Other Expenses (Income) — The following table summarizes fluctuations in certain non-operating expenses (income), included in our consolidated income statements, for the year ended December 31, 2014, as compared to the year ended December 31, 2013.
Year Ended December 31, | Increase (Decrease) | |||||||||||||
2014 | 2013 | Amount | Percentage | |||||||||||
(Dollars in thousands) | ||||||||||||||
Interest expense | $ | 80,064 | $ | 99,534 | $ | (19,470 | ) | (19.6 | )% | |||||
Derivative interest expense | $ | 6,495 | $ | 3,852 | $ | 2,643 | 68.6 | % | ||||||
Merger and acquisition expense | $ | — | $ | 4,913 | $ | (4,913 | ) | (100.0 | )% | |||||
Loss on debt extinguishment | $ | 39,909 | $ | 5,540 | $ | 34,369 | 620.4 | % | ||||||
Gain on sale of real property | $ | — | $ | (6,876 | ) | $ | 6,876 | (100.0 | )% | |||||
Income tax expense | $ | 89,474 | $ | 100,982 | $ | (11,508 | ) | (11.4 | )% | |||||
Interest Expense — The decrease in interest expense was primarily due to redeeming our Senior Notes in November 2014, lowering our other debt balances primarily from voluntary prepayments, and replacing the 2013 Agreement with the 2014 Agreement, which had lower interest rates.
Derivative Interest Expense — Derivative interest expense reflects losses reclassified from AOCI into net income from the effective portion of cash flow hedges, as well as the income effect of mark-to-market adjustments and current settlements of interest rate swaps, which were de-designated in February 2013.
Merger and Acquisition Expense — As the result of the Central Acquisition, both Swift and Central incurred certain transactional related expenses, including financial advisory, severance and other professional fees in 2013.
Loss on Debt Extinguishment — In November 2014, the Company redeemed, in full, the remaining $428.1 million face value of its Senior Notes. The Company paid 105% of face value, plus accrued and unpaid interest, to call the Senior Notes. The November 2014 redemption followed a series of refinancing transactions that occurred in the first nine months of 2014, in which the Company used cash on hand to repurchase $71.9 million in principal of the Senior Notes at an average price of 109.05%. In total, these transactions resulted in a loss on debt extinguishment of $34.7 million, reflecting the write-off of the unamortized OID.
Also, in June 2014, we replaced the 2013 Agreement with the 2014 Agreement, which resulted in a loss on debt extinguishment of $5.2 million, reflecting the write-off of the unamortized OID and deferred financing fees related to the 2013 Agreement and the previous revolving credit line.
In 2013, $5.0 million of the loss on debt extinguishment was from replacing the 2012 Agreement with the 2013 Agreement and $0.5 million was from repaying certain outstanding Central debt in full at closing of the Central Acquisition.
Gain on Sale of Real Property — Gains and losses from sales of properties that are unrelated to our core operations are included in this line item. During 2013, we disposed of two non-operating properties in Phoenix, Arizona and one non-operating property in Wilmington, California, resulting in a gain of $6.9 million. We did not sell any non-operating facilities in 2014.
Income Tax Expense — The effective tax rate in 2014 was 35.7%, which was lower than our expectation of 38.5%, primarily due to the benefit of prior year federal income tax credits realized in the third quarter of 2014 and federal employment income tax credits realized in the fourth quarter of 2014.
The effective tax rate for 2013 was 39.4%, which was 90 basis points higher than our normalized effective tax rate. This increase was primarily due to a new tax rate in Mexico, Central's conversion to a C-Corporation from an S-Corporation, fixed asset basis differences and state tax rate changes, Central Acquisition-related costs, as well as the benefit realized from Central's designation as an S-corporation prior to the Central Acquisition.
53
SWIFT TRANSPORTATION COMPANY
MANAGEMENT'S DISCUSSION AND ANALYSIS OF FINANCIAL CONDITION AND RESULTS OF OPERATIONS — CONTINUED
Liquidity and Capital Resources |
Sources of Liquidity
The following table presents our available sources of liquidity as of December 31, 2015 (in thousands):
Source: | Amount | |||
Cash and cash equivalents, excluding restricted cash | $ | 107,590 | ||
Availability under New Revolver, due July 2020 (1) | 305,000 | |||
Availability under 2015 RSA (2) | 107,000 | |||
Total unrestricted liquidity | $ | 519,590 | ||
Restricted cash (3) | 55,241 | |||
Restricted investments, held to maturity, amortized cost (3) | 23,215 | |||
Total liquidity, including restricted cash and restricted investments | $ | 598,046 | ||
____________
(1) | As of December 31, 2015, we had $200.0 million in borrowings and $95.0 million in letters of credit, primarily related to workers' compensation and self-insurance liabilities under our $600.0 million New Revolver, leaving $305.0 million available. |
(2) | Based on eligible receivables at December 31, 2015, our borrowing base for the 2015 RSA was $332.0 million, while outstanding borrowings were $225.0 million. |
(3) | Restricted cash and restricted short-term investments are primarily held by our captive insurance companies for claims payments. |
Uses of Liquidity
Our business requires substantial amounts of cash for operating expenses, capital expenditures, other assets, working capital changes, principal and interest payments on our obligations, tax payments and letters of credit required for insurance.
When justified by customer demand, as well as our liquidity and our ability to generate acceptable returns, we make substantial capital expenditures to maintain a modern company tractor fleet, refresh our trailer fleet and fund growth in our revenue equipment fleet. We expect net cash capital expenditures of approximately $200 million to $250 million for 2016. Further, we expect to continue to obtain a portion of our equipment under operating and capital leases, which are not reflected as net cash capital expenditures. In addition, we believe we have ample flexibility with our trade cycle and purchase agreements to alter our current plans if economic or other conditions warrant. Beyond 2016, we expect our net capital expenditures to remain substantial.
We believe we can finance our expected cash needs, including debt repayment, for at least the next twelve months with cash flows from operations, borrowings under our revolving credit facility, borrowings under our 2015 RSA, and lease financing. Over the long-term, we will continue to have significant capital requirements, which may require us to seek additional borrowings, lease financing, or equity capital. The availability of financing or equity capital will depend upon our financial condition and results of operations as well as prevailing market conditions. If such additional borrowings, lease financing, or equity capital is not available at the time we need to incur such indebtedness, then we may be required to utilize the revolving portion of our senior secured credit facility (if not then fully drawn), extend the maturity of then-outstanding indebtedness, rely on alternative financing arrangements, or engage in asset sales.
There can be no assurance that we will be able to incur additional debt under our existing financial arrangements to satisfy our ongoing capital requirements. However, we believe the combination of our expected cash flows, financing available through operating leases which are not subject to debt incurrence baskets, the capital lease basket, available funds under the 2015 RSA, and availability under our revolving credit facility will be sufficient to fund our expected capital expenditures for 2016.
Material Debt Agreements
As of December 31, 2015, we had $1.4 billion in material debt obligations at the following carrying values:
• | $669.8 million: New Term Loan A, due July 2020 |
• | $225.0 million: 2015 RSA outstanding borrowings, due January 2019 |
• | $281.8 million: Capital lease obligations |
• | $200.0 million: New Revolver, due July 2020 |
• | $11.1 million: Other |
54
SWIFT TRANSPORTATION COMPANY
MANAGEMENT'S DISCUSSION AND ANALYSIS OF FINANCIAL CONDITION AND RESULTS OF OPERATIONS — CONTINUED
As of December 31, 2014, we had $1.5 billion in material debt obligations at the following carrying values:
• | $500.0 million: Old Term Loan A, due June 2019 |
• | $396.1 million: Term Loan B, due June 2021, net of $0.9 million OID |
• | $334.0 million: 2013 RSA outstanding borrowings, due July 2016 |
• | $201.0 million: Capital lease obligations |
• | $57.0 million: Old Revolver, due July 2019 |
• | $7.0 million: Other |
Fourth Amended and Restated Credit Agreement
On July 27, 2015, the Company entered into the 2015 Agreement, which replaced the 2014 Agreement, including the $450.0 million Old Revolver (zero outstanding at closing), $500.0 million Old Term Loan A ($485.0 million outstanding at closing) and $400.0 million Term Loan B ($395.0 million outstanding at closing). The 2015 Agreement includes a $600.0 million New Revolver and a $680.0 million New Term Loan A. Upon closing, the $680.0 million in proceeds from the New Term Loan A, a $200.0 million draw on the New Revolver and $4.9 million cash on hand were used to pay off the then-outstanding balances of the Old Term Loan A and Term Loan B, including accrued interest and fees under the 2014 Agreement, as well as certain transactional fees associated with the 2015 Agreement. The pricing of the New Revolver and New Term Loan A at closing was comparable to the 2014 Agreement at 1.75% over LIBOR, subject to a leverage-based grid. This pricing for the New Term Loan A is lower than the pricing of the Term Loan B. The New Revolver and New Term Loan A mature in July 2020 and are subject to the same financial covenants and substantially the same terms as those contained in the 2014 Agreement. As of December 31, 2015, we were in compliance with the covenants of the 2015 Agreement.
2015 RSA
On December 10, 2015, SRCII, a wholly-owned subsidiary of the Company, entered into the 2015 RSA, which further amends the 2013 RSA. The parties to the 2015 RSA include SRCII as the seller, Swift Transportation Services, LLC as the servicer, the various conduit purchasers, the various related committed purchasers, the various purchaser agents, the various letters of credit participants, and PNC Bank, National Association as the issuing bank of letters of credit and as administrator. Pursuant to the 2015 RSA, the Company's receivable originator subsidiaries sell, on a revolving basis, undivided interests in all of their eligible accounts receivable to SRCII. In turn, SRCII sells a variable percentage ownership interest in the eligible accounts receivable to the various purchasers.
The 2015 RSA increases the maximum borrowing capacity secured by the receivables from $375.0 million to $400.0 million (with an accordion option to increase the maximum borrowing capacity by up to an additional $75.0 million subject to participation of the purchasers), extends the final maturity date from July 13, 2016 to January 10, 2019, and reduces the program fee from one-month LIBOR plus 95 basis points to one-month LIBOR plus 90 basis points.
The 2015 RSA is subject to customary fees and contains various customary affirmative and negative covenants, representations and warranties, and default and termination provisions. Collections on the underlying receivables by the Company are held for the benefit of SRCII and the various purchasers and are unavailable to satisfy claims of the Company and its subsidiaries.
Debt Terms
Key terms and other details regarding our material debt and capital lease agreements are discussed in Notes 11, 12, and 13 in the Notes to Consolidated Financial Statements, included in Part II, Item 8, Financial Statements and Supplementary Data, in this Annual Report on Form 10-K for the year ended December 31, 2015, herein incorporated by reference.
Cash Flow Analysis
Year Ended December 31, | |||||||||||
2015 | 2014 | 2013 | |||||||||
(In thousands) | |||||||||||
Net cash provided by operating activities | $ | 569,498 | $ | 395,781 | $ | 473,504 | |||||
Net cash used in investing activities | (241,807 | ) | (139,750 | ) | (311,720 | ) | |||||
Net cash used in financing activities | (325,233 | ) | (210,077 | ) | (156,202 | ) | |||||
55
SWIFT TRANSPORTATION COMPANY
MANAGEMENT'S DISCUSSION AND ANALYSIS OF FINANCIAL CONDITION AND RESULTS OF OPERATIONS — CONTINUED
Net cash provided by operating activities decreased by $77.7 million from 2013 to 2014 and increased by $173.7 million from 2014 to 2015. The following factors affected cash flows from operating activities:
Net Cash Provided by Operating Activities: Comparison Between 2013 and 2014
Unfavorable Cash Flow Variances:
(1) | $62.2 million increase in tax payments from 2013 to 2014, due to utilizing substantially all of our net operating losses from prior periods. |
(2) | $15.5 million net remaining unfavorable variance was related to various factors that had an immaterial impact on net cash provided by operating activities, individually and in aggregate. |
Net Cash Provided by Operating Activities: Comparison Between 2014 and 2015
Favorable Cash Flow Variances:
(3) | $112.0 million increase in cash flows related to changes within accounts receivable. This increase in net cash provided by changes in accounts receivable was primarily related to the timing of collections during 2015, compared to 2014. |
(4) | $44.0 million decrease in interest payments, primarily due to the redemption of our Senior Notes in November 2014. |
(5) | $17.7 million net remaining favorable variance was related to various factors that had an immaterial impact on net cash provided by operating activities, individually and in aggregate. |
56
SWIFT TRANSPORTATION COMPANY
MANAGEMENT'S DISCUSSION AND ANALYSIS OF FINANCIAL CONDITION AND RESULTS OF OPERATIONS — CONTINUED
Net cash used in investing activities decreased by $171.9 million from 2013 to 2014 and increased by $102.0 million from 2014 to 2015. The following factors affected cash flows from investing activities:
Net Cash Used in Investing Activities: Comparison Between 2013 and 2014
Favorable Cash Flow Variances:
(1) | $150.3 million cash used, net of debt repayments, to pay Central stockholders in the Central Acquisition in 2013, with no comparable transaction in 2014. |
(2) | $13.9 million increase in proceeds from the sale of property and equipment from 2013 to 2014. |
(3) | $12.3 million decrease in cash capital expenditures from 2013 to 2014. |
Unfavorable Cash Flow Variance:
(4) | $4.6 million net remaining unfavorable variance was related to various factors that had an immaterial impact on net cash used in investing activities, individually and in aggregate. |
Net Cash Used in Investing Activities: Comparison Between 2014 and 2015
Unfavorable Cash Flow Variances:
(5) | $36.6 million increase in cash capital expenditures from 2014 to 2015. This is consistent with executing our plan to grow our fleet during the first half of 2015, as well as accelerating the average trade-in cycle for our tractors throughout 2015. |
(6) $32.8 million increase in net cash used in assets held for sale transactions from 2014 to 2015.
(7) $16.7 million decrease in proceeds from sale of property and equipment from 2014 to 2015.
(8) $14.8 million increase in cash restrictions for claims payments from 2014 to 2015.
(9) | $1.1 million net remaining unfavorable variance was related to various factors that had an immaterial impact on net cash used in investing activities, individually and in aggregate. |
57
SWIFT TRANSPORTATION COMPANY
MANAGEMENT'S DISCUSSION AND ANALYSIS OF FINANCIAL CONDITION AND RESULTS OF OPERATIONS — CONTINUED
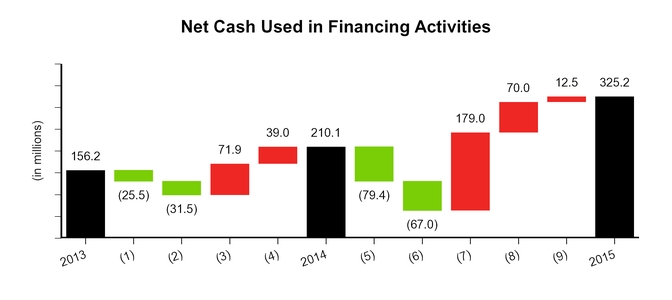
Net cash used in financing activities increased by $53.9 million from 2013 to 2014 and increased by $115.1 million from 2014 to 2015. The following factors affected cash flows from financing activities:
Cash Flow Impact of the 2015 Agreement: As noted under, "Fourth Amended and Restated Credit Agreement," above, the 2015 Agreement includes a $600.0 million New Revolver and a $680.0 million New Term Loan A. Upon closing in July 2015, the proceeds from the New Term Loan A, a $200.0 million draw on the New Revolver and $4.9 million cash on hand were used to pay off the then-outstanding balances of the Old Term Loan A ($485.0 million) and Term Loan B ($395.0 million), including accrued interest and fees under the 2014 Agreement, as well as certain transactional fees associated with the 2015 Agreement.
Cash Flow Impact of the 2014 Agreement: In June 2014, we entered into the 2014 Agreement, replacing the 2013 Agreement. Total proceeds received under the 2014 Agreement included $50.0 million at closing under the $500.0 million delayed-draw Old Term Loan A and $400.0 million under the Term Loan B. Additionally, we borrowed $164.0 million under the Old Revolver of the 2014 Agreement. With these proceeds, we repaid the then-existing first lien term loan B-1 tranche and first lien term loan B-2 tranche under the 2013 Agreement with outstanding principal balances of $229.0 million and $370.9 million plus accrued interest, respectively, and paid $10.5 million in deferred financing fees at closing. The Company subsequently drew the remaining $450.0 million available on the Old Term Loan A to facilitate redemption of the Senior Notes in November 2014.
The following variance analysis excludes the impact of the aforementioned cash transactions from the 2015 Agreement and the 2014 Agreement.
Net Cash Used in Financing Activities: Comparison Between 2013 and 2014
Favorable Cash Flow Variances:
(1) $25.5 million increase in net borrowings under the revolving credit facility in 2014, compared to 2013.
(2) | $31.5 million net remaining favorable variance was related to various factors that had an immaterial impact on net cash used in financing activities, individually and in aggregate. |
Unfavorable Cash Flow Variances:
(3) $71.9 million cash used in open market purchases to redeem our Senior Notes during 2014.
(4) $39.0 million in voluntary prepayments on the B-2 tranche of the 2013 Agreement during 2014.
Net Cash Used in Financing Activities: Comparison Between 2014 and 2015
Favorable Cash Flow Variances:
(5) | $79.4 million decrease in net cash used for voluntary and scheduled repayments of long-term debt and capital lease obligations. Excluding the impact of the 2015 Agreement, we repaid $95.3 million in 2015. Excluding the impact of the 2014 Agreement, we repaid $174.7 million in 2014. |
58
SWIFT TRANSPORTATION COMPANY
MANAGEMENT'S DISCUSSION AND ANALYSIS OF FINANCIAL CONDITION AND RESULTS OF OPERATIONS — CONTINUED
(6) | $67.0 million decrease in net repayments on our revolving credit line. Excluding the impact of the 2015 Agreement, we repaid $57.0 million in 2015. Excluding the impact of the 2014 Agreement, we repaid $124.0 million in 2014. |
Unfavorable Cash Flow Variances:
(7) | $179.0 million increase in repayments on the accounts receivable securitization. Excluding the impact of the 2015 Agreement, we made net repayments of $109.0 million in 2015. Excluding the impact of the 2014 Agreement, we had net borrowings of $70.0 million in 2014. |
(8) | $70.0 million cash used in November 2015 to repurchase shares of our outstanding Class A common stock, pursuant to a $100.0 million share repurchase plan authorized by the Board in September of 2015. |
(9) | $12.5 million net remaining unfavorable variance was related to various factors that had an immaterial impact on net cash used in financing activities, individually and in aggregate. |
Working Capital
As of December 31, 2015, we had a working capital surplus of $306.7 million. As of December 31, 2014, our working capital surplus was $378.2 million, as previously reported. Including the reclassification of current deferred income taxes to noncurrent, pursuant to our early adoption of ASU 2015-17, our working capital surplus was $334.9 million as of December 31, 2014. ASU 2015-17 is discussed in Note 3 in the Notes to Consolidated Financial Statements, included in Part II, Item 8, Financial Statements and Supplementary Data.
Capital and Operating Leases
In addition to our net cash capital expenditures, we enter into lease agreements to acquire revenue equipment, including tractors and trailers. Our tractor and trailer lease acquisitions and terminations were as follows (in thousands):
Year Ended December 31, | |||||||||||
2015 | 2014 | 2013 | |||||||||
Gross value of revenue equipment acquired with: | |||||||||||
Capital leases | $ | 145,338 | $ | 101,581 | $ | 85,094 | |||||
Operating leases | 404,313 | 330,650 | 367,279 | ||||||||
Originating value of terminated revenue equipment leases: | |||||||||||
Capital leases | 22,852 | 75,803 | 129,497 | ||||||||
Operating leases | 362,156 | 74,134 | 95,987 | ||||||||
Contractual Obligations |
The table below summarizes our contractual obligations as of December 31, 2015 (in thousands):
Payments Due By Period (6) | |||||||||||||||||||
Total | 1 Year or Less | 1-3 Years | 3-5 Years | More Than 5 Years | |||||||||||||||
Long-term debt obligations | $ | 680,872 | $ | 35,582 | $ | 100,040 | $ | 545,250 | $ | — | |||||||||
Revolving line of credit | 200,000 | — | — | 200,000 | — | ||||||||||||||
2015 RSA (1) | 225,000 | — | — | 225,000 | — | ||||||||||||||
Capital lease obligations (2) | 281,795 | 59,794 | 114,910 | 61,603 | 45,488 | ||||||||||||||
Interest obligations (3) | 109,331 | 29,108 | 50,566 | 28,300 | 1,357 | ||||||||||||||
Operating lease obligations (4) | 613,289 | 214,790 | 279,019 | 71,977 | 47,503 | ||||||||||||||
Purchase obligations (5) | 885,966 | 695,085 | 190,881 | — | — | ||||||||||||||
Total contractual obligations | $ | 2,996,253 | $ | 1,034,359 | $ | 735,416 | $ | 1,132,130 | $ | 94,348 | |||||||||
________
(1) | Represents borrowings owed at December 31, 2015. Interest rates vary. |
59
SWIFT TRANSPORTATION COMPANY
MANAGEMENT'S DISCUSSION AND ANALYSIS OF FINANCIAL CONDITION AND RESULTS OF OPERATIONS — CONTINUED
(2) | Represents principal payments owed at December 31, 2015. The borrowing consists of capital leases with finance companies, with fixed borrowing amounts and fixed interest rates, as set forth on each applicable lease schedule. Accordingly, interest on each lease varies between schedules. |
(3) | Represents interest obligations on long-term debt, 2015 RSA, and capital lease obligations. For variable rate debt, the interest rate in effect as of December 31, 2015 was utilized. The table assumes long-term debt and the 2015 RSA are held to maturity. |
(4) | Represents future monthly rental payment obligations, which include an interest element, under operating leases for tractors, trailers, chassis, and facilities. Substantially all lease agreements for revenue equipment have fixed payment terms based on the passage of time. The tractor lease agreements generally stipulate maximum miles and provide for mileage penalties for excess miles. These leases generally run for a period of three to five years for tractors and five to seven years for trailers. |
(5) | Represents purchase obligations for revenue equipment and facilities of which a significant portion is expected to be financed with operating and capital leases to the extent available. We have the option to cancel tractor purchase orders with 60 to 90 days' notice. As of December 31, 2015, approximately 10.1% of this amount had become non-cancelable. |
(6) | Deferred taxes and long-term portion of claims accruals are excluded from other long-term liabilities in the contractual obligations table. |
Off Balance Sheet Arrangements |
We lease 8,715 tractors under operating leases, which includes 5,599 company tractors and 3,116 owners-operator tractors financed by the Company. Operating leases have been an important source of financing for our revenue equipment. In accordance with ASC Topic 840, Leases, property and equipment held under operating leases, and liabilities related thereto, are not reflected on our balance sheet. All expenses related to operating leases and related liabilities are reflected in our consolidated income statements under "Rental expense." Rent expense was $240.5 million, $229.3 million and $180.3 million for the years ended 2015, 2014 and 2013, respectively. The total amount of remaining payments under operating leases as of December 31, 2015 was approximately $613.3 million.
As of December 31, 2015, the Company had commitments outstanding to acquire revenue equipment in 2016 for approximately $681.8 million ($484.1 million of which were tractor commitments) and in 2017 to 2018 for approximately $190.9 million (all of which were tractor commitments). The Company has the option to cancel tractor purchase orders with 60 to 90 days' notice prior to the scheduled production, although the notice period has lapsed for approximately 10.1% of the tractor commitments outstanding as of December 31, 2015. These purchases are expected to be financed by the combination of operating leases, capital leases, debt, proceeds from sales of existing equipment and cash flows from operations.
As of December 31, 2015, the Company had outstanding purchase commitments of approximately $13.3 million for facilities and non-revenue equipment. Factors such as costs and opportunities for future terminal expansions may change the amount of such expenditures.
Inflation |
Inflation can have an impact on our operating costs. A prolonged period of inflation could cause interest rates, fuel, wages, and other costs to increase, which would adversely affect our results of operations unless freight rates correspondingly increased. However, the effect of inflation has been minor over the past three years.
Critical Accounting Estimates |
The preparation of our consolidated financial statements in conformity with US-GAAP requires management to make estimates and assumptions that impact the amounts reported in our consolidated financial statements and accompanying notes. Therefore, the reported amounts of assets, liabilities, revenue, expenses, and associated disclosures of contingent assets and liabilities are affected by these estimates and assumptions. We evaluate these estimates and assumptions on an ongoing basis, utilizing historical experience, consultation with experts, and other methods considered reasonable in the particular circumstances. Nevertheless, actual results may differ significantly from our estimates and assumptions, and it is possible that materially different amounts could be reported using differing estimates or assumptions. We consider our critical accounting estimates to be those that require us to make more significant judgments and estimates when we prepare our financial statements. Our critical accounting estimates include the following:
Claims Accruals — Note 2 to the consolidated financial statements describes the Company's claims accrual accounting policy. The following discussion should be read in conjunction with Note 2, as it presents uncertainties involved in applying the accounting policy, and provides insight into the quality of management's estimates and variability in our claims accruals. Insurance and claims
60
SWIFT TRANSPORTATION COMPANY
MANAGEMENT'S DISCUSSION AND ANALYSIS OF FINANCIAL CONDITION AND RESULTS OF OPERATIONS — CONTINUED
expense varies as a percentage of operating revenue, based on the frequency and severity of claims incurred in a given period, as well as changes in claims development trends. The actual cost to settle our self-insured claim liabilities may differ from our reserve estimates due to legal costs, claims that have been incurred but not reported and various other uncertainties, including the inherent difficulty in estimating the severity of the claim and the potential judgment or settlement amount to dispose of the claim. If claims development factors that are based upon historical experience had increased by 10%, our claims accrual as of December 31, 2015 would have potentially increased by $18.0 million.
Goodwill and Indefinite-lived Intangible Assets — Note 2 to the consolidated financial statements describes the Company's goodwill and indefinite-lived intangible assets accounting policy. The following discussion should be read in conjunction with Note 2, as it presents uncertainties involved in applying the accounting policy, and provides insight into the quality of management's estimates and variability in valuation of goodwill and indefinite-lived intangible assets. The test of goodwill and indefinite-lived intangible assets requires judgment, including the identification of reporting units, assigning assets (including goodwill) and liabilities to reporting units and determining the fair value of each reporting unit. Fair value of the reporting unit is determined using a combination of comparative valuation multiples of publicly traded companies, internal transaction methods and discounted cash flow models. Estimating the fair value of reporting units includes several significant assumptions, including future cash flow estimates, determination of appropriate discount rates, and other assumptions that management believed reasonable under the circumstances. Changes in these estimates and assumptions could materially affect the determination of fair value and/or goodwill impairment for each reporting unit.
We evaluated goodwill as of November 30, 2015 and 2014 using the qualitative factors prescribed in ASC Topic 350 to determine whether to perform the two-step quantitative goodwill impairment test. The assessment of qualitative factors requires judgment, including identification of reporting units, evaluation of macroeconomic conditions, analysis of industry and market conditions, measurement of cost factors, and identification of entity-specific events (such as financial performance and changes within our share price). In evaluating these qualitative factors, we determined that it was more likely than not that fair value exceeded carrying value for our reporting units as of November 30, 2015 and 2014. As such, it was not necessary to perform the two-step quantitative goodwill impairment test.
Truckload and Dedicated are the only reporting units to which goodwill has been allocated, due to their respective fair value materiality at the time of the 2007 Transactions. As of December 31, 2015 and 2014, gross goodwill allocated to the Truckload segment was $377.0 million and gross goodwill allocated to the Dedicated segment was $130.7 million. We recognized accumulated impairment losses of $190.4 million in our Truckload reporting unit during 2007 and 2008, $64.1 million in our Dedicated reporting unit during 2007 and no impairment losses thereafter. As of December 31, 2015 and 2014 the Truckload reporting unit had a carrying value of $186.6 million and the Dedicated reporting unit had a carrying value of $66.7 million.
Depreciation and Amortization — Note 2 to the consolidated financial statements describes the Company's depreciation accounting policy under "Property and Equipment," and the amortization accounting policy under "Intangible Assets, other than Goodwill." The following discussion should be read in conjunction with Note 2, as it presents uncertainties involved in applying the accounting policies, and provides insight into the quality of management's estimates and potential variability in amounts recorded for depreciation and amortization. Selecting the appropriate accounting method requires management judgment, as there are multiple acceptable methods that are in accordance with US-GAAP, including straight-line, declining-balance and sum-of-the-years' digits. As discussed in Note 2, property and equipment is depreciated on a straight-line basis and intangible customer relationships acquired in the 2007 Transactions are amortized on a 150% double-declining-balance basis over the useful lives of the assets. We believe that these methods properly spread the costs over the useful lives of the assets. Management judgment is also involved when determining estimated useful lives of the Company's long-lived assets. We determine useful lives of our long-lived assets, based on historical experience, as well as future expectations regarding the period we expect to benefit from the asset. Factors affecting estimated useful lives of property and equipment may include estimating loss, damage, obsolescence, and company policies around maintenance and asset replacement. Factors affecting estimated useful lives of long-lived intangible assets may include legal, contractual or other provisions that limit useful lives, historical experience with similar assets, future expectations of customer relationships, among others.
Impairments of Long-lived Assets — Note 2 to the consolidated financial statements describes the Company's accounting policy for long-lived asset impairments under "Property and Equipment," and "Intangible Assets, other than Goodwill." The following discussion should be read in conjunction with Note 2, as it presents uncertainties involved in applying the accounting policies, and provides insight into the quality of management's estimates and potential variability in amounts recorded for asset impairments. Fair value is determined through various valuation techniques, including discounted cash flow models, quoted market values, and third-party independent appraisals, as necessary. Estimating fair value includes several significant assumptions, including future cash flow estimates, determination of appropriate discount rates, and other assumptions that management believed reasonable under the circumstances. Changes in these estimates and assumptions could materially affect the determination of fair value and/or impairment.
61
SWIFT TRANSPORTATION COMPANY
MANAGEMENT'S DISCUSSION AND ANALYSIS OF FINANCIAL CONDITION AND RESULTS OF OPERATIONS — CONTINUED
Income Taxes — Note 2 to the consolidated financial statements describes the Company's income tax accounting policy. The following discussion should be read in conjunction with Note 2, as it presents uncertainties involved in applying the accounting policy, and provides insight into the quality of management's estimates and variability in our deferred tax assets and liabilities. Our deferred tax assets and liabilities represent items that will result in taxable income or tax deductions in future years for which we have already recorded the related tax expense or benefit in our consolidated income statements. Deferred tax accounts arise as a result of timing differences between when items are recognized in our consolidated financial statements compared to when they are recognized in our tax returns. Significant management judgment is required in determining our provision for income taxes and in determining whether deferred tax assets will be realized in full or in part. Deferred tax assets and liabilities are measured using enacted tax rates expected to apply to taxable income in the years in which those temporary differences are expected to be recovered or settled. We periodically assess the likelihood that all or some portion of deferred tax assets will be recovered from future taxable income. To the extent we believe the likelihood of recovery is not sufficient, a valuation allowance is established for the amount determined not to be realizable. As of December 31, 2015, we had no valuation allowance. All deferred tax assets are considered more likely than not to be realized as they are expected to be utilized by continued profitability in future periods.
United States income and foreign withholding taxes have not been provided on approximately $25.3 million of cumulative undistributed earnings of foreign subsidiaries. The earnings are considered to be permanently reinvested outside the United States. As the Company intends to reinvest these earnings indefinitely outside the United States, it is not required to provide United States income taxes on them until they are repatriated in the form of dividends or otherwise.
We believe that we have adequately provided for our future tax consequences based upon current facts and circumstances and current tax law. However, should our tax positions be challenged, different outcomes could result and have a significant impact on the amounts reported through our consolidated income statements.
Operating Leases — See "Off Balance Sheet Arrangements," above.
Stock-based Compensation — Note 2 to the consolidated financial statements describes the Company's stock-based compensation accounting policy. The following discussion should be read in conjunction with Note 2, as it presents uncertainties involved in applying the accounting policy, and provides insight into the quality of management's estimates and variability in stock-based compensation expense. We issue several types of share-based compensation, including awards that vest, based on service and performance conditions or a combination of service and performance conditions. Performance-based awards vest contingent upon meeting certain performance criteria established by our compensation committee. All awards require future service and thus forfeitures are estimated based on historical forfeitures and the remaining term until the related award vests. ASC Topic 718 requires that all share-based payments to employees, including grants of employee stock options, be recognized in the financial statements based upon a grant-date fair value of an award. Determining the appropriate amount to expense in each period is based on likelihood and timing of achievement of the stated targets for performance-based awards, and requires judgment, including forecasting future financial results and market performance. The estimates are revised periodically based on the probability and timing of achieving the required performance targets, respectively, and adjustments are made as appropriate. Awards that are only subject to time-vesting provisions are amortized using the straight-line method. Awards subject to time-based vesting and performance conditions are amortized using the individual vesting tranches.
Recently Issued Accounting Pronouncements |
See Note 2 under Part II Item 8: Financial Statements, in this Annual Report on Form 10-K for recently issued accounting pronouncements that could have an impact on our consolidated financial statements.
62
ITEM 7A. | QUANTITATIVE AND QUALITATIVE DISCLOSURES ABOUT MARKET RISK |
We have interest rate exposure arising from outstanding debt from our 2015 Agreement, 2015 RSA, and other financing agreements, which have variable interest rates. These variable interest rates are impacted by changes in short-term interest rates. We primarily manage interest rate exposure through a mix of variable rate debt (weighted average rate of 1.9%). Assuming the current level of borrowings, a hypothetical one percentage point increase in interest rates would increase our annual interest expense by $10.9 million.
We have commodity exposure with respect to fuel used in company-owned tractors. Increases in fuel prices will raise our operating costs, even after applying fuel surcharge revenue. Historically, we have been able to recover a majority of fuel price increases from our customers in the form of fuel surcharges. The weekly average diesel price per gallon in the United States, as reported by the DOE, decreased from an average of $3.825 per gallon for the year ended December 31, 2014 to $2.707 per gallon for the year ended December 31, 2015. We cannot predict the extent or speed of potential changes in fuel price levels in the future, the degree to which the lag effect of our fuel surcharge programs will impact us as a result of the timing and magnitude of such changes, or the extent to which effective fuel surcharges can be maintained and collected to offset such increases. We generally have not used derivative financial instruments to hedge our fuel price exposure in the past, but continue to evaluate this possibility.
ITEM 8. | FINANCIAL STATEMENTS AND SUPPLEMENTARY DATA |
The Consolidated Financial Statements of the Company as of December 31, 2015 and 2014 and for the years ended December 31, 2015, 2014 and 2013, together with related notes and the report of KPMG LLP, independent registered public accountants, are set forth on the following pages. Other required financial information set forth herein is more fully described in Item 15 of this Annual Report.
63
Audited Financial Statements of Swift Transportation Company | |
Index to Consolidated Financial Statements | |
Financial Statements | Page |
Notes to Consolidated Financial Statements | ||
Note 1 | ||
Note 2 | ||
Note 3 | ||
Note 4 | ||
Note 5 | ||
Note 6 | ||
Note 7 | ||
Note 8 | ||
Note 9 | ||
Note 10 | ||
Note 11 | ||
Note 12 | ||
Note 13 | ||
Note 14 | ||
Note 15 | ||
Note 16 | ||
Note 17 | ||
Note 18 | ||
Note 19 | ||
Note 20 | ||
Note 21 | ||
Note 22 | ||
Note 23 | ||
Note 24 | ||
Note 25 | ||
Note 26 | ||
64
Report of Independent Registered Public Accounting Firm
The Board of Directors and Stockholders
Swift Transportation Company:
We have audited the accompanying consolidated balance sheets of Swift Transportation Company and subsidiaries (the Company) as of December 31, 2015 and 2014, and the related consolidated statements of income, comprehensive income, stockholders’ equity, and cash flows for each of the years in the three-year period ended December 31, 2015. These consolidated financial statements are the responsibility of the Company’s management. Our responsibility is to express an opinion on these consolidated financial statements based on our audits.
We conducted our audits in accordance with the standards of the Public Company Accounting Oversight Board (United States). Those standards require that we plan and perform the audit to obtain reasonable assurance about whether the financial statements are free of material misstatement. An audit includes examining, on a test basis, evidence supporting the amounts and disclosures in the financial statements. An audit also includes assessing the accounting principles used and significant estimates made by management, as well as evaluating the overall financial statement presentation. We believe that our audits provide a reasonable basis for our opinion.
In our opinion, the consolidated financial statements referred to above present fairly, in all material respects, the financial position of Swift Transportation Company and subsidiaries as of December 31, 2015 and 2014, and the results of their operations and their cash flows for each of the years in the three-year period ended December 31, 2015, in conformity with U.S. generally accepted accounting principles.
As discussed in note 3 to the consolidated financial statements, the Company has adopted, on a retrospective basis, FASB Accounting Standards Update No. 2015-17, Balance Sheet Classification of Deferred Taxes classifying all deferred tax assets, liabilities and associated allowances as non-current.
We also have audited, in accordance with the standards of the Public Company Accounting Oversight Board (United States), the Company’s internal control over financial reporting as of December 31, 2015, based on criteria established in Internal Control - Integrated Framework (2013) issued by the Committee of Sponsoring Organizations of the Treadway Commission (COSO), and our report dated February 22, 2016 expressed an unqualified opinion on the effectiveness of the Company’s internal control over financial reporting.
/s/ KPMG LLP
Phoenix, Arizona
February 22, 2016
65
CONSOLIDATED BALANCE SHEETS
December 31, | |||||||
2015 | 2014 | ||||||
ASSETS | (In thousands, except share data) | ||||||
Current assets: | |||||||
Cash and cash equivalents | $ | 107,590 | $ | 105,132 | |||
Restricted cash | 55,241 | 45,621 | |||||
Restricted investments, held to maturity, amortized cost | 23,215 | 24,510 | |||||
Accounts receivable, net | 422,421 | 478,999 | |||||
Equipment sales receivable | — | 288 | |||||
Income tax refund receivable | 11,664 | 18,455 | |||||
Inventories and supplies | 18,426 | 18,992 | |||||
Assets held for sale | 9,084 | 2,907 | |||||
Prepaid taxes, licenses, insurance and other | 48,149 | 51,441 | |||||
Current portion of notes receivable | 9,817 | 9,202 | |||||
Total current assets | 705,607 | 755,547 | |||||
Property and equipment, at cost: | |||||||
Revenue and service equipment | 2,278,618 | 2,061,835 | |||||
Land | 131,693 | 122,835 | |||||
Facilities and improvements | 269,769 | 268,025 | |||||
Furniture and office equipment | 99,519 | 67,740 | |||||
Total property and equipment | 2,779,599 | 2,520,435 | |||||
Less: accumulated depreciation and amortization | (1,128,499 | ) | (978,305 | ) | |||
Net property and equipment | 1,651,100 | 1,542,130 | |||||
Other assets | 29,353 | 41,855 | |||||
Intangible assets, net | 283,119 | 299,933 | |||||
Goodwill | 253,256 | 253,256 | |||||
Total assets | $ | 2,922,435 | $ | 2,892,721 | |||
LIABILITIES AND STOCKHOLDERS’ EQUITY | |||||||
Current liabilities: | |||||||
Accounts payable | $ | 121,827 | $ | 160,186 | |||
Accrued liabilities | 97,313 | 98,719 | |||||
Current portion of claims accruals | 84,429 | 81,251 | |||||
Current portion of long-term debt | 35,582 | 31,445 | |||||
Current portion of capital lease obligations | 59,794 | 42,902 | |||||
Fair value of interest rate swaps | — | 6,109 | |||||
Total current liabilities | 398,945 | 420,612 | |||||
Revolving line of credit | 200,000 | 57,000 | |||||
Long-term debt, less current portion | 645,290 | 871,615 | |||||
Capital lease obligations, less current portion | 222,001 | 158,104 | |||||
Claims accruals, less current portion | 149,281 | 143,693 | |||||
Deferred income taxes | 463,832 | 437,389 | |||||
Accounts receivable securitization | 225,000 | 334,000 | |||||
Other liabilities | 959 | 14 | |||||
Total liabilities | 2,305,308 | 2,422,427 | |||||
Commitments and contingencies (notes 13, 14 and 15) | |||||||
Stockholders’ equity: | |||||||
Preferred stock, par value $0.01 per share; Authorized 10,000,000 shares; none issued | — | — | |||||
Class A common stock, par value $0.01 per share; Authorized 500,000,000 shares; 87,808,801 and 91,103,643 shares issued and outstanding as of December 31, 2015 and December 31, 2014, respectively | 878 | 911 | |||||
Class B common stock, par value $0.01 per share; Authorized 250,000,000 shares; 50,991,938 shares issued and outstanding as of December 31, 2015 and December 31, 2014 | 510 | 510 | |||||
Additional paid-in capital | 754,589 | 781,124 | |||||
Accumulated deficit | (139,033 | ) | (310,017 | ) | |||
Accumulated other comprehensive income (loss) | 81 | (2,336 | ) | ||||
Noncontrolling interest | 102 | 102 | |||||
Total stockholders’ equity | 617,127 | 470,294 | |||||
Total liabilities and stockholders’ equity | $ | 2,922,435 | $ | 2,892,721 | |||
See accompanying notes to consolidated financial statements.
66
CONSOLIDATED INCOME STATEMENTS
Year Ended December 31, | |||||||||||
2015 | 2014 | 2013 | |||||||||
(In thousands, except per share data) | |||||||||||
Operating revenue: | |||||||||||
Revenue, excluding fuel surcharge revenue | $ | 3,781,976 | $ | 3,535,391 | $ | 3,326,714 | |||||
Fuel surcharge revenue | 447,346 | 763,333 | 791,481 | ||||||||
Operating revenue | 4,229,322 | 4,298,724 | 4,118,195 | ||||||||
Operating expenses: | |||||||||||
Salaries, wages and employee benefits | 1,111,946 | 970,683 | 903,990 | ||||||||
Operating supplies and expenses | 387,735 | 342,073 | 319,023 | ||||||||
Fuel | 416,782 | 591,855 | 640,000 | ||||||||
Purchased transportation | 1,180,403 | 1,321,268 | 1,255,646 | ||||||||
Rental expense | 240,501 | 229,290 | 180,328 | ||||||||
Insurance and claims | 179,545 | 159,246 | 142,179 | ||||||||
Depreciation and amortization of property and equipment | 251,735 | 221,122 | 226,008 | ||||||||
Amortization of intangibles | 16,814 | 16,814 | 16,814 | ||||||||
Impairments | — | 2,308 | — | ||||||||
Gain on disposal of property and equipment | (32,453 | ) | (27,682 | ) | (22,664 | ) | |||||
Communication and utilities | 31,606 | 29,871 | 25,593 | ||||||||
Operating taxes and licenses | 74,604 | 71,806 | 74,319 | ||||||||
Total operating expenses | 3,859,218 | 3,928,654 | 3,761,236 | ||||||||
Operating income | 370,104 | 370,070 | 356,959 | ||||||||
Other expenses (income): | |||||||||||
Interest expense | 38,350 | 80,064 | 99,534 | ||||||||
Derivative interest expense | 3,972 | 6,495 | 3,852 | ||||||||
Interest income | (2,526 | ) | (2,909 | ) | (2,474 | ) | |||||
Merger and acquisition expense | — | — | 4,913 | ||||||||
Loss on debt extinguishment | 9,567 | 39,909 | 5,540 | ||||||||
Non-cash impairments of non-operating assets | 1,480 | — | — | ||||||||
Loss (gain) on sale of real property | 133 | — | (6,876 | ) | |||||||
Legal settlement | 6,000 | — | — | ||||||||
Other income, net | (3,658 | ) | (4,115 | ) | (3,934 | ) | |||||
Total other expenses (income), net | 53,318 | 119,444 | 100,555 | ||||||||
Income before income taxes | 316,786 | 250,626 | 256,404 | ||||||||
Income tax expense | 119,209 | 89,474 | 100,982 | ||||||||
Net income | $ | 197,577 | $ | 161,152 | $ | 155,422 | |||||
Basic earnings per share | $ | 1.39 | $ | 1.14 | $ | 1.11 | |||||
Diluted earnings per share | $ | 1.38 | $ | 1.12 | $ | 1.09 | |||||
Shares used in per share calculations: | |||||||||||
Basic | 142,018 | 141,431 | 140,179 | ||||||||
Diluted | 143,668 | 143,475 | 142,221 | ||||||||
See accompanying notes to consolidated financial statements.
67
CONSOLIDATED STATEMENTS OF COMPREHENSIVE INCOME
Year Ended December 31, | |||||||||||
2015 | 2014 | 2013 | |||||||||
(In thousands) | |||||||||||
Net income | $ | 197,577 | $ | 161,152 | $ | 155,422 | |||||
Accumulated losses on derivatives reclassified to derivative interest expense | 3,886 | 6,218 | 3,143 | ||||||||
Change in fair value of interest rate swaps | — | — | (145 | ) | |||||||
Other comprehensive income before income taxes | 3,886 | 6,218 | 2,998 | ||||||||
Income tax effect of items within other comprehensive income | (1,469 | ) | (2,392 | ) | (958 | ) | |||||
Other comprehensive income, net of income taxes | 2,417 | 3,826 | 2,040 | ||||||||
Total comprehensive income | $ | 199,994 | $ | 164,978 | $ | 157,462 | |||||
See accompanying notes to consolidated financial statements.
68
CONSOLIDATED STATEMENTS OF STOCKHOLDERS' EQUITY
Class A Common Stock | Class B Common Stock | Additional Paid in Capital | Accumulated Deficit | Accumulated Other Comprehensive (Loss) Income | Noncontrolling Interest | Central's Stockholder Loans Receivable, Pre-acquisition | Total Stockholders' Equity | ||||||||||||||||||||||||||||||
Shares | Par Value | Shares | Par Value | ||||||||||||||||||||||||||||||||||
(In thousands, except share data) | |||||||||||||||||||||||||||||||||||||
Balances, December 31, 2012 | 87,055,664 | $ | 871 | 52,495,236 | $ | 525 | $ | 920,827 | $ | (601,777 | ) | $ | (8,202 | ) | $ | 102 | $ | (22,142 | ) | $ | 290,204 | ||||||||||||||||
Exercise of stock options | 1,210,184 | 12 | 12,973 | 12,985 | |||||||||||||||||||||||||||||||||
Central non-cash exercise of stock options | 3,415 | (3,415 | ) | — | |||||||||||||||||||||||||||||||||
Stock-based compensation expense | 3,670 | 3,670 | |||||||||||||||||||||||||||||||||||
Excess tax benefit from stock-based compensation | 187 | 187 | |||||||||||||||||||||||||||||||||||
Grant of restricted Class A common stock | 10,480 | — | 86 | 86 | |||||||||||||||||||||||||||||||||
Shares issued under employee stock purchase plan | 73,365 | — | 960 | 960 | |||||||||||||||||||||||||||||||||
Conversion of Class B common stock to Class A common stock | 53,298 | (53,298 | ) | — | |||||||||||||||||||||||||||||||||
Central acceleration of non-cash equity compensation | 887 | 887 | |||||||||||||||||||||||||||||||||||
Issuance of Central stockholders' loan receivable, pre-acquisition | (30,000 | ) | (30,000 | ) | |||||||||||||||||||||||||||||||||
Distribution to Central stockholders, pre-acquisition | (2,499 | ) | (2,499 | ) | |||||||||||||||||||||||||||||||||
Acquisition of Central, a common control entity, net of repayment of stockholders' loans receivable at closing of acquisition | (183,597 | ) | 33,295 | (150,302 | ) | ||||||||||||||||||||||||||||||||
Net settlements of distribution to Central stockholders in satisfaction of stockholders' loans receivable, pre-acquisition | (22,315 | ) | 22,315 | — | |||||||||||||||||||||||||||||||||
Interest on Central stockholders' loans receivable, pre-acquisition | (53 | ) | (53 | ) | |||||||||||||||||||||||||||||||||
Net income | 155,422 | 155,422 | |||||||||||||||||||||||||||||||||||
Other comprehensive income, net of income taxes | 2,040 | 2,040 | |||||||||||||||||||||||||||||||||||
Balances, December 31, 2013 | 88,402,991 | $ | 883 | 52,441,938 | $ | 525 | $ | 759,408 | $ | (471,169 | ) | $ | (6,162 | ) | $ | 102 | $ | — | $ | 283,587 | |||||||||||||||||
Exercise of stock options | 1,100,998 | 11 | 11,477 | 11,488 | |||||||||||||||||||||||||||||||||
Stock-based compensation expense | 5,080 | 5,080 | |||||||||||||||||||||||||||||||||||
Excess tax benefit from stock-based compensation | 3,730 | 3,730 | |||||||||||||||||||||||||||||||||||
Grant of restricted Class A common stock | 98,866 | 1 | 314 | 315 | |||||||||||||||||||||||||||||||||
Shares issued under employee stock purchase plan | 50,788 | 1 | 1,115 | 1,116 | |||||||||||||||||||||||||||||||||
Conversion of Class B common stock to Class A common stock | 1,450,000 | 15 | (1,450,000 | ) | (15 | ) | — | ||||||||||||||||||||||||||||||
Net income | 161,152 | 161,152 | |||||||||||||||||||||||||||||||||||
Other comprehensive income, net of income taxes | 3,826 | 3,826 | |||||||||||||||||||||||||||||||||||
Balances, December 31, 2014 | 91,103,643 | $ | 911 | 50,991,938 | $ | 510 | $ | 781,124 | $ | (310,017 | ) | $ | (2,336 | ) | $ | 102 | $ | — | $ | 470,294 | |||||||||||||||||
Common stock issued under stock plans | 821,412 | 8 | 6,945 | 6,953 | |||||||||||||||||||||||||||||||||
Stock-based compensation expense | 6,525 | 6,525 | |||||||||||||||||||||||||||||||||||
Excess tax benefits from stock-based compensation | 2,147 | 2,147 | |||||||||||||||||||||||||||||||||||
Shares issued under employee stock purchase plan | 59,556 | 1 | 1,213 | 1,214 | |||||||||||||||||||||||||||||||||
Repurchase and cancellation of Class A Common Stock | (4,175,810 | ) | (42 | ) | (43,365 | ) | (26,593 | ) | (70,000 | ) | |||||||||||||||||||||||||||
Net income | 197,577 | 197,577 | |||||||||||||||||||||||||||||||||||
Other comprehensive income, net of income taxes | 2,417 | 2,417 | |||||||||||||||||||||||||||||||||||
Balances, December 31, 2015 | 87,808,801 | $ | 878 | 50,991,938 | $ | 510 | $ | 754,589 | $ | (139,033 | ) | $ | 81 | $ | 102 | $ | — | $ | 617,127 | ||||||||||||||||||
See accompanying notes to consolidated financial statements.
69
CONSOLIDATED STATEMENTS OF CASH FLOWS
Year Ended December 31, | |||||||||||
2015 | 2014 | 2013 | |||||||||
(In thousands) | |||||||||||
Cash flows from operating activities: | |||||||||||
Net income | $ | 197,577 | $ | 161,152 | $ | 155,422 | |||||
Adjustments to reconcile net income to net cash provided by operating activities: | |||||||||||
Depreciation and amortization of property, equipment and intangibles | 268,549 | 237,936 | 242,822 | ||||||||
Amortization of debt issuance costs, original issue discount, and losses on terminated swaps | 5,937 | 10,407 | 7,247 | ||||||||
Gain on disposal of property and equipment less write-off of totaled tractors | (30,195 | ) | (23,236 | ) | (21,574 | ) | |||||
Gain on sale of real property | — | (3,018 | ) | (6,876 | ) | ||||||
Impairments | 1,480 | 2,308 | — | ||||||||
Equity losses of investee | — | — | 537 | ||||||||
Deferred income taxes | 26,476 | (3,980 | ) | 102,290 | |||||||
Provision for losses on accounts receivable | 8,004 | 2,844 | 1,370 | ||||||||
Non-cash loss on debt extinguishment and write-offs of deferred financing costs and original issue discount | 9,567 | 11,994 | 5,540 | ||||||||
Non-cash equity compensation | 6,525 | 5,396 | 4,645 | ||||||||
Excess tax benefits from stock-based compensation | (2,147 | ) | (3,730 | ) | (187 | ) | |||||
Income effect of mark-to-market adjustment of interest rate swaps | 87 | (155 | ) | 805 | |||||||
Interest on Central stockholders' loan receivable, pre-acquisition | — | — | (53 | ) | |||||||
Increase (decrease) in cash resulting from changes in: | |||||||||||
Accounts receivable | 48,574 | (63,407 | ) | (16,613 | ) | ||||||
Inventories and supplies | 566 | (562 | ) | (912 | ) | ||||||
Prepaid expenses and other current assets | 17,741 | 17,802 | (12,013 | ) | |||||||
Other assets | 7,785 | 14,745 | 6,296 | ||||||||
Accounts payable, accrued and other liabilities | 2,972 | 29,285 | 4,758 | ||||||||
Net cash provided by operating activities | 569,498 | 395,781 | 473,504 | ||||||||
Cash flows from investing activities: | |||||||||||
(Increase) decrease in restricted cash | (9,620 | ) | 5,212 | 845 | |||||||
Proceeds from maturities of investments | 33,015 | 29,783 | 25,217 | ||||||||
Purchases of investments | (31,930 | ) | (28,921 | ) | (28,756 | ) | |||||
Proceeds from sale of property and equipment | 116,330 | 133,020 | 119,158 | ||||||||
Capital expenditures | (342,615 | ) | (305,966 | ) | (318,271 | ) | |||||
Payments received on notes receivable | 4,252 | 5,481 | 3,868 | ||||||||
Expenditures on assets held for sale | (25,937 | ) | (4,053 | ) | (18,415 | ) | |||||
Payments received on assets held for sale | 14,410 | 25,326 | 53,486 | ||||||||
Payments received on equipment sale receivables | 288 | 368 | 1,450 | ||||||||
Acquisition of Central, net of debt repayment | — | — | (150,302 | ) | |||||||
Net cash used in investing activities | (241,807 | ) | (139,750 | ) | (311,720 | ) | |||||
Cash flows from financing activities: | |||||||||||
Repayment of long-term debt and capital leases | (979,816 | ) | (1,224,628 | ) | (236,388 | ) | |||||
Proceeds from long-term debt | 684,504 | 900,000 | 26,267 | ||||||||
Net borrowings on revolving line of credit | 143,000 | 40,000 | 14,469 | ||||||||
Borrowings under accounts receivable securitization | 75,000 | 119,000 | 184,000 | ||||||||
Repayment of accounts receivable securitization | (184,000 | ) | (49,000 | ) | (124,000 | ) | |||||
Issuance of Central stockholders' loan receivable, pre-acquisition | — | — | (30,000 | ) | |||||||
Distribution to Central stockholders, pre-acquisition | — | — | (2,499 | ) | |||||||
Payment of deferred loan costs | (4,235 | ) | (11,783 | ) | (2,183 | ) | |||||
Proceeds from common stock issued | 8,167 | 12,604 | 13,945 | ||||||||
Repurchase of Class A common stock | (70,000 | ) | — | — | |||||||
Excess tax benefits from stock-based compensation | 2,147 | 3,730 | 187 | ||||||||
Net cash used in financing activities | (325,233 | ) | (210,077 | ) | (156,202 | ) | |||||
Net increase in cash and cash equivalents | 2,458 | 45,954 | 5,582 | ||||||||
Cash and cash equivalents at beginning of period | 105,132 | 59,178 | 53,596 | ||||||||
Cash and cash equivalents at end of period | $ | 107,590 | $ | 105,132 | $ | 59,178 | |||||
See accompanying notes to consolidated financial statements.
70
CONSOLIDATED STATEMENTS OF CASH FLOWS — CONTINUED
Year Ended December 31, | |||||||||||
2015 | 2014 | 2013 | |||||||||
(In thousands) | |||||||||||
Supplemental disclosures of cash flow information: | |||||||||||
Cash paid during the period for: | |||||||||||
Interest | $ | 45,390 | $ | 89,341 | $ | 103,238 | |||||
Income taxes | 78,522 | 82,776 | 20,625 | ||||||||
Non-cash investing activities: | |||||||||||
Equipment purchase accrual | $ | 447 | $ | 35,831 | $ | 7,710 | |||||
Notes receivable from sale of assets | 7,670 | 5,431 | 8,089 | ||||||||
Equipment sales receivables | — | 288 | 1,252 | ||||||||
Non-cash financing activities: | |||||||||||
Capital lease additions | $ | 145,338 | $ | 101,581 | $ | 85,094 | |||||
Accrued deferred loan costs | 105 | 177 | — | ||||||||
Insurance premium and software notes payable | 7,658 | 37 | 9,198 | ||||||||
Non-cash distribution to Central stockholders in satisfaction of stockholders' loans receivable, pre-acquisition | — | — | 22,315 | ||||||||
Non-cash exercise of Central stock options in exchange for stockholders' loans receivable, pre-acquisition | — | — | 3,415 | ||||||||
Cancellation of Central stockholders' loans receivable at closing of acquisition | — | — | 33,295 | ||||||||
See accompanying notes to consolidated financial statements.
71
Notes to Consolidated Financial Statements |
Note 1 — Description of Business and Basis of Presentation
Certain acronyms and terms used throughout this Annual Report on Form 10-K are specific to our company, commonly used in our industry, or are otherwise frequently used throughout our document. Definitions for these acronyms and terms are provided in the "Glossary of Terms," available in the front of this document.
Description of Business
Swift is a transportation solutions provider, headquartered in Phoenix, Arizona. As of December 31, 2015, the Company's fleet of revenue equipment included 19,864 tractors (comprised of 15,211 company tractors and 4,653 owner-operator tractors), 65,233 trailers and 9,150 intermodal containers. The Company’s four reportable segments are Truckload, Dedicated, Swift Refrigerated (formerly Central Refrigerated) and Intermodal.
Basis of Presentation
General — The accompanying consolidated financial statements include the accounts of Swift Transportation Company and its wholly-owned subsidiaries. All significant intercompany balances and transactions have been eliminated in preparing the consolidated financial statements. When the Company does not have a controlling interest in an entity, but exerts significant influence over the entity, the Company applies the equity method of accounting. In management's opinion, the accompanying financial statements were prepared in accordance with principles generally accepted in the United States and include all adjustments necessary for the fair presentation of the periods presented.
Central Acquisition — On August 6, 2013, the Company entered into a stock purchase agreement with the stockholders of Central, pursuant to which the Company acquired all of the outstanding capital stock of Central for aggregate consideration of approximately $225.0 million. The Company paid approximately $189.0 million in cash to the stockholders of Central and assumed approximately $36.0 million of capital lease obligations and other debt. Cash consideration was primarily funded from borrowings on the Company's then-existing credit facilities, including $85.0 million from the Company's revolving line of credit and $100.0 million from the Company's accounts receivable securitization facility. Pursuant to the stock purchase agreement, within 90 days after the closing date, the Company prepared a final closing statement setting forth the final estimate of the purchase price. As a result of this process and calculation, the purchase price was increased by $2.4 million.
At closing, a portion of the purchase price was placed in escrow to secure payment of any post-closing adjustments to the purchase price and to secure the seller’s indemnification obligations to the Company. Jerry Moyes, Swift's CEO and controlling stockholder, also contributed into escrow 1,131,862 shares of Swift Class B common stock to further secure such indemnification obligations.
Mr. Moyes was the majority stockholder of Central prior to the Central Acquisition. Given Mr. Moyes’ interests in the temperature-controlled truckload industry, our Board established a special committee comprised solely of independent and disinterested directors in May of 2011 to evaluate Swift’s expansion of its temperature-controlled operations. The special committee evaluated alternative business opportunities, including organic growth and various acquisition targets, and negotiated the transaction contemplated by the stock purchase agreement, with the assistance of its independent financial advisors. Upon the unanimous recommendation of the special committee, the Central Acquisition was approved by the Board (with Mr. Moyes not participating in the vote).
Given Mr. Moyes' controlling interest in both Swift and Central, the Central Acquisition was accounted for using the guidance for transactions between entities under common control as described in ASC Topic 805, Business Combinations. In accordance with ASC Topic 805-30, the Company has recognized the assets and liabilities of Central at their carrying amounts at the date of transfer.
Changes in Presentation
Beginning in 2015, the Company made the following changes in presentation:
• | Excess tax benefits from stock-based compensation are separately presented within "Net cash provided by operating activities" in the consolidated statements of cash flows. The prior period presentation has been retrospectively adjusted to reclassify the amount out of "Accounts payable, accrued and other liabilities" and into the new line item "Excess tax benefits from stock-based compensation." The change in presentation has no net impact on "Net cash provided by operating activities." |
• | Gross amounts of investment in securities activities are presented as "Proceeds from maturities of investments" and "Purchases of investments" in the consolidated statements of cash flows. The prior period presentation has been retrospectively adjusted to accommodate this gross presentation. The change in presentation has no net impact on "Net cash used in investing activities." |
• | "Operating revenue" in the consolidated income statements is disaggregated into the line items "Revenue, excluding fuel surcharge revenue" and "Fuel surcharge revenue." The change in presentation has no net impact on "Operating revenue." |
• | Current deferred income taxes have been reclassified to noncurrent deferred income taxes on the consolidated balance sheet, pursuant to ASU 2015-17. See further details at Note 3. |
72
SWIFT TRANSPORTATION COMPANY
NOTES TO CONSOLIDATED FINANCIAL STATEMENTS — CONTINUED
Use of Estimates — The preparation of the consolidated financial statements, in accordance with US-GAAP, requires management to make estimates and assumptions about future events that affect the amounts reported in the Company’s consolidated financial statements and accompanying notes. On an ongoing basis, management evaluates and periodically adjusts its estimates and assumptions, based on historical experience, the impact of the current economic environment, and other key factors. Volatile energy markets, as well as changes in consumer spending have increased the inherent uncertainty in such estimates and assumptions. As future events and their effects cannot be determined with precision, actual results could differ significantly from these estimates. Significant items subject to such estimates and assumptions include:
• | carrying amount of property and equipment, intangibles and goodwill; |
• | valuation allowances for receivables, inventories and deferred income tax assets; |
• | valuation of financial instruments; |
• | calculation of share-based compensation; |
• | estimates of claims accruals; and |
• | contingent obligations. |
Segments — The Company uses the "management approach" to determine its reportable segments, as well as to determine the basis of reporting the operating segment information. The management approach focuses on financial information that management uses to make operating decisions. The CODMs use operating revenues, operating expense categories, operating ratios, operating income and key operating statistics to evaluate performance and allocate resources to the Company’s operations.
Operating income is the measure of segment profit or loss management uses to evaluate segment performance and allocate resources, which is consistent with US-GAAP for segment reporting. It is the Company’s measure of segment performance. Operating income should not be viewed as a substitute for US-GAAP net income (loss). Management believes the presentation of operating income enhances the understanding of the Company's performance by highlighting the results of operations and the underlying profitability drivers of the business segments. Operating income is defined as operating revenues less operating expenses, before income tax expense.
Based on the unique nature of the Company's operating structure, revenue-generating assets are interchangeable between segments. Therefore, the Company does not prepare separate balance sheets by segment, as assets are not separately identifiable by segment. The Company allocates depreciation and amortization expense on its property and equipment to the segments based on the actual utilization of the asset by the segment during the period.
Cash and Cash Equivalents — The Company considers all highly liquid debt instruments purchased with original maturities of three months or less to be cash equivalents.
Restricted Cash — The Company’s wholly-owned captive insurance companies, Red Rock and Mohave, maintain certain operating bank accounts, working trust accounts and investment accounts. The cash and short-term investments within the accounts are restricted by insurance regulations to fund the insurance claim losses to be paid by the captive insurance companies. Therefore, these cash and short-term investments are classified as "Restricted cash" in the consolidated balance sheets.
Restricted Investments — The Company's investments are restricted by insurance regulations to fund the insurance claim losses to be paid by the captive insurance companies. The Company accounts for its investments in accordance with ASC Topic 320, Investments – Debt and Equity Securities. Management determines the appropriate classification of its investments in debt securities at the time of purchase and re-evaluates the determination on a quarterly basis. As of December 31, 2015, all of the Company’s investments in fixed-maturity securities were classified as held-to-maturity, as the Company has the positive intent and ability to hold these securities to maturity. Held-to-maturity securities are carried at amortized cost. The amortized cost of debt securities is adjusted using the effective interest rate method for amortization of premiums and accretion of discounts. Amortization and accretion is reported in "Other expenses (income)" in the consolidated income statements.
Management periodically evaluates restricted investments for impairment. The assessment of whether impairments have occurred is based on management’s case-by-case evaluation of the underlying reasons for the decline in estimated fair value. Management accounts for other-than-temporary impairments of debt securities in accordance with ASC Topic 320, Investments – Debt and Equity Securities. This guidance requires the Company to evaluate whether it intends to sell an impaired debt security or whether it is more likely than not that it will be required to sell an impaired debt security before recovery of the amortized cost basis. If either of these criteria are met, an impairment equal to the difference between the debt security’s amortized cost and its estimated fair value is recognized in earnings. For impaired debt securities that do not meet these criteria, the Company determines if a credit loss exists with respect to the impaired security. If a credit loss exists, the credit loss component of the impairment (i.e., the difference
73
SWIFT TRANSPORTATION COMPANY
NOTES TO CONSOLIDATED FINANCIAL STATEMENTS — CONTINUED
between the security’s amortized cost and the present value of projected future cash flows expected to be collected) is recognized in earnings and the remaining portion of the impairment is recognized as a component of AOCI.
Inventories and Supplies — Inventories and supplies primarily consist of spare parts, tires, fuel and supplies and are stated at lower of cost or market. Cost is determined using the first-in, first-out method.
Property and Equipment — Property and equipment are stated at cost. Costs to construct significant assets include capitalized interest incurred during the construction and development period. Expenditures for replacements and improvements are capitalized. Maintenance and repairs are expensed as incurred.
Depreciation on property and equipment is calculated on a straight-line basis over the following estimated useful lives:
Category | Range | |||
Facilities and improvements | 3 | to | 40 years | |
Revenue and service equipment | 3 | to | 20 years | |
Furniture and office equipment | 3 | to | 5 years | |
Net gains on the disposal of property and equipment are presented in the consolidated income statements within operating income.
Tires on purchased revenue equipment are capitalized along with the related equipment cost when the vehicle is placed in service and depreciated over the life of the vehicle. Replacement tires are classified as inventory and expensed when placed in service.
Management evaluates its property and equipment whenever events or changes in circumstances indicate that the carrying amount of an asset may not be recoverable in accordance with ASC Topic 360, Property, Plant and Equipment. When such events or changes in circumstances occur, management performs a recoverability test that compares the carrying amount with the projected undiscounted cash flows from the use and eventual disposition of the asset or asset group. An impairment is recorded for any excess of the carrying amount over the estimated fair value. Fair value is determined through various valuation techniques including discounted cash flow models, quoted market values and third-party independent appraisals, as considered necessary.
Intangible Assets other than Goodwill — The Company’s intangible assets other than goodwill primarily consist of acquired customer relationships and trade names. Amortization of acquired customer relationships is calculated on the 150% declining balance method over the estimated useful life of 15 years. The customer relationship contributed to the Company at May 9, 2007 is amortized over 15 years on a straight-line basis. The trade name has an indefinite useful life and is not amortized, but is tested for impairment at least annually, unless events occur or circumstances change between annual tests that would more likely than not reduce the fair value.
Management reviews its intangible assets for impairment whenever events or circumstances indicate that the carrying amount of the asset may not be recoverable, in accordance with ASC Topic 350, Intangibles – Goodwill and Other. When such events or changes in circumstances occur, management performs a recoverability test that compares the carrying amount with the projected undiscounted cash flows from the use and eventual disposition of the asset or asset group. An impairment is recorded for any excess of the carrying amount over the estimated fair value, which is generally determined using discounted future cash flows.
Goodwill — Management evaluates goodwill on an annual basis as of November 30th, or more frequently if indicators of impairment exist. The Company assesses qualitative factors to determine whether it is more likely than not that the fair value of a reporting unit is less than the carrying amount. If the Company concludes that it is more likely than not that the fair value of a reporting unit is less than its carrying amount, the Company conducts a two-step quantitative goodwill impairment test. The first step of the impairment test involves comparing the fair values of the applicable reporting units with their carrying values. Management estimates the fair values of its reporting units using a combination of the income and market approaches. If the carrying amount of a reporting unit exceeds the reporting unit’s fair value, then management performs the second step of the goodwill impairment test. The second step of the goodwill impairment test involves comparing the implied fair value of the affected reporting unit’s goodwill with the carrying value of that goodwill. Any amount by which the carrying value of the goodwill exceeds its implied fair value is recognized as an impairment loss. Refer to Note 8 for discussion of the results of the Company's annual evaluation as of November 30, 2015.
Claims Accruals — The Company is self-insured for a portion of its auto liability, workers’ compensation, property damage, cargo damage risk and employer medical expense prior to January 1, 2015. This self-insurance results from buying insurance coverage that applies in excess of a retained portion of risk for each respective line of coverage. The Company accrues for the cost of the uninsured portion of pending claims by evaluating the nature and severity of individual claims and by estimating future claims development based upon historical claims development trends. The actual cost to settle our self-insured claim liabilities may differ from our reserve estimates due to legal costs, claims that have been incurred but not reported and various other uncertainties, including the inherent difficulty in estimating the severity of the claims and the potential judgment or settlement amount to dispose of the claim.
74
SWIFT TRANSPORTATION COMPANY
NOTES TO CONSOLIDATED FINANCIAL STATEMENTS — CONTINUED
Fair Value Measurements — See Note 24 for accounting policies and financial information relating to fair value measurements.
Revenue Recognition — The Company recognizes operating revenues and the related direct costs of such revenue as of the date the freight is delivered, in accordance with ASC Topic 605-20-25-13, Services for Freight-in-Transit at the End of a Reporting Period.
The Company recognizes operating lease revenue from leasing tractors and related equipment to owner-operators. Operating lease revenue from rental operations is recognized as earned, which is straight-lined per the rent schedules in the lease agreements. Losses from lease defaults are recognized as offsets to revenue.
Stock-based Compensation — The Company accounts for stock-based compensation expense in accordance with ASC Topic 718, Compensation – Stock Compensation. ASC Topic 718 requires that all share-based payments to employees and non-employee directors, including grants of employee stock options, be recognized in the financial statements based upon a grant-date fair value of an award. The Company calculates the number of awards expected to vest as awards granted, less expected forfeitures over the life of the award (estimated at grant date). Compensation expense is recorded based on amortization of the grant-date fair value over a graded vesting period. Unless a material deviation from the assumed forfeiture rate is observed during the term in which the awards are expensed, any adjustment necessary to reflect differences in actual experience is recognized in the period the award becomes payable or exercisable. See Note 17 for additional information relating to the Company’s stock compensation plan.
Income Taxes — Management accounts for income taxes under the asset and liability method. Deferred tax assets and liabilities are recognized for the future tax consequences attributable to operating loss and tax credit carryforwards, as well as differences between the financial statement carrying amounts of existing assets and liabilities and their respective tax bases. The effect on deferred tax assets and liabilities of changes in tax rates is recognized in income in the period that includes the enactment date.
A valuation allowance is provided against deferred tax assets if the Company determines it is more likely than not that such assets will not ultimately be realized.
The Company does not recognize a tax benefit for uncertain tax positions unless it concludes that it is more likely than not that the benefit will be sustained on audit by the taxing authority based solely on the technical merits of the associated tax position. If the recognition threshold is met, the Company recognizes a tax benefit measured at the largest amount of the tax benefit that, in the management's judgment, is greater than 50% likely to be realized. The Company records interest and penalties related to unrecognized tax positions in "Income tax expense" in the consolidated income statements.
Derivative Instruments — All financial derivative instruments are recorded on our consolidated balance sheets at estimated fair value. Derivatives not designated as hedges are adjusted to fair value through the Company’s consolidated income statements. Depending on the nature of a derivative that is designated as a hedge, effective changes in its fair value either offset the change in fair value of the hedged assets, liabilities or firm commitments through the Company’s consolidated income statements, or are recorded in AOCI until the hedged item is recorded in the Company’s consolidated income statements. Any portion of a change in a derivative's estimated fair value that is considered to be ineffective, or is excluded from the measurement of effectiveness, is recorded immediately in income.
In November 2015, FASB issued ASU 2015-17, Balance Sheet Classification of Deferred Taxes, which amends ASC Topic 740, Income Taxes. The amendments in this ASU simplify balance sheet presentation by establishing the requirement that deferred income taxes must be classified as noncurrent. The amendments in this ASU do not change the requirement that deferred tax liabilities and assets should be presented on a net basis. For public business entities, the amendments in this ASU are effective for annual periods beginning after December 15, 2016, and interim periods within those annual periods. Earlier application is permitted for all entities as of the beginning of an interim or annual reporting period. The amendments in this ASU may be applied to all deferred tax liabilities and assets either prospectively or retrospectively to all periods presented. The Company early-adopted the guidance at December 31, 2015 and retrospectively adjusted the December 31, 2014 presentation by reclassifying a $43.3 million net current deferred tax asset ($44.9 million from the current asset "Deferred income taxes," net of a $1.6 million current deferred tax liability from "Accrued liabilities") into the net noncurrent liability "Deferred income taxes."
In August 2015, FASB issued ASU 2015-14, Deferral of the Effective Date, which amends ASC Topic 606, Revenue from Contracts with Customers. ASC Topic 606 was established by previously-issued ASU 2014-09, discussed below. For public business entities, the amendments in ASU 2015-14 defer the effective date of ASU 2014-09 to annual reporting periods beginning after December 15, 2017. Early adoption of ASU 2014-09 is permitted. In May 2014, FASB issued ASU 2014-09, Revenue from Contracts with Customers, which established ASC Topic 606. The new revenue recognition standard eliminates all industry-specific guidance and provides a five-step analysis of transactions to determine when and how revenue is recognized. The premise of the guidance is
75
SWIFT TRANSPORTATION COMPANY
NOTES TO CONSOLIDATED FINANCIAL STATEMENTS — CONTINUED
that a company should recognize revenue to depict the transfer of promised goods or services to customers in an amount that reflects the consideration to which the company expects to be entitled in exchange for those goods or services. The amendments in this ASU may be applied retrospectively to each period presented, or as a cumulative effect adjustment as of the date of adoption. Management is currently evaluating the accounting, transition and disclosure requirements of the standard and expects to know the financial statement impact upon adoption in 2018.
In July 2015, FASB issued ASU 2015-11, Simplifying the Measurement of Inventory, which amends ASC Topic 330, Inventory. The amendments in this ASU simplify subsequent measurement of inventory for all inventory measurement methods, except for last-in-first-out and retail inventory methods. Current guidance requires entities to measure inventory at the lower of cost or market. However, market could be the replacement cost, net realizable value, or net realizable value less an approximately normal profit margin. The new guidance requires entities to measure inventory at the lower of cost and net realizable value, instead of the previously issued guidance of lower of cost or market. FASB defines net realizable value as estimated selling prices in the ordinary course of business, less reasonably predictable costs of completion, disposal and transportation. For public business entities, the amendments in this ASU are effective for fiscal years beginning after December 15, 2016, including interim periods within those fiscal years. The amendments should be applied prospectively. Although early adoption is permitted, the Company expects to adopt this guidance at the beginning of 2017. However, due to the nature of the Company's inventory balances (spare parts, tires, fuel and supplies), inventory is predominantly stated at cost, which is consistently below net realizable value. As such, the amendments in this ASU are not expected to have a material impact on the Company's financial position or results of operations upon adoption.
In April 2015, FASB issued ASU 2015-03, Simplifying the Presentation of Debt Issuance Costs, which amends ASC Subtopic 835-30, Interest — Imputation of Interest. The amendments in this ASU simplify the presentation of debt issuance costs and align the presentation with debt discounts. Entities will be required to present debt issuance costs as a direct deduction from the face amount of the related note, rather than as a deferred charge. In August 2015, FASB issued ASU 2015-15, Presentation and Subsequent Measurement of Debt Issuance Costs Associated with Line-of-Credit Arrangements — Amendments to SEC Paragraphs Pursuant to Staff Announcement at June 18, 2015 EITF Meeting (SEC Update), which also amends ASC Subtopic 835-30, Interest — Imputation of Interest. The SEC determined that ASU 2015-03 (discussed above) did not address costs related to line-of-credit arrangements. The amendments in ASU 2015-15 clarify that entities may defer and present debt issuance costs as an asset, and subsequently amortize the deferred debt issuance costs ratably over the term of the line-of-credit arrangement, regardless of whether there are any outstanding borrowings on the line-of-credit arrangement. The amendments in these ASUs require retrospective application, with related disclosures for a change in accounting principle. Upon adoption, the Company will comply with these disclosure requirements by providing the nature and reason for the change, the transition method, a description of the adjusted prior period information and the effect of the change on the financial statement line items. For public business entities, the amendments in these ASUs will be effective for financial statements issued for fiscal years beginning after December 15, 2015, and the interim periods within those fiscal years. Early adoption is permitted; however, the Company expects to adopt this guidance at the beginning of 2016. Upon adoption, the amended guidance will affect Swift's classification of debt issuance costs, which are currently classified in "Other assets" in the consolidated balance sheets. In accordance with the amendments in ASU 2015-15, debt issuance costs associated with the revolving line of credit will remain within "Other assets" in the consolidated balance sheets. All other debt issuance costs will be reclassified, in accordance with the amendments in ASU 2015-03. This reclassification of debt issuance costs will effectively decrease "Other assets" by approximately $2.6 million and correspondingly decrease the long-term debt balances by the same amount.
In February 2015, FASB issued ASU 2015-02, Amendments to the Consolidation Analysis, which amends ASC Topic 810, Consolidation, by changing the analysis that reporting entities are required to perform to determine whether certain types of legal entities should be consolidated. The amendments in this ASU focus on limited partnerships and similar legal entities (such as limited liability companies); however, all legal entities are subject to reevaluation under the revised consolidation model. The revised consolidation model modifies the evaluation of whether limited partnerships and similar legal entities are variable interest entities or voting interest entities, and eliminates the presumption that a general partner should consolidate a limited partnership. It also affects the consolidation analysis of reporting entities that are involved with variable interest entities, especially those that have fee arrangements and related-party relationships. The amendments in the ASU also affect certain investment funds. For public business entities, the amendments in this ASU are effective for fiscal years beginning after December 15, 2015, and the interim periods within those fiscal years. Early adoption is permitted. Entities may use a retrospective approach, or a modified retrospective approach by recording a cumulative-effect adjustment to equity as of the beginning of the year of adoption. The Company is currently evaluating the accounting, transition and disclosure requirements of the standard; however, the amendments in this ASU are not expected to have a material impact on the Company's financial position or results of operations upon adoption.
76
SWIFT TRANSPORTATION COMPANY
NOTES TO CONSOLIDATED FINANCIAL STATEMENTS — CONTINUED
Note 4 — Restricted Investments
These investments are used to pay insurance claim losses incurred by the Company’s captive insurance companies, Red Rock and Mohave, and are restricted by insurance regulations.
The following table presents the cost or amortized cost, gross unrealized gains and losses, and estimated fair value of the Company’s restricted investments (in thousands):
December 31, 2015 | |||||||||||||||
Gross Unrealized | |||||||||||||||
Cost or Amortized Cost | Gains | Temporary Losses | Estimated Fair Value | ||||||||||||
United States corporate securities | $ | 16,686 | $ | 2 | $ | (27 | ) | $ | 16,661 | ||||||
Municipal bonds | 4,904 | 1 | (1 | ) | 4,904 | ||||||||||
Negotiable certificates of deposit | 1,625 | — | — | 1,625 | |||||||||||
Total restricted investments | $ | 23,215 | $ | 3 | $ | (28 | ) | $ | 23,190 | ||||||
December 31, 2014 | |||||||||||||||
Gross Unrealized | |||||||||||||||
Cost or Amortized Cost | Gains | Temporary Losses | Estimated Fair Value | ||||||||||||
United States corporate securities | $ | 20,892 | $ | 2 | $ | (10 | ) | $ | 20,884 | ||||||
Foreign corporate securities | 1,503 | — | — | 1,503 | |||||||||||
Negotiable certificates of deposit | 2,115 | — | — | 2,115 | |||||||||||
Total restricted investments | $ | 24,510 | $ | 2 | $ | (10 | ) | $ | 24,502 | ||||||
Refer to Note 24 for additional information regarding fair value measurements of restricted investments.
As of December 31, 2015, the contractual maturities of the restricted investments were one year or less. There were 36 securities and 24 securities that were in an unrealized loss position for less than twelve months as of December 31, 2015 and 2014, respectively. The Company did not recognize any impairment losses for the years ended December 31, 2015, 2014 or 2013.
Accounts receivable balances were as follows (in thousands):
December 31, | |||||||
2015 | 2014 | ||||||
Trade customers | $ | 415,219 | $ | 457,823 | |||
Equipment manufacturers | 6,801 | 7,725 | |||||
Other | 18,329 | 23,375 | |||||
Total accounts receivable | 440,349 | 488,923 | |||||
Less: Allowance for doubtful accounts | (17,928 | ) | (9,924 | ) | |||
Accounts receivable, net | $ | 422,421 | $ | 478,999 | |||
77
SWIFT TRANSPORTATION COMPANY
NOTES TO CONSOLIDATED FINANCIAL STATEMENTS — CONTINUED
The following schedule presents the rollforward of the allowance for doubtful accounts (in thousands):
December 31, | |||||||||||
2015 | 2014 | 2013 | |||||||||
Beginning balance | $ | 9,924 | $ | 7,504 | $ | 7,432 | |||||
Provision | 8,004 | 2,844 | 1,370 | ||||||||
Recoveries | — | 89 | 35 | ||||||||
Write-offs | — | (513 | ) | (1,333 | ) | ||||||
Ending balance | $ | 17,928 | $ | 9,924 | $ | 7,504 | |||||
See Note 11 for a discussion of the Company’s accounts receivable securitization program and the related accounting treatment.
Assets held for sale balances were (in thousands):
December 31, | |||||||
2015 | 2014 | ||||||
Land and facilities | $ | 288 | $ | 288 | |||
Revenue equipment | 8,796 | 2,619 | |||||
Assets held for sale | $ | 9,084 | $ | 2,907 | |||
As of December 31, 2015 and 2014, assets held for sale are carried at the lower of depreciated cost or estimated fair value, less expected selling costs when the required criteria, as defined by ASC Topic 360, Property, Plant and Equipment, are satisfied. Depreciation ceases on the date that the held for sale criteria are met. The Company expects to sell these assets within the next 12 months. The Company did not recognize any impairment losses for the years ended December 31, 2015, 2014 or 2013.
During the year ended December 31, 2015, the Company sold zero operating properties classified as held for sale.
During the year ended December 31, 2014, the Company sold five operating properties classified as held for sale with a carrying value of $14.5 million. As a result, the Company recognized $3.0 million in (pre-tax) gain on disposal of property and equipment in the consolidated income statements.
Notes receivable are included in "Current portion of notes receivable" and "Other assets" in the consolidated balance sheets and were comprised of (in thousands):
December 31, | |||||||
2015 | 2014 | ||||||
Notes receivable due from owner-operators, with interest rates at 15%, secured by revenue equipment. Terms range from several months to three years | $ | 15,725 | $ | 13,642 | |||
Other | 24 | 1,933 | |||||
Total notes receivable | 15,749 | 15,575 | |||||
Less: current portion | (9,817 | ) | (9,202 | ) | |||
Long-term notes receivable | $ | 5,932 | $ | 6,373 | |||
78
SWIFT TRANSPORTATION COMPANY
NOTES TO CONSOLIDATED FINANCIAL STATEMENTS — CONTINUED
The following presents the components of goodwill by reportable segment as of December 31, 2015 and 2014 (in thousands):
Gross Carrying Amount | Accumulated Impairment Losses | Net Carrying Amount | |||||||||
Truckload | $ | 376,998 | $ | (190,394 | ) | $ | 186,604 | ||||
Dedicated | 130,742 | (64,090 | ) | 66,652 | |||||||
Total | $ | 507,740 | $ | (254,484 | ) | $ | 253,256 | ||||
There were no impairments identified during annual goodwill impairment testing in 2015, 2014 or 2013.
Intangible asset balances were as follows (in thousands):
December 31, | |||||||
2015 | 2014 | ||||||
Customer Relationships: | |||||||
Gross carrying value | $ | 275,324 | $ | 275,324 | |||
Accumulated amortization | (173,242 | ) | (156,428 | ) | |||
Customer relationships, net | 102,082 | 118,896 | |||||
Trade Name: | |||||||
Gross carrying value | 181,037 | 181,037 | |||||
Intangible assets, net | 283,119 | 299,933 | |||||
In conjunction with the 2007 Transactions, definite-lived intangible assets with a gross carrying value of $261.2 million were recorded. The following table presents amortization for the years ended December 31, 2015, 2014, and 2013 related to intangible assets recognized in conjunction with the 2007 Transactions and the previous intangible assets existing prior to the 2007 Transactions (in thousands):
Year Ended December 31, | |||||||||||
2015 | 2014 | 2013 | |||||||||
Amortization of intangible assets related to the 2007 Transactions | $ | 15,648 | $ | 15,648 | $ | 15,648 | |||||
Amortization related to intangible assets existing prior to the 2007 Transactions | 1,166 | 1,166 | 1,166 | ||||||||
Amortization of intangibles | $ | 16,814 | $ | 16,814 | $ | 16,814 | |||||
Management anticipates that the composition and amount of amortization associated with intangible assets as of December 31, 2015 will remain consistent at $16.8 million through 2017, and will decrease to $16.3 million in 2018, of which $0.7 million will represent the final amortization of the intangible assets existing prior to the 2007 Transactions. Amortization of intangible assets is expected to be $15.6 million in both 2019 and 2020. Actual amounts of amortization expense may differ from estimated amounts due to additional intangible asset acquisitions, impairment of intangible assets, accelerated amortization of intangible assets and other events.
79
SWIFT TRANSPORTATION COMPANY
NOTES TO CONSOLIDATED FINANCIAL STATEMENTS — CONTINUED
The following table presents the composition of accrued liabilities (in thousands):
December 31, | |||||||
2015 | 2014 | ||||||
Employee compensation | $ | 55,750 | $ | 50,398 | |||
Owner-operator lease purchase reserve | 5,271 | 10,418 | |||||
Income tax accrual (1) | 2,043 | 1,931 | |||||
Accrued owner-operator expenses | 6,711 | 6,507 | |||||
Deferred revenue | 1,740 | 1,504 | |||||
Fuel and property taxes | 4,076 | 3,812 | |||||
Accrued interest expense | 1,532 | 4,216 | |||||
Other | 20,190 | 19,933 | |||||
Accrued liabilities | $ | 97,313 | $ | 98,719 | |||
____________
(1) | Refer to Note 3, regarding the reclassification of deferred income taxes, per ASU 2015-17. |
Claims accruals represent accruals for the uninsured portion of outstanding claims at year-end. The current portion reflects the amount of claims expected to be paid in the following year. The Company’s insurance program for workers’ compensation, group medical liability, auto and collision liability, physical damage and cargo damage involves self-insurance with varying risk retention levels.
Claims accruals were comprised of the following (in thousands):
December 31, | |||||||
2015 | 2014 | ||||||
Auto and collision liability | $ | 123,086 | $ | 112,548 | |||
Workers’ compensation liability | 92,608 | 82,439 | |||||
Owner-operator claims liability | 12,304 | 13,233 | |||||
Group medical and other liability (1) | 364 | 12,064 | |||||
Cargo damage liability | 5,348 | 4,660 | |||||
Claims accrual | 233,710 | 224,944 | |||||
Less: current portion | (84,429 | ) | (81,251 | ) | |||
Long-term claim accruals | $ | 149,281 | $ | 143,693 | |||
____________
(1) | Effective January 1, 2015, the Company is fully insured on its group medical benefits, subject to contributed premiums. Prior to January 1, 2015, the Company had a $500 thousand specific deductible with an aggregating individual deductible of $150 thousand beginning January 1, 2013, of each employee health care claim, as well as commercial insurance for the balance. |
80
SWIFT TRANSPORTATION COMPANY
NOTES TO CONSOLIDATED FINANCIAL STATEMENTS — CONTINUED
On December 10, 2015, SRCII, a wholly-owned subsidiary of the Company, entered into the 2015 RSA, which further amends the 2013 RSA. The parties to the 2015 RSA include SRCII as the seller, Swift Transportation Services, LLC as the servicer, the various conduit purchasers, the various related committed purchasers, the various purchaser agents, the various letters of credit participants, and PNC Bank, National Association as the issuing bank of letters of credit and as administrator. Pursuant to the 2015 RSA, the Company's receivable originator subsidiaries sell, on a revolving basis, undivided interests in all of their eligible accounts receivable to SRCII. In turn, SRCII sells a variable percentage ownership interest in the eligible accounts receivable to the various purchasers. The facility qualifies for treatment as a secured borrowing under ASC Topic 860, Transfers and Servicing. As such, outstanding amounts are classified as liabilities on the Company’s consolidated balance sheets.
The following table summarizes the key differences between the current and previous securitization programs (dollar amounts in thousands):
2015 RSA | 2013 RSA | ||||||
Effective | December 2015 | June 2013 | |||||
Borrowing capacity (1) | $ | 400,000 | $ | 375,000 | |||
Final maturity date | January 10, 2019 | July 13, 2016 | |||||
Unused commitment fee rate | 15 basis points | 35 basis points | |||||
Program fees on outstanding balances | one-month LIBOR + 90 basis points | one-month LIBOR + 95 basis points | |||||
____________
(1) | The 2015 RSA has an accordion option to increase the maximum borrowing capacity by up to an additional $75.0 million, subject to participation by the Purchasers. The 2013 RSA borrowing capacity included a $50.0 million accordion option, which was exercised in September 2014. |
As of December 31, 2015 and 2014, interest accrued on the aggregate principal balance at a rate of 1.0% and 0.8%, respectively. Program fees and unused commitment fees are recorded in "Interest expense" in the consolidated income statements. The Company incurred program fees of $3.5 million, $3.5 million and $3.1 million, during the years ended December 31, 2015, 2014 and 2013, respectively.
The 2015 RSA is subject to customary fees and contains various customary affirmative and negative covenants, representations and warranties, and default and termination provisions. Collections on the underlying receivables by the Company are held for the benefit of SRCII and the various purchasers and are unavailable to satisfy claims of the Company and its subsidiaries.
Other than the Company’s accounts receivable securitization as discussed in Note 11 and its outstanding capital lease obligations as discussed in Note 13, the Company's long-term debt consisted of the following (in thousands):
December 31, | |||||||
2015 | 2014 | ||||||
2015 Agreement: New Term Loan A, due July 2020 | $ | 669,750 | $ | — | |||
2014 Agreement: Old Term Loan A, due June 2019 | — | 500,000 | |||||
2014 Agreement: Term Loan B, due June 2021, net of $920 OID | — | 396,080 | |||||
Other | 11,122 | 6,980 | |||||
Long-term debt | 680,872 | 903,060 | |||||
Less: current portion of long-term debt | (35,582 | ) | (31,445 | ) | |||
Long-term debt, less current portion | $ | 645,290 | $ | 871,615 | |||
81
SWIFT TRANSPORTATION COMPANY
NOTES TO CONSOLIDATED FINANCIAL STATEMENTS — CONTINUED
December 31, | |||||||
2015 | 2014 | ||||||
Long-term debt | $ | 680,872 | $ | 903,060 | |||
Revolving line of credit (1) | 200,000 | 57,000 | |||||
Long-term debt, including revolving line of credit | $ | 880,872 | $ | 960,060 | |||
____________
(1) | The Company also had outstanding letters of credit, primarily related to workers' compensation and self-insurance liabilities of $95.0 million under the New Revolver at December 31, 2015 and $100.3 million under the Old Revolver at December 31, 2014. |
Credit Agreements
2015 Agreement — On July 27, 2015, the Company entered into the 2015 Agreement, which replaced the 2014 Agreement, including the $450.0 million Old Revolver (zero outstanding at closing), $500.0 million Old Term Loan A ($485.0 million outstanding at closing), and $400.0 million Term Loan B ($395.0 million outstanding at closing). The 2015 Agreement includes a New Revolver and a New Term Loan A. Upon closing, the $680.0 million in proceeds from the New Term Loan A, a $200.0 million draw on the New Revolver and $4.9 million cash on hand were used to pay off the then-outstanding balances of the Old Term Loan A and Term Loan B, including accrued interest and fees under the 2014 Agreement, as well as certain transactional fees associated with the 2015 Agreement.
The following table presents the key terms of the 2015 Agreement (dollars in thousands):
2015 Agreement | New Term Loan A | New Revolver (2) | ||
Maximum borrowing capacity | $680,000 | $600,000 | ||
Final maturity date | July 27, 2020 | July 27, 2020 | ||
Interest rate base | LIBOR | LIBOR | ||
LIBOR floor | —% | —% | ||
Interest rate minimum margin (1) | 1.50% | 1.50% | ||
Interest rate maximum margin (1) | 2.25% | 2.25% | ||
Minimum principal payment — amount (3) | $6,625 | $— | ||
Minimum principal payment — frequency | Quarterly | Once | ||
Minimum principal payment — commencement date (3) | December 31, 2015 | July 27, 2020 | ||
____________
(1) | The interest rate margin for the New Term Loan A and New Revolver is 1.75%, which is lower than the 2014 Agreement's Term Loan B. Beginning December 31, 2015, the interest rate margin for the New Term Loan A and New Revolver is based on the Company's consolidated leverage ratio. As of December 31, 2015, interest accrued at 2.12% on the New Term Loan A and 2.08% on the New Revolver. |
(2) | The commitment fee for the unused portion of the New Revolver is based on the Company's consolidated leverage ratio, and ranges from 0.25% to 0.35%. As of December 31, 2015, commitment fees on the unused portion of the New Revolver accrued at 0.25% and outstanding letter of credit fees accrued at 1.75%. |
(3) | Commencing in March 2017, the minimum quarterly payment amount on the New Term Loan A is $12.3 million, at which it remains until final maturity. |
The New Revolver and New Term Loan A of the 2015 Agreement contain certain financial covenants with respect to a maximum leverage ratio and a minimum consolidated interest coverage ratio. The 2015 Agreement provides flexibility regarding the use of proceeds from asset sales, payment of dividends, stock buybacks, and equipment financing. In addition to the financial covenants, the 2015 Agreement includes customary events of default, including a change in control default and certain affirmative and negative covenants, including, but not limited to, restrictions, subject to certain exceptions, on incremental indebtedness, asset sales, certain restricted payments (including dividends and stock repurchases), certain incremental investments or advances, transactions with affiliates, engaging in additional business activities, and prepayments of certain other indebtedness.
Borrowings under the 2015 Agreement are secured by substantially all of the assets of the Company and are guaranteed by Swift Transportation Company, IEL, Swift Refrigerated Transportation, LLC (formerly Central Refrigerated Transportation, LLC) and its subsidiaries, Swift Transportation Co., LLC and its domestic subsidiaries other than its captive insurance subsidiaries, driver academy subsidiary, and its bankruptcy-remote special purpose subsidiary.
82
SWIFT TRANSPORTATION COMPANY
NOTES TO CONSOLIDATED FINANCIAL STATEMENTS — CONTINUED
2014 Agreement — The Company entered into the 2014 Agreement on June 9, 2014, which included the Old Term Loan A, a first lien Term Loan B tranche, and the Old Revolver. The 2014 Agreement replaced the then-existing revolving credit line, as well as the first lien term loan B-1 and B-2 tranches of the 2013 Agreement, which had outstanding principal balances at closing of $229.0 million and $370.9 million, respectively. Upon closing, the Company drew $164.0 million on the Old Revolver and $50.0 million on the Old Term Loan A. The Company subsequently drew the remaining $450.0 million available on the Old Term Loan A to facilitate redemption of the Senior Notes in November 2014.
The following table presents the key terms of the 2014 Agreement (dollars in thousands):
2014 Agreement | Old Term Loan A | Term Loan B | Old Revolver | |||
Maximum borrowing capacity | $500,000 | $400,000 | $450,000 | |||
Final maturity date | June 9, 2019 | June 9, 2021 | June 9, 2019 | |||
Interest rate base | LIBOR | LIBOR | LIBOR | |||
LIBOR floor | —% | 0.75% | —% | |||
Interest rate minimum margin (1) | 1.50% | 3.00% | 1.50% | |||
Interest rate maximum margin (1) | 2.25% | 3.00% | 2.25% | |||
Minimum principal payment — amount (2) | $5,625 | $1,000 | $— | |||
Minimum principal payment — frequency | Quarterly | Quarterly | Once | |||
Minimum principal payment — commencement date (2) | March 31, 2015 | June 30, 2014 | June 30, 2019 | |||
____________
(1) | Interest rate margins on the Old Term Loan A and Old Revolver were based on the Company's consolidated leverage ratio. Additionally, after December 31, 2014, interest rate margins on the Term Loan B were determined by the Company's consolidated leverage ratio, ranging from 2.75% to 3.00%. As of December 31, 2014, interest accrued at 2.16% and 3.75% on the Old Term Loan A and Term Loan B, respectively. |
The commitment fee for the unused portion of the Old Revolver was also based on the Company's consolidated leverage ratio, and ranged from 0.25% to 0.35%. As of December 31, 2014, commitment fees on the unused portion of the Old Revolver accrued at 0.30% and letter of credit fees accrued at 2.00%.
(2) | Commencing in March 2017, the minimum principal payment amount on the Old Term Loan A would have been $11.3 million. |
Senior Notes
In November 2014, the Company redeemed, in full, the remaining $428.1 million face value of its Senior Notes. This was primarily funded with the proceeds from the Company’s Old Term Loan A. The Company paid 105.0% of face value, plus accrued and unpaid interest, to call the Senior Notes. While the redeemed Senior Notes incurred interest at 10.0%, the source of funds from the Old Term Loan A incurred interest at LIBOR plus applicable margin of 1.50% to 2.25%. The November 2014 redemption followed a series of open market purchases that occurred in the first nine months of 2014, in which the Company used cash on hand to repurchase $71.9 million in principal of the Senior Notes. Including the November 2014 redemption, the Company repurchased the entire $500.0 million in principal of the Senior Notes during 2014, at an average price of 105.58% of face value.
Payment of principal and interest on the Senior Notes was previously guaranteed by certain of the Company’s 100% owned domestic subsidiaries. Pursuant to the terms of the indenture governing the Senior Notes, the guarantees were subject to release at which time the subsidiaries no longer had indebtedness that would have required a guarantee. Thus, the Company's redemption of the Senior Notes on November 15, 2014, released the related guarantee.
Central Debt
As discussed in Note 1, the Company completed the Central Acquisition on August 6, 2013. As of December 31, 2014, Central had an outstanding principal balance of $1.2 million for various notes payable to finance companies secured by revenue equipment with due dates through May 2015. Additionally, at the closing of the Central Acquisition, the Company repaid a Central note payable to a bank secured by real estate with a due date of March 2016 including outstanding principal and accrued interest of $3.4 million. As of December 31, 2015, all outstanding principal balances were paid in full.
Deferred Loan Costs and Loss on Debt Extinguishment
Deferred loan costs, reported in "Other assets" in the Company's consolidated balance sheets, were $4.3 million and $10.4 million as of December 31, 2015 and 2014, respectively.
83
SWIFT TRANSPORTATION COMPANY
NOTES TO CONSOLIDATED FINANCIAL STATEMENTS — CONTINUED
The Company incurred $9.6 million in losses on debt extinguishment during the year ended December 31, 2015, reflecting the write-off of the unamortized OID and deferred financing fees related to the 2014 Agreement, which was replaced by the 2015 Agreement. For the year ended December 31, 2014, the Company incurred $39.9 million in losses on debt extinguishment related to the Company's redemption of its Senior Notes and the replacement of the 2013 Agreement with the 2014 Agreement. For the year ended December 31, 2013, the Company incurred $5.5 million in losses on debt extinguishment related to the Company's replacement of the 2012 Agreement with the 2013 Agreement and repaying certain outstanding Central debt in full at closing of the Central Acquisition.
The Company finances a portion of its revenue equipment under capital and operating leases and certain terminals under operating leases.
Capital Leases (as Lessee) — The Company’s capital leases are typically structured with balloon payments at the end of the lease term equal to the residual value the Company is contracted to receive from certain equipment manufacturers upon sale or trade back to the manufacturers. If the Company does not receive proceeds of the contracted residual value from the manufacturer, the Company is still obligated to make the balloon payment at the end of the lease term. Certain leases contain renewal or fixed price purchase options. The present value of obligations under capital leases is included under "Current portion of capital lease obligations" and "Capital lease obligations, less current portion" in the consolidated balance sheets. As of December 31, 2015, the leases were collateralized by revenue equipment with a cost of $357.8 million and accumulated amortization of $90.1 million. As of December 31, 2014, the leases were collateralized by revenue equipment with a cost of $270.6 million and accumulated amortization of $68.0 million. Amortization of the equipment under capital leases is included in "Depreciation and amortization of property and equipment" in the Company’s consolidated income statements.
Operating Leases (as Lessee) — The revenue equipment leases generally include a purchase option exercisable at the completion of the lease. From time to time, the Company guarantees certain residual values under its operating lease agreements for revenue equipment. At the termination of these operating leases, the Company would be responsible for the excess, if any, of the guarantee amount above the fair market value of the equipment. As of December 31, 2015 and 2014, the Company had no liability for the estimated fair value of guarantees.
Rent expense related to operating leases was $240.5 million, $229.3 million and $180.3 million for the years ended December 31, 2015, 2014, and 2013, respectively.
As of December 31, 2015, annual future minimum lease commitments for all noncancelable leases were (in thousands):
Operating | Capital | ||||||
2016 | $ | 214,790 | $ | 66,894 | |||
2017 | 172,735 | 76,108 | |||||
2018 | 106,284 | 47,631 | |||||
2019 | 49,250 | 57,512 | |||||
2020 | 22,727 | 8,055 | |||||
Thereafter | 47,503 | 46,845 | |||||
Total minimum lease payments | $ | 613,289 | $ | 303,045 | |||
Less: amounts representing interest | (21,250 | ) | |||||
Present value of minimum lease payments | 281,795 | ||||||
Less: current portion | (59,794 | ) | |||||
Capital lease obligations, long-term | $ | 222,001 | |||||
84
SWIFT TRANSPORTATION COMPANY
NOTES TO CONSOLIDATED FINANCIAL STATEMENTS — CONTINUED
Operating Leases (as Lessor) — The Company’s wholly-owned financing subsidiaries lease revenue equipment to the Company’s owner-operators under operating leases. Annual future minimum lease payments receivable under operating leases for the periods noted below were (in thousands):
2016 | $ | 120,194 | |
2017 | 93,547 | ||
2018 | 42,076 | ||
2019 | 5,827 | ||
2020 | — | ||
Thereafter | — | ||
Total | $ | 261,644 | |
Lease classification is determined based on minimum rental payments per the agreement, including residual value guarantees, when applicable, as well as receivables due to the Company upon default or cross-default. When owner-operators default on their leases, the Company typically re-leases the equipment to other owner-operators. As such, future minimum lease payments reflect original leases and re-leases.
As of December 31, 2015, the Company had commitments outstanding to acquire revenue equipment in 2016 for approximately $681.8 million ($484.1 million of which were tractor commitments) and in 2017 to 2018 for approximately $190.9 million (all of which were tractor commitments). The Company has the option to cancel tractor purchase orders with 60 to 90 days' notice prior to the scheduled production, although the notice period has lapsed for approximately 10.1% of the tractor commitments outstanding as of December 31, 2015. These purchases are expected to be financed by the combination of operating leases, capital leases, debt, proceeds from sales of existing equipment and cash flows from operations.
On October 27, 2015, management announced that the Company would not further grow its tractor fleet in the remainder of 2015 and in 2016. As such, the Company canceled the purchase and trade of 450 trucks. The impact of these cancellations is included in the outstanding purchase commitment amounts, discussed above. New tractors received under 2016 purchase commitments are intended to replace older tractors in our fleet.
As of December 31, 2015, the Company had outstanding purchase commitments of approximately $13.3 million for facilities and non-revenue equipment. Factors such as costs and opportunities for future terminal expansions may change the amount of such expenditures.
The Company is involved in certain claims and pending litigation primarily arising in the normal course of business. The majority of these claims relate to workers compensation, auto collision and liability, and physical damage and cargo damage. The Company expenses legal fees as incurred and accrues for the uninsured portion of contingent losses from these and other pending claims when it is both probable that a liability has been incurred and the amount of the loss can be reasonably estimated. Based on the knowledge of the facts and, in certain cases, advice of outside counsel, management believes the resolution of claims and pending litigation, taking into account existing reserves, will not have a material adverse effect on the Company. Moreover, the results of complex legal proceedings are difficult to predict and the Company’s view of these matters may change in the future as the litigation and events related thereto unfold.
For certain cases described below, management is unable to provide a meaningful estimate of the possible loss or range of loss because, among other reasons, (i) the proceedings are in various stages; (ii) damages have not been sought; (iii) damages are unsupported and/or exaggerated; (iv) there is uncertainty as to the outcome of pending appeals and/or (v) there are significant factual issues to be resolved. For these cases, however, management does not believe, based on currently available information, that the outcomes of these proceedings will have a material adverse effect on our financial condition, though the outcomes could be material to our operating results for any particular period, depending, in part, upon the operating results for such period.
Arizona Owner-operator Class Action Litigation
On January 30, 2004, a class action lawsuit was filed by Leonel Garza on behalf of himself and all similarly-situated persons against Swift Transportation: Garza v. Swift Transportation Co., Inc., Case No. CV7-472 (the "Garza Complaint"). The putative class originally involved certain owner-operators who contracted with the Company under a 2001 Contractor Agreement that was in place for one year. The putative class is alleging that the Company should have reimbursed owner-operators for actual miles driven rather than
85
SWIFT TRANSPORTATION COMPANY
NOTES TO CONSOLIDATED FINANCIAL STATEMENTS — CONTINUED
the contracted and industry standard remuneration based upon dispatched miles. The trial court denied plaintiff’s petition for class certification. The plaintiff appealed and on August 6, 2008, the Arizona Court of Appeals issued an unpublished Memorandum Decision reversing the trial court’s denial of class certification and remanding the case back to the trial court. On November 14, 2008, the Company filed a petition for review to the Arizona Supreme Court regarding the issue of class certification as a consequence of the denial of the Motion for Reconsideration by the Court of Appeals. On March 17, 2009, the Arizona Supreme Court granted the Company’s petition for review, and on July 31, 2009, the Arizona Supreme Court vacated the decision of the Court of Appeals, opining that the Court of Appeals lacked automatic appellate jurisdiction to reverse the trial court’s original denial of class certification and remanded the matter back to the trial court for further evaluation and determination. Thereafter, the plaintiff renewed the motion for class certification and expanded it to include all persons who were employed by Swift as employee drivers or who contracted with Swift as owner-operators on or after January 30, 1998, in each case who were compensated by reference to miles driven. On November 4, 2010, the Maricopa County trial court entered an order certifying a class of owner-operators and expanding the class to include employees. Upon certification, the Company filed a motion to compel arbitration, as well as filing numerous motions in the trial court urging dismissal on several other grounds including, but not limited to the lack of an employee as a class representative, and because the named owner-operator class representative only contracted with the Company for a three-month period under a one-year contract that no longer exists. In addition to these trial court motions, the Company also filed a petition for special action with the Arizona Court of Appeals, arguing that the trial court erred in certifying the class because the trial court relied upon the Court of Appeals ruling that was previously overturned by the Arizona Supreme Court. On April 7, 2011, the Arizona Court of Appeals declined jurisdiction to hear this petition for special action and the Company filed a petition for review to the Arizona Supreme Court. On August 31, 2011, the Arizona Supreme Court declined to review the decision of the Arizona Court of Appeals. In April 2012, the trial court issued the following rulings with respect to certain motions filed by Swift: (1) denied Swift’s motion to compel arbitration; (2) denied Swift’s request to decertify the class; (3) granted Swift’s motion that there is no breach of contract; and (4) granted Swift’s motion to limit class size based on statute of limitations. On November 13, 2014, the court denied plaintiff's motion to add new class representatives for the employee class and therefore the employee class remains without a plaintiff class representative. On March 18, 2015, the court denied Swift's two motions for summary judgment (1) to dismiss any claims related to the employee class since there is no class representative; and (2) to dismiss plaintiff's claim of breach of a duty of good faith and fair dealing. On July 14, 2015, the court granted Swift's motion to decertify the entire class. On December 23, 2015, Plaintiff filed a Petition for Special Action with the Arizona Court of appeals. That petition has been fully briefed and oral argument is scheduled for February 17, 2016.
Ninth Circuit Owner-Operator Misclassification Class Action Litigation
On December 22, 2009, a class action lawsuit was filed against Swift Transportation and IEL: Virginia VanDusen, John Doe 1 and Joseph Sheer, individually and on behalf of all other similarly-situated persons v. Swift Transportation Co., Inc., Interstate Equipment Leasing, Inc., Jerry Moyes, and Chad Killebrew, Case No. 9-CIV-10376 filed in the United States District Court for the Southern District of New York (the "Sheer Complaint"). The putative class involves owner-operators alleging that Swift Transportation misclassified owner-operators as independent contractors in violation of the federal Fair Labor Standards Act ("FLSA"), and various New York and California state laws and that such owner-operators should be considered employees. The lawsuit also raises certain related issues with respect to the lease agreements that certain owner-operators have entered into with IEL. At present, in addition to the named plaintiffs, approximately 450 other current or former owner-operators have joined this lawsuit. Upon Swift’s motion, the matter was transferred from the United States District Court for the Southern District of New York to the United States District Court in Arizona. On May 10, 2010, the plaintiffs filed a motion to conditionally certify an FLSA collective action and authorize notice to the potential class members. On September 23, 2010, plaintiffs filed a motion for a preliminary injunction seeking to enjoin Swift and IEL from collecting payments from plaintiffs who are in default under their lease agreements and related relief. On September 30, 2010, the district court granted Swift’s motion to compel arbitration and ordered that the class action be stayed, pending the outcome of arbitration. The district court further denied plaintiff’s motion for preliminary injunction and motion for conditional class certification. The district court also denied plaintiff’s request to arbitrate the matter as a class.
The plaintiff filed a petition for a writ of mandamus to the Ninth Circuit Court of Appeals asking that the district court’s September 30, 2010 order be vacated. On July 27, 2011, the Ninth Circuit Court of Appeals denied the plaintiff’s petition for writ of mandamus and thereafter the district court denied plaintiff’s motion for reconsideration and certified its September 30, 2010 order. The plaintiffs filed an interlocutory appeal to the Ninth Circuit Court of Appeals to overturn the district court’s September 30, 2010 order to compel arbitration, alleging that the agreement to arbitrate is exempt from arbitration under Section 1 of the Federal Arbitration Act ("FAA") because the class of plaintiffs allegedly consists of employees exempt from arbitration agreements. On November 6, 2013, the Ninth Circuit Court of Appeals reversed and remanded, stating its prior published decision, "expressly held that a district court must determine whether an agreement for arbitration is exempt from arbitration under Section 1 of the FAA as a threshold matter." As a consequence of this determination by the Ninth Circuit Court of Appeals being different from a decision of the Eighth Circuit Court of Appeals on a similar issue, on February 4, 2014, the Company filed a petition for writ of certiorari to the United States Supreme Court to address whether the district court or arbitrator should determine whether the contract is an employment contract exempt from Section 1 of the Federal Arbitration Act. On June 16, 2014, the United States Supreme Court denied the Company’s petition for writ of certiorari.
The matter remains pending in the district court and is currently in discovery. The Company also filed a writ of mandamus and appeal from the district court's order that effectively denied the Company's motion to compel arbitration. The Ninth Circuit held oral
86
SWIFT TRANSPORTATION COMPANY
NOTES TO CONSOLIDATED FINANCIAL STATEMENTS — CONTINUED
argument on November 16, 2015 and the parties await a decision from the Court. The Company intends to vigorously defend against any proceedings. The final disposition of this case and the impact of such final disposition cannot be determined at this time.
California Wage, Meal and Rest Employee Class Actions
On March 22, 2010, a class action lawsuit was filed by John Burnell, individually and on behalf of all other similarly-situated persons against Swift Transportation: John Burnell and all others similarly-situated v. Swift Transportation Co., Inc., filed in the Superior Court of California, County of San Bernardino (the "Burnell Complaint"). On September 3, 2010, upon motion by Swift, the matter was removed to the United States District Court for the Central District of California, Case No. EDCV10-809-VAP. The putative class includes drivers who worked for Swift during the four years preceding the date of filing alleges that Swift failed to pay the California minimum wage, failed to provide proper meal and rest periods and failed to timely pay wages upon separation from employment. On April 9, 2013, the Company filed a motion for judgment on the pleadings, requesting dismissal of plaintiff's claims related to alleged meal and rest break violations under the California Labor Code alleging that such claims are preempted by the Federal Aviation Administration Authorization Act.
On April 5, 2012, the Company was served with a class action lawsuit, alleging facts similar to those as set forth in the Burnell Complaint: James R. Rudsell, on behalf of himself and all others similarly-situated v. Swift Transportation Co. of Arizona, LLC and Swift Transportation Company, in the Superior Court of California, County of San Bernardino (the "Rudsell Complaint"). On May 3, 2012, upon motion by Swift, the matter was removed to the United States District Court for the Central District of California, Case No. EDCV12-00692-VAP. The Rudsell Complaint was stayed on April 29, 2013, pending a resolution of the Burnell Complaint.
On September 25, 2014, a class action lawsuit was filed by Lawrence Peck on behalf of himself and all other similarly-situated persons against Swift Transportation: Peck v. Swift Transportation Co. of Arizona, LLC in the Superior Court of California, County of Riverside (the "Peck Complaint"). The putative class, which includes current and former non-exempt employee truck drivers who performed services in California within the four-year statutory period, alleges that Swift failed to pay for all hours worked (specifically that pay-per-mile fails to compensate drivers for non-driving related services), failed to pay overtime, failed to properly reimburse work-related expenses, failed to timely pay wages and failed to provide accurate wage statements. On October 24, 2014, upon motion by Swift, the matter was removed to the United States District Court for the Central District of California, Case No. 14-CV-02206-VAP. The Peck Complaint was stayed on April 6, 2015, pending a resolution of the earlier filed cases.
On February 27, 2015, Sadashiv Mares filed a complaint alleging five Causes of Action arising under California state law on behalf of himself and a putative class against Swift Transportation Co. of Arizona, LLC, in the Superior Court of California, County of Alameda (the "Mares Complaint"). On July 13, 2015, upon motion by Swift, the matter was removed to the United States District Court for the Northern District of California, Case No. 2:15-CV-03253-JSW. Upon the Parties stipulation, on October 17, 2015, the case was transferred to the United States District Court for the Central District of California, Case No. 2:15-CV-07920-VAP. Swift has filed a Motion to Dismiss or, in the Alternative, to stay the Mares Complaint, based on the similarities between the Mares Complaint and the Burnell, Rudsell and Peck Complaints, which is currently pending before the Court.
On April 15, 2015, a complaint was filed in the Superior Court of California, County of San Bernardino: Rafael McKinsty et al. v. Swift Transportation Co. of Arizona, LLC, et al. (the "McKinsty Complaint"). The McKinsty Complaint, a purported class action, alleges violation of California rest break laws and is similar to the Burnell, Rudsell, Peck and Mares Complaints. On July 2, 2015, upon motion by Swift, the matter was removed to the United States District Court for the Central District of California, Case No. 15-CV-1317-VAP. The McKinsty Complaint was stayed on August 19, 2015, pending a resolution of the earlier filed cases.
On October 15, 2015, a class action lawsuit was filed in the Superior Court of California, County of Riverside: Thor Nilsen v. Swift Transportation Co. of Arizona, LLC (the "Nilsen Complaint"). The Nilsen Complaint alleges violations of California law similar to the Burnell, Rudsell, Peck, Mares, and McKinsty Complaints. On December 9, 2015, upon motion by Swift, the matter was removed to the United States District Court for the Central District of California, Case No. 15-CV-02504-VAP. The Parties are currently discussing a stay of the Nilsen Complaint, pending a resolution of the earlier filed cases.
The issue of class certification must first be resolved before the court will address the merits of these cases, and the Company retains all of its defenses against liability and damages, pending a determination of class certification. A class certification briefing schedule has been set in the Burnell Complaint, and a class certification hearing is scheduled on April 25, 2016. The Company intends to vigorously defend against certification of the class in all of these matters, as well as the merits of these matters, should the classes be certified. The final disposition of these cases and the impact of such final dispositions of these cases cannot be determined at this time.
Delaware Fair Labor Standards Act Class Action Litigation
On December 29, 2015, a class action lawsuit was filed by Pamela Julian, individually and on behalf of all other similarly-situated persons against Swift Transportation, Inc., et al. in the United States District Court for the District of Delaware, Case No. 1:15-CV-01212-UNA. The complaint alleges that Swift violated the FLSA by failing to pay its trainee drivers minimum wage for all work performed and by failing to pay overtime. Swift expects to file a responsive pleading to the complaint. The Company retains all of its defenses against liability and damages. The Company intends to vigorously defend against the merits of these claims and to
87
SWIFT TRANSPORTATION COMPANY
NOTES TO CONSOLIDATED FINANCIAL STATEMENTS — CONTINUED
challenge certification. The final disposition of this case and the impact of such final disposition of this case cannot be determined at this time.
Washington Overtime Class Action
On September 9, 2011, a class action lawsuit was filed by Troy Slack and several other drivers on behalf of themselves, and all similarly-situated persons, against Swift Transportation: Troy Slack, et al. v. Swift Transportation Co. of Arizona, LLC and Swift Transportation Corporation in the State Court of Washington, Pierce County (the "Slack Complaint"). The Slack Complaint was removed to federal court on October 12, 2011, case number 11-2-114380. The putative class includes all current and former Washington state-based employee drivers during the three-year statutory period prior to the filing of the lawsuit, and through the present, and alleges that they were not paid minimum wage and overtime in accordance with Washington state law and that they suffered unlawful deductions from wages. On November 23, 2013, the court entered an order on plaintiffs' motion to certify the class. The court only certified the class as it pertains to "dedicated" drivers and did not certify any other class, including any class related to over-the-road drivers. The parties dispute the definition of "dedicated" as used by the court and a class notice has not yet been issued. On September 2, 2015, new counsel was appointed for Plaintiffs and on November 16, 2015, new legal counsel was substituted for the Company. As a result of the substitution of counsel for both parties, the court has extended all existing dates by ten months. The matter is now anticipated to move into discovery. The Company retains all of its defenses against liability and damages. The Company intends to vigorously defend against the merits of these claims and to challenge certification. The final disposition of this case and the impact of such final disposition of this case cannot be determined at this time.
Indiana Fair Credit Reporting Act Class Action Litigation
On March 18, 2015, a class action lawsuit was filed by Melvin Banks, individually and on behalf of all other similarly-situated persons against Central Refrigerated Service, Inc. in the United States District Court for the Northern District of Indiana, Case No. 2:15-CV-00105. The complaint alleges that Central violated the Fair Credit Reporting Act by failing to provide job applicants with adverse action notices and copies of their consumer reports and statements of rights. At this time, the size of the potential class is unknown. The matter is now anticipated to move into discovery. The Company retains all of its defenses against liability and damages. The Company intends to vigorously defend against the merits of these claims and to challenge certification. The final disposition of this case and the impact of such final disposition of this case cannot be determined at this time.
Utah Collective and Individual Arbitration
On June 1, 2012, Gabriel Cilluffo, Kevin Shire and Bryan Ratterree filed a putative class and collective action lawsuit against Central Refrigerated Service, Inc., Central Leasing, Inc., Jon Isaacson, and Jerry Moyes (collectively referred to herein as the "Central Parties"), Case No. ED CV 12-00886 in the United States District Court for the Central District of California. Through this action, the plaintiffs alleged that the Central Parties misclassified owner-operator drivers as independent contractors and were therefore liable to these drivers for minimum wages and other employee benefits under the FLSA. The complaint also alleged a federal forced labor claim under 18 U.S.C. § 1589 and 1595, as well as fraud and other state-law claims.
Pursuant to the plaintiffs' owner-operator agreements, the district court issued an Order compelling arbitration and directed that the plaintiffs' causes of action under the FLSA should proceed to collective arbitration, while their forced labor, fraud and state law claims would proceed as separate individual arbitrations. A collective arbitration was subsequently initiated with the American Arbitration Association ("AAA"). Notice of the collective arbitration was sent to more than 3,000 owner-operators who worked for Central Refrigerated Service, Inc. and leased a vehicle from Central Leasing, Inc. on or after June 1, 2009. The parties are currently conducting discovery. No trial date has been set by the arbitrator.
In addition to the collective arbitration that is pending before the AAA, the three named plaintiffs, along with approximately 400 other owner-operators, have initiated a series of individual, bilateral proceedings against the Central Parties with the AAA. Discovery is commencing in these individual cases, which are pending before approximately 30 separate arbitrators. Trial dates for these arbitrations are expected to begin in late 2016.
Upon the acquisition of Central Refrigerated by Swift Transportation Company, the plaintiffs in both the collective and individual actions were allowed to amend their complaints in June 2015 to include Swift Transportation Company as a defendant. The Company and the Central Parties intend to vigorously defend against the merits of plaintiffs' claims in both the collective and individual arbitration proceedings. The final disposition of this case and the impact cannot be determined at this time.
California Class and Collective Action for Pre-employment Physical Testing
On October 6, 2014 Robin Anderson filed a putative class and collective action against Central Refrigerated Service, Inc., ("Central Refrigerated") Case No. 5:14-CV 02062 in the United States District Court for the Central District of California (the "Anderson Complaint"). In this action, plaintiff alleges that pre-employment tests of physical strength administered by a third party on behalf of Central Refrigerated had an unlawfully discriminatory impact on female applicants and applicants over the age of 40. The suit seeks damages under Title VII of the Civil Rights Act of 1964, the Age Discrimination Act, and parallel California state law provisions, including the California Fair Employment and Housing Act.
88
SWIFT TRANSPORTATION COMPANY
NOTES TO CONSOLIDATED FINANCIAL STATEMENTS — CONTINUED
Upon the acquisition of Central Refrigerated by Swift Transportation Company, Plaintiff was allowed to amend her complaint in October 2015 to include Swift Transportation Company and Workwell Systems, Inc. as additional defendants. Workwell Systems, Inc. is the company that provided the physical testing service used by Central Refrigerated. The litigation is still at a very preliminary stage and plaintiff has not yet effected service on the newly added defendants. Discovery has not yet commenced in the case and no trial date has been set. There is not currently any information available regarding the number of potential members of the putative class or collective actions.
Central Refrigerated and Swift intend to vigorously defend against the merits of plaintiff’s claims. The final disposition of this case and the impact cannot be determined at this time.
Demand for Inspection of Books and Records
In February 2016, the Company received several shareholder demands, requesting to inspect the Company’s books and records, pursuant to Section 220 of the Delaware General Corporation Law. The demands relate to the shareholders’ alleged investigation pertaining to whether the Board and Jerry Moyes have breached their fiduciary duties with respect to matters that have been publicly disclosed concerning the Company's securities trading policy, limitations on the pledging of Company stock on margin and share repurchases. The Company is in the process of responding to the shareholders’ requests. Any future disposition or resolution of these matters cannot be determined at this time.
Environmental
The Company's tractors and trailers are involved in motor vehicle accidents, experience damage, mechanical failures and cargo issues as an incidental part of its normal ordinary course of operations. From time to time, these matters result in the discharge of diesel fuel, motor oil or other hazardous materials into the environment. Depending on local regulations and who is determined to be at fault, the Company is sometimes responsible for the clean-up costs associated with these discharges. As of December 31, 2015, the Company's estimate for its total legal liability for all such clean-up and remediation costs was approximately $0.4 million in the aggregate for all current and prior year claims.
The Company has typically used pay-fixed/receive-variable interest rate swaps to reduce the Company’s aggregate exposure to interest rate risk. The Company does not enter into derivative agreements for speculative purposes.
Swift Interest Rate Swaps
In April 2011, as contemplated by the then-existing credit facility, the Company entered into two forward-starting interest rate swap agreements with a notional amount of $350.0 million. These interest rate swaps were effective in January 2013 and had a maturity date of July 2015. On April 27, 2011 ("designation date"), the Company designated and qualified these interest rate swaps as cash flow hedges. Subsequent to the designation date, the effective portion of the changes in estimated fair value of the designated swaps was recorded in AOCI, and thereafter reclassified to derivative interest expense in the periods that the interest on the hedged debt affected earnings. The Company began accruing for hedged interest in January 2013. Refer to Note 24 for amounts and the Company's methodology related to fair value of interest rate swaps.
On March 7, 2013, the Company entered into the 2013 Agreement, as discussed in Note 12. Due to the incorporation of a new interest rate floor provision in the 2013 Agreement, the Company concluded, as of February 28, 2013, that the outstanding interest rate swaps were no longer highly effective in achieving offsetting changes in cash flows related to the hedged interest payments. As a result, the Company de-designated the hedges as of February 28, 2013 ("de-designation date"), at which time the effective portion of the change in fair value of interest rate swaps (previously recorded in AOCI) was, and will continue to be, amortized as derivative interest expense over the period of the originally designated hedged interest payments through July 2015. Following the de-designation date, changes in fair value of the interest rate swaps are immediately recognized as derivative interest expense in the consolidated income statements.
89
SWIFT TRANSPORTATION COMPANY
NOTES TO CONSOLIDATED FINANCIAL STATEMENTS — CONTINUED
Effects on Income and AOCI
The final settlement of the Company's interest rate swaps occurred in July 2015. The following table presents pre-tax losses from changes in fair value of the Company's interest rate swaps included in AOCI and earnings (in thousands):
Year Ended December 31, | |||||||||||
2015 | 2014 | 2013 | |||||||||
Losses recognized in AOCI from cash flow hedges (effective portion) | $ | — | $ | — | $ | 145 | |||||
Loss reclassified from AOCI into net income from cash flow hedges (effective portion) | $ | 3,886 | $ | 6,218 | $ | 3,143 | |||||
Loss recognized in income from de-designated derivative contracts | 86 | 277 | 709 | ||||||||
Derivative interest expense | $ | 3,972 | $ | 6,495 | $ | 3,852 | |||||
Losses (benefits) on cash flow hedging, reclassified out of AOCI into the consolidated income statements were as follows (in thousands):
Year Ended December 31, | |||||||||||||
Reclassified to: | 2015 | 2014 | 2013 | ||||||||||
Interest rate swaps | Derivative interest expense | $ | 3,886 | $ | 6,218 | $ | 3,143 | ||||||
Income tax benefit | Income tax expense | (1,469 | ) | (2,220 | ) | (1,226 | ) | ||||||
Net income | $ | 2,417 | $ | 3,998 | $ | 1,917 | |||||||
Activities related to AOCI, net of tax, are presenting in the consolidated statement of stockholder's equity, and primarily pertain to derivative financial instruments. The tax effects are presented in the consolidated statements of comprehensive income.
Activities related to foreign currency transactions were immaterial for the years ended December 31, 2015, 2014 and 2013.
Common Stock
Holders of Class A common stock are entitled to one vote per share, while holders of Class B common stock are entitled to two votes per share on any matter to be voted on by our stockholders. Holders of Class A and Class B common stock vote together as a single class on all matters submitted to a vote of stockholders, unless otherwise required by law, except that a separate vote of each class would be required for:
• | any merger or consolidation in which holders of shares of Class A common stock receive consideration that is not identical to holders of shares of Class B common stock; |
• | any amendment of Swift Transportation Company’s amended and restated certificate of incorporation or amended and restated bylaws that alters the relative rights of its common stockholders; and |
• | any increase in the authorized number of shares of Class B common stock or the issuance of shares of Class B common stock, other than such increase or issuance required to effect a stock split, stock dividend, or recapitalization pro rata with any increase or issuance of Class A common stock. |
Stock Plans
On March 28, 2014, the Board adopted the 2014 Stock Plan, which replaced the 2007 Stock Plan. The 2014 Stock Plan became effective upon stockholder approval on May 8, 2014, after which date no new awards would be granted under the 2007 Stock Plan. The 2007 Stock Plan continues to govern all awards granted under the 2007 Stock Plan until such awards have been exercised, forfeited, canceled or have otherwise expired or terminated.
The 2014 Stock Plan generally contains the same features, terms and conditions as the 2007 Stock Plan. Additionally, the 2014 Stock Plan did not increase the number of shares of stock available for grant.
The 2014 Stock Plan permits the payment of cash incentive compensation and authorizes the granting of stock options, stock appreciation rights, restricted stock and RSUs, performance shares and performance share units, cash-based awards, and stock-based awards to the Company's employees and non-employee directors for up to 12.0 million shares of Class A common stock. As of December 31, 2015, the aggregate number of shares remaining available under the 2014 Stock Plan was 4.9 million.
90
SWIFT TRANSPORTATION COMPANY
NOTES TO CONSOLIDATED FINANCIAL STATEMENTS — CONTINUED
Stock-based Compensation Expense
Stock-based compensation expense, which is included in "Salaries, wages and employee benefits" in the consolidated income statements is comprised of the following (in thousands):
Year Ended December 31, | |||||||||||
2015 | 2014 | 2013 | |||||||||
Stock options | $ | 1,333 | $ | 3,007 | $ | 3,359 | |||||
Restricted stock shares and RSUs | 3,939 | 1,600 | 887 | ||||||||
Performance shares | 1,253 | 789 | 399 | ||||||||
Total stock-based compensation expense | $ | 6,525 | $ | 5,396 | $ | 4,645 | |||||
Income tax benefit | $ | 2,453 | $ | 1,926 | $ | 1,788 | |||||
During 2010, the Company repriced approximately 4.3 million outstanding options that had exercise prices above the IPO price. These options were repriced down to the IPO price of $11.00 per share and were held by approximately 1,100 employees. This resulted in $5.6 million of incremental equity compensation expense recognized over the remaining service period of the repriced options through August 2013.
The following table presents the total unrecognized stock-based compensation expense and the expected weighted average period over which these expenses will be recognized:
December 31, 2015 | |||||
Expense | Weighted Average Period | ||||
(In thousands) | (In years) | ||||
Stock options | $ | 1,628 | 0.87 | ||
Restricted stock shares and RSUs | $ | 6,742 | 1.05 | ||
Performance shares | $ | 1,650 | 0.83 | ||
Stock Options
Stock options are the contingent right of award holders to purchase shares of Swift Transportation Company Class A common stock at a stated price for a limited time. For options granted prior to the Company's IPO in December 2010, the exercise price of options granted equaled or exceeded the estimated fair value of the common stock on the grant date. The estimated fair value of the common stock prior to the Company’s IPO in each case was determined by management based upon a number of factors, including the Company's discounted projected cash flows, comparative multiples of similar companies, the lack of liquidity of the Company's common stock and certain risks the Company faced at the time of the valuation. Options granted prior to the Company's IPO that had an exercise price that exceeded the IPO price of $11.00 were repriced to the IPO price at the time of the IPO. For options granted after the Company’s IPO, the exercise price of options granted equaled the fair value of the Company’s common stock determined by the closing price of the Company’s Class A common stock quoted on the NYSE on the grant date.
All options have a ten-year contractual term. The options issued prior to the Company's IPO were granted to two categories of employees. The options granted to the first category of employees vest upon the occurrence of the earliest of: (i) a sale or a change in control of the Company or, (ii) a five-year vesting period at a rate of 33 1/3% following the third anniversary date of the grant. The options granted to the second category of employees vest upon the later of (i) the occurrence of an initial public offering of the Company or (ii) a five-year vesting period at a rate of 33 1/3% following the third anniversary date of the grant. To the extent vested, both types of options become exercisable simultaneous with the closing of the earlier of (i) an initial public offering, (ii) a sale, or (iii) a change in control of the Company. The options granted in 2013 and later have a vesting period of three years at a rate of 33 1/3% per year.
91
SWIFT TRANSPORTATION COMPANY
NOTES TO CONSOLIDATED FINANCIAL STATEMENTS — CONTINUED
A summary of the activity related to stock options for the year ended December 31, 2015 was as follows:
Shares Under Option | Weighted Average Exercise Price | Weighted Average Remaining Contractual Term | Aggregate Intrinsic Value (1) | |||||||||
(In years) | (In thousands) | |||||||||||
Outstanding at January 1, 2015 | 3,764,874 | $ | 11.34 | 4.68 | $ | 65,089 | ||||||
Granted | 195,017 | $ | 24.84 | |||||||||
Exercised | (665,531 | ) | $ | 10.45 | ||||||||
Expired | (25,542 | ) | $ | 11.37 | ||||||||
Forfeited | (44,565 | ) | $ | 16.83 | ||||||||
Outstanding at December 31, 2015 | 3,224,253 | $ | 11.01 | 4.04 | $ | 9,051 | ||||||
Aggregate number of stock options expected to vest at a future date as of December 31, 2015 | 429,266 | $ | 13.18 | 8.10 | $ | 275 | ||||||
Exercisable at December 31, 2015 | 2,720,513 | $ | 10.63 | 3.30 | $ | 8,691 | ||||||
____________
(1) | The aggregate intrinsic value was computed using the closing share price on December 31, 2015 of $13.82 and on December 31, 2014 of $28.63, as applicable. |
The fair value of each stock option grant is estimated on the grant date using the Black-Scholes-Merton option-pricing model, which uses a number of assumptions to determine the fair value of the options on the grant date. The following table presents the weighted average assumptions used to determine the fair value of stock options issued:
Year Ended December 31, | |||||
2015 | 2014 | 2013 | |||
Dividend yield | —% | —% | —% | ||
Risk-free rate of return | 1.41% | 1.28% | 1.04% | ||
Expected volatility | 37.22% | 40.00% | 40.80% | ||
Expected term (in years) | 5.8 | 5.8 | 5.8 | ||
Weighted average fair value of stock options granted | $6.96 | $6.79 | $5.90 | ||
The dividend yield assumption is based on anticipated dividend payouts. The risk-free interest rate assumption is based on the United States Treasury yield curve at the grant date with maturity dates approximately equal to the expected life at the grant date. The Company estimates the expected volatility and expected option life assumption consistent with ASC Topic 718, Compensation – Stock Compensation. Expected volatility is based upon an analysis of historical prices of similar market capitalized trucking group participants within the Dow Jones Total United States Market Index over the expected term of the options. The Company chose a daily measurement interval for historical volatility as it believes this better depicts the nature of employee option exercise decisions being based on shorter-term trends in the price of the underlying shares, rather than on monthly price movements. As a result of the inability to predict the expected future employee exercise behavior, the Company estimated the expected term of the options using a simplified method based on contractual and vesting terms of the options. The Company uses historical data to estimate pre-vesting option forfeitures and records stock-based compensation expense only for those awards that are expected to vest.
The following table summarizes stock option exercise information for the years presented (in thousands, except share data):
Year Ended December 31, | |||||||||||
2015 | 2014 | 2013 | |||||||||
Number of stock options exercised | 665,531 | 1,100,998 | 1,210,184 | ||||||||
Intrinsic value of stock options exercised | $ | 9,695 | $ | 15,830 | $ | 8,773 | |||||
Cash received upon exercise of stock options | $ | 6,953 | $ | 11,488 | $ | 12,985 | |||||
Income tax benefit | $ | 2,147 | $ | 3,730 | $ | 187 | |||||
92
SWIFT TRANSPORTATION COMPANY
NOTES TO CONSOLIDATED FINANCIAL STATEMENTS — CONTINUED
The following table is a rollforward of the Company's nonvested stock options:
Stock Options | ||||||
Shares | Weighted Average Fair Value | |||||
Nonvested at January 1, 2015 | 988,338 | $ | 4.02 | |||
Granted | 195,017 | $ | 6.96 | |||
Vested | (635,050 | ) | $ | 5.02 | ||
Forfeited | (44,565 | ) | $ | 6.77 | ||
Nonvested at December 31, 2015 | 503,740 | $ | 6.92 | |||
The total fair value of the shares vested during the years ended December 31, 2015, 2014 and 2013 was $3.2 million, $3.2 million and $4.0 million, respectively.
Restricted Stock Awards
Restricted stock awards are shares of Swift's Class A common stock that are subject to forfeiture until the lapse of defined restrictions, including time-based restrictions. Restricted stock awards, which are granted in the form of restricted stock shares and RSUs, are accounted for as equity awards. Accordingly, the estimated fair value of restricted stock awards is based upon the closing price of the Company’s Class A common stock on the grant date.
Restricted Stock Share — This is typically the form of restricted stock award granted to the Board. Directors on the board are entitled to vote during the vesting period. For awards granted in 2014 and thereafter, the forfeiture restrictions associated with restricted stock shares lapse on the first anniversary of the grant date with respect to an equal installment of shares. For awards granted prior to 2014, the forfeiture restrictions associated with restricted stock shares lapse on each of the first three anniversaries of the grant date with respect to an equal installment of shares. Additionally, restricted stock shares are not transferable for a period of four years from the grant date, other than for applicable tax withholdings.
RSU — This is typically the form of restricted stock award granted to Company employees. An RSU represents a right to receive a common share of stock when the unit vests. RSU recipients cannot vote during the vesting period. Employees forfeit their units if their employment terminates before the vesting date.
The following table presents grants of restricted stock awards and the respective plans under which they were granted:
Year Ended December 31, | ||||||||
2015 | 2014 | 2013 | ||||||
(2014 Stock Plan) | (2007 Stock Plan) | |||||||
Restricted stock shares granted to the Board | 16,601 | 17,102 | 10,480 | |||||
RSUs granted to company employees | 212,272 | 203,968 | 254,533 | |||||
Total restricted stock awards granted | 228,873 | 221,070 | 265,013 | |||||
The following table is a rollforward of nonvested restricted stock awards:
Restricted Stock Awards | ||||||
Number of Awards | Weighted Average Fair Value | |||||
Nonvested at January 1, 2015 | 374,309 | $ | 19.95 | |||
Granted | 228,873 | $ | 24.43 | |||
Vested (1) | (158,304 | ) | $ | 19.44 | ||
Forfeited | (26,597 | ) | $ | 21.69 | ||
Nonvested at December 31, 2015 (2) | 418,281 | $ | 22.54 | |||
____________
(1) | Includes 19,024 shares of restricted stock previously issued to Board members, but that vested during 2015. |
(2) | Includes 19,221 shares of restricted stock previously issued to Board members, but not yet vested as of December 31, 2015. |
93
SWIFT TRANSPORTATION COMPANY
NOTES TO CONSOLIDATED FINANCIAL STATEMENTS — CONTINUED
Performance Shares
Beginning in 2013, the Company granted certain members of executive management performance shares. These awards provide each grantee a number of shares of Swift's Class A common stock at the end of a three-year period, based on certain performance criteria established by the compensation committee of the Board. The performance criteria are designed to focus management's attention on the Company's key long-term financial goals, and are measured over the three-year period.
The following table is a rollforward of nonvested performance shares:
Performance Shares | ||||||
Shares | Weighted Average Fair Value | |||||
Nonvested at January 1, 2015 | 165,940 | $ | 17.23 | |||
Granted | 58,960 | $ | 23.86 | |||
Vested (1) | — | $ | — | |||
Forfeited | (9,567 | ) | $ | 18.40 | ||
Nonvested at December 31, 2015 | 215,333 | $ | 18.99 | |||
____________
(1) | The performance period for the performance share awards granted in February 2013 ended on December 31, 2015. The Board will approve the final vesting of these awards subsequent to December 31, 2015, based on the results of the three-year performance period. |
2012 Employee Stock Purchase Plan
In 2012, the Company’s Board adopted and its stockholders approved the Swift Transportation Company 2012 ESPP. The 2012 ESPP is intended to qualify under Section 423 of the Internal Revenue Code and is considered noncompensatory. Pursuant to the 2012 ESPP, the Company is authorized to issue up to 2.0 million shares of its Class A common stock to eligible employees who participate in the plan. Employees are eligible to participate in the 2012 ESPP following at least 90 days of employment with the Company or any of its participating subsidiaries. Under the terms of the 2012 ESPP, eligible employees may elect to purchase common stock through payroll deductions, not to exceed 15% of their gross cash compensation. The purchase price of the common stock is 95% of the common stock’s fair market value quoted on the NYSE on the last trading day of each offering period. There are four three-month offering periods corresponding to the calendar quarters. Each eligible employee is restricted to purchasing a maximum of $6,250 of common stock during an offering period, determined by the fair market value of the common stock as of the first day of the offering period, and $25,000 of common stock during a calendar year. Employees who own 5% or more of the total voting power or value of all classes of common stock are restricted from participating in the 2012 ESPP.
During the year ended December 31, 2015, the Company issued 59,556 shares, under the 2012 ESPP at an average price per share of $20.38. As of December 31, 2015, the Company is authorized to issue an additional 1.8 million shares under the 2012 ESPP.
Related Party Common Stock Transactions
Amended M Capital II VPF and Cactus VPF — On October 30, 2015, M Capital II and another Moyes Affiliate, Cactus Holding I, entered into the Amended M Capital II VPF and the Cactus VPF, respectively. The purposes of these two VPF contracts were to (i) extend the maturity date of M Capital II’s then-existing VPF with Citibank N.A. entered into on October 29, 2013 and maturing on November 4, 2015 through November 6, 2015 and (ii) generate cash proceeds for the repayment of certain stock-secured obligations of Cactus Holding II, a Moyes Affiliate, and thereby effect the release of certain shares of Class B Common Stock pledged in connection with the same.
Cactus Holding I entered into the Cactus VPF contract in respect of 3.3 million shares of the Company's Class B Common Stock, which were pledged by Cactus Holding I as security for its obligations under the Cactus VPF contract. Under the Cactus VPF contract, Cactus Holding I is required to deliver to Citigroup Global Markets Inc. ("CGMI") a variable amount of stock or cash during a three trading day period at the maturity of the contract on November 21, 2016 through November 24, 2016. In connection with the Cactus VPF contract, Cactus Holding I received $48.3 million from CGMI.
In connection with the Amended M Capital II VPF, M Capital II paid Citibank N.A $18.5 million. The source of these funds was a cash payment from CGMI in connection with the Cactus VPF Contract. Under the Amended M Capital II VPF contract, M Capital II is required to deliver to Citibank N.A. a variable amount of stock or cash during a three trading day period at the maturity of the contract on November 21, 2016 through November 24, 2016. The number of shares of the Company's Class B Common Stock subject to the Amended M Capital VPF remains unchanged at 13.7 million.
94
SWIFT TRANSPORTATION COMPANY
NOTES TO CONSOLIDATED FINANCIAL STATEMENTS — CONTINUED
The Amended M Capital II VPF and the Cactus VPF contracts allow Mr. Moyes and the Moyes Affiliates to retain the same number of shares and voting percentage as they had prior to these VPF contracts. In addition, Mr. Moyes and the Moyes Affiliates are able to participate in any price appreciation of the Company’s common stock. The Amended M Capital II VPF Contract generally permits M Capital II to participate in any price appreciation in the Company’s common stock between $22.00 and $26.40 per share. Under the then-existing VPF, M Capital II was generally permitted to participate in any price appreciation in the Company's common stock between $22.54 and $34.00 per share. The Cactus VPF Contract generally permits Cactus Holding I to participate in any price appreciation in the Company's common stock between $22.00 and $26.40 per share.
In connection with the Amended M Capital II VPF transaction, 26.0 million shares of Class B Common Stock are collateralized by Citibank, N.A. to secure M Capital II’s obligations under the VPF Contract.
Cactus II Pledging — In July 2011 and December 2011, Cactus Holding Company II, LLC ("Cactus II"), an entity controlled by Mr. Moyes, pledged 12.0 million shares of Class B common stock on margin as collateral for personal loan arrangements entered into by Cactus II and relating to Mr. Moyes. In connection with these December 2011 transactions, Cactus II converted 6.6 million of the 12.0 million pledged shares of Class B common stock into shares of Class A common stock on a one-for-one basis. During 2012, the Moyes Affiliates converted an additional 1.1 million shares of Class B common stock to Class A common stock and sold 4.8 million of these pledged Class A shares to a counter-party pursuant to a sale and repurchase agreement with a full recourse obligation to repurchase the securities at the same price on the fourth anniversary of sale. As of December 31, 2015, the Moyes Affiliates had pledged on margin 9.1 million shares.
During 2014 and 2013, the Moyes Affiliates converted shares of common stock on a one-for-one basis as follows:
Transaction Date | Converted from Class B | Converted to Class A | ||||
May 30, 2014 | (1,450,000 | ) | 1,450,000 | |||
December 31, 2013 | (53,298 | ) | 53,298 | |||
There were no shares converted in 2015.
Central's Stockholder Loans Receivable, Pre-acquisition
Upon closing of the Central Acquisition on August 6, 2013, Central's majority stockholder repaid $30.0 million on an unsecured promissory note to Central that was originally loaned on March 8, 2013.
On September 25, 2015, the Company announced that the Board authorized a $100.0 million repurchase of the Company's outstanding Class A common stock. In November 2015, the Company repurchased and canceled 4.2 million shares of its outstanding Class A common stock for $70.0 million. The excess of the purchase price over par value was allocated $43.4 million to "Additional paid-in capital" and $26.6 million to "Accumulated deficit" in the consolidated balance sheet. As of December 31, 2015, $30.0 million remained available under the repurchase agreement. In January 2016, the Company repurchased $30.0 million of its outstanding Class A common stock, thus completing the share repurchase program. There were no share repurchase transactions in 2014 or 2013.
On February 22, 2016, the Company announced that the Board authorized up to an additional $150.0 million repurchase of the Company’s outstanding Class A common stock, subject to free cash flow availability after fleet reinvestment and certain debt reduction targets.
95
SWIFT TRANSPORTATION COMPANY
NOTES TO CONSOLIDATED FINANCIAL STATEMENTS — CONTINUED
Basic and diluted earnings per share, as presented in the consolidated income statements, are calculated by dividing net income by the respective weighted average common shares outstanding during the period.
The following table reconciles basic weighted average shares outstanding to diluted weighted average shares outstanding (in thousands):
December 31, | ||||||||
2015 | 2014 | 2013 | ||||||
Basic weighted average common shares outstanding | 142,018 | 141,431 | 140,179 | |||||
Dilutive effect of stock options | 1,650 | 2,044 | 2,042 | |||||
Diluted weighted average common shares outstanding | 143,668 | 143,475 | 142,221 | |||||
Anti-dilutive shares excluded from diluted earnings per share (1) | 354 | 162 | 174 | |||||
____________
(1) | Shares were excluded from the dilutive-effect calculation because the outstanding options' exercise prices were greater than the average market price of the Company's common shares during the period. |
The following table presents the Company's income tax expense (benefit) (in thousands):
Year Ended December 31, | |||||||||||
2015 | 2014 | 2013 | |||||||||
Current expense (benefit): | |||||||||||
Federal | $ | 76,737 | $ | 81,117 | $ | (224 | ) | ||||
State | 8,826 | 8,861 | 5,143 | ||||||||
Foreign | 8,783 | 4,107 | 1,530 | ||||||||
94,346 | 94,085 | 6,449 | |||||||||
Deferred expense (benefit): | |||||||||||
Federal | 24,097 | (4,189 | ) | 85,512 | |||||||
State | 3,419 | 1,975 | 4,273 | ||||||||
Foreign | (2,653 | ) | (2,397 | ) | 4,748 | ||||||
$ | 24,863 | (4,611 | ) | 94,533 | |||||||
Income tax expense | $ | 119,209 | $ | 89,474 | $ | 100,982 | |||||
Rate Reconciliation — The Company’s effective tax rate was 37.6%, 35.7% and 39.4%, for the years ended December 31, 2015, 2014 and 2013, respectively. Expected tax expense is computed by applying the United States federal corporate income tax rate of 35.0% to earnings before income taxes. Actual tax expense differs from expected tax expense as follows (in thousands):
Year Ended December 31, | |||||||||||
2015 | 2014 | 2013 | |||||||||
Computed "expected" tax expense | $ | 110,875 | $ | 87,719 | $ | 89,742 | |||||
Increase (decrease) in income taxes resulting from: | |||||||||||
State income taxes, net of federal income tax benefit | 8,745 | 6,866 | 6,912 | ||||||||
Central pre-affiliation earnings taxed as S-Corp | — | — | (4,986 | ) | |||||||
Foreign tax rate change in deferred items | — | — | 5,023 | ||||||||
Other | (411 | ) | (5,111 | ) | 4,291 | ||||||
Income tax expense | $ | 119,209 | $ | 89,474 | $ | 100,982 | |||||
96
SWIFT TRANSPORTATION COMPANY
NOTES TO CONSOLIDATED FINANCIAL STATEMENTS — CONTINUED
Deferred Income Taxes — As discussed in Note 3, the Company early-adopted ASU 2015-17. Accordingly, net deferred income taxes at December 31, 2015 are classified as noncurrent and the December 31, 2014 presentation was retrospectively adjusted to conform to this presentation. The components of the net deferred tax asset (liability) included in "Deferred income taxes" in the consolidated balance sheets were (in thousands):
December 31, | |||||||
2015 | 2014 | ||||||
Deferred tax assets: | |||||||
Self-insurance accruals | $ | 66,949 | $ | 61,305 | |||
Allowance for doubtful accounts | 11,448 | 9,561 | |||||
Amortization of stock options | 8,923 | 9,598 | |||||
Other | 18,352 | 25,239 | |||||
Total deferred tax assets, net | 105,672 | 105,703 | |||||
Deferred tax liabilities: | |||||||
Property and equipment, principally due to differences in depreciation | (434,802 | ) | (401,963 | ) | |||
Prepaid taxes, licenses and permits deducted for tax purposes | (14,083 | ) | (13,170 | ) | |||
Cancellation of debt | (5,622 | ) | (7,503 | ) | |||
Intangible assets | (110,546 | ) | (115,115 | ) | |||
Other | (4,451 | ) | (5,341 | ) | |||
Total deferred tax liabilities | (569,504 | ) | (543,092 | ) | |||
Net deferred tax liability | $ | (463,832 | ) | $ | (437,389 | ) | |
Valuation Allowance — As of December 31, 2015, the Company had federal and state net operating loss carryforwards remaining, with estimated tax effects of $0.4 million and $0.6 million, respectively. The federal and state net operating losses will expire at various times between 2016 and 2030. The Company has not established a valuation allowance as it has been determined that, based upon available evidence, a valuation allowance is not required. Management asserts that it is more likely than not that the results of future operations will generate sufficient taxable income to realize the deferred tax assets. All other deferred tax assets are expected to be realized and utilized by continued profitability in future periods.
Cumulative Undistributed Foreign Earnings — United States income and foreign withholding taxes have not been provided on approximately $25.3 million of cumulative undistributed earnings of foreign subsidiaries. The earnings are considered to be permanently reinvested outside the United States. As such, the Company is not required to provide United States income taxes on these earnings until they are repatriated in the form of dividends or otherwise.
Unrecognized Tax Benefits — The Company's unrecognized tax benefits as of December 31, 2015 would favorably impact our effective tax rate if subsequently recognized. The following is a rollforward of our unrecognized tax benefits (in thousands):
Year Ended December 31, | |||||||||||
2015 | 2014 | 2013 | |||||||||
Unrecognized tax benefits at beginning of year | $ | 1,739 | $ | 2,385 | $ | 2,385 | |||||
Increases for tax positions taken prior to beginning of year | — | 95 | — | ||||||||
Decreases for tax positions taken prior to beginning of year | — | (741 | ) | — | |||||||
Unrecognized tax benefits at end of year | $ | 1,739 | $ | 1,739 | $ | 2,385 | |||||
The Company does not anticipate a decrease of unrecognized tax benefits during the next twelve months.
Tax Examinations — During the year ended December 31, 2014, the Company concluded its California examination, as well as various other state examinations for certain of its subsidiaries. The conclusion of these examinations resulted in $0.8 million of additional tax payments and $0.4 million of interest and penalties during 2014. Additional tax payments, as well as interest and penalties related to various state and federal tax examinations concluded during the years ended December 31, 2015 and 2013 were immaterial. Other state jurisdictions are currently conducting examinations for years ranging from 2011 to 2013. At the completion of these examinations, management does not expect any adjustments that would have a material impact on the Company’s effective tax rate. Years subsequent to 2011 remain subject to examination.
97
SWIFT TRANSPORTATION COMPANY
NOTES TO CONSOLIDATED FINANCIAL STATEMENTS — CONTINUED
Interest and Penalties — The Company recognizes potential accrued interest and penalties related to unrecognized tax benefits as a component of income tax expense. Accrued interest and penalties as of December 31, 2015, 2014 and 2013, were approximately $1.4 million, $1.3 million and $1.5 million, respectively. To the extent interest and penalties are not assessed with respect to uncertain tax positions, amounts accrued will be reduced and reflected as a reduction of the overall income tax provision.
Regulatory Developments — In December 2014, United States President, Barack Obama, signed the TIPA Act. Among other things, TIPA extended 50% bonus depreciation and the WOTC. During the first three quarters of 2014, the Company did not include 50% bonus depreciation or WOTC in its income tax provision, as these items were not allowed under the previous tax code. Income tax calculations performed for the year ended December 31, 2014 included the full year's adjustment for 50% bonus depreciation and WOTC, as TIPA allowed for retrospective inclusion.
In December 2015, President Obama signed the PATH Act of 2015. Among other things, PATH extended 50% bonus depreciation and WOTC. During the first three quarters of 2015, the Company did not include 50% bonus depreciation or WOTC in its income tax provision, as these items were not allowed under the previous tax regime. Income tax calculations performed for the year ended December 31, 2015 include the full year's adjustment for 50% bonus depreciation and WOTC, as PATH allowed for retrospective inclusion.
The Company maintains a 401(k) benefit plan available to all employees who are 21 years of age or older and have completed six months of service. Under the plan, the Company has the option to match employee discretionary contributions up to 3% of an employee’s compensation. Employees’ rights to employer contributions vest after five years from their date of employment.
For the years ended December 31, 2015, 2014 and 2013, the Company’s employee benefits expense for matching contributions, included in "Salaries, wages and employee benefits" in the consolidated income statements, was approximately $5.6 million, $4.7 million and $5.5 million, respectively. As of December 31, 2015 and 2014, the Company owed $5.9 million and $4.9 million in matching contributions, respectively, to the plan in respect of such matching contributions. The accrued balance is included in "Accrued liabilities" in the consolidated balance sheets.
Services provided to the Company’s largest customer, Wal-Mart, generated 12%, 11% and 11% of operating revenue in 2015, 2014 and 2013, respectively. Operating revenue generated by Wal-Mart is reported in the Truckload, Dedicated, Swift Refrigerated and Intermodal operating segments. No other customer accounted for 10% or more of operating revenue in the reporting period.
98
SWIFT TRANSPORTATION COMPANY
NOTES TO CONSOLIDATED FINANCIAL STATEMENTS — CONTINUED
The following table presents Swift's transactions with companies controlled by and/or affiliated with its related parties (in thousands):
Year Ended December 31, | |||||||||||||||||||||||
2015 | 2014 | 2013 | |||||||||||||||||||||
Provided by Swift | Received by Swift | Provided by Swift | Received by Swift | Provided by Swift | Received by Swift | ||||||||||||||||||
Freight Services: | |||||||||||||||||||||||
Thermo King (1) | $ | 4 | $ | — | $ | — | $ | — | $ | — | $ | — | |||||||||||
Central Freight Lines (2) | 237 | 25 | 25 | 24 | 15 | 47 | |||||||||||||||||
SME Industries (2) | 978 | — | 185 | — | 99 | — | |||||||||||||||||
Other Affiliates (2) | — | — | 14 | — | 61 | — | |||||||||||||||||
Total | $ | 1,219 | $ | 25 | $ | 224 | $ | 24 | $ | 175 | $ | 47 | |||||||||||
Facility and Equipment Leases: | |||||||||||||||||||||||
Thermo King (1) | $ | 12 | $ | — | $ | — | $ | — | $ | — | $ | — | |||||||||||
Central Freight Lines (2) | 1,090 | 435 | 843 | 400 | 716 | 399 | |||||||||||||||||
Other Affiliates (2) | 20 | 1 | 20 | 228 | 20 | 200 | |||||||||||||||||
Total | $ | 1,122 | $ | 436 | $ | 863 | $ | 628 | $ | 736 | $ | 599 | |||||||||||
Other Services: | |||||||||||||||||||||||
Thermo King (1) | $ | 1 | $ | 518 | $ | — | $ | 184 | $ | — | $ | — | |||||||||||
Central Freight Lines (2) | 142 | — | 388 | — | 1,000 | — | |||||||||||||||||
Swift Aircraft Management (2) | — | 636 | — | 699 | — | 876 | |||||||||||||||||
Other Affiliates (2) | 1 | 139 | 4 | 73 | 159 | 132 | |||||||||||||||||
Total | $ | 144 | $ | 1,293 | $ | 392 | $ | 956 | $ | 1,159 | $ | 1,008 | |||||||||||
____________
(1) | Thermo King West, Inc. and Thermo King Chesapeake, Inc. are owned by William Riley III, a member of Swift's Board. Transactions associated with the Thermo King affiliated entities primarily consist of parts and equipment purchases by Swift. Swift also provided freight services, equipment leasing and other services to the Thermo King affiliated entities. |
(2) | Transactions with Central Freight Lines ("Central Freight") and other companies controlled by and/or affiliated with Jerry Moyes, Swift's CEO and majority shareholder, include freight services, facility leases, equipment leases, and other services. |
• | Freight Services Provided by Swift — The rates the Company charges for freight services to each of these companies for transportation services are market rates, which are comparable to rates charged to third-party customers. These transportation services provided to affiliates provide the Company with an additional source of operating revenue at its normal freight rates. |
• | Freight Services Received by Swift — Transportation services received from Central Freight represent LTL freight services rendered to haul parts and equipment to Company shop locations. The rates paid to Central Freight for these loads are comparable to market rates charged by other unaffiliated LTL carriers. |
• | Other Services Provided by Swift — Other services provided by the Company to the identified related parties include equipment sales and miscellaneous services. |
• | Other Services Received by Swift — Executive air transport, fuel storage, event fees, equipment purchases, miscellaneous repair services, and certain third-party payroll and employee benefits administration services from the identified related parties are included in other services received by the Company. |
In 2015, the Company purchased bulk diesel fuel totaling $63 thousand from Common Market Trading LLC, which is also included in other services received by Swift from other affiliates. Common Market Trading LLC was initially owned by both Jerry Moyes and his brother, Ronald Moyes, but wholly owned by Ronald Moyes as of October 20, 2015.
99
SWIFT TRANSPORTATION COMPANY
NOTES TO CONSOLIDATED FINANCIAL STATEMENTS — CONTINUED
Receivables and Payables pertaining to these related party transactions were (in thousands):
As of December 31, | |||||||||||||||
2015 | 2014 | ||||||||||||||
Receivable | Payable | Receivable | Payable | ||||||||||||
Central Freight Lines | $ | 3 | $ | 3 | $ | 93 | $ | 1 | |||||||
Thermo King | 4 | 46 | — | 23 | |||||||||||
Other Affiliates | 84 | 29 | 23 | — | |||||||||||
Total | $ | 91 | $ | 78 | $ | 116 | $ | 24 | |||||||
ASC Topic 820, Fair Value Measurements and Disclosures, requires that the Company disclose estimated fair values for its financial instruments. The estimated fair value of a financial instrument is the amount that would be received to sell an asset or paid to transfer a liability in an orderly transaction between market participants at the measurement date in the principal or most advantageous market for the asset or liability. Fair value estimates are made at a specific point in time and are based on relevant market information and information about the financial instrument. These estimates do not reflect any premium or discount that could result from offering for sale at one time the Company’s entire holdings of a particular financial instrument. Changes in assumptions could significantly affect these estimates. Because the fair value is estimated as of December 31, 2015 and 2014, the amounts that will actually be realized or paid at settlement or maturity of the instruments in the future could be significantly different.
The tables below exclude certain financial instruments. The excluded financial instruments are as follows: cash and cash equivalents, restricted cash, net accounts receivable, income tax refund receivable and accounts payable. The estimated fair value of these financial instruments approximate carrying value as they are short-term in nature. Additionally, for notes payable under revolving lines of credit, fair value approximates the carrying value due to the variable interest rate. For capital leases, the carrying value approximates the fair value. The table below also excludes financial instruments reported at estimated fair value on a recurring basis. See "Recurring Fair Value Measurements." All remaining balance sheet amounts excluded from the table below are not considered financial instruments subject to this disclosure.
The following table presents the carrying amounts and estimated fair values of the Company’s financial instruments (in thousands):
As of December 31, | |||||||||||||||
2015 | 2014 | ||||||||||||||
Carrying Value | Estimated Fair Value | Carrying Value | Estimated Fair Value | ||||||||||||
Financial Assets: | |||||||||||||||
Restricted investments (1) | $ | 23,215 | $ | 23,190 | $ | 24,510 | $ | 24,502 | |||||||
Financial Liabilities: | |||||||||||||||
2015 Agreement: New Term Loan A, due July 2020 (2) | 669,750 | 669,750 | — | — | |||||||||||
2014 Agreement: Old Term Loan A, due June 2019 (2) | — | — | 500,000 | 500,000 | |||||||||||
2014 Agreement: Term Loan B, due June 2021, net of $920 OID (2) | — | — | 396,080 | 390,436 | |||||||||||
Accounts receivable securitization | 225,000 | 225,000 | 334,000 | 334,000 | |||||||||||
Revolving line of credit (3) | 200,000 | 200,000 | 57,000 | 57,000 | |||||||||||
____________
The carrying amounts of the final instruments shown in the table are included in the consolidated balance sheets, as follows:
(1) | Restricted investments are included in "Restricted investments, held to maturity, amortized cost." |
(2) | The New Term Loan A, Old Term Loan A and Term Loan B are included in "Current portion of long-term debt" and "Long-term debt, less current portion." |
(3) | The New Revolver (due July 2020) and Old Revolver (due June 2019) are included in "Revolving line of credit." |
The estimated fair values of the financial instruments shown in the above table as of December 31, 2015 and 2014, represent management’s best estimates of the amounts that would be received to sell those assets or that would be paid to transfer those liabilities in an orderly transaction between market participants at that date. The estimated fair value measurements maximize the use of observable inputs. However, in situations where there is little, if any, market activity for the asset or liability at the measurement
100
SWIFT TRANSPORTATION COMPANY
NOTES TO CONSOLIDATED FINANCIAL STATEMENTS — CONTINUED
date, the estimated fair value measurement reflects the Company’s own judgments about the assumptions that market participants would use in pricing the asset or liability. These judgments are developed by the Company based on the best information available under the circumstances.
The following summary presents a description of the methods and assumptions used to estimate the fair value of each class of financial instrument.
Restricted Investments — The estimated fair value of the Company’s restricted investments is based on quoted prices in active markets that are readily and regularly obtainable.
Term Loans — The estimated fair value of the Term Loan B was determined by bid prices in trades between qualified institutional buyers.
Securitization of Accounts Receivable — The Company’s securitization of accounts receivable consists of borrowings outstanding pursuant to the Company’s 2015 RSA and 2013 RSA as of December 31, 2015 and 2014, respectively, as discussed in Note 11. Its fair value is estimated by discounting future cash flows using a discount rate commensurate with the uncertainty involved.
Derivative Financial Instruments — As of December 31, 2014, interest rate swaps represent the only major category of assets or liabilities included in the consolidated balance sheets that are measured by estimating fair value on a recurring basis. The fair values of the interest rate swaps was based on valuations provided by third parties, derivative pricing models, and credit spreads derived from the trading levels of the Company’s first lien term loan as of December 31, 2014. The Company’s interest rate swaps were not actively traded, but are valued using valuation models and credit valuation adjustments, both of which used significant inputs that were observable in active markets over the terms of the instruments the Company held, and accordingly, the Company classified these valuation techniques as Level 2 in the hierarchy. Interest rate yield curves and credit spreads derived from trading levels of the Company’s first lien term loan were the significant inputs into these valuation models. These inputs were observable in active markets over the terms of the instruments the Company held. The Company considered the effect of its own credit standing and that of its counterparties in the valuations of its derivative financial instruments.
Fair Value Hierarchy — ASC Topic 820 establishes a framework for measuring fair value in accordance with US-GAAP and expands financial statement disclosure requirements for fair value measurements. ASC Topic 820 further specifies a hierarchy of valuation techniques, which is based on whether the inputs into the valuation technique are observable or unobservable. The hierarchy is as follows:
• | Level 1 — Valuation techniques in which all significant inputs are quoted prices from active markets for assets or liabilities that are identical to the assets or liabilities being measured. |
• | Level 2 — Valuation techniques in which significant inputs include quoted prices from active markets for assets or liabilities that are similar to the assets or liabilities being measured and/or quoted prices from markets that are not active for assets or liabilities that are identical or similar to the assets or liabilities being measured. Also, model-derived valuations in which all significant inputs and significant value drivers are observable in active markets are Level 2 valuation techniques. |
• | Level 3 — Valuation techniques in which one or more significant inputs or significant value drivers are unobservable. Unobservable inputs are valuation technique inputs that reflect the Company’s own assumptions about the assumptions that market participants would use in pricing an asset or liability. |
When available, the Company uses quoted market prices to determine the estimated fair value of an asset or liability. If quoted market prices are not available, the Company measures fair value using valuation techniques that use, when possible, current market-based or independently-sourced market parameters, such as interest rates and currency rates. The level in the fair value hierarchy within which a fair value measurement in its entirety falls is based on the lowest level input that is significant to the estimated fair value measurement in its entirety.
101
SWIFT TRANSPORTATION COMPANY
NOTES TO CONSOLIDATED FINANCIAL STATEMENTS — CONTINUED
Recurring Fair Value Measurements — As of December 31, 2015 and 2014, no assets of the Company were measured at estimated fair value on a recurring basis. As of December 31, 2015, no liabilities of the Company were measured at estimated fair value on a recurring basis.
The following table presents information about inputs into the estimated fair value measurements of each major category of the Company’s liabilities that were measured at estimated fair value on a recurring basis in periods subsequent to their initial recognition as of December 31, 2014 (in thousands):
Fair Value Measurements at Reporting Date Using | |||||||||||||||
Estimated Fair Value | Level 1 Inputs | Level 2 Inputs | Level 3 Inputs | ||||||||||||
As of December 31, 2014 | |||||||||||||||
Interest rate swaps | $ | 6,109 | $ | — | $ | 6,109 | $ | — | |||||||
Nonrecurring Fair Value Measurements — As of December 31, 2015 and 2014, none of the Company's liabilities were measured at estimated fair value on a nonrecurring basis. The following table presents assets measured at estimated fair value on a nonrecurring basis, (in thousands):
Fair Value Measurements at Reporting Date Using | |||||||||||||||||||
Estimated Fair Value | Level 1 Inputs | Level 2 Inputs | Level 3 Inputs | Total Losses | |||||||||||||||
As of December 31, 2015 | |||||||||||||||||||
Note receivable | $ | — | $ | — | $ | — | $ | — | $ | (1,480 | ) | ||||||||
As of December 31, 2014 | |||||||||||||||||||
Other assets | $ | — | $ | — | $ | — | $ | — | $ | (2,308 | ) | ||||||||
In September 2013, the Company agreed to advance up to $2.3 million, pursuant to an unsecured promissory note, to an independent fleet contractor that transported freight on Swift's behalf. In March 2015, management became aware that the independent contractor violated various covenants outlined in the unsecured promissory note, which created an event of default that made the principal and accrued interest immediately due and payable. As a result of this event of default, as well as an overall decline in the independent contractor's financial condition, management re-evaluated the fair value of the unsecured promissory note. At March 31, 2015, management determined that the remaining balance due from the independent contractor to the Company was not collectible, which resulted in a $1.5 million pre-tax adjustment that was recorded in "Non-cash impairments of non-operating assets" in the Company's consolidated income statements.
Fair value of assets measured on a nonrecurring basis as of December 31, 2014 represents certain operations software that was replaced, and for which the carrying value was determined to be fully impaired during the three months ended September 30, 2014.
Segment Information
During 2015, we operated four reportable segments: Truckload, Dedicated, Swift Refrigerated (formerly Central Refrigerated) and Intermodal.
Truckload — The truckload segment consists of one-way movements over irregular routes throughout the United States, Mexico, and Canada. This service utilizes both company and owner-operator tractors with dry van, flatbed, and other specialized trailing equipment.
Dedicated — Through the dedicated segment, the Company devotes use of equipment to specific customers and offers tailored solutions under long-term contracts. This dedicated segment utilizes refrigerated, dry van, flatbed and other specialized trailing equipment.
Swift Refrigerated — This segment primarily consists of shipments for customers that require temperature-controlled trailers. These shipments include one-way movements over irregular routes, as well as dedicated truck operations.
Intermodal — The intermodal segment includes revenue generated by moving freight over the rail in the Company's containers and other trailing equipment, combined with revenue for drayage to transport loads between the railheads and customer locations.
102
SWIFT TRANSPORTATION COMPANY
NOTES TO CONSOLIDATED FINANCIAL STATEMENTS — CONTINUED
Non-reportable Segment — The other non-reportable segment includes the Company's logistics and freight brokerage services, as well as support services provided by its subsidiaries to customers and owner-operators, including repair and maintenance shop services, equipment leasing, and insurance. Intangible asset amortization related to the 2007 Transactions is also included in this other non-reportable segment.
Intersegment Eliminations — Certain operating segments provide transportation and related services for other affiliates outside their reportable segment. Revenues for such services are based on negotiated rates, which we believe approximate fair value, and are reflected as revenues of the billing segment. These rates are adjusted from time to time based on market conditions. Such intersegment revenues and expenses are eliminated in our consolidated results.
Set forth in the tables below is certain financial information with respect to the Company’s reportable segments (in thousands):
Operating Revenues | |||||||||||
Year Ended December 31, | |||||||||||
2015 | 2014 | 2013 | |||||||||
Truckload | $ | 2,204,114 | $ | 2,301,010 | $ | 2,313,035 | |||||
Dedicated | 927,657 | 892,078 | 738,929 | ||||||||
Swift Refrigerated | 380,251 | 417,980 | 452,531 | ||||||||
Intermodal | 390,572 | 401,577 | 376,075 | ||||||||
Subtotal | 3,902,594 | 4,012,645 | 3,880,570 | ||||||||
Non-reportable segment | 407,781 | 342,969 | 287,853 | ||||||||
Intersegment eliminations | (81,053 | ) | (56,890 | ) | (50,228 | ) | |||||
Consolidated operating revenue | $ | 4,229,322 | $ | 4,298,724 | $ | 4,118,195 | |||||
Operating Income | |||||||||||
Year Ended December 31, | |||||||||||
2015 | 2014 | 2013 | |||||||||
Truckload | $ | 257,007 | $ | 258,072 | $ | 225,963 | |||||
Dedicated | 82,735 | 75,794 | 83,520 | ||||||||
Swift Refrigerated | 17,080 | 14,035 | 17,682 | ||||||||
Intermodal | 4,128 | 8,298 | 5,619 | ||||||||
Subtotal | 360,950 | 356,199 | 332,784 | ||||||||
Non-reportable segment | 9,154 | 13,871 | 24,175 | ||||||||
Consolidated operating income | $ | 370,104 | $ | 370,070 | $ | 356,959 | |||||
Depreciation and Amortization of Property and Equipment | |||||||||||
Year Ended December 31, | |||||||||||
2015 | 2014 | 2013 | |||||||||
Truckload | $ | 121,144 | $ | 113,875 | $ | 127,404 | |||||
Dedicated | 62,221 | 53,682 | 45,568 | ||||||||
Swift Refrigerated | 16,160 | 12,510 | 13,926 | ||||||||
Intermodal | 13,723 | 10,875 | 9,268 | ||||||||
Subtotal | 213,248 | 190,942 | 196,166 | ||||||||
Non-reportable segment | 38,487 | 30,180 | 29,842 | ||||||||
Consolidated depreciation and amortization of property and equipment | $ | 251,735 | $ | 221,122 | $ | 226,008 | |||||
Geographical Information
In aggregate, operating revenue from the Company's foreign operations was less than 5.0% of consolidated operating revenue for each of the years ended December 31, 2015, 2014 and 2013. Additionally, long-lived assets on the balance sheets of the Company's foreign subsidiaries were less than 5.0% of consolidated Total assets as of December 31, 2015 and 2014.
103
SWIFT TRANSPORTATION COMPANY
NOTES TO CONSOLIDATED FINANCIAL STATEMENTS — CONTINUED
In management's opinion, the following summarized financial information fairly presents the Company's results of operations for the quarters noted. These results are not necessarily indicative of future quarterly results.
First Quarter | Second Quarter | Third Quarter | Fourth Quarter | ||||||||||||
(In thousands, except per share data) | |||||||||||||||
2015 | |||||||||||||||
Operating revenue | $ | 1,015,144 | $ | 1,059,404 | $ | 1,064,973 | $ | 1,089,801 | |||||||
Operating income | 75,000 | 98,476 | 74,921 | 121,707 | |||||||||||
Net income | 37,840 | 50,954 | 36,281 | 72,502 | |||||||||||
Basic earnings per share | 0.27 | 0.36 | 0.25 | 0.52 | |||||||||||
Diluted earnings per share | 0.26 | 0.35 | 0.25 | 0.51 | |||||||||||
2014 | |||||||||||||||
Operating revenue | $ | 1,008,446 | $ | 1,075,898 | $ | 1,074,880 | $ | 1,139,500 | |||||||
Operating income | 46,170 | 94,022 | 97,411 | 132,467 | |||||||||||
Net income | 12,305 | 40,198 | 50,158 | 58,491 | |||||||||||
Basic earnings per share | 0.09 | 0.28 | 0.35 | 0.41 | |||||||||||
Diluted earnings per share | 0.09 | 0.28 | 0.35 | 0.41 | |||||||||||
104
ITEM 9. | CHANGES IN AND DISAGREEMENTS WITH ACCOUNTANTS ON ACCOUNTING AND FINANCIAL DISCLOSURE |
None.
ITEM 9A. | CONTROLS AND PROCEDURES |
Disclosure Controls and Procedures
As of the end of the period covered by this annual report on Form 10-K, we carried out an evaluation, under the supervision and with the participation of our management, including our CEO and CFO, of the effectiveness of our disclosure controls and procedures as such term is defined in Exchange Act Rules 13a-15(e) and 15d-15(e), including controls and procedures to timely alert management to material information relating to Swift Transportation Company and subsidiaries required to be included in our periodic SEC filings. Based on that evaluation, our CEO and CFO have concluded that our disclosure controls and procedures were effective as of the end of the period covered by this report.
Changes in Internal Control over Financial Reporting
There has been no significant change in our internal control over financial reporting during the quarter ended December 31, 2015 that has materially affected, or is reasonably likely to materially affect, our internal control over financial reporting.
Management’s Report on Internal Control over Financial Reporting
Management is responsible for establishing and maintaining adequate internal control over financial reporting as defined in Rules 13a-15(f) and 15d-15(f) under the Securities Exchange Act of 1934. The Company's internal control over financial reporting is designed to provide reasonable assurance regarding the reliability of financial reporting and the preparation of financial statements for external purposes in accordance with accounting principles generally accepted in the United States. Internal control over financial reporting includes policies and procedures that:
(i) | pertain to the maintenance of records that, in reasonable detail, accurately and fairly reflect the transactions and dispositions of the Company’s assets; |
(ii) | provide reasonable assurance that transactions are recorded as necessary to permit preparation of financial statements in accordance with accounting principles generally accepted in the United States, and that receipts and expenditures are being made only in accordance with the authorization of management and directors of the Company; and |
(iii) | provide reasonable assurance regarding prevention or timely detection of unauthorized acquisition, use or disposition of the Company’s assets that could have a material effect on the financial statements. |
Because of inherent limitations, internal control over financial reporting may not prevent or detect misstatements. Therefore, even those systems determined to be effective can provide only reasonable assurance with respect to financial statement preparation and presentation.
Under the supervision and with the participation of our CEO and CFO, management conducted an evaluation of the Company's internal control over financial reporting as of December 31, 2015. In making this evaluation, management used the criteria in Internal Control – Integrated Framework, issued in 2013 by the Committee of Sponsoring Organizations of the Treadway Commission ("COSO"). Based on this assessment, management concluded that its internal control over financial reporting was effective as of December 31, 2015.
The effectiveness of internal control over financial reporting as of December 31, 2015 was audited by KPMG LLP, the independent registered public accounting firm that also audited the Company's consolidated financial statements included in this Annual Report on Form 10-K. KPMG LLP’s report on the Company's internal control over financial reporting is included herein.
105
Report of Independent Registered Public Accounting Firm
The Board of Directors and Stockholders
Swift Transportation Company:
We have audited Swift Transportation Company and subsidiaries’ (the Company) internal control over financial reporting as of December 31, 2015, based on criteria established in Internal Control - Integrated Framework (2013) issued by the Committee of Sponsoring Organizations of the Treadway Commission (COSO). The Company’s management is responsible for maintaining effective internal control over financial reporting and for its assessment of the effectiveness of internal control over financial reporting, included in the accompanying “Management’s Report on Internal Control over Financial Reporting” appearing under Item 9A. Our responsibility is to express an opinion on the Company’s internal control over financial reporting based on our audit.
We conducted our audit in accordance with the standards of the Public Company Accounting Oversight Board (United States). Those standards require that we plan and perform the audit to obtain reasonable assurance about whether effective internal control over financial reporting was maintained in all material respects. Our audit included obtaining an understanding of internal control over financial reporting, assessing the risk that a material weakness exists, and testing and evaluating the design and operating effectiveness of internal control based on the assessed risk. Our audit also included performing such other procedures as we considered necessary in the circumstances. We believe that our audit provides a reasonable basis for our opinion.
A company’s internal control over financial reporting is a process designed to provide reasonable assurance regarding the reliability of financial reporting and the preparation of financial statements for external purposes in accordance with generally accepted accounting principles. A company’s internal control over financial reporting includes those policies and procedures that (1) pertain to the maintenance of records that, in reasonable detail, accurately and fairly reflect the transactions and dispositions of the assets of the company; (2) provide reasonable assurance that transactions are recorded as necessary to permit preparation of financial statements in accordance with generally accepted accounting principles, and that receipts and expenditures of the company are being made only in accordance with authorizations of management and directors of the company; and (3) provide reasonable assurance regarding prevention or timely detection of unauthorized acquisition, use, or disposition of the company’s assets that could have a material effect on the financial statements.
Because of its inherent limitations, internal control over financial reporting may not prevent or detect misstatements. Also, projections of any evaluation of effectiveness to future periods are subject to the risk that controls may become inadequate because of changes in conditions, or that the degree of compliance with the policies or procedures may deteriorate.
In our opinion, the Company maintained, in all material respects, effective internal control over financial reporting as of December 31, 2015, based on criteria established in Internal Control - Integrated Framework (2013) issued by COSO.
We also have audited, in accordance with the standards of the Public Company Accounting Oversight Board (United States), the consolidated balance sheets of Swift Transportation Company and subsidiaries as of December 31, 2015 and 2014, and the related consolidated statements of income, comprehensive income, stockholders’ equity, and cash flows for each of the years in the three-year period ended December 31, 2015, and our report dated February 22, 2016 expressed an unqualified opinion on those consolidated financial statements.
/s/ KPMG LLP
Phoenix, Arizona
February 22, 2016
106
ITEM 9B. | OTHER INFORMATION |
None.
107
PART III | ||||
ITEM 10. | DIRECTORS, EXECUTIVE OFFICERS AND CORPORATE GOVERNANCE |
The information required under this Item 10 is hereby incorporated by reference to the information responsive to this Item contained in the Company’s definitive proxy statement for its 2016 Annual Meeting of Stockholders to be filed with the SEC.
ITEM 11. | EXECUTIVE COMPENSATION |
The information required under this Item 11 is hereby incorporated by reference to the information responsive to this Item contained in the Company’s definitive proxy statement for its 2016 Annual Meeting of Stockholders to be filed with the SEC.
ITEM 12. | SECURITY OWNERSHIP OF CERTAIN BENEFICIAL OWNERS AND MANAGEMENT AND RELATED STOCKHOLDER MATTERS |
Equity Compensation Plan Information
On March 28, 2014, the Board adopted the Swift Transportation Company 2014 Omnibus Incentive Plan ("2014 Stock Plan,") which replaced the Swift Transportation Company 2007 Omnibus Incentive Plan ("2007 Stock Plan"). The 2014 Stock Plan became effective on May 8, 2014, upon approval by the Company's stockholders. After May 8, 2014, no new awards were granted under the 2007 Stock Plan. The 2007 Stock Plan continues to govern all awards granted under the 2007 Stock Plan until such awards have been exercised, forfeited, canceled or have otherwise expired or terminated.
The 2014 Stock Plan generally contains the same features, terms and conditions as the 2007 Stock Plan. Additionally, the 2014 Stock Plan did not increase the number of shares of stock available for grant, which means that the number of shares available for grant under the 2014 Stock Plan reflected the number of authorized but unissued (and not subject to outstanding awards) under the 2007 Stock Plan as of the date the 2014 Stock Plan became effective.
The following table represents securities authorized for issuance under the 2014 Stock Plan at December 31, 2015:
Number of securities to be issued upon exercise of outstanding options, warrants and rights | Weighted-average exercise price of outstanding options, warrants and rights | Number of securities remaining available for future issuance under equity compensation plans (excluding securities reflected in column (a)) | |||||||
Plan Category: | (a) | (b) | (c) | ||||||
Equity compensation plans approved by security holders | 3,838,646 | $ | 12.66 | 6,651,518 | |||||
Equity compensation plans not approved by security holders | — | — | — | ||||||
Total | 3,838,646 | $ | 12.66 | 6,651,518 | |||||
Column (c) includes 1,800,070 shares available for issuance under the Company's 2012 Employee Stock Purchase Plan "2012 ESPP." No amounts related to the 2012 ESPP are included in columns (a) or (b).
The material features of the Company’s 2014 Stock Plan and 2012 ESPP are described in Note 17 to the consolidated financial statements contained in this Form 10-K.
Other information required under this Item 12 is hereby incorporated by reference to the information responsive to this Item contained in the Company’s definitive proxy statement for its 2016 Annual Meeting of Stockholders to be filed with the SEC.
ITEM 13. | CERTAIN RELATIONSHIPS AND RELATED TRANSACTIONS, AND DIRECTOR INDEPENDENCE |
The information required under this Item 13 is hereby incorporated by reference to the information responsive to this Item contained in the Company’s definitive proxy statement for its 2016 Annual Meeting of Stockholders to be filed with the SEC.
ITEM 14. | PRINCIPAL ACCOUNTANT FEES AND SERVICES |
The information required under this Item 14 is hereby incorporated by reference to the information responsive to this Item contained in the Company’s definitive proxy statement for its 2016 Annual Meeting of Stockholders to be filed with the SEC.
108
PART IV | ||||
ITEM 15. | EXHIBITS AND FINANCIAL STATEMENT SCHEDULES |
(a) | List of documents filed as a part of this Form 10-K: |
(1) | See the Consolidated Financial Statements included in Item 8 hereof. |
(2) | Financial Statement Schedules are omitted since the required information is not present or is not present in the amounts sufficient to require submission of a schedule, or because the information required is included in the consolidated financial statements, including the notes thereto. |
(b) | Exhibits |
Exhibit Number | Description | Page or Method of Filing | ||
2.1 | Agreement or Plan of Merger by and between Swift Corporation and Swift Transportation Company | Incorporated by reference to Exhibit 2.1 of Form 10-K for the year ended December 31, 2010 | ||
2.2 | Central Refrigerated Stock Purchase Agreement | Incorporated by Reference to Exhibit 2.1 of Form 8-K filed on August 6, 2013 | ||
3.1 | Amended and Restated Certificate of Incorporation of Swift Transportation Company | Incorporated by reference to Exhibit 3.1 of Form 10-K for the year ended December 31, 2010 | ||
3.2 | Bylaws of Swift Transportation Company | Incorporated by reference to Exhibit 3.2 of Form 10-K for the year ended December 31, 2010 | ||
4.1 | Specimen Class A Common Stock Certificate of Swift Transportation Company | Incorporated by reference to Exhibit 4.1 to Amendment No. 3 to Registration Statement No. 333-168257 filed on November 30, 2010 | ||
10.1 | Swift Holdings Corp. 2007 Omnibus Incentive Plan, effective October 10, 2007, as amended and restated on December 15, 2010 * | Incorporated by reference to Exhibit 10.5 of Form 10-K for the year ended December 31, 2010 | ||
10.2 | Form of Option Award Notice * | Incorporated by reference to Exhibit 10.6 to Registration Statement No. 333-168257 filed on July 22, 2010 | ||
10.3 | Swift Corporation Retirement Plan, effective January 1, 1992 * | Incorporated by reference to Exhibit 10.7 to Registration Statement No. 333-168257 filed on July 22, 2010 | ||
10.4 | Swift Corporation Amended and Restated Deferred Compensation Plan * | Incorporated by reference to Exhibit 10.8 to Registration Statement No. 333-168257 filed on July 22, 2010 | ||
10.5 | First Amendment to the Swift Corporation Deferred Compensation Plan * | Incorporated by reference to Exhibit 10.11 to Amendment No. 3 to Registration Statement No. 333-168257 filed on November 30, 2010 | ||
10.6 | Swift Transportation Company 2012 Employee Stock Purchase Plan | Incorporated by reference to Exhibit 99.1 to Form S-8 Registration Statement No. 333-181201 | ||
10.7 | Form of Restricted Unit Award Agreement * | Incorporated by reference to Exhibit 10.1 of Form 8-K filed on February 28, 2013 | ||
10.8 | Form of Option Award Notice * | Incorporated by reference to Exhibit 10.2 of Form 8-K filed on February 28, 2013 | ||
10.9 | Form of Performance Unit Award Agreement * | Incorporated by reference to Exhibit 10.3 of Form 8-K filed on February 28, 2013 | ||
10.10 | Amended and Restated Receivables Purchase Agreement ** | Incorporated by reference to Exhibit 10.1 to Form 10-Q for the quarter ended June 30, 2013 | ||
10.11 | Third Amended and Restated Credit Agreement ** | Incorporated by reference to Exhibit 10.1 of Form 10-Q for the quarter ended June 30, 2014 | ||
10.12 | Swift Transportation Company 2014 Omnibus Incentive Plan * | Incorporated by reference to Appendix A to the Company's 2014 Proxy Statement, filed on April 4, 2014 | ||
10.13 | Form of Restricted Stock Grant Award Notice - 2014 Omnibus Incentive Plan * | Filed herewith | ||
10.14 | Form of Restricted Stock Unit Award Notice - 2014 Omnibus Incentive Plan * | Filed herewith | ||
10.15 | Form of Non-qualified Stock Option Award Notice - 2014 Omnibus Incentive Plan * | Filed herewith | ||
109
Exhibit Number | Description | Page or Method of Filing | ||
10.16 | Form of Performance Unit Award Notice - 2014 Omnibus Incentive Plan * | Filed herewith | ||
10.17 | Second Amendment to Amended and Restated Receivables Purchase Agreement ** | Incorporated by reference to Exhibit 10.1 of Form 10-Q for the quarter ended June 30, 2015 | ||
10.18 | Third Amendment to Amended and Restated Receivables Purchase Agreement ** | Filed herewith | ||
10.19 | First Amendment to Amended and Restated Receivables Purchase Agreement ** | Filed herewith | ||
10.20 | Fourth Amended and Restated Credit Agreement ** | Incorporated by reference to Exhibit 10.1 of Form 10-Q for the quarter ended September 30, 2015 | ||
21.1 | Subsidiaries of Swift Transportation Company | Filed herewith | ||
23.1 | Consent of KPMG LLP | Filed herewith | ||
24.1 | Powers of Attorney | See signature page | ||
31.1 | Certification by CEO pursuant to Rule 13a-14(a) or 15d-14(a) of the Securities Exchange Act of 1934, as adopted pursuant to Section 302 of the Sarbanes-Oxley Act of 2002 | Filed herewith | ||
31.2 | Certification by CFO pursuant to Rule 13a-14(a) or 15d-14(a) of the Securities Exchange Act of 1934, as adopted pursuant to Section 302 of the Sarbanes-Oxley Act of 2002 | Filed herewith | ||
32.1 | Certification by CEO and CFO pursuant to 18 U.S.C. Section 1350, as adopted pursuant to Section 906 of the Sarbanes-Oxley Act of 2002 | Furnished herewith | ||
101.INS | XBRL Instance Document | Filed herewith | ||
101.SCH | XBRL Taxonomy Extension Schema Document | Filed herewith | ||
101.CAL | XBRL Taxonomy Calculation Linkbase Document | Filed herewith | ||
101.LAB | XBRL Taxonomy Label Linkbase Document | Filed herewith | ||
101.PRE | XBRL Taxonomy Presentation Linkbase Document | Filed herewith | ||
101.DEF | XBRL Taxonomy Extension Definition Document | Filed herewith | ||
* | Management contract or compensatory plan, contract or arrangement. |
** | Certain confidential information contained in this Exhibit was omitted by means of redacting a portion of the text and replacing it with an asterisk. This Exhibit has been filed separately with the Secretary of the Securities and Exchange Commission without the redaction pursuant to Confidential Treatment Request under Rule 24b-2 of the Securities Exchange Act of 1934. |
110
SIGNATURES
Pursuant to the requirement of Section 13 or 15(d) of the Securities Exchange Act of 1934, the registrant has duly caused this report to be signed on its behalf by the undersigned, thereunto duly authorized.
SWIFT TRANSPORTATION COMPANY | ||||
By: | /s/ Mickey R. Dragash | |||
Mickey R. Dragash | ||||
Executive Vice President, | ||||
General Counsel and Corporate Secretary | ||||
February 22, 2016
KNOW ALL MEN BY THESE PRESENTS, that each person whose signature appears below constitutes and appoints Jerry Moyes, Mickey R. Dragash and Virginia Henkels, and each of them, his or her true and lawful attorneys-in-fact and agents, with full power of substitution and resubstitution, for him or her and in his or her name, place and stead, in any and all capacities, to sign any and all amendments to this Annual Report on Form 10-K, and to file the same, with all exhibits thereto and other documents in connection therewith the Securities and Exchange Commission, granting unto said attorneys-in-fact and agents, and each of them, full power and authority to do and perform each and every act and thing requisite and necessary to be done in and about the premises, as fully and to all intents and purposes as he or she might or could do in person hereby ratifying and confirming all that said attorneys-in-fact and agents, or his or her substitute or substitutes, may lawfully do or cause to be done by virtue hereof.
Pursuant to the requirements of the Securities Exchange Act of 1934, this report has been signed below by the following persons on behalf of the registrant and in the capacities and on the date indicated.
Signature and Title | Date | Signature and Title | Date | |||
/s/ Jerry Moyes | February 22, 2016 | /s/ Richard H. Dozer | February 22, 2016 | |||
Jerry Moyes | Richard H. Dozer | |||||
Chief Executive Officer and Director | Chairman | |||||
(Principal executive officer) | ||||||
/s/ Virginia Henkels | February 22, 2016 | /s/ David Vander Ploeg | February 22, 2016 | |||
Virginia Henkels | David Vander Ploeg | |||||
Executive Vice President and Chief Financial Officer | Director | |||||
(Principal financial officer) | ||||||
/s/ Cary M. Flanagan | February 22, 2016 | /s/ Glenn Brown | February 22, 2016 | |||
Cary M. Flanagan | Glenn Brown | |||||
Vice President and Corporate Controller | Director | |||||
(Principal accounting officer) | ||||||
/s/ José A. Cárdenas | February 22, 2016 | |||||
José A. Cárdenas | ||||||
Director | ||||||
/s/ William F. Riley, III | February 22, 2016 | |||||
William F. Riley, III | ||||||
Director | ||||||
111