Attached files
| file | filename |
|---|---|
| EX-32 - EXHIBIT 32 - WESTERN CAPITAL RESOURCES, INC. | g081935_ex32.htm |
| EX-31.2 - EXHIBIT 31.2 - WESTERN CAPITAL RESOURCES, INC. | g081935_ex31-2.htm |
| EX-31.1 - EXHIBIT 31.1 - WESTERN CAPITAL RESOURCES, INC. | g081935_ex31-1.htm |
| EX-21.1 - EXHIBIT 21.1 - WESTERN CAPITAL RESOURCES, INC. | g081935_ex21-1.htm |
| EX-14 - EXHIBIT 14 - WESTERN CAPITAL RESOURCES, INC. | g081935_ex14.htm |
| EX-10.4 - EXHIBIT 10.4 - WESTERN CAPITAL RESOURCES, INC. | g081935_ex10-4.htm |
| EX-4.1 - EXHIBIT 4.1 - WESTERN CAPITAL RESOURCES, INC. | g081935_ex4-1.htm |
UNITED STATES SECURITIES AND EXCHANGE COMMISSION
WASHINGTON, D.C. 20549
FORM 10-K
(Mark One)
☒
ANNUAL REPORT PURSUANT TO SECTION 13 OR 15(d) OF THE SECURITIES EXCHANGE ACT OF 1934
For the fiscal year ended
December 31, 2019
or
☐
TRANSITION REPORT PURSUANT TO SECTION 13 OR 15(d) OF THE SECURITIES EXCHANGE ACT OF 1934
For the transition period from
_______________________ to ___________________
Commission File Number 000-52015
WESTERN CAPITAL RESOURCES, INC.
(Exact name of registrant as specified in its charter)
|
Delaware |
47-0848102 |
|
(State of incorporation) |
(I.R.S. Employer Identification No.) |
|
|
|
|
11550 “I” Street, Suite 150 Omaha, Nebraska |
68137 |
|
(Address of principal executive offices) |
(Zip Code) |
Registrant’s telephone number, including area code: (402) 551-8888
Securities registered pursuant to Section 12(b) of the Act: |
|||||
Title of Each Class |
Trading Symbol(s) |
|
Name of Each Exchange on which Registered |
||
None |
N/A |
|
N/A |
||
Securities registered pursuant to Section 12(g) of the Act: Common Stock, par value $0.0001 per share
Indicate by check mark if the registrant is a well-known seasoned issuer, as defined in Rule 405 of the Securities Act. ☐ Yes ☒ No
Indicate by check mark if the registrant is not required to file reports pursuant to Section 13 or Section 15(d) of the Act. ☐ Yes ☒ No
Indicate by check mark whether the registrant (1) has filed all reports required to be filed by Section 13 or 15(d) of the Securities Exchange Act of 1934 during the preceding 12 months (or for such shorter period that the registrant was required to file such reports), and (2) has been subject to the filing requirements for the past 90 days ☒ Yes ☐ No
Indicate by check mark whether the registrant has submitted electronically every Interactive Data File required to be submitted pursuant to Rule 405 of Regulation S-T (§232.405 of this chapter) during the preceding 12 months (or for such shorter period that the registrant was required to submit such files). ☒ Yes ☐ No
Indicate by check mark whether the registrant is a large accelerated filer, an accelerated filer, a non-accelerated filer or a smaller reporting company. See definition of “accelerated filer,” large accelerated filer” and “smaller reporting company” in Rule 12b-2 of the Exchange Act.
Large accelerated filer ☐ Accelerated filer ☐ Non-accelerated filer ☒ Smaller reporting company ☒ Emerging Growth Company ☐
Indicate by check mark whether the registrant is a shell company (as defined in Rule 12b-2 of the Act). ☐ Yes ☒ No
The aggregate market value of the voting stock held by persons other than officers, directors and more than 5% shareholders of the registrant as of June 30, 2019 was approximately $11,057,000 based on the closing sales price of $3.75 per share as reported on the OTCQB. As of March 30, 2020, there were 9,265,778 shares of our common stock, $0.0001 par value per share, outstanding.
DOCUMENTS INCORPORATED IN PART BY REFERENCE
None.
Western Capital Resources, Inc.
Form 10-K
Table of Contents
OVERVIEW
Western Capital Resources, Inc. (“WCR” or “Western Capital”), a Delaware corporation originally incorporated in Minnesota in 2001 and reincorporated in Delaware in 2016, is a holding company having a controlling interest in subsidiaries operating in the following industries and operating segments:
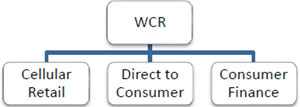
Our “Cellular Retail” segment is comprised of an authorized Cricket Wireless dealer and involves the retail sale of cellular phones and accessories to consumers through our wholly owned subsidiary PQH Wireless, Inc. and its controlled but less than 100% owned subsidiaries. Our “Direct to Consumer” segment consists of a wholly owned online and direct marketing distribution retailer of live plants, seeds, holiday gifts and garden accessories selling its products under Park Seed, Jackson & Perkins and Wayside Gardens brand names and home improvement and restoration products operating as Van Dyke’s Restorers as well as a wholesaler under the Park Wholesale brand. Our “Consumer Finance” segment consists of retail financial services conducted through our wholly owned subsidiaries Wyoming Financial Lenders, Inc. and Express Pawn, Inc. Our investment holdings are included with WCR. Throughout this report, we collectively refer to WCR and its consolidated subsidiaries as “we,” the “Company,” and “us.”
RECENT EVENTS
Cellular Retail Segment
During 2019 we made many strategic changes to our portfolio of Wireless Retail locations. We completed three joint venture transactions with other Cricket Wireless authorized retailers acquiring a total of 61 locations, sold 43 locations to other authorized retailers and purchased, launched or closed several others. In total in 2019, we added 69 locations and sold or closed 52 locations, ending the year operating 222 locations compared to 205 in operation at the beginning of the year.
Consumer Finance Segment
The payday lending industry continues to suffer from the perception and widespread belief that payday lenders are by their nature, predatory lenders. Consumer advocacy groups in many states are activity seeking state law changes which would effectively end the viability of a payday loan business, including Nebraska where we generate approximately 30% of our payday lending revenue or approximately 2% of our consolidated revenue. If these groups are successful in Nebraska, we will likely cease payday lending activities in Nebraska.
Release of Escrow Funds
In October 2019, we received $3,367,940, the scheduled release of the remaining 50% of the funds held in escrow relating to the 2017 sale of our Franchise segment, together with interest earned.
Common Stock Repurchases
During 2019, the Company repurchased 122,899 shares of its common Stock. Repurchases were made in the open market and through privately negotiated transactions.
Acquisitions
We are actively searching for acquisition opportunities. We are industry agnostic and target leaders in niche industries or geographies as well as opportunistic purchases of businesses that we believe we can improve operationally. We have a particular interest in companies facing succession dilemmas, corporate divestitures and businesses in out-of-favor industries. In addition, we seek to grow our subsidiaries through add-on acquisitions in the e-commerce, cellular retail and consumer finance segments. Our overall strategy continues to focus on building a diversified portfolio of strong cash flow generating businesses. Our financial strength, long-term view and operating expertise allow subsidiary companies to focus on growing and maximizing return on investment. We expect to be patient and move upon what we believe to be the right investment opportunities.
1
CELLULAR RETAIL SEGMENT
General Description
We operate cellular retail stores as an authorized Cricket Wireless retailer, selling cellular phones and accessories, activating Cricket Wireless customers on the Cricket network, providing ancillary services and accepting service payments from Cricket customers. As an authorized Cricket Wireless dealer, we are only permitted to sell the Cricket line of no-contract cellular phones and service at our Cricket retail stores.
We generate revenue in this business through retail sales of cellular phones, receipt of back-end compensation from Cricket, sales of phone accessories (e.g., cases, car chargers and bluetooth speakers), fees charged when a customer changes services (service activations and reactivations, adding lines, phone number changes, etc.), or whenever a customer whom we activated on the Cricket network pays his or her no-contract cellular bill.
A summary table of the number of cellular retail stores we operated during the periods ended December 31, 2019 and 2018 follows:
|
|
|
2019 |
|
|
2018 |
|
||
|
Beginning |
|
|
205 |
|
|
|
278 |
|
|
Acquired / Launched / Managed |
|
|
69 |
|
|
|
2 |
|
|
Closed |
|
|
(52 |
) |
|
|
(75 |
) |
|
Ending |
|
|
222 |
|
|
|
205 |
|
Market Information and Marketing
Cricket Wireless service offers customers simple, no-contract, predictable and affordable nationwide flat rate wireless plans. Cricket Wireless customers have the added advantage of unlimited minutes, text and data access on the AT&T network.
No-contract cellular products and services were historically targeted primarily only to market segments that were underserved by traditional communications companies requiring credit approval, a contractual commitment from the subscriber for a period of at least one year, and often included overage charges for minute and data usage in excess of a specified limit. We believe that a large portion of the U.S. cellular market consists of customers who are price-sensitive and prefer not to enter into these fixed-term contracts. We believe that the Cricket Wireless cellular retail product and service offerings we offer appeal strongly to both the underserved markets and the greater U.S. cellular market and believe we are positioned to benefit as a Cricket Wireless dealer.
Market Strategy
We believe that our business model is scalable and we can apply our operational protocols and administrative office functions to continue expanding our cellular retail business. We will continue to evaluate strategic and opportunistic acquisitions of existing Cricket dealerships and will actively close, dispose or consolidate locations that do not meet our operating criteria in order to streamline operations.
Products and Services
Our authorized Cricket retail stores offer the following products and services:
|
|
● |
Cricket Wireless service plans, each designed to attract customers by offering simple, predictable and affordable talk, text and high-speed data services that are a competitive alternative to traditional wireless and wireline services (e.g., flat-rate and unlimited talk/text plans, without fixed-term contracts, early termination fees or credit checks); |
|
|
● |
Cricket Wireless plan upgrades, such as Cricket International, individual country add-ons, Deezer (an independent music service on a no-contract basis), Cricket Protect and mobile hotspots; and |
2
|
|
● |
Cricket handsets and accessories. |
When purchasing a phone, our customers have options among the latest in Apple, Samsung and other Android-based and Windows OS-based smartphones. Because there is no contract for the monthly service, customer phone purchases are paid in full at the time of purchase.
Seasonality
Our Cellular Retail segment operations are influenced by seasonal effects related to traditional retail selling periods and other factors affecting our customer base. In particular, we generally expect sales activity to be highest in the first and fourth quarters. Nevertheless, our revenues can be strongly affected by the launch of new markets, new or improved products such as release of the latest smartphone edition, promotional activity, the timing of federal tax-refunds and the actions of our competitors, any of which have the ability to offset or exacerbate the seasonality we normally experience.
Competition
There is substantial and ever-increasing competition in the wireless phone industry where customers can choose between many other postpaid and no-contract resellers, including AT&T, Verizon, Sprint/Boost Mobile, T-Mobile/Metro PCS and a larger number of regional providers. We compete for customers based principally on Cricket’s service/device offerings, price, call quality and coverage area.
Competition for the no-contract customers is primarily among MetroPCS, Virgin Mobile and Boost Mobile, but also includes the traditional postpaid carriers that have introduced no-contract products. There is also competition with other no-contract phone service providers such as Straight Talk by Wal-Mart or Wal-Mart’s Family Mobile powered by T-Mobile, an increase of national retailers offering similar or identical products and services that we provide, such as Cricket phones sold at Game Stop and Wal-Mart, and an increase in mobile virtual network operator (“MVNO”) offerings.
Our Cricket store business also competes with other current or potential authorized Cricket Wireless dealers and direct-to-consumer sales through the Cricket Wireless website. The authorization to sell Cricket products and services is granted by Cricket Wireless, LLC, a wholly owned subsidiary of AT&T. Our ability to compete with other sellers of Cricket products and services will depend on the success with which we operate our stores and the attractiveness of their locations.
DIRECT TO CONSUMER SEGMENT
General Description
Our direct to consumer segment is a direct marketer of roses, plants, seeds, holiday gifts and home restoration products. The business is composed of: 1) a multi-channel retailer of garden and living gift products; 2) a wholesale seed business; and 3) a multi-channel retailer of home hardware and restoration products. Our garden products brands are highly recognizable in the rose and garden space as both the Jackson & Perkins and Park Seed brands were founded more than 149 years ago.
Products and Services
Our direct to consumer segment sells product through catalogs and online under the following brands:
● Jackson & Perkins, approximately 150 years of history and is the most recognized brand of premium garden roses. Jackson and Perkins is one of the largest direct to consumer retailers of bare root roses in the United States, selling over 150 active varieties of bare root roses, of which 87 varieties are patented by Jackson and Perkins. In addition to bare root roses, we sell perennials, flower bulbs, outdoor living products as well as living holiday gifts plants. Holiday gifts include fresh evergreen wreathes, live decorative Christmas trees and holiday amaryllis.
● Park Seed, over 150 years in the business and one of America’s oldest and largest direct to consumer seed retailers. As a leader within the direct to consumer seed business, Park Seed sells over 2,500 premium vegetable and flower seed varieties, as well as various gardening supplies. The wholesale seed business sells seeds, plants and other horticultural products in larger quantities to small-medium sized growers, nurseries and garden centers. Plants and seeds sales are concentrated during the spring months.
● Wayside Gardens, sells unique, hard to find high-end flowers, plants and gardening supplies to the master gardener. The Wayside Gardens customer is extremely selective, very knowledgeable, and seeks high quality plants. Approximately 60% of sales occur in the three months from March to May, during the spring planting season.
3
● Van Dyke’s, an online and catalog retailer with a vast assortment of vintage home restoration wood products, hardware and antique furniture, many of which are hard to find. Van Dyke’s focus is on hardware, decorative wood, home accents, knobs and pulls and kitchen, bath and other décor.
Seasonality
Demand for live goods and holiday products is cyclical in nature, sensitive to seasonal growing patterns, general weather conditions, holiday sales patterns and competitive influences. As such, the direct to consumer segment’s results of
operations, financial condition and cash flows could fluctuate significantly from period to period. The majority of segment revenue is derived in three selling periods, spring, fall, and the December holiday season, while the summer season accounts for a small portion of sales.
Market Strategy
As a direct to consumer retailer, we focus our marketing spending on mail order catalogs, internet advertising, and traditional advertising mediums (i.e., public relations, magazines, social media, etc.). We are focused on niche markets and direct our advertising to repeat and new customers through internet marketing strategies.
Competition
In the retail garden business, within the bare root rose category, we compete against brick and mortar garden centers and nurseries (approximately 10,000 across the United States), as well as other online and mail-order retailers, including David Austin Roses and Regan Nursery. Across other plant categories, we compete against Gardens Alive and their portfolio of brands, and other competitors. Our biggest competitive advantages are our recognizable Jackson & Perkins brand name proprietary patented rose varieties and exclusive garden seed products. The most direct competitor for Wayside Gardens is White Flower Farms, which also focuses on high-end, premium plants.
Within the holiday gift segment, we compete against larger competitors including Harry and David and 1-800 Flowers, among others. Within the seed business, our primary competitor is Burpee which, in addition to having an online presence, supplies lower-end seed products to mass market retailers, including Wal-Mart.
Our Van Dyke’s Restorers brand competes primarily with other online retailers since brick and mortar stores cannot afford to carry Van Dyke’s breadth of SKUs. Our competitors are Signature Hardware, House of Antique Hardware, and Rejuvenation Hardware (part of Williams Sonoma). The above-mentioned competitors compete primarily in the hardware, lighting and kitchen and bath categories. The decorative wood portion of the Van Dyke’s business is in a very fragmented industry niche and there are no big decorative wood competitors. Van Dyke’s competes primarily through the breadth of its product variety as well as through its established brand name and customer list.
CONSUMER FINANCE SEGMENT
General Description
The majority of short-term consumer loans we provide are commonly referred to as “payday loans” or “cash advance” loans. Such loans are referred to as “payday loans” because they are typically made to borrowers who have no available cash and promise to repay the loan out of their next paycheck. We also provide short-term installment and pawn loans as part of this operating segment.
We provide short-term consumer loans in amounts that typically range from $100 to $500 with the average loan amount, including fee, being approximately $432. Cash advance loans provide customers with cash in exchange for a promissory note with a maturity of generally two to four weeks and the customer’s post-dated personal check for the aggregate amount of the cash advance, plus a fee. The fee varies from state to state based on applicable regulations, and generally ranges from $15 to $22 for each whole or partial increment of $100 borrowed. To repay the cash advance loan, a customer may pay with cash, in which case their personal check is returned to them, or allow the check to be presented to the bank for collection. Approximately 91% and 89% of our lending revenue (comprised of payday loan fees and installment and pawn loan interest and fees) in the Consumer Finance segment was derived from payday lending in 2019 and 2018, respectively. Payday lending revenue made up approximately 76% and 74% of our total revenue (comprised of lending revenue, check cashing fees, pawn fees and miscellaneous other revenue) in the Consumer Finance segment in 2019 and 2018, respectively.
4
We currently offer short-term installment loans only in Wisconsin but also offered short-term installment loans in Colorado until February 2019. Approximately 3% and 6% of our total revenue in the Consumer Finance segment was derived from installment lending in 2019 and 2018, respectively. We provide our installment loan customers with cash in exchange for a promissory note with a maturity of generally six months. The fee and interest rate on installment loans vary based on applicable regulations. Like cash advance or payday loans, installment loans are unsecured.
We operate three pawn stores in our Consumer Finance segment. Our pawn stores provide collateralized non-recourse loans, commonly known as “pawn loans” with maturities of one to four months. Allowable service charges vary by state and loan size. The loan amount varies depending on our valuation of each item pawned. We generally lend from 30% to 55% of our estimate of the collateral’s resale value. Customers have the option to redeem the pawned merchandise during the term or at maturity, or else forfeit the merchandise to us on maturity. At our pawn stores we sell merchandise that was acquired through either customer forfeiture of pawn collateral, second-hand merchandise purchased from customers or consigned to us, or new merchandise purchased from vendors. Pawn store revenues made up approximately 17% of our total revenue in the Consumer Finance segment in 2019 and 2018.
All of our Consumer Finance lending activities and other services are subject to state regulations (which vary from state to state), federal regulations and local regulations, where applicable.
As part of each payday and installment loan transaction, we enter into a standardized written promissory note with the borrowing customer and obtain proof of income and identity, a personal post-dated check for the principal loan amount plus a specified fee if a payday loan, and other documentation. Our standardized contracts vary based on state laws, but all of our contracts plainly state in simple terms the annual percentage rate (assuming the fees we charge are computed as interest) in compliance with Regulation Z, the borrower’s right to rescind the transaction, a dispute-resolution clause, a notice of financial privacy rights, an affirmative representation about whether the borrower is a member of the U.S. military, and the consequences of defaulting on the loan. We retain copies of our written contracts and provide a signed copy to our customers.
In general, our lending process and standards are extraordinarily different from those used by banks. To our knowledge, banks typically order and carefully review credit reports on all loans, engage in extensive underwriting analysis, and will typically make independent verification of earnings history through phone calls, reviews of tax returns and other processes. As a result, we generally experience a higher default rate on our personal loans than banks do on their personal loans (see caption below, “Risks Associated with Our Loans—Default and Collection”). At December 31, 2019, we had an aggregate (of all loan types) of approximately:
|
|
● |
$3.70 million in current outstanding loan principal, fees and interest due to us; and |
|
|
● |
$0.83 million of late loans (customers’ repayment checks deposited and returned as NSF within the last 180 days or installment loan balances not past the final installment due date with one or more payments delinquent). |
A summary table of the number of Consumer Finance locations operated during the periods ended December 31, 2019 and 2018 follows:
| 2019 | 2018 | |||||||
| Beginning | 41 | 41 | ||||||
| Acquired / Launched | — | — | ||||||
| Closed | (2 | ) | — | |||||
| Ending | 39 | 41 | ||||||
The Fees We Charge
The fee we charge for a payday loan varies from state to state, based on applicable regulations, and generally ranges from $15 to $22 for each whole or partial increment of $100 borrowed. We do not charge interest in connection with our payday loans but do charge interest and fees where allowable on our short-term installment loans made in Wisconsin. If, however, we calculate the loan fees we charge as an annual percentage rate of interest (“APR”), such rate would range from 177% for a 31-day loan transacted in Kansas (on the low end) to approximately 536% for a 14-day loan in Wyoming (on the high end), with the actual average loan amount and average actual loan fees we charge involving an imputed annual percentage rate of approximately 439% and 198% for a 14-day and 31-day loan, respectively. The term of a loan significantly affects the imputed APR of the fees we charge for our loans. For instance, when a $15 fee is charged for a two-week loan of $100, the resulting APR is 391%. When the same fee on $100 is charged for a four-week loan, the resulting APR is 195%. Currently, we do not charge the maximum fee permitted in all of the states where we operate. We do, however, charge a uniform fee for all transactions processed in any particular state that involve the same range of payday loan amounts and the same term.
5
Of the six states in which we presently operate, only one state (Wisconsin) does not limit the loan fees we may charge or the term (i.e., the length) of the loan we may offer our customers.
In Wisconsin, we generally offer short-term installment loans in amounts from $300 to $750 payable in six equal monthly payments. Wisconsin installment loans are payable over four to six months at an annual percentage rate of approximately 480%.
We also offer pawn loans in Nebraska and Iowa. Allowable service charges for pawn loans vary by state and loan size. Our pawn loans earn 20% per month for loans under $1,000 and our average pawn loan amount typically ranges between $10 and $250, although may range as high as $5,000. The loan amount varies depending on our estimated value of each item pawned.
Many states have laws limiting the amount of fees that may be charged in connection with any lending transaction (including payday and pawn lending transactions) when calculated as an APR, and some states expressly prohibit payday lending. These limitations, combined with other limitations and restrictions, effectively prohibit us from utilizing our present business model for cash advance or “payday” lending in those jurisdictions. In addition, the federal “2007 Military Authorization Act” prohibits lenders from offering or making payday loans (or similar lending transactions) to members of the U.S. military when the interest or fees exceed a 36% APR. Like the state limitations discussed above, this limitation effectively prohibits us from providing our cash advance or “payday” lending to members of the U.S. military. As a result of these restrictions, we do not conduct business with U.S. military personnel.
The above-described payday fees are the only fees we assess and collect from our customers for payday loans. Nevertheless, we also charge a flat fee that ranges from $15 to $40 (depending on the state) for returned checks in the event that a post-dated check we attempt to cash as repayment for our loan is returned.
Extensions or “Rollovers” of Payday Loans
Most states prohibit payday lenders from extending or refinancing a payday loan. Nevertheless, one state in which we presently provide payday loans (North Dakota) permits a loan to be extended or “rolled over” once.
When a customer “rolls over” or extends the term of an outstanding loan, when permitted by state law, we treat that rollover or extension as a brand new loan and we again charge the above-described loan fee for that transaction. This rollover has no effect on the imputed APR of the loan in those cases where the extended term is equal to the initial term of the loan. For example, a $100 four-week loan that costs $20 to obtain is the APR equivalent of 261%. If a customer extends the term of that loan for an additional four-week period, the customer will have paid $40 total in fees to obtain the $100 eight-week loan—which is again the APR equivalent of 261%. In cases where a customer (1) extends or rolls over a loan for a length of time that is less than the original loan or (2) repays the extended loan prior to the expiration of the fully extended term, the imputed APR will increase. For example, if a customer who obtained an initial $100 four-week loan for $20 in loan fees (the APR equivalent of 261%) later extends the term of that loan for only two additional weeks and pays the additional $20 loan fee, that customer will have borrowed $100 for a six-week period at a total cost of $40—which is the APR equivalent of 347%. We do not charge any interest on the unpaid fee from the initial term of the loan because, as a condition to agreeing to a loan extension, we will only accept cash payment of the fee for extending the loan.
Risks Associated With Our Loans—Default and Collection
Ordinarily, our customers approach us for a loan because they currently have insufficient funds to meet their present obligations, and so rarely if ever do our customers have sufficient funds in their checking accounts to cover the personal post-dated checks they provide us at the time of the loan transaction. The nature of our payday loan transactions presents a number of risks, including the ultimate risk that the loan will not be paid back. In addition, we do not obtain security for our payday loans principally because, even assuming our customers would have potential collateral to offer as security for a payday loan, the small size of each particular lending transaction does not justify the time, effort and expense of identifying the collateral and properly obtaining a security interest in such collateral. As a consequence, all of our payday loans are unsecured. This means that, absent court or other legal action compelling a customer to repay our loans, we rely principally on the willingness and ability of our customers to repay amounts they owe us. In this regard, in many cases the costs of merely attempting to collect the amounts owed to us exceed the amounts we would seek to collect—making it impractical to take formal legal action against a defaulted borrower.
6
When a customer defaults on a loan, we engage in collection practices that include contacting the customer for repayment and the customer’s bank to determine whether funds are available to satisfy their personal post-dated check. If funds are available, we present the check to the bank for repayment and an official check from the bank is obtained to pay off the item. The costs involved in these initial collection efforts are minimal and involve some employee time and possibly a flat $15-30 bank fee to cover the cost of the cashier’s check. If funds are not available, we generally attempt to collect returned checks for up to 90 days (or up to 180 days in cases where a bank account is still active and the customer has not initiated a stop payment on the postdated check provided), principally through continued attempts to contact the customer. If our attempts remain unsuccessful after 90 (or 180) days, we generally assign the item to a collection agency. Assignment to a collection agency may cost us 30-40% of the amount eventually collected (if any) from the customer. Ordinarily, we do not recoup any costs of collection from our customers.
Historically, we collect approximately 60% of the amount of all returned checks, which results in approximately 2.56% of our total payday loan principal and fee volume being uncollectible. In 2019, we generated approximately 126,000 payday loan transactions.
Industry Information
According to a December 2017 study by the Center for Financial Services Innovation (“2017 Financially Underserved Market Size Study”) consumers spent approximately $3.2 billion on fees for single payment loan products from storefront payday lenders in 2016, compared to $3.6 million in 2015. This year over year decline continues a trend that is expected to continue going forward. According to the Community Financial Services Association of America (“CFSA”) website, industry analysts estimate that 19 million U.S. households use short-term payday advances and estimate that there are 20,600 payday advance locations across the United States, which extend approximately $38.5 billion in short-term credit to households experiencing cash-flow shortfalls. In addition to being a valuable source of credit for many consumers, the payday loan industry makes significant contributions to the U.S. and state economies employing more than 50,000 Americans who earn $2 billion in wages and generating more than $2.6 billion in federal, state, and local taxes. Industry trends indicate that there will likely be a net decrease in total payday lending stores over the next few years due to store closings resulting from a combination of regulatory or legal changes, regulatory pressures, a slowdown in new store growth, and general economic conditions.
Predatory Lending and Regulatory Concerns
In general, the payday lending industry suffers from the perception and widespread belief that payday lenders are by their nature, predatory lenders, offering loans to low income and poorly educated consumers at costs that are too high to be good for consumers. This perception and belief results in frequent efforts in the U.S. Congress and various state legislatures, often proposed by consumer advocacy groups and lobbyists for traditional financial institutions such as banks, to further regulate and restrict or prohibit payday lending outright. See “Item 1A – Risk Factors” for further information regarding regulatory risks.
We do not believe the payday lending is predatory, nor do we believe that our loans are too costly for consumers if they are judiciously obtained. In fact, we believe that bank overdraft fees by themselves are typically far more costly for consumers, and bouncing a check can often involve other negative consequences such as independent fees levied by the parties to whom a bad check is written, negative publicity, etc. In this regard, the FDIC released a November 2008 report called “Study of Bank Overdraft Programs.” The report indicates that the average amount obtained when bank customers overdraw their accounts is $60, and the average overdraft fee charged by the bank is $27. This equates to an APR of 1,173% and 587% for a two-week and four-week $60 bank “loan,” respectively. In sum, we believe that many of the bad perceptions about our industry are fueled primarily by:
|
|
● |
the effects of our loans on consumers who do not judiciously obtain payday loans; |
|
|
● |
a lack of genuine understanding about the choices faced by low and middle-income people facing a critical cash shortage; and |
|
|
● |
anti-payday lending lobbying campaigns, often funded by traditional financial institutions such as banks and credit unions that would economically benefit from the elimination of payday lending. |
Seasonality
Our Consumer Finance segment results are subject to seasonality, with the first and fourth quarters typically being our strongest periods as a result of broader economic factors, such as holiday spending habits at the end of each year and income tax refunds during the first quarter.
7
Competition
Like most other payday lenders, we believe that the primary competitive factors in our business are location and customer service. We face intense competition in an industry with relatively low barriers to entry, and we believe that the payday lending markets are becoming more competitive as the industry matures and consolidates. We compete with other payday lending and check cashing stores, and with financial service entities and retail businesses that offer payday loans or similar financial services. For example, we consider credit card companies that offer payday features, credit unions, banks that offer small loans, and creditors and loan services that can extend payment terms on outstanding loans to be our competitors. In addition, we compete in part with services offered by traditional financial institutions, most particularly with respect to the “overdraft protection” services those institutions may offer and the charges they levy for checks written with insufficient funds.
Additional areas of competition have arisen. Businesses offer loans over the Internet as well as “loans by phone,” and these services compete with the services we offer. There also has been increasing penetration of electronic banking and related services into the check cashing and money transfer industry, including direct deposit of payroll checks, payroll or debit cards, stored-value cards, prepaid credit and debit cards, and electronic transfer of government benefits.
We also believe that customer service is critical to developing loyalty. In our industry, we believe that quality customer service means:
|
|
● |
assisting with the loan application process and helping our customers understand the loan terms; |
|
|
● |
treating customers respectfully; and |
|
|
● |
processing transactions with accuracy, efficiency and speed. |
Our competitors for pawn store merchandise sales include numerous retail and wholesale stores, including jewelry stores, discount retail stores, consumer electronics stores, other pawn stores, other resale stores, electronic commerce retailers and auction sites.
The pawn industry in the United States is large and highly fragmented. The industry consists of approximately 13,000 pawn stores owned primarily by independent operators who own one to three locations. We consider the industry relatively mature. The three largest pawn store operators account for approximately 10% of the total estimated pawn stores in the United States.
Effect of General Economic Conditions on our Consumer Finance Segment
Our business has experienced fluctuating changes in our provision for loan losses in recent years. For example, our provision for loan losses as a percentage of payday, installment and pawn loan revenue was 11.5%, 13.9%, and 12.3% in 2019, 2018, and 2017, respectively. We are uncertain how the current economic conditions will affect demand for our services or our loan losses after 2019.
Credit and financing available to us and our industry has been negatively impacted by recent federal and state legislation and regulation, including the overall negative perception associated with payday lending. For example, we are aware of federal and state regulatory pressures being exerted on our banking relationships due to the negative perception about payday lending. For more information, see “Regulation - Regulation of Consumer Financing Activities” below.
REGULATION
We are subject to regulation by federal, state and local governments that affect the products and services we provide. Generally, these regulations are designed to protect consumers who use our services and are not designed to protect our shareholders.
Regulation of Consumer Financing Activities
In those states where we currently operate consumer finance activities, we are licensed as a payday lender or pawn broker where required and are subject to various state regulations regarding the terms and conditions of our payday, installment and pawn loans and our lending policies, procedures and operations. In some states, payday lending is referred to as “deferred presentment,” “cash advance loans,” “deferred deposit loans” or “consumer installment loans.” State regulations normally limit the amount that we may lend to any single consumer and may limit the number of loans that we may make to any consumer at one time or in the course of a single year. State regulations also limit the amount of fees that we may assess in connection with any loan transaction and may limit a customer’s ability to extend or “rollover” a loan with us. Often, state regulations also specify minimum and maximum maturity dates for payday loans and, in some cases, specify mandatory cooling-off periods between transactions.
8
Our payday lending practices must also comply with the disclosure requirements of the Federal Truth-In-Lending Act and Regulation Z under that Act. Our collection activities for delinquent loans are generally subject to consumer protection laws regulating debt-collection practices. Finally, our payday lending business subjects us to the Equal Credit Opportunity Act and the Gramm-Leach-Bliley Act.
During the last few years, legislation has been introduced and passed in the U.S. Congress and in certain state legislatures proposing or effecting various restrictions or an outright prohibition on payday or certain installment lending. Currently, state laws in Arizona, Colorado, Montana, Oregon, South Dakota and Georgia have effectively eliminated the ability to conduct payday and certain installment lending in those states. In 2010, Congress passed the Dodd-Frank Wall Street Reform and Consumer Protection Act, which consolidated most federal regulation of financial services offered to consumers, and replaced the Office of Thrift Supervision’s seat on the FDIC Board. Almost all credit providers, including mortgage lenders, providers of payday loans, other nonbank financial companies, and banks and credit unions with assets over $10 billion, are subject to regulations and oversight by the Consumer Financial Protection Bureau (“CFPB”). While the CFPB does not have authority to make rules limiting interest rates or fees charged, the scope and extent of its authority is broad enough to impose limits on rollovers and extensions of payday loans, as well as compliance with federal rules and regulations.
After several years of research, debate, and public hearings, in October 2017 the CFPB issued new rules for payday lending. The proposed rules, originally scheduled to go into effect in August 2019, would impose significant restrictions on the industry, and it is expected that a large number of lenders would be forced to close their stores. The CFPB’s studies projected a reduction in the number of lenders by 50%, while industry studies forecast a much higher attrition rate. Included in the new rules are requirements for vetting borrowers (i.e., obtaining a credit report and performing basic underwriting procedures), limits on the number of loans a consumer could obtain in a 12-month period, limiting to two the number of times a consumer’s check may be presented to the consumer’s bank for payment, and provisions requiring paydowns by the consumer on successive loans. However, in January 2018, the CFPB issued a statement that it intends to “reconsider” the regulation. The most current information from the CFPB website states the proposals it is considering includes rescinding the mandatory underwriting provisions contained in the rule and to delay the August 19, 2019 compliance date for the other provisions to November 19, 2020. At this time it is uncertain whether the rule will be implemented as announced, rewritten with more favorable terms for the industry, or thrown out altogether. If the rule is implemented as written, it could have a significant and negative impact on business conducted within our Consumer Finance segment.
In addition, our Consumer Finance segment activities are subject to the following federal consumer laws, regulations and CFPB guidance:
|
|
● |
Unfair, Deceptive or Abusive Acts or Practices (“UDAAP”) |
|
|
● |
Fair Debt Collections Practice Act (“FDCPA”) |
|
|
● |
Consumer Complaint Management |
|
|
● |
Electronic Fund Transfer Act (“EFTA”) (Reg. E) |
|
|
● |
Fair Credit Reporting Act (“FCRA”) |
|
|
● |
Service Members Civil Relief Act |
For more information, see “PAYDAY LENDING BUSINESS—Predatory Lending and Regulatory Concerns” above.
Financial Reporting Regulation
Regulations promulgated by the United States Department of the Treasury under the Bank Secrecy Act require us to report all transactions involving currency in an amount greater than $10,000. Generally, every financial institution must report each deposit, withdrawal, exchange of currency or other payment or transfer that involves an amount greater than $10,000. In addition, multiple currency transactions must be treated as a single transaction if we have knowledge that the transactions are by or on behalf of any one person and result, in a single business day, in the transfer of cash in or out totaling more than $10,000. In addition, the regulations require us to maintain information concerning sales of monetary instruments for cash in amounts from $3,000 to $10,000. The Bank Secrecy Act requires us, under certain circumstances, to file a suspicious activity report.
9
The Money Laundering Suppression Act of 1994 requires us, as a money service business (“MSB”), to register with the United States Department of the Treasury. MSBs include check cashers and sellers of money orders. MSBs must renew their registrations every two years, maintain a list of their agents, update the agent list annually, and make the agent list available for examination.
Finally, we have established various procedures designed to comply, and we continue to monitor and evaluate our business methods and procedures to ensure compliance, with the USA PATRIOT Act.
Privacy Regulation
We are subject to a variety of federal and state laws and regulations restricting the use and seeking to protect the confidentiality of customer identity and other personal nonpublic customer information. We have identified our systems that capture and maintain nonpublic personal information, as that term is understood under the Gramm-Leach-Bliley Act and associated regulations. We disclose our public information policies to our customers as required by that law. We also have systems in place intended to safeguard this information as required by the Gramm-Leach-Bliley Act, which specifically governs certain aspects of our payday lending business.
TECHNOLOGY AND INFORMATION
We maintain an integrated system of retail points of sale and management software applications and platforms for processing the various types of financial transactions we offer. These systems provide us with customer service, internal control mechanisms, record-keeping and reporting information. These systems are designed to provide summary, detailed and exception information to various levels of management.
SECURITY
We believe the principal security risks to our Consumer Finance and Cellular Retail segments are robbery and employee theft. We have established extensive security and management information systems to address both areas of potential loss. To protect against robbery, most payday lending store employees work behind bullet-resistant glass, and the back office, safe and computer areas are locked and closed to customers. Security measures utilized in our retail locations include mechanical safes, electronic alarm systems monitored by third parties or remote controlled systems, control over entry to customer service representative, motion detection devices, locked cases, and, at times, the use of professional security services. Consumer Finance segment employees also use cellular phones to ensure safety and security whenever they are outside secured areas.
We implemented critical safeguarding controls, including daily cash and deposit monitoring, unannounced audits of cash and inventory items, and requiring immediate responses from our staff when irregularities in cash balances are discovered. We primarily self-insure for employee theft and dishonesty at the store level.
We regularly receive and store information about our customers, vendors and other third parties. We have programs in place to detect, contain, and respond to data security incidents. However, because the techniques used to obtain unauthorized access, disable or degrade service, or sabotage systems change frequently and may be difficult to detect for long periods of time, we may be unable to anticipate these techniques or implement adequate preventive measures. In addition, hardware, software, or applications we develop or procure from third parties or through open source solutions may contain defects in design or manufacture or other problems that could unexpectedly compromise information security. Unauthorized parties may also attempt to gain access to our systems or facilities, or those of third parties with whom we do business, through fraud, trickery, or other forms of deceiving our team members, contractors, and vendors.
EMPLOYEES
At December 31, 2019, we had approximately 980 employees. We believe our relationship with our employees is good, and we have not suffered any work stoppages or labor disputes. We do not have any employees that operate under collective-bargaining agreements.
CORPORATE INFORMATION
Our principal offices are located at 11550 “I” Street, Suite 150, Omaha, Nebraska 68137, our telephone number at that office is (402) 551-8888 and our internet website is https://www.westerncapitalresources.com.
10
Our fiscal year ends December 31. Neither we nor any of our predecessors have been in bankruptcy, receivership or any similar proceeding.
You should consider the following risk factors, in addition to the other information presented or incorporated by reference into this Annual Report on Form 10-K, in evaluating our business and your investment in us.
Investment Risks
Acquisitions and strategic investments may fail to meet our expectations, and any such failure could have a negative impact on our results of operation or financial condition, and could ultimately result in dilution to our shareholders.
Our long-term growth strategy includes acquisitions. We may not successfully execute this strategy. An acquisition strategy includes numerous risks, including, among others, the risk that our financial projections relating to our acquisitions may turn out to be incorrect and our investment may fail to positively impact our results and growth as anticipated (and may in fact negatively impact our results), the risk of unexpected or unidentified issues not discovered in the due diligence process which could harm our financial condition, risks related to our ability to successfully integrate an acquisition target into the Company, and the need for substantial additional capital which may result in dilution to our shareholders.
Acquisitions and strategic investments made wholly or partly on the basis of our issuance of securities to the target companies, or acquisitions made with cash that is obtained from outside investors or lenders, will result in dilution to our shareholders.
The structuring of future acquisitions, whether through share exchanges, merger acquisitions or otherwise, may result in dilution to existing shareholders. In addition, cash-based transactions may not be financed from corporate cash flows and reserves, and may themselves be financed through borrowing arrangements or the sale of equity or equity-linked securities, the latter of which would be dilutive to our shareholders.
Acquisitions and strategic investments may be disruptive to our business.
The time and expense associated with finding suitable acquisitions or with integrating acquired entities and operations with our Company can be disruptive to our ongoing business and divert our management’s attention. In addition, the financing of acquisitions may impact our ability to obtain or renew financing for existing operations, or subject us to covenants restricting certain activities. Any of these outcomes could have a short- or long-term adverse effect on our results of operation and our ability to further execute our acquisition strategy.
Unpredictability in financing and other markets could impair our ability to grow our business through acquisitions
We anticipate that opportunities to acquire businesses will materially depend on the availability of financing alternatives with acceptable terms as well as acceptable market valuations of prospective acquisitions. As a result, poor credit and other market conditions, mergers and acquisitions market valuations, any uncertainty in the financing markets, or the adverse regulatory pressures of being involved in the payday lending business in particular, could materially limit our ability to grow through acquisitions since such conditions and uncertainty make obtaining financing and finding attractive opportunities more difficult and more expensive.
Our controlling shareholder possesses controlling voting power with respect to our common stock, which will limit other shareholders’ influence on corporate matters.
Our controlling shareholders, WCR, LLC and BC Alpha Holdings I, LLC, which are under common control (see Item 12), had beneficial ownership of approximately 60.42% of our common stock as of March 20, 2020. As a result, the controlling shareholders have the ability to outright control our affairs through the election and removal of our entire Board of Directors and all other matters requiring shareholder approval, including a future merger or consolidation of the Company, or a sale of all or substantially all of our assets. This concentrated control limits the Company’s public float and could discourage others from initiating any such potential merger, consolidation or sale or other change-of-control transaction that may otherwise be beneficial to our shareholders. Furthermore, this concentrated control will limit the practical effect of your participation in Company matters, through shareholder votes and otherwise.
We are subject to risks associated with public health crises and epidemics/pandemics, such as the novel strain of coronavirus that recently originated in China.
We are exposed to risks associated with public health crises and epidemics/pandemics, such as the novel strain of coronavirus that recently originated in China (COVID-19). COVID-19 may have an adverse impact on our operations, supply chains and distribution systems and increase our expenses, including as a result of impacts associated with preventive and precautionary measures that we, other businesses and governments are taking. Due to these impacts and measures, we may experience significant and unpredictable reductions or increases in demand for certain of our products and services. In addition to existing travel restrictions, the United States, states or municipalities may impose prolonged quarantines or further restrict travel, which may significantly impact the ability of our employees to get to their places of work, or may significantly hamper our products from moving through the supply and distribution chains. As a result, given the rapid and evolving nature of the virus, COVID-19 could negatively affect our sales, and it is uncertain how COVID-19 will affect our operations generally if these impacts persist or exacerbate over an extended period of time. Any of these impacts could have a material adverse effect on our business, financial condition and results of operations.
11
Our certificate of incorporation grants our Board of Directors the power to issue additional shares of common and preferred stock and to designate other classes of preferred stock, all without shareholder approval.
Our authorized capital consists of 12.5 million shares of capital stock. Pursuant to authority granted by our certificate of incorporation, our Board of Directors, without any action by our shareholders, may designate and issue shares in such classes or series (including other classes or series of preferred stock) as it deems appropriate and establish the rights, preferences and privileges of such shares, including dividends, liquidation and voting rights, provided they are consistent with Delaware law. The rights of holders of other classes or series of stock that may be issued could be superior to the rights of holders of our common shares. The designation and issuance of shares of capital stock having preferential rights could adversely affect other rights appurtenant to shares of our common stock. Furthermore, any issuances of additional stock (common or preferred) will dilute the percentage of ownership interest of then-current holders of our capital stock and may dilute our book value per share.
Our common stock trades only in an illiquid trading market.
Trading of our common stock is conducted on the OTCQB, a tier of the OTC Markets (symbol: WCRS). This has an adverse effect on the liquidity of our common stock, not only in terms of the number of shares that can be bought and sold at a given price, but also through delays in the timing of transactions and reduction in security analysts’ and the media’s coverage of us and our common stock. This may result in lower prices for our common stock than might otherwise be obtained and could also result in a larger spread between the bid and asked prices for our common stock.
There is not now and there may not ever be an active market for shares of our common stock.
In general, there has been minimal trading volume in our common stock. During 2019, the average daily trading volume was under 1,500 shares. The small trading volume will likely make it difficult for our shareholders to sell their shares as and when they choose. Furthermore, small trading volumes are generally understood to depress market prices. As a result, you may not always be able to resell shares of our common stock publicly at the time and prices that you feel are fair or appropriate.
Failure to achieve and maintain effective internal controls could limit our ability to detect and prevent fraud and thereby adversely affect our business and stock price.
Effective internal controls are necessary for us to provide reliable financial reports. Nevertheless, all internal control systems, no matter how well designed, have inherent limitations. Even those systems determined to be effective can provide only reasonable assurance with respect to financial statement preparation and presentation. As we continue executing on our acquisition strategy, our fraud risks will change and likely increase as the acquired entity may be unfamiliar or uncooperative with proper internal controls and procedures. Our inability to maintain an effective control environment may cause investors to lose confidence in our reported financial information, which could in turn have a material adverse effect on our stock price.
Our reliance on information management and transaction systems to operate our business exposes us to potential security breaches of our sensitive information from cyber incidents and hacking.
Effective information security internal controls are necessary for us to protect our sensitive information from illegal activities and unauthorized disclosure. Despite our efforts to maintain the highest level of security around our information systems, the sophistication of hackers continues to increase. Our inability to maintain effective controls or utilization of information technology providers that also maintain effective controls may increase our vulnerability to cyber-attacks. Breaches of our information management systems could adversely affect our business reputation. We could also be subject to lawsuits or fines relating to the unauthorized disclosure of information. Any of these outcomes could negatively affect our results of operations and the price of our common stock.
Any disruption in the availability of our information systems could adversely affect our operations.
We rely upon our information systems to manage and operate our business. Our security measures could fail to prevent a disruption in the availability of our information systems, our back-up systems could fail to operate properly, or we may experience denial of service attacks or corruption of our data. Any disruption in the availability of our information systems could adversely affect our results of operations by impairing our ability to efficiently effect transactions.
12
A significant portion of our assets consists of goodwill and other intangible assets.
As of December 31, 2019, 10.7% of our assets consisted of goodwill and other intangible assets. Under generally accepted accounting principles, the carrying value of goodwill is subject to periodic review and testing to determine if it is impaired. The value of our assets will depend on market conditions, regulatory environment, the availability of buyers and similar factors. While the value of these assets is based on management projections and assumptions and is determined by using the discounted cash flow method for purposes of our impairment testing, those values may differ from what could ultimately be realized by us in a sales transaction or otherwise and that difference, while not affecting cash flow, could have a material adverse impact on our operating results and financial position.
Industry Risks
The payday loan industry is highly regulated under federal, state and local laws and regulations. Changes in federal, state or local laws and regulations governing lending practices, or changes in the interpretation of such laws and regulations, could negatively affect our business.
Our Consumer Finance segment activities are highly regulated under numerous federal, state and local laws, regulations and rules, which are subject to change. New laws, regulations or rules could be enacted or issued, interpretations of existing laws, regulations or rules may change and enforcement action by regulatory agencies may intensify.
Although states provide the primary regulatory framework under which we offer payday loans, certain federal laws also affect our business. For example, because payday loans are viewed as extensions of credit, we must comply with the federal Truth-in-Lending Act and Regulation Z under that Act. Additionally, we are subject to the Equal Credit Opportunity Act, the Gramm-Leach-Bliley Act and certain other federal laws.
From a federal standpoint, anti-payday loan legislation has occasionally been introduced in the U.S. Congress. Over the past several years, consumer advocacy groups and certain media reports have advocated governmental and regulatory action to prohibit or severely restrict sub-prime lending activities such as those we conduct. As outlined under “BUSINESS – REGULATION – Regulation of Consumer Financing Activities,” the CFPB released their final rule in October 2017 but announced in January 2018 that it is reconsidering the rule. If implemented in substantially its present form, the rule may put in question the viability of the entire industry and result in mass store closures.
In the states, there are nearly always bills pending to alter the current laws governing payday lending. There is also a current trend for consumer activist groups to seek law changes through a ballot initiative. Any of these bills or ballot initiatives, or future proposed legislation or regulations prohibiting payday loans or making them less profitable, could be passed in any state at any time, or existing laws permitting payday lending could expire. From time to time legislation banning payday loans has been introduced in Nebraska but has not been passed into law and there is currently an active ballot initiative in Nebraska to include on the 2020 ballot an initiated state statute capping annual interest on payday lenders to 36%. Since we derive a significant percentage of our payday revenues in Nebraska, the passage of any such legislation in Nebraska would have a highly material and negative effect on our consumer finance business.
Statutes authorizing payday loans typically provide state agencies that regulate banks and financial institutions with significant regulatory powers to administer and enforce the laws relating to payday lending. Under statutory authority, state regulators have broad discretionary power and may impose new licensing requirements, interpret or enforce existing regulatory requirements in different ways or issue new administrative rules, even if not contained in state statutes, that affect the way we do business and may force us to terminate or modify our operations in those jurisdictions. They may also impose rules that are generally adverse to our industry. Finally, in many states, the attorney general has scrutinized or continues to scrutinize the payday loan statutes and the interpretations of those statutes.
In sum, the passage of federal or state laws and regulations that govern or otherwise affect lending, or changes in interpretations of them, could, at any point, result in our curtailment or cessation of operations in certain or all jurisdictions or locations essentially prohibiting us from conducting our lending business in its current form. Any such legal or regulatory change would certainly have a material and adverse effect on us, our operating results, financial condition and prospects, and perhaps even our viability. Furthermore, any failure to comply with any applicable federal, state or local laws or regulations could result in fines, litigation, closure of one or more store locations and negative publicity.
13
Adverse changes in laws or regulations relating to pawn lending services could negatively impact our financial results and/or limit our ability to expand into new markets.
Our pawn lending products and services are subject to extensive regulation and supervision under various federal, state and local laws, ordinances and regulations. We face the risk that restrictions or limitations on pawn loan amounts, pawn loan yields and customer acceptance of pawn loan products resulting from the enactment, change or interpretation of laws and regulations could have a negative effect on our business activities. In particular, short-term consumer loans have come under increased scrutiny and increasingly restrictive regulation in recent years. Adoption of such federal, state or local regulation or legislation could restrict, or even eliminate, our ability to conduct our pawn lending operations at a profit level we consider reasonable at some or all of our stores, and could prevent us from expanding into new markets.
Litigation and regulatory actions directed toward the consumer finance industry or our Company could adversely affect our operating results, particularly in certain key states.
During the last few years, the consumer finance industry has been subject to regulatory proceedings, class action lawsuits and other litigation regarding the offering of payday loans, and we could suffer losses resulting from interpretations of state laws in those lawsuits or regulatory proceedings, even if we are not a party to those proceedings. The losses we could suffer could be directly incurred through our involvement in litigation or regulatory proceedings, or could be indirectly incurred through negative publicity regarding the industry in general that is generated by litigation on regulatory proceedings involving third parties.
In addition, regulatory actions or enforcement efforts taken with respect to money services businesses could negatively affect our ability to operate our consumer finance segment in our current form. For example, federal bank regulators are imposing significant costs and regulatory pressure on banks that do business with money services businesses, even though our business is conducted in a manner compliant with applicable law. As a result, fewer and fewer banks are willing to accept or even retain customers in the MSB industry. We may be forced to change long-standing banking relationships and change the way we operate our consumer finance operations, incurring additional capital expenditures and paying higher banking fees.
Public perception of payday lending as being predatory or abusive could adversely affect our business.
In recent years, consumer advocacy groups and media reports have advocated governmental action to prohibit or severely restrict payday loans. The consumer groups and media reports typically focus on the cost to a consumer for this type of loan, which is higher than the interest typically charged by credit card issuers. The consumer groups and media reports typically characterize these transactions as predatory or abusive toward consumers. If this negative characterization of payday lending becomes widely accepted by consumers, demand for our payday loans could significantly decrease, which could adversely affect our results of operations primarily by decreasing our revenues. Negative perception of payday lending activities could also result in our industry being subject to more restrictive laws and regulations and greater exposure to litigation.
Competition in the consumer finance industry is intense and could cause us to lose market share and revenues.
We believe that the primary competitive factors in the payday loan industry are store location and customer service. We face intense competition in the payday and pawn lending industry, and we believe that those markets are becoming more competitive as these industries mature and begin to consolidate. The payday loan industry has low barriers to entry, and new competitors, such as Wal-Mart, may easily enter the market. The pawn lending industry has medium level barriers to entry, however, there are several large pawn lending companies with which we directly compete. We also currently compete with services, such as overdraft protection offered by traditional financial institutions, and with other payday loan and check cashing stores and other financial service entities and retail businesses that offer payday loans or other similar financial services, as well as a rapidly growing internet-based payday loan market. Some of our competitors have larger and more established customer bases and substantially greater financial, marketing and other resources than we have. As a result, we could lose market share and our revenues could decline, thereby affecting our earnings and potential for growth.
We face significant cellular retail competition that may reduce our market share and lower our profits.
We face significant competition in our Cellular Retail segment. We compete with the four national wireless service providers (AT&T, Sprint, T-Mobile and Verizon Wireless) as well as other smaller brands or carriers such as U.S. Cellular, Boost Mobile and Metro by T-Mobile and with many mobile virtual network operators (“MVNOs”) such as Walmart’s Straight Talk and Family Mobile plans. We also compete with government-financed “lifeline assurance” programs that offer free or reduced-cost cellular services to individuals and families receiving many types of public assistance. Our ability to compete effectively will depend on, among other things, the pricing of cellular services and equipment, the quality of our customer service, the reach and quality of our sales and distribution channels and our capital resources. It will also depend on how successfully we anticipate and respond to various factors affecting our industry, including new technologies and business models, changes in consumer preferences, demographic trends and economic conditions.
14
The cellular retail industry also faces competition from other communications and technology companies seeking to capture customer revenue and brand dominance with respect to the provision of cellular accessories and services. For example, Apple Inc. packages software applications and content with its handsets, and Google Inc. has developed and deployed an operating system and related applications for mobile devices.
Free shipping pressure in the e-commerce industry could decrease our direct to consumer segment’s revenues and profitability.
The abundance of free shipping offers from Amazon.com and other online retailers is putting pressure on our Direct to Consumer segment shipping revenues, currently representing 15% of Direct to Consumer revenues. If market forces lead to the elimination of this revenue stream, it may be difficult for the Direct to Consumer segment to make up that lost revenue.
General economic conditions affect our loan losses, and accordingly, our results of operations could be adversely affected by a general economic slowdown or other negative economic conditions such as high unemployment.
Provision for loan losses, net of recoveries, is one of our largest Consumer Finance segment operating expenses, constituting approximately 11% of our loan fee revenues for the year ended December 31, 2019, with payday loan losses comprising most of the losses. Any changes in economic factors that adversely affect our customers, such as an economic downturn or high unemployment, could result in higher loan loss experiences than anticipated, which could in turn adversely affect our loan charge-offs and operating results.
A sustained deterioration in the economy could reduce demand for our products and services and result in reduced earnings.
A sudden or sustained deterioration in the economy could result in decreased demand for our seed, live plant, holiday gifts and home restoration products. This could result in decreased revenue and, because a significant portion of our sales in the Direct to Consumer segment are of live goods, inventory losses on live product acquired prior to a seasonal selling period could be significant.
In addition, a sudden or sustained deterioration in the economy could cause worsening performance of our pawn loans and in consumer demand for and resale value of pre-owned merchandise that we sell in our stores. This, in turn, could reduce the amount that we could effectively lend on an item of collateral. Such reductions could adversely affect pawn loan balances, pawn loan redemption rates, inventory balances, revenues and gross profit margins.
Company Risks
The concentration of our Consumer Finance revenues in certain states could adversely affect us.
We currently provide payday or installment lending services in six states. For the year ended December 31, 2019, Consumer Finance revenues from our locations in Nebraska represented approximately 35.4% of our total Consumer Finance segment revenues. For the foreseeable future, we expect that a material portion of our Consumer Finance revenues will continue to be generated in Nebraska. In addition, for the year ended December 31, 2019, Consumer Finance revenues from our North Dakota, Iowa and Wyoming stores represented approximately 25.3%, 16.4% and 14.5% of our total Consumer Finance revenues, respectively. Changes to prevailing economic, demographic, competitive, regulatory or any other conditions, including the legislative, regulatory or litigation risks mentioned above, in the markets in which we operate, and in Nebraska in particular, could lead to a reduction in demand for our services and result in a decline in our revenues or an increase in our provision for doubtful accounts, or even an outright legal prohibition on the conduct of our business. In this regard, we are aware of pending legislation in Nebraska that is aimed at eliminating payday lending in that state and permitting short-term loans in the nature of installment loans and of a ballot initiative capping annual interest on payday lenders to 36%. Any of these outcomes could in turn result in a material and swift deterioration of our Consumer Finance segment financial condition principally by impairing its revenues and affecting its ability to obtain financing and operating liquidity, its operating results and its business prospects.
15
If estimates of our loan losses are not adequate to absorb actual losses, our financial condition and results of operations may be adversely affected.
We maintain an allowance for loan losses at levels to cover the estimated incurred losses in the collection of our payday and installment loan portfolios outstanding at the end of each applicable period. At the end of each period, management considers recent collection history to develop expected loss rates, which are used to establish the allowance for loan losses. Our allowance for loan losses was $0.67 million on December 31, 2019. Our allowance for loan losses is an estimate, and if actual loan losses are materially greater than our allowance for losses, our financial condition and results of operations could be adversely affected.
We face substantial risk through reliance on a single wireless retail carrier.
We operate our Cellular Retail segment exclusively as an authorized dealer for Cricket, which means that this segment of our operations is entirely dependent upon continued operations as a Cricket dealer under our dealer agreement with Cricket Wireless, the commitment of Cricket Wireless to advertise and offer competitive product and service offerings in our markets, and the health of our relationship with Cricket Wireless. If Cricket Wireless were to change certain aspects of its dealer arrangements, including items such as pricing, product supply, credit terms and dealer compensation structure (all of which are primarily determined by Cricket Wireless) in a manner that is adverse to us, our margins and results of operations would likely suffer. In addition, if Cricket Wireless were to begin growing its relationship with other operators, or were to embark upon an effort to significantly grow corporate-owned locations, our prospects for growth in this segment would suffer.
Managing our inventory is complex and may include write-downs of excess or obsolete inventory.
Managing our inventory, across our segments, is complicated by a number of factors, including the need to maintain a significant inventory of finished goods to support our cellular retail locations and online orders for our products that we anticipate but may not be received. These issues may cause us to purchase and maintain significant amounts of inventory. If this inventory is not used as expected based on anticipated requirements, it may become excess or obsolete. The existence of excess or obsolete inventory can result in sales price reductions or inventory write-downs, which could adversely affect our business and results of operations.
Outside factors may affect our ability to obtain product and fulfill orders in our Direct to Consumer segment.
In our Direct to Consumer segment we have year-to-year agreements with third party wholesale growers that could be impacted by changes in their business operations, including, but not limited to plant disease, financial difficulties, labor disruptions, land lease issues and water supplies. Although J&P Park Acquisition, Inc. ("JPPA") has taken steps to purchase from multiple vendors and identify alternate sources of supply, the long lead time involved in growing operations could mean the Company might not be able to obtain certain crops at certain times. Certain of the Company’s growers also compete with the Company through their own direct-to-consumer selling operations. Additionally, the recent COVID-19 virus has caused some imported products to be delayed. There could be further disruptions, whether caused by the third party wholesaler, pandemic, weather or other environmental or climate influences that could limit the supply of product we rely upon to fulfill orders.
Because we maintain a significant supply of cash in our locations, we may experience losses due to employee error and theft.
Because our business requires us to maintain a significant supply of cash in our stores, we are subject to the risk of cash shortages resulting from employee error and theft. We periodically experience employee error and theft in stores, which can significantly increase the operating losses of those stores for the period in which the employee error or theft is discovered. We self-insure for employee error and theft at the store level. If our controls to limit our exposure to employee error and theft at the store level and at our corporate headquarters do not operate effectively or are structured ineffectively, our operating margins could be adversely affected by costs associated with increased security and preventative measures.
Regular turnover among our location managers and employees makes it more difficult for us to operate our locations and increases our costs of operation.
We experience a relatively stable workforce among our location managers and employees. Turnover interferes with implementation of operating strategies. Increases in our workforce turnover in the future would likely increase our operating pressures and operating costs and could restrict our ability to grow. Additionally, high turnover would create challenges for us in maintaining high levels of employee awareness of and compliance with our internal procedures and external regulatory compliance requirements. In sum, high turnover would increase our training and supervisory costs, and result in decreased earnings with corresponding greater risks of regulatory non-compliance.
16
A significant disruption in our computer systems and our inability to adequately maintain and update those systems could adversely affect our operations and our ability to maintain the confidence of our customers and business partners.
We rely extensively on our computer systems to manage our businesses. Our systems are subject to damage or interruption from power outages, telecommunications failures, computer viruses, malicious attacks, security breaches, and catastrophic events. If our systems are damaged or fail to function properly or reliably, we may incur substantial repair or replacement costs, experience data loss or theft and impediments to our ability to manage inventories or process customer transactions, engage in additional promotional activities to retain our customers, and encounter lost confidence of our customers and other business partners, which could adversely affect our results of operations.
We regularly invest to maintain and update our computer systems. Implementing significant system changes increases the risk of computer system disruption. The potential problems and interruptions associated with implementing technology initiatives, as well as providing training and support for those initiatives, could disrupt or reduce our operational efficiency, and could negatively impact customer experience and confidence of our customers and other business partners.
If our efforts to protect the security of information about our customers, vendors and other third parties are unsuccessful, we may face costly government enforcement actions and private litigation, and our sales and reputation could suffer.
We regularly receive and store information about our customers, vendors and other third parties. We have programs in place to detect, contain, and respond to data security incidents. However, because the techniques used to obtain unauthorized access, disable or degrade service, or sabotage systems change frequently and may be difficult to detect for long periods of time, we may be unable to anticipate these techniques or implement adequate preventive measures. In addition, hardware, software, or applications we develop or procure from third parties or through open source solutions may contain defects in design or manufacture or other problems that could unexpectedly compromise information security. Unauthorized parties may also attempt to gain access to our systems or facilities, or those of third parties with whom we do business, through fraud, trickery, or other forms of deceiving our team members, contractors, and vendors.
If we, our vendors, or other third parties with whom we do business experience additional significant data security breaches or fail to detect and appropriately respond to significant data security breaches, we could be exposed to government enforcement actions or private litigation. In addition, our customers could lose confidence in our ability to protect their information, which could cause them to no longer purchase our products or use our services.
ITEM 1B UNRESOLVED STAFF COMMENTS
None.
Our headquarters is in Omaha, Nebraska. We lease a 12,420-square-foot space which is used as our corporate headquarters as well as headquarters for our Cellular Retail and Consumer Finance segments, with additional space available, which is sufficient for our projected near-term future growth. Our monthly lease amount is currently $13,943 and the lease expires on January 31, 2025. The corporate phone number is (402) 551-8888.
Our Direct to Consumer segment, acquired on July 1, 2015, owns a 100-acre property with a 382,790 square foot facility in Greenwood, South Carolina. This facility is utilized as JPPA distribution and warehouse facility and corporate offices. The real estate is not encumbered as of December 31, 2019.
We are involved in a variety of legal claims and proceedings incidental to our business, including customer bankruptcy and employment-related matters from time to time, and other legal matters that arise in the normal course of business. We believe these claims and proceedings are not out of the ordinary course for a business of the type and size in which we are engaged. While we are unable to predict the ultimate outcome of these claims and proceedings, management believes there is not a reasonable possibility that the costs and liabilities of such matters, individually or in the aggregate, will have a material adverse effect on our consolidated financial condition or consolidated results of operations.
ITEM 4 MINE SAFETY DISCLOSURES
Not applicable.
17
ITEM 5 MARKET FOR REGISTRANT’S COMMON EQUITY, RELATED SHAREHOLDER MATTERS
MARKET INFORMATION
Our common stock is listed for trading under the symbol “WCRS” on the “OTCQB,” which is the OTC Markets’ middle-tier over-the-counter quotation platform. The transfer agent and registrar for our common stock is Corporate Stock Transfer, Inc., located at 3200 Cherry Creek Drive South, Suite 430, Denver, Colorado 80209.
HOLDERS
As of the date of this report, we had 9,265,778 shares of common stock outstanding held by approximately 250 holders of record.
18
PURCHASES OF EQUITY SECURITIES BY THE ISSUER AND AFFILIATED PURCHASERS
The following table provides information about purchases of Western Capital Resources, Inc. common stock by us during the three months ended December 31, 2019.
|
Share Repurchases |
||||||||||||||||||||
|
Period Beginning |
|
Period |
|
|
Total Number of Shares Purchased |
|
|
Average Price Paid Per Share |
|
|
Total Number of Shares Purchased as Part of Board Approved Plans or Programs |
|
|
Approximate Dollar Value of Shares That May Yet Be Purchased Under the Program (1) |
|
|||||
|
October 1, 2019 |
|
|
October 31, 2019 |
|
|
|
— |
|
|
$ |
— |
|
|
|
— |
|
|
$ |
831,500 |
|
|
November 1, 2019 |
|
|
November 30, 2019 |
|
|
|
22,100 |
|
|
|
4.15 |
|
|
|
22,100 |
|
|
|
739,700 |
|
|
December 1, 2019 |
|
|
December 31, 2019 |
|
|
|
60,817 |
|
|
|
4.32 |
|
|
|
60,817 |
|
|
|
476,900 |
|
|
|
|
|
|
|
|
|
82,917 |
|
|
$ |
— |
|
|
|
82,917 |
|
|
|
|
|
|
(1) |
On September 13, 2018, our Board of Directors authorized a share repurchase program under which we may repurchase up to $1 million of common stock. Repurchases may be made from time to time on the open market or through privately negotiated transactions. |
| In March 2020, our Board of Directors amended the repurchase program, increasing the amount of share repurchases authorized from $1 million to $2 million. |
DESCRIPTION OF EQUITY SECURITIES
Our authorized capital stock consists of 12.5 million shares of common stock, $0.0001 par value per share (unless otherwise determined by the Board of Directors). All shares of common stock have equal voting rights and are entitled to one vote per share on all matters to be voted upon by our shareholders. Shares of our common stock have no preemptive, subscription, conversion or redemption rights and may be issued only as fully paid and non-assessable shares. Cumulative voting in the election of directors is not permitted. In the event of our liquidation, each holder of our common stock is entitled to receive a proportionate share of our assets available for distribution to stockholders after the payment of liabilities. All shares of our common stock issued and outstanding are fully paid and non-assessable.
|
SELECTED FINANCIAL DATA |
Not applicable.
|
MANAGEMENT’S DISCUSSION AND ANALYSIS OF FINANCIAL CONDITION AND RESULTS OF OPERATIONS |
The following discussion should be read in conjunction with the consolidated financial statements and related notes that appear elsewhere in this report. This discussion contains forward-looking statements that involve significant uncertainties. Our actual results could differ materially from those anticipated in these forward-looking statements as a result of various factors, including those discussed in “Risk Factors” elsewhere in this report. For further information, see “Forward-Looking Statements” below.
19
OVERVIEW
Our growth focus in 2016 and 2017 was in the Cellular Retail segment. We began 2016 operating 99 Cricket retail locations and by the end of 2017 we were operating 278. The growth came from a combination of launching new locations and acquiring existing stores from other Cricket dealers. Many of the locations did not develop as anticipated; therefore, by transferring some stores to other authorized Cricket dealers while closing other retail locations we reduced the number of retail stores operated within our Cellular Retail segment to 205 during fiscal year 2018. This strategy continued throughout 2019, when we added 69 locations, primarily through joint ventures, and shed 52 locations in sales or closures. At the end of 2019 our Cellular Retail segment operated 222 locations. We believe these maneuvers will play a significant role in further developing the profitability of the Cellular Retail segment. As the industry undergoes changes, we are continually reviewing opportunities to take strategic action.
RESULTS OF OPERATIONS:
YEAR ENDED DECEMBER 31, 2019 COMPARED TO YEAR ENDED DECEMBER 31, 2018
Net income (loss) attributable to our common shareholders was $2.32 million, or $0.25 per share, in 2019 compared to ($2.24) million, or ($0.24) per share, in 2018. Both the Cellular Retail and Direct to Consumer segments experienced losses in 2018 and returned to profitability in 2019. Revenues increased from $114 million in 2018 to $117 million in 2019, with the Cellular Retail segment being the contributor to the increase.
20
The following table provides year-over-year revenues and net income attributable to WCR common shareholders by operating segment (in thousands):
|
|
|
Cellular |
|
|
Direct to |
|
|
Consumer |
|
|
Corporate |
|
|
Total |
|
|||||
|
Year Ended December 31, 2019 |
|
|
|
|
|
|
|
|
|
|
|
|
|
|
|
|
|
|
|
|
|
Revenue from external customers |
|
$ |
68,682 |
|
|
$ |
38,024 |
|
|
$ |
1,696 |
|
|
$ |
— |
|
|
$ |
108,402 |
|
|
Fee and interest income |
|
$ |
— |
|
|
$ |
— |
|
|
$ |
8,513 |
|
|
$ |
— |
|
|
$ |
8,513 |
|
|
Total revenue |
|
$ |
68,682 |
|
|
$ |
38,024 |
|
|
$ |
10,209 |
|
|
$ |
— |
|
|
$ |
116,915 |
|
|
% of total revenue |
|
|
58.8 |
% |
|
|
32.5 |
% |
|
|
8.7 |
% |
|
|
0.0 |
% |
|
|
100.0 |
% |
|
Net income (loss) |
|
$ |
2,502 |
|
|
$ |
588 |
|
|
$ |
1,066 |
|
|
$ |
(700 |
) |
|
$ |
3,456 |
|
|
Net income (loss) attributable to noncontrolling interests |
|
$ |
1,135 |
|
|
$ |
— |
|
|
$ |
— |
|
|
$ |
— |
|
|
$ |
1,135 |
|
|
Net income (loss) attributable to WCR common shareholders |
|
$ |
1,366 |
|
|
$ |
588 |
|
|
$ |
1,066 |
|
|
$ |
(700 |
) |
|
$ |
2,320 |
|
|
|
|
|
|
|
|
|
|
|
|
|
|
|
|
|
|
|
|
|
|
|
|
Year Ended December 31, 2018 |
|
|
|
|
|
|
|
|
|
|
|
|
|
|
|
|
|
|
|
|
|
Revenue from external customers |
|
$ |
65,096 |
|
|
$ |
38,433 |
|
|
$ |
1,813 |
|
|
$ |
— |
|
|
$ |
105,342 |
|
|
Fee and interest income |
|
$ |
— |
|
|
$ |
— |
|
|
$ |
8,923 |
|
|
$ |
— |
|
|
$ |
8,923 |
|
|
Total revenue |
|
$ |
65,096 |
|
|
$ |
38,433 |
|
|
$ |
10,736 |
|
|
$ |
— |
|
|
$ |
114,265 |
|
|
% of total revenue |
|
|
57.0 |
% |
|
|
33.6 |
% |
|
|
9.4 |
% |
|
|
— |
% |
|
|
100.0 |
% |
|
Net income (loss) |
|
$ |
(1,272 |
) |
|
$ |
(481 |
) |
|
$ |
1,117 |
|
|
$ |
(885 |
) |
|
$ |
(1,521 |
) |
|
Net income (loss) attributable to noncontrolling interests |
|
$ |
720 |
|
|
$ |
— |
|
|
$ |
— |
|
|
$ |
— |
|
|
$ |
720 |
|
|
Net income (loss) attributable to WCR common shareholders |
|
$ |
(1,992 |
) |
|
$ |
(481 |
) |
|
$ |
1,117 |
|
|
$ |
(885 |
) |
|
$ |
(2,241 |
) |
21
Cellular Retail
The following table summarizes our Cellular Retail segment operating results:
| Year
Ended December 31, (in thousands) |
2019 % of | 2018 % of | ||||||||||||||
| 2019 | 2018 | Revenues | Revenues | |||||||||||||
| Revenues: | ||||||||||||||||
| Retail sales and associated fees | $ | 52,377 | $ | 49,013 | 76.3 | % | 75.3 | % | ||||||||
| Other revenue | 16,305 | 16,083 | 23.7 | % | 24.7 | % | ||||||||||
| 68,682 | 65,096 | 100.0 | % | 100.0 | % | |||||||||||
| Cost of revenues | 28,863 | 25,747 | 42.0 | % | 39.6 | % | ||||||||||
| Gross profit | 39,819 | 39,349 | 58.0 | % | 60.4 | % | ||||||||||
| Salaries, wages and benefits expense | 21,360 | 22,033 | 31.1 | % | 33.8 | % | ||||||||||
| Occupancy expense | 8,929 | 10,286 | 13.0 | % | 15.8 | % | ||||||||||
| Depreciation and amortization expense | 1,960 | 2,121 | 2.9 | % | 3.3 | % | ||||||||||
| Interest expense | 62 | 47 | 0.1 | % | 0.1 | % | ||||||||||
| Other expense | 4,516 | 6,707 | 6.6 | % | 10.3 | % | ||||||||||
| Provision for income taxes | 490 | (573 | ) | 0.7 | % | (0.9 | )% | |||||||||
| 37,317 | 40,621 | 54.4 | % | 62.4 | % | |||||||||||
| Net (loss) income | $ | 2,502 | $ | (1,272 | ) | 3.6 | % | (2.0 | )% | |||||||
Segment contribution to net income (loss) before noncontrolling interests was $2.50 million in 2019 compared to ($1.27) million in 2018. Many of our 2016 and 2017 growth initiative store launches did not meet sales growth expectations resulting in store operating losses and costs of closures being a drag on operating results in 2018. Expense to close or transfer stores to other dealers, including losses on disposal of fixed assets, was in excess of $1.70 million in 2018, and is included above in other expense.
Direct to Consumer
The following table summarizes our actual Direct to Consumer segment operating results:
| Year
Ended December 31, (in thousands) |
2019 % of | 2018 % of | ||||||||||||||
| 2019 | 2018 | Revenues | Revenues | |||||||||||||
| Revenues | $ | 38,024 | $ | 38,433 | 100.0 | % | 100.0 | % | ||||||||
| Cost of revenues | 19,800 | 20,936 | 52.1 | % | 54.5 | % | ||||||||||
| Gross profit | 18,224 | 17,497 | 47.9 | % | 45.5 | % | ||||||||||
| Salaries, wages and benefits expense | 6,474 | 6,297 | 17.0 | % | 16.4 | % | ||||||||||
| Occupancy expense | 531 | 549 | 1.4 | % | 1.4 | % | ||||||||||
| Depreciation and amortization expense | 513 | 512 | 1.4 | % | 1.3 | % | ||||||||||
| Interest expense | 2 | 5 | — | % | — | % | ||||||||||
| Other expense | 9,941 | 10,751 | 26.1 | % | 28.0 | % | ||||||||||
| Provision for income taxes | 175 | (136 | ) | 0.5 | % | (0.4 | )% | |||||||||
| 17,636 | 17,978 | 46.3 | % | 46.7 | % | |||||||||||
| Net income (loss) | $ | 588 | $ | (481 | ) | 1.5 | % | (1.2 | )% | |||||||
The Direct to Consumer segment contributed $0.59 million of net income in 2019 compared to ($0.48) million of net loss in 2018. The segment was challenged with lost sales in 2018 due to unfavorable weather patterns. In 2019, the segment experienced a decrease in product sales but was able to partially mitigate the decrease with less free or discounted shipping promotions and better expense management.
22
Consumer Finance
The following table summarizes our Consumer Finance segment operating results:
| Year Ended December 31, (in thousands) |
2019 % of | 2018 % of | ||||||||||||||
| 2019 | 2018 | Revenues | Revenues | |||||||||||||
| Revenues: | ||||||||||||||||
| Retail sales | $ | 1,369 | $ | 1,448 | 13.4 | % | 13.5 | % | ||||||||
| Financing fees and interest | 8,513 | 8,923 | 83.4 | % | 83.1 | % | ||||||||||
| Other revenue | 328 | 364 | 3.2 | % | 3.4 | % | ||||||||||
| 10,210 | 10,735 | 100.0 | % | 100.0 | % | |||||||||||
| Cost of revenues | 1,833 | 2,179 | 18.0 | % | 20.3 | % | ||||||||||
| Gross profit | 8,377 | 8,556 | 82.0 | % | 79.7 | % | ||||||||||
| Salaries, wages and benefits expense | 3,692 | 3,689 | 36.2 | % | 34.3 | % | ||||||||||
| Occupancy expense | 1,244 | 1,284 | 12.2 | % | 12.0 | % | ||||||||||
| Depreciation and amortization expense | 31 | 51 | 0.3 | % | 0.5 | % | ||||||||||
| Other expense | 1,963 | 2,018 | 19.2 | % | 18.8 | % | ||||||||||
| Provision for income taxes | 381 | 397 | 3.7 | % | 3.7 | % | ||||||||||
| 7,311 | 7,439 | 71.6 | % | 69.3 | % | |||||||||||
| Net income | $ | 1,066 | $ | 1,117 | 10.4 | % | 10.4 | % | ||||||||
Consumer Finance segment net income decreased to $1.07 million in 2019 from $1.12 million in 2018, the decrease being directly attributable to the continued industry decline in payday lending activity and the closing of our Colorado location. Consumer Finance had full-year operations in six states during 2019 compared to seven states in 2018.
Corporate
Net cost of our Corporate segment was ($0.70) million for the year ended December 31, 2019 compared to ($0.89) million for the year ended December 31, 2018, the reduced net cost due in part the reduced interest expense and increased investment income.
Consolidated Income Tax Expense
Income tax expense was $0.91 million for 2019 compared to tax benefit of $0.62 million for 2018 for an effective rate of 20.8% and 28.9%, respectively. Income before income taxes attributable to noncontrolling interest flows through to the noncontrolling interest and thus is not taxable at the Company level. Excluding the non-taxable flow-through income to the non-controlling interest, the effective rate for 2019 and 2018 is 28.1% and 21.6%, respectively. The effective rate increase year over year is a due to a combination of many state income taxation factors, including forfeited net operating losses in states we exited in 2018 or 2019, changes in apportionment of taxable income (loss) among states and the impact of minimum state taxes in a loss year.
LIQUIDITY AND CAPITAL RESOURCES
Summary cash flow data is as follows:
|
|
|
Year Ended December 31, |
|
|||||
|
|
|
2019 |
|
|
2018 |
|
||
|
|
|
|
|
|
|
|
|
|
|
Cash flows provided (used) by: |
|
|
|
|
|
|
|
|
|
Operating activities |
|
$ |
4,824,658 |
|
|
$ |
(16,287,103 |
) |
|
Investing activities |
|
|
9,748,911 |
|
|
|
14,304,374 |
|
|
Financing activities |
|
|
(4,166,012 |
) |
|
|
(2,588,107 |
) |
|
Net increase in cash |
|
|
10,407,557 |
|
|
|
(4,570,836 |
) |
|
Cash and cash equivalents, beginning of year |
|
|
16,724,983 |
|
|
|
21,295,819 |
|
|
Cash and cash equivalents, end of year |
|
$ |
27,132,540 |
|
|
$ |
16,724,983 |
|
23
At December 31, 2019, we had cash and cash equivalents of $27.13 million compared to cash and cash equivalents of $16.72 million on December 31, 2018. We believe that our available cash, combined with expected cash flows from operations and our held-to-maturity investments, will be sufficient to fund our liquidity and capital expenditure requirements through March of 2021. Our expected short-term uses of available cash include the funding of operating activities and the payment of dividends.
In addition to cash and cash equivalents, at December 31, 2019, we had $9.05 million invested in certificates of deposit (limited to $250,000 per financial institution per entity) and approximately $7.21 million in short-term T-Bills or Notes.
In October 2019, we received $3,367,940, the scheduled release of the remaining 50% of the funds held in escrow relating to the 2017 sale of our Franchise segment, together with interest earned.
At December 31, 2019, our outstanding debt and capital lease obligations were $1.09 million compared to $0.84 million at December 31, 2018.
On April 21, 2016, we entered into a revolver and acquisition credit facility with a financial institution. The facility included a $9 million acquisition facility commitment and a $3 million revolving credit commitment. Interest accrued on advanced funds at LIBOR plus 3.5%. The facility was extended for two years when it was scheduled to mature on April 21, 2018. Considering the amount of our cash and cash equivalent and investment holdings available, on October 8, 2019, we terminated the credit facility.
CRITICAL ACCOUNTING POLICIES
Our consolidated financial statements and accompanying notes have been prepared in accordance with accounting principles generally accepted in the United States of America applied on a consistent basis. The preparation of these consolidated financial statements requires us to make a number of estimates and assumptions that affect the reported amounts of assets and liabilities, the disclosure of contingent assets and liabilities at the date of the consolidated financial statements and the reported amounts of revenues and expenses during the reporting periods. We evaluate these estimates and assumptions on an ongoing basis. We base these estimates on the information currently available to us and on various other assumptions that we believe are reasonable under the circumstances. Actual results could vary materially from these estimates under different assumptions or conditions.
Our significant accounting policies are discussed in Note 1, “Nature of Business and Summary of Significant Accounting Policies,” of the notes to our consolidated financial statements included in this report. We believe that the following critical accounting policies affect the more significant estimates and assumptions used in the preparation of our consolidated financial statements:
Receivables and Loss Allowance
Direct to Consumer
Receivables are recorded when billed or accrued and represent claims against third parties that will be settled in cash. The carrying value of receivables, net of the allowance for doubtful accounts, represents their estimated net realizable value. The allowance for doubtful accounts is estimated based on historical collection trends, type of customer, the age of outstanding receivables and existing economic conditions. If events or changes in circumstances indicate that specific receivable balances may be impaired, further consideration is given to the collectability of those balances and the allowance is adjusted accordingly. Past due receivable balances are written-off when internal collection efforts have been unsuccessful in collecting the amount due.
Consumer Finance
Included in loans receivable are unpaid principal, interest and fee balances of payday, installment, pawn and title loans that have not reached their maturity date, and “late” payday loans that have reached maturity within the last 180 days and have remaining outstanding balances. Late payday loans generally are unpaid loans where a customer’s personal check has been deposited and the check has been returned due to non-sufficient funds in the customer’s account, a closed account, or other reasons. All returned items are charged-off after 180 days, as collections after that date have not been significant. Loans are carried at cost plus accrued interest or fees less payments made and a loans receivable allowance.
24
We do not specifically reserve for any individual payday, installment or title loan. Instead, we aggregate loan types for purposes of estimating the loss allowance using a methodology that analyzes historical portfolio statistics and management’s judgment regarding recent trends noted in the portfolio. This methodology takes into account several factors, including (1) the amount of loan principal, interest and fee outstanding, (2) historical charge offs from loans that originated during the last 24 months, (3) current and expected collection patterns and (4) current economic trends. We utilize a software program to assist with the tracking of our historical portfolio statistics. A loan loss allowance is maintained for anticipated losses for payday and installment loans based primarily on our historical percentages by loan type of net charge offs, applied against the applicable balance of loan principal, interest and fees outstanding. We also periodically perform a look-back analysis on our loan loss allowance to verify the historical allowance established tracks with the actual subsequent loan write-offs and recoveries. We are aware that as conditions change, we may also need to make additional allowances in future periods. Loan losses or charge-offs of pawn loans are not recorded because the value of the collateral exceeds the loan amount.
See Note 4, “Loans Receivable,” and Note 5, “Loans Receivable Allowance,” of the notes to our consolidated financial statements included in this report for our outstanding loans receivable aging and loans receivable allowance rollforward as of and for the year ended December 31, 2019 and December 31, 2018.
Inventory
We value inventories at the lower of cost or market. Reserves for excess and obsolescence are estimated and recorded to reduce the carrying value to estimated net realizable value. The amount of the reserve is determined based on historical usage, projected sales information, plans for discontinued products and other factors. Though management considers these reserves adequate and proper, changes in sales volumes due to unexpected economic or competitive conditions are among the factors that could materially affect the adequacy of this reserve.
Long-lived Assets
Property and equipment are recorded at cost less accumulated depreciation. Depreciation is provided on the straight-line method over the estimated useful lives of the asset. The cost of maintenance and repairs is charged to operations as incurred while renewals and betterments are capitalized.
Finite-lived intangible assets represent the fair values management assigned to assets acquired through business acquisitions, are amortized over periods of three to 15 years based on management’s estimates of the useful life of the asset and are subject to impairment evaluations.
We assess the possibility of impairment of long-lived assets, other than goodwill, whenever events or changes in circumstances indicate that the carrying value may not be recoverable. Factors that could trigger an impairment review include significant underperformance relative to expected historical or projected future cash flows, significant changes in the manner of use of acquired assets or the strategy for the overall business, and significant negative industry events or trends.
Leases
The Company has many retail lease agreements which are accounted for as operating leases. The Company determines if an arrangement is or contains a lease at inception. Operating leases are included in operating lease right-of-use (“ROU”) assets and operating lease liabilities (current and noncurrent).
ROU assets and lease liabilities are recognized based on the present value of future minimum lease payments over the lease term at commencement date. As most of the Company’s leases do not provide an implicit rate, Management used the Company’s collateralized incremental borrowing rate based on the information available at commencement date in determining the present value of future payments.
Due to the significant assumptions and judgements required in accounting for leases (to include whether a contract contains a lease, the allocation of the consideration, and the determination of the discount rate), the judgment and estimates made could have a significant effect on the amount of assets and liabilities recognized.
Goodwill
Goodwill represents the excess of acquisition cost over the fair value of identifiable finite lived net assets acquired and is not amortized. Goodwill is tested for impairment annually as of October 1, or more frequently if events or changes in circumstances indicate potential impairment. We test for goodwill impairment at the reporting unit level, which aligns with the Company’s segments. We perform a qualitative assessment to determine if a quantitative impairment test is necessary. If quantitative testing is necessary based on a qualitative assessment, we apply a fair value test. This fair value test involves a two-step process. The first step is to compare the carrying value of our net assets to our fair value. If the fair value is determined to be less than the carrying value, a second step is performed to measure the amount of the impairment, if any.
OFF BALANCE SHEET ARRANGEMENTS
We have no off balance sheet arrangements.
CAUTIONARY NOTE REGARDING FORWARD-LOOKING STATEMENTS
Some of the statements made in this report are “forward-looking statements,” as that term is defined under Section 27A of the Securities Act and Section 21E of the Securities Exchange Act of 1934. These forward-looking statements are based upon our current expectations and projections about future events. Whenever used in this report, the words “believe,” “anticipate,” “intend,” “estimate,” “expect,” “will” and similar expressions, or the negative of such words and expressions, are intended to identify forward-looking statements, although not all forward-looking statements contain such words or expressions. The forward-looking statements in this report are primarily located in the material set forth under the headings “Description of Business,” “Risk Factors,” “Management’s Discussion and Analysis of Financial Condition and Results of Operations,” but are found in other parts of this report as well. These forward-looking statements generally relate to our plans, objectives and expectations for future operations and are based upon management’s current estimates and projections of future results or trends. Although we believe that our plans and objectives reflected in or suggested by these forward-looking statements are reasonable, we may not achieve these plans or objectives. You should read this report completely and with the understanding that actual future results may be materially different from what we expect. We are not undertaking any obligation to update any forward-looking statements even though our situation may change in the future.
25
Specific factors that might cause actual results to differ from our expectations or may affect the value of the common stock, include, but are not limited to:
|
|
● |
Changes in local, state or federal laws and regulations governing lending practices, or changes in the interpretation of such laws and regulations; |
|
|
● |
Litigation and regulatory actions directed toward the consumer finance industry or us, particularly in certain key states; |
|
|
● |
Our need for additional financing; |
|
|
● |
Changes in our authorization to be a dealer for Cricket Wireless; |
|
|
● |
Changes in authorized Cricket dealer compensation; |
|
● |
Lack in advertising support and sales promotions from Cricket Wireless in the markets we operate; |
| ● | Direct and indirect effects of COVID-19 on our employees, customers, our supply chain, the economy and financial markets; and |
|
|
● |
Unpredictability or uncertainty in financing and merger and acquisition markets, which could impair our ability to grow our business through acquisitions. |
Other factors that could cause actual results to differ from those implied by the forward-looking statements in this report are more fully described in the “Risk Factors” section and of this report.
Industry data and other statistical information used in this report are based on independent publications, government publications, reports by market research firms or other published independent sources. Some data are also based on our good faith estimates, derived from our review of internal surveys and the independent sources listed above. Although we believe these sources are reliable, we have not independently verified the information.
ITEM 7A QUANTITATIVE AND QUALITATIVE DISCLOSURES ABOUT MARKET RISK
Not applicable.
26
ITEM 8 FINANCIAL STATEMENTS AND SUPPLEMENTARY DATA
INDEX OF FINANCIAL INFORMATION
CONTENTS
|
|
|
Page(s) |
|
|
F-1 |
|
|
|
|
|
|
CONSOLIDATED FINANCIAL STATEMENTS |
|
|
|
|
F-2 |
|
|
|
|
|
|
|
F-3 |
|
|
|
|
|
|
|
F-4 |
|
|
|
|
|
|
|
F-5 |
|
|
|
|
|
|
|
F-6 |
27

REPORT OF INDEPENDENT REGISTERED PUBLIC ACCOUNTING FIRM
To the Board of Directors and Shareholders of Western Capital Resources, Inc.:
Opinion on the Financial Statements
We have audited the accompanying consolidated balance sheets of Western Capital Resources, Inc. (“the Company”) as of December 31, 2019 and 2018, the related consolidated statements of operations, stockholders’ equity, and cash flows for each of the years in the two-year period ended December 31, 2019 and the related notes (collectively referred to as the “financial statements”). In our opinion, the financial statements referred to above present fairly, in all material respects, the financial position of the Company as of December 31, 2019 and 2018, and the results of its operations and its cash flows for each of the years in the two-year period ended December 31, 2019, in conformity with accounting principles generally accepted in the United States of America.
Basis for Opinion
These financial statements are the responsibility of the Company’s management. Our responsibility is to express an opinion on the Company’s financial statements based on our audits. We are a public accounting firm registered with the Public Company Accounting Oversight Board (United States) (“PCAOB”) and are required to be independent with respect to the Company in accordance with the U.S. federal securities laws and the applicable rules and regulations of the Securities and Exchange Commission and the PCAOB.
We conducted our audits in accordance with the standards of the PCAOB. Those standards require that we plan and perform the audit to obtain reasonable assurance about whether the financial statements are free of material misstatement, whether due to error or fraud. The Company is not required to have, nor were we engaged to perform, an audit of its internal control over financial reporting. As part of our audits, we are required to obtain an understanding of internal control over financial reporting, but not for the purpose of expressing an opinion on the effectiveness of the Company’s internal control over financial reporting. Accordingly, we express no such opinion.
Our audits included performing procedures to assess the risks of material misstatement of the financial statements, whether due to error or fraud, and performing procedures that respond to those risks. Such procedures included examining on a test basis, evidence regarding the amounts and disclosures in the financial statements. Our audits also included evaluating the accounting principles used and significant estimates made by management, as well as evaluating the overall presentation of the financial statements. We believe that our audits provide a reasonable basis for our opinion.
/s/ Sadler, Gibb & Associates, LLC
We have served as the Company’s auditor since 2017.
Salt Lake City, UT
March 30, 2020
office 801.783.2950
fax 801.783.2960
www.sadlergibb.com | Main: 2455 East Parleys Way Suite 320, Salt Lake City, UT 84109 | Provo: 3507 N University Ave #100, Provo, UT 84604
F-1
WESTERN CAPITAL RESOURCES, INC. AND SUBSIDIARIES
|
|
|
December 31, |
|
|||||
|
|
|
2019 |
|
|
2018 |
|
||
|
ASSETS |
|
|
|
|
|
|
|
|
|
|
|
|
|
|
|
|
|
|
|
CURRENT ASSETS |
|
|
|
|
|
|
|
|
|
Cash and cash equivalents |
|
$ |
27,132,540 |
|
|
$ |
16,724,983 |
|
|
Short-term investments |
|
|
14,756,665 |
|
|
|
22,394,748 |
|
|
Loans receivable (less allowance for losses of $673,000 and $818,000, respectively) |
|
|
3,860,411 |
|
|
|
4,111,842 |
|
|
Accounts receivable (less allowance for losses of $13,000 and $25,000, respectively) |
|
|
517,476 |
|
|
|
493,208 |
|
|
Inventory (less reserve of $1,065,000 and $670,000, respectively) |
|
|
8,330,691 |
|
|
|
8,467,512 |
|
|
Prepaid income taxes |
|
|
— |
|
|
|
512,099 |
|
|
Prepaid expenses and other |
|
|
2,679,859 |
|
|
|
2,954,794 |
|
|
Escrow and other receivables |
|
|
— |
|
|
|
3,312,984 |
|
|
TOTAL CURRENT ASSETS |
|
|
57,277,642 |
|
|
|
58,972,170 |
|
|
|
|
|
|
|
|
|
|
|
|
INVESTMENTS |
|
|
1,500,000 |
|
|
|
1,000,000 |
|
|
|
|
|
|
|
|
|
|
|
|
PROPERTY AND EQUIPMENT, net |
|
|
9,725,043 |
|
|
|
9,945,826 |
|
|
|
|
|
|
|
|
|
|
|
|
OPERATING LEASE RIGHT-OF-USE ASSETS |
|
|
12,344,894 |
|
|
|
— |
|
|
|
|
|
|
|
|
|
|
|
|
INTANGIBLE ASSETS, net |
|
|
4,041,650 |
|
|
|
4,167,110 |
|
|
|
|
|
|
|
|
|
|
|
|
LOAN RECEIVABLE |
|
|
694,987 |
|
|
|
— |
|
|
|
|
|
|
|
|
|
|
|
|
OTHER |
|
|
525,884 |
|
|
|
558,209 |
|
| GOODWILL | 5,796,528 | 5,796,528 | ||||||
|
|
|
|
|
|
|
|
|
|
|
TOTAL ASSETS |
|
$ |
91,906,628 |
|
|
$ |
80,439,843 |
|
|
|
|
|
|
|
|
|
|
|
|
LIABILITIES AND EQUITY |
|
|
|
|
|
|
|
|
|
|
|
|
|
|
|
|
|
|
|
CURRENT LIABILITIES |
|
|
|
|
|
|
|
|
|
Accounts payable |
|
$ |
7,710,222 |
|
|
$ |
10,106,182 |
|
|
Accrued payroll |
|
|
2,572,331 |
|
|
|
1,709,868 |
|
|
Current portion operating lease liabilities |
|
|
5,079,745 |
|
|
|
— |
|
|
Other current liabilities |
|
|
1,276,613 |
|
|
|
1,291,713 |
|
|
Income taxes payable |
|
|
243,149 |
|
|
|
— |
|
|
Current portion notes payable |
|
|
65,414 |
|
|
|
— |
|
|
Current portion finance lease obligations |
|
|
1,161 |
|
|
|
51,211 |
|
|
Deferred revenue |
|
|
794,830 |
|
|
|
1,012,772 |
|
|
TOTAL CURRENT LIABILITIES |
|
|
17,743,465 |
|
|
|
14,171,746 |
|
|
|
|
|
|
|
|
|
|
|
|
LONG-TERM LIABILITIES |
|
|
|
|
|
|
|
|
|
Notes payable |
|
|
1,019,837 |
|
|
|
789,216 |
|
|
Operating lease liabilities, net of current portion |
|
|
7,444,789 |
|
|
|
— |
|
|
Deferred income taxes |
|
|
385,000 |
|
|
|
795,000 |
|
|
TOTAL LONG-TERM LIABILITIES |
|
|
8,849,626 |
|
|
|
1,584,216 |
|
|
|
|
|
|
|
|
|
|
|
|
TOTAL LIABILITIES |
|
|
26,593,091 |
|
|
|
15,755,962 |
|
|
|
|
|
|
|
|
|
|
|
|
COMMITMENTS AND CONTINGENCIES (Note 21) |
|
|
|
|
|
|
|
|
|
|
|
|
|
|
|
|
|
|
|
EQUITY |
|
|
|
|
|
|
|
|
|
|
|
|
|
|
|
|
|
|
|
WESTERN SHAREHOLDERS’ EQUITY |
|
|
|
|
|
|
|
|
|
Common stock, $0.0001 par value, 12,500,000 shares authorized, 9,265,778 and 9,388,677 issued and outstanding as of December 31, 2019 and December 31, 2018, respectively. |
|
|
927 |
|
|
|
939 |
|
|
Additional paid-in capital |
|
|
29,031,741 |
|
|
|
29,031,741 |
|
|
Retained earnings |
|
|
33,706,035 |
|
|
|
33,774,293 |
|
|
TOTAL WESTERN SHAREHOLDERS’ EQUITY |
|
|
62,738,703 |
|
|
|
62,806,973 |
|
|
|
|
|
|
|
|
|
|
|
|
NONCONTROLLING INTERESTS |
|
|
2,574,834 |
|
|
|
1,876,908 |
|
|
|
|
|
|
|
|
|
|
|
|
TOTAL EQUITY |
|
|
65,313,537 |
|
|
|
64,683,881 |
|
|
|
|
|
|
|
|
|
|
|
|
TOTAL LIABILITIES AND EQUITY |
|
$ |
91,906,628 |
|
|
$ |
80,439,843 |
|
See notes to consolidated financial statements.
F-2
WESTERN CAPITAL RESOURCES, INC. AND SUBSIDIARIES
CONSOLIDATED STATEMENTS OF OPERATIONS
|
|
|
Year ended December 31, |
|
|||||
|
|
|
2019 |
|
|
2018 |
|
||
|
REVENUES |
|
|
|
|
|
|
|
|
|
Sales and associated fees |
|
$ |
91,769,074 |
|
|
$ |
88,895,105 |
|
|
Financing fees and interest |
|
|
8,513,084 |
|
|
|
8,922,780 |
|
|
Other revenue |
|
|
16,632,383 |
|
|
|
16,447,075 |
|
|
Total Revenues |
|
|
116,914,541 |
|
|
|
114,264,960 |
|
|
|
|
|
|
|
|
|
|
|
|
COST OF REVENUES |
|
|
|
|
|
|
|
|
|
Cost of sales |
|
|
49,518,838 |
|
|
|
47,620,763 |
|
|
Provisions for loans receivable losses |
|
|
975,938 |
|
|
|
1,241,638 |
|
|
Total Cost of Revenues |
|
|
50,494,776 |
|
|
|
48,862,401 |
|
|
|
|
|
|
|
|
|
|
|
|
GROSS PROFIT |
|
|
66,419,765 |
|
|
|
65,402,559 |
|
|
|
|
|
|
|
|
|
|
|
|
OPERATING EXPENSES |
|
|
|
|
|
|
|
|
|
Salaries, wages and benefits |
|
|
33,813,783 |
|
|
|
34,242,187 |
|
|
Occupancy |
|
|
11,038,556 |
|
|
|
12,406,166 |
|
|
Advertising, marketing and development |
|
|
6,857,809 |
|
|
|
7,824,393 |
|
|
Depreciation |
|
|
1,811,918 |
|
|
|
1,899,114 |
|
|
Amortization |
|
|
699,636 |
|
|
|
794,688 |
|
|
Other |
|
|
8,448,241 |
|
|
|
10,818,109 |
|
|
Total Operating Expenses |
|
|
62,669,943 |
|
|
|
67,984,657 |
|
|
|
|
|
|
|
|
|
|
|
|
OPERATING INCOME (LOSS) |
|
|
3,749,822 |
|
|
|
(2,582,098 |
) |
|
|
|
|
|
|
|
|
|
|
|
OTHER INCOME (EXPENSES): |
|
|
|
|
|
|
|
|
|
Dividend and interest income |
|
|
729,166 |
|
|
|
631,670 |
|
|
Interest expense |
|
|
(115,438 |
) |
|
|
(189,281 |
) |
|
Total Other Income (Expenses) |
|
|
613,728 |
|
|
|
442,389 |
|
|
|
|
|
|
|
|
|
|
|
|
INCOME (LOSS) BEFORE INCOME TAXES |
|
|
4,363,550 |
|
|
|
(2,139,709 |
) |
|
|
|
|
|
|
|
|
|
|
|
PROVISION FOR INCOME TAX EXPENSE (BENEFIT) |
|
|
908,000 |
|
|
|
(619,000 |
) |
|
|
|
|
3,455,550 |
|
|
|
(1,520,709 |
) |
|
|
|
|
|
|
|
|
|
|
|
LESS NET INCOME ATTRIBUTABLE TO NONCONTROLLING INTEREST |
|
|
(1,135,174 |
) |
|
|
(720,422 |
) |
|
|
|
|
|
|
|
|
|
|
|
NET INCOME (LOSS) ATTRIBUTABLE TO WESTERN COMMON SHAREHOLDERS |
|
$ |
2,320,376 |
|
|
$ |
(2,241,131 |
) |
|
|
|
|
|
|
|
|
|
|
|
EARNINGS (LOSS) PER SHARE ATTRIBUTABLE TO WESTERN COMMON SHAREHOLDERS |
|
|
|
|
|
|
|
|
|
Basic and diluted |
|
$ |
0.25 |
|
|
$ |
(0.24 |
) |
|
|
|
|
|
|
|
|
|
|
|
WEIGHTED AVERAGE COMMON SHARES OUTSTANDING |
|
|
|
|
|
|
|
|
|
Basic and diluted |
|
|
9,369,891 |
|
|
|
9,390,355 |
|
See notes to consolidated financial statements.
F-3
WESTERN CAPITAL RESOURCES, INC. AND SUBSIDIARIES
CONSOLIDATED STATEMENTS OF SHAREHOLDERS’ EQUITY
| Western Capital Resources, Inc. Shareholders | ||||||||||||||||||||||||
| Common Stock | Additional Paid-In | Retained | Noncontrolling | |||||||||||||||||||||
| Shares | Amount | Capital | Earnings | Interests | Total | |||||||||||||||||||
| BALANCE – December 31, 2017 | 9,390,997 | $ | 939 | $ | 29,031,741 | $ | 37,903,204 | $ | 1,757,686 | $ | 68,693,570 | |||||||||||||
| Net Income (Loss) | — | — | — | (2,241,131 | ) | 720,422 | (1,520,709 | ) | ||||||||||||||||
| Stock redemption | (2,320 | ) | — | — | (9,697 | ) | — | (9,697 | ) | |||||||||||||||
| Dividends | — | — | — | (1,878,083 | ) | (601,200 | ) | (2,479,283 | ) | |||||||||||||||
| BALANCE – December 31, 2018 | 9,388,677 | 939 | 29,031,741 | 33,774,293 | 1,876,908 | 64,683,881 | ||||||||||||||||||
| Net Income | — | — | — | 2,320,376 | 1,135,174 | 3,455,550 | ||||||||||||||||||
| Noncontrolling interest equity contribution | — | — | — | — | 499,352 | 499,352 | ||||||||||||||||||
| Stock redemption | (122,899 | ) | (12 | ) | — | (513,419 | ) | — | (513,431 | ) | ||||||||||||||
| Dividends | — | — | — | (1,875,215 | ) | (936,600 | ) | (2,811,815 | ) | |||||||||||||||
| BALANCE – December 31, 2019 | 9,265,778 | $ | 927 | $ | 29,031,741 | $ | 33,706,035 | $ | 2,574,834 | $ | 65,313,537 | |||||||||||||
See notes to consolidated financial statements.
F-4
WESTERN CAPITAL RESOURCES, INC. AND SUBSIDIARIES
CONSOLIDATED STATEMENTS OF CASH FLOWS
|
|
|
Year Ended December 31, |
|
|||||
|
|
|
2019 |
|
|
2018 |
|
||
|
OPERATING ACTIVITIES |
|
|
|
|
|
|
|
|
|
Net Income (Loss) |
|
$ |
3,455,550 |
|
|
$ |
(1,520,709 |
) |
|
Adjustments to reconcile net income to net cash provided by (used in) operating activities: |
|
|
|
|
|
|
|
|
|
Depreciation |
|
|
1,811,918 |
|
|
|
1,899,114 |
|
|
Amortization |
|
|
699,636 |
|
|
|
794,688 |
|
|
Amortization of operating lease right-of-use assets |
|
|
5,710,933 |
|
|
|
— |
|
|
Deferred income taxes |
|
|
(410,000 |
) |
|
|
(661,000 |
) |
|
Loss (gain) on disposals |
|
|
(86,467 |
) |
|
|
941,367 |
|
|
Changes in operating assets and liabilities: |
|
|
|
|
|
|
|
|
|
Loans receivable |
|
|
251,431 |
|
|
|
198,161 |
|
|
Accounts receivable |
|
|
(780 |
) |
|
|
270,863 |
|
|
Inventory |
|
|
366,704 |
|
|
|
582,282 |
|
|
Prepaid expenses and other assets |
|
|
1,259,354 |
|
|
|
242,628 |
|
|
Operating lease liabilities |
|
|
(6,352,423 |
) |
|
|
— |
|
|
Accounts payable and accrued expenses |
|
|
(1,648,156 |
) |
|
|
(18,812,565 |
) |
|
Deferred revenue and other current liabilities |
|
|
(233,042 |
) |
|
|
(221,932 |
) |
|
Net cash and cash equivalents provided by (used in) operating activities |
|
|
4,824,658 |
|
|
|
(16,287,103 |
) |
|
|
|
|
|
|
|
|
|
|
|
INVESTING ACTIVITIES |
|
|
|
|
|
|
|
|
|
Purchase of investments |
|
|
(20,907,047 |
) |
|
|
(29,817,011 |
) |
|
Proceeds from held-to-maturity investments |
|
|
28,045,130 |
|
|
|
41,711,012 |
|
|
Purchase of property and equipment |
|
|
(712,469 |
) |
|
|
(960,883 |
) |
|
Acquisition of stores, net of cash acquired |
|
|
(602,200 |
) |
|
|
(76,707 |
) |
|
Advances on note receivable, net |
|
|
(694,987 |
) |
|
|
— |
|
|
Release of escrowed funds |
|
|
3,312,984 |
|
|
|
3,435,963 |
|
|
Proceeds from the disposal of property, plant and equipment |
|
|
1,307,500 |
|
|
|
12,000 |
|
|
Net cash and cash equivalents provided by investing activities |
|
|
9,748,911 |
|
|
|
14,304,374 |
|
|
|
|
|
|
|
|
|
|
|
|
FINANCING ACTIVITIES |
|
|
|
|
|
|
|
|
|
Payments on notes payable – short-term, net |
|
|
— |
|
|
|
(51,992 |
) |
|
Payments on notes payable – long-term |
|
|
(1,072,622 |
) |
|
|
— |
|
|
Common stock redemption |
|
|
(513,431 |
) |
|
|
(9,697 |
) |
|
Payments on finance leases |
|
|
(50,050 |
) |
|
|
(47,135 |
) |
|
Contributions from noncontrolling interests |
|
|
281,906 |
|
|
|
— |
|
|
Distributions to noncontrolling interests |
|
|
(936,600 |
) |
|
|
(601,200 |
) |
|
Payments of dividends |
|
|
(1,875,215 |
) |
|
|
(1,878,083 |
) |
|
Net cash and cash equivalents used in financing activities |
|
|
(4,166,012 |
) |
|
|
(2,588,107 |
) |
|
|
|
|
|
|
|
|
|
|
|
NET INCREASE (DECREASE) IN CASH AND CASH EQUIVALENTS |
|
|
10,407,557 |
|
|
|
(4,570,836 |
) |
|
|
|
|
|
|
|
|
|
|
|
CASH AND CASH EQUIVALENTS |
|
|
|
|
|
|
|
|
|
Beginning of year |
|
|
16,724,983 |
|
|
|
21,295,819 |
|
|
End of year |
|
$ |
27,132,540 |
|
|
$ |
16,724,983 |
|
|
|
|
|
|
|
|
|
|
|
|
SUPPLEMENTAL DISCLOSURE OF CASH FLOW INFORMATION |
|
|
|
|
|
|
|
|
|
|
|
|
|
|
|
|
|
|
|
Income taxes paid |
|
$ |
575,501 |
|
|
$ |
19,284,007 |
|
|
Interest paid |
|
$ |
94,723 |
|
|
$ |
124,817 |
|
|
|
|
|
|
|
|
|
|
|
|
Noncash investing and financing activities: |
|
|
|
|
|
|
|
|
|
Assets received in acquisition (See Note 19) |
|
$ |
6,235,183 |
|
|
$ |
— |
|
|
Liabilities assumed in acquisition (See Note 19) |
|
$ |
4,785,280 |
|
|
$ |
— |
|
|
Note payable assumed in acquisition (See Note 19) |
|
$ |
1,350,499 |
|
|
$ |
— |
|
|
Noncontrolling interest contribution to subsidiary (See Note 19) |
|
$ |
217,446 |
|
|
$ |
— |
|
|
Right-of-use assets obtained, operating lease obligations incurred |
|
$ |
5,786,575 |
|
|
$ |
— |
|
|
Right-of-use assets and operating lease obligation disposals |
|
$ |
2,218,787 |
|
|
$ |
— |
|
See notes to consolidated financial statements.
F-5
1. Basis of Presentation, Nature of Business and Summary of Significant Accounting Policies –
Basis of Presentation / Nature of Business
Western Capital Resources, Inc. (“WCR”) is a parent company owning operating subsidiaries, with percentage owned shown parenthetically, as summarized below.
|
● |
Cellular Retail |
|
○ |
PQH Wireless, Inc. (“PQH”) (100%) – operates 222 cellular retail stores as of December 31, 2019 (108 100% owned plus 114 through its controlled but less than 100% owned subsidiaries), exclusively as an authorized retailer of the Cricket brand. |
|
● |
Direct to Consumer |
|
○ |
J&P Park Acquisitions, Inc. (“JPPA”) (100%) – an online and direct marketing distribution retailer of 1) live plants, seeds, holiday gifts and garden accessories selling its products under Park Seed, Jackson & Perkins, and Wayside Gardens brand names and 2) home improvement and restoration products operating under the Van Dyke’s Restorers brand, as well as a seed wholesaler under the Park Wholesale brand. |
|
○ |
J&P Real Estate, LLC (“JPRE”) (100%) – owns real estate utilized as JPPA’s distribution and warehouse facility and the corporate offices of JPPA. |
|
● |
Consumer Finance |
|
○ |
Wyoming Financial Lenders, Inc. (“WFL”) (100%) – owns and operates “payday” stores (38 as of December 31, 2019, two of which are located within the Company’s retail pawn stores) in six states (Iowa, Kansas, Nebraska, North Dakota, Wisconsin and Wyoming) providing sub-prime short-term uncollateralized non-recourse “cash advance” or “payday” loans typically ranging from $100 to $500 with a maturity of generally two to four weeks, sub-prime short-term uncollateralized non-recourse installment loans typically ranging from $300 to $800 with a maturity of six months, check cashing and other money services to individuals. |
|
○ |
Express Pawn, Inc. (“EPI”) (100%) – owns and operates retail pawn stores (three as of December 31, 2019) in Nebraska and Iowa providing collateralized non-recourse pawn loans and retail sales of merchandise obtained from forfeited pawn loans or purchased from customers. |
References in these financial statement notes to “Company” or “we” refer to Western Capital Resources, Inc. and its subsidiaries. References to specific companies within our enterprise, such as” “PQH,” “JPPA,” “JPRE,” “WFL,” or “EPI” are references only to those companies.
Basis of Consolidation
The consolidated financial statements include the accounts of WCR, its wholly owned subsidiaries and other entities in which the Company owns a controlling financial interest. For financial interests in which the Company owns a controlling financial interest, the Company applies the provisions of Financial Accounting Standards Board Accounting Standards Codification (“ASC”) 810, “Consolidation” applicable to reporting the equity and net income or loss attributable to noncontrolling interests. All significant intercompany balances and transactions of the Company have been eliminated in consolidation.
Use of Estimates
The preparation of consolidated financial statements in conformity with accounting principles generally accepted in the United States of America requires management to make estimates and assumptions that may affect certain reported amounts and disclosures in the consolidated financial statements and accompanying notes. Management bases its estimates on historical experience and on various other assumptions that are believed to be reasonable under the circumstances. Actual results could differ from those estimates. Significant management estimates relate to the notes and loans receivable allowance, carrying value and impairment of long-lived goodwill and intangible assets, inventory valuation and obsolescence, estimated useful lives of property and equipment, gift certificate and merchandise credits liability and deferred taxes and tax uncertainties.
F-6
Revenue Recognition
On January 1, 2018, we adopted Topic 606, as further disclosed later in this Note 1. Also refer to Notes 17, “Revenue,” and 20, “Segment Information,” for additional information, including the disaggregation of revenue by segment.
Cash and Cash Equivalents
For purposes of the consolidated statements of cash flows, the Company considers all highly liquid investments with a maturity of three months or less at the time of purchase to be cash equivalents.
Fair Value of Financial Measurement
In determining fair value measurements, the Company follows the provisions of ASC 820, Fair Value Measurements and Disclosures. ASC 820 defines fair value, establishes a framework for measuring fair value under GAAP, and enhances disclosures about fair value measurements. The topic provides a consistent definition of fair value focusing on an exit price, which is the price that would be received to sell an asset or paid to transfer a liability in an orderly transaction between market participants at the measurement date. The topic also prioritizes, within the measurement of fair value, the use of market-based information over entity-specific information and establishes a three-level hierarchy for fair value measurements based on the nature of inputs used in the valuation of an asset or liability as of the measurement date. The three level hierarchy is as follows:
Level 1 - Pricing inputs are quoted prices available in active markets for identical assets or liabilities as of the measurement date.
Level 2 - Pricing inputs are quoted prices for similar assets and liabilities, or inputs that are observable, either directly or indirectly, for substantially the full term through corroboration with observable market data.
Level 3 - Pricing inputs are unobservable for the assets and liabilities, that is, inputs that reflect the reporting entity’s own assumptions about the assumptions market participants would use in pricing the asset or liability.
In certain cases, the inputs used to measure fair value may fall into different levels of the fair value hierarchy. In such cases, an asset or liability’s level within the fair value hierarchy is based on the lowest level of input that is significant to the fair value measurement. The Company’s assessment of the significance of a particular input to the fair value measurement in its entirety requires judgment, and considers factors specific to the asset or liability.
The Company’s held to maturity securities are comprised of a U.S Treasury zero coupon T-Bill and certificates of deposit. The Company’s available for sale securities consist of mutual funds held in money market mutual funds in a brokerage account, which are classified as cash equivalents.
The fair value of these investments is based on quoted prices from recognized pricing services, or in the case of mutual funds, at their closing published net asset value.
The Company assesses the levels of the investments at each measurement date, and transfers between levels are recognized on the actual date of the event or change in circumstances that caused the transfer in accordance with the Company’s accounting policy regarding the recognition of transfers between levels of the fair value hierarchy. During the years 2019 and 2018, there were no transfers between levels.
Receivables and Loss Allowance
Cellular Retail
Receivables for noncash sales are recorded when possession of products is taken by the customer or services are completed, represent claims against third parties that will be settled in cash, include unsettled credit card charges, and are included in accounts receivable. The carrying value of accounts receivables, net of the allowance for doubtful accounts, represents their estimated net realizable value.
F-7
Direct to Consumer
Receivables for noncash sales are recorded when orders are shipped, represent claims against third parties that will be settled in cash, include unsettled credit card charges and wholesales sales on terms, and are included in accounts receivable. The carrying value of accounts receivable, net of the allowance for doubtful accounts, represents their estimated net realizable value. The allowance for doubtful accounts is estimated based on historical collection trends, type of customer, the age of outstanding receivables and existing economic conditions. If events or changes in circumstances indicate that specific receivable balances may be impaired, further consideration is given to the collectability of those balances and the allowance is adjusted accordingly. Past due receivable balances are written-off when internal collection efforts have been unsuccessful in collecting the amount due.
Consumer Finance
Included in loans receivable are unpaid principal, interest and fee balances of payday, installment and pawn loans that have not reached their maturity date, and “late” payday loans that have reached maturity within the last 180 days and have remaining outstanding balances. Late payday loans generally are unpaid loans where a customer’s personal check has been deposited and the check has been returned due to non-sufficient funds in the customer’s account, a closed account, or other reasons. All returned items are charged-off after 180 days, as collections after that date have not been significant. Loans are carried at cost plus accrued interest or fees less payments made and a loans receivable allowance.
The Company does not specifically reserve for any individual payday or installment loan. The Company aggregates loan types for purposes of estimating the loss allowance using a methodology that analyzes historical portfolio statistics and management’s judgment regarding recent trends noted in the portfolio. This methodology takes into account several factors, including (1) the amount of loan principal, interest and fee outstanding, (2) historical charge offs from loans that originated during the last 24 months, (3) current and expected collection patterns and (4) current economic trends. The Company utilizes a software program to assist with the tracking of its historical portfolio statistics. A loan loss allowance is maintained for anticipated losses for payday and installment loans based primarily on our historical percentages by loan type of net charge offs, applied against the applicable balance of loan principal, interest and fees outstanding. The Company also periodically performs a look-back analysis on its loan loss allowance to verify the historical allowance established tracks with the actual subsequent loan write-offs and recoveries. The Company is aware that as conditions change, it may also need to make additional allowances in future periods. Loan losses or charge-offs of pawn loans are not recorded because the value of the collateral exceeds the loan amount.
Inventory
Cellular Retail
Inventory, consisting of phones and accessories, is stated at cost, determined on the specific identification and weighted-average cost basis, respectively.
Direct to Consumer
Inventory is valued at the lower of cost or market using the weighted-average method of determining cost.
Consumer Finance
Merchandise inventory is stated at the lower of cost or market. The principal amount of an unpaid loan becomes the inventory cost for forfeited collateral.
Long-Lived Assets
Property and equipment are recorded at cost less accumulated depreciation. Depreciation is provided on the straight-line method over the estimated useful lives of the related assets as follows:
|
● |
Computer equipment and software |
3 – 10 years |
|
● |
Improvements and equipment |
3 – 15 years |
|
● |
Building |
39 years |
The cost of maintenance and repairs is charged to operations as incurred while renewals and betterments are capitalized.
F-8
The Company capitalizes certain internal costs, including payroll costs, incurred in connection with the development of software for internal use. These costs are capitalized beginning when the Company has entered the application development stage. The capitalization of these costs ceases when the software is substantially complete and ready for its intended use. Only costs incurred for enhancements that are expected to result in additional features or functionality are capitalized and expensed over the estimated useful life of the enhancements.
Finite-lived intangible assets represent the fair values management assigned to assets acquired through business acquisitions, are amortized over periods of three to 15 years based on management’s estimates of the useful life of the asset and are subject to impairment evaluations.
The Company assesses the possibility of impairment of long-lived assets, other than goodwill, whenever events or changes in circumstances indicate that the carrying value may not be recoverable. Factors that could trigger an impairment review include significant underperformance relative to expected historical or projected future cash flows, significant changes in the manner of use of acquired assets or the strategy for the overall business, and significant negative industry events or trends.
Goodwill
Goodwill represents the excess of acquisition cost over the fair value of identifiable finite lived net assets acquired and is not amortized. Goodwill is tested for impairment annually as of October 1, or more frequently if events or changes in circumstances indicate potential impairment. The Company tests for goodwill impairment at the reporting unit level, which aligns with the Company’s segments. The Company performs a qualitative assessment to determine if a quantitative impairment test is necessary. If quantitative testing is necessary based on a qualitative assessment, we apply a fair value test. This fair value test involves a two-step process. The first step is to compare the carrying value of our net assets to our fair value. If the fair value is determined to be less than the carrying value, a second step is performed to measure the amount of the impairment, if any.
Merchandise Credits and Gift Card Liabilities
Direct to Consumer
The Company maintains a liability for unredeemed gift cards, gift certificates and merchandise credits until the earlier of redemption, escheatment or a maximum of two years. The Company has concluded based on historical redemption trends that the likelihood of these liabilities being redeemed beyond two years from the date of issuance is remote. The liability is also reserved for estimated redemption rates which management bases on historical trends.
Advertising, Marketing and Development Costs
Direct to Consumer
The Company expenses advertising costs as they are incurred, except for direct-response advertising, which is capitalized and amortized over its expected period of future benefits, not to exceed six months. Direct-response advertising consists primarily of catalog book production, printing, and postage costs. Prepaid advertising costs at December 31, 2019 and 2018 were $0.67 million and $0.88 million, respectively.
Consumer Finance
The costs of advertising and marketing are expensed as incurred.
Stock-based Compensation
The Company accounts for its employee stock-based compensation plans using the fair value method. The fair value method requires the Company to estimate the grant-date fair value of its stock-based awards and amortize this fair value to compensation expense over the requisite service period or vesting term.
The Company uses the Black-Scholes option-pricing model to estimate the fair value of the Company’s stock option awards. The determination of the fair value of stock-based payment awards on the date of grant using an option-pricing model is affected by the Company’s stock price as well as assumptions regarding a number of complex and subjective variables. These variables include the expected stock price volatility over the term of the awards, actual and projected employee stock option exercise behaviors, the risk-free interest rate and expected dividends. Due to the inherent limitations of option-valuation models, future events that are unpredictable and the estimation process utilized in determining the valuation of the stock-based awards, the ultimate value realized by award holders may vary significantly from the amounts expensed in the Company’s financial statements.
F-9
Stock-based compensation expense is recognized net of estimated forfeitures such that expense is recognized only for those stock-based awards that are expected to vest. A forfeiture rate is estimated at the time of grant and revised, if necessary, in subsequent periods if actual forfeitures differ from initial estimate.
Income Taxes
Deferred income taxes reflect the tax consequences in future years of differences between the tax basis of assets and liabilities and their financial reporting amounts, based on enacted tax laws and statutory tax rates applicable in the periods in which the differences are expected to affect taxable income. Valuation allowances are established when necessary to reduce deferred tax assets to the amounts expected to be realized. The provision for income taxes represents taxes paid or payable for the current year and changes during the year in deferred tax assets and liabilities.
Net Income (Loss) Per Common Share
Basic net income (loss) per common share is computed by dividing the income available to common shareholders by the weighted average number of common shares outstanding for the period. Diluted earnings per share gives effect to all potentially dilutive common shares outstanding during the period, including stock options, using the treasury stock method. Options to purchase 65,000 shares granted under the 2015 Stock Incentive Plan effective February 6, 2015 (see Note 15) were outstanding at December 31, 2019. These options have a strike price in excess of the market price as of December 31, 2019 and 2018, were antidilutive and therefore not included in the computation of diluted earnings per share. Thus, there were no dilutive common shares as of December 31, 2019 and 2018.
Fair Value of Financial Instruments
The amounts reported in the balance sheets for cash, short-term investments, accounts and loans receivable, inventory, and accounts payable are short-term in nature and their carrying values approximate fair values. The amounts reported in the balance sheets for notes payable are both long-term and short-term and for investments are long-term and their carrying value approximates fair value.
Reclassifications
Certain Statement of Cash Flows reclassifications have been made in the presentation of our prior financial statements to conform to the presentation as of and for the year ended December 31, 2019.
Recent Accounting Pronouncements
In February 2016, the FASB issued ASU 2016-02, Leases (Topic 842), related to recognition of lease assets and lease liabilities on the balance sheet and disclosing key information about leasing arrangements. Under the new guidance, lessees are required to recognize the following for all leases: (1) a lease liability, which is the present value of a lessee’s obligation to make lease payments, and (2) a right-of-use asset, which is an asset that represents the lessee’s right to use, or control the use of, a specified asset for the lease term. All entities must classify leases to determine how to recognize lease-related revenue and expense. Quantitative and qualitative disclosures are required by lessees and lessors to meet the objective of enabling users of financial statements to assess the amount, timing, and uncertainty of cash flows arising from leases. The intention is to require enough information to supplement the amounts recorded in the financial statements so that users can understand more about the nature of an entity’s leasing activities. All entities are required to use a modified retrospective approach for leases that exist or are entered into after the beginning of the earliest comparative period in the financial statements. The Company adopted ASU 2016-02 and ASC 842 using the modified retrospective method on January 1, 2019. See Note 9 for further disclosures.
In June 2016, the FASB issued ASU 2016-13, Financial Instruments - Credit Losses (Topic 326), related to the measurement of credit losses on financial instruments. The standard requires a financial asset (or a group of financial assets) measured at amortized cost basis to be presented at the net amount expected to be collected. The ASU is effective for annual reporting periods beginning after December 15, 2019 and interim periods within that annual period, with early adoption permitted and the standard to be applied using a modified retrospective approach. The Company does not believe adoption of ASU 2016-13 will have a material impact on our financial condition, results of operations or consolidated financial statements.
F-10
In July 2018, the FASB issued ASU 2018-11, Leases - Targeted Improvements (Topic 842) to provide entities with relief from the costs of implementing certain aspects of the new leasing standard, ASU 2016-02. Specifically, under the amendments in ASU 2018-11: (1) entities may elect not to recast the comparative periods presented when transitioning to the new leasing standard, and (2) lessors may elect to not separate non-lease components from leases when certain conditions are met. The amendments have the same effective date as ASU 2016-02 (January 1, 2019 for the Company). The Company adopted certain options available under ASU 2018-11on January 1, 2019. See Note 9 for further disclosures.
No other new accounting pronouncements issued or effective during the fiscal year have had or are expected to have a material impact on the consolidated financial statements.
2. Risks Inherent in the Operating Environment –
Regulatory
The Company’s Consumer Finance segment activities are highly regulated under numerous federal, state, and local laws, regulations and rules, which are subject to change. New laws, regulations or rules could be enacted or issued, interpretations of existing laws, regulations or rules may change and enforcement action by regulatory agencies may intensify. Over the past several years, consumer advocacy groups and certain media reports have advocated governmental and regulatory action to prohibit or severely restrict sub-prime lending activities of the kind conducted by the Company. After several years of research, debate, and public hearings, in October 2017 the U.S. Consumer Financial Protection Bureau (“CFPB”) adopted a new rule for payday lending. The rule, originally scheduled to go into effect in August 2019, would impose significant restrictions on the industry, and it is expected that a large number of lenders would be forced to close their stores. The CFPB’s studies projected a reduction in the number of lenders by 50%, while industry studies forecast a much higher attrition rate if the rule is implemented as originally adopted.
However, in January 2018, the CFPB issued a statement that it intends to “reconsider” the regulation. The most current information from the CFPB website states the proposals it is considering includes rescinding the mandatory underwriting provisions contained in the rule and to delay the August 19, 2019 compliance date for the other provisions to November 19, 2020. At this time it is uncertain whether the rule will be implemented as announced, rewritten with more favorable terms for the industry, or thrown out altogether. If the rule is implemented as written, it could have a significant and negative impact on business conducted within our Consumer Finance segment.
Consumer advocacy groups in many states are actively seeking state law changes which would effectively end the viability of a payday loan business, including Nebraska where we generate approximately 30% of our payday lending revenue or approximately 2% of our consolidated revenue. If these groups are successful in Nebraska, we will likely cease payday lending activities in Nebraska.
The above rule or any other adverse change in present federal, state, or local laws or regulations that govern or otherwise affect lending could result in the Consumer Finance segment’s curtailment or cessation of operations in certain or all jurisdictions or locations. Furthermore, any failure to comply with any applicable local, state or federal laws or regulations could result in fines, litigation, closure of one or more store locations or negative publicity. Any such change or failure would have a corresponding impact on the Company’s and segment’s results of operations and financial condition, primarily through a decrease in revenues resulting from the cessation or curtailment of operations, or a decrease in operating income through increased legal expenditures or fines, and could also negatively affect the Company’s general business prospects due to lost or decreased operating income or if negative publicity effects its ability to obtain additional financing as needed.
In addition, the passage of federal, state or local laws and regulations or changes in interpretations of them could, at any point, essentially prohibit the Consumer Finance segment from conducting its lending business in its current form. Any such legal or regulatory change would certainly have a material and adverse effect on the Company, its operating results, financial condition and prospects, and perhaps even the viability of the Consumer Finance segment.
Concentrations
The Company has demand deposits at financial institutions, often times in excess of the limit for insurance by the Federal Deposit Insurance Corporation. As of December 31, 2019, the Company had demand deposits in excess of insurance amounts of approximately $6.77 million.
F-11
Loans receivable in the Consumer Finance segment are concentrated in the sub-prime market and geographically, primarily in the Midwest. For the years ended December 31, 2019 and 2018, the Consumer Finance segment had geographic economic and regulatory risk concentrations (shown as a percentage of the Consumer Finance segment’s revenue by state when 10% or more) as follows:
|
Consumer Finance Segment |
|||||||||
|
|
|
2019 % of Revenues |
|
|
2018 % of Revenues |
|
|||
|
Nebraska |
|
|
35 |
% |
|
|
36 |
% |
|
|
North Dakota |
|
|
25 |
% |
|
|
23 |
% |
|
|
Iowa |
|
|
16 |
% |
|
|
17 |
% |
|
|
Wyoming |
|
|
14 |
% |
|
|
14 |
% |
|
The Company’s Cellular Retail segment is an authorized retailer for Cricket Wireless. As an authorized retailer operating exclusively for a single carrier, the Company is subject to a number of concentrations, including revenues from a single brand, a single supplier for phones, a single operating system provider and select third party processors.
Our Direct to Consumer subsidiary JPPA has an agreement with a third-party wholesale grower that is in effect until 2022. The grower has agreed to perform research for JPPA and maintain JPPA’s research crop for product to be sold through 2022. In exchange, this grower/researcher (also a direct-to-consumer competitor) is allowed to sell certain Jackson & Perkins branded roses in their wholesale division.
3. Cash Equivalents and Investments –
The following table shows the Company’s cash equivalents and held-to-maturity investments, by significant investment category, recorded as cash equivalents or short- and long-term investments:
|
|
|
December 31, 2019 |
|
|
December 31, 2018 |
|
||
|
Cash and cash equivalents |
|
|
|
|
|
|
|
|
|
Operating accounts |
|
$ |
10,163,845 |
|
|
$ |
10,901,929 |
|
|
Money Market – U.S. Treasury obligations |
|
|
4,450,433 |
|
|
|
2,808,576 |
|
|
U.S. Treasury obligations |
|
|
12,518,262 |
|
|
|
3,014,478 |
|
|
Subtotal |
|
|
27,132,540 |
|
|
|
16,724,983 |
|
|
|
|
|
|
|
|
|
|
|
|
Held to Maturity Investments |
|
|
|
|
|
|
|
|
|
Certificates of deposit (4 – 24 month maturities, FDIC insured) |
|
$ |
9,049,787 |
|
|
$ |
12,711,069 |
|
|
U.S. Treasury obligations (less than one year maturities) |
|
|
7,206,878 |
|
|
|
10,683,679 |
|
|
Subtotal |
|
|
16,256,665 |
|
|
|
23,394,748 |
|
|
|
|
|
|
|
|
|
|
|
|
TOTAL |
|
$ |
43,389,205 |
|
|
$ |
40,119,731 |
|
Held to maturity investments consisted of the following:
|
December 31, 2019 |
|||||||||||||||||||||||||
|
|
|
Cost |
|
|
Accrued Interest |
|
|
Amortized Discount |
|
|
Amortized Cost |
|
|
Unrealized |
|
|
Estimated Fair Value |
|
|||||||
|
|
|
|
|
|
|
|
|
|
|
|
|
|
|
|
|
|
|
|
|
|
|
|
|
|
|
|
Certificates of Deposit |
|
$ |
9,051,618 |
|
|
$ |
34,169 |
|
|
$ |
— |
|
|
$ |
9,049,787 |
|
|
$ |
(32,429 |
) |
|
$ |
9,017,358 |
|
|
|
U.S. Treasuries |
|
|
7,153,587 |
|
|
|
— |
|
|
|
53,291 |
|
|
|
7,206,878 |
|
|
|
2,883 |
|
|
|
7,209,761 |
|
|
|
|
|
$ |
16,169,205 |
|
|
$ |
34,169 |
|
|
$ |
53,291 |
|
|
$ |
16,256,665 |
|
|
$ |
(29,546 |
) |
|
$ |
16,227,119 |
|
|
F-12
|
December 31, 2018 |
|||||||||||||||||||||||||
|
|
|
Cost |
|
|
Accrued Interest |
|
|
Amortized Discount |
|
|
Amortized Cost |
|
|
Unrealized |
|
|
Estimated Fair Value |
|
|||||||
|
|
|
|
|
|
|
|
|
|
|
|
|
|
|
|
|
|
|
|
|
|
|
|
|
|
|
|
Certificates of Deposit |
|
$ |
12,670,000 |
|
|
$ |
41,069 |
|
|
$ |
— |
|
|
$ |
12,711,069 |
|
|
$ |
(68,087 |
) |
|
$ |
12,642,982 |
|
|
|
U.S. Treasuries |
|
|
10,564,160 |
|
|
|
25,707 |
|
|
|
93,812 |
|
|
|
10,683,679 |
|
|
|
(30,229 |
) |
|
|
10,653,450 |
|
|
|
|
|
$ |
23,234,160 |
|
|
$ |
66,776 |
|
|
$ |
93,812 |
|
|
$ |
23,394,748 |
|
|
$ |
(98,316 |
) |
|
$ |
23,296,432 |
|
|
Interest income recognized on held-to-maturity investments and other sources was as follows:
|
|
|
2019 |
|
|
2018 |
|
||
|
|
|
|
|
|
|
|
|
|
|
Held-to-maturity |
|
$ |
488,824 |
|
|
$ |
503,502 |
|
|
Other |
|
|
240,342 |
|
|
|
128,168 |
|
|
|
|
$ |
729,166 |
|
|
$ |
631,670 |
|
The Company deposited in aggregate $1.75 million of cash across seven different accounts at a financial institution as an accommodation to its majority stockholder, who has other business relationships with the financial institution. The funds in these accounts can be withdrawn at any time, do not serve as collateral in any way, and are held on market terms.
4. Loans Receivable –
The Consumer Finance segment’s outstanding loans receivable aging was as follows:
|
December 31, 2019 |
|||||||||||||||||
|
|
|
Payday |
|
|
Installment |
|
|
Pawn |
|
|
Total |
|
|||||
|
Current |
|
$ |
3,322,131 |
|
|
$ |
67,891 |
|
|
$ |
309,934 |
|
|
$ |
3,699,956 |
|
|
|
1-30 |
|
|
216,753 |
|
|
|
10,590 |
|
|
|
— |
|
|
|
227,343 |
|
|
|
31-60 |
|
|
140,872 |
|
|
|
6,234 |
|
|
|
— |
|
|
|
147,106 |
|
|
|
61-90 |
|
|
117,544 |
|
|
|
2,649 |
|
|
|
— |
|
|
|
120,193 |
|
|
|
91-120 |
|
|
118,626 |
|
|
|
840 |
|
|
|
— |
|
|
|
119,466 |
|
|
|
121-150 |
|
|
110,278 |
|
|
|
395 |
|
|
|
— |
|
|
|
110,673 |
|
|
|
151-180 |
|
|
108,674 |
|
|
|
— |
|
|
|
— |
|
|
|
108,674 |
|
|
|
|
|
|
4,134,878 |
|
|
|
88,599 |
|
|
|
309,934 |
|
|
|
4,533,411 |
|
|
|
Less Allowance |
|
|
(673,000 |
) |
|
|
— |
|
|
|
— |
|
|
|
(673,000 |
) |
|
|
|
|
$ |
3,461,878 |
|
|
$ |
88,599 |
|
|
$ |
309,934 |
|
|
$ |
3,860,411 |
|
|
|
December 31, 2018 |
|||||||||||||||||
|
|
|
Payday |
|
|
Installment |
|
|
Pawn |
|
|
Total |
|
|||||
|
Current |
|
$ |
3,314,182 |
|
|
$ |
254,255 |
|
|
$ |
321,447 |
|
|
$ |
3,889,884 |
|
|
|
1-30 |
|
|
224,091 |
|
|
|
41,596 |
|
|
|
— |
|
|
|
265,687 |
|
|
|
31-60 |
|
|
199,259 |
|
|
|
30,285 |
|
|
|
— |
|
|
|
229,544 |
|
|
|
61-90 |
|
|
153,449 |
|
|
|
15,189 |
|
|
|
— |
|
|
|
168,638 |
|
|
|
91-120 |
|
|
131,480 |
|
|
|
9,001 |
|
|
|
— |
|
|
|
140,481 |
|
|
|
121-150 |
|
|
125,074 |
|
|
|
4,311 |
|
|
|
— |
|
|
|
129,385 |
|
|
|
151-180 |
|
|
101,619 |
|
|
|
4,604 |
|
|
|
— |
|
|
|
106,223 |
|
|
|
|
|
|
4,249,154 |
|
|
|
359,241 |
|
|
|
321,447 |
|
|
|
4,929,842 |
|
|
|
Less Allowance |
|
|
(770,000 |
) |
|
|
(48,000 |
) |
|
|
— |
|
|
|
(818,000 |
) |
|
|
|
|
$ |
3,479,154 |
|
|
$ |
311,241 |
|
|
$ |
321,447 |
|
|
$ |
4,111,842 |
|
|
F-13
5. Loans Receivable Allowance –
As a result of the Consumer Finance segment’s collection efforts, it historically writes off approximately 40% of returned payday items, the most significant element making up loans receivable. Based on days past the check return date, write-offs of payday returned items historically have tracked at the following approximate percentages: 1 to 30 days – 40%; 31 to 60 days – 66%; 61 to 90 days – 85%; 91 to 120 days – 89%; and 121 to 150 – 92% and 151+ days – 93%.
A rollforward of the Company’s loans receivable allowance is as follows:
|
|
|
Year Ended |
|
|||||
|
|
|
2019 |
|
|
2018 |
|
||
|
Loans receivable allowance, beginning of year |
|
$ |
818,000 |
|
|
$ |
833,000 |
|
|
Provision for loan losses charged to expense |
|
|
975,938 |
|
|
|
1,241,638 |
|
|
Charge-offs, net |
|
|
(1,120,938 |
) |
|
|
(1,256,638 |
) |
|
Loans receivable allowance, end of year |
|
$ |
673,000 |
|
|
$ |
818,000 |
|
6. Accounts Receivable –
A breakdown of accounts receivables by segment are as follows:
|
December 31, 2019 |
|||||||||||||||||
|
|
|
Cellular Retail |
|
|
Direct to Consumer |
|
|
Consumer Finance |
|
|
Total |
|
|||||
|
Accounts receivable |
|
$ |
184,519 |
|
|
$ |
318,235 |
|
|
$ |
27,722 |
|
|
$ |
530,476 |
|
|
|
Less allowance |
|
|
— |
|
|
|
(13,000 |
) |
|
|
— |
|
|
|
(13,000 |
) |
|
|
Net account receivable |
|
$ |
184,519 |
|
|
$ |
305,235 |
|
|
$ |
27,722 |
|
|
$ |
517,476 |
|
|
|
December 31, 2018 |
|||||||||||||||||
|
|
|
Cellular Retail |
|
|
Direct to Consumer |
|
|
Consumer Finance |
|
|
Total |
|
|||||
|
Accounts receivable |
|
$ |
130,251 |
|
|
$ |
372,076 |
|
|
$ |
15,881 |
|
|
$ |
518,208 |
|
|
|
Less allowance |
|
|
— |
|
|
|
(25,000 |
) |
|
|
— |
|
|
|
(25,000 |
) |
|
|
Net account receivable |
|
$ |
130,251 |
|
|
$ |
347,076 |
|
|
$ |
15,881 |
|
|
$ |
493,208 |
|
|
A portion of accounts receivable are unsettled credit card sales from the prior one to five business days. This makes up 68% and 57% of the net accounts receivable balance at December 31, 2019 and December 31, 2018, respectively.
7. Inventory –
Inventories consist of:
|
|
|
2019 |
|
|
2018 |
|
||
|
Finished Goods |
|
|
|
|
|
|
|
|
|
Cellular Retail |
|
$ |
5,687,771 |
|
|
$ |
5,456,898 |
|
|
Direct to Consumer |
|
|
2,888,483 |
|
|
|
2,848,484 |
|
|
Consumer Finance |
|
|
819,437 |
|
|
|
832,130 |
|
|
Reserve |
|
|
(1,065,000 |
) |
|
|
(670,000 |
) |
|
TOTAL |
|
$ |
8,330,691 |
|
|
$ |
8,467,512 |
|
As a result of changes in the market for certain Company products and the resulting deteriorating value, carrying amounts for those inventories were reduced by approximately $1,065,000 and $670,000 during the year ended December 31, 2019 and 2018, respectively. These inventory write-downs have been reflected in cost of goods sold in the statement of operations. Management believes that these reductions properly reflect inventory at lower of cost or market, and no additional losses will be incurred upon disposition.
F-14
8. Property and Equipment –
A rollforward of the Company’s property and equipment is as follows:
|
|
|
December 31, 2018 |
|
|
Acquisitions |
|
|
Additions |
|
|
Deletions |
|
|
December 31, 2019 |
|
|||||
|
Property, equipment and sales floor |
|
$ |
8,182,321 |
|
|
$ |
1,606,331 |
|
|
$ |
531,028 |
|
|
$ |
(1,840,524 |
) |
|
$ |
8,479,156 |
|
|
Software |
|
|
1,736,669 |
|
|
|
— |
|
|
|
159,137 |
|
|
|
(11,325 |
) |
|
|
1,884,481 |
|
|
Building (owned) |
|
|
5,458,008 |
|
|
|
— |
|
|
|
30,214 |
|
|
|
— |
|
|
|
5,488,222 |
|
|
Land |
|
|
1,200,000 |
|
|
|
— |
|
|
|
— |
|
|
|
— |
|
|
|
1,200,000 |
|
|
|
|
|
16,576,998 |
|
|
|
1,606,331 |
|
|
|
720,379 |
|
|
|
(1,851,849 |
) |
|
|
17,051,859 |
|
|
Accumulated depreciation |
|
|
(6,631,172 |
) |
|
|
— |
|
|
|
(1,811,918 |
) |
|
|
1,116,274 |
|
|
|
(7,326,816 |
) |
|
|
|
$ |
9,945,826 |
|
|
$ |
1,606,331 |
|
|
$ |
(1,091,539 |
) |
|
$ |
(735,575 |
) |
|
$ |
9,725,043 |
|
|
|
|
December 31, 2017 |
|
|
Acquisitions |
|
|
Additions |
|
|
Deletions |
|
|
December 31, 2018 |
|
|||||
|
Property, equipment and sales floor |
|
$ |
8,706,997 |
|
|
$ |
30,000 |
|
|
$ |
693,448 |
|
|
$ |
(1,248,124 |
) |
|
$ |
8,182,321 |
|
|
Software |
|
|
1,634,489 |
|
|
|
— |
|
|
|
102,180 |
|
|
|
— |
|
|
|
1,736,669 |
|
|
Building - owned |
|
|
5,292,753 |
|
|
|
— |
|
|
|
165,255 |
|
|
|
— |
|
|
|
5,458,008 |
|
|
Land |
|
|
1,200,000 |
|
|
|
— |
|
|
|
— |
|
|
|
— |
|
|
|
1,200,000 |
|
|
Other |
|
|
39,294 |
|
|
|
— |
|
|
|
— |
|
|
|
(39,294 |
) |
|
|
— |
|
|
|
|
|
16,873,533 |
|
|
|
30,000 |
|
|
|
960,883 |
|
|
|
(1,287,418 |
) |
|
|
16,576,998 |
|
|
Accumulated depreciation |
|
|
(5,526,299 |
) |
|
|
— |
|
|
|
(1,899,114 |
) |
|
|
794,241 |
|
|
|
(6,631,172 |
) |
|
|
|
$ |
11,347,234 |
|
|
$ |
30,000 |
|
|
$ |
(938,231 |
) |
|
$ |
(493,177 |
) |
|
$ |
9,945,826 |
|
As of December 31, 2019, estimated future depreciation expense for property and equipment (in thousands) is as follows:
|
2020 |
|
$ |
1,765 |
|
|
2021 |
|
|
1,478 |
|
|
2022 |
|
|
903 |
|
|
2023 |
|
|
495 |
|
|
2024 |
|
|
303 |
|
|
Thereafter |
|
|
3,581 |
|
|
|
|
$ |
8,525 |
|
9. Leases –
The Company adopted ASC 842 - Leases, using the modified retrospective method on January 1, 2019. The Company elected the package of practical expedients relief option offered in ASU 2016-02 and the accounting policy election for lessees not to separate lease and non-lease components (election applies to leased real property asset class).
The most significant impact of the adoption of ASC 842 was the recognition of right-of-use (“ROU”) assets and lease liabilities for operating leases of $11.53 million and $11.76 million, respectively, and a reversal of deferred rent of $0.23 million on January 1, 2019. The Company’s accounting for finance leases, which are insignificant, remained unchanged. The adoption of ASC 842 did not have any impact on the Company’s operating results or cash flows.
The Company has many retail and office space lease agreements and insignificant equipment lease agreements which are accounted for as operating leases. The real property leases typically are for three- to five-year terms with many containing options for similar renewal periods. The Company determines if an arrangement is or contains a lease at inception. Operating leases are included in operating lease right-of-use assets and operating lease liabilities (current and noncurrent) in the condensed consolidated balance sheet. Finance leases are included in property and equipment and finance lease obligations in the condensed consolidated balance sheet.
ROU assets and lease liabilities are recognized based on the present value of future minimum lease payments over the lease term at commencement date. As most of the Company’s leases do not provide an implicit rate, Management used the Company’s collateralized incremental borrowing rate based on the information available at commencement date in determining the present value of future payments.
F-15
The lease payment terms may include fixed payment terms and variable payments. Fixed payment terms and variable payments that depend on an index (i.e., Consumer Price Index, or “CPI”) or rate are considered in the determination of the operating lease liabilities. While lease liabilities are not remeasured because of changes to the CPI, changes are treated as variable lease payments and recognized in the period in which the obligation for those payments was incurred. Variable payments that do not depend on an index or rate are not included in the lease liabilities determination. Rather, these payments are recognized as variable lease expense when incurred. Expenses related to leases with a lease term of one month or less are recognized as variable lease expense when incurred. Variable lease payments are included within operating costs and expenses in the condensed consolidated statement of operations.
Due to the significant assumptions and judgements required in accounting for leases (to include whether a contract contains a lease, the allocation of the consideration, and the determination of the discount rate), the judgements and estimates made could have a significant effect on the amount of assets and liabilities recognized.
Total components of operating lease expense for the real property asset class (in thousands) were as follows:
|
|
|
2019 |
|
|
|
Operating lease expense |
|
$ |
5,701 |
|
|
Variable lease expense |
|
|
2,708 |
|
|
Total lease expense |
|
$ |
8,409 |
|
Other information related to operating leases as of December 31, 2019 was as follows:
|
Weighted average remaining lease term, in years |
|
|
3.00 |
|
|
|
|
|
|
|
|
Weighted Average Discount Rate |
|
|
5.8 |
% |
Future minimum lease payments under operating leases as of December 31, 2019 (in thousands) were as follows:
|
2020 |
|
$ |
5,660 |
|
|
2021 |
|
|
3,940 |
|
|
2022 |
|
|
2,403 |
|
|
2023 |
|
|
1,144 |
|
|
2024 |
|
|
525 |
|
|
Thereafter |
|
|
118 |
|
|
Total minimum lease payments |
|
|
13,790 |
|
|
Less: Imputed interest |
|
|
(1,265 |
) |
|
Total present value of minimum lease payments |
|
$ |
12,525 |
|
|
Current portion operating lease liabilities |
|
$ |
5,080 |
|
|
Non-Current operating lease liabilities |
|
|
7,445 |
|
|
Total operating lease liabilities |
|
$ |
12,525 |
|
10. Goodwill and Long-Lived Assets –
During the fourth quarter of 2019, the Company completed the annual impairment assessments for goodwill and long-lived assets, determining there was no impairment.
F-16
A rollforward of the carrying amount of goodwill is as follows:
|
|
|
Cellular Retail Segment |
|
|
Direct to Consumer Segment |
|
|
Consumer Finance Segment |
|
|
Total |
|
||||
|
Balance at December 31, 2017 |
|
|
|
|
|
|
|
|
|
|
|
|
|
|
|
|
|
Goodwill |
|
$ |
5,765,284 |
|
|
$ |
31,244 |
|
|
$ |
7,559,063 |
|
|
$ |
13,355,591 |
|
|
Accumulated impairment losses |
|
|
— |
|
|
|
— |
|
|
|
(7,559,063 |
) |
|
|
(7,559,063 |
) |
|
Goodwill, net of impairment losses |
|
|
5,765,284 |
|
|
|
31,244 |
|
|
|
— |
|
|
|
5,796,528 |
|
|
2018 Activity: |
|
|
|
|
|
|
|
|
|
|
|
|
|
|
|
|
|
Goodwill acquired during year |
|
|
— |
|
|
|
— |
|
|
|
— |
|
|
|
— |
|
|
Impairment losses |
|
|
— |
|
|
|
— |
|
|
|
— |
|
|
|
— |
|
|
Balance at December 31, 2018 |
|
|
|
|
|
|
|
|
|
|
|
|
|
|
|
|
|
Goodwill |
|
|
5,765,284 |
|
|
|
31,244 |
|
|
|
7,559,063 |
|
|
|
13,355,591 |
|
|
Accumulated impairment losses |
|
|
— |
|
|
|
— |
|
|
|
(7,559,063 |
) |
|
|
(7,559,063 |
) |
|
Goodwill, net of impairment losses |
|
|
5,765,284 |
|
|
|
31,244 |
|
|
|
— |
|
|
|
5,796,528 |
|
|
2019 Activity: |
|
|
|
|
|
|
|
|
|
|
|
|
|
|
|
|
|
Goodwill acquired during year |
|
|
— |
|
|
|
— |
|
|
|
— |
|
|
|
— |
|
|
Impairment losses |
|
|
— |
|
|
|
— |
|
|
|
— |
|
|
|
— |
|
|
Balance at December 31, 2019 |
|
|
|
|
|
|
|
|
|
|
|
|
|
|
|
|
|
Goodwill |
|
|
5,765,284 |
|
|
|
31,244 |
|
|
|
7,559,063 |
|
|
|
13,355,591 |
|
|
Accumulated impairment losses |
|
|
— |
|
|
|
— |
|
|
|
(7,559,063 |
) |
|
|
(7,559,063 |
) |
|
Goodwill, net of impairment losses |
|
$ |
5,765,284 |
|
|
$ |
31,244 |
|
|
$ |
— |
|
|
$ |
5,796,528 |
|
A rollforward of the Company’s intangible assets is as follows:
|
|
|
December 31, 2018 |
|
|
Acquisitions |
|
|
Additions |
|
|
Deletions |
|
|
December 31, 2019 |
|
|||||
|
Customer relationships |
|
$ |
10,142,533 |
|
|
$ |
747,903 |
|
|
$ |
— |
|
|
$ |
(888,405 |
) |
|
$ |
10,002,031 |
|
|
Other |
|
|
227,000 |
|
|
|
— |
|
|
|
— |
|
|
|
— |
|
|
|
227,000 |
|
|
Amortizable Intangible assets |
|
|
10,369,533 |
|
|
|
747,903 |
|
|
|
— |
|
|
|
(888,405 |
) |
|
|
10,229,031 |
|
|
Less accumulated amortization |
|
|
(6,202,423 |
) |
|
|
— |
|
|
|
(699,636 |
) |
|
|
714,678 |
|
|
|
(6,187,381 |
) |
|
Net Amortizable Intangible Assets |
|
|
4,167,110 |
|
|
|
747,903 |
|
|
|
(699,636 |
) |
|
|
(173,727 |
) |
|
|
4,041,650 |
|
|
Non-amortizable trademarks |
|
|
— |
|
|
|
— |
|
|
|
— |
|
|
|
— |
|
|
|
— |
|
|
Intangible Assets, net |
|
$ |
4,167,110 |
|
|
$ |
747,903 |
|
|
$ |
(699,636 |
) |
|
$ |
(173,727 |
) |
|
$ |
4,041,650 |
|
|
|
|
December 31, 2017 |
|
|
Acquisitions |
|
|
Additions |
|
|
Deletions |
|
|
December 31, 2018 |
|
|||||
|
Customer relationships |
|
$ |
10,381,426 |
|
|
$ |
46,707 |
|
|
$ |
— |
|
|
$ |
(285,600 |
) |
|
$ |
10,142,533 |
|
|
Other |
|
|
227,000 |
|
|
|
— |
|
|
|
— |
|
|
|
— |
|
|
|
227,000 |
|
|
Amortizable Intangible assets |
|
|
10,608,426 |
|
|
|
46,707 |
|
|
|
— |
|
|
|
(285,600 |
) |
|
|
10,369,533 |
|
|
Less accumulated amortization |
|
|
(5,620,657 |
) |
|
|
— |
|
|
|
(794,688 |
) |
|
|
212,922 |
|
|
|
(6,202,423 |
) |
|
Net Amortizable Intangible Assets |
|
|
4,987,769 |
|
|
|
46,707 |
|
|
|
(794,688 |
) |
|
|
(72,678 |
) |
|
|
4,167,110 |
|
|
Non-amortizable trademarks |
|
|
— |
|
|
|
— |
|
|
|
— |
|
|
|
— |
|
|
|
— |
|
|
Intangible Assets, net |
|
$ |
4,987,769 |
|
|
$ |
46,707 |
|
|
$ |
(794,688 |
) |
|
$ |
(72,678 |
) |
|
$ |
4,167,110 |
|
As of December 31, 2019, estimated future amortization expense for the amortizable intangible assets is as follows:
|
2020 |
|
$ |
677,627 |
|
|
2021 |
|
|
578,832 |
|
|
2022 |
|
|
539,117 |
|
|
2023 |
|
|
521,452 |
|
|
2024 |
|
|
491,721 |
|
|
Thereafter |
|
|
1,232,901 |
|
|
|
|
$ |
4,041,650 |
|
11. Loans Receivable – Non-Current –
The Company has two non-current loans receivable from noncontrolling interests. The loans include a 5% annual interest rate, include no prepayment penalties and the Company, at its option, has the right to apply non-tax related distributions to the outstanding balances.
F-17
12. Deferred Revenue and Other Liabilities –
Deferred revenue and other liabilities consisted of the following:
|
|
|
December 31, |
|
|||||
|
|
|
2019 |
|
|
2018 |
|
||
|
Deferred financing fees |
|
$ |
218,113 |
|
|
$ |
218,729 |
|
|
Merchandise credits and gift card liability |
|
|
576,717 |
|
|
|
794,043 |
|
|
Total |
|
$ |
794,830 |
|
|
$ |
1,012,772 |
|
13. Notes Payable – Long Term –
The Company’s long-term debt was as follows:
|
|
|
December 31, |
|
|||||
|
|
|
2019 |
|
|
2018 |
|
||
|
Subsidiary note payable to seller with monthly interest only payments at 6%, guaranteed by PQH, maturing August 5, 2022 when the principal balance is due. |
|
$ |
789,216 |
|
|
$ |
789,216 |
|
|
Subsidiary note payable with $6,692 monthly payments of principal together with interest at 5.5%, , maturing January 4, 2024. |
|
|
296,035 |
|
|
|
— |
|
|
Total |
|
|
1,085,251 |
|
|
|
789,216 |
|
|
Less current maturities |
|
|
(65,414 |
) |
|
|
— |
|
|
|
|
$ |
1,019,837 |
|
|
$ |
789,216 |
|
Future minimum long-term principal payments as of December 31, 2019 were as follows:
|
2020 |
|
$ |
65,414 |
|
|
2021 |
|
|
69,202 |
|
|
2022 |
|
|
862,378 |
|
|
2023 |
|
|
77,347 |
|
|
2024 |
|
|
10,910 |
|
|
Thereafter |
|
|
— |
|
|
|
|
$ |
1,085,251 |
|
14. Income Taxes –
The provision for income taxes consists of an amount for taxes currently payable and a provision for tax consequences deferred to future periods. Deferred income taxes are recognized for the future tax consequences attributable to differences between the financial statement carrying amounts of existing assets and liabilities and their respective tax bases. Deferred income tax assets and liabilities are measured using enacted tax rates expected to apply to taxable income in the years in which those temporary differences are expected to be recovered or settled
F-18
The Company’s provision for income tax expense (benefit) was as follows for the year ended December 31:
|
|
|
2019 |
|
|
2018 |
|
||
|
Current: |
|
|
|
|
|
|
|
|
|
Federal |
|
$ |
1,026,000 |
|
|
$ |
— |
|
|
State |
|
|
292,000 |
|
|
|
42,000 |
|
|
|
|
|
1,318,000 |
|
|
|
42,000 |
|
|
|
|
|
|
|
|
|
|
|
|
Deferred: |
|
|
|
|
|
|
|
|
|
Federal |
|
|
(319,000 |
) |
|
|
(574,000 |
) |
|
State |
|
|
(91,000 |
) |
|
|
(87,000 |
) |
|
|
|
|
(410,000 |
) |
|
|
(661,000 |
) |
|
|
|
|
|
|
|
|
|
|
|
|
|
$ |
908,000 |
|
|
$ |
(619,000 |
) |
Deferred income tax assets (liabilities) are summarized as follows:
|
|
|
December 31, |
|
|||||
|
|
|
2019 |
|
|
2018 |
|
||
|
Allowance for accounts and loans receivable |
|
$ |
179,000 |
|
|
$ |
216,000 |
|
|
Inventory capitalization |
|
|
57,000 |
|
|
|
57,000 |
|
|
Inventory reserve |
|
|
139,000 |
|
|
|
136,000 |
|
|
Accrued expenses |
|
|
147,000 |
|
|
|
116,000 |
|
|
Net operating loss carryforward |
|
|
— |
|
|
|
135,000 |
|
|
Prepaid expense |
|
|
(209,000 |
) |
|
|
(243,000 |
) |
|
Property and equipment |
|
|
(587,000 |
) |
|
|
(686,000 |
) |
|
Goodwill and intangible assets |
|
|
(111,000 |
) |
|
|
259,000 |
|
|
Installment sale proceeds receivable |
|
|
— |
|
|
|
(785,000 |
) |
|
|
|
|
|
|
|
|
|
|
|
Net deferred income tax asset (liability) |
|
$ |
(385,000 |
) |
|
$ |
(795,000 |
) |
Reconciliations from the statutory federal income tax rate to the effective income tax rate are as follows for the year ended December 31:
|
|
|
2019 |
|
|
2018 |
|
||
|
Income tax expense (benefit) using the statutory federal rate |
|
$ |
917,000 |
|
|
$ |
(449,000 |
) |
|
State income taxes, net of federal benefit |
|
|
235,000 |
|
|
|
(55,000 |
) |
|
Non-deductible meals and entertainment |
|
|
12,000 |
|
|
|
9,000 |
|
|
Noncontrolling interest’s pass through income |
|
|
(270,000 |
) |
|
|
(163,000 |
) |
|
Other |
|
|
14,000 |
|
|
|
39,000 |
|
|
|
|
|
|
|
|
|
|
|
|
Income tax expense (benefit) |
|
$ |
908,000 |
|
|
$ |
(619,000 |
) |
For the year ended December 31, 2018, the Company generated federal net operating losses (“NOLs”) of approximately $500,000 which were fully utilized in 2019.
It is the Company’s practice to recognize penalties and/or interest related to income tax matters in interest and penalties expense. As of December 31, 2019 and 2018, the Company had an immaterial amount of accrued interest and penalties.
The Company is subject to income taxes in the U.S. federal jurisdiction and various states and local jurisdictions. Tax regulations within each jurisdiction are subject to the interpretation of the related tax laws and regulations and require significant judgment to apply. Accounting principles generally accepted in the United States of America require management to evaluate tax positions taken by the Company and recognize a tax liability (or asset) if the Company has taken an uncertain position that more likely than not would not be sustained upon examination by the Internal Revenue Service. Management has analyzed the tax positions taken by the Company and has concluded that as of December 31, 2019, there are no uncertain positions taken or expected to be taken that would require recognition of a liability (or asset) or disclosure in the consolidated financial statements. The Company is subject to routine audits by taxing jurisdictions. Currently the Company has no federal or state audits in progress. Management believes the Company is no longer subject to income tax examinations for years prior to 2016.
F-19
15. Equity –
WCR 2015 Stock Incentive Plan
On February 2, 2008, the Board of Directors of the Company approved and adopted the Company’s 2008 Stock Incentive Plan, pursuant to which an aggregate of 100,000 shares of common stock have been reserved for issuance. Effective February 6, 2015, the Board of Directors terminated the 2008 Stock Incentive Plan and adopted the Company’s new 2015 Stock Incentive Plan. There were no incentives issued or outstanding under the terminated plan. As of December 31, 2019 65,000 options had been granted under the 2015 plan.
The Board of Directors, or a committee of the Board, administers the 2015 Stock Incentive Plan and has complete authority to award incentives, to interpret the plan and to make any other determination which it believes necessary and advisable for the proper administration of the plan. A total of 100,000 shares of common stock were reserved in connection with the adoption of the 2015 Stock Incentive Plan.
The 2015 Stock Incentive plan permits the granting of incentives in any one or a combination of the following forms:
|
|
● |
stock options, including options intended to qualify under Section 422 of the Internal Revenue Code of 1986, as amended, as “qualified” or “incentive” stock options; |
|
|
● |
stock appreciation rights (often referred to as “SARs”) payable in shares of common stock; |
|
|
● |
restricted stock and restricted stock units; |
|
|
● |
performance awards of cash, stock or property; and |
|
|
● |
stock awards. |
The following table summarizes nonvested stock option awards outstanding at December 31, 2019 and the changes for the year then ended:
|
|
|
Number of Shares |
|
|
Weighted-Average Exercise Price Per Share |
|
|
Weighted-Average Remaining Contractual Term |
|
|
Aggregate Intrinsic Value |
|
||||
|
Outstanding and nonvested at December 31, 2018 |
|
|
— |
|
|
$ |
— |
|
|
|
|
|
|
$ |
— |
|
|
Granted |
|
|
— |
|
|
|
— |
|
|
|
|
|
|
|
— |
|
|
Vested |
|
|
— |
|
|
|
— |
|
|
|
|
|
|
|
— |
|
|
Forfeited |
|
|
— |
|
|
|
— |
|
|
|
|
|
|
|
— |
|
|
Outstanding and nonvested at December 31, 2019 |
|
|
— |
|
|
$ |
— |
|
|
|
|
|
|
$ |
— |
|
|
|
|
|
|
|
|
|
|
|
|
|
|
|
|
|
|
|
|
Exercisable at December 31, 2019 |
|
|
65,000 |
|
|
$ |
6.00 |
|
|
|
|
|
|
$ |
— |
|
The vested options were granted on February 9, 2015 and have a contract life of ten years. The strike price of outstanding vested options exceeded the share value at December 31, 2019 and thus there was no intrinsic value in outstanding vested options at December 31, 2019. As of December 31, 2019, there was no unrecognized stock-based compensation expense.
Noncontrolling Interests
The subsidiary PQH owns less than a 100% interest in subsidiary limited liability companies. For financial interests in which the Company owns a controlling financial interest, the Company applies the provisions of ASC 810, which are applicable to reporting the equity and net income or loss attributable to noncontrolling interests.
F-20
16. Dividends –
Our Board of Directors declared the following dividends payable in 2019:
|
Date Declared |
Record Date |
Dividend Per Share |
Payment Date |
Dividend Paid |
|
February 2, 2019 |
March 1, 2019 |
$0.05 |
March 11, 2019 |
$469,434 |
|
May 2, 2019 |
May 23, 2019 |
$0.05 |
June 3, 2019 |
$469,434 |
|
August 1, 2019 |
August 23, 2019 |
$0.05 |
September 3, 2019 |
$468,912 |
|
October 31, 2019 |
November 15, 2019 |
$0.05 |
November 25, 2019 |
$467,435 |
17. Revenue –
Revenue generated from contracts with customers and recognized per ASC 606 primarily consists of sales of merchandise and services at the point of sale and compensation from Cricket Wireless. As a Cricket Wireless authorized retailer, we earn compensation from Cricket Wireless for activating a new customer on the Cricket Wireless network, activating new devices for existing Cricket Wireless customers (“back-end compensation”) and upon an existing Cricket Wireless customer whom we originally activated on the Cricket Wireless GSM network making a continuing service payment (“CSP”). Compensation from Cricket Wireless in 2019 and 2018 was $29.19 million and $29.29 million, respectively.
Revenue generated from short-term lending agreements in the Consumer Finance segment and from Company investments are recognized in accordance with ASC 825.
Total net sales of merchandise, which exclude sales taxes, are generally recorded as follows:
|
|
● |
Cellular Retail – net sales reflects the transaction price at point of sale when payment is received or receivable, the customer takes control of the merchandise and, applicable to devices, the device has been activated on the Cricket Wireless network. The sale and activation of a wireless device also correlates to the recording of back-end compensation from Cricket Wireless. Sales returns are generally not material to our financial statements. |
|
|
● |
Direct to Consumer – net sales reflect the transaction price when product is shipped to customers, FOB shipping point, reduced by variable consideration. Shipping and handling fees are also included in total net sales. Variable consideration is comprised of estimated future returns and merchandise credits which are estimated based primarily on historical rates and sales levels. |
|
|
● |
Consumer Finance - net sales reflects the transaction price at point of sale when payment in full is received and the customer takes control of the merchandise. Sales returns are generally not material to our financial statements. |
Services revenue from customer paid fees is generally recorded at point of sale when payment is received and the customer receives the benefit of the service. CSP compensation from Cricket Wireless is recorded as of the time certain Cricket Wireless customers make a service payment, as reported to us by Cricket Wireless.
Recognized as revenue per ASC 825, Consumer Finance loan fees and interest on cash advance loans are recognized on a constant-yield basis ratably over a loan’s term. Installment loan fees and interest are recognized using the interest method, except that installment loan origination fees are recognized as they become non-refundable and installment loan maintenance fees are recognized when earned. The Company recognizes fees on pawn loans on a constant-yield basis ratably over the loans’ terms, less an estimated amount for expected forfeited pawn loans which is based on historical forfeiture rates.
See Note 20, “Segment Information,” for disaggregation of revenue by segment.
F-21
18. Other Operating Expenses –
A breakout of other operating expenses is as follows for the year ended December 31:
|
|
|
2019 |
|
|
2018 |
|
||
|
Bank fees |
|
$ |
1,956,674 |
|
|
$ |
1,915,795 |
|
|
Collection costs |
|
|
324,595 |
|
|
|
331,712 |
|
|
Insurance |
|
|
805,547 |
|
|
|
867,204 |
|
|
Management and advisory fees |
|
|
835,154 |
|
|
|
794,800 |
|
|
Professional and consulting fees |
|
|
1,406,914 |
|
|
|
1,935,561 |
|
|
Supplies |
|
|
658,500 |
|
|
|
702,371 |
|
|
Disposal loss on closed/sold locations |
|
|
75,077 |
|
|
|
1,731,893 |
|
|
Other |
|
|
2,385,780 |
|
|
|
2,538,773 |
|
|
|
|
$ |
8,448,241 |
|
|
$ |
10,818,109 |
|
19. Acquisitions –
Cellular Retail Acquisitions
In 2019, the Company’s Cellular Retail segment completed numerous small Cricket retail location transactions, acquiring 67 locations in total, most of which involved the selling party contributing a noncontrolling interest.
The purchase price calculation is as follows:
| 2019 | ||||
| Cash | $ | 738 | ||
| Note payable | 18 | |||
| Noncontrolling interests / equity | 218 | |||
| $ | 974 | |||
The assets acquired and contributed and liabilities assumed (in thousands) were recorded at their estimated fair values as of the purchase date as follows:
| 2019 | ||||
| Cash | $ | 136 | ||
| Inventory | 458 | |||
| Property and equipment | 1,579 | |||
| Intangible assets | 748 | |||
| Operating lease right-of-use assets | 3,606 | |||
| Other assets | 582 | |||
| Other liabilities | (1,179 | ) | ||
| Notes payable | (1,350 | ) | ||
| Operating lease liabilities | (3,606 | ) | ||
| $ | 974 | |||
20. Segment Information –
The Company has grouped its operations into four segments – Cellular Retail, Direct to Consumer, Consumer Finance and Corporate. The Cellular Retail segment is an authorized retailer for Cricket Wireless selling cellular phones and accessories, ancillary services and serving as a payment center for customers. The Direct to Consumer segment, which consists of an online and direct marketing distribution retailer with product offerings including seeds, live goods and garden accessories operating in the retail market under Park Seed, Jackson & Perkins and Wayside Gardens, and in the wholesale market under Park Wholesale, and an online retail seller of home improvement and restoration products operating over the internet through the domain name of www.Vandykes.com and through direct mail catalogs. The Consumer Finance segment provides financial and ancillary services. The Corporate segment includes the parent company activities, inclusive of the acquisitions department and management of acquired subsidiaries.
F-22
Segment information related to the year ended December 31, 2019 and 2018 is as follows:
|
December 31, 2019 |
|||||||||||||||||||||
|
|
|
Cellular Retail |
|
|
Direct to Consumer |
|
|
Consumer Finance |
|
|
Corporate |
|
|
Total |
|
||||||
|
|
|
|
|
|
|
|
|
|
|
|
|
|
|
|
|
|
|
|
|
|
|
|
Revenue from external customers |
|
$ |
68,682 |
|
|
$ |
38,024 |
|
|
$ |
1,696 |
|
|
$ |
— |
|
|
$ |
108,402 |
|
|
|
Fees and interest income |
|
$ |
— |
|
|
$ |
— |
|
|
$ |
8,513 |
|
|
$ |
— |
|
|
$ |
8,513 |
|
|
|
Total Revenue |
|
$ |
68,682 |
|
|
$ |
38,024 |
|
|
$ |
10,209 |
|
|
$ |
— |
|
|
$ |
116,915 |
|
|
|
Depreciation and amortization |
|
$ |
1,961 |
|
|
$ |
513 |
|
|
$ |
31 |
|
|
$ |
7 |
|
|
$ |
2,512 |
|
|
|
Interest expense |
|
$ |
62 |
|
|
$ |
2 |
|
|
$ |
— |
|
|
$ |
51 |
|
|
$ |
115 |
|
|
|
Income tax expense (benefit) |
|
$ |
490 |
|
|
$ |
175 |
|
|
$ |
381 |
|
|
$ |
(138 |
) |
|
$ |
908 |
|
|
|
Net income (loss) |
|
$ |
2,502 |
|
|
$ |
588 |
|
|
$ |
1,066 |
|
|
$ |
(700 |
) |
|
$ |
3,456 |
|
|
|
Total segment assets |
|
$ |
35,816 |
|
|
$ |
12,397 |
|
|
$ |
8,582 |
|
|
$ |
35,112 |
|
|
$ |
91,907 |
|
|
|
Expenditures for segmented assets |
|
$ |
1,007 |
|
|
$ |
308 |
|
|
$ |
— |
|
|
$ |
— |
|
|
$ |
1,315 |
|
|
|
December 31, 2018 |
|||||||||||||||||||||
|
|
|
Cellular Retail |
|
|
Direct to Consumer |
|
|
Consumer Finance |
|
|
Corporate |
|
|
Total |
|
||||||
|
|
|
|
|
|
|
|
|
|
|
|
|
|
|
|
|
|
|
|
|
|
|
|
Revenue from external customers |
|
$ |
65,096 |
|
|
$ |
38,433 |
|
|
$ |
1,813 |
|
|
$ |
— |
|
|
$ |
105,342 |
|
|
|
Fees and interest income |
|
$ |
— |
|
|
$ |
— |
|
|
$ |
8,923 |
|
|
$ |
— |
|
|
$ |
8,923 |
|
|
|
Total Revenue |
|
$ |
65,096 |
|
|
$ |
38,433 |
|
|
$ |
10,736 |
|
|
$ |
— |
|
|
$ |
114,265 |
|
|
|
Depreciation and amortization |
|
$ |
2,121 |
|
|
$ |
512 |
|
|
$ |
51 |
|
|
$ |
10 |
|
|
$ |
2,694 |
|
|
|
Interest expense |
|
$ |
47 |
|
|
$ |
5 |
|
|
$ |
— |
|
|
$ |
137 |
|
|
$ |
189 |
|
|
|
Income tax expense (benefit) |
|
$ |
(573 |
) |
|
$ |
(136 |
) |
|
$ |
397 |
|
|
$ |
(307 |
) |
|
$ |
(619 |
) |
|
|
Net income (loss) |
|
$ |
(1,272 |
) |
|
$ |
(481 |
) |
|
$ |
1,117 |
|
|
$ |
(885 |
) |
|
$ |
(1,521 |
) |
|
|
Total segment assets |
|
$ |
24,816 |
|
|
$ |
13,769 |
|
|
$ |
7,408 |
|
|
$ |
34,447 |
|
|
$ |
80,440 |
|
|
|
Expenditures for segmented assets |
|
$ |
512 |
|
|
$ |
504 |
|
|
$ |
22 |
|
|
$ |
— |
|
|
$ |
1,038 |
|
|
21. Commitments and Contingencies –
Employment Agreements
The Company is party to an employment agreement with its Chief Executive Officer, Mr. John Quandahl. The agreement runs from November 1, 2019 through November 2022. The agreement provides an annual base salary and eligibility for an annual performance-based cash bonus pool for management and contains customary non-solicitation and non-competition provisions as well as provisions for severance payments upon termination by the Company without cause or upon termination by Mr. Quandahl with good reason.
The Company is party to an Amended and Restated Employment Agreement effective August 16, 2017 with its Chief Financial Officer / Chief Investment Officer, Mr. Angel Donchev. The agreement provides an annual base salary and eligibility for a discretionary annual performance-based bonus up to $135,000 and contains provisions for severance payments upon termination by the Company without cause.
The Company has also entered into several employment agreements with certain members of subsidiary management. The terms of each agreement are different. However, one or all of these agreements include stipulated base salary and bonus potential. The agreements also contain customary non-solicitation and non-competition provisions as well as provisions for severance payments upon termination by the Company without cause.
F-23
Pursuant to the numerous employment agreements, bonuses of approximately $881,000 and $286,000 were accrued for the year ended December 31, 2019 and 2018, respectively.
Assigned Leases
The Company’s Cellular Retail segment has transferred operations of many locations to other dealers and remains contingently liable under many lease agreements. Minimum lease payments of assigned or assumed non-cancelable operating leases related to transferred of 45 locations in which a release has not been obtained from the lessor are approximately $2,208,000 as of December 31, 2019.
Legal Proceedings
The Company is party to a variety of legal actions arising out of the normal course of business. Plaintiffs occasionally seek punitive or exemplary damages. The Company does not believe that such normal and routine litigation will have a material impact on its consolidated financial results.
22. Management and Advisory Agreement –
The Company is party to a Second Amended and Restated Management and Advisory Agreement dated November 1, 2017 with Blackstreet Capital Management, LLC, (“Blackstreet”) under which Blackstreet provides certain financial, managerial, strategic and operating advice and assistance to the Company. The agreement requires the Company to pay Blackstreet a fee in an amount equal to $400,000 upon the closing of an acquisition in consideration for Blackstreet’s referral to the Company of such acquisition opportunity, and Blackstreet’s assistance in the performance of due diligence services relating thereto. The annual fees under the agreement equal the greater of (i) $674,840 (subject to annual increases of five percent) or (ii) five percent of Western Capital’s “EBITDA” as defined under the agreement. Finally, the agreement may only be terminated by mutual consent of the parties. Upon any termination, the Company shall pay a termination fee equal to three times the previous 12-month annual fee.
The annual management and advisory fees related to the management and advisory agreement with Blackstreet for the years ended December 31, 2019 and 2018 were $735,154 and $697,335, respectively.
23. Committees of the Board of Directors –
The Board of Directors has appointed Mr. Ellery Roberts to various committees of the Board. Annual Director and committee fees expense was $42,000 and $21,000 for the year ended December 31, 2019 and 2018, respectively.
24. Related Party Transactions –
Leases
The Company leases three properties from an officer of the Company and another party under operating leases, one that is month-to-month, requiring monthly lease payments of $1,680, one that month-to-month, requiring monthly lease payments of $1,200, and one that is month-to-month, requiring monthly lease payments of $5,500.
On August 31, 2011, the Company entered into two operating leases for property owned by Ladary, LLC. Ladary, which acquired the two properties in foreclosure sales, is partially owned by the Chief Executive Officer and Chief Financial Officer of the Company, two current or past directors and one employee of the management company that manages the Company’s largest shareholder. The leases, one of which replaced an earlier lease that the Company had entered into with the prior landlord, have four-year terms, require aggregate monthly rental payments of $4,200, and are on terms and conditions substantially similar to those contained in the replaced leases. In 2018, Ladary, LLC sold one of the properties and acquired another in which the Company had existing leases in place. The leases that the Company had entered into with the prior landlord have five-year terms expiring in 2020 and require aggregate monthly rental payments of $6,696.
Annual rent expense to related parties for the retail locations for 2019 and 2018 was approximately $209,000 and $205,000, respectively.
F-24
25. Subsequent Events –
Dividend
Our Board of Directors declared the following dividends payable in 2020:
|
Date Declared |
Record Date |
Dividend Per Share |
Payment Date |
|
February 13, 2020 |
February 28, 2020 |
$0.05 |
March 9, 2020 |
We evaluated all events or transactions that occurred after December 31, 2019 up through the date we issued these financial statements. During this period we did not have any other material subsequent events that impacted our financial statements.
F-25
ITEM 9 CHANGES IN AND DISAGREEMENTS WITH ACCOUNTANTS ON ACCOUNTING AND FINANCIAL DISCLOSURE
None.
ITEM 9A CONTROLS AND PROCEDURES
EVALUATION OF DISCLOSURE CONTROLS AND PROCEDURES
We maintain disclosure controls and procedures designed to provide reasonable assurance that information required to be disclosed in our reports filed pursuant to the Securities Exchange Act of 1934 is recorded, processed, summarized and reported within the time periods specified in the SEC’s rules and forms, and that such information is accumulated and communicated to our management, including our Chief Executive Officer and Chief Financial Officer as appropriate, to allow timely decisions regarding required disclosure. A control system, no matter how well conceived and operated, can provide only reasonable, not absolute, assurance the objectives of the control system are met.
We utilize the Committee of Sponsoring Organization’s Internal Control – Integrated Framework, 2013 version, for the design, implementation and assessment of the effectiveness of our disclosure controls and procedures and internal control over financial reporting.
As of December 31, 2019, our Chief Executive Officer and Chief Financial Officer carried out an evaluation of the effectiveness of our disclosure controls and procedures as such term is defined in Rule 13a-15(e) under the Securities and Exchange Act of 1934. Based on that evaluation, our Chief Executive Officer and Chief Financial Officer concluded our disclosure controls and procedures are effective as of December 31, 2019.
MANAGEMENT’S REPORT ON INTERNAL CONTROL OVER FINANCIAL REPORTING
Our management is responsible for establishing and maintaining adequate internal control over financial reporting. Internal control over financial reporting is a set of processes designed by, or under the supervision of, a company’s principal executive and principal financial officers, to provide reasonable assurance regarding the reliability of financial reporting and the preparation of financial statements for external purposes in accordance with GAAP and includes those policies and procedures that:
|
|
● |
pertain to the maintenance of records that in reasonable detail accurately and fairly reflect our transactions and dispositions of our assets; |
|
|
● |
provide reasonable assurance our transactions are recorded as necessary to permit preparation of our financial statements in accordance with GAAP, and that receipts and expenditures are being made only in accordance with authorizations of our management and directors; and |
|
|
● |
provide reasonable assurance regarding prevention or timely detection of unauthorized acquisition, use or disposition of our assets that could have a material effect on the financial statement. |
Because of its inherent limitations, internal control over financial reporting may not prevent or detect misstatements. It should be noted that any system of internal control, however well designed and operated, can provide only reasonable, and not absolute, assurance that the objectives of the system will be met. Also, projections of any evaluation of effectiveness to future periods are subject to the risk that controls may become inadequate because of changes in conditions, or that the degree of compliance with the policies or procedures may deteriorate.
Under the supervision and with the participation of management, including its principal executive officer and principal financial officer, the Company’s management assessed the design and operating effectiveness of internal control over financial reporting as of December 31, 2019 based on the framework set forth in Internal Control—Integrated Framework issued by the Committee of Sponsoring Organizations of the Treadway Commission.
Based on this assessment, management concluded that the Company’s internal control over financial reporting was effective as of December 31, 2019. Sadler, Gibb & and Associates, LLC, an independent registered public accounting firm, is not required to issue, and thus has not issued, an attestation report on the Company’s internal control over financial reporting as of December 31, 2019.
28
CHANGES IN INTERNAL CONTROL OVER FINANCIAL REPORTING
There were no changes in our internal controls over financial reporting that occurred during the fiscal year covered by this report that materially affected, or were reasonably likely to materially affect such controls.
None.
29
ITEM 10 DIRECTORS, EXECUTIVE OFFICERS AND CORPORATE GOVERNANCE
MANAGEMENT
Our Board of Directors consists of Richard E. Miller, Ellery Roberts, Kevin Kuby, Jack Myers and John Quandahl. The following table sets forth the name and position of each of our current directors and executive officers.
|
Name |
|
Age |
|
Positions |
|
John Quandahl |
|
53 |
|
Chief Executive Officer, Chief Operating Officer and Director |
|
Angel Donchev |
|
38 |
|
Chief Financial Officer, Chief Investment Officer |
|
Steve Irlbeck |
|
55 |
|
Secretary |
|
Ellery Roberts |
|
49 |
|
Director |
|
Richard Miller |
|
73 |
|
Director |
|
Kevin Kuby |
|
51 |
|
Director |
|
Jack Myers |
|
28 |
|
Director |
The biographies of the above-identified individuals are set forth below:
John Quandahl, is the Company’s Chief Executive and Operating Officer. From 2005 until joining Wyoming Financial Lenders, Mr. Quandahl was the President of Houlton Enterprises, Inc., and prior to that served as that corporation’s Chief Operating Officer from 1999 until 2004. During his tenure at Wyoming Financial Lenders and Houlton Enterprises, Mr. Quandahl and the respective employers were based in Omaha, Nebraska. Mr. Quandahl was the controller at Silverstone Group, Inc., from 1993 until 1998, and before that began his career at the Nebraska Department of Revenue as a tax auditor in 1989. Mr. Quandahl is a certified public accountant (inactive) and earned a degree in accounting from the University of Nebraska - Lincoln. Effective January 1, 2009, Mr. Quandahl was appointed as our Chief Executive Officer and until May 2011, our interim Chief Financial Officer. Mr. Quandahl was appointed to the Board of Directors on March 9, 2009.
Angel Donchev was appointed the Company’s Chief Financial Officer on August 16, 2017. He joined the Company as its Chief Investment Officer in February 2015 and continues to hold that position. From 2005 until February 2015, Mr. Donchev was employed by Blackstreet Capital Management, LLC, a Delaware limited liability company principally engaged in the management of private investments. Prior to Blackstreet, Mr. Donchev worked as a generalist in the Corporate Finance division of Stephens Inc., a middle market investment bank. Mr. Donchev served as a director of AlphaGraphics, Inc. from February 2012 until its sale in October 2017. Mr. Donchev was previously a director of the Company from March 31, 2010 until he resigned on October 1, 2014. Mr. Donchev has been involved in control buyouts of lower middle market companies with combined revenues in excess of $700 million over the past 15 years. Mr. Donchev is a Harvard Business School alumnus and has a BBA in Business Honors and Finance from the McCombs School of Business at the University of Texas at Austin.
Steve Irlbeck was appointed the Company’s Secretary on August 16, 2017, served as the Company’s Chief Financial Officer from May 2011 until August 16, 2017 and is Chief Financial Officer of certain of the Company’s subsidiaries. Mr. Irlbeck joined the Company in January 2009 as the Company’s Senior Director of Accounting. From 1995 until 2008, Mr. Irlbeck was employed at Lutz & Company, PC, a public accounting and consulting firm in Omaha, Nebraska where he was a tax partner. Mr. Irlbeck is a certified public accountant (inactive) and earned a degree in accounting from Creighton University.
Richard Miller is an independent business consultant. Previously, Mr. Miller was Chief Executive Officer of Pirelli Tire North America, a $120 million tire manufacturer, and Chief Executive Officer of Dunn Tire Corporation, a $25 million regional tire retailer. Prior experience also includes senior operating positions with Dunlop Tire. Mr. Miller has served as Executive Chairman of True Home Value, Inc., and currently serves as Chairman of Swisher, Inc. and Swift Spinning, Inc. ― private companies to which Blackstreet Capital Management, LLC provides management and advisory services. Mr. Miller is a decorated former Marine Captain and holds a BA from Chapman College in California. Mr. Miller previously served as our Chairman of the Board from 2010 to 2015.
30
Ellery Roberts was appointed by the Board of Directors to serve as a director on May 10, 2010. Mr. Roberts brings over 20 years of private equity investing experience to our company. Mr. Roberts has been the Chairman and Chief Executive Officer of 1847 Holdings LLC since its inception on January 22, 2013. Prior to the formation of 1847 Holdings LLC, Mr. Roberts served as the managing member of The 1847 Companies LLC, a buyer and operator of two lower-middle market businesses recapitalized in 2012. Prior to The 1847 Companies, LLC, Mr. Roberts was the co-founder and was co-managing principal from October 2009 to June 2011 of RW Capital Partners LLC, the recipient of a “Green Light” letter from the U.S. Small Business Administration (SBA). Mr. Roberts was a founding member of Parallel Investment Partners, LP (formerly SKM Growth Investors, LP), or Parallel, a Dallas-based private equity fund focused on re-capitalizations, buyouts and growth capital investments in lower middle market companies throughout the United States. During his tenure at Parallel, Mr. Roberts held the position of Managing Director from January 2004 to September 2009, Vice President from January 2003 to December 2003 and Senior Associate from January 2000 to December 2002. Mr. Roberts was responsible for approximately $400 million in invested capital across two funds. Also during his tenure with Parallel, Mr. Roberts sat on the boards of Environmental Lighting Concepts, Hat World Corporation, Senex Financial Corporation, Builders TradeSource Corporation, Action Sports, Weisman Discount Home Centers, Winnercom, Mealey’s Furniture, Regional Management Corporation, Marmalade Cafes, and Diesel Service and Supply (all of which are private companies). Prior to Parallel, Mr. Roberts was a Vice President with Lazard Group LLC (NYSE: LAZ), or Lazard, from July 1997 to December 2000. While at Lazard, he focused on and also gained experience in the home building, health care, retail, industrial and lodging sectors. Prior to joining Lazard in 1997, Mr. Roberts was a Senior Financial Analyst with Colony Capital, Inc. from July 1995 to June 1996, where he analyzed and executed transactions for Colony Investors II, L.P., a $625 million private equity fund. Prior to that, he was a Financial Analyst with the Corporate Finance Division of Smith Barney Inc. (now known as Morgan Stanley Smith Barney LLC) from January 1994 to June 1995 where he participated in a wide variety of investment banking activities. During his career Mr. Roberts has been directly involved with over $3.0 billion in direct private equity investments. Mr. Roberts received his B.A. degree in English from Stanford University.
Kevin Kuby was appointed to the Board of Directors on July 1, 2015 at the direction of BC Alpha Holdings I, consistent with certain director-appointment rights granted to that company in the AlphaGraphics Merger Agreement. Mr. Kuby serves as the Managing Director of Restructuring for Blackstreet Capital Management, LLC, Executive Vice President and Chief Restructuring Officer of Blackstreet Capital Holdings, LLC, and Executive Vice President – Operations for Black Bear Sports Group, Inc. Mr. Kuby joined Blackstreet in 2012. Prior to joining Blackstreet, Mr. Kuby previously worked for Alvarez & Marsal, FTI Consulting and for PricewaterhouseCoopers in their business restructuring practices. Currently, Mr. Kuby sits on the Board of Directors of AWE, ThinkDirect Marketing Group, Northern Brewer, Jerry’s Subs and Pizza, IMarketing, Cartesian, Inc., Mom 365, Inc., Ice Rink Holding, Inc. and NSA Media Group, Inc. Mr. Kuby received an MBA from the University of Chicago and a B.A. in Economics from the University of Illinois – Urbana / Champaign.
Jack Myers, CFA, was appointed to the Board of Directors on August 28, 2019 at the direction of BC Alpha Holdings I, consistent with certain director-appointment rights granted to that company in the Alpha Graphics Merger Agreement. Mr. Myers is an Associate at Blackstreet Capital Management, LLC and Blackstreet Capital Holdings, LLC, positions he has held since June 2017. From 2013 to 2017, Mr. Myers worked as an Associate and an Analyst in the investment banking division of FBR & Co. where he gained experience in public and private equity offerings as well as M&A transactions in a variety of industries. Mr. Myers graduated cum laude from Wake Forest University with a B.S. in Finance and is a CFA charterholder. Mr. Myers also serves on the Board of Directors of AWE Acquisition, Inc., NSA Media Holdings, Inc., Cartesian Holdings, Inc., Mom365 Holdings Corp., Bijoux Nouveau, Inc. and Northern Brewer, LLC.
Under our corporate bylaws, all of our directors serve for terms expiring upon the next annual meeting of our shareholders.
When considering whether directors and nominees have the experience, qualifications, attributes and skills to enable the Board of Directors to satisfy its oversight responsibilities effectively in light of the Company’s business and structure, the Board of Directors focuses primarily on the industry and transactional experience, and other background, in addition to any unique skills or attributes associated with a director. With regard to Mr. Quandahl, the Board of Directors considered his significant experience, expertise and background with regard to accounting, financial and tax matters, his particular experience with the payday lending industry as well as retail operations, and his demonstrated experience and skills in managing and evaluating the coordination and integration of the Company’s two principal operating segments. With regard to Mr. Miller, the Board of Directors considered his leadership experience as well as his background and experience in retail operations. With regard to Mr. Roberts, the Board of Directors considered his extensive experience in finance and capital structures, his prior board leadership experience as well as his prior experience in retail operations. With regard to Mr. Kuby, the Board of Directors considered his diverse board experience and his restructuring knowledge and experience. With regard to Mr. Myers, his experience with M&A and investment banking lead to the conclusion that he should serve as a director.
AUDIT COMMITTEE FINANCIAL EXPERT
The Board of Directors has determined that the sole member of the Audit Committee, Mr. Ellery Roberts, is an “audit committee financial expert” as that term is defined in Regulation S-K promulgated under the Exchange Act. Mr. Robert’s relevant experience is detailed in Item 10 above. As noted above, Mr. Roberts qualifies as an “independent director,” as such term is defined in Section 5605(a)(2) of the Nasdaq listing rules, and meets the criteria for independence set forth in Rule 10A-3(b)(1) under the Exchange Act. The Board of Directors has determined that Mr. Roberts is able to read and understand fundamental financial statements and has past employment experience in finance or accounting.
31
CODE OF ETHICS
We have adopted a Code of Ethics that governs the conduct of our officers, directors and employees in order to promote honesty, integrity, loyalty and the accuracy of our financial statements. Our Code of Ethics was amended and restated effective as of August 15, 2019. A copy of that amended and restated Code of Ethics is filed as an exhibit to this report. You may obtain a copy of the Code of Ethics without charge by writing us and requesting a copy, attention: John Quandahl, 11550 “I” Street, Omaha, Nebraska 68137. You may also request a copy by calling us at (402) 551-8888.
COMPLIANCE WITH SECTION 16(a) OF THE EXCHANGE ACT
Section 16(a) of the Securities Exchange Act of 1934 requires our officers, directors and persons considered to be beneficial owners of more than ten percent of a registered class of our equity securities to file reports of ownership and changes in ownership with the SEC. Officers, directors and greater-than-ten-percent shareholders are required by SEC regulations to furnish us with copies of all Section 16(a) forms they file. Based solely on our review of the copies of such forms furnished to us by our officers and directors and by WCR, LLC and BC Alpha Holdings I, LLC, we believe that all such filings were filed on a timely basis for fiscal year 2019, except that Mr. Donchev and Mr. Miller each had one late Form 4 filing.
ITEM 11 EXECUTIVE COMPENSATION
SUMMARY COMPENSATION TABLE
The following table sets forth the cash and non-cash compensation awarded to or earned by: (i) each individual who served as the principal executive officer and principal financial officer of Western Capital during the year ended December 31, 2019; and (ii) each other individual that served as an executive officer of Western Capital at the conclusion of the year ended December 31, 2019 and who received more than $100,000 in the form of salary and bonus during such fiscal year. For purposes of this report, these individuals are collectively referred to as our “named executives.”
|
Name and Principal Position |
|
|
|
Salary |
|
|
Bonus |
|
|
Total |
|
John Quandahl (1) Pres. and Chief Executive Officer |
2019 2018 |
|
$ $ |
305,000 300,000 |
|
$ $ |
167,500 — |
|
$ $ |
472,500 300,000 |
|
Angel Donchev (2) Chief Financial Officer, Chief Investment Officer |
2019 2018 |
|
$ $ |
300,000 300,000 |
|
$ $ |
135,000 135,000 |
|
$ $ |
435,000 435,000 |
|
Steve Irlbeck (3) Secretary |
2019 2018 |
|
$ $ |
245,000 225,000 |
|
$ $ |
125,000 40,500 |
|
$ $ |
370,000 265,500 |
|
|
(1) |
Mr. Quandahl is our President and Chief Executive Officer (appointed January 1, 2009) and our Chief Operating Officer (appointed November 29, 2007). |
|
|
(2) |
Mr. Donchev serves as our Chief Financial Officer (appointed on August 16, 2017) and Chief Investment Officer (appointed February 2015). |
|
|
(3) |
Mr. Irlbeck currently serves as our Secretary (appointed August 16, 2017) and as Chief Financial Officer of certain subsidiaries. Mr. Irlbeck served as our Chief Financial Officer from May 10, 2011 to August 16, 2017. |
EMPLOYMENT AND CHANGE-IN-CONTROL AGREEMENTS
We do not currently have change-in-control agreements with any named executives or any other current members of our executive management.
Western Capital entered into an Amended and Restated Employment Agreement with Angel Donchev, effective as of August 16, 2017, under which Mr. Donchev became the Company’s Chief Financial Officer. Mr. Donchev retained his current title and responsibilities as the Company’s Chief Investment Officer, a position he has held since February 2015. Under the terms of the Amended and Restated Employment Agreement, Mr. Donchev is paid an annual base salary of $300,000 and is eligible to receive an annual performance-based cash bonus targeted to an amount of $135,000. In addition, Western Capital accelerated the vesting of an issued and outstanding stock option held by Mr. Donchev, entitling him to purchase up to 65,000 shares of common stock at the per-share price of $6.00 through March 31, 2025. The Amended and Restated Employment Agreement contains other customary provisions, including a non-disclosure covenant binding Mr. Donchev, and a Company obligation to pay Mr. Donchev 12 months of base salary, as severance, in the event that the Company were to terminate Mr. Donchev’s employment without cause.
32
Effective April 1, 2016, we entered into a First Amendment to Amended and Restated Employment and Non-Competition Agreement with our Chief Executive Officer, Mr. John Quandahl. In November 2019, we entered into a new agreement with Mr. Quandahl effective through November 2022. The agreement has a term of three years and contains other terms and conditions that are similar to those of the original and amended agreements which have expired. Specifically, the amended and restated agreement provides an annual base salary and eligibility for an annual performance-based cash bonus pool for management. The amended and restated agreement also contains customary non-solicitation and non-competition provisions as well as provisions for severance payments upon termination by the Company without cause or upon termination by Mr. Quandahl with good reason.
COMPENSATION OF DIRECTORS
|
Name and Principal Position |
|
|
|
Compensation |
|
|
Other Annual Compensation |
|
|
Total |
|
Richard Miller (1) Director |
2019 2018 |
|
$ $ |
— — |
|
$ $ |
100,000 100,000 |
|
$ $ |
100,000 100,000 |
|
Ellery Roberts (2) Director |
2019 2018 |
|
$ $ |
42,000 21,000 |
|
$ $ |
— — |
|
$ $ |
42,000 21,000 |
|
Kevin Kuby Director |
2019 2018 |
|
$ $ |
— — |
|
$ $ |
— — |
|
$ $ |
— — |
|
Jonathan Tipton (3) Director |
2019 2018 |
|
$ $ |
— — |
|
$ $ |
— — |
|
$ $ |
— — |
|
Jack Myers (4) Director |
2019 2018 |
|
$ $ |
— — |
|
$ $ |
— — |
|
$ $ |
— — |
|
(1) |
Mr. Miller provides management consulting services to the Company in addition to his services as a director of the Board. In accordance with the consulting agreement, his compensation is $100,000 per year. |
|
(2) |
Mr. Roberts serves on the Audit and Compensation Committees of the Board of Directors. In connection with this service, the Board of Directors approved the payment of compensation. |
|
(3) |
Mr. Tipton resigned from the Board of Directors on June 14, 2018. |
|
(4) |
Mr. Myers was appointed to the Board of Directors effective August 28, 2019. |
ITEM 12 SECURITY OWNERSHIP OF CERTAIN BENEFICIAL OWNERS AND MANAGEMENT AND RELATED SHAREHOLDER MATTERS
SECURITIES AUTHORIZED FOR ISSUANCE UNDER EQUITY COMPENSATION PLANS
The table below sets forth certain information, as of the close of business on December 31, 2019, regarding equity compensation plans (including individual compensation arrangements) under which our securities were then authorized for issuance.
|
|
|
Number of Securities to be Issued Upon Exercise of Outstanding Options, Warrants and Rights |
|
Weighted-Average Exercise Price of Outstanding Options, Warrants and Rights |
|
Number of Securities Remaining Available for Issuance Under Equity Compensation Plans (excluding securities reflected in column a) |
|
|
|
(a) |
|
(b) |
|
(c) |
|
Equity compensation plans approved by securityholders |
|
65,000 |
|
6.00 |
|
35,000 (1) |
|
Equity compensation plans not approved by securityholders |
|
None |
|
n/a |
|
None |
|
(1) |
In February 2015, our Board of Directors adopted the 2015 Stock Incentive Plan. The 2015 Stock Incentive Plan was approved by our shareholders on January 20, 2016. Refer to Note 15, “Equity” of the notes to our consolidated financial statements included in this report for additional information. We are not required by applicable state law or the listing standards of any self-regulatory organization or quotation service (e.g., the OTC Markets, NASD, AMEX or NYSE) to obtain the approval of our security holders prior to issuing any compensatory options, warrants or other rights to purchase our securities. |
Certain managers of our subsidiaries have options issued for subsidiary stock, which if exercised will dilute parent’s ownership in those subsidiaries.
Security ownership of certain beneficial owners and management
As of the close of business on March 30, 2020, we had outstanding 9,265,778 shares of common stock. Each share of capital stock is currently entitled to one vote on all matters put to a vote of our shareholders. The following table sets forth the number of common shares, and percentage of outstanding common shares, beneficially owned as of March 30, 2019, by:
|
|
● |
each person known by the Company to be the beneficial owner of more than five percent of the Company’s outstanding common stock |
|
|
● |
each current director |
|
|
● |
each executive officer of the Company and other persons identified as a named executive in ITEM 11 above, and |
|
|
● |
all current executive officers and directors as a group. |
33
Unless otherwise indicated, the address of each of the following persons is 11550 “I” Street, Omaha, Nebraska 68137, and each such person has sole voting and investment power with respect to the shares set forth opposite his, her or its name.
|
Name and Address |
|
Common Shares Beneficially Owned (1) |
|
Percentage of Common Shares (1) |
|
|
Richard Miller |
|
92,166 |
|
* |
% |
|
Ellery Roberts |
|
— |
|
— |
% |
|
Kevin Kuby |
|
— |
|
— |
% |
|
Jack Myers |
|
— |
|
— |
% |
|
John Quandahl |
|
30,000 |
|
* |
% |
|
Steve Irlbeck |
|
10,000 |
|
* |
% |
|
Angel Donchev |
|
54,865 |
|
* |
% |
|
All current executive officers and directors as a group (2) |
|
187,031 |
|
1.99 |
% |
|
WCR, LLC (3) 5425 Wisconsin Avenue Suite #701 Chevy Chase, MD 20815 |
|
4,117,510 |
|
44.44 |
% |
|
BC Alpha Holdings I, LLC (4) c/o Blackstreet Capital Management, LLC 5425 Wisconsin Avenue Suite #701 Chevy Chase, MD 20815 |
|
1,480,691 |
|
15.98 |
% |
|
Blackstreet Capital Advisors II, LLC (5) 5425 Wisconsin Avenue Suite #701 Chevy Chase, MD 20815 |
|
667,511 |
|
7.20 |
% |
|
* |
less than one percent. |
|
(1) |
Beneficial ownership is determined in accordance with the rules of the SEC, and includes general voting power and/or investment power with respect to securities. Shares of common stock issuable upon exercise of options or warrants that are currently exercisable or exercisable within 60 days of the record rate, and shares of common stock issuable upon conversion of other securities currently convertible or convertible within 60 days, are deemed outstanding for computing the beneficial ownership percentage of the person holding such securities but are not deemed outstanding for computing the beneficial ownership percentage of any other person. Under the applicable SEC rules, each person’s beneficial ownership is calculated by dividing the total number of shares with respect to which they possess beneficial ownership by the total number of outstanding shares of the Company. In any case where an individual has beneficial ownership over securities that are not outstanding, but are issuable upon the exercise of options or warrants or similar rights within the next 60 days, that same number of shares is added to the denominator in the calculation described above. Because the calculation of each person’s beneficial ownership set forth in the “Percentage of Common Shares” column of the table may include shares that are not presently outstanding, the sum total of the percentages set forth in such column may exceed 100%. |
|
(2) |
Consists of Messrs. Miller, Roberts, Kuby, Quandahl, Irlbeck, Donchev, and Myers. |
|
(3) |
Share figures contained in the table are taken from WCR, LLC’s most recent filing under §13 of the Securities Exchange Act of 1934, filed on January 9, 2017. |
|
(4) |
Share figures contained in the table are taken from BC Alpha Holdings I, LLC’s most recent filing under §13 of the Securities Exchange Act of 1934, filed on January 9, 2017. |
34
|
(5) |
Share figures contained in the table are taken from Blackstreet Capital Advisors II, LLC’s most recent filing under §13 of the Securities Exchange Act of 1934, filed on January 9, 2017. |
ITEM 13 CERTAIN RELATIONSHIPS AND RELATED TRANSACTIONS AND DIRECTOR INDEPENDENCE
CERTAIN RELATIONSHIPS AND TRANSACTIONS
None.
RELATED-PARTY TRANSACTION POLICY
The Board of Directors has adopted a written Conflict of Interest and Related Party Transaction Policy. That policy governs the approval of all related-party transactions, subject only to certain customary exceptions (e.g., compensation, certain charitable donations, transactions made available to all employees generally, etc.). The policy contains a minimum dollar threshold of $5,000.
The entire Board of Directors administers the policy and approves any related-party transactions. At each calendar year’s first regularly scheduled meeting, management discloses any known related-party transactions to be entered into by the Company for that calendar year, including the proposed aggregate value of such transactions if applicable. After full disclosure of all material facts, review and discussion, the board votes whether to approve the proposed transactions. If a related-party transaction will be ongoing, the board may establish guidelines for management to follow in its ongoing dealings with the related party. However, management is generally required to update the board as to any material change to the related-party transactions approved at the first calendar year meeting.
In the event management recommends any related-party transactions after the first calendar year meeting, such transactions are generally presented to the board for approval in advance, or preliminarily entered into by management subject to ratification by the board. If ratification is not obtained, management must make all reasonable efforts to cancel or annul such transaction.
Procedurally, no director is allowed vote in any approval of a related-party transaction for which he or she is the related party, except that such a director may otherwise participate in a related discussion and shall provide to the board all material information concerning the related-party transaction and the director’s interest therein.
DIRECTOR INDEPENDENCE
The Company does not have a standing nominating committee. Instead, the entire Board of Directors shares the responsibility of identifying potential director-nominees to serve on the Board of Directors.
The Board of Directors does have a standing Compensation Committee and Audit Committee. The Compensation Committee is composed of Mr. Roberts. The Audit Committee is composed of Mr. Roberts. The Board of Directors has determined that only Mr. Roberts is “independent,” as such term is defined in Section 5605(a)(2) of the Nasdaq listing rules, and meets the criteria for independence set forth in Rule 10A-3(b)(1) under the Exchange Act. The preceding disclosure respecting director independence is required under applicable SEC rules. However, as a corporation whose shares are listed for trading on the OTCQB, we are not required to have any independent directors at all on our Board of Directors, or any independent directors serving on any particular committees of the Board of Directors.
35
ITEM 14 PRINCIPAL ACCOUNTANT FEES AND SERVICES
The following table summarizes the fees we were billed for audit and non-audit services rendered for fiscal years 2019 and 2018. Sadler, Gibb & Associates, LLC reviewed our quarterly filings and audited the Company’s consolidated financial statements for the year 2019 and 2018.
|
Independent Registered Public Accounting Firm Fees
|
|||||
|
|
|
2019 |
|
|
2018 |
|
Audit Fees |
$ |
130,000 |
|
$ |
117,500 |
|
Audit-Related Fees |
|
— |
|
|
— |
|
Tax Fees |
|
— |
|
|
— |
|
All Other Fees |
|
— |
|
|
— |
|
|
|
|
|
|
|
|
Total |
$ |
130,000 |
|
$ |
117,500 |
Our auditor Sadler, Gibb & Associates, LLC did not perform any other audit-related, tax-related or other services for fees during either of fiscal 2019 or 2018.
Audit Fees. The fees identified under this caption were for professional fees rendered in connection with the audit of our annual consolidated financial statements, review of our quarterly condensed consolidated financial statements and statutory and regulatory filings and engagements for the years identified.
Approval Policy. Our Audit Committee approves in advance all services provided by our independent registered public accounting firm. All engagements of our independent registered public accounting firms in years ended 2019 and 2018 were pre-approved by the Audit Committee.
36
ITEM 15 EXHIBITS AND FINANCIAL STATEMENT SCHEDULES
FINANCIAL STATEMENTS
|
Item |
|
Page |
|
Report of Independent Registered Public Accounting Firm on Consolidated Financial Statements |
|
F-1 |
|
Consolidated Balance Sheets – December 31, 2019 and December 31, 2018 |
|
F-2 |
|
Consolidated Statements of Operations – Years ended December 31, 2019 and December 31, 2018 |
|
F-3 |
|
Consolidated Statement of Shareholders’ Equity – Years ended December 31, 2019 and December 31, 2018 |
|
F-4 |
|
Consolidated Statements of Cash Flows – Years ended December 31, 2019 and December 31, 2018 |
|
F-5 |
|
Notes to Consolidated Financial Statements |
|
F-6 |
EXHIBITS
|
Exhibit No. |
|
Description |
|
|
||
|
|
||
| 4.1 | Description of Registrant's Securities | |
|
|
||
|
|
||
|
|
||
|
|
Employment Agreement with John Quandahl dated as of November 1, 2019 (filed herewith). |
|
|
|
||
|
|
||
|
|
Code of Ethics (amended and restated as of August 15, 2019) (filed herewith) |
|
|
|
||
|
|
Certification pursuant to Section 302 of the Sarbanes Oxley Act of 2002 (filed herewith). |
|
|
|
Certification pursuant to Section 302 of the Sarbanes Oxley Act of 2002 (filed herewith). |
|
|
|
||
|
101.INS |
|
XBRL Instance Document (filed herewith). |
|
101.SCH |
|
XBRL Schema Document (filed herewith). |
37
|
101.CAL |
|
XBRL Calculation Linkbase Document (filed herewith). |
|
101.DEF |
|
XBRL Definition Linkbase Document (filed herewith). |
|
101.LAB |
|
XBRL Label Linkbase Document (filed herewith). |
|
101.PRE |
|
XBRL Presentation Linkbase Document (filed herewith). |
38
Pursuant to the requirements of Section 13 or 15(d) of the Securities Exchange Act of 1934, the registrant has duly caused this report to be signed on its behalf by the undersigned, thereunto duly authorized.
|
|
Western Capital Resources, Inc. |
|
|
|
|
|
|
|
/s/ John Quandahl |
3/30/20 |
|
|
John Quandahl |
|
|
|
|
|
|
|
Chief Executive Officer |
|
|
|
|
|
|
|
/s/ Angel Donchev |
3/30/20 |
|
|
Angel Donchev |
|
|
|
|
|
|
|
Chief Financial Officer |
|
Pursuant to the requirements of the Securities Exchange Act of 1934, this report has been signed below by the following persons on behalf of the registrant and in the capacities and on the dates indicated.
|
/s/ John Quandahl |
3/30/20 |
|
/s/ Ellery Roberts, Director |
3/30/20 |
|
John Quandahl, Director, Chief Executive Officer, Chief Operating Officer (principal executive officer) |
|
|
|
|
|
|
|
|
|
|
|
/s/ Angel Donchev |
3/30/20 |
|
/s/ Richard Miller, Director |
3/30/20 |
|
Angel Donchev, Chief Financial Officer (principal financial officer and principal accounting officer) |
|
|
|
|
|
|
|
|
|
|
|
/s/ Kevin Kuby |
3/30/20 |
|
/s/ Jack Myers |
3/30/20 |
|
Kevin Kuby, Director |
|
|
Jack Myers, Director |
|
39