Attached files
| file | filename |
|---|---|
| EX-32 - EXHIBIT 32 - WESTERN CAPITAL RESOURCES, INC. | s102872_ex32.htm |
| EX-21.1 - EXHIBIT 21-1 - WESTERN CAPITAL RESOURCES, INC. | s102872_ex21-1.htm |
| EX-31.1 - EXHIBIT 31-1 - WESTERN CAPITAL RESOURCES, INC. | s102872_ex31-1.htm |
| EX-10.9 - EXHIBIT 10.9 - WESTERN CAPITAL RESOURCES, INC. | s102872_ex10-9.htm |
| EX-31.2 - EXHIBIT 31-2 - WESTERN CAPITAL RESOURCES, INC. | s102872_ex31-2.htm |
UNITED STATES SECURITIES AND EXCHANGE COMMISSION
WASHINGTON, D.C. 20549
FORM 10-K
(Mark One)
| x | ANNUAL REPORT PURSUANT TO SECTION 13 OR 15(d) OF THE SECURITIES EXCHANGE ACT OF 1934 For the fiscal year ended December 31, 2015 |
or
| ¨ | TRANSITION REPORT PURSUANT TO SECTION 13 OR 15(d) OF THE SECURITIES EXCHANGE ACT OF 1934 For the transition period from _______________________ to ___________________ |
Commission File Number 000-52015
WESTERN CAPITAL RESOURCES, INC.
(Exact name of registrant as specified in its charter)
| Minnesota | 47-0848102 |
| (State of incorporation) | (I.R.S. Employer Identification No.) |
|
11550 “I” Street, Suite 150 Omaha, Nebraska |
68137 |
| (Address of principal executive offices) | (Zip Code) |
Registrant’s telephone number, including area code: (402) 551-8888
| Securities registered pursuant to Section 12(b) of the Act: | ||
| Title of Each Class | Name of Each Exchange on which Registered | |
| None | N/A | |
Securities registered pursuant to Section 12(g) of the Act: Common Stock, no par value per share
Indicate by check mark if the registrant is a well-known seasoned issuer, as defined in Rule 405 of the Securities Act. ¨ Yes x No
Indicate by check mark if the registrant is not required to file reports pursuant to Section 13 or Section 15(d) of the Act. ¨ Yes x No
Indicate by check mark whether the registrant (1) has filed all reports required to be filed by Section 13 or 15(d) of the Securities Exchange Act of 1934 during the preceding 12 months (or for such shorter period that the registrant was required to file such reports), and (2) has been subject to the filing requirements for the past 90 days x Yes ¨ No
Indicate by check mark whether the registrant has submitted electronically and posted on its corporate website, if any, every Interactive Data File required to be submitted and posted pursuant to Rule 405 of Regulation S-T (§232.405 of this chapter) during the preceding 12 months (or for such shorter period that the registrant was required to submit and post such files). x Yes ¨ No
Indicate by check mark if disclosure of delinquent filers pursuant to Item 405 of Regulation S-K is not contained herein, and will not be contained, to the best of registrant’s knowledge, in definitive proxy or information statements incorporated by reference in Part III of this Form 10-K or any amendment to this Form 10-K. ¨
Indicate by check mark whether the registrant is a large accelerated filer, an accelerated filer, a non-accelerated filer or a smaller reporting company. See definition of “accelerated filer,” large accelerated filer” and “smaller reporting company” in Rule 12b-2 of the Exchange Act. (Check one):
Large accelerated filer ¨ Accelerated filer ¨ Non-accelerated filer ¨ Smaller reporting company x
Indicate by check mark whether the registrant is a shell company (as defined in Rule 12b-2 of the Act). ¨ Yes x No
The aggregate market value of the voting stock held by persons other than officers, directors and more than 5% shareholders of the registrant as of June 30, 2015 was approximately $2,202,000 based on the closing sales price of $4.60 per share as reported on the OTCQB. As of March 30, 2016, there were 9,497,534 shares of our common stock, no par value per share, outstanding.
DOCUMENTS INCORPORATED IN PART BY REFERENCE
None.
Western Capital Resources, Inc.
Form 10-K
Table of Contents
OVERVIEW
Western Capital Resources, Inc. (“WCR” or “Western Capital”) is a holding company having a controlling interest in subsidiaries operating in the following industries and operating segments:
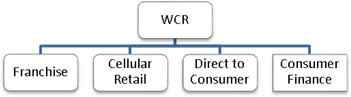
Our “Franchise” segment is comprised of AlphaGraphics, Inc. (99.2% owned), the franchisor of AlphaGraphics® customized print and marketing solutions. Our “Cellular Retail” segment is comprised of an authorized Cricket Wireless dealer and involves the retail sale of cellular phones and accessories to consumers through our wholly owned subsidiary PQH Wireless, Inc. and its subsidiaries. Our “Direct to Consumer” segment consists of (1) a wholly owned online and direct marketing retailer and distributor of live plants, seeds, holiday gifts and garden accessories operating in the retail market under the Park Seed, Jackson & Perkins and Wayside Gardens trade names, and in the wholesale market under the Park Wholesale trade name, and (2) a wholly owned online and direct marketing distribution retailer of home improvement and restoration products operating as Van Dyke’s Restorers. Our “Consumer Finance” segment consists of retail financial services conducted through our wholly owned subsidiaries Wyoming Financial Lenders, Inc. and Express Pawn, Inc. Throughout this report, we collectively refer to WCR and its consolidated subsidiaries as “we,” the “Company,” and “us.”
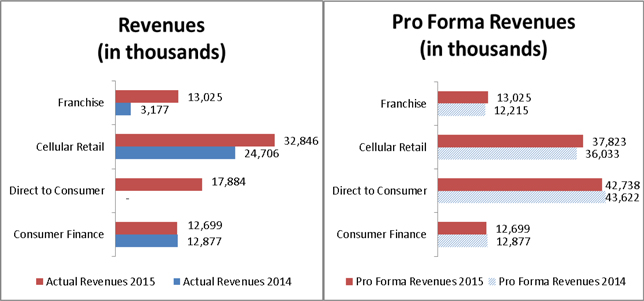
Key actual and pro forma financial data for the years ended December 31, 2015 and 2014 were as follows:
RECENT EVENTS
Acquisition of Direct to Consumer Segment
After the close of business on June 30, 2015, we acquired a 100% ownership interest in the businesses comprising our Direct to Consumer segment. These businesses were acquired through a merger transaction governed by a Merger and Contribution Agreement entered into on June 9, 2015. As contemplated under the Merger and Contribution Agreement, we issued an aggregate of 3,500,000 shares of our common stock, representing approximately 37% of our total issued and outstanding common stock immediately after the merger.
1
Cellular Retail Growth
In 2015, we acquired 51 Cricket retail locations from other Cricket dealers, subsequently closing ten locations as part of a rationalization and store consolidation plan focused on closing underperforming stores and stores in close proximity to others. We also launched three new locations in 2015. In 2016, we thus far have acquired another ten locations and launched three more locations. We continue to seek opportunities to continue our growth in this segment.
Acquisitions Department
In February 2015, Angel Donchev joined us as our Chief Investment Officer and head of our new acquisitions department. We believe that Mr. Donchev brings us significant experience in evaluating, negotiating and managing acquisition transactions. In addition, as a former member of our Board of Directors from March 2010 to September 2014, Mr. Donchev is intimately familiar with both our business and our strategy to grow profitability through the acquisition of established companies and diversify the industries and geographies in which we operate.
We expect our focus will be on growing through the acquisition of established lower middle-market businesses. We are industry agnostic and target leaders in niche industries or geographies, as well as opportunistic purchases of businesses we believe we can improve operationally. We have a particular interest in situations involving companies facing succession dilemmas, corporate divestitures and businesses in out-of-favor industries.
Pending Reincorporation
On January 20, 2016, our shareholders approved a plan to reincorporate Western Capital Resources, Inc. in Delaware at a special meeting of the shareholders called for that purpose. Presently, we expect to consummate the reincorporation in April 2016.
FRANCHISE SEGMENT
General Description
We offer business format franchise opportunities for AlphaGraphics® Business Centers within the United States and internationally. The AlphaGraphics franchise model permits our franchisees to market and provide customized marketing solutions utilizing AlphaGraphics’ trademarks, operating methods and custom-developed or licensed information technology solutions. Through our preferred vendors, we provide site selection assistance including design and construction oversight, assist with locating financing, and provide training to our franchisees prior to the launch of their franchise Business Center location(s). Additionally, throughout the term of the franchise agreement, we provide ongoing training to franchisees, national and regional advertising, and operational procedures to Business Center owners. Franchisees locate and operate their franchise locations in designated territories within a predetermined geographical region. Franchisees are also responsible to develop and maintain their customer base and operate their Business Center(s) in accordance with the franchise agreement and such standards as we direct from time to time. We profit in this segment primarily through the collection of royalty fees, as further discussed below.
2
The table below summarizes the number of franchised Business Centers in operation during the years ended December 31, 2015 and 2014:
| Beginning | New | Closed | Ending | |||||||||||||
| 2015 | ||||||||||||||||
| US Centers | 242 | 17 | (5 | ) | 254 | |||||||||||
| International Centers | 32 | 1 | (8 | ) | 25 | |||||||||||
| Total | 274 | 18 | (13 | ) | 279 | |||||||||||
| 2014 | ||||||||||||||||
| US Centers | 243 | 7 | (8 | ) | 242 | |||||||||||
| International Centers | 34 | 2 | (4 | ) | 32 | |||||||||||
| Total | 277 | 9 | (12 | ) | 274 | |||||||||||
In addition to opening new franchise locations, we also assist with the transfer process between current and future franchise owners when a franchisee seeks to sell their franchise center. We facilitated 19 and 13 franchise center transfers to new owners during the years ended December 31, 2015 and 2014, respectively.
Our U.S. and international franchisees reported sales volumes for the years ended December 31, 2015 and 2014 as follows:
| 2015 | 2014 | |||||||
| Total gross U.S. network-wide center sales | $ | 268,020,000 | $ | 255,216,000 | ||||
| Total gross international network-wide center sales | 30,694,000 | 41,144,000 | ||||||
| Total gross network-wide center sales | $ | 298,714,000 | $ | 296,360,000 | ||||
| Average center sales per U.S. center open 12 months or more | $ | 1,098,000 | $ | 1,067,000 | ||||
Products and Services
AlphaGraphics is a business-to-business print and marketing franchisor offering:
| l | Marketing solutions | l | Brand imaging | l | Graphic design |
| l | Print – digital, offset, and wide format | l | Direct mail marketing | l | Social media management |
| l | Website development | l | E-mail marketing campaigns | l | QR codes / SEO |
The Franchise Process
Potential franchisees have the option to: (1) develop a new Business Center, (2) purchase an existing Business Center, (3) acquire an existing graphics and/or marketing related business and convert it to a Business Center, or (4) convert their own graphics and/or marketing related business to a Business Center. Our discovery process for new Business Center owners involves:
| · | Understanding potential franchisee’s background and goals |
| · | Discussing AlphaGraphics’ vision, objectives and unique B2B value proposition and the profile, style, character and habits of successful AlphaGraphics franchise owners |
| · | Completing our no-obligation, confidential online Request for Consideration |
| · | Assisting with the funding process |
| · | Development of a business plan |
| · | Reviewing our Franchise Disclosure Document |
| · | Participating in a Discovery Day at our Salt Lake City, Utah location |
| · | Providing in-depth discussions with current franchise owners |
| · | Executing franchise agreement and paying required fees |
3
Our new franchise owners must meet the following financial requirements:
| · | Investment range: $260,800 - $394,400 (excluding real estate costs) |
| · | Minimum required net worth: $400,000 |
| · | Liquid capital: $150,000 |
| · | Credit score 700+ |
The Fees We Charge
We assess initial franchise fees, royalty fees, fees to support our dedicated AlphaGraphics Integrated Marketing Fund (“AIM”), Managed Service Fees (“MSF”) and various other fees. We currently offer a Universal Service Credits (“USC” or “rebate”) program allowing franchisees to earn a percentage of timely paid royalties as credits which can be used to offset various service and other fees.
Royalty fees are billed monthly with fees determined by multiplying a royalty rate against franchisee gross sales. For most franchisees, the rates used range from 8% down to 3%, with the rate decreasing as franchisee fiscal year-to-date gross sales reach established thresholds. The fiscal year for royalty fee calculations is July 1st to June 30th. We may allow franchisees an election to apply their prior year’s effective rate to their royalty payments with a true up at the end of the fiscal year to adjust to the actual rate schedule.
The table below outlines the initial non-refundable franchise fees fixed as of December 31, 2015.
| New Business Center Pathway | Transfer Pathway | Acquisition and Conversion Pathway | Conversion Pathway | |||||||||||||
| Initial franchise fee 1 | $ | 40,000 | $ | - | $ | 40,000 | $ | 10,000 | ||||||||
| Transfer fee 2 | - | 40,000 | - | - | ||||||||||||
| Training fee 3 | 8,000 | 8,000 | 8,000 | - | ||||||||||||
| Sales and marketing fee | 15,000 | - | 15,000 | - | ||||||||||||
| Sales and marketing fee or grand opening package 3 | - | 15,000 | - | - | ||||||||||||
| Client transition and marketing package 4 | - | - | - | 2,500 | ||||||||||||
| Total | $ | 63,000 | $ | 63,000 | $ | 63,000 | $ | 12,500 | ||||||||
| (1) | The franchise segment is a member of the International Franchise Association (“IFA”) and participates in the IFA’s VetFran program and MinorityFran Initiative. If an approved franchisee qualifies under either program, they are offered a $5,000 discount on the Initial Franchise Fee if the franchisee is acquiring a Business Center through either the New Business Center or Acquisition and Conversion Pathway. |
| (2) | The current standard Transfer Fee is $40,000. |
| (3) | Depends on terms within the selling franchisee’s franchise agreement. |
| (4) | Includes support, training and consultation to help reposition the operation as an AlphaGraphics Business Center. |
Competition
Franchise Industry
The franchise business model has grown in popularity over the past several decades. Franchising provides a small business owner with the opportunity to independently own and operate a business selling brand-name products or providing established services yet enjoy widespread support from the franchisor. According to USA Today, the ten most popular franchising opportunities are in the following industries:
| l | Fast food | l | Business Services | l | Retail | l | Automotive | l | Restaurants |
| l | Retail – Food | l | Building and Construction | l | Service | l | Maintenance | l | Lodging |
Because of the variety of industries participating in the franchising space with high visibility brand recognition, we face considerable competition in attracting new franchise owners.
4
Printing Industry
The quick printing industry is composed of establishments primarily engaged in traditional printing activities, such as short-run offset printing or pre-press services, in combination with document photocopying service. These establishments, known as “quick printers,” generally provide short-run printing and copying with fast turnaround times.
The digital printing industry is composed of establishments primarily engaged in printing graphic materials using digital printing equipment. Establishments known as digital printers typically provide sophisticated pre-press services, including the use of scanners to input graphic images and computers to manipulate and format the images, prior to printing.
We face competition in the printing industry, an industry largely driven by consumer demand and costs to produce, and specifically in the quick and digital printing segments where we operate.
Investment in a franchise location is significant, both financially and in time commitment. We believe our franchise model, with its operational advantages and guidance, provides our franchisees with substantial advantage over competitors with stand-alone operations.
Industry Information
According to EPICOMM (an association for leaders in print, mail, fulfillment and marketing services), sales within the industry have shown modest gains and corresponding offsetting losses, with the greatest declines realized in 2008 and 2009, and an overall shift to consolidation of commercial printing establishments. Although digitization and the Internet have broken down barriers to entry, the printing industry has found itself in highly competitive markets with little tolerance for inefficiency and spoilage.
CELLULAR RETAIL SEGMENT
General Description
We operate cellular retail stores as an authorized Cricket dealer, selling cellular phones and accessories, providing ancillary services and accepting service payments from customers. Authorized Cricket dealers are permitted to sell the carrier’s line and generally locate their store operations in areas with a strong potential customer base where the carrier does not maintain a corporate storefront. As an authorized Cricket dealer, we are only permitted to sell the Cricket line of no-contract cellular phones and service at our Cricket retail stores.
We generate revenue in this business through retail sales of Cricket cellular phones, receipt of back-end compensation from Cricket, sales of phone accessories (e.g., face plates and phone chargers), fees charged when a customer changes services (service activations and reactivations, adding lines, phone number changes, etc.), or whenever a customer whom we activated on the Cricket GSM network pays his or her no-contract cellular bill.
A summary table of the number of cellular retail stores we operated during the periods ended December 31, 2015 and 2014 follows:
| 2015 | 2014 | |||||||
| Beginning | 61 | 57 | ||||||
| Acquired / Launched | 54 | 9 | ||||||
| Closed | (16 | ) | (5 | ) | ||||
| Ending | 99 | 61 | ||||||
Market Information and Marketing
Cricket Wireless service offers customers simple, predictable and affordable nationwide flat rate wireless plans. Cricket Wireless customers have had the added advantage of unlimited minutes, text messages and data on the AT&T network.
No-contract cellular products and services are primarily targeted to market segments that are underserved by traditional communications companies. In contrast, the majority of cellular customers in the U.S. subscribe to post-pay services that may require credit approval, a contractual commitment from the subscriber for a period of at least one year, and may include overage charges for call volumes, text messages or data usage in excess of a specified maximum. We believe that a significant portion of the remaining growth potential in the U.S. cellular market consists of customers who are price-sensitive and prefer not to enter into fixed-term contracts. We believe that our cellular retail product and service offerings appeal strongly to this target-market segment.
5
Market Strategy
We believe that our business model is scalable and can be expanded successfully into new markets as we continue to perfect our operational protocols and administrative office functions relating to our cellular retail business. We expect to continue making strategic and opportunistic acquisitions of existing Cricket dealerships and to launch additional stores in new AT&T markets that are currently underserved by competing service providers.
Products and Services
Our authorized Cricket retail stores offer the following products and services:
| · | Cricket Wireless service plans, each designed to attract customers by offering simple, predictable and affordable wireless voice, text and data services that are a competitive alternative to traditional wireless and wireline services (e.g., flat-rate and unlimited voice/text plans, without fixed-term contracts, early termination fees or credit checks). |
| · | Cricket Wireless plan upgrades (e.g., international calling minutes to Canada, unlimited calls to Mexico, and roaming service packages) and special phone applications (e.g., customized ring tones, wallpapers, photos, greeting cards, games, and news and entertainment message deliveries) on a no-contract basis. |
| · | Cricket handsets. |
When purchasing a phone, our customers also have options among the latest in Apple, Android-based and Windows OS-based smartphones. Because there is no contract for the monthly service, customer phone purchases are paid in full at the time of purchase.
Seasonality
Our Cellular Retail segment operations are influenced by seasonal effects related to traditional retail selling periods and other factors that arise from our target customer base. In particular, we generally expect sales activity to be highest in the first and fourth quarters. Nevertheless, our revenues can be strongly affected by the launch of new markets, promotional activity and competitive actions, any of which have the ability to offset or exacerbate the seasonality we normally experience.
Competition
There is substantial and ever increasing competition in the wireless phone industry where customers can choose between many other postpaid and no-contract resellers, including AT&T, Verizon, Sprint, T-Mobile/Metro PCS and a larger number of regional providers. We compete for customers based principally on Cricket’s service/device offerings, price, call quality and coverage area.
Competition for the no-contract customers, the sub-industry in which we operate, continues to grow. Other significant no-contract carriers include MetroPCS, Virgin Mobile and Boost Mobile. There is also competition with other no-contract phone service providers such as Straight Talk by Wal-Mart or Wal-Mart’s Family Mobile powered by T-Mobile, an increase of national retailers offering similar or identical products and services that we provide, such as Cricket phones sold at Game Stop and Wal-Mart, and an increase in mobile virtual network operator (“MVNO”) offerings.
Our Cricket store business also competes with other actual or potential authorized sellers and distributors of Cricket products and services. The authorization to sell Cricket products and services is granted by Cricket Wireless, LLC, a wholly owned entity of Leap Wireless International, Inc. On March 13, 2014, Leap Wireless International was acquired by AT&T. Presently, we believe that our ability to compete with other sellers of Cricket products and services will depend on the success with which we operate our current store locations. If we successfully manage those stores and are able to develop and maintain a strong working relationship with Cricket, we expect that we may be able to effectively compete for additional store authorizations when and as they come available.
6
DIRECT TO CONSUMER SEGMENT
General Description
Our direct to consumer segment is a direct marketer of roses, plants, seeds, holiday gifts and home restoration products. The business is composed of: 1) a multi-channel retailer of garden and living gift products; 2) a small wholesale seed business; and 3) a multi-channel retailer of home hardware and restoration products. Our garden products brands are highly recognizable in the rose and garden space as both the Jackson & Perkins and Park Seed brands were founded more than 140 years ago.
Products and Services
Our direct to consumer segment sells product through catalogs and online under the following brands:
| · | Jackson & Perkins, 145 years of history and the most recognized brand name and the largest seller of premium roses. Jackson and Perkins is the largest seller of bare root roses in the United States, sells 130 active varieties of bare root roses, of which 52 varieties are patented by Jackson and Perkins. In addition to bare root roses, we sell rose bulbs, other flowers as well as live plants packaged as holiday gifts. Holiday gifts include wreathes, baskets and more as well as live decorative Christmas trees and amaryllis; |
| · | Park Seed, 148 years in the business and one of America’s oldest and largest direct seed retailers. The # 2 brand within the seed business, Park Seed sells premium vegetable and flower seeds and various gardening supplies directly to consumers. Park Seed sells approximately 3,000 seed varieties. The wholesale seed business sells seeds, plants and other horticultural products in larger quantities to small-medium sized growers, nurseries and garden centers. Plants and seeds sales are concentrated during the spring months; |
| · | Wayside Gardens, which sells unique, hard to find high-end flowers, plants and gardening supplies to the master gardener. The Wayside Gardens customer is extremely selective and will sometimes wait 2 years to fill a garden spot with a plant. Approximately 60% of sales occur in the three months from March to May, during the spring planting season; and |
| · | Van Dyke’s, sells home restoration products, focusing on wood products and hardware. Van Dyke’s is an online and catalog retailer with a vast assortment of vintage home restoration wood products, hardware and antique furniture, many of which are hard to find. Historically 75% of Van Dyke’s products are shipped through a third party logistics provider located in St. Louis, MO, and the remaining 25% are drop shipped to customers but this is trending to a 55/45 mix. Sales in 2015 were concentrated in 5 primary categories – Hardware, Decorative Wood, Home Accents, Knobs and Pulls and Kitchen, Bath and Other Decor. |
Seasonality
Demand for live good and holiday products are cyclical in nature, sensitive to seasonal growing patterns, general weather conditions, holiday sales patterns and competitive influences. As such, the direct to consumer segment’s results of operations, financial condition and cash flows could fluctuate significantly from period to period. The majority of segment revenue is derived in three selling periods, spring, fall, and the December holiday season, while the summer season accounts for a small portion of sales.
Market Strategy
As a direct to consumer retailer, we focus our marketing spending on internet advertising, magazine advertisements and catalogs. We are focused on niche markets and direct our advertising to repeat and new customers through internet marketing strategies.
Competition
In the retail garden business, within the bare root rose category, we compete against brick and mortar garden centers and nurseries (approximately 10,000 across the United States), as well as other online and mail-order retailers, including David Austin Roses and Regan Nursery. Across other plant categories, we compete against Gardens Alive and their portfolio of brands, and other competitors. Our biggest competitive advantages are our recognizable Jackson & Perkins brand name and its proprietary patented rose varieties. The most direct competitor for Wayside Gardens is White Flower Farms, which also focuses on high-end, premium plants.
7
Within the holiday gift segment, we compete against larger competitors including Harry and David and 1-800 Flowers, among others. Within the seed business, our primary competitor is Burpee which, in addition to having an online presence, supplies seed products to mass market retailers, including Wal-Mart.
Our Van Dyke’s Restorers brand competes primarily with other online retailers since brick and mortar stores cannot afford to carry Van Dyke’s breadth of SKUs. Our competitors are Signature Hardware, House of Antique Hardware, and Rejuvenation Hardware (part of Williams Sonoma). The above-mentioned competitors compete primarily in the hardware, lighting and kitchen and bath categories. The decorative wood portion of the Van Dyke’s business is in a very fragmented industry niche and there are no big decorative wood competitors. Van Dyke’s competes primarily through the breadth of its product variety as well as through its established brand name and customer list.
CONSUMER FINANCE SEGMENT
General Description
The majority of short-term consumer loans we provide are commonly referred to as “payday loans” or “cash advance” loans. Such loans are referred to as “payday loans” because they are typically made to borrowers who have no available cash and promise to repay the loan out of their next paycheck. We also provide short-term installment and pawn loans as part of this operating segment.
We provide short-term consumer loans in amounts that typically range from $100 to $500 with the average loan amount, including fee, being approximately $416. Cash advance loans provide customers with cash in exchange for a promissory note with a maturity of generally two to four weeks and the customer’s post-dated personal check for the aggregate amount of the cash advance, plus a fee. The fee varies from state to state based on applicable regulations, and generally ranges from $15 to $22 for each whole or partial increment of $100 borrowed. To repay the cash advance loan, a customer may pay with cash, in which case their personal check is returned to them, or allow the check to be presented to the bank for collection. Approximately 90% and 88% of our lending revenue in the Consumer Finance segment was derived from payday lending in 2015 and 2014, respectively. Payday lending revenue made up approximately 76% of our total revenue in the Consumer Finance segment in 2015 and 2014.
We offer short-term “installment” loans in Colorado and Wisconsin. Approximately 7% and 9% of our lending revenue in the Consumer Finance segment was derived from installment lending in 2015 and 2014, respectively. We provide our installment loan customers with cash in exchange for a promissory note with a maturity of generally six months. The fee and interest rate on installment loans vary based on applicable regulations. Like cash advance or payday loans, installment loans are unsecured.
We operate three pawn stores in our Consumer Finance segment. Our pawn stores provide collateralized non-recourse loans, commonly known as “pawn loans” with maturities of one to four months. Allowable service charges vary by state and loan size. The loan amount varies depending on our valuation of each item pawned. We generally lend from 30% to 55% of our estimate of the collateral’s resale value. Customers have the option to redeem the pawned merchandise during the term or at maturity, or else forfeit the merchandise to us on maturity. At our pawn stores we sell merchandise that was acquired through either customer forfeiture of pawn collateral, second-hand merchandise purchased from customers or consigned to us, or new merchandise purchased from vendors. Pawn store revenues made up approximately 13% and 11% of our total revenue in the Consumer Finance segment in 2015 and 2014, respectively.
All of our Consumer Finance lending activities and other services are subject to state regulations (which vary from state to state), federal regulations and local regulation, where applicable.
As part of each payday and installment loan transaction, we enter into a standardized written promissory note with the borrowing customer and obtain proof of income and identity, a personal post-dated check for the principal loan amount plus a specified fee if a payday loan, and other documentation. Our standardized contracts vary based on state laws, but all of our contracts plainly state in simple terms the annual percentage rate (assuming the fees we charge are computed as interest) in compliance with Regulation Z, the borrower’s right to rescind the transaction, a dispute-resolution clause, a notice of financial privacy rights, an affirmative representation about whether the borrower is a member of the U.S. military, and the consequences of defaulting on the loan. We retain copies of our written contracts and provide a signed copy to our customers.
8
In general, our lending process and standards are extraordinarily different from those used by banks. To our knowledge, banks typically order and carefully review credit reports on all loans, engage in extensive underwriting analysis, and will typically make independent verification of earnings history through phone calls, reviews of tax returns and other processes. As a result, we generally experience a higher default rate on our personal loans than banks do on their personal loans (see caption below, “Risks Associated with Our Loans—Default and Collection”). At December 31, 2015, we had an aggregate (of all loan types) of approximately:
| · | $4.64 million in current outstanding loan principal, fees and interest due to us |
| · | $1.42 million of late loans (customers’ repayment checks presented as NSF within the last 180 days or installment loan balances not past the final installment due date with one or more payments delinquent) |
A summary table of the number of Consumer Finance locations operated during the periods ended December 31, 2015 and 2014 follows:
| 2015 | 2014 | |||||||
| Beginning | 51 | 52 | ||||||
| Acquired / Launched | - | - | ||||||
| Closed | (4 | ) | (1 | ) | ||||
| Ending | 47 | 51 | ||||||
The Fees We Charge
The fee we charge for a payday loan varies from state to state, based on applicable regulations, and generally ranges from $15 to $22 for each whole or partial increment of $100 borrowed. We do not charge interest in connection with our payday loans but do charge interest and fees where allowable on our short-term installment loans made in Colorado and Wisconsin. If, however, we calculate the loan fees we charge as an annual percentage rate of interest (APR), such rate would range from 177% for a 31-day loan transacted in Kansas (on the low end) to approximately 536% for a 14-day loan in Wyoming (on the high end), with the actual average loan amount and average actual loan fees we charge involving an imputed annual percentage rate of approximately 439% and 198% for a 14-day and 31-day loan, respectively. The term of a loan significantly affects the imputed APR of the fees we charge for our loans. For instance, when a $15 fee is charged for a two-week loan of $100, the resulting APR is 391%. When the same fee on $100 is charged for a four-week loan, the resulting APR is 195%. Currently, we do not charge the maximum fee permitted in all of the states where we operate. We do, however, charge a uniform fee for all transactions processed in any particular state that involve the same range of payday loan amounts and the same term.
Of the eight states in which we presently operate, two states (South Dakota and Wisconsin) do not limit the payday loan fees we may charge or the term (i.e., the length) of the loans we may offer our customers
In Wisconsin and Colorado, we generally offer short-term installment loans in amounts from $300 to $2,000 payable in six equal monthly payments. Colorado loan terms include a 45% annual interest rate, an origination fee of 20% on loan amounts up to $300 and 7.5% on loan amounts thereafter, and a monthly maintenance fee. Wisconsin installment loans are payable over four to six months at an annual percentage rate of approximately 480%.
In Nebraska and Iowa we also offer pawn loans. Allowable service charges vary by state and loan size. Our pawn loans earn 20% per month and our average pawn loan amount typically ranges between $10 and $250, although may range as high as $2,000. The loan amount varies depending on our estimated value of each item pawned.
Many states have laws limiting the amount of fees that may be charged in connection with any lending transaction (including payday and pawn lending transactions) when calculated as an APR, and some states expressly prohibit payday lending. These limitations, combined with other limitations and restrictions, effectively prohibit us from utilizing our present business model for cash advance or “payday” lending in those jurisdictions. In addition, the federal “2007 Military Authorization Act” prohibits lenders from offering or making payday loans (or similar lending transactions) to members of the U.S. military when the interest or fees exceed a 36% APR. Like the state limitations discussed above, this limitation effectively prohibits us from providing our cash advance or “payday” lending to members of the U.S. military. As a result of these restrictions, we do not conduct business with U.S. military personnel.
The above-described payday fees are the only fees we assess and collect from our customers for payday loans. Nevertheless, we also charge a flat fee that ranges from $15 to $30 (depending on the state) for returned checks in the event that a post-dated check we attempt to cash as repayment for our loan is returned. In 2015 and 2014, we had approximately 7,700 and 7,400 checks returned that were assessed a fee.
9
Extensions or “Rollovers” of Payday Loans
When a customer “rolls over” or extends the term of an outstanding loan, when permitted by state law, we treat that rollover or extension as a brand new loan and we again charge the above-described loan fee for that transaction. This rollover has no effect on the imputed APR of the loan in those cases where the extended term is equal to the initial term of the loan. For example, a $100 four-week loan that costs $20 to obtain is the APR equivalent of 261%. If a customer extends the term of that loan for an additional four-week period, the customer will have paid $40 total in fees to obtain the $100 eight-week loan—which is again the APR equivalent of 261%. In cases where a customer (1) extends or rolls over a loan for a length of time that is less than the original loan or (2) repays the extended loan prior to the expiration of the fully extended term, the imputed APR will increase. For example, if a customer who obtained an initial $100 four-week loan for $20 in loan fees (the APR equivalent of 261%) later extends the term of that loan for only two additional weeks and pays the additional $20 loan fee, that customer will have borrowed $100 for a six-week period at a total cost of $40—which is the APR equivalent of 347%. We do not charge any interest on the unpaid fee from the initial term of the loan because, as a condition to agreeing to a loan extension, we will only accept cash payment of the fee for extending the loan.
Most states prohibit payday lenders from extending or refinancing a payday loan. Nevertheless, two states in which we presently provide payday loans (North Dakota and South Dakota) permit a loan to be extended or “rolled over” for a specified period. Specifically, North Dakota permits only one loan extension and South Dakota permits up to four loan extensions.
Risks Associated With Our Loans—Default and Collection
Ordinarily, our customers approach us for a loan because they currently have insufficient funds to meet their present obligations, and so rarely if ever do our customers have sufficient funds in their checking accounts to cover the personal post-dated checks they provide us at the time of the loan transaction. The nature of our payday loan transactions presents a number of risks, including the ultimate risk that the loan will not be paid back. In addition, we do not obtain security for our payday loans principally because, even assuming our customers would have potential collateral to offer as security for a payday loan, the small size of each particular lending transaction does not justify the time, effort and expense of identifying the collateral and properly obtaining a security interest in such collateral. As a consequence, all of our payday loans are unsecured. This means that, absent court or other legal action compelling a customer to repay our loans, we rely principally on the willingness and ability of our customers to repay amounts they owe us. In this regard, in many cases the costs of merely attempting to collect the amounts owed to us exceed the amounts we would seek to collect—making it impractical to take formal legal action against a defaulted borrower.
When a customer defaults on a loan, we engage in collection practices that include contacting the customer for repayment and the customer’s bank to determine whether funds are available to satisfy their personal post-dated check. If funds are available, we present the check to the bank for repayment and an official check from the bank is obtained to pay off the item. The costs involved in these initial collection efforts are minimal, involve some employee time and possibly a flat $15-30 bank fee to cover the cost of the cashier’s check. If funds are not available, we generally attempt to collect returned checks for up to 90 days (or up to 180 days in cases where a bank account is still active and the customer has not initiated a stop payment on the postdated check provided), principally through continued attempts to contact the customer. If our attempts remain unsuccessful after 90 (or 180) days, we assign the item to a collection agency. Assignment to a collection agency may cost us 30-40% of the amount eventually collected (if any) from the customer. Ordinarily, we do not recoup any costs of collection from our customers.
Historically, we collect approximately 57% of the amount of all returned checks, which results in approximately 3.04% of our total payday loan principal and fee volume being uncollectible. In 2015, we generated approximately 161,000 payday loan transactions.
Industry Information
According to the Community Financial Services Association of America (CFSA), more than 19 million American households count a payday loan among their choice of short-term credit products. They also estimate 20,600 operating cash advance loan stores in the United States, which in the aggregate provide approximately $38.5 billion annually in short-term credit to households experiencing cash-flow shortfalls. In addition to being a valuable source of credit for many consumers, the payday loan industry makes significant contributions to the U.S. and state economies employing more than 50,000 Americans who earn $2 billion in wages and generating more than $2.6 billion in federal, state, and local taxes. Industry trends indicate that there will likely be a net decrease in total payday lending stores over the next few years due to store closings resulting from a combination of regulatory or legal changes, a slowdown in new store growth, and general economic conditions.
10
Predatory Lending and Regulatory Concerns
In general, the payday lending industry suffers from the perception and widespread belief that payday lenders are in the nature of predatory lenders, offering loans to low income and poorly educated consumers at costs that are too high to be good for consumers. This perception and belief results in frequent efforts in the U.S. Congress and various state legislatures, often proposed by consumer advocacy groups and lobbyists for traditional financial institutions such as banks, to further regulate and restrict or prohibit payday lending outright. See “Item 1A – Risk Factors” for further information regarding regulatory risks.
We do not believe the payday lending is predatory, nor do we believe that our loans are too costly for consumers if they are judiciously obtained. In fact, we believe that bank overdraft fees by themselves are typically far more costly for consumers, and bouncing a check can often involve other negative consequences such as independent fees levied by the parties to whom a bad check is written, negative publicity, etc. In this regard, the FDIC released a November 2008 report called “Study of Bank Overdraft Programs.” The report indicates that the average amount obtained when bank customers overdraw their accounts is $60, and the average overdraft fee charged by the bank is $27. This equates to an APR of 1,173% and 587% for a two-week and four-week $60 bank “loan,” respectively. In sum, we believe that many of the bad perceptions about our industry are fueled primarily by:
| · | the effects of our loans on consumers who do not judiciously obtain payday loans |
| · | a lack of genuine understanding about the choices faced by low and middle-income people facing a critical cash shortage |
| · | anti-payday lending lobbying campaigns often funded by traditional financial institutions, such as banks and credit unions, that would economically benefit from the elimination of payday lending. |
Seasonality
Our Consumer Finance segment results are subject to seasonality, with the first and fourth quarters typically being our strongest periods as a result of broader economic factors, such as holiday spending habits at the end of each year and income tax refunds during the first quarter.
Competition
Like most other payday lenders, we believe that the primary competitive factors in our business are location and customer service. We face intense competition in an industry with relatively low barriers to entry, and we believe that the payday lending markets are becoming more competitive as the industry matures and consolidates. We compete with other payday lending and check cashing stores, and with financial service entities and retail businesses that offer payday loans or similar financial services. For example, we consider credit card companies that offer payday features, credit unions, banks that offer small loans, and creditors and loan services that can extend payment terms on outstanding loans to be our competitors. In addition, we compete in part with services offered by traditional financial institutions, most particularly with respect to the “overdraft protection” services those institutions may offer and the charges they levy for checks written with insufficient funds.
Additional areas of competition have arisen. Businesses offer loans over the Internet as well as “loans by phone,” and these services compete with the services we offer. There also has been increasing penetration of electronic banking and related services into the check cashing and money transfer industry, including direct deposit of payroll checks, payroll or debit cards, stored-value cards, prepaid credit and debit cards, and electronic transfer of government benefits.
We also believe that customer service is critical to developing loyalty. In our industry, we believe that quality customer service means:
| · | assisting with the loan application process and helping our customers understand the loan terms |
| · | treating customers respectfully |
| · | processing transactions with accuracy, efficiency and speed |
11
Our competitors for pawn store merchandise sales include numerous retail and wholesale stores, including jewelry stores, discount retail stores, consumer electronics stores, other pawn stores, other resale stores, electronic commerce retailers and auction sites.
The pawn industry in the United States is large and highly fragmented. The industry consists of approximately 13,000 pawn stores owned primarily by independent operators who own one to three locations. We consider the industry relatively mature. The three largest pawn store operators account for approximately 10% of the total estimated pawn stores in the United States.
Effect of General Economic Conditions on our Consumer Finance Segment
While our business experienced fluctuating changes in our provision for loan losses in recent years, our provision for loan losses as a percentage of payday, installment and pawn loan revenue was 17.7% for 2015 and 16.7% in 2014. In sum, we are uncertain how the current economic conditions will affect demand for our services or our loan losses for 2016.
Credit and financing available to us and our industry has been negatively impacted by recent federal and state legislation and regulation, including the overall negative perception associated with payday lending. For example, we are aware of federal and state regulatory pressures being exerted on our banking relationships due to the negative perception about payday lending. For more information, see “Negative Perceptions About Payday Lending” above and “Regulation” below.
REGULATION
We are subject to regulation by federal, state and local governments that affect the products and services we provide. Generally, these regulations are designed to protect consumers who deal with us and are not designed to protect our shareholders.
Regulation of Franchise Activities
Our franchise offerings are governed by federal and state laws that require us to provide prospective franchisees with information describing the franchisor-franchisee relationship, and certain financial and operating information about our franchise offering. Annually and when material events occur, we prepare, register or file, and amend our “Franchise Disclosure Document” in all states requiring registration.
Regulation of Consumer Financing Activities
In those states where we currently operate consumer finance activities, we are licensed as a payday lender or pawn broker where required and are subject to various state regulations regarding the terms and conditions of our payday, installment and pawn loans and our lending policies, procedures and operations. In some states, payday lending is referred to as “deferred presentment,” “cash advance loans,” “deferred deposit loans” or “consumer installment loans.” State regulations normally limit the amount that we may lend to any single consumer and may limit the number of loans that we may make to any consumer at one time or in the course of a single year. State regulations also limit the amount of fees that we may assess in connection with any loan transaction and may limit a customer’s ability to extend or “rollover” a loan with us. Often, state regulations also specify minimum and maximum maturity dates for payday loans and, in some cases, specify mandatory cooling-off periods between transactions.
Our payday lending practices must also comply with the disclosure requirements of the Federal Truth-In-Lending Act and Regulation Z under that Act. Our collection activities for delinquent loans are generally subject to consumer protection laws regulating debt-collection practices. Finally, our payday lending business subjects us to the Equal Credit Opportunity Act and the Gramm-Leach-Bliley Act.
During the last few years, legislation has been introduced and passed in the U.S. Congress and in certain state legislatures proposing or effecting various restrictions or an outright prohibition on payday lending. Currently, state laws in Arizona, Montana, Oregon and Georgia have effectively eliminated the ability to conduct payday lending in those states. In 2010, Congress passed the Dodd-Frank Wall Street Reform and Consumer Protection Act, which consolidated most federal regulation of financial services offered to consumers, and replaced the Office of Thrift Supervision’s seat on the FDIC Board. Almost all credit providers, including mortgage lenders, providers of payday loans, other nonbank financial companies, and banks and credit unions with assets over $10 billion, are now subject to new regulations to be passed by the Consumer Financial Protection Bureau. While the Bureau does not appear to have authority to make rules limiting interest rates or fees charged, the scope and extent of the Bureau’s authority will nonetheless be broad, and it is expected that the Bureau will address issues such as rollovers or extensions of payday loans and compliance with federal rules and regulations. Future restrictions on the payday lending industry could have serious consequences for us.
12
In addition, our Consumer Finance segment activities are subject to the following additional federal consumer laws and regulations:
| · | Unfair, Deceptive or Abusive Acts or Practices (UDAAP) |
| · | Collections Fair Debt Collections Practice Act (FDCPA) |
| · | Consumer Compliant Management |
| · | Electronic Fund Transfer Act (EFTA) (Reg. E) |
| · | Fair Credit Reporting Act (FCRA) |
| · | Service Members Civil Relief Act |
For more information, see “PAYDAY LENDING BUSINESS—Predatory Lending and Regulatory Concerns” above.
Financial Reporting Regulation
Regulations promulgated by the United States Department of the Treasury under the Bank Secrecy Act require us to report all transactions involving currency in an amount greater than $10,000. Generally, every financial institution must report each deposit, withdrawal, exchange of currency or other payment or transfer that involves an amount greater than $10,000. In addition, multiple currency transactions must be treated as a single transaction if we have knowledge that the transactions are by or on behalf of any one person and result, in a single business day, in the transfer of cash in or out totaling more than $10,000. In addition, the regulations require us to maintain information concerning sales of monetary instruments for cash in amounts from $3,000 to $10,000. The Bank Secrecy Act requires us, under certain circumstances, to file a suspicious activity report.
The Money Laundering Suppression Act of 1994 requires us, as a money service business, to register with the United States Department of the Treasury. Money services businesses include check cashers and sellers of money orders. Money services businesses must renew their registrations every two years, maintain a list of their agents, update the agent list annually, and make the agent list available for examination.
Finally, we have established various procedures designed to comply, and we continue to monitor and evaluate our business methods and procedures to ensure compliance with the USA PATRIOT Act.
Privacy Regulation
We are subject to a variety of federal and state laws and regulations restricting the use and seeking to protect the confidentiality of customer identity and other personal nonpublic customer information. We have identified our systems that capture and maintain nonpublic personal information, as that term is understood under the Gramm-Leach-Bliley Act and associated regulations. We disclose our public information policies to our customers as required by that law. We also have systems in place intended to safeguard this information as required by the Gramm-Leach-Bliley Act, which specifically governs certain aspects of our payday lending business.
Technology and Information
We maintain an integrated system of retail points of sale and management software applications and platforms for processing the various types of financial transactions we offer. These systems provide us with customer service, internal control mechanisms, record-keeping and reporting information. Both of our point-of-sale systems used at our payday and Cricket store locations integrate transaction data with our management information systems on a real-time basis, whereas our pawn point of sale system is fully contained. These systems are designed to provide summary, detailed and exception information to regional, area and store managers as well as corporate staff.
Franchisees utilize our internally developed intranet site that provides access to tools, resources and information including Business Center contact information, royalty calculations, AIM schedules, the MSF system and the franchisee USC rebate program.
13
Security
We believe the principal security risks to our Consumer Finance and Cellular Retail segments are robbery and employee theft. We have established extensive security and management information systems to address both areas of potential loss. To protect against robbery, most payday lending store employees work behind bullet-resistant glass, and the back office, safe and computer areas are locked and closed to customers. Security measures utilized in our retail locations include mechanical safes, electronic alarm systems monitored by third parties or remote controlled systems, control over entry to customer service representative, motion detection devices, locked cases, and, at times, the use of professional security services. Consumer Finance segment employees also use cellular phones to ensure safety and security whenever they are outside secured areas.
We implemented critical safeguarding controls, including daily cash and deposit monitoring, unannounced audits of cash and inventory items, and requiring immediate responses from our staff when irregularities in cash balances are discovered. We primarily self-insure for employee theft and dishonesty at the store level.
EMPLOYEES
At December 31, 2015, we had approximately 660 employees. We believe our relationship with our employees is good, and we have not suffered any work stoppages or labor disputes. We do not have any employees that operate under collective-bargaining agreements.
CORPORATE INFORMATION
Our principal offices are located at 11550 “I” Street, Suite 150, Omaha, Nebraska 68137, and our telephone number at that office is (402) 551-8888.
Our fiscal year ends December 31. Neither we nor any of our predecessors have been in bankruptcy, receivership or any similar proceeding.
You should consider the following risk factors, in addition to the other information presented or incorporated by reference into this Annual Report on Form 10-K, in evaluating our business and your investment in us.
Investment Risks
Acquisitions and strategic investments may fail to meet our expectations, and any such failure could have a negative impact on our results of operation or financial condition, and could ultimately result in dilution to our shareholders.
Our long-term growth strategy includes acquisitions. We may not achieve this objective. An acquisition strategy includes numerous risks, including, among others, the risk that our financial projections relating to our acquisitions may turn out to be incorrect and our investment may fail to positively impact our results and growth as anticipated (and may in fact negatively impact our results), the risk of unexpected or unidentified issues not discovered in the diligence process which could harm our financial condition, and the need for substantial additional capital which may result in dilution to our shareholders.
Acquisitions and strategic investments made wholly or partly on the basis of our issuance of securities to the target companies, or acquisitions made with cash that is obtained from outside financiers, will result in dilution to our shareholders.
The structuring of future acquisitions, whether through share exchanges, merger acquisitions or otherwise, may result in dilution to existing shareholders. In addition, cash-based transactions may not be financed from corporate cash flows and reserves, and may themselves be financed through borrowing arrangements or the sale of equity or equity-linked securities, the latter of which would be dilutive to our shareholders.
Acquisitions and strategic investments may be disruptive to our business.
The time and expense associated with finding suitable acquisitions or with integrating acquired entities and operations with our Company can be disruptive to our ongoing business and divert our management’s attention. In addition, the financing of acquisitions may impact our ability to obtain or renew financing for existing operations, or subject us to covenants restricting certain activities. Any of these outcomes could have a short- or long-term adverse effect on our results of operation and our ability to further execute our acquisition strategy.
14
Unpredictability in financing markets could impair our ability to grow our business through acquisitions.
We anticipate that opportunities to acquire businesses will materially depend on the availability of financing alternatives with acceptable terms. As a result, poor credit and other market conditions or uncertainty in the financing markets, or the adverse regulatory pressures of being involved in the payday lending business in particular, could materially limit our ability to grow through acquisitions since such conditions and uncertainty make obtaining financing more difficult and more expensive.
Our controlling shareholder possesses controlling voting power with respect to our common stock, which will limit other shareholders’ influence on corporate matters.
Our controlling shareholders, WCR, LLC and BC Alpha Holdings I, LLC, which are under common control (see Item 12), had beneficial ownership of approximately 76.70% of our common stock as of December 31, 2015. As a result, the controlling shareholders have the ability to outright control our affairs through the election and removal of our entire Board of Directors and all other matters requiring shareholder approval, including the future merger, consolidation or sale of all or substantially all of our assets. This concentrated control could discourage others from initiating any potential merger, takeover or other change-of-control transaction that may otherwise be beneficial to our shareholders. Furthermore, this concentrated control will limit the practical effect of your participation in Company matters, through shareholder votes and otherwise.
Our articles of incorporation grant our Board of Directors the power to issue additional shares of common and preferred stock and to designate other classes of preferred stock, all without shareholder approval.
Our authorized capital consists of 12.5 million shares of capital stock. Pursuant to authority granted by our articles of incorporation, our Board of Directors, without any action by our shareholders, may designate and issue shares in such classes or series (including other classes or series of preferred stock) as it deems appropriate and establish the rights, preferences and privileges of such shares, including dividends, liquidation and voting rights, provided it is consistent with Minnesota law. The rights of holders of other classes or series of stock that may be issued could be superior to the rights of holders of our common shares. The designation and issuance of shares of capital stock having preferential rights could adversely affect other rights appurtenant to shares of our common stock. Furthermore, any issuances of additional stock (common or preferred) will dilute the percentage of ownership interest of then-current holders of our capital stock and may dilute our book value per share.
Our common stock trades only in an illiquid trading market.
Trading of our common stock is conducted on the OTCQB, a tier of the OTC Markets (symbol: WCRS). This has an adverse effect on the liquidity of our common stock, not only in terms of the number of shares that can be bought and sold at a given price, but also through delays in the timing of transactions and reduction in security analysts’ and the media’s coverage of us and our common stock. This may result in lower prices for our common stock than might otherwise be obtained and could also result in a larger spread between the bid and asked prices for our common stock.
There is not now and there may not ever be an active market for shares of our common stock.
In general, there has been minimal trading volume in our common stock. During 2015, the average daily trading volume (as reported by OTC Markets) was approximately 178 shares. The small trading volume will likely make it difficult for our shareholders to sell their shares as and when they choose. Furthermore, small trading volumes are generally understood to depress market prices. As a result, you may not always be able to resell shares of our common stock publicly at the time and prices that you feel are fair or appropriate.
A default under our borrowing arrangements could require us to seek financing on a short-term basis that may be disadvantageous to us.
Our borrowing arrangements provide for a series of financial covenants and reporting requirements. If we are unable to comply with the terms or the financial covenants of those borrowing arrangements, we may need to seek additional financing. We may not be able to obtain financing on a short-term basis. Furthermore, even if we are able to obtain needed short-term financing, we may be unable to do so on terms that are favorable or acceptable to us.
15
Failure to achieve and maintain effective internal controls could limit our ability to detect and prevent fraud and thereby adversely affect our business and stock price.
Effective internal controls are necessary for us to provide reliable financial reports. Nevertheless, all internal control systems, no matter how well designed, have inherent limitations. Even those systems determined to be effective can provide only reasonable assurance with respect to financial statement preparation and presentation. As we continue executing on our acquisition strategy, our fraud risks will change and likely increase as the acquired entity may be unfamiliar or uncooperative with proper internal controls and procedures. Our inability to maintain an effective control environment may cause investors to lose confidence in our reported financial information, which could in turn have a material adverse effect on our stock price.
Our reliance on information management and transaction systems to operate our business exposes us to potential security breaches of our sensitive information from cyber incidents and hacking.
Effective information security internal controls are necessary for us to protect our sensitive information from illegal activities and unauthorized disclosure. Despite our efforts to maintain the highest level of security around our information systems, the sophistication of hackers continues to increase. Our inability to maintain effective controls or utilization of information technology providers that also maintain effective controls may increase our vulnerability to cyber-attacks. Breaches of our information management systems could adversely affect our business reputation. We could also be subject to lawsuits or fines relating to the unauthorized disclosure of information. Any of these outcomes could negatively affect our results of operations and the price of our common stock.
Any disruption in the availability of our information systems could adversely affect our operations.
We rely upon our information systems to manage and operate our business. Our security measures could fail to prevent a disruption in the availability of our information systems, our back-up systems could fail to operate properly, or we may experience denial of service attacks or corruption of our data. Any disruption in the availability of our information systems could adversely affect our results of operations by impairing our ability to efficiently effect transactions.
A significant portion of our assets consists of goodwill and other intangible assets.
As of December 31, 2015, 38% of our assets consisted of goodwill and other intangible assets. Under generally accepted accounting principles, the carrying value of goodwill is subject to periodic review and testing to determine if it is impaired. The value of our assets will depend on market conditions, regulatory environment, the availability of buyers and similar factors. While the value of these assets is based on management projections and assumptions and is determined by using the discounted cash flow method for purposes of our impairment testing, those values may differ from what could ultimately be realized by us in a sales transaction or otherwise and that difference, while not affecting cash flow, could have a material adverse impact on our operating results and financial position.
Industry Risks
The payday loan industry is highly regulated under federal, state and local laws. Changes in federal, state or laws and regulations governing lending practices, or changes in the interpretation of such laws and regulations, could negatively affect our business.
Our Consumer Finance segment activities are highly regulated under numerous federal, state and local laws, regulations and rules, which are subject to change. New laws, regulations or rules could be enacted or issued, interpretations of existing laws, regulations or rules may change and enforcement action by regulatory agencies may intensify.
Although states provide the primary regulatory framework under which we offer payday loans, certain federal laws also affect our business. For example, because payday loans are viewed as extensions of credit, we must comply with the federal Truth-in-Lending Act and Regulation Z under that Act. Additionally, we are subject to the Equal Credit Opportunity Act, the Gramm-Leach-Bliley Act and certain other federal laws.
From a federal standpoint, anti-payday loan legislation has occasionally been introduced in the U.S. Congress. Over the past several years, consumer advocacy groups and certain media reports have advocated governmental and regulatory action to prohibit or severely restrict sub-prime lending activities such as those we conduct. The federal Consumer Financial Protection Bureau has indicated that it will use its authority to further regulate the payday industry. Most payday lenders expect that the Bureau will eventually attempt to promulgate procedural or disclosure-based regulations affecting payday loans throughout the United States.
16
In the states, there are nearly always bills pending to alter the current laws governing payday lending. Any of these bills, or future proposed legislation or regulations prohibiting payday loans or making them less profitable, could be passed in any state at any time, or existing laws permitting payday lending could expire. From time to time legislation banning payday loans has been introduced in Nebraska but has not been passed into law. Since we derive a significant percentage of our payday revenues in Nebraska, the passage of any such legislation in Nebraska would have a highly material and negative effect on our business.
Statutes authorizing payday loans typically provide state agencies that regulate banks and financial institutions with significant regulatory powers to administer and enforce the laws relating to payday lending. Under statutory authority, state regulators have broad discretionary power and may impose new licensing requirements, interpret or enforce existing regulatory requirements in different ways or issue new administrative rules, even if not contained in state statutes, that affect the way we do business and may force us to terminate or modify our operations in those jurisdictions. They may also impose rules that are generally adverse to our industry. Finally, in many states, the attorney general has scrutinized or continues to scrutinize the payday loan statutes and the interpretations of those statutes.
In sum, the passage of federal or state laws and regulations that govern or otherwise affect lending, or changes in interpretations of them, could, at any point, result in our curtailment or cessation of operations in certain or all jurisdictions or locations essentially prohibiting us from conducting its lending business in its current form. Any such legal or regulatory change would certainly have a material and adverse effect on us, our operating results, financial condition and prospects, and perhaps even our viability. Furthermore, any failure to comply with any applicable federal, state or local laws or regulations could result in fines, litigation, closure of one or more store locations and negative publicity.
Adverse changes in laws or regulations relating to pawn lending services could negatively impact our financial results and/or limit our ability to expand into new markets.
Our products and services are subject to extensive regulation and supervision under various federal, state and local laws, ordinances and regulations. We face the risk that restrictions or limitations on pawn loan amounts, pawn loan yields and customer acceptance of pawn loan products resulting from the enactment, change or interpretation of laws and regulations could have a negative effect on our business activities. In particular, short-term consumer loans have come under increased scrutiny and increasingly restrictive regulation in recent years. Adoption of such federal, state or local regulation or legislation could restrict, or even eliminate, our ability to conduct our pawn lending operations at a profit level we consider reasonable at some or all of our stores, and could prevent us from expanding into new markets.
Litigation and regulatory actions directed toward our industry or our company could adversely affect our operating results, particularly in certain key states.
During the last few years, our industry has been subject to regulatory proceedings, class action lawsuits and other litigation regarding the offering of payday loans, and we could suffer losses resulting from interpretations of state laws in those lawsuits or regulatory proceedings, even if we are not a party to those proceedings. The losses we could suffer could be directly incurred through our involvement in litigation or regulatory proceedings, or could be indirectly incurred through negative publicity regarding the industry in general that is generated by litigation on regulatory proceedings involving third parties.
In addition, regulatory actions or enforcement efforts taken with respect to money services businesses could negatively affect our ability to operate our consumer finance segment in our current form. For example, federal bank regulators are imposing significant costs and regulatory pressure on banks that do business with money services businesses, even though our business is conducted in a manner compliant with applicable law. As a result, fewer and fewer banks are willing to accept or even retain customers in the money services business industry. We may be forced to change long-standing banking relationships and change the way we operate our consumer finance operations, incurring additional capital expenditures and paying higher banking fees.
Public perception of payday lending as being predatory or abusive could adversely affect our business.
In recent years, consumer advocacy groups and media reports have advocated governmental action to prohibit or severely restrict payday loans. The consumer groups and media reports typically focus on the cost to a consumer for this type of loan, which is higher than the interest typically charged by credit card issuers. The consumer groups and media reports typically characterize these transactions as predatory or abusive toward consumers. If this negative characterization of our business becomes widely accepted by consumers, demand for our payday loans could significantly decrease, which could adversely affect our results of operations primarily by decreasing our revenues. Negative perception of our business activities could also result in our industry being subject to more restrictive laws and regulations and greater exposure to litigation.
17
Competition in the consumer finance industry is intense and could cause us to lose market share and revenues.
We believe that the primary competitive factors in the payday loan industry are store location and customer service. We face intense competition in the payday and pawn lending industry, and we believe that those markets are becoming more competitive as these industries mature and begin to consolidate. The payday loan industry has low barriers to entry, and new competitors, such as Wal-Mart, may easily enter the market. The pawn lending industry has medium level barriers to entry, however, there are several large pawn lending companies with which we directly compete. We also currently compete with services, such as overdraft protection offered by traditional financial institutions, and with other payday loan and check cashing stores and other financial service entities and retail businesses that offer payday loans or other similar financial services, as well as a rapidly growing internet-based payday loan market. Some of our competitors have larger and more established customer bases and substantially greater financial, marketing and other resources than we have. As a result, we could lose market share and our revenues could decline, thereby affecting our earnings and potential for growth.
We face significant cellular retail competition that may reduce our market share and lower our profits.
We face significant competition in our Cellular Retail segment. We compete with the four national wireless service providers (AT&T, Sprint, T-Mobile and Verizon Wireless) as well as other smaller carriers such as US Cellular and Metro PCS and with many MVNOs such as Walmart’s Straight Talk and Family Mobile plans. We also compete with government-financed “lifeline assurance” programs that offer free or reduced-cost cellular services to individuals and families receiving many types of public assistance. Our ability to compete effectively will depend on, among other things, the pricing of cellular services and equipment, the quality of our customer service, the reach and quality of our sales and distribution channels and our capital resources. It will also depend on how successfully we anticipate and respond to various factors affecting our industry, including new technologies and business models, changes in consumer preferences, demographic trends and economic conditions.
The cellular retail industry also faces competition from other communications and technology companies seeking to capture customer revenue and brand dominance with respect to the provision of cellular accessories and services. For example, Apple Inc. is packaging software applications and content with its handsets, and Google Inc. has developed and deployed an operating system and related applications for mobile devices.
General economic conditions affect our loan losses, and accordingly, our results of operations could be adversely affected by a general economic slowdown or other negative economic conditions such as high unemployment.
Provision for loan losses, net of recoveries, is one of our largest operating expenses, constituting approximately 18% of our loan revenues for the year ended December 31, 2015, with payday loan losses comprising most of the losses. Any changes in economic factors that adversely affect our customers, such as an economic downturn or high unemployment, could result in higher loan loss experiences than anticipated, which could in turn adversely affect our loan charge-offs and operating results.
A sustained deterioration in the economy could reduce demand for our products and services and result in reduced earnings.
A sudden or sustained deterioration in the economy could result in decreased demand for our seed, live plant, holiday gifts and home restoration products. This could result in decreased revenue and, because a significant portion of our sales in the Direct to Consumer segment are of live goods, inventory losses on live product acquired prior to a seasonal selling period could be significant.
In addition, it could cause worsening performance of our pawn loans and in consumer demand for and resale value of pre-owned merchandise that we sell in our stores. This, in turn, could reduce the amount that we could effectively lend on an item of collateral. Such reductions could adversely affect pawn loan balances, pawn loan redemption rates, inventory balances, revenues and gross profit margins.
We may be exposed to litigation and federal employment actions involving our franchisees.
In August 2015, the National Labor Relations Board (NLRB) changed its long-standing joint-employer standard in a widely discussed decision, Browning Ferris Industries of California, Inc. In that decision, the NLRB asserted that two or more entities are joint employers of a single workforce if they share or co-determine, even indirectly, those matters governing the essential terms and conditions of employment. In terms of franchise business models, the NLRB has to date refused to dismiss various labor and wage-violation complaints alleging that McDonalds is a joint employer together with its franchisees. In the past, courts determining whether a franchisor and franchisee are joint employers of a single workforce have generally examined whether the franchisor exercises direct (as opposed to indirect) and significant control over the franchisees' employment-related decisions—i.e., the hiring, firing or discipline of franchisee employees, payment of their wages, or setting of their work schedules. It is presently uncertain what the ultimate outcome will be of attempts by plaintiffs and regulatory authorities to impose employment-related liabilities upon franchisors under the theory that they are joint employers of their franchisees’ employees. Nevertheless, the extension of the Browning Ferris principles to franchise business models, and their application to our AlphaGraphics business, could have material and adverse consequences to the operating results, financial condition and prospects of that business and our Company.
18
Company Risks
The concentration of our Consumer Finance revenues in certain states could adversely affect us.
We currently provide payday lending services in nine states. For the year ended December 31, 2015, revenues from our locations in Nebraska represented approximately 33% of our total payday revenues. For the foreseeable future, we expect that a material portion of our revenues will continue to be generated in Nebraska. For the year ended December 31, 2015, revenues from our Nebraska, North Dakota, Wyoming and Iowa stores represented approximately 33%, 19%, 14% and 14% of our total Consumer Finance revenues, respectively. As a result, changes to prevailing economic, demographic, competitive, regulatory or any other conditions, including the legislative, regulatory or litigation risks mentioned above, in the markets in which we operate, and in Nebraska in particular, could lead to a reduction in demand for our services and result in a decline in our revenues or an increase in our provision for doubtful accounts, or even an outright legal prohibition on the conduct of our business. Any of these outcomes could in turn result in a material and swift deterioration of our financial condition principally by impairing our revenues and affecting our ability to obtain financing and operating liquidity, our operating results and our business prospects (again, principally by reducing our revenues and impairing our ability to grow our business).
If estimates of our loan losses are not adequate to absorb actual losses, our financial condition and results of operations may be adversely affected.
We maintain an allowance for loan losses at levels to cover the estimated incurred losses in the collection of our payday and installment loan portfolios outstanding at the end of each applicable period. At the end of each period, management considers recent collection history to develop expected loss rates, which are used to establish the allowance for loan losses. Our allowance for loan losses was $1.18 million on December 31, 2015. Our allowance for loan losses is an estimate, and if actual loan losses are materially greater than our allowance for losses, our financial condition and results of operations could be adversely affected.
We face substantial risk through reliance on a single wireless retail carrier.
We operate our Cellular Retail segment exclusively as an authorized dealer for Cricket, which means that this segment of our operations is entirely dependent upon continued operations as a Cricket dealer under our dealer agreement with Cricket Wireless, and the health of our relationship with Cricket Wireless. If Cricket Wireless were to change certain aspects of its dealer arrangements, including items such as pricing, product supply, credit terms and dealer compensation structure (all of which are primarily determined by Cricket Wireless) in a manner that is adverse to us, our margins and results of operations would likely suffer. In addition, if Cricket Wireless were to begin growing its relationship with other operators, or were to embark upon an effort to significantly grow corporate-owned locations, our prospects for growth in this segment would suffer.
Outside factors may affect our ability to obtain product and fulfill orders in our direct to consumer segment.
In our Direct to Consumer segment we have an agreement with a third party wholesale grower that is in effect until 2019 and contains options to renew the agreement for consecutive two-year terms and the agreement calls for a 24 month notice prior to termination. The grower also performs research for us and maintains our research crop. . Disruptions, whether caused by the third party wholesaler, weather or other environmental or climate influences could limit the supply of product we rely upon to fulfill orders.
Our Van Dyke’s portion of our Direct to Consumer segment has an agreement with a single third-party fulfillment provider. The contract with the fulfillment provider expired in early 2016 and an extension agreement is currently being negotiated while we operate under a month-to-month agreement. The fulfillment provider receives and stores inventory, performs periodic cycle counts, picks, packs and ships customer orders. Additional services such as, order taking, processing of customer payments, personalization, customer services, and order processing are also performed by the fulfillment provider.
19
Because we maintain a significant supply of cash in our locations, we may experience losses due to employee error and theft.
Because our business requires us to maintain a significant supply of cash in our stores, we are subject to the risk of cash shortages resulting from employee error and theft. We periodically experience employee error and theft in stores, which can significantly increase the operating losses of those stores for the period in which the employee error or theft is discovered. We self-insure for employee error and theft at the store level. If our controls to limit our exposure to employee error and theft at the store level and at our corporate headquarters do not operate effectively or are structured ineffectively, our operating margins could be adversely affected by costs associated with increased security and preventative measures.
Regular turnover among our location managers and employees makes it more difficult for us to operate our locations and increases our costs of operation.
We experience a relatively stable workforce among our location managers and employees. Turnover interferes with implementation of operating strategies. Increases in our workforce turnover in the future would likely increase our operating pressures and operating costs and could restrict our ability to grow. Additionally, high turnover would create challenges for us in maintaining high levels of employee awareness of and compliance with our internal procedures and external regulatory compliance requirements. In sum, high turnover would increase our training and supervisory costs, and result in decreased earnings with corresponding greater risks of regulatory non-compliance.
We may not succeed in promoting and strengthening our franchise brand, which could prevent us from retaining existing and securing new franchise owners and increasing revenues.
A primary component of our business strategy is to promote and strengthen our franchise brand. If we are unable to promote our brand or provide franchise owners with a high-quality experience, tools and resources they require, we may fail to attract new franchisees, maintain existing franchise relationships, or sustain or increase our revenues.
Our growth and success also depends upon the ability of our franchisees to operate their franchise successfully to our standards and promote our brand. Although we have established criteria to evaluate prospective franchisees, and our franchise agreements include certain operating standards, each franchisee operates his/her franchise location independently. Various laws limit our ability to influence the day-to-day operation of our franchise locations. We cannot assure you that our franchisees will be able to successfully operate their location in a manner consistent with our concepts and standards, which could reduce their sales and correspondingly, our franchise royalties, and could adversely affect our operating income and our ability to leverage our brand.
ITEM 1B UNRESOLVED STAFF COMMENTS
None.
Our headquarters is in Omaha, Nebraska. We lease a 12,420-square-foot space, with additional space available, which is sufficient for our projected near-term future growth. Our monthly lease amount is currently $10,879 and the lease expires on January 31, 2020. The corporate phone number is (402) 551-8888.
Our Direct to Consumer segment, acquired on July 1, 2015, owns 100-acre property with a 382,790 sq. ft. facility in Greenwood, South Carolina. This facility is utilized as JPPA’s distribution and warehouse facility and the corporate offices of JPPA and RAI. The real estate is encumbered with an outstanding mortgage in the amount of $3.37 million as of December 31, 2015.
20
We are involved in a variety of legal claims and proceedings incidental to our business, including customer bankruptcy and employment-related matters from time to time, and other legal matters that arise in the normal course of business. We believe these claims and proceedings are not out of the ordinary course for a business of the type and size in which we are engaged. While we are unable to predict the ultimate outcome of these claims and proceedings, management believes there is not a reasonable possibility that the costs and liabilities of such matters, individually or in the aggregate, will have a material adverse effect on our consolidated financial condition or consolidated results of operations.
ITEM 4 MINE SAFETY DISCLOSURES
Not applicable.
21
ITEM 5 MARKET FOR REGISTRANT’S COMMON EQUITY, RELATED SHAREHOLDER MATTERS
MARKET INFORMATION
Our common stock is listed for trading under the symbol “WCRS” on the “OTCQB,” which is the OTC Markets’ middle-tier over-the-counter quotation platform. The transfer agent and registrar for our common stock is Corporate Stock Transfer, Inc., 3200 Cherry Creek Drive South, Suite 430, Denver, Colorado 80209. The following table sets forth the high and low bid prices for our common stock as reported by the OTC Bulletin Board in 2015 and 2014. These quotations reflect inter-dealer prices, without retail mark-up, markdown, or commission, and may not represent actual transactions. Trading in the Company’s common stock during the period represented was sporadic, exemplified by low trading volume and many days during which no trades occurred.
On May 30, 2014, our Board of Directors approved a 1-for-20 reverse stock split that was affected on June 20, 2014. The reverse stock split reduced the number of issued and outstanding shares of common stock to approximately 3,010,765 shares, after the cancellation of resulting partial shares. The reverse stock split similarly reduced by a factor of 20 the authorized number of shares of capital stock that the Company may issue to 12,500,000.
| Market Price (high/low) | ||||||||
| For the Fiscal Year | 2015 | 2014 | ||||||
| First Quarter | $ 5.00 – 3.00 | $ 3.60 – 1.40 | ||||||
| Second Quarter | $ 5.00 – 3.51 | $ 4.40 – 3.00 | ||||||
| Third Quarter | $ 5.00 – 3.10 | $ 4.50 – 1.75 | ||||||
| Fourth Quarter | $ 3.50 – 2.60 | $ 4.20 – 3.00 | ||||||
HOLDERS
As of the date of this report, we had 9,497,534 shares of common stock outstanding held by approximately 290 holders of record.
DIVIDENDS
Holders of our common stock are entitled to share pro rata in dividends and distributions with respect to the common stock when, as and if declared by our Board of Directors out of funds legally available therefor. We have not paid any dividends on our common stock.
SECURITIES AUTHORIZED FOR ISSUANCE UNDER EQUITY COMPENSATION PLANS
The table below sets forth certain information, as of the close of business on December 31, 2015, regarding equity compensation plans (including individual compensation arrangements) under which our securities were then authorized for issuance.
| Number of Securities to be Issued Upon Exercise of Outstanding Options, Warrants and Rights | Weighted-Average Exercise Price of Outstanding Options, Warrants and Rights | Number of Securities in column a) | ||||||||||
| (a) | (b) | (c) | ||||||||||
| Equity compensation plans approved by securityholders | None | n/a | None | |||||||||
| Equity compensation plans not approved by securityholders | 65,000 | 6.00 | 35,000 | (1) | ||||||||
| (1) | In February 2008, our Board of Directors adopted the 2008 Stock Incentive Plan which permits the issuance of various incentives, including options or similar rights to purchase or acquire up to 100,000 shares of common stock. No incentives were ever issued under such plan. In February 2015, the 2008 Stock Incentive Plan was terminated and replaced with our 2015 Stock Incentive Plan. The 2015 Stock Incentive Plan was approved by our shareholders on January 20, 2016. Refer to Note 11 of Notes to Consolidated Financial Statements included in this report for additional information. We are not required by applicable state law or the listing standards of any self-regulatory organization or quotation service (e.g., the OTC Markets, NASD, AMEX or NYSE) to obtain the approval of our security holders prior to issuing any compensatory options, warrants or other rights to purchase our securities. |
22
DESCRIPTION OF EQUITY SECURITIES
Our authorized capital stock consists of 12.5 million shares of capital stock, no par value per share (unless otherwise
determined by the Board of Directors). All shares of common stock have equal voting rights and are entitled to one vote per share on all matters to be voted upon by our shareholders. Shares of our common stock have no preemptive, subscription, conversion or redemption rights and may be issued only as fully paid and non-assessable shares. Cumulative voting in the election of directors is not permitted. In the event of our liquidation, each holder of our common stock is entitled to receive a proportionate share of our assets available for distribution to stockholders after the payment of liabilities. All shares of our common stock issued and outstanding are fully paid and non-assessable.
ITEM 6 SELECTED FINANCIAL DATA
Not applicable.
ITEM 7 MANAGEMENT’S DISCUSSION AND ANALYSIS OF FINANCIAL CONDITION AND RESULTS OF OPERATIONS
The following discussion should be read in conjunction with the consolidated financial statements and related notes that appear elsewhere in this report. This discussion contains forward-looking statements that involve significant uncertainties. Our actual results could differ materially from those anticipated in these forward-looking statements as a result of various factors, including those discussed in “Risk Factors” elsewhere in this report. For further information, see “Forward-Looking Statements” below.
OVERVIEW
On July 1, 2015, we acquired the businesses of our Direct to Consumer segment by completing a merger and contribution transaction. In consideration for the acquisition of these businesses, we issued to the former owners of those businesses an aggregate of 3.5 million shares of our common stock representing approximately 37% of our total issued and outstanding common stock after consummation of the acquisition.
In 2015, we experienced significant growth in our Cellular Retail segment. We acquired 54 new Cellular Retail store locations and launched an additional three. After strategic consolidation of storefronts and closing of underperforming locations we ended the year operating 99 Cricket retail locations. In April 2014, AT&T acquired Leap Wireless, parent company to Cricket, the exclusive brand we sell in our Cellular Retail stores. AT&T is significantly larger than Leap Wireless and we believe that it brings with it, among many other positives, a better network, stronger financial backing and new commitments, strategies and offerings. While our margins have decreased as a result of new dealer compensation plans, increased volume is expected to offset the margin decline. We have experienced increases in sales volumes, which we attribute to AT&T’s acquisition and their superior nationwide network now serving Cricket consumers and to our increase in the number of stores operated.
On October 1, 2014, we acquired AlphaGraphics through a merger transaction in which we issued 2,986,823 shares, representing 49.8% of our post-acquisition outstanding shares.
These are very significant acquisitions for us in many ways. By adding an industry-leading franchisor and well known direct to consumer brands to our holdings, we have added business segments that provide further income diversification and an opportunity for continued growth. In addition, we expect these acquisitions to provide a source of cash flow that we can utilize for future growth.
Our Consumer Finance segment experienced a small decline in segment net income in 2015 primarily due to an increase in net bad debt and incurring increasing compliance costs. This segment has been relatively flat the past few years and we do not anticipate meaningful growth in the near term but do anticipate marginal increases in operating income. During 2015, the segment again provided a steady source of cash flows. Nevertheless, we are aware of increasing regulatory, compliance and operating costs in this segment. This industry is continually under regulatory pressure and we expect the same in 2016. One threat difficult for us to presently quantify comes from the federal Consumer Financial Protection Bureau, which has indicated that it will propose new rules for the payday-lending industry in the near future.
23
RESULTS OF OPERATIONS:
YEAR ENDED DECEMBER 31, 2015 COMPARED TO YEAR ENDED DECEMBER 31, 2014
Net income attributable to our common shareholders was $3.52 million, or $0.45 per share, in 2015 compared to $2.41 million, or $0.64 per share, in 2014. The Direct to Consumer segment, acquired on July 1, 2015, contributed $0.24 million of the increase, the Franchise segment contributed $1.57 million of the increase and the Cellular Retail segment increased $0.53 million from 2014 while the Consumer Finance segment declined $0.19 million from 2014 and our Corporate segment had net operating costs of $1.04 million. We expect the mix of segmented contributions to net income to change again in 2016 with recognition of full year operating results from our Direct to Consumer segment, increased contributions to operating results in our Cellular Retail division from locations acquired in 2015 as well as potential benefits from future acquisitions.
Revenues increased to $76.45 million in 2015 from $40.76 million in 2014, an increase of $35.69 million. Revenues of $32.85 million in our Cellular Retail segment increased $8.14 million compared to $24.71 million during 2014. Franchise segment revenues increased to $13.03 million in 2015 for the full year compared to $3.18 million for the three months post acquisition in 2014. Consumer Finance revenues totaled $12.70 million in 2015 compared to $12.88 million in 2014. Direct to Consumer revenues from July 1, 2015 (date of acquisition) through December 31, 2015 were $17.88 million.
24
The following table provides year-over-year revenues and net income attributable to WCR common shareholders by operating segment (in thousands):
| Franchise | Cellular Retail | Direct
to Consumer | Consumer Finance | Corporate | Total | |||||||||||||||||||
| Year Ended December 31, 2015 | ||||||||||||||||||||||||
| Revenue | $ | 13,025 | $ | 32,846 | $ | 17,884 | $ | 12,699 | $ | - | $ | 76,454 | ||||||||||||
| % of total revenue | 17.0 | % | 43.0 | % | 23.4 | % | 16.6 | % | -% | 100.0 | % | |||||||||||||
| Net income (loss) | $ | 2,270 | $ | 1,110 | $ | 243 | $ | 952 | $ | (1,038 | ) | $ | 3,537 | |||||||||||
| Net income attributable to noncontrolling interests | $ | 17 | $ | - | $ | - | $ | - | $ | - | $ | 17 | ||||||||||||
| Net income (loss) attributable to WCR common shareholders | $ | 2,253 | $ | 1,110 | $ | 243 | $ | 952 | $ | (1,038 | ) | $ | 3,520 | |||||||||||
| Earnings (loss) per share attributable to WCR common shareholders – basic and diluted | $ | 0.290 | $ | 0.140 | $ | 0.030 | $ | 0.120 | $ | (0.130 | ) | $ | 0.450 | |||||||||||
| Year Ended December 31, 2014 | ||||||||||||||||||||||||
| Revenue | $ | 3,177 | $ | 24,706 | $ | - | $ | 12,877 | $ | - | $ | 40,760 | ||||||||||||
| % of total revenue | 7.8 | % | 60.6 | % | - | % | 31.6 | % | -% | 100.0 | % | |||||||||||||
| Net income | $ | 690 | $ | 584 | $ | - | $ | 1,137 | $ | - | $ | 2,411 | ||||||||||||
| Net income attributable to noncontrolling interests | $ | 5 | $ | - | $ | - | $ | - | $ | - | $ | 5 | ||||||||||||
| Net income attributable to WCR common shareholders | $ | 685 | $ | 584 | $ | - | $ | 1,137 | $ | - | $ | 2,406 | ||||||||||||
| Earnings per share attributable to WCR common shareholders – basic and diluted | $ | 0.180 | $ | 0.160 | $ | - | $ | 0.300 | $ | - | $ | 0.640 | ||||||||||||
Pro forma financial information as though our acquisitions of JPPA, RAI, JPRE and AGI had occurred on January 1, 2014 follows. Refer to Note 13 of the Notes to Consolidated Financial Statements in Item 8 of this Annual Report on Form 10-K for additional reportable segment information and additional acquisition and pro forma information.
| Franchise | Cellular Retail | Direct
to Consumer | Consumer Finance | Corporate | Total | |||||||||||||||||||
| Year Ended December 31, 2015 | ||||||||||||||||||||||||
| Pro forma revenue | $ | 13,025 | $ | 37,823 | $ | 42,738 | $ | 12,699 | $ | - | $ | 106,285 | ||||||||||||
| % of total pro forma revenue | 12.3 | % | 35.6 | % | 40.2 | % | 11.9 | % | -% | 100.0 | % | |||||||||||||
| Pro forma net income (loss) | $ | 2,270 | $ | 1,167 | $ | 2,177 | $ | 952 | $ | (736 | ) | $ | 5,830 | |||||||||||
| Pro forma net income (loss) attributable to noncontrolling interests | $ | 17 | $ | - | $ | - | $ | - | $ | - | $ | 17 | ||||||||||||
| Pro forma net income (loss) attributable to WCR common shareholders | $ | 2,253 | $ | 1,167 | $ | 2,177 | $ | 952 | $ | (736 | ) | $ | 5,813 | |||||||||||
| Pro forma earnings (loss) per share attributable to WCR common shareholders – basic and diluted | $ | 0.237 | $ | 0.123 | $ | 0.229 | $ | 0.100 | $ | (0.077 | ) | $ | 0.612 | |||||||||||
| Year Ended December 31, 2014 | ||||||||||||||||||||||||
| Pro forma revenue | $ | 12,215 | $ | 36,033 | $ | 43,622 | $ | 12,877 | $ | - | $ | 104,747 | ||||||||||||
| % of total pro forma revenue | 11.7 | % | 34.4 | % | 41.6 | % | 12.3 | % | -% | 100.0 | % | |||||||||||||
| Pro forma net income | $ | 1,554 | $ | 930 | $ | 1,427 | $ | 1,274 | $ | - | $ | 5,185 | ||||||||||||
| Pro forma net income attributable to noncontrolling interests | $ | 13 | $ | - | $ | - | $ | - | $ | - | $ | 13 | ||||||||||||
| Pro forma net income attributable to WCR common shareholders | $ | 1,541 | $ | 930 | $ | 1,427 | $ | 1,274 | $ | - | $ | 5,172 | ||||||||||||
| Pro forma earnings per share attributable to WCR common shareholders – basic and diluted | $ | 0.162 | $ | 0.098 | $ | 0.150 | $ | 0.134 | $ | - | $ | 0.544 | ||||||||||||
25
Franchise
The following table summarizes our actual Franchise segment operating results:
Year Ended December 31, (in thousands) | 2015 % of | 2014 % of | ||||||||||||||
| 2015 | 2014 | Revenues | Revenues | |||||||||||||
| Revenues: | ||||||||||||||||
| Royalty and franchise development | $ | 10,771 | $ | 2,814 | 82.7 | % | 88.6 | % | ||||||||
| Other revenue | 2,254 | 363 | 17.3 | % | 11.4 | % | ||||||||||
| 13,025 | 3,177 | 100.0 | % | 100.0 | % | |||||||||||
| Cost of revenues | 1,197 | 169 | 9.2 | % | 5.3 | % | ||||||||||
| Gross profit | 11,828 | 3,008 | 90.8 | % | 94.7 | % | ||||||||||
| Salaries, wages and benefits expense | 4,485 | 1,063 | 34.4 | % | 33.5 | % | ||||||||||
| Occupancy | 224 | 52 | 1.7 | % | 1.6 | % | ||||||||||
| Depreciation and amortization expense | 441 | 112 | 3.4 | % | 3.5 | % | ||||||||||
| Interest expense | 202 | 63 | 1.6 | % | 2.0 | % | ||||||||||
| Other (income) expense | 2,833 | 587 | 21.8 | % | 18.5 | % | ||||||||||
| Provision for income taxes | 1,373 | 441 | 10.5 | % | 13.9 | % | ||||||||||
| 9,558 | 2,318 | 73.4 | % | 73.0 | % | |||||||||||
| Net income | $ | 2,270 | $ | 690 | 17.4 | % | 21.7 | % | ||||||||
The Franchise segment contributed $2.27 million of net income (representing a full year of operating results) for the year ended December 31, 2015 and $0.69 million of net income for the period beginning October 1, 2014 (date of acquisition) through December 31, 2014. AGI added a net of 12 new franchised business centers in 2015 bringing the number of franchisees of U.S. Centers to 254 as of December 31, 2015. Total gross U.S. network-wide Center sales increased from $255 million in 2014 to $268 million in 2015 while gross international Center sales decreased to $31 million in 2015, down from $41 million in 2014. Our focus has been on growing and strengthening our domestic franchise network as evidenced in the year over year changes in gross Center sales.
Cellular Retail
The following table summarizes our Cellular Retail segment operating results:
Year Ended December 31, (in thousands) | 2015 % of | 2014 % of | ||||||||||||||
| 2015 | 2014 | Revenues | Revenues | |||||||||||||
| Revenues: | ||||||||||||||||
| Retail sales, fees and commissions | $ | 27,178 | $ | 21,395 | 82.7 | % | 86.6 | % | ||||||||
| Other revenue | 5,668 | 3,311 | 17.3 | % | 13.4 | % | ||||||||||
| 32,846 | 24,706 | 100.0 | % | 100.0 | % | |||||||||||
| Cost of revenues | 15,415 | 12,079 | 46.9 | % | 48.9 | % | ||||||||||
| Gross profit | 17,431 | 12,627 | 53.1 | % | 51.1 | % | ||||||||||
| Salaries, wages and benefits expense | 8,779 | 6,368 | 26.7 | % | 25.8 | % | ||||||||||
| Occupancy expense | 4,077 | 2,833 | 12.4 | % | 11.5 | % | ||||||||||
| Depreciation and amortization expense | 430 | 327 | 1.3 | % | 1.3 | % | ||||||||||
| Interest expense | 284 | 191 | 0.9 | % | 0.8 | % | ||||||||||
| Other (income) expense | 2,119 | 1,939 | 6.5 | % | 7.7 | % | ||||||||||
| Provision for income taxes | 632 | 385 | 1.9 | % | 1.6 | % | ||||||||||
| 16,321 | 12,043 | 49.7 | % | 48.7 | % | |||||||||||
| Net income | $ | 1,110 | $ | 584 | 3.4 | % | 2.4 | % | ||||||||
In 2015, we added a net of 38 Cricket retail store locations compared to a net of four added during 2014, bringing the total stores operated at December 31, 2015 to 99 compared to 61 at December 31, 2014.
26
Year-over-year revenues in the Cellular Retail segment increased $8.14 million, or 32.9%, to $32.85 million. This increase is due to a combination of factors, such as AT&T’s acquisition of Leap Wireless and customer migrations to the new Cricket network, Cricket’s increased advertising, and our decision to acquire additional store locations and relocate under-performing locations to better serve our customer base. We operate in a highly competitive marketplace and our future growth and success is largely dependent on our relationship with Cricket and the dealer compensation package we have with them. We expect to continue our strategic acquisitions of other dealers and to open additional Cricket stores in new and existing markets.
Our two most significant operating expense categories for this segment are salaries, wages and benefits and occupancy expenses. Salaries, wages and benefits expense increased 37.9% from 2014, primarily as a result of adding the new stores with partial offset by the reduction in costs associated with the smaller closed stores. Stated as a percentage of Cellular Retail revenues, salaries, wages and benefits expense was 26.7% and 25.8% for year 2015 and 2014, respectively. Occupancy expenses, which include base rents, additional rents (common area maintenance, insurance and real estate taxes assessed operating per lease agreements), telephone, utility and repair and maintenance expenses, were $4.08 million and $2.83 million for the year 2015 and 2014, respectively. This equates to 12.4% and 11.5% of Cellular Retail revenues for the year 2015 and 2014, respectively.
Segment contribution to net income was $1.11 million and $0.58 million for the year 2015 and 2014, respectively.
Direct to Consumer
The following table summarizes our actual Direct to Consumer segment operating results:
Year Ended December 31, (in thousands) | 2015 % of | 2014 % of | ||||||||||||||
| 2015 | 2014 | Revenues | Revenues | |||||||||||||
| Revenues: | ||||||||||||||||
| Sales | $ | 17,721 | $ | - | 99.1 | % | - | % | ||||||||
| Other revenue | 163 | - | 0.9 | % | - | % | ||||||||||
| 17,884 | - | 100.0 | % | - | % | |||||||||||
| Cost of revenues | 8,960 | - | 50.1 | % | - | % | ||||||||||
| Gross profit | 8,924 | - | 49.9 | % | - | % | ||||||||||
| Salaries, wages and benefits expense | 2,802 | - | 15.7 | % | - | % | ||||||||||
| Occupancy expense | 584 | - | 3.3 | % | - | % | ||||||||||
| Depreciation and amortization expense | 214 | - | 1.2 | % | - | % | ||||||||||
| Interest expense | 90 | - | 0.4 | % | - | % | ||||||||||
| Other (income) expense | 4,784 | - | 26.7 | % | - | % | ||||||||||
| Provision for income taxes | 207 | - | 1.2 | % | - | % | ||||||||||
| 8,681 | - | 48.5 | % | - | % | |||||||||||
| Net income | $ | 243 | $ | - | 1.4 | % | - | % | ||||||||
The Direct to Consumer segment contributed $0.24 million of net income for the period beginning July 1, 2015 (date of acquisition) through December 31, 2015. Pro forma revenues for the year ended December 31, 2015 were $42.74 million and pro forma net income was $2.18 million compared to year ended December 31, 2014 pro forma revenues and pro forma net income of $43.62 million and $1.43 million, respectively.
Pro forma net income contributions from the home restoration category increased year over year by approximately $0.48 million. A number of strategic changes have produced this result, including a reduction in the number for SKUs offered and change in merchandise mix resulting in higher margins and an increase in the ratio of drop ship to fulfillment center sales, thus reducing costs, and enhancing our web-platform content which we believe has contributed to a 31% overall improvement in organic visits for the year.
27
Consumer Finance
The following table summarizes our Consumer Finance segment operating results:
Year Ended December 31, (in thousands) | 2015 % of | 2014 % of | ||||||||||||||
| 2015 | 2014 | Revenues | Revenues | |||||||||||||
| Revenues: | ||||||||||||||||
| Retail sales | $ | 1,344 | $ | 1,140 | 10.6 | % | 8.8 | % | ||||||||
| Financing fees and interest | 10,773 | 11,124 | 84.8 | % | 86.4 | % | ||||||||||
| Other revenue | 582 | 613 | 4.6 | % | 4.8 | % | ||||||||||
| 12,699 | 12,877 | 100.0 | % | 100.0 | % | |||||||||||
| Cost of revenues | 2,739 | 2,453 | 21.6 | % | 19.0 | % | ||||||||||
| Gross profit | 9,960 | 10,424 | 78.4 | % | 81.0 | % | ||||||||||
| Salaries, wages and benefits expense | 4,197 | 4,163 | 33.0 | % | 32.3 | % | ||||||||||
| Occupancy expense | 1,636 | 1,726 | 12.9 | % | 13.4 | % | ||||||||||
| Depreciation and amortization expense | 113 | 118 | 0.9 | % | .09 | % | ||||||||||
| Interest expense | - | 62 | - | % | 0.5 | % | ||||||||||
| Other (income) expense | 2,488 | 2,498 | 19.6 | % | 19.5 | % | ||||||||||
| Provision for income taxes | 574 | 720 | 4.5 | % | 5.6 | % | ||||||||||
| 9,008 | 9,287 | 70.9 | % | 72.2 | % | |||||||||||
| Net income | $ | 952 | $ | 1,137 | 7.5 | % | 8.8 | % | ||||||||
Our Consumer Finance segment revenues decreased 1.38% year over year. Financing fees and interest declined 3.2% while pawn retail sales increased $.20 million or 17.9%. The pawn sales growth is primarily due to growth in our pawn stores opened during 2012 through 2014. The reduction in financing fees and interest income in 2015 was primarily due to the October 1, 2015 sale of our four loan centers in Utah.
Cost of revenues included a provision for loan losses and cost of pawn merchandise sales. The provision for loan losses was $1.90 million in 2015 compared to $1.82 million in 2014. As a percentage of financing fees and interest revenue the provision for loan losses increased from 16.3% in 2014 to 17.7% in 2015.
Net income contribution from the Consumer Finance segment decreased to $.95 million in 2015 from $1.14 million in 2014. Segment net income included an after-tax loss related to our exit from Utah of approximately $0.27 million.
Income Tax Expense
Income tax expense on continuing operations increased to $2.48 million in 2015 compared to $1.55 million in 2014 for an effective rate of 41.2% and 39.1%, respectively. The 2015 effective rate increased due to certain nondeductible transaction costs incurred in 2015.
LIQUIDITY AND CAPITAL RESOURCES
Summary cash flow data is as follows:
| Year Ended December 31, | ||||||||
| 2015 | 2014 | |||||||
| Cash flows provided (used) by : | ||||||||
| Operating activities | $ | 5,416,134 | $ | 4,415,293 | ||||
| Investing activities | (994,195 | ) | (485,707 | ) | ||||
| Financing activities | (847,620 | ) | (1,640,071 | ) | ||||
| Net increase in cash | 3,574,319 | 2,289,515 | ||||||
| Cash, beginning of period | 4,273,350 | 1,983,835 | ||||||
| Cash, end of year | $ | 7,847,669 | $ | 4,273,350 | ||||
28
At December 31, 2015, we had cash of $7.85 million compared to cash of $4.27 million on December 31, 2014. For 2016, we believe that our available cash, combined with expected cash flows from operations and credit available under our credit facilities, will be sufficient to fund our liquidity and capital expenditure requirements through March of 2017. Our expected short-term uses of available cash include the funding of operating activities (including cyclical increases in payday loans), the financing of expansion activities, including new store openings or store acquisitions (refer to Notes 15 and 19 of the Notes to Consolidated Financial Statements in Item 8 of this Annual Report on Form 10-K for additional information regarding the January 2016 acquisition of Cricket retail stores for approximately $456,000), and the reduction of term debt.
At December 31, 2015 our outstanding debt was $8.00 million compared to $5.13 million at December 31, 2014. The increase consists of $3.37 million real estate debt within our new Direct to Consumer segment less $0.50 million in net reductions in other segments. Available credit at December 31, 2015 under credit facilities in place on that date was $7.25 million.
CRITICAL ACCOUNTING POLICIES
Our consolidated financial statements and accompanying notes have been prepared in accordance with accounting principles generally accepted in the United States of America applied on a consistent basis. The preparation of these consolidated financial statements requires us to make a number of estimates and assumptions that affect the reported amounts of assets and liabilities, the disclosure of contingent assets and liabilities at the date of the consolidated financial statements and the reported amounts of revenues and expenses during the reporting periods. We evaluate these estimates and assumptions on an ongoing basis. We base these estimates on the information currently available to us and on various other assumptions that we believe are reasonable under the circumstances. Actual results could vary materially from these estimates under different assumptions or conditions.
Our significant accounting policies are discussed in Note 1, “Nature of Business and Summary of Significant Accounting Policies,” of the notes to our consolidated financial statements included in this report. We believe that the following critical accounting policies affect the more significant estimates and assumptions used in the preparation of our consolidated financial statements:
Receivables and Loss Allowance
Franchise
Accounts receivable are recorded for earned but uncollected royalties and other related franchise fees. Allowances are provided on an account-by-account basis for estimated uncollectible accounts as deemed necessary by management. We consider current economic trends and changes in payment terms when evaluating the adequacy of the allowance.
Direct to Consumer
Receivables are recorded when billed or accrued and represent claims against third parties that will be settled in cash. The carrying value of receivables, net of the allowance for doubtful accounts, represents their estimated net realizable value. The allowance for doubtful accounts is estimated based on historical collection trends, type of customer, the age of outstanding receivables and existing economic conditions. If events or changes in circumstances indicate that specific receivable balances may be impaired, further consideration is given to the collectability of those balances and the allowance is adjusted accordingly. Past due receivable balances are written-off when internal collection efforts have been unsuccessful in collecting the amount due.
29
Consumer Finance
Included in loans receivable are unpaid principal, interest and fee balances of payday, installment, pawn and title loans that have not reached their maturity date, and “late” payday loans that have reached maturity within the last 180 days and have remaining outstanding balances. Late payday loans generally are unpaid loans where a customer’s personal check has been deposited and the check has been returned due to non-sufficient funds in the customer’s account, a closed account, or other reasons. All returned items are charged-off after 180 days, as collections after that date have not been significant. Loans are carried at cost plus accrued interest or fees less payments made and a loans receivable allowance.
We do not specifically reserve for any individual payday, installment or title loan. Instead, we aggregate loan types for purposes of estimating the loss allowance using a methodology that analyzes historical portfolio statistics and management’s judgment regarding recent trends noted in the portfolio. This methodology takes into account several factors, including (1) the amount of loan principal, interest and fee outstanding, (2) historical charge offs from loans that originated during the last 24 months, (3) current and expected collection patterns and (4) current economic trends. We utilize a software program to assist with the tracking of its historical portfolio statistics. A loan loss allowance is maintained for anticipated losses for payday and installment loans based primarily on our historical percentages by loan type of net charge offs, applied against the applicable balance of loan principal, interest and fees outstanding. We also periodically perform a look-back analysis on our loan loss allowance to verify the historical allowance established tracks with the actual subsequent loan write-offs and recoveries. We are aware that as conditions change, we may also need to make additional allowances in future periods. Loan losses or charge-offs of pawn or title loans are not recorded because the value of the collateral exceeds the loan amount.
At December 31, 2015 and December 31, 2014 our outstanding loans receivable aging was as follows:
| December 31, 2015 | ||||||||||||||||
| Payday | Installment | Pawn & Title | Total | |||||||||||||
| Current | $ | 4,065,706 | $ | 291,947 | $ | 286,514 | $ | 4,644,167 | ||||||||
| 1-30 | 332,217 | 43,179 | - | 375,396 | ||||||||||||
| 31-60 | 263,486 | 24,233 | - | 287,719 | ||||||||||||
| 61-90 | 199,526 | 16,293 | - | 215,819 | ||||||||||||
| 91-120 | 196,123 | 9,417 | - | 205,540 | ||||||||||||
| 121-150 | 160,386 | 4,985 | - | 165,371 | ||||||||||||
| 151-180 | 165,237 | 2,189 | - | 167,426 | ||||||||||||
| 5,382,681 | 392,243 | 286,514 | 6,061,438 | |||||||||||||
| Less Allowance | (1,081,000 | ) | (96,000 | ) | - | (1,177,000 | ) | |||||||||
| $ | 4,301,681 | $ | 296,243 | $ | 286,514 | $ | 4,884,438 | |||||||||
December 31, 2014 | ||||||||||||||||
| Payday | Installment | Pawn & Title | Total | |||||||||||||
| Current | $ | 4,387,393 | $ | 321,634 | $ | 372,805 | $ | 5,081,832 | ||||||||
| 1-30 | 305,382 | 47,321 | - | 352,703 | ||||||||||||
| 31-60 | 223,465 | 24,791 | - | 248,256 | ||||||||||||
| 61-90 | 236,072 | 11,799 | - | 247,871 | ||||||||||||
| 91-120 | 206,705 | 5,438 | - | 212,143 | ||||||||||||
| 121-150 | 200,101 | 1,984 | - | 202,085 | ||||||||||||
| 151-180 | 204,804 | 572 | - | 205,376 | ||||||||||||
| 5,763,922 | 413,539 | 372,805 | 6,550,266 | |||||||||||||
| Less Allowance | (1,147,000 | ) | (72,000 | ) | - | (1,219,000 | ) | |||||||||
| $ | 4,616,922 | $ | 341,539 | $ | 372,805 | $ | 5,331,266 | |||||||||
As a result of our collection efforts, we historically write off approximately 42% of the returned payday items, the most significant element making up accounts and loans receivable. Based on days past the check return date, write-offs of returned items historically have tracked at the following approximate percentages: 1 to 30 days – 43%; 31 to 60 days – 65%; 61 to 90 days – 83%; 91 to 120 days – 89%; and 121 to 150 days – 91% and 151+ days – 93%. A rollforward of our loans receivable allowance for the years ended December 31, 2015 and 2014 is as follows:
30
| Year Ended December 31, | ||||||||
| 2015 | 2014 | |||||||
| Loans receivable allowance, beginning of period | $ | 1,219,000 | $ | 1,215,000 | ||||
| Provision for loan losses charged to expense | 1,904,893 | 1,817,822 | ||||||
| Charge-offs, net | (1,946,893 | ) | (1,813,822 | ) | ||||
| Accounts and loans receivable allowance, end of period | $ | 1,177,000 | $ | 1,219,000 | ||||
Valuation of Long-lived and Intangible Assets
We assess the possibility of impairment of long-lived and intangible assets whenever events or changes in circumstances indicate that the carrying value may not be recoverable. Factors that could trigger an impairment review include significant underperformance relative to expected historical or projected future cash flows, significant changes in the manner of use of acquired assets or the strategy for the overall business, and significant negative industry events or trends. In addition, we conduct an annual goodwill impairment test as of October 1 each year. We assess our goodwill for impairment at the reporting unit level by applying a fair value test. This fair value test involves a two-step process. The first step is to compare the carrying value of our net assets to our fair value. If the fair value is determined to be less than the carrying value, a second step is performed to measure the amount of the impairment, if any.
Due to the minimal amount of public float for our common stock, the market capitalization approach of valuing the reporting unit as a whole is not practical. The discounted future cash flows method is utilized in estimating value. When estimated future cash flows are less than the carrying value of the net assets and related goodwill, an impairment test is performed to measure and recognize the amount of the impairment loss, if any. No impairment charges were recorded in 2015 or 2014.
In determining the estimated future discounted cash flows, we consider current and projected future levels of income, as well as strategic plans, business trends, prospects, and market and economic conditions. Impairment tests involve the use of judgments and estimates related to the fair market value of the business operations with which goodwill is associated, taking into consideration both historical operating performance and anticipated financial position and future earnings. We believe that the estimates of future cash flows and fair value determined as of October 1, 2015 are reasonable. Changes in estimates of those cash flows and fair value, however, could affect the evaluation. Based upon this evaluation, we concluded that the unit fair values exceeded the carrying value of net assets and there was no impairment.
As of December 31, 2015, we evaluated whether any triggering events or changes in circumstances had occurred subsequent to our annual impairment test. As part of this evaluation, we considered additional qualitative factors, including whether there had been any significant adverse changes in legal factors or in our business climate, adverse action or assessment by a regulator, unanticipated competition, loss of key personnel or likely sale or disposal of all or a significant portion of our reporting unit. This analysis resulted in a determination that no triggering events or changes in circumstances had occurred.
OFF BALANCE SHEET ARRANGEMENTS
We have no off balance sheet arrangements.
FORWARD-LOOKING STATEMENTS
Some of the statements made in this report are “forward-looking statements,” as that term is defined under Section 27A of the Securities Act and Section 21E of the Securities Exchange Act of 1934. These forward-looking statements are based upon our current expectations and projections about future events. Whenever used in this report, the words “believe,” “anticipate,” “intend,” “estimate,” “expect” and similar expressions, or the negative of such words and expressions, are intended to identify forward-looking statements, although not all forward-looking statements contain such words or expressions. The forward-looking statements in this report are primarily located in the material set forth under the headings “Description of Business,” “Risk Factors,” “Management’s Discussion and Analysis of Financial Condition and Results of Operations,” but are found in other parts of this report as well. These forward-looking statements generally relate to our plans, objectives and expectations for future operations and are based upon management’s current estimates and projections of future results or trends. Although we believe that our plans and objectives reflected in or suggested by these forward-looking statements are reasonable, we may not achieve these plans or objectives. You should read this report completely and with the understanding that actual future results may be materially different from what we expect. We will not update forward-looking statements even though our situation may change in the future.
31
Specific factors that might cause actual results to differ from our expectations or may affect the value of the common stock, include, but are not limited to:
| · | Changes in local, state or federal laws and regulations governing lending practices, or changes in the interpretation of such laws and regulations |
| · | Litigation and regulatory actions directed toward our industry or us, particularly in certain key states |
| · | Our need for additional financing |
| · | Change in our authorization to be a dealer for Cricket Wireless |
| · | Change in authorized Cricket dealer compensation |
| · | Unpredictability or uncertainty in financing markets which could impair our ability to grow our business through acquisitions. |
Other factors that could cause actual results to differ from those implied by the forward-looking statements in this report are more fully described in the “Risk Factors” section and of this report.
Industry data and other statistical information used in this report are based on independent publications, government publications, reports by market research firms or other published independent sources. Some data are also based on our good faith estimates, derived from our review of internal surveys and the independent sources listed above. Although we believe these sources are reliable, we have not independently verified the information.
ITEM 7A QUANTITATIVE AND QUALITATIVE DISCLOSURES ABOUT MARKET RISK
Not applicable.
32
ITEM 8 FINANCIAL STATEMENTS AND SUPPLEMENTARY DATA
INDEX OF FINANCIAL INFORMATION
CONTENTS
| Page | ||
| REPORTS OF INDEPENDENT REGISTERED PUBLIC ACCOUNTING FIRMS | F-1 | |
| CONSOLIDATED FINANCIAL STATEMENTS | ||
| Consolidated Balance Sheets | F-3 | |
| Consolidated Statements of Income | F-4 | |
| Consolidated Statements of Shareholders’ Equity | F-5 | |
| Consolidated Statements of Cash Flows | F-6 | |
| Notes to Consolidated Financial Statements | F-7 |
33

REPORT OF INDEPENDENT REGISTERED PUBLIC ACCOUNTING FIRM
To the Board of Directors and Stockholders of Western Capital Resources, Inc. and Subsidiaries
We have audited the accompanying consolidated balance sheet of Western Capital Resources, Inc. and subsidiaries as of December 31, 2015 and 2014, and the related consolidated statements of income, stockholders’ equity, and cash flows for the years ended December 31, 2015 and 2014. These financial statements are the responsibility of the Company’s. Our responsibility is to express an opinion on these consolidated financial statements based on our audit. We did not audit the December 31, 2014 financial statements of Alpha Graphics, Inc. a majority owned subsidiary which statements reflect total assets and revenues constituting 27 percent and 8 percent, respectively, of the consolidated total. Those statements were audited by other auditors whose report has been furnished to us, and our opinion in so far as it relates to the amounts included for Alpha Graphics, Inc., is based solely on the report of other auditors.
We conducted our audits in accordance with the standards of the Public Company Accounting Oversight Board (United States). Those standards require that we plan and perform the audit to obtain reasonable assurance about whether the financial statements are free of material misstatement. The company is not required to have, nor were we engaged to perform, an audit of its internal control over financial reporting. Our audit included consideration of internal control over financial reporting as a basis for designing audit procedures that are appropriate in the circumstances, but not for the purpose of expressing an opinion on the effectiveness of the company’s internal control over financial reporting. Accordingly, we express no such opinion. An audit also includes examining, on a test basis, evidence supporting the amounts and disclosures in the financial statements, assessing the accounting principles used and significant estimates made by management, as well as evaluating the overall financial statement presentation. We believe that our audits provide a reasonable basis for our opinion.
In our opinion, based upon our audit, and the report of the other independent auditors with respect to the December 31, 2014 financial statements of Alpha Graphics, Inc., the consolidated financial statements referred to above present fairly, in all material respects, the financial position of Western Capital Resources, Inc. and Subsidiaries as of December 31, 2015 and 2014 and the results of its operations and its cash flows for the years ended December 31, 2015 and 2014 in conformity with accounting principles generally accepted in the United States of America.
|
/s/ KLJ & Associates, LLP
KLJ & Associates, LLP |
| Edina, MN |
| March 30, 2016 |
5201 Eden Avenue
Suite 300
Edina, MN 55436
630.277.2330
| F-1 |

REPORT OF INDEPENDENT REGISTERED PUBLIC ACCOUNTING FIRM
To the Board of Directors and Stockholders AlphaGraphics, Inc.
We have audited the accompanying balance sheet of AlphaGraphics, Inc. (the Company) as of December 31, 2014, and the related statements of income, stockholders’ equity, and cash flows for the period from October 1, 2014 through December 31, 2014. These financial statements are the responsibility of the Company’s management. Our responsibility is to express an opinion on these financial statements based on our audit.
We conducted our audit in accordance with the standards of the Public Company Accounting Oversight Board (United States). Those standards require that we plan and perform the audit to obtain reasonable assurance about whether the financial statements are free of material misstatement. An audit includes consideration of internal control over financial reporting as a basis for designing audit procedures that are appropriate in the circumstances, but not for the purpose of expressing an opinion on the effectiveness of the Company’s internal control over financial reporting. Accordingly, we express no such opinion. An audit includes examining, on a test basis, evidence supporting the amounts and disclosures in the financial statements. An audit also includes assessing the accounting principles used and significant estimates made by management, as well as evaluating the overall financial statement presentation. We believe that our audit provides a reasonable basis for our opinion.
In our opinion, the financial statements referred to above present fairly, in all material respects, the financial position of AlphaGraphics, Inc. as of December 31, 2014, and the results of its operations and its cash flows for the period from October 1, 2014 through December 31, 2014 in conformity with accounting principles generally accepted in the United States of America.

February 19, 2015
| F-2 |
WESTERN CAPITAL RESOURCES, INC. AND SUBSIDIARIES
CONSOLIDATED BALANCE SHEETS
| December 31, | ||||||||
| 2015 | 2014 | |||||||
| ASSETS | ||||||||
| CURRENT ASSETS | ||||||||
| Cash | $ | 7,847,669 | $ | 4,273,350 | ||||
| Loans receivable (less allowance for losses of $1,177,000 and $1,219,000, respectively) | 4,884,438 | 5,331,266 | ||||||
| Accounts receivable (less allowance for losses of $272,000 and $59,405, respectively) | 1,963,192 | 1,135,127 | ||||||
| Inventory | 7,617,850 | 2,340,824 | ||||||
| Prepaid expenses and other | 2,589,749 | 1,435,918 | ||||||
| Deferred income taxes | 563,000 | 644,000 | ||||||
| TOTAL CURRENT ASSETS | 25,465,898 | 15,160,485 | ||||||
| PROPERTY AND EQUIPMENT, net | 8,561,321 | 1,197,710 | ||||||
| GOODWILL | 13,355,591 | 12,956,868 | ||||||
| INTANGIBLE ASSETS, net | 8,018,616 | 7,248,793 | ||||||
| OTHER | 783,907 | 198,408 | ||||||
| TOTAL ASSETS | $ | 56,185,333 | $ | 36,762,264 | ||||
| LIABILITIES AND EQUITY | ||||||||
| CURRENT LIABILITIES | ||||||||
| Accounts payable | $ | 4,577,118 | $ | 699,692 | ||||
| Accrued expenses and other liabilities | 6,232,267 | 5,326,228 | ||||||
| Income taxes payable | 1,135,031 | 755,615 | ||||||
| Current portion long-term debt | 4,900,008 | 3,500,000 | ||||||
| Current portion capital lease obligations | 23,860 | 42,240 | ||||||
| Deferred revenue and other | 1,796,338 | 638,068 | ||||||
| TOTAL CURRENT LIABILITIES | 18,664,622 | 10,961,843 | ||||||
| LONG-TERM LIABILITIES | ||||||||
| Notes payable, net of current portion | 3,096,452 | 1,625,000 | ||||||
| Capital lease obligations, net of current portion | 33,347 | 31,481 | ||||||
| Deferred income taxes | 4,452,000 | 3,939,000 | ||||||
| Other | 80,403 | 114,514 | ||||||
| TOTAL LONG-TERM LIABILITIES | 7,662,202 | 5,709,995 | ||||||
| TOTAL LIABILITIES | 26,326,824 | 16,671,838 | ||||||
| COMMITMENTS AND CONTINGENCIES (Note 15) | ||||||||
| EQUITY | ||||||||
| WESTERN SHAREHOLDERS’ EQUITY | ||||||||
| Common stock, no par value, 12,500,000 shares authorized, 9,497,534 and 5,997,588 issued and outstanding. | - | - | ||||||
| Additional paid-in capital | 28,934,392 | 22,703,745 | ||||||
| Retained earnings (accumulated deficit) | 898,038 | (2,621,692 | ) | |||||
| TOTAL WESTERN SHAREHOLDERS’ EQUITY | 29,832,430 | 20,082,053 | ||||||
| NONCONTROLLING INTERESTS | 26,079 | 8,373 | ||||||
| TOTAL EQUITY | 29,858,509 | 20,090,426 | ||||||
| TOTAL LIABILITIES AND EQUITY | $ | 56,185,333 | $ | 36,762,264 | ||||
See notes to consolidated financial statements.
| F-3 |
WESTERN CAPITAL RESOURCES, INC. AND SUBSIDIARIES
CONSOLIDATED STATEMENTS OF INCOME
| Year ended December 31, | ||||||||
| 2015 | 2014 | |||||||
| REVENUES | ||||||||
| Sales and associated fees | $ | 46,243,284 | $ | 22,535,116 | ||||
| Financing fees and interest | 10,772,785 | 11,123,882 | ||||||
| Royalty and franchise fees, net | 10,770,914 | 2,814,273 | ||||||
| Other revenue | 8,667,052 | 4,286,282 | ||||||
| 76,454,035 | 40,759,553 | |||||||
| COST OF REVENUES | ||||||||
| Cost of sales | 25,209,412 | 12,714,413 | ||||||
| Provisions for loans receivable losses | 1,904,893 | 1,817,822 | ||||||
| Other | 1,196,172 | 168,952 | ||||||
| 28,310,477 | 14,701,187 | |||||||
| GROSS PROFIT | 48,143,558 | 26,058,366 | ||||||
| OPERATING EXPENSES | ||||||||
| Salaries, wages and benefits | 20,859,080 | 11,593,794 | ||||||
| Occupancy | 6,570,537 | 4,610,807 | ||||||
| Advertising, marketing and development | 4,164,473 | 478,261 | ||||||
| Depreciation | 697,956 | 368,827 | ||||||
| Amortization | 499,697 | 187,669 | ||||||
| Other | 8,761,172 | 4,547,955 | ||||||
| 41,552,915 | 21,787,313 | |||||||
| OPERATING INCOME | 6,590,643 | 4,271,053 | ||||||
| OTHER INCOME (EXPENSES): | ||||||||
| Interest income | 4,269 | 1,807 | ||||||
| Interest expense | (575,712 | ) | (315,568 | ) | ||||
| (571,443 | ) | (313,761 | ) | |||||
| INCOME BEFORE INCOME TAXES | 6,019,200 | 3,957,292 | ||||||
| INCOME TAX EXPENSE | 2,481,764 | 1,545,860 | ||||||
| NET INCOME | 3,537,436 | 2,411,432 | ||||||
| Less net income attributable to noncontrolling interests | (17,706 | ) | (5,546 | ) | ||||
| NET INCOME ATTRIBUTABLE TO WESTERN COMMON SHAREHOLDERS | $ | 3,519,730 | $ | 2,405,886 | ||||
| EARNINGS PER SHARE ATTRIBUTABLE TO WESTERN COMMON SHAREHOLDERS | ||||||||
| Basic and diluted | $ | 0.45 | $ | 0.64 | ||||
| WEIGHTED AVERAGE COMMON SHARES OUTSTANDING | ||||||||
| Basic and diluted | 7,761,918 | 3,763,726 | ||||||
See notes to consolidated financial statements.
| F-4 |
WESTERN CAPITAL RESOURCES, INC. AND SUBSIDIARIES
CONSOLIDATED STATEMENTS OF SHAREHOLDERS’ EQUITY
| Western Capital Resources, Inc. Shareholders | ||||||||||||||||||||||||
| Common Stock | Additional Paid-In | Retained Earnings / (Accumulated | Noncontrolling | |||||||||||||||||||||
| Total | Shares | Amount | Capital | Deficit) | Interests | |||||||||||||||||||
| BALANCE – December 31, 2013 | $ | 17,326,022 | 3,011,009 | $ | - | $ | 22,353,600 | $ | (5,027,578 | ) | $ | - | ||||||||||||
| Fractional shares repurchased | (388 | ) | (244 | ) | - | (388 | ) | - | - | |||||||||||||||
| Shares of common stock issued October 1, 2014 for AlphaGraphics entities acquisition | 357,392 | 2,986,823 | - | 350,533 | - | 6,859 | ||||||||||||||||||
| Net income | 2,411,432 | - | - | - | 2,405,886 | 5,546 | ||||||||||||||||||
| Distributions made by subsidiary to noncontrolling interests | (4,032 | ) | - | - | - | - | (4,032 | ) | ||||||||||||||||
| BALANCE – December 31, 2014 | 20,090,426 | 5,997,588 | - | 22,703,745 | (2,621,692 | ) | 8,373 | |||||||||||||||||
Shares of common stock issued July 1, 2015 for JPPA/RAI acquisition | 6,123,398 | 3,500,000 | - | 6,123,398 | - | - | ||||||||||||||||||
| Removal of partial shares | - | (54 | ) | - | - | - | - | |||||||||||||||||
| Net Income | 3,537,436 | - | - | - | 3,519,730 | 17,706 | ||||||||||||||||||
| Share based compensation | 107,249 | - | - | 107,249 | - | - | ||||||||||||||||||
| BALANCE – December 31, 2015 | $ | 29,858,509 | 9,497,534 | $ | - | $ | 28,934,392 | $ | 898,038 | $ | 26,079 | |||||||||||||
See notes to consolidated financial statements.
| F-5 |
WESTERN CAPITAL RESOURCES, INC. AND SUBSIDIARIES
CONSOLIDATED STATEMENTS OF CASH FLOWS
| Year Ended December 31, | ||||||||
| 2015 | 2014 | |||||||
| OPERATING ACTIVITIES | ||||||||
| Net Income | $ | 3,537,436 | $ | 2,411,432 | ||||
| Adjustments to reconcile net income to net cash provided by operating activities: | ||||||||
| Depreciation | 697,956 | 368,827 | ||||||
| Amortization | 499,697 | 187,669 | ||||||
| Share based compensation | 107,249 | - | ||||||
| Deferred income taxes | 611,000 | 349,000 | ||||||
| Loss on disposal of property, equipment and other assets | 447,790 | 14,088 | ||||||
| Changes in operating assets and liabilities: | ||||||||
| Loans receivable | 446,828 | 106,936 | ||||||
| Accounts receivable | (300,699 | ) | 91,633 | |||||
| Inventory | (1,679,584 | ) | (761,957 | ) | ||||
| Prepaid expenses and other assets | (785,181 | ) | (424,072 | ) | ||||
| Note receivable | - | 636,196 | ||||||
| Accounts payable and accrued liabilities | 1,169,915 | 1,478,484 | ||||||
| Deferred revenue and other current liabilities | 697,838 | (12,497 | ) | |||||
| Accrued liabilities and other | (34,111 | ) | (30,446 | ) | ||||
| Net cash provided by operating activities | 5,416,134 | 4,415,293 | ||||||
| INVESTING ACTIVITIES | ||||||||
| Purchases of property and equipment | (766,625 | ) | (237,161 | ) | ||||
| Purchase of intangible assets | - | (250,000 | ) | |||||
| Acquisition of stores, net of cash acquired | (2,698,500 | ) | (166,800 | ) | ||||
| Cash received through acquisitions | 2,470,930 | 168,254 | ||||||
| Net cash used in investing activities | (994,195 | ) | (485,707 | ) | ||||
| FINANCING ACTIVITIES | ||||||||
| Payments on notes payable – short-term, net | (120,000 | ) | - | |||||
| Payments on notes payable – long-term, net | (666,670 | ) | (1,625,000 | ) | ||||
| Common stock redemption | - | (388 | ) | |||||
| Payments on capital lease | (60,950 | ) | (10,651 | ) | ||||
| Subsidiary distributions to noncontrolling interests | - | (4,032 | ) | |||||
| Net cash used in financing activities | (847,620 | ) | (1,640,071 | ) | ||||
| NET INCREASE IN CASH | 3,574,319 | 2,289,515 | ||||||
| CASH | ||||||||
| Beginning of year | 4,273,350 | 1,983,835 | ||||||
| End of year | $ | 7,847,669 | $ | 4,273,350 | ||||
| SUPPLEMENTAL DISCLOSURE OF CASH FLOW INFORMATION | ||||||||
| Income taxes paid | $ | 2,046,817 | $ | 449,972 | ||||
| Interest paid | $ | 549,361 | $ | 312,817 | ||||
| Noncash investing and financing activities: | ||||||||
| Shares issued and net assets acquired in acquisitions (Notes 11 and 13) | $ | 6,123,398 | $ | 350,533 | ||||
| Receivable from sale of intangible asset | $ | - | $ | 10,000 | ||||
| Deposit applied to purchase of intangibles | $ | 50,000 | $ | - | ||||
See notes to consolidated financial statements.
| F-6 |
WESTERN CAPITAL RESOURCES, INC. AND SUBSIDIARIES
NOTES TO CONSOLIDATED FINANCIAL STATEMENTS
| 1. | Basis of Presentation, Nature of Business and Summary of Significant Accounting Policies – |
Basis of Presentation / Nature of Business
Western Capital Resources, Inc. (WCR) is a parent company owning operating subsidiaries, with percentage owned shown parenthetically, as summarized below.
| · | Franchise |
| o | AlphaGraphics, Inc. (AGI) (99.2% – Acquired October 1, 2014) – franchisor of 254 domestic and 25 international AlphaGraphics Business Centers which specialize in the planning, production, and management of visual communications for businesses and individuals throughout the world. |
| · | Cellular Retail |
| o | PQH Wireless, Inc. (PQH) (100%) – owns and operates cellular retail stores (99 as of December 31, 2015), as an exclusive dealer of the Cricket brand. |
| · | Direct to Consumer |
| o | J & P Park Acquisitions, Inc. (JPPA) (100% – Acquired July 1, 2015) – an online and direct marketing distribution retailer of live plants, seeds, holiday gifts and garden accessories selling its products under Park Seed, Jackson & Perkins, and Wayside Gardens brand names as well as a wholesaler under the Park Wholesale brand. |
| o | Restorers Acquisition, Inc. (RAI) (100% – Acquired July 1, 2015) – an online and direct marketing distribution retailer of home improvement and restoration products operating under Van Dyke’s Restorers. |
| o | J & P Real Estate, LLC (JPRE) (100% – Acquired July 1, 2015) – owns real estate utilized as JPPA’s distribution and warehouse facility and the corporate offices of JPPA and RAI. |
| · | Consumer Finance |
| o | Wyoming Financial Lenders, Inc. (WFL) (100%) – owns and operates “payday” stores (46 as of December 31, 2015) in eight states (Colorado, Iowa, Kansas, Nebraska, North Dakota, South Dakota, Wisconsin and Wyoming) providing sub-prime short-term uncollateralized non-recourse “cash advance” or “payday” loans typically ranging from $100 to $500 with a maturity of generally two to four weeks, sub-prime short-term uncollateralized non-recourse installment loans typically ranging from $300 to $800 with a maturity of six months, check cashing and other money services to individuals. |
| o | Express Pawn, Inc. (EPI) (100%) – owns and operates retail pawn stores (three as of December 31, 2015) in Nebraska and Iowa providing collateralized non-recourse pawn loans and retail sales of merchandise obtained from forfeited pawn loans or purchased from customers. |
References in these financial statement notes to “Company” or “we” refer to Western Capital Resources, Inc. and its subsidiaries. References to specific companies within our enterprise, such “AGI,” “PQH,” “JPPA,” “RAI,” “JPRE,” “WFL” or “EPI” are references only to those companies.
Basis of Consolidation
The consolidated financial statements include the accounts of the WCR, its wholly owned subsidiaries and other entities in which the Company owns a controlling financial interest. For financial interests in which the Company owns a controlling financial interest, the Company applies the provisions of ASC 810 applicable to reporting the equity and net income or loss attributable to noncontrolling interests. All significant intercompany balances and transactions of the Company have been eliminated in consolidation.
| F-7 |
WESTERN CAPITAL RESOURCES, INC. AND SUBSIDIARIES
NOTES TO CONSOLIDATED FINANCIAL STATEMENTS
Use of Estimates
The preparation of consolidated financial statements in conformity with accounting principles generally accepted in the United States of America requires management to make estimates and assumptions that may affect certain reported amounts and disclosures in the consolidated financial statements and accompanying notes. Management bases its estimates on historical experience and on various other assumptions that are believed to be reasonable under the circumstances. Actual results could differ from those estimates. Significant management estimates relate to the notes and loans receivable allowance, carrying value and impairment of long-lived goodwill and intangible assets, inventory valuation and obsolescence, estimated useful lives of property and equipment, gift certificate liability and deferred taxes and tax uncertainties.
Revenue Recognition
Franchise
Royalty revenues from franchisees are primarily based on a percentage of business center sales and are recognized in the period in which they are earned. Initial franchise fee revenues are recognized when the obligations required by the franchise agreement have been substantially performed by AGI, which is generally upon the training of the franchisee. Revenues from area development franchise fees and International Master License Agreement (IML) fees are recognized when the obligations required by the area development and IML agreements have been substantially performed.
Supply sales, service fees and other revenues are recognized when products have been shipped or services provided.
Cellular Retail
Sales revenue for sales of phones and accessories and dealer compensation for related activations is recognized in the period in which the sale is completed (retail sales and associated fees). Customer service fees are recognized upon completion of the service and payment received. Other dealer compensation not attributed to phone activations is recorded in the period earned as reported to us by Cricket Wireless. All sales are presented net of sales taxes, which are excluded from revenue.
Direct to Consumer
Sales revenue is recognized in the period in which product is shipped. Sales billed or cash received in advance of actual shipment are deferred and recorded as income in the period in which shipment is made. Shipping and handling fees billed to customers is included in net sales. Shipping and handling costs are expensed as incurred and included in cost of sales. All sales are presented net of sales taxes, which are excluded from revenue.
Consumer Finance
Loan fees and interest on cash advance loans are recognized on a constant-yield basis ratably over a loan’s term. Title and installment loan fees and interest are recognized using the interest method, except that installment loan origination fees are recognized as they become non-refundable and installment loan maintenance fees are recognized when earned. The Company recognizes fees on pawn loans on a constant-yield basis ratably over the loans’ terms. No fees are recognized on forfeited pawn loans.
Receivables and Loss Allowance
Franchise
Accounts receivable are recorded for earned but uncollected royalties and other related franchise fees. Allowances are provided on an account-by-account basis for estimated uncollectible accounts as deemed necessary by management. The Company considers current economic trends and changes in payment terms when evaluating the adequacy of the allowance.
Direct to Consumer
Receivables, for noncash sales, are recorded when orders are shipped and represent claims against third parties that will be settled in cash. The carrying value of receivables, net of the allowance for doubtful accounts, represents their estimated net realizable value. The allowance for doubtful accounts is estimated based on historical collection trends, type of customer, the age of outstanding receivables and existing economic conditions. If events or changes in circumstances indicate that specific receivable balances may be impaired, further consideration is given to the collectability of those balances and the allowance is adjusted accordingly. Past due receivable balances are written-off when internal collection efforts have been unsuccessful in collecting the amount due.
| F-8 |
WESTERN CAPITAL RESOURCES, INC. AND SUBSIDIARIES
NOTES TO CONSOLIDATED FINANCIAL STATEMENTS
Consumer Finance
Included in loans receivable are unpaid principal, interest and fee balances of payday, installment, pawn and title loans that have not reached their maturity date, and “late” payday loans that have reached maturity within the last 180 days and have remaining outstanding balances. Late payday loans generally are unpaid loans where a customer’s personal check has been deposited and the check has been returned due to non-sufficient funds in the customer’s account, a closed account, or other reasons. All returned items are charged-off after 180 days, as collections after that date have not been significant. Loans are carried at cost plus accrued interest or fees less payments made and a loans receivable allowance.
The Company does not specifically reserve for any individual payday, installment or title loan. The Company aggregates loan types for purposes of estimating the loss allowance using a methodology that analyzes historical portfolio statistics and management’s judgment regarding recent trends noted in the portfolio. This methodology takes into account several factors, including (1) the amount of loan principal, interest and fee outstanding, (2) historical charge offs from loans that originated during the last 24 months, (3) current and expected collection patterns and (4) current economic trends. The Company utilizes a software program to assist with the tracking of its historical portfolio statistics. A loan loss allowance is maintained for anticipated losses for payday and installment loans based primarily on our historical percentages by loan type of net charge offs, applied against the applicable balance of loan principal, interest and fees outstanding. The Company also periodically performs a look-back analysis on its loan loss allowance to verify the historical allowance established tracks with the actual subsequent loan write-offs and recoveries. The Company is aware that as conditions change, it may also need to make additional allowances in future periods. Loan losses or charge-offs of pawn or title loans are not recorded because the value of the collateral exceeds the loan amount.
Inventory
Cellular Retail
Inventory, consisting of phones and accessories, is stated at cost, determined on the specific identification and a first-in, first-out basis, respectively.
Direct to Consumer
Inventory is valued at the lower of cost or market using the weighted-average method of determining cost.
Consumer Finance
Merchandise inventory is stated at the lower of cost or market. The principal amount of an unpaid loan becomes the inventory cost for forfeited collateral.
Property and Equipment
Property and equipment are recorded at cost less accumulated depreciation. Depreciation is provided on the straight-line method over the estimated useful lives of the related assets as follows:
| Ÿ | Computer equipment and software | 3 – 10 years | |
| Ÿ | Improvements and equipment | 3 – 15 years | |
| Ÿ | Building | 39 years |
The cost of maintenance and repairs is charged to operations as incurred while renewals and betterments are capitalized.
The Company capitalizes certain internal costs, including payroll costs, incurred in connection with the development of software for internal use. These costs are capitalized beginning when the Company has entered the application development stage. The capitalization of these costs ceases when the software is substantially complete and ready for its intended use. Costs incurred for enhancements that are expected to result in additional features or functionality are capitalized and expensed over the estimated useful life of the enhancements.
| F-9 |
WESTERN CAPITAL RESOURCES, INC. AND SUBSIDIARIES
NOTES TO CONSOLIDATED FINANCIAL STATEMENTS
Goodwill
Goodwill represents the excess of cost over the fair value of net assets acquired using purchase accounting and is not amortized.
Intangible Assets
Intangible assets represent the fair values management assigned to assets acquired through business acquisitions and is amortized over periods of three to 15 years based on management’s estimates of the useful life of the asset.
Long-Lived Assets
The Company assesses the possibility of impairment of long-lived and intangible assets whenever events or changes in circumstances indicate that the carrying value may not be recoverable. Factors that could trigger an impairment review include significant underperformance relative to expected historical or projected future cash flows, significant changes in the manner of use of acquired assets or the strategy for the overall business, and significant negative industry events or trends. In addition, the Company conducts an annual goodwill impairment test as of October 1 each year. The Company assesses goodwill for impairment at the reporting unit level by applying a fair value test. This fair value test involves a two-step process. The first step is to compare the carrying value of our net assets to our fair value. If the fair value is determined to be less than the carrying value, a second step is performed to measure the amount of the impairment, if any.
Due to the minimal amount of public float for the Company’s common stock, the market capitalization approach of valuing the reporting unit as a whole is not practical. The discounted future cash flows method is utilized in estimating value. When estimated future cash flows are less than the carrying value of the net assets and related goodwill, an impairment test is performed to measure and recognize the amount of the impairment loss, if any. There were no impairment charges recorded in 2015 or 2014.
Merchandise Credits and Gift Card Liabilities
Direct to Consumer
The Company maintains a liability for unredeemed gift cards, gift certificates and merchandise credits until the earlier of redemption, escheatment or a maximum of two years. The Company has concluded based on historical redemption trends that the likelihood of these liabilities being redeemed beyond two years from the date of issuance is remote.
Advertising, Marketing and Development Costs
Franchise
The costs of advertising, marketing and development are expenses as incurred.
Certain amounts received from franchisees for marketing and advertising campaigns benefiting the franchisees are held in the AlphaGraphics Integrated Marketing Fund. AGI controls the manner in which these funds are spent. In addition to advertising, marketing and development expenses, fund expenses include general operating expenses such as reasonable salaries, travel related expenditures, administrative expenses, and overhead incurred by AGI on behalf of the fund. Amounts in the fund and the related revenues and expenses are not reflected in the accompanying consolidated financial statements. AGI may direct that the amount spent in any fiscal year is greater or less than the aggregate contributions made by the franchisees into the fund.
| F-10 |
WESTERN CAPITAL RESOURCES, INC. AND SUBSIDIARIES
NOTES TO CONSOLIDATED FINANCIAL STATEMENTS
Direct to Consumer
The Company expenses advertising costs as they are incurred, except for direct-response advertising, which is capitalized and amortized over its expected period of future benefits, not to exceed six months. Direct-response advertising consists primarily of catalog book production, printing, and postage costs. Prepaid advertising costs at December 31, 2015 were $0.92 million.
Consumer Finance
The costs of advertising and marketing are expenses as incurred.
Stock-based Compensation
The Company accounts for its employee stock-based compensation plans using the fair value method. The fair value method requires the Company to estimate the grant-date fair value of its stock-based awards and amortize this fair value to compensation expense over the requisite service period or vesting term.
The Company uses the Black-Scholes option-pricing model to estimate the fair value of the Company’s stock option awards. The determination of the fair value of stock-based payment awards on the date of grant using an option-pricing model is affected by the Company’s stock price as well as assumptions regarding a number of complex and subjective variables. These variables include the expected stock price volatility over the term of the awards, actual and projected employee stock option exercise behaviors, the risk-free interest rate and expected dividends. Due to the inherent limitations of option-valuation models, future events that are unpredictable and the estimation process utilized in determining the valuation of the stock-based awards, the ultimate value realized by award holders may vary significantly from the amounts expensed in the Company’s financial statements.
Stock-based compensation expense is recognized net of estimated forfeitures such that expense is recognized only for those stock-based awards that are expected to vest. A forfeiture rate is estimated at the time of grant and revised, if necessary, in subsequent periods if actual forfeitures differ from initial estimate.
Income Taxes
Deferred income taxes reflect the tax consequences in future years of differences between the tax basis of assets and liabilities and their financial reporting amounts, based on enacted tax laws and statutory tax rates applicable in the periods in which the differences are expected to affect taxable income. Valuation allowances are established when necessary to reduce deferred tax assets to the amounts expected to be realized. The provision for income taxes represents taxes paid or payable for the current year and changes during the year in deferred tax assets and liabilities.
Net Income Per Common Share
Basic net income per common share is computed by dividing the income available to common shareholders by the weighted average number of common shares outstanding for the period. Diluted earnings per share gives effect to all potentially dilutive common shares outstanding during the period, including stock options, using the treasury stock method. Options to purchase 65,000 shares granted under the 2015 Stock Incentive Plan effective February 6, 2015 (see Note 11) were outstanding at December 31, 2015. These options have a strike price in excess of the market price as of December 31, 2015, were antidilutive and therefore not included in the computation of diluted earnings per share. Thus, there were no dilutive common shares as of December 31, 2015 and 2014.
Fair Value of Financial Instruments
The amounts reported in the balance sheets for cash, accounts and loans receivable, inventory, and accounts payable are short-term in nature and their carrying values approximate fair values. The amounts reported in the balance sheets for notes payable are both long-term and short-term and their carrying value approximates fair value.
| F-11 |
WESTERN CAPITAL RESOURCES, INC. AND SUBSIDIARIES
NOTES TO CONSOLIDATED FINANCIAL STATEMENTS
Reclassifications
Certain Statement of Income reclassifications have been made in the presentation of our prior financial statements and accompanying notes to conform to the presentation as of and for the year ended December 31, 2015.
Recent Accounting Pronouncements
In May 2014, the Financial Accounting Standards Board (FASB) and the International Accounting Standards Board (IASB) jointly issued a comprehensive new revenue recognition standard that will supersede nearly all existing revenue recognition guidance under US GAAP and IFRS. This converged standard is effective for annual and interim periods beginning after December 15, 2016. The Company is currently assessing the potential effects on our financial condition and results of operations and consolidated financial statements.
In November 2014 the FASB issued ASU 2015-17, Income Taxes (Topic 740) Related to the Balance Sheet Classification of Deferred Taxes which will require entities to present deferred tax assets (DTAs) and deferred tax liabilities (DTLs) as noncurrent in a classified balance sheet. The ASU simplifies the current guidance (ASC 740-10-45-4), which requires entities to separately present DTAs and DTLs as current and noncurrent in a classified balance sheet. The ASU is effective for annual reporting periods beginning on or after December 15, 2016, and interim periods within those annual periods, with early application permitted. The Company is currently assessing the potential effects on our consolidated financial position.
No other new accounting pronouncements issued or effective during the fiscal year have had or are expected to have a material impact on the consolidated financial statements.
| 2. | Risks Inherent in the Operating Environment – |
Regulatory
The Company’s Consumer Finance segment activities are highly regulated under numerous local, state, and federal laws, regulations and rules, which are subject to change. New laws, regulations or rules could be enacted or issued, interpretations of existing laws, regulations or rules may change and enforcement action by regulatory agencies may intensify. Over the past several years, consumer advocacy groups and certain media reports have advocated governmental and regulatory action to prohibit or severely restrict sub-prime lending activities of the kind conducted by the Company. The federal Consumer Financial Protection Bureau has indicated that it will use its authority to further regulate the payday industry and has been actively assessing significant penalties or seeking settlement payments.
Any adverse change in present local, state, and federal laws or regulations that govern or otherwise affect lending could result in the Consumer Finance segment’s curtailment or cessation of operations in certain or all jurisdictions or locations. Furthermore, any failure to comply with any applicable local, state or federal laws or regulations could result in fines, litigation, closure of one or more store locations or negative publicity. Any such change or failure would have a corresponding impact on the Company’s and segment’s results of operations and financial condition, primarily through a decrease in revenues resulting from the cessation or curtailment of operations, decrease in operating income through increased legal expenditures or fines, and could also negatively affect the Company’s general business prospects due to lost or decreased operating income or if negative publicity effects its ability to obtain additional financing as needed.
In addition, the passage of federal or state laws and regulations or changes in interpretations of them could, at any point, essentially prohibit the Consumer Finance segment from conducting its lending business in its current form. Any such legal or regulatory change would certainly have a material and adverse effect on the Company, its operating results, financial condition and prospects, and perhaps even the viability of the Consumer Finance segment.
Concentrations
The Company’s subsidiaries each have demand deposits at financial institutions, often times in excess of the limit for insurance by the Federal Deposit Insurance Corporation. As of December 31, 2015, the Company had demand deposits in excess of insurance amounts of approximately $5.69 million compared to $2.25 million at December 31, 2014.
| F-12 |
WESTERN CAPITAL RESOURCES, INC. AND SUBSIDIARIES
NOTES TO CONSOLIDATED FINANCIAL STATEMENTS
Loans receivable in the Consumer Finance segment are concentrated in the sub-prime market and geographically, primarily in the Midwest. For the years ended December 31, 2015 and 2014, the Consumer Finance segment had geographic economic and regulatory risk concentrations (shown as a percentage of applicable segment’s revenue by state when 10% or more) as follows:
| Consumer Finance Segment | ||||||||
2015 % of Revenues | 2014 % of Revenues | |||||||
| Nebraska | 33 | % | 30 | % | ||||
| North Dakota | 19 | % | 18 | % | ||||
| Wyoming | 14 | % | 14 | % | ||||
| Iowa | 14 | % | 14 | % | ||||
The Company’s Wireless Retail segment is an exclusive dealer for Cricket. As a dealer operating exclusively for a single carrier, the Company is subject to a number of concentrations, including revenues from a single brand, a single supplier for phones, a single operating system providers and select third party processors.
Our Direct to Consumer subsidiary JPPA has an agreement with a third party wholesale grower that is in effect until 2019. The grower has agreed to perform research for JPPA and maintain JPPA's research crop in exchange for a reduction in royalties to be paid to JPPA for growing JPPA's patented roses. There is an option to renew the agreement for consecutive two year terms and the agreement calls for a 24 month notice prior to termination.
RAI has an agreement with a single third-party fulfillment provider, Speed Commerce, Inc. Speed Commerce, Inc.is under extreme financial distress and is attempting to restructure its organization. The contract with the fulfillment provider expired in early 2016 and an extension agreement is currently being negotiated while we operate under a month to month agreement. The fulfillment provider receives and stores inventory, performs periodic cycle counts, picks, packs and ships customer orders. Additional services such as, order taking, processing of customer payments, personalization, customer services, and order processing are also performed by the fulfillment provider.
| 3. | Loans Receivable – |
At December 31, 2015 and December 31, 2014, the Company’s outstanding loans receivable aging was as follows:
December 31, 2015
| Payday | Installment | Pawn & Title | Total | |||||||||||||
| Current | $ | 4,065,706 | $ | 291,947 | $ | 286,514 | $ | 4,644,167 | ||||||||
| 1-30 | 332,217 | 43,179 | - | 375,396 | ||||||||||||
| 31-60 | 263,486 | 24,233 | - | 287,719 | ||||||||||||
| 61-90 | 199,526 | 16,293 | - | 215,819 | ||||||||||||
| 91-120 | 196,123 | 9,417 | - | 205,540 | ||||||||||||
| 121-150 | 160,386 | 4,985 | - | 165,371 | ||||||||||||
| 151-180 | 165,237 | 2,189 | - | 167,426 | ||||||||||||
| 5,382,681 | 392,243 | 286,514 | 6,061,438 | |||||||||||||
| Less Allowance | (1,081,000 | ) | (96,000 | ) | - | (1,177,000 | ) | |||||||||
| $ | 4,301,681 | $ | 296,243 | $ | 286,514 | $ | 4,884,438 | |||||||||
| F-13 |
WESTERN CAPITAL RESOURCES, INC. AND SUBSIDIARIES
NOTES TO CONSOLIDATED FINANCIAL STATEMENTS
December 31, 2014
| Payday | Installment | Pawn & Title | Total | |||||||||||||
| Current | $ | 4,387,393 | $ | 321,634 | $ | 372,805 | $ | 5,081,832 | ||||||||
| 1-30 | 305,382 | 47,321 | - | 352,703 | ||||||||||||
| 31-60 | 223,465 | 24,791 | - | 248,256 | ||||||||||||
| 61-90 | 236,072 | 11,799 | - | 247,871 | ||||||||||||
| 91-120 | 206,705 | 5,438 | - | 212,143 | ||||||||||||
| 121-150 | 200,101 | 1,984 | - | 202,085 | ||||||||||||
| 151-180 | 204,804 | 572 | - | 205,376 | ||||||||||||
| 5,763,922 | 413,539 | 372,805 | 6,550,266 | |||||||||||||
| Less Allowance | (1,147,000 | ) | (72,000 | ) | - | (1,219,000 | ) | |||||||||
| $ | 4,616,922 | $ | 341,539 | $ | 372,805 | $ | 5,331,266 | |||||||||
| 4. | Loans Receivable Allowance – |
As a result of the Company’s Consumer Finance segment’s collection efforts, it historically writes off approximately 43% of the returned payday items, the most significant element making up loans receivable. Based on days past the check return date, write-offs of payday returned items historically have tracked at the following approximate percentages: 1 to 30 days – 43%; 31 to 60 days – 65%; 61 to 90 days – 83%; 91 to 120 days – 89%; and 121 to 150 – 91% and 151+ days – 93%.
A rollforward of the Company’s loans receivable allowance for the years ended December 31, 2015 and 2014 is as follows:
Year Ended December 31, | ||||||||
| 2015 | 2014 | |||||||
| Loans receivable allowance, beginning of period | $ | 1,219,000 | $ | 1,215,000 | ||||
| Provision for loan losses charged to expense | 1,904,893 | 1,817,822 | ||||||
| Charge-offs, net | (1,946,893 | ) | (1,813,822 | ) | ||||
| Loans receivable allowance, end of period | $ | 1,177,000 | $ | 1,219,000 | ||||
| 5. | Accounts Receivable – |
A breakdown of accounts receivables by segment as of December 31, 2015 and 2014 are as follows:
| December 31, 2015 | ||||||||||||||||
| Franchise | Cellular Retail | Direct to Consumer | Total | |||||||||||||
| Accounts receivable | $ | 1,332,446 | $ | 148,346 | $ | 754,400 | $ | 2,235,192 | ||||||||
| Less allowance | (183,000 | ) | - | (89,000 | ) | (272,000 | ) | |||||||||
| Net account receivable | $ | 1,149,446 | $ | 148,346 | $ | 665,400 | $ | 1,963,192 | ||||||||
| December 31, 2014 | ||||||||||||||||
| Franchise | Cellular Retail | Direct to Consumer | Total | |||||||||||||
| Accounts receivable | $ | 1,194,532 | $ | - | $ | - | $ | 1,194,532 | ||||||||
| Less allowance | (59,405 | ) | - | - | (59,405 | ) | ||||||||||
| Net account receivable | $ | 1,135,127 | $ | - | $ | - | $ | 1,135,127 | ||||||||
| F-14 |
WESTERN CAPITAL RESOURCES, INC. AND SUBSIDIARIES
NOTES TO CONSOLIDATED FINANCIAL STATEMENTS
| 6. | Property and Equipment – |
A rollforward of the Company’s property and equipment is as follows:
| December 31, 2014 | Acquisitions | Additions | Deletions | December 31, 2015 | ||||||||||||||||
| Property and equipment | $ | 2,853,603 | $ | 1,202,435 | $ | 605,204 | $ | (861,915 | ) | $ | 3,799,327 | |||||||||
| Leasehold improvements | 787,188 | - | 22,766 | (88,803 | ) | 721,151 | ||||||||||||||
| Software | 504,967 | 1,197,839 | 112,876 | (123,443 | ) | 1,692,239 | ||||||||||||||
| Building | 85,906 | 5,034,348 | 28,449 | - | 5,148,703 | |||||||||||||||
| Land | 9,500 | 1,200,000 | - | - | 1,209,500 | |||||||||||||||
| Other | 96,311 | - | - | - | 96,311 | |||||||||||||||
| 4,337,475 | 8,634,622 | 769,295 | (1,074,161 | ) | 12,667,231 | |||||||||||||||
| Accumulated depreciation | (3,139,765 | ) | (1,334,555 | ) | (697,956 | ) | 1,066,366 | (4,105,910 | ) | |||||||||||
| $ | 1,197,710 | $ | 7,300,067 | $ | 71,339 | $ | (7,795 | ) | $ | 8,561,321 | ||||||||||
| December 31, 2013 | Acquisitions | Additions | Deletions | December 31, 2014 | ||||||||||||||||
| Property and equipment | $ | 1,571,152 | $ | 1,159,500 | $ | 159,076 | $ | (36,125 | ) | $ | 2,853,603 | |||||||||
| Leasehold improvements | 701,764 | 73,798 | 43,539 | (31,913 | ) | 787,188 | ||||||||||||||
| Software | 17,322 | 487,645 | - | - | 504,967 | |||||||||||||||
| Building | 85,906 | - | - | - | 85,906 | |||||||||||||||
| Land | 9,500 | - | - | - | 9,500 | |||||||||||||||
| Other | 61,765 | - | 34,546 | - | 96,311 | |||||||||||||||
| 2,447,409 | 1,720,943 | 237,161 | (68,038 | ) | 4,337,475 | |||||||||||||||
| Accumulated depreciation | (1,519,335 | ) | (1,319,641 | ) | (368,827 | ) | 68,038 | (3,139,765 | ) | |||||||||||
| $ | 928,074 | $ | 401,302 | $ | (131,666 | ) | $ | - | $ | 1,197,710 | ||||||||||
| 7. | Intangible Assets – |
| December 31, 2014 | Acquisitions | Additions | Deletions | December 31, 2015 | ||||||||||||||||
| Customer relationships | $ | 4,924,912 | $ | 1,148,000 | $ | - | $ | - | $ | 6,072,912 | ||||||||||
| Acquired franchise agreements | 5,227,112 | - | - | - | 5,227,112 | |||||||||||||||
| Other | - | 227,000 | - | - | 227,000 | |||||||||||||||
| Amortizable Intangible assets | 10,152,024 | 1,375,000 | - | - | 11,527,024 | |||||||||||||||
| Less accumulated amortization | (5,685,523 | ) | (105,480 | ) | (499,697 | ) | - | (6,290,700 | ) | |||||||||||
| Net Amortizable Intangible Assets | 4,466,501 | 1,269,520 | (499,697 | ) | - | 5,236,324 | ||||||||||||||
| Non-amortizable trademarks | 2,782,292 | - | - | - | 2,782,292 | |||||||||||||||
| Intangible Assets, net | $ | 7,248,793 | $ | 1,269,520 | $ | (499,697 | ) | $ | - | $ | 8,018,616 | |||||||||
| December 31, 2013 | Acquisitions | Additions | Deletions | December 31, 2014 | ||||||||||||||||
| Customer relationships | $ | 4,627,412 | $ | 327,000 | $ | - | $ | (29,500 | ) | $ | 4,924,912 | |||||||||
| Acquired franchise agreements | - | 5,227,112 | - | - | 5,227,112 | |||||||||||||||
| Other | - | - | - | - | - | |||||||||||||||
| Amortizable Intangible assets | 4,627,412 | 5,554,112 | - | (29,500 | ) | 10,152,024 | ||||||||||||||
| Less accumulated amortization | (4,510,316 | ) | (992,950 | ) | (187,669 | ) | 5,412 | (5,685,523 | ) | |||||||||||
| Net Amortizable Intangible Assets | 117,096 | 4,561,162 | (187,669 | ) | (24,088 | ) | 4,466,501 | |||||||||||||
| Non-amortizable trademarks | - | 2,782,292 | - | - | 2,782,292 | |||||||||||||||
| Intangible Assets, net | $ | 117,096 | $ | 7,343,454 | $ | (187,669 | ) | $ | (24,088 | ) | $ | 7,248,793 | ||||||||
As of December 31, 2015, estimated future amortization expense for the amortizable intangible assets is as follows:
| 2016 | $ | 555,778 | ||
| 2017 | 542,224 | |||
| 2018 | 530,027 | |||
| 2019 | 519,048 | |||
| 2020 | 502,434 | |||
| Thereafter | 2,586,813 | |||
| $ | 5,236,324 |
| F-15 |
WESTERN CAPITAL RESOURCES, INC. AND SUBSIDIARIES
NOTES TO CONSOLIDATED FINANCIAL STATEMENTS
| 8. | Deferred Revenue and Other Liabilities – |
Deferred revenue and other liabilities consisted of the following:
| For the Year Ended December 31, | ||||||||
| 2015 | 2014 | |||||||
| Deferred financing fees | $ | 285,452 | $ | 284,231 | ||||
| Deferred franchise development fees | 264,000 | 281,837 | ||||||
| Merchandise credits and gift card liability | 1,127,470 | - | ||||||
| Other | 119,416 | 72,000 | ||||||
| Total | $ | 1,796,338 | $ | 638,068 | ||||
| 9. | Leases – |
The Company leases retail and office facilities under operating leases with terms ranging from month to month to six years, with rights to extend for additional periods. Rent expense, inclusive of base rents and common area maintenance obligations, insurance and real estate tax reimbursements, on all operations was approximately $4,490,000 and $3,003,000 in 2015 and 2014, respectively. Future minimum lease payments (in thousands) are approximately as follows:
| Year Ending December 31, | Operating Leases | |||
| 2016 | $ | 3,088 | ||
| 2017 | 2,141 | |||
| 2018 | 1,146 | |||
| 2019 | 670 | |||
| 2020 | 226 | |||
| thereafter | 7 | |||
| Total minimum lease payments | $ | 7,278 | ||
| 10. | Notes Payable – Long Term – |
The Company’s long-term debt is as follows:
| December 31, | ||||||||
| 2015 | 2014 | |||||||
| Note payable (with a credit limit of $3,000,000) to River City Equity, Inc., a related party (see Note 18), with interest payable monthly at 12% due June 30, 2016 and upon certain events can be collateralized by substantially all assets of WCR, excluding any equity interest in AGI | $ | 3,000,000 | $ | 2,000,000 | ||||
| Subsidiary note payable to a financial institution with quarterly principal payments of $375,000 plus interest at prime rate plus 2.5% (6% as of December 31, 2015), secured by the AGI’s assets, maturing March 2017 | 1,625,000 | 3,125,000 | ||||||
| Subsidiary note payable to a financial institution with monthly principal payment of $33,334 plus annual paydowns equal to JPRE’s net cash flow from operations due within 120 days of the calendar year end plus interest at LIBOR plus 3.5% (3.75% at December 31, 2015), secured by JPRE assets, maturing June 5, 2019 when remaining principal balance is due | 3,371,460 | - | ||||||
| Total | 7,996,460 | 5,125,000 | ||||||
| Less current maturities | (4,900,008 | ) | (3,500,000 | ) | ||||
| $ | 3,096,452 | $ | 1,625,000 | |||||
| F-16 |
WESTERN CAPITAL RESOURCES, INC. AND SUBSIDIARIES
NOTES TO CONSOLIDATED FINANCIAL STATEMENTS
Future minimum long-term principal payments are as follows:
| Year Ending December 31, | Amount | |||
| 2016 | $ | 4,900,008 | ||
| 2017 | 525,008 | |||
| 2018 | 400,008 | |||
| 2019 | 400,008 | |||
| 2020 | 400,008 | |||
| Thereafter | 1,371,420 | |||
| $ | 7,996,460 | |||
As part of the lending agreements, applicable subsidiaries may draw on respective line of credit (LOC) agreements which cumulatively amount to $7,250,000 of available credit. The LOCs bear interest at rates varying from LIBOR plus 2.75% to the greater of (a) the prime rate plus 2.50% or (b) the LIBOR rate plus 5.50%. There is no amount outstanding under the various LOCs as of December 31, 2015.
The Company’s subsidiaries’ notes payable with financial institutions include certain financial covenants. Management has determined that the applicable subsidiaries were in compliance with these financial covenants as of December 31, 2015.
| 11. | Income Taxes – |
The Company’s provision for income taxes is as follows:
| For the Year Ended December 31, | ||||||||
| 2015 | 2014 | |||||||
| Current: | ||||||||
| Federal | $ | 1,535,444 | $ | 1,007,860 | ||||
| State | 305,120 | 181,000 | ||||||
| Foreign | 30,200 | 8,000 | ||||||
| 1,870,764 | 1,196,860 | |||||||
| Deferred: | ||||||||
| Federal | 547,000 | 293,000 | ||||||
| State | 64,000 | 56,000 | ||||||
| 611,000 | 349,000 | |||||||
| $ | 2,481,764 | $ | 1,545,860 | |||||
| F-17 |
WESTERN CAPITAL RESOURCES, INC. AND SUBSIDIARIES
NOTES TO CONSOLIDATED FINANCIAL STATEMENTS
Deferred income tax assets (liabilities) are summarized as follows:
| For the Year Ended December 31, | ||||||||||||||||
| 2015 | 2014 | |||||||||||||||
| Current | Non-Current | Current | Non-Current | |||||||||||||
| Deferred income tax assets: | ||||||||||||||||
| Allowance for accounts and loans receivable | $ | 544,000 | $ | - | $ | 521,000 | $ | - | ||||||||
| Inventory capitalization | 120,000 | - | - | - | ||||||||||||
| Inventory reserve | 75,000 | - | - | - | ||||||||||||
| Prepaid expense | (374,000 | ) | - | - | - | |||||||||||
| Accrued expenses | 198,000 | - | 123,000 | - | ||||||||||||
| 563,000 | - | 644,000 | - | |||||||||||||
| Deferred income tax liabilities: | ||||||||||||||||
| Property and equipment | - | (721,000 | ) | - | (306,000 | ) | ||||||||||
| Goodwill and intangible assets | - | (3,864,000 | ) | - | (3,867,000 | ) | ||||||||||
| Net operating losses (expires 2031) | - | 113,000 | - | 208,000 | ||||||||||||
| Capital loss carryforward (expires 2016) | - | 20,000 | - | 21,000 | ||||||||||||
| Foreign tax credits | - | 21,000 | - | 40,000 | ||||||||||||
| Valuation allowance | - | (21,000 | ) | - | (35,000 | ) | ||||||||||
| - | (4,452,000 | ) | - | (3,939,000 | ) | |||||||||||
| Net | $ | 563,000 | $ | (4,452,000 | ) | $ | 644,000 | $ | (3,939,000 | ) | ||||||
Reconciliations from the statutory federal income tax rate to the effective income tax rate are as follows:
| For the Year Ended December 31, | ||||||||
| 2015 | 2014 | |||||||
| Income tax expense using the statutory federal rate | $ | 2,047,000 | $ | 1,345,000 | ||||
| State income taxes, net of federal benefit | 213,000 | 152,000 | ||||||
| Transaction expenses | 119,000 | 64,000 | ||||||
| Share based compensation | 41,000 | - | ||||||
| Other | 61,764 | (15,000 | ) | |||||
| Income tax expense | $ | 2,481,764 | $ | 1,546,000 | ||||
It is the Company’s practice to recognize penalties and/or interest related to income tax matters in interest and penalties expense. As of December 31, 2015 and 2014, the Company had an immaterial amount of accrued interest and penalties.
The Company is subject to income taxes in the U.S. federal jurisdiction and various states and local jurisdictions. Tax regulations within each jurisdiction are subject to the interpretation of the related tax laws and regulations and require significant judgment to apply. Accounting principles generally accepted in the United States of America require management to evaluate tax positions taken by the Company and recognize a tax liability (or asset) if the company has taken an uncertain position that more likely than not would not be sustained upon examination by the Internal Revenue Service. Management has analyzed the tax positions taken by the Company and has concluded that as of December 31, 2015, there are no uncertain positions taken or expected to be taken that would require recognition of a liability (or asset) or disclosure in the consolidated financial statements. The Company is subject to routine audits by taxing jurisdictions. Currently the Company has a federal and state of Missouri audit in progress. Management believes the Company is no longer subject to income tax examinations for years prior to 2012.
| F-18 |
WESTERN CAPITAL RESOURCES, INC. AND SUBSIDIARIES
NOTES TO CONSOLIDATED FINANCIAL STATEMENTS
| 11. | Equity – |
Capitalization
On May 30, 2014, the Company’s Board of Directors approved a 1-for-20 reverse stock split. The reverse stock split became effective on June 20, 2014. The accompanying financial statements and notes have been adjusted retroactively to reflect the reverse stock split. As a result of the reverse stock split, the Company’s adjusted authorized capital stock consists of 12,500,000 shares of no par value capital stock. All shares have equal voting rights and are entitled to one vote per share.
Common Stock Issued
As further explained in Note 13, on July 1, 2015, we issued an aggregate 3.5 million shares of common stock for the acquisition of JPPA, RAI and JPRE. This represented approximately 37% of the total issued and outstanding common stock of the Company after the issuance, which totaled 9.497,534 shares.
As further explained in Note 13, after the close of business on September 30, 2014 we issued 2,986,823 shares of common stock for the acquisition of AlphaGraphics. This represented approximately 49.8% of the total issued and outstanding common stock of the Company after the issuance, which totaled 5,997,588 shares.
WCR 2015 Stock Incentive Plan
On February 2, 2008, the Board of Directors of the Company approved and adopted the Company’s 2008 Stock Incentive Plan, pursuant to which an aggregated of 100,000 shares of common stock have been reserved for issuance. Effective February 6, 2015, the Board of Directors terminated the earlier adopted 2008 Stock Incentive Plan and adopted the Company’s new 2015 Stock Incentive Plan. There were no incentives issued or outstanding under the terminated plan. As of December 31, 2015 65,000 options had been granted under the 2015 plan.
The Board of Directors, or a committee of the board, administers the 2015 Stock Incentive Plan and has complete authority to award incentives, to interpret the plan and to make any other determination which it believes necessary and advisable for the proper administration of the plan. A total of 100,000 shares of common stock were reserved in connection with the adoption of the 2015 Stock Incentive Plan.
The 2015 Stock Incentive plan permits the granting of incentives in any one or a combination of the following forms:
| Ÿ | stock options, including options intended to qualify under Section 422 of the Internal Revenue Code of 1986, as amended, as “qualified” or “incentive” stock options; | |
| Ÿ | stock appreciation rights (often referred to as “SARs”) payable in shares of common stock; | |
| Ÿ | restricted stock and restricted stock units; | |
| Ÿ | performance awards of cash, stock or property; and | |
| Ÿ | stock awards. |
| F-19 |
WESTERN CAPITAL RESOURCES, INC. AND SUBSIDIARIES
NOTES TO CONSOLIDATED FINANCIAL STATEMENTS
The following table summarizes nonvested stock option awards outstanding at September 30, 2015 and the changes for the nine months then ended:
Number of Shares | Weighted- Average Exercise Price Per Share | Weighted- Average Remaining Contractual Term (in years) | Aggregate Intrinsic Value | |||||||||||||
| Outstanding and nonvested at December 31, 2014 | - | $ | - | $ | - | |||||||||||
| Granted | 65,000 | 6.00 | 9.17 | - | ||||||||||||
| Vested | - | - | - | |||||||||||||
| Forfeited | - | - | - | |||||||||||||
| Outstanding and nonvested at December 31, 2015 | 65,000 | $ | 6.00 | 9.17 | $ | - | ||||||||||
| Exercisable at December 31, 2015 | - | |||||||||||||||
The option vests in three annual and near-equal installments on each of February 8, 2016, 2017 and 2018, and has a contract life of ten years. There were no vested options at December 31, 2015, and thus no intrinsic value in outstanding vested options at December 31, 2015. As of December 31, 2015, total unrecognized stock-based compensation expense related to nonvested stock options was approximately $89,000, which is expected to be recognized over a weighted-average period of approximately 1.1 years.
Noncontrolling Interests
The Company owns 99.2% of AGI. For financial interests in which the Company owns a controlling financial interest, the Company applies the provisions of SFAS 160 which are applicable to reporting the equity and net income or loss attributable to noncontrolling interests.
| 12. | Other Expenses – |
A breakout of other expense is as follows:
| For the Year Ended December 31, | ||||||||
| 2015 | 2014 | |||||||
| Bank fees | $ | 1,079,930 | $ | 473,632 | ||||
| Collection costs | 431,682 | 449,301 | ||||||
| Conference expense | 680,991 | - | ||||||
| Insurance | 540,257 | 305,935 | ||||||
| Management and advisory fees | 578,082 | 536,369 | ||||||
| Professional and consulting fees | 1,911,163 | 1,048,599 | ||||||
| Supplies | 694,302 | 637,730 | ||||||
| Other | 2,844,765 | 1,096,389 | ||||||
| $ | 8,761,172 | $ | 4,547,955 | |||||
| 13. | Acquisitions – |
Cellular Retail Growth
Effective June 1, 2015, PQH purchased with cash all outstanding membership interests in four separate limited liability companies (Green Communications, LLC, an Arizona LLC, Green Communications, LLC, an Oregon LLC, Green Communications, LLC, a Washington LLC and Go Green, LLC an Arizona LLC). The entities acquired, when combined, do not meet the 20% significant subsidiaries thresholds under Rule 210.1-02 as modified by Rule 210.3-05(b) of SEC Reg. S-X. Under the equity method of accounting, the assets acquired and liabilities assumed were recorded at their estimated fair values as of the purchase date as follows:
| F-20 |
WESTERN CAPITAL RESOURCES, INC. AND SUBSIDIARIES
NOTES TO CONSOLIDATED FINANCIAL STATEMENTS
| June 1, 2015 | ||||
| Cash | $ | 389,000 | ||
| Inventory | 427,000 | |||
| Other receivables | 405,000 | |||
| Property and equipment | 612,000 | |||
| Goodwill | 578,000 | |||
| Intangible assets | 903,000 | |||
| Other assets | 69,000 | |||
| Accounts payable and accrued liabilities | (826,000 | ) | ||
| $ | 2,557,000 | |||
Direct to Consumer Segment
Effective July 1, 2015, the Company acquired a 100% interest in the businesses of RAI, JPPA, and JPRE, by completing a merger and contribution transaction. In consideration for the acquisition of these businesses, the Company issued to the former owners an aggregate of 3.5 million shares of the Company’s common stock representing approximately 37% of the total issued and outstanding common stock after consummation of the acquisition.
The entities are affiliated entities under common control and in accordance with Accounting Standards Codification Topic 805, “Business Combinations,” and the Company, as the acquirer, recognized the assets and liabilities of the target entities at their historical values as of the date of merger as follows:
| July 1, 2015 | ||||
| Cash | $ | 2,082,000 | ||
| Accounts Receivables, net | 527,000 | |||
| Inventory | 3,170,000 | |||
| Deferred income tax asset | 186,000 | |||
| Prepaid expense and other current assets | 525,000 | |||
| Property and equipment, net | 6,590,000 | |||
| Goodwill | 31,000 | |||
| Intangible assets, net | 122,000 | |||
| Accounts payable and accrued liabilities | (2,231,000 | ) | ||
| Short-term notes payable | (120,000 | ) | ||
| Income taxes payable | (547,000 | ) | ||
| Deferred revenue and other | (460,000 | ) | ||
| Notes payable and capital leases | (3,583,000 | ) | ||
| Deferred income tax liability | (169,000 | ) | ||
| $ | 6,123,000 | |||
Franchise Segment
Effective October 1, 2014, we acquired a 99.2% interest in the business of AlphaGraphics, Inc., a Delaware corporation, through a merger transaction governed by an Agreement and Plan of Merger dated August 29, 2014 (the “Merger Agreement”). As contemplated under the Merger Agreement, we issued an aggregate of 2,986,823 shares of our common stock, representing approximately 49.8% of our total issued and outstanding common stock immediately after the merger, to BC Alpha Holdings I, LLC, a Delaware limited liability company that had earlier owned the AlphaGraphics business.
| F-21 |
WESTERN CAPITAL RESOURCES, INC. AND SUBSIDIARIES
NOTES TO CONSOLIDATED FINANCIAL STATEMENTS
The entities are affiliated entities under common control and in accordance with Accounting Standards Codification Topic 805, “Business Combinations,” and Western Capital, as the acquirer, recognized the assets and liabilities of the AlphaGraphics entities at their historical values as of the date of merger as follows:
| October 1, 2014 | ||||
| Cash | $ | 168,000 | ||
| Receivables | 1,227,000 | |||
| Property and equipment | 374,000 | |||
| Intangible assets | 7,016,000 | |||
| Note receivable | 636,000 | |||
| Other assets | 453,000 | |||
| Accounts payable and accrued liabilities | (2,493,000 | ) | ||
| Other liabilities | (506,000 | ) | ||
| Note and lease obligations | (4,084,000 | ) | ||
| Deferred tax liability | (2,434,000 | ) | ||
| 357,000 | ||||
| Noncontrolling interests | (7,000 | ) | ||
| $ | 350,000 | |||
The results of the operations for the acquired business have been included in the consolidated financial statements since the date of the acquisition. The following table presents the unaudited pro forma results of operations for the year ended December 31, 2015 and 2014 (in thousands), as if the acquisitions had been consummated at the beginning of 2014. The pro forma net income below excludes the expense of the transactions. The pro forma results of operations are prepared for comparative purposes only and do not necessarily reflect the results that would have occurred had the acquisition occurred at the beginning of the 2014 or the results which may occur in the future.
| F-22 |
WESTERN CAPITAL RESOURCES, INC. AND SUBSIDIARIES
NOTES TO CONSOLIDATED FINANCIAL STATEMENTS
| Franchise | Cellular Retail | Direct to Consumer | Consumer Finance | Corporate | Total | |||||||||||||||||||
| Year Ended December 31, 2015 | ||||||||||||||||||||||||
| Pro forma revenue | $ | 13,025 | $ | 37,823 | $ | 42,738 | $ | 12,699 | $ | - | $ | 106,285 | ||||||||||||
| % of total pro forma revenue | 12.3 | % | 35.6 | % | 40.2 | % | 11.9 | % | 0.00 | % | 100.0 | % | ||||||||||||
| Pro forma net income | $ | 2,270 | $ | 1,167 | $ | 2,177 | $ | 952 | $ | (736 | ) | $ | 5,830 | |||||||||||
| Pro forma net income attributable to noncontrolling interests | $ | 17 | $ | - | $ | - | $ | - | $ | - | $ | 17 | ||||||||||||
| Pro forma net income attributable to WCR common shareholders | $ | 2,253 | $ | 1,167 | $ | 2,177 | $ | 952 | $ | (736 | ) | $ | 5,813 | |||||||||||
| Pro forma earnings per share attributable to WCR common shareholders – basic and diluted | $ | 0.237 | $ | 0.123 | $ | 0.229 | $ | 0.100 | $ | (0.077 | ) | $ | 0.612 | |||||||||||
| Year Ended December 31, 2014 | ||||||||||||||||||||||||
| Pro forma revenue | $ | 12,215 | $ | 36,033 | $ | 43,622 | $ | 12,877 | $ | - | $ | 104,747 | ||||||||||||
| % of total pro forma revenue | 11.7 | % | 34.4 | % | 41.6 | % | 12.3 | % | 0.00 | % | 100.0 | % | ||||||||||||
| Pro forma net income | $ | 1,554 | $ | 930 | $ | 1,427 | $ | 1,274 | $ | - | $ | 5,185 | ||||||||||||
| Pro forma net income attributable to noncontrolling interests | $ | 13 | $ | - | $ | - | $ | - | $ | - | $ | 13 | ||||||||||||
| Pro forma net income attributable to WCR common shareholders | $ | 1,541 | $ | 930 | $ | 1,427 | $ | 1,274 | $ | - | $ | 5,172 | ||||||||||||
| Pro forma earnings per share attributable to WCR common shareholders – basic and diluted | $ | 0.162 | $ | 0.098 | $ | 0.150 | $ | 0.134 | $ | - | $ | 0.544 | ||||||||||||
| F-23 |
WESTERN CAPITAL RESOURCES, INC. AND SUBSIDIARIES
NOTES TO CONSOLIDATED FINANCIAL STATEMENTS
| 14. | Segment Information – |
The Company has grouped its operations into five segments – Franchise, Cellular Retail, Direct to Consumer, Consumer Finance and Corporate. The Direct to Consumer and Corporate segments were added in 2015. The Franchise segment offers franchise ownership opportunities for customized marketing solutions. The Cellular Retail segment is a dealer for Cricket Wireless selling cellular phones and accessories, ancillary services and serving as a payment center for customers. The “Direct to Consumer” segment, which consists of an online and direct marketing distribution retailer with product offerings including seeds, live goods and garden accessories operating in the retail market under Park Seed, Jackson & Perkins and Wayside Gardens, and in the wholesale market under Park Wholesale, and an online retail seller of home improvement and restoration products operating over the internet through the domain name of www.Vandykes.com and through direct mail catalogs. The Consumer Finance segment provides financial and ancillary services. The Corporate segment includes the parent company activities, inclusive of the acquisitions department and management of acquired subsidiaries.
Segment information related to the years ended December 31, 2015 and 2014:
December 31, 2015 (in thousands) | ||||||||||||||||||||||||
| Franchise | Cellular Retail | Direct to Consumer | Consumer Finance | Corporate | Total | |||||||||||||||||||
| Revenue from external customers | $ | 13,025 | $ | 32,846 | $ | 17,884 | $ | 12,699 | $ | - | $ | 76,454 | ||||||||||||
| Depreciation and amortization | $ | 441 | $ | 430 | $ | 214 | $ | 113 | $ | - | $ | 1,198 | ||||||||||||
| Interest expense | $ | 202 | $ | 284 | $ | 90 | $ | - | $ | - | $ | 576 | ||||||||||||
| Income tax expense (benefit) | $ | 1,373 | $ | 632 | $ | 207 | $ | 574 | $ | (304 | ) | $ | 2,482 | |||||||||||
| Net income (loss) | $ | 2,270 | $ | 1,110 | $ | 243 | $ | 952 | $ | (1,038 | ) | $ | 3,537 | |||||||||||
| Total segment assets | $ | 10,079 | $ | 14,180 | $ | 15,878 | $ | 15,511 | $ | 537 | $ | 56,185 | ||||||||||||
| Expenditures for segmented assets | $ | 113 | $ | 3,865 | $ | 304 | $ | 45 | $ | 14 | $ | 4,341 | ||||||||||||
December 31, 2014 (in thousands) | ||||||||||||||||||||||||
| Franchise | Cellular Retail | Direct to Consumer | Consumer Finance | Corporate | Total | |||||||||||||||||||
| Revenue from external customers | $ | 3,177 | $ | 24,706 | $ | - | $ | 12,877 | $ | - | $ | 40,760 | ||||||||||||
| Depreciation and amortization | $ | 112 | $ | 327 | $ | - | $ | 117 | $ | - | $ | 556 | ||||||||||||
| Interest expense | $ | 63 | $ | 191 | $ | - | $ | 62 | $ | - | $ | 316 | ||||||||||||
| Income tax expense (benefit) | $ | 441 | $ | 385 | $ | - | $ | 720 | $ | - | $ | 1,546 | ||||||||||||
| Net income (loss) | $ | 690 | $ | 584 | $ | - | $ | 1,137 | $ | - | $ | 2,411 | ||||||||||||
| Total segment assets | $ | 10,053 | $ | 9,777 | $ | - | $ | 16,932 | $ | - | $ | 36,762 | ||||||||||||
| Expenditures for segmented assets | $ | 16 | $ | 519 | $ | - | $ | 119 | $ | - | $ | 654 | ||||||||||||
| 15. | Commitments and Contingencies – |
Employment Agreements
On April 11, 2013, the Company entered into an Amended and Restated Employment Agreement with its Chief Executive Officer, Mr. John Quandahl, to be effective as of April 1, 2013. The amended and restated agreement has a term of three years and contains other terms and conditions that are identical to those of the original agreement which had expired. Specifically, the amended and restated agreement provides an annual base salary and eligibility for an annual performance-based cash bonus pool for management. The amended and restated agreement also contains customary non-solicitation and non-competition provisions as well as provisions for severance payments upon termination by the Company without cause or upon termination by Mr. Quandahl with good reason.
| F-24 |
WESTERN CAPITAL RESOURCES, INC. AND SUBSIDIARIES
NOTES TO CONSOLIDATED FINANCIAL STATEMENTS
Effective February 9, 2015, the Company entered into a three-year employment agreement with its Chief Investment Officer (CIO). Pursuant to that agreement, the CIO is eligible for a discretionary annual performance-based bonus up to $200,000. In connection with the employment agreement, the Company granted Mr. Donchev a stock option providing him with the ten-year right to purchase up to 65,000 shares of the Company’s common stock at an exercise price of $6.00 per share. The option vests in three annual and near-equal installments on each of February 8, 2016, 2017 and 2018. The stock option grant is evidenced by a stock option agreement entered into effective February 9, 2015. The option granted to Mr. Donchev was issued under the Company’s new 2015 Stock Incentive Plan approved by the Board of Directors effective February 6, 2015.
The Company has also entered into several employment agreements with certain members of subsidiary management. The terms of each agreement are different. However, one or all of these agreements include stipulated base salary and bonus potential. The agreement also contains customary non-solicitation and non-competition provisions as well as provisions for severance payments upon termination by the Company without cause.
Pursuant to the numerous employment agreements, bonuses of approximately $1,008,000 and $352,000 were accrued for the years ended December 31, 2015 and 2014, respectively.
Asset Purchase Agreement
On November 10, 2015, the PQH entered into an asset purchase agreement to acquire 10 additional Cricket retail stores for a cost of approximately $456,000. The acquisition of the Cricket locations and payment of the purchase price, net of a deposit paid in 2015, is expected to be completed January 2, 2016.
Vendor Service Agreement
In September 2015, AGI entered into a service agreement with a vendor for approximately $680,000. The vendor will provide services over a three year period.
Legal Proceedings
The Company is party to a variety of legal actions arising out of the normal course of business. Plaintiffs occasionally seek punitive or exemplary damages. The Company does not believe that such normal and routine litigation will have a material impact on its consolidated financial results.
At the time of the Company’s acquisition of AlphaGraphics, that subsidiary was party to litigation with an individual (plaintiff) who was the former CEO, member of its Board of Directors and franchisee owning two AlphaGraphics franchises. In November 2014, AlphaGraphics and the plaintiff entered into a settlement agreement pursuant to which the parties fully released each other and AlphaGraphics was paid a sum of $636,000 in settlement of certain other obligations that had been owed to it by the plaintiff.
| 16. | Management and Advisory Agreement – |
The Company is party to an Amended and Restated Management and Advisory Agreement with Blackstreet Capital Management, LLC, (“Blackstreet”) under which Blackstreet provides certain financial, managerial, strategic and operating advice and assistance to the Company.
The amended and restated agreement requires the Company to pay Blackstreet a fee in an amount equal to $400,000 upon the closing of an acquisition in consideration for Blackstreet’s referral to the Company of such acquisition opportunity, and Blackstreet’s assistance in the performance of due diligence services relating thereto. Any fees which may have been payable per these terms related to the AGI, JPPA, RAI and JPRE acquisitions (see Note 13) were waived by Blackstreet.
| F-25 |
WESTERN CAPITAL RESOURCES, INC. AND SUBSIDIARIES
NOTES TO CONSOLIDATED FINANCIAL STATEMENTS
Effective July 1, 2015 the agreement with Blackstreet was amended. The annual fees under the amended and restated contract will be the greater of (i) $612,100 (subject to annual increases of five percent) or (ii) five percent of Western Capital’s “EBITDA” as defined under the agreement. All other terms and provisions remain unmodified.
Finally, the amended and restated agreement provides that a termination fee will be paid to Blackstreet in the event that the Company terminates the agreement in connection with a sale of all or substantially all of the assets of the Company to, or any merger or other transaction with, an unaffiliated entity, which transaction results in the holders of a majority of the stock of the Company immediately prior to such transaction owning less than 50% of the stock of the Company (or any successor entity) after giving effect to the transaction.
The annual management and advisory fees related to the Amended and Restated Management and Advisory Agreement with Blackstreet for the years ended December 31, 2015 and 2014 were $478,082 and $416,369, respectively.
| 17. | Special Committee of the Board of Directors – |
The Board of Directors has appointed Mr. Ellery Roberts to various special committees of the board. Annual Director and special committee fees expense was $50,000 for the years ended December 31, 2015 and 2014.
| 18. | Related Party Transactions – |
Leases
The Company leases three properties from an officer of the Company and another party under operating leases, one that extends through October 2016, requiring monthly lease payments of $1,680, one that in month-to-month, requiring monthly lease payments of $1,200, and one that extends through November 2017, requiring monthly lease payments of $5,000.
In October 2012, the Company entered into the latter lease. The lease is for a term of five years and has monthly base rental payments of $5,000 per month. The lease is at terms substantially similar to other leases for property near that location. The lease transaction was approved by the Board of Directors and the related party abstained from voting. This property is used for a Cricket retail storefront.
On August 31 2011, the Company entered into two operating leases for property owned by Ladary, Inc. Ladary, which acquired the two properties in foreclosure sales, is a corporation partially owned by the Chief Executive Officer of the Company, three current or past directors and one employee of the management company that manages the Company’s largest shareholder. The new leases, one of which replaced an earlier lease that the Company had entered into with the prior landlord, have four-year terms, require aggregate monthly rental payments of $6,000, and are on terms and conditions substantially similar to those contained in the replaced leases.
Annual rent expense to related parties for the five retail locations for 2015 and 2014 was approximately $171,000 and $166,500, respectively.
Credit Facility
On December 7, 2012 (and later amended on March 21, 2014, September 30, 2014 and May 21, 2015), we entered in a borrowing arrangement with River City Equity, Inc. Under this arrangement, as amended, we may borrow up to $3.0 million at an interest rate of 12% per annum, with interest payable on a monthly basis. The note contains no prepayment penalties, and pursuant to the May 21, 2015 amendment, matures on June 30, 2016. The note, under certain circumstances, permits River City Equity to obtain a security interest in substantially all of our assets. As of December 31, 2015, $3.0 million was due and owing under this borrowing agreement.
| 19. | Subsequent Events – |
Cellular Retail Store Purchase
On January 2, 2016, PQH acquired Cricket retail store locations for approximately $456,000.
| F-26 |
WESTERN CAPITAL RESOURCES, INC. AND SUBSIDIARIES
NOTES TO CONSOLIDATED FINANCIAL STATEMENTS
Pending Reincorporation
On January 20, 2016, our shareholders approved a plan to reincorporate Western Capital Resources, Inc. in Delaware at a special meeting of the shareholders called for that purpose. Presently, we expect to consummate the reincorporation in April 2016.
| F-27 |
ITEM 9 CHANGES IN AND DISAGREEMENTS WITH ACCOUNTANTS ON ACCOUNTING AND FINANCIAL DISCLOSURE
None.
ITEM 9A CONTROLS AND PROCEDURES
EVALUATION OF DISCLOSURE CONTROLS AND PROCEDURES
We maintain disclosure controls and procedures designed to provide reasonable assurance that information required to be disclosed in our reports filed pursuant to the Securities Exchange Act of 1934 is recorded, processed, summarized and reported within the time periods specified in the SEC’s rules and forms, and that such information is accumulated and communicated to our management, including our Chief Executive Officer and Chief Financial Officer as appropriate, to allow timely decisions regarding required disclosure. A control system, no matter how well conceived and operated, can provide only reasonable, not absolute, assurance the objectives of the control system are met.
We utilize the Committee of Sponsoring Organization’s Internal Control – Integrated Framework, 2013 version, for the design, implementation and assessment of the effectiveness of our disclosure controls and procedures and internal control over financial reporting.
MANAGEMENT’S REPORT ON INTERNAL CONTROL OVER FINANCIAL REPORTING
Our management is responsible for establishing and maintaining adequate internal control over financial reporting. Internal control over financial reporting is a set of processes designed by, or under the supervision of, a company’s principal executive and principal financial officers, to provide reasonable assurance regarding the reliability of financial reporting and the preparation of financial statements for external purposes in accordance with GAAP and includes those policies and procedures that:
| · | pertain to the maintenance of records that in reasonable detail accurately and fairly reflect our transactions and dispositions of our assets |
| · | provide reasonable assurance our transactions are recorded as necessary to permit preparation of our financial statements in accordance with GAAP, and that receipts and expenditures are being made only in accordance with authorizations of our management and directors, and |
| · | provide reasonable assurance regarding prevention or timely detection of unauthorized acquisition, use or disposition of our assets that could have a material effect on the financial statement. |
Because of its inherent limitations, internal control over financial reporting may not prevent or detect misstatements. It should be noted that any system of internal control, however well designed and operated, can provide only reasonable, and not absolute, assurance that the objectives of the system will be met. Also, projections of any evaluation of effectiveness to future periods are subject to the risk that controls may become inadequate because of changes in conditions, or that the degree of compliance with the policies or procedures may deteriorate.
As of December 31, 2015, our Chief Executive Officer and Chief Financial Officer carried out an assessment of the effectiveness of our disclosure controls and procedures as such term is defined in Rule 13a-15(e) under the Securities and Exchange Act of 1934. We excluded our July 1, 2015 acquisition from our assessment because the period from acquisition to the date of management’s assessment resulted in an insufficient period of time to adequately implement and assess control effectiveness.
In our Quarterly Report on Form 10-Q for the period ended September 30, 2015, we identified the following three material weaknesses in internal control over financial reporting:
| · | Effective controls over the period-end financial reporting process with respect to journal entries and proper segregation of duties were not maintained. Journal entries, both recurring and nonrecurring, were not always accompanied by sufficient supporting documentation and were not adequately reviewed and approved for validity, completeness and accuracy. |
| · | Proper segregation of duties within the financial application were not maintained. In certain instances, persons responsible for financial reporting lacked restrictions to their access to ensure separation of functions involving custody of assets, authorization or approval of related transactions affecting those assets, and recording or reporting of related transactions were established and maintained. |
| · | Effective general computer controls to ensure proper change management policies and procedures existed and were followed for migration of updates and upgrades to our financial application or to maintain separate development, test and production environments were not implemented. |
A material weakness is a deficiency, or combination of deficiencies, in internal control over financial reporting, such that there is a reasonable possibility that a material misstatement of the annual or interim financial statements will not be prevented or detected on a timely basis.
Despite the remediation progress we have made, we were unable to conclude that the material weaknesses described in our Quarterly Report for the period ended September 30, 2015 were effectively remediated as of December 31, 2015, due to the fact that (i) less than the entire remediation plan has been implemented and (ii) the time period for remediation testing was insufficient to assess the effectiveness of those controls.
Based on its evaluation of the effectiveness of the design and operation of our internal control over financial reporting as of December 31, 2015, management has identified no new material weaknesses that would be in addition to those previously described in the Quarterly Report. Nevertheless, in light of the un-remediated material weakness in internal control over financial reporting that continued to exist as of December 31, 2015, management performed additional analysis and procedures, an independent review of certain transactions, and completed remedial actions prior to the filing of this annual report, we believe that the consolidated financial statements contained in this report present fairly, in all material respects, our financial position, results of operations, and cash flows as of the dates, and for the periods, presented in conformity with generally accepted accounting principles in the Unites States of America (“GAAP”). KLJ and Associates, LLP, an independent registered public accounting firm, is not required to issue, and thus has not issued, an attestation report on the Company’s internal control over financial reporting as of December 31, 2015.
34
CHANGES IN INTERNAL CONTROL OVER FINANCIAL REPORTING
There were no changes in our internal controls over financial reporting that occurred during the fiscal year covered by this report that materially affected, or were reasonably likely to materially affect such controls, except as described below.
We are still in the process of remediating our material weaknesses. However, to date, we have performed the following remediation steps:
| · | increased the oversight performed by our Chief Executive Officer and Chief Financial Officer at decentralized subsidiary locations; |
| · | providing additional oversight of the Company’s internal controls for newly acquired entities; |
| · | implemented separate test and production environments for our decentralized subsidiary’s financial application; |
| · | began development of corporate-wide information technology policies and procedures; |
| · | realigned job functions within the financial reporting process to ensure proper segregation of duties; and |
| · | began the design of role-based security within our financial reporting process and financial application to ensure proper segregation of duties is achieved; and |
| · | designed and implemented a formalized financial reporting process that includes properly prepared, supported and reviewed balance sheet reconciliations; properly prepared, supported and reviewed journal entries; properly segregated duties, and properly completed and approved financial close checklist and financial reporting calendar for our decentralized subsidiaries. |
None.
35
ITEM 10 DIRECTORS, EXECUTIVE OFFICERS AND CORPORATE GOVERNANCE
MANAGEMENT
Our Board of Directors consists of Lawrence Berger, Richard E. Miller, Ellery Roberts, Kevin Kuby and John Quandahl. The following table sets forth the name and position of each of our current directors and executive officers.
| Name | Age | Positions | ||
| John Quandahl | 49 | Chief Executive Officer, Chief Operating Officer and Director | ||
| Steve Irlbeck | 51 | Chief Financial Officer | ||
| Angel Donchev | 34 | Chief Investment Officer | ||
| Lawrence Berger | 44 | Director (Chairman) | ||
| Ellery Roberts | 45 | Director | ||
| Richard Miller | 69 | Director | ||
| Kevin Kuby | 47 | Director |
The biographies of the above-identified individuals are set forth below:
John Quandahl, the Company’s Chief Executive and Operating Officer, currently also serves as the President of Wyoming Financial Lenders, Inc., a position he has held since 2007. Mr. Quandahl served as the Company’s Interim Chief Financial Officer from January 1, 2008 to May 10, 2011. From 2005 until joining Wyoming Financial Lenders, Mr. Quandahl was the President of Houlton Enterprises, Inc., and prior to that served as that corporation’s Chief Operating Officer from 1999 until 2004. During his tenure at Wyoming Financial Lenders and Houlton Enterprises, Mr. Quandahl and the respective employers were based in Omaha, Nebraska. Mr. Quandahl was the controller as Silverstone Group, Inc., from 1993 until 1998, and before that began his career at the Nebraska Department of Revenue as a tax auditor in 1989. Mr. Quandahl is a certified public accountant (inactive) and earned a degree in accounting from the University of Nebraska - Lincoln. Mr. Quandahl served as Chief Operating Officer of Wyoming Financial Lenders prior to its merger with the Company has continued to serve as our Chief Operating Officer since that time. Effective January 1, 2009, Mr. Quandahl was appointed as our Chief Executive Officer and until May 2011, our interim Chief Financial Officer. Mr. Quandahl was appointed to the Board of Directors on March 9, 2009.
Steve Irlbeck was appointed the Company’s Chief Financial Officer in May 2011. Mr. Irlbeck joined the Company in January 2009 as the Company’s Senior Director of Accounting. From 1995 until 2008, Mr. Irlbeck was employed at Lutz & Company, PC, a public accounting and consulting firm in Omaha, Nebraska where he was a tax partner. Mr. Irlbeck is a certified public accountant (inactive) and earned a degree in accounting from Creighton University.
Angel Donchev joined the Company as its Chief Investment Officer in February 2015. From 2005 until February 2015, Mr. Donchev was employed by Blackstreet Capital Management, LLC, a Delaware limited liability company principally engaged in the management of private investments. Prior to Blackstreet, Mr. Donchev worked as a generalist in the Corporate Finance division of Stephens Inc., a middle market investment bank. Mr. Donchev has served as a director of AlphaGraphics, Inc. since February 2012, and currently also serves as a director of Swift Spinning, Inc. (a private company). Mr. Donchev was previously a director of the Company from March 31, 2010 until he resigned on October 1, 2014. Mr. Donchev has been involved in control buyouts of lower middle market companies with combined revenues in excess of $700 million over the past ten years. Mr. Donchev is a Harvard Business School alumnus and has a BBA in Business Honors and Finance from the McCombs School of Business at the University of Texas at Austin.
36
Lawrence Berger was appointed to the Board of Directors on October 1, 2014 at the direction of BC Alpha Holdings I, consistent with certain director-appointment rights granted to that company in the AlphaGraphics Merger Agreement.
Mr. Berger served as the Managing Director of Investments for Blackstreet Capital Management, LLC since 2006. Prior to joining Western Capital’s board, Mr. Berger participated in private equity investments in excess of $200 million of equity while working for The Washington Post Company from 1997 to 2000, Watergate Holdings from 2002 to 2003, and Ames Watson Capital, LLC from 2003 to 2006. In addition, from 1994 to 1996, Mr. Berger worked as an associate at Boston Consulting Group. Currently, Mr. Berger is Chairman of the Board of Distinctive Apparel, Inc. and serves on the Board of Directors of Pasta Pomodoro, Inc., and Bijoux Nouveau, Inc. Mr. Berger received a Bachelor of Science in Economics degree in 1994 from the Wharton School of the University of Pennsylvania and a Master of Business Administration in 2000 from the Wharton School of the University of Pennsylvania, where he was also a Price Fellow. Mr. Berger serves as Chairman of the Board.
Richard Miller is an independent business consultant. Previously, Mr. Miller was Chief Executive Officer of Pirelli Tire North America, a $120 million tire manufacturer, and Chief Executive Officer of Dunn Tire Corporation, a $25 million regional tire retailer. Prior experience also includes senior operating positions with Dunlop Tire. Mr. Miller has served as Executive Chairman of True Home Value, Inc., and currently serves as Chairman of Swisher, Inc. ― a private company to which Blackstreet Capital Management, LLC provides management and advisory services. Mr. Miller is a decorated former Marine Captain and holds a BA from Chapman College in California. Mr. Miller previously served as our Chairman of the Board.
Ellery Roberts was appointed by the Board of Directors to serve as a director on May 10, 2010. Mr. Roberts brings over 18 years of private equity investing experience to our company. Mr. Roberts has been the Chairman and Chief Executive Officer of 1847 Holdings LLC since its inception on January 22, 2013. Prior to the formation of 1847 Holdings LLC, Mr. Roberts served as the managing member of The 1847 Companies LLC, a buyer and operator of two lower-middle market businesses recapitalized in 2012. Prior to The 1847 Companies, LLC, Mr. Roberts was the co-founder and was co-managing principal from October 2009 to June 2011 of RW Capital Partners LLC, the recipient of a “Green Light” letter from the U.S. Small Business Administration (SBA). Mr. Roberts was a founding member of Parallel Investment Partners, LP (formerly SKM Growth Investors, LP), or Parallel, a Dallas-based private equity fund focused on re-capitalizations, buyouts and growth capital investments in lower middle market companies throughout the United States. During his tenure at Parallel, Mr. Roberts held the position of Managing Director from January 2004 to September 2009, Vice President from January 2003 to December 2003 and Senior Associate from January 2000 to December 2002. Mr. Roberts was responsible for approximately $400 million in invested capital across two funds. Also during his tenure with Parallel, Mr. Roberts sat on the boards of Environmental Lighting Concepts, Hat World Corporation, Senex Financial Corporation, Builders TradeSource Corporation, Action Sports, Weisman Discount Home Centers, Winnercom, Mealey’s Furniture, Regional Management Corporation, Marmalade Cafes, and Diesel Service and Supply (all of which are private companies). Prior to Parallel, Mr. Roberts was a Vice President with Lazard Group LLC (NYSE: LAZ), or Lazard, from July 1997 to December 2000. While at Lazard, he focused on and also gained experience in the home building, health care, retail, industrial and lodging sectors. Prior to joining Lazard in 1997, Mr. Roberts was a Senior Financial Analyst with Colony Capital, Inc. from July 1995 to June 1996, where he analyzed and executed transactions for Colony Investors II, L.P., a $625 million private equity fund. Prior to that, he was a Financial Analyst with the Corporate Finance Division of Smith Barney Inc. (now known as Morgan Stanley Smith Barney LLC) from January 1994 to June 1995 where he participated in a wide variety of investment banking activities. During his career Mr. Roberts has been directly involved with over $3.0 billion in direct private equity investments. Mr. Roberts received his B.A. degree in English from Stanford University.
Kevin Kuby was appointed to the Board of Directors on July 1, 2015 at the direction of BC Alpha Holdings I, consistent with certain director-appointment rights granted to that company in the AlphaGraphics Merger Agreement. Mr. Kuby is and has been since 2012 a Managing Director in Restructuring at Blackstreet Capital Management, LLC. Mr. Kuby has worked in the turnaround and restructuring industry for over 17 years. He has worked across a wide variety of industries developing and implementing restructuring strategies for financially distressed clients. Prior to joining Blackstreet Capital, from 2008 to 2012, Mr. Kuby worked for Alvarez & Marsal in their restructuring practice, where he held various positions including Managing Director. Mr. Kuby also previously worked for FTI Consulting from 2002 to 2008, most recently as Senior Managing Director, and for PricewaterhouseCoopers in their business restructuring practice from 1998 to 2002, most recently as Director. Mr. Kuby received an MBA from the University of Chicago and a B.A. in Economics from the University of Illinois – Urbana / Champaign.
Under our corporate bylaws, all of our directors serve for indefinite terms expiring upon the next annual meeting of our shareholders.
37
When considering whether directors and nominees have the experience, qualifications, attributes and skills to enable the Board of Directors to satisfy its oversight responsibilities effectively in light of the Company’s business and structure, the Board of Directors focuses primarily on the industry and transactional experience, and other background, in addition to any unique skills or attributes associated with a director. With regard to Mr. Quandahl, the Board of Directors considered his significant experience, expertise and background with regard to accounting, financial and tax matters, his particular experience with the payday lending industry as well as retail operations, and his demonstrated experience and skills in managing and evaluating the coordination and integration of the Company’s two principal operating segments. With regard to Mr. Miller, the Board of Directors considered his leadership experience as well as his background and experience in retail operations. With regards to Mr. Roberts, the Board of Directors considered his extensive experience in finance and capital structures, his prior board leadership experience as well as his prior experience in retail operations. With regards to Mr. Berger, the Board of Directors considered his diverse board experience and his particular experience with equity investments and acquisitions.
FAMILY RELATIONSHIPS
The Board of Directors has affirmatively determined that there are no familial relationships among any of our officers or directors.
INVOLVEMENT IN CERTAIN LEGAL PROCEEDINGS
During the past ten years, no officer, director, control person or promoter of the Company has been:
| · | involved in any petition under the federal bankruptcy laws or any state insolvency law that was filed by or against, or a receiver, fiscal agent or similar officer appointed by a court for the business or property of such person, or any partnership in which he was a general partner at or within two years, or any corporation or business association of which he was an executive officer at or within two years within the date of this report; |
| · | convicted in a criminal proceeding or named subject of a pending criminal proceeding (excluding traffic violations and other minor offenses); |
| · | the subject of any order, judgment, or decree, not subsequently reversed, suspended or vacated, of any court of competent jurisdiction, permanently or temporarily enjoining him from, or otherwise limiting, the following activities: (1) acting as a futures commission merchant, introducing broker, commodity trading advisor, commodity pool operator, floor broker, leverage transaction merchant, any other person regulated by the Commodity Futures Trading Commission, or an associated person of any of the foregoing, or as an investment adviser, underwriter, broker or dealer in securities, or as an affiliated person, director or employee of any investment company, bank, savings and loan association or insurance company, or engaging in or continuing any conduct or practice in connection with such activity; (2) engaging in any type of business practice; or (3) engaging in any activity in connection with the purchase or sale of any security or commodity or in connection with any violation of federal or state securities laws or federal commodities laws; |
| · | the subject of any order, judgment or decree, not subsequently reversed, suspended or vacated, of any federal or state authority barring, suspending or otherwise limiting for more than 60 days the right of such person to engage in any activity described in paragraph (f)(3)(i) of this section, or to be associated with persons engaged in any such activity; |
| · | found by a court of competent jurisdiction in a civil action or by the SEC to have violated any federal or state securities law, and the judgment in such civil action or finding by the SEC has not been subsequently reversed, suspended, or vacated; |
| · | found by a court of competent jurisdiction in a civil action or by the Commodity Futures Trading Commission to have violated any federal commodities law, and the judgment in such civil action or finding by the Commodity Futures Trading Commission has not been subsequently reversed, suspended or vacated; |
| · | the subject of, or a party to, any federal or state judicial or administrative order, judgment, decree, or finding, not subsequently reversed, suspended or vacated, relating to an alleged violation of: (1) any federal or state securities or commodities law or regulation; or (2) any law or regulation respecting financial institutions or insurance companies including, but not limited to, a temporary or permanent injunction, order of disgorgement or restitution, civil money penalty or temporary or permanent cease-and-desist order, or removal or prohibition order; or (3) any law or regulation prohibiting mail or wire fraud or fraud in connection with any business entity; or |
38
| · | the subject of, or a party to, any sanction or order, not subsequently reversed, suspended or vacated, of any self-regulatory organization (as defined in Section 3(a)(26) of the Exchange Act (15 U.S.C. 78c(a)(26))), any registered entity (as defined in Section 1(a)(29) of the Commodity Exchange Act (7 U.S.C. 1(a)(29))), or any equivalent exchange, association, entity or organization that has disciplinary authority over its members or persons associated with a member. |
AUDIT COMMITTEE FINANCIAL EXPERT
The Board of Directors has determined that at least one member of the Audit Committee, Mr. Ellery Roberts, is an “audit committee financial expert” as that term is defined in Regulation S-K promulgated under the Exchange Act. Mr. Robert’s relevant experience is detailed in Item 10 above. As noted above, Mr. Roberts qualifies as an “independent director,” as such term is defined in Section 5605(a)(2) of the Nasdaq listing rules, and meets the criteria for independence set forth in Rule 10A-3(b)(1) under the Exchange Act. The Board of Directors has determined that each of the Audit Committee members is able to read and understand fundamental financial statements and that at least one member of the Audit Committee has past employment experience in finance or accounting.
CODE OF ETHICS
We have adopted a Code of Ethics which governs the conduct of our officers, directors and employees in order to promote honesty, integrity, loyalty and the accuracy of our financial statements. Our Code of Ethics was amended and restated effective as of August 4, 2015, and a copy of that amended and restated Code of Ethics is filed as an exhibit to this report. You may obtain a copy of the Code of Ethics without charge by writing us and requesting a copy, attention: John Quandahl, 11550 “I” Street, Omaha, Nebraska 68137. You may also request a copy by calling us at (402) 551-8888.
COMPLIANCE WITH SECTION 16(A) OF THE EXCHANGE ACT
Section 16(a) of the Securities Exchange Act of 1934 requires our officers, directors and persons considered to be beneficial owners of more than ten percent of a registered class of our equity securities to file reports of ownership and changes in ownership with the SEC and Nasdaq. Officers, directors and greater-than-ten-percent shareholders are required by SEC regulations to furnish us with copies of all Section 16(a) forms they file. Based solely on review of the copies of Forms 3 and 4 and amendments thereto furnished to the Company during the fiscal year ended December 31, 2015, and Forms 5 and amendments thereto furnished to the Company with respect to such fiscal year, or written representations that no Forms 5 were required, the Company believes that the following is the list of its officers, directors and greater than ten percent beneficial owners who have failed to file on a timely basis all Section 16(a) filing requirements during the fiscal year ended December 31, 2015: Lawrence Berger had 2 late reports and 3 transactions filed late and Kevin Kuby had 1 late report.
ITEM 11 EXECUTIVE COMPENSATION
SUMMARY COMPENSATION TABLE
The following table sets forth the cash and non-cash compensation for awarded to or earned by: (i) each individual who served as the principal executive officer and principal financial officer of Western Capital during the year ended December 31, 2014; and (ii) each other individual that served as an executive officer of Western Capital at the conclusion of the year ended December 31, 2015 and who received more than $100,000 in the form of salary and bonus during such fiscal year. For purposes of this report, these individuals are collectively referred to as our “named executives.”
| Name and Principal Position | Salary | Bonus | Total | |||||||||||
| John Quandahl (1) | 2015 | $ | 246,000 | $ | 84,500 | $ | 330,500 | |||||||
| Pres. and Chief Executive Officer | 2014 | $ | 246,000 | $ | 81,000 | $ | 327,000 | |||||||
| Steve Irlbeck (2) | 2015 | $ | 225,000 | $ | 84,500 | $ | 309,500 | |||||||
| Chief Financial Officer | 2014 | $ | 165,000 | $ | 81,000 | $ | 246,000 | |||||||
| (1) | Mr. Quandahl is our President and Chief Executive Officer. Mr. Quandahl also serves as our Chief Operating Officer, a position he has held since November 29, 2007. Mr. Quandahl became our President and Chief Executive Officer on January 1, 2009. From January 1, 2009 through May 10, 2011, Mr. Quandahl also served as interim our Chief Financial Officer. |
| (2) | Mr. Irlbeck is our Chief Financial Officer, a position he has held since May 10, 2011. Prior to May 10, 2011, Mr. Irlbeck was our Senior Director of Accounting. |
39
We had no outstanding equity awards as of December 31, 2015 for any named executives.
EMPLOYMENT AND CHANGE-IN-CONTROL AGREEMENTS
We do not currently have change-in-control agreements with any named executives or any other current members of our executive management.
On April 11, 2013, we entered into an Amended and Restated Employment Agreement with our Chief Executive Officer, Mr. John Quandahl, to be effective as of April 1, 2013. The amended and restated agreement has a term of three years and contains other terms and conditions that are identical to those of the original agreement which had expired. Specifically, the amended and restated agreement provides an annual base salary and eligibility for an annual performance-based cash bonus pool for management. The amended and restated agreement also contains customary non-solicitation and non-competition provisions as well as provisions for severance payments upon termination by the Company without cause or upon termination by Mr. Quandahl with good reason.
Effective February 9, 2015, the Company entered into a three-year employment agreement with Mr. Angel Donchev. Under the agreement, Mr. Donchev will serve as the Company’s “Chief Investment Officer” charged with managing the Company’s acquisition strategy and acquisition efforts. In that role, Mr. Donchev will earn a base salary of $235,000, and be eligible for a discretionary annual performance-based cash bonus targeted at $200,000. The employment agreement also contains other customary terms and conditions respecting company property, confidential information, early termination for cause, and early termination without cause, by either party, upon at least 30 days prior written notice. In connection with the employment agreement, the Company granted Mr. Donchev a stock option providing him with the ten-year right to purchase up to 65,000 shares of the Company’s common stock at an exercise price of $6.00 per share. The option vests in three annual and near-equal installments on each of February 8, 2016, 2017 and 2018. The stock option grant is evidenced by a stock option agreement entered into effective February 9, 2015. The option granted to Mr. Donchev was issued under the Company’s new 2015 Stock Incentive Plan approved by the Board of Directors effective February 6, 2015.
COMPENSATION OF DIRECTORS
| Name and Principal Position | Compensation | Other Annual Compensation | Total | |||||||||||
| Richard Miller (1) | 2015 | $ | - | $ | 100,000 | 100,000 | ||||||||
| 2014 | $ | - | $ | 100,000 | $ | 100,000 | ||||||||
| Ellery Roberts (2) | 2015 | $ | 50,000 | $ | - | $ | 50,000 | |||||||
| Director | 2014 | $ | 50,000 | $ | - | $ | 50,000 | |||||||
| Angel Donchev (3) | 2015 | $ | - | $ | - | $ | - | |||||||
| Director | 2014 | $ | - | $ | - | $ | - | |||||||
| Thomas Ripley (4) | 2015 | $ | - | $ | - | $ | - | |||||||
| Director | 2014 | $ | 8,000 | $ | - | $ | 8,000 | |||||||
| Gay A. Burke (5) | 2015 | $ | - | $ | - | $ | - | |||||||
| Director | 2014 | $ | - | $ | - | $ | - | |||||||
| Lawrence Berger (6) | 2015 | $ | - | $ | - | $ | - | |||||||
| 2014 | $ | - | $ | - | $ | - | ||||||||
| Kevin Kuby (7) | 2015 | $ | - | $ | - | $ | - | |||||||
| Director | 2014 | $ | - | $ | - | $ | - | |||||||
| (1) | Mr. Miller provides management consulting services to the Company in addition to his services as a director of the Board. In accordance with the consulting agreement, his compensation is $100,000 per year. |
| (2) | Mr. Roberts served on a special committee of the Board of Directors. In connection with this service, the Board of Directors approved the payment of compensation to Mr. Roberts in the amount of $50,000 for years 2015 and 2014. |
| (3) | Mr. Donchev resigned from the Board of Directors effective October 1, 2014. |
| (4) | Mr. Ripley resigned from the Board of Directors effective October 1, 2014. |
| (5) | Ms. Burke resigned from the Board of Directors effective July 1, 2015. |
| (6) | Mr. Berger was appointed to the Board of Directors effective October 1, 2014 and is the Chairman of the Board. |
| (7) | Mr. Kuby was appointed to the Board of Directors effective July 1, 2015. |
40
ITEM 12 SECURITY OWNERSHIP OF CERTAIN BENEFICIAL OWNERS AND MANAGEMENT AND RELATED SHAREHOLDER MATTERS
As of the close of business on March 30, 2016, we had outstanding 9,497,534 shares of common stock. Each share of capital stock is currently entitled to one vote on all matters put to a vote of our shareholders. The following table sets forth the number of common shares, and percentage of outstanding common shares, beneficially owned as of March 30, 2016, by:
| · | each person known by the Company to be the beneficial owner of more than five percent of the Company’s outstanding common stock |
| · | each current director |
| · | each executive officer of the Company and other persons identified as a named executive in ITEM 11 above, and |
| · | all current executive officers and directors as a group. |
Unless otherwise indicated, the address of each of the following persons is 11550 “I” Street, Omaha, Nebraska 68137, and each such person has sole voting and investment power with respect to the shares set forth opposite his, her or its name.
| Name and Address | Common Shares Beneficially Owned (1) | Percentage of Common Shares (1) | ||||||
| Richard Miller | 84,166 | * | % | |||||
| Ellery Roberts | - | - | % | |||||
| Lawrence Berger (2) | 5,437 | * | % | |||||
| Kevin Kuby | - | - | % | |||||
| John Quandahl | 10,000 | * | % | |||||
| Steve Irlbeck | 10,000 | * | % | |||||
| Angel Donchev | 7,445 | * | % | |||||
| All current executive officers and directors as a group (3) | 117,048 | 1.23 | % | |||||
WCR, LLC (4) c/o Blackstreet Capital Management, LLC 5425 Wisconsin Avenue Suite #701 Chevy Chase, MD 20815 | 4,117,509 | 43.35 | % | |||||
BC Alpha Holdings I, LLC (5) c/o Blackstreet Capital Management, LLC 5425 Wisconsin Avenue Suite #701 Chevy Chase, MD 20815 | 3,167,513 | 33.35 | % | |||||
* less than one percent.
| (1) | Beneficial ownership is determined in accordance with the rules of the SEC, and includes general voting power and/or investment power with respect to securities. Shares of common stock issuable upon exercise of options or warrants that are currently exercisable or exercisable within 60 days of the record rate, and shares of common stock issuable upon conversion of other securities currently convertible or convertible within 60 days, are deemed outstanding for computing the beneficial ownership percentage of the person holding such securities but are not deemed outstanding for computing the beneficial ownership percentage of any other person. Under the applicable SEC rules, each person’s beneficial ownership is calculated by dividing the total number of shares with respect to which they possess beneficial ownership by the total number of outstanding shares of the Company. In any case where an individual has beneficial ownership over securities that are not outstanding, but are issuable upon the exercise of options or warrants or similar rights within the next 60 days, that same number of shares is added to the denominator in the calculation described above. Because the calculation of each person’s beneficial ownership set forth in the “Percentage of Common Shares” column of the table may include shares that are not presently outstanding, the sum total of the percentages set forth in such column may exceed 100%. |
41
| (2) | Includes 2,287 common shares held by Blue Jays Investment 2, LLC, a Delaware limited liability company to which Mr. Berger is a member and manager and taken from Mr. Berger’s most recent filing under §13 of the Securities Exchange Act of 1934, filed on July 14, 2015. |
| (3) | Consists of Messrs. Miller, Roberts, Berger, Kuby, Quandahl, Irlbeck and Donchev. |
| (4) | Share figures contained in the table are taken from WCR, LLC’s most recent filing under §13 of the Securities Exchange Act of 1934, filed on August 10, 2015. |
| (5) | Share figures contained in the table are taken from BC Alpha Holdings I, LLC’s most recent filing under §13 of the Securities Exchange Act of 1934, filed on August 10, 2015. |
ITEM 13 CERTAIN RELATIONSHIPS AND RELATED TRANSACTIONS AND DIRECTOR INDEPENDENCE
CERTAIN RELATIONSHIPS AND TRANSACTIONS
On October 18, 2011 (and later amended on December 7, 2012, March 21, 2014 and May 21, 2015), we entered in a borrowing arrangement with River City Equity, Inc. Under this arrangement, as amended, we may borrow up to $3.0 million at an interest rate of 12% per annum, with interest payable on a monthly basis. The note contains no prepayment penalties, and pursuant to the May 21, 2015 amendment, matures on June 30, 2016. The note, under certain circumstances, permits River City Equity to obtain a security interest in substantially all of our assets. As of December 31, 2015, $3.0 million was due and owing under this borrowing agreement.
After the initial advancement from River City Equity under the borrowing arrangement, a family member of the Company’s Chief Executive Officer obtained an ownership interest in River City Equity. Since such time, there have been additional advances of funds under the borrowing arrangement. The Board of Directors has been apprized of the fact that, subsequent to the transactions creating the arrangement with River City Equity, that entity has become a “related party” under applicable SEC disclosure rules. We may in the future seek further advances from the remaining amount available under the borrowing arrangement. In any such case, advances will be approved in the manner required under the board’s related-party transaction policy discussed below.
RELATED-PARTY TRANSACTION POLICY
The Board of Directors has adopted a written Conflict of Interest and Related Party Transaction Policy. That policy governs the approval of all related-party transactions, subject only to certain customary exceptions (e.g., compensation, certain charitable donations, transactions made available to all employees generally, etc.). The policy contains a minimum dollar threshold of $5,000.
The entire Board of Directors administers the policy and approves any related-party transactions. At each calendar year’s first regularly scheduled meeting, management discloses any known related-party transactions to be entered into by the Company for that calendar year, including the proposed aggregate value of such transactions if applicable. After full disclosure of all material facts, review and discussion, the board votes whether to approve the proposed transactions. If a related-party transaction will be ongoing, the board may establish guidelines for management to follow in its ongoing dealings with the related party. However, management is generally required to update the board as to any material change to the related-party transactions approved at the first calendar year meeting.
In the event management recommends any related-party transactions after the first calendar year meeting, such transactions are generally presented to the board for approval in advance, or preliminarily entered into by management subject to ratification by the board. If ratification is not obtained, management must make all reasonable efforts to cancel or annul such transaction.
Procedurally, no director is allowed vote in any approval of a related-party transaction for which he or she is the related party, except that such a director may otherwise participate in a related discussion and shall provide to the board all material information concerning the related-party transaction and the director’s interest therein.
42
DIRECTOR INDEPENDENCE
The Company does not have a standing nominating committee. Instead, the entire Board of Directors shares the responsibility of identifying potential director-nominees to serve on the Board of Directors.
The Board of Directors does have a standing Compensation Committee and Audit Committee. The Compensation Committee is composed of Mr. Roberts. The Audit Committee is composed of Mr. Roberts. The Board of Directors has determined that only Mr. Roberts is “independent,” as such term is defined in Section 5605(a)(2) of the Nasdaq listing rules, and meets the criteria for independence set forth in Rule 10A-3(b)(1) under the Exchange Act. The preceding disclosure respecting director independence is required under applicable SEC rules. However, as a corporation whose shares are listed for trading on the OTCQB, we are not required to have any independent directors at all on its Board of Directors, or any independent directors serving on any particular committees of the Board of Directors.
ITEM 14 PRINCIPAL ACCOUNTANT FEES AND SERVICES
The following table summarizes the fees we were billed for audit and non-audit services rendered for fiscal years 2015 and 2014. Our principal accountant, KLJ and Associates, LLP, reviewed our quarterly filings and audited the Company’s consolidated financial statements for the years 2015 and 2014.
| 2015 | 2014 | |||||||
| Audit Fees | $ | 125,000 | $ | 71,500 | ||||
| Audit-Related Fees | - | - | ||||||
| Tax Fees | - | - | ||||||
| All Other Fees | - | - | ||||||
| Total | $ | 125,000 | $ | 71,500 | ||||
KLJ and Associates, LLP did not perform any other tax-related or other services for fees during fiscal 2015 and 2014.
Audit Fees. The fees identified under this caption were for professional fees rendered in connection with the audit of our annual consolidated financial statements, review of our quarterly condensed consolidated financial statements and statutory and regulatory filings and engagements for the years identified.
Approval Policy. Our Audit Committee approves in advance all services provided by our independent registered public accounting firm. All engagements of our independent registered public accounting firms in years ended 2015 and 2014 were pre-approved by the Audit Committee.
43
ITEM 15 EXHIBITS AND FINANCIAL STATEMENT SCHEDULES
Financial Statements
| Item | Page | |
| Report of Independent Registered Public Accounting Firm on Consolidated Financial Statements | F-1 | |
| Consolidated Balance Sheets – December 31, 2015 and December 31, 2014 | F-3 | |
| Consolidated Statements of Income – Years ended December 31, 2015 and December 31, 2014 | F-4 | |
| Consolidated Statement of Shareholders’ Equity – Years ended December 31, 2015 and December 31, 2014 | F-5 | |
| Consolidated Statements of Cash Flows – Years ended December 31, 2015 and December 31, 2014 | F-6 | |
| Notes to Consolidated Financial Statements | F-7 |
EXHIBITS
| Exhibit No. | Description | |
| 2.1 | Agreement and Plan of Merger by and among the registrant, WCRS Acquisition Co., LLC, and BC Alpha Holdings II, LLC, dated August 29, 2014 (incorporated by reference to the registrant’s current report on Form 8-K filed on September 5, 2014). | |
| 2.2 | Merger and Contribution Agreement with Restorers Acquisition, Inc., J&P Park Acquisitions, Inc., and J&P Real Estate, LLC, and certain other parties, dated June 9, 2015 (incorporated by reference to Exhibit 10.3 to the registrant’s quarterly report on Form 10-Q filed on August 14, 2015). | |
| 3.1 | Amended and Restated Articles of Incorporation, filed with the Minnesota Secretary of State on May 25, 2007 (incorporated by reference to the registrant’s annual report on Form 10-K filed on April 7, 2008) (see also Exhibits 3.2 through 3.6 below). | |
| 3.2 | Amendment to Amended and Restated Articles of Incorporation, filed with the Minnesota Secretary of State on December 27, 2007 (incorporated by reference to the registrant’s annual report on Form 10-K filed on April 7, 2008). | |
| 3.3 | Certificate of Designation for Series A Convertible Preferred Stock (incorporated by reference to the registrant’s current report on Form 8-K filed on January 7, 2008). | |
| 3.4 | Amendment to Articles of Incorporation, filed with the Minnesota Secretary of State on March 18, 2008 (incorporated by reference to the registrant’s annual report on Form 10-K filed on April 7, 2008). | |
| 3.5 | Amendment to Articles of Incorporation, filed with the Minnesota Secretary of State on July 29, 2008 (incorporated by reference to the registrant’s current report on Form 8-K filed on July 29, 2008). | |
| 3.6 | Amendment to Articles of Incorporation, filed with the Minnesota Secretary of State on March 30, 2010 (incorporated by reference to the registrant’s current report on Form 8-K filed on April 2, 2010). | |
| 3.7 | Amendment to Articles of Incorporation, filed with the Minnesota Secretary of State on June 23, 2014 (incorporated by reference to the registrant’s quarterly report on Form 10-Q filed on August 12, 2014). | |
| 3.8 | Amended and Restated Bylaws (incorporated by reference to Exhibit 3.1 to the registrant’s current report on Form 8-K filed on June 23, 2008). | |
| 3.9 | Amendment to Amended and Restated Bylaws dated May 30, 2014 (incorporated by reference to the registrant’s quarterly report on Form 10-Q filed on August 12, 2014). | |
| 10.1 | 2015 Stock Incentive Plan (incorporated by reference to the registrant’s current report on Form 8-K filed on February 9, 2015). | |
| 10.2 | Form of Stock Option Agreement for use with 2015 Stock Incentive Plan (incorporated by reference to the registrant’s current report on Form 8-K filed on February 9, 2015). |
44
| 10.3 | Promissory Note delivered in favor of River City Equity, Inc. dated as of October 18, 2011 (incorporated by reference to Exhibit 10.11 to registrant’s annual report on Form 10-K filed on March 30, 2012). | |
| 10.4 | Security Agreement delivered in favor of River City Equity, Inc. dated as of October 18, 2011 (incorporated by reference to Exhibit 10.12 to registrant’s annual report on Form 10-K filed on March 30, 2012). | |
| 10.5 | Consulting Agreement with Ric Miller Consulting, Inc. dated as of April 1, 2010 (incorporated by reference to Exhibit 10.17 to registrant’s annual report on Form 10-K filed on March 30, 2012). | |
| 10.6 | Amended and Restated Employment Agreement with John Quandahl dated as of April 1, 2013 (incorporated by reference to Exhibit 10.1 to the registrant’s quarterly report on Form 10-Q filed on May 14, 2013). | |
| 10.7 | Amended and Restated Management and advisory Agreement with Blackstreet Capital Management, LLC, dated June 21, 2012 (incorporated by reference to Exhibit 10.3 to registrant’s quarterly report on Form 10-Q filed on August 14, 2012.). | |
| 10.8 | First Amendment to Amended and Restated Management and advisory Agreement with Blackstreet Capital Management, LLC, dated October 1, 2014 (incorporated by reference to Exhibit 10.12 to registrant’s annual report on Form 10-K filed on March 31, 2015). | |
| 10.9 | Second Amendment to Amended and Restated Management and Advisory Agreement with Blackstreet Capital Management, LLC, dated July 1, 2015 (filed herewith). | |
| 10.10 | Employment Agreement with Angel Donchev dated as of February 9, 2015 (incorporated by reference to the registrant’s current report on Form 8-K filed on February 9, 2015). | |
| 14 | Code of Ethics (amended and restated as of March 30, 2012) (incorporated by reference to Exhibit 14 to registrant's annual report on form 10-K filed on March 31, 2015). | |
| 21 | List of Subsidiaries (filed herewith). | |
| 31.1 | Certification pursuant to Section 302 of the Sarbanes Oxley Act of 2002 (filed herewith). | |
| 31.2 | Certification pursuant to Section 302 of the Sarbanes Oxley Act of 2002 (filed herewith). | |
| 32 | Certification pursuant to Section 1350, as adopted pursuant to Section 906 of the Sarbanes-Oxley Act of 2002 (filed herewith). | |
| 101.INS | XBRL Instance Document (filed herewith). | |
| 101.SCH | XBRL Schema Document (filed herewith). | |
| 101.CAL | XBRL Calculation Linkbase Document (filed herewith). | |
| 101.DEF | XBRL Definition Linkbase Document (filed herewith). | |
| 101.LAB | XBRL Label Linkbase Document (filed herewith). | |
| 101.PRE | XBRL Presentation Linkbase Document (filed herewith). |
45
Pursuant to the requirements of Section 13 or 15(d) of the Securities Exchange Act of 1934, the registrant has duly caused this report to be signed on its behalf by the undersigned, thereunto duly authorized.
| Western Capital Resources, Inc. | |||
| /s/ John Quandahl | 3/30/16 | ||
| John Quandahl | |||
| Chief Executive Officer | |||
| /s/ Steve Irlbeck | 3/30/16 | ||
| Steve Irlbeck | |||
| Chief Financial Officer |
Pursuant to the requirements of the Securities Exchange Act of 1934, this report has been signed below by the following persons on behalf of the registrant and in the capacities and on the dates indicated.
| /s/ John Quandahl | 3/30/16 | /s/ Lawrence Berger | 3/30/16 | |
John Quandahl, Director, Chief Executive Officer, Chief Operating Officer |
Lawrence Berger, Director (Chairman) |
|||
| /s/ Ellery Roberts | 3/30/16 | |||
| Ellery Roberts, Director | ||||
| /s/ Steve Irlbeck | 3/30/16 | /s/ Kevin Kuby | 3/30/16 | |
Steve Irlbeck, Chief Financial Officer (principal financial officer and principal accounting |
Kevin Kuby, Director | |||
| /s/ Richard Miller | 3/30/16 | |||
| Richard Miller, Director |
46