Attached files
| file | filename |
|---|---|
| EX-32.1 - EXHIBIT 32-1 - WESTERN CAPITAL RESOURCES, INC. | s103160_ex32-1.htm |
| EX-31.2 - EXHIBIT 31-2 - WESTERN CAPITAL RESOURCES, INC. | s103160_ex31-2.htm |
| EX-31.1 - EXHIBIT 31-1 - WESTERN CAPITAL RESOURCES, INC. | s103160_ex31-1.htm |
SECURITIES AND EXCHANGE COMMISSION
Washington, D.C. 20549
Form 10-Q
| x | Quarterly report pursuant to Section 13 or 15(d) of the Securities Exchange Act of 1934 |
For the quarterly period ended March 31, 2016
| ¨ | Transition report pursuant to Section 13 or 15(d) of the Securities Exchange Act of 1934 |
Commission File Number: 000-52015
Western Capital Resources, Inc.
(Exact Name of Registrant as Specified in its Charter)
| Minnesota | 47-0848102 | |
| (State or Other Jurisdiction of Incorporation or Organization) | (I.R.S. Employer Identification Number) |
11550 “I” Street, Suite 150, Omaha, Nebraska 68137
(Address of Principal Executive Offices) (Zip Code)
Registrant’s telephone number, including area code: (402) 551-8888
N/A
(Former name, former address and former fiscal year, if changed since last report)
Check whether the issuer (1) filed all reports required to be filed by Section 13 or 15(d) of the Securities Exchange Act of 1934 during the past 12 months (or for such shorter period that the registrant was required to file such reports), and (2) has been subject to such filing requirements for the past 90 days. Yes þ No ¨
Indicate by check mark whether the registrant has submitted electronically and posted on its corporate website, if any, every Interactive Data File required to be submitted and posted pursuant to Rule 405 of Regulation S-T (§232.405 of this chapter) during the preceding 12 months (or for such shorter period that the registrant was required to submit and post such files). Yes þ No ¨
Indicate by check mark whether the registrant is a large accelerated filer, an accelerated filer, a non-accelerated filer, or a smaller reporting company. See definitions of “large accelerated filer,” “accelerated filer,” and “smaller reporting company” in Rule 12b-2 of the Exchange Act (check one):
| Large accelerated filer ¨ | Accelerated filer ¨ |
| Non-accelerated filer ¨ | Smaller reporting company þ |
Indicate by check mark whether the registrant is a shell company (as defined in Rule 12b-2 of the Exchange Act).
Yes ¨ No þ
APPLICABLE ONLY TO CORPORATE ISSUERS
As of May 16, 2016, the registrant had outstanding 9,497,534 shares of common stock, no par value per share.
Western Capital Resources, Inc.
Index
2
WESTERN CAPITAL RESOURCES, INC. AND SUBSIDIARIES
CONTENTS
3
WESTERN CAPITAL RESOURCES, INC. AND SUBSIDIARIES
CONDENSED CONSOLIDATED BALANCE SHEETS
March 31, 2016 (Unaudited) | December 31, 2015 | |||||||
| ASSETS | ||||||||
| CURRENT ASSETS | ||||||||
| Cash | $ | 6,306,070 | $ | 7,847,669 | ||||
| Loans receivable (less allowance for losses of $955,000 and $1,177,000, respectively) | 3,945,775 | 4,884,438 | ||||||
| Accounts receivable (less allowance for losses of $137,000 and $272,000, respectively) | 3,452,444 | 1,963,192 | ||||||
| Inventory | 8,531,043 | 7,617,850 | ||||||
| Prepaid expenses and other | 2,394,513 | 2,589,749 | ||||||
| TOTAL CURRENT ASSETS | 24,629,845 | 24,902,898 | ||||||
| PROPERTY AND EQUIPMENT, net | 9,183,776 | 8,561,321 | ||||||
| GOODWILL | 13,355,591 | 13,355,591 | ||||||
| INTANGIBLE ASSETS, net | 7,877,628 | 8,018,616 | ||||||
| OTHER | 404,580 | 783,907 | ||||||
| TOTAL ASSETS | $ | 55,451,420 | $ | 55,622,333 | ||||
| LIABILITIES AND EQUITY | ||||||||
| CURRENT LIABILITIES | ||||||||
| Accounts payable | $ | 4,386,505 | $ | 4,577,118 | ||||
| Accrued expenses and other liabilities | 5,535,076 | 6,232,267 | ||||||
| Income taxes payable | 475,473 | 1,135,031 | ||||||
| Current portion long-term debt | 1,233,338 | 4,900,008 | ||||||
| Current portion capital lease obligations | 79,256 | 23,860 | ||||||
| Deferred revenue and other | 1,650,477 | 1,796,338 | ||||||
| TOTAL CURRENT LIABILITIES | 13,360,125 | 18,664,622 | ||||||
| LONG-TERM LIABILITIES | ||||||||
| Notes payable, net of current portion | 5,788,120 | 3,096,452 | ||||||
| Capital lease obligations, net of current portion | 137,251 | 33,347 | ||||||
| Deferred income taxes | 4,233,000 | 3,889,000 | ||||||
| Other | 77,760 | 80,403 | ||||||
| TOTAL LONG-TERM LIABILITIES | 10,236,131 | 7,099,202 | ||||||
| TOTAL LIABILITIES | 23,596,256 | 25,763,824 | ||||||
| COMMITMENTS AND CONTINGENCIES (Note 11) | ||||||||
| EQUITY | ||||||||
| WESTERN SHAREHOLDERS’ EQUITY | ||||||||
| Common stock, no par value, 12,500,000 shares authorized, 9,497,534 issued and outstanding. | - | - | ||||||
| Additional paid-in capital | 28,955,463 | 28,934,392 | ||||||
| Retained earnings | 2,869,437 | 898,038 | ||||||
| TOTAL WESTERN SHAREHOLDERS’ EQUITY | 31,824,900 | 29,832,430 | ||||||
| NONCONTROLLING INTERESTS | 30,264 | 26,079 | ||||||
| TOTAL EQUITY | 31,855,164 | 29,858,509 | ||||||
| TOTAL LIABILITIES AND EQUITY | $ | 55,451,420 | $ | 55,622,333 | ||||
See notes to condensed consolidated financial statements
4
WESTERN CAPITAL RESOURCES, INC. AND SUBSIDIARIES
CONDENSED CONSOLIDATED STATEMENTS OF INCOME (unaudited)
| Three Months Ended | ||||||||
| March 31, 2016 | March 31, 2015 | |||||||
| REVENUES | ||||||||
| Sales and associated fees | $ | 20,015,542 | $ | 7,505,748 | ||||
| Financing fees and interest | 2,484,220 | 2,585,394 | ||||||
| Royalty and franchise fees, net | 2,794,756 | 2,705,157 | ||||||
| Other revenue | 3,140,768 | 1,645,532 | ||||||
| 28,435,286 | 14,441,831 | |||||||
| COST OF REVENUES | ||||||||
| Cost of sales | 10,356,860 | 4,508,255 | ||||||
| Provisions for loans receivable losses | 302,872 | 326,210 | ||||||
| Other | 553,414 | 195,678 | ||||||
| 11,213,146 | 5,030,143 | |||||||
| GROSS PROFIT | 17,222,140 | 9,411,688 | ||||||
| OPERATING EXPENSES | ||||||||
| Salaries, wages and benefits | 6,748,950 | 4,216,114 | ||||||
| Occupancy | 1,973,805 | 1,307,229 | ||||||
| Advertising, marketing and development | 1,951,009 | 256,495 | ||||||
| Depreciation | 276,592 | 104,082 | ||||||
| Amortization | 140,990 | 103,840 | ||||||
| Other | 2,820,251 | 1,941,221 | ||||||
| 13,911,597 | 7,928,981 | |||||||
| OPERATING INCOME | 3,310,543 | 1,482,707 | ||||||
| OTHER INCOME (EXPENSES): | ||||||||
| Interest income | 1,052 | 1,354 | ||||||
| Interest expense | (169,011 | ) | (105,975 | ) | ||||
| (167,959 | ) | (104,621 | ) | |||||
| INCOME BEFORE INCOME TAXES | 3,142,584 | 1,378,086 | ||||||
| INCOME TAX EXPENSE | 1,167,000 | 539,650 | ||||||
| NET INCOME | 1,975,584 | 838,436 | ||||||
| Less net income attributable to noncontrolling interests | (4,185 | ) | (2,377 | ) | ||||
| NET INCOME ATTRIBUTABLE TO WESTERN COMMON SHAREHOLDERS | $ | 1,971,399 | $ | 836,059 | ||||
| EARNINGS PER SHARE ATTRIBUTABLE TO WESTERN COMMON SHAREHOLDERS | ||||||||
| Basic and diluted | $ | 0.21 | $ | 0.14 | ||||
| WEIGHTED AVERAGE COMMON SHARES OUTSTANDING | ||||||||
| Basic and diluted | 9,497,534 | 5,997,588 | ||||||
See notes to condensed consolidated financial statements
5
WESTERN CAPITAL RESOURCES, INC. AND SUBSIDIARIES
CONDENSED CONSOLIDATED STATEMENTS OF CASH FLOWS (unaudited)
| Three Months Ended | ||||||||
| March 31, 2016 | March 31, 2015 | |||||||
| OPERATING ACTIVITIES | ||||||||
| Net Income | $ | 1,975,584 | $ | 838,436 | ||||
| Adjustments to reconcile net income to net cash provided by operating activities: | ||||||||
| Depreciation | 276,592 | 104,082 | ||||||
| Amortization | 140,990 | 103,840 | ||||||
| Share based compensation | 21,071 | - | ||||||
| Deferred income taxes | 344,000 | 101,000 | ||||||
| Changes in operating assets and liabilities: | ||||||||
| Loans receivable | 938,663 | 1,227,529 | ||||||
| Accounts receivable | (1,489,252 | ) | (99,266 | ) | ||||
| Inventory | (913,193 | ) | 49,824 | |||||
| Prepaid expenses and other assets | 574,563 | (190,461 | ) | |||||
| Accounts payable and accrued liabilities | (1,547,364 | ) | (1,187,214 | ) | ||||
| Deferred revenue and other current liabilities | (145,861 | ) | 7,178 | |||||
| Accrued liabilities and other | (2,643 | ) | 4,188 | |||||
| Net cash provided by operating activities | 173,150 | 959,136 | ||||||
| INVESTING ACTIVITIES | ||||||||
| Purchases of property and equipment | (432,211 | ) | (70,646 | ) | ||||
| Acquisition of stores, net of cash acquired | (466,836 | ) | (440,000 | ) | ||||
| Net cash used by investing activities | (899,047 | ) | (510,646 | ) | ||||
| FINANCING ACTIVITIES | ||||||||
| Payments on notes payable – long-term, net | (975,002 | ) | (1,375,000 | ) | ||||
| Proceeds from (payments on) capital leases, net | 159,300 | (10,797 | ) | |||||
| Net cash used by financing activities | (815,702 | ) | (1,385,797 | ) | ||||
| NET DECREASE IN CASH | (1,541,599 | ) | (937,307 | ) | ||||
| CASH | ||||||||
| Beginning of period | 7,847,669 | 4,273,350 | ||||||
| End of period | $ | 6,306,070 | $ | 3,336,043 | ||||
| SUPPLEMENTAL DISCLOSURE OF CASH FLOW INFORMATION | ||||||||
| Income taxes paid | $ | 1,483,301 | $ | 1,133,458 | ||||
| Interest paid | $ | 166,131 | $ | 114,523 | ||||
| Noncash investing and financing activities: | ||||||||
| Deposit applied to purchase of intangibles | $ | - | $ | 50,000 | ||||
See notes to condensed consolidated financial statements.
6
WESTERN CAPITAL RESOURCES, INC. AND SUBSIDIARIES
NOTES TO CONDENSED CONSOLIDATED FINANCIAL STATEMENTS
| 1. | Basis of Presentation, Nature of Business and Summary of Significant Accounting Policies – |
Basis of Presentation
The accompanying unaudited condensed consolidated financial statements have been prepared according to the instructions to Form 10-Q and Section 210.8-03(b) of Regulation S-X of the Securities and Exchange Commission (SEC) and, therefore, certain information and footnote disclosures normally included in financial statements prepared in accordance with accounting principles generally accepted in the United States of America (“GAAP”) have been omitted.
In the opinion of management, all adjustments (consisting of normal recurring accruals) considered necessary for a fair presentation have been included. Operating results for the three-month period ended March 31, 2016 are not necessarily indicative of the results that may be expected for the year ending December 31, 2016.
For further information, refer to the Condensed Consolidated Financial Statements and footnotes thereto included in our Form 10-K for the year ended December 31, 2015. The condensed consolidated balance sheet at December 31, 2015, has been derived from the audited consolidated financial statements at that date, but does not include all of the information and footnotes required by GAAP.
Nature of Business
Western Capital Resources, Inc. (WCR) is a parent company owning operating subsidiaries, with percentage owned shown parenthetically, as summarized below
| · | Franchise |
| o | AlphaGraphics, Inc. (AGI) (99.2%) – franchisor of 257 domestic and 26 international AlphaGraphics Business Centers which specialize in the planning, production and management of visual communications for businesses and individuals throughout the world. |
| · | Cellular Retail |
| o | PQH Wireless, Inc. and subsidiaries (PQH) (100%) – owns and operates 111 cellular retail stores as an exclusive dealer of the Cricket brand. |
| · | Direct to Consumer |
| o | J & P Park Acquisitions, Inc. (JPPA) (100% – Acquired July 1, 2015) – an online and direct marketing distribution retailer of live plants, seeds, holiday gifts and garden accessories selling its products under Park Seed, Jackson & Perkins, and Wayside Gardens brand names as well as a wholesaler under the Park Wholesale brand. |
| o | Restorers Acquisition, Inc. (RAI) (100% – Acquired July 1, 2015) – an online and direct marketing distribution retailer of home improvement and restoration products operating under Van Dyke’s Restorers. |
| o | J & P Real Estate, LLC (JPRE) (100% – Acquired July 1, 2015) – owns real estate utilized as JPPA’s distribution and warehouse facility and the corporate offices of JPPA and RAI. |
| · | Consumer Finance |
| o | Wyoming Financial Lenders, Inc. (WFL) (100%) – owns and operates “payday” stores 46 in eight states (Colorado, Iowa, Kansas, Nebraska, North Dakota, South Dakota, Wisconsin and Wyoming) providing sub-prime short-term uncollateralized non-recourse “cash advance” or “payday” loans typically ranging from $100 to $500 with a maturity of generally two to four weeks, sub-prime short-term uncollateralized non-recourse installment loans typically ranging from $300 to $800 with a maturity of six months, check cashing and other money services to individuals. |
| o | Express Pawn, Inc. (EPI) (100%) – owns and operates retail three pawn stores in Nebraska and Iowa providing collateralized non-recourse pawn loans and retail sales of merchandise obtained from forfeited pawn loans or purchased from customers. |
References in these financial statement notes to “Company” or “we” refer to Western Capital Resources, Inc. and its subsidiaries. References to specific companies within our enterprise, such “AGI,” “PQH,” “JPPA,” “RAI,” “JPRE,” “WFL” or “EPI” are references only to those companies.
7
Basis of Consolidation
The consolidated financial statements include the accounts of the WCR, its wholly owned subsidiaries and other entities in which the Company owns a controlling financial interest. For financial interests in which the Company owns a controlling financial interest, the Company applies the provisions of ASC 810 applicable to reporting the equity and net income or loss attributable to noncontrolling interests. All significant intercompany balances and transactions of the Company have been eliminated in consolidation.
Use of Estimates
The preparation of condensed consolidated financial statements in conformity with accounting principles generally accepted in the United States of America requires management to make estimates and assumptions that may affect certain reported amounts and disclosures in the condensed consolidated financial statements and accompanying notes. Management bases its estimates on historical experience and on various other assumptions that are believed to be reasonable under the circumstances. Actual results could differ from those estimates. Significant management estimates relate to the notes and loans receivable allowance, carrying value and impairment of long-lived goodwill and intangible assets, inventory valuation and obsolescence, estimated useful lives of property and equipment, gift certificate and customer credits liability and deferred taxes and tax uncertainties.
Reclassifications
Certain Statement of Income reclassifications have been made in the presentation of our prior financial statements and accompanying notes to conform to the presentation as of and for the three months ended March 31, 2016.
Recent Accounting Pronouncements
In May 2014, the Financial Accounting Standards Board (FASB) issued a comprehensive new revenue recognition standard that will supersede nearly all existing revenue recognition guidance under US GAAP. This standard, including subsequent updates, is effective for annual and interim periods beginning after December 15, 2017. The Company is currently assessing the potential effects on our financial condition, results of operations and consolidated financial statements.
In November 2015, the Financial Accounting Standards Board (“FASB”) issued Accounting Standards Update (“ASU”) No. 2015-17, “Income Taxes (Topic 740): Balance Sheet Classification of Deferred Taxes” (“ASU 2015-17”). The standard requires that deferred tax assets and liabilities be classified as noncurrent on the balance sheet rather than being separated into current and noncurrent. ASU 2015-17 is effective for fiscal years, and interim periods within those years, beginning after December 15, 2016. Early adoption is permitted and the standard may be applied either retrospectively or on a prospective basis to all deferred tax assets and liabilities. The Company early adopted ASU 2015-17 during our first quarter of fiscal year 2016 on a retrospective basis. Accordingly, we reclassified the current deferred taxes to noncurrent on our December 31, 2015 Condensed Consolidated Balance Sheet, which decreased current deferred tax assets $0.56 million and decreased noncurrent deferred tax liabilities $0.56 million.
In February 2016, the Financial Accounting Standards Board (“FASB”) issued Accounting Standards Update (“ASU”) No. 2016-02, “Leases (Topic 842)” (“ASU 2016-02”). The standard requires recognizing lease assets and lease liabilities on the balance sheet and disclosing key information about leasing arrangements. ASU 2016-02 is effective for fiscal years, and interim periods within those years, beginning after December 15, 2018. Early adoption is permitted and the standard is to be applied using a modified retrospectively approach. The Company is currently evaluating the impact that ASU 2016-02 will have on our consolidated financial statements.
No other accounting pronouncements issued or effective during the fiscal quarter have had or are expected to have a material impact on our condensed consolidated financial statements.
| 2. | Risks Inherent in the Operating Environment – |
Regulatory
The Company’s Consumer Finance segment activities are highly regulated under numerous local, state, and federal laws, regulations and rules, which are subject to change. New laws, regulations or rules could be enacted or issued, interpretations of existing laws, regulations or rules may change and enforcement action by regulatory agencies may intensify. Over the past several years, consumer advocacy groups and certain media reports have advocated governmental and regulatory action to prohibit or severely restrict sub-prime lending activities of the kind conducted by the Company. The federal Consumer Financial Protection Bureau has indicated that it will use its authority to further regulate the payday industry and has been actively assessing significant penalties or seeking settlement payments.
Any adverse change in present local, state, and federal laws or regulations that govern or otherwise affect lending could result in the Consumer Finance segment’s curtailment or cessation of operations in certain or all jurisdictions or locations. Furthermore, any failure to comply with any applicable local, state or federal laws or regulations could result in fines, litigation, closure of one or more store locations or negative publicity. Any such change or failure would have a corresponding impact on the Company’s and segment’s results of operations and financial condition, primarily through a decrease in revenues resulting from the cessation or curtailment of operations, decrease in operating income through increased legal expenditures or fines, and could also negatively affect the Company’s general business prospects due to lost or decreased operating income or if negative publicity effects its ability to obtain additional financing as needed.
8
In addition, the passage of federal or state laws and regulations or changes in interpretations of them could, at any point, essentially prohibit the Consumer Finance segment from conducting its lending business in its current form. Any such legal or regulatory change would certainly have a material and adverse effect on the Company, its operating results, financial condition and prospects, and perhaps even the viability of the Consumer Finance segment.
| 3. | Loans Receivable – |
At March 31, 2016 and December 31, 2015, the Company’s outstanding loans receivable aging was as follows:
| March 31, 2016 | ||||||||||||||||
| Payday | Installment | Pawn & Title | Total | |||||||||||||
| Current | $ | 3,295,567 | $ | 205,095 | $ | 253,950 | $ | 3,754,612 | ||||||||
| 1-30 | 221,140 | 39,821 | - | 260,961 | ||||||||||||
| 31-60 | 162,501 | 24,866 | - | 187,367 | ||||||||||||
| 61-90 | 191,760 | 16,292 | - | 208,052 | ||||||||||||
| 91-120 | 162,082 | 5,769 | - | 167,851 | ||||||||||||
| 121-150 | 165,775 | 3,333 | - | 169,108 | ||||||||||||
| 151-180 | 151,528 | 1,296 | - | 152,824 | ||||||||||||
| 4,350,353 | 296,472 | 253,950 | 4,900,775 | |||||||||||||
| Less Allowance | (889,000 | ) | (66,000 | ) | - | (955,000 | ) | |||||||||
| $ | 3,461,353 | $ | 230,472 | $ | 253,950 | $ | 3,945,775 | |||||||||
| December 31, 2015 | ||||||||||||||||
| Payday | Installment | Pawn & Title | Total | |||||||||||||
| Current | $ | 4,065,706 | $ | 291,947 | $ | 286,514 | $ | 4,644,167 | ||||||||
| 1-30 | 332,217 | 43,179 | - | 375,396 | ||||||||||||
| 31-60 | 263,486 | 24,233 | - | 287,719 | ||||||||||||
| 61-90 | 199,526 | 16,293 | - | 215,819 | ||||||||||||
| 91-120 | 196,123 | 9,417 | - | 205,540 | ||||||||||||
| 121-150 | 160,386 | 4,985 | - | 165,371 | ||||||||||||
| 151-180 | 165,237 | 2,189 | - | 167,426 | ||||||||||||
| 5,382,681 | 392,243 | 286,514 | 6,061,438 | |||||||||||||
| Less Allowance | (1,081,000 | ) | (96,000 | ) | - | (1,177,000 | ) | |||||||||
| $ | 4,301,681 | $ | 296,243 | $ | 286,514 | $ | 4,884,438 | |||||||||
| 4. | Loans Receivable Allowance – |
As a result of the Company’s collection efforts, it historically writes off approximately 42% of returned payday items. Based on days past the check return date, write-offs of payday returned items historically have tracked at the following approximate percentages: 1 to 30 days – 42%; 31 to 60 days – 64%; 61 to 90 days – 83%; 91 to 120 days – 88%; 121 to 150 days – 91%; and 151 + days – 93%.
A rollforward of the Company’s loans receivable allowance is as follows:
Three Months Ended March 31, 2016 | Year Ended December 31, 2015 | |||||||
| Loans receivable allowance, beginning of period | $ | 1,177,000 | $ | 1,219,000 | ||||
| Provision for loan losses charged to expense | 302,872 | 1,904,893 | ||||||
| Charge-offs, net | (524,872 | ) | (1,946,893 | ) | ||||
| Loans receivable allowance, end of period | $ | 955,000 | $ | 1,177,000 | ||||
9
| 5. | Accounts Receivable – |
A breakdown of accounts receivables by segment as of March 31, 2016 and December 31, 2015 are as follows:
| March 31, 2016 | ||||||||||||||||
| Franchise | Cellular Retail | Direct to Consumer | Total | |||||||||||||
| Accounts receivable | $ | 1,444,791 | $ | 106,208 | $ | 2,038,445 | $ | 3,589,444 | ||||||||
| Less allowance | (100,000 | ) | - | (37,000 | ) | (137,000 | ) | |||||||||
| Net account receivable | $ | 1,344,791 | $ | 106,208 | $ | 2,001,445 | $ | 3,452,444 | ||||||||
| December 31, 2015 | ||||||||||||||||
| Franchise | Cellular Retail | Direct to Consumer | Total | |||||||||||||
| Accounts receivable | $ | 1,332,446 | $ | 148,346 | $ | 754,400 | $ | 2,235,192 | ||||||||
| Less allowance | (183,000 | ) | - | (89,000 | ) | (272,000 | ) | |||||||||
| Net account receivable | $ | 1,149,446 | $ | 148,346 | $ | 665,400 | $ | 1,963,192 | ||||||||
| 6. | Deferred Revenue and Other Liabilities – |
Deferred revenue and other liabilities consist of the following:
| March 31, 2016 | December 31, 2015 | |||||||
| Deferred financing fees | $ | 203,445 | $ | 285,452 | ||||
| Deferred franchise development fees | 350,634 | 264,000 | ||||||
| Merchandise credits and gift card liability | 939,069 | 1,127,470 | ||||||
| Other | 157,329 | 119,416 | ||||||
| Total | $ | 1,650,477 | $ | 1,796,338 | ||||
| 7. | Notes Payable – Long Term – |
| March 31, 2016 | December 31, 2015 | |||||||
| Note payable (with a credit limit of $3,000,000) to River City Equity, Inc., a related party, with interest payable monthly at 12% due June 30, 2016 and upon certain events can be collateralized by substantially all assets of WCR, excluding any equity interest in AGI | $ | 3,000,000 | $ | 3,000,000 | ||||
| Subsidiary note payable to a financial institution with quarterly principal payments of $375,000 plus interest at prime rate plus 2.5%, secured by the AGI’s assets, maturing March 2017 | 750,000 | 1,625,000 | ||||||
| Subsidiary note payable to a financial institution with monthly principal payment of $33,334 plus annual paydowns equal to JPRE’s net cash flow from operations due within 120 days of the calendar year end plus interest at LIBOR plus 3.5% (4% at March 31, 2016), secured by JPRE assets, maturing June 5, 2019 when remaining principal balance is due | 3,271,458 | 3,371,460 | ||||||
| Total | 7,021,458 | 7,996,460 | ||||||
| Less current maturities (see Note 12) | (1,233,338 | ) | (4,900,008 | ) | ||||
| $ | 5,788,120 | $ | 3,096,452 | |||||
Future minimum long-term principal payments are as follows, after giving effect of refinancing as further discussed in Note 12:
| Year | Amount | |||||
| 1 | $ | 1,233,338 | ||||
| 2 | 1,058,341 | |||||
| 3 | 1,058,341 | |||||
| 4 | 2,729,767 | |||||
| 5 | 658,333 | |||||
| Thereafter | 283,338 | |||||
| $ | 7,021,458 | |||||
10
| 8. | Other Operating Expense – |
A breakout of other operating expense is as follows:
| For the Three Months Ended March 31, | ||||||||
| 2016 | 2015 | |||||||
| Bank fees | $ | 438,034 | $ | 149,523 | ||||
| Collection costs | 116,188 | 111,319 | ||||||
| Conferences | 265,405 | 210,645 | ||||||
| Insurance | 171,563 | 82,795 | ||||||
| Management and advisory fees | 221,025 | 149,502 | ||||||
| Professional and consulting fees | 595,210 | 406,032 | ||||||
| Supplies | 183,274 | 170,514 | ||||||
| Other | 829,552 | 660,891 | ||||||
| $ | 2,820,251 | $ | 1,941,221 | |||||
| 9. | Pro Forma Information – |
Effective June 1, 2015, PQH purchased with cash all outstanding membership interests in four separate limited liability companies (Green Communications, LLC, an Arizona LLC, Green Communications, LLC, an Oregon LLC, Green Communications, LLC, a Washington LLC and Go Green, LLC an Arizona LLC). Effective July 1, 2015, the Company acquired a 100% interest in the businesses of RAI, JPPA, and JPRE, by completing a merger and contribution transaction.
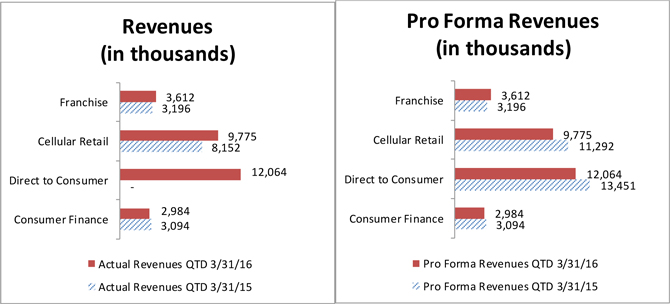
As further discussed in Note 13 of the December 31, 2015 Notes to Consolidated Financial Statements, the results of the operations for the acquired business have been included in the consolidated financial statements since the dates of the acquisition. The following table presents the unaudited results of operations for the three-months ended March 31, 2016 and the unaudited pro forma results of operations for the three-months ended March 31, 2015 (in thousands, except for per share data) as if the acquisitions had been consummated at the beginning of 2015. The pro forma net income below excludes the expense of the transactions. The pro forma results of operations are prepared for comparative purposes only and do not necessarily reflect the results that would have occurred had the acquisition occurred at the beginning of the 2015 or the results which may occur in the future.
11
| Franchise | Cellular Retail | Direct to Consumer | Consumer Finance | Corporate | Total | |||||||||||||||||||
| Three Months Ended March 31, 2016 | ||||||||||||||||||||||||
| Revenue | $ | 3,612 | $ | 9,775 | $ | 12,064 | $ | 2,984 | $ | - | $ | 28,435 | ||||||||||||
| % of total revenue | 12.7 | % | 34.4 | % | 42.4 | % | 10.5 | % | -% | 100.0 | % | |||||||||||||
| Net income | $ | 523 | $ | 371 | $ | 904 | $ | 312 | $ | (135 | ) | $ | 1,975 | |||||||||||
| Net income attributable to noncontrolling interests | $ | 4 | $ | - | $ | - | $ | - | $ | - | $ | 4 | ||||||||||||
| Net income attributable to WCR common shareholders | $ | 519 | $ | 371 | $ | 904 | $ | 312 | $ | (135 | ) | $ | 1,971 | |||||||||||
| Earnings per share attributable to WCR common shareholders – basic and diluted | $ | 0.055 | $ | 0.039 | $ | 0.095 | $ | 0.033 | $ | (0.014 | ) | $ | 0.208 | |||||||||||
| Three Months Ended March 31, 2015 | ||||||||||||||||||||||||
| Pro forma revenue | $ | 3,196 | $ | 11,292 | $ | 13,451 | $ | 3,094 | $ | - | $ | 31,033 | ||||||||||||
| % of total pro forma revenue | 10.3 | % | 36.4 | % | 43.3 | % | 10.0 | % | -% | 100.0 | % | |||||||||||||
| Pro forma net income | $ | 299 | $ | 392 | $ | 828 | $ | 286 | $ | (73 | ) | $ | 1,732 | |||||||||||
| Pro forma net income attributable to noncontrolling interests | $ | 2 | $ | - | $ | - | $ | - | $ | - | $ | 2 | ||||||||||||
| Pro forma net income attributable to WCR common shareholders | $ | 297 | $ | 392 | $ | 828 | $ | 286 | $ | (73 | ) | $ | 1,730 | |||||||||||
| Pro forma earnings per share attributable to WCR common shareholders – basic and diluted | $ | 0.031 | $ | 0.041 | $ | 0.087 | $ | 0.031 | $ | (0.008 | ) | $ | 0.182 | |||||||||||
12
| 10. | Segment Information – |
Segment information related to the three month period ended March 31, 2016 and 2015, is presented below:
March 31, 2016 (in thousands) | ||||||||||||||||||||||||
| Franchise |
Cellular | Direct to Consumer | Consumer Finance | Corporate | Total | |||||||||||||||||||
| Revenue from external customers | $ | 3,612 | $ | 9,775 | $ | 12,064 | $ | 2,984 | $ | - | $ | 28,435 | ||||||||||||
| Net income (loss) | $ | 523 | $ | 371 | $ | 904 | $ | 312 | $ | (135 | ) | $ | 1,975 | |||||||||||
| Total segment assets | $ | 9,481 | $ | 14,746 | $ | 16,779 | $ | 13,747 | $ | 698 | $ | 55,451 | ||||||||||||
March 31, 2015 (in thousands) | ||||||||||||||||||||||||
| Franchise | Cellular Retail | Direct to Consumer | Consumer Finance | Corporate | Total | |||||||||||||||||||
| Revenue from external customers | $ | 3,196 | $ | 8,152 | $ | - | $ | 3,094 | $ | - | $ | 14,442 | ||||||||||||
| Net income (loss) | $ | 299 | $ | 326 | $ | - | $ | 286 | $ | (73 | ) | $ | 838 | |||||||||||
| Total segment assets | $ | 9,909 | $ | 9,502 | $ | - | $ | 15,085 | $ | - | $ | 34,496 | ||||||||||||
| 11. | Commitments and Contingencies – |
Pursuant to the Company’s numerous employment agreements, bonuses of approximately $356,000 and $182,000 were accrued for the three-months ended March 31, 2016 and 2015, respectively.
| 12. | Subsequent Events – |
Credit Facility
On April 22, 2016, the Company entered into a Credit Agreement with a financial institution. The Credit Agreement provides the company with (i) a revolving credit facility in an aggregate amount of up to $3,000,000, having a maturity date of April 21, 2018, and (ii) an acquisition loan facility in an aggregate amount of up to $9,000,000, having a maturity date of April 21, 2018. Under the Credit Agreement, both the revolving credit facility and acquisition loan facility bear interest at a floating per annum rate equal to one-month LIBOR plus 3.50%, adjusted on a monthly basis. At closing, $3,500,000 was advanced under the acquisition loan replacing the $3,000,000 River City Equity debt and $500,000 of other term debt.
Certain company subsidiaries are guarantors of the company’s borrowings and obligations under the Credit Agreement. All borrowings under the Credit Agreement are secured by substantially all assets of the company and the guarantor subsidiaries.
The Credit Agreement requires the company to meet certain financial tests, including a leverage ratio and a fixed charge coverage ratio, as defined in the Credit Agreement. Subject to certain exceptions, the Credit Agreement contains covenants limiting the company’s ability to (or to permit the guarantor subsidiaries to) merge or consolidate with, or engage in a sale of substantially all assets to, any party, but the company or any guarantor subsidiary generally may nonetheless merge with another party if (i) the company or guarantor subsidiary is the entity surviving such merger, and (ii) immediately after giving effect to such merger, no default shall have occurred and be continuing under the Credit Agreement. Subject to certain exceptions, the Credit Agreement also contains covenants limiting the company’s ability to (or to permit the guarantor subsidiaries to) create liens on assets, incur additional indebtedness, make certain types of investments, and pay dividends or make certain other types of restricted payments, but the company may nonetheless pay dividends to its shareholders if (a) there are no outstanding loans or unpaid interest under the revolving credit facility, and (b) no default shall have occurred and be continuing under the Credit Agreement.
Reincorporation
On January 20, 2016, our shareholders approved a plan to reincorporate Western Capital Resources, Inc. in Delaware at a special meeting of the shareholders called for that purpose. The reincorporation was completed May 11, 2016.
13
Item 2. Management’s Discussion and Analysis of Financial Condition and Results of Operations
Forward-Looking Statements
Some of the statements made in this report are “forward-looking statements,” as that term is defined under Section 27A of the Securities Act and Section 21E of the Securities Exchange Act of 1934. These forward-looking statements are based upon our current expectations and projections about future events. Whenever used in this report, the words “believe,” “anticipate,” “intend,” “estimate,” “expect” and similar expressions, or the negative of such words and expressions, are intended to identify forward-looking statements, although not all forward-looking statements contain such words or expressions. The forward-looking statements in this report are primarily located in the material set forth under the heading “Management’s Discussion and Analysis of Financial Condition and Results of Operations” (Part I, Item 2), but may be found in other parts of this report as well. These forward-looking statements generally relate to our plans, objectives and expectations for future operations and are based upon management’s current estimates and projections of future results or trends. Although we believe that our plans and objectives reflected in or suggested by these forward-looking statements are reasonable, we may not achieve these plans or objectives. You should read this report completely and with the understanding that actual future results may be materially different from what we expect. We will not necessarily update forward-looking statements even though our situation may change in the future.
Specific factors that might cause actual results to differ from our expectations embodied in our forward-looking statements, or that might affect the value of the common stock, include but are not limited to:
| · | changes in local, state or federal laws and regulations governing lending practices, or changes in the interpretation of such laws and regulations; |
| · | litigation and regulatory actions directed toward us or the industries in which we operate, particularly in certain key states or nationally; |
| · | our need for additional financing; |
| · | unpredictability or uncertainty in financing markets which could impair our ability to grow our business through acquisitions; |
| · | changes in Cricket dealer compensation; |
| · | the impact on us, as a Cricket dealer, of the AT&T acquisition of the Cricket Wireless business; |
| · | failure of or disruption caused by a significant vendor; |
| · | outside factors that affect our ability to obtain product and fulfill orders; and |
| · | our ability to successfully operate or integrate recent or future business acquisitions. |
Other factors that could cause actual results to differ from those implied by the forward-looking statements in this report are more fully described in the “Risk Factors” section of our Annual Report on Form 10-K for the fiscal year ended December 31, 2015.
Industry data and other statistical information used in this report are based on independent publications, government publications, reports by market research firms or other published independent sources. Some data are also based on our good faith estimates, derived from our review of internal surveys and the independent sources listed above. Although we believe these sources are reliable, we have not independently verified the information.
OVERVIEW
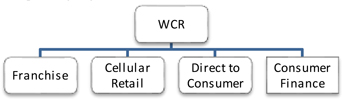
Western Capital Resources, Inc. (“WCR” or “Western Capital”) is a holding company having a controlling interest in subsidiaries operating in the following industries and operating segments:
14
Our “Franchise” segment is comprised of AlphaGraphics, Inc. (99.2% owned), the franchisor of AlphaGraphics® customized print and marketing solutions. Our “Cellular Retail” segment is comprised of an authorized Cricket Wireless dealer and involves the retail sale of cellular phones and accessories to consumers through our wholly owned subsidiary PQH Wireless, Inc. and its subsidiaries. Our “Direct to Consumer” segment consists of (1) a wholly owned online and direct marketing retailer and distributor of live plants, seeds, holiday gifts and garden accessories operating in the retail market under the Park Seed, Jackson & Perkins and Wayside Gardens trade names, and in the wholesale market under the Park Wholesale trade name, and (2) a wholly owned online and direct marketing distribution retailer of home improvement and restoration products operating as Van Dyke’s Restorers. Our “Consumer Finance” segment consists of retail financial services conducted through our wholly owned subsidiaries Wyoming Financial Lenders, Inc. and Express Pawn, Inc. Throughout this report, we collectively refer to WCR and its consolidated subsidiaries as “we,” the “Company,” and “us.”
Following is key actual and pro forma financial data for the three month period ended March 31, 2016 and 2015:
Discussion of Critical Accounting Policies
Our condensed consolidated financial statements and accompanying notes have been prepared in accordance with accounting principles generally accepted in the United States of America applied on a consistent basis. The preparation of these financial statements requires us to make a number of estimates and assumptions that affect the reported amounts of assets and liabilities, the disclosure of contingent assets and liabilities at the date of the financial statements, and the reported amounts of revenues and expenses during the reporting periods. We evaluate these estimates and assumptions on an ongoing basis. We base these estimates on the information currently available to us and on various other assumptions that we believe are reasonable under the circumstances. Actual results could vary materially from these estimates under different assumptions or conditions.
Our significant accounting policies are discussed in Note 1, “Basis of Presentation, Nature of Business and Summary of Significant Accounting Policies,” of the notes to our condensed consolidated financial statements included in this report. We believe that the following critical accounting policies affect the more significant estimates and assumptions used in the preparation of our condensed consolidated financial statements.
Loan Loss Allowance
Included in loans receivable are unpaid principal, interest and fee balances of payday, installment, pawn and title loans that have not reached their maturity date, and “late” payday loans that have reached maturity within the last 180 days and have remaining outstanding balances. Late payday loans generally are unpaid loans where a customer’s personal check has been deposited and the check has been returned due to non-sufficient funds in the customer’s account, a closed account, or other reasons. All returned items are charged-off after 180 days, as collections after that date have not been significant. Loans are carried at cost plus accrued interest or fees through maturity date, less payments made and a loans receivable allowance.
The Company does not specifically reserve for any individual payday, installment or title loan. The Company aggregates loan types for purposes of estimating the loss allowance using a methodology that analyzes historical portfolio statistics and management’s judgment regarding recent trends noted in the portfolio. This methodology takes into account several factors, including (1) the amount of loan principal, interest and fee outstanding, (2) historical charge offs from loans that originated during the last 24 months, (3) current and expected collection patterns and (4) current economic trends. The Company utilizes a software program to assist with the tracking of its historical portfolio statistics. A loan loss allowance is maintained for anticipated losses for payday and installment loans based primarily on our historical percentages by loan type of net charge offs, applied against the applicable balance of loan principal, interest and fees outstanding. The Company also periodically performs a look-back analysis on its loan loss allowance to verify the historical allowance established tracks with the actual subsequent loan write-offs and recoveries. The Company is aware that as conditions change, it may also need to make additional allowances in future periods. Loan losses or charge-offs of pawn or title loans are not recorded because the value of the collateral exceeds the loan amount. See Note 4 to our condensed consolidated financial statements included in this report for a rollforward of our loans receivable allowance.
15
Valuation of Long-lived and Intangible Assets
We assess the possibility of impairment of long-lived and intangible assets whenever events or changes in circumstances indicate that the carrying value may not be recoverable. Factors that could trigger an impairment review include significant underperformance relative to expected historical or projected future cash flows, significant changes in the manner of use of acquired assets or the strategy for the overall business, and significant negative industry events or trends. In addition, we conduct an annual goodwill impairment test as of October 1 each year. We assess our goodwill for impairment at the reporting unit level by applying a fair value test. This fair value test involves a two-step process. The first step is to compare the carrying value of our net assets to our fair value. If the fair value is determined to be less than the carrying value, a second step is performed to measure the amount of the impairment, if any.
Results of Operations – Three Months Ended March 31, 2016 Compared to Three Months Ended March 31, 2015
Net income attributable to our common shareholders was $1.97 million, or $0.21 per share (basic and diluted), for the three months ended March 31, 2016, compared to $.84 million, or $0.14 per share (basic and diluted), for the three months ended March 31, 2015. As further discussed below, each operating segment contributed to the increase in net income for the year over year period, but the most significant contribution to the increase is from the addition of our Direct to Consumer segment acquired on July 1, 2015, and thus there was no comparable net income included in prior year period results. Following is a discussion of operating results by segment.
We expect segment operating results and earnings per share to change throughout 2016 due, at least in part, to the seasonality of the Direct to Consumer and Cellular Retail segments and potential for mergers and acquisitions activity.
16
The following table provides quarter-over-quarter revenues and net income (in thousands) attributable to WCR common shareholders by operating segment:
| Franchise | Cellular Retail | Direct to Consumer | Consumer Finance | Corporate | Total | |||||||||||||||||||
| Three Months Ended March 31, 2016 | ||||||||||||||||||||||||
| Revenues | $ | 3,612 | $ | 9,775 | $ | 12,064 | $ | 2,984 | $ | - | $ | 28,435 | ||||||||||||
| % of total revenue | 12.7 | % | 34.4 | % | 42.4 | % | 10.5 | % | - | 100.0 | % | |||||||||||||
| Net income (loss) | $ | 523 | $ | 371 | $ | 904 | $ | 312 | $ | (135 | ) | $ | 1,975 | |||||||||||
| Net income (loss) attributable to WCR common shareholders | $ | 519 | $ | 371 | $ | 904 | $ | 312 | $ | (135 | ) | $ | 1,971 | |||||||||||
| Three Months Ended March 31, 2015 | ||||||||||||||||||||||||
| Revenues | $ | 3,196 | $ | 8,152 | $ | - | $ | 3,094 | $ | - | $ | 14,442 | ||||||||||||
| % of total revenue | 22.1 | % | 56.5 | % | - | 21.4 | % | - | 100.0 | % | ||||||||||||||
| Net income (loss) | $ | 299 | $ | 326 | $ | - | $ | 286 | $ | (73 | ) | $ | 838 | |||||||||||
| Net income (loss) attributable to WCR common shareholders | $ | 297 | $ | 326 | $ | - | $ | 286 | $ | (73 | ) | $ | 836 | |||||||||||
17
Franchise
The table below summarizes the number of AlphaGraphics business centers owned and operated by franchisees during the three-month period ended March 31, 2016 and 2015:
| Beginning | New | Closed | Ending | |||||||||||||
| 2016 | ||||||||||||||||
| US Centers | 254 | 4 | (1 | ) | 257 | |||||||||||
| International Centers | 25 | - | - | 25 | ||||||||||||
| Total | 279 | 4 | (1 | ) | 282 | |||||||||||
| 2015 | ||||||||||||||||
| US Centers | 242 | 5 | (2 | ) | 245 | |||||||||||
| International Centers | 32 | - | - | 32 | ||||||||||||
| Total | 274 | 5 | (2 | ) | 277 | |||||||||||
Our U.S. franchisees reported approximate center sales for the three-month period ended March 31 as follows:
| 2016 | 2015 | |||||||
| Total gross U.S. network-wide center sales | $ | 67,786,000 | $ | 63,864,000 | ||||
Revenues and net income for the three month period ended March 31, 2016 and 2015 were $3.61 million versus $3.20 million and $0.52 million versus $0.30 million, respectively. The revenue growth of 13% was attributable to a 6.5% increase in royalty and franchise development fee revenue with the balance earned from low margin services revenue. The revenue growth, net of direct costs and together with a reduction in operating costs period over period accounted for the segment net income increase to $0.52 million from $0.30 million in 2015.
Cellular Retail
A summary table of the number of Cricket cellular retail stores we operated during the three-month period ended March 31, 2016 and 2015 follows:
| 2016 | 2015 | |||||||
| Beginning | 99 | 61 | ||||||
| Acquired/ Launched | 14 | 7 | ||||||
| Closed | (2 | ) | - | |||||
| Ending | 111 | 68 | ||||||
As of the end of the comparable periods, we added a net of 43 locations, a store count growth of 63%. This resulted in period-over-period growth in revenue of 20%, growth in gross profit of 47%, growth in expenses of 50% and growth in net income of 13%. Phone sales revenue increased due to the additional location operated, but same store sales were down period over period. This was expected as prior period volume was positively influenced by customer migrations to Cricket Wireless’ new GSM network. An increase in customer fees and dealer commission revenue not related to phone activations, each with zero cost of sale associated with them, led to the gross profit growth percentage being greater than the sales growth percentage. Our expenses increased $1.79 million from $3.51 million for the three-month period ended March 31, 2015 to $5.30 million for the three-month period ended March 31, 2016, primarily due to the additional store locations.
Direct to Consumer
On July 1, 2015, we acquired our newest segment, Direct to Consumer. The Direct to Consumer segment has seasonal sources of revenue and historically experiences a greater proportion of annual net income in the quarter ending March 31 due to an uptick in sales of the seasonal products it sells (seeds and live goods). For the current quarter, the Direct to Consumer segment had net income of $0.90 million or $0.09 cents per share. Revenues for the three month period ended March 31, 2016 were $12.06 million and net income was $0.90 million compared to pro forma revenues and pro forma net income for the comparable period in 2015 of $13.45 million and $0.83 million, respectively. Wholesale seed sales increased period over period while sales of live plants was relatively flat and retails seed and restoration product sales decreased. The decrease in restoration product sales was expected as we refine product offerings and strategies, changes which have resulted in increased margins.
18
Consumer Finance
A summary table of the number of consumer finance locations we operated during the three-month period ended March 31, 2016 and 2015 follows:
| 2016 | 2015 | |||||||
| Beginning | 47 | 51 | ||||||
| Acquired/ Launched | - | - | ||||||
| Closed | - | - | ||||||
| Ending | 47 | 51 | ||||||
Our Consumer Finance segment revenues decreased slightly for the three months ended March 31, 2016 compared to the three month period ended March 31, 2015. Payday and installment lending revenue decreased period over period due to the sale of four stores on October 1, 2015. However, same store revenues from the remaining stores showed only a nominal decline period over period. Revenue from our three pawn store operations increased 6.9% period over period. Our cost of revenues, which is made up of pawn merchandise sales and net bad debt, decreased from $.52 million for the three months ended March 31, 2015 to $.51 million for the three months ended March 31, 2016 while operating expenses also decreased period over period, both a result of the few number of stores operated. Consumer finance contributions to net income increased to $0.31 million for the period compared to $0.29 in the comparable period.
Corporate
Costs related to our Corporate segment were $0.14 million for the three months ended March 31, 2016 compared to $0.07 million for the three months ended March 31, 2015.
Liquidity and Capital Resources
Summary cash flow data is as follows:
| Three Months Ended March 31, | ||||||||
| 2016 | 2015 | |||||||
| Cash flows provided (used) by: | ||||||||
| Operating activities | $ | 173,150 | $ | 959,136 | ||||
| Investing activities | (899,047 | ) | (510,646 | ) | ||||
| Financing activities | (815,702 | ) | (1,385,797 | ) | ||||
| Net decrease in cash | (1,541,599 | ) | (937,307 | ) | ||||
| Cash, beginning of period | 7,847,669 | 4,273,350 | ||||||
| Cash, end of period | $ | 6,306,070 | $ | 3,336,043 | ||||
At March 31, 2016, we had cash of $6.31 million compared to cash of $3.34 million on March 31, 2015. Both comparable periods include cash flows utilized for growth in our Cellular Retail segment in 2016. We believe that our available cash, combined with expected cash flows from operations and available financing, will be sufficient to fund our scheduled debt repayments and capital expenditure in our Cellular Retail segment through March 31, 2017.
On April 22, 2016, the Company entered into a Credit Agreement with a financial institution. The Credit Agreement provides the company with (i) a revolving credit facility in an aggregate amount of up to $3,000,000, having a maturity date of April 21, 2018, and (ii) an acquisition loan facility in an aggregate amount of up to $9,000,000, having a maturity date of April 21, 2018. Under the Credit Agreement, both the revolving credit facility and acquisition loan facility bear interest at a floating per annum rate equal to one-month LIBOR plus 3.50%, adjusted on a monthly basis. At closing, $3,500,000 was advanced under the acquisition loan replacing the $3,000,000 River City Equity debt which had a maturity date of June 30, 2016 and $500,000 of other term debt.
Off-Balance Sheet Arrangements
We had no off-balance sheet arrangements as of March 31, 2016.
19
Item 4. Controls and Procedures
Evaluation of Disclosure Controls and Procedures
We maintain disclosure controls and procedures designed to provide reasonable assurance that information required to be disclosed in our reports filed pursuant to the Securities Exchange Act of 1934 is recorded, processed, summarized and reported within the time periods specified in the SEC’s rules and forms, and that such information is accumulated and communicated to our management, including our Chief Executive Officer and Chief Financial Officer, as appropriate, to allow timely decisions regarding required disclosure. A control system, no matter how well conceived and operated, can provide only reasonable, not absolute, assurance the objectives of the control system are met.
We utilize the Committee of Sponsoring Organization’s Internal Control – Integrated Framework, 2013 version, for the design, implementation and assessment of the effectiveness of our disclosure controls and procedures and internal control over financial reporting.
As of March 31, 2016, our Chief Executive Officer and Chief Financial Officer carried out an assessment of the effectiveness of our disclosure controls and procedures as such term is defined in Rule 13a-15(e) under the Securities and Exchange Act of 1934.
In our Quarterly Report on Form 10-Q for the period ended September 30, 2015, we identified the following material weaknesses in internal control over financial reporting:
| · | Proper segregation of duties within the financial application were not maintained. In certain instances, persons responsible for financial reporting lacked restrictions to their access to ensure separation of functions involving custody of assets, authorization or approval of related transactions affecting those assets, and recording or reporting of related transactions were established and maintained. |
| · | Effective general computer controls to ensure proper change management policies and procedures existed and were followed for migration of updates and upgrades to our financial application or to maintain separate development, test and production environments were not implemented. |
We further provided in the Quarterly Report on Form 10-Q for the period ended September 30, 2015 and the Annual Report on Form 10-K for the year ended December 31, 2015 Management’s remediation plan and efforts to correct the identified material weaknesses. Despite the remediation progress made, we were unable to conclude that the material weaknesses described above were effectively remediated as of March 31, 2016 due to the fact that the time period necessary for remediation testing is insufficient to assess the effectiveness of those controls.
Changes in Internal Control over Financial Reporting
There were no changes in our internal control over
financial reporting during the quarter ended March 31, 2016 that have materially affected, or are reasonably likely to materially
affect, our internal control over financial reporting.
20
| Exhibit | Description | |
| 31.1 | Certification pursuant to Section 302 of the Sarbanes-Oxley Act of 2002 (filed herewith). | |
| 31.2 | Certification pursuant to Section 302 of the Sarbanes-Oxley Act of 2002 (filed herewith). | |
| 32 |
Certification pursuant to 18 U.S.C. Section 1350 as adopted pursuant to Section 906 of the Sarbanes-Oxley Act of 2002 (filed herewith). | |
| 101.INS | XBRL Instance Document (filed herewith). | |
| 101.SCH | XBRL Schema Document (filed herewith). | |
| 101.CAL | XBRL Calculation Linkbase Document (filed herewith). | |
| 101.DEF | XBRL Definition Linkbase Document (filed herewith). | |
| 101.LAB | XBRL Label Linkbase Document (filed herewith). | |
| 101.PRE | XBRL Presentation Linkbase Document (filed herewith). |
21
Pursuant to the requirements of the Securities and Exchange Act of 1934, the registrant has duly caused this report to be signed on its behalf by the undersigned, thereunto duly authorized.
| Dated: May 13, 2016 | Western Capital Resources, Inc. | |
| (Registrant) | ||
| By: | /s/ John Quandahl | |
| John Quandahl | ||
| Chief Executive Officer and Chief Operating Officer | ||
| By: | /s/ Stephen Irlbeck | |
| Stephen Irlbeck | ||
| Chief Financial Officer | ||
22