Attached files
UNITED STATES
SECURITIES AND EXCHANGE COMMISSION
WASHINGTON, D.C. 20549
FORM 10-Q
|
☑
|
QUARTERLY REPORT PURSUANT TO SECTION 13 OR 15(d) OF THE
SECURITIES EXCHANGE ACT OF 1934
|
For the quarterly period ended September 30, 2018
OR
|
☐
|
TRANSITION REPORT PURSUANT TO SECTION 13 OR 15(d) OF THE
SECURITIES EXCHANGE ACT OF 1934
|
Commission File Number 001-36498
CELLULAR BIOMEDICINE GROUP, INC.
(Exact name of registrant as specified in its charter)
|
Delaware
|
|
86-1032927
|
|
State of Incorporation
|
|
IRS Employer Identification No.
|
1345 Avenue of Americas, 11th Floor
New York, New York 10105
(Address of principal
executive offices)
(408) 973-7884
(Registrant’s telephone number)
Indicate
by check mark whether the registrant (1) has filed all reports
required to be filed by Section 13 or 15(d) of the
Securities Exchange Act of 1934 during the preceding 12 months (or
for such shorter period that the registrant was required to file
such reports), and (2) has been subject to such filing
requirements for the past 90 days.
Yes ☑ No ☐
Indicate
by check mark whether the registrant has submitted electronically,
if any, every Interactive Data File required to be submitted and
posted pursuant to Rule 405 of Regulation S-T (§232.405
of this chapter) during the preceding 12 months (or for such
shorter period than the registrant was required to submit such
files). Yes ☑ No ☐
Indicate
by check mark whether the registrant is a large accelerated filer,
an accelerated filer, or a non-accelerated filer. See definition of
“accelerated filer,” and “large accelerated
filer” and “smaller reporting company” in
Rule 12b-2 of the Exchange Act. (Check one):
|
Large
accelerated filer
|
☐
|
Accelerated
filer
|
☑
|
|
Non-accelerated
filer
|
☐
|
Smaller
reporting company
|
☐
|
|
Emerging
growth company
|
☐
|
|
|
If an
emerging growth company, indicate by check mark if the registrant
has elected not to use the extended transition period for complying
with any new or revised financial accounting standards provided
pursuant to Section 13(a) of the Exchange Act.
☐
Indicate by check
mark whether the registrant is a shell company (as defined in
Rule 12b-2 of the Exchange Act).
Yes ☐ No ☑
As of
October 31, 2018, there were 19,101,309 and 18,396,503 shares
of common stock, par value $.001 per share, issued and outstanding,
respectively.
TABLE OF CONTENTS
|
PART I FINANCIAL INFORMATION
|
|
|
|
|
|
|
|
|
|
Item 1.
|
Condensed
Consolidated Financial Statements (unaudited)
|
|
3
|
|
|
Condensed
Consolidated Balance Sheets (unaudited)
|
|
3
|
|
|
Condensed
Consolidated Statements of Operations and Comprehensive Loss
(unaudited)
|
|
4
|
|
|
Condensed
Consolidated Statements of Cash Flows (unaudited)
|
|
5
|
|
|
Condensed
Notes to Consolidated Financial Statements (unaudited)
|
|
6
|
|
|
|
|
|
|
Item 2.
|
Management’s
Discussion and Analysis of Financial Condition and Results of
Operations
|
|
21
|
|
|
|
|
|
|
Item 3.
|
Quantitative
and Qualitative Disclosures About Market Risk
|
|
45
|
|
|
|
|
|
|
Item 4.
|
Controls
and Procedures
|
|
46
|
|
|
|
|
|
|
PART II OTHER
INFORMATION
|
|
|
|
|
|
|
|
|
|
Item 1.
|
Legal
Proceedings
|
|
47
|
|
|
|
|
|
|
Item 1A.
|
Risk
Factors
|
|
47
|
|
|
|
|
|
|
Item 2.
|
Unregistered
Sales of Equity Securities and Use of Proceeds
|
|
48
|
|
|
|
|
|
|
Item 3.
|
Defaults
Upon Senior Securities
|
|
48
|
|
|
|
|
|
|
Item 4.
|
Mine
Safety Disclosures
|
|
48
|
|
|
|
|
|
|
Item 5.
|
Other
Information
|
|
48
|
|
|
|
|
|
|
Item 6.
|
Exhibits
|
|
48
|
|
|
|
|
|
|
SIGNATURES
|
|
49
|
|
2
PART I – FINANCIAL INFORMATION
Item 1. Condensed Consolidated Financial Statements
(Unaudited)
CONDENSED CONSOLIDATED BALANCE SHEETS (UNAUDITED)
AS OF SEPTEMBER 30, 2018 AND DECEMBER 31, 2017
|
|
September 30,
|
December 31,
|
|
|
2018
|
2017
|
|
|
|
(note
16)
|
|
Assets
|
|
|
|
Cash
and cash equivalents
|
$57,925,198
|
$21,568,422
|
|
Short-term
investment
|
10,000,000
|
-
|
|
Accounts receivable, less allowance for doubtful amounts of
$94,648 and $10,789 as of September 30, 2018 and
December 31, 2017, respectively
|
37,592
|
202,887
|
|
Other
receivables
|
249,771
|
170,842
|
|
Prepaid
expenses
|
2,132,910
|
1,852,695
|
|
Total
current assets
|
70,345,471
|
23,794,846
|
|
|
|
|
|
Long-term
investments
|
240,000
|
269,424
|
|
Property,
plant and equipment, net
|
14,313,801
|
12,973,342
|
|
Goodwill
|
7,678,789
|
7,678,789
|
|
Intangibles,
net
|
8,153,428
|
12,419,692
|
|
Long-term
prepaid expenses and other assets
|
5,683,464
|
4,026,203
|
|
Total
assets (1)
|
$106,414,953
|
$61,162,296
|
|
|
|
|
|
Liabilities and Stockholders' Equity
|
|
|
|
|
|
|
|
Liabilities:
|
|
|
|
Accounts
payable
|
$483,986
|
$225,287
|
|
Accrued
expenses
|
1,456,911
|
1,097,327
|
|
Taxes
payable
|
28,875
|
28,875
|
|
Other
current liabilities
|
3,960,765
|
2,324,632
|
|
Total
current liabilities
|
5,930,537
|
3,676,121
|
|
|
|
|
|
Other
non-current liabilities
|
441,093
|
183,649
|
|
Total
liabilities (1)
|
6,371,630
|
3,859,770
|
|
|
|
|
|
Commitments
and Contingencies (note 11)
|
|
|
|
|
|
|
|
Stockholders'
equity:
|
|
|
|
|
|
|
|
Preferred
stock, par value $.001, 50,000,000 shares authorized;
none issued and outstanding as of September 30, 2018
and December 31, 2017, respectively
|
-
|
-
|
|
|
|
|
|
Common
stock, par value $.001, 300,000,000 shares authorized;
19,093,243
and 15,615,558 issued; and 18,532,475 and 15,188,764
outstanding, as of September 30, 2018 and December 31,
2017, respectively
|
19,093
|
15,616
|
|
Treasury
stock at cost; 560,768 and 426,794 shares of common
stock as of September 30, 2018 and December 31, 2017,
respectively
|
(6,513,993)
|
(3,977,929)
|
|
Additional
paid in capital
|
249,527,729
|
172,691,339
|
|
Accumulated
deficit
|
(141,463,260)
|
(111,036,997)
|
|
Accumulated
other comprehensive loss
|
(1,526,246)
|
(389,503)
|
|
Total
stockholders' equity
|
100,043,323
|
57,302,526
|
|
|
|
|
|
Total
liabilities and stockholders' equity
|
$106,414,953
|
$61,162,296
|
_______________
|
(1)
|
The
Company’s consolidated assets as of September 30, 2018 and
December 31, 2017 included $25,103,395 and $21,775,087,
respectively, of assets of variable interest entities, or VIEs,
that can only be used to settle obligations of the VIEs. Each of
the following amounts represent the balances as of September 30,
2018 and December 31, 2017, respectively. These assets include cash
and cash equivalents of $3,444,121 and $2,337,173; other
receivables of $65,530 and $61,735; prepaid expenses of $1,997,163
and $1,750,509; property, plant and equipment, net, of $13,407,165
and $12,477,315; intangibles of $1,314,833 and $1,516,449; and
long-term prepaid expenses and other assets of $4,874,583 and
$3,631,906 as of September 30,
2018 and December 31, 2017, respectively. The
Company’s consolidated liabilities as of September 30, 2018
and December 31, 2017 included $4,961,475 and $2,688,520,
respectively, of liabilities of the VIEs whose creditors have no
recourse to the Company. These liabilities include accounts payable
of $311,348 and $181,231; other payables of $3,105,400 and
$1,631,582; accrued payroll of $1,092,669 and $682,248, which
mainly includes bonus accrual of $1,025,917 and $673,443; deferred
income of $10,965 and $9,810; and other non-current liabilities of
$441,093 and $183,649. See further description in Note 3, Variable
Interest Entities.
|
The
accompanying notes are an integral part of these unaudited
condensed consolidated financial statements.
3
CELLULAR BIOMEDICINE GROUP, INC.
CONDENSED CONSOLIDATED STATEMENTS OF OPERATIONS AND COMPREHENSIVE
LOSS
(UNAUDITED)
FOR THE THREE MONTHS AND NINE MONTHS ENDED SEPTEMBER 30, 2018 AND
2017
|
|
For the Three Months Ended
|
For the Nine Months Ended
|
||
|
|
September 30,
|
September 30,
|
||
|
|
2018
|
2017
|
2018
|
2017
|
|
|
|
|
|
|
|
Net
sales and revenue
|
$70,431
|
$106,787
|
$198,705
|
$268,126
|
|
|
|
|
|
|
|
Operating
expenses:
|
|
|
|
|
|
Cost
of sales
|
37,483
|
55,294
|
114,176
|
130,793
|
|
General
and administrative
|
3,315,614
|
3,023,390
|
9,626,106
|
9,527,730
|
|
Selling
and marketing
|
84,782
|
85,742
|
252,247
|
280,011
|
|
Research
and development
|
6,545,490
|
4,076,186
|
17,985,997
|
10,469,820
|
|
Impairment
on non-current assets
|
2,884,896
|
-
|
2,914,320
|
-
|
|
Total
operating expenses
|
12,868,265
|
7,240,612
|
30,892,846
|
20,408,354
|
|
Operating
loss
|
(12,797,834)
|
(7,133,825)
|
(30,694,141)
|
(20,140,228)
|
|
|
|
|
|
|
|
Other
income :
|
|
|
|
|
|
Interest
income
|
18,173
|
23,933
|
140,457
|
113,688
|
|
Other
income
|
38,376
|
907,678
|
132,300
|
1,461,265
|
|
Total
other income
|
56,549
|
931,611
|
272,757
|
1,574,953
|
|
Loss
before taxes
|
(12,741,285)
|
(6,202,214)
|
(30,421,384)
|
(18,565,275)
|
|
|
|
|
|
|
|
Income
taxes provision
|
(2,479)
|
-
|
(4,879)
|
(2,450)
|
|
|
|
|
|
|
|
|
|
|
|
|
|
Net
loss
|
$(12,743,764)
|
$(6,202,214)
|
$(30,426,263)
|
$(18,567,725)
|
|
Other comprehensive income (loss):
|
|
|
|
|
|
Cumulative
translation adjustment
|
(834,382)
|
291,665
|
(1,136,743)
|
637,786
|
|
Unrealized
loss on investments, net of tax
|
-
|
-
|
-
|
(240,000)
|
|
Total
other comprehensive income (loss):
|
(834,382)
|
291,665
|
(1,136,743)
|
397,786
|
|
|
|
|
|
|
|
Comprehensive
loss
|
$(13,578,146)
|
$(5,910,549)
|
$(31,563,006)
|
$(18,169,939)
|
|
|
|
|
|
|
|
|
|
|
|
|
|
Net
loss per share :
|
|
|
|
|
|
Basic
and diluted
|
$(0.72)
|
$(0.43)
|
$(1.76)
|
$(1.30)
|
|
|
|
|
|
|
|
|
|
|
|
|
|
Weighted average common shares outstanding:
|
|
|
||
|
Basic
and diluted
|
17,604,473
|
14,349,569
|
17,281,240
|
14,310,344
|
|
|
|
|
|
|
The
accompanying notes are an integral part of these unaudited
condensed consolidated financial statements.
4
CELLULAR BIOMEDICINE GROUP, INC.
CONDENSED CONSOLIDATED STATEMENTS OF CASH FLOWS
(UNAUDITED)
FOR THE NINE MONTHS ENDED SEPTEMBER 30, 2018 AND 2017
|
|
For the Nine Months Ended
|
|
|
|
September 30,
|
|
|
|
2018
|
2017
|
|
|
|
|
|
CASH
FLOWS FROM OPERATING ACTIVITIES:
|
|
|
|
Net
loss
|
$(30,426,263)
|
$(18,567,725)
|
|
Adjustments
to reconcile net loss to net cash
|
|
|
|
used
in operating activities:
|
|
|
|
Depreciation
and amortization
|
3,790,436
|
2,125,391
|
|
Loss
on disposal of assets
|
4,593
|
317
|
|
Stock
based compensation expense
|
3,748,082
|
4,240,822
|
|
Other
than temporary impairment on investments
|
29,424
|
-
|
|
Impairment
on intangible assets
|
2,884,896
|
-
|
|
Allowance
for doubtful account
|
83,992
|
-
|
|
Changes
in operating assets and liabilities:
|
|
|
|
Accounts
receivable
|
70,155
|
(103,701)
|
|
Other
receivables
|
(81,892)
|
(496,229)
|
|
Prepaid
expenses
|
(376,821)
|
(669,592)
|
|
Long-term
prepaid expenses and other assets
|
(333,647)
|
(936,168)
|
|
Accounts
payable
|
41,791
|
1,012,693
|
|
Accrued
expenses
|
396,639
|
(475,274)
|
|
Deferred
income
|
(12,114)
|
510,419
|
|
Other
current liabilities
|
541,074
|
(206,196)
|
|
Other
non-current liabilities
|
280,319
|
(386,504)
|
|
Net
cash used in operating activities
|
(19,359,336)
|
(13,951,747)
|
|
|
|
|
|
CASH
FLOWS FROM INVESTING ACTIVITIES:
|
|
|
|
Proceeds
from disposal of assets
|
292
|
286
|
|
Putting
six-month deposits with the banks
|
(10,000,000)
|
-
|
|
Purchases
of intangibles
|
(33,495)
|
(23,562)
|
|
Purchases
of assets
|
(4,438,135)
|
(6,978,348)
|
|
Net
cash used in investing activities
|
(14,471,338)
|
(7,001,624)
|
|
|
|
|
|
CASH
FLOWS FROM FINANCING ACTIVITIES:
|
|
|
|
Net
proceeds from the issuance of common stock
|
70,383,181
|
-
|
|
Proceeds
from exercise of stock options
|
2,708,603
|
232,910
|
|
Repurchase
of treasury stock
|
(2,536,064)
|
(2,443,122)
|
|
Net
cash provided by financing activities
|
70,555,720
|
(2,210,212)
|
|
|
|
|
|
EFFECT
OF EXCHANGE RATE CHANGES ON CASH
|
(368,270)
|
203,182
|
|
|
|
|
|
INCREASE
IN CASH AND CASH EQUIVALENTS
|
36,356,776
|
(22,960,401)
|
|
CASH
AND CASH EQUIVALENTS, BEGINNING OF PERIOD
|
21,568,422
|
39,252,432
|
|
CASH
AND CASH EQUIVALENTS, END OF PERIOD
|
$57,925,198
|
$16,292,031
|
|
|
|
|
|
|
|
|
|
SUPPLEMENTAL CASH FLOW INFORMATION
|
|
|
|
|
|
|
|
Cash
paid for income taxes
|
$4,879
|
$-
|
Note:
Six-month bank deposits of $10,000,000 was recorded as short-term
investment and excluded from cash and cash equivalents as of
September 30, 2018.
The
accompanying notes are an integral part of these unaudited
condensed consolidated financial statements.
5
CELLULAR BIOMEDICINE GROUP, INC.
FOR THE THREE MONTHS ENDED SEPTEMBER 30, 2018 AND 2017
NOTES TO UNAUDITED CONDENSED CONSOLIDATED FINANCIAL
STATEMENTS
NOTE 1 – DESCRIPTION OF BUSINESS
As used
in this quarterly report, "we", "us", "our", "CBMG", "Company" or
"our company" refers to Cellular Biomedicine Group, Inc. and,
unless the context otherwise requires, all of its subsidiaries and
variable interest entities.
Overview
Cellular
Biomedicine Group, Inc. is a clinical stage biopharmaceutical
company, principally engaged in the development of therapies for
cancer and degenerative diseases utilizing proprietary cell-based
technologies. Our technology includes two major platforms: (i)
Immune cell therapy for treatment of a broad range of cancer
indications comprised of technologies in Chimeric Antigen Receptor
modified T cells ("CAR-T"), T-Cell Receptor ("TCR"), next
generation neoantigen-reactive tumor infiltrating lymphocyte
(“TIL”), and (ii) human adipose-derived mesenchymal
progenitor cells ("haMPC") for treatment of joint diseases.
CBMG’s Research & Development facilities are based in
Gaithersburg, Maryland and Shanghai, China, and its manufacturing
facilities are based in China in the cities of Shanghai, Wuxi, and
Beijing.
We are
focused on developing and marketing safe and effective cell-based
therapies based on our cellular platforms, to treat cancer and
orthopedic diseases. We have developed proprietary technologies and
know-how in our cell therapy platforms. We are conducting clinical
studies in China with our stem cell based therapies to treat knee
osteoarthritis (“KOA”). Prior to China’s December
2017 revised regulation we have completed a Phase IIb autologous
haMPC KOA clinical study and published its promising results. Led
by Shanghai Renji Hospital, one of the largest teaching hospitals
in China, we have completed a Phase I clinical trial of our
off-the-shelf allogeneic haMPC (AlloJoin™) therapy for
treating KOA patients. We have completed and presented the
Allojoin™ Phase I 48-week data in China and have met with the
National Medical Products Administration (NMPA, renamed from China
Food and Drug Administration (“CFDA”)) in a pre-IND
meeting to discuss methods to potentially enhance
development.
Our
primary target market is China. We believe that our cell-based
therapies will be able to help patients with high unmet medical
needs. We expect to carry out clinical studies leading to the
eventual NMPA approval of our products through Biologics License
Application ("BLA") filings and authorized clinical centers
throughout Greater China.
CBMG
was developing its own anti-CD19 CAR-T cell therapy in B-cell
non-Hodgkin lymphoma ("NHL")and adult acute lymphoblastic leukemia
(“ALL”) and had already initiated IND applications in
China. On September 25, 2018, we entered into a strategic licensing
and collaboration agreement with Novartis to manufacture and supply
their CAR-T cell therapy Kymriah (tisagenlecleucel) in China. As
part of the deal, Novartis took approximately a 9% equity stake in
CBMG, and CBMG is discontinuing development of its own anti-CD19
CAR-T cell therapy. This collaboration with Novartis reflects our
shared commitment to bringing the first marketed CAR-T cell therapy
product, Kymriah, currently approved in the US, EU and Canada for
two difficult-to-treat cancers, to China where the number of
patients remains the highest in the world. We continue to develop
cell therapies other than CD19 on our own and Novartis has the
first right of negotiation on these developments. The CBMG oncology
pipeline includes CAR-T targeting CD20-, CD22- and B-cell
maturation antigen (BCMA), AFP TCR-T and TIL. We are striving to
build competitive research capabilities, a cutting edge
translational medicine unit, along with a well-established cellular
manufacturing capability and ample capacity, to support Kymriah in
China and our development of cell therapy products. We expect to
initiate first in-human multiple CAR-T and TCR-T therapies in
coming quarters.
Corporate History
Headquartered in
New York, the Company is a Delaware biopharmaceutical company
focused on developing treatment for cancer and orthopedic diseases
for patients in China. The Company started its regenerative
medicine business in China in 2009 and expanded to CAR-T therapies
in 2014.
NOTE 2 – BASIS OF PRESENTATION AND SIGNIFICANT
ACCOUNTING POLICIES
The
accompanying unaudited Condensed Consolidated Financial Statements
have been prepared in accordance with accounting principles
generally accepted in the United States of America (“U.S.
GAAP”) for interim financial information and the rules and
regulations of the Securities and Exchange Commission
(“SEC”) for reporting on Form 10-Q. Accordingly, they
do not include all the information and footnotes required by U.S.
GAAP for complete financial statements herein. The unaudited
Condensed Consolidated Financial Statements herein should be read
in conjunction with the historical consolidated financial
statements of the Company for the years ended December 31, 2017
included in our Annual Report on Form 10-K for the year ended
December 31, 2017. Operating results for the three and nine months
ended September 30, 2018 are not necessarily indicative of the
results that may be expected for the year ending December 31,
2018.
6
Principles of Consolidation
Our
unaudited condensed consolidated financial statements reflect all
adjustments, which are, in the opinion of management, necessary for
a fair presentation of our financial position and results of
operations. Such adjustments are of a normal recurring nature,
unless otherwise noted. The balance sheet as of September 30, 2018
and the results of operations for the three and nine months ended
September 30, 2018 are not necessarily indicative of the results to
be expected for any future period.
Our
unaudited condensed consolidated financial statements are prepared
in accordance with U.S. GAAP. These accounting principles require
us to make certain estimates, judgments and assumptions that affect
the reported amounts if assets and liabilities and disclosure of
contingent assets and liabilities at the date of the financial
statements and the reported amounts of revenues and expenses during
the reporting period. We believe that the estimates, judgments and
assumptions are reasonable, based on information available at the
time they are made. Actual results could differ materially from
those estimates.
Recent Accounting Pronouncements
Accounting pronouncements adopted during the nine months ended
September 30, 2018
In May
2017, the Financial Accounting Standards Board (“FASB”)
issued Accounting Standards Update (“ASU”) 2017-09,
“Compensation—Stock
Compensation (Topic 718): Scope of Modification
Accounting” (“ASU 2017-09”), which
provides guidance on determining which changes to the terms and
conditions of share-based payment awards require an entity to apply
modification accounting under Topic 718. The amendments in this ASU
are effective for all entities for annual periods, and interim
periods within those annual periods, beginning after December 15,
2017. Early adoption is permitted, including adoption in any
interim period, for (1) public business entities for reporting
periods for which financial statements have not yet been issued and
(2) all other entities for reporting periods for which financial
statements have not yet been made available for issuance. The
amendments in this ASU should be applied prospectively to an award
modified on or after the adoption date. The adoption of the ASU
2017-09 did not have a material impact on the Company’s
consolidated financial statements.
In
February 2017, the FASB issued ASU No. 2017-05, “Other Income—Gains and Losses
from the Derecognition of Nonfinancial Assets (Subtopic 610-20):
Clarifying the Scope of Asset Derecognition Guidance and Accounting
for Partial Sales of Nonfinancial Assets” (“ASU
2017-05”), which clarifies the scope of the nonfinancial
asset guidance in Subtopic 610-20. This ASU also clarifies that the
derecognition of all businesses and nonprofit activities (except
those related to conveyances of oil and gas mineral rights or
contracts with customers) should be accounted for in accordance
with the derecognition and deconsolidation guidance in Subtopic
810-10. The amendments in this ASU also provide guidance on the
accounting for what often are referred to as partial sales of
nonfinancial assets within the scope of Subtopic 610-20 and
contributions of nonfinancial assets to a joint venture or other
non-controlled investee. The amendments in this ASU are effective
for annual reporting reports beginning after December 15, 2017,
including interim reporting periods within that reporting period.
Public entities may apply the guidance earlier but only as of
annual reporting periods beginning after December 15, 2016,
including interim reporting periods within that reporting period.
The adoption of the ASU 2017-05 did not have a material impact on
the Company’s consolidated financial statements.
In
November 2016, the FASB issued ASU No. 2016-18, “Statement of Cash Flows (Topic 230):
Restricted Cash” (“ASU 2016-18”),
which requires that a statement of cash flows explain the change
during the period in the total of cash, cash equivalents, and
amounts generally described as restricted cash or restricted cash
equivalents. Therefore, amounts generally described as restricted
cash and restricted cash equivalents should be included with cash
and cash equivalents when reconciling the beginning-of-period and
end-of-period total amounts shown on the statement of cash flows.
The amendments in this ASU do not provide a definition of
restricted cash or restricted cash equivalents. The amendments in
this ASU are effective for public business entities for fiscal
years beginning after December 15, 2017, and interim periods within
those fiscal years. Early adoption is permitted, including adoption
in an interim period. The adoption of the ASU 2016-18 did not have
a material impact on the Company’s consolidated financial
statements.
In
August 2016, the FASB issued ASU No. 2016-15, “Statement of Cash Flows (Topic 230):
Classification of Certain Cash Receipts and Cash
Payments” (“ASU 2016-15”), which
addresses the following eight specific cash flow issues: debt
prepayment or debt extinguishment costs; settlement of zero-coupon
debt instruments or other debt instruments with coupon interest
rates that are insignificant in relation to the effective interest
rate of the borrowing; contingent consideration payments made after
a business combination; proceeds from the settlement of insurance
claims; proceeds from the settlement of corporate-owned life
insurance policies (including bank-owned life insurance policies;
distributions received from equity method investees; beneficial
interests in securitization transactions; and separately
identifiable cash flows and application of the predominance
principle. The amendments in this ASU are effective for public
business entities for fiscal years beginning after December 15,
2017, and interim periods within those fiscal years. Early adoption
is permitted, including adoption in an interim period. The adoption
of the ASU 2016-15 did not have a material impact on the
Company’s consolidated financial statements.
In
January 2016, the FASB issued ASU No. 2016-01, “Financial Instruments – Overall
(Subtopic 825-10): Recognition and Measurement of Financial Assets
and Financial Liabilities” (“ASU
2016-01”). The amendments in this update require all equity
investments to be measured at fair value with changes in the fair
value recognized through net income (other than those accounted for
under equity method of accounting or those that result in
consolidation of the investee). The amendments in this update also
require an entity to present separately in other comprehensive
income the portion of the total change in the fair value of a
liability resulting from a change in the instrument-specific credit
risk when the entity has elected to measure the liability at fair
value in accordance with the fair value option for financial
instruments. In addition, the amendments in this update eliminate
the requirement for to disclose the method(s) and significant
assumptions used to estimate the fair value that is required to be
disclosed for financial instruments measured at amortized cost on
the balance sheet for public entities. For public business
entities, the amendments in ASU 2016-01 are effective for fiscal
years beginning after December 15, 2017, including interim periods
within those fiscal years. Except for the early application
guidance discussed in ASU 2016-01, early adoption of the amendments
in this update is not permitted. The adoption of the ASU 2016-01
did not have a material impact on the Company’s consolidated
financial statements.
7
In May
2014, the FASB issued ASU No. 2014-09, “Revenue from Contracts with Customers
(Topic 606)” (“ASU
2014-09”), which
amended the existing accounting standards for revenue recognition.
ASU 2014-09 establishes principles for recognizing revenue upon the
transfer of promised goods or services to customers, in an amount
that reflects the expected consideration received in exchange for
those goods or services. ASU 2014-09 and its related clarifying
ASUs are effective for annual reporting periods beginning after
December 15, 2017 and interim periods within those annual periods.
The Company adopted ASC Topic 606, Revenue from Contracts with Customers,
in the first quarter of 2018 using the modified retrospective
transition approach. Because the Company’s primary source of
revenues for the nine-month period ended September 30, 2018 was
only from cell banking services as well as cell therapy technology
services, and the service revenues are recognized when cell banking
and cell therapy technology services are rendered (i.e., the two
performance obligations that arise from its contracts with
customers are satisfied), the impact on its consolidated financial
statements from adoption of ASC Topic 606 is not
material.
Accounting pronouncements not yet effective to adopt
In June
2018, the FASB issued ASU 2018-07, which simplifies several aspects
of the accounting for nonemployee share-based payment transactions
resulting from expanding the scope of Topic 718, Compensation-Stock
Compensation, to include share-based payment transactions for
acquiring goods and services from non-employees. Some of the areas
for simplification apply only to nonpublic entities. The amendments
specify that Topic 718 applies to all share-based payment
transactions in which a grantor acquires goods or services to be
used or consumed in a grantor’s own operations by issuing
share-based payment awards. The amendments also clarify that Topic
718 does not apply to share-based payments used to effectively
provide (1) financing to the issuer or (2) awards granted in
conjunction with selling goods or services to customers as part of
a contract accounted for under Topic 606, Revenue from Contracts
with Customers. The amendments in this Update are effective for
public business entities for fiscal years beginning after December
15, 2018, including interim periods within that fiscal year. Early
adoption is permitted. We do not plan to early adopt this ASU. We
are currently evaluating the potential impacts of this updated
guidance, and do not expect the adoption of this guidance to have a
material impact on our consolidated financial statements and
related disclosures.
In
February 2018, the FASB issued ASU No. 2018-02, “Income Statement—Reporting
Comprehensive Income (Topic 220): Reclassification of Certain Tax
Effects from Accumulated Other Comprehensive Income”
(“ASU 2018-02”), which provides financial statement
preparers with an option to reclassify stranded tax effects within
accumulated other comprehensive income to retained earnings in each
period in which the effect of the change in the U.S. federal
corporate income tax rate in the Tax Cuts and Jobs Act (or portion
thereof) is recorded. The amendments in this ASU are effective for
all entities for fiscal years beginning after December 15, 2018,
and interim periods within those fiscal years. Early adoption of
ASU 2018-02 is permitted, including adoption in any interim period
for the public business entities for reporting periods for which
financial statements have not yet been issued. The amendments in
this ASU should be applied either in the period of adoption or
retrospectively to each period (or periods) in which the effect of
the change in the U.S. federal corporate income tax rate in the Tax
Cuts and Jobs Act is recognized. We do not expect the adoption of
ASU 2018-02 to have a material impact on our consolidated financial
statements.
In July
2017, the FASB issued ASU No. 2017-11, “Earnings Per Share (Topic 260);
Distinguishing Liabilities from Equity (Topic 480); Derivatives and
Hedging (Topic 815): (Part I) Accounting for Certain Financial
Instruments with Down Round Features, (Part II) Replacement of the
Indefinite Deferral for Mandatorily Redeemable Financial
Instruments of Certain Nonpublic Entities and Certain Mandatorily
Redeemable Non-controlling Interests with a Scope
Exception” (“ASU 2017-11”), which
addresses the complexity of accounting for certain financial
instruments with down round features. Down round features are
features of certain equity-linked instruments (or embedded
features) that result in the strike price being reduced on the
basis of the pricing of future equity offerings. Current accounting
guidance creates cost and complexity for entities that issue
financial instruments (such as warrants and convertible
instruments) with down round features that require fair value
measurement of the entire instrument or conversion option. The
amendments in Part I of this ASU are effective for public business
entities for fiscal years, and interim periods within those fiscal
years, beginning after December 15, 2018. The Company is currently
evaluating the impact of the adoption of ASU 2017-11 on its
consolidated financial statements.
In
January 2017, the FASB issued ASU No. 2017-04, “Intangibles—Goodwill and Other
(Topic 350): Simplifying the Test for Goodwill
Impairment” (“ASU 2017-04”), which removes
Step 2 from the goodwill impairment test. An entity will apply a
one-step quantitative test and record the amount of goodwill
impairment as the excess of a reporting unit's carrying amount over
its fair value, not to exceed the total amount of goodwill
allocated to the reporting unit. The new guidance does not amend
the optional qualitative assessment of goodwill impairment. Public
business entity that is a U.S. Securities and Exchange Commission
filer should adopt the amendments in this ASU for its annual or any
interim goodwill impairment test in fiscal years beginning after
December 15, 2019. Early adoption is permitted for interim or
annual goodwill impairment tests performed on testing dates after
January 1, 2017. We are currently evaluating the impact of the
adoption of ASU 2017-04 on our consolidated financial
statements.
In June
2016, the FASB issued ASU No. 2016-13, “Financial Instruments—Credit
Losses (Topic 326): Measurement of Credit Losses on Financial
Instruments” (“ASU 2016-13”).
Financial Instruments—Credit Losses (Topic 326) amends
guideline on reporting credit losses for assets held at amortized
cost basis and available-for-sale debt securities. For assets held
at amortized cost basis, Topic 326 eliminates the probable initial
recognition threshold in current GAAP and, instead, requires an
entity to reflect its current estimate of all expected credit
losses. The allowance for credit losses is a valuation account that
is deducted from the amortized cost basis of the financial assets
to present the net amount expected to be collected. For
available-for-sale debt securities, credit losses should be
measured in a manner similar to current GAAP, however Topic 326
will require that credit losses be presented as an allowance rather
than as a write-down. ASU 2016-13 affects entities holding
financial assets and net investment in leases that are not
accounted for at fair value through net income. The amendments
affect loans, debt securities, trade receivables, net investments
in leases, off balance sheet credit exposures, reinsurance
receivables, and any other financial assets not excluded from the
scope that have the contractual right to receive cash. The
amendments in this ASU will be effective for fiscal years beginning
after December 15, 2019, including interim periods within those
fiscal years. We are currently evaluating the impact of the
adoption of ASU 2016-13 on our consolidated financial
statements.
8
In
February 2016, the FASB issued ASU No. 2016-02, “Leases (Topic
842)” (“ASU 2016-02”). The amendments
in this update create Topic 842, Leases, and supersede the leases
requirements in Topic 840, Leases. Topic 842 specifies the
accounting for leases. The objective of Topic 842 is to establish
the principles that lessees and lessors shall apply to report
useful information to users of financial statements about the
amount, timing, and uncertainty of cash flows arising from a lease.
The main difference between Topic 842 and Topic 840 is the
recognition of lease assets and lease liabilities for those leases
classified as operating leases under Topic 840. Topic 842 retains a
distinction between finance leases and operating leases. The
classification criteria for distinguishing between finance leases
and operating leases are substantially similar to the
classification criteria for distinguishing between capital leases
and operating leases in the previous leases guidance. The result of
retaining a distinction between finance leases and operating leases
is that under the lessee accounting model in Topic 842, the effect
of leases in the statement of comprehensive income and the
statement of cash flows is largely unchanged from previous GAAP.
The amendments in ASU 2016-02 are effective for fiscal years
beginning after December 15, 2018, including interim periods within
those fiscal years for public business entities. Early application
of the amendments in ASU 2016-02 is permitted. We are currently
evaluating the impact of the adoption of ASU 2016-02 on our
consolidated financial statements.
NOTE 3 – VARIABLE INTEREST ENTITIES
VIEs are those entities
in which a company, through contractual arrangements, bears the
risk of, and enjoys the rewards normally associated with ownership
of the entity, and therefore the Company is the primary beneficiary
of the entity. Cellular Biomedicine Group Ltd (Shanghai)
(“CBMG Shanghai”) and its subsidiaries are variable
interest entities (VIEs), through which the Company conducts immune
therapy and stem cell research and clinical trials in China. The
registered shareholders of CBMG Shanghai are Lu Junfeng and Chen
Mingzhe, who together own 100% of the equity interests in CBMG
Shanghai. Lu Junfeng and Chen Mingzhe are not Board members
and do not participate in management of the Company. The initial
capitalization and operating expenses of CBMG Shanghai are funded
by our wholly foreign-owned enterprise (“WFOE”),
Cellular Biomedicine Group Ltd. (Wuxi) (“CBMG Wuxi”).
CBMG Shanghai was incorporated on October 19, 2011. Agreen Biotech
Co. Ltd. (“AG”) was acquired by CBMG Shanghai in
September 2014. AG was incorporated on April 27, 2011. In January
2017, CBMG Shanghai established two fully owned subsidiaries
- Wuxi Cellular
Biopharmaceutical Group Ltd. and Shanghai Cellular
Biopharmaceutical Group Ltd, which are located in Wuxi and Shanghai
respectively. For the period ended
September 30, 2018 and 2017, 31% and 2% of the Company revenue is
derived from VIEs respectively.
As of September 30, 2018, CBMG Wuxi provided financing to CBMG
Shanghai and its subsidiaries in the amount of $25,693,120 for
working capital purposes. As of the same date CBMG Shanghai and its
subsidiary provided technology services of $22,443,550 to CBMG Wuxi
and CBMG Hong Kong and CBMG Wuxi purchased $27,407,693 of
intellectual property from CBMG Shanghai. In conjunction with the
provided financing, exclusive option agreements were executed
granting CBMG Wuxi the irrevocable and exclusive right to convert
the unpaid portion of the provided financing into equity interest
of CBMG Shanghai at CBMG Wuxi’s sole and absolute discretion.
CBMG Wuxi and CBMG Shanghai additionally executed a business
cooperation agreement whereby CBMG Wuxi is to provide CBMG Shanghai
with technical and business support, consulting services, and other
commercial services. The shareholders of CBMG Shanghai pledged 100%
of their equity interest in CBMG Shanghai as collateral in the
event CBMG Shanghai does not perform its obligations under the
business cooperation agreement.
The Company has determined it is the primary beneficiary of CBMG
Shanghai by reference to the power and benefits criterion under ASC
Topic 810, Consolidation. This determination was reached after
considering the financing provided by CBMG Wuxi to CBMG Shanghai is
convertible into equity interest of CBMG Shanghai and the business
cooperation agreement grants the Company and its officers the power
to manage and make decisions that affect the operation of CBMG
Shanghai.
There are substantial uncertainties regarding the interpretation,
application and enforcement of PRC laws and regulations, including
but not limited to the laws and regulations governing our business
or the enforcement and performance of our contractual arrangements.
See Risk Factors below regarding “Risks Related to Our
Structure”.
As the primary beneficiary of CBMG Shanghai and its subsidiaries,
the Company consolidates in its financial statements the financial
position, results of operations, and cash flows of CBMG Shanghai
and its subsidiaries, and all intercompany balances and
transactions between the Company and CBMG Shanghai and its
subsidiaries are eliminated in the consolidated financial
statements.
9
The
Company has aggregated the financial information of CBMG Shanghai
and its subsidiaries in the table below. The aggregate carrying
value of assets and liabilities of CBMG Shanghai and its
subsidiaries (after elimination of intercompany transactions and
balances) in the Company’s condensed consolidated balance
sheets as of September 30, 2018 and December 31, 2017 are as
follows:
|
|
September 30,
|
December 31,
|
|
|
2018
|
2017
|
|
|
|
(note
16)
|
|
Assets
|
|
|
|
Cash
|
$3,444,121
|
$2,337,173
|
|
Other
receivables
|
65,530
|
61,735
|
|
Prepaid
expenses
|
1,997,163
|
1,750,509
|
|
Total
current assets
|
5,506,814
|
4,149,417
|
|
|
|
|
|
Property,
plant and equipment, net
|
13,407,165
|
12,477,315
|
|
Intangibles
|
1,314,833
|
1,516,449
|
|
Long-term
prepaid expenses and other assets
|
4,874,583
|
3,631,906
|
|
Total
assets
|
$25,103,395
|
$21,775,087
|
|
|
|
|
|
Liabilities
|
|
|
|
Accounts
payable
|
$311,348
|
$181,231
|
|
Other
payables
|
3,105,400
|
1,631,582
|
|
Accrued
payroll *
|
1,092,669
|
682,248
|
|
Deferred
income
|
10,965
|
9,810
|
|
Total
current liabilities
|
$4,520,382
|
$2,504,871
|
|
|
|
|
|
Other
non-current liabilities
|
441,093
|
183,649
|
|
Total
liabilities
|
$4,961,475
|
$2,688,520
|
*
Accrued payroll mainly includes bonus accrual of $1,025,917 and
$673,443.
10
NOTE 4 – PROPERTY, PLANT AND EQUIPMENT
As of
September 30, 2018 and December 31, 2017, property, plant and
equipment, carried at cost, consisted of the
following:
|
|
September 30,
2018
|
December 31,
2017
|
|
|
|
|
|
Office
equipment
|
$101,876
|
$105,114
|
|
Manufacturing
equipment
|
6,364,024
|
4,781,936
|
|
Computer
equipment
|
402,831
|
233,539
|
|
Leasehold
improvements
|
12,381,971
|
4,196,589
|
|
Construction
work in process
|
1,006,753
|
7,498,272
|
|
|
20,257,455
|
16,815,450
|
|
Less:
accumulated depreciation
|
(5,943,654)
|
(3,842,108)
|
|
|
$14,313,801
|
$12,973,342
|
For the three and nine months ended
September 30, 2018, depreciation expense was $857,768 and
$2,445,470, respectively, as compared to $342,562 and $817,987 for
the three and nine months ended September 30, 2017,
respectively.
NOTE 5 – INVESTMENTS
Short-term Investment
The
Company’s short-term investments are held in several
six-month bank deposits.
Long-term Investments
The
Company’s investments represent the investment in equity
securities listed in Over-The-Counter (“OTC”) markets
of the United States of America:
|
September 30, 2018
|
Cost
|
Gross Unrealized Gains
|
Gross Unrealized Losses more than 12 months
|
Gross Unrealized Losses less than 12 months
|
Market or Fair Value
|
|
Equity
position in Arem Pacific Corporation
|
480,000
|
-
|
-
|
(240,000)
|
240,000
|
|
|
|
|
|
|
|
|
Total
|
$480,000
|
$-
|
$-
|
$(240,000)
|
$240,000
|
|
|
|
|
|
|
|
11
|
December 31, 2017
|
Cost
|
Gross Unrealized Gains
|
Gross Unrealized Losses more than 12 months
|
Gross Unrealized Losses less than 12 months
|
Market or Fair Value
|
|
Equity
position in Alpha Lujo, Inc.
|
$251,388
|
$-
|
$(221,964)
|
$-
|
$29,424
|
|
Equity
position in Arem Pacific Corporation
|
480,000
|
-
|
-
|
(240,000)
|
240,000
|
|
|
|
|
|
|
|
|
Total
|
$731,388
|
$-
|
$(221,964.00)
|
$(240,000)
|
$269,424
|
The
unrealized holding loss for the investments, net of tax that were
recognized in other comprehensive income (loss) for the three and
nine months ended September 30, 2018 was nil, as compared to nil
and $(240,000) for the three and nine months ended September 30,
2017, respectively.
The
Company tracks each investment with an unrealized loss and evaluate
them on an individual basis for other-than-temporary impairments,
including obtaining corroborating opinions from third party
sources, performing trend analysis and reviewing management’s
future plans. When investments have declines determined
by management to be other-than-temporary the Company recognizes
write downs through earnings. Other-than-temporary
impairment of investments for the three and nine months ended
September 30, 2018 was nil and $29,424, as compared to nil for the
three and nine months ended September 30, 2017. The Company
provided full impairment of $29,424 for shares of Alpha Lujo, Inc.
(“ALEV”) for the nine months ended September 30, 2018
as ALEV filed Form 15 (Certification and Notice of Termination of
Registration under Section 12(g) of the Securities Exchange Act of
1934 or Suspension of Duty to File Reports) with the SEC and is no
longer traded in the market in 2018.
NOTE 6 – FAIR VALUE ACCOUNTING
The
Company has adopted ASC Topic 820, Fair Value Measurement and
Disclosure, which defines fair value, establishes a framework for
measuring fair value in GAAP, and expands disclosures about fair
value measurements. It does not require any new fair value
measurements, but provides guidance on how to measure fair value by
providing a fair value hierarchy used to classify the source of the
information. It establishes a three-level valuation hierarchy of
valuation techniques based on observable and unobservable inputs,
which may be used to measure fair value and include the
following:
Level 1
– Quoted prices in active markets for identical assets or
liabilities.
Level 2
– Inputs other than Level 1 that are observable, either
directly or indirectly, such as quoted prices for similar assets or
liabilities; quoted prices in markets that are not active; or other
inputs that are observable or can be corroborated by observable
market data for substantially the full term of the assets or
liabilities.
Level 3
– Unobservable inputs that are supported by little or no
market activity and that are significant to the fair value of the
assets or liabilities.
Classification
within the hierarchy is determined based on the lowest level of
input that is significant to the fair value
measurement.
The
carrying value of financial items of the Company including cash and
cash equivalents, accounts receivable, other receivables, accounts
payable and accrued liabilities, approximate their fair values due
to their short-term nature and are classified within Level 1 of the
fair value hierarchy. The Company’s investments are
classified within Level 2 of the fair value hierarchy because of
the limited trading of such stocks, which are traded solely in OTC
market.
Assets
measured at fair value within Level 2 on a recurring basis as of
September 30, 2018 and December 31, 2017 are summarized as
follows:
12
|
|
As of September 30, 2018
|
|||
|
|
Fair Value Measurements at Reporting Date Using:
|
|||
|
|
|
Quoted Prices in
|
Significant Other
|
Significant
|
|
|
|
Active Markets for
|
Observable
|
Unobservable
|
|
|
|
Identical Assets
|
Inputs
|
Inputs
|
|
|
Total
|
(Level 1)
|
(Level 2)
|
(Level 3)
|
|
Assets:
|
|
|
|
|
|
Equity
position in Arem Pacific Corporation
|
240,000
|
-
|
240,000
|
-
|
|
|
|
|
|
|
|
|
$240,000
|
$-
|
$240,000
|
$-
|
|
|
As of December 31, 2017
|
|||
|
|
Fair Vaue Measurements at Reporting Date Using:
|
|||
|
|
|
Quoted Prices in
|
Significant Other
|
Significant
|
|
|
|
Active Markets for
|
Observable
|
Unobservable
|
|
|
|
Identical Assets
|
Inputs
|
Inputs
|
|
|
Total
|
(Level 1)
|
(Level 2)
|
(Level 3)
|
|
Assets:
|
|
|
|
|
|
Equity
position in Alpha Lujo, Inc.
|
$29,424
|
$-
|
$29,424
|
$-
|
|
Equity
position in Arem Pacific Corporation
|
240,000
|
-
|
240,000
|
-
|
|
|
$269,424
|
$-
|
$269,424
|
$-
|
No shares were acquired in the nine
months ended September 30, 2018 and 2017.
As of
September 30, 2018 and December 31, 2017, the Company holds
8,000,000 shares in Arem Pacific Corporation (“ARPC”),
2,942,350 shares in ALEV and 2,057,131 shares in Wonder
International Education and Investment Group Corporation
(“Wonder”), respectively. Full impairment
has been provided for shares of Wonder and ALEV as of September 30,
2018. All available-for-sale investments held by the Company at
September 30, 2018 and December 31, 2017 have been valued based on
level 2 inputs due to the illiquid nature of these non-reporting
securities that cannot easily be sold or exchanged for
cash.
NOTE 7 – INTANGIBLE ASSETS
Intangible assets
that are subject to amortization are reviewed for potential
impairment whenever events or circumstances indicate that carrying
amounts may not be recoverable. Assets not subject to amortization
are tested for impairment at least annually. The Company evaluates
the continuing value of the intangibles at each balance sheet date
and records write-downs if the continuing value has become
impaired. An impairment is determined to exist if the anticipated
undiscounted future cash flow attributable to the asset is less
than its carrying value. The asset is then reduced to the net
present value of the anticipated future cash flow.
As of
September 30, 2018 and December 31, 2017, intangible assets, net
consisted of the following:
13
|
Patents
& knowhow & license
|
|
|
|
|
September 30,
2018
|
December 31,
2017
|
|
Cost
basis
|
$17,576,023
|
$17,674,431
|
|
Less:
accumulated amortization
|
(6,617,882)
|
(5,325,113)
|
|
Less:
impairment
|
(2,884,896)
|
-
|
|
|
$8,073,245
|
$12,349,318
|
|
Software
|
|
|
|
|
September 30,
2017
|
December 31,
2016
|
|
Cost
basis
|
$182,167
|
$158,273
|
|
Less:
accumulated amortization
|
(101,984)
|
(87,899)
|
|
|
$80,183
|
$70,374
|
|
|
|
|
|
|
|
|
|
Total
intangibles, net
|
$8,153,428
|
$12,419,692
|
All
software is provided by a third party vendor, is not
internally developed, and has an estimated useful life of five
years. Patents and knowhow are amortized using an estimated useful
life of three to ten years. Amortization expense for the three and
nine months ended September 30, 2018 was $446,523 and $1,344,966,
respectively, and amortization expense for the three and nine
months ended September 30, 2017 was $413,661 and $1,307,404,
respectively.
During
the three months ended September 30, 2018, the Company reassessed
its return on investment to develop GVAX for cancer therapies in
the current competitive market and decided to terminate its GVAX
program and its license agreements with the University of South
Florida (“USF”) and the Moffitt Cancer Center
(“Moffitt”). As a result the Company made a full
impairment of $2,884,896 for the USF and Moffitt
licenses. CD40LGVAX
was licensed in 2015 with the intention of providing alternative
treatment options for late stage non-small cell lung cancer (NSCLC)
patients. Since then, the landscape of NSCLC has changed
dramatically. Pembrolizumab has been approved as first-line
treatment for patients with metastatic NSCLC with high PD-L1
expression, and for patients with metastatic NSCLC following
disease progression on chemotherapy. Recently, the FDA has accepted
a supplemental biologics license application (sBLA) for the
combination of nivolumab plus ipilimumab for the frontline
treatment of patients with advanced NSCLC with tumor mutational
burden (TMB) ≥10 mutations per megabase (mut/Mb). In
addition, the Company has recently licensed TIL patents from
NIH/NCI for multiple indications in solid tumors and decided that
TIL technology platform has a higher potential to capture a broader
solid tumors market. Hence we decided to terminate the development
of CD40LGVAX and focus our clinical development effort based on the
TCR-T and TIL technologies for solid tumors.
Estimated
amortization expense for each of the ensuing years are as follows
for the years ending September 30:
|
Years
ending September 30,
|
Amount
|
|
2019
|
$1,351,076
|
|
2020
|
1,348,817
|
|
2021
|
1,343,661
|
|
2022
|
1,332,328
|
|
2023
and thereafter
|
2,777,546
|
|
|
$8,153,428
|
14
NOTE 8 – LEASES
The
Company leases facilities under non-cancellable operating lease
agreements. These facilities are located in the United
States, Hong Kong and China. The Company recognizes
rental expense on a straight-line basis over the life of the lease
period. Rent expense under operating leases for the
three and nine months ended September 30, 2018 was approximately
$679,585 and $2,628,440, respectively, as compared to $1,264,995
and $3,049,940 for the three and nine months ended September 30,
2017, respectively.
As of
September 30, 2018, the Company has the following future minimum
lease payments due under the foregoing lease
agreements:
|
Years
ending September 30,
|
Amount
|
|
2019
|
$2,856,546
|
|
2020
|
2,630,350
|
|
2021
|
2,498,662
|
|
2022
|
2,498,662
|
|
2023
and thereafter
|
10,033,593
|
|
|
|
|
|
$20,517,813
|
NOTE 9 – RELATED PARTY TRANSACTIONS
As of
September 30, 2018 and December 31, 2017, accrued expenses included
unpaid director fees of nil and $25,882.
From
time to time, cash advance is offered to employees for
business travel purposes. No interest is charged on the
outstanding balances. As of September 30, 2018 and December 31,
2017, other receivables due from officers for business travel
purposes was nil and $8,531, respectively.
NOTE 10 – EQUITY
ASC
Topic 505 Equity paragraph 505-50-30-6
establishes that share-based payment transactions with nonemployees
shall be measured at the fair value of the consideration received
or the fair value of the equity instruments issued, whichever is
more reliably measurable.
On
December 15, 2017, the Company entered into a Share Purchase
Agreement with three of its executive officers, pursuant to which
the Company agreed to sell, and the three executive officers agreed
to purchase an aggregate of 41,667 shares of the Company’s
common stock, par value $0.001 per share at $12.00 per share, for
total gross proceeds of approximately $500,000. The transaction
closed on December 22, 2017.
On
December 26, 2017, the Company entered into a Share Purchase
Agreement with two investors, pursuant to which the Company agreed
to sell and the two investors agreed to purchase from the Company,
an aggregate of 1,166,667 shares of the Company’s common
stock, par value $0.001 per share, at $12.00 per share, for total
gross proceeds of approximately $14,000,000. The transaction closed
on December 28, 2017. Together with a private placement with three
of its executive officers on December 22, 2017, the Company raised
an aggregate of approximately $14.5 million in the two private
placements in December 2017.
On
January 30, 2018 and February 5, 2018, the Company entered into
securities purchase agreements with certain investors pursuant to
which the Company agreed to sell, and the investors agreed to
purchase from the Company, an aggregate of 1,719,324 shares of the
Company’s common stock, par value $0.001 per share, at $17.80
per share, for total gross proceeds of approximately $30.6
million. The transaction closed on February 5,
2018.
15
On
September 25, 2018, the Company entered into a share purchase
agreement with Novartis Pharma AG
(“Novartis”) pursuant to which the Company agreed
to sell, and Novartis agreed to purchase from the Company, an
aggregate of 1,458,257 shares of the Company’s common stock,
par value $0.001 per share, at a purchase price of $27.43 per
share, for total gross proceeds of approximately $40 million. The
transaction closed on September 26, 2018.
During
the three and nine months ended September 30, 2018, the Company
expensed $844,181 and $2,439,887 associated with unvested option
awards and $426,287 and $1,308,195 associated with restricted
common stock issuances, respectively. During the three and nine
months ended September 30, 2017, the Company expensed $1,067,778
and $3,702,748 associated with unvested options awards and $270,931
and $538,074 associated with restricted common stock issuances,
respectively.
During
the three and nine months ended September 30, 2018, options for
101,210 and 233,484 underlying shares were exercised on a cash
basis, 101,210 and 233,484 shares of the Company’s common
stock were issued accordingly. During the three and nine months
ended September 30, 2017, options for 12,000 and 45,000 underlying
shares were exercised on a cash basis, 12,000 and 45,000 shares of
the Company’s common stock were issued
accordingly.
During
the three and nine months ended September 30, 2018, 30,538 and
66,620 of the Company's restricted common stock were issued
respectively. During the three and nine months ended September 30,
2017, 27,032 and 49,128 shares of the Company’s restricted
common stock were issued respectively.
The
Company's Board of Directors approved a stock repurchase program
granting the company authority to repurchase up to $10 million in
common shares through open market purchases pursuant to a plan
adopted in accordance with Rule 10b5-1 and 10b-18 of the Securities
Exchange Act of 1934, as amended (the “Exchange Act”)
and was announced on June 1, 2017.
For the
three and nine months ended September 30, 2018, the Company
repurchased nil and 133,974 shares of its common stock with the
total cost of nil and $2,536,064, respectively. Details are as
follows:
|
|
Total number of shares purchased
|
Average price paid per share
|
|
|
|
|
|
Treasury
stock as of December 31, 2017
|
426,794
|
$9.32
|
|
Repurchased
from January 1, 2018 to March 31, 2018
|
37,462
|
$19.10
|
|
Repurchased
from April 1, 2018 to June 30, 2018
|
96,512
|
$18.86
|
|
Repurchased
from July 1, 2018 to September 30, 2018
|
-
|
$-
|
|
|
|
|
|
Treasury
stock as of September 30, 2018
|
560,768
|
$11.62
|
NOTE 11 – COMMITMENTS AND CONTINGENCIES
Capital commitments
As of
September 30, 2018, the capital commitments of the Company are
summarized as follows:
|
|
September 30,
2018
|
|
|
|
|
Contracts
for acquisition of plant and equipment being or to be
executed
|
$1,452,986
|
16
NOTE 12 – STOCK BASED COMPENSATION
Our
stock-based compensation arrangements include grants of stock
options and restricted stock awards under its equity incentive
plans (collectively, the “Plans”), and certain awards
granted outside of these plans. The compensation cost that has been
charged against income related to stock options for the three and
nine months ended September 30, 2018 was $844,181 and $2,439,887,
respectively, and for the three and nine months ended September 30,
2017 was $1,067,778 and $3,702,748, respectively. The compensation
cost that has been charged against income related to restricted
stock awards for the three and nine months ended September 30, 2018
was $426,287 and $1,308,195, respectively, and for the three and
nine months ended September 30, 2017 was $270,931 and $538,074,
respectively.
As of
September 30, 2018, there was $4,418,388 all unrecognized
compensation cost related to an aggregate of 498,239 of non-vested
stock option awards and $3,456,690 related to an aggregate of
265,918 of non-vested restricted stock awards. These
costs are expected to be recognized over a weighted-average period
of 1.86 years for the stock options awards and 1.49 years for the
restricted stock awards.
During
the three months ended September 30, 2018, the Company issued
options to purchase an aggregate of 16,000 shares of the
Company’s common stock under the Plans. The grant date fair
value of these options was $208,940 using Black-Scholes option
valuation models with the following assumptions: exercise price
equal to the grant date stock price or average selling prices over
the 30-business day period preceding the date of grant ranging from
$20.6 to $23.55, volatility ranging from 65.15% to 66.34%, expected
life of 6.0 years, and risk-free rate ranging from 2.86% to 3.00%.
The Company is expensing these options on a straight-line basis
over the requisite service period.
During
the nine months ended September 30, 2018, the Company issued
options to purchase an aggregate of 206,682 shares of the
Company’s common stock to officers, directors and employees
under the Plans. The grant date fair value of these options was
$2,809,655 using Black-Scholes option valuation models with the
following assumptions: exercise price equal to the grant date stock
price or average selling prices over the 30-business day period
preceding the date of grant ranging from $14.5 to $23.55,
volatility ranging from 65.15% to 90.43%, expected life of 6.0
years, and risk-free rate ranging from 2.33% to 3.00%. The Company
is expensing these options on a straight-line basis over the
requisite service period.
During
the three months ended September 30, 2017, the Company issued
options to purchase an aggregate of 12,000 shares of the
Company’s common stock to officers, directors, employees and
advisors under the Plans. The grant date fair value of these
options was $76,655 using Black-Scholes option valuation models
with the following assumptions: exercise price equal to the grant
date stock price ranging from $8.55 to $8.75, volatility ranging
from 87.77% to 88.68%, expected life 6.0 years, and risk-free rate
ranging from 1.94% to 2.07%. The Company is expensing these options
on a straight-line basis over the requisite service
period.
During
the nine months ended September 30, 2017, the Company issued
options to purchase an aggregate of 523,738 shares of the
Company’s common stock to officers, directors, employees and
advisors under the Plans. The grant date fair value of these
options was $4,425,913 using Black-Scholes option valuation models
with the following assumptions: exercise price equal to the grant
date stock price ranging from $5.3 to $13.2, volatility ranging
from 87.77% to 89.62%, expected life 6.0 years, and risk-free rate
ranging from 1.86% to 2.29%. The Company is expensing these options
on a straight-line basis over the requisite service
period.
The
following table summarizes stock option activity as of September
30, 2018 and December 31, 2017 and for the nine months ended
September 30, 2018:
|
|
Number of Options
|
Weighted- Average Exercise Price
|
Weighted- Average Remaining Contractual Term (in
years)
|
Aggregate Intrinsic Value
|
|
|
|
|
|
|
|
Outstanding
as of December 31, 2017
|
1,892,189
|
$11.54
|
7.0
|
$4,909,194
|
|
Grants
|
206,682
|
|
|
|
|
Forfeitures
|
(57,324)
|
|
|
|
|
Exercises
|
(233,484)
|
|
|
|
|
Outstanding
as of September 30, 2018
|
1,808,063
|
$12.32
|
6.7
|
$12,194,007
|
|
|
|
|
|
|
|
Vested
and exercisable as of September 30, 2018
|
1,309,824
|
$11.29
|
5.9
|
$9,412,456
|
17
|
Exercise
|
Number of Options
|
|
|
Price
|
Outstanding
|
Exercisable
|
|
|
|
|
|
$3.00 - $4.95
|
185,547
|
185,547
|
|
$5.00 - $9.19
|
465,124
|
428,176
|
|
$9.20 - $15.00
|
525,070
|
303,467
|
|
$15.01 - $20.00
|
468,822
|
261,534
|
|
$20.10+
|
163,500
|
131,100
|
|
|
1,808,063
|
1,309,824
|
The aggregate intrinsic value for
stock options outstanding is defined as the positive difference
between the fair market value of our common stock and the exercise
price of the stock options.
Cash
received from option exercises under all share-based compensation
arrangements for the three and nine months ended September 30, 2018
was $1,542,840 and $2,708,603, respectively, as compared to
$159,131 and $232,910 for the three and nine months ended September
30, 2017, respectively. The proceeds were from
non-executives.
NOTE 13 – NET LOSS PER SHARE
Basic
and diluted net loss per common share is computed on the basis of
our weighted average number of common shares outstanding, as
determined by using the calculations outlined below:
|
|
For the Three Months Ended
|
For the Nine Months Ended
|
||
|
|
September 30,
|
September 30,
|
||
|
|
2018
|
2017
|
2018
|
2017
|
|
|
|
|
|
|
|
Net
loss
|
$(12,743,764)
|
$(6,202,214)
|
$(30,426,263)
|
$(18,567,725)
|
|
|
|
|
|
|
|
Weighted
average shares of common stock
|
17,604,473
|
14,349,569
|
17,281,240
|
14,310,344
|
|
Dilutive
effect of stock options
|
-
|
-
|
-
|
-
|
|
Restricted
stock vested not issued
|
-
|
-
|
-
|
-
|
|
Common
stock and common stock equivalents
|
17,604,473
|
14,349,569
|
17,281,240
|
14,310,344
|
|
|
|
|
|
|
|
Net
loss per basic and diluted share
|
$(0.72)
|
$(0.43)
|
$(1.76)
|
$(1.30)
|
Basic
and diluted net loss per share is calculated by dividing net loss
by the weighted average number of common shares outstanding during
the period, without consideration for common stock equivalents. The
Company’s potentially dilutive shares, which include unvested
restricted stock and options to purchase common stock, are
considered to be common stock equivalents and are only included in
the calculation of diluted net loss per share when their effect is
dilutive.
18
NOTE 14 – INCOME TAXES
Income
taxes are accounted for under the asset and liability method.
Deferred tax assets and liabilities are recognized for the future
tax consequences attributable to differences between the financial
statement carrying amounts of existing assets and liabilities and
their respective tax bases and operating loss and tax credit
carry-forwards. Deferred tax assets and liabilities are measured
using enacted tax rates expected to apply to taxable income in the
years in which those temporary differences are expected to be
recovered or settled. The effect of a change in tax rates on
deferred tax assets and liabilities is recognized in income in the
period during which such rates are enacted.
The
Company considers all available evidence to determine whether it is
more likely than not that some portion or all of the deferred tax
assets will be realized. The ultimate realization of deferred tax
assets is dependent upon the generation of future taxable income
during the periods in which those temporary differences become
realizable. Management considers the scheduled reversal of deferred
tax liabilities (including the impact of available carryback and
carry-forward periods), and projected taxable income in assessing
the realizability of deferred tax assets. In making such judgments,
significant weight is given to evidence that can be objectively
verified. Based on all available evidence, in particular our
three-year historical cumulative losses, recent operating losses
and U.S. pre-tax loss for the three months ended September 30,
2018, we recorded a valuation allowance against our U.S. net
deferred tax assets. In order to fully realize the U.S. deferred
tax assets, we will need to generate sufficient taxable income in
future periods before the expiration of the deferred tax assets
governed by the tax code.
In each
of the reporting period since inception, the Company has recorded a
valuation allowance for the full amount of net deferred tax assets,
as the realization of deferred tax assets is uncertain. As a
result, the Company has not recorded any federal or state income
tax benefit in the consolidated statements of operations and
comprehensive income (loss).
Under
the December 22, 2017 tax reform bill (Tax Cut and Jobs Act
(H.R.1)), top corporate tax rate was reduced from 35% to 21%
effective from January 1, 2018. Pursuant to this new Act,
non-operating loss (“NOL”) carry back period is
eliminated and an indefinite carry forward period is permitted. As
of September 30, 2018, U.S. federal and California state NOL was
$21.3 million and $15.6 million respectively. As of September 30,
2018, the Company had net operating loss carryforwards of $5
million and $19 million for Chinese income tax purposes, such
losses are set to expire in 2028 (for advanced and new technology
enterprises and small and middle technology enterprises) and 2023
(for other Chinese enterprises) for Chinese income tax purposes,
respectively. All deferred income tax expense is offset by changes
in the valuation allowance pertaining to the Company's existing net
operating loss carryforwards due to the unpredictability of future
profit streams prior to the expiration of the tax
losses. The Company's effective tax rate differs from
statutory rates of 21% for U.S. federal income tax purposes, 15%,
20% and 25% for Chinese income tax purpose and 16.5% for Hong Kong
income tax purposes due to the effects of the valuation allowance
and certain permanent differences as it pertains to book-tax
differences in the value of client shares received for
services.
Pursuant to the PRC
Corporate Income Tax Law, all of the Company’s PRC
subsidiaries are liable to PRC Corporate Income Taxes
(“CIT”) at a rate of 25% except for CBMG
Shanghai” and AG. According to Guoshuihan 2009 No. 203, if an
entity is certified as an “advanced and new technology
enterprise”, it is entitled to a preferential income tax rate
of 15%. CBMG Shanghai obtained the certificate of “advanced
and new technology enterprise” dated October 30, 2015 with an
effective period of three years and the provision for PRC corporate
income tax for CBMG Shanghai is calculated by applying the income
tax rate of 15% from 2015. The October 2015 issued certificate
expires in October, 2018 and the Company is in the process of
renewing the certificate for another three years. CBMG Shanghai is
re-applying for the certificate of “advanced and new
technology enterprise”. AG was certified as a “small
and micro enterprise” in its 2017 annual tax filing and
enjoys the preferential income tax rate of 20%. AG’s
eligibility for the reduced tax rate will need to be verified
annually.
NOTE 15 – SEGMENT INFORMATION
The
Company is engaged in the development of new treatments for
cancerous and degenerative diseases utilizing proprietary
cell-based technologies, which have been organized as one reporting
segment as they have substantially similar economic characteristic
since they have similar nature and economic characteristics. The
Company’s principle operating decision maker, the Chief
Executive Officer, receives and reviews the result of the operation
for all major cell platforms as a whole when making decisions about
allocating resources and assessing performance of the Company. In
accordance with FASB ASC 280-10, the Company is not required to
report the segment information.
19
NOTE 16 – COMPARATIVE FIGURES
Lease
deposits of $690,870 might be recovered over one year considering
the lease term, the Company recorded it in other long-term assets.
Comparative figures of $732,098 have been reclassified to conform
with the current period’s presentation to facilitate
comparison.
NOTE 17 – SUBSEQUENT EVENTS
On
October 2, 2018, the Company entered into a non-exclusive license
agreement (the “License Agreement”) with The U.S.
Department of Health and Human Services, as represented by the
National Cancer Institute (“NCI”), an Institute or
Center (the “IC”) of the National Institutes of Health,
pursuant to which the Company was granted rights to the worldwide
development, manufacture and commercialization of autologous,
tumor-reactive lymphocyte adoptive cell therapy products, isolated
from tumor infiltrating lymphocytes as claimed in the IC licensed
patent rights, for the treatment of non-small cell lung, stomach,
esophagus, colorectal, and head and neck cancer(s) in
humans.
On
October 10, 2018, the Company commenced a share repurchase program
(the “2018 Share Repurchase Program”), pursuant to
which the Company may, from time to time, purchase shares of its
common stock for an aggregate purchase price not to exceed
approximately $8.48 million. As previously reported on a
Current Report on Form 8-K filed with the Securities and Exchange
Commission on June 1, 2017, the Company authorized a stock
repurchase program (“2017 Share Repurchase Program”),
under which approximately $6.52 million in shares of common stock
were repurchased. It is contemplated that total shares to be
repurchased under the 2017 and 2018 Share Repurchase Programs shall
not exceed $15 million in the aggregate.
On
October 17, 2018, the Company received a grant of $872,194 from
Shanghai Zhangjiang government for the Company’s research and
development establishment in Zhangjiang Hi-Tech Park.
On October 29, 2018, after reassessing the return
of investment to develop GVAX for cancer therapies in the current
competitive market the Company
notified USF and Moffitt to terminate its GVAX license
agreements.
On
November 2, 2018 we relocated our principal executive offices from
Cupertino, California to New York, New York.
20
ITEM 2. MANAGEMENT’S DISCUSSION AND ANALYSIS OF FINANCIAL
CONDITION AND RESULTS OF OPERATIONS
The following discussion and analysis summarizes the significant
factors affecting our results of operations, financial condition
and liquidity position for the three and nine months ended
September 30, 2018 and 2017, and should be read in conjunction with
our unaudited condensed consolidated financial statements and
related notes included elsewhere in this filing.
This
report contains forward-looking statements. These statements relate
to future events or to our future financial performance and involve
known and unknown risks, uncertainties and other factors which may
cause our actual results, performance or achievements to be
materially different from any future results, performance or
achievements expressed or implied by the forward-looking
statements.
Factors
that might affect our forward-looking statements include, among
other things:
|
●
|
overall
economic and business conditions;
|
|
●
|
U.S.
and China’s foreign policies;
|
|
●
|
the
demand for our products and services;
|
|
●
|
competitive
factors in the market in which we compete;
|
|
●
|
the
emergence of new technologies which compete with our product and
service offerings;
|
|
●
|
our
cash position and cash burn rate;
|
|
●
|
other
capital market conditions, including availability of funding
sources;
|
|
●
|
the
strength of our intellectual property portfolio; and
|
|
●
|
changes
in government regulations in China and in the U.S. related to
our industries.
|
In some
cases, you can identify forward-looking statements by terms such as
“may”, “will”, “should”,
“could”, “would”, “expects”,
“plans”, “anticipates”,
“believes”, “estimates”,
“projects”, “predicts”,
“potential” and similar expressions. These statements
reflect our current views with respect to future events and are
based on assumptions and are subject to risks and uncertainties.
Given these uncertainties, you should not place undue reliance on
these forward-looking statements. We discuss many of these risks in
greater detail under the heading “Risk Factors”
included in other reports we file with the Securities and Exchange
Commission. Also, these forward-looking statements represent our
estimates and assumptions only as of the date of the document
containing the applicable statement.
Unless
required by law, we undertake no obligation to update or revise any
forward-looking statements to reflect new information or future
events or developments. Thus, you should not assume that our
silence over time means that actual events are bearing out as
expressed or implied in such forward-looking
statements.
21
OVERVIEW
The
“Company”, “CBMG”, “we”,
“us”, “our” and similar terms refer to
Cellular Biomedicine Group, Inc. (a Delaware corporation) as a
combined entity including each of its subsidiaries and controlled
companies, unless the context otherwise requires.
Recent Developments
On
January 3, 2017, we announced the signing of a ten-year lease
of an 113,038-square foot building located in the
“Pharma Valley” in Shanghai Zhangjiang High-Tech Park.
The new facility designed and built to GMP standards has
approximately 40,000 square feet dedicated to advanced cell
manufacturing. We invested approximately $10 million to
transform the Zhangjiang GMP facility and leasehold improvement. At
the end of 2017, the combination of new Zhangjiang facility, an
expanded Wuxi, and Beijing facilities, have an aggregate of
approximately 70,000 square feet for cell
manufacturing.
On
January 9, 2017, we announced the commencement of patient
enrollment in China for our CALL-1 (“CAR-T against Acute
Lymphoblastic Leukemia”) Phase I clinical trial of CD19 CAR-T
therapy utilizing our optimized proprietary C-CAR011 construct for
the treatment of patients with relapsed or refractory (r/r) CD19+
B-cell ALL. We have been enrolling patients and working with the
China Center for Drug Evaluation (“CDE”) of the NMPA to
obtain approval of the Company’s IND
application.
On May
15, 2017, we announced the addition of a new independent Phase
I clinical trial of the Company’s ongoing CARD-1 study in
patients with chemorefractory or refractory B cell Non-Hodgkin
Lymphoma ("NHL"). The Company and Shanghai Tongji Hospital are
conducting a single arm, non-randomized study to evaluate the
safety and efficacy of C-CAR011 (Anti-CD19 single-chain variable
fragment (scFv) (41BB-CD3zeta)) therapy in relapsed or refractory B
cell NHL patients. We have been enrolling patients and working with
CDE to obtain approval of the Company’s IND
application.
On June
1, 2017, we announced that our Board of Directors approved a stock
repurchase program (the “2017 Share Repurchase
Program”) granting the Company authority to repurchase up to
$10 million in common shares through open market
purchases pursuant to a plan adopted in accordance with Rule 10b5-1
and Rule 10b-18 of the Securities Exchange Act of 1934, as amended
(the “Exchange Act”). The program contemplated
repurchases of shares of the Company’s common stock in the
open market in accordance with all applicable securities laws and
regulations. From June 2017 to June 2018 the Company repurchased a
total of 560,768 shares at a total price of $6,513,993, or an
average of $11.62 per share.
On June
20, 2017, we announced the establishment of an External Advisory
Board and the appointment of Michael A. Caligiuri, MD, then
President of the AACR and director of The Ohio State University
Comprehensive Cancer Center and CEO of the Arthur G. James Cancer
Hospital and Richard J. Solove Research Institute in Columbus,
Ohio, as Chair of the External Advisory Board to bring together
experts from diverse disciplines to provide knowledge and insight
to help CBMG fulfill its mission and build a network for
development opportunities. Dr. Caligiuri is president of City of
Hope National Medical Center and physician-in-chief.
On June
26, 2017, we announced the appointment of Dr. Xia Meng as Chief
Operating Officer for the Company. On February 6, 2018, driven by
the Company’s strategic move to expand its business
operations in early diagnosis and cancer intervention, Meng Xia
transitioned from the role of Chief Operating Officer to Head of
the Early Diagnosis & Intervention for the
Company.
On
November 4, 2017, we announced the grand opening of our Zhangjiang
facility. On the same day, we announced the signing of a strategic
partnership with Thermo Fisher Scientific (China) Ltd. to build a
joint Cell Therapy Technology Innovation and Application Center at
CBMG’s newly opened Shanghai Zhangjiang
facility.
On
December 28, 2017, we announced the closing of two private
placement transactions pursuant to which we sold an aggregate of
1,208,333 shares of the Company’s common stock to select key
executives and private investors at $12.00 per share, for total
aggregate gross proceeds of approximately $14.5
million.
On
January 30, 2018 and February 5, 2018, we entered into securities
purchase agreements with certain investors pursuant to which the
Company agreed to sell, and the investors agreed to purchase from
the Company, an aggregate of 1,719,324 shares (the “February
2018 Private Placement”) of the Company’s common stock,
par value $0.001 per share, at $17.80 per share, for total gross
proceeds of approximately $30.6 million. The transaction
closed on February 5, 2018. Pursuant to the purchase agreement, the
Investors have the right to nominate one director to the board of
directors of the Company to stand for election at the 2018 Annual
Meeting of Stockholders. Effective as of the closing of the
February 2018 Private Placement, Bosun S. Hau was appointed as a
non-executive Class III director of the Company and his appointment
was subsequent ratified by the shareholders during the Annual
Shareholders Meeting on April 27, 2018,
On
February 15, 2018, we obtained a 36–month exclusive option
with Augusta University to negotiate a royalty-bearing, exclusive
license to the patent rights owned by the Augusta University
relating to an invention to identify novel alpha fetoprotein
(“AFP”) specific TCR for a hepatocellular carcinoma
(“HCC”) immunotherapy. The Company is evaluating the
feasibility and opportunities of this novel alpha fetoprotein TCR
to redirect T Cells for the HCC indication. We are evaluating the
efficacy and specificity of the AFP TCR to identity the most
appropriate candidate for first time in human ("FTIH") study. In
addition, human CD8+ T cells will be redirected with the AFP TCRs
and their anti-tumor activity will be evaluated by in vitro
cytokine release assay and cytotoxicity assay. Concurrently,
potential on/off-target toxicity including allo-reactivity will
also be evaluated and the best candidate TCRs for clinical use will
be further tested in humanized mouse models. We plan to exercise
our exclusive right to license the technology from Augusta
University if and when the FTIH proof of mechanism study shows
promising clinical efficacy signal and manageable safety
profile.
22
On
March 16, 2018, we issued a press release announcing the
presentation of the Allojoin™ Phase I 48-week data in China,
as well as the termination of the Company’s U.S.
Allojoin™ program with CIRM to focus the clinical development
in China. Prior to termination, the Company had received $1.2
million of the potential $2.29 million available under the CIRM
grant.
On
April 18, 2018 and April 21, 2018, the NMPA CDE posted on its
website acceptance of the IND application for CAR-T cancer
therapies in treating patients with NHL and ALL submitted by two of
the wholly-owned subsidiaries of the Company,
respectively. Thus far, a total of
three Chinese companies that submitted their IND
application ahead of the Company have received approval of their
IND application for CAR-T cancer therapies.
On June
22, 2018, the Company announced the grand opening of its new
research and development center in Gaithersburg,
Maryland.
On
September 25, 2018, the Company, together with certain of its
subsidiaries and controlled entities, entered into a License and
Collaboration Agreement (the “Collaboration Agreement”)
with Novartis pursuant to which the Company will manufacture and
supply Novartis the T CAR-T cell therapy Kymriah®
(tisagenlecleucel) (the “Product”) in China. The
Company also granted Novartis a world-wide license certain of its
intellectual property and technology, including intellectual
property and technology related to the Product. Such license is
exclusive with respect to the development, manufacture and
commercialization of the Product and non-exclusive with respect to
the development, manufacture and commercialization of other
products.
Also,
on September 25, 2018, we entered into a Share Purchase Agreement
with Novartis pursuant to which the Company agreed to sell, and
Novartis agreed to purchase from the Company, an aggregate of
1,458,257 shares of the Company’s common stock, at a purchase
price of $27.43 per share, which was the equivalent of 130% of the
volume-weighted average price of the Common Stock for the prior 20
consecutive trading days, for total gross proceeds of approximately
$40 million (the “Private Placement”). In
connection with the Private Placement, the Company filed a Form S-3
with the SEC on October 10, 2018 to satisfy the registration
requirement. The SEC declared the registration effective on October
22 and the Company filed the Private Placement Prospectus on
October 23, 2018.
On
October 2, 2018, we entered into entered into a non-exclusive
license agreement with The U.S. Department of Health and Human
Services, as represented by National Cancer Institute, an Institute
or Center (the “IC”) of the National Institutes of
Health, pursuant to which the Company was granted rights to the
worldwide development, manufacture and commercialization of
autologous, tumor-reactive lymphocyte adoptive cell therapy
products, isolated from tumor infiltrating lymphocytes as claimed
in the IC licensed patent rights, for the treatment of non-small
cell lung, stomach, esophagus, colorectal, and head and neck
cancer(s) in humans.
On
October 10, 2018, we announced that we commenced a stock repurchase
program (the “2018 Share Repurchase Program”) granting
the Company authority to purchase up to $8.48 million in
common shares through open market purchases pursuant to a plan
adopted in accordance with Rule 10b5-1 and Rule 10b-18 of the
Exchange Act. The program contemplated repurchases of shares of the
Company’s common stock in the open market in accordance with
all applicable securities laws and regulations. It is
contemplated that total shares to be repurchased under the 2017 and
2018 Share Repurchase Programs shall not exceed $15 million in the
aggregate.
On October 29, 2018, after reassessing the
return of investment to develop GVAX for cancer therapies in the
current competitive market the Company
notified USF and Moffitt to terminate its GVAX license
agreements.
On
November 2, 2018, we relocated our principal executive offices from
Cupertino, California to New York, New York.
In the
next 12 months, we aim to accomplish the following, though there
can be no assurances that we will be able to accomplish any of
these goals:
●
Execute
the technical transfer and align the manufacturing processes with
Novartis to support Novartis’ development of the
Kymriah® therapy in China;
●
Advance Allojoin™ and Rejoin™ KOA IND
applications with the NMPA’s CDE and initiate clinical
studies to support the BLA submissions in China;
●
Bolster R&D resources to fortify our
intellectual properties portfolio and scientific development.
Continue to develop a competitive cell therapy pipeline for
CBMG. Seek opportunities to file new patent applications in
potentially the rest of the world and in
China;
●
Leveraging
our quality system and our strong scientific expertise to develop a
platform as preferred parties for international pharmaceutical
companies to co-develop cell therapies in China by implementing our
quality strategies and leveraging the experience and expertise of
our strong scientific team in the U.S. and in China;
23
●
Initiate
an investigator sponsored phase I trial of anti-BCMA CAR-T in
adults with relapsed/refractory multiple myeloma;
●
Evaluate
and implement digital platform system for research, material
management, production and clinical data tracking;
●
Evaluate
new regenerative medicine technology platform for other indications
and review recent development in the competitive
landscape;
●
Advance
our Quality Management System (QMS), Validation Master
Plan VMP) and quality assurance automation;
●
Initiate
investigator sponsored studies and/or CBMG sponsored clinical
trials of:
o
Anti-BCMA
CAR-T in Multiple Myeloma (MM)
o
Anti-CD22
CAR-T in hairy cell leukemia (HCL) and anti-CD19 CAR-T relapsing
ALL
o
NKG2D
CAR-T in acute myeloid leukemia (AML)
o
Alpha
Fetoprotein Specific TCR-T for HCC
o
anti-CD
20 CAR-T for anti-CD19 CAR-T relapsing NHL
o
TIL
for solid tumors;
●
Improve
liquidity and fortify our balance sheet by courting institutional
investors; and
●
Evaluate
possibility of dual listing on the Hong Kong Stock Exchange to
expand investor base in Asia.
Corporate History
Please
refer to Note 1 of unaudited condensed consolidated financial
statements for the corporate history.
BIOPHARMACEUTICAL BUSINESS
The
biopharmaceutical business was founded in 2009 by a team of
seasoned Chinese-American executives, scientists and doctors. In
2010, we established a facility designed and built to China's Good
Manufature Practice (GMP) standards in Wuxi, China and in 2012 we
established a U.S. Food and Drug Administration (FDA) GMP standard
protocol-compliant manufacturing facility in Shanghai. In October
2015, we opened a facility designed and built to GMP standards in
Beijing. In November 2017, we opened our Zhangjiang facility in
Shanghai, of which 40,000 square feet was designed and built to GMP
standards and dedicated to advanced cell manufacturing. Our focus
has been to serve the rapidly growing health care market in China
by marketing and commercializing immune cell and stem cell
therapeutics, related tools and products from our patent-protected
homegrown and acquired cell technology, as well as by utilizing
in-licensed and other acquired intellectual
properties.
Our
current treatment focal points are KOA and cancer and we are
evaluating companion diagnostics that can benefit personalized
cancer treatment.
Cancer. We are focusing our
clinical development efforts on CD20-, CD22- and B-cell maturation
antigen (BCMA)-specific CAR-T therapies, T-cell receptor (TCR) and
tumor infiltrating lymphocyte (TIL) technologies. With the
execution of the Novartis Collaboration Agreement we have
prioritized our efforts on working with Novartis to bring Kymriah
to patients in China as soon as practicable. In view of our
collaboration with Novartis, we will no longer pursue our own ALL
and DLBCL BLA submission with the National Medical Products
Administration (NMPA). On the research and development side we will
endeavor to bring our CD22 HCL and CD19 CAR-T relapsing ALL, CD 20
for CD19 CAR-T Relapsing NHL, BCMA in Multiple Myeloma (MM), NKG2D
in acute myeloid leukemia (AML), AFP TCR-T in Hepatocellular
carcinoma (HCC) and neoantigen reactive TIL on solid tumors,
respectively, in first in human trial as soon as possible. We plan
to continue to leverage our quality system and our strong
scientific expertise to develop a platform as preferred parties for
international pharmaceutical companies to co-develop cell therapies
with the Company in China by implementing our quality strategies
and leveraging the experience and expertise of our strong
scientific team in the U.S and in China.
KOA. In 2013, we completed a
Phase I/IIa clinical study, in China, for our KOA therapy named
Re-Join®. The trial tested the safety and efficacy of
intra-articular injections of autologous haMPCs in order to reduce
inflammation and repair damaged joint cartilage. The 6-month
follow-up clinical data showed Re-Join® therapy to be both
safe and effective.
24
In Q2
of 2014, we completed patient enrollment for the Phase IIb clinical
trial of Re-Join® for KOA. The multi-center study enrolled 53
patients to participate in a randomized, single blind trial. We
published 48 weeks follow-up data of Phase I/IIa on December 5,
2014. The 48 week data indicated that patients have
reported a decrease in pain and a significant improvement in
mobility and flexibility, while the clinical data shows our
Re-Join® regenerative medicine treatment to be
safe. We announced the interim 24 week results for
Re-Join® on March 25, 2015 and released positive
Phase IIb 48 week follow-up data in January 2016, which shows the
primary and secondary endpoints of Re-Join® therapy group
having all improved significantly compared to their baseline, which
has confirmed some of the Company’s Phase I/IIa results. Our
Re-Join® human adipose-derived mesenchymal progenitor cell
(haMPC) therapy for KOA is an interventional therapy using
proprietary process, culture and medium.
Our
process is distinguishable from sole Stromal Vascular Fraction
(SVF) therapy. The immunophenotype of our haMPCs exhibited multiple
biomarkers such as CD29+, CD73+, CD90+, CD49d+, HLA-I+, HLA-DR-,
Actin-, CD14-, CD34-, and CD45-. In contrast, SVF is
merely a heterogeneous fraction including preadipocytes,
endothelial cells, smooth muscle cells, pericytes, macrophages,
fibroblasts, and adipose-derived stem cells.
In
January 2016, we launched the Allogeneic KOA Phase I Trial in China
to evaluate the safety and efficacy of AlloJoin™, an off-the
shelf allogeneic adipose derived progenitor cell (haMPC) therapy
for the treatment of KOA. On August 5, 2016 we completed patient
treatment for the Allogeneic KOA Phase I trial, and on December 9,
2016 we announced interim 3-month safety data from the Allogenic
KOA Phase I Trial in China. The interim analysis of the trial has
preliminarily demonstrated a safety and tolerability profile of
AlloJoin™ in the three doses tested, and no serious adverse
events (SAE) have been observed. On March 16, 2018, we announced
the positive 48-week Allojoin™ Phase I data in China, which
demonstrated good safety and early efficacy for the prevention of
cartilage deterioration. China has finalized its cell therapy
policy in December, 2017. We plan to advance the KOA IND
application for AlloJoin™ with NMPA in the near
future.
The
unique lines of adult adipose-derived progenitor cells and the
immune cell therapies enable us to create multiple cell
formulations in treating specific medical conditions and diseases.
The quality management systems of CBMG Shanghai were issued a
Certificate of ISO-9001:2015 in 2018 and to be updated to 9001:2015
in this year. (i)The cleanrooms in our new facility are ISO 14644
certified and in compliance with China’s Good Manufacture
Practice (GMP) requirement (2010 edition); (ii) the equipment in
the new Shanghai facility has been calibrated and qualified, and
the biological safety cabinets were also qualified. The quality
management systems of CBMG Wuxi were certified as meeting the
requirement of ISO-9001:2015, and the facility and equipment were
also qualified.
Our
proprietary processes and procedures include (i) banking of
allogenic cellular product and intermediate product; (ii)
manufacturing procedures of GMP-grade viral vectors; (iii)
manufacturing procedures of GMP-grade cellular product; (iv)
analytical testing to ensure the safety, identity, purity and
potency of cellular product.
Recent Developments in Cancer Cell Therapy
According to the
U.S. National Cancer Institute’s 2013 cancer topics research
update on CAR-T-Cells, excitement is growing for
immunotherapy—therapies that harness the power of a
patient’s immune system to combat their disease, or what some
in the research community are calling the “fifth
pillar” of cancer treatment.
One
approach to immunotherapy involves engineering patients’
own immune cells to recognize and attack their tumors. This
approach is called adoptive cell transfer (ACT). ACT’s
building blocks are T cells, a type of immune cell collected
from the patient’s own blood. One of the well-established ACT
approaches is CAR-T cancer therapy. After collection, the T
cells are genetically engineered to produce special
receptors on their surface called chimeric antigen receptors
(CARs). CARs are proteins that allow the T cells to recognize
a specific protein (antigen) on tumor cells. These engineered
CAR-T cells are then grown until they number in the billions.
The expanded population of CAR-T cells is then infused into
the patient. After the infusion, if all goes as planned, the T
cells multiply in the patient’s body and, with guidance
from their engineered receptor, recognize and kill cancer
cells that harbor the antigen on their surfaces. This process
builds on a similar form of ACT pioneered from
NCI’s Surgery Branch for patients with advanced
melanoma. According to www.cancer.gov/.../research-updates/2013/CAR-T-Cells,
in 2013 NCI’s Pediatric Oncology Branch commented that
the CAR-T cells are much more potent than anything they can
achieve with other immune-based treatments being
studied. Although investigators working in this field caution
that there is still much to learn about CAR T-cell therapy,
the early results from trials like these have generated
considerable optimism.
CAR-T
cell therapies, such as anti-CD19 CAR-T and anti-BCMA CAR-T, have
been tested in several hematological indications on patients
that are refractory/relapsing to chemotherapy, and many of
them have relapsed after stem cell transplantation. All
of these patients had very limited treatment option prior
to CAR-T therapy. CAR-T has shown encouraging clinical
efficacy in many of these patients, and some of them have durable
clinical response for years. However, some adverse effects, such as
cytokine release syndrome (CRS) and neurological toxicity, have
been observed in patients treated with CAR-T cells. For example, in
July 2016, Juno Therapeutics, Inc. reported the death of
patients enrolled in the U.S. Phase II clinical trial of
JCAR015 (anti-CD19 CAR-T) for the treatment of relapsed or
refractory B cell acute lymphoblastic leukemia (B-ALL). The US
FDA put the trial on hold and lifted the hold within a
week after Juno provided satisfactory explanation and
solution. Juno attributed the cause of patient deaths to the
use of Fludarabine preconditioning and they switched to use
only cyclophosphamide pre-conditioning in subsequent
enrollment.
In
August 2017, the U.S. FDA approved Novartis’ Kymriah
(tisagenlecleucel), a CD19-targeted CAR-T therapy, for the
treatment of patients up to 25 years old for relapsed or refractory
(r/r) acute lymphoblastic leukemia (ALL), the most common
cancer in children. Current treatments show a rate of 80%
remission using intensive chemotherapy. However, there
are almost no conventional treatments to help patients who have
relapsed or are refractory to traditional treatment. Kymriah
has shown results of complete and long lasting remission, and
was the first FDA-approved CAR-T therapy. In October 2017, the
U.S. FDA approved Kite Pharmaceuticals’ (Gilead) CAR-T
therapy for diffuse large B-cell lymphoma (DLBCL), the most
common type of NHL in adults. The initial results
of axicabtagene ciloleucel (Yescarta), the prognosis of
high-grade chemo refractory NHL is dismal with a medium
survival time of a few weeks. Yescarta is a therapy
for patients who have not responded to or who have relapsed
after at least two other kinds of treatment.
25
In May
2018, the FDA approved Novartis’ Kymriah for intravenous
infusion for its second indication - the treatment of adult
patients with relapsed or refractory (r/r) large B-cell lymphoma
after two or more lines of systemic therapy including diffuse large
B-cell lymphoma (DLBCL) not otherwise specified, high grade B-cell
lymphoma and DLBCL arising from follicular lymphoma. Kymriah is now
the only CAR-T cell therapy to receive FDA approval for two
distinct indications in non-Hodgkin lymphoma (NHL) and B-cell ALL.
On September 25, 2018, we entered into the Collaboration Agreement
with Novartis to manufacture and supply Kymriah to Novartis in
China.
Besides
anti-CD19 CAR-T, anti-BCMA CAR-T has shown promising clinical
efficacy in treatment of multiple myeloma. For example, bb2121, a
CAR-T therapy targeting BCMA, has been developed by Bluebird bio,
Inc. and Celgene for previously treated patients with multiple
myeloma. Based on preliminary clinical data from the ongoing phase
1 study CRB-401, bb2121 has been granted Breakthrough Therapy
Designation by the U.S. FDA and PRIME eligibility by the European
Medicines Agency (EMA) in November 2017. We plan to initiate our
anti-BCMA CAR-T investigator initiated trial in late
2018.
Recent
progress in Universal Chimeric Antigen Receptor (UCAR) T-cells
showed benefits such as ease of use, availability and the drug
pricing challenge. Currently, most therapeutic UCAR products have
been developed with gene editing platforms such as CRISPR or TALEN.
For example, UCART19 is an allogeneic CAR T-cell product candidate
developed by Cellectis for treatment of CD19-expressing
hematological malignancies. UCART19 Phase I clinical trials started
in adult and pediatric patients in Europe in June 2016 and in the
U.S. in 2017. The use of UCAR may has the potential to overcome the
limitation of the current autologous approach by providing an
allogeneic, frozen, “off-the-shelf” T cell product for
cancer treatment.
While
CAR-T cell therapy has been proven successful in treatment of
several hematological malignancies, other cell therapy approaches,
including Tumor Infiltrating Lymphocytes (TIL) and T Cell Receptor
engineered T cells (TCR-Ts) are being developed to treat solid
tumors. For example, Iovance Biotherapeutics is focused on the
development of autologous tumor-directed TILs for treatments of
patients with various solid tumor
indications. Iovance is conducting several Phase 2
clinical trials to assess the efficacy and safety of autologous TIL
for treatment of patients with Metastatic Melanoma, Squamous Cell
Carcinoma of the Head and Neck, Non-Small Cell Lung Cancer (NSCLC)
and Cervical Cancer in the US and Europe.
Adaptimmune is
partnering with GlaxoSmithKline to develop TCR-T
therapy targeting the NY-ESO-1 peptide, which is present across
multiple cancer types. Their NY-ESO SPEAR T-cell has been used in
multiple Phase 1/2 clinical trials in patients with solid tumors
and haematological malignancies, including synovial sarcoma, myxoid
round cell liposarcoma, multiple myeloma, melanoma, NSCLC and
ovarian cancer. The initial data suggested positive clinical
responses and evidence of tumor reduction in patients. NY-ESO
SPEART T-cell has been granted breakthrough therapy designation by
the U.S. FDA and PRIME regulatory access in Europe.
Adaptimmune’s other TCR-T product, AFP SPEAR T-cell targeting
AFP peptide, is aimed at the treatment of patients with
hepatocellular carcinoma (HCC). AFP SPEAR T-cell is in a Phase I
study and enrolling HCC patients in the U.S.
In
December 2017, the Chinese government issued trial guidelines
concerning the development and testing of cell therapy products in
China. Although these trial guidelines are not yet codified as
mandatory regulation, we believe they provide a measure of clarity
and a preliminary regulatory pathway for our cell therapy
operations in a still uncertain regulatory environment. On April 18
and April 21, 2018, the CDE posted on its website acceptance of the
IND application for CAR-T cancer therapies in treating patients
with NHL and adult ALL submitted by the Company’s
wholly-owned subsidiaries Cellular Biomedicine Group (Shanghai)
Ltd. and Shanghai Cellular Biopharmaceutical Group Ltd. On
September 25, 2018 we entered into a strategic licensing and
collaboration agreement with Novartis to manufacture and supply
Kymriah in China. As part of the deal, Novartis took approximately
a 9% equity stake in CBMG, and CBMG is discontinuing development of
its own anti-CD19 CAR-T cell therapy. This collaboration with
Novartis reflects our shared commitment to bringing the first
marketed CAR-T cell therapy, Kymriah, a transformative treatment
option currently approved in the US, EU and Canada for two
difficult-to-treat cancers, to China where the number of patients
in need remains the highest in the world. Together with Novartis,
we plan to bring the first CAR-T cell therapy to patients in China
as soon as possible. We continue to develop CAR-T therapies other
than CD 19 on our own and Novartis has the first right of
negotiation on these CAR-T developments. The CBMG oncology pipeline
includes preclinical compounds targeting CD20-, CD22- and B-cell
maturation antigen (BCMA)-specific CAR-T compounds, TCR and TIL
technologies. Our current priority is to collaborate with Novartis
to bring Kymriah to China. At the same time, we remain committed to
developing our existing pipeline of immunotherapy candidates for
hematologic and solid tumor cancers to help deliver potential new
treatment options for patients in China. We are striving to build a
competitive research and development function, a translational
medicine unit, along with a well-established cellular manufacturing
capability and ample capacity, to support Kymriah in China and our
development of multiple assets in multiple indications. We believe
that these efforts will allow us to boost the Company's
Immuno-Oncology presence. We expect to initiate first in-human
multiple CAR-T and TCR-T therapies in coming quarters.
Market for Stem Cell-Based Therapies
The
forecast is that in the United States, shipments of treatments with
stem cells or instruments which concentrate stem cell preparations
for injection into painful joints will fuel an overall increase in
the use of stem cell based treatments and an increase to $5.7
billion in 2020, with key growth areas being Spinal Fusion, Sports
Medicine and Osteoarthritis of the joints. According to Centers for
Disease Control and Prevention. Prevalence of doctor-diagnosed
arthritis and arthritis-attributable activity limitation United
States. 2010-2012, Osteoarthritis (OA) is a chronic disease that is
characterized by degeneration of the articular cartilage,
hyperosteogeny, and ultimately, joint destruction that can affect
all of the joints. According to Dillon CF, Rasch EK, Gu Q et al.
Prevalence of knee osteoarthritis in the United States: Arthritis
Data from the Third National Health and Nutrition Examination
Survey 1991-94. J Rheumatol. 2006, the incidence of OA is 50% among
people over age 60 and 90% among people over age 65. KOA accounts
for the majority of total OA conditions and in adults, OA is the
second leading cause of work disability and the disability
incidence is high (53%). The costs of OA management have grown
exponentially over recent decades, accounting for up to 1% to 2.5%
of the gross national product of countries with aging populations,
including the U.S., Canada, the UK, France, and Australia.
According to the American Academy of Orthopedic Surgeons (AAOS),
the only pharmacologic therapies recommended for OA symptom
management are non-steroidal anti-inflammatory drugs (NSAIDs) and
tramadol (for patients with symptomatic osteoarthritis). Moreover,
there is no approved disease modification therapy for OA in the
world. Disease progression is a leading cause of hospitalization
and ultimately requires joint replacement surgery. In 2009, the
U.S. spent over $42 billion on replacement surgery for hip and knee
joints alone. International regulatory guidelines on clinical
investigation of medicinal products used in the treatment of OA
were updated in 2015, and clinical benefits (or trial outcomes) of
a disease modification therapy for KOA has been well defined and
recommended. Medicinal products used in the treatment of
osteoarthritis need to provide both a symptom relief effect for at
least 6 months and a structure modification effect to slow
cartilage degradation by at least 12 months. Symptom relief is
generally measured by a composite questionnaire Western Ontario and
McMaster Universities Osteoarthritis Index (WOMAC) score, and
structure modification is measured by MRI, or radiographic image as
accepted by international communities. The Company uses the WOMAC
as primary end point to demonstrate symptom relief, and MRI to
assess structure and regeneration benefits as a secondary
endpoint.
26
According to the
Foundation for the National Institutes of Health, there are 27
million Americans with Osteoarthritis (OA), and symptomatic Knee
Osteoarthritis (KOA) occurs in 13% of persons aged 60 and older.
The International Journal of Rheumatic Diseases, 2011 reports that
approximately 57 million people in China suffer from KOA. Currently
no treatment exists that can effectively preserve knee joint
cartilage or slow the progression of KOA. Current common drug-based
methods of management, including anti-inflammatory medications
(NSAIDs), only relieve symptoms and carry the risk of side effects.
Patients with KOA suffer from compromised mobility, leading to
sedentary lifestyles; doubling the risk of cardiovascular diseases,
diabetes, and obesity; and increasing the risk of all causes of
mortality, colon cancer, high blood pressure, osteoporosis, lipid
disorders, depression and anxiety. According to the Epidemiology of
Rheumatic Disease (Silman AJ, Hochberg MC. Oxford Univ. Press,
1993:257), 53% of patients with KOA will eventually become
disabled.
Our Strategy
In
addition to the manufacturing Novartis’ Kymriah for patients
in China that is contemplated by the Collaboration Agreement and
Manufacture and Supply Agreement with Novartis, we are also
actively developing and evaluating other therapies comprised of
other CAR-T, TCR-T and TIL. We plan to advance our KOA IND
applications for Allojoin™ and Rejoin™ with the NMPA in
the near future.
In
addition to our drug development efforts, we also actively seek
co-development opportunities with international partners. We
believe that such partnership will enable us to take advantage of
the technologies of our partners such as international
pharmaceutical companies while leveraging our quality control and
manufacturing infrastructure and further expand our pipelines in a
relatively rapid fashion.
Our
goal is to develop safe and effective cellular medicine therapies
for indications that represent a large unmet need in China, based
on technologies developed both in-house and obtained through
acquisition, licensing and collaboration arrangements with
other companies. We intend to use our first-mover advantage in
China, against a backdrop of enhanced regulation by the central
government, to differentiate ourselves from the competition and
establish a leading position in the China cell therapeutic
market. We believe that few competitors in
China are as well-equipped as we are in the clinical trial
development, diversified international standard protocol compliant
manufacturing facilities, quality assurance and control processes,
regulatory compliance vigor, as well as continuous process
improvement to speed up manufacturing timelines for its cell
therapy clinical trials and commercial launch.
In
order to expedite fulfillment of patient treatment, we have been
actively developing technologies and products with a strong
intellectual properties protection, including haMPC, derived from
fat tissue, for the treatment of KOA and other indications.
CBMG’s acquisition of a 36-month exclusive option to license
the patent rights owned by the Augusta University relating to an
invention to identify novel alpha fetoprotein specific T-cell
receptors (TCR) for a hepatocellular carcinoma (HCC) immunotherapy
provides an enlarged opportunity to expand the application of
CBMG’s cancer therapy-enabling technologies and to initiate
clinical trials with leading cancer hospitals.
Our
proprietary and patent-protected production processes enable us to
produce raw material, manufacture cells, and conduct cell banking
and distribution. Our clinical protocols include medical assessment
to qualify each patient for treatment, evaluation of each patient
before and after a specific therapy, cell transplantation
methodologies including dosage, frequency and the use of adjunct
therapies, handling potential adverse effects and their proper
management. Applying our proprietary intellectual property, we plan
to customize specialize formulations to address complex diseases
and debilitating conditions.
We have
a total of approximately 70,000 square feet of manufacturing space
in four locations, the majority of which is in the new Shanghai
facility. We operate our manufacturing facilities under the design
of the standard (GMP) conditions in the ISO accredited laboratories
standard. We employ institutionalized and proprietary process and
quality management system to optimize reproducibility and to hone
our efficiency. Our Beijing, Shanghai and Wuxi facilities are
designed and built to meet international GMP standards. With our
integrated Plasmid, Viral Vectors, and CAR-T cells
Chemistry, Manufacturing, and Controls processes and expanding
capacity, we are highly distinguishable from other companies in the
cellular medicine space.
Most
importantly, our seasoned cell therapy team members have decades of
highly-relevant experience in the United States, China, and
European Union. We believe that these are the primary factors that
make CBMG a high quality cell products manufacturer in
China.
27
Our Targeted Indications and Potential Therapies
The
chart below illustrates CBMG’s pipelines:
CBMG Immuno-Oncology pipeline
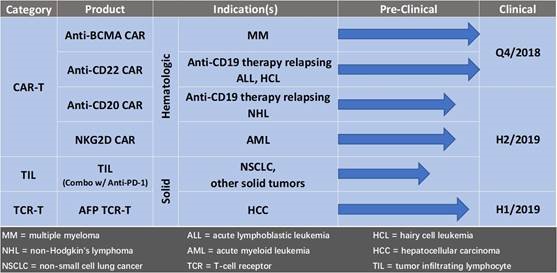
28
Our Stem
Cell KOA Pipeline
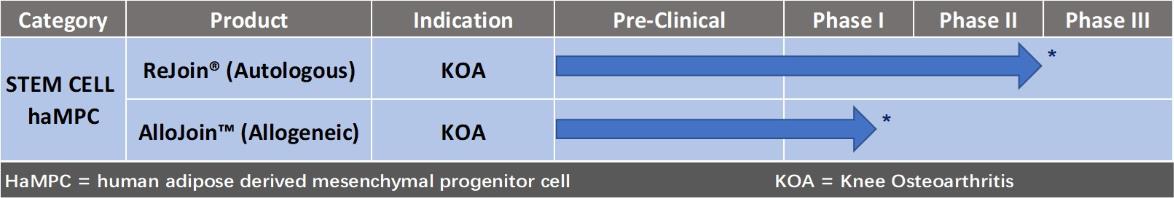
☐
Regulatory path for stem cell therapy in China now
clarified
☐
Rejoin® phase llb met primary and secondary end points
*
■ Safe, and provide both symptom relief and cartilage
regeneration
☐
AlloJoin™ phase l interim data showed safety and tolerance
*
*Note:
December 2017, Chinese government issued trial guidelines
concerning development and testing of cell therapy products in
China. Plan to file anew in Q4, 2018 under the new
regulation
29
Immuno-oncology (I/o)
Our
CAR-T platform is built on lenti-virial vector and
second-generation CAR design, which is used by most of the current
trials and studies. We select the patient population for each asset
and indication to allow the optimal path forward for potential
regulatory approval. We integrate the state of art translational
medicine effort into each clinical study to aid in dose selection,
to confirm the mechanism of action and proof of concept, and to
attempt to identify the optimal targeting patient population. We
plan to continue to grow our translational medicine team and engage
key opinion leaders to support our development
efforts.
We have
developed a serial of pipelines to treat hematological malignancies
including CD20, CD22, and BCMA CAR-Ts, which have been approved to
be potent and effective in treating hematology tumors in early
phase of clinical studies.
CD20 CAR
CD20 is
broadly overexpressed in a serial of B cell malignant tumors. In
the patients relapsed after CD19 CAR-T treatment, the expression of
CD20 on target tumor cells is relatively stable. It is proven to be
an optimal target for treating CD19 CAR-T relapsing patients. We
have developed a number of novel CD20 CARs, which demonstrated
strong anti-tumor activity in both in vitro assays and in vivo animal studies. We have filed
patent in China and plan to initiate first in human investigator
initiated trial with Kymriah relapsing NHL patients in the second
half of 2019.
CD22 CAR
CD22 is
another surface maker highly expressed in B cell malignancies
especially in Hairy cell leukemia. It also expresses in the
patients relapsed after CD19 CAR-T treatment. We have developed
novel CD22 CARs, which displayed effective anti-tumor activity in
in vitro cytotoxicity
assays. We plan to initiate investigator initiated trial with
Kymriah relapsing ALL patients and Hairy cell leukemia in the first
half of 2019.
BCMA CAR
BCMA is
a member of the TNF receptor superfamily, universally expressed in
multiple myeloma (MM) cells. It is not detectable in normal tissues
except plasma and mature B cells. It is proven to be an effective
and safer target for treating refractory MM patients in several
clinical trials. We have developed unique BCMA CARs. Our BCMA CAR
clinical lead exhibits potent anti-tumor activity both in vitro and in vivo. We have filed patent for BCMA
CAR in China and plan to initiate investigator initiated trial in
refractory MM patients in Q4 2018.
NKG2D CAR
Early
studies on CAR-T therapy targeting NK cell signaling has shown
promising clinical benefits. We are developing novel generation
CARs using NKG2D extracellular fragment as antigen binding domain.
These CARs can recognize targets tumor cells expressing NKG2D
ligands. We plan to initiate first in human investigator
initiated trial with R/R AML patients in the second half of
2019.
Solid
tumors pose more challenges than hematological
cancers. The patients are more heterogeneous, making it
difficult to have one drug to work effectively in the majority of
the patients in any cancer indication. The duration of
response is most likely shorter and patients are likely to relapse
even after initial positive clinical response. We will
continue our effort in developing cell based therapies to target
both hematological cancers and solid tumors.
30
AFP TCR-T
We are
evaluating the efficacy and specificity of the AFP TCRs to identity
the most appropriate candidate for first time in human (FTIH)
study. Human CD8+ T cells will be redirected with the AFP TCRs and
their anti-tumor activity will be evaluated by in vitro cytokine
release and cytotoxicity assays. Concurrently, potential
on/off-target toxicity including allo-reactivity will be also
evaluated. The best candidate TCRs for clinical use will be further
tested in vivo efficacy in
animal models. We plan to exercise our exclusive right to license
the technology from Augusta University if and when the FTIH proof
of mechanism study shows promising clinical efficacy signal and
manageable safety profile.
TIL
Augmented by the
U.S. National Cancer Institute (“NCI”) technology
license, CBMG is developing neoantigen reactive TIL therapies to
treat immunogenic cancers. In the early stages of cancer,
lymphocytes infiltrate into the tumor, specifically recognizing the
tumor targets and mediating anti-tumor response. . These cells are
known as TIL. TIL based therapies have shown encouraging clinical
results in early development. For example, in Phase-2 clinical
studies in patients with metastatic melanoma performed by Dr.
Rosenberg at NCI, TIL therapy demonstrated robust efficacy in
patients with metastatic melanoma with objective response rates of
56% and complete response rates of 24%. We plan to start our
development with NSCLC as soon as practicable, and eventually
expand into other cancer indications.
Knee Osteoarthritis (KOA)
We are
currently pursuing two primary therapies for the treatment of KOA:
our Re-Join® therapy and our
AlloJoin™ therapy.
We
completed the Phase I/IIa clinical trial for the
treatment of KOA. The trial tested the safety and efficacy of
intra-articular injections of autologous haMPCs in order to reduce
inflammation and repair damaged joint cartilage. The 6-month
follow-up clinical data showed Re-Join® therapy to be
both safe and effective.
In the
second quarter of 2014, we completed patient enrollment for the
Phase IIb clinical trial of Re-Join® for KOA. The multi-center
study has enrolled 53 patients to participate in a randomized,
single blind trial. We published 48 weeks follow-up data of Phase
I/IIa on December 5, 2014. The 48 weeks data indicated
that patients have reported a decrease in pain and a significant
improvement in mobility and flexibility, while the clinical data
shows our Re-Join® regenerative medicine treatment to be safe.
We announced positive Phase IIb 48-week follow-up data in January
2016, with statistical significant evidence that Re-Join®
enhanced cartilage regeneration, which concluded the planned phase
IIb trial.
In
January 2016, we launched the Allogeneic KOA Phase I Trial in
China to evaluate the safety and efficacy of AlloJoin™,
an off-the shelf haMPC therapy for the treatment of KOA. On August
5, 2016 we completed patient treatment for the Allogeneic KOA
Phase I trial. On August 5, 2016 we completed patient treatment for
the Allogenic KOA Phase I Trial, and on December 9, 2016, we
announced interim 3-month safety data from the Allogenic KOA Phase
I Trial in China. The interim analysis of the trial has
preliminarily demonstrated a safety and tolerability profile of
AlloJoin™ in the three doses tested, and no SAEs have been
observed. On March 16, 2018, we announced the positive 48-week
Allojoin™ Phase I data in China, which demonstrated good
safety and early efficacy for the prevention of cartilage
deterioration.
31
Osteoarthritis is a
degenerative disease of the joints. KOA is one of the most common
types of osteoarthritis. Pathological manifestation of
osteoarthritis is primarily local inflammation caused by immune
response and subsequent damage of joints. Restoration of immune
response and joint tissues are the objective of
therapies.
According
to International Journal of
Rheumatic Diseases, 2011, 53% of KOA patients will
degenerate to the point of disability. Conventional treatment
usually involves invasive surgery with painful recovery and
physical therapy. As drug-based methods of management are
ineffective, the same journal estimates that some 1.5 million
patients with this disability will degenerate to the point of
requiring artificial joint replacement surgery every year. However,
only 40,000 patients will actually be able to undergo replacement
surgery, leaving the majority of patients to suffer from a
life-long disability due to lack of effective
treatment.
Adult
mesenchymal stem cells can currently be isolated from a variety of
adult human sources, such as liver, bone marrow, and adipose (fat)
tissue. We believe the advantages in using adipose tissue (as
opposed to bone marrow or blood) are that it is one of the richest
sources of pluripotent cells in the body, the easy and repeatable
access to fat via liposuction, and the simple cell isolation
procedures that can begin to take place even on-site with minor
equipment needs. The procedure we are testing for autologous KOA
involves extracting a very small amount of fat using a minimally
invasive extraction process which takes up to 20 minutes and leaves
no scarring. The haMPC cells are then processed and isolated on
site, and injected intra articularly into the knee joint with
ultrasound guidance. For allogeneic KOA we use donor haMPC
cells.
These
haMPC cells are capable of differentiating into bone, cartilage,
tendon, skeletal muscle, and fat under the right conditions. As
such, haMPCs are an attractive focus for medical research and
clinical development. Importantly, we believe both allogeneic and
autologously sourced haMPCs may be used in the treatment of
disease. Numerous studies have provided preclinical data that
support the safety and efficacy of allogeneic and autologously
derived haMPC, offering a choice for those where factors such as
donor age and health are an issue.
Additionally,
certain disease treatment plans call for an initial infusion of
these cells in the form of SVF, an initial form of cell isolation
that can be completed and injected within ninety minutes of
receiving lipoaspirate. The therapeutic potential conferred by the
cocktail of ingredients present in the SVF is also evident, as it
is a rich source for preadipocytes, mesenchymal stem cells,
endothelial progenitor cells, T regulatory cells and
anti-inflammatory macrophages.
haMPCs
are currently being considered as a new and effective treatment for
osteoarthritis, with a huge potential
market. Osteoarthritis is one of the ten most disabling
diseases in developed countries. Worldwide estimates are that 9.6%
of men and 18.0% of women aged over 60 years have symptomatic
osteoarthritis. It is estimated that the global OA therapeutics
market was worth $4.4 billion in 2010 and is forecast to grow at a
compound annual growth rate of 3.8% to reach $5.9 billion by
2018.
In
order to bring haMPC-based KOA therapy to market, our market
strategy is to: (a) establish regional laboratories that comply
with cGMP standards in Shanghai and Beijing that meet Chinese
regulatory approval; and (b) submit to the NMPA an IND package for
Allojoin™ to treat patients with donor haMPC cells, and (c)
file joint applications with Class AAA hospitals to use
Re-Join® to treat patients with their own haMPC
cells.
Our
competitors are pursuing treatments for osteoarthritis with knee
cartilage implants. However, unlike their approach, our
KOA therapy is not surgically invasive – it uses a small
amount (30ml) of adipose tissue obtained via liposuction from the
patient, which is cultured and re-injected into the patient. The
injections are designed to induce the body’s secretion of
growth factors promoting immune response and regulation, and
regrowth of cartilage. The down-regulation of the patient’s
immune response is aimed at reducing and controlling inflammation
which is a central cause of KOA.
We believe
our proprietary method, subsequent haMPC proliferation and
processing know-how will enable haMPC therapy to be a low cost and
relatively safe and effective treatment for KOA. Additionally,
banked haMPCs can continue to be stored for additional use in the
future.
Based
on current estimates, we expect our biopharmaceutical business to
generate collaboration payment and revenues through our sale of
Kymriah products to Novartis within the next two to three years and
through the development of therapies for the treatment of CD22 HCL
and CD19 CAR-T for relapsing ALL, BCMA MM, NKG2D on AML, and KOA
within the next three to four years although we cannot assure you
that we will be successful at all or within the foregoing
timeframe.
32
Competition
Many
companies operate in the cellular biopharmaceutical
field. Currently there are several approved stem cell
therapies on the market including Canada’s pediatric
graft-versus-host disease and the European Commission’s
approval in March 2018 for the treatment of complex perianal
fistulas in adult Crohn’s disease. There are several
public and private cellular biopharmaceutical focused companies
outside of China with varying phases of clinical trials addressing
a variety of diseases. We compete with these companies in
bringing cellular therapies to the market. However, our
focus is to develop a core business in the China market. This
difference in focus places us in a different competitive
environment from other western companies with respect to fund
raising, clinical trials, collaborative partnerships, and the
markets in which we compete.
The PRC
central government has a focused strategy to enable China to
compete effectively in certain designated areas of biotechnology
and the health sciences. Because of the aging population in
China, China’s Ministry of Science and Technology (MOST) has
targeted stem cell development as high priority field, and
development in this field has been intense in the agencies under
MOST. For example, the 973 Program has funded a number of
stem cell research projects such as differentiation of human
embryonic germ cells and the plasticity of adult stem cells.
To the best of our knowledge, none of the companies in China are
utilizing our proposed international manufacturing protocol and our
unique technologies in conducting what we believe will be fully
compliant NMPA-sanctioned clinical trials to commercialize cell
therapies in China. Our management believes that it is
difficult for most of these Chinese companies to turn their results
into translational stem cell science or commercially successful
therapeutic products using internationally acceptable
standards.
We
compete globally with respect to the discovery and development of
new cell-based therapies, and we also compete within China to bring
new therapies to market. In the biopharmaceutical
specialty segment, namely in the areas of cell processing and
manufacturing, clinical development of cellular therapies and cell
collection, processing and storage, are characterized by rapidly
evolving technology and intense competition. Our
competitors worldwide include pharmaceutical, biopharmaceutical and
biotechnology companies, as well as numerous academic and research
institutions and government agencies engaged in drug discovery
activities or funding, in the U.S., Europe and Asia. Many of these
companies are well-established and possess technical, research and
development, financial, and sales and marketing resources
significantly greater than ours. In addition, many of our smaller
potential competitors have formed strategic collaborations,
partnerships and other types of joint ventures with larger, well
established industry competitors that afford these companies
potential research and development and commercialization advantages
in the technology and therapeutic areas currently being pursued by
us. Academic institutions, governmental agencies and
other public and private research organizations are also conducting
and financing research activities which may produce products
directly competitive to those being commercialized by us. Moreover,
many of these competitors may be able to obtain patent protection,
obtain government (e.g. FDA) and other regulatory approvals and
begin commercial sales of their products before
us.
Our
primary competitors in the field of stem cell therapy for
osteoarthritis, and other indications include Cytori Therapeutics
Inc., Caladrius Biosciences, Inc. and others. Among our
competitors, to our knowledge, the only ones based in and operating
in Greater China are Lorem Vascular, which has partnered with
Cytori to commercialize Cytori Cell Therapy for the cardiovascular,
renal and diabetes markets in China and Hong Kong, and
OLife Bio, a Medi-Post joint venture with JingYuan Bio in Taian,
Shandong Province, who planned to initiate clinical trial in China
in 2016. To our knowledge, none of the aforementioned
companies have made any progress or advancement in the clinical
development in China.
Our
primary competitors in the field of cancer immune cell therapies
include pharmaceutical, biotechnology companies such as Eureka
Therapeutics, Inc., Iovance Biotherapeutics,Inc., Juno
Therapeutics, Inc. (Celgene), Kite Pharma, Inc. (Gilead), CARSgen,
Sorrento Therapeutics, Inc. and others. Among our
competitors, the ones based in and operating in Greater China are
CARsgen, Hrain Biotechnology, Nanjing Legend Biotechnology, Galaxy
Biomed, Persongen and Anke Biotechnology, Shanghai Minju
Biotechnology, Unicar Therapy, Immuno China Biotech, Chongqing
Precision Biotech, SiDanSai Biotechnology and China Oncology Focus
Limited, which has licensed Sorrento’s anti-PD-L1 monoclonal
antibody for Greater China. Other western big pharma and biotech
companies in the cancer immune cell therapies space have made
inroads in China by partnering with local companies. For example,
in April, 2016, Seattle-based Juno Therapeutics, Inc (Celgene)
started a new company with WuXi AppTec in China named JW
Biotechnology (Shanghai) Co., Ltd. by leveraging Juno's CAR-T and
TCR technologies together with WuXi AppTec's R&D and
manufacturing platform and local expertise to develop novel
cell-based immunotherapies for patients with hematologic and solid
organ cancers. In January 2017, Shanghai Fosun Pharmaceutical
created a joint venture with Santa Monica-based Kite Pharma Inc.
(Gilead) to develop, manufacture and commercialize CAR-T and TCR
products in China. In late 2017 Gilead acquired Kite Pharma for
$11.9 billion. On January 22, 2018 Celgene announced that it had
agreed to buy Juno Therapeutics for approximately $9
billion.
33
The
NMPA has received IND applications for CD19 chimeric antigen
receptor T cells cancer therapies from many companies and have
granted the initial phase of acceptance to several companies thus
far.
Additionally, in
the general area of cell-based therapies for knee osteoarthritis
ailments, we potentially compete with a variety of companies, from
big pharma to specialty medical products or biotechnology
companies. Some of these, such as Abbvie, Merck KGaA, Sanofi, Teva,
GlaxosmithKline, Baxter, Johnson & Johnson, Sanumed, Medtronic
and Miltenyi Biotech, are well-established and have substantial
technical and financial resources compared to
ours. However, as cell-based products are only just
emerging as viable medical therapies, many of our more direct
competitors are smaller biotechnology and specialty medical
products companies comprised of Vericel Corporation, Regeneus Ltd.,
Advanced Cell Technology, Inc., Nuo Therapeutics, Inc., Arteriocyte
Medical Systems, Inc., ISTO technologies, Inc., Ember Therapeutics,
Athersys, Inc., Bioheart, Inc., Cytori Therapeutics, Inc., Harvest
Technologies Corporation, Mesoblast, Pluristem, Inc., TissueGene,
Inc. Medipost Co. Ltd. and others. There are also several
non-cell-based, small molecule and peptide clinical trials
targeting knee osteoarthritis, and several other FDA approved
treatments for knee pain.
Certain
CBMG competitors also work with adipose-derived stem
cells. To the best of our knowledge, none of these
companies are currently utilizing the same technologies as ours to
treat KOA, nor to our knowledge are any of these companies
conducting government-approved clinical trials in
China.
Some of
our targeted disease applications may compete with drugs from
traditional pharmaceutical or Traditional Chinese Medicine
companies. We believe that our chosen targeted disease
applications are not effectively in competition with the products
and therapies offered by traditional pharmaceutical or Traditional
Chinese Medicine companies.
We
believe we have a strategic advantage over our competitors based on
our outstanding quality management system, robust and efficient
manufacturing capability which we believe is possessed by few to
none of our competitors in China, in an industry in which meeting
exacting standards and achieving extremely high purity levels is
crucial to success. In addition, in comparison to the
broader range of cellar biopharmaceutical firms, we believe we have
the advantages of cost and expediency, and a first mover advantage
with respect to commercialization of cell therapy products and
treatments in the China market.
Critical Accounting Policies
The
discussion and analysis of our financial condition and results of
operations are based on our consolidated financial statements,
which have been prepared in accordance with accounting principles
generally accepted in the United States of America (“U.S.
GAAP”). The preparation of these financial statements
requires management to make estimates and assumptions that affect
the reported amounts of assets and liabilities and disclosure of
contingent assets and liabilities at the date of the consolidated
financial statements and the reported amounts of revenue and
expenses during the reporting period. On an ongoing basis, our
management evaluates the estimates, including those related to
revenue recognition, accounts receivable, long-lived assets,
goodwill and other intangibles, investments, stock-based
compensation, and income taxes. Of the accounting estimates we
routinely make relating to our critical accounting policies, those
estimates made in the process of determining the valuation of
accounts receivable, long-lived assets, and goodwill and other
intangibles, measuring share-based compensation expense, preparing
investment valuations, and establishing income tax valuation
allowances and liabilities are the estimates most likely to have a
material impact on our financial position and results of
operations. The Company bases its estimates on historical
experience and on various other assumptions that are believed to be
reasonable under the circumstances. However, because these
estimates inherently involve judgments and uncertainties, there can
be no assurance that actual results will not differ materially from
those estimates.
ASC
Topic 606, Revenue from Contracts
with Customers, was effective during the three months ended
March 31, 2018. ASC Topic 606 amended the existing accounting
standards for revenue recognition (ASC Topic 605, Revenue Recognition) and established
principles for recognizing revenue upon the transfer of promised
goods or services to customers, in an amount that reflects the
expected consideration received in exchange for those goods or
services. The Company adopted ASC Topic 606 in the first quarter of
2018 using the modified retrospective transition approach. Because
the Company’s primary source of revenues for the three-month
period ended September 30, 2018 was only from cell banking services
as well as cell therapy technology services, and the service
revenues are recognized when the cell banking and cell therapy
technology services are rendered (i.e., the two performance
obligations that arise from its contracts with customers are
satisfied), the impact on its consolidated financial statements
from adoption of ASC Topic 606 is not material.
Other
than as discussed above, during the three months ended September
30, 2018, we believe that there have been no significant changes to
the items that we disclosed as our critical accounting policies and
estimates in the “Critical Accounting Policies and
Estimates” section of Item 7 - Management’s Discussion
and Analysis of Financial Condition and Results of Operations in
our Annual Report on Form 10-K for the fiscal year ended December
31, 2017.
Results of
Operations
Below is a discussion
of
the results of our operations for the
three and nine months ended September 30, 2018 and 2017. These
results are not necessarily indicative
of result that may be
expected in any future period. Our prospects
should be considered in light of the risks, expenses
and difficulties that we may encounter. We may not be successful in addressing
these risks and difficulties.
34
Comparison of Three Months Ended September 30, 2018 to Three Months
Ended September 30, 2017
The
descriptions in the results of operations below reflect our
operating results as set forth in our Consolidated Statement of
Operations filed herewith.
|
|
Three Months Ended
September 30,
2018
|
Three Months Ended
September 30,
2017
|
|
|
|
|
|
Net
sales and revenue
|
$70,431
|
$106,787
|
|
|
|
|
|
Operating
expenses:
|
|
|
|
Cost
of sales *
|
37,483
|
55,294
|
|
General
and administrative *
|
3,315,614
|
3,023,390
|
|
Selling
and marketing *
|
84,782
|
85,742
|
|
Research
and development *
|
6,545,490
|
4,076,186
|
|
Impairment
on non-current assets
|
2,884,896
|
-
|
|
Total
operating expenses
|
12,868,265
|
7,240,612
|
|
Operating
loss
|
(12,797,834)
|
(7,133,825)
|
|
|
|
|
|
Other
income
|
|
|
|
Interest
income
|
18,173
|
23,933
|
|
Other
income
|
38,376
|
907,678
|
|
Total
other income
|
56,549
|
931,611
|
|
Loss
before taxes
|
(12,741,285)
|
(6,202,214)
|
|
|
|
|
|
Income
taxes provision
|
(2,479)
|
-
|
|
|
|
|
|
Net
loss
|
$(12,743,764)
|
$(6,202,214)
|
|
Other
comprehensive income (loss):
|
|
|
|
Cumulative
translation adjustment
|
(834,382)
|
291,665
|
|
Total
other comprehensive income (loss):
|
(834,382)
|
291,665
|
|
Comprehensive
loss
|
$(13,578,146)
|
$(5,910,549)
|
|
|
|
|
|
|
|
|
|
Net
loss per share:
|
|
|
|
Basic
and diluted
|
$(0.72)
|
$(0.43)
|
|
|
|
|
|
|
|
|
|
Weighted
average common shares outstanding:
|
|
|
|
Basic
and diluted
|
17,604,473
|
14,349,569
|
* These
line items include the following amounts of non-cash, stock-based
compensation expense for the periods indicated.
|
|
Three Months Ended
September 30,
2018
|
Three Months Ended
September 30,
2017
|
|
|
|
|
|
Cost
of sales
|
-
|
26,150
|
|
General
and administrative
|
673,624
|
618,877
|
|
Selling
and marketing
|
25,047
|
20,907
|
|
Research
and development
|
571,797
|
672,775
|
|
|
1,270,468
|
1,338,709
|
35
Results of Operations
Net sales and revenue
|
|
2018
|
2017
|
Change
|
Percent
|
|
|
|
|
|
|
|
For
the three months ended September 30,
|
$70,431
|
$106,787
|
$(36,356)
|
(34)%
|
Revenue
for the three months period ended September 30, 2018 was mainly
derived from both cell banking services and cell therapy technology
service whereas revenue for the three months period ended September
30, 2017 was mainly derived from cell therapy technology
service.
Cost of Sales
|
|
2018
|
2017
|
Change
|
Percent
|
|
|
|
|
|
|
|
For
the three months ended September 30,
|
$37,483
|
$55,294
|
$(17,811)
|
(32)%
|
The
gross margin change was a result of the revenue mix change towards
adipose cell banking services.
General and Administrative Expenses
|
|
2018
|
2017
|
Change
|
Percent
|
|
|
|
|
|
|
|
For
the three months ended September 30,
|
$3,315,614
|
$3,023,390
|
$292,224
|
10%
|
The
growth of G&A expenses was primarily attributed to the
additional headcount and depreciation of new facility.
Selling and Marketing Expenses
|
|
2018
|
2017
|
Change
|
Percent
|
|
|
|
|
|
|
|
For
the three months ended September 30,
|
$84,782
|
$85,742
|
$(960)
|
(1)%
|
No
material change as compared with the three months ended September
30, 2017.
36
Research and Development Expenses
|
|
2018
|
2017
|
Change
|
Percent
|
|
|
|
|
|
|
|
For
the three months ended September 30,
|
$6,545,490
|
$4,076,186
|
$2,469,304
|
61%
|
Research
and development costs increased by approximately $2,469,000 in the
three months ended September 30, 2018 as compared to the three
months ended September 30, 2017. The increase was primarily
attributed to increased spending in the growth of our pipeline in
both liquid tumor and solid tumor development and establishing U.S.
R&D center at Gaithersburg, Maryland.
Impairment of Non-current Assets
|
|
2018
|
2017
|
Change
|
Percent
|
|
|
|
|
|
|
|
For
the three months ended September 30,
|
$2,884,896
|
$-
|
$2,884,896
|
N/A
|
The
impairment of non-current assets for the three months ended
September 30, 2018 is a full provision of $2,884,896 provided
against the net book value of GVAX license. No such expense existed
in the same period in 2017.
The
Company reassessed its return on investment to develop GVAX for
cancer therapies in the current competitive market and decided to
terminate its GVAX program and its license agreements with the
University of South Florida (“USF”) and the Moffitt
Cancer Center (“Moffitt”). As a result the Company made
a full impairment of $2,884,896 for the USF and Moffitt
licenses. CD40LGVAX
was licensed in 2015 with the intention of providing alternative
treatment options for late stage non-small cell lung cancer (NSCLC)
patients. Since then, the landscape of NSCLC has changed
dramatically. Pembrolizumab has been approved as first-line
treatment for patients with metastatic NSCLC with high PD-L1
expression, and for patients with metastatic NSCLC following
disease progression on chemotherapy. Recently, the FDA has accepted
a supplemental biologics license application (sBLA) for the
combination of nivolumab plus ipilimumab for the frontline
treatment of patients with advanced NSCLC with tumor mutational
burden (TMB) ≥10 mutations per megabase (mut/Mb). In
addition, the Company has recently licensed TIL patents from
NIH/NCI for multiple indications in solid tumors and decided that
TIL technology platform has a higher potential to capture a broader
solid tumors market. Hence we decided to terminate the development
of CD40LGVAX and focus our clinical development effort based on the
TCR-T and TIL technologies for solid tumors. On October 29, 2018
the Company notified Moffit of such termination.
Operating Loss
|
|
2018
|
2017
|
Change
|
Percent
|
|
|
|
|
|
|
|
For
the three months ended September 30,
|
$(12,797,834)
|
$(7,133,825)
|
$(5,664,009)
|
79%
|
The
increase in the operating loss for the three months ended September
30, 2018 as compared to the same period in 2017 was primarily due
to changes in research and development expenses of $2,469,000 and
impairment of non-current assets of $2,885,000.
Total Other Income
|
|
2018
|
2017
|
Change
|
Percent
|
|
|
|
|
|
|
|
For
the three months ended September 30,
|
$56,549
|
$931,611
|
$(875,062)
|
(94)%
|
37
Other
income for the three months ended September 30, 2018 and September
30, 2017 was primarily interest income, government grants and
gain/loss from currency exchange fluctuation; bolstered in 2017
by $0.99 million government grants.
Income Taxes Provision
|
|
2018
|
2017
|
Change
|
Percent
|
|
|
|
|
|
|
|
For
the three months ended September 30,
|
$(2,479)
|
$-
|
$(2,479)
|
N/A
|
While
we have plans for growing and developing our business, we
determined that a valuation allowance was necessary given the
current and expected near term losses and the uncertainty with
respect to our ability to generate sufficient profits from our
business model. Therefore, we established a valuation allowance for
deferred tax assets other than the extent of the benefit from other
comprehensive income. Income tax expense for three months ended
September 30, 2018 represents the withholding corporation income
tax of Hong Kong subsidiary for its royalty income derived from
China.
Net Loss
|
|
2018
|
2017
|
Change
|
Percent
|
|
|
|
|
|
|
|
For
the three months ended September 30,
|
$(12,743,764)
|
$(6,202,214)
|
$(6,541,550)
|
105%
|
Changes
in net loss are primarily attributable to changes in operations
described above.
Comprehensive Loss
|
|
2018
|
2017
|
Change
|
Percent
|
|
|
|
|
|
|
|
For
the three months ended September 30,
|
$(13,578,146)
|
$(5,910,549)
|
$(7,667,597)
|
130%
|
Comprehensive
loss for three months ended September 30, 2018 includes a currency
exchange loss of approximately $834,000 combined with the changes
in net income. Comprehensive loss for three months ended September
30, 2017 includes a currency exchange gain of approximately
$292,000 combined with the changes in net income.
38
Comparison of Nine Months Ended September 30, 2018 to Nine Months
Ended September 30, 2017
The
descriptions in the results of operations below reflect our
operating results as set forth in our Consolidated Statement of
Operations filed herewith.
|
|
Nine Months Ended
September 30,
2018
|
Nine Months Ended
September 30,
2017
|
|
|
|
|
|
Net
sales and revenue
|
$198,705
|
$268,126
|
|
|
|
|
|
Operating
expenses:
|
|
|
|
Cost
of sales *
|
114,176
|
130,793
|
|
General
and administrative *
|
9,626,106
|
9,527,730
|
|
Selling
and marketing *
|
252,247
|
280,011
|
|
Research
and development *
|
17,985,997
|
10,469,820
|
|
Impairment
on non-current assets
|
2,914,320
|
-
|
|
Total
operating expenses
|
30,892,846
|
20,408,354
|
|
Operating
loss
|
(30,694,141)
|
(20,140,228)
|
|
|
|
|
|
Other
income
|
|
|
|
Interest
income
|
140,457
|
113,688
|
|
Other
income
|
132,300
|
1,461,265
|
|
Total
other income
|
272,757
|
1,574,953
|
|
Loss
before taxes
|
(30,421,384)
|
(18,565,275)
|
|
|
|
|
|
Income
taxes provision
|
(4,879)
|
(2,450)
|
|
|
|
|
|
Net
loss
|
$(30,426,263)
|
$(18,567,725)
|
|
Other
comprehensive income (loss):
|
|
|
|
Cumulative
translation adjustment
|
(1,136,743)
|
637,786
|
|
Unrealized
loss on investments, net of tax
|
-
|
(240,000)
|
|
Total
other comprehensive income:
|
(1,136,743)
|
397,786
|
|
Comprehensive
loss
|
$(31,563,006)
|
$(18,169,939)
|
|
|
|
|
|
|
|
|
|
Net
loss per share:
|
|
|
|
Basic
and diluted
|
$(1.76)
|
$(1.30)
|
|
|
|
|
|
Weighted
average common shares outstanding:
|
|
|
|
Basic
and diluted
|
17,281,240
|
14,310,344
|
* These
line items include the following amounts of non-cash, stock-based
compensation expense for the periods indicated.
|
|
Nine Months Ended
September 30,
2018
|
Nine Months Ended
September 30,
2017
|
|
|
|
|
|
Cost
of sales
|
-
|
49,066
|
|
General
and administrative
|
1,774,527
|
2,314,990
|
|
Selling
and marketing
|
68,827
|
34,604
|
|
Research
and development
|
1,904,728
|
1,842,162
|
|
|
3,748,082
|
4,240,822
|
|
|
|
|
39
Results of Operations
Net sales and revenue
|
|
2018
|
2017
|
Change
|
Percent
|
|
|
|
|
|
|
|
For
the nine months ended September 30,
|
$198,705
|
$268,126
|
$(69,421)
|
(26)%
|
Revenue
for the nine months period ended September 30, 2018 was mainly
derived from both cell banking services and cell therapy technology
service whereas revenue for the nine months period ended September
30, 2017 was mainly derived from cell therapy technology
service.
Cost of Sales
|
|
2018
|
2017
|
Change
|
Percent
|
|
|
|
|
|
|
|
For
the nine months ended September 30,
|
$114,176
|
$130,793
|
$(16,617)
|
(13)%
|
|
|
|
|
|
|
The
gross margin change was a result of the revenue mix change towards
adipose cell banking services.
General and Administrative Expenses
|
|
2018
|
2017
|
Change
|
Percent
|
|
|
|
|
|
|
|
For
the nine months ended September 30,
|
$9,626,106
|
$9,527,730
|
$98,376
|
1%
|
The growth of G&A expenses was primarily attributed to the
additional headcount and depreciation of new facility.
Selling and Marketing Expenses
|
|
2018
|
2017
|
Change
|
Percent
|
|
|
|
|
|
|
|
For
the nine months ended September 30,
|
$252,247
|
$280,011
|
$(27,764)
|
(10)%
|
The
selling and marketing expenses decreased by approximately $27,000
in the nine months ended September 30, 2018 as compared to the nine
months ended September 30, 2017, primarily as a result of a
severance payment in 2017 to a member of our sales
force.
40
Research and Development Expenses
|
|
2018
|
2017
|
Change
|
Percent
|
|
|
|
|
|
|
|
For
the nine months ended September 30,
|
$17,985,997
|
$10,469,820
|
$7,516,177
|
72%
|
Research
and development costs increased by approximately $7,516,000 in the
nine months ended September 30, 2018 as compared to the nine months
ended September 30, 2017. The increase was primarily attributed to
the growth of our pipeline in both liquid tumor and solid tumor
development and establishing U.S. R&D center at Gaithersburg,
Maryland.
Impairment of Non-current Assets
|
|
2018
|
2017
|
Change
|
Percent
|
|
|
|
|
|
|
|
For
the nine months ended September 30,
|
$2,914,320
|
$-
|
$2,914,320
|
N/A
|
The
impairment of investments for the nine months ended September 30,
2018 is comprised of the recognition of other than temporary
impairment on the value of shares in investments of $29,423 and
impairment of $2,884,896 provided against the net book value of
GVAX license. No such expense existed in the same period in
2017.
The Company provided full impairment of $29,424 for shares of ALEV
for the nine months ended September 30, 2018 as ALEV filed Form 15
in SEC and was no longer traded in the market in recent
quarter.
The
Company reassessed its return on investment to develop GVAX for
cancer therapies in the current competitive market and decided to
terminate its GVAX program and its license agreements with the
University of South Florida (“USF”) and the Moffitt
Cancer Center (“Moffitt”). As a result the Company made
a full impairment of $2,884,896 for the USF and Moffitt
licenses. CD40LGVAX
was licensed in 2015 with the intention of providing alternative
treatment options for late stage non-small cell lung cancer (NSCLC)
patients. Since then, the landscape of NSCLC has changed
dramatically. Pembrolizumab has been approved as first-line
treatment for patients with metastatic NSCLC with high PD-L1
expression, and for patients with metastatic NSCLC following
disease progression on chemotherapy. Recently, the FDA has accepted
a supplemental biologics license application (sBLA) for the
combination of nivolumab plus ipilimumab for the frontline
treatment of patients with advanced NSCLC with tumor mutational
burden (TMB) ≥10 mutations per megabase (mut/Mb). In
addition, the Company has recently licensed TIL patents from
NIH/NCI for multiple indications in solid tumors and decided that
TIL technology platform has a higher potential to capture a broader
solid tumors market. Hence we decided to terminate the development
of CD40LGVAX and focus our clinical development effort based on the
TCR-T and TIL technologies for solid tumors. On October 29, 2018
the Company notified Moffit of such termination.
Operating Loss
|
|
2018
|
2017
|
Change
|
Percent
|
|
|
|
|
|
|
|
For
the nine months ended September 30,
|
$(30,694,141)
|
$(20,140,228)
|
$(10,553,913)
|
52%
|
The
increase in the operating loss for the nine months ended September
30, 2018 as compared to the same period in 2017 was primarily due
to changes in research and development expenses of $7,516,000 and
impairment of non-current assets of $2,914,000.
41
Total Other Income
|
|
2018
|
2017
|
Change
|
Percent
|
|
|
|
|
|
|
|
For
the nine months ended September 30,
|
$272,757
|
$1,574,953
|
$(1,302,196)
|
(83)%
|
Other
income for the nine months ended September 30, 2018 and September
30, 2017 was primarily interest income, government grants and
gain/loss from currency exchange fluctuation; bolstered in 2017
by $1.58 million government grants.
Income Taxes Provision
|
|
2018
|
2017
|
Change
|
Percent
|
|
|
|
|
|
|
|
For
the nine months ended September 30,
|
$(4,879)
|
$(2,450)
|
$(2,429)
|
99%
|
While
we have plans for growing and developing our business, we
determined that a valuation allowance was necessary given the
current and expected near term losses and the uncertainty with
respect to our ability to generate sufficient profits from our
business model. Therefore, we established a valuation allowance for
deferred tax assets other than the extent of the benefit from other
comprehensive income. Income tax expense for nine months ended
September 30, 2018 was comprised of US state tax of $2,400 and the
withholding corporation income tax of $2,479 of Hong Kong
subsidiary for its royalty income derived from China. Income tax
expense for nine months ended September 30, 2017 all represent US
state tax.
Net Loss
|
|
2018
|
2017
|
Change
|
Percent
|
|
|
|
|
|
|
|
For
the nine months ended September 30,
|
$(30,426,263)
|
$(18,567,725)
|
$(11,858,538)
|
64%
|
Changes
in net loss are primarily attributable to changes in operations
described above.
Comprehensive Loss
|
|
2018
|
2017
|
Change
|
Percent
|
|
|
|
|
|
|
|
For
the nine months ended September 30,
|
$(31,563,006)
|
$(18,169,939)
|
$(13,393,067)
|
74%
|
Comprehensive
net loss for nine months ended September 30, 2018 includes a
currency translation net loss of approximately $1,137,000 combined
with the changes in net income. Comprehensive net loss for nine
months ended September 30, 2017 includes unrealized net loss on
investments of approximately $240,000 and a currency translation
net gain of approximately $638,000 combined with the changes in net
income.
Liquidity and Capital Resources
We had
working capital of $64,414,934 as of September 30, 2018 compared to
$20,118,725 as of December 31, 2017. Our cash position increased to
$57,925,198 (excluding six-month deposits of $10,000,000 recorded
in short-term investment) at September 30, 2018 compared to
$21,568,422 at December 31, 2017 for the cash used in operating and
investment activities.
Net
cash provided by or used in operating, investing and financing
activities from continuing operations was as follows:
42
Net
cash used in operating activities was approximately $19,359,000 and
$13,952,000 for the nine months ended September 30, 2018 and 2017,
respectively. The following table reconciles net loss to net cash
used in operating activities:
|
For
the nine months ended September 30,
|
2018
|
2017
|
Change
|
|
Net
loss
|
$(30,426,263)
|
$(18,567,725)
|
$(11,858,538)
|
|
Non
cash transactions
|
10,541,423
|
6,366,530
|
4,174,893
|
|
Changes
in operating assets, net
|
525,504
|
(1,750,552)
|
2,276,056
|
|
Net
cash used in operating activities
|
$(19,359,336)
|
$(13,951,747)
|
$(5,407,589)
|
The
2018 change in non-cash transaction was primarily due to the
increase in impairment on intangible assets of $2,885,000 as well
as the increase in depreciation and amortization of $1,665,000
compared with same period in 2017.
Net
cash used in investing activities was approximately $14,471,000 and
$7,002,000 in the nine months ended September 30, 2018 and 2017,
respectively. The $14,471,000 includes a $10,000,000
short-term deposits and the $4,438,000 is capital
expenditures for new equipment and facility
improvement.
Net
cash (used in) provided by financing activities was approximately
$70,556,000 and $(2,210,000) in the nine months ended September 30,
2018 and 2017, respectively. Net cash inflow in the financing
activities in 2018 was mainly attributed to the proceeds received
from the issuance of common stock and exercise of options, net of
the repurchase of the Company’s common stock. Net cash used
in the financing activities in 2017 was mainly attributed to
repurchase of the Company’s common stock.
Liquidity and Capital Requirements Outlook
We
anticipate that the Company will require approximately $46 million
in cash to operate as planned in the coming 12 months. Of this
amount, approximately $33 million will be used in operation and
approximately $13 million will be used as capital expenditure,
although we may revise these plans depending on the changing
circumstances of our biopharmaceutical business.
We
expect to rely on current cash balances on hand and additional
equity financing to provide for these capital requirements. We do
not intend to use, and will not rely on our holdings in these
illiquid securities to fund our operations. One of our stocks
held, Arem Pacific Corporation, has a declared effective S-1
prospectus which relates to the resale of up to 13,694,711 shares
of common stock, inclusive of the 8,000,000 shares held by the
Company. However, the shares offered by this filing may only be
sold by the selling stockholders at $0.05 per share until the
shares are quoted on the OTCQB® tier of OTC Markets or an
exchange. Other two of our stocks held, Alpha Lujo, Inc.
(“ALEV”) and Wonder International Education &
Investment Group Corporation (“Wonder”), are no longer
traded on any stock market. We do not know whether we can
liquidate any of our 8,000,000 shares of Arem Pacific stock or the
2,942,350 shares of ALEV stock and the 2,057,131 shares of Wonder
stock, or if liquidated, whether the realized amount will be
meaningful at all. As a result, we have written down these stocks
to their fair value.
In
February and April of 2016, the Company completed two closings of a
financing transaction with Wuhan Dangdai Science & Technology
Industries Group Inc., pursuant to which the Company sold to the
Investor an aggregate of 2,270,000 shares of the Company’s
common stock, par value $0.001 per share, for approximately
$43,130,000 in gross proceeds. On March 22, 2016, the Company filed
a registration statement on Form S-3 to offer and sell from time to
time, in one or more series, any of the securities of the Company,
for total gross proceeds up to $150,000,000. On June 17, 2016, the
SEC declared the S-3 effective; we have yet to utilize any of the
$150,000,000 registered under the S-3. On December 26, 2017, the
Company entered into a Share Purchase Agreement with two investors,
pursuant to which the Company agreed to sell and the two investors
agreed to purchase from the Company, an aggregate of 1,166,667
shares of the Company’s common stock, par value $0.001 per
share, at $12.00 per share, for total gross proceeds of
approximately $14,000,000. The transaction closed on December 28,
2017. Together with a private placement with three of its executive
officers on December 22, 2017, the Company raised an aggregate of
approximately $14.5 million in the two private placements in
December 2017. On January 30, 2018 and February 5, 2018, the
Company entered into Securities Purchase Agreements with certain
investors, pursuant to which the Company agreed to sell, and the
Investors agreed to purchase from the Company, an aggregate of
1,719,324 shares of the Company’s common stock, par value
$0.001 per share, at $17.80 per share, for total gross proceeds of
approximately $30.6 million. The February 2018 Private
Placement closed on February 5, 2018. On March 5, 2018, the
Company filed a registration statement on Form S-3 for resale of up
to 2,927,658 shares acquired on three private placement financing
on December, 2017 and on February 2018. On April 9, 2018, the SEC
declared the S-3 effective; and on April 11, 2018 we filed the
requisite resale prospectus. On September 25, 2018, the Company
entered into a Securities Purchase Agreement with Novartis Pharma
AG, pursuant to which the Company agreed to sell, and the Investors
agreed to purchase from the Company, an aggregate of 1,458,257
shares of the Company’s common stock, par value $0.001 per
share (the “Novartis Shares”), at $27.43 per share, for
total gross proceeds of approximately $40 million. On
October 10, 2018, the Company filed a registration statement on
Form S-3 for resale of the Novartis Shares. On October 22, 2018,
the SEC declared the S-3 effective. On October 23, 2018, we filed
the requisite resale prospectus.
43
As we
continue to incur losses, achieving profitability is dependent upon
the successful development of our cell therapy business and
commercialization of our technology in research and development
phase, which is a number of years in the future. Once that occurs,
we will have to achieve a level of revenues adequate to support our
cost structure. We may never achieve profitability, and unless and
until we do, we will continue to need to raise additional capital.
Management intends to fund future operations through additional
debt or equity offerings, and may seek additional capital through
arrangements with strategic partners or from other
sources.
In
order to finance our medium to long-term plans, we intend to rely
upon external financing. This financing may be in the form of
equity and or debt, in private placements and/or public offerings,
or arrangements with private lenders. Our medium to long term
capital needs involve the further development of our
biopharmaceutical business, and may include, at management’s
discretion, new clinical trials for other indications, strategic
partnerships, joint ventures, acquisition of licensing rights from
new or current partners and/or expansion of our research and
development programs. Furthermore, as our therapies pass through
the clinical trial process and if they gain regulatory approval, we
expect to expend significant resources on sales and marketing of
our future products, services and therapies in order to
finance.
Due to
our short operating history and our early stage of development,
particularly in our biopharmaceutical business, we may find it
challenging to raise capital on terms that are acceptable to us, or
at all. Furthermore, our negotiating position in the capital
raising process may worsen as we consume our existing resources.
Investor interest in a company such as ours is dependent on a wide
array of factors, including the state of regulation of our industry
in China (e.g. the policies of MOH and the NMPA), the U.S. and
other countries, political headwinds affecting our industry, the
investment climate for issuers involved in businesses located or
conducted within China, the risks associated with our corporate
structure, risks relating to our partners, licensed intellectual
property, as well as the condition of the global economy and
financial markets in general. Additional equity financing may be
dilutive to our stockholders; debt financing, if available, may
involve significant cash payment obligations and covenants that
restrict our ability to operate as a business; our stock price may
not reach levels necessary to induce option or warrant exercises;
and asset sales may not be possible on terms we consider
acceptable. If we are unable to raise the capital necessary to meet
our medium- and long-term liquidity needs, we may have to delay or
discontinue certain clinical trials, the licensing, acquisition
and/or development of cell therapy technologies, and/or the
expansion of our biopharmaceutical business; or we may have to
raise funds on terms that we consider unfavorable.
Off Balance Sheet Transactions
CBMG
does not have any off-balance sheet arrangements except the lease
and capital commitment disclosed in the unaudited condensed
consolidated financial statements.
Contractual Obligations
We have
various contractual obligations that will affect our
liquidity. The following table sets forth our contractual
obligations as of September 30, 2018.
|
|
Payments due by period
|
||||
|
Contractual Obligations
|
|
Less than
|
2-3
|
4-5
|
More than
|
|
|
Total
|
1 year
|
years
|
years
|
5 years
|
|
Capital
Commitment
|
$1,452,986
|
$1,452,986
|
-
|
-
|
-
|
|
Operating
Lease Obligations
|
20,517,813
|
2,856,546
|
5,129,012
|
4,997,323
|
7,534,932
|
|
Total
|
$21,970,799
|
$4,309,532
|
$5,129,012
|
$4,997,323
|
$7,534,932
|
|
|
|
|
|
|
|
44
ITEM 3. QUANTITATIVE AND QUALITATIVE DISCLOSURES ABOUT MARKET
RISK
Exposure
to credit, liquidity, interest rate and currency risks arises in
the normal course of the Company’s business. The
Company’s exposure to these risks and the financial risk
management policies and practices used by the Company to manage
these risks are described below.
Credit Risk
Credit
risk is the risk that one party to a financial instrument will
cause a financial loss for the other party by failing to discharge
an obligation. The Company’s credit risk is primarily
attributable to cash at bank, current investment and receivables
etc. Exposure to these credit risks are monitored by management on
an ongoing basis.
The
Company’s cash and current investment is mainly held with
well-known or state owned financial institutions, such as HSBC,
Bank of China, CITIC Bank and China Merchant Bank etc. Management
does not foresee any significant credit risks from these
deposits/investments and does not expect that these financial
institutions may default and cause losses to the
Company.
In
respect of receivables, the Company does not obtain collateral from
customers. The Company’s exposure to credit risk is
influenced mainly by the individual characteristics of each
customer rather than the industry, country or area in which the
customers operate and therefore significant concentrations of
credit risk arise primarily when the Group has significant exposure
to individual customers. As of September 30, 2018, 100% of the
total accounts receivable was due from the largest customer group
of the Company.
The
maximum exposure to credit risk is represented by the carrying
amount of each financial asset in the balance sheet.
Interest Rate Risk
The
Company’s interest rate risk arises primarily from cash
deposited at banks and the Company doesn’t have any
interest-bearing long-term payable/ borrowing, therefore its
exposure to interest rate risk is limited.
Currency Risk
The
Company is exposed to currency risk primarily from sales and
purchases which give rise to receivables, payables that are
denominated in a foreign currency (mainly RMB). The Company has
adopted USD as its functional currency, thus the fluctuation of
exchange rates between RMB and USD exposes the Company to currency
risk.
The
following table details the Company’s exposure as of
September 30, 2018 to currency risk arising from recognised assets
or liabilities denominated in a currency other than the functional
currency of the entity to which they relate. For presentation
purposes, the amounts of the exposure are shown in USD translated
using the spot rate as of September 30, 2018. Differences resulting
from the translation of the financial statements of entities into
the Company’s presentation currency are
excluded.
|
|
Exposure to foreign currencies (Expressed in USD)
|
|
|
|
As of September 30, 2018
|
|
|
|
RMB
|
USD
|
|
Cash
and cash equivalents
|
1,303
|
185,302
|
|
|
|
|
|
Net
exposure arising from recognised assets and
liabilities
|
1,303
|
185,302
|
|
|
|
|
|
|
|
|
45
The
following table indicates the instantaneous change in the
Company’s net loss that would arise if foreign exchange rates
to which the Company has significant exposure at the end of the
reporting period had changed at that date, assuming all other risk
variables remained constant.
|
|
As of September 30, 2018
|
|
|
|
increase/(decrease) in foreign exchange rates
|
Effect on net loss (Expressed in USD)
|
|
|
|
|
|
RMB
(against USD)
|
5%
|
(9,200)
|
|
|
|
|
|
|
-5%
|
9,200
|
Results
of the analysis as presented in the above table represent an
aggregation of the instantaneous effects on each of the
Company’s subsidiaries’ net loss measured in the
respective functional currencies, translated into USD at the
exchange rate ruling at the end of the reporting period for
presentation purposes.
The
sensitivity analysis assumes that the change in foreign exchange
rates had been applied to re-measure those financial instruments
held by the Company which expose the Company to foreign currency
risk at the end of the reporting period, including inter-company
payables and receivables within the Company which are denominated
in a currency other than the functional currencies of the lender or
the borrower. The analysis excludes differences that would result
from the translation of the financial statements of subsidiaries
into the Company’s presentation currency.
ITEM 4. CONTROLS AND PROCEDURES
Disclosure Controls and Procedures
Disclosure
controls and procedures include, without limitation, controls and
procedures designed to ensure that information required to be
disclosed by an issuer in the reports that it files or submits
under the Securities Exchange Act of 1934, as amended (the
“Exchange Act”) is recorded, processed, summarized and
reported within the time periods specified in the Securities and
Exchange Commission’s rules and forms. It should be
noted that the design of any system of controls is based in part
upon certain assumptions about the likelihood of future events, and
there can be no assurance that any design will succeed in achieving
its stated goals under all potential future conditions, regardless
of how remote.
We
carried out an evaluation, under the supervision and with the
participation of our management, including our Chief Executive
Officer and Chief Financial Officer, of the effectiveness of our
disclosure controls and procedures (as defined in Exchange Act
Rules 13a-15(e) and 15d-15(e)). Based upon that evaluation, our
Chief Executive Officer and Chief Financial Officer concluded that,
as of the end of the period covered in this report, our disclosure
controls and procedures were effective to ensure that information
required to be disclosed in reports filed under the Exchange Act is
recorded, processed, summarized and reported within the required
time periods and is accumulated and communicated to our management,
including our Chief Executive Officer and Chief Financial Officer,
as appropriate to allow timely decisions regarding required
disclosure.
Changes in Internal Control over Financial Reporting
During
the three months ended September 30, 2018, there was no change in
our internal control over financial reporting (as such term is
defined in Rule 13a-15(f) under the Exchange Act) that has
materially affected, or is reasonably likely to materially affect,
our internal control over financial reporting.
46
PART II – OTHER INFORMATION
ITEM 1. LEGAL PROCEEDINGS
None.
ITEM 1A. RISK FACTORS
During
the three months ended September 30, 2018, there were no material
changes to the risk factors disclosed in Item 1A of our Annual
Report on Form 10-K for the year ended December 31, 2017 except the
risks set forth below.
Litigation and other proceedings relating to intellectual property
is expensive, time consuming and uncertain, and we may be
unsuccessful in our efforts to protect against infringement by
third parties or defend ourselves against claims of infringement or
otherwise.
To
protect our intellectual property, we may initiate litigation or
other proceedings. Third parties may also initiate proceedings to
challenge our intellectual property rights. For instance, in
April 2018, a company based in Hangzhou, China, submitted a
petition with the PRC Trademark Office to challenge our
Rejoin™ trademark on the basis of a lack of use. Upon such
petition, the PRC Trademark Office has issued a notice, requesting
us to provide evidence of use by August 30, 2018. We
collected evidence in response to such notice and timely submitted
a response to refute the claim. Although we are dedicated to
protecting our intellectual property in such proceedings and
believe that we have resources to do so, there is no assurance that
we will succeed or defend such notice in each of these
matters. The loss or narrowing of our intellectual property
protection, the inability to secure or enforce our intellectual
property rights or a finding that we have infringed the
intellectual property rights of a third party could limit our
ability to develop or market our products and services in the
future or adversely affect our revenues. In addition, intellectual
property litigation and other adverse proceedings are costly and
time-consuming in general, divert the attention of management and
technical personnel and could result in substantial uncertainty
regarding our future viability, even if we ultimately
prevail. Furthermore, any public announcements related to
such litigation or regulatory proceedings could adversely affect
the price of our common stock.
Third
parties may allege that the research, development and
commercialization activities we conduct infringe patents or other
proprietary rights owned by such parties. This may turn out to be
the case even though we have conducted a search and analysis of
third-party intellectual property rights and have determined that
certain aspects of our research and development and proposed
products activities apparently do not infringe on any third-party
Chinese intellectual property rights. If we are found to have
infringed the intellectual property of a third party, we may be
required to pay substantial damages; we also may be required to
seek from such party a license, which may not be available on
acceptable terms, if at all, to continue our activities. A judicial
finding or infringement or the failure to obtain necessary licenses
could prevent us from commercializing our products, which would
have a material adverse effect on our business, operating results
and financial condition.
47
ITEM 2. UNREGISTERED SALES OF EQUITY SECURITIES AND USE OF
PROCEEDS
As
previously disclosed on a Current Report on Form 8-K filed on June
1, 2017, the Company authorized a share repurchase program (the
“2017 Share Repurchase Program”), pursuant to which the
Company may, from time to time, purchase shares of its common stock
for an aggregate purchase price not to exceed $10 million under
which approximately $6.52 million in shares of common stock were
repurchased.. On October 10, 2018, the Company commenced a share
repurchase program (the “2018 Share Repurchase
Program”), pursuant to which the Company may, from time to
time, purchase shares of its common stock for an aggregate purchase
price not to exceed approximately $8.48 million. It is
contemplated that total shares to be repurchased under the 2017 and
2018 Share Repurchase Programs shall not exceed $15 million in the
aggregate. The table below summarizes purchases made by or on
behalf of the Company or affiliated purchasers as defined in
Regulation S-K under the 2017 Share Purchase Program during the
nine months ended September 30, 2018.
|
Period
|
Total number of shares purchased
|
Average price paid per share
|
Total number of shares purchased as part of publicly announced
plans or programs
|
Maximum dollar value of shares that may yet be purchased under the
plans or programs
|
|
|
|
|
|
|
|
Prior
to 2018
|
426,794
|
$9.32
|
426,794
|
|
|
January
1, 2018 ~ January 31, 2018
|
-
|
$-
|
-
|
|
|
February
1, 2018 ~ February 28, 2018
|
-
|
$-
|
-
|
|
|
March
1, 2018 ~ March 31, 2018
|
37,462
|
$19.10
|
37,462
|
|
|
April
1, 2018 ~ April 30, 2018
|
17,984
|
$19.84
|
17,984
|
|
|
May
1, 2018 ~ May 31, 2018
|
47,006
|
$18.97
|
47,006
|
|
|
June
1, 2018 ~ June 30, 2018
|
31,522
|
$18.14
|
31,522
|
|
|
July
1, 2018 ~ July 31, 2018
|
-
|
$-
|
-
|
|
|
August
1, 2018 ~ August 31, 2018
|
-
|
$-
|
-
|
|
|
September
1, 2018 ~ September 30, 2018
|
-
|
$-
|
-
|
|
|
|
|
|
|
|
|
Total
|
560,768
|
$11.62
|
560,768
|
8,486,007
|
ITEM 3. DEFAULTS UPON SENIOR SECURITIES
None.
ITEM 4. MINE SAFETY DISCLOSURES
Not
applicable.
ITEM 5. OTHER INFORMATION
ITEM 6. EXHIBITS
Exhibits
|
Exhibit Number
|
|
Description
|
|
|
Certification
Pursuant to Section 302 of the Sarbanes-Oxley Act of 2002 - Chief
Executive Officer and Chief Financial Officer.
|
|
|
|
Certifications
Pursuant to Section 906 of the Sarbanes-Oxley Act of
2002.
|
|
|
101.INS
|
|
XBRL
Instance Document
|
|
101.SCH
|
|
XBRL
Taxonomy Extension Schema
|
|
101.CAL
|
|
XBRL
Taxonomy Extension Calculation Linkbase
|
|
101.DEF
|
|
XBRL
Taxonomy Extension Definition Linkbase
|
|
101.LAB
|
|
XBRL
Taxonomy Extension Label Linkbase
|
|
101.PRE
|
|
XBRL
Taxonomy Extension Presentation Linkbase
|
48
SIGNATURES
In
accordance with Section 13 or 15(d) of the Securities
Exchange Act of 1934, as amended, the registrant caused this report
to be signed on its behalf by the undersigned, thereunto duly
authorized.
|
|
CELLULAR BIOMEDICINE GROUP, INC.
|
|
|
|
|
(Registrant)
|
|
|
|
|
|
|
|
|
Date:
November 6, 2018
|
By:
|
/s/
Bizuo (Tony) Liu
|
|
|
|
|
Bizuo
(Tony) Liu
|
|
|
|
|
Chief
Executive Officer and Chief Financial Officer
|
|
|
|
|
(Principal
Executive Officer and Principal Financial and Accounting
Officer)
|
|
|
|
|
|
|
49