Attached files
| file | filename |
|---|---|
| EX-32 - EX-32 - EDGEWATER TECHNOLOGY INC/DE/ | d561556dex32.htm |
| EX-31.2 - EX-31.2 - EDGEWATER TECHNOLOGY INC/DE/ | d561556dex312.htm |
| EX-31.1 - EX-31.1 - EDGEWATER TECHNOLOGY INC/DE/ | d561556dex311.htm |
Table of Contents
UNITED STATES
SECURITIES AND EXCHANGE COMMISSION
Washington, D.C. 20549
FORM 10-Q
| ☒ | Quarterly report pursuant to Section 13 or 15 (d) of the Securities Exchange Act of 1934 |
For the quarterly period ended March 31, 2018
or
| ☐ | Transition report pursuant to Section 13 or 15 (d) of the Securities Exchange Act of 1934 |
for the transition period from to
Commission file number: 000-20971
EDGEWATER TECHNOLOGY, INC.
(Exact Name of Registrant as Specified in its Charter)
| Delaware | 71-0788538 | |
| (State or Other Jurisdiction of Incorporation or Organization) |
(I.R.S. Employer Identification No.) | |
| 200 Harvard Mill Square, Suite 210 Wakefield, MA |
01880-3209 | |
| (Address of Principal Executive Offices) | (Zip Code) | |
Registrant’s telephone number, including area code: (781) 246-3343
Indicate by check mark whether the registrant (1) has filed all reports required to be filed by Section 13 or 15(d) of the Securities Exchange Act of 1934 during the preceding 12 months (or for such shorter period that the registrant was required to file such reports), and (2) has been subject to such filing requirements for the past 90 days. Yes ☒ No ☐
Indicate by check mark whether the registrant has submitted electronically and posted on its corporate Web site, if any, every Interactive Data File required to be submitted and posted pursuant to Rule 405 of Regulation S-T (§232.405 of this chapter) during the preceding 12 months (or for such shorter period that the registrant was required to submit and post such files). Yes ☒ No ☐
Indicate by check mark whether the registrant is a large accelerated filer, an accelerated filer, a non-accelerated filer, smaller reporting company, or an emerging growth company. See the definitions of “large accelerated filer,” “accelerated filer,” “smaller reporting company” and “emerging growth company” in Rule 12b-2 of the Exchange Act:
| Large accelerated filer | ☐ | Accelerated filer | ☒ | |||
| Non-accelerated filer | ☐ (Do not check if smaller reporting company) | Smaller Reporting Company | ☐ | |||
| Emerging Growth Company | ☐ | |||||
If an emerging growth company, indicate by check mark if the registrant has elected not to use the extended transition period for complying with any new or revised financial accounting standards provided pursuant to Section 13(a) of the Exchange Act. ☐
Indicate by check mark whether the registrant is a shell company (as defined in Rule 12b-2 of the Exchange Act). Yes ☐ No ☒
The number of shares of Common Stock of the Registrant, par value $.01 per share, outstanding at May 7, 2018 was 14,394,076.
Table of Contents
EDGEWATER TECHNOLOGY, INC.
FORM 10-Q FOR THE QUARTER ENDED MARCH 31, 2018
2
Table of Contents
PART I – FINANCIAL INFORMATION
EDGEWATER TECHNOLOGY, INC.
UNAUDITED CONDENSED CONSOLIDATED BALANCE SHEETS
(In Thousands, Except Per Share Data)
| March 31, 2018 |
December 31, 2017 |
|||||||
| ASSETS | ||||||||
| Current assets: |
||||||||
| Cash and cash equivalents |
$ | 8,442 | $ | 15,398 | ||||
| Accounts receivable, net of allowance of $150 |
24,561 | 22,218 | ||||||
| Prepaid expenses and other current assets |
2,983 | 2,075 | ||||||
|
|
|
|
|
|||||
| Total current assets |
35,986 | 39,691 | ||||||
| Property and equipment, net |
424 | 409 | ||||||
| Intangible assets, net |
5,015 | 5,575 | ||||||
| Goodwill |
29,983 | 29,983 | ||||||
| Other assets |
210 | 216 | ||||||
|
|
|
|
|
|||||
| Total assets |
$ | 71,618 | $ | 75,874 | ||||
|
|
|
|
|
|||||
| LIABILITIES AND STOCKHOLDERS’ EQUITY | ||||||||
| Current liabilities: |
||||||||
| Accounts payable |
$ | 978 | $ | 767 | ||||
| Accrued liabilities |
13,747 | 14,984 | ||||||
| Deferred revenue |
2,301 | 2,140 | ||||||
| Revolving credit facility |
5,000 | 5,000 | ||||||
|
|
|
|
|
|||||
| Total liabilities |
22,026 | 22,891 | ||||||
|
|
|
|
|
|||||
| Stockholders’ equity: |
||||||||
| Preferred stock, $.01 par value; 2,000 shares authorized, no shares issued or outstanding |
— | — | ||||||
| Common stock, $.01 par value; 48,000 shares authorized, 29,736 shares issued as of March 31, 2018 and December 31, 2017, 14,363 and 14,046 shares outstanding as of March 31, 2018 and December 31, 2017, respectively |
297 | 297 | ||||||
| Paid-in capital |
200,818 | 202,749 | ||||||
| Treasury stock, at cost, 15,373 and 15,690 shares at March 31, 2018 and December 31, 2017, respectively |
(95,894 | ) | (98,684 | ) | ||||
| Accumulated other comprehensive loss |
(613 | ) | (582 | ) | ||||
| Retained deficit |
(55,016 | ) | (50,797 | ) | ||||
|
|
|
|
|
|||||
| Total stockholders’ equity |
49,592 | 52,983 | ||||||
|
|
|
|
|
|||||
| Total liabilities and stockholders’ equity |
$ | 71,618 | $ | 75,874 | ||||
|
|
|
|
|
|||||
See notes to the unaudited condensed consolidated financial statements.
3
Table of Contents
EDGEWATER TECHNOLOGY, INC.
UNAUDITED CONDENSED CONSOLIDATED STATEMENTS OF COMPREHENSIVE LOSS
(In Thousands, Except Per Share Data)
| Three Months Ended March 31, |
||||||||
| 2018 | 2017 | |||||||
| Revenue: |
||||||||
| Service revenue |
$ | 22,480 | $ | 25,135 | ||||
| Software revenue |
1,325 | 2,531 | ||||||
| Reimbursable expenses |
1,324 | 1,464 | ||||||
|
|
|
|
|
|||||
| Total revenue |
25,129 | 29,130 | ||||||
| Cost of revenue: |
||||||||
| Project and personnel costs |
15,530 | 16,286 | ||||||
| Software costs |
— | 1,392 | ||||||
| Reimbursable expenses |
1,324 | 1,464 | ||||||
|
|
|
|
|
|||||
| Total cost of revenue |
16,854 | 19,142 | ||||||
|
|
|
|
|
|||||
| Gross profit |
8,275 | 9,988 | ||||||
| Operating expenses: |
||||||||
| Selling, general and administrative |
10,415 | 9,938 | ||||||
| Merger related transaction costs |
1,278 | — | ||||||
| Named executive officer severance |
— | 3,371 | ||||||
| Consent solicitation expense |
— | 666 | ||||||
| Change in fair value of contingent earnout consideration |
— | 604 | ||||||
| Depreciation and amortization |
636 | 808 | ||||||
|
|
|
|
|
|||||
| Total operating expenses |
12,329 | 15,387 | ||||||
|
|
|
|
|
|||||
| Operating loss |
(4,054 | ) | (5,399 | ) | ||||
| Other expense, net |
34 | 233 | ||||||
|
|
|
|
|
|||||
| Loss before income taxes |
(4,088 | ) | (5,632 | ) | ||||
| Tax provision (benefit) |
131 | (2,945 | ) | |||||
|
|
|
|
|
|||||
| Net loss |
$ | (4,219 | ) | $ | (2,687 | ) | ||
|
|
|
|
|
|||||
| Comprehensive loss: |
||||||||
| Currency translation adjustments |
(31 | ) | (2 | ) | ||||
|
|
|
|
|
|||||
| Total comprehensive loss |
$ | (4,250 | ) | $ | (2,689 | ) | ||
|
|
|
|
|
|||||
| Net loss per share: |
||||||||
| Basic net loss per share of common stock |
$ | (0.30 | ) | $ | (0.21 | ) | ||
|
|
|
|
|
|||||
| Diluted net loss per share of common stock |
$ | (0.30 | ) | $ | (0.21 | ) | ||
|
|
|
|
|
|||||
| Shares used in computing basic net loss per share of common stock |
14,137 | 12,971 | ||||||
|
|
|
|
|
|||||
| Shares used in computing diluted net loss per share of common stock |
14,137 | 12,971 | ||||||
|
|
|
|
|
|||||
See notes to the unaudited condensed consolidated financial statements.
4
Table of Contents
EDGEWATER TECHNOLOGY, INC.
UNAUDITED CONDENSED CONSOLIDATED STATEMENTS OF CASH FLOWS
(In Thousands)
| Three Months Ended March 31, |
||||||||
| 2018 | 2017 | |||||||
| CASH FLOWS FROM OPERATING ACTIVITIES: |
||||||||
| Net loss |
$ | (4,219 | ) | $ | (2,687 | ) | ||
| Adjustments to reconcile net loss to net cash used in operating activities, excluding the impact of acquisitions: |
||||||||
| Depreciation and amortization |
636 | 811 | ||||||
| Share-based compensation expense |
202 | 510 | ||||||
| Deferred income taxes |
— | (3,204 | ) | |||||
| Accretion of contingent earnout consideration |
— | 236 | ||||||
| Change in fair value of contingent earnout consideration |
— | 604 | ||||||
| Changes in operating accounts, net of acquisition: |
||||||||
| Accounts receivable |
(2,388 | ) | 275 | |||||
| Prepaid expenses and other current assets |
(387 | ) | (572 | ) | ||||
| Accounts payable |
209 | (47 | ) | |||||
| Accrued liabilities and other liabilities |
(1,128 | ) | 220 | |||||
| Deferred revenue |
161 | 111 | ||||||
|
|
|
|
|
|||||
| Net cash used in operating activities |
(6,914 | ) | (3,743 | ) | ||||
|
|
|
|
|
|||||
| CASH FLOWS FROM INVESTING ACTIVITIES: |
||||||||
| Purchases of property and equipment |
(91 | ) | (19 | ) | ||||
|
|
|
|
|
|||||
| Net cash used in investing activities |
(91 | ) | (19 | ) | ||||
|
|
|
|
|
|||||
| CASH FLOWS FROM FINANCING ACTIVITIES: |
||||||||
| Proceeds from employee stock plans and stock option exercises |
982 | 1,730 | ||||||
| Repurchase of common stock |
(948 | ) | — | |||||
|
|
|
|
|
|||||
| Net cash provided by financing activities |
34 | 1,730 | ||||||
|
|
|
|
|
|||||
| Effects of exchange rates on cash |
15 | 13 | ||||||
|
|
|
|
|
|||||
| Net decrease in cash and cash equivalents |
(6,956 | ) | (2,019 | ) | ||||
| CASH AND CASH EQUIVALENTS, beginning of period |
15,398 | 19,693 | ||||||
|
|
|
|
|
|||||
| CASH AND CASH EQUIVALENTS, end of period |
$ | 8,442 | $ | 17,674 | ||||
|
|
|
|
|
|||||
| SUPPLEMENTAL DISCLOSURES OF CASH FLOW INFORMATION: |
||||||||
| Cash paid for income taxes |
$ | 42 | $ | 40 | ||||
|
|
|
|
|
|||||
| Issuance of restricted stock awards |
$ | — | $ | — | ||||
|
|
|
|
|
|||||
See notes to the unaudited condensed consolidated financial statements.
5
Table of Contents
EDGEWATER TECHNOLOGY, INC.
NOTES TO UNAUDITED CONDENSED CONSOLIDATED FINANCIAL STATEMENTS
1. ORGANIZATION:
Edgewater Technology, Inc. helps the C-suite drive transformational change through its unique selection of business and technology services and channel-based solutions.
Classic consulting disciplines (such as business advisory, process improvement, organizational change management, M&A due diligence, and domain expertise) are blended with technical services (such as digital transformation, technical roadmaps, data and analytics services, custom development and system integration) to help organizations leverage investments in legacy IT assets to create new digital business models.
The Company delivers product based consulting in both the Enterprise Performance Management (“EPM”) and Enterprise Resource Planning (“ERP”) areas both on premise and in the cloud. Within the EPM offering, our Oracle channel, Edgewater Ranzal, provides Business Analytics solutions leveraging Oracle EPM, Business Intelligence (“BI”) and Big Data technologies. Within the ERP offering, our Microsoft channel, Edgewater Fullscope, delivers Dynamics AX ERP, Business Intelligence and CRM solutions primarily in the manufacturing space.
In this Quarterly Report on Form 10-Q (the “Form 10-Q”), we use the terms “Edgewater,” “Edgewater Technology,” “we,” “our Company,” “the Company,” “our” and “us” to refer to Edgewater Technology, Inc. and its wholly-owned subsidiaries, which are described in our 2016 Annual Report on Form 10-K, as filed with the Securities and Exchange Commission (the “SEC”) on March 16, 2018 (the “2017 Form 10-K”).
On March 15, 2018, Edgewater Technology, Inc. (the “Company”) entered into an Arrangement Agreement (the “Arrangement Agreement”) with 9374-8572 Québec Inc., a newly-formed Québec corporation (“CanCo Parent”), Alithya Group Inc., a Québec private corporation (“Alithya”), which now conducts a digital technology and consulting business, and 9374-8572 Delaware Inc., a newly-formed wholly-owned Delaware subsidiary of CanCo Parent (“U.S. Merger Sub”). Under the terms of the Arrangement Agreement, (a) CanCo Parent will acquire Alithya pursuant to a plan of arrangement under the laws of Québec, Canada, and (b) U.S. Merger Sub will merge with and into the Company (the “Merger”), with the Company as the surviving corporation (together, the “Arrangement”). As a result of the Arrangement, both the Company and Alithya will become wholly-owned subsidiaries of CanCo Parent.
The Arrangement Agreement is subject to approval by the respective shareholders of the Company and Alithya. In order to solicit such approval, the Company and Alithya will jointly prepare a management proxy circular and other documents required by applicable laws for the Alithya shareholders and a prospectus/proxy statement for the Company shareholders. That prospectus/proxy statement will be included in a registration statement on Form F-4 (the “CanCo Parent Registration Statement”) to be filed by CanCo Parent with the Securities and Exchange Commission (the “SEC”) under which, as described below, CanCo Parent will offer to the shareholders of the Company and Alithya, in exchange for all of their common shares in the Company and Alithya, common shares of CanCo Parent (“CanCo Parent Shares”) and, to those Alithya shareholders which now hold Alithya multiple voting shares, multiple voting shares of CanCo Parent (“CanCo Parent Multiple Voting Shares”). CanCo Parent will also apply to have the CanCo Parent Shares listed, subject to official notice of issuance, for trading on NASDAQ and the Toronto Stock Exchange.
The closing of the Arrangement (the “Closing”) is now expected to occur in the third quarter of 2018. However, the Company cannot predict with certainty when, or if, the Arrangement will close because such closing is subject to conditions beyond the Company’s control.
The Arrangement Agreement provides that, upon the terms and subject to the conditions set forth therein, the following will occur on or prior to the effective time of the Arrangement (the “Effective Time”):
| (i) | in connection with the Merger, CanCo Parent will issue CanCo Parent Shares to the Company’s shareholders based upon an exchange ratio of 1.3118 CanCo Parent Share for each Company common share, but subject to potential adjustment if the volume weighted average trading price of the Company’s common shares on NASDAQ during the 10 consecutive trading days preceding the Closing (the “VWAP”) shall be less than U.S.$5.25; |
| (ii) | in connection with the acquisition of Alithya, CanCo Parent will issue CanCo Parent Shares to those shareholders of Alithya which now hold Alithya common shares and, to those Alithya shareholders which now hold Alithya multiple voting shares, equivalent CanCo Parent Multiple Voting Shares, based upon an exchange ratio of one CanCo Parent Share or one CanCo Parent Multiple Voting Share for each Alithya common share or Alithya multiple voting share, respectively; |
6
Table of Contents
| (iii) | CanCo Parent will change its name to Alithya Group, Inc. and its headquarters to the current headquarters of Alithya in Montreal, Québec; |
| (iv) | CanCo Parent’s board of directors will consist of nine directors, of whom six will be nominated by Alithya’s current board and three by the Company’s current board, and Paul Raymond (Alithya’s current chief executive officer), Claude Rousseau (Alithya’s current chief operating officer), and Mathieu Lupien (Alithya’s current chief financial officer) will become, respectively, CanCo Parent’s chief executive officer, chief operating officer and chief financial officer; and in addition to the right of the Company shareholders to receive CanCo Parent Shares, the Company will pay, immediately prior to the Closing, to the Company’s shareholders and option holders a special dividend equal to U.S.$20.5 million (approximately $1.54 per currently outstanding Company share), provided that (i) the total amount of such dividend shall proportionately increase or decrease to the extent, if any, the Company’s “Net Cash” (as defined in the Arrangement Agreement) shall then be greater or less than U.S.$8.5 million and (ii) such dividend shall be payable either in cash (for the Company’s shareholders) or an adjustment (for the Company’s option holders) to the exercise price of such options. |
2. BASIS OF PRESENTATION:
The accompanying unaudited condensed consolidated financial statements have been prepared by Edgewater pursuant to the rules and regulations of the SEC regarding interim financial reporting. Certain information and note disclosures normally included in annual financial statements prepared in accordance with accounting principles generally accepted in the United States of America have been omitted pursuant to those rules and regulations, although we believe that the disclosures made are adequate to ensure the information presented is not misleading.
The accompanying unaudited condensed consolidated financial statements reflect all adjustments (which were of a normal, recurring nature) that, in the opinion of management, are necessary to present fairly our financial position, results of operations and cash flows as of and for the interim periods presented. All intercompany transactions have been eliminated in the accompanying unaudited condensed consolidated financial statements. These financial statements should be read in conjunction with the audited financial statements and notes thereto included in our 2017 Form 10-K.
The results of operations for the three months ended March 31, 2018 are not necessarily indicative of the results to be expected for any future period or the full fiscal year. Our revenue and earnings may fluctuate from quarter-to-quarter based on factors within and outside our control, including variability in demand for information technology professional services, the length of the sales cycle associated with our service offerings, the number, size and scope of our projects and the efficiency with which we utilize our employees.
Other comprehensive loss consists of net loss plus or minus any currency translation adjustments.
3. REVENUE RECOGNITION:
As of January 1, 2018, the Company adopted Accounting Standards Update (“ASU”) 2014-09, Revenue from Contracts with Customers (“ASC 606”), which impacts the timing of when certain types of revenue will be recognized. Revenues are recognized when we satisfy a performance obligation by transferring goods or services promised in a contract to a customer, in an amount that reflects the consideration that we expect to receive in exchange for those goods and services. Performance obligations in our contracts represent distinct or separate service or product streams that we provide to our customers. The Company has adopted the standard using the modified retrospective approach. The standard was applied to all open contracts as of the date of adoption. The Company did not recognize any cumulative catch-up adjustment in connection with the adoption of this standard.
We evaluate our revenue contracts with customers based on the five-step model under ASC 606: (1) Identify the contract with the customer; (2) Identify the performance obligations in the contract; (3) Determine the transaction price; (4) Allocate the transaction price to separate performance obligations; and (5) Recognize revenue when (or as) each performance obligation is satisfied.
The Company’s contracts with customers contain performance obligations related to the performance of professional services (in the form of time and materials, fixed fee or retainer based contracts), the delivery of software and/or the performance of maintenance services. The Company separately evaluates all performance obligations and allocates revenue based upon stand-alone selling price of the individual performance obligations.
We generate the majority of our revenues by providing consulting services to our clients. Our consulting service contracts are based on one of the following types of arrangements:
| • | Time and expense arrangements require the client to pay us based on the number of hours worked at contractually agreed-upon rates. We recognize revenue for these arrangements over time based on hours incurred and contracted rates. Revenue recognition over time is based on the enforceable right to payment. |
7
Table of Contents
| • | Fixed fee arrangements require the client to pay a pre-established fee in exchange for a predetermined set of professional services. We recognize revenue for these arrangements over time based on the proportional performance (using a hours-based input method) related to individual performance obligations within each arrangement. Revenue recognition over time is based on the enforceable right to payment. |
| • | Retainer based arrangements require the client to pay a recurring fee in exchange for a monthly recurring service (typically support). We recognize revenue for these arrangements over time (using a hours-based input method). Revenue recognition over time is based on customer simultaneously receiving and consuming the benefit of the services provided. |
We generate software revenue from the resale of certain third-party off-the-shelf software and maintenance. The majority of the software sold by the Company is delivered electronically. For software that is delivered electronically, we consider transfer of control to have occurred when the customer either (a) takes possession of the software via a download (that is, when the customer takes possession of the electronic data on its hardware), or (b) has been provided with access codes that allow the customer to take immediate possession of the software on its hardware pursuant to an agreement or purchase order for the software. In all instances, the resale of third-party software and maintenance is recorded on a net basis. Company created software, and the associated maintenance, is reported on a gross basis, however it is immaterial in all periods presented.
Third party software and maintenance revenue are recognized upon delivery of the software, as all related warranty and maintenance is performed by the primary software vendor and not the Company.
The Company enters into arrangements with multiple performance obligations which typically include software, post-contract support (or maintenance), and consulting services. Contracts that contain multiple performance obligations require an allocation of the transaction price to each performance obligation based on a relative standalone selling price basis. The Company has determined standalone selling price for each of the performance obligations in connection with our evaluation of arrangements with multiple performance obligations. The Company has established standalone selling price for consulting services based on a stated and consistent rate per hour range in standalone transactions. The Company has established standalone selling price for software through consistent stated rates for software components. The Company has established standalone selling price for maintenance based on observable prices for standalone renewals.
Unfulfilled performance obligations represent the remaining contract transaction prices allocated to the performance obligations that are unsatisfied, or partially unsatisfied, and therefore revenues have not yet been recorded. Unfulfilled performance obligations primarily consist of the remaining fees not yet recognized under our proportional performance method for our fixed fee arrangements. The aggregate amount of the transaction price allocated to the performance obligations that are unsatisfied (or partially unsatisfied) as of March 31, 2018 was $382 thousand and is expected to be recognized within the next twelve months. For time and expense arrangements, the Company has elected the practical expedient not to disclose transaction price allocated to unsatisfied (or partially unsatisfied) performance obligations for which we recognize revenue in accordance with paragraph 606-10-55-18. Revenue from these performance obligations is expected to be recognized within the next twelve months.
Contract liabilities are defined as liabilities incurred when we have received consideration from a client but have not yet performed the agreed upon services. This may occur when we receive advance billings before the performance of a support contract, billings in advance of service performed in connection with a fixed price arrangement, or occasional pre-billing of services to be performed under a time and materials contract. The contract liability balance was $2.3 million and $2.1 million as of March 31, 2018 and December 31, 2017, respectively.
The Company’s standard payment terms are 30 days from invoice date. Customer prepayments, even if nonrefundable, are deferred (classified as deferred revenue) and recognized over future periods as services are performed.
The Company routinely assesses the exposure associated with the potential for returns and refunds. Historic results support the conclusion that returns and refunds are insignificant, however should such concessions be deemed necessary the reserve would be established in the period in which the item was identified.
8
Table of Contents
The following tables further depict the disaggregation of revenue for the three-month periods ended March 31, 2018 and 2017. The information included in the disaggregation of revenue tables below have been presented in accordance with the standards set forth in ASC 606 for the three-month period ended March 31, 2018.
| Three-Months Ended March 31, 2018 |
||||||||||||
| Service (1) | Software | Total | ||||||||||
| Revenue by Reporting Unit: |
||||||||||||
| ERP |
$ | 11,820 | $ | 1,325 | $ | 13,145 | ||||||
| EPM |
10,949 | — | 10,949 | |||||||||
| Classic Consulting |
1,035 | — | 1,035 | |||||||||
|
|
|
|
|
|
|
|||||||
| Consolidated revenue |
$ | 23,804 | $ | 1,325 | $ | 25,129 | ||||||
|
|
|
|
|
|
|
|||||||
| Revenue by Contract Type: |
||||||||||||
| Time and materials |
19,373 | — | 19,373 | |||||||||
| Fixed price |
1,878 | — | 1,878 | |||||||||
| Retainer |
1,229 | — | 1,229 | |||||||||
| Software |
— | 1,325 | 1,325 | |||||||||
| Expense |
1,324 | — | 1,324 | |||||||||
|
|
|
|
|
|
|
|||||||
| Consolidated revenue |
$ | 23,804 | $ | 1,325 | $ | 25,129 | ||||||
|
|
|
|
|
|
|
|||||||
| Revenue Recognition |
||||||||||||
| Point in time |
— | 1,325 | 1,325 | |||||||||
| Over time |
23,804 | — | 23,804 | |||||||||
|
|
|
|
|
|
|
|||||||
| Consolidated revenue |
$ | 23,804 | $ | 1,325 | $ | 25,129 | ||||||
|
|
|
|
|
|
|
|||||||
| (1) | Service revenue includes both service and the corresponding reimbursable expense revenue. |
Adoption of the new revenue recognition standard did not have a meaningful impact on the Company’s consolidated balance sheet. The Company has not made any significant changes to the outstanding contracts. The Company has not changed the method of recording or presenting accounts receivable or deferred revenue. The Company did not incur or capitalize any amounts in connection with the cost to obtain customer contracts nor did the Company record any contract assets in connection with our contracts with customers. During the three-month period ended March 31, 2018, the Company recognized $1.0 million of service revenue that was recorded and presented as deferred revenue in prior periods.
The Company, under the standards set forth in ASC 606 has presented software revenue on a net basis for the three-month period ended March 31, 2018. This represents a change from the presentation basis on the previous revenue recognition guidance. There have been no meaningful changes to the structure of the software contracts during the current quarter, however the assessment of gross versus net now relies heavily on the concept of control and therefore the Company has concluded that net presentation is appropriate.
The table below presents software revenue in accordance with ASC 605 for the three-month period ended March 31, 2018. No other financials statement line items were affected by the adoption of ASC 606.
| Comparable Software Revenue: |
Three-month period ended March 31, 2018 |
|||
| Software Revenue |
$ | 2,595 | ||
| Software Expense |
1,270 | |||
|
|
|
|||
| Software Gross Margin |
$ | 1,325 | ||
|
|
|
|||
|
|
|
|||
The Company has elected to make the following accounting policy elections through the adoption of the following practical expedients:
Right to Invoice – Where applicable, the Company will recognize revenue from a contract with a customer in an amount that corresponds directly with the value to the customer of the Company’s performance completed to date and the amount to which the entity has a right to invoice.
Significant Financing Component – The Company will not adjust the promised amount of consideration for the effects of a significant financing component if the Company expects, at contract inception, that the period between when the entity transfers a promised good or service to a customer and when the customer pays for that good or service will be one year or less.
9
Table of Contents
There are also certain considerations related to internal control over financial reporting that are associated with implementing Topic 606. The Company has evaluated its internal control framework over revenue recognition and designed and implemented the appropriate internal controls to enable the preparation of financial information and obtain and disclose the information required under Topic 606. This evaluation did not result in any material changes to the Company’s existing internal control framework over revenue recognition.
4. SHARE-BASED COMPENSATION:
Share-based compensation expense under all of the Company’s share-based plans was $202 thousand and $510 thousand for the three-month periods ended March 31, 2018 and 2017, respectively.
Cash received from the employee stock purchase plan (“ESPP”) and through stock option exercises was $982 thousand and $1.7 million during the three-month periods ended March 31, 2018 and 2017, respectively. As of March 31, 2018, unrecognized compensation expense, net of estimated forfeitures, related to the unvested portion of all share-based compensation arrangements was approximately $188 thousand and is expected to be recognized over a weighted-average period of 1.41 years.
The Company intends to use previously purchased treasury shares for shares issued for options, restricted share awards and ESPP purchases. Shares may also be issued from authorized but unissued share reserves.
5. INCOME TAXES:
The Company recorded tax provisions (benefits) of $131 thousand and $(2.9) million for the three-month periods ended March 31, 2018 and 2017, respectively. The reported tax provision (benefit) for the three-month periods ended March 31, 2018 and 2017, are based upon estimated annual effective tax rates of 3.2% and 52.3%, respectively. The effective tax rate, in the three-month period ended March 31, 2018, reflected our foreign income tax provisions. The effective tax rate, in the three-month period ended March 31, 2017, reflected our combined Federal and state income tax rates, foreign income tax provisions and the recognition of U.S. deferred tax liabilities for differences between the book and tax basis of goodwill.
We assess the realizability of our deferred tax assets and assess the need for a valuation allowance on an ongoing basis. The periodic assessment of the net carrying value of our deferred tax assets under the applicable accounting rules is highly judgmental. We are required to consider all available positive and negative evidence in evaluating the likelihood that we will be able to realize the benefit of our deferred tax assets in the future. Such evidence includes scheduled reversals of deferred tax liabilities, projected future taxable income, tax planning strategies and the results of recent operations. Since this evaluation requires consideration of events that may occur some years into the future, there is significant judgment involved, and our conclusion could be materially different should certain of our expectations not transpire.
When assessing all available evidence, we consider the extent to which we have generated pre-tax income or losses over the most recent three-year period to be an important piece of objective evidence. As of March 31, 2018, and December 31, 2017, the recorded deferred tax asset valuation allowance balance was $21.7 million.
Our policy is to classify interest and penalties related to unrecognized tax benefits as income tax expense. This policy has been consistently applied in all periods. No such amounts were recognized in the three-month periods ended March 31, 2018 or 2017. We have reviewed the tax positions taken, or to be taken, in our tax returns for all tax years currently open to examination by a taxing authority. We have identified no uncertain tax positions for which it is reasonably possible that the total amount of unrecognized tax benefits will significantly increase or decrease within the twelve months ending March 31, 2019. We remain subject to examination until the statute of limitations expires for each respective tax jurisdiction.
The Company adopted the Accounting Standards Update related to stock-based compensation during the three-month period ended March 31, 2017. This adoption had an impact on the tax treatment for stock option exercises during the quarter ended March 31, 2017 (as well as a cumulative adjustment for prior period activity). In connection with the adoption of this standard, all excess tax benefits and tax deficiencies will be recognized in the statement of comprehensive income in the period in which they occur. The Company recognized $111 thousand and $241 thousand of tax expense related to stock option exercises in the three-month periods ended March 31, 2018 and 2017, respectively, however, because the Company is in a full valuation allowance position, no benefit was taken in the consolidated financial statements. During the three-month period ended March 31, 2017, the Company recorded a $1.4 million cumulative adjustment to retained earnings to present the impact of prior period activity in accordance with the adopted standard.
10
Table of Contents
6. GOODWILL AND INTANGIBLE ASSETS:
There have been no changes to the Company’s goodwill balance. Our annual goodwill and intangible assets measurement date is December 2. The Company has determined that no triggering events have occurred during the three-month period ended March 31, 2018.
We amortize our intangible assets that have finite lives using either the straight-line method or based on estimated future cash flows to approximate the pattern in which the economic benefit of the asset will be utilized. Amortization expense was $561 thousand and $698 thousand during the three-month periods ended March 31, 2018 and 2017, respectively. This amortization expense relates to certain non-competition covenants and customer lists, which expire at various times through 2021.
Estimated annual amortization expense of our intangible assets for the current year and the following four years ending December 31, is as follows:
| Amortization Expense |
||||
| (In Thousands) | ||||
| 2018 |
$ | 2,240 | ||
| 2019 |
$ | 1,713 | ||
| 2020 |
$ | 1,057 | ||
| 2021 |
$ | 565 | ||
7. ACCRUED EXPENSES AND OTHER LIABILITIES:
Accrued liabilities as of March 31, 2018 and December 31, 2017 consisted of the following:
| March 31, 2018 |
December 31, 2017 |
|||||||
| (In Thousands) | ||||||||
| Accrued bonuses |
$ | 4,218 | $ | 5,590 | ||||
| Accrued payroll related liabilities |
1,888 | 3,277 | ||||||
| Accrued vacation |
2,952 | 2,497 | ||||||
| Accrued commissions |
722 | 825 | ||||||
| Accrued software expense |
463 | 675 | ||||||
| Accrued contractor fees |
341 | 346 | ||||||
| Accrued professional service fees |
1,511 | 341 | ||||||
| Deferred rent |
60 | 64 | ||||||
| Income tax related accruals |
531 | 189 | ||||||
| Other accrued expenses |
1,061 | 1,180 | ||||||
|
|
|
|
|
|||||
| Total |
$ | 13,747 | $ | 14,984 | ||||
|
|
|
|
|
|||||
11
Table of Contents
8. NET LOSS PER SHARE:
A reconciliation of net loss and weighted average shares used in computing basic and diluted net loss per share is as follows:
| Three Months Ended March 31, |
||||||||
| 2018 | 2017 | |||||||
| Basic net loss per share: |
||||||||
| Net loss applicable to common shares |
$ | (4,219 | ) | $ | (2,687 | ) | ||
|
|
|
|
|
|||||
| Weighted average common shares outstanding |
14,137 | 12,971 | ||||||
|
|
|
|
|
|||||
| Basic net loss per share of common stock |
$ | (0.30 | ) | $ | (0.21 | ) | ||
|
|
|
|
|
|||||
| Diluted net loss per share: |
||||||||
| Net loss applicable to common shares |
$ | (4,219 | ) | $ | (2,687 | ) | ||
|
|
|
|
|
|||||
| Weighted average common shares outstanding |
14,137 | 12,971 | ||||||
| Dilutive effects of stock options |
— | — | ||||||
|
|
|
|
|
|||||
| Weighted average common shares, assuming dilutive effect of stock options |
14,137 | 12,971 | ||||||
|
|
|
|
|
|||||
| Diluted net loss per share of common stock |
$ | (0.30 | ) | $ | (0.21 | ) | ||
|
|
|
|
|
|||||
Share-based awards, inclusive of all grants made under the Company’s equity plans, for which either the stock option exercise price or the fair value of the restricted share award exceeds the average market price over the period, have an anti-dilutive effect on earnings per share, and accordingly, are excluded from the diluted computations for all periods presented. Had such shares been included, shares for the diluted computation would have increased by approximately 551 thousand and 194 thousand in the three-month periods ended March 31, 2018 and 2017, respectively. As of March 31, 2018 and 2017, there were approximately 1.0 million and 2.5 million share-based awards outstanding, respectively, under the Company’s equity plans. Options to purchase 323 thousand and 1.7 million shares of common stock that were outstanding during the three months ended March 31, 2018 and 2017, respectively, were not included in the computation of diluted net loss per share due to the reported periodic loss.
9. STOCK REPURCHASE PROGRAM:
In December 2007, our Board of Directors (the “Board”) authorized a stock repurchase program for up to $5.0 million of common stock on the open market or through privately negotiated transactions from time-to-time through December 31, 2008 (the “Stock Repurchase Program”). The Board subsequently amended the Stock Repurchase Program, authorizing both an increase to and an extension of the Stock Repurchase Program. The Stock Repurchase Program, as amended, had a maximum purchase value of shares of $23.1 million (the “Purchase Authorization”) and was set to expire on September 22, 2017 (the “Repurchase Period”). On September 20, 2017, we announced that the Board had approved an extension of the Repurchase Period to September 21, 2018.
The timing and amount of the purchases will be based upon market conditions, securities law considerations and other factors. The Stock Repurchase Program does not obligate the Company to acquire a specific number of shares in any period and may be modified, suspended, extended or discontinued at any time, without prior notice.
The Company repurchased 151 thousand shares at an aggregate price of $948 thousand during the three-month period ended March 31, 2018. The Company did not repurchase any shares of common stock during the three-month period ended March 31, 2017. As of March 31, 2018, the Company had $6.5 million of purchase authorization remaining under the plan.
10. REVOLVING LINE OF CREDIT:
In September 2013, the Company entered into a secured revolving credit facility (the “Credit Facility”). The Credit Facility was modified through an amendment in December 2015, which increased the borrowing base to $15 million (from the previous $10 million) with an additional accordion feature that allows the Company to request an additional $5.0 million as needed, extending the total credit facility borrowing capacity to $20 million over its three-year term. The Credit Facility is collateralized by substantially all assets of the Company and its domestic subsidiaries, and is subject to normal financial covenants. The Company was not in compliance with one of its loan covenants as of March 31, 2018. Subsequent to quarter-end, the Company has received a waiver of compliance for the period ending March 31, 2018 related to the failure to meet the Minimum Interest Coverage covenant. In connection with this waiver, the Company is required to maintain a minimum cash balance in the amount of $4 million through May 21, 2018, at which point in time the minimum cash balance required increases to $5 million.
12
Table of Contents
Under the terms of the Credit Facility, any advances will accrue interest at a variable per annum rate of interest equal to the LIBOR Rate plus 1.5%. Interest is due and payable, in arrears, on a monthly basis. The Company will be obligated to pay an annual commitment fee of 0.15% on the daily undrawn balance of the facility. Any amounts outstanding under the Credit Facility will be due on December 21, 2018. The Company has drawn down $5.0 million of this balance as of March 31, 2018.
11. GEOGRAPHIC INFORMATION
Total revenue to unaffiliated customers by geographic area were as follows:
| For the Three- Months Ended March 31, |
||||||||
| 2018 | 2017 | |||||||
| United States |
$ | 21,767 | $ | 25,100 | ||||
| Canada |
2,155 | 2,876 | ||||||
| Other International |
1,207 | 1,154 | ||||||
|
|
|
|
|
|||||
| Total Revenue |
$ | 25,129 | $ | 29,130 | ||||
|
|
|
|
|
|||||
Substantially all of the Company’s long-lived assets are located within the United States.
12. SEGMENT INFORMATION
In accordance with the provisions of Topic 280, Segment Reporting to the FASB ASC (“ASC 280”), the Company determined that it has three operating segments (Enterprise Performance Management (“EPM”), Enterprise Resource Planning (“ERP”) and Classic Consulting).
The EPM segment provides Business Analytics solutions leveraging Oracle EPM, BI and Big Data technologies. The ERP segment delivers Dynamics AX ERP, Business Intelligence and CRM solutions, primarily in the manufacturing space. The Classic Consulting segment provides business advisory services that are blended with technical services to help organizations leverage investments in legacy IT assets to create new digital business models.
The Company’s chief operating decision maker evaluates performance using several factors, of which the primary financial measures are revenue and operating segment operating income. The accounting policies of the operating segments are the same as those described in Note 2 “Summary of Significant Accounting Policies”.
Segment information for the three-month periods ended March 31, 2018 and 2017 were as follows:
| EPM | ERP | Classic Consulting | Corporate | Consolidated | ||||||||||||||||
| (In Thousands) | ||||||||||||||||||||
| March 31, 2018 |
||||||||||||||||||||
| Total revenue |
$ | 10,949 | $ | 13,145 | $ | 1,035 | $ | — | $ | 25,129 | ||||||||||
| Operating income (loss) |
$ | (628 | ) | $ | 1,595 | $ | (677 | ) | $ | (4,344 | ) | $ | (4,054 | ) | ||||||
| Depreciation and amortization expense |
$ | 448 | $ | 172 | $ | — | $ | 16 | $ | 636 | ||||||||||
| March 31, 2017 |
||||||||||||||||||||
| Total revenue |
$ | 14,307 | $ | 11,350 | $ | 3,473 | $ | — | $ | 29,130 | ||||||||||
| Operating income (loss) |
$ | 899 | $ | 929 | $ | (25 | ) | $ | (7,202 | ) | $ | (5,399 | ) | |||||||
| Depreciation and amortization expense |
$ | 562 | $ | 198 | $ | 3 | $ | 48 | $ | 811 | ||||||||||
The Company is not disclosing total assets for each of its reportable segments, as total assets by reportable segment is not a key metric provided to the Company’s chief operating decision maker.
13
Table of Contents
ITEM 2. MANAGEMENT’S DISCUSSION AND ANALYSIS OF FINANCIAL CONDITION AND RESULTS OF OPERATIONS
The following information should be read in conjunction with the information contained in the Unaudited Condensed Consolidated Financial Statements and notes thereto appearing elsewhere in this Quarterly Report on Form 10-Q. This Quarterly Report on Form 10-Q contains forward-looking statements that involve risks and uncertainties. See “Risk Factors” and “Special Note Regarding Forward-Looking Statements” included elsewhere herein. We use the terms “we,” “our,” “us,” “Edgewater” and “the Company” in this report to refer to Edgewater Technology, Inc. and its wholly-owned subsidiaries.
Edgewater Technology, Inc. helps the C-suite drive transformational change through its unique selection of business and technology services and channel-based solutions.
Classic consulting disciplines (such as business advisory, process improvement, organizational change management, M&A due diligence, and domain expertise) are blended with technical services (such as digital transformation, technical roadmaps, data and analytics services, custom development and system integration) to help organizations leverage investments in legacy IT assets to create new digital business models.
Delivering both on premise and in the cloud, Edgewater offers two major channel-based services. In the Oracle channel, Edgewater Ranzal provides Business Analytics solutions leveraging Oracle EPM, BI and Big Data technologies. In the Microsoft channel, Edgewater Fullscope delivers Dynamics AX ERP, Business Intelligence and CRM solutions primarily in the manufacturing space.
Our Services
Edgewater offers a full spectrum of services and expertise to ensure the success of our engagements. Our consulting services are categorized into two different components: (1) Channel View and (2) Systems Integration View.
The following diagram illustrates these offerings:
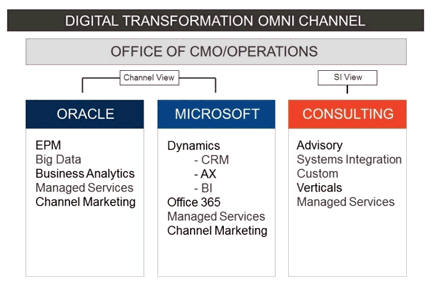
Edgewater has the proven expertise to plan, deliver and manage integration services that improve performance and maximize business results. We focus on deploying new systems and unlocking the value of the existing corporate assets. This proven expertise enables us to bring complex technologies and systems together while minimizing risk, leveraging our clients’ technology investments and delivering tailored solutions.
14
Table of Contents
Factors Influencing Our Results of Operations
Revenue. The Company derives its service revenue from time and materials-based contracts, fixed-price contracts and retainer-based arrangements. Time and materials-based contracts represented 86.2% of service revenue for the three-month period ended March 31, 2018. Time and materials-based contracts represented 84.2% of service revenue for the three-month period ended March 31, 2017. Revenue under time and materials contracts is recognized as services are rendered and performed at contractually agreed upon rates. Fixed-price contracts represented 8.3% of service revenue for the three-month period ended March 31, 2018. Fixed-price contracts represented 8.7% of service revenue for the three-month period ended March 31, 2017. Revenue pursuant to fixed-price contracts is recognized over time based on the proportional performance (using a hours-based input method) related to individual performance obligations within each arrangement. Retainer-based contracts represented 5.5% of service revenue during the three-month period ended March 31, 2018. Retainer-based contracts represented 7.1% of service revenue during the three-month period ended March 31, 2017. Revenue under retainer-based contracts is recognized ratably over the contract period, as outlined within the respective contract.
Estimates of total project costs are continually monitored during the term of an engagement. There are situations where the number of hours to complete projects may exceed (or be less than) our original estimate, because of an increase (or decrease) in project scope, unforeseen events that arise, or the inability of the client or the delivery team to fulfill their responsibilities. Accordingly, recorded revenues and costs are subject to revision throughout the life of a project based on current information and historical trends. Such revisions may result in increases or decreases to revenue and income and are reflected in the consolidated financial statements in the periods in which they are first identified. In all instances, the re-sale of third party software is recorded in a net basis, company created software, and the associated maintenance, is reported on a gross basis, however it is immaterial in all periods presented.
We anticipate that software revenue will continue to be a significant portion of our revenues. Our reported software revenue represents the resale of certain third-party off-the-shelf software and related maintenance (primarily relates to the resale of Microsoft Dynamics AX product).
Software revenue is recognized upon delivery, except in the infrequent situation where the Company provides maintenance services, in which case the related maintenance is recognized over time over the maintenance period (while the software revenue is recognized upon delivery). Software revenue is expected to fluctuate between quarters, dependent on our customers’ demand for such third-party off-the-shelf software. Fluctuations in software revenue may have an impact upon our periodic operating performance, including gross margin.
Operating Expenses. The largest portion of our operating expenses consists of cash and non-cash compensation and benefits associated with our project consulting personnel and related expenses. Non-cash compensation includes share-based compensation expense arising from restricted stock and option grants to employees. Project personnel expenses also consist of payroll costs and related benefits associated with our professional staff. Other related expenses include travel, subcontracting costs, third-party vendor payments and non-billable expenses associated with the delivery of services to our customers. We consider the relationship between project personnel expenses and revenue to be an important measure of our operating performance. The relationship between project personnel expenses and revenue is driven largely by the chargeability of our consultant base, the prices we charge our customers and the non-billable costs associated with securing new customer engagements and developing new service offerings. The remainder of our recurring operating expenses consists of expenses associated with the development of our business and the support of our customer-serving professionals, such as professional development and recruiting, marketing and sales, and management and administrative support. Professional development and recruiting expenses consist primarily of recruiting and training, content development and delivery costs. Marketing and sales expenses consist primarily of the costs associated with the development and maintenance of our marketing materials and programs. Management and administrative support expenses consist primarily of the costs associated with operations, including finance, information systems, human resources, facilities (including the rent of office space) and other administrative support for project personnel.
The Company regularly reviews its fees for services, professional compensation and overhead costs to ensure that its services and compensation are competitive within the industry and that its overhead costs are balanced with its revenue levels. In addition, we monitor the progress of customer projects with customer senior management. The Company manages the activities of its professionals by closely monitoring engagement schedules and staffing requirements. However, a rapid decline in the demand for the professional services that we provide could result in lower utilization of our professionals than we planned. In addition, because most of our customer engagements are terminable by our customers without penalty, an unanticipated termination of a customer project could require us to maintain underutilized employees. While professional staff levels must be adjusted to reflect active engagements, the Company must also maintain a sufficient number of consulting professionals to oversee existing customer engagements and to participate in sales activities to secure new customer assignments.
15
Table of Contents
Merger related transaction costs. The Company incurred $1.3 million of merger related acquisition costs related to the proposed Alithya Merger Transaction in the three-month period ended March 31, 2018. Incurred expenses included investment banking fees, legal fees, accounting and other professional fees directly associated with completion of the merger. No such expenses were incurred in the three-month period ended March 31, 2017.
Named Executive Officer Severance. The Company incurred $3.4 million of expense associated with the termination of two Named Executive Officers of the Company during the three-month period ended March 31, 2017. During the three months ended March 31, 2017, the Company terminated without cause the employment of the Chairman, President, and Chief Executive Officer as well as the Executive Vice President and Chief Strategy and Technology Officer. The severance expense associated with these terminations include salary and salary related expenses (including bonus) as well as the expense associated with the acceleration of stock award vesting. No such expenses were incurred in the three-month period ended March 31, 2018.
Consent solicitation expense. The Company incurred $666 thousand of legal and advisory costs related to the defense of a consent solicitation in the three-month period ended March 31, 2017. No such expenses were incurred in the three-month period ended March 31, 2018.
Adjustments to Fair Value of Contingent Consideration. The Company remeasures the estimated carrying value of contingent consideration each quarter, with any changes (income or expense) in the estimated fair value recorded as an operating expense. During the three-month period ended March 31, 2017 the Company recorded an increase to the fair value of contingent earnout consideration (recorded within selling, general and administrative expense) of $604 thousand. This adjustment was related to the finalization of the M2 Dynamics and Zero2Ten earnout calculations. Accretion of the contingent earnout liability is classified as other expense on the consolidated statements of comprehensive loss. As of March 31, 2018 and December 31, 2017, the Company had no remaining obligations under any contingent earnout consideration agreements.
Company Performance Measurement Systems and Metrics. The Company’s management monitors and assesses its operating performance by evaluating key metrics and indicators on an ongoing basis. For example, we regularly review performance information related to annualized revenue per billable consultant, periodic consultant utilization rates, gross profit margins, average bill rates and billable employee headcount. Edgewater has also developed internal Enterprise Performance Management systems which aid us in measuring our operating performance and consultant utilization rates. The matching of sales opportunities to available skill sets in our consultant base is one of our greatest challenges and therefore, we monitor consultant utilization closely. These metrics, along with other operating and financial performance metrics, are used in evaluating management’s overall performance. These metrics and indicators are discussed in more detail under “Results for the Three Months Ended March 31, 2018, Compared to Results for the Three Months Ended March 31, 2017,” included elsewhere in this Quarterly Report on Form 10-Q.
Results for the Three Months Ended March 31, 2018, Compared to Results for the Three Months Ended March 31, 2017
The financial information that follows has been rounded in order to simplify its presentation. The amounts and percentages below have been calculated using the detailed financial information contained in the unaudited condensed consolidated financial statements, the notes thereto, and the other financial data included in this Quarterly Report on Form 10-Q.
16
Table of Contents
The following table sets forth the percentage of total revenue of items included in our unaudited condensed consolidated statements of comprehensive loss:
| Three Months Ended March 31, |
||||||||
| 2018 | 2017 | |||||||
| Revenue: |
||||||||
| Service revenue |
89.5 | % | 86.3 | % | ||||
| Software revenue |
5.2 | % | 8.7 | % | ||||
| Reimbursable expenses |
5.3 | % | 5.0 | % | ||||
|
|
|
|
|
|||||
| Total revenue |
100.0 | % | 100.0 | % | ||||
| Cost of revenue: |
||||||||
| Project and personnel costs |
61.8 | % | 55.9 | % | ||||
| Software costs |
— | % | 4.8 | % | ||||
| Reimbursable expenses |
5.3 | % | 5.0 | % | ||||
|
|
|
|
|
|||||
| Total cost of revenue |
67.1 | % | 65.7 | % | ||||
|
|
|
|
|
|||||
| Gross profit |
32.9 | % | 34.3 | % | ||||
| Operating expenses: |
||||||||
| Selling, general and administrative |
41.4 | % | 34.1 | % | ||||
| Named executive officer severance |
5.1 | % | 11.6 | % | ||||
| Consent solicitation expense |
— | % | 2.3 | % | ||||
| Change in fair value of contingent earnout |
— | % | 2.1 | % | ||||
| Depreciation and amortization |
2.5 | % | 2.7 | % | ||||
|
|
|
|
|
|||||
| Total operating expenses |
49.0 | % | 52.8 | % | ||||
|
|
|
|
|
|||||
| Operating loss |
(16.1 | )% | (18.5 | )% | ||||
| Other expense, net |
0.2 | % | (0.8 | )% | ||||
|
|
|
|
|
|||||
| Loss before income taxes |
(16.3 | )% | (19.3 | )% | ||||
| Income tax benefit |
0.5 | % | (10.1 | )% | ||||
|
|
|
|
|
|||||
| Net loss |
(16.8 | )% | (9.2 | )% | ||||
|
|
|
|
|
|||||
Revenue. Total revenue decreased by $(4.0) million, or (13.7)%, to $25.1 million during the three-month period ended March 31, 2018, compared to total revenue of $29.1 million in the three-month period ended March 31, 2017. Service revenue decreased by $(2.7) million, or (10.6)%, to $22.5 million during the three-month period ended March 31, 2018, compared to service revenue of $25.1 million in the three-month period ended March 31, 2017.
Service revenue continues to be negatively affected by the channel disruption related to the vendor push to the adoption of cloud-based technologies and our customers’ decision processes and timing related to such adoption. While our 2015 acquisitions of M2 Dynamics, Branchbird and Zero2Ten have strengthened the Company’s cloud-based offerings in both the EPM and ERP markets, we are still experiencing delays in customer purchasing. The transition to cloud-based offerings is further along within our ERP customer base (with this practice showing year over year sequential quarterly growth), however it continues to experience delays within the EPM space.
As we experience a transition within our EPM and ERP channels from on-premise to hybrid to cloud-based solutions we may experience a disruption in the timing of our customer purchasing habits. This transition may cause fluctuations in our service and software revenue and related margin contributions in the coming periods. Because of this, we believe that periodic fluctuations in the amount of revenue recognized by the Company may have a material impact upon our gross margins.
Billable consultant utilization decreased to 70.9% in the three-month period ended March 31, 2018 compared to 74.3% in the three-month period ended March 31, 2017. Billable consultant utilization has decreased and the billable headcount base has also decreased by 31, to 310 (excluding contractors) compared to 341 (excluding contractors) at March 31, 2017.
On a sequential quarterly basis, billable consultant utilization increased to 70.9% from 68.7% in the fourth quarter of 2017. The increase in sequential quarterly service revenue is driven by the impact that the year-end 2017 holiday schedule had on our ability to convert closed deals into billable services. We realized billable consultant utilization improvement on a monthly basis as we moved through the quarter ended March 31, 2018.
17
Table of Contents
Annualized service revenue per billable consultant, as adjusted for utilization, was $370 thousand and $365 thousand during the three-month periods ended March 31, 2018 and 2017, respectively. The periodic fluctuations in our annualized service revenue per billable consultant metric continue to reflect the changes in the mix of our service offering revenue generated by our current engagements.
During the three-month period ended March 31, 2018, software revenue totaled $1.3 million, or 5.2% of total revenue, compared to software revenue of $2.5 million, or 8.7% of total revenue, in the three-month period ended March 31, 2017. Software revenue, in 2018 has been reported on a net basis (as a result of the evaluation under ASC 606), while presentation in prior years is on a gross basis. This results in a decrease in software (and total revenue) for the three-month period ended March 31, 2018, however the amounts remain comparable from a gross margin contribution perspective.
Our software revenue is primarily related to our resale of Microsoft Dynamics software, cloud-based licenses and maintenance. Software revenue is expected to fluctuate on a period-to-period basis dependent upon our customers’ demand for such third-party off-the-shelf software. We anticipate that software revenue will continue to represent a meaningful portion of revenues in future years. Because of this, we believe that periodic fluctuations in the amount of software revenue recognized by the Company may have a material impact upon our gross margins.
Generally, we are reimbursed for our out-of-pocket expenses incurred in connection with our customers’ consulting projects. Reimbursed expense revenue was $1.3 million and $1.5 million for the three-month periods ended March 31, 2018 and 2017, respectively. The aggregate amount of reimbursed expenses will fluctuate from period-to-period depending on the number of billable consultants as well the location of our customers, the general fluctuation of travel costs, such as airfare, and the number of our projects that require travel.
The number of customers the Company served during the three-month period ended March 31, 2018 totaled 444, as compared to 468 customers during the three-month period ended March 31, 2017. During the first three months of 2018, we secured first-time engagements with a total of 24 new customers, compared to 23 new customer engagements during the first three months of 2017.
Cost of Revenue. Cost of revenue primarily consists of project personnel costs principally related to salaries, payroll taxes, employee benefits, software costs and travel expenses for personnel dedicated to customer projects. These costs represent the most significant expense we incur in providing our services. In total, cost of revenue decreased by $(2.3) million, or (12.0)%, to $16.9 million for the three-month period ended March 31, 2018, compared to $19.1 million in the comparable 2017 quarterly period.
The primary drivers of the 2018 year-over-year decrease in total cost of revenue during the three-month period ended March 31, 2018, on an absolute dollar basis, were related to the presentation of software revenue on a net basis combined with the decreases in salary- and fringe-related expenses (primarily associated with the decrease in billable consultant headcount from our strategic headcount management efforts). The Company maintained 310 billable consultants (excluding contractors) as of the quarter ended March 31, 2018, compared to 341 billable consultants (excluding contractors) at the end of the first quarter of 2017. Additionally, billable consultant bonuses decrease period over period in correlation to the decrease in service revenue.
Project and personnel costs represented 61.8% of total revenue during the three-month period ended March 31, 2018, as compared to 55.9% of total revenue during the three-month period ended March 31, 2017.
The increase in project and personnel costs during the three-month period ended March 31, 2018, as a percentage of total revenue, was driven by the decrease in service revenue in the comparable periods.
Software revenue was presented on a net basis during the three-month period ended March 31, 2018 (and therefore no corresponding expense is presented). Software costs amounted to $1.4 million during the three-month period ended March 31, 2017. Reimbursable expenses were $1.3 million and $1.5 million for the three-month periods ended March 31, 2018 and 2017, respectively.
Gross Profit. During the three-month period ended March 31, 2018, total gross profit decreased $(1.7) million, or (17.2)%, to $8.3 million, compared to gross profit of $10.0 million in the three-month period ended March 31, 2017. For purposes of further analysis, we refer to gross profit as a percentage of revenue generally as gross margin.
18
Table of Contents
Total gross margin, as a percentage of total revenue, was 32.9% and 34.3% in the three-month periods ended March 31, 2018 and 2017, respectively. The year-over-year quarterly decrease in revenue contribution was partially offset by the decrease in salary and salary-related expenses (primarily associated with the decreased billable headcount).
Service revenue gross margins were 30.9% in the first quarter of 2018, compared to 35.2% in the first quarter of 2017. The decrease in service revenue gross margin for the three-month period ended March 31, 2018 was similarly related to the decrease in service revenue, as described above.
We anticipate that software revenue will continue to be a meaningful part of our revenue in future periods. Additionally, our future gross margins may continue to be influenced by the timing of the recognition of our software revenue.
Selling, General and Administrative (“SG&A”) Expenses. The Company’s recurring selling, general and administrative expenses increased by $477 thousand, or 4.8%, to $10.4 million at March 31, 2018 compared to $9.9 million at March 31, 2017. As a percentage of total revenue, SG&A expenses were 41.4% during the three-month period ended March 31, 2018, compared to 34.1% in the three-month period of 2017.
Merger Related Transaction Costs. During the three-month period ended March 31, 2018, we incurred $1.3 million of legal and advisory expenses in connection with the proposed merger with Alithya. No such expenses were incurred in the three-month period ended March 31, 2017.
Named Executive Officer Severance. During the three-month period ended March 31, 2017, the Company terminated the employment of the former Chairman, President, and Chief Executive Officer and the former Chief Strategy and Technology Officer. In connection with these terminations, the Company incurred $3.4 million of severance related expenses. These expenses were associated with contractually agreed upon salary, bonus and acceleration of vesting of stock-based compensation awards. No such expenses were incurred in the three-month period ended march 31, 2018.
Consent Solicitation Expense. During the three-month period ended March 31, 2017, we incurred $666 thousand of legal and advisory expenses in connection with defense against a consent solicitation. No such expenses were incurred in the three-month period ended March 31, 2018.
Change in Fair Value of Contingent Earnout Consideration. The Company continually examines actual results in comparison to financial metrics utilized in each of our earnout calculations and assesses the carrying value of the contingent earnout consideration. During the three-month period ended March 31, 2017, the Company recorded changes in fair value of the estimated earnout consideration to be achieved (as a result of higher achievement of financial targets than initially forecasted) which resulted in $604 thousand of expense. No such expenses were incurred in the three-month period ended March 31, 2018.
Depreciation and Amortization Expense. Depreciation and amortization expense decreased $(172) thousand, or (21.3)%, to $636 thousand in the three-month period ended March 31, 2018, as compared to $808 thousand in the three-month period ended March 31, 2017. The decrease in amortization expense during the first quarter of 2018 is primarily the result of the timing of amortization expense associated with the intangible assets identified in connection with the Zero2Ten, Branchbird and M2 Dynamics Acquisitions. The Company recognizes amortization expense over the periods in which it expects to realize the economic benefit.
Depreciation expense was $75 thousand and $113 thousand in the three-month periods ended March 31, 2018 and 2017, respectively.
Operating Loss. Operating loss was $(4.1) million in the first quarter of 2018, compared to operating loss of $(5.4) million in the comparable 2017 quarterly period.
The 2018 first quarter operating loss is primarily driven by the decreased gross margin contribution combined with the merger related transaction costs. The operating loss in the first quarter of 2017 was primarily driven by the severance-related expenses associated with the terminations of the Company’s former Chairman, President and Chief Executive Officer as well as the former Executive Vice President and Chief Strategy and Technology Officer, the decrease in service revenue and the expenses associated with the consent solicitation process.
19
Table of Contents
Other Expense, Net. Other expense, net, totaled $34 thousand during the three-month period ended March 31, 2018, while other expense, net, totaled $233 thousand during the comparable 2017 period. Other expense, net, for the three months ended March 31, 2018 primarily represents interest paid on our credit facility as well as periodic foreign currency exchange gains and losses. Other expense, net, for the three months ended March 31, 2017 primarily represents the accretion of the contingent earnout liability recognized in connection with the Zero2Ten and Branchbird Acquisitions and also includes periodic foreign currency exchange gains and losses.
Income Tax Benefit. We recorded a provision from income taxes of $131 thousand during the three-month period ended March 31, 2018. We recorded a benefit from income taxes of $(2.9) million during the three-month period ended March 31, 2017. Our periodic income tax benefit amounts are derived based upon an estimated annual effective income tax rate, inclusive of federal and state income taxes, of 3.2% and 52.3% during the three-month periods ended March 31, 2018 and 2017, respectively.
Reported income tax expense also includes expense amounts attributable to foreign income taxes, the recognition of U.S. deferred tax liabilities for differences between the book and tax basis of goodwill and interest and penalties.
We have deferred tax assets that have arisen primarily as a result of timing differences, net operating loss carryforwards and tax credits. Our ability to realize a deferred tax asset is based on our ability to generate sufficient future taxable income. We assess, on a routine periodic basis, the estimated future realizability of the gross carrying value of our deferred tax assets on a more likely than not basis. Our periodic assessments take into consideration both positive evidence (future profitability projections for example) and negative evidence (accumulated deficit) as it relates to evaluating the future recoverability of our deferred tax assets.
The Company considers scheduled reversals of deferred tax liabilities, projected future taxable income, ongoing tax planning strategies and other matters, including the period over which our deferred tax assets will be recoverable, in assessing the need for and the amount of the valuation allowance. In the event that actual results differ from these estimates, or we adjust these estimates in the future periods, further adjustments to our valuation allowance may be recorded, which could materially impact our financial position and net income in the period of the adjustment.
Net Loss. We generated a net loss of $(4.2) million during the three-month period ended March 31, 2018, compared to a net loss of $(2.7) million during the three-month period ended March 31, 2017. The 2018 first quarter net loss is primarily attributable to the impact of the decreased service revenue contribution combined with the merger related transaction costs. The 2017 first quarter net loss is primarily attributable to the impact of the severance expenses related to the Company’s termination of employment of two executive officers during the first quarter of 2017, combined with the decrease in service revenue and the expenses incurred related to the consent solicitation process.
Operating Segments. Total revenue within our EPM operating segment decreased $(3.4) million, or (23.5)%, to $10.9 million in the three-month period ended March 31, 2018 compared to $14.3 million in the three-month period ended March 31, 2017. The decrease in EPM total revenue was driven primarily by the channel disruption associated with the emphasis of cloud-based solutions by channel partners. Total revenue within our ERP operating segment increased by $1.8 million, or 15.8%, to $13.1 million in the three-month period ended March 31, 2018 compared to $11.4 million in the three-month period ended March 31, 2017. The increase in ERP revenue was driven primarily by the increase in billable consultant utilization (which is reflective of the progress within the customer base with respects to adoption of cloud based solutions). This increase existed despite the change in presentation of software revenue from gross in 2017 to net in 2018. Total revenue within our Classic Consulting segment decreased $(2.4) million, or (70.2)%, to $1.0 million in the three-month period ended March 31, 2018 compared to $3.5 million in the three-month period ended March 31, 2017. The decrease in Classic Consulting was driven principally by the decrease in billable consultant utilization specific to the Classic Consulting segment.
Operating income within our EPM operating segment decreased $(1.5) million, or (169.9)%, to $(628) thousand in the three-month period ended March 31, 2018 compared to $899 thousand in the three-month period ended March 31, 2017. The decrease in operating income was driven principally by the decrease in total revenue (which was driven by the channel disruption of the transition to cloud-based solutions). Operating income within our ERP operating segment increased by $666 thousand, or 71.7%, to $1.6 million in the three-month period ended March 31, 2018 compared to $929 thousand in the three-month period ended March 31, 2017. The increase in operating income was, due in part to the increased revenue contribution noted above. Operating income within our Classic Consulting operating segment decreased by $(652) thousand, or (2,608.0)%, to $(677) thousand in the three-month period ended March 31, 2018 compared to $(25) thousand in the three-month period ended March 31, 2017. The decrease in operating income was driven primarily by the decrease in billable consultant utilization (specifically within Classic Consulting).
20
Table of Contents
Liquidity and Capital Resources
The following table summarizes our cash flow activities for the periods indicated:
| Three Months Ended March 31, |
||||||||
| 2018 | 2017 | |||||||
| (In Thousands) | ||||||||
| Cash flows (used in) provided by: |
||||||||
| Operating activities |
$ | (6,914 | ) | $ | (3,743 | ) | ||
| Investing activities |
(91 | ) | (19 | ) | ||||
| Financing activities |
34 | 1,730 | ||||||
| Effects of exchange rates on cash |
15 | 13 | ||||||
|
|
|
|
|
|||||
| Total cash used in the period |
$ | (6,956 | ) | $ | (2,019 | ) | ||
|
|
|
|
|
|||||
As of March 31, 2018, we had cash and cash equivalents of $8.4 million, a $7.0 million decrease from the December 31, 2017 balance of $15.4 million. The primary drivers of the decrease in cash during the first quarter of 2018 are the bonus and commission payments related to the Company’s 2017 performance-based incentive programs, the funding of an additional payroll cycle during the first quarter and premium payments associated with the renewal of annual insurance policies. The Company partially offset these cash outflows through the recurring collection of customer receivables.
Working capital, which is defined as current assets less current liabilities, decreased to $14.0 million as of March 31, 2018, as compared to $16.8 million as of December 31, 2017.
Historically, we have used our operating cash flows, available cash, available funds under our credit facility and periodic sales of our common stock to finance ongoing operations and business combinations. We believe that our cash and cash equivalents will be sufficient to finance our working capital needs for at least the next twelve months. We periodically reassess the adequacy of our liquidity position, taking into consideration current and anticipated operating cash flow, anticipated capital expenditures, and possible business combinations. The pace at which we will either generate or consume cash will be dependent upon future operations and the level of demand for our services on an ongoing basis.
Cash flow from operating activities is driven by collections of fees for our consulting services and the reselling of software products. Cash used in operations predominantly relates to employee compensation and payments to third-party software providers. Accrued payroll and related liabilities fluctuate from period to period based on the timing of our normal payroll cycle and the timing of variable compensation payments. Annual components of our variable compensation plans are paid in the first quarter of the following year, causing fluctuations in cash flow from quarter to quarter.
Accounts payable and accrued expenses are most significantly affected by the timing of payments required to be made to third-party software providers in connection with the resale of software products to our customers. Historically, a significant portion of our software sales has occurred at the end of the second quarter.
Net cash used in operating activities was $(6.9) million for the three-month period ended March 31, 2018, as compared to net cash used by operating activities of $(3.7) million for the three-month period ended March 31, 2017. The primary components of operating cash flows during the first three months of 2018 were driven by the payment of bonus and commissions under our 2017 performance-based bonus programs, the funding of an additional payroll cycle in the quarter and the timing of payments related to annual insurance-related premiums and third-party software expenses. Additionally, cash from operations was influenced by non-cash activity of $838 thousand (primarily depreciation and amortization and stock-based compensation). The primary components of operating cash flows during the first three months of 2017 were driven by the payment of bonus and commissions under our 2016 performance-based bonus programs, the funding of an additional payroll cycle in the quarter and the timing of payments related to annual insurance-related premiums and third-party software expenses. Additionally, cash from operations was influenced by non-cash activity of $(1.0) million (primarily changes in deferred tax assets and changes in fair value of contingent earnout consideration, partially offset by depreciation and amortization and stock-based compensation).
Net cash used in investing activities was $(91) thousand during the three-month period ended March 31, 2018, compared to net cash used in investing activities of $(19) thousand in the three-month period ended March 31, 2017. Cash used in investing activities in the three-month periods ended March 31, 2018 and 2017, respectively, consisted of payments associated with the purchases of property and equipment.
21
Table of Contents
All capital expenditures are discretionary as the Company currently has no long-term commitments for capital expenditures.
Net cash provided by financing activities was $34 thousand in the three-month period ended March 31, 2018, compared to net cash provided by financing activities of $1.7 million in the three-month period ended March 31, 2017. The 2018 and 2017 cash flows provided by financing activities are attributable to proceeds associated with our Employee Stock Purchase Plan and stock option exercises. Proceeds in three-month period ended March 31, 2018 were partially offset by the expense associated with common stock repurchases.
In September 2013, the Company entered into a secured revolving credit facility (the “Credit Facility”). The Credit Facility was modified through an amendment in December 2015, which increased the borrowing base to $15 million (from the previous $10 million) with an additional accordion feature that allows the Company to request an additional $5.0 million as needed, extending the total credit facility borrowing capacity to $20 million over its three-year term. The Credit Facility is secured by substantially all assets of the Company and its domestic subsidiaries, and is subject to normal covenants. The Company was not in compliance with one of its loan covenants as of March 31, 2018. Subsequent to quarter-end, the Company has received a waiver of compliance for the period ending March 31, 2018 related to the failure to meet the Minimum Interest Coverage covenant. In connection with this waiver, the Company is required to maintain a minimum cash balance in the amount of $4 million through May 21, 2018, at which point in time the minimum cash balance required increases to $5 million. Under the terms of the Credit Facility, any advances will accrue interest at a variable per annum rate of interest equal to the LIBOR Rate plus 1.5%. Interest is due and payable, in arrears, on a monthly basis. The Company will be obligated to pay an annual commitment fee of 0.15% on the daily undrawn balance of the facility. Any amounts outstanding under the Credit Facility will be due on December 21, 2018. The Company had drawn down $5.0 million of this balance as of March 31, 2018.
Off Balance Sheet Arrangements
We do not have any off-balance sheet arrangements that have or are reasonably likely to have a current or future effect on our financial condition, changes in financial condition, revenues or expenses, results of operations, liquidity, capital expenditures or capital resources that are material to investors.
Critical Accounting Policies and Estimates
We prepare our unaudited condensed consolidated financial statements in conformity with accounting principles generally accepted in the United States of America. As such, we are required to make certain estimates, judgments and assumptions that we believe are reasonable based upon the information available. These estimates and assumptions affect the reported amounts of assets and liabilities at the date of the financial statements and the reported amounts of revenues and expenses during the periods presented.
The Company’s accounting policies were revised in connection with the implementation of ASC 606. See Note 3, “Revenue Recognition” in Part I, Item 1, of this Quarterly Report on Form 10-Q. There were no other material changes to our critical accounting policies and estimates from the information provided in “Critical Accounting Policies” in Part II, Item 7, of our Annual Report on Form 10-K for the year ended December 31, 2017 filed with the SEC.
Recent Accounting Pronouncements
In February 2016, the FASB issued Accounting Standards Update No. 2016-02, Leases (Topic 842) (ASU 2016-02), which requires lessees to record most leases on their balance sheets, recognizing a lease liability for the obligation to make lease payments and a right-to-use asset for the right to use the underlying asset for the lease term. The guidance in ASU 2016-02 is required for annual reporting periods beginning after December 15, 2018, with early adoption permitted. We currently expect that most of our operating lease commitments will be subject to the update and recognized as operating lease liabilities and right-of-use assets upon adoption. However, the Company is currently evaluating the effect that implementation of this update will have upon adoption on its consolidated financial position and results of operations.
22
Table of Contents
We operate in a rapidly changing environment that involves certain risks and uncertainties, some of which are beyond our control. You should carefully review and consider the information regarding certain risk factors that could materially affect our business, financial condition or future results set forth under “Part I – Item 1A – Risk Factors” in our Annual Report on Form 10-K, for the year ended December 31, 2017, which was filed with the Securities and Exchange Commission on March 16, 2018 and in this Quarterly Report on Form 10-Q under “Special Note Regarding Forward-Looking Statements.”
23
Table of Contents
SPECIAL NOTE REGARDING FORWARD-LOOKING STATEMENTS
Some of the statements in this Quarterly Report on Form 10-Q and elsewhere constitute forward-looking statements under Section 27A of the Securities Act of 1933, as amended, and Section 21E of the Securities Exchange Act of 1934, as amended. These statements involve known and unknown risks, uncertainties and other factors that may cause results, levels of activity, growth, performance, tax consequences or achievements to be materially different from any future results, levels of activity, growth, performance, tax consequences or achievements expressed or implied by such forward-looking statements. Such factors include, among other things, those listed below, as well as those further set forth under the heading “Risk Factors” in our 2017 Annual Report on Form 10-K as filed with the SEC on March 16, 2018.
Factors that may cause actual results, goals, targets or objectives to differ materially from those contemplated, projected, forecasted, estimated, anticipated, planned or budgeted in such forward-looking statements include, among others, the following possibilities: (1) failure to obtain new customers or retain significant existing customers; (2) the loss of one or more key executives and/or employees; (3) changes in industry trends, such as a decline in the demand for Enterprise Resource Planning and Enterprise Performance Management solutions, custom development and system integration services and/or declines in industry-wide information technology spending, whether on a temporary or permanent basis and/or delays by customers in initiating new projects or existing project milestones; (4) inability to execute upon growth objectives, including new services and growth in entities acquired by our Company; (5) adverse developments and volatility involving geopolitical or technology market conditions; (6) unanticipated events or the occurrence of fluctuations or variability in the matters identified under “Critical Accounting Policies”; (7) delays in, or the failure of, our sales pipeline being converted to billable work and recorded as revenue; (8) termination by clients of their contracts with us or inability or unwillingness of clients to pay for our services, which may impact our accounting assumptions; (9) inability to recruit and retain professionals with the high level of information technology skills and experience needed to provide our services; (10) failure to expand outsourcing services to generate additional revenue; (11) any changes in ownership of the Company or otherwise that would result in a limitation of the net operating loss carry forward under applicable tax laws; (12) the possibility that activist stockholders may wage proxy or consent contests or gain representation on or control of our Board of Directors, causing uncertainty about the direction of our business; (13) the increased emphasis on a cloud strategy that may give rise to risks that could harm our business; (14) the failure of the marketplace to embrace advisory and product-based consulting services; and/or (15) the effects of the pending merger with a wholly-owned subsidiary of Alithya Group Inc., a Quebec corporation (“Alithya”), on our business and operations, and the potential adverse effects if such merger is not completed.
Although we believe that the expectations in the forward-looking statements are reasonable, we cannot guarantee future results, levels of activity, performance, growth, earnings per share or achievements. However, neither we nor any other person assumes responsibility for the accuracy and completeness of such statements. Except as otherwise required, we undertake no obligation to update any of the forward-looking statements after the date of this Form 10-Q to conform such statements to actual results.
ITEM 3. QUANTITATIVE AND QUALITATIVE DISCLOSURES ABOUT MARKET RISK
Our primary financial instruments include investments in money market funds that are sensitive to market risks and interest rates. The investment portfolio is used to preserve our capital until it is required to fund operations, strategic acquisitions or distributions to stockholders. None of our market-risk sensitive instruments are held for trading purposes. We did not purchase derivative financial instruments in the three-month periods ended March 31, 2018 or 2017. Should interest rates on the Company’s investments fluctuate by 10% the impact would not be material to the financial condition, results of operations or cash flows.
The impact of inflation and changing prices has not been material on revenue or income from continuing operations during the three-month periods ended March 31, 2018 and 2017.
ITEM 4. CONTROLS AND PROCEDURES
Evaluation of Disclosure Controls and Procedures
We maintain disclosure controls and procedures, which we have designed to ensure that material information related to the Company, including our consolidated subsidiaries, is properly identified and evaluated on a regular basis and disclosed in accordance with all applicable laws and regulations. The Chairman, Interim President and Interim Chief Executive Officer and the Interim Chief Financial Officer of Edgewater Technology, Inc. (its principal executive officer and principal financial officer, respectively) have concluded, based on their evaluations of the Company’s disclosure controls and procedures as of the end of the period covered by this report, that the Company’s disclosure controls and procedures are effective to ensure that information required to be disclosed by the Company in the reports filed or submitted by it under the Securities Exchange Act of 1934, as amended, is recorded, processed, summarized and reported within the time periods specified in the Securities and Exchange Commission rules and forms, and include controls and procedures designed to ensure that information required to be disclosed by the Company in such reports is accumulated and communicated to the Company’s management as appropriate to allow timely decisions regarding required disclosure.
24
Table of Contents
Changes in Controls and Procedures
There were no changes in our internal control over financial reporting, as such term is defined in Rules 13a-15(f) and 15d-15(f) under the Exchange Act, during the period covered by this report that have materially affected, or are reasonably likely to materially affect, our internal control over financial reporting.
The Company is involved in legal proceedings, claims, and litigation arising in the ordinary course of business not specifically discussed herein.
As discussed in “Part I – Item 1A – Risk Factors” of our Annual Report on Form 10-K for the year ended December 31, 2017 and herein under “Special Note Regarding Forward-Looking Statements,” investors should be aware of certain risks, uncertainties and assumptions in our business. We encourage you to refer to our Annual Report on Form 10-K to carefully consider these risks, uncertainties and assumptions.
ITEM 2. UNREGISTERED SALES OF EQUITY SECURITIES AND USE OF PROCEEDS
In December 2007, our Board of Directors (the “Board”) authorized a stock repurchase program for up to $5.0 million of common stock on the open market or through privately negotiated transactions from time-to-time through December 31, 2008 (the “Stock Repurchase Program”). The Board subsequently amended the Stock Repurchase Program, authorizing both an increase to and an extension of the Stock Repurchase Program. The Stock Repurchase Program, as amended, had a maximum purchase value of shares of $23.1 million (the “Purchase Authorization”) and was set to expire on September 22, 2017 (the “Repurchase Period”). On September 20, 2017, we announced that the Board had approved an extension of the Repurchase Period to September 21, 2018.
The timing and amount of the purchases will be based upon market conditions, securities law considerations and other factors. The Stock Repurchase Program does not obligate the Company to acquire a specific number of shares in any period and may be modified, suspended, extended or discontinued at any time, without prior notice.
The following table provides information with respect to purchases of our common stock during the quarter ended March 31, 2018:
Issuer Purchases of Equity Securities
| Period |
Total Number of Shares Purchased |
Average Price Paid Per Share |
Total Number of Shares Purchased as Part of Publicly Announced Plans or Programs |
Maximum Dollar Value of Shares that May Yet Be Purchased Under the Plans or Programs |
||||||||||||
| January 1 – 31, 2018 |
— | $ | — | — | $ | 7,448,081 | ||||||||||
| February 1 – 28, 2018 |
— | $ | — | — | $ | 7,448,081 | ||||||||||
| March 1 – 31, 2018 |
151,349 | $ | 6.26 | 151,349 | $ | 6,500,636 | ||||||||||
|
|
|
|
|
|
|
|
|
|||||||||
| Total |
151,349 | $ | 6.26 | 151,349 | $ | 6,500,636 | ||||||||||
|
|
|
|
|
|
|
|
|
|||||||||
ITEM 3. DEFAULTS UPON SENIOR SECURITIES
None.
ITEM 4. MINE SAFETY DISCLOSURES
Not applicable.
25
Table of Contents
None
| 31.1 | 13a-14 Certification – Chairman, Interim President and Interim Chief Executive Officer* | |
| 31.2 | 13a-14 Certification – Interim Chief Financial Officer* | |
| 32 | Section 1350 Certification** | |
| 101 | Interactive Data Files Pursuant to Rule 405 of Regulation S-T: (i) Unaudited Condensed Consolidated Balance Sheets as of March 31, 2018 and December 31, 2017, (ii) Unaudited Condensed Consolidated Statements of Comprehensive Loss for the Three Months ended March 31, 2018 and 2017, (iii) Unaudited Condensed Consolidated Statements of Cash Flows for the Three Months ended March 31, 2018 and 2017 and (iv) Notes to Unaudited Condensed Consolidated Financial Statements.* | |
* – Filed herewith.
** – Furnished herewith.
26
Table of Contents
Pursuant to the requirements of the Securities Exchange Act of 1934, as amended, the registrant has duly caused this report to be signed on its behalf by the undersigned thereunto duly authorized.
| EDGEWATER TECHNOLOGY, INC. | ||
| Date: May 10, 2017 | /s/ JEFFREY RUTHERFORD | |
| Jeffrey Rutherford | ||
| Chairman, Interim President and Interim Chief Executive Officer (Principal Executive Officer) | ||
| Date: May 10, 2017 | /s/ PAUL MCNEICE | |
| Paul McNeice Interim Chief Financial Officer (Principal Financial and Accounting Officer) | ||
27