Attached files
Table of Contents
UNITED STATES
SECURITIES AND EXCHANGE COMMISSION
Washington, D.C. 20549
Form 10-K
| x | ANNUAL REPORT PURSUANT TO SECTION 13 OR 15(D) OF THE SECURITIES EXCHANGE ACT OF 1934 |
FOR THE FISCAL YEAR ENDED DECEMBER 31, 2009
| ¨ | TRANSITION REPORT PURSUANT TO SECTION 13 OR 15(D) OF THE SECURITIES EXCHANGE ACT OF 1934 |
Commission file number: 0-20971
EDGEWATER TECHNOLOGY, INC.
(Exact name of registrant as specified in its charter)
| Delaware | 71-0788538 | |
| (State or other jurisdiction of incorporation or organization) |
(I.R.S. Employer Identification No.) |
| 20 Harvard Mill Square Wakefield, Massachusetts |
01880 | |
| (Address of principal executive offices) | (Zip Code) |
Registrant’s telephone number including area code: (781) 246-3343
Securities registered pursuant to Section 12(b) of the Act: None
Securities registered pursuant to Section 12(g) of the Act:
Common Stock, $0.01 par value
(Title of class)
Indicate by a check mark if the registrant is a well-known seasoned issuer, as defined in Rule 405 of the Securities Act. Yes ¨ No x
Indicate by a check mark if the registrant is not required to file reports pursuant to Section 13 or Section 15(d) of the Act. Yes ¨ No x
Indicate by check mark whether the registrant (1) has filed all reports required to be filed by Section 13 or 15(d) of the Securities Exchange Act of 1934 during the preceding 12 months (or for such shorter period that the registrant as required to file such reports), and (2) has been subject to such filing requirements for the past 90 days. Yes x No ¨
Indicate by check mark whether the registrant has submitted electronically and posted on its corporate Web site, if any, every Interactive Data File required to be submitted and posted pursuant to Rule 405 of Regulation S-T (§232.405 of this chapter) during the preceding 12 months (or for such shorter period that the registrant was required to submit and post such files). Yes ¨ No ¨
Indicate by check mark if disclosure of delinquent filers pursuant to Item 405 of Regulation S-K (§229.405 of this chapter) is not contained herein, and will not be contained, to the best of registrant’s knowledge, in definitive proxy or information statements incorporated by reference in Part III of this Form 10-K or any amendment to this Form 10-K. Yes x No ¨
Indicate by check mark whether the registrant is a large accelerated filer, an accelerated filer, a non-accelerated filer, or a smaller reporting company. See definition of “large accelerated filer,” “accelerated filer,” and “smaller reporting company” in Rule 12b-2 of the Exchange Act:
| Large accelerated filer | ¨ | Accelerated filer | ¨ | |||
| Non-accelerated filer | x | Smaller reporting company | ¨ | |||
Indicate by a check mark whether the registrant is a shell company (as defined in Rule 12b-2 of the Act). Yes ¨ No x
As of June 30, 2009, there were 12,152,158 shares of Common Stock of the Registrant outstanding. The aggregate market value of the Common Stock of the Registrant held by non-affiliates (assuming for these purposes, but not conceding, that all executive officers and directors are “affiliates” of the Registrant) as of June 30, 2009 was approximately $30.1 million, computed based upon the closing price of $2.58 per share on June 30, 2009.
As of March 4, 2010, there were 12,208,808 shares of Common Stock of the Registrant outstanding.
DOCUMENTS INCORPORATED BY REFERENCE
Part III of this Annual Report on Form 10-K incorporates by reference portions of the Registrant’s definitive proxy statement, to be filed with the Securities and Exchange Commission no later than 120 days after the close of its fiscal year; provided that if such proxy statement is not filed with the Commission in such 120-day period, an amendment to this Form 10-K shall be filed no later than the end of the 120-day period.
Table of Contents
SPECIAL NOTE REGARDING FORWARD-LOOKING STATEMENTS
Some of the statements under “Business,” “Risk Factors,” “Legal Proceedings,” “Market for Registrant’s Common Stock and Related Stockholder Matters” and “Management Discussion and Analysis of Financial Condition and Results of Operations” and elsewhere in this Annual Report on Form 10-K (this “Form 10-K”) constitute forward-looking statements under Section 27A of the Securities Act of 1933, as amended, and Section 21E of the Securities Exchange Act of 1934, as amended, including statements made with respect to future revenues, future operating income, future earnings per share, future cash flows, potential business combination transactions, competitive and strategic initiatives or revenues, market opportunities, potential stock repurchases and future liquidity needs. These statements involve known and unknown risks, uncertainties and other factors that may cause results, levels of activity, growth, performance, earnings per share or achievements to be materially different from any future results, levels of activity, growth, performance, earnings per share or achievements expressed or implied by such forward-looking statements. Such factors include, among other things, those listed under “Business – Factors Affecting Finances, Business Prospects and Stock Volatility” and elsewhere in this Form 10-K.
The forward-looking statements included in this Form 10-K and referred to elsewhere are related to future events or our strategies or future financial performance. In some cases, you can identify forward-looking statements by terminology such as “may,” “should,” “believe,” “anticipate,” “anticipated,” “expectation,” “continued,” “future,” “forward,” “potential,” “estimate,” “estimated,” “forecast,” “project,” “encourage,” “opportunity,” “goal,” “objective,” “could,” “expect,” “expected,” “intend,” “plan,” “planned,” or the negative of such terms or comparable terminology. These forward-looking statements inherently involve certain risks and uncertainties, although they are based on our current plans or assessments which are believed to be reasonable as of the date of this Form 10-K. Factors that may cause actual results, goals, targets or objectives to differ materially from those contemplated, projected, forecasted, estimated, anticipated, planned or budgeted in such forward-looking statements include, among others, the following possibilities: (1) failure to obtain new customers or retain significant existing customers; (2) the loss of one or more key executives and/or employees; (3) changes in industry trends, such as a decline in the demand for Enterprise Resource Planning (“ERP”) and Enterprise Performance Management (“EPM”) solutions, custom development and system integration services and/or declines in industry-wide information technology (“IT”) spending, whether on a temporary or permanent basis and/or delays by customers in initiating new projects or existing project milestones; (4) inability to successfully integrate Fullscope, Inc. operations and realize the anticipated incremental revenues, synergies and other benefits from the Fullscope acquisition; (5) adverse developments and volatility involving geopolitical or technology market conditions; (6) unanticipated events or the occurrence of fluctuations or variability in the matters identified under “Critical Accounting Policies;” (7) delays in, or the failure of, our sales pipeline being converted to billable work and recorded as revenue; (8) inability to recruit and retain professionals with the high level of information technology skills and experience needed to provide our services; (9) failure to expand outsourcing services to generate additional revenue; (10) any changes in ownership of the Company or otherwise that would result in a limitation of the net operating loss carry forward under applicable tax laws; and/or (11) the failure of the marketplace to embrace specialty consulting services. In evaluating these statements, you should specifically consider various factors described above as well as the risks outlined under “Item IA Risk Factors.” These factors may cause our actual results to differ materially from those contemplated, projected, anticipated, planned or budgeted in any such forward-looking statements.
Although we believe that the expectations in the forward-looking statements are reasonable, we cannot guarantee future results, levels of activity, performance, growth, earnings per share or achievements. Neither we nor any other person assumes responsibility for the accuracy and completeness of such statements. We are under no duty to update any of the forward-looking statements after the date of this Form 10-K to conform such statements to actual results.
1
Table of Contents
Form 10-K
Annual Report
For the Year Ended December 31, 2009
TABLE OF CONTENTS
2
Table of Contents
PART I
AVAILABLE INFORMATION; BACKGROUND
Edgewater Technology, Inc. maintains executive offices located at 20 Harvard Mill Square, Wakefield, MA 01880-3209. Our telephone number is (781) 246-3343. Our stock is traded on the NASDAQ Global Market under the symbol “EDGW.” Our Internet address is www.edgewater.com. We make available, free of charge, on the Investor Relations section of our website, our Annual Reports on Form 10-K, Quarterly Reports on Form 10-Q, Current Reports on Form 8-K and all amendments to those reports as soon as reasonably practicable after such material is electronically filed with the Securities and Exchange Commission (the “SEC”). Copies are also available, without charge, from Edgewater Technology, Inc. Attn: Investor Relations, 20 Harvard Mill Square, Wakefield, MA 01880-3209 or by emailing ir@edgewater.com. Alternatively, reports filed with the SEC may be viewed or obtained at the SEC Public Reference Room in Washington, D.C., or the SEC’s Internet site at www.sec.gov. We do not intend for information contained in our website to be part of this Annual Report on Form 10-K.
In this Annual Report on Form 10-K, we use the terms “Edgewater Technology,” “Edgewater,” “our Company,” “the Company,” “we,” “our,” and “us” to refer to Edgewater Technology, Inc. and its wholly-owned subsidiaries. A listing of our wholly-owned subsidiaries as of December 31, 2009 is included as Exhibit 21.1 to this Annual Report on Form 10-K (“Form 10-K”).
| ITEM 1. | BUSINESS |
Overview
Edgewater is a consulting firm that brings a synergistic blend of specialty services in the areas of business advisory, analytics, data management, and technology to our client base. We work onsite with our clients, providing services in the following primary areas:
| • | Business advisory services: |
| • | focus on facets within mergers & acquisitions for private equity, venture and office of the Chief Financial Officer (“CFO”): |
| • | process, operational, and technical due diligence |
| • | manage and implement programs to drive financial and operational efficiencies |
| • | drive strategic planning, organizational integration and change, and special projects aligned with an organization’s strategic goals and industry best practice |
| • | provide industry driven management consulting services centered around transformational change |
| • | Analytics services: |
| • | drive the implementation of best practices through key performance metrics and benchmarks |
| • | provide analytics driven dashboard visualization of financial and operational data |
| • | set foundation for predictive analytics |
| • | Enterprise information management services: |
| • | provide industry driven master data management and data governance best practices services |
| • | construct enterprise data architectures and roadmaps |
| • | provide for all forms of data conversion, transformation and quality strategies |
| • | provide for comprehensive data platforms for all analytics, business intelligence and enterprise application efforts |
| • | Enterprise application services: |
| • | facilitate business transformation with enterprise application platforms |
| • | design and implement enterprise performance management (“EPM”) solutions for the office of the CFO |
| • | design and implement advanced Customer Relationship Management (“CRM”) solutions |
| • | design and implement Enterprise Resource Planning (“ERP”) solutions and services |
| • | Technology services: |
| • | provide technology management services from application management through infrastructure services |
| • | provide technology architectures and roadmaps |
| • | provide specialized technical strategies and solutions |
| • | provide custom disaster recovery and business continuity design and implementation services |
3
Table of Contents
Our primary target is the client who wants experienced, highly-trained talent onsite for strategic, transformational projects providing a high rate of return. Edgewater typically goes to market both vertically by industry and horizontally by product and technology specialty. We provide horizontal services and capabilities packaged with vertical expertise to clients in industries including, but not limited to: CPG/Manufacturing; Discrete and Process Manufacturing; Energy/Utilities; Healthcare; Hospitality; Insurance; Retail; Travel/Entertainment; and various Emerging Markets. Our EPM and EIM offerings go to market horizontally and provide highly experienced teams of product specialists who span all industries.
Industry Dynamics and Opportunity
Industry Dynamics. In today’s complex business environment, organizations are seeking specialized advisory services to set financial and operational strategies. Many of the classic providers, such as the large management consulting firms, large accounting firms, and multinational integrators only provide these specialized services as part of a larger package of services which in many cases are too slow to deploy and not discreet enough to serve the customer’s specific needs. Edgewater’s advisory services are quickly deployable and focused especially in the mid-market and by specialized service customers such as private equity and venture capital.
Strategic, financial or operational analysis always leads to ways to optimize business processes and improve the delivery of information to customers, suppliers, employees, stockholders, partners and other constituents through the use of advanced IT systems and software products. While some organizations support their IT needs and initiatives internally, many lack the resources or expertise to clearly identify opportunities for improvements and then implement them. Businesses are looking to build, integrate and implement change across their enterprise and finding the right industry, software product, and technical expertise to assist in this process is a critical decision.
Companies typically turn to consulting firms, like Edgewater, to fill these internal project gaps for a number of different reasons:
| • | For deep industry, product, data and technical expertise; |
| • | To provide strategic consulting services in an accelerated timeframe; |
| • | To mitigate their business risk with focused onsite project teams; |
| • | To receive an outside objective perspective; |
| • | To provide EPM EIM-related services; |
| • | To provide product and services related to ERP and CRM; and/or |
| • | To serve as an agent to plan, manage and implement change. |
We believe a structural change is taking place in the consulting industry. The change is two-fold: customer buying habits are becoming more complex and industry dynamics are evolving.
Customers with sufficient scale are looking for lower cost commodity programming services to reduce overall operational expenses and tend to look for offshore solutions. Offshore solutions are now mature, well understood and serve large-scale Business Process Outsourcing and IT service maintenance cheaply and efficiently. However, offshore solutions do not address all IT service needs. Many companies are seeking strategic consulting services to facilitate and expedite the management and implementation of smaller strategic projects, both product-based and custom vertically-focused systems. Many companies are looking to local firms to build strategic components or systems that address a specialized business problem. Strategic IT services, with its combination of business context and technology, usually proves to be the most effective solution in terms of project time and cost.
Industry Opportunity. Focused advisory services provided independent of large customary providers and larger classic business consulting engagements are exactly what many customers are looking for in times of rapid change and uncertainty. Technology has become such an integral part of business that it requires skilled strategic management in its own right. Technology has become a key enabler to business change when the appropriate strategic steps, a meld of business process change and technology, are well laid out and thoughtfully executed. Technology management consulting firms deliver innovative strategic thinking and in-depth vertical industry expertise, along with the ability to implement business process transformation through the judicious use of appropriate technologies. We have steadily enhanced our offerings to address the evolving need for strategic advisory and IT services and plan to continue to grow our competencies in these arenas. Our goal is to provide a complete continuum of focused business services, encompassing all facets of business, through the enablement of technology.
Competitive Strengths
Edgewater offers strategic consulting services designed to assist our clients in improving financial and operational performance across their enterprise. We develop business strategies and technology solutions that address their specific needs while providing them with increased competitive advantage. We feel that five core values differentiate us from our competition.
4
Table of Contents
These values include the following:
| (1) | Delivery Excellence — Our history is built upon more than eighteen years of proven methodology and well-defined process, in addition to continually delivering business and technology solutions that work. Our delivery excellence is a derivative of a well-defined business plan, highly-skilled consultants, strong technical expertise and established implementation and support methodologies. Most importantly, we use an iterative business and technology approach, with an emphasis on quality assurance and project management, to achieve rapid and successful deployment of our solutions. Our delivery history has contributed to our ability to build long-term customer relationships. |
| (2) | Vertical Expertise — We combine vertical industry knowledge with a broad base of key strategic technologies to serve our customers’ needs and deliver tailored and innovative strategies and solutions. We have developed core competencies in primary vertical markets such as: CPG/Manufacturing; Discrete and Process Manufacturing, Energy/Utilities; Healthcare; Higher Education; Hospitality; Insurance; Retail; Travel/Entertainment; and various Emerging Markets. |
| (3) | Technology Excellence — We deliver our services by blending proven strategic technologies and business practices to build scalable solutions providing a solid return on the investment. Our team of professionals has the business and technology expertise to offer comprehensive strategies and solutions. Our areas of expertise include: business advisory services, EPM solutions in planning, budgeting and consolidation, Microsoft Dynamics solutions in the area of CRM and ERP, data analytics, Web analytics, advanced data and infrastructure services, and specialized IT services. |
| (4) | Client Focus — Edgewater is positioned to provide our customers with onsite services across North America. Edgewater’s client-centric model is well positioned to serve the needs of the Global 2000 for tight, highly-trained product specialist project teams, as well as the upper middle market whose needs tend to span the full spectrum of our business/IT service offerings. |
| (5) | Adherence to Operational Metrics — Since our inception in 1992, Edgewater’s original management team has built an organization that is defined by a record of operational excellence, tracking key performance indicators and well-defined operating metrics to manage our consulting resources, utilization and gross margin. |
Business Strategy
Our business strategy is to position our Company as the leading provider of business and technology transformational services. We believe we can attain this strategic objective by delivering a range of blended solutions through a combination of industry specific business consulting and advanced software product technology. Clients desire the personal attention provided by onsite industry, financial, and strategic expertise buttressed with the ability to speed idea implementation with cost-effective advanced software package solutions. Our ability to begin our services dialogue at the strategy level in business vernacular all the way through specific software product RFP response provides a spectrum of sales opportunities with varying degrees of channel control and cost. This spectrum of engagement entry opportunities provides, on balance, the highest probability of serving the upper mid-market through the Global 2000 with an appropriate set of services.
Our services are loosely categorized into five distinct groups; business advisory, analytics, enterprise information management, enterprise application, and technology services. The spectrum begins with pure consulting and ends with pure information technology. Smaller organizations such as mid-market, subsidiaries of Global 2000, private equity, and venture capital will tend to start at the advisory and consulting level, while the Global 2000 tend to initially engage with enterprise application services. Following are the categories listed with sample services:
| • | Business advisory services |
| • | Monetize knowledge, new revenue streams from corporate data |
| • | Customer transformation, moving from business-to-business to business-to-customer or the reverse for new revenue opportunities |
| • | Business process rejuvenation with industry best practice and cross pollination |
| • | Specialized operational, due diligence, and technology management expertise to M&A, private equity, and venture capital |
| • | Strategic advice, costing, estimates to complete, failing or failed programs or project initiatives |
| • | Independent package selection and Request for Information or Proposal process design and implementation |
| • | Analytics services |
| • | Lead derivation of key financial and operational performance indicators and correlate their measurement, visualization, and action for a given organization |
| • | Advise on opportunities for the use of predictive techniques, external data and benchmarks to improve business performance measurement and forecasting |
5
Table of Contents
| • | Advise on the creation and adoption of analytics architectures, roadmaps, and supporting organizations |
| • | Advise, design, architecture, and roadmap analytics-based near real-time to real-time alerting strategies and implementations |
| • | Enterprise information management services |
| • | Provide for all things data related: master data management, data governance, logical and physical data base design, data warehouse strategies and design |
| • | Provide practical data architectures and roadmaps to support transactional systems, enterprise performance management, through advanced analytics |
| • | Provide all forms of data manipulation, transformation, and quality services |
| • | Enterprise application services |
| • | Effect business transformation through the use of packaged software solutions |
| • | Enterprise performance management with Oracle and SAP budgeting, planning and consolidation |
| • | Enterprise resource planning with Microsoft Dynamics AX, discrete manufacturing and a specialty of process-based manufacturing |
| • | Customer relationship management with Microsoft CRM |
| • | Industry specific platform and best practice solutions |
| • | Blended solutions; Microsoft CRM/XRM and custom |
| • | Technology services |
| • | Technical architecture and roadmaps |
| • | Technical evaluations and design |
| • | Custom component design and implementation |
| • | Web-centric solutions: internal, external and/or collaborative |
| • | Infrastructure optimization and redesign, disaster recovery, and business continuity specialized design and assistance |
Our consultants are expected to travel and to be onsite with the customer to provide the highest level of service and support in all of these endeavors. We work with varying degrees of customer project assistance and will incorporate customer resources for technology transfer or cost optimization purposes. Independent teams and proper project process and delineation provide conflict-free transition points between all key service offerings as well as independent entry points. Leads for all offerings are internally driven with assistance from the respective vendors for software product solutions.
6
Table of Contents
Our Services
Edgewater offers a full spectrum of services and expertise to ensure the success of our engagement. Our consulting services are consolidated into three major synergistic offerings: (1) Advisory Services, (2) Vertical Services and (3) Enterprise Applications all based upon a foundation of Strategic Technical & Data Services. The diagram that follows clearly illustrates these offerings:
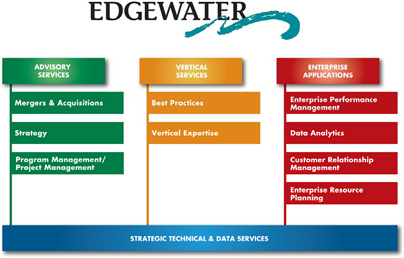
Edgewater has the proven expertise to plan, deliver and manage integration services that improve performance and maximize business results. We focus on deploying new systems and unlocking the value of the existing corporate assets. This proven expertise enables us to bring complex technologies and systems together while minimizing risk, leveraging our clients’ technology investments and delivering tailored solutions.
Customers; Significant Customers
Historically, we have derived a significant portion of our consulting services based-revenues (and overall revenues) from large technical consulting projects involving a limited number of customers. When we complete large technical consulting projects, we redeploy consulting professionals to new projects, even though these new projects, either individually or in the aggregate, may not be as large as the prior completed project. Our EPM engagements, in comparison, are smaller on a relative basis and do not typically entail commitments or project revenues comparable to large technical consulting projects.
Service revenue from our five largest customers, as a percentage of total service revenue, was 20.4%, 26.2% and 45.1% for the years ended December 31, 2009, 2008 and 2007, respectively. This trend has occurred for several reasons. Given the growth of our EPM service business and our efforts to expand and diversify our client base, particularly over the last three fiscal years, our reliance on (and the risks associated with) a limited number of significant customers has diminished. Also, during 2009, service revenue from several of our larger customers decreased significantly compared to prior years. See “Item 1A Risk Factors—Our success depends on a limited number of significant customers, and our results of operations and financial condition could be negatively affected by the loss of a major customer or significant project or the failure to collect a large account receivable.” During 2009, we recorded service revenue from 249 customers, of which 63 were new customers, as compared to recording service revenue from 308 customers in 2008, of which 81 were new customers.
Marketing, Sales and Strategic Alliances
Marketing. The primary goal of our marketing efforts is to generate sales opportunities by increasing Edgewater’s brand awareness, value proposition and overall domain expertise. Our marketing efforts continue to be closely aligned with the Company’s go-to-market strategy, while introducing specific offerings that address business and IT problems faced by our clients. We leverage the core competencies we have developed in delivering our services in key industries and horizontal offerings to increase the efficiency of our marketing efforts. Our marketing function utilizes comprehensive
7
Table of Contents
Internet marketing strategies that involve integrated activities including, but not limited to: webinars, highly-targeted email campaigns distributed to prospect and client lists developed with specific demographics and attributes and social media outlets to promote our Company’s capabilities and services (e.g. both company-driven and domain-specific blogs, social networking and video sharing websites). By leveraging closely coupled Internet marketing strategies to promote our services, we are able to reach a wider audience and communicate in a medium that has become more widely accepted and brings in quicker results from both a sales and marketing perspective. We also gather key statistics from our websites, blogs, email campaigns and other social media outlets to test, measure and trace our marketing initiatives. This enables us to ensure we are reaching the right target audience with concise and compelling offerings to promote our capabilities and warrant further action by our target audience. We also author white papers, byline and contribute to articles in trade publications, attend events and participate in targeted industry conferences and tradeshows.
Sales. Our sales approach is to combine traditional sales with our strength in industries and technology. Our traditional sales function is comprised of direct sales professionals and inside sales professionals. Both work closely with our practice directors to identify potential opportunities within each account. Using a consultative selling methodology, target prospects are identified and a pursuit plan is developed for each key account. When contact with a target is established, we utilize a blended sales model to demonstrate our expertise, combining consultative selling with traditional sales methods. Once the customer has engaged Edgewater, our sales professionals maintain their relationships with the customer by working collaboratively with the consulting professionals who are assigned to the customer.
Strategic Alliances. As part of our sales and marketing effort, we have established working relationships with a number of companies, including: Cognos, IBM, Informatica Corporation, ISO Insurance Technology Solutions, Google, Microsoft Corporation, Optical Image Technology, Oracle America, Inc. (“Oracle”), SAP, Sun Microsystems, UBMatrix, VMWare and Webtrends. These alliances generally entail sharing sales leads, joint marketing efforts, making joint customer presentations, negotiating discounts on license fees or other charges and conducting similar activities. Our arrangements with many of these companies are informal and are not subject to definitive written agreements. For those companies with whom we do have definitive written agreements, those agreements are either terminable at will by either party or are for terms of one year or less. We believe we have been successful in establishing alliances with a strong group of companies who are either industry leaders or well-regarded new entrants.
Professional Recruitment, Retention and Development
Our success depends in part upon our ability to recruit and retain business and technology professionals with the high level of skills and experience needed to provide our specialty services. We believe that the combination of professional support, intellectual challenge, corporate culture and compensation we offer will continue to be attractive to these highly-skilled professionals. Our working environment also fosters collaboration, creativity and innovation. We believe that our employees are one of our most valuable assets.
Employees. As of December 31, 2009, Edgewater had 237 employees. Of these employees, 180 were billable consultants and 57 were management and administrative personnel, comprised of sales, marketing, human resources, finance, accounting, internal information systems and administrative support. The average tenure of our employee base is approximately 5.4 years and the average “years of experience” is approximately 20 years. Our employees are not represented by a collective bargaining agreement. We believe that our employee relations are strong.
Culture. We believe that our business culture is critically important in hiring and retaining qualified professionals. Our ability to provide effective multidisciplinary teams is dependent upon our ability to develop and sustain a business culture that is common across all disciplines and vertical practices throughout our Company. Our employees are talented and energetic professionals that come from a multitude of professional backgrounds. Edgewater believes that this creates an exciting, diverse and creative work environment for our employees.
Compensation. We have competitive compensation programs that have been structured to attract and retain highly-skilled professionals. Edgewater’s compensation programs include competitive base salaries, coupled with cash bonus and equity-based incentive opportunities. Compensation plans may be tied to the achievement of the Company’s financial performance or tied to individual and team performance goals.
Recruiting. We believe that our long-term success will depend upon our ability to attract, retain and motivate highly-skilled employees. Our recruitment department has traditionally conducted its own direct recruiting efforts and coordinated informal and search firm referrals. We believe that our business model, which results in an intellectually stimulating work environment, provides greater opportunities for professional development and a dynamic corporate culture, which enhances our ability to attract and retain top professionals.
Professional Development. We believe that providing our professionals with a wide variety of challenging projects, the opportunity to demonstrate ability and achieve professional advancement are keys to their retention. We work with our professionals to assist them with their professional development by offering internal and external learning opportunities. We encourage them to attain industry certifications which strengthen their expertise in both business and technology. In addition, we also believe that the working relationships they form on various project teams foster valuable formal and informal mentoring and knowledge sharing.
8
Table of Contents
Competition
We operate in a competitive and rapidly changing market. We also compete with a variety of organizations that offer services similar to those that we offer. Our clients often retain us on non-exclusive, project-by-project basis. We compete with a number of different types of businesses, including:
Traditional management and strategy consulting firms that focus on advising “C”-level executives on organization and corporate strategy. Many of the traditional strategic consulting firms have added services in information technology.
Systems integration and IT consulting firms that design and implement technology solutions, including software installation, for departments and enterprises. These firms have grown in size and scope of services, including the provision of offshore software development services.
Information technology product and service vendors that offer technical consulting to support their own products. Many of these firms have also developed various alliances with systems integration and IT consulting firms to augment their own capabilities.
There is significant competition in the management and IT consulting services space. Mergers or consolidations in our market may create new, larger or better-capitalized competitors with enhanced abilities to attract and retain professionals. The following is a representative list of competitors in the IT and management consulting services space:
| • | Technical Consulting/Systems integrators: Accenture, CMGI, EDS, eLoyalty Corporation, IBM Global Services, Business and Decision Group, Caritor, Inc., LogicaCMG, Perficient and Sapient; |
| • | Offshore software development firms: Aztec Software, Cognizant Technology Solutions, Infosys, Ventyx, Satyam, Tata and Wipro; |
| • | Management/Business Consulting firms: Bain & Company, Booz-Allen & Hamilton, Boston Consulting Group, Diamond Management and Technology Consultants, Inc. and McKinsey & Company; |
| • | Enterprise Performance Management / Business Activity Monitoring / Business Intelligence providers: The Hackett Group, Hitachi Consulting Corporation and Hewlett-Packard; and |
| • | Computer hardware, software and service vendors: Hewlett-Packard, IBM, Oracle, Microsoft and SAP. |
We believe that the principal criteria considered by prospective clients when selecting a consulting firm include skills and capabilities of consultants, scope of services, project methodology and approach, technical and industry expertise, reputation and quality of past work, perceived value and a commitment to delivering a solution that works as intended. Due to our ongoing dedication and attention to all of the above characteristics, Edgewater believes that it is well positioned against our competitors in our marketplace.
Intellectual Property
We consider our intellectual property to be a valuable asset in a highly competitive industry. We also consider our intellectual property to be an important factor in building brand recognition for quality service and performance. Therefore, we have secured certain service marks for “Edgewater,” “Edgewater Technology,” “Edgewater Strategy Services” and “Edgewater Technology-Ranzal,” among others. We believe we have secured all rights to trademarks and trade names related to our business.
We rely on a combination of trade secret, copyright and trademark laws to protect our proprietary rights. In particular, we require each of our employees to sign an invention and non-disclosure agreement, which provides that they must maintain the confidentiality of our intellectual property and that any intellectual property that they develop while employed by us is the property of Edgewater. We have developed detailed tools, processes and methodologies which are used in developing software code, scripts, libraries, data models, applications, business processes, frameworks and other technology used within our Company and in customer engagements. See also “Item 1A—Risk Factors” included elsewhere in this Form 10-K.
9
Table of Contents
Potential Future Strategies, Transactions and Changes
Critical to our ability to create long-term stockholder value, the Company will continue to pursue internal growth initiatives and appropriate business combination transaction alternatives to achieve growth in revenues and profitability. From time-to-time, we have engaged and we may continue to engage in preliminary discussions with various persons regarding potential business combination transactions.
We believe that our current cash reserves and our anticipated cash flow from our operations will be, taken together, adequate for our working capital needs for at least the next twelve months. However, our actual experience may differ significantly from our expectation, particularly if we pursue growth through business combination transactions, which we presently believe will be advantageous to building long-term stockholder value. In addition, other future events may adversely or materially affect our business, expenses or prospects and could affect our available cash or the availability or cost of external financial resources.
We may, in the future, purchase common stock in the open market, in private transactions or otherwise, pursuant to board approved repurchase programs. See “Item 5 – Market for Registrant’s Common Equity, Related Stockholder Matters and Issuer Purchases of Equity Securities” included elsewhere in this Form10-K. Any future purchases by us will depend on many factors, including, but not limited to, the following:
| • | The market price of our common stock; |
| • | Our business strategy; |
| • | Our business and financial position; and |
| • | General economic and market conditions. |
| ITEM 1A. | RISK FACTORS |
Risk Factors Affecting Finances, Business Prospects and Stock Volatility
In addition to other information contained in this Form 10-K, the following risk factors should be carefully considered in evaluating Edgewater and its business because such factors could have a significant impact on our business, operating results and financial condition. These risk factors could cause actual results to materially differ from those projected in any forward-looking statements.
Our business could be adversely affected by material changes to our strategic relationship with Oracle America, Inc. Our EPM-related service offering derives a substantial portion of its revenues from a channel relationship with Oracle. This relationship involves Oracle assisted lead generation support with respect to the business intelligence services provided in connection with our EPM-related service offerings. This relationship is governed by an Oracle PartnerNetwork Agreement, which is subject to annual renewal and is scheduled to expire in September of 2010. A failure to renew this relationship, or a material modification or change in Oracle’s partner approach or its contract terms, for any reason, could have a material adverse impact on our results of operations.
Our business could be adversely affected by material changes to our strategic relationship with Microsoft Corporation. As a result of our December 31, 2009 acquisition of Fullscope, Inc. (“Fullscope”), we will derive a substantial portion of our future ERP-related product and service revenues from a channel relationship with Microsoft Corporation. This relationship involves Microsoft-assisted lead generation support with respect to the ERP-related services provided by Fullscope. This relationship is governed by a Microsoft Partner Agreement, which is subject to annual renewal. A failure to renew this relationship, or a material modification or change in Microsoft’s partner approach or its contract terms, for any reason, could have a material adverse impact on our results of operations.
Our results can be subject to variability as work is completed for a limited number of significant customers, and our results of operations and financial condition could be negatively affected by the loss of a major customer or significant project or the failure to collect a large account receivable. We have in the past derived, and may in the future derive, a significant portion of our service revenue from a limited number of customers. From year-to-year, revenue from one or more of our customers may exceed 10% of our total service revenue. Although reliance on significant customers has diminished over the last three fiscal years (see “Item 1 – Customers—Significant Customers”), the loss of a major customer or large project could materially and adversely affect our results of operations. In this regard, two technical consulting customers that accounted for $8.9 million of our 2008 service revenues ceased using our services in the first quarter of 2009, which had a material impact upon our 2009 service revenues. This loss of service revenue may continue to cause variability in operating results and period-to-period comparisons, until we are able to replace these customers with other projects and customers. However, given the current adverse economic landscape, corporate budgetary restrictions and reduced external IT services spending trends, it may take us longer than we desire to raise revenues at or above 2009 levels and no assurance can be given that we can be successful in this regard. In 2009, one customer accounted for more than 5% of our service revenues and our top five customers represented only 20.4% of our 2009 service revenues. Nonetheless, the future receipt of significant commitments from new or existing clients could create future risks such as those described above concerning customer concentration.
10
Table of Contents
We perform varying amounts of work for specific customers from year-to-year. A major customer in one year may not use our services in another year. In addition, we may derive revenue from a major customer that constitutes a large portion of a particular quarter’s total revenue. If we lose any major customers or any of our customers cancel or significantly reduce a large project’s scope, our results of operations and financial condition could be materially and adversely affected. Further, if we fail to collect a large accounts receivable balance, we could be subjected to a material adverse impact on financial results and a decrease in cash flow.
Our business could be adversely affected by a significant or prolonged economic downturn. Our results of operations are affected by the level of business activity of our clients, which in turn is affected by the level of economic activity in the industries and markets that they serve. A decline in the level of business activity of our clients has had and could continue to have a material adverse effect on our revenue and profit margin. Future economic conditions could cause some clients to reduce or defer their expenditures for consulting services. We have implemented and will continue to implement cost-savings initiatives to manage our expenses as a percentage of revenue. However, current and future cost-management initiatives may not be sufficient to avoid reductions in our margins if the economic environment should weaken for a prolonged period.
Our lack of long-term customer contracts reduces the predictability of our revenues because these contracts may be canceled on short notice and without penalty. Our customers generally retain us on a project-by-project basis, rather than under long-term contracts. As a result, a customer may not engage us for further services once a project is complete. If a significant customer, or a number of customers, terminate, significantly reduce, or modify their contracts with us, our results of operations would be materially and adversely affected. Consequently, future revenue should not be predicted or anticipated based on the number of customers we have or the number and size of our existing projects. If a customer were to postpone, modify or cancel a project, we would be required to shift our consultants to other projects to minimize the impact on our operating results. We cannot provide assurance that we will be successful in efficiently and effectively shifting our consultants to new projects in the event of project terminations, which could result in reduced service revenue and lower gross margins. If we experience unexpected changes or variability in our revenue, we could experience variations in our quarterly operating results and our actual results may differ materially from the amounts planned and our operating profitability may be reduced or eliminated.
We have significant fixed operating costs, which may be difficult to adjust in response to unanticipated fluctuations in revenue. A high percentage of our operating expenses, particularly salary expense, rent, depreciation expense and amortization of intangible assets, are fixed in advance of any particular quarter. As a result, an unanticipated decrease in the number or average size of, or unanticipated delay in the scheduling for, our projects may cause significant variations in operating results in any particular quarter and could have a material adverse effect on operations for that quarter. An unanticipated termination or decrease in size or scope of a significant project, a client’s decision not to proceed with a project we anticipated or the completion during the quarter of several significant client projects could require us to maintain underutilized employees and could have a material adverse effect on our business, financial condition and results of operations.
If we fail to satisfy our customers’ expectations, our existing and continuing business could be adversely affected. Our sales and marketing strategy emphasizes our belief that we have highly referenceable accounts. Therefore, if we fail to satisfy the expectations of our customers, we could damage our reputation and our ability to retain existing customers and attract new customers. In addition, if we fail to deliver and perform on our engagements, we could be liable to our customers for breach of contract. Although most of our contracts limit the amount of any damages to the fees we receive, we could still incur substantial cost, negative publicity and diversion of management resources to defend a claim, and as a result, our business results could suffer.
We may have lower margins, or lose money, on fixed-price contracts. As part of our strategy, we intend to continue to grow our business with time-and-materials contracts, fixed-price contracts and fixed-fee contracts. In 2009, fixed-price contracts represented approximately 4.7% of our total service revenue. We assume greater financial risk on fixed-price contracts than on time-and-materials or fixed-fee engagements, and we cannot assure you that we will be able to successfully price our larger fixed-price contracts. If we fail to accurately estimate the resources and time required for an engagement, fail to manage customer expectations effectively or fail to complete fixed-price engagements within planned budgets, on time and to our customers’ satisfaction, we could be exposed to cost overruns, potentially leading to lower gross profit margins or even losses on these engagements.
Competition in the IT and management consulting services market is intense and, therefore, we may lose projects to, or face pricing pressure from, our competitors or prospective customers’ internal IT departments or international outsourcing firms. The market for IT and management consulting providers is highly competitive. In many cases, we compete for specialty IT services work with in-house technical staff, software product companies with extended service organizations and other international IT and management consulting firms, including offshore outsourcing firms. In addition, there are many small, boutique technology management consulting firms who have developed services similar to those offered by us. We believe that competition will continue to be strong and may increase in the future, especially if our competitors continue to reduce their price for IT and management consulting services. Such pricing pressure could have a material impact on our revenues and margins and limit our ability to provide competitive services.
11
Table of Contents
Our target market is rapidly evolving and is subject to continuous technological change. As a result, our competitors may be better positioned to address these developments or may react more favorably to these changes, which could have a material adverse effect on our business. We compete on the basis of a number of factors, many of which are beyond our control. Existing or future competitors may develop or offer IT and management consulting services that provide significant technological, creative, performance, price or other advantages over the services we offer.
See “Item 1 – Business—Competition” included elsewhere in this Form 10-K for a representative list of competitors in the IT and management consulting services space.
Some of our competitors have longer operating histories and significantly greater financial, technical, marketing and managerial resources than we do. There are relatively low barriers of entry into our business. We have no patented or other proprietary technology that would preclude or inhibit competitors from entering the IT services market. Therefore, we must rely on the skill of our personnel and the quality of our customer service. The costs to start an IT and management consulting services firm are low. We expect that we will continue to face additional competition from new entrants into the market in the future, offshore providers and larger integrators and we are subject to the risk that our employees may leave us and may start competing businesses. Any one or more of these factors could have a material impact on our business.
If clients view offshore development as a viable alternative to our service offerings, our pricing, revenue, margins and profitability may be negatively affected. In recent years, international IT service firms have been founded in countries such as India and China, which have well-educated and technically-trained workforces available at wage rates that are substantially lower than U.S. wage rates. While traditionally we have not competed with offshore development, the offshore model has matured and offers an alternative choice when companies evaluate their IT consulting needs. To counteract the alternative of going offshore for IT consulting services, we are focusing on specialty service offerings, including design and strategy consulting engagements, which are more difficult for offshore development firms to replicate. If we are unable to continually evolve our service offerings or the rate of acceptance of offshore development advances beyond current levels, then our pricing and revenue could be adversely affected.
Because we rely on highly-trained and experienced personnel to design and build complex systems for our customers, an inability to retain existing employees and attract new qualified employees would impair our ability to provide our services to existing and new customers. Our future success depends in large part on our ability to attract new qualified employees and retain existing highly-trained and experienced technical consultants, project management consultants, business analysts and sales and marketing professionals of various experience levels. If we fail to attract new employees or retain our existing employees, we may be unable to complete existing projects or bid for new projects of similar size, which could adversely affect our revenues. While attracting and retaining experienced employees is critical to our business and growth strategy, maintaining our current employee base may also be particularly difficult. Even if we are able to grow and expand our employee base, the additional resources required to attract new employees and retain existing employees may adversely affect our operating margins.
We depend on our key personnel, and the loss of their services may adversely affect our business. We believe that our success depends on the continued employment of the senior management team and other key personnel. This dependence is particularly important to our business because personal relationships are a critical element in obtaining and maintaining customer engagements. If one or more members of the senior management team or other key personnel were unable or unwilling to continue in their present positions, our business could be seriously harmed. Furthermore, other companies seeking to develop in-house business capabilities may hire away some of our key personnel.
Past or future business combination transactions or other strategic alternatives could disrupt our ongoing business, distract our management and employees, increase our expenses and adversely affect our business. We have, in the past, realized growth, in part, through acquisitions, including our recent acquisition of Fullscope, Inc., and we anticipate that a portion of our future growth may be accomplished through one or more business combination transactions or other strategic alternatives. The ultimate success of any such transactions, including the Fullscope acquisition, will depend upon, among other things, our ability to integrate acquired personnel, operations, products and technologies into our organization effectively, to retain and motivate key personnel of acquired businesses and to retain customers of acquired businesses. We cannot assure you that we will be successful in this regard or that we will be able to identify suitable opportunities, successfully grow acquired businesses, integrate acquired personnel and operations successfully or utilize our cash or equity securities as acquisition currency on acceptable terms to complete any such business combination transactions. These difficulties could disrupt our ongoing business, distract our management and employees, increase our expenses and materially and adversely affect our results of operations. Any such transactions would involve certain other risks, including the reduction of cash and/or working capital, the assumption of additional liabilities, potentially dilutive issuances of equity securities and diversion of management’s attention from operating activities.
We may not be able to protect our intellectual property rights or we may infringe upon the intellectual property rights of others, which could adversely affect our business. Our future success will depend, in part, upon our intellectual property rights and our ability to protect these rights. We do not have any patents or patent applications pending. Existing trade secret and copyright laws afford us only limited protection. Third parties may attempt to disclose, obtain or use our solutions or technologies. This is particularly true in foreign countries where laws or law enforcement practices may not protect our proprietary rights as fully as in the United States. Others may independently develop and obtain patents or copyrights for
12
Table of Contents
technologies that are similar or superior to our technologies. If that happens, we may need to license these technologies and we may not be able to obtain licenses on reasonable terms, if at all. If we are unsuccessful in any future intellectual property litigation, we may be forced to do one or more of the following:
| • | Cease selling or using technology or services that incorporate the challenged intellectual property; |
| • | Obtain a license, which may not be available on reasonable terms or at all, to use the relevant technology; |
| • | Configure services to avoid infringement; and |
| • | Refund license fees or other payments that we have previously received. |
Generally, we develop software applications for specific customer engagements. Issues relating to ownership of and rights to use software applications and frameworks can be complicated. Also, we may have to pay economic damages in these disputes, which could adversely affect our results of operations and financial condition.
Fluctuations in our quarterly revenues and operating results may lead to increased volatility of our stock. Our quarterly revenues and operating results can sometimes be volatile. We believe comparisons of prior period operating results cannot be relied upon as indicators of future performance. If our revenues or our operating results in any future period fall below the expectations of securities analysts and investors, the market price of our securities would likely decline.
Factors that may cause our quarterly results to fluctuate in the future include the following:
| • | Variability in market demand for IT and management consulting services; |
| • | General economic or stock market conditions unrelated to our operating performance; |
| • | Length of the sales cycle associated with our service offerings; |
| • | Unanticipated variations in the size, budget, number or progress toward completion of our engagements; |
| • | Unanticipated termination of a major engagement, a customer’s decision not to proceed with an engagement we anticipated or the completion or delay during a quarter of several major customer engagements; |
| • | Efficiency with which we utilize our employees, or utilization, including our ability to transition employees from completed engagements to new engagements; |
| • | Our ability to manage our operating costs, a large portion of which are fixed in advance of any particular quarter; |
| • | Changes in pricing policies by us or our competitors; |
| • | Seasonality and cyclicality, including the effects of lower utilization rates during periods with disproportionately high holiday and vacation usage experience; |
| • | The timing of customer year-end periods and the impact of spending relative to such year-end periods; |
| • | Our ability to manage future growth; and |
| • | Costs of attracting, retaining and training skilled personnel. |
Some of these factors are within our control, while others are outside of our control.
Volatility of our stock price could result in expensive class action litigation. If our common stock suffers from volatility like the securities of other technology and consulting companies, we could be subject to securities class action litigation similar to that which has been brought against other companies following periods of volatility in the market price of their common stock. The process of defending against these types of claims, regardless of their merit, is costly and often creates a considerable distraction to senior management. Any future litigation could result in substantial additional costs and could divert our resources and senior management’s attention. This could harm our productivity and profitability and potentially adversely affect our stock price.
Anti-takeover provisions in our charter documents, our stockholder rights plan and/or Delaware law could prevent or delay a change in control of our Company. Our Board of Directors can issue preferred stock in one or more series without stockholder action. The existence of this “blank-check” preferred stock provision could render more difficult or discourage an attempt to obtain control by means of a tender offer, merger, proxy contest or otherwise. In addition, our Company has a stockholder rights plan, commonly referred to as a “poison pill,” that may discourage an attempt to obtain control by means of a tender offer, merger, proxy contest or otherwise. If a person acquires 20% or more of our outstanding shares of common stock, except for certain institutional stockholders, who may acquire up to 25% of our outstanding shares of common stock, then rights under this plan would be triggered, which would significantly dilute the voting rights of any such acquiring person. Certain provisions of the Delaware General Corporation Law may also discourage someone from acquiring or merging with us.
We may not generate enough income in future periods to maintain the current net carrying value of our deferred tax asset. We have a deferred tax asset of approximately $21.1 million, net of an applicable valuation allowance, as of December 31, 2009. If we are unable to generate enough income in future periods, the valuation allowance relating to our deferred tax asset may have to be revised upward, which would reduce the carrying value of this asset on our consolidated balance sheet under generally accepted accounting principles. An increase in the valuation allowance and a related reduction in the carrying value of this asset would increase our provision for income taxes, thereby reducing net income or increasing net loss, and could reduce our total assets (depending on the amount of any such change or changes). An increase in the valuation allowance could otherwise have a material adverse effect on our results of operations and/or our stockholders’ equity and financial position.
13
Table of Contents
We may be required to record additional impairment charges against the carrying value of our goodwill and other intangible assets in future quarters. As of December 31, 2009, we had recorded goodwill and intangible assets with a net book value of $15.6 million related to prior acquisitions. We test for impairment at least annually and whenever evidence of impairment exists. We have in the past recorded impairment charges against the carrying value of our goodwill and intangible assets. The carrying value of our goodwill and intangible asset values are measured using a variety of factors, including values of comparable companies, overall stock market and economic data and our own projections of future financial performance. We may be required in the future to record additional impairment charges that could have a material adverse effect on our reported results.
Our operating results could be adversely affected by fluctuations in the value of the U.S. dollar against foreign currencies. As a result of the our acquisition of Fullscope, a portion of our future revenues and operating expenses will be denominated in currencies other than the U.S. dollar. As result, Fullscope’s revenues and operating expenses are affected by fluctuating foreign currency exchange rates. An increase in the U.S. dollar relative to other currencies in which we have revenues will cause our revenues to be lower than with a stable exchange rate. Changes in exchange rates between other foreign currencies and the U.S. dollar can affect the recorded levels of our assets, liabilities and expenses relating to our operations. The primary foreign currencies in which we have exchange rate fluctuation exposure are the Canadian dollar and the Euro. Exchange rates between these currencies and U.S. dollars have fluctuated significantly in recent years, particularly as the current global financial crisis has unfolded, and may continue to do so in the future. We cannot predict the impact of future exchange rate fluctuations on our operating results.
| ITEM 1B. | UNRESOLVED STAFF COMMENTS |
None.
| ITEM 2. | PROPERTIES |
We lease 66,027 square feet of office space for our principal executive offices currently located at 20 Harvard Mill Square, Wakefield, Massachusetts 01880-3209. We also have office facilities in Alabama, Georgia, New Hampshire, New York and Montreal.
Our corporate and satellite offices are all leased properties. We do not own any real estate. Our existing properties satisfy our current operating needs, however we will seek additional space in the event our existing properties are unable to meet our operating requirements in the future.
| ITEM 3. | LEGAL PROCEEDINGS |
We are sometimes a party to litigation incidental to our business. We maintain insurance in amounts, with coverages and deductibles that we believe are reasonable. As of the date of the filing of this Form 10-K, our Company is not a party to any existing material litigation matters.
| ITEM 4. | RESERVED |
14
Table of Contents
PART II
| ITEM 5. | MARKET FOR REGISTRANT’S COMMON EQUITY, RELATED STOCKHOLDER MATTERS AND ISSUER PURCHASES OF EQUITY SECURITIES |
Stock Price Information
Our common stock, which has a par value of $0.01 per share, trades on the NASDAQ Global Market under the symbol “EDGW.” On March 4, 2010, there were approximately 1,766 holders of record of our common stock and 12.2 million shares of our common stock were outstanding. The number of record holders indicated above does not reflect persons or entities that hold their shares of stock in nominee or “street” name through various bankers or brokerage firms. Based on our Company’s solicitations of proxies in April 2009, we estimate that there are approximately 8,000 holders of our Company’s common stock.
The following table sets forth the range of high and low trading prices for our common stock as reported by the NASDAQ Global Market for each quarter in 2008 and 2009 and the first quarter of 2010 through March 4, 2010.
| High | Low | |||||
| FISCAL 2008: |
||||||
| First Quarter |
$ | 7.40 | $ | 5.16 | ||
| Second Quarter |
5.97 | 4.85 | ||||
| Third Quarter |
5.04 | 4.37 | ||||
| Fourth Quarter |
4.83 | 1.90 | ||||
| FISCAL 2009: |
||||||
| First Quarter |
$ | 3.17 | $ | 2.29 | ||
| Second Quarter |
2.90 | 2.08 | ||||
| Third Quarter |
3.34 | 2.16 | ||||
| Fourth Quarter |
3.16 | 2.48 | ||||
| FISCAL 2010: |
||||||
| First Quarter |
$ | 3.23 | $ | 2.76 | ||
| (through March 4, 2010) |
||||||
Recent Sales of Unregistered Securities
None.
Issuer Purchases of Equity Securities
In December 2007, our Board of Directors (the “Board”) authorized a stock repurchase program for up to $5.0 million of common stock on the open market or through privately negotiated transactions from time-to-time through December 31, 2008 (the “Stock Repurchase Program”). In September 2008, the Board authorized both an increase to and an extension of the Stock Repurchase Program. The Board increased the maximum dollar value of shares to be purchased under the Stock Repurchase Program by $3.5 million, to a total of $8.5 million and extended the period during which purchases could be made from December 31, 2008 to September 24, 2009 (the “Repurchase Period”). On September 23, 2009, the Board authorized an extension of the Repurchase Period from September 24, 2009 to September 23, 2010, while maintaining the Stock Repurchase Program’s cumulative maximum dollar repurchase limitation.
The timing and amount of the purchases will be based upon market conditions, securities law considerations and other factors. The Stock Repurchase Program does not obligate the Company to acquire a specific number of shares in any period and may be modified, suspended, extended or discontinued at any time, without prior notice.
The Company has repurchased a total of 1,548,449 shares of common stock since the inception of the Stock Repurchase Program at an aggregate purchase price of $5.7 million. See also “Item 1 – Business—Potential Future Strategies, Transactions and Changes” included elsewhere herein.
15
Table of Contents
Performance Graph
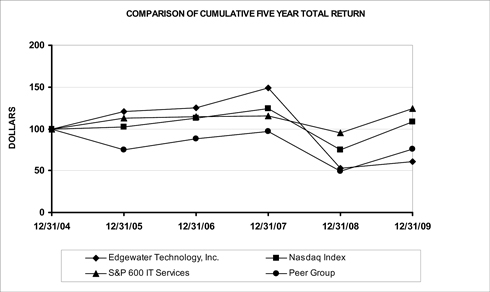
The following chart compares the cumulative total stockholder return and total return analysis, respectively, of our common stock with the cumulative total return on the NASDAQ Composite US Index, the SP600 IT Services Index and the common stock of six companies in the technology consulting industry for the five-year period beginning on December 31, 2004 (the closing sale price of our common stock on this date was $4.90) and ending on December 31, 2009 (the last trading date for our common stock in the 2009 fiscal year), assuming a $100 investment in each and assuming the reinvestment of dividends. We did not pay any dividends during the period. Refer to the footnotes below the graph for a listing of the companies included in our peer group.
| Company Name / Index |
12/31/04 | 12/31/05 | 12/31/06 | 12/31/07 | 12/31/08 | 12/31/09 | ||||||
| Edgewater Technology, Inc. |
100 | 120.41 | 124.69 | 148.98 | 52.86 | 60.61 | ||||||
| Nasdaq Index |
100 | 102.20 | 112.68 | 124.56 | 74.70 | 108.56 | ||||||
| S&P 600 IT Services |
100 | 113.09 | 114.19 | 115.48 | 95.49 | 124.55 | ||||||
| Peer Group |
100 | 74.51 | 87.78 | 97.02 | 49.49 | 75.41 |
Our self-selected peer group consists of the following companies: The Hackett Group, Ciber, Inc., Diamond Management & Technology Consultants, Inc., eLoyalty Corporation, Perficient, Inc. and Sapient Corporation.
Other Stockholder Matters
We have not paid dividends in the past and intend to retain any earnings to finance the expansion and operations of our business. We do not anticipate paying any cash dividends with regard to cash generated through our normal operations in the foreseeable future. The trading price of our common stock is subject to wide fluctuations in response to quarterly variations in operating results, announcements of acquisitions, performance by our competitors and other market events or factors. In addition, the stock market has, from time-to-time, experienced price and volume fluctuations, which have particularly affected the market price of many professional service companies and which often have been unrelated to the operating performance of these companies. These broad market fluctuations may adversely affect the market price of our common stock.
16
Table of Contents
| ITEM 6. | SELECTED FINANCIAL DATA |
The 2009, 2008, 2007, 2006 and 2005 selected consolidated financial data presented below has been derived from our audited consolidated financial statements and have been prepared in accordance with United States generally accepted accounting principles. We believe that this information should be read in conjunction with our audited consolidated financial statements and accompanying notes and “Item 7—Management’s Discussion and Analysis of Financial Condition and Results of Operations” included elsewhere in this Annual Report on Form10-K.
| Year Ended December 31, | ||||||||||||||||||
| 2009 | 2008 | 2007 | 2006 | 2005 | ||||||||||||||
| (In Thousands, Except per Share Data) | ||||||||||||||||||
| Consolidated Statements of Operations Data: |
||||||||||||||||||
| Total revenue |
$ | 50,085 | $ | 73,743 | $ | 68,490 | $ | 60,083 | $ | 43,126 | ||||||||
| Cost of revenue |
33,987 | 44,955 | 40,392 | 35,582 | 25,126 | |||||||||||||
| Gross profit |
16,098 | 28,788 | 28,098 | 24,501 | 18,000 | |||||||||||||
| Operating expenses: |
||||||||||||||||||
| Selling, general and administrative |
18,412 | 23,232 | 21,335 | 18,721 | 15,883 | |||||||||||||
| Depreciation and amortization |
2,694 | 3,771 | 2,448 | 1,755 | 1,046 | |||||||||||||
| Impairment of goodwill and other intangible assets (1) |
— | 48,594 | — | — | — | |||||||||||||
| Total operating expenses |
21,106 | 75,597 | 23,783 | 20,476 | 16,929 | |||||||||||||
| Operating (loss) income |
(5,008 | ) | (46,809 | ) | 4,315 | 4,025 | 1,071 | |||||||||||
| Other income, net |
122 | 503 | 1,599 | 1,283 | 1,054 | |||||||||||||
| (Loss) income before taxes, and discontinued operations |
(4,886 | ) | (46,306 | ) | 5,914 | 5,308 | 2,125 | |||||||||||
| Tax (benefit) provision |
(1,047 | ) | 712 | (2,896 | ) | 2,105 | 850 | |||||||||||
| (Loss) income from continuing operations before discontinued operations |
(3,839 | ) | (47,018 | ) | 8,810 | 3,203 | 1,275 | |||||||||||
| Discontinued operations: |
||||||||||||||||||
| Income from discontinued divisions, net of applicable taxes |
— | — | — | — | 325 | |||||||||||||
| Net (loss) income |
$ | (3,839 | ) | $ | (47,018 | ) | $ | 8,810 | $ | 3,203 | $ | 1,600 | ||||||
| Basic (loss) income per share: |
||||||||||||||||||
| Continuing operations |
$ | (0.32 | ) | $ | (3.66 | ) | $ | 0.75 | $ | 0.29 | $ | 0.13 | ||||||
| Discontinued operations |
— | — | — | — | 0.03 | |||||||||||||
| Net (loss) income |
$ | (0.32 | ) | $ | (3.66 | ) | $ | 0.75 | $ | 0.29 | $ | 0.16 | ||||||
| Weighted average shares, basic |
12,067 | 12,861 | 11,793 | 10,980 | 10,241 | |||||||||||||
| Diluted (loss) income per share: |
||||||||||||||||||
| Continuing operations |
$ | (0.32 | ) | $ | (3.66 | ) | $ | 0.66 | $ | 0.27 | $ | 0.12 | ||||||
| Discontinued operations |
— | — | — | — | 0.03 | |||||||||||||
| Net (loss) income |
$ | (0.32 | ) | $ | (3.66 | ) | $ | 0.66 | $ | 0.27 | $ | 0.15 | ||||||
| Weighted average shares, diluted |
12,067 | 12,861 | 13,358 | 11,956 | 10,653 | |||||||||||||
| (1) | During 2008, the Company recorded $48.6 million of impairment charges related to the carrying values of its goodwill and certain other intangible assets. Additional details can be found in the Company’s previously filed reports with the SEC. |
17
Table of Contents
| As of December 31, | |||||||||||||||
| 2009 (2) | 2008 | 2007 | 2006 | 2005 | |||||||||||
| (In Thousands) | |||||||||||||||
| Consolidated Balance Sheet Data: |
|||||||||||||||
| Cash, cash equivalent and marketable securities |
$ | 12,661 | $ | 24,566 | $ | 22,775 | $ | 33,141 | $ | 33,381 | |||||
| Accounts receivable, net |
18,043 | 11,683 | 15,146 | 10,883 | 9,858 | ||||||||||
| Goodwill and intangibles, net |
15,582 | 3,592 | 53,715 | 29,163 | 17,076 | ||||||||||
| Deferred tax asset, net |
21,108 | 22,393 | 22,255 | 18,549 | 21,491 | ||||||||||
| Other assets |
5,737 | 4,836 | 6,335 | 3,884 | 2,783 | ||||||||||
| Total assets |
$ | 73,131 | $ | 67,070 | $ | 120,226 | $ | 95,620 | $ | 84,589 | |||||
| Total liabilities |
$ | 18,015 | $ | 9,112 | $ | 12,700 | $ | 9,370 | $ | 6,504 | |||||
| Stockholders’ equity |
55,116 | 57,958 | 107,526 | 86,250 | 78,085 | ||||||||||
| Total liabilities and stockholders’ equity |
$ | 73,131 | $ | 67,070 | $ | 120,226 | $ | 95,620 | $ | 84,589 | |||||
| Outstanding shares of common stock |
12,132 | 12,162 | 13,297 | 11,522 | 10,683 | ||||||||||
| (2) | Edgewater’s December 31, 2009 balance sheet amounts reflect initial fair value assessments related to the assets acquired, liabilities assumed, allocation to identifiable intangible assets, recognition of deferred taxes and the allocation to goodwill associated with our acquisition of Fullscope, Inc. See “Item 8 – Financial Statements and Supplementary Data—Notes to Consolidated Financial Statements—Note 4 – Business Combinations” included elsewhere herein. |
| ITEM 7. | MANAGEMENT’S DISCUSSION AND ANALYSIS OF FINANCIAL CONDITION AND RESULTS OF OPERATIONS |
You should read the following summary together with the more detailed business information and consolidated financial statements and related notes that appear elsewhere in this annual report and in the documents that we incorporate by reference into this annual report. This annual report may contain certain “forward-looking” information within the meaning of the Private Securities Litigation Reform Act of 1995. This information involves risks and uncertainties. Our actual results may differ materially from the results discussed in the forward-looking statements. Factors that might cause such a difference include, but are not limited to, those discussed in “Item 1A—Risk Factors” and under “Special Note Regarding Forward-Looking Statements.”
Overview
Edgewater is a consulting firm that brings a synergistic blend of specialty services in the areas of business advisory, analytics, data management, and technology to its client base. During the fiscal year ended December 31, 2009, we generated revenues, including software revenue and reimbursement of out-of-pocket expenses, of approximately $50.1 million from a total of 249 clients. Headquartered in Wakefield, Massachusetts, as of December 31, 2009, our Company employed approximately 180 consulting professionals and 237 total professionals.
Service Revenue
Our service revenue is derived from professional services generated from strategy and other management consulting services, specialized technology and data analytic solutions and Enterprise Application Services such as ERP, CRM and EPM provided to our clients. Most of our projects, approximately 92.7%, are performed on a time and materials basis and a smaller amount of revenue is derived from projects performed on either a fixed-price or a periodic fixed-fee basis. Fixed-priced engagements represented approximately 4.7% of our service revenue for the year ended December 31, 2009. Fixed-fee engagements represented approximately 2.6% of our service revenue for the year ended December 31, 2009. For time and material projects, revenue is recognized and billed as services are performed. For fixed-price projects, revenue is generally recognized using the proportionate performance method. Provisions for estimated profits or losses on uncompleted projects are made on a contract-by-contract basis and are recognized in the period in which such profits or losses are determined. On many projects, we are reimbursed for out-of-pocket expenses such as airfare, lodging and meals. These reimbursements are included as a component of revenue and cost of revenue. The aggregate amount of reimbursed expenses will fluctuate depending on the location of our customers, the total number of our projects that require travel and whether our arrangements with our clients provide for the reimbursement of travel and other project-related expenses.
18
Table of Contents
Operating Expenses
The largest portion of our operating expenses consists of cash and non-cash compensation and benefits associated with our project consulting personnel and related expenses. Non-cash compensation includes stock compensation expense arising from restricted stock and option grants to employees. Project personnel expenses also consist of payroll costs and related benefits associated with our professional staff. Other related expenses include travel, subcontracting costs, third-party vendor payments and non-billable expenses associated with the delivery of services to our clients. We consider the relationship between project personnel expenses and revenue to be an important measure of our operating performance. The relationship between project personnel expenses and revenue is driven largely by the chargeability of our consultant base, the prices we charge our clients and the non-billable costs associated with securing new client engagements and developing new service offerings. The remainder of our recurring operating expense is comprised of expenses associated with the development of our business and the support of our client-serving professionals, such as professional development and recruiting, marketing and sales, and management and administrative support. Professional development and recruiting expenses consist primarily of recruiting and training content development and delivery costs. Marketing and sales expenses consist primarily of the costs associated with the development and maintenance of our marketing materials and programs. Management and administrative support expenses consist primarily of the costs associated with operations including finance, information systems, human resources, facilities (including the rent of office space), and other administrative support for project personnel.
We regularly review our fees for services, professional compensation and overhead costs to ensure that our services and compensation are competitive within the industry, and that our overhead costs are balanced with our revenue levels. In addition, we monitor the progress of client projects with client senior management. We manage the activities of our professionals by closely monitoring engagement schedules and staffing requirements. However, a rapid decline in the demand for the professional services that we provide could result in lower utilization of our professionals than we planned. In addition, because most of our client engagements are terminable by our clients without penalty, an unanticipated termination of a client project could require us to maintain underutilized employees. While professional staff levels must be adjusted to reflect active engagements, we must also maintain a sufficient number of consulting professionals to oversee existing client engagements and to participate in sales activities to secure new client assignments.
Company Performance Measurement Systems and Metrics
The Company’s management monitors and assesses its operating performance by evaluating key metrics and indicators on an ongoing basis. For example, we regularly review performance information related to annualized revenue per billable consultant, periodic consultant utilization rates, gross profit margins, average bill rates and billable employee headcount. Edgewater has also developed internal Enterprise Performance Management systems which aid us in measuring our operating performance and consultant utilization rates. The matching of sales opportunities to available skill sets in our consultant base is one of our greatest challenges and therefore, we monitor consultant utilization closely. These metrics, along with other operating and financial performance metrics, are used in evaluating management’s overall performance. These metrics and indicators are discussed in more detail under “Item 7—Management’s Discussion and Analysis of Financial Condition and Results of Operations—Results for the Year Ended December 31, 2009 Compared to Results for the Year Ended December 31, 2008.”
Plans for Growth and Acquisitions
Our goal is to continue to build one of the leading consulting firms in North America by growing our client base, leveraging our industry expertise to enhance our service offerings and continue to make disciplined strategic acquisitions. Previous acquisitions have further expanded our geographical footprint, increased our vertical expertise and have provided more scale to our organization.
Consistent with our strategy of growth, we consummated one acquisition during 2009. On December 31, 2009, the Company, pursuant to the terms of an Agreement and Plan of Merger and Reorganization (the “Purchase Agreement”) acquired all of the outstanding stock of Fullscope, Inc. (“Fullscope”) (the “Fullscope Acquisition”). Fullscope, with corporate offices located in Athens, Alabama and satellite offices in Alpharetta, Georgia and Montreal, Canada, is a Microsoft Dynamics consulting firm that provides discrete and process manufacturing Enterprise Resource Planning-related (“ERP”) consulting services in the upper mid-market. The Fullscope Acquisition provides Edgewater with ERP integration and related consulting service capabilities, discrete and process manufacturing expertise and extends the reach of the Company’s strategic data and analytics offerings into the upper middle market. The acquisition is more fully described in “Item 8 – Financial Statements and Supplementary Data—Notes to Consolidated Financial Statements—Note 4 – Business Combinations” included elsewhere herein.
2008 Goodwill and Intangible Asset Impairment Charges
Following the second quarter of 2008, as a result of the economic environment impacting our business and results and an overall decline in billable consultant utilization coupled with a material decline of the Company’s stock price since
19
Table of Contents
December of 2007, the Company determined that it had an impairment triggering event that would require an interim impairment evaluation of the carrying value of its goodwill and intangible assets. Based upon the results of the impairment procedures performed, the Company recognized impairment charges of $23.5 million and $1.2 million related to goodwill and other intangible assets, respectively during the second quarter of 2008.
During the third quarter of 2008, the Company reviewed both its market capitalization, as compared to book value of equity, and operating results, as compared to forecasts and projections, and did not identify the existence of a triggering event which would require a formal review of the carrying value of the goodwill and intangible assets.
Subsequently, on December 2, 2008, in connection with the Company’s annual review for impairment (the “Annual Impairment Review”), we determined that the carrying value of the Company’s single reporting unit exceeded the estimated fair value of the reporting unit. As a result, we determined that the carrying value of the Company’s goodwill and intangible assets had become further impaired. The Annual Impairment Review procedures performed by the Company resulted in the recognition of additional 2008 impairment charges of $23.6 million and $0.2 million during the fourth quarter of 2008 related to goodwill and other intangible assets, respectively.
Collectively, the impairment charges resulting from both our interim review for impairment and our Annual Impairment Review are referred to as the “2008 Impairment Charges.”
2008 Increase to Deferred Tax Asset Valuation Allowance
We evaluate the realizability of our deferred tax assets and assess the need for a valuation allowance on an ongoing basis. In evaluating our deferred tax assets during the fourth quarter of 2008, we consider whether it is more likely than not that the deferred income tax assets will be realized. The ultimate realization of our deferred tax assets depends upon generating sufficient future taxable income prior to the expiration of the tax attribute. This assessment requires significant management judgment.
The 2008 Impairment Charges recorded by the Company increased the gross carrying value of the Company’s deferred tax assets by approximately $11.9 million. The increase was directly related to the recognition of future deductible temporary timing differences associated with the impairment of the tax deductible goodwill and intangible assets. Additionally, the impairment charges also served to place the Company into a trailing three-year cumulative loss position.
On December 31, 2008, the Company performed an evaluation of the more than likely recoverability of the gross carrying value of its deferred tax assets, which considered and evaluated positive evidence (recent trend of tax-basis profitability) and negative evidence (cumulative loss position as of December 31, 2008 as a result of the current year impairment charges) (the “2008 DTA Review”). The 2008 DTA Review primarily centered upon the carrying value and future recoverability of the Company’s federal net operating loss (“NOL”) carryforwards, a majority of which expire on December 31, 2020, and the consideration of certain other alternative minimum and foreign tax credits.
The Company’s forecasts and projections were a key assumption utilized in the 2008 DTA Review. While the Company’s forward looking forecasts and projections supported a continued profitability trend, they projected a reduction in near-term earnings, mirroring the economic climate impacting IT consulting companies at that time. The Company’s future projections reduced profitability to levels in which it is not more than likely that the Company would be able to fully realize future economic benefit from all of its federal net operating loss carryforwards and other tax-related credits. Accordingly, the 2008 DTA Review resulted in the Company recording an increase to its deferred tax valuation allowance of $9.9 million during the fourth quarter of 2008, reducing the net carrying value of the Company’s deferred tax assets to the estimated more likely than not realizable amount.
Critical Accounting Policies
Our consolidated financial statements are prepared in accordance with accounting principles generally accepted in the United States of America (“GAAP”). These accounting principles require us to make certain estimates, judgments and assumptions. We believe that the estimates, judgments and assumptions, upon which we rely, are reasonable based upon information available to us at the time that they are made. These estimates, judgments and assumptions can affect the reported amounts of assets and liabilities as of the date of the financial statements, as well as the reported amounts of revenues and expenses during the periods presented. To the extent there are differences between these estimates, judgments or assumptions and actual results, our financial statements may be affected. The accounting policies that we believe are the most critical to aid in fully understanding and evaluating our reported financial results include the following:
| • | Income Taxes and Valuation of Deferred Tax Assets; |
| • | Revenue Recognition; |
| • | Allowance for Doubtful Accounts; |
| • | Share-based Compensation; |
| • | Goodwill, Other Intangible Assets and Impairment of Long-Lived Assets; and |
| • | Purchase Price Allocation. |
20
Table of Contents
Senior management has reviewed these critical accounting policies and related disclosures with our Audit Committee. See “Item 8 – Financial Statements and Supplementary Data—Notes to Consolidated Financial Statements” included elsewhere herein, which contains additional information regarding our accounting policies and other disclosures required by GAAP. We have identified the policies listed below as critical to our business operations and the understanding of our results of operations.
Income Taxes and Valuation of Deferred Tax Assets. In determining our current income tax provision, we assess temporary differences resulting from different treatments of items for tax and accounting purposes. These differences result in deferred tax assets and liabilities, which are recorded in our consolidated balance sheets. We evaluate the realizability of our deferred tax assets and assess the need for a valuation allowance on an ongoing basis. In evaluating our deferred tax assets, we consider whether it is more likely than not that the deferred income tax assets will be realized. The ultimate realization of our deferred tax assets depends upon generating sufficient future taxable income prior to the expiration of the tax attributes. In assessing the need for a valuation allowance we must project future levels of taxable income. This assessment requires significant judgment. Recovery of the deferred tax assets is dependent on achieving such projections and failure to do so would result in an increase in the valuation allowance in a future period.
As of December 31, 2009, the net deferred tax asset recorded on the Company’s consolidated balance sheet, which includes the deferred tax attributes recorded in connection with the Fullscope Acquisition, was approximately $21.1 million. This amount was comprised of approximately $23.4 million in federal NOL carryforwards, $0.9 million in state NOL carryforwards, $1.5 million in foreign federal and provincial NOL carryforwards, $2.6 million in available federal credits, $1.2 million in future tax benefits related to share-based compensation expense and $9.0 million in net deferred tax assets related to temporary timing differences, which were primarily generated by the 2008 Impairment Charges, reduced by a $1.8 million deferred tax liability recognized in 2009 in connection with the Fullscope Acquisition, which is described in further detail in “Item 8 – Financial Statements and Supplementary Data—Notes to Consolidated Financial Statements—Note 4” included elsewhere herein.
The gross value of the Company’s net deferred tax asset amounts is offset by a valuation reserve of approximately $17.5 million, providing for a net deferred tax asset of $21.1 million. This net deferred tax asset is representative of the Company’s assessment of the more likely than not expected future realization of the recorded deferred tax assets as of December 31, 2009. Any future changes in the valuation allowance could result in additional income tax expense (benefit) and reduce or increase stockholders’ equity, and such changes could have a significant impact upon our earnings in the future.
The Company’s December 31, 2009 deferred tax assets incorporates our purchase price accounting fair value estimate of the deferred tax attributes recognized in connection with the Fullscope Acquisition. The Company has initially recognized $6.5 million of net deferred tax assets, which are primarily comprised of federal, state and foreign net operating loss carryforwards and available research and development credits which will most likely have limited future use. The Company, based upon its preliminary assessment of the more likely than not expected future realization of Fullscope’s net operating loss carryforwards, has applied a full valuation allowance against the acquired net operating loss carryforwards. The Company will continue to evaluate these attributes, as well as Fullscope’s deferred tax attributes related to temporary timing differences during the measurement period. If necessary, we will adjust our initial estimates of the carrying value of these deferred tax attributes, and the related valuation allowance applied against these assets, in connection with the filing of Fullscope’s 2009 federal and state income tax returns or as more information becomes available. Adjustments to the carrying value of the deferred tax assets and future tax benefits, if any, recognized from the acquired Fullscope-related deferred tax asset attributes, will result in a subsequent modification to the goodwill recognized in connection with the Fullscope Acquisition.
When assessing the probability of the future realization of the recorded value of our deferred tax assets, the Company weighs both positive (projections and acquisitions) and negative (recent financial results) evidence. In projecting future income, we use our internal operating budgets and long-range planning projections. We develop our budgets and long-range projections based on recent results and trends, our project pipeline, and other appropriate factors. Based upon these analyses, the Company believes that it is more likely than not that it will be able to recover the currently recorded value of our net deferred tax assets.
The largest component of our deferred tax assets relates to historically generated federal net operating loss carryforwards. On a tax effected basis, $16.8 million of our federal net operating loss carryforwards expire in 2020 (the “2020 NOL”). Our projections are also utilized in assessing the recoverability of the 2020 NOL. Accordingly, the use of our projections to assess the recoverability of the 2020 NOL may result in volatility in our income tax expense as we may adjust the recoverability estimates in future periods. In addition, if we do not generate sufficient future revenue and profits, the realization of these deferred tax assets may be impaired, resulting in an additional income tax expense, thereby reducing net income or increasing net loss, in the period in which it is determined that it is more likely than not that either a portion or all of the deferred tax asset is not recoverable.
The evaluation of our tax positions in is a two-step process. The first step is a recognition process whereby the enterprise determines whether a tax position is more likely than not to be sustained upon examination, including resolution of any related appeals or litigation processes, based on the technical merits of the position. In evaluating whether a tax
21
Table of Contents
position has met the more likely than not recognition threshold, the enterprise should presume that the position will be examined by the appropriate taxing authority that has full knowledge of all relevant information. The second step is a measurement process whereby a tax position that meets the more likely than not recognition threshold is calculated to determine the amount of benefit to recognize in the financial statements. The tax position is measured at the largest amount of benefit that is greater than 50% likely of being realized upon ultimate settlement.
As of December 31, 2009, the Company maintains an accrual in the amount of $282 thousand related to unrecognized tax benefits. Current year activity included $13 thousand in settlements of unrecognized state tax benefits, inclusive of penalties and interest, a current year provision of $31 thousand for estimated penalties and interest on existing unrecognized tax benefits, and an increase of $25 thousand in connection with an accrual for potential penalties acquired as part of the Fullscope Acquisition.
Revenue Recognition. Our Company recognizes revenue from providing consulting services under written service contracts with our customers. The service contracts we enter into generally fall into three specific categories: time and materials, fixed-price and fixed-fee. Our revenues are generated from sources such as management consulting engagements, technical consulting engagements, EIM/data services and infrastructure services, ERP and CRM solutions and Enterprise Performance Management consulting engagements. Revenue from these service offerings is recognized as the services are performed and amounts are earned. We consider amounts to be earned once evidence of an arrangement has been obtained, services are delivered, fees are fixed or determinable and collectability is reasonably assured.
Edgewater engages in business activities under one operating segment. In response to continuous changes in our service offerings, we have begun to re-categorize of our service offerings, which are more fully described in “Item I – Business – Our Services.” In our future annual and quarterly SEC filings, we plan to present our consulting services as being consolidated into these three new major synergistic offerings: (1) Advisory Services, (2) Vertical Services and (3) Enterprise Applications all based upon a foundation of Strategic Technical & Data Services. However, in this Annual Report on Form 10-K, we will discuss our offerings in our traditional manner.
For the years ended December 31, 2009, 2008 and 2007, revenue from management consulting engagements, technical consulting engagements and enterprise performance management consulting engagements represented the following:
| Year Ended December 31, |
Management Consulting Engagements |
Technical Consulting Engagements |
Enterprise Performance Management Consulting Engagements |
||||||
| 2009 |
3.7 | % | 28.6 | % | 67.7 | % | |||
| 2008 |
6.4 | % | 36.6 | % | 57.0 | % | |||
| 2007 |
12.5 | % | 57.2 | % | 30.3 | % |
The Company derives a significant portion of its service revenue from time and materials-based contracts. Time and materials-based contracts represented 92.7%, 96.7% and 95.0% of service revenue for the years ended December 31, 2009, 2008 and 2007, respectively. Revenue under time and materials contracts is recognized as services are rendered and performed at contractually agreed upon rates.
Revenue pursuant to fixed-price contracts is recognized under the proportional performance method of accounting. Fixed-price contracts represented 4.7%, 1.0% and 2.4% of service revenue for the years ended December 31, 2009, 2008 and 2007, respectively. Over the course of a fixed-price contract, we routinely evaluate whether revenue and profitability should be recognized in the current period. We estimate the proportional performance on our fixed-price contracts on a monthly basis utilizing hours incurred to date as a percentage of total estimated hours to complete the project. If we do not have a sufficient basis to measure progress toward completion, revenue is recognized upon completion of performance, subject to any warranty provisions or other project management assessments as to the status of work performed. This method is used because reasonably dependable estimates of costs and revenue earned can be made, based on historical experience and milestones identified in any particular contract.
Typically, the Company provides warranty services on its fixed-price contracts related to providing customers with the ability to have any “design flaws” remedied and/or have our Company “fix” routine defects. The warranty services, as outlined in the respective contracts, are provided for a specific period of time after a project is complete. The Company values the warranty services based upon historical labor hours incurred for similar services at standard billing rates. Revenue related to the warranty provisions within our fixed-price contracts is recognized as the services are performed or the revenue is earned. The warranty period is typically short term or for a 30-60 day period after the project is complete.
In the event we are unable to accurately estimate the resources required or the scope of work to be performed on a fixed-price contract, or we do not manage the project properly within the planned time period, then we may recognize a loss on a contract. Provisions for estimated losses on uncompleted projects are made on a contract-by-contract basis. Any known or probable losses on projects are charged to operations in the period in which such losses are determined. A formal project
22
Table of Contents
review process takes place quarterly, although most projects are evaluated on an ongoing basis. Management reviews the estimated total direct costs on each contract to determine if the estimated amounts are accurate, and estimates are adjusted as needed in the period revised estimates are made. No losses were recognized on fixed-price contracts during the year ended December 31, 2009, 2008 or 2007.
We also perform services on a periodic fixed-fee basis under infrastructure service contracts, which include monthly hosting and support services. Fixed-fee contracts represented 2.6%, 2.3% and 2.6% of service revenues for the years ended December 31, 2009, 2008 and 2007, respectively. Revenue under fixed-fee contracts is recognized ratably over the contract period, as outlined within the respective contract. In the event additional services are required, above the minimum retained or contracted amount, then such services are billed on a time and materials basis.
When a customer enters into a time and materials, fixed-price or a fixed-fee contract, we recognized revenue in accordance with our evaluation of the deliverables in each contract. Our evaluation is conducted to determine whether they represent separate units of accounting. If the deliverables represent separate units of accounting, we then measure and allocate the consideration from the arrangement to the separate units, based on reliable evidence of fair value for each deliverable.
Client prepayments, even if nonrefundable, are deferred (classified as a liability) and recognized over future periods as services are performed. As of December 31, 2009 and 2008, the Company has recorded a deferred liability of approximately $809 thousand and $199 thousand, respectively, which is included in the financial statement caption of “deferred revenue and other liabilities” related to customer prepayments.
Software revenue represents the resale of certain third-party off-the-shelf software and is recorded on a gross basis provided we act as a principal in the transaction, whereby we have credit risk and we set the price to the end user. In the event we do not meet the requirements to be considered a principal in the software sale transaction and act as an agent, software revenue will be recorded on a net basis. Revenue from software resale arrangements represented 1.3%, 1.5% and 3.5% of total revenue for the years ending December 31, 2009, 2008 and 2007, respectively. Revenue and related costs are recognized and amounts are invoiced upon the customer’s constructive receipt of purchased software. All related warranty and maintenance arrangements are performed by the primary software vendor and are not the obligation of the Company.
We recognize revenue for services where the collection from the client is probable and our fees are fixed or determinable. We establish billing terms at the time at which the project deliverables and milestones are agreed. Our standard payment terms are 30 days from invoice date. Out-of-pocket reimbursable expenses charged to customers are reflected as revenue.
Our revenue and earnings may fluctuate from year-to-year based on the number, size and scope of projects in which we are engaged, the contractual terms and degree of completion of such projects, any delays incurred in connection with a project, employee utilization rates, the adequacy of provisions for losses, the use of estimates of resources required to complete ongoing projects, general economic conditions and other factors. Certain significant estimates include those used for fixed-price contracts, such as deferrals related to our volume purchase agreements, warranty holdbacks, allocations of fair value of elements under multiple element arrangements and the valuation of our allowance for doubtful accounts.
Allowance for Doubtful Accounts. The Company maintains an allowance for doubtful accounts related to its accounts receivable that have been deemed to have a high risk of collectability. Management reviews its accounts receivable balances on a monthly basis to determine if any receivables are potentially uncollectible. Management further analyzes historical collection trends and changes in its customer payment patterns, customer concentration and credit worthiness when evaluating the adequacy of its allowance for doubtful accounts. The Company includes any accounts receivable balances that are deemed to be potentially uncollectible, along with a general reserve, in its overall allowance for doubtful accounts. Based on the information available, management believes the allowance for doubtful accounts is adequate, however future write-offs could exceed the recorded allowance.
Share-Based Compensation. Share-based compensation expense is measured at the grant date based on the value of the award and is recognized as expense over the vesting period. Determining the fair value of share-based awards at the grant date requires judgment, including estimating the expected term of stock options and the expected volatility of our stock. In addition, judgment is also required in estimating the income tax benefits related to the share-based awards and the amount of share-based awards that are expected to be forfeited. If actual results differ significantly from our estimates, share-based compensation expense and our results of operations could be materially impacted.
Share-based compensation expense under all of the Company’s share-based plans was $1.1 million, $1.6 million and $1.5 million in the years ended December 31, 2009, 2008 and 2007, respectively. See “Item 8 – Financial Statements and Supplementary Data—Notes to Consolidated Financial Statements—Note 10” included elsewhere herein.
Goodwill, Other Intangible Assets and Impairment of Long-Lived Assets. Business acquisitions typically result in goodwill and other intangible assets, and the recorded values of those assets may become impaired in the future. The determination of the value of such intangible assets requires us to make estimates and assumptions that affect our consolidated financial statements. Goodwill has an indefinite useful life and is not amortized, but is evaluated for
23
Table of Contents
impairment annually, on December 2, or whenever events or changes in circumstances indicate that the carrying value may not be recoverable. We record intangible assets at cost. Our intangible assets consist primarily of non-compete arrangements, customer relationships and trade names and trademarks. We amortize our intangible assets that have finite lives using either the straight-line method or based on estimated future cash flows to approximate the pattern in which the economic benefit of the asset will be utilized.
Goodwill is tested annually for impairment at the reporting unit level utilizing the “fair value” methodology. Factors the Company considers important that could trigger an interim review for impairment include, but are not limited to, the following:
| • | Significant under-performance relative to historical or projected future operating results; |
| • | Significant changes in the manner of its use of acquired assets or the strategy for its overall business; |
| • | Significant negative industry or economic trends; |
| • | Significant decline in its stock price for a sustained period; and |
| • | Significant decline in market capitalization relative to net book value. |
Goodwill is evaluated for impairment using the two-step process. The first step is to compare the fair value of the reporting unit to the carrying amount of the reporting unit (the “First Step”). If the carrying amount exceeds the fair value, a second step must be followed to calculate impairment (the “Second Step”). Otherwise, if the fair value of the reporting unit exceeds the carrying amount, the goodwill is not considered to be impaired as of the measurement date. In its review of the carrying value of the goodwill, the Company determines fair values for the reporting unit using the Income Approach, or more specifically the Discounted Cash Flow Method, and the Market Approach, utilizing both the Guideline Company Method and the Comparable Transactions Method. These valuation methods require management to project revenues, operating expenses, working capital investment, capital spending and cash flows for the reporting unit over a multiyear period, as well as determine the weighted average cost of capital to be used as a discount rate.
Long-lived assets, specifically our tangible and intangible assets other than goodwill, held and used are reviewed for impairment whenever events or changes in circumstances indicate that their net book value may not be entirely recoverable. When such factors and circumstances exist, we compare the projected undiscounted future cash flows associated with the related asset or group of assets over their estimated useful lives against their respective carrying amounts. Impairment, if any, is based on the excess of the carrying amount over the fair value of those assets and is recorded in the period in which the determination was made. Any resulting impairment losses recorded by the Company could have an adverse impact on our results of operations by either decreasing net income or increasing net loss.
On December 2, 2009, in connection with the Annual Impairment Test, the Company performed its annual review for impairment. Based upon the valuation approaches described above, the Company determined that the current carrying value of its goodwill assets has not been impaired.
Goodwill amounted to $9.3 million as of December 31, 2009. The Company did not report any goodwill balances as of December 31, 2008 as a result of the 2008 Impairment Charges. Other net intangible assets amounted to $6.3 million and $3.6 million as of December 31, 2009 and 2008, respectively. During 2009, the Company recorded the following significant adjustments to the carrying value of goodwill and other intangible assets:
| • | Lynx Business Intelligence Consulting, Inc. (“Lynx”) Acquisition: On September 23, 2009, Lynx completed its second and final earnout period. Accordingly, the Company accrued and paid $140 thousand in contingent earnout consideration. The contingent earnout consideration earned by Lynx, which served to increase goodwill, was paid, in cash, during the fourth quarter of 2009. The Lynx acquisition was completed in 2007. Additional details can be found in the Company’s previously filed reports with the SEC. |
| • | Fullscope, Inc. (“Fullscope”) Acquisition: On December 31, 2009, the Company acquired all of the outstanding stock of Fullscope (the “Fullscope Acquisition”) and, in connection with our initial valuation estimates, have recognized $9.2 million in goodwill and $4.5 million in identifiable intangible assets. The identifiable intangible assets will be amortized over periods ranging from 1.5 to 6 years and amortization expense will reflect the economic benefit received by the Company as the assets are consumed. The former stockholders of Fullscope are eligible to receive additional contingent consideration based upon performance-based thresholds, which will be determined, periodically, over an eighteen-month period from the date of acquisition and concluding on June 30, 2011. In connection with our initial recognition of contingent earnout consideration, the Company has increased total purchase price consideration by approximately $1.2 million, which represent our initial fair value estimate of the contingent consideration to be paid to Fullscope. |
| • | Intangible Asset Amortization: During 2009, the Company recorded $1.8 million in amortization expense on its previously recorded identifiable intangible asset balances. |
Purchase Price Allocation. We allocate the purchase price of our acquisitions to the assets and liabilities acquired, including identifiable intangible assets, based on their respective fair values at the date of acquisition. Some of the items, including accounts receivable, property and equipment, other intangible assets, certain accrued liabilities and other reserves
24
Table of Contents
require a degree of management judgment. Certain estimates may change as additional information becomes available. Goodwill is assigned at the enterprise level and is deductible for tax purposes for certain types of acquisitions. Management finalizes the purchase price allocation within twelve months of the acquisition date as certain initial accounting estimates are resolved.
Results of Operations
The following table sets forth, for the periods presented, selected statements of operations data as a percentage of total revenue:
| Year Ended December 31, | |||||||||
| 2009 | 2008 | 2007 | |||||||
| Revenue: |
|||||||||
| Service revenue |
92.1 | % | 92.4 | % | 92.3 | % | |||
| Software revenue |
1.3 | % | 1.5 | % | 3.5 | % | |||
| Reimbursable expenses |
6.6 | % | 6.1 | % | 4.2 | % | |||
| Total revenue |
100.0 | % | 100.0 | % | 100.0 | % | |||
| Cost of revenue: |
|||||||||
| Project and personnel costs |
60.3 | % | 53.7 | % | 51.8 | % | |||
| Software costs |
1.0 | % | 1.2 | % | 3.0 | % | |||
| Reimbursable expenses |
6.6 | % | 6.1 | % | 4.2 | % | |||
| Total cost of revenue |
67.9 | % | 61.0 | % | 59.0 | % | |||
| Gross profit |
32.1 | % | 39.0 | % | 41.0 | % | |||
| Operating expenses: |
|||||||||
| Selling, general and administrative |
36.8 | % | 31.5 | % | 31.2 | % | |||
| Depreciation and amortization |
5.3 | % | 5.1 | % | 3.5 | % | |||
| Impairment charges |
— | % | 65.9 | % | — | % | |||
| Total operating expenses |
42.1 | % | 102.5 | % | 34.7 | % | |||
| Operating (loss) income |
(10.0 | )% | (63.5 | )% | 6.3 | % | |||
| Other income, net |
0.2 | % | 0.7 | % | 2.3 | % | |||
| (Loss) income before taxes |
(9.8 | )% | (62.8 | )% | 8.6 | % | |||
| Tax (benefit) provision |
(2.1 | )% | 1.0 | % | (4.3 | )% | |||
| Net (loss) income |
(7.7 | )% | (63.8 | )% | 12.9 | % | |||
Results for the Year Ended December 31, 2009 Compared to Results for the Year Ended December 31, 2008
On December 31, 2009, the Company announced its acquisition of Fullscope, Inc. The Fullscope Acquisition was completed after the close of business on December 31, 2009, the last day of our fiscal year. Accordingly, our 2009 results and the following discussion related to our comparative 2009 operating results and cash flows do not include any contributions related to the Fullscope Acquisition. Fullscope’s operating results will become part of Edgewater’s operating results beginning on January 1, 2010.
Revenue. Total revenue decreased by $23.7 million, or 32.1%, to $50.1 million for the year ended December 31, 2009 from $73.7 million for the year ended December 31, 2008. Of the $23.7 million decrease in 2009 total revenue, service revenue, excluding software and reimbursable expense revenue, decreased by $22.0 million, or 32.3%, to $46.1 million, as compared to service revenue of $68.1 million in 2008.
The 2009 decline in total revenue and service revenue is reflective of the combined effect of current economic conditions and external IT spending trends, which have lead to 1) a decrease in service revenue attributable to certain of our historically larger accounts within our technology service offerings; 2) the absence of follow-on service revenue following the successful completion of projects during 2008 and 2009 that we have not been able to fully replace due to external IT spending trends; and 3) a slower than anticipated cyclical recovery in our EPM-related service offerings during the last nine months of 2009. Our EPM-related offerings tend to have a slower first quarter followed by stronger subsequent quarters. We believe that in the current economic landscape, companies have reduced capital budgets and have been hesitant to initiate new or additional phases of projects. As a result, these conditions have had an adverse impact on our ability to generate recurring service revenue in 2009, as compared to service revenue generated in 2008.
The comparative year-over-year fluctuations in our service revenue are largely attributable to changes in our customer’s buying habits specific to our classic technology consulting service offerings and our long-term technology maintenance engagements. Traditionally, our classic technology consulting offerings have centered upon long-term system designs and
25
Table of Contents
builds. With the current macroeconomic environment, customer cutbacks in classic IT services have drastically reduced these opportunities in terms of size, scope and timing. This is reflected in our classic IT consulting engagements becoming more concentrated in our newer, shorter-term, specialized projects around a core product set. The loss of classic technology consulting engagements is the primary driver of our revenue decline in the comparative 2009 and 2008 full-year periods. In advance of, and during, this macroeconomic decline, we have taken proactive measures to match the dramatic shift in our revenue mix. We have expanded our service offerings and capabilities, implemented training initiatives and initiated cost and staff reduction initiatives targeted at aligning our operating expenses with our anticipated service revenues.
Due to the pullback in classic IT spending, our EPM-related offerings became the major portion of service revenues during 2009. Historically, EPM engagements were naturally smaller in size and had shorter project cycles than our historic classic technology consulting projects. During 2009, offerings in classic IT tended to be smaller in nature (akin to EPM), which we believe, reflects a combination of the prevailing economic conditions, as well as the shift to new technology and packaging of new offerings. Our EPM business remains strong, despite challenging economic conditions during 2009. Toward the end of 2009, we have observed that engagement sizes appear to be increasing. We believe this may be reflective of increased confidence in the economy and increasing acceptance of our offerings across the board. We have not seen the same secular and economic shifts that are affecting our classic IT consulting engagements, impacting our EPM-related services, nor the recently acquired Fullscope operations. While we cannot estimate when the current economic conditions that are negatively impacting our business will reverse, we believe that we have stabilized the Company and are positioned to capitalize on opportunities as conditions improve. The full impact of the Fullscope Acquisition will be felt in 2010 and should positively impact our service as well as our total service revenue.
Utilization, which is the rate at which we are able to generate revenue from our consultants, amounted to 65.5% in 2009 compared to 73.5% in 2008. We typically target utilization in a range from 78%-82%. This objective is influenced by a variety of factors, including customer demand for IT spending and general economic circumstances. Our 2009 utilization rate is below the historical target range. The drop in our utilization rate below our target rate during 2009 is attributable to the factors described above. To offset this decline in utilization, the Company proactively managed billable consultant headcount to anticipated revenue. By the end of the fourth quarter of 2009, utilization rates had stabilized and in fact, had begun to rise.
Annualized service revenue per billable consultant, as adjusted for utilization, was $348 thousand during 2009, compared to $340 thousand in 2008. This metric reflects the shift in our revenue to a greater mix of high-end EPM consulting services, which services have higher consultant billing rates than our other offerings and remains a solid measure of our performance in a tough environment.
Software revenue, which has been directly attributable to our EPM offering, decreased by $468 thousand, to $664 thousand in 2009, as compared to $1.1 million in 2008. Software sales have not historically been a primary driver of our revenue and are at times generated through the sale of our EPM-related service offerings. Software revenue represented 1.3% and 1.5% of our total revenue in 2009 and 2008, respectively. As a result of our acquisition of Fullscope, we anticipate that software sales will represent more than 10% of our total revenue in 2010. Additionally, our historical gross margins related to software revenue have generally been much lower than those achieved on our consulting services. Fullscope’s software revenue, which will represent the majority of our anticipated software revenue in 2010, has historically been sold at a higher margin than our EPM-related software. We believe that our future gross margins on software revenue will increase above our historically achieved margins as a result of the Fullscope Acquisition.
Generally, we are reimbursed for our out-of-pocket expenses incurred in connection with our customers’ consulting projects. Reimbursed expense revenue decreased approximately $1.2 million in 2009, to approximately $3.3 million, as compared to $4.5 million in 2008. The aggregate amount of reimbursed expenses will fluctuate from year-to-year depending on the location of our customers, the general fluctuation of travel costs, such as airfare, and the number of our projects that require travel.
In 2009, we entered into service arrangements with 63 new customers. Comparatively, in 2008, we secured engagements with 83 new customers. The total number of customers the Company served during 2009 totaled 249, as compared to 308 customers during 2008. This year-over-year change is a result of a general slowdown in IT spending for new projects, delays in proposal decisions for IT service project commitments due to a challenging economic climate and a shift in our revenue mix towards a greater concentration of EPM-related consulting engagements. While Fullscope did not contribute to our service revenue during 2009, it provided services to approximately 80 customers during the year.
Cost of Revenue. Cost of revenue primarily consists of project personnel costs principally related to salaries, payroll taxes, employee benefits and travel expenses for personnel dedicated to customer projects. These costs represent the most significant expense we incur in providing our services. In total, cost of revenue decreased by $11.0 million, or 24.4%, to $34.0 million in 2009, as compared to $45.0 million in 2008. The 2009 decrease in cost of revenue is primarily attributable to comparative year-over-year fluctuations in billable consultant resources.
On a year-over-year basis, the Company’s total number of billable consultants has decreased by 61, to 180 billable consultants at the end of 2009, which excludes any increases in billable consultants attributable to the Fullscope Acquisition, as compared to 241 billable consultants at the end of 2008. The year-over-year decrease in billable consultant headcount is
26
Table of Contents
a result of current year attrition and a targeted reduction in connection with the decrease in legacy-related projects and service revenue. Billable consultant reductions made in conjunction with the decrease in legacy account revenue were initiated by the Company as cost cutting measures targeted at aligning Company resources with demand for our services. As a result of the December 31, 2009 Fullscope Acquisition, we are entering 2010 with a combined total of 242 billable consultant resources. It should be noted that 15 of these billable consultants will be fully dedicated to Fullscope’s business process unit, which is the unit that will provide the services upon which the earnout agreement associated with the Fullscope Acquisition is based. See “Item 8 – Financial Statements and Supplementary Data—Notes to Consolidated Financial Statements—Note 4 – Business Combinations” included elsewhere herein.
As a percentage of total revenue, total cost of revenue was 67.9% and 61.0% in 2009 and 2008, respectively. A significant portion of our cost of revenue is attributable to project and personnel costs. Project and personnel costs represented 60.3% and 53.7% of total revenue during 2009 and 2008, respectively. The 2009 year-over-year increases, as a percentage of total revenue, are attributable to both the comparative full year changes in total revenue and the lower utilization rate for our billable consultants during the current year. Our utilization rates during 2009 have been negatively impacted by excess capacity in connection with the revenue and sales trends described above under “— Revenue.”
Software costs amounted to $496 thousand and $861 thousand during 2009 and 2008, respectively. Software costs are expected to fluctuate between quarters depending on our customers demand for EPM-related software. As a result of the Fullscope Acquisition, we anticipate that software costs, as a result of the anticipated increase in related software revenue, will increase in 2010 on a total dollar basis and as a percentage of total cost of revenue.
Reimbursable expenses, which increased as a percent of revenue, to 6.6% in 2009, as compared to 6.1% in 2008, were a direct result of the Company’s increased travel-related expenses incurred during the comparative years.
Gross Profit. Gross profit decreased by $12.7 million, or 44.1%, to $16.1 million, as compared to $28.8 million in 2008. Gross profit, as a percentage of total revenue (which we generally refer to as gross margin) decreased to 32.1%, as compared to 39.0% in 2008.
The comparative fluctuation in gross profit is a direct result of the current year decline in revenue, which was partially offset by the current year reductions in billable consultant resources. The 2009 decline in gross margin is primarily attributable to the current year change in billable consultant utilization rates and pricing pressure as a result of increased competition. The Company’s billable consultant utilization rate was 65.5% in 2009, as compared to 73.5% in 2008. The year-over-year variation is a direct result of an increase in excess capacity resulting from the reduction in legacy account service revenues and current economic conditions. Each of the current year factors impacting current year gross profit and gross margin are described in further detail above under “—Revenue” and “—Cost of Revenue.”
Historically, the Company has targeted and operated at utilization rates ranging between 78% and 82%. Our 2009 utilization rate was 65.5%, below our historical and targeted utilization ranges. The billable consultant headcount reductions initiated by the Company during 2009, were made with the intention of reducing excess capacity and improving consultant utilization. It is anticipated that the 2009 reductions in billable consultant headcount will serve to increase 2010’s utilization rate. However, no assurances can be given that the efficiency measures implemented by the Company will generate the intended results.
Selling, General and Administrative Expense (“SG&A”). SG&A expenses decreased 20.7% to $18.4 million, as compared to SG&A expenses of $23.2 million in 2008. The comparative improvement, on a dollar basis, in SG&A expenses during 2009 is the combined result of (i) personnel reductions initiated in the latter part of 2008, which have served to reduce operations-related salary expense; (ii) reduced 2009 commissions and bonus expense as a result of the decrease in comparative 2009 operating performance; and (iii) a reduction in other SG&A expenses such as travel, training, marketing, recruiting and occupancy expenses resulting from the Company’s cost cutting initiatives to better align its operating cost base with its revenues.
SG&A expense, as a percentage of revenue, was 36.8% for the year ended December 31, 2009, as compared to 31.5% for the year ended December 31, 2008. The Company continuously monitors its SG&A costs, with the goal of achieving greater economies of scale over the long term. The current year increase in the SG&A expenses, as a percentage of revenue, is due to the year-over-year decline in revenue and the timing of our cost reduction initiatives. We anticipate, in connection with the Fullscope Acquisition, that SG&A expenses, as a percentage of revenue, will be more consistent with our historical levels in 2010.
Depreciation and Amortization Expense. Depreciation and amortization expense decreased by $1.1 million, or 28.6%, to $2.7 million, as compared to $3.8 million in 2008. The current year change is primarily related to reduced amortization expense and, to a lesser extent, a reduction in current year depreciation expense. Amortization expense decreased by $938 thousand, or 34.4%, to $1.8 million in 2009, as compared to $2.7 million in 2008. The current year change is a combination of the 2008 Impairment Charges and certain other identified intangible assets associated with acquisitions consummated prior to 2009 becoming fully amortized during the current year.
27
Table of Contents
Impairment of Goodwill and Other Intangible Assets. In 2008, the Company, as a result of the 2008 Impairment Charges, recorded $48.6 million in impairment charges against the carrying value of its goodwill and other intangible assets. In 2009, in connection with the Annual Impairment Test, the Company performed its annual review for impairment. Based upon the valuation approaches described above, the Company determined that the current carrying value of its goodwill assets has not been impaired.
Operating Loss. The Company’s comparative operating loss improved by $41.8 million, to $5.0 million, as compared to $46.8 million in 2008. The current year improvement in operating loss is primarily attributable to the absence of the 2008 Impairment Charges and to a lesser extent, the other comparative year-over-year changes discussed above.
Other Income, Net. We earned interest income of $156 thousand, as compared to net interest income of $503 thousand in 2008. The current year change in interest income is attributable to reduced average yields on our investments throughout 2009, as compared to those achieved throughout 2008. Average maturity and yield rates on marketable security instruments as of December 31, 2009 were 106 days and 0.5%, respectively, as compared to 168 days and 2.3% in 2008, respectively.
Income Tax (Benefit) Provision. The Company recorded a tax benefit of $(1.0) million for the year ended December 31, 2009, as compared to a tax provision of $0.7 million in 2008. The Company’s effective income tax rate, prior to the consideration of changes in the valuation allowance applied against our deferred tax assets and other items impacting our income tax provision, was (21.5)% and 1.5% in 2009 and 2008, respectively. The reported income tax (benefit) provision amounts in both 2009 and 2008 are impacted by changes in our deferred tax assets and, in the case of 2008 activity, related to changes in our deferred tax asset valuation allowance.
Items impacting our 2009 income tax benefit included provisions for foreign income taxes and changes in carrying value of our deferred tax assets. During 2009, we decreased the carrying value of deferred tax assets attributable to timing differences, in connection with a decrease in the effective income tax rates. Our comparative effective income tax rate, reflective of both federal and state income taxes, decreased as a result of the reduction in our consolidated state income tax rate. This rate change is reflective of our current year modification in filing positions in certain states, which enabled us to achieve a lower, consolidated state income tax rate. We anticipate that this rate will be sustainable in future tax periods. As a result of this decrease in our consolidated effective income tax rate, we decreased the carrying value of our deferred tax attributes, and accordingly increased income tax expense, by $929 thousand.
The significant changes impacting our reported 2008 income tax provision related to the establishment of deferred tax assets in connection with the 2008 Impairment Charges and a $9.6 million increase to the valuation allowance provided against the deferred tax assets. Each of these items are more fully described elsewhere herein, including “Item 7—Management’s Discussion and Analysis of Financial Condition and Results of Operations – Goodwill, Other Intangible Assets and Impairment of Long-Lived Assets” and “Item 7—Management’s Discussion and Analysis of Financial Condition and Results of Operations – Income Taxes and Valuation of Deferred Tax Assets.”
Net Loss. Net loss increased $43.2 million, or 91.8%, to $(3.8) million, as compared to $(47.0) million in 2008. The current year improvement in reported net loss is a direct result of the absence, in 2009, of the 2008 Impairment Charges. To a lesser extent, 2009 net loss is also impacted by the decline in comparative service revenue, lower billable consultant utilization rate and associated gross margin, the reduction in comparative SG&A expenses and the tax benefit recorded by the Company. Each of these items is explained in further detail above.
Results for the Year Ended December 31, 2008 Compared to Results for the Year Ended December 31, 2007
Revenue. Total revenue increased by $5.2 million, or 7.7%, to $73.7 million for the year ended December 31, 2008 from $68.5 million for the year ended December 31, 2007.
Of the $5.2 million increase in 2008 total revenue, service revenue, excluding software and reimbursable expense revenue, increased by $4.9 million, or 7.8%, to $68.1 million, as compared to service revenue of $63.2 million in 2007. The 2008 increase in service revenue was primarily attributable to the full year contributions of Alecian, Lynx and Vertical Pitch (the “2007 Acquisitions”), which was offset by a reduction in service revenue generated from certain legacy accounts within our technology service offerings.
During 2008, service revenue from our top five largest customers amounted to $17.9 million, or 26.2% of our total service revenue. In 2007, service revenue generated from our top five largest customers amounted to $28.5 million, or 45.1% of our total service revenue. Our top five largest customers have historically been comprised of legacy accounts associated with our core business service offerings and include services such as infrastructure support, custom software development and systems integration. We believe that the current year reduction in the services that we have historically provided to our larger legacy customers is directly related to, and being impacted by, the current economic environment, which is placing increased pressure on our legacy customers to either reduce or delay IT-related expenditures for services typically provided by our Company.
28
Table of Contents
Software revenue, which is directly attributable to our EPM offering, decreased by $1.3 million, to $1.1 million in 2008, as compared to $2.4 million in 2007. Software sales are not a primary driver of our revenue and are at times generated through the sale of our EPM-related service offerings. As such, our ability to generate revenue from such software sales is inherently unpredictable. Gross profit margins are generally much lower on software sales than on consulting services.
Generally, we are reimbursed for our out-of-pocket expenses incurred in connection with our customer’s consulting projects. Reimbursed expense revenue increased approximately $1.6 million in 2008, to approximately $4.5 million, as compared to $2.9 million in 2007. The aggregate amount of reimbursed expenses will fluctuate from year-to-year depending on the location of our customers, the general fluctuation of travel costs, such as airfare, and the number of our projects that require travel.
Our annualized revenue per billable consultant, adjusted for utilization, increased 13.3%, to $340 thousand in 2008, as compared to $300 thousand in 2007. The improvement in this metric is due to full year impact of the 2007 Acquisitions. The 2007 Acquisitions were primarily related to our EPM service offerings, which have higher average consultant billing rates than those traditionally experienced in our technology service offerings. During 2008, the Company increased the number of customers it served to 308, as compared to 265 customers in 2007.
Cost of Revenue. Cost of revenue primarily consists of project personnel costs principally related to salaries, payroll taxes, employee benefits and travel expenses for personnel dedicated to customer projects. These costs represent the most significant expense we incur in providing our services. In total, cost of revenue increased by $4.6 million, or 11.3%, to $45.0 million in 2008, as compared to $40.4 million in 2007. The 2008 increase in cost of revenue is primarily attributable to the full year impact of adding 49 billable consultants in connection with the 2007 acquisitions.
On a year-over-year basis, the Company’s total number of billable consultants has decreased by 61, to 241 billable consultants at the end of 2008, as compared to 302 billable consultants at the end of 2007. The year-over-year decrease in billable consultant headcount is a result of current year attrition and a targeted reduction in connection with the decrease in legacy-related projects and service revenue. Billable consultant reductions made in conjunction with the decrease in legacy account revenue were initiated by the Company as cost cutting measures targeted at aligning Company resources with demand for our services. Despite the year-over-year decrease in billable consultant headcount, the current year reductions did not significantly reduce total comparative 2008 wage-related expenses as these initiatives were enacted primarily during the fourth quarter of 2008.
During the first quarter of 2009, as a result of the cancellation of certain projects related to our legacy accounts, the Company enacted additional cost cutting measures, reducing our billable consultant headcount by 13 consultants. The additional reductions in consultant headcount are expected to improve our billable consultant utilization rates and to reduce wage-related cost of revenue, by approximately $1.1 million, in 2009.
Reimbursable expenses, which increased by $1.6 million, to $4.5 million, as compared to $2.9 million in 2007, were a direct result of the Company’s increased customer base and associated travel-related expenses incurred during the comparative years.
Gross Profit. Gross profit increased by $0.7 million, or 2.5%, to $28.8 million, as compared to $28.1 million in 2007. Gross profit, as a percentage of total revenue, decreased to 39.0%, as compared to 41.0% in 2007.
Despite the current year $4.9 million increase in service revenue, the comparative 2008 and 2007 gross profit, on an absolute dollar basis, remained consistent, while the gross profit margin decreased by 2.0%. Both the absence of current year growth in gross profit and the reduction in the gross profit margin is primarily attributable to a decrease in billable consultant utilization rates. The Company’s billable consultant utilization rate was 73.5% in 2008, as compared to 80.1% in 2007. The year-over-year decrease is a direct result of an increase in excess capacity resulting from the reduction in legacy account service revenues. The billable consultant headcount reductions initiated by the Company during the fourth quarter of 2008 were made with the intention of reducing excess capacity.
Historically, the Company has targeted and operated at utilization rates ranging between 78% and 82%. Our 2008 utilization rate was 73.5%, below our recent and targeted utilization ranges.
Selling, General and Administrative Expense (“SG&A”). SG&A expenses increased 8.9% to $23.2 million, as compared to SG&A expenses of $21.3 million in 2007. The increase in SG&A expense during 2008 was primarily due to increases in sales and management personnel related to our EPM service offerings, comparatively higher sales commissions due to revenue growth in our non-legacy accounts and an increase in training expenses as we expanded the skill sets of our billable consultants in order to meet the demands of the changing IT marketplace. The current year increases in SG&A expenses were mitigated by comparative decreases in bonus accruals related to our 2008 Performance-Based Bonus Plan, recruiting costs and marketing expenses.
SG&A expense, as a percentage of revenue, was 31.5% for the year ended December 31, 2008, which remains consistent with 31.2% for the year ended December 31, 2007. There was only a modest increase in SG&A expense, as a percentage of revenue, in the current year. The Company continues to monitor its SG&A costs, with the goal of achieving greater economies of scale over the long term.
29
Table of Contents
Depreciation and Amortization Expense. Depreciation and amortization expense increased by $1.4 million, or 54.1%, to $3.8 million, as compared to $2.4 million in 2007. The current year increase is primarily related to amortization expense, as depreciation expense of $1.0 million was consistent with 2007. Amortization expense increased by $1.3 million, or 94.1%, to $2.7 million in 2008, as compared to $1.4 million in 2007. The current year increase is directly related to the intangible assets identified in connection with the 2007 Acquisitions.
Impairment of Goodwill and Other Intangible Assets. As more fully described under “Item 7—Management’s Discussion and Analysis of Financial Condition and Results of Operations – Goodwill, Other Intangible Assets and Impairment of Long-Lived Assets,” the Company, in connection with an interim review for impairment in June 2008 and subsequently in connection with our Annual Impairment Review, recorded $48.6 million in impairment charges related to the carrying value of its goodwill and intangible assets.
Operating (Loss) Income. The Company’s comparative operating income decreased by $51.1 million, to a loss of $(46.8) million, as compared to operating income of $4.3 million in 2007. The current year operating loss is primarily attributable to the 2008 Impairment Charges and, to a lesser extent, the other comparative year-over-year changes discussed above.
Other Income, Net. We earned net interest income of $0.5 million, as compared to net interest income of $1.6 million in 2007. The current year decrease in interest income is attributable to reduced average yields on our investments throughout 2008, as compared to those achieved throughout 2007. Average maturity and yield rates as of December 31, 2008 were approximately 168 days and 2.3%, respectively, as compared to 168 days and 5.0% in 2007.
Income Tax Provision (Benefit). The Company recorded a tax provision of $0.7 million for the year ended December 31, 2008, as compared to a tax benefit of $(2.9) million in 2007. The reported income tax provision (benefit) amounts in both 2008 and 2007 are significantly impacted by changes in our deferred tax assets and activity related to our deferred tax asset valuation allowance.
The current year income tax-related changes are more fully described elsewhere herein, including “Item 7—Management’s Discussion and Analysis of Financial Condition and Results of Operations – Overview,” “Goodwill, Other Intangible Assets and Impairment of Long-Lived Assets” and “Income Taxes and Valuation of Deferred Tax Assets.”
Net (Loss) Income. Net income decreased $55.8 million, or 633.7%, to $(47.0) million, as compared to $8.8 million in 2007. The current year decrease in net income is primarily due to the cumulative effect of the 2008 Impairment Charges and the changes effecting the current year income tax provision. Each of these items is discussed above.
Liquidity and Capital Resources
The following table summarizes our cash flow activities for the periods indicated:
| Year Ended December 31 | ||||||||||||
| 2009 | 2008 | 2007 | ||||||||||
| (In thousands) | ||||||||||||
| Cash flows (used in) provided by: |
||||||||||||
| Operating activities |
$ | (243 | ) | $ | 7,742 | $ | 9,242 | |||||
| Investing activities |
(7,123 | ) | 2,556 | (14,361 | ) | |||||||
| Financing activities |
(363 | ) | (4,301 | ) | 3,480 | |||||||
| Discontinued operating activities |
— | (8 | ) | (565 | ) | |||||||
| Total cash (used) provided during the year |
$ | (7,729 | ) | $ | 5,989 | $ | (2,204 | ) | ||||
As of December 31, 2009, we had cash, cash equivalents and marketable securities of $12.7 million, an $11.9 million decrease from the December 31, 2008 balance of $24.6 million. Working capital, which is defined as current assets less current liabilities, decreased $13.6 million, to $15.7 million, as of December 31, 2009, as compared to $29.3 million as of December 31, 2008. The $11.9 million decrease in cash, cash equivalents and marketable securities is primarily attributable to the $10.9 million in net cash paid in connection with the Fullscope Acquisition, the $3.8 million net loss for 2009, bonus and commission payments made under the Company’s 2008 performance-based bonus plans, $0.5 million in current year repurchases of our common stock, $215 thousand in payment on our capital lease obligations and $0.1 million in contingent earnout consideration paid to Lynx in connection with the completion of their second and final earnout period. These outflows were partially offset by collections of accounts receivable, $4.0 million in net redemptions of marketable securities and $0.4 million in proceeds from the employee stock purchase plan.
30
Table of Contents
Our primary historical sources of funds have been from operations and the proceeds from equity offerings, as well as sales of businesses in fiscal years 2000 and 2001. Our principal historical uses of cash have been to fund working capital requirements, capital expenditures and acquisitions. We generally pay our employees bi-weekly for their services, while receiving payments from customers 30 to 60 days from the date of the invoice.
Net cash (used in) provided by operating activities was $(243) thousand in 2009, as compared to net cash provided by operating activities of $7.7 million in 2008. The primary components impacting our operating cash flow during 2009 included cash outflows associated with a reported net loss of $3.8 million, a net decrease of $1.3 million in accrued payroll and related wage accruals primarily associated with a decrease in current year bonuses to be paid in connection with the Company’s 2009 Performance-Based Bonus Plans, a $1.0 million decrease in accounts payable and accrued expenses and an increase of $819 thousand in prepaid expenses and other current assets as a result of overpayments of federal, state and foreign income taxes. These cash outflows were partially offset by positive cash flows from a $2.9 million decrease in accounts receivable plus non-cash charges such as depreciation and amortization, stock-based compensation and amortization of marketable securities premiums totaling $4.0 million.
Net cash provided by operating activities was $7.7 million in 2008. Significant changes in operating accounts included a $4.0 million decrease in accounts receivable, depreciation and amortization of $3.8 million and 2008 income from continuing operations of $1.6 million, adjusted to exclude the effects of the non-cash 2008 Impairment Charges. The cash flow provided by the above items was partially offset by a $0.5 million decrease in accounts payable and accrued expenses, a decrease of $2.0 million in accrued bonuses in connection with a decrease in current year bonuses to be paid in connection with the Company’s 2008 Performance-Based Bonus Plans and a $2.9 million decrease in accrued payroll and related liabilities.
Net cash provided by operating activities was $9.2 million in 2007. Significant changes in operating accounts included the 2007 net income from continuing operations of $8.8 million, depreciation and amortization of $2.4 million, $1.5 million in current year share-based compensation and a $1.5 million increase in accrued payroll and related liabilities in connection with the expected payouts to be made under the Company’s 2007 performance-based bonus plan. The cash flow provided by the above items was partially offset by an increase in accounts receivable of $1.1 million and an increase in the carrying value of our net deferred tax assets of $3.7 million related to the current year favorable deferred tax benefits recognized by the Company in connection with a review of the future realizability of our net operating loss carryforwards.
For the year ended December 31, 2009, we used $7.1 million in cash associated with investing activities. Comparatively, we generated cash flow from investing activities of $2.6 million in 2008. Current year net uses of cash related to $10.9 million in net cash paid in connection with our December 31, 2009 acquisition of Fullscope, Inc. and $140 thousand in contingent earnout consideration paid to Lynx in connection with their completion of a second and final earnout period. These outflows were partially offset by $4.0 million in net redemptions of marketable securities.
All capital expenditures are discretionary as the Company currently has no long-term commitments for capital expenditures.
Net cash provided by investing activities was $2.6 million in 2008. Current year inflows of cash related to $4.1 million in current year net redemptions of marketable securities. These inflows were offset by $1.2 million in contingent earnout consideration payments made in connection with the 2007 Acquisitions and $0.3 million of capital expenditures.
Net cash used in investing activities was $14.4 million in 2007. Net outflows relate to the $19.6 million cash portion of the purchase price for the 2007 Acquisitions, $0.7 million contingent earnout consideration payment made to the former stockholder of NDS in connection with the successful completion of NDS’ first earnout period and capital expenditures of $2.3 million. These outflows of cash were offset by $8.2 million in proceeds from net redemptions of marketable securities.
Net cash (used in) provided by financing activities was $(363) thousand, $(4.3) million and $3.5 million in 2009, 2008, and 2007, respectively. Components of cash used in financing activities during 2009 included $579 thousand related to repurchases of the Company’s common stock and $215 thousand in payment made under capital lease obligations. These outflows were offset by $431 in cash received from our employees related to our Employee Stock Purchase Plan. Cash used in financing activities during 2008 was primarily attributable to repurchases of the Company’s common stock, which totaled $5.1 million. These purchases were offset by net proceeds from our Employee Stock Purchase Plan and exercises of stock options. Cash provided by financing activities during 2007 was primarily representative of proceeds received by the Company in connection with purchases under our Employee Stock Purchase Plan and through the exercise of stock options.
Net cash used in discontinued operations was $8 thousand and $565 thousand in 2008 and 2007, respectively. These amounts represent payments made by the Company related to its discontinued operations accrual. The Company, in 2000-2001 made a strategic decision to undergo a comprehensive restructuring program to refocus future growth initiatives in its systems integration and consulting business and as a result, committed to divestures in each of its staffing businesses. Payments in each of the presented fiscal years represent payments related to the discontinuance of the operations, which were accrued for in previous years. No payments were made by the Company against accruals associated with previously discontinued operations during 2009.
31
Table of Contents
As a result of the above, our combined cash and cash equivalents (decreased) increased by $(7.7) million, $6.0 million and $(2.2) million in 2009, 2008 and 2007, respectively. The aggregate of our cash, cash equivalents and marketable securities was $12.7 million, $24.6 million and $22.8 million, as of December 31, 2009, 2008 and 2007, respectively.
We have entered into various contingent earnout agreements in connection with the acquisitions we have completed. Earnout periods, related performance measurements and the value of the contingent earnout consideration to be earned are specific to each acquisition. Contingent earnout consideration paid by the Company has historically been paid in either cash or a combination of cash and stock.
During 2009, Lynx completed its second and final earnout period. As a result, the Company accrued and paid $140 thousand in contingent earnout consideration, in cash, to Lynx. The contingent earnout consideration paid by the Company was reported as an increase to goodwill in the Company’s consolidated balance sheet.
On December 31, 2009, Edgewater acquired all of the outstanding stock of Fullscope, Inc. As provided for under the Agreement and Plan of Merger and Reorganization (the “Purchase Agreement”), Fullscope’s stockholders are eligible to receive additional contingent consideration based upon performance-based thresholds, which will be determined, periodically, over an eighteen-month period from the date of acquisition and concluding on June 30, 2011. In accordance with ASC Subtopic 805-30-25, the Company has increased total purchase price consideration by approximately $1.2 million, which represents our initial fair value estimate of the contingent consideration to be paid to Fullscope. See “Item 8 – Financial Statements and Supplementary Data—Notes to Consolidated Financial Statements—Note 4 – Business Combinations.”
We believe that our current cash balances and cash flows from operations will be sufficient to fund our short-term operating and liquidity requirements, at least through 2010, and the long-term operating and liquidity requirements for our existing operations. We periodically reassess the adequacy of our liquidity position, taking into consideration current and anticipated operating cash flow, anticipated capital expenditures, business combinations, possible stockholder distributions and public or private offerings of debt or equity securities. The pace at which we will either generate or consume cash will be dependent upon future operations and the level of demand for our services on an ongoing basis. See “Item 1—Business, Potential Future Strategies, Transactions and Changes.”
Off Balance Sheet Arrangements, Contractual Obligations and Contingent Liabilities and Commitments
We lease office space under noncancellable operating lease arrangements through 2016. Rent expense, including amounts paid to related parties for discontinued operations, was approximately $1.7 million, $1.9 million and $2.3 million for the years ended December 31, 2009, 2008 and 2007, respectively.
We have lease financing arrangements (the “Capital Lease Arrangements”) with a bank related to certain property and equipment, as further described in “Item 8 – Financial Statements and Supplementary Data—Notes to Consolidated Financial Statements—Note 6 – Property and Equipment” included elsewhere herein. Payments under the Capital Lease Arrangements are to be made over a period of 48 to 60 months and have a blended interest rate of 6.03% per annum on the outstanding principal balances. As of December 31, 2009 and 2008, our outstanding obligations under the Capital Lease Arrangements totaled $420 thousand and $635 thousand, respectively. During the year ended December 31, 2009, 2008 and 2007, the Company made payments of principal and interest totaling $251 thousand, $251 thousand and $185 thousand, respectively under the Capital Lease Arrangements.
Annual future minimum payments required under capital and operating leases that have an initial or remaining noncancellable lease term in excess of one year and existing purchase obligations are as follows:
| Payments Due By Period | |||||||||||||||
| Contractual Obligations |
Less Than 1 Year |
1 – 3 Years |
3 – 5 Years |
Greater Than 5 Years |
Total | ||||||||||
| (Amounts in thousands) | |||||||||||||||
| Capital leases (1) |
$ | 243 | $ | 211 | $ | — | $ | — | $ | 454 | |||||
| Operating leases |
1,568 | 2,899 | 2,589 | 2,330 | 9,386 | ||||||||||
| Total (2) |
$ | 1,811 | $ | 3,110 | $ | 2,589 | $ | 2,330 | $ | 9,840 | |||||
| (1) | - | Presented future payments on capital lease obligations represent payments of principal and related interest. | ||
| (2) | - | Excluded from the above table is $282 thousand of gross liability for uncertain tax positions recorded in accounts payable and accrued liabilities in our consolidated balance sheet at December 31, 2009. We are not able to reasonably estimate in which future periods these amounts will ultimately be settled. See “Item 8 – Financial Statements and Supplementary Data—Notes to Consolidated Financial Statements—Note 8 – Income Taxes” included elsewhere herein. |
32
Table of Contents
Recently Issued Accounting Pronouncements
Refer to “Item 8 – Financial Statements and Supplementary Data—Notes to Consolidated Financial Statements—Note 2 – Summary of Significant Accounting Policies” included elsewhere herein for a discussion of recent accounting changes.
| ITEM 7A. | QUANTITATIVE AND QUALITATIVE DISCLOSURES ABOUT MARKET RISK |
Our primary financial instruments include investments in money market funds, short-term municipal bonds, commercial paper and U.S. government securities that are sensitive to market risks and interest rates. The investment portfolio is used to preserve our capital until it is required to fund operations, strategic acquisitions or distributions to stockholders. None of our market-risk sensitive instruments are held for trading purposes. We did not purchase derivative financial instruments in 2009 or 2008. Should interest rates on the Company’s investments fluctuate by 10% the impact would not be material to the financial condition, results of operations or cash flows.
For the last three years, the impact of inflation and changing prices has not been material on revenues or income from continuing operations.
33
Table of Contents
| ITEM 8. | FINANCIAL STATEMENTS AND SUPPLEMENTARY DATA |
(a) Consolidated Financial Statements:
The following consolidated financial statements are included in this Form 10-K:
34
Table of Contents
REPORT OF INDEPENDENT REGISTERED PUBLIC ACCOUNTING FIRM
To the Board of Directors and Stockholders of Edgewater Technology, Inc.
Wakefield, Massachusetts:
We have audited the accompanying consolidated balance sheets of Edgewater Technology, Inc. and subsidiaries (the “Company”) as of December 31, 2009 and 2008, and the related consolidated statements of operations, stockholders’ equity, and cash flows for each of the three years in the period ended December 31, 2009. These financial statements are the responsibility of the Company’s management. Our responsibility is to express an opinion on these financial statements based on our audits.
We conducted our audits in accordance with the standards of the Public Company Accounting Oversight Board (United States). Those standards require that we plan and perform the audit to obtain reasonable assurance about whether the financial statements are free of material misstatement. An audit includes examining, on a test basis, evidence supporting the amounts and disclosures in the financial statements. An audit also includes assessing the accounting principles used and significant estimates made by management, as well as evaluating the overall financial statement presentation. We believe that our audits provide a reasonable basis for our opinion.
In our opinion, such consolidated financial statements present fairly, in all material respects, the financial position of Edgewater Technology, Inc. and subsidiaries as of December 31, 2009 and 2008, and the results of their operations and their cash flows for each of the three years in the period ended December 31, 2009, in conformity with accounting principles generally accepted in the United States of America.
As discussed in Note 4 to the consolidated financial statements, the Company changed its method of accounting for business combinations on January 1, 2009.
We have also audited, in accordance with the standards of the Public Company Accounting Oversight Board (United States), the Company’s internal control over financial reporting as of December 31, 2009, based on the criteria established in Internal Control—Integrated Framework issued by the Committee of Sponsoring Organizations of the Treadway Commission and our report dated March 15, 2010 expressed an unqualified opinion on the Company’s internal control over financial reporting.
/s/ Deloitte & Touche LLP
Boston, Massachusetts
March 15, 2010
35
Table of Contents
Consolidated Balance Sheets
(In Thousands, Except Per Share Data)
| December 31, | ||||||||
| 2009 | 2008 | |||||||
| ASSETS | ||||||||
| Current assets: |
||||||||
| Cash and cash equivalents |
$ | 5,889 | $ | 13,618 | ||||
| Restricted cash |
702 | — | ||||||
| Marketable securities |
6,772 | 10,948 | ||||||
| Accounts receivable, net of allowance of $490 and $437, respectively |
18,043 | 11,683 | ||||||
| Deferred income taxes, net |
348 | 942 | ||||||
| Prepaid expenses and other current assets |
1,645 | 782 | ||||||
| Total current assets |
33,399 | 37,973 | ||||||
| Property and equipment, net |
3,297 | 4,013 | ||||||
| Intangible assets, net |
6,302 | 3,592 | ||||||
| Goodwill |
9,280 | — | ||||||
| Deferred income taxes, net |
20,760 | 21,451 | ||||||
| Other assets |
93 | 41 | ||||||
| Total assets |
$ | 73,131 | $ | 67,070 | ||||
| LIABILITIES AND STOCKHOLDERS’ EQUITY | ||||||||
| Current liabilities: |
||||||||
| Accounts payable and accrued liabilities |
$ | 11,192 | $ | 3,692 | ||||
| Accrued bonuses |
1,817 | 1,810 | ||||||
| Accrued payroll and related liabilities |
1,238 | 600 | ||||||
| Accrued commissions |
971 | 1,483 | ||||||
| Deferred revenue and other liabilities |
2,270 | 892 | ||||||
| Capital lease obligations, current |
220 | 215 | ||||||
| Total current liabilities |
17,708 | 8,692 | ||||||
| Other liabilities |
107 | — | ||||||
| Capital lease obligations |
200 | 420 | ||||||
| Total liabilities |
18,015 | 9,112 | ||||||
| Commitments and contingencies (Note 14) |
||||||||
| Stockholders’ equity: |
||||||||
| Preferred stock, $0.01 par value; 2,000 shares authorized, no shares issued or outstanding |
— | — | ||||||
| Common stock, $0.01 par value; 48,000 shares authorized, 29,736 shares issued and 12,132 and 12,162 shares outstanding as of December 31, 2009 and 2008, respectively |
297 | 297 | ||||||
| Paid-in capital |
213,531 | 213,354 | ||||||
| Treasury stock, at cost, 17,604 and 17,574 shares at December 31, 2009 and 2008, respectively |
(125,568 | ) | (126,382 | ) | ||||
| Accumulated other comprehensive income |
6 | — | ||||||
| Retained deficit |
(33,150 | ) | (29,311 | ) | ||||
| Total stockholders’ equity |
55,116 | 57,958 | ||||||
| Total liabilities and stockholders’ equity |
$ | 73,131 | $ | 67,070 | ||||
See notes to consolidated financial statements.
36
Table of Contents
CONSOLIDATED STATEMENTS OF OPERATIONS
(In Thousands, Except Per Share Data)
| Year Ended December 31, | ||||||||||||
| 2009 | 2008 | 2007 | ||||||||||
| Revenue: |
||||||||||||
| Service revenue |
$ | 46,120 | $ | 68,125 | $ | 63,188 | ||||||
| Software revenue |
664 | 1,132 | 2,383 | |||||||||
| Reimbursable expenses |
3,301 | 4,486 | 2,919 | |||||||||
| Total revenue |
50,085 | 73,743 | 68,490 | |||||||||
| Cost of revenue: |
||||||||||||
| Project and personnel costs ** |
30,190 | 39,608 | 35,443 | |||||||||
| Software costs |
496 | 861 | 2,030 | |||||||||
| Reimbursable expenses |
3,301 | 4,486 | 2,919 | |||||||||
| Total cost of revenue |
33,987 | 44,955 | 40,392 | |||||||||
| Gross profit |
16,098 | 28,788 | 28,098 | |||||||||
| Operating expenses: |
||||||||||||
| Selling, general and administrative ** |
18,412 | 23,232 | 21,335 | |||||||||
| Depreciation and amortization |
2,694 | 3,771 | 2,448 | |||||||||
| Impairment of goodwill and other intangible assets |
— | 48,594 | — | |||||||||
| Total operating expenses |
21,106 | 75,597 | 23,783 | |||||||||
| Operating (loss) income |
(5,008 | ) | (46,809 | ) | 4,315 | |||||||
| Other income, net |
122 | 503 | 1,599 | |||||||||
| (Loss) income before income taxes |
(4,886 | ) | (46,306 | ) | 5,914 | |||||||
| Tax (benefit) provision |
(1,047 | ) | 712 | (2,896 | ) | |||||||
| Net (loss) income |
$ | (3,839 | ) | $ | (47,018 | ) | $ | 8,810 | ||||
| (Loss) earnings per share: |
||||||||||||
| Basic net (loss) earnings per share of common stock |
$ | (0.32 | ) | $ | (3.66 | ) | $ | 0.75 | ||||
| Diluted net (loss) earnings per share of common stock |
$ | (0.32 | ) | $ | (3.66 | ) | $ | 0.66 | ||||
| Shares used in computing basic net (loss) income per share of common stock |
12,067 | 12,861 | 11,793 | |||||||||
| Shares used in computing diluted net (loss) income per share of common stock |
12,067 | 12,861 | 13,358 | |||||||||
|
** - The following amounts of share-based compensation expense are included in each of the respective expense categories reported above: |
||||||||||||
| Project and personnel costs |
$ | 269 | $ | 395 | $ | 378 | ||||||
| Selling, general and administrative |
870 | 1,160 | 1,101 | |||||||||
| Total share-based compensation |
$ | 1,139 | $ | 1,555 | $ | 1,479 | ||||||
See notes to consolidated financial statements.
37
Table of Contents
CONSOLIDATED STATEMENTS OF STOCKHOLDERS’ EQUITY
(In Thousands)
| Common Stock | Paid-in Capital |
Treasury Stock | Accumulated Other Comprehensive Income |
Retained Earnings/ (Deficit) |
Total Stockholders’ Equity |
Comprehensive Income |
|||||||||||||||||||||||||
| Shares | Amount | Shares | Amount | ||||||||||||||||||||||||||||
| BALANCE, January 1, 2007 |
29,736 | $ | 297 | $ | 213,979 | (18,214 | ) | $ | (136,923 | ) | $ | — | $ | 8,897 | $ | 86,250 | |||||||||||||||
| Issuance of common stock related to employee stock plans |
— | — | (182 | ) | 85 | 678 | — | — | 496 | ||||||||||||||||||||||
| Issuance of restricted stock awards |
— | — | (302 | ) | 38 | 302 | — | — | — | ||||||||||||||||||||||
| Issuance of common stock related to acquisition(s) |
— | — | (756 | ) | 1,131 | 9,051 | — | — | 8,295 | ||||||||||||||||||||||
| Stock option exercises |
— | — | (1,722 | ) | 649 | 5,195 | — | — | 3,473 | ||||||||||||||||||||||
| Shares surrendered in connection with option exercises and taxes |
— | — | — | (128 | ) | (1,277 | ) | — | — | (1,277 | ) | ||||||||||||||||||||
| Share-based compensation expense |
— | — | 1,479 | — | — | — | — | 1,479 | |||||||||||||||||||||||
| Net income |
— | — | — | — | — | — | 8,810 | 8,810 | $ | 8,810 | |||||||||||||||||||||
| BALANCE, December 31, 2007 |
29,736 | 297 | 212,496 | (16,439 | ) | (122,974 | ) | — | 17,707 | 107,526 | $ | 8,810 | |||||||||||||||||||
| Issuance of common stock related to employee stock plans |
— | — | (369 | ) | 111 | 887 | — | — | 518 | ||||||||||||||||||||||
| Forfeitures of restricted stock awards |
— | — | 89 | (11 | ) | (89 | ) | — | — | — | |||||||||||||||||||||
| Stock option exercises |
— | — | (417 | ) | 118 | 945 | — | — | 528 | ||||||||||||||||||||||
| Repurchases of common stock |
— | — | — | (1,344 | ) | (5,105 | ) | — | — | (5,105 | ) | ||||||||||||||||||||
| Shares surrendered in connection with option exercise |
— | — | — | (9 | ) | (46 | ) | — | — | (46 | ) | ||||||||||||||||||||
| Share-based compensation expense |
— | — | 1,555 | — | — | — | — | 1,555 | |||||||||||||||||||||||
| Net loss |
— | — | — | — | — | — | (47,018 | ) | (47,018 | ) | $ | (47,018 | ) | ||||||||||||||||||
| BALANCE, December 31, 2008 |
29,736 | 297 | 213,354 | (17,574 | ) | (126,382 | ) | — | (29,311 | ) | 57,958 | $ | (47,018 | ) | |||||||||||||||||
| Issuance of common stock related to employee stock plans |
— | — | (1,102 | ) | 192 | 1,533 | — | — | 431 | ||||||||||||||||||||||
| Forfeitures of restricted stock awards |
— | — | 140 | (18 | ) | (140 | ) | — | — | — | |||||||||||||||||||||
| Repurchases of common stock |
— | — | — | (204 | ) | (579 | ) | — | — | (579 | ) | ||||||||||||||||||||
| Share-based compensation expense |
— | — | 1,139 | — | — | — | — | 1,139 | |||||||||||||||||||||||
| Unrealized gain on available-for-sale marketable securities |
— | — | — | — | — | 6 | — | 6 | $ | 6 | |||||||||||||||||||||
| Net loss |
— | — | — | — | — | — | (3,839 | ) | (3,839 | ) | $ | (3,839 | ) | ||||||||||||||||||
| BALANCE, December 31, 2009 |
29,736 | $ | 297 | $ | 213,531 | (17,604 | ) | $ | (125,568 | ) | $ | 6 | $ | (33,150 | ) | $ | 55,116 | $ | (3,833 | ) | |||||||||||
See notes to consolidated financial statements.
Table of Contents
CONSOLIDATED STATEMENTS OF CASH FLOWS
(In thousands)
| Year Ended December 31, | ||||||||||||
| 2009 | 2008 | 2007 | ||||||||||
| CASH FLOWS FROM OPERATING ACTIVITIES: |
||||||||||||
| Net (loss) income |
$ | (3,839 | ) | $ | (47,018 | ) | $ | 8,810 | ||||
| Adjustments to reconcile net (loss) income to net cash provided by operating activities, net of acquisitions: |
||||||||||||
| Depreciation and amortization |
2,694 | 3,771 | 2,448 | |||||||||
| Provision for doubtful accounts |
113 | 150 | 126 | |||||||||
| Deferred income taxes |
(516 | ) | (138 | ) | (3,706 | ) | ||||||
| Stock-based compensation |
1,139 | 1,555 | 1,479 | |||||||||
| Amortization of marketable securities discounts (premiums), net |
184 | 136 | (63 | ) | ||||||||
| Excess tax benefits from stock options |
— | (6 | ) | (729 | ) | |||||||
| Impairment of goodwill and other intangible assets |
— | 48,594 | — | |||||||||
| Loss on sale of marketable securities |
7 | — | (6 | ) | ||||||||
| Loss on disposal of fixed assets |
34 | |||||||||||
| Changes in operating accounts: |
||||||||||||
| Accounts receivable |
2,896 | 3,958 | (1,084 | ) | ||||||||
| Prepaid expenses and other assets |
(819 | ) | 111 | (452 | ) | |||||||
| Other assets |
(42 | ) | 7 | 4 | ||||||||
| Accounts payable and accrued liabilities |
(1,046 | ) | (494 | ) | 204 | |||||||
| Accrued payroll and related liabilities |
(1,279 | ) | (2,856 | ) | 1,543 | |||||||
| Deferred revenue and other liabilities |
231 | (28 | ) | 668 | ||||||||
| Net cash (used in) provided by operating activities |
(243 | ) | 7,742 | 9,242 | ||||||||
| Net cash used in discontinued operating activities |
— | (8 | ) | (565 | ) | |||||||
| CASH FLOWS FROM INVESTING ACTIVITIES: |
||||||||||||
| Redemptions of marketable securities |
21,463 | 29,723 | 52,285 | |||||||||
| Purchases of marketable securities |
(17,472 | ) | (25,661 | ) | (44,054 | ) | ||||||
| Purchase of Fullscope Inc., net of cash acquired |
(10,942 | ) | ||||||||||
| Purchase of National Decision Systems, Inc., including payment under earnouts |
— | — | (709 | ) | ||||||||
| Purchase of Vertical Pitch, LLC |
— | (49 | ) | (15,548 | ) | |||||||
| Purchase of Alecian Corporation, including payment under earnout |
— | (1,000 | ) | (794 | ) | |||||||
| Purchase of Lynx Business Intelligence Consulting, Inc., including payment under earnouts |
(140 | ) | (150 | ) | (3,263 | ) | ||||||
| Purchases of property and equipment |
(32 | ) | (307 | ) | (2,278 | ) | ||||||
| Net cash (used in) provided by investing activities |
(7,123 | ) | 2,556 | (14,361 | ) | |||||||
| CASH FLOW FROM FINANCING ACTIVITIES: |
||||||||||||
| Payments on capital leases |
(215 | ) | (202 | ) | (147 | ) | ||||||
| Proceeds from employee stock purchase plans and stock option exercises |
431 | 1,000 | 2,898 | |||||||||
| Excess tax benefits from stock options |
— | 6 | 729 | |||||||||
| Repurchases of common stock |
(579 | ) | (5,105 | ) | — | |||||||
| Net cash (used in) provided by financing activities |
(363 | ) | (4,301 | ) | 3,480 | |||||||
| Net (decrease) increase in cash and cash equivalents |
(7,729 | ) | 5,989 | (2,204 | ) | |||||||
| CASH AND CASH EQUIVALENTS, beginning of period |
13,618 | 7,629 | 9,833 | |||||||||
| CASH AND CASH EQUIVALENTS, end of period |
$ | 5,889 | $ | 13,618 | $ | 7,629 | ||||||
| SUPPLEMENTAL DISCLOSURES OF CASH FLOW INFORMATION: |
||||||||||||
| Interest paid |
$ | 36 | $ | 51 | $ | 53 | ||||||
| Cash paid for income taxes |
$ | 428 | $ | 964 | $ | 799 | ||||||
| Cash receipts from related parties |
$ | — | $ | 179 | $ | 206 | ||||||
| Cash payments to related parties |
$ | — | $ | — | $ | 628 | ||||||
| NON-CASH INVESTING AND FINANCING ACTIVITIES: |
||||||||||||
| Goodwill adjustment (Note 4) |
$ | 1,800 | $ | — | $ | — | ||||||
| Unrealized gain on available for sale securities |
$ | 6 | $ | — | $ | — | ||||||
| (Forfeiture) issuance of restricted stock awards |
$ | (140 | ) | $ | (89 | ) | $ | 302 | ||||
| Issuance of common stock for acquisitions and earnouts |
$ | — | $ | — | $ | 8,295 | ||||||
| Shares surrendered to cover option exercises and taxes |
$ | — | $ | 46 | $ | 1,277 | ||||||
| Purchases of property and equipment under capital lease obligations |
$ | — | $ | — | $ | 22 | ||||||
See notes to consolidated financial statements.
39
Table of Contents
NOTES TO CONSOLIDATED FINANCIAL STATEMENTS
1. NATURE OF BUSINESS AND BASIS OF PRESENTATION:
Edgewater Technology, Inc. (“Edgewater” or the “Company”) is a consulting firm that brings a synergistic blend of specialty services in the areas of business advisory, analytics, data management, and technology to our client base. Headquartered in Wakefield, Massachusetts, as of December 31, 2009, our Company employed approximately 180 consulting professionals and 237 total professionals throughout our network of satellite offices.
2. SUMMARY OF SIGNIFICANT ACCOUNTING POLICIES:
The accompanying consolidated financial statements reflect the application of certain significant accounting policies as described in this note and elsewhere in the accompanying consolidated financial statements and notes.
Basis of Presentation –
The consolidated financial statements include the accounts of Edgewater and its wholly-owned subsidiaries. All intercompany transactions have been eliminated in consolidation.
The Company considers events or transactions that occur after the balance sheet date but before the financial statements are issued to provide additional evidence relative to certain estimates or to identify matters that require additional disclosure. The Company did not identify any recognizable events during this period.
Use of Estimates –
Our consolidated financial statements are prepared in accordance with accounting principles generally accepted in the United States of America. These accounting principles require management to make certain estimates, judgments and assumptions that affect the reported amounts of assets, liabilities and disclosure of contingent assets and liabilities at the date of the financial statements and the reported amount of revenues and expenses during the reporting period. These estimates, judgments and assumptions used in preparing the accompanying consolidated financial statements are based upon management’s evaluation of the relevant facts and circumstances as of the date of the consolidated financial statements. Although the Company regularly assesses these estimates, judgments and assumptions used in preparing these consolidated financial statements, actual results could differ from those estimates. Changes in estimates are recorded in the period in which they become known.
Cash and Cash Equivalents –
Cash and cash equivalent balances consist of deposits, investments in money market funds and repurchase agreements with large U.S. commercial banks. All highly liquid investments with remaining maturities of three months or less at the date of purchase are considered cash equivalents. The Company’s cash equivalents consisted of $12 thousand in money market funds as of December 31, 2009. Cash equivalents consisted of $3.6 million in money market funds and $1.0 million in commercial paper, which is a short-term equity instrument and is classified as trading security under the provisions of Financial Accounting Standards Board (“FASB”) Accounting Standards Codification (“ASC”) Topic 820, “Fair Value Measurements and Disclosures,” as of December 31, 2008.
The following tables represent the Company’s fair value hierarchy for its Level 2 trading securities, which are carried at fair value, as of December 31, 2008:
| Amortized Cost |
Gross Unrealized Gains |
Gross Unrealized Losses |
Fair Value | |||||||||
| Trading securities |
$ | 997 | $ | 3 | $ | — | $ | 1,000 | ||||
40
Table of Contents
EDGEWATER TECHNOLOGY, INC.
NOTES TO CONSOLIDATED FINANCIAL STATEMENTS–(Continued)
2. SUMMARY OF SIGNIFICANT ACCOUNTING POLICIES (Continued):
Restricted Cash –
In connection with Edgewater’s December 31, 2009 acquisition of Fullscope, Inc. (“Fullscope”), Fullscope, at the closing date of the acquisition, had $702 thousand of restricted cash. The restricted cash represents an escrow deposit made in connection with Fullscope’s sale of certain intellectual property in June 2009 and is scheduled to be released in June 2010. As provided for under the Agreement and Plan of Merger and Reorganization between Edgewater and Fullscope, the restricted cash, once released from escrow, will be distributed to the former stockholders of Fullscope. The escrow deposit is invested in an interest-bearing account at a federally insured bank. Edgewater’s acquisition of Fullscope is described in further detail in Note 4 of the notes to consolidated financial statements,
Marketable Securities –
Marketable securities are classified as available-for-sale securities, which are recorded at fair market value with unrealized gains and losses recorded as part of accumulated and other comprehensive income, which is separate component of stockholders’ equity, until such gains and losses are realized. Marketable securities consist of marketable instruments, which include but are not limited to government obligations, including agencies, government sponsored entities and commercial paper. All marketable securities have original maturities greater than three months, but less than one year, at the date of purchase. The fair value of these securities is based upon quoted prices for identical or similar assets. If a decline in the fair value is considered other-than-temporary, based on available evidence, the unrealized loss is transferred from other comprehensive income (loss) to the consolidated statements of operations. Realized gains or losses are determined on the specific identification method and are included in interest income in the consolidated statements of operations.
Property and Equipment –
Property and equipment are stated at cost, net of accumulated depreciation and amortization. Property and equipment are depreciated on a straight-line basis over the estimated useful lives of the assets, which range from three to ten years. Equipment held under capital leases is amortized utilizing the straight-line method over the lesser of the estimated useful life of the asset or the term of the lease. See Note 6 and Note 14 of the notes to consolidated financial statements. Additions that extend the lives of the assets are capitalized, while repairs and maintenance costs are expensed as incurred.
Costs Incurred to Develop Software for Internal Use –
The Company capitalizes certain internal and external costs in connection with software developed for internal use. These costs are comprised of employee salaries and third-party consulting fees incurred during the application development stage of the project. Such capitalized costs are expensed over the estimated life of the software, typically three years, using the straight-line method. No costs related to internally developed software were capitalized by the Company during the years ended December 31, 2009 and 2008.
Impairment of Long-Lived Assets –
We evaluate our long-lived assets for impairment whenever events or changes in circumstances indicate that the carrying amount of such assets may not be recoverable. Impairment is generally assessed by a comparison of cash flows expected to be generated by an asset to its carrying value, with the exception that goodwill impairment is assessed by use of a fair value model (see Note 7 of the notes to consolidated financial statements). If such assets are considered to be impaired, the impairment to be recognized is measured by the amount by which the carrying amount of the asset exceeds its fair value.
Goodwill and Intangible Assets –
Goodwill has an indefinite useful life and is not amortized, but is evaluated for impairment annually (the “Annual Impairment Test”) or whenever events or changes in circumstances indicate that the carrying value may not be recoverable. We record intangible assets at historical cost. Our intangible assets consist primarily of non-compete arrangements, customer relationships and trade names and trademarks. We amortize our intangible assets that have finite lives using either the straight-line method or based on estimated future cash flows to approximate the pattern in which the economic benefit of the asset will be utilized. Amortization is recorded over the estimated useful lives ranging from 1.5 to 7.5 years and is further described in Notes 4 and 7.
41
Table of Contents
EDGEWATER TECHNOLOGY, INC.
NOTES TO CONSOLIDATED FINANCIAL STATEMENTS–(Continued)
2. SUMMARY OF SIGNIFICANT ACCOUNTING POLICIES (Continued):
Goodwill is tested for impairment annually at the reporting unit level utilizing the “fair value” methodology. Our annual measurement date is December 2. Factors the Company considers important that could trigger an interim review for impairment include, but are not limited to, the following:
| • | Significant under-performance relative to historical or projected future operating results; |
| • | Significant changes in the manner of its use of acquired assets or the strategy for its overall business; |
| • | Significant negative industry or economic trends; |
| • | Significant decline in its stock price for a sustained period; and |
| • | Its market capitalization relative to net book value. |
Goodwill is evaluated for impairment using a two-step process. The first step is to compare the fair value of the reporting unit to the carrying amount of the reporting unit (the “First Step”). If the carrying amount exceeds the fair value, a second step must be followed to calculate potential impairment (the “Second Step”). Otherwise, if the fair value of the reporting unit exceeds the carrying amount, the goodwill is not considered to be impaired as of the measurement date. In its review of the carrying value of the goodwill, the Company determines fair values for the reporting unit using the Income Approach, or more specifically the Discounted Cash Flow Method, and the Market Approach, utilizing both the Guideline Company Method and the Comparable Transactions Method. These valuation methods require management to project revenues, operating expenses, working capital investment, capital spending and cash flows for the reporting unit over a multi-year period, as well as determine the weighted average cost of capital to be used as a discount rate.
Revenue Recognition –
Our Company recognizes revenue from providing consulting services under written service contracts with our customers. The service contracts we enter into generally fall into three specific categories: time and materials, fixed-price and fixed-fee. Our revenues are generated from sources such as management consulting engagements, technical consulting engagements, EIM/data services and infrastructure services, ERP and CRM solutions, and Enterprise Performance Management consulting engagements. Revenue from these service offerings is recognized as the services are performed and amounts are earned. We consider amounts to be earned once evidence of an arrangement has been obtained, services are delivered, fees are fixed or determinable and collectability is reasonably assured.
For the years ended December 31, 2009, 2008 and 2007, revenue from management consulting engagements, technical consulting engagements and enterprise performance management consulting engagements represented the following:
| Year Ended December 31, |
Management Consulting Engagements |
Technical Consulting Engagements |
Enterprise Performance Management Consulting Engagements |
||||||
| 2009 |
3.7 | % | 28.6 | % | 67.7 | % | |||
| 2008 |
6.4 | % | 36.6 | % | 57.0 | % | |||
| 2007 |
12.5 | % | 57.2 | % | 30.3 | % |
The Company derives a significant portion of its service revenue from time and materials-based contracts. Time and materials-based contracts represented 92.7%, 96.7% and 95.0% of service revenue for the years ended December 31, 2009, 2008 and 2007, respectively. Revenue under time and materials contracts is recognized as services are rendered and performed at contractually agreed upon rates.
Revenue pursuant to fixed-price contracts is recognized under the proportional performance method of accounting. Fixed-price contracts represented 4.7%, 1.0% and 2.4% of service revenue for the years ended December 31, 2009, 2008 and 2007, respectively. Over the course of a fixed-price contract, we routinely evaluate whether revenue and profitability should be recognized in the current period. We estimate the proportional performance on our fixed-price contracts on a monthly basis utilizing hours incurred to date as a percentage of total estimated hours to complete the project. If we do not have a sufficient basis to measure progress toward completion, revenue is recognized upon completion of performance, subject to any warranty provisions or other project management assessments as to the status of work performed. This method is used because reasonably dependable estimates of costs and revenue earned can be made, based on historical experience and milestones identified in any particular contract.
42
Table of Contents
EDGEWATER TECHNOLOGY, INC.
NOTES TO CONSOLIDATED FINANCIAL STATEMENTS–(Continued)
2. SUMMARY OF SIGNIFICANT ACCOUNTING POLICIES (Continued):
Typically, the Company provides warranty services on its fixed-price contracts related to providing customers with the ability to have any “design flaws” remedied and/or have our Company “fix” routine defects. The warranty services, as outlined in the respective contracts, are provided for a specific period of time after a project is complete. The Company values the warranty services based upon historical labor hours incurred for similar services at standard billing rates. Revenue related to the warranty provisions within our fixed-price contracts is recognized as the services are performed or the revenue is earned. The warranty period is typically short term or for a 30-60 day period after the project is complete.
In the event we are unable to accurately estimate the resources required or the scope of work to be performed on a fixed-price contract, or we do not manage the project properly within the planned time period, then we may recognize a loss on a contract. Provisions for estimated losses on uncompleted projects are made on a contract-by-contract basis. Any known or probable losses on projects are charged to operations in the period in which such losses are determined. A formal project review process takes place quarterly, although most projects are evaluated on an ongoing basis. Management reviews the estimated total direct costs on each contract to determine if the estimated amounts are accurate, and estimates are adjusted as needed in the period revised estimates are made. No losses were recognized on fixed-price contracts during the years ended December 31, 2009, 2008 or 2007.
We also perform services on a periodic fixed-fee basis under infrastructure service contracts, which include monthly hosting and support services. Fixed-fee contracts represented 2.6%, 2.3% and 2.6% of service revenues for the years ended December 31, 2009, 2008 and 2007, respectively. Revenue under periodic fixed-fee contracts is recognized ratably over the contract period, as outlined within the respective contract. In the event additional services are required, above the minimum retained or contracted amount, then such services are billed on a time and materials basis.
When a customer enters into a time and materials, fixed-price or a periodic fixed-fee contract, we recognized revenue in accordance with our evaluation of the deliverables in each contract. Our evaluation is conducted to determine whether they represent separate units of accounting. If the deliverables represent separate units of accounting, we then measure and allocate the consideration from the arrangement to the separate units, based on reliable evidence of fair value for each deliverable.
Client prepayments, even if nonrefundable, are deferred (classified as a liability) and recognized over future periods as services are performed. As of December 31, 2009 and 2008, the Company has recorded a deferred liability of approximately $809 thousand and $199 thousand, respectively, which is included in the financial statement caption of “deferred revenue and other liabilities” related to customer prepayments.
Software revenue represents the resale of certain third-party off-the-shelf software and is recorded on a gross basis provided we act as a principal in the transaction, whereby we have credit risk and we set the price to the end user. In the event we do not meet the requirements to be considered a principal in the software sale transaction and act as an agent, software revenue will be recorded on a net basis. Revenue from software resale arrangements represented 1.3%, 1.5% and 3.5% of total revenue for the years ended December 31, 2009, 2008 and 2007, respectively. Revenue and related costs are recognized and amounts are invoiced upon the customer’s constructive receipt of purchased software. All related warranty and maintenance arrangements are performed by the primary software vendor and are not the obligation of the Company.
We recognize revenue for services where the collection from the client is probable and our fees are fixed or determinable. We establish billing terms at the time at which the project deliverables and milestones are agreed. Our standard payment terms are 30 days from invoice date. Out-of-pocket reimbursable expenses charged to customers are reflected as revenue.
Our revenue and earnings may fluctuate from year-to-year based on the number, size and scope of projects in which we are engaged, the contractual terms and degree of completion of such projects, any delays incurred in connection with a project, employee utilization rates, the adequacy of provisions for losses, the use of estimates of resources required to complete ongoing projects, general economic conditions and other factors. Certain significant estimates include those used for fixed-price contracts, such as deferrals related to our volume purchase agreements, warranty holdbacks, allocations of fair value of elements under multiple element arrangements and the valuation of our allowance for doubtful accounts.
Allowance for Doubtful Accounts –
The Company maintains an allowance for doubtful accounts related to its accounts receivable that have been deemed to have a high risk of collectability. Management reviews its accounts receivable balances on a monthly basis to determine if any receivables are potentially uncollectible. Management further analyzes historical collection trends and changes in its customer payment patterns, customer concentration and credit worthiness when evaluating the adequacy of its allowance for doubtful accounts. The Company includes any accounts receivable balances that are deemed to be potentially uncollectible, along with a general reserve, in its overall allowance for doubtful accounts. Based on the information available, management believes the allowance for doubtful accounts is adequate, however future write-offs could exceed the recorded allowance.
43
Table of Contents
EDGEWATER TECHNOLOGY, INC.
NOTES TO CONSOLIDATED FINANCIAL STATEMENTS–(Continued)
2. SUMMARY OF SIGNIFICANT ACCOUNTING POLICIES (Continued):
Cost of Services –
Our cost of services are comprised primarily of project personnel costs, including direct salaries, payroll taxes, employee benefits and travel expenses for personnel dedicated to customer projects. These costs represent the most significant expense we incur in providing our services.
Other Income, Net –
The following table represents the components of other income, net:
| Year Ended December 31, | ||||||||||||
| 2009 | 2008 | 2007 | ||||||||||
| (In Thousands) | ||||||||||||
| Interest income |
$ | 192 | $ | 554 | $ | 1,652 | ||||||
| Interest expense |
(36 | ) | (51 | ) | (53 | ) | ||||||
| Loss on disposal of fixed assets |
(34 | ) | — | — | ||||||||
| Other income, net |
$ | 122 | $ | 503 | $ | 1,599 | ||||||
Provision for Taxes –
In determining our current income tax provision, we assess temporary differences resulting from different treatments of items for tax and accounting purposes. These differences result in deferred tax assets and liabilities, which are recorded in our consolidated balance sheets. We evaluate the realizability of our deferred tax assets and assess the need for a valuation allowance on an ongoing basis. In evaluating our deferred tax assets, we consider whether it is more likely than not that the deferred income tax assets will be realized. The ultimate realization of our deferred tax assets depends upon generating sufficient future taxable income during the periods in which our temporary differences either become deductible or expire. This assessment requires significant judgment. However, recovery is dependent on achieving such projections and failure to do so would result in an increase in the valuation allowance in a future period.
Any future changes in the valuation allowance could result in additional income tax expense (benefit) and reduce or increase stockholders’ equity, and such changes could have a significant impact upon our earnings in the future.
Income tax reserves are based on a determination of whether and how much of a tax benefit taken by the Company in its tax filings or positions is more likely than not realized following resolution of any potential contingencies present related to the tax benefit. Potential interest and penalties associated with such uncertain tax position is recorded as a component of the income tax provision.
Earnings Per Share –
Basic earnings per share reflect the weighted-average number of common shares outstanding during each period. Diluted earnings per share reflect the impact, when dilutive, of the exercise of options using the treasury stock method. Following is a reconciliation of the shares used in computing basic and diluted earnings per share for the fiscal years ended December 31, 2009, 2008 and 2007:
| Year Ended December 31, | ||||||
| 2009 | 2008 | 2007 | ||||
| (In Thousands) | ||||||
| Shares used in computing basic earnings per share |
12,067 | 12,861 | 11,793 | |||
| Dilutive effect of stock options and unvested restricted stock awards, determined using the treasury stock method |
— | — | 1,565 | |||
| Shares used in computing diluted earnings per share |
12,067 | 12,861 | 13,358 | |||
Stock options for which the exercise price exceeds the average market price have an anti-dilutive effect on earnings per share, and accordingly, are excluded from the diluted computations of earnings per share in each of the periods presented. Had such shares been included, the presented number of shares for the diluted computation would have increased by approximately 4.2 million, 2.9 million and 0.4 million in the years ended December 31, 2009, 2008 and 2007, respectively. Options to purchase approximately 12 thousand and 206 thousand shares of common stock that were outstanding during the year ended December 31, 2009 and 2008, respectively, were not included in the computation of diluted net loss per share due to the reported loss.
44
Table of Contents
EDGEWATER TECHNOLOGY, INC.
NOTES TO CONSOLIDATED FINANCIAL STATEMENTS–(Continued)
2. SUMMARY OF SIGNIFICANT ACCOUNTING POLICIES (Continued):
Fair Value of Financial Instruments –
Edgewater’s financial instruments include cash and cash equivalents, marketable securities, accounts receivable and accounts payable. The carrying values of cash and cash equivalents, accounts receivable and accounts payable approximate their fair value due to the relatively short-term nature of the accounts.
Concentrations of Credit Risk –
Financial instruments that potentially subject the Company to significant concentration of market or credit risk consist principally of cash equivalent instruments, marketable securities and accounts receivable. The Company places its cash balances with reputable financial institutions and investments are generally limited to 10% in any one financial instrument. Trade receivables potentially subject the Company to credit risk. The Company extends credit to its customers based upon an evaluation of the customer’s financial condition and credit history and generally does not require collateral. The Company has historically incurred minimal credit losses.
| December 31, | ||||||
| 2009 | 2008 | |||||
| Accounts receivable: |
||||||
| Customer A |
— | % | 10.8 | % | ||
| Customer B |
10.9 | % | — | % | ||
For the years ended December 31, 2009 and 2008, no customer represented more that 10% of the Company’s total service revenue. In the year ended December 31, 2007, three customers contributed more than 10% of the Company’s service revenue. For the years ended December 31, 2009, 2008 and 2007, our five largest customers represented 20.4%, 26.2%, and 45.1% of our service revenue in the aggregate, respectively.
| Year Ended December 31, | |||||||||
| 2009 | 2008 | 2007 | |||||||
| Revenue: |
|||||||||
| Customer C |
— | % | — | % | 11.0 | % | |||
| Customer D |
— | % | — | % | 13.6 | % | |||
| Customer E |
— | % | — | % | 11.3 | % | |||
Comprehensive (Loss) Income –
Comprehensive (loss) income consists of periodic net (loss) income and net unrealized gains (losses) on our available-for-sale marketable securities.
Share-Based Compensation –
We recognize as compensation expense the total fair value of share-based awards, over the requisite employee service period (generally the vesting period of the grant). We have used and expect to continue to use the Black-Scholes option-pricing model to compute the estimated fair value of stock-based awards on the date of grant. The Black-Scholes option pricing model includes assumptions regarding dividend yields, expected volatility, expected option term and risk-free interest rates. We estimate expected volatility based upon historical volatility. The risk-free interest rate is based on the U.S. Treasury yield curve in effect at the time of grant.
The assumptions used in computing the fair value of stock-based awards reflect our best estimates, but involve uncertainties relating to market and other conditions, many of which are outside of our control. As a result, if other assumptions or estimates had been used, the stock-based compensation expense that was recorded for the years ended December 31, 2009, 2008 and 2007 could have been materially different. Furthermore, if different assumptions are used in future periods, stock-based compensation expense could be materially impacted in the future.
The Company has elected to adopt the alternative transition (“short-cut”) method for calculating the tax effects of share-based compensation. The alternative transition method includes simplified methods to establish the beginning balance of the additional paid-in capital pool (“APIC Pool”) related to the tax effects of employee share-based compensation and to determine the subsequent impact on the APIC Pool of the tax effects of employee share-based compensation awards that are outstanding as of January 1, 2006. See Note 10 for additional information relating to the Company’s stock plans and the recognition of share-based compensation expense.
45
Table of Contents
EDGEWATER TECHNOLOGY, INC.
NOTES TO CONSOLIDATED FINANCIAL STATEMENTS–(Continued)
2. SUMMARY OF SIGNIFICANT ACCOUNTING POLICIES (Continued):
Foreign Currency Translation –
The financial statements for Edgewater’s non-U.S. operations are translated to U.S. dollars at current exchange rates. For assets and liabilities, the year-end rate is used. For revenues, expenses, gains and losses, the average rate for the period is used. Unrealized currency adjustments in our financial statements are accumulated in equity as a component of accumulated other comprehensive income (loss).
Edgewater’s non-U.S. operations are directly related to the December 31, 2009 acquisition of Fullscope, Inc., which is more fully described in Note 4 of the notes to consolidated financial statements.
Segment Information –
The Company engages in business activities under one operating segment, which combines management consulting, technical knowledge, and enterprise management solutions to develop custom technology and business process solutions. The chief operating decision maker formulates decisions about how to allocate resources and assess performance based on consolidated financial results.
Recent Accounting Pronouncements –
Accounting Standards Update (“ASU”) 2009-13, “Multiple-Deliverable Revenue Arrangements” amends ASC Subtopic 650-25, “Revenue Recognition—Multiple-Element Arrangements” to eliminate the requirement that all undelivered elements have vendor-specific objective evidence (“VSOE”) or third-party evidence (“TPE”) before an entity can recognize the portion of an overall arrangement fee that is attributable to items that already have been delivered. In the absence of VSOE or TPE of the standalone selling price for one or more delivered or undelivered elements in a multiple-element arrangement, entities will be required to estimate the selling prices of those elements. The overall arrangement fee will be allocated to each element (both delivered and undelivered items) based on their relative selling prices, regardless of whether those selling prices are evidenced by VSOE or TPE or are based on the entity’s estimated selling price. Additionally, the new guidance will require entities to disclose more information about their multiple-element revenue arrangements. This ASU is effective prospectively for revenue arrangements entered into or materially modified in fiscal years beginning on or after June 15, 2010 and early adoption is permitted. The Company does not believe that the adoption of this ASU will have a material impact on its consolidated financial statements.
ASU 2009-05, “Fair Value Measurements and Disclosures (Topic 820)—Measuring Liabilities at Fair Value” allows entities determining the fair value of a liability to use the perspective of an investor that holds the related obligation as an asset. The ASU is effective for interim and annual periods beginning after August 27, 2009, and applies to all fair-value measurements of liabilities required by GAAP. The Company’s adoption of this ASU did not have a material impact on our consolidated financial statements.
In July 2009, FASB issued Statements of Financial Accounting Standards (“SFAS”) No. 168, “The FASB Accounting Standards Codification and the Hierarchy of Generally Accepted Accounting Principles,” which is codified in the ASC under Topic 105, “Generally Accepted Accounting Principles” (“ASC Topic 105”). ASC Topic 105 identifies the sources of accounting principles and the framework for selecting the principles used in the preparation of financial statements of nongovernmental entities that are presented in conformity with Generally Accepted Accounting Principles in the United States. ASC Topic 105 was effective for financial statements issued for interim and annual periods ending after September 15, 2009. We adopted the provisions of ASC Topic 105 during the third quarter of 2009.
In May 2009, FASB issued SFAS No. 165, “Subsequent Events,” which is now codified in ASC Topic 855, “Subsequent Events” (“ASC Topic 855”). ASC Topic 855 defines the subsequent events or transactions period, circumstances under which such events or transactions should be recognized, and disclosures regarding subsequent events or transactions. ASC Topic 855 is effective for interim or annual periods ending after June 15, 2009. The Company has adopted the provisions of ASC Topic 855 as of June 30, 2009. Although our adoption did not materially impact our financial condition, results of operations, or cash flows, the Company is now required to provide additional disclosures, which are included in Note 2 “–Basis of Presentation” of the notes to consolidated financial statements.
In April 2009, FASB issued FASB Staff Position No. FAS 107-1 and APB 28-1, “Interim Disclosures about Fair Value of Financial Instruments,” which is now codified in the ASC under Topic 825, “Financial Instruments” (“ASC Topic 825”). This standard extends the disclosure requirements concerning the fair value of financial instruments to interim financial statements of publicly traded companies. This guidance is effective for interim or annual financial periods ending after June 15, 2009, and as such, became effective for the Company in the quarter ended June 30, 2009. Although our adoption did not materially impact our financial condition, results of operations, or cash flows, the Company is now required to provide additional disclosures, which are included in Note 3.
46
Table of Contents
EDGEWATER TECHNOLOGY, INC.
NOTES TO CONSOLIDATED FINANCIAL STATEMENTS–(Continued)
3. MARKETABLE SECURITIES:
We utilize the following valuation hierarchy for disclosure of the inputs to valuation used to measure fair value. This hierarchy prioritizes the inputs into three broad levels as follows:
| • | Level 1 inputs are quoted prices (unadjusted) in active markets for identical assets or liabilities. |
| • | Level 2 inputs are quoted prices for similar assets and liabilities in active markets or inputs that are observable for the asset or liability, either directly or indirectly through market corroboration, for substantially the full term of the financial instrument. |
| • | Level 3 inputs are unobservable inputs based on our own assumptions used to measure assets and liabilities at fair value. |
A financial asset or liability’s classification within the hierarchy is determined based on the lowest level input that is significant to the fair value measurement.
All marketable securities that have original maturities greater than three months, but less than one year, are considered to be current marketable securities.
During 2009, we changed the classification of our marketable securities from held-to-maturity to available-for-sale. Prior to this change, our marketable securities were reported at amortized cost. We changed the classification of our marketable securities as a result of our selling certain securities prior to their maturity. The proceeds from the sale were used in connection with the funding of our acquisition of Fullscope, Inc., which is described in more detail in Note 4. At the time we changed our classification, our marketable securities had a fair value of $6.8 million and we recognized an unrealized gain of $6 thousand at the time of transfer.
As of December 31, 2009, our marketable securities are classified as available-for-sale securities, which are recorded at fair value and consist of marketable instruments, which include but are not limited to corporate bonds and commercial paper. As of December 31, 2008, our marketable securities were classified as held-to-maturity securities and they were reported at amortized cost.
The following tables represent the Company’s fair value hierarchy for its marketable securities as of December 31, 2009 and December 31, 2008. As a result of the Company’s change in the classification of its marketable securities during the current year, the marketable security balances reported in the Company’s December 31, 2009 balance sheet are presented at fair value, while the amounts presented in the December 31, 2008 balance sheet are reported at amortized cost. Each of the below listed marketable securities is classified as a Level 2 securities within the fair value hierarchy.
| December 31, 2009 | ||||||||||||
| Amortized Cost |
Gross Unrealized Gains |
Gross Unrealized Losses |
Fair Value | |||||||||
| Government obligations |
$ | 6,766 | $ | 6 | $ | — | $ | 6,772 | ||||
| Total marketable securities |
$ | 6,766 | $ | 6 | $ | — | $ | 6,772 | ||||
| December 31, 2008 | ||||||||||||
| Amortized Cost |
Gross Unrealized Gains |
Gross Unrealized Losses |
Fair Value | |||||||||
| Commercial paper |
$ | 3,736 | $ | 14 | $ | — | $ | 3,750 | ||||
| Corporate bonds |
7,212 | 43 | $ | — | 7,255 | |||||||
| Total marketable securities |
$ | 10,948 | $ | 57 | $ | — | $ | 11,005 | ||||
Amortization expense related to the net discounts and (premiums) on our available-for-sale securities was $184 thousand, $136 thousand and $(61) thousand for the years ended December 31, 2009, 2008 and 2007, respectively.
Other Financial Instruments: As of December 31, 2009 and 2008, the fair values of our other financial instruments, which include cash and cash equivalents, restricted cash, accounts receivable and accounts payable, approximate the carrying amounts of the respective asset and/or liability due to the short-term nature of these financial instruments.
47
Table of Contents
EDGEWATER TECHNOLOGY, INC.
NOTES TO CONSOLIDATED FINANCIAL STATEMENTS–(Continued)
4. BUSINESS COMBINATIONS:
In December 2007, the FASB issued SFAS No. 141(R), “Business Combinations,” which is now codified under, and referred to as, ASC Topic 805, “Business Combinations” (“ASC Topic 805”). ASC Topic 805 establishes principles and requirements for how an acquirer recognizes and measures in its financial statements the identifiable assets acquired, liabilities assumed, any non-controlling interest in the acquiree and the goodwill acquired. ASC Topic 805 also establishes disclosure requirements which will enable users to evaluate the nature and financial effects of the business combination. ASC Topic 805 became effective for fiscal years beginning after December 31, 2008. We, in connection with our acquisition of Fullscope, Inc., adopted the provisions of ASC Topic 805 during the year ended December 31, 2009.
Acquisition of Fullscope, Inc.: On December 31, 2009, the Company, pursuant to the terms of an Agreement and Plan of Merger and Reorganization (the “Purchase Agreement”) acquired all of the outstanding stock of Fullscope, Inc. (“Fullscope”) (the “Fullscope Acquisition”). Fullscope, with corporate offices located in Athens, Alabama and satellite offices in Alpharetta, Georgia and Montreal, Canada, is a Microsoft Dynamics consulting firm that provides discrete and process manufacturing Enterprise Resource Planning-related (“ERP”) consulting services in the upper mid-market. The Fullscope Acquisition provides Edgewater with ERP integration and related consulting service capabilities, discrete and process manufacturing expertise and extends the reach of the Company’s strategic data and analytics offerings into the upper middle market.
The Company has initially estimated total allocable purchase price consideration to be $15.6 million. The initial purchase price estimate is comprised of $14.4 million in cash paid at closing increased by $1.2 million representing our initial fair value estimate of additional contingent earnout consideration that may earned by the former Fullscope stockholders, as described in more detail below. The cash paid at closing consisted of the $12.5 million purchase price plus $1.9 million in additional cash consideration attributable to Fullscope delivering net working capital in excess of agreed upon levels established in the Purchase Agreement. Fullscope’s excess net working capital adjustment was primarily generated by Fullscope’s $3.5 million cash on hand at closing. Adjusting for the cash acquired, Edgewater paid $10.9 million in net cash at closing. In addition to the above payments, the Company incurred approximately $613 thousand in transaction costs, which, in accordance with the provisions of ASC Topic 805, are no longer capitalizable as part of the purchase price, but are expensed when incurred.
An earnout agreement was entered into in connection with the Fullscope Acquisition under which the former Fullscope stockholders are eligible to receive additional contingent consideration. Contingent earnout consideration to be paid, if any, to the former Fullscope stockholders will be based upon the generation of positive, after-tax income, which will be determined, periodically, over an eighteen-month period from the date of acquisition and concluding on June 30, 2011. The Company has increased total purchase price consideration described above by $1.2 million, which represents our initial fair value estimate of the contingent consideration to be paid under the earnout agreement. There is no limit with respect to the amounts that can be earned by the former Fullscope stockholders under the terms of the earnout agreement.
The Company, as of December 31, 2009, has performed an initial estimate with respect to the fair value allocation of the total $15.6 million purchase price consideration between assets, liabilities, identified intangible assets and goodwill. Based upon our initial fair value estimates, the Company has incorporated the following purchase price allocation in its December 31, 2009 financial statements:
| Total | Life (In Years) | |||||
| (In Thousands) | ||||||
| Cash acquired |
$ | 3,481 | ||||
| Net fair value of accounts receivable |
9,369 | |||||
| Net fair value of other liabilities assumed |
(9,115 | ) | ||||
| Acquired intangible assets |
4,500 | 1.5 Years to 6 Years | ||||
| Goodwill (not deductible for tax purposes) |
7,388 | |||||
| Total purchase price |
$ | 15,623 | ||||
The above represents the Company’s initial fair value estimates as of December 31, 2009, due to the fact that the transaction was completed on the last day of our fiscal year. Substantially all of these amounts are subject to subsequent adjustment as the Company obtains additional information during the measurement period. The reported fair value of the accounts receivable is net of an estimate of uncollectible accounts of $100 thousand. We would expect the measurement period to be completed during the second quarter of 2010, except for any impact that may arise from the filing of Fullscope’s 2009 income tax returns. Any subsequent adjustments to the original fair value estimates occurring during the measurement period will result in an adjustment to the carrying value of goodwill.
Our initial fair value estimates related to the various identified intangible assets were determined under various valuation approaches including the Income Approach, Relief-from-Royalty Method, Discounted Cash Flow Method, Lost Profits Method and Avoided Cost Method. These valuation methods require management to project revenues, operating expenses, working capital investment, capital spending and cash flows for the reporting unit over a multiyear period, as well as determine the weighted average cost of capital to be used as a discount rate.
48
Table of Contents
EDGEWATER TECHNOLOGY, INC.
NOTES TO CONSOLIDATED FINANCIAL STATEMENTS–(Continued)
4. BUSINESS COMBINATIONS (Continued):
In connection with the Fullscope Acquisition, the Company recorded a $1.8 million deferred tax liability, which served to reduce the carrying value of the Company’s net deferred tax assets as of December 31, 2009. The Fullscope Acquisition was a stock purchase, and accordingly, the Company does not have a tax basis in the identified intangible assets recorded as part of the Fullscope Acquisition. The establishment of the deferred tax liability resulted in an increase to the Company’s goodwill asset.
The Fullscope Acquisition was accounted for as a purchase transaction and was effective after the close of business on December 31, 2009, the last day of our fiscal year. Accordingly, Fullscope’s assets and liabilities are reflected in the Company’s balance sheet as of December 31, 2009. The results of operations related to Fullscope will be included in the Company’s consolidated statements of operations beginning on January 1, 2010.
The following table sets forth supplemental unaudited pro forma financial information that assumes the acquisition of Fullscope was completed at the beginning of 2008. The information for the twelve-month periods ended December 31, 2009 and 2008 include the historical results of Edgewater and Fullscope. The unaudited pro forma results include estimates and assumptions regarding the amortization of intangible assets recognized as part of the acquisition, acquisition-related costs and interest income. The pro forma results, as presented, are not necessarily indicative of the results that would have occurred if the acquisition had occurred on the date indicated, or that may result in the future.
| For the Year Ended December 31, | ||||||||
| 2009 | 2008 | |||||||
| (Amounts in Thousands, Except Per Share Data) | ||||||||
| Pro forma revenues |
$ | 86,471 | $ | 94,710 | ||||
| Pro forma net loss |
$ | (1,131 | ) | $ | (49,837 | ) | ||
| Pro forma diluted earnings per share |
$ | (0.09 | ) | $ | (3.88 | ) | ||
On June 25, 2009, Fullscope sold to Microsoft Corporation (“Microsoft”) two software product add-on modules to Microsoft Dynamics AX 2009 at an aggregate purchase price of $7.5 million (the “Microsoft Sale”). The above 2009 unaudited pro forma financial information includes $6.8 million in revenue associated with the Microsoft Sale.
Acquisition of Lynx Business Intelligence Consulting, Inc.: On September 24, 2007, the Company acquired certain assets and liabilities of Lynx Business Intelligence Consulting, Inc. (“Lynx”), pursuant to the terms of an Asset Purchase Agreement (the “Lynx Acquisition). In addition to the Asset Purchase Agreement, the Company entered into an earnout agreement, specifying additional contingent earnout consideration that could be payable to Lynx. Earnout payments were conditioned upon the attainment of certain performance measurements for the Lynx business over a 12- to 24-month period from the date of the acquisition. Assuming all performance measurements were met within the predetermined performance ranges, additional earnout consideration of approximately $0.5 million would be payable, in cash, to Lynx.
On September 24, 2008, Lynx completed the first of two twelve-month earnout periods, during which the required minimum performance measurements were achieved. Accordingly, during the third quarter of 2008, the Company accrued $150 thousand in contingent earnout consideration payable to Lynx directly related to the completion of the first earnout period. The contingent earnout consideration, which was paid in cash during the fourth quarter of 2008, was recorded as an increase in goodwill in the Company’s consolidated balance sheet during the third quarter of 2008.
On September 23, 2009, Lynx completed its second and final earnout period. The Company accrued and paid $140 thousand in contingent earnout consideration to Lynx directly related to the completion of the second and final earnout period. The contingent earnout consideration, which was paid in cash during the fourth quarter of 2009, was recorded as an increase in goodwill in the Company’s consolidated balance sheet during the third quarter of 2009.
5. ACCOUNTS RECEIVABLE:
Included in accounts receivable are unbilled amounts totaling approximately $1.8 million and $3.8 million at December 31, 2009 and 2008, respectively, which relate to services performed during the year and billed in the subsequent year. The Company maintains allowances for potential losses which management believes are adequate to absorb any possible losses to be incurred in realizing the accounts receivable amounts recorded in the accompanying consolidated financial statements.
49
Table of Contents
EDGEWATER TECHNOLOGY, INC.
NOTES TO CONSOLIDATED FINANCIAL STATEMENTS–(Continued)
5. ACCOUNTS RECEIVABLE (Continued):
The following are the changes in the allowance for doubtful accounts:
| Year Ended December 31, | ||||||||||||
| 2009 | 2008 | 2007 | ||||||||||
| (In Thousands) | ||||||||||||
| Balance at beginning of year |
$ | 437 | $ | 375 | $ | 318 | ||||||
| Provisions for bad debts |
113 | 150 | 126 | |||||||||
| Charge-offs, net of recoveries |
(60 | ) | (88 | ) | (69 | ) | ||||||
| Balance at end of year |
$ | 490 | $ | 437 | $ | 375 | ||||||
6. PROPERTY AND EQUIPMENT:
Components of property and equipment consisted of the following:
| December 31, | ||||||||
| 2009 | 2008 | |||||||
| Furniture, fixtures and equipment |
$ | 1,418 | $ | 1,507 | ||||
| Computer equipment and software |
1,464 | 1,681 | ||||||
| Leasehold improvements |
3,608 | 3,854 | ||||||
| 6,490 | 7,042 | |||||||
| Less accumulated depreciation and amortization |
(3,193 | ) | (3,029 | ) | ||||
| Total |
$ | 3,297 | $ | 4,013 | ||||
Depreciation expense related to property and equipment for the years ended December 31, 2009, 2008 and 2007 totaled approximately $905 thousand, $1.0 million and $1.0 million, respectively.
The above table of property and equipment includes assets under capital leases as listed below.
| December 31, | ||||||||
| 2009 | 2008 | |||||||
| (In Thousands) | ||||||||
| Furniture, fixtures and equipment |
$ | 999 | $ | 999 | ||||
| Less accumulated depreciation and amortization |
(486 | ) | (324 | ) | ||||
| Total |
$ | 513 | $ | 675 | ||||
7. GOODWILL AND INTANGIBLE ASSETS:
The changes in the carrying amount of goodwill are as follows:
| Year Ended December 31, | ||||||||
| 2009 | 2008 | |||||||
| (In Thousands) | ||||||||
| Goodwill: |
||||||||
| Balance at beginning of year |
$ | — | $ | 46,033 | ||||
| Acquisitions consummated during 2007 |
(48 | ) | 49 | |||||
| Contingent earnout consideration related to 2007 acquisitions |
140 | 1,150 | ||||||
| Acquisition consummated during 2009 |
9,188 | — | ||||||
| Impairment charges |
— | (47,232 | ) | |||||
| Balance at end of year |
$ | 9,280 | $ | — | ||||
50
Table of Contents
EDGEWATER TECHNOLOGY, INC.
NOTES TO CONSOLIDATED FINANCIAL STATEMENTS–(Continued)
7. GOODWILL AND INTANGIBLE ASSETS (Continued):
Significant changes impacting the carrying value of goodwill during the year ended December 31, 2009 and 2008 included the following:
| • | In September 2009, Lynx completed its second and final earnout period. Accordingly, the Company accrued and paid $140 thousand in contingent earnout consideration to Lynx directly related to the completion of the second and final earnout period. The contingent earnout consideration, which was paid in cash during the fourth quarter of 2009, was recorded as an increase in goodwill in the Company’s consolidated balance sheet during the third quarter of 2009. |
| • | The Company increased the gross carrying value of goodwill by $9.2 million during the year ended December 31, 2009 in connection with the Fullscope Acquisition. The Fullscope Acquisition and the related fair value allocation of purchase price between assets, liabilities, intangible assets and goodwill is described further detail in Note 4. |
| • | At the end of the second quarter of 2008, as a result of the economic environment impacting our business and results and an overall decline in billable consultant utilization coupled with a material decline of the Company’s stock price since December of 2007, the Company determined that it had identified an impairment triggering event that would require an interim impairment evaluation of the carrying value of its goodwill and intangible assets. |
Upon determining that a triggering event had occurred, the Company performed the First Step of the goodwill impairment process and determined that the book value of the reporting unit exceeded the fair value of the reporting unit. Therefore, the Second Step of the goodwill impairment test was performed. The Second Step measured the amount of the impairment loss by comparing the implied fair value of the reporting unit goodwill with the carrying amount of that goodwill. For the definite-lived intangible asset impairment review, the Company compared the carrying value of the intangible asset against the estimated undiscounted cash flows to be generated over the remaining life of the intangible asset. Based upon the results, the Company recognized impairment charges of $23.5 million and $1.2 million during the second quarter of 2008 related to goodwill and other intangible assets, respectively.
| • | On December 2, 2008, in connection with the 2008 Annual Impairment Test, the Company performed its annual review for impairment. Based upon the valuation approaches described in Note 2 – “Summary of Significant Accounting Policies—Goodwill and Intangible Assets,” the Company determined that the carrying value of the reporting unit exceeded the fair value of the reporting unit, requiring the performance of the Second Step of the impairment review process. Based upon the results of the Second Step impairment review procedures, the Company identified that the remaining carrying value of the recorded goodwill was fully impaired. Accordingly, the Company recognized additional impairment charges of $23.6 million and $0.2 million during the fourth quarter of 2008 related to goodwill and other intangible assets, respectively. |
As of December 31, 2009, the net carrying amount of intangible assets consists of amounts related to business combination transactions consummated by the Company from 2004 to 2009. These transactions include the Fullscope, Vertical Pitch, Lynx, Alecian, NDS and Ranzal acquisitions. The Vertical Pitch, Lynx, Alecian and NDS transactions were completed in 2007 and 2006 and are discussed in greater detail in the Company’s previously filed reports with the SEC. The Ranzal acquisition was completed in 2004 and is discussed in greater detail in the Company’s previously filed reports with the SEC.
Other net intangibles amounted to $6.3 million and $3.6 million as of December 31, 2009 and 2008, respectively. Following is a summary of the Company’s identifiable intangible assets that are subject to amortization:
| December 31, 2009 | ||||||||||||
| Gross Carrying Amount |
Impairment Charges |
Accumulated Amortization |
Net Carrying Amount | |||||||||
| (In thousands) | ||||||||||||
| Identifiable intangibles: |
||||||||||||
| Non-compete agreements |
$ | 3,410 | $ | — | $ | 2,524 | $ | 886 | ||||
| Customer relationships |
11,640 | 1,362 | 6,762 | 3,516 | ||||||||
| Asset purchase agreement |
1,400 | — | — | 1,400 | ||||||||
| Trade name and trademark |
600 | — | 100 | 500 | ||||||||
| $ | 17,050 | $ | 1,362 | $ | 9,386 | $ | 6,302 | |||||
51
Table of Contents
EDGEWATER TECHNOLOGY, INC.
NOTES TO CONSOLIDATED FINANCIAL STATEMENTS–(Continued)
7. GOODWILL AND INTANGIBLE ASSETS (Continued):
| December 31, 2008 | ||||||||||||
| Gross Carrying Amount |
Impairment Charges |
Accumulated Amortization |
Net Carrying Amount | |||||||||
| (In thousands) | ||||||||||||
| Identifiable intangibles: |
||||||||||||
| Non-compete agreements |
$ | 2,910 | $ | — | $ | 2,313 | $ | 597 | ||||
| Customer relationships |
9,540 | 1,362 | 5,183 | 2,995 | ||||||||
| Trade name and trademark |
100 | — | 100 | — | ||||||||
| $ | 12,550 | $ | 1,362 | $ | 7,596 | $ | 3,592 | |||||
The Company increased the gross carrying value of intangible assets by $4.5 million during the year ended December 31, 2009 in connection with the Fullscope Acquisition. The Fullscope Acquisition and the related fair value allocation of purchase price between assets, liabilities, intangible assets and goodwill is described further detail in Note 4.
The intangible assets were identified and valued by the Company. The original estimated useful lives of the acquired identifiable intangible assets are as follows:
| Non-compete agreements | 4 to 5 years | |||
| Customer relationships | 4 to 7.5 years | |||
| Asset purchase agreement | 1.5 years | |||
| Trade name and trademark | 2 to 5 years |
We amortize intangible assets assuming no expected residual value over the periods in which the economic benefit of these assets is consumed. The weighted average amortization period for all intangible assets subject to amortization was 3.9 years, 3.4 years and 3.8 years as of December 31, 2009, 2008 and 2007, respectively. Amortization expense related to all intangible assets was $1.8 million, $2.7 million and $1.4 million in 2009, 2008 and 2007, respectively.
Estimated annual amortization expense for the next five years ending December 31, which encompasses the remaining useful life of the intangible assets, is as follows:
| Amortization Expense | |||
| (In Thousands) | |||
| 2010 |
$ | 3,084 | |
| 2011 |
$ | 1,810 | |
| 2012 |
$ | 863 | |
| 2013 |
$ | 302 | |
| 2014 |
$ | 197 | |
| Thereafter |
$ | 46 | |
8. INCOME TAXES:
We are subject to U.S. federal tax as well as income tax in multiple states, local and foreign jurisdictions. The Company’s 2003 through 2008 tax years are open and may be subject to examination by these taxing authorities. To our best knowledge we are no longer subject to U.S. federal and state and local tax examinations by tax authorities for years before 2002. Such examinations, if any, could result in challenges to tax positions taken and, accordingly, we may record adjustments to our tax provision based on the outcome of such matters. However, we believe that the resolution of any future income tax examination will not have a material effect on our financial position or results of operations.
The Company has elected to recognize interest and penalties related to income tax matters as a part of the income tax (benefit) provision.
52
Table of Contents
EDGEWATER TECHNOLOGY, INC.
NOTES TO CONSOLIDATED FINANCIAL STATEMENTS–(Continued)
8. INCOME TAXES (Continued):
Significant components of the Company’s income tax (benefit) provision consisted of the following:
| Year Ended December 31, | ||||||||||||
| 2009 | 2008 | 2007 | ||||||||||
| (In Thousands) | ||||||||||||
| Current tax (benefit) expense: |
||||||||||||
| Federal |
$ | (32 | ) | $ | (14 | ) | $ | 138 | ||||
| State |
(366 | ) | 605 | 472 | ||||||||
| Foreign |
(164 | ) | 220 | — | ||||||||
| (562 | ) | 811 | 610 | |||||||||
| Deferred tax (benefit) expense: |
||||||||||||
| Federal |
(1,667 | ) | (6,212 | ) | (1,891 | ) | ||||||
| State |
1,151 | (3,548 | ) | 81 | ||||||||
| Change in valuation allowance |
— | 9,622 | (1,896 | ) | ||||||||
| (516 | ) | (138 | ) | (3,706 | ) | |||||||
| Unrecognized tax benefit |
31 | 39 | 200 | |||||||||
| Income tax (benefit) provision |
$ | (1,047 | ) | $ | 712 | $ | (2,896 | ) | ||||
Deferred income taxes reflect the net tax effects of temporary differences between the carrying amounts of assets and liabilities for financial reporting purposes and the amounts used for income tax purposes. Significant components of the Company’s deferred tax assets and liabilities as of December 31, 2009 and 2008 are as follows:
| December 31, | ||||||||
| 2009 | 2008 | |||||||
| (In Thousands) | ||||||||
| Deferred income tax assets: |
||||||||
| Net operating loss carryforwards and credits |
$ | 28,412 | $ | 20,596 | ||||
| Acquired intangible assets |
10,177 | 11,211 | ||||||
| Non-deductible reserves and accruals |
611 | 691 | ||||||
| Share-based compensation |
1,207 | 943 | ||||||
| Depreciation |
52 | 91 | ||||||
| Total deferred income tax assets |
40,459 | 33,532 | ||||||
| Deferred income tax liabilities: |
||||||||
| Acquired intangible assets |
(1,800 | ) | — | |||||
| Other |
(59 | ) | (118 | ) | ||||
| Total deferred income tax liabilities |
(1,859 | ) | (118 | ) | ||||
| Valuation allowance |
(17,492 | ) | (11,021 | ) | ||||
| Deferred income tax, net |
$ | 21,108 | $ | 22,393 | ||||
Components of the net deferred tax assets (liabilities) reported in the accompanying consolidated balance sheets are as follows:
| December 31, 2009 | December 31, 2008 | |||||||||||||||
| Current | Long-term | Current | Long-term | |||||||||||||
| (In Thousands) | ||||||||||||||||
| Assets |
$ | 611 | $ | 39,870 | $ | 1,525 | $ | 32,089 | ||||||||
| Liabilities |
(65 | ) | (1,816 | ) | (83 | ) | (117 | ) | ||||||||
| Valuation allowance |
(198 | ) | (17,294 | ) | (500 | ) | (10,521 | ) | ||||||||
| Net deferred tax asset |
$ | 348 | $ | 20,760 | $ | 942 | $ | 21,451 | ||||||||
53
Table of Contents
EDGEWATER TECHNOLOGY, INC.
NOTES TO CONSOLIDATED FINANCIAL STATEMENTS–(Continued)
8. INCOME TAXES (Continued):
Significant deferred tax attributes and current year activity within the Company’s deferred tax accounts included the following:
Acquired Deferred Tax Attributes: As discussed in Note 4, on December 31, 2009, the Company acquired the outstanding stock of Fullscope, Inc. In connection with the Fullscope Acquisition, the Company assumed Fullscope’s deferred tax attributes as of the date of the acquisition. In connection with our initial fair value assessments of assets, liabilities, intangible assets and goodwill, the Company reviewed the carrying value of the acquired deferred tax attributes. Based upon initial fair value estimates, the Company recognized net operating loss carryforwards and credits totaling $6.4 million, which are reflected in the Company’s deferred tax balances as of December 31, 2009.
A significant portion of the deferred tax attributes assumed in connection with the acquisition are related to Fullscope’s federal net operating loss carryforwards. Prior to the acquisition, the federal net operating loss carryforwards were subject to Internal Revenue Code Section 382 Limitations (“Section 382 Limitations”). As a result of our acquisition, the future use of Fullscope’s federal net operating loss carryforwards will be subject to further Section 382 Limitations. The Company, as part of its purchase accounting, has applied a full valuation allowance against the gross carrying value of Fullscope’s net operating loss carryforwards and tax credits due to uncertainty with respect to our ability to realize a future tax benefit related to these attributes.
The establishment of the valuation allowance served to increase the goodwill recognized by the Company. We will continue to evaluate Fullscope’s deferred tax asset attributes during the measurement period as we receive updated information. Any subsequent adjustment to the carrying value of Fullscope’s deferred tax attributes during the measurement period that relate to facts that existed as of December 31, 2009 will result in an adjustment to goodwill. All other subsequent adjustment to Fullscope’s deferred tax attributes will be recorded through income tax expense.
Additionally, in connection with the Fullscope Acquisition, the Company recorded a $1.8 million deferred tax liability, which served to reduce the carrying value of the Company’s net deferred tax assets as of December 31, 2009. The Fullscope Acquisition was a stock purchase, and accordingly, the Company does not have a tax basis in the identified intangible assets recorded as part of the Fullscope Acquisition. The establishment of the deferred tax liability resulted in an increase to the Company’s goodwill asset.
Net Operating Loss Carryforwards and Credits: As of December 31, 2009, including the deferred tax attributes associated with the Fullscope Acquisition, we have tax affected net operating loss carryforwards for federal income tax purposes of approximately $23.5 million and alternative minimum, worker’s opportunity and foreign tax credits of approximately $2.6 million, which expire at various intervals through 2029. However, $16.8 million of the Company’s federal net operating loss carryforwards and $1.0 million of workers opportunity tax credits are set to expire in 2020. In addition, the Company has various tax affected net operating loss carryforwards for state income tax purposes of approximately $0.9 million, which expire at various intervals through 2029. The Internal Revenue Code contains provisions that limit the amount of net operating loss and tax credit carryforwards available to be used in any given year in the event of certain circumstances, including significant changes in ownership interests. These limitations may result in the expiration of our historical net operating loss carryforwards and tax credits prior to their utilization.
Annual changes to the deferred tax valuation allowance are as follows:
| Year Ended December 31, | |||||||||||
| 2009 | 2008 | 2007 | |||||||||
| (In Thousands) | |||||||||||
| Balance, beginning of year |
$ | 11,021 | $ | 4,579 | $ | 6,474 | |||||
| Additions |
— | 9,890 | 1,324 | ||||||||
| Allowance reversals |
— | (269 | ) | (3,219 | ) | ||||||
| Write-offs |
— | (3,179 | ) | — | |||||||
| Allowance established in connection with Fullscope Acquisition (Note 4) |
6,471 | — | — | ||||||||
| Balance, end of year |
$ | 17,492 | $ | 11,021 | $ | 4,579 | |||||
54
Table of Contents
EDGEWATER TECHNOLOGY, INC.
NOTES TO CONSOLIDATED FINANCIAL STATEMENTS–(Continued)
8. INCOME TAXES (Continued):
At December 31, 2009, the Company weighed both positive (projections and acquisition of Fullscope) and negative (recent financial results) evidence in assessing the recoverability of our deferred tax assets. Our judgment in assessing the evidence was that the negative and positive evidence were effectively offset and our valuation allowance levels were appropriate.
During 2008, the Company recorded adjustments to its valuation allowance including a $9.9 million increase in the valuation allowance in connection with management’s estimate of the future realizability of federal net operating loss carryforwards and certain tax credits and a write-off of $3.2 million related to a 1999 foreign tax credit (“FTC”).
The 2008 Impairment Charges generated an increase of $11.9 million in the gross carrying value of the Company’s deferred tax assets. The increase was directly related to the recognition of the future deductible temporary timing differences associated with the impairment of the tax deductible goodwill and intangible assets. Additionally, the 2008 Impairment Charges also served to place the Company into a historical three-year cumulative loss position. As is our practice, the Company assessed the recoverability of our deferred tax assets on a more likely than not basis. The review primarily centered upon the carrying value and future recoverability of the Company’s federal net operating loss carryforwards and credits, a majority of which were set to expire on December 31, 2020, and a consideration of certain other alternative minimum and foreign tax credits.
The Company’s forecasts and projections were a key assumption utilized in our review. While the Company’s current forward looking forecasts and projections support a continued profitability trend, we are projecting a reduction in near-term earnings which reflect the current economic climate impacting IT consulting companies. Based upon our review, we determined that it was not more than likely that the Company will be able to fully realize future economic benefit from its federal net operating loss carryforwards and other tax-related credits. Accordingly, the Company recorded an increase to its deferred tax valuation allowance of $9.9 million during the fourth quarter of 2008, reducing the net carrying value of the Company’s deferred tax assets to their estimated more likely than not realizable amount.
During 2007, in light of operating results and the additive effect of the 2007 Acquisitions, the Company completed certain analyses related to the historical valuation allowance that had been provided against certain deferred tax assets. As a result of this review, the Company reversed approximately $3.2 million in valuation allowance. The allowance reversal was primarily based upon the Company’s judgment as of and during the year ended December 31, 2007, which considered current and anticipated future profitability, that it was more likely than not that the Company would be able to fully realize future economic benefit from its federal and certain state net operating loss carryforwards against which the Company had provided a valuation allowance. Additionally, during 2007, the Company increased its valuation allowance by $1.3 million in connection with its anticipated conversion of the 1999 FTC, which was set to expire at the end of 2009, into additional federal net operating loss carryforwards. The 2007 increase in the valuation allowance adjusted the $4.8 million gross carrying value of the 1999 FTC to a net deferred tax amount of $1.6 million, or its expected conversion amount as of December 31, 2007.
The Company considers scheduled reversals of deferred tax liabilities, projected future taxable income, ongoing tax planning strategies and other matters, including the period over which our deferred tax assets will be recoverable, in assessing the need for and the amount of the valuation allowance. In the event that actual results differ from these estimates or we adjust these estimates in future periods, an adjustment to the valuation allowance may be recorded, which could materially impact our financial position and net income (loss) in the period of the adjustment.
55
Table of Contents
EDGEWATER TECHNOLOGY, INC.
NOTES TO CONSOLIDATED FINANCIAL STATEMENTS–(Continued)
8. INCOME TAXES (Continued):
The differences in income taxes determined by applying the statutory federal tax rate of 34% to (loss) income from continuing operations before income taxes and the amounts recorded in the accompanying consolidated statements of operations result from the following:
| Year Ended December 31, | |||||||||||||||||||||
| 2009 | 2008 | 2007 | |||||||||||||||||||
| Amount | Rate | Amount | Rate | Amount | Rate | ||||||||||||||||
| (Dollar Amounts In Thousands) | |||||||||||||||||||||
| Income tax at statutory rate |
$ | (1,662 | ) | 34.0 | % | $ | (15,744 | ) | 34.0 | % | $ | 2,011 | 34.0 | % | |||||||
| Add (deduct): |
|||||||||||||||||||||
| State income taxes, net of federal tax benefit |
(279 | ) | 5.7 | (2,092 | ) | 4.5 | 318 | 5.4 | |||||||||||||
| Foreign income taxes |
(223 | ) | 4.6 | 220 | (0.5 | ) | |||||||||||||||
| Revaluation of deferred tax attributes due to change in effective state income tax rate |
929 | (19.0 | ) | — | — | — | — | ||||||||||||||
| Non-deductible transaction costs, intangible assets and goodwill amortization charges and other permanent items |
173 | (3.5 | ) | 8,753 | (18.9 | ) | 19 | 0.3 | |||||||||||||
| Additions (reversals) of valuation allowance against certain deferred tax assets |
— | — | 9,622 | (20.8 | ) | (1,896 | ) | (32.1 | ) | ||||||||||||
| Benefit related to recognition of foreign tax credits and other deferred tax asset attributes |
— | — | — | — | (3,606 | ) | (61.0 | ) | |||||||||||||
| Unrecognized tax benefits |
31 | (0.6 | ) | 39 | (0.1 | ) | 200 | 3.4 | |||||||||||||
| Other, net |
(16 | ) | 0.3 | (86 | ) | 0.3 | 58 | 1.0 | |||||||||||||
| $ | (1,047 | ) | (21.5 | )% | $ | 712 | (1.5 | )% | $ | (2,896 | ) | (49.0 | )% | ||||||||
In accordance with our evaluation of unrecognized tax benefits, we have established a liability representing our estimated amount of unrecognized tax benefits, plus an additional provision for penalties and interest. Additionally, on December 31, 2009, in connection with the Fullscope Acquisition, we assumed a liability for penalties of $25 thousand.
A reconciliation of the beginning and ending balances of the total amounts of gross unrecognized tax benefits is as follows:
| Year Ended December 31, | ||||||||||
| 2009 | 2008 | 2007 | ||||||||
| (In Thousands) | ||||||||||
| Gross unrecognized tax benefits at beginning of year |
$ | 239 | $ | 200 | $ | — | ||||
| Decreases) increases in tax positions in the current year |
— | 12 | 150 | |||||||
| Settlements |
(13 | ) | — | — | ||||||
| Accrued penalties acquired in connection with Fullscope Acquisition (Note 4) |
25 | — | — | |||||||
| Accrued penalties and interest |
31 | 27 | 50 | |||||||
| Gross unrecognized tax benefits at end of year |
$ | 282 | $ | 239 | $ | 200 | ||||
As of December 31, 2009, the $282 thousand tax benefit, if recognized, would decrease our 2009 annual effective tax rate from 21.5% to a tax rate of 18.9%. We do not expect our unrecognized tax benefits to change significantly over the next twelve months.
9. EMPLOYEE BENEFIT PLANS:
The Company has a 401(k) tax deferred savings plan that is available to all employees who satisfy certain minimum hour requirements each year (the “Plan”). The Company matches 30% of each participant’s annual contribution under the Plan, up to 6% of each participant’s annual base salary. Contributions by the Company to the plan were approximately $357 thousand, $437 thousand and $394 thousand in each of the years ended December 31, 2009, 2008 and 2007.
56
Table of Contents
EDGEWATER TECHNOLOGY, INC.
NOTES TO CONSOLIDATED FINANCIAL STATEMENTS–(Continued)
10. EMPLOYEE SHARE-BASED COMPENSATION PLANS:
Overview
We recognize as compensation expense the total fair value of share-based awards, over the requisite employee service period (generally the vesting period of the grant). We have used and expect to continue to use the Black-Scholes option-pricing model to compute the estimated fair value of stock-based awards on the date of grant. The Black-Scholes option pricing model includes assumptions regarding dividend yields, expected volatility, expected option term and risk-free interest rates. We estimate expected volatility based upon a combination of historical, implied and adjusted historical volatility. The risk-free interest rate is based on the U.S. treasury yield curve in effect at the time of grant.
Share-Based Compensation Plans
The Company has three share-based compensation plans which are described below; the Amended and Restated 1996 Stock Option Plan (“1996 Plan”), the Amended and Restated 2000 Stock Option Plan (“2000 Plan”), the 2003 Equity Incentive Plan (“2003 Plan”), and the 2008 Omnibus Incentive Plan (“2008 Plan”), collectively the “Equity Plans.” Specifics related to each plan are as follows:
1996 Plan: Grants for shares under the 1996 Plan were limited to 15% of our Company’s outstanding common stock. The only grants outstanding under the 1996 Plan are non-qualified stock option grants, with total qualified stock option grants under the 1996 Plan were limited to 650,000 shares of the Company’s common stock. No grants of qualified stock options were ever issued under the 1996 Plan. The 1996 Plan expired on June 30, 2006; thus, no further grants will be awarded after June 30, 2006, but options awarded prior to that date remain outstanding subject to the terms of the 1996 Plan and any related option agreements.
2000 Plan: The 2000 Plan provides for grants of non-qualified stock options of our Company’s common stock. The 2000 Plan is limited to grants covering up to 4.0 million shares of our Company’s common stock.
2003 Plan: The 2003 Plan provides for grants of non-qualified stock options and awards of restricted shares of our Company’s common stock. The 2003 Plan is limited to stock option grants and restricted stock awards covering up to 500,000 shares of our Company’s common stock.
2008 Plan: The 2008 Plan provides for a broad range of awards, including non-qualified stock options and awards of restricted shares of our Company’s common stock. The 2008 Plan authorizes the issuance of 1.5 million shares of our Company’s common stock plus certain authorized awards or shares under other Company share-based compensation plans to the extent the awards or shares are not utilized or forfeited. The 2008 Plan became effective on June 11, 2008.
As of December 31, 2009, there are 38,242, 47,950 and 1,058,362 shares available for future grant under the 2000 Plan, 2003 Plan and 2008 Plan, respectively. No shares were available for issuance under the 1996 Plan, as it expired on June 30, 2006.
Option Plans (Excluding Restricted Share Awards)
The Company’s Equity Plans authorize the granting of qualified and non-qualified stock options to officers, employees and certain persons who are not employees on the date of grant, including certain non-employee members of the Board of Directors. All such options are for shares of the Company’s common stock.
The Equity Plans provide that the exercise price of the stock options will be determined based upon the fair market value of the Company’s common stock on the NASDAQ Global Market System as of the date of grant. Prior to 2007, options granted to officers and employees generally vested in three, four or five year periods, dependent upon the plan or award, and expired on the tenth anniversary of the grant date. Beginning in 2007, certain option awards were made with a shorter expiration date (seven years from the date of grant) and a longer vesting period (up to six years). Annual options granted to non-employee members of the Company’s Board of Directors generally vest in equal quarterly increments and expire on the fifth anniversary of the grant date, and option grants issued upon their initial election to the Company’s Board of Directors vest in equal one-third increments as of the date of grant and the first and second anniversary of the date of grant.
During the year ended December 31, 2009, the Company granted 930,687 stock options (excluding issuances of restricted share awards, if any, issued under either the 2000 Plan or the 2008 Plan), principally as part of a long term incentive program and in connection with the Company’s Board of Director compensation program. The fair value of each option award is estimated on the date of grant using the Black-Sholes option pricing model utilizing the assumptions noted in the following table. Expected volatility is based upon historical volatility of the Company’s common stock. The expected life (period of time the award will be outstanding) was estimated using the historical exercise behavior of the Company’s employees. The risk-free interest rate is based on the U.S. Treasury yield curve in effect at the time of grant. The Company applied an estimated forfeiture rate of 26.5% to the calculated fair value of each option. The applied forfeiture rate utilized by the Company was based upon the historical forfeiture experience of the Equity Plans.
57
Table of Contents
EDGEWATER TECHNOLOGY, INC.
NOTES TO CONSOLIDATED FINANCIAL STATEMENTS–(Continued)
10. EMPLOYEE SHARE-BASED COMPENSATION PLANS (Continued):
The fair value of each option award granted during 2009, 2008 and 2007, was based upon the following weighted-average assumptions:
| Year Ending December 31, | |||||||||
| 2009 | 2008 | 2007 | |||||||
| Expected volatility |
52.0 | % | 45.1 | % | 41.9 | % | |||
| Expected dividend yield |
— | % | — | % | — | % | |||
| Expected life (in years) |
3.36 | 3.57 | 5.3 | ||||||
| Risk-free interest rate |
1.4 | % | 2.5 | % | 4.7 | % | |||
The weighted-average grant-date fair value of all options granted (excluding restricted share awards) during the year ended December 31, 2009, 2008 and 2007 was $1.11, $1.40 and $4.00 per share, respectively. The total fair value of share awards vested during the years ended December 31, 2009, 2008 and 2007 was $866 thousand, $1.0 million and $653 thousand, respectively.
A summary of stock option activity under the Equity Plans (excluding restricted share awards) is presented below:
| Stock Options: |
Shares Under Options |
Weighted Average Exercise Price Per Share |
Weighted Average Remaining Contractual Term (Years) |
Aggregate Intrinsic Value | |||||||
| (In Thousands) | |||||||||||
| Outstanding at January 1, 2009 |
3,717,868 | $ | 5.90 | ||||||||
| Granted |
930,687 | 2.81 | |||||||||
| Exercised |
— | — | |||||||||
| Forfeited or expired |
(542,897 | ) | 5.90 | ||||||||
| Outstanding at December 31, 2009 |
4,105,658 | $ | 5.20 | 3.12 | $ | 182 | |||||
| Vested and expected to vest at December 31, 2009 |
3,813,707 | $ | 5.31 | 3.03 | $ | 143 | |||||
| Exercisable at December 31, 2009 |
3,005,617 | $ | 5.71 | 1.94 | $ | 34 | |||||
The total intrinsic value of stock options exercised during 2008 and 2007 was approximately $108 thousand and $1.9 million, respectively. No stock options were exercised during 2009.
2003 Equity Incentive Plan and 2008 Omnibus Incentive Plan – Restricted Share Awards
The 2003 Plan and the 2008 Plan also authorize the granting of restricted share awards to officers, employees and certain non-employee members of the Board of Directors (the “Restricted Share Plans”). Restricted share awards are made at prices determined by the Compensation Committee of the Company’s Board of Directors (the “Compensation Committee”) and are compensatory in nature. Employees granted restricted share awards are required to provide consideration for the shares at the share price set by the Compensation Committee, which historically has equaled the par value per share the Company’s common stock ($0.01 per share). Shares of restricted stock generally vest over a five-year period, during which time the Company has the right to repurchase any unvested shares at the amount paid if the relationship between the employee and the Company ceases. As of December 31, 2009, 71,230 restricted share awards were subject to repurchase by the Company under the restricted stock agreements. The Company records compensation expense related to restricted share awards on a straight-line basis over the vesting term of the award.
No restricted share awards were issued to employees during the year ended December 31, 2009 and 2008. During the year ended December 31, 2007, the Company issued 37,800 restricted share awards to employees at a purchase price of $0.01 per share. Additionally, the Company recognized share-based compensation expense of $338 thousand, $448 thousand and $471 thousand during the years ended December 31, 2009, 2008 and 2007, respectively related to restricted share awards.
58
Table of Contents
EDGEWATER TECHNOLOGY, INC.
NOTES TO CONSOLIDATED FINANCIAL STATEMENTS–(Continued)
10. EMPLOYEE SHARE-BASED COMPENSATION PLANS (Continued):
A summary of non-vested restricted share activity under the Restricted Share Plans is presented below:
| Restricted Share Awards: |
Non-vested Restricted Shares |
Weighted Average Grant Date Fair Value | ||||
| Non-vested at January 1, 2009 |
152,020 | $ | 6.27 | |||
| Granted |
— | — | ||||
| Vested |
(63,250 | ) | 6.24 | |||
| Forfeited or expired |
(17,540 | ) | 6.84 | |||
| Non-vested at December 31, 2009 |
71,230 | $ | 6.23 | |||
| Expected to vest at December 31, 2009 |
71,230 | $ | 6.23 | |||
The total fair value of stock awards vested during the years ended December 31, 2009, 2008 and 2007 was $395 thousand, $529 thousand and $426 thousand, respectively.
Employee Stock Purchase Plan
In June 2008, in connection with the Company’s Annual Meeting of Stockholders, the stockholders of the Company approved, and the Company adopted, the Edgewater Technology, Inc. 2008 Employee Stock Purchase Plan (the “2008 ESPP Plan”). The 2008 ESPP Plan became effective on October 1, 2008. The 2008 ESPP Plan allows a maximum of 500,000 shares of the Company’s common stock, plus any shares of common stock that were reserved for issuance, but were not issued, under the Edgewater Technology, Inc. 1999 Employee Stock Purchase Plan (“1999 ESPP Plan”) to be purchased by Edgewater employees.
Prior to the effective date of the 2008 ESPP Plan, the Company offered eligible employees the option to purchase the Company’s common stock under the 1999 ESPP Plan. The 1999 ESPP Plan allowed a maximum of 700,000 shares to be purchased by employees and as of December 31, 2008, no shares were available for future issuance. The 2008 ESPP Plan and the 1999 ESPP Plan are collectively referred to in this document as the “ESPP Plans.”
The ESPP Plans offers eligible employees the option to purchase the Company’s Common Stock at 85% of the lower of the closing price, as quoted on NASDAQ, on either the first trading day or the last trading day of the quarterly purchase period. Enrollment periods occur on January 1 and July 1. Purchases occur every three months. The amount each employee can purchase is limited to the lesser of (i) 10% of an employee’s annual base salary or (ii) $25,000 of stock value on an annual basis. The ESPP is designed to qualify for certain tax benefits for employees under section 423 of the Internal Revenue Code.
During the year ended December 31, 2009, 2008 and 2007, the Company issued 179,901, 143,949 and 84,741 shares, respectively, to employees under the ESPP Plans.
The fair value of each ESPP offering was estimated on the date of grant using the Black-Sholes option pricing model that uses the weighted-average assumptions noted in the following table. The risk-free interest rate is based on the U.S. Treasury yield curve in effect at the time of grant. Expected volatility was based on historical volatility.
| Year Ending December 31, | |||||||||
| 2009 | 2008 | 2007 | |||||||
| Expected volatility |
74.5 | % | 39.4 | % | 34.9 | % | |||
| Expected dividend yield |
— | % | — | % | — | % | |||
| Expected life (in years) |
0.25 | 0.25 | 0.25 | ||||||
| Risk-free interest rate |
0.1 | % | 1.8 | % | 4.7 | % | |||
The weighted-average fair value of the shares issued under the ESPP Plans in 2009, 2008 and 2007, based upon the assumptions in the preceding table, was $0.80, $1.30 and $1.73, respectively.
Compensation Expense
Share-based compensation expense under all of the Company’s share-based plans was $1.1 million, $1.6 million and $1.5 million in the years ended December 31, 2009, 2008 and 2007, respectively.
59
Table of Contents
EDGEWATER TECHNOLOGY, INC.
NOTES TO CONSOLIDATED FINANCIAL STATEMENTS–(Continued)
10. EMPLOYEE SHARE-BASED COMPENSATION PLANS (Continued):
Cash received from stock option and ESPP exercises under all share-based payment arrangements was $431 thousand, $1.0 million and $2.9 million during the years ended December 31, 2009, 2008 and 2007, respectively. The Company recognized related tax benefits of $264 thousand, $375 thousand and $328 thousand for the years ended December 31, 2009, 2008 and 2007, respectively.
As of December 31, 2009, unrecognized compensation expense, net of estimated forfeitures, related to the unvested portion of all share-based compensation arrangements was approximately $1.3 million and is expected to be recognized over a period of 3.3 years.
The Company is using previously purchased treasury shares for all shares issued for options, restricted share awards and ESPP issuances. Shares may also be issued from unissued share reserves.
11. CAPITAL STOCK:
Common and Preferred Stock -
The Company’s stockholders had authorized 48.0 million shares of common stock available for issuance as of December 31, 2009 and 2008, and had 2.0 million shares of preferred stock available for issuance as of December 31, 2009 and 2008.
Stockholder Rights Plan -
The Company has a stockholder rights plan, commonly referred to as a “poison pill,” that may discourage an attempt to obtain control by means of a tender offer, merger, proxy contest or otherwise. Under this plan, our Board of Directors can issue preferred stock in one or more series without stockholder action. If a person acquires 20% or more of our outstanding shares of common stock, except for certain institutional stockholders, who may acquire up to 25% of our outstanding shares of common stock, then rights under this plan would be triggered, which would significantly dilute the voting rights of any such acquiring person. Certain provisions of the General Corporation Law of Delaware may also discourage someone from acquiring or merging with us. No preferred stock has been issued as of December 31, 2009.
Stock Repurchase Program -
In December 2007, our Board of Directors (the “Board”) authorized a stock repurchase program for up to $5.0 million of common stock on the open market or through privately negotiated transactions from time-to-time through December 31, 2008 (the “Stock Repurchase Program”). In September 2008, the Board authorized both an increase to and an extension of the Stock Repurchase Program. The Board increased the maximum dollar value of shares to be purchased under the Stock Repurchase Program by $3.5 million, to a total of $8.5 million and extended the period during which purchases could be made from December 31, 2008 to September 24, 2009 (the “Repurchase Period”). On September 23, 2009, the Board authorized an extension of the Repurchase Period from September 24, 2009 to September 23, 2010, while maintaining the Stock Repurchase Program’s cumulative maximum dollar repurchase limitation.
The timing and amount of the purchases will be based upon market conditions, securities law considerations and other factors. The Stock Repurchase Program does not obligate the Company to acquire a specific number of shares in any period and may be modified, suspended, extended or discontinued at any time, without prior notice.
The Company has repurchased a total of 1,548,449 shares of common stock since the inception of the Stock Repurchase Program at an aggregate purchase price of $5.7 million.
12. RELATED PARTY TRANSACTIONS:
Lease Agreement. Our Company entered into a lease agreement in 1999 (the “Original Lease”), which was modified in June 2000, with a stockholder who is a former officer and director and an immediate family member of one of our directors (the “Landlord”). The lease pertained to certain parcels of land and buildings in Fayetteville, Arkansas for our former corporate headquarters that were included in our Company’s discontinued operations since 2001. On June 28, 2007, the Company entered into a Lease Termination Agreement (the “Termination Agreement”) with the Landlord to terminate the Original Lease as of June 30, 2007, prior to its scheduled June 30, 2009 expiration date.
The Termination Agreement required the Company to make a lump sum payment of $503 thousand, which was paid on June 28, 2007 (the “Termination Payment”), representing the remaining lease payments due under the Original Lease, which was to expire on June 30, 2009, and a partial payment of projected 2008 real estate taxes. The amounts paid by the Company in connection with the Termination Agreement were previously accrued at the time the Company discontinued operations of certain divisions, which were sold in 2000 and 2001.
60
Table of Contents
EDGEWATER TECHNOLOGY, INC.
NOTES TO CONSOLIDATED FINANCIAL STATEMENTS–(Continued)
12. RELATED PARTY TRANSACTIONS (Continued):
Rent payments, including the Termination Payment, related to these facilities totaled approximately $0.6 million (including the Termination Payment noted above) and $0.2 million for the years ended December 31, 2007 and 2006, respectively. No rent payments were made in 2009 and 2008 as a result of the Termination Agreement.
13. RESTRUCTURING CHARGES:
In April 2009, the Company initiated cost savings measures, including a reduction of staff, targeted at maintaining operating costs in line with revenue expectations. The measures taken by the Company resulted in severance costs totaling $387 thousand. All related severance costs were accrued by the Company during the second quarter and were recorded as a part of either cost of revenue or selling, general and administrative expense. Severance costs recorded to cost of revenue and selling, general and administrative expenses totaled $375 thousand and $12 thousand, respectively. All related severance costs have been fully paid as of December 31, 2009.
14. COMMITMENTS AND CONTINGENCIES:
Commitments. We have lease financing arrangements (the “Capital Lease Arrangements”) with a bank related to certain property and equipment, as further described in Note 6. Payments under the Capital Lease Arrangements are to be made over a period of 48 to 60 months and have a blended interest rate of 6.03% per annum on the outstanding principal balances. As of December 31, 2009 and 2008, our outstanding obligations under the Capital Lease Arrangements totaled $420 thousand, $635 thousand, respectively. During the year ended December 31, 2009, 2008 and 2007, the Company made payments of principal and interest totaling $251 thousand, $251 thousand and $185 thousand, respectively, under the Capital Lease Arrangements.
We lease office space and certain equipment under capital and operating leases that expire at various times through 2016. Annual future minimum lease payments required under capital leases, together with the present value of such payments, and future minimum lease payments required under operating leases that have initial or remaining non-cancelable lease terms in excess of one year as of December 31, 2009, were as follows:
| Year Ending December 31, | Capital Leases |
Operating Leases | ||||
| (In Thousands) | ||||||
| 2010 |
$ | 243 | 1,568 | |||
| 2011 |
158 | 1,549 | ||||
| 2012 |
53 | 1,350 | ||||
| 2013 |
— | 1,258 | ||||
| 2014 |
— | 1,331 | ||||
| Thereafter |
— | 2,330 | ||||
| 454 | $ | 9,386 | ||||
| Less amounts representing interest |
34 | |||||
| $ | 420 | |||||
Rent payments under operating leases were $1.7 million and $1.9 million for the years ended December 31, 2009 and 2008, respectively. Rent payments under operating leases, including amounts paid to related parties included in discontinued operations, was approximately $2.3 million for the year ended December 31, 2007.
Contingencies. We are sometimes a party to litigation incidental to our business. We believe that these routine legal proceedings will not have a material adverse effect on our financial position. We maintain insurance in amounts with coverages and deductibles that we believe are reasonable. However, there can be no assurance that such coverages will continue to be available on reasonable terms or will be available in sufficient amounts to cover possible claims that may arise in the future, or that our insurers will not disclaim coverage as to any future claim. The successful assertion of one or more claims against the Company that exceed available insurance coverages or changes in the Company’s insurance policies, including premium increases or the imposition of a large deductible or co-insurance requirements, would have a material adverse effect on the Company’s business, results of operations and financial condition.
The Company had approximately $282 thousand and $239 thousand of unrecognized tax benefits, penalties and interest expense related to uncertain tax positions as of December 31, 2009 and 2008, respectively.
61
Table of Contents
| ITEM 8B. |
Unaudited Supplementary Quarterly Financial Information
(In Thousands, Except Per Share Data)
The following tables set forth certain unaudited supplementary quarterly financial information for the years ended December 31, 2009 and 2008. The quarterly operating results are not necessarily indicative of future results of operations.
| 2009 | ||||||||||||||||||||
| 1st Quarter | 2nd Quarter | 3rd Quarter | 4th Quarter | Total | ||||||||||||||||
| Total revenue |
$ | 14,880 | $ | 12,037 | $ | 11,777 | $ | 11,391 | $ | 50,085 | ||||||||||
| Gross profit |
4,648 | 3,134 | 4,192 | 4,124 | 16,098 | |||||||||||||||
| Net loss |
(454 | ) | (1,278 | ) | (249 | ) | (1,858 | ) | (3,839 | ) | ||||||||||
| Basic loss per share |
$ | (0.04 | ) | $ | (0.11 | ) | $ | (0.02 | ) | $ | (0.15 | ) | $ | (0.32 | ) | |||||
| Diluted loss per share |
$ | (0.04 | ) | $ | (0.11 | ) | $ | (0.02 | ) | $ | (0.15 | ) | $ | (0.32 | ) | |||||
| 2008 | ||||||||||||||||||||
| 1st Quarter | 2nd Quarter | 3rd Quarter | 4th Quarter | Total | ||||||||||||||||
| Total revenue |
$ | 19,461 | $ | 19,613 | $ | 18,345 | $ | 16,324 | $ | 73,743 | ||||||||||
| Gross profit |
7,406 | 7,645 | 7,467 | 6,270 | 28,788 | |||||||||||||||
| Net income (loss) (1) |
203 | (20,090 | ) | 788 | (27,919 | ) | (47,018 | ) | ||||||||||||
| Basic income (loss) per share |
$ | 0.02 | $ | (1.52 | ) | $ | 0.06 | $ | (2.30 | ) | $ | (3.66 | ) | |||||||
| Diluted income (loss) per share |
$ | 0.02 | $ | (1.52 | ) | $ | 0.06 | $ | (2.30 | ) | $ | (3.66 | ) | |||||||
| (1) | During both the second and fourth quarters of 2008, the Company recorded $24.7 million and $23.8 million of impairment charges, respectively, related to the carrying values of its goodwill and certain other intangible assets. Additional details can be found in the Company’s previously filed reports with the SEC. |
62
Table of Contents
| ITEM 9. | CHANGES IN AND DISAGREEMENTS WITH ACCOUNTANTS ON ACCOUNTING AND FINANCIAL DISCLOSURE |
None.
| ITEM 9A. | CONTROLS AND PROCEDURES |
(a) Evaluation of Disclosure Controls and Procedures
We maintain disclosure controls and procedures, which we have designed to ensure that material information related to the Company, including our consolidated subsidiaries, is properly identified and evaluated on a regular basis and disclosed in accordance with all applicable laws and regulations. In response to recent legislation and proposed regulations, we reviewed our disclosure controls and procedures. We also established a disclosure committee, which consists of certain members of our senior management. The President and Chief Executive Officer and the Chief Financial Officer of Edgewater Technology, Inc. (its principal executive officer and principal financial officer, respectively) have concluded, based on their evaluations as of the end of the period covered by this Report, that the Company’s disclosure controls and procedures are effective to ensure that information required to be disclosed by the Company in the reports filed or submitted by it under the Securities Exchange Act of 1934, as amended, is recorded, processed, summarized and reported within the time periods specified in the Securities and Exchange Commission rules and forms, and include controls and procedures designed to ensure that information required to be disclosed by the Company in such reports is accumulated and communicated to the Company’s management as appropriate to allow timely decisions regarding required disclosure.
(b) Management’s Report on Internal Control over Financial Reporting
Our management is responsible for establishing and maintaining adequate internal control over financial reporting, as such term is defined in Exchange Act Rules 13a-15(f). In fulfilling this responsibility, estimates and judgments by management are required to assess the expected benefits and related costs of control procedures. The objectives of internal control include providing management with reasonable, but not absolute, assurance that assets are safeguarded against loss from unauthorized use or disposition, and that transactions are executed in accordance with management’s authorization and recorded properly to permit the preparation of consolidated financial statements in conformity with accounting principles generally accepted in the United States of America. Under the supervision and with the participation of our management, including our principal executive officer and principal financial officer, we conducted an evaluation of the effectiveness of our internal control over financial reporting based on the framework in Internal Control—Integrated Framework issued by the Committee of Sponsoring Organizations of the Treadway Commission. Based on our assessment under those criteria, management concluded that the Company’s internal control over financial reporting was effective as of December 31, 2009. We have excluded Fullscope, Inc. from our assessment of internal controls over financial reporting because it was acquired on December 31, 2009. The balance sheet of Fullscope reflects total assets constituting 16.9% (excluding goodwill and intangibles) of the related consolidated balance sheet amounts as of December 31, 2009.
Our internal control over financial reporting as of December 31, 2009 has been audited by Deloitte & Touche LLP, an independent registered public accounting firm, as stated in their report, which appears below.
REPORT OF INDEPENDENT REGISTERED PUBLIC ACCOUNTING FIRM
To the Board of Directors and Stockholders of Edgewater Technology, Inc.
Wakefield, Massachusetts
We have audited the internal control over financial reporting of Edgewater Technology, Inc. and subsidiaries (the “Company”) as of December 31, 2009, based on criteria established in Internal Control—Integrated Framework issued by the Committee of Sponsoring Organizations of the Treadway Commission. The Company’s management is responsible for maintaining effective internal control over financial reporting and for its assessment of the effectiveness of internal control over financial reporting, included in the accompanying Management’s Report on Internal Control Over Financial Reporting. Our responsibility is to express an opinion on the Company’s internal control over financial reporting based on our audit.
As described in Management’s Report on Internal Control over Financial Reporting, management excluded from its assessment the internal control over financial reporting at Fullscope, Inc., which was acquired on December 31, 2009 and whose financial statements constitute 16.9% (excluding goodwill and intangibles) of the related consolidated balance sheet amounts as of December 31, 2009. Accordingly, our audit did not include the internal control over financial reporting at Fullscope, Inc.
We conducted our audit in accordance with the standards of the Public Company Accounting Oversight Board (United States). Those standards require that we plan and perform the audit to obtain reasonable assurance about whether effective internal control over financial reporting was maintained in all material respects. Our audit included obtaining an understanding of internal control over financial reporting, assessing the risk that a material weakness exists, testing and evaluating the design and operating effectiveness of internal control based on the assessed risk, and performing such other procedures as we considered necessary in the circumstances. We believe that our audit provides a reasonable basis for our opinion.
63
Table of Contents
A company’s internal control over financial reporting is a process designed by, or under the supervision of, the company’s principal executive and principal financial officers, or persons performing similar functions, and effected by the company’s board of directors, management, and other personnel to provide reasonable assurance regarding the reliability of financial reporting and the preparation of financial statements for external purposes in accordance with generally accepted accounting principles. A company’s internal control over financial reporting includes those policies and procedures that (1) pertain to the maintenance of records that, in reasonable detail, accurately and fairly reflect the transactions and dispositions of the assets of the company; (2) provide reasonable assurance that transactions are recorded as necessary to permit preparation of financial statements in accordance with generally accepted accounting principles, and that receipts and expenditures of the company are being made only in accordance with authorizations of management and directors of the company; and (3) provide reasonable assurance regarding prevention or timely detection of unauthorized acquisition, use, or disposition of the company’s assets that could have a material effect on the financial statements.
Because of the inherent limitations of internal control over financial reporting, including the possibility of collusion or improper management override of controls, material misstatements due to error or fraud may not be prevented or detected on a timely basis. Also, projections of any evaluation of the effectiveness of the internal control over financial reporting to future periods are subject to the risk that the controls may become inadequate because of changes in conditions, or that the degree of compliance with the policies or procedures may deteriorate.
In our opinion, the Company maintained, in all material respects, effective internal control over financial reporting as of December 31, 2009, based on the criteria established in Internal Control—Integrated Framework issued by the Committee of Sponsoring Organizations of the Treadway Commission.
We have also audited, in accordance with the standards of the Public Company Accounting Oversight Board (United States), the consolidated financial statements as of and for the year ended December 31, 2009 of the Company and our report dated March 15, 2010 expressed an unqualified opinion on those financial statements, and included an explanatory paragraph relating to the change in method of accounting for business combinations as of January 1, 2009.
/s/ Deloitte & Touche LLP
Boston, Massachusetts
March 15, 2010
(c) Changes in Controls and Procedures
There were no significant changes in the Company’s internal controls, or in other factors that could significantly affect these internal controls, subsequent to the date of our most recent evaluation.
| ITEM 9B. | OTHER INFORMATION |
None.
64
Table of Contents
PART III
| ITEM 10. | DIRECTORS, EXECUTIVE OFFICERS AND CORPORATE GOVERNANCE |
Information required by Part III of the Annual Report on Form 10-K is omitted from this report because we will file a definitive proxy statement in accordance with Regulation 14A of the SEC’s rules on or before April 30, 2010. These items include:
| (a) | The information called for by Item 10 of the Annual Report on Form 10-K, involving Item 401 of Regulation S-K is incorporated by reference to the material under the captions “Election of Directors – Nominees for Election” and “Named Executive Officers” in our proxy statement for our Annual Meeting of Stockholders to be held on June 16, 2010. |
| (b) | The information called for by Item 10 of the Annual Report on Form 10-K involving Item 405 of Regulation S-K is incorporated by reference to the material under the caption “Stock Ownership—Section 16 (a) Beneficial Ownership Reporting Compliance” in our proxy statement for our Annual Meeting of Stockholders to be held on June 16, 2010. |
| (c) | The information called for by Item 10 of the Annual Report on Form 10-K involving Item 406 of Regulation S-K is incorporated by reference to the material under the caption “Corporate Governance—Code of Ethics” in our proxy statement for our Annual Meeting of Stockholders to be held on June 16, 2010. |
| (d) | The information called for by Item 10 of the Annual Report on Form 10-K involving paragraphs (c)(3), (d)(4) and (d)(5) of Item 407 for Regulation S-K is incorporated by reference to the material under caption “Corporate Governance – Board and Board Committee Matters” in our proxy statement for our Annual Meeting of Stockholders to be held on June 16, 2010. |
| ITEM 11. | EXECUTIVE COMPENSATION |
The information called for by Item 11 of the Annual Report on Form 10-K for management remuneration involving Item 402 of Regulation S-K and paragraphs (e)(4) and (e)(5) of Item 407 of Regulation S-K is incorporated herein by reference to the material under the captions “Corporate Governance—Compensation of Outside Directors” and “Compensation of Named Executive Officers – Summary Compensation Table” in our proxy statement for our Annual Meeting of Stockholders to be held on June 16, 2010.
| ITEM 12. | SECURITY OWNERSHIP OF CERTAIN BENEFICIAL OWNERS AND MANAGEMENT AND RELATED STOCKHOLDER MATTERS |
The information called for by Item 12 of the Annual Report on Form 10-K involving Item 201 (d) of Regulation S-K and Item 403 of Regulation S-K for the securities authorized under equity compensation plans and security ownership of certain beneficial owners and management, respectively, is incorporated herein by reference to the material under the captions “Corporate Governance—Compensation of Outside Directors,” “Compensation of Named Executive Officers – Summary Compensation Table,” “Equity Compensation Plans – Equity Compensation Plan Information” and “Stock Ownership – Beneficial Ownership of Certain Stockholders, Directors and Executive Officers,” respectively, in our proxy statement for our Annual Meeting of Stockholders to be held on June 16, 2010.
| ITEM 13. | CERTAIN RELATIONSHIPS AND RELATED TRANSACTIONS, AND DIRECTOR INDEPENDENCE |
The information called for by Item 13 of the Annual Report on Form 10-K involving Item 404 of Regulation S-K and Item 407(a) of Regulation S-K is incorporated herein by reference to the material under the captions “Corporate Governance – Board and Board Committee Matters” and “Certain Transactions” in our proxy statement for our Annual Meeting of Stockholders to be held on June 16, 2010.
| ITEM 14. | PRINCIPAL ACCOUNTING FEES AND SERVICES |
The information called for by Item 9(e) of Schedule 14A is incorporated herein by reference to the material under the captions “Corporate Governance—Board and Board Committee Matters – Audit Committee” and “Audit Fees and Non-Audit Services” in our proxy statement for our Annual Meeting of Stockholders to be held on June 16, 2010.
65
Table of Contents
PART IV
| ITEM 15. | EXHIBITS, FINANCIAL STATEMENT SCHEDULES |
| (a) | 1. | Financial Statements required by Item 15 are included and indexed in Part II, Item 8. | ||
| (a) | 2. | Financial Statement Schedules included in Part IV of this report. Schedule II is omitted because the information is included in the Notes to Consolidated Financial Statements. All other schedules under the accounting regulations of the SEC are not required under the related instructions or are inapplicable and, thus have been omitted. | ||
| (a) | 3. | See “Exhibit Index” on the following pages. | ||
66
Table of Contents
| (a)3. | Exhibits |
EXHIBIT INDEX
| Exhibit |
Description | |
| 2.1 | Asset Purchase Agreement dated as of December 10, 2007, by and among Edgewater Technology-Ranzal, Inc., Vertical Pitch, LLC and Daniel Gudal (Incorporated by reference from Exhibit 2.1 to the Company’s Form 8-K filed with the SEC on December 12, 2007). | |
| 2.2 | Agreement and Plan or Merger and Reorganization dated as of December 31, 2009, by and among Edgewater Technology, Inc., Edgewater Technology-Fullscope, Inc., Fullscope, Inc. and Rurik G. Vandevenne (Incorporated by reference from Exhibit 2.1 to the Company’s Form 8-K filed with the SEC on January 5, 2010). | |
| 2.3 | Earnout Agreement dated as of December 31, 2009, by and among Edgewater Technology, Inc., Edgewater Technology-Fullscope, Inc., Fullscope, Inc. and the Designated Agent, on behalf of the Agent Committee and the Stockholders.* | |
| 3.1 | Certificate of Incorporation of the Company (Incorporated by reference from Exhibit 3.1 to the Company’s Registration Statement on Form S-1 (File No. 333-07513)). | |
| 3.2 | Certificate of Amendment of the Certificate of Incorporation (Incorporated by reference from Exhibit 3.2 to the Company’s Registration Statement on Form S-1 (File No. 333-07513)). | |
| 3.3 | Certificate of Amendment of the Certificate of Incorporation dated May 8, 1998 (Incorporated by reference from Exhibit 3.3 to the Company’s Form 10-K filed with the SEC on March 16, 1999). | |
| 3.4 | Amended and Restated By-Laws of the Company, as amended to date (Incorporated by reference from Exhibit 3.1 to the Company’s Form 8-K filed with the SEC on September 28, 2007). | |
| 4.1 | Form of certificate evidencing ownership of common stock of the Company (Incorporated by reference from Exhibit 4.1 to the Company’s Registration Statement on Form S-1 (File No. 333-07513)). | |
| 4.2 | Article Four of the Certificate of Incorporation of the Company (included in Exhibit 3.1). | |
| 10.1 | Form of Director Indemnification Agreement between the Company and each of its directors and executive officers (Incorporated by reference from Exhibit 10.3 to the Company’s Registration Statement on Form S-1 (File No. 333-07513)). | |
| 10.2 | The Company’s 1997 Employee Stock Purchase Plan adopted May 2, 1997 (Incorporated by reference from the Company’s Registration Statement on Form S-8 (File No. 333-29689)), which has been terminated by approval and adoption of the Edgewater Technology, Inc. 1999 Employee Stock Purchase Plan referenced in Exhibit 10.52. | |
| 10.3 | The Company’s Non-Qualified 401(K) Plan. (Incorporated by reference from Exhibit 10.27 from the Company’s Quarterly Report on Form 10-Q for the quarter ended March 31, 1998, as filed with the SEC on May 7, 1998). (1) | |
| 10.4 | Edgewater Technology, Inc. Amended and Restated 1996 Stock Option Plan, most recently amended, effective March 20, 2002 (Incorporated by reference from Exhibit 10.48 to the Company’s Form 10-K for the year ended December 31,2001, filed with the SEC on March 27, 2002). (1) | |
| 10.5 | Edgewater Technology, Inc. Amended and Restated 2000 Stock Option Plan, amended and restated effective March 20, 2002. (Incorporated by reference from Exhibit 10.49 to the Company’s Form 10-K for the year ended December 31, 2001, filed with the SEC on March 27, 2002) which has been amended and in its current state is reflected in Exhibit 10.51.(1) | |
| (1) | This agreement is a compensatory plan or arrangement required to be filed as an exhibit to this Annual Report on Form 10-K pursuant to Item 15(c). |
| * | Filed herein |
67
Table of Contents
| (a)3. | Exhibits (Continued) |
EXHIBIT INDEX
| Exhibit |
Description | |
| 10.6 | Edgewater Technology, Inc. Amended and Restated 1999 Employee Stock Purchase Plan, as amended on May 22, 2002. (Incorporated by reference from Exhibit 4.9 to Post Effective Amendment No. 1 to Form S-8, File No. 333-88313, filed with the SEC on May 30, 2002). (1) | |
| 10.7 | Edgewater Technology, Inc. 2003 Equity Incentive Plan, incorporated by reference to Exhibit 4.10 of Form S-8, 333-106325 filed with the SEC on June 20, 2003. (Incorporated by reference from Exhibit 10.56 to the Company’s Form 10-Q for the quarter ended June 30, 2003 filed with the SEC on August 14, 2003). (1) | |
| 10.8 | Third Amendment to Lease between Edgewater Technology (Delaware), Inc. and Harvard Mills Limited Partnership, dated March 21, 2006 and effective as of May 3, 2006 for Edgewater Technology, Inc.’s corporate headquarters at 20 Harvard Mill Square, Wakefield, Massachusetts. (Incorporated by reference from Exhibit 99.1 to the Company’s Form 8-K filed with the SEC on May 3, 2006). | |
| 10.9 | Employment Agreement by and among the Company, Edgewater Technology (Delaware), Inc. (“Edgewater Delaware”) and Shirley Singleton dated as of June 12, 2007, which supersedes and terminates that certain employment agreement dated as of June 12, 2003 by and between Edgewater Delaware and Shirley Singleton. (Incorporated by reference from Exhibit 10.1 to the Company’s Form 8-K filed with the SEC on June 15, 2007). (1) | |
| 10.10 | Employment Agreement by and among the Company, Edgewater Technology (Delaware), Inc. (“Edgewater Delaware”) and David Clancey dated as of June 12, 2007, which supersedes and terminates that certain employment agreement dated as of June 12, 2003 by and between Edgewater Delaware and David Clancey. (Incorporated by reference from Exhibit 10.2 to the Company’s Form 8-K filed with the SEC on June 15, 2007). (1) | |
| 10.11 | Edgewater Technology, Inc. 2008 Omnibus Incentive Plan, incorporated by reference to Exhibit 10.1 of Form S-8, 333-153740 filed with the SEC on September 30, 2008. (1) | |
| 10.12 | Edgewater Technology, Inc. 2008 Employee Stock Purchase Plan, incorporated by reference to Exhibit 10.1 of Form S-8, 333-153741 filed with the SEC on September 30, 2008. (1) | |
| 21.1 | Subsidiaries of Edgewater Technology, Inc. as of December 31, 2009.* | |
| 23.1 | Consent of Independent Registered Public Accounting Firm.* | |
| 24.1 | Power of Attorney (See Signature Page).* | |
| 31.1 | 13a-14 Certification – President and Chief Executive Officer* | |
| 31.2 | 13a-14 Certification –Chief Financial Officer* | |
| 32 | Section 1350 Certification* | |
| (1) | This agreement is a compensatory plan or arrangement required to be filed as an exhibit to this Annual Report on Form 10-K pursuant to Item 15(c). |
| * | Filed herein |
68
Table of Contents
Pursuant to the requirements of Section 13 or 15(d) of the Securities Exchange Act of 1934, the registrant has duly caused this report to be signed on its behalf by the undersigned, thereunto duly authorized, in the Town of Wakefield, State of Massachusetts, on March 15, 2010.
| Edgewater Technology, Inc. |
| /S/ SHIRLEY SINGLETON |
| Shirley Singleton |
| Chairman, President and Chief Executive Officer |
Pursuant to the requirements of the Securities Exchange Act of 1934, this report has been signed below by the following persons on behalf of the registrant and in the capacities and on the dates indicated.
KNOW ALL PERSONS BY THESE PRESENTS, that each person whose signature appears below appoints jointly and severally, Shirley Singleton and Timothy R. Oakes and each one of them, his or her attorneys-in-fact, each with the power of substitution, for him or her in any and all capacities, to sign any and all amendments to this Annual Report on Form 10-K and to file the same, with exhibits thereto and other documents in connection therewith, with the SEC, hereby ratifying and confirming all that each said attorneys-in-fact, or his substitute or substitutes, may do or cause to be done by virtue hereof.
| Name |
Title |
Date | ||
| /S/ SHIRLEY SINGLETON Shirley Singleton |
Chairman, President and Chief Executive Officer (Principal Executive Officer) | March 15, 2010 | ||
| /S/ TIMOTHY R. OAKES Timothy R. Oakes |
Chief Financial Officer (Principal Financial and Accounting Officer) |
March 15, 2010 | ||
| /S/ PAUL E. FLYNN Paul E. Flynn |
Director | March 15, 2010 | ||
| /S/ PAUL GUZZI Paul Guzzi |
Director | March 15, 2010 | ||
| /S/ NANCY L. LEAMING Nancy Leaming |
Director | March 15, 2010 | ||
| /S/ MICHAEL R. LOEB Michael R. Loeb |
Director | March 15, 2010 | ||
| /S/ DANIEL O’CONNELL Daniel O’Connell |
Director | March 15, 2010 | ||
| /S/ WAYNE WILSON Wayne Wilson |
Director | March 15, 2010 | ||
69