Attached files
| file | filename |
|---|---|
| EX-32 - EX-32 - EDGEWATER TECHNOLOGY INC/DE/ | d596462dex32.htm |
| EX-31.2 - EX-31.2 - EDGEWATER TECHNOLOGY INC/DE/ | d596462dex312.htm |
| EX-31.1 - EX-31.1 - EDGEWATER TECHNOLOGY INC/DE/ | d596462dex311.htm |
| EXCEL - IDEA: XBRL DOCUMENT - EDGEWATER TECHNOLOGY INC/DE/ | Financial_Report.xls |
Table of Contents
UNITED STATES
SECURITIES AND EXCHANGE COMMISSION
Washington, D.C. 20549
FORM 10-Q
| x | Quarterly report pursuant to Section 13 or 15 (d) of the Securities Exchange Act of 1934 |
For the quarterly period ended September 30, 2013
or
| ¨ | Transition report pursuant to Section 13 or 15 (d) of the Securities Exchange Act of 1934 |
for the transition period from to
Commission file number: 000-20971
EDGEWATER TECHNOLOGY, INC.
(Exact Name of Registrant as Specified in its Charter)
| Delaware | 71-0788538 | |
| (State or Other Jurisdiction of Incorporation or Organization) |
(I.R.S. Employer Identification No.) |
| 200 Harvard Mill Square, Suite 210 | ||
| Wakefield, MA | 01880-3209 | |
| (Address of Principal Executive Offices) | (Zip Code) |
Registrant’s telephone number, including area code: (781) 246-3343
Indicate by check mark whether the registrant (1) has filed all reports required to be filed by Section 13 or 15(d) of the Securities Exchange Act of 1934 during the preceding 12 months (or for such shorter period that the registrant was required to file such reports), and (2) has been subject to such filing requirements for the past 90 days. Yes x No ¨
Indicate by check mark whether the registrant has submitted electronically and posted on its corporate Web site, if any, every Interactive Data File required to be submitted and posted pursuant to Rule 405 of Regulation S-T (§232.405 of this chapter) during the preceding 12 months (or for such shorter period that the registrant was required to submit and post such files). Yes x No ¨
Indicate by check mark whether the registrant is a large accelerated filer, an accelerated filer, a non-accelerated filer, or a smaller reporting company. See the definitions of “large accelerated filer,” “accelerated filer,” and “smaller reporting company” in Rule 12b-2 of the Exchange Act (check one):
| Large accelerated filer | ¨ | Accelerated filer | ¨ | |||
| Non-accelerated filer | ¨ | Smaller reporting company | x | |||
Indicate by check mark whether the registrant is a shell company (as defined in Rule 12b-2 of the Exchange Act). Yes ¨ No x
The number of shares of Common Stock of the Registrant, par value $.01 per share, outstanding at October 28, 2013 was 10,880,340.
Table of Contents
EDGEWATER TECHNOLOGY, INC.
FORM 10-Q FOR THE QUARTER ENDED SEPTEMBER 30, 2013
2
Table of Contents
PART I – FINANCIAL INFORMATION
EDGEWATER TECHNOLOGY, INC.
UNAUDITED CONDENSED CONSOLIDATED BALANCE SHEETS
(In Thousands, Except Per Share Data)
| September 30, 2013 |
December 31, 2012 |
|||||||
| ASSETS | ||||||||
| Current assets: |
||||||||
| Cash and cash equivalents |
$ | 17,487 | $ | 16,651 | ||||
| Accounts receivable, net of allowance of $250 |
19,001 | 18,281 | ||||||
| Prepaid expenses and other current assets |
1,150 | 1,418 | ||||||
|
|
|
|
|
|||||
| Total current assets |
37,638 | 36,350 | ||||||
| Property and equipment, net |
1,613 | 1,949 | ||||||
| Intangible assets, net |
1,115 | 1,194 | ||||||
| Goodwill |
12,049 | 12,049 | ||||||
| Other assets |
249 | 247 | ||||||
|
|
|
|
|
|||||
| Total assets |
$ | 52,664 | $ | 51,789 | ||||
|
|
|
|
|
|||||
| LIABILITIES AND STOCKHOLDERS’ EQUITY | ||||||||
| Current liabilities: |
||||||||
| Accounts payable |
$ | 598 | $ | 593 | ||||
| Accrued liabilities |
14,369 | 14,280 | ||||||
| Deferred revenue |
1,462 | 2,969 | ||||||
|
|
|
|
|
|||||
| Total current liabilities |
16,429 | 17,842 | ||||||
| Other liabilities |
832 | 1,272 | ||||||
|
|
|
|
|
|||||
| Total liabilities |
17,261 | 19,114 | ||||||
| Stockholders’ equity: |
||||||||
| Preferred stock, $.01 par value; 2,000 shares authorized, no shares issued or outstanding |
— | — | ||||||
| Common stock, $.01 par value; 48,000 shares authorized, 29,736 shares issued as of September 30, 2013 and December 31, 2012, 10,911 and 10,897 shares outstanding as of September 30, 2013 and December 31, 2012, respectively |
297 | 297 | ||||||
| Paid-in capital |
212,170 | 213,238 | ||||||
| Treasury stock, at cost, 18,825 and 18,839 shares at September 30, 2013 and December 31, 2012, respectively |
(124,284 | ) | (125,806 | ) | ||||
| Accumulated other comprehensive loss |
(146 | ) | (123 | ) | ||||
| Retained deficit |
(52,634 | ) | (54,931 | ) | ||||
|
|
|
|
|
|||||
| Total stockholders’ equity |
35,403 | 32,675 | ||||||
|
|
|
|
|
|||||
| Total liabilities and stockholders’ equity |
$ | 52,664 | $ | 51,789 | ||||
|
|
|
|
|
|||||
See notes to the unaudited condensed consolidated financial statements.
3
Table of Contents
EDGEWATER TECHNOLOGY, INC.
UNAUDITED CONDENSED CONSOLIDATED STATEMENTS OF COMPREHENSIVE INCOME
(In Thousands, Except Per Share Data)
| Three Months Ended September 30, |
Nine Months Ended September 30, |
|||||||||||||||
| 2013 | 2012 | 2013 | 2012 | |||||||||||||
| Revenue: |
||||||||||||||||
| Service revenue |
$ | 21,389 | $ | 20,232 | $ | 62,684 | $ | 63,615 | ||||||||
| Software revenue |
2,260 | 2,032 | 8,568 | 7,038 | ||||||||||||
| Reimbursable expenses |
1,750 | 1,901 | 5,523 | 5,980 | ||||||||||||
|
|
|
|
|
|
|
|
|
|||||||||
| Total revenue |
25,399 | 24,165 | 76,775 | 76,633 | ||||||||||||
| Cost of revenue: |
||||||||||||||||
| Project and personnel costs |
13,071 | 12,401 | 39,837 | 39,107 | ||||||||||||
| Software costs |
921 | 1,051 | 4,577 | 4,709 | ||||||||||||
| Reimbursable expenses |
1,750 | 1,901 | 5,523 | 5,980 | ||||||||||||
|
|
|
|
|
|
|
|
|
|||||||||
| Total cost of revenue |
15,742 | 15,353 | 49,937 | 49,796 | ||||||||||||
|
|
|
|
|
|
|
|
|
|||||||||
| Gross profit |
9,657 | 8,812 | 26,838 | 26,837 | ||||||||||||
| Operating expenses: |
||||||||||||||||
| Selling, general and administrative |
7,590 | 7,499 | 23,231 | 24,001 | ||||||||||||
| Depreciation and amortization |
302 | 452 | 925 | 1,342 | ||||||||||||
|
|
|
|
|
|
|
|
|
|||||||||
| Total operating expenses |
7,892 | 7,951 | 24,156 | 25,343 | ||||||||||||
|
|
|
|
|
|
|
|
|
|||||||||
| Operating income |
1,765 | 861 | 2,682 | 1,494 | ||||||||||||
| Other (income) expense, net |
(81 | ) | (95 | ) | 92 | 10 | ||||||||||
|
|
|
|
|
|
|
|
|
|||||||||
| Income before income taxes |
1,846 | 956 | 2,590 | 1,484 | ||||||||||||
| Tax provision |
74 | 163 | 293 | 382 | ||||||||||||
|
|
|
|
|
|
|
|
|
|||||||||
| Net income |
$ | 1,772 | $ | 793 | $ | 2,297 | $ | 1,102 | ||||||||
|
|
|
|
|
|
|
|
|
|||||||||
| Comprehensive income: |
||||||||||||||||
| Currency translation adjustments |
(2 | ) | (8 | ) | (23 | ) | (20 | ) | ||||||||
|
|
|
|
|
|
|
|
|
|||||||||
| Total comprehensive income |
$ | 1,770 | $ | 785 | $ | 2,274 | $ | 1,082 | ||||||||
|
|
|
|
|
|
|
|
|
|||||||||
| Net income per share: |
||||||||||||||||
| Basic net income per share of common stock |
$ | 0.17 | $ | 0.07 | $ | 0.21 | $ | 0.10 | ||||||||
|
|
|
|
|
|
|
|
|
|||||||||
| Diluted net income per share of common stock |
$ | 0.14 | $ | 0.07 | $ | 0.19 | $ | 0.10 | ||||||||
|
|
|
|
|
|
|
|
|
|||||||||
| Shares used in computing basic net income per share of common stock |
10,732 | 11,137 | 10,800 | 11,258 | ||||||||||||
|
|
|
|
|
|
|
|
|
|||||||||
| Shares used in computing diluted net income per share of common stock |
12,233 | 11,677 | 11,785 | 11,680 | ||||||||||||
|
|
|
|
|
|
|
|
|
|||||||||
See notes to the unaudited condensed consolidated financial statements.
4
Table of Contents
EDGEWATER TECHNOLOGY, INC.
UNAUDITED CONDENSED CONSOLIDATED STATEMENTS OF CASH FLOWS
(In Thousands)
| Nine Months Ended September 30, |
||||||||
| 2013 | 2012 | |||||||
| CASH FLOWS FROM OPERATING ACTIVITIES: |
||||||||
| Net income |
$ | 2,297 | $ | 1,102 | ||||
| Adjustments to reconcile net income to net cash provided by operating activities: |
||||||||
| Depreciation and amortization |
1,183 | 1,437 | ||||||
| Share-based compensation expense |
1,174 | 1,005 | ||||||
| Deferred income taxes |
25 | — | ||||||
| Fair value adjustment of contingent earnout consideration |
— | (231 | ) | |||||
| Changes in operating accounts: |
||||||||
| Accounts receivable |
(749 | ) | 636 | |||||
| Prepaid expenses and other current assets |
262 | (699 | ) | |||||
| Accounts payable |
5 | (2,458 | ) | |||||
| Accrued liabilities and other liabilities |
(371 | ) | 1,812 | |||||
| Deferred revenue |
(1,507 | ) | 2,310 | |||||
|
|
|
|
|
|||||
| Net cash provided by operating activities |
2,319 | 4,914 | ||||||
|
|
|
|
|
|||||
| CASH FLOWS FROM INVESTING ACTIVITIES: |
||||||||
| Capitalization of product development costs |
(289 | ) | (206 | ) | ||||
| Purchases of property and equipment |
(280 | ) | (322 | ) | ||||
| Acquisition of intellectual property |
(200 | ) | — | |||||
|
|
|
|
|
|||||
| Net cash used in investing activities |
(769 | ) | (528 | ) | ||||
|
|
|
|
|
|||||
| CASH FLOW FROM FINANCING ACTIVITES: |
||||||||
| Purchases of treasury stock |
(1,513 | ) | (2,164 | ) | ||||
| Proceeds from employee stock plans and stock option exercises |
793 | 470 | ||||||
| Payments on capital leases |
— | (52 | ) | |||||
|
|
|
|
|
|||||
| Net cash used in financing activities |
(720 | ) | (1,746 | ) | ||||
|
|
|
|
|
|||||
| Effects of exchange rates on cash |
6 | 1 | ||||||
|
|
|
|
|
|||||
| Net increase in cash and cash equivalents |
836 | 2,641 | ||||||
| CASH AND CASH EQUIVALENTS, beginning of period |
16,651 | 10,333 | ||||||
|
|
|
|
|
|||||
| CASH AND CASH EQUIVALENTS, end of period |
$ | 17,487 | $ | 12,974 | ||||
|
|
|
|
|
|||||
| SUPPLEMENTAL DISCLOSURES OF CASH FLOW INFORMATION: |
||||||||
| Cash paid for income taxes |
$ | 184 | $ | 534 | ||||
|
|
|
|
|
|||||
| Issuance of restricted stock awards |
$ | 1,051 | $ | — | ||||
|
|
|
|
|
|||||
See notes to the unaudited condensed consolidated financial statements.
5
Table of Contents
EDGEWATER TECHNOLOGY, INC.
NOTES TO UNAUDITED CONDENSED CONSOLIDATED FINANCIAL STATEMENTS
| 1. | ORGANIZATION: |
Edgewater Technology, Inc. (“Edgewater” or the “Company”) is a strategic consulting firm that brings a synergistic blend of specialty services to drive transformational change that (1) improves process, (2) reduces costs and (3) increases revenue. Our solutions are tailored to the C-level executives in the upper mid-market and Global 2000. Headquartered in Wakefield, Massachusetts, we work with customers to reduce costs, improve process and increase revenue through the judicious use of technology.
In this Quarterly Report on Form 10-Q (the “Form 10-Q”), we use the terms “Edgewater,” “Edgewater Technology,” “we,” “our Company,” “the Company,” “our” and “us” to refer to Edgewater Technology, Inc. and its wholly-owned subsidiaries, which are described in our 2012 Annual Report on Form 10-K, as filed with the Securities and Exchange Commission (the “SEC”) on March 8, 2013 (the “2012 Form 10-K”).
| 2. | BASIS OF PRESENTATION: |
The accompanying unaudited condensed consolidated financial statements have been prepared by Edgewater pursuant to the rules and regulations of the SEC regarding interim financial reporting. Certain information and note disclosures normally included in annual financial statements prepared in accordance with accounting principles generally accepted in the United States of America have been omitted pursuant to those rules and regulations, although we believe that the disclosures made are adequate to ensure the information presented is not misleading.
The accompanying unaudited condensed consolidated financial statements reflect all adjustments (which were of a normal, recurring nature) that, in the opinion of management, are necessary to present fairly our financial position, results of operations and cash flows as of and for the interim periods presented. All intercompany transactions have been eliminated in the accompanying unaudited condensed consolidated financial statements. These financial statements should be read in conjunction with the audited financial statements and notes thereto included in our 2012 Form 10-K.
The results of operations for the three and nine months ended September 30, 2013 are not necessarily indicative of the results to be expected for any future period or the full fiscal year. Our revenue and earnings may fluctuate from quarter-to-quarter based on factors within and outside our control, including variability in demand for information technology professional services, the length of the sales cycle associated with our service offerings, the number, size and scope of our projects and the efficiency with which we utilize our employees. Substantially all of our revenue is generated within North America.
Other comprehensive income consists of net income plus or minus any periodic currency translation adjustments.
| 3. | REVENUE RECOGNITION: |
Our Company generates revenue primarily through the provision of consulting services and the resale of third-party, off-the-shelf software and maintenance.
We generate revenue by providing consulting services under written service contracts with our customers. The service contracts we enter into generally fall into three specific categories: time and materials, fixed-price and retainer.
We consider amounts to be earned once evidence of an arrangement has been obtained, services are delivered, fees are fixed or determinable and collectability is reasonably assured. We establish billing terms at the time at which the project deliverables and milestones are agreed. Our standard payment terms are 30 days from invoice date. Out-of-pocket reimbursable expenses charged to customers are reflected as revenue.
When a customer enters into a time and materials, fixed-price or a periodic retainer-based contract, the Company recognizes revenue in accordance with its evaluation of the deliverables in each contract. If the deliverables represent separate units of accounting, the Company then measures and allocates the consideration from the arrangement to the separate units, based on vendor specific objective evidence (“VSOE”) of the value for each deliverable.
The revenue under time and materials contracts is recognized as services are rendered and performed at contractually agreed upon rates. Revenue pursuant to fixed-price contracts is recognized under the proportional performance method of accounting. We routinely evaluate whether revenue and profitability should be recognized in the current period.
6
Table of Contents
EDGEWATER TECHNOLOGY, INC.
NOTES TO UNAUDITED CONDENSED CONSOLIDATED FINANCIAL STATEMENTS
3. REVENUE RECOGNITION: (Continued)
We estimate the proportional performance on our fixed-price contracts on a monthly basis utilizing hours incurred to date as a percentage of total estimated hours to complete the project. This method is used because reasonably dependable estimates of costs and revenue earned can be made, based on historical experience and milestones identified in any particular contract. If we do not have a sufficient basis to measure progress toward completion, revenue is recognized upon completion of performance, subject to any warranty provisions or other project management assessments as to the status of work performed.
Estimates of total project costs are continuously monitored during the term of an engagement. There are situations where the number of hours to complete projects may either exceed (or be less than) our original estimate, as a result of an increase (or decrease) in project scope, unforeseen events that arise, or the inability of the client or the delivery team to fulfill their responsibilities. Accordingly, recorded revenues and costs are subject to revision throughout the life of a project based on current information and historical trends. Such revisions may result in increases or decreases to revenue and income and are reflected in the consolidated financial statements in the periods in which they are first identified.
If our initial estimates of the resources required or the scope of work to be performed on a contract are inaccurate, or we do not manage the project properly within the planned time period, a provision for estimated losses on incomplete projects is made. Any known or probable losses on projects are charged to operations in the period in which such losses are determined. A formal project review process takes place quarterly, although projects are evaluated on an ongoing basis. Management reviews the estimated total direct costs on each contract to determine if the estimated amounts are accurate, and estimates are adjusted as needed in the period revised estimates are made. No losses were recognized on fixed price contracts during the three- or nine-month periods ended September 30, 2013 or 2012.
We also perform services on a periodic retainer basis under infrastructure service contracts, which include monthly hosting and support services. Revenue under periodic retainer-based contracts is recognized ratably over the contract period, as outlined within the respective contract. In the event additional services are required, above the minimum retained or contracted amount, then such services are billed on a time and materials basis.
Typically, the Company provides warranty services on its fixed-price contracts related to providing customers with the ability to have any “design flaws” remedied and/or have our Company “fix” routine defects. The warranty services, as outlined in the respective contracts, are provided for a specific period of time after a project is complete. The Company values the warranty services based upon historical labor hours incurred for similar services at standard billing rates. Revenue related to the warranty provisions within our fixed-price contracts is recognized as the services are performed or the revenue is earned. The warranty period is typically for a 30-60 day period after the project is complete.
Customer prepayments, even if nonrefundable, are deferred (classified as deferred revenue on the condensed consolidated balance sheets) and recognized over future periods as services are performed.
Software revenue represents the resale of certain third-party off-the-shelf software and maintenance and has historically been recorded on a gross basis provided we act as a principal in the transaction, which we have determined based upon several factors, including, but not limited to, the fact that we have credit risk and we set the price to the end user. In the event we do not meet the requirements to be considered a principal in the software sale transaction and act as an agent, software revenue is recorded on a net basis.
The majority of the software sold by the Company is delivered electronically. For software that is delivered electronically, we consider delivery to have occurred when the customer either (a) takes possession of the software via a download (that is, when the customer takes possession of the electronic data on its hardware), or (b) has been provided with access codes that allow the customer to take immediate possession of the software on its hardware pursuant to an agreement or purchase order for the software.
7
Table of Contents
EDGEWATER TECHNOLOGY, INC.
NOTES TO UNAUDITED CONDENSED CONSOLIDATED FINANCIAL STATEMENTS
3. REVENUE RECOGNITION: (Continued)
The Company enters into multiple element arrangements which typically include software, post-contract support (or maintenance), and consulting services. Consistent with the software described above, maintenance that is in the form of a pass through transaction is recognized upon delivery of the software, as all related warranty and maintenance is performed by the primary software vendor and not the Company. Maintenance fee revenue for the Company’s software products, which is inconsequential in all years presented, is recognized ratably over the term of the arrangements, which are generally for a one-year period. The Company has established VSOE with respect to the services provided based on the price charged when the services are sold separately. The Company has established VSOE for maintenance based upon the stated renewal rate.
In June 2012, Microsoft Corporation agreed to purchase Edgewater Fullscope’s Process Industries 2 (“PI2”) software and intellectual property along with certain services. The sale of PI2 is a significant multiple element contract. This contract includes $3.25 million of license consideration and subsequent development and training services. We have determined that the license does not have stand-alone value without the services, and thus the license and services are being accounted for as one unit. The license revenue is being recognized as revenue over the period the services are being performed. We recognized $614 thousand and $2.0 million of revenue, reported as Software revenue in our Consolidated Statement of Comprehensive Income, during the three- and nine-month periods ended September 30, 2013, respectively. We recognized $354 thousand of revenue, reported as Software revenue in our Consolidated Statement of Comprehensive Income, during the three- and nine-month periods ended September 30, 2012.
| 4. | SHARE-BASED COMPENSATION: |
Share-based compensation expense under all of the Company’s share-based plans was $336 thousand and $1.2 million for the three- and nine-month periods ended September 30, 2013, respectively. Share-based compensation expense under all of the Company’s share-based plans was $298 thousand and $1.0 million for the three- and nine-month periods ended September 30, 2012, respectively.
Cash received from the employee stock purchase plan (“ESPP”) and through stock option exercises was $377 thousand and $793 thousand during the three- and nine-month periods ended September 30, 2013, respectively. Cash received from ESPP and stock option exercises was $230 thousand and $470 thousand during the three- and nine-month periods ended September 30, 2012, respectively.
As of September 30, 2013, unrecognized compensation expense, net of estimated forfeitures, related to the unvested portion of all share-based compensation arrangements was approximately $1.9 million and is expected to be recognized over a weighted-average period of 1.2 years.
The Company intends to use previously purchased treasury shares for shares issued for options, restricted share awards and ESPP purchases. Shares may also be issued from authorized but unissued share reserves.
8
Table of Contents
EDGEWATER TECHNOLOGY, INC.
NOTES TO UNAUDITED CONDENSED CONSOLIDATED FINANCIAL STATEMENTS
| 5. | INCOME TAXES: |
The Company recorded a tax provision of $74 thousand and $293 thousand for the three- and nine-month periods ended September 30, 2013, respectively. The Company recorded a tax provision of $163 thousand and $382 thousand for the three- and nine-month periods ended September 30, 2012, respectively. The reported tax expense for the three- and nine-month periods ended September 30, 2013, is based upon an estimated annual effective tax rate of 4.0% and 11.3%, respectively, related to our combined federal and state income tax rates, foreign income tax provisions and the recognition of U.S. deferred tax liabilities for differences between the book and tax basis of goodwill. The reported estimated annual effective tax rate is lower than an anticipated statutory rate due to a full valuation allowance being provided against our deferred tax assets, which includes significant federal net operating loss carryforwards. The reported tax expense for the three- and nine-month periods ended September 30, 2012 is based upon an estimated annual effective tax rate of 17.0% and 25.7%, respectively.
Our policy is to classify interest and penalties related to unrecognized tax benefits as income tax expense. This policy has been consistently applied in all periods. During the three- and nine-month periods ended September 30, 2013, we reduced income tax expense by $(88) thousand and $(45) thousand, respectively, from the reversal of previously recorded unrecognized state income tax-related tax benefits (and associated penalties and interest) as a result of the expiration of certain statutes of limitations. Similarly, during the three-month period ended September 30, 2012, we reduced income tax expense by $(41) thousand in connection with the reversal of certain state unrecognized tax benefits and associated accrued penalties and interest. No income tax expense was recognized related to our unrecognized tax benefits during the nine-month period ended September 30, 2012.
We have reviewed the tax positions taken, or to be taken, in our tax returns for all tax years currently open to examination by a taxing authority. As of September 30, 2013, the gross amount of unrecognized tax benefits exclusive of interest and penalties was $108 thousand. Other than certain unrecognized tax benefits for which the statute of limitations expired during the third quarter of 2013, we have identified no other uncertain tax positions for which it is reasonably possible that the total amount of unrecognized tax benefits will significantly increase or decrease within the twelve months ending September 30, 2014. We remain subject to examination until the statute of limitations expires for each respective tax jurisdiction.
We have deferred tax assets that have arisen primarily as a result of timing differences, net operating loss carryforwards and tax credits. Our ability to realize a deferred tax asset is based on our ability to generate sufficient future taxable income within the applicable carryforward period and subject to any applicable limitations. We assess, on a routine periodic basis, the estimated future realizability of the gross carrying value of our deferred tax assets on a more likely than not basis. Our periodic assessments take into consideration both positive evidence (future profitability projections for example) and negative evidence (recent and historical financial performance for example) as it relates to evaluating the future recoverability of our deferred tax assets.
We have a full valuation allowance against our deferred tax assets at September 30, 2013. The establishment of a full valuation allowance against the gross carrying value of our deferred tax assets does not prohibit or limit the Company’s ability to realize a tax benefit in future periods. All existing deferred tax assets, net operating loss carryforwards and credits will be available, subject to possible statutory limitations, to reduce certain future federal and state income tax obligations.
| 6. | FAIR VALUE MEASUREMENT: |
We utilize the following valuation hierarchy for disclosure of the inputs to valuation used to measure fair value. This hierarchy prioritizes the inputs into three broad levels as follows:
| • | Level 1 inputs are quoted prices (unadjusted) in active markets for identical assets or liabilities. |
| • | Level 2 inputs are quoted prices for similar assets and liabilities in active markets or inputs that are observable for the asset or liability, either directly or indirectly through market corroboration, for substantially the full term of the financial instrument. |
| • | Level 3 inputs are unobservable inputs based on our own assumptions used to measure assets and liabilities at fair value. |
A financial asset or liability’s classification within the hierarchy is determined based upon the lowest level input that is significant to the fair value measurement.
9
Table of Contents
EDGEWATER TECHNOLOGY, INC.
NOTES TO UNAUDITED CONDENSED CONSOLIDATED FINANCIAL STATEMENTS
6. FAIR VALUE MEASUREMENT: (Continued)
As of September 30, 2013, the Company’s only financial assets and liabilities required to be measured on a recurring basis were our money market investments. As of December 31, 2012, the Company’s only financial assets and liabilities required to be measured on a recurring basis were our money market investments and the accrued contingent earnout consideration payable in connection with the Company’s acquisition of Meridian Consulting International (“Meridian”).
The following table represents the Company’s fair value hierarchy for its financial assets and liabilities required to be measured on a recurring basis:
| Basis of Fair Value Measurements | ||||||||||||||||
| Balance | Quoted Prices in Active Markets for Identical Items (Level 1) |
Significant Other Observable Inputs (Level 2) |
Significant Unobservable Inputs (Level 3) |
|||||||||||||
| (In Thousands) | ||||||||||||||||
| Balance at September 30, 2013: |
||||||||||||||||
| Financial assets: |
||||||||||||||||
| Money market investment |
$ | 4,084 | $ | 4,084 | $ | — | $ | — | ||||||||
|
|
|
|
|
|
|
|
|
|||||||||
| Total financial assets |
$ | 4,084 | $ | 4,084 | $ | — | $ | — | ||||||||
|
|
|
|
|
|
|
|
|
|||||||||
| Balance at December 31, 2012: |
||||||||||||||||
| Financial assets: |
||||||||||||||||
| Money market investment |
$ | 4,084 | $ | 4,084 | $ | — | $ | — | ||||||||
|
|
|
|
|
|
|
|
|
|||||||||
| Total financial assets |
$ | 4,084 | $ | 4,084 | $ | — | $ | — | ||||||||
|
|
|
|
|
|
|
|
|
|||||||||
The Company had historically classified its liability for contingent earnout consideration relating to its acquisition of Meridian within Level 3 of the fair value hierarchy because the fair value is determined using significant unobservable inputs, which includes probability weighted cash flows. The former Meridian stockholders’ third and final twelve-month earnout period concluded in May 2013. None of the minimum financial performance measures necessary to earn additional contingent earnout consideration were achieved.
A reconciliation of the beginning and ending Level 3 net liabilities is as follows:
| Fair Value | ||||
| Measurements Using Significant Unobservable Inputs (Level 3) |
||||
| (In Thousands) | ||||
| Balance at January 1, 2012 |
$ | 231 | ||
| Change in fair value related to Meridian contingent earnout consideration |
(231 | ) | ||
|
|
|
|||
| Balance at December 31, 2012 |
— | |||
| Change in fair value related to Meridian contingent earnout consideration |
— | |||
|
|
|
|||
| Ending balance at September 30, 2013 |
$ | — | ||
|
|
|
|||
10
Table of Contents
EDGEWATER TECHNOLOGY, INC.
NOTES TO UNAUDITED CONDENSED CONSOLIDATED FINANCIAL STATEMENTS
6. FAIR VALUE MEASUREMENT: (Continued)
The Company routinely examined, on a periodic basis, actual results in comparison to the performance measurements utilized in the earnout calculation and assesses the carrying value of the contingent earnout consideration. No adjustment was made to fair value during the three- or nine-month periods ended September 30, 2013. During the three- and nine-month periods ended September 30, 2012, the Company decreased the estimated accrual of contingent earnout consideration earned by the former Meridian stockholders by $246 thousand and $231 thousand, respectively. The reduction was due to our estimate that Meridian’s projected financial operating performance was trending below the required minimum financial performance measures necessary for the former Meridian stockholders to achieve additional contingent consideration payments.
No financial instruments were transferred into or out of Level 3 classification during the three- or nine-month period ended September 30, 2013.
As of September 30, 2013 and December 31, 2012, the fair values of our other financial instruments, which include cash and cash equivalents, accounts receivable and accounts payable, approximate the carrying amounts of the respective asset and/or liability due to the short-term nature of these financial instruments.
| 7. | GOODWILL AND INTANGIBLE ASSETS: |
There has been no change in the Company’s recorded goodwill balance during the three- or nine-month periods ended September 30, 2013 or 2012. Our annual goodwill and intangible assets measurement date is December 2.
We amortize our intangible assets that have finite lives using either the straight-line method or based on estimated future cash flows to approximate the pattern in which the economic benefit of the asset will be utilized. Amortization expense was $101 thousand and $310 thousand during the three- and nine-month periods ended September 30, 2013, respectively. Amortization expense was $241 thousand and $723 thousand during the three- and nine-month periods ended September 30, 2012, respectively. This amortization expense relates to certain non-competition covenants, trade names and customer lists, which expire between 2012 and 2016.
The Company recorded amortization from capitalized internally developed software (intellectual property) (reported as part of our software expense) of $77 thousand and $258 thousand during the three- and nine-month periods ended September 30, 2013, respectively. The Company recorded amortization from capitalized internally developed software (reported as part of our software expense) of $53 thousand and $95 thousand during the three- and nine-month periods ended September 30, 2012, respectively.
Estimated annual amortization expense (including amortization expense associated with capitalized software costs) for the current year and the following four years ending December 31, is as follows:
| Amortization | ||||
| Expense | ||||
| (In Thousands) | ||||
| 2013 |
$ | 663 | ||
| 2014 |
$ | 583 | ||
| 2015 |
$ | 265 | ||
| 2016 |
$ | 172 | ||
| 2017 |
$ | — | ||
11
Table of Contents
EDGEWATER TECHNOLOGY, INC.
NOTES TO UNAUDITED CONDENSED CONSOLIDATED FINANCIAL STATEMENTS
| 8. | ACCRUED LIABILITIES: |
Accrued liabilities as of September 30, 2013 and December 31, 2012 consisted of the following:
| September 30, 2013 |
December 31, 2012 |
|||||||
| (In Thousands) | ||||||||
| Accrued bonuses |
$ | 2,524 | $ | 2,245 | ||||
| Accrued vacation |
2,275 | 1,838 | ||||||
| Accrued payroll related liabilities |
2,217 | 1,364 | ||||||
| Accrued commissions |
2,122 | 2,229 | ||||||
| Income tax related accruals |
709 | 498 | ||||||
| Accrued software expense |
673 | 1,668 | ||||||
| Short-term portion of lease abandonment accrual |
580 | 580 | ||||||
| Deferred rent |
559 | 526 | ||||||
| Accrued sales and use tax |
308 | 1,482 | ||||||
| Other accrued expenses |
2,402 | 1,850 | ||||||
|
|
|
|
|
|||||
| Total |
$ | 14,369 | $ | 14,280 | ||||
|
|
|
|
|
|||||
Other long-term liabilities as of September 30, 2013 and December 31, 2012 consisted of the following:
| September 30, 2013 |
December 31, 2012 |
|||||||
| (In Thousands) | ||||||||
| Long-term portion of lease abandonment accrual |
$ | 722 | $ | 1,179 | ||||
| Long-term portion of deferred tax liability |
110 | 93 | ||||||
|
|
|
|
|
|||||
| Total |
$ | 832 | $ | 1,272 | ||||
|
|
|
|
|
|||||
| 9. | NET INCOME PER SHARE: |
A reconciliation of net income and weighted average shares used in computing basic and diluted net income per share is as follows:
| Three Months Ended September 30, |
Nine Months Ended September 30, |
|||||||||||||||
| 2013 | 2012 | 2013 | 2012 | |||||||||||||
| (In Thousands, Except Per Share Data) | ||||||||||||||||
| Basic net income per share: |
||||||||||||||||
| Net income applicable to common shares |
$ | 1,772 | $ | 793 | $ | 2,297 | $ | 1,102 | ||||||||
|
|
|
|
|
|
|
|
|
|||||||||
| Weighted average common shares outstanding |
10,732 | 11,137 | 10,800 | 11,258 | ||||||||||||
|
|
|
|
|
|
|
|
|
|||||||||
| Basic net income per share of common stock |
$ | 0.17 | $ | 0.07 | $ | 0.21 | $ | 0.10 | ||||||||
|
|
|
|
|
|
|
|
|
|||||||||
| Diluted net income per share: |
||||||||||||||||
| Net income applicable to common shares |
$ | 1,772 | $ | 793 | $ | 2,297 | $ | 1,102 | ||||||||
|
|
|
|
|
|
|
|
|
|||||||||
| Weighted average common shares outstanding |
10,732 | 11,137 | 10,800 | 11,258 | ||||||||||||
| Dilutive effects of stock options |
1,501 | 540 | 985 | 422 | ||||||||||||
|
|
|
|
|
|
|
|
|
|||||||||
| Weighted average common shares, assuming dilutive effect of stock options |
12,233 | 11,677 | 11,785 | 11,680 | ||||||||||||
|
|
|
|
|
|
|
|
|
|||||||||
| Diluted net income per share of common stock |
$ | 0.14 | $ | 0.07 | $ | 0.19 | $ | 0.10 | ||||||||
|
|
|
|
|
|
|
|
|
|||||||||
12
Table of Contents
EDGEWATER TECHNOLOGY, INC.
NOTES TO UNAUDITED CONDENSED CONSOLIDATED FINANCIAL STATEMENTS
9. NET INCOME PER SHARE: (Continued)
Share-based awards, inclusive of all grants made under the Company’s equity plans, for which either the stock option exercise price or the fair value of the restricted share award exceeds the average market price over the period, have an anti-dilutive effect on earnings per share, and accordingly, are excluded from the diluted computations for all periods presented. Had such shares been included, shares for the diluted computation would have increased by approximately 478 thousand and 1.0 million in the three- and nine-month periods ended September 30, 2013, respectively. The diluted computation would have increased by approximately 1.2 million and 1.3 million, respectively, in the three- and nine-month periods ended September 30, 2012. As of September 30, 2013 and 2012, there were approximately 4.3 million and 4.2 million share-based awards outstanding, respectively, under the Company’s equity plans.
10. STOCK REPURCHASE PROGRAM:
In December 2007, our Board of Directors (the “Board”) authorized a stock repurchase program for up to $5.0 million of common stock on the open market or through privately negotiated transactions from time to time through December 31, 2008 (the “Stock Repurchase Program”). The Board subsequently amended the Stock Repurchase Program, authorizing both an increase to and an extension of the Stock Repurchase Program. The Stock Repurchase Program, as amended, had a maximum purchase value of shares of $16.1 million (the “Purchase Authorization”) and was scheduled to expire on September 20, 2013 (the “Repurchase Period”). In September 2013, the Board approved both a $7.0 million increase to the Purchase Authorization, to $23.1 million, and an extension of the Repurchase Period to September 19, 2014. As of September 30, 2013, there was $10.0 million of remaining Purchase Authorization under the Stock Repurchase Program.
The timing and amount of the purchases will be based upon market conditions, securities law considerations and other factors. The Stock Repurchase Program does not obligate the Company to acquire a specific number of shares in any period and may be modified, suspended, extended or discontinued at any time, without prior notice.
The Company repurchased a total of 365 thousand shares of common stock during the nine- month period ended September 30, 2013 at an aggregate purchase price of $1.5 million. The Company did not repurchase any shares during the three-month period ended September 30, 2013. The Company repurchased a total of 380 thousand and 568 thousand shares of common stock during the three- and nine-month periods ended September 30, 2012, respectively, at an aggregate purchase price of $1.5 million and $2.2 million, respectively.
11. FULLSCOPE EMBEZZLEMENT:
During the second quarter of 2010, the Company discovered embezzlement activities at Fullscope, one of its wholly-owned subsidiaries, which was acquired by the Company in December 2009 (the “Fullscope Embezzlement Issue”). Based upon the results of forensic accounting procedures, we identified that the embezzlement activities occurred for an extended period prior to our acquisition of Fullscope and also during the first and second quarter of 2010.
The Company incurred a majority of its embezzlement-related expenses during fiscal 2010 in connection with its identification and investigation of the embezzlement activity. Embezzlement-related expenses incurred in the three- and nine-month periods ended September 30, 2013 were not material.
During the fourth quarter of 2012, the Company began to file tax returns and pay sales and use tax liabilities related to the Fullscope Embezzlement (which were created by the methods employed by a former employee of Fullscope to conceal the discovered fraudulent activity). As of September 30, 2013, the Company had made payments totaling $1.2 million associated with the sales and use tax liabilities. As of September 30, 2013, the remaining accrual for pre-acquisition sales and use tax exposure was $273 thousand. The Company expects to continue to make payments associated with these liabilities during the fourth quarter of 2013.
13
Table of Contents
EDGEWATER TECHNOLOGY, INC.
NOTES TO UNAUDITED CONDENSED CONSOLIDATED FINANCIAL STATEMENTS
11. FULLSCOPE EMBEZZLEMENT: (Continued)
The Company has incurred significant expenses related to the investigation and related to the filing of sales and use tax returns. The Company anticipates that it may continue to incur additional expenses associated with the Fullscope Embezzlement Issue. We intend to aggressively pursue recovery of these expenses through a claim against existing escrow accounts established in connection with the acquisition of Fullscope, Inc. (“Fullscope Acquisition”) which consists of total of approximately $4.6 million as of September 30, 2013, which is sufficient to cover our claims. The Company fully expects to be reimbursed for payments made in relation to embezzlement-related professional services, as well as the payments associated with the filing of amended sales and use tax returns. However, reimbursement from escrow is not expected until resolution is reached on all outstanding embezzlement-related sales and use tax amounts. Amounts recovered, if any, will be recorded during the period in which settlement is determined to be probable of recovery from escrow.
| 12. PURCHASE OF INTELLECTUAL PROPERTY: |
In March 2013, the Company purchased Trade Program Management (“TPM”) software assets. The purchase price for the TPM intellectual property was $200 thousand, payable in two installments ($150 thousand and $50 thousand paid in the first and second quarters of 2013, respectively). The Company has recorded this asset within intangible assets on the condensed consolidated balance sheet as of June 30, 2013 (and will begin to amortize the purchase price, over a three-year period (the expected period of benefit), once development is complete and the product is commercially available).
| 13. REVOLVING LINE OF CREDIT: |
In September 2013, the Company entered into a three-year secured revolving credit facility (the “Credit Facility”). The Credit Facility allows the Company to borrow up to $10.0 million and includes an additional accordion feature that allows the Company to request an additional $5.0 million as needed, extending the total credit facility borrowing capacity to $15 million over its three-year term. The Credit Facility is secured by the personal property of the Company and its domestic subsidiaries, and is subject to normal covenants. The Company was in compliance with all covenants as of September 30, 2013. Under the terms of the Credit Facility, any advances will accrue interest at a variable per annum rate of interest equal to, as elected by the Company, (i) the Prime Rate, or (ii) the LIBOR Rate plus 1.5%. Interest is due and payable, in arrears, on a monthly basis. The Company will be obligated to pay an annual commitment fee of 0.15% on the daily undrawn balance of the facility. Any amounts outstanding under the Credit Facility will be due on September 23, 2016. No amounts were drawn under this facility as of September 30, 2013.
14
Table of Contents
ITEM 2. MANAGEMENT’S DISCUSSION AND ANALYSIS OF FINANCIAL CONDITION AND RESULTS OF OPERATIONS
The following information should be read in conjunction with the information contained in the Unaudited Condensed Consolidated Financial Statements and notes thereto appearing elsewhere in this Quarterly Report on Form 10-Q. This Quarterly Report on Form 10-Q contains forward-looking statements that involve risks and uncertainties. See “Risk Factors” and “Special Note Regarding Forward-Looking Statements” included elsewhere herein. We use the terms “we,” “our,” “us,” “Edgewater” and “the Company” in this report to refer to Edgewater Technology, Inc. and its wholly-owned subsidiaries.
Edgewater is a strategic consulting firm that brings a synergistic blend of specialty services to drive transformational change that (1) improves process, (2) reduces costs and (3) increases revenue. Our solutions are tailored to the C-level executives in the upper mid-market and Global 2000.
We deliver our services across a broad range of industries. We work onsite with our clients, providing a full spectrum of services in the following areas: classic consulting and product-based consulting, primarily in enterprise performance management (“EPM”) and enterprise resource planning (“ERP”).
Our Services
Edgewater offers a full spectrum of services and expertise to ensure the success of our engagement. Our consulting services are consolidated into two major synergistic offerings: (1) Classic Consulting and (2) Product-Based Consulting.
The following diagram illustrates these offerings:
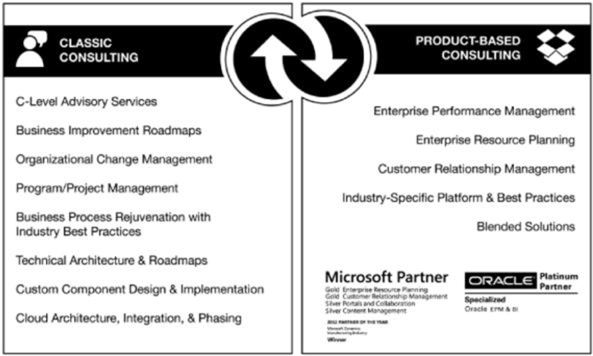
Edgewater has the proven expertise to plan, deliver and manage integration services that improve performance and maximize business results. We focus on deploying new systems and unlocking the value of the existing corporate assets. This proven expertise enables us to bring complex technologies and systems together while minimizing risk, leveraging our clients’ technology investments and delivering tailored solutions.
15
Table of Contents
The following are Edgewater’s service categories with sample services:
Classic consulting services
| • | CFO advisory services |
| • | Business improvement roadmaps |
| • | Organizational change management |
| • | Program/project management |
| • | Business process rejuvenation with best practices |
| • | Specialized operational, due diligence and technology management expertise to mergers and acquisitions, private equity and venture capital |
| • | Strategic advice, costing, estimates to complete, failing or failed programs or project initiatives |
| • | Independent package selection and Request for Information or Proposal process design and implementation |
| • | Technical architecture and roadmaps |
| • | CIO advisory services |
| • | Strategic technology selections |
| • | Technical evaluation and design |
| • | Custom component design and implementation |
| • | Customer intelligence solutions using web/mobile analytics combined with social intelligence |
| • | Cloud architecture, integration and phasing solutions |
| • | On-going support services |
| • | Infrastructure optimization and redesign, disaster recovery and business continuity specialized design and assistance |
Product-based consulting services
| • | Effect business transformation through the use of packaged software solutions |
| • | Enterprise performance management with Oracle budgeting, planning, consolidation and strategic finance |
| • | Enterprise resource planning with Microsoft Dynamics AX targeted in process and discrete manufacturing verticals such as CPG, IEM, Chemical, and Pharmaceuticals |
| • | Customer relationship management with Microsoft Dynamics CRM |
| • | Industry specific platform and best practice solutions |
| • | Blended solutions; Microsoft CRM/XRM and specialized custom solutions |
| • | Business intelligence analytics |
| • | Design, develop and introduce IP that helps “verticalize” channel product stacks |
| • | Support and training services |
In addition to the above services, the Company also provides synergistic services in the area of data management and analytics. Examples of such services include the following:
Enterprise information management services
| • | Provide for data related matters: master data management, data governance, logical and physical data base design, data warehouse strategies and design |
| • | Provide practical data architectures and roadmaps to support transactional systems and enterprise performance management through advanced analytics |
| • | Provide forms of data manipulation, transformation and quality services |
16
Table of Contents
Analytics services
| • | Lead derivation of key financial and operational performance indicators and correlate their measurement, visualization and action for a given organization |
| • | Advise on opportunities for the use of predictive techniques, external data and benchmarks to improve business performance measurement and forecasting |
| • | Advise on the creation and adoption of analytics architectures, roadmaps and supporting organizations |
| • | Advise, design and roadmap analytics-based near real-time to real-time alerting strategies and implementations |
Our consultants are expected to travel and to be onsite with the customer to provide the highest level of service and support in all of these endeavors. We provide varying degrees of customer project assistance and will incorporate customer resources for technology transfer or cost optimization purposes. Independent teams and proper project process and delineation provide conflict-free transition points among all key service offerings as well as independent entry points. Leads for all offerings are internally driven with assistance from the respective vendors for software product solutions.
Factors Influencing Our Results of Operations
Revenue. The Company derives its service revenue from time and materials-based contracts, fixed-price contracts and retainer-based arrangements. Time and materials-based contracts represented 89.9% and 91.4% of service revenue for the three- and nine-month periods ended September 30, 2013, respectively. Time and materials-based contracts represented 93.2% and 94.8% of service revenue for the three- and nine-month periods ended September 30, 2012, respectively. Revenue under time and materials contracts is recognized as services are rendered and performed at contractually agreed upon rates. Fixed-price contracts represented 7.4% and 5.6% of service revenue for the three- and nine-month periods ended September 30, 2013, respectively. Fixed-price contracts represented 4.3% and 2.6% of service revenue for the three- and nine-month periods ended September 30, 2012, respectively. Revenue pursuant to fixed-price contracts is recognized under the proportional performance method of accounting. Retainer-based contracts represented 2.7% and 3.0% of service revenue during the three- and nine-month periods ended September 30, 2013, respectively. Retainer-based contracts represented 2.5% and 2.6% of service revenue during the three- and nine-month periods ended September 30, 2012, respectively. Revenue under retainer-based contracts is recognized ratably over the contract period, as outlined within the respective contract.
Estimates of total project costs are continuously monitored during the term of an engagement. There are situations where the number of hours to complete projects may exceed (or be less than) our original estimate, as a result of an increase (or decrease) in project scope, unforeseen events that arise, or the inability of the client or the delivery team to fulfill their responsibilities. Accordingly, recorded revenues and costs are subject to revision throughout the life of a project based on current information and historical trends. Such revisions may result in increases or decreases to revenue and income and are reflected in the consolidated financial statements in the periods in which they are first identified.
We anticipate that software revenue will continue to be a significant portion of our revenues. Our reported software revenue represents the resale of certain third-party off-the-shelf software and related maintenance (primarily relates to the resale of Microsoft Dynamics AX product) and has historically been recorded on a gross basis provided we act as principal in the transaction, whereby we have credit risk and we set the price to the end user. In the event we do not meet the requirements to be considered a principal in the software sale transaction and act as an agent, software revenue is recorded on a net basis.
Software revenue is recognized upon delivery, except in the infrequent situation where the Company provides maintenance services, in which case the related maintenance is recognized ratably over the maintenance period (while the software revenue is recognized upon delivery). Software revenue is expected to fluctuate between quarters, dependent on our customers’ demand for such third-party off-the-shelf software. Fluctuations in software revenue may have an impact upon our periodic operating performance, including gross margin.
Prior to the second quarter of 2013, we recorded the majority of our software resale revenue on a gross basis (reporting all of the revenue and cost from the transaction in our statement of operations). However, during the second quarter of 2013, due to changes in the nature of the terms of certain of our Microsoft Dynamics AX software resale arrangements, we began to recognize an increasing portion of our software resale revenue on a net basis (reporting only the net profit from the transaction as revenue in our statement of operations). We expect this trend to continue and also anticipate that the number of new software resale arrangements subject to these terms will increase in future periods. Additionally, the changes in the terms of the resale arrangements will also, in certain situations, extend the timing of the recognition period (from full, immediate recognition of the gross margin on the transaction to recognition of the gross margin on the transaction spread evenly over a three-year period) and reduce the amount of the software gross margin to be recognized by the Company.
17
Table of Contents
Operating Expenses. The largest portion of our operating expenses consists of cash and non-cash compensation and benefits associated with our project consulting personnel and related expenses. Non-cash compensation includes share-based compensation expense arising from restricted stock and option grants to employees. Project personnel expenses also consist of payroll costs and related benefits associated with our professional staff. Other related expenses include travel, subcontracting costs, third-party vendor payments and non-billable expenses associated with the delivery of services to our customers. We consider the relationship between project personnel expenses and service revenue to be an important measure of our operating performance. The relationship between project personnel expenses and service revenue is driven largely by the chargeability of our consultant base, the prices we charge our customers and the non-billable costs associated with securing new customer engagements and developing new service offerings. The remainder of our recurring operating expense is composed of expenses associated with the development of our business and the support of our customer-serving professionals, such as professional development and recruiting, marketing and sales, and management and administrative support. Professional development and recruiting expenses consist primarily of recruiting and training content development and delivery costs. Marketing and sales expenses consist primarily of the costs associated with the development and maintenance of our marketing materials and programs. Management and administrative support expenses consist primarily of the costs associated with operations, including finance, information systems, human resources, facilities (including the rent of office space) and other administrative support for project personnel.
We regularly review our fees for services, professional compensation and overhead costs to ensure that our services and compensation are competitive within the industry and that our overhead costs are balanced with our revenue levels. In addition, we monitor the progress of customer projects with customer senior management. We manage the activities of our professionals by closely monitoring engagement schedules and staffing requirements. However, a rapid decline in the demand for the professional services that we provide could result in lower utilization of our professionals than we planned. In addition, because most of our customer engagements are terminable by our customers without penalty, an unanticipated termination of a customer project could require us to maintain underutilized employees. While professional staff levels must be adjusted to reflect active engagements, we must also maintain a sufficient number of consulting professionals to oversee existing customer engagements and to participate in sales activities to secure new customer assignments.
Adjustments to Fair Value of Contingent Consideration. During the three- and nine-month periods ended September 30, 2012, we made adjustments to the estimated fair value of certain acquisition-related contingent consideration liabilities. We remeasure the estimated carrying value of contingent consideration each quarter, with any changes (income or expense) in the estimated fair value recorded as an operating expense. Changes in the carrying value of contingent consideration liabilities may fluctuate significantly in future periods depending on changes in estimates, including probabilities associated with achieving the milestones and the period in which we estimate these milestones will be achieved. As of September 30, 2013, all contingent earnout agreements were settled and there was no remaining future obligation.
Fullscope Embezzlement Expenses. Since fiscal 2010, we have incurred certain non-routine professional service-related expenses associated with our identification of embezzlement activities at Fullscope, one of our wholly-owned subsidiaries (the “Fullscope Embezzlement Issue”). We incurred a majority of our embezzlement-related expenses during fiscal 2010 in connection with our identification and investigation of the embezzlement activity.
During the fourth quarter of 2012, the Company began to file tax returns and pay sales and use tax liabilities related to the Fullscope Embezzlement (which were created by the methods employed by a former employee of Fullscope to conceal the discovered fraudulent activity). As of September 30, 2013, the Company had made payments totaling $1.2 million associated with the sales and use tax liabilities. As of September 30, 2013, the remaining accrual for pre-acquisition sales and use tax exposure was $273 thousand. The Company expects to continue to make payments associated with these liabilities during the fourth quarter of 2013.
The Company has incurred significant expenses related to the investigation and related to the filing of sales and use tax returns. The Company anticipates that it may continue to incur additional expenses associated with the Fullscope Embezzlement Issue. We intend to aggressively pursue recovery of these expenses through a claim against existing escrow accounts established in connection with the acquisition of Fullscope, Inc. (“Fullscope Acquisition”) which consists of total of approximately $4.6 million as of September 30, 2013, which is sufficient to cover our claims. The Company fully expects to be reimbursed for payments made in relation to embezzlement-related professional services, as well as the payments associated with the filing of amended sales and use tax returns. However, reimbursement from escrow is not expected until resolution is reached on all outstanding embezzlement-related sales and use tax amounts. Amounts recovered, if any, will be recorded during the period in which settlement is determined to be probable of recovery from escrow.
18
Table of Contents
Company Performance Measurement Systems and Metrics. The Company’s management monitors and assesses its operating performance by evaluating key metrics and indicators on an ongoing basis. For example, we regularly review performance information related to annualized revenue per billable consultant, periodic consultant utilization rates, gross profit margins, average bill rates and billable employee headcount. Edgewater has also developed internal Enterprise Performance Management systems which aid us in measuring our operating performance and consultant utilization rates. The matching of sales opportunities to available skill sets in our consultant base is one of our greatest challenges and therefore, we monitor consultant utilization closely. These metrics, along with other operating and financial performance metrics, are used in evaluating management’s overall performance. These metrics and indicators are discussed in more detail under “Results for the Three and Nine Months Ended September 30, 2013, Compared to Results for the Three and Nine Months Ended September 30, 2012,” included elsewhere in this Quarterly Report on Form 10-Q.
Results for the Three and Nine Months Ended September 30, 2013, Compared to Results for the Three and Nine Months Ended September 30, 2012
The financial information that follows has been rounded in order to simplify its presentation. The amounts and percentages below have been calculated using the detailed financial information contained in the unaudited condensed consolidated financial statements, the notes thereto, and the other financial data included in this Quarterly Report on Form 10-Q.
19
Table of Contents
The following table sets forth the percentage of total revenue of items included in our unaudited condensed consolidated statements of operations:
| Three Months Ended September 30, |
Nine Months Ended September 30, |
|||||||||||||||
| 2013 | 2012 | 2013 | 2012 | |||||||||||||
| Revenue: |
||||||||||||||||
| Service revenue |
84.2 | % | 83.7 | % | 81.6 | % | 83.0 | % | ||||||||
| Software revenue |
8.9 | % | 8.4 | % | 11.2 | % | 9.2 | % | ||||||||
| Reimbursable expenses |
6.9 | % | 7.9 | % | 7.2 | % | 7.8 | % | ||||||||
|
|
|
|
|
|
|
|
|
|||||||||
| Total revenue |
100.0 | % | 100.0 | % | 100.0 | % | 100.0 | % | ||||||||
| Cost of revenue: |
||||||||||||||||
| Project and personnel costs |
51.5 | % | 51.3 | % | 51.9 | % | 51.0 | % | ||||||||
| Software costs |
3.6 | % | 4.3 | % | 5.9 | % | 6.1 | % | ||||||||
| Reimbursable expenses |
6.9 | % | 7.9 | % | 7.2 | % | 7.8 | % | ||||||||
|
|
|
|
|
|
|
|
|
|||||||||
| Total cost of revenue |
62.0 | % | 63.5 | % | 65.0 | % | 64.9 | % | ||||||||
|
|
|
|
|
|
|
|
|
|||||||||
| Gross profit |
38.0 | % | 36.5 | % | 35.0 | % | 35.1 | % | ||||||||
| Operating expenses: |
||||||||||||||||
| Selling, general and administrative |
29.9 | % | 31.0 | % | 30.3 | % | 31.3 | % | ||||||||
| Depreciation and amortization |
1.2 | % | 1.9 | % | 1.2 | % | 1.8 | % | ||||||||
|
|
|
|
|
|
|
|
|
|||||||||
| Total operating expenses |
31.1 | % | 32.9 | % | 31.5 | % | 33.1 | % | ||||||||
|
|
|
|
|
|
|
|
|
|||||||||
| Operating income |
6.9 | % | 3.6 | % | 3.5 | % | 2.0 | % | ||||||||
| Other (income) expense, net |
(0.4 | )% | (0.4 | )% | 0.1 | % | — | % | ||||||||
|
|
|
|
|
|
|
|
|
|||||||||
| Income before income taxes |
7.3 | % | 4.0 | % | 3.4 | % | 2.0 | % | ||||||||
| Income tax provision |
0.3 | % | 0.7 | % | 0.4 | % | 0.5 | % | ||||||||
|
|
|
|
|
|
|
|
|
|||||||||
| Net income |
7.0 | % | 3.3 | % | 3.0 | % | 1.5 | % | ||||||||
|
|
|
|
|
|
|
|
|
|||||||||
Revenue. Total revenue increased by $1.2 million, or 5.1%, to $25.4 million during the three-month period ended September 30, 2013, compared to total revenue of $24.2 million in the three-month period ended September 30, 2012. Total revenue increased by $142 thousand, or 0.2%, to $76.8 million during the nine-month period ended September 30, 2013, compared to total revenue of $76.6 million in the nine-month period ended September 30, 2012. With respect to the comparative changes in year-over-year total revenue, service revenue increased to $21.4 million for the three-month period ended September 30, 2013, compared to $20.2 million during the comparative 2012 quarterly period, while service revenue decreased to $62.7 million during the nine-month period ended September 30, 2013 compared to $63.6 million during the nine-month period ended September 30, 2012. Software revenue represented $2.3 million, or 8.9% of total revenue, during the three-month period ended September 30, 2013, compared to $2.0 million, or 8.4% of total revenue, during the third quarter of 2012 and was $8.6 million, or 11.2% of total revenue, during the nine-month period ended September 30, 2013, compared to $7.0 million, or 9.2% of total revenue, during the first nine months of 2012.
On a year-over-year basis, the increase in quarterly service revenue is reflective of the improved pipeline activity and project signings in 2013. The second half of 2012 was the start of a period of customer project signing delays which continued into the first quarter of 2013. On a sequential quarterly basis, service revenue in the third quarter of 2013 decreased by $(210) thousand, or (1.0)%, compared to the second quarter of 2013. The sequential quarterly decrease in service revenue is primarily the result of delayed project starts, specifically within our ERP-related service offering. These delays hindered our ability to convert our previously signed engagements into current quarter service revenue. Unlike the delays experienced in the second half of 2012 and the first quarter of 2013, which saw customers delay the actual signing of engagement contracts, these delays were short-term in nature (with several of our ERP customers delaying the launch of previously signed engagements until the later parts of the third quarter of 2013). The Company continues to develop strong pipeline activity across each of our service offerings.
The addition of intellectual property (IP) design and build capabilities to our strategic offerings mix has had a positive impact on our lead generation and overall sales activity. We plan to continue to build out intellectual property in the healthcare, insurance and manufacturing space in future periods.
20
Table of Contents
Utilization, which is the rate at which we are able to generate revenue from our consultants, increased to 71.1% during the third quarter of 2013, compared to 69.5% during the third quarter of 2012. Billable headcount, including contractors, decreased by 10 during the third quarter of 2013, compared to the third quarter of 2012. The majority of the decrease in headcount came in the form of contractors, as the Company proactively manages its reliance on external resources, while maintaining appropriate levels of staff to service existing customer demand and effectively respond to proposal activity. Third quarter 2013 utilization, on a sequential quarterly basis, declined from 75.0% during the second quarter of 2013 essentially as a result of the temporary delays in project starts experienced in our ERP service offering.
Annualized service revenue per billable consultant, as adjusted for utilization, was $370 thousand and $357 thousand during the three- and nine-month periods ended September 30, 2013, compared to $359 thousand during the comparative 2012 three- and nine-month periods. The increase in annualized service revenue per billable consultant for the comparable quarterly periods is reflective of the increased proportion of EPM-related service revenues (which have historically generated higher billing rates) in the three-month period ended September 30, 2013.
During the three- and nine-month periods ended September 30, 2013, software revenue totaled $2.3 million and $8.6 million, or 8.9% and 11.2% of total revenue, respectively, compared to software revenue of $2.0 million and $7.0 million, or 8.4% and 9.2%, respectively, in the three- and nine-month periods ended September 30, 2012. Our software revenue is primarily related to our resale of Microsoft Dynamics AX ERP software and maintenance. Software revenue is expected to fluctuate on a period-to-period basis dependent upon our customers’ demand for such third-party off-the-shelf software. We anticipate that software revenue will continue to be a significant component of revenues in future years. Because of this, we believe that periodic fluctuations in the amount of software revenue recognized by the Company may have a material impact upon our total revenue and gross margins.
Prior to the second quarter of 2013, we recorded the majority of our software resale revenue on a gross basis (reporting all of the revenue and cost from the transaction in our statement of operations). However, beginning with the second quarter of 2013, due to changes in the nature of the terms of certain of our Microsoft Dynamics AX software resale arrangements, we began to recognize an increasing portion of our software resale revenue on a net basis (reporting only the net profit from the transaction as revenue in our statement of operations). We expect this trend to continue and also anticipate that the number of new software resale arrangements subject to these terms may increase in future periods. Additionally, the changes in the terms of the resale arrangements may also, in certain situations, extend the timing of the recognition period (from full, immediate recognition of the gross margin on the transaction to recognition of the gross margin on the transaction spread evenly over a three-year period) and reduce the amount of the software revenue and associated gross margin to be recognized by the Company.
A significant amount of our 2013 three- and nine-month software revenue is associated with the recognition of PI2 license revenue. In June 2012, Microsoft purchased the Company’s internally developed PI2 software and intellectual property (the “PI2 Solution”) for an aggregate purchase price of $3.25 million. The sale of the PI2 Solution was a significant multiple element contract. This contract includes $3.25 million of license consideration and subsequent development and training services. At the time of the sale, we determined that the license did not have stand-alone value without the services, and accordingly we accounted for the license and related services as one unit. Since June 2012, we have recognized the license revenue over the period the expected services are to be performed.
We perform routine periodic reviews of our current and expected performance against the service contracts in connection with our PI2 revenue recognition procedures. During the three months ended June 30, 2013, in conjunction with our periodic review, the Company revised its estimate to complete certain work under the training services agreement. As a result of our revised estimates, we recognized software revenue related to the PI2 transaction of $934 thousand during the second quarter of 2013, which amount is higher than what we have recognized on a recurring quarterly basis since entering the transaction in the second quarter of 2012. We recognized $614 thousand and $2.0 million in PI2-related software revenue during the three- and nine-months ended September 30, 2013, respectively. The Company recognized $354 thousand in PI2-related software revenue during the three- and nine-month periods ended September 30, 2012. As of September 30, 2013, there is $453 thousand in PI2-related software revenue remaining to be recognized in future periods.
Generally, we are reimbursed for our out-of-pocket expenses incurred in connection with our customers’ consulting projects. Reimbursed expense revenue remained consistent at $1.8 million for the three-month periods ended September 30, 2013 compared to $1.9 million for the three-month period ended September 30, 2012. Reimbursed expense revenue decreased $457 thousand, to $5.5 million for the nine-month period ended September 30, 2013, as compared to $6.0 million in the comparative 2012 year-to-date period. The aggregate amount of reimbursed expenses will fluctuate from period-to-period depending on the number of billable consultants as well the location of our customers, the general fluctuation of travel costs, such as airfare, and the number of our projects that require travel.
21
Table of Contents
The number of customers the Company served during the nine-month period ended September 30, 2013 totaled 354, as compared to 375 customers during the nine-month period ended September 30, 2012. During the first nine months of 2013, we secured first-time engagements with a total of 74 new customers, compared to 87 new customer engagements during the first nine months of 2012.
Cost of Revenue. Cost of revenue primarily consists of project personnel costs principally related to salaries, payroll taxes, employee benefits, software costs and travel expenses for personnel dedicated to customer projects. These costs represent the most significant expense we incur in providing our services. In total, cost of revenue increased by $389 thousand, or 2.5%, to $15.7 million for the three-month period ended September 30, 2013, compared to $15.4 million in the comparative 2012 quarterly period. Similarly, cost of revenue increased by $141 thousand, or 0.3%, to $49.9 million during the year-to-date period ended September 30, 2013 compared to $49.8 million in the comparative 2012 year-to-date period.
The primary drivers of the 2013 year-over-year quarterly increase in total cost of revenue, on an absolute dollar basis, were related to an increase in expense associated with billable consultant revenue share programs (driven by the comparable period service revenue growth) and, to a lesser extent, increases in salary- and fringe-related expenses (primarily associated with the additional day of payroll expense in the three-months ended September 30, 2013). The Company maintained 305 billable consultants (excluding contractors) as of the quarter ended September 30, 2013, compared to 308 billable consultants (excluding contractors) at the end of the third quarter of 2012.
In regards to total cost of revenue for the nine-month period ended September 30, 2013, increases in salary- and fringe-related expenses, combined with increases in billable consultant revenue share programs, were partially offset by a decrease in contractor expense (as the Company continues to manage the need to leverage external billable resources) and software-related expense.
Project and personnel costs represented 51.5% and 51.9% of total revenue during the three- and nine-month periods ended September 30, 2013 as compared to 51.3% and 51.0% of total revenue during the three- and nine-month periods ended September 30, 2012. As a percentage of total revenue, project and personnel costs remained fairly consistent in each of the comparative reporting periods.
Software costs amounted to $921 thousand and $4.6 million during the three- and nine-month periods ended September 30, 2013. Software costs amounted to $1.1 million and $4.7 during the three- and nine-month periods ended September 30, 2012. Software costs are expected to fluctuate between quarters depending on our customers’ demand for software. Additionally, the amount of future periodic software costs reported by the Company will also be influenced by the accounting method (gross versus net) employed by the Company to record the transaction.
Reimbursable expenses were $1.8 million and $5.5 million for the three- and nine-month periods ended September 30, 2013, compared to $1.9 million and $6.0 million in the comparative periods of 2012.
Gross Profit. During the three-month period ended September 30, 2013, total gross profit increased $845 thousand, or 9.6%, to $9.7 million compared to gross profit of $8.8 million in the three-month period ended September 30, 2012. During the nine-month period ended September 30, 2013, total gross profit decreased to $26.8 million compared $26.9 million in the nine-month period ended September 30, 2012. For purposes of further analysis, we refer to gross profit as a percentage of revenue generally as gross margin.
Total gross margin, as a percentage of total revenue, increased to 38.0% in the third quarter of 2013, compared to 36.5% in the third quarter of 2012. Total gross margin of 35.0% in the nine-month period ended September 30, 2013 was relatively consistent with 35.1% in the comparative 2012 year-to-date period. The third quarter 2013 year-over-year improvement in total gross margin is directly related to the improvement in billable consultant utilization and an increase in software revenue-related margin contribution (which is being driven by the 2013 year-to-date recognition of higher margin PI2 software revenue and the recognition of certain software revenue transactions on a net basis, as described under “Factors Influencing Our Results of Operation”). Similarly, the comparative year-over-year change in 2013 total gross margin was associated with a slight decline in billable consultant utilization, offset by the improvement in software revenue margin contribution due to the PI2-related revenue.
Service revenue gross margin was 38.9% in the third quarter of 2013, compared to 38.7% in the third quarter of 2012. Service revenue gross margin was 36.4% in the nine-month period ended September 30, 2013, compared to 38.5% in the comparative 2012 year-to-date period. The consistency of the service revenue gross margin in the comparative 2013 and 2012 quarterly periods is reflective of the service revenue growth and improvement in billable consultant utilization, which were offset by the increase in project and personnel costs, as described in “Cost of Revenue” above. The decrease in service gross margin for the nine-month periods ended September 30, 2013 is primarily the result of the slight decrease in comparative service revenue and the previously described increase in project and personnel costs.
22
Table of Contents
We anticipate that software revenue will continue to be a significant part of our revenue in future periods. Our software revenue has historically influenced, and we anticipate that it will continue to influence in the future, our quarterly gross margins. We believe, in connection with changes in the nature of the terms of certain of our Microsoft Dynamics AX software resale arrangements as described in “Revenue” above, that anticipated changes in the terms of the resale arrangements will, in certain situations, extend the timing of the recognition period of the gross margin on software sales (from full, immediate recognition of the gross margin on the transaction to recognition of the gross margin on the transaction spread evenly over a three-year period) and result in a reduction in the amount of the software gross margin to be recognized by the Company.
Selling, General and Administrative (“SG&A”) Expenses. As a percentage of total revenue, SG&A expenses were 29.9% and 30.3% during the three- and nine-month periods ended September 30, 2013, respectively, compared to 31.0% and 31.3% in the three- and nine-month periods of 2012, respectively. On an absolute dollar-basis, SG&A expenses increased by $91 thousand, or 1.2%, to $7.6 million in the three-month period ended September 30, 2013, compared to SG&A expenses of $7.5 million in the three-month period ended September 30, 2012. On an absolute dollar-basis, SG&A expenses decreased by $(770) thousand, or (3.2)%, to $23.2 million in the nine-month period ended September 30, 2013, compared to SG&A expenses of $24.0 million in the nine-month period ended September 30, 2012.
The year-over-year increase in SG&A expenses in the three-month period ended September 30, 2013, compared to the three-month period ended September 30, 2012 was driven primarily by the absence of the $246 thousand reduction in the estimated fair value of accrued contingent earnout consideration associated with the Meridian acquisition recorded by the Company in the third quarter of 2012, which was offset by decreases in occupancy-related expenses, recruiting and sales-related salaries and wages (including commissions).
The year-over-year decrease in SG&A expenses in the nine-month period of 2013, compared to the comparative 2012 year-to-date period, is primarily the result of decreases in recruiting costs, occupancy-related expenses, sales-related salaries and wages (including commissions) and the absence of a $550 thousand incremental expense recognized in the second quarter of 2012 related to the estimated pre-acquisition Fullscope sales and use tax exposure. These decreases in comparative year-to-date SG&A expenses were partially offset by increased expenses related to bonus and commission plans, stock-based compensation expense and professional fees.
During the nine-month period ended September 30, 2013, we incurred an immaterial amount of expenses associated with the Fullscope Embezzlement Issue, and we anticipate that we may continue to incur additional expenses associated with this issue in future periods. We intend to aggressively pursue recovery of all incurred expenses associated with the Fullscope Embezzlement Issue through all possible avenues, including a claim against the escrow account established in connection with the Fullscope Acquisition and reimbursement under insurance policies. We believe that we may be able to recover some, if not all, of the expenses we incur in addressing this situation. Amounts recovered and/or reimbursed, if any, in connection with this matter will be recorded in the period during which amounts are determined to be probable of recovery from escrow.
Depreciation and Amortization Expense. Depreciation and amortization expense decreased $(150) thousand, or (33.2)%, to $302 thousand in the quarter ended September 30, 2013 as compared to $452 thousand in the quarter ended September 30, 2012. Similarly, depreciation and amortization expense decreased $(417) thousand, or (31.1)%, to $925 thousand in the nine-month period ended September 30, 2013 compared to $1.3 million in the comparative 2012 year-to-date period.
Amortization expense was $101 thousand and $310 thousand during the three- and nine-month periods ended September 30, 2013 compared to amortization expense of $241 thousand and $723 thousand in the three- and nine-month periods ended September 30, 2012. The decrease in amortization expense is primarily the result of a reduction in amortization expense associated with the intangible assets identified in connection with the Fullscope Acquisition. The Company recognizes amortization expense over the periods in which it expects to realize the economic benefit. A significant portion of the intangible asset amortization expense related to the Fullscope Acquisition was recorded during 2010 and 2011.
Depreciation expense of $201 thousand and $615 thousand recorded in the three- and nine-month periods ended September 30, 2013, respectively, were consistent with depreciation expense recognized during the comparative 2012 quarterly and year-to-date periods.
23
Table of Contents
Operating Income. Operating income was $1.8 million in the third quarter of 2013, compared to operating income of $861 thousand in the comparative 2012 quarterly period. Similarly, operating income for the nine-month period ended September 30, 2013 was $2.7 million, compared to operating income of $1.5 million in the comparative 2012 year-to-date period.
The 2013 third quarter and year-to-date improvements in operating income are primarily attributable to third quarter 2013 service revenue growth and the increase in gross margin contribution from software revenue (directly related to the recognition of high margin PI2-related software revenue). Additionally, the 2013 year-to-date period was further impacted by the absence of the second quarter of 2012 charge associated with pre-acquisition Fullscope sales and use tax exposure. These items were partially offset by changes in other operating expenses, which are described above.
Other Expense, Net. Other (income) expense, net, totaled $(81) thousand and $92 thousand during the three- and nine-month periods ended September 30, 2013 while other expense, net, totaled $(95) thousand and $10 thousand during the comparative 2012 periods. These amounts primarily represent the Company’s periodic foreign currency exchange gains and losses.
Income Tax Provision. We recorded a provision for income taxes of $74 thousand and $293 thousand during the three and nine months ended September 30, 2013, respectively. We recorded a provision for income taxes of $163 thousand and $382 thousand during the three and nine months ended September 30, 2012, respectively. Our periodic income tax provision amounts are derived based upon an estimated annual effective income tax rate, inclusive of federal and state income taxes, of 4.0% and 11.3% during the three- and nine-month periods ended September 30, 2013, respectively.
Reported income tax expense during the comparative 2013 and 2012 quarterly periods also includes expense amounts attributable to foreign income taxes, the recognition of U.S. deferred tax liabilities for differences between the book and tax basis of goodwill and interest and penalties. The reported estimated annual effective tax rate is lower than an anticipated statutory rate due to a full valuation allowance being provided against our deferred tax assets, which includes significant federal net operating loss carryforwards.
We have deferred tax assets that have arisen primarily as a result of timing differences, net operating loss carryforwards and tax credits. Our ability to realize a deferred tax asset is based on our ability to generate sufficient future taxable income. We assess, on a routine periodic basis, the estimated future realizability of the gross carrying value of our deferred tax assets on a more likely than not basis. Our periodic assessments take into consideration both positive evidence (future profitability projections for example) and negative evidence (recent and historical financial performance for example) as it relates to evaluating the future recoverability of our deferred tax assets. Based on such evaluations, we have concluded that a full valuation allowance against our deferred tax assets remains appropriate.
The establishment of a full valuation allowance against the gross carrying value of our net deferred tax assets does not prohibit or limit the Company’s ability to realize a tax benefit in future periods. All existing deferred tax assets, net operating loss carryforwards and credits will be available, subject to possible statutory limitations, to reduce certain future federal and state income tax obligations.
The Company considers scheduled reversals of deferred tax liabilities, projected future taxable income, ongoing tax planning strategies and other matters, including the period over which our deferred tax assets will be recoverable, in assessing the need for and the amount of the valuation allowance. In the event that actual results differ from these estimates, or we adjust these estimates in the future periods, further adjustments to our valuation allowance may be recorded, which could materially impact our financial position and net income in the period of the adjustment.
Net Income. We generated net income of $1.8 million and $2.3 million during the three- and nine-month periods ended September 30, 2013, respectively, compared to net income of $793 thousand and $1.1 million during the three- and nine-month periods ended September 30, 2012, respectively. The increase in periodic net income in both the three- and nine-month periods of 2013 is primarily attributable to a combination of third quarter 2013 service revenue growth and/or the comparative year-over-year increase in software revenue gross margin contribution (directly related to the recognition of high margin PI2-related software revenue) and a reduction in amortization expense. The increase for the comparable quarterly period was further impacted by the absence of the second quarter of 2012 charges associated with pre-acquisition Fullscope sales and use tax exposure. Each of these comparative changes is described in further detail above.
24
Table of Contents
Liquidity and Capital Resources
The following table summarizes our cash flow activities for the periods indicated:
| Nine Months Ended September 30, |
||||||||
| 2013 | 2012 | |||||||
| (In Thousands) | ||||||||
| Cash flows provided by (used in): |
||||||||
| Operating activities |
$ | 2,319 | $ | 4,914 | ||||
| Investing activities |
(769 | ) | (528 | ) | ||||
| Financing activities |
(720 | ) | (1,746 | ) | ||||
| Effects of exchange rates on cash |
6 | 1 | ||||||
|
|
|
|
|
|||||
| Total cash provided during the period |
$ | 836 | $ | 2,641 | ||||
|
|
|
|
|
|||||
Working capital, which is defined as current assets less current liabilities, increased to $21.2 million as of September 30, 2013, as compared to $18.5 million as of December 31, 2012. As of September 30, 2013, we had cash and cash equivalents of $17.5 million, an $836 thousand increase from the December 31, 2012 balance of $16.7 million. The primary drivers of the increase in cash during 2013 are the collection of receivables related to service and software revenue, proceeds received in connection with the Company’s employee stock purchase plan and proceeds generated through employee stock option exercises. These sources of cash were partially offset by $1.5 million in repurchases of the Company’s common stock, $1.2 million in payments made in connection with the settlement of pre-acquisition Fullscope sales and use tax liabilities, the Company’s 2012 performance-based bonus programs, insurance policy premiums, and, to a lesser extent, purchases of property and equipment.
Historically, we have used our operating cash flows, available cash and periodic sales of our common stock to finance ongoing operations and business combinations. We believe that our cash and cash equivalents will be sufficient to finance our working capital needs for at least the next twelve months. We periodically reassess the adequacy of our liquidity position, taking into consideration current and anticipated operating cash flow, anticipated capital expenditures, and possible business combinations. The pace at which we will either generate or consume cash will be dependent upon future operations and the level of demand for our services on an ongoing basis.
Cash flow from operating activities is driven by collections of fees for our consulting services and the reselling of software products. Cash used in operations predominantly relates to employee compensation and payments to third-party software providers. Accrued payroll and related liabilities fluctuate from period to period based on the timing of our normal payroll cycle and the timing of variable compensation payments. Annual components of our variable compensation plans are paid in the first quarter of the following year, causing fluctuations in cash flow from quarter to quarter.
Accounts payable and accrued expenses are most significantly impacted by the timing of payments required to be made to third-party software providers in connection with the resale of software products to our customers. Historically, a significant portion of our software sales has occurred at the end of the second quarter.
Net cash provided by operating activities was $2.3 million for the nine-month period ended September 30, 2013, as compared to net cash provided by operating activities of $4.9 million for the nine-month period ended September 30, 2012. The primary components of operating cash flows during the first nine months of 2013 were related the collection of accounts receivable, net income from operations of $2.3 million, and non-cash charges of $2.4 million (primarily depreciation, amortization and stock-based compensation expense). These changes were partially offset by the $1.5 million decrease in deferred revenue (primarily related to the recognition of PI2 related revenue). The primary components of operating cash flows during the first nine months of 2012 were related the collection of accounts receivable, net income from operations of $1.1 million, an increase in accrued payroll and related liabilities of $1.8 million, deferred revenue of $2.3 million, and non-cash charges of $2.2 million (primarily depreciation, amortization and stock-based compensation expense).
Net cash used in investing activities was $(769) thousand during the nine-month period ended September 30, 2013, compared to net cash used in investing activities of $(528) thousand in the nine-month period ended September 30, 2012. Cash used in investing activities in the nine-month period ended September 30, 2013 included the Company’s acquisition of a Microsoft Dynamics-based trade promotions management software assets and intellectual property, purchases of property and equipment and capitalized software development costs (related to internal software development initiatives). Cash used in investing activities in the nine-month period ended September 30, 2012 was associated with purchases of property and equipment and the capitalization of internal software development initiatives.
25
Table of Contents
All capital expenditures are discretionary as the Company currently has no long-term commitments for capital expenditures.
Net cash used in financing activities was $(720) thousand in the nine-month period ended September 30, 2013, compared to net cash used in financing activities of $(1.7) million in the nine-month period ended September 30, 2012. The 2013 activities were driven by the repurchase of common stock in the amount of $1.5 million, returning excess cash balances that were not being invested in organic operations or strategic acquisitions to stockholders, partially offset by $793 thousand received from our employees related to our Employee Stock Purchase Plan and stock option exercises. Net cash used in financing activities in the nine-month period ended September 30, 2012 consisted of repurchases of common stock in the amount of $2.2 million, partially offset with proceeds of $470 thousand received from our Employee Stock Purchase Plan.
In September 2013, the Company entered into a three-year secured revolving credit facility (the “Credit Facility”). The Credit Facility allows the Company to borrow up to $10.0 million and includes an additional accordion feature that allows the Company to request an additional $5.0 million as needed, extending the total credit facility borrowing capacity to $15 million over its three-year term. The Credit Facility is secured by the personal property of the Company and its domestic subsidiaries, and is subject to normal covenants. Under the terms of the Credit Facility, any advances will accrue interest at a variable per annum rate of interest equal to, as elected by the Company, (i) the Prime Rate, or (ii) the LIBOR Rate plus 1.5%. Interest is due and payable, in arrears, on a monthly basis. The Company will be obligated to pay an annual commitment fee of 0.15% on the daily undrawn balance of the facility. Any amounts outstanding under the Credit Facility will be due on September 23, 2016. No amounts were drawn under this facility as of September 30, 2013.
Acquisitions, Earnout Payments and Commitments
We have entered into various contingent earnout agreements in connection with the acquisitions we have completed.
Earnout periods, related performance measurements and the value of the contingent earnout consideration to be earned are specific to each acquisition. Contingent earnout consideration paid by the Company has historically been paid in either cash or a combination of cash and stock. As of September 30, 2013, there were no ongoing earnouts.
On May 17, 2010, the Company acquired substantially all of the assets of Meridian Consulting International. As provided for under the related purchase agreement, Meridian’s former stockholders were eligible to receive additional contingent consideration based upon performance-based thresholds over a 36-month period from the date of acquisition. The Company increased total purchase price consideration by $1.2 million, which represented our initial fair value estimate of the contingent consideration to be paid to the former stockholders of Meridian.
On a routine periodic basis, the Company reassesses the estimated fair value of contingent consideration and records any changes in fair value within selling, general and administrative expense in the period the change occurred. The former Meridian stockholders’ third and final twelve-month earnout period concluded in May 2013. None of the minimum financial performance measures necessary to earn additional contingent earnout consideration were achieved.
Off Balance Sheet Arrangements
We do not have any off-balance sheet arrangements that have or are reasonably likely to have a current or future effect on our financial condition, changes in financial condition, revenues or expenses, results of operations, liquidity, capital expenditures or capital resources that are material to investors.
Critical Accounting Policies and Estimates
We prepare our unaudited condensed consolidated financial statements in conformity with accounting principles generally accepted in the United States of America. As such, we are required to make certain estimates, judgments and assumptions that we believe are reasonable based upon the information available. These estimates and assumptions affect the reported amounts of assets and liabilities at the date of the financial statements and the reported amounts of revenues and expenses during the periods presented. We reaffirm the critical accounting policies and estimates as reported in our 2012 Annual Report on Form 10-K, which was filed with the Securities and Exchange Commission on March 8, 2013.
26
Table of Contents
Recent Accounting Pronouncements
In February 2013, the Financial Accounting Standards Board issued Accounting Standards Update (“ASU”) 2013-02, “Comprehensive Income (Topic 220): Reporting of Amounts Reclassified Out of Accumulated Other Comprehensive Income.” ASU 2013-02 requires an entity to report the effect of significant reclassifications out of accumulated other comprehensive income on the respective line items in net income if the amount being reclassified is required to be reclassified in its entirety to net income. For other amounts that are not required to be reclassified in their entirety to net income in the same reporting period, an entity is required to cross-reference other disclosures that provide additional detail about these amounts. The amendments do not change the current requirements for reporting net income or other comprehensive income in financial statements. For public entities, the amendments are effective prospectively for reporting periods beginning after December 15, 2012. Early adoption is permitted. The adoption of ASU 2013-2 did not have a material impact on the Company’s condensed consolidated financial statements as no significant amounts were reclassified out of Accumulated Other Comprehensive Income during the three- and nine-month periods ended September 30, 2013 and 2012, respectively.
We operate in a rapidly changing environment that involves certain risks and uncertainties, some of which are beyond our control. You should carefully review and consider the information regarding certain risk factors that could materially affect our business, financial condition or future results set forth under “Part I – Item 1A – Risk Factors” in our Annual Report on Form 10-K, for the period ended December 31, 2012, which was filed with the Securities and Exchange Commission on March 8, 2013 and in this Quarterly Report on Form 10-Q under “Special Note Regarding Forward-Looking Statements.”
27
Table of Contents
SPECIAL NOTE REGARDING FORWARD-LOOKING STATEMENTS
Some of the statements in this Quarterly Report on Form 10-Q and elsewhere constitute forward-looking statements under Section 27A of the Securities Act of 1933, as amended, and Section 21E of the Securities Exchange Act of 1934, as amended. These statements involve known and unknown risks, uncertainties and other factors that may cause results, levels of activity, growth, performance, tax consequences or achievements to be materially different from any future results, levels of activity, growth, performance, tax consequences or achievements expressed or implied by such forward-looking statements. Such factors include, among other things, those listed below, as well as those further set forth under the heading “Risk Factors” in our 2012 Annual Report on Form 10-K as filed with the SEC on March 8, 2013.
The forward-looking statements included in this Form 10-Q and referred to elsewhere are related to future events or our strategies or future financial performance, including statements concerning our 2013 outlook, future revenue and growth, customer spending outlook, general economic trends, IT service demand, future revenue and revenue mix, utilization, new service offerings, significant customers, competitive and strategic initiatives, growth plans, potential stock repurchases, future results, tax consequences and liquidity needs. In some cases, you can identify forward-looking statements by terminology such as “may,” “should,” “believe,” “anticipate,” “anticipated,” “expectation,” “continued,” “future,” “forward,” “potential,” “estimate,” “estimated,” “forecast,” “project,” “encourage,” “opportunity,” “goal,” “objective,” “could,” “expect,” “expected,” “intend,” “plan,” “planned,” or the negative of such terms or comparable terminology. These forward-looking statements inherently involve certain risks and uncertainties, although they are based on our current plans or assessments which are believed to be reasonable as of the date of this Form 10-Q. Factors that may cause actual results, goals, targets or objectives to differ materially from those contemplated, projected, forecasted, estimated, anticipated, planned or budgeted in such forward-looking statements include, among others, the following possibilities: (1) failure to obtain new customers or retain significant existing customers; (2) the loss of one or more key executives and/or employees; (3) changes in industry trends, such as a decline in the demand for Enterprise Resource Planning and Enterprise Performance Management solutions, custom development and system integration services and/or declines in industry-wide information technology spending, whether on a temporary or permanent basis and/or delays by customers in initiating new projects or existing project milestones; (4) inability to execute upon growth objectives, including new services and growth in entities acquired by our Company; (5) adverse developments and volatility involving geopolitical or technology market conditions; (6) unanticipated events or the occurrence of fluctuations or variability in the matters identified under “Critical Accounting Policies” in our 2012 Annual Report on Form 10-K; (7) delays in, or the failure of, our sales pipeline being converted to billable work and recorded as revenue; (8) termination by clients of their contracts with us or inability or unwillingness of clients to pay for our services, which may impact our accounting assumptions; (9) inability to recruit and retain professionals with the high level of information technology skills and experience needed to provide our services; (10) failure to expand outsourcing services to generate additional revenue; (11) any changes in ownership of the Company or otherwise that would result in a limitation of the net operating loss carry forward under applicable tax laws; (12) the failure of the marketplace to embrace advisory and product-based consulting services; (13) changes in our utilization levels; and/or (14) failure to make a successful claim against the Fullscope escrow account. In evaluating these statements, you should specifically consider various factors described above as well as the risks outlined under Part I—Item IA “Risk Factors” in our 2012 Annual Report on Form 10-K filed with the SEC on March 8, 2013. These factors may cause our actual results to differ materially from those contemplated, projected, anticipated, planned or budgeted in any such forward-looking statements.
Although we believe that the expectations in the forward-looking statements are reasonable, we cannot guarantee future results, levels of activity, performance, growth, earnings per share or achievements. However, neither we nor any other person assumes responsibility for the accuracy and completeness of such statements. Except as otherwise required, we undertake no obligation to update any of the forward-looking statements after the date of this Form 10-Q to conform such statements to actual results.
28
Table of Contents
ITEM 3. QUANTITATIVE AND QUALITATIVE DISCLOSURES ABOUT MARKET RISK
Our primary financial instruments include investments in money market funds that are sensitive to market risks and interest rates. The investment portfolio is used to preserve our capital until it is required to fund operations, strategic acquisitions or distributions to stockholders. None of our market-risk sensitive instruments are held for trading purposes. We did not purchase derivative financial instruments in the three- or nine-month periods ended September 30, 2013 and 2012. Should interest rates on the Company’s investments fluctuate by 10% the impact would not be material to the financial condition, results of operations or cash flows.
The impact of inflation and changing prices has not been material on revenue or income from continuing operations during the three- and nine-month periods ended September 30, 2013 and 2012.
ITEM 4. CONTROLS AND PROCEDURES
Evaluation of Disclosure Controls and Procedures
We maintain disclosure controls and procedures, which we have designed to ensure that material information related to the Company, including our consolidated subsidiaries, is properly identified and evaluated on a regular basis and disclosed in accordance with all applicable laws and regulations. The Chairman, President and Chief Executive Officer and the Chief Financial Officer of Edgewater Technology, Inc. (its principal executive officer and principal financial officer, respectively) have concluded, based on their evaluations of the Company’s disclosure controls and procedures as of the end of the period covered by this report, that the Company’s disclosure controls and procedures are effective to ensure that information required to be disclosed by the Company in the reports filed or submitted by it under the Securities Exchange Act of 1934, as amended, is recorded, processed, summarized and reported within the time periods specified in the Securities and Exchange Commission rules and forms, and include controls and procedures designed to ensure that information required to be disclosed by the Company in such reports is accumulated and communicated to the Company’s management as appropriate to allow timely decisions regarding required disclosure.
Changes in Controls and Procedures
There were no changes in our internal control over financial reporting, as such term is defined in Rules 13a-15(f) and 15d-15(f) under the Exchange Act, during the period covered by this report that have materially affected, or are reasonably likely to materially affect, our internal control over financial reporting.
We are sometimes a party to litigation incidental to our business. We are not involved in any active, pending, or (to the best of our knowledge) threatened legal proceedings which would be material to our consolidated financial statements. We maintain insurance in amounts, with coverages and deductibles, which we believe are reasonable.
As discussed in “Part I—Item 1A—Risk Factors” of our Annual Report on Form 10-K for the year ended December 31, 2012 and herein under “Special Note Regarding Forward-Looking Statements,” investors should be aware of certain risks, uncertainties and assumptions in our business. We encourage you to refer to our Annual Report on Form 10-K to carefully consider these risks, uncertainties and assumptions.
29
Table of Contents
In addition, please note the following risk:
Our business could be adversely affected by local political, social, legal, tax, regulatory or environmental requirements. The local business risks in different cities, states and countries in which we or our current or potential customers operate could have a material impact on our financial condition, results of operations and growth prospects. We sell our classic consulting and product-based consulting services in different cities, states and countries and may increasingly become exposed to changing political, social, legal, tax, regulatory and environmental requirements at the local, national or international level. Also, new policies or measures by governments, whether fiscal, tax, regulatory, environmental or other competitive changes, may lead to an increase in additional or unplanned expenditures, discourage our customers or potential customers from purchasing our services and ultimately adversely affect our financial condition, results of operations and growth prospects.
ITEM 2. UNREGISTERED SALES OF EQUITY SECURITIES AND USE OF PROCEEDS
In December 2007, our Board of Directors (the “Board”) authorized a stock repurchase program for up to $5.0 million of common stock on the open market or through privately negotiated transactions from time-to-time through December 31, 2008 (the “Stock Repurchase Program”). The Board subsequently amended the Stock Repurchase Program, authorizing both an increase to and an extension of the Stock Repurchase Program. The Stock Repurchase Program, as amended, had a maximum purchase value of shares of $16.1 million (the “Purchase Authorization”) and was set to expire on September 20, 2013 (the “Repurchase Period”). On September 19, 2013, we announced that the Board had approved both a $7.0 million increase to the Purchase Authorization, to $23.1 million, and an extension of the Repurchase Period to September 19, 2014.
The following table provides information with respect to purchases of our common stock during the quarter ended September 30, 2013:
Issuer Purchases of Equity Securities
| Period |
Total Number of Shares Purchased |
Average Price Paid Per Share |
Total Number of Shares Purchased as Part of Publicly Announced Plans or Programs |
Maximum Dollar Value of Shares that May Yet Be Purchased Under the Plans or Programs |
||||||||||||
| July 1 – 31, 2013 |
— | $ | — | — | $ | 3,032,351 | ||||||||||
| August 1 – 31, 2013 |
— | $ | — | — | $ | 3,032,351 | ||||||||||
| September 1 – 30, 2013 |
— | $ | — | — | $ | 10,032,351 | ||||||||||
|
|
|
|
|
|
|
|
|
|||||||||
| Total |
— | $ | — | — | $ | 10,032,351 | ||||||||||
|
|
|
|
|
|
|
|
|
|||||||||
ITEM 3. DEFAULTS UPON SENIOR SECURITIES
None.
ITEM 4. MINE SAFETY DISCLOSURES
Not applicable.
None.
30
Table of Contents
| 10.1 | Loan Agreement, dated as of September 23, 2013, among Edgewater Technology, Inc., its subsidiaries listed therein and RBS Citizens, N.A. (Incorporated herein by reference to Exhibit 10.1 to the Company’s Current Report on Form 8-K filed with the Securities and Exchange Commission on September 25, 2013 (File No. 000-20971)) | |
| 31.1 | 13a-14 Certification – Chairman, President and Chief Executive Officer* | |
| 31.2 | 13a-14 Certification – Chief Financial Officer* | |
| 32 | Section 1350 Certification** | |
| 101 | Interactive Data Files Pursuant to Rule 405 of Regulation S-T: (i) Unaudited Condensed Consolidated Balance Sheets as of September 30, 2013 and December 31, 2012, (ii) Unaudited Condensed Consolidated Statements of Comprehensive Income for the Three and Nine Months ended September 30, 2013 and 2012, (iii) Unaudited Condensed Consolidated Statements of Cash Flows for the Nine Months ended September 30, 2013 and 2012 and (iv) Notes to Unaudited Condensed Consolidated Financial Statements.* | |
| * - | Filed herewith. |
| ** - | Furnished herewith. |
Pursuant to the requirements of the Securities Exchange Act of 1934, as amended, the registrant has duly caused this report to be signed on its behalf by the undersigned thereunto duly authorized.
| EDGEWATER TECHNOLOGY, INC. | ||||
| Date: October 31, 2013 | /s/ SHIRLEY SINGLETON | |||
| Shirley Singleton | ||||
| Chairman, President and Chief Executive Officer (Principal Executive Officer) | ||||
| Date: October 31, 2013 | /s/ TIMOTHY R. OAKES | |||
| Timothy R. Oakes | ||||
| Chief Financial Officer (Principal Financial and Accounting Officer) | ||||
31