Attached files
| file | filename |
|---|---|
| EX-32 - EX-32 - EDGEWATER TECHNOLOGY INC/DE/ | d95834dex32.htm |
| EX-31.1 - EX-31.1 - EDGEWATER TECHNOLOGY INC/DE/ | d95834dex311.htm |
| EX-23.1 - EX-23.1 - EDGEWATER TECHNOLOGY INC/DE/ | d95834dex231.htm |
| EX-21.1 - EX-21.1 - EDGEWATER TECHNOLOGY INC/DE/ | d95834dex211.htm |
| EX-31.2 - EX-31.2 - EDGEWATER TECHNOLOGY INC/DE/ | d95834dex312.htm |
Table of Contents
UNITED STATES
SECURITIES AND EXCHANGE COMMISSION
Washington, D.C. 20549
Form 10-K
| [X] | ANNUAL REPORT PURSUANT TO SECTION 13 OR 15(D) OF THE SECURITIES |
| EXCHANGE | ACT OF 1934 FOR THE FISCAL YEAR ENDED DECEMBER 31, 2015 |
| [ ] | TRANSITION REPORT PURSUANT TO SECTION 13 OR 15(D) OF THE |
| SECURITIES | EXCHANGE ACT OF 1934 |
Commission file number: 000-20971
EDGEWATER TECHNOLOGY, INC.
(Exact name of registrant as specified in its charter)
| Delaware | 71-0788538 | |
| (State or other jurisdiction of incorporation or organization) |
(I.R.S. Employer Identification No.) | |
| 200 Harvard Mill Square, Suite 210 | ||
| Wakefield, Massachusetts | 01880 | |
| (Address of principal executive offices) | (Zip Code) | |
Registrant’s telephone number, including area code: (781) 246-3343
Securities registered pursuant to Section 12(b) of the Act:
| Title of each class |
Name of each exchange on which registered | |
| Common Stock, $0.01 par value | NASDAQ Global Market |
Securities registered pursuant to Section 12(g) of the Act: None
Indicate by a check mark if the registrant is a well-known seasoned issuer, as defined in Rule 405 of the Securities Act. Yes [ ] No [X]
Indicate by a check mark if the registrant is not required to file reports pursuant to Section 13 or Section 15(d) of the Act. Yes [ ] No [X]
Indicate by check mark whether the registrant (1) has filed all reports required to be filed by Section 13 or 15(d) of the Securities Exchange Act of 1934 during the preceding 12 months (or for such shorter period that the registrant was required to file such reports), and (2) has been subject to such filing requirements for the past 90 days. Yes [X] No [ ]
Indicate by check mark whether the registrant has submitted electronically and posted on its corporate Web site, if any, every Interactive Data File required to be submitted and posted pursuant to Rule 405 of Regulation S-T (§232.405 of this chapter) during the preceding 12 months (or for such shorter period that the registrant was required to submit and post such files). Yes [X] No [ ]
Indicate by check mark if disclosure of delinquent filers pursuant to Item 405 of Regulation S-K (§229.405 of this chapter) is not contained herein, and will not be contained, to the best of registrant’s knowledge, in definitive proxy or information statements incorporated by reference in Part III of this Form 10-K or any amendment to this Form 10-K. [ ]
Indicate by check mark whether the registrant is a large accelerated filer, an accelerated filer, a non-accelerated filer, or a smaller reporting company. See the definitions of “large accelerated filer,” “accelerated filer,” and “smaller reporting company” in Rule 12b-2 of the Exchange Act:
Large accelerated filer [ ] Accelerated filer [X] Non-accelerated filer [ ] Smaller reporting company [ ]
Indicate by check mark whether the registrant is a shell company (as defined in Rule 12b-2 of the Act). Yes [ ] No [X]
As of June 30, 2015, there were 11,718,375 shares of Common Stock of the Registrant outstanding. The aggregate market value of the Common Stock of the Registrant held by non-affiliates (assuming for these purposes that all executive officers and directors are “affiliates” of the Registrant) as of June 30, 2015 was approximately $78.2 million, computed based upon the closing price of $7.30 per share on June 30, 2015.
As of March 2, 2016, there were 11,893,696 shares of Common Stock of the Registrant outstanding.
DOCUMENTS INCORPORATED BY REFERENCE
Part III of this Annual Report on Form 10-K incorporates by reference portions of the Registrant’s definitive proxy statement for the Registrant’s 2016 annual meeting of stockholders, to be filed with the Securities and Exchange Commission no later than 120 days after the close of its fiscal year, provided that if such proxy statement is not filed with the Commission in such 120-day period, an amendment to this Form 10-K shall be filed no later than the end of the 120-day period.
Table of Contents
SPECIAL NOTE REGARDING FORWARD-LOOKING STATEMENTS
Some of the statements in this Annual Report on Form 10-K (this “Form 10-K”) may constitute forward-looking statements under Section 27A of the Securities Act of 1933, as amended, and Section 21E of the Securities Exchange Act of 1934, as amended. These statements involve known and unknown risks, uncertainties and other factors that may cause results, levels of activity, growth, performance, tax consequences or achievements to be materially different from any future results, levels of activity, growth, performance, tax consequences or achievements expressed or implied by such forward-looking statements.
In some cases, you can identify forward-looking statements by terminology such as “may,” “should,” “believe,” “anticipate,” “anticipated,” “expectation,” “continued,” “future,” “forward,” “potential,” “estimate,” “estimated,” “forecast,” “project,” “encourage,” “opportunity,” “goal,” “objective,” “could,” “expect,” “expected,” “intend,” “plan,” “planned,” or the negative of such terms or comparable terminology. These forward-looking statements inherently involve certain risks and uncertainties, although they are based on our current plans or assessments which are believed to be reasonable as of the date of this Form 10-K. Factors that may cause actual results, goals, targets or objectives to differ materially from those contemplated, projected, forecasted, estimated, anticipated, planned or budgeted in such forward-looking statements include, among others, the following possibilities: (1) failure to obtain new customers or retain significant existing customers; (2) the loss of one or more key executives and/or employees; (3) changes in industry trends, such as a decline in the demand for Enterprise Resource Planning and Enterprise Performance Management solutions, custom development and system integration services and/or declines in industry-wide information technology spending, whether on a temporary or permanent basis and/or delays by customers in initiating new projects or existing project milestones; (4) inability to execute upon growth objectives, including new services and growth in entities acquired by our Company; (5) adverse developments and volatility involving geopolitical or technology market conditions; (6) unanticipated events or the occurrence of fluctuations or variability in the matters identified under “Critical Accounting Policies”; (7) delays in, or the failure of, our sales pipeline being converted to billable work and recorded as revenue; (8) termination by clients of their contracts with us or inability or unwillingness of clients to pay for our services, which may impact our accounting assumptions; (9) inability to recruit and retain professionals with the high level of information technology skills and experience needed to provide our services; (10) failure to expand outsourcing services to generate additional revenue; (11) any changes in ownership of the Company or otherwise that would result in a limitation of the net operating loss carry forward under applicable tax laws; (12) the possibility that activist stockholders may wage proxy or consent contests or gain representation on or control of our Board of Directors, causing uncertainty about the direction of our business; and/or (13) the failure of the marketplace to embrace advisory and product-based consulting services. In evaluating these statements, you should specifically consider various factors described above as well as the risks outlined under “Item 1A. — Risk Factors .” These factors may cause our actual results to differ materially from those contemplated, projected, anticipated, planned or budgeted in any such forward-looking statements.
Although we believe that the expectations in the forward-looking statements are reasonable, we cannot guarantee future results, levels of activity, performance, growth, earnings per share or achievements. Neither we nor any other person assumes responsibility for the accuracy and completeness of such statements. Except as required by law, we do not intend to update any of the forward-looking statements after the date of this Form 10-K to conform such statements to actual results.
- 2 -
Table of Contents
Form 10-K
Annual Report
For the Year Ended December 31, 2015
TABLE OF CONTENTS
| Page | ||||||
| PART I | ||||||
| Item 1. |
4 | |||||
| 12 | ||||||
| Item 1A. |
15 | |||||
| Item 1B. |
20 | |||||
| Item 2. |
20 | |||||
| Item 3. |
20 | |||||
| Item 4. |
20 | |||||
| PART II | ||||||
| Item 5. |
21 | |||||
| Item 6. |
25 | |||||
| Item 7. |
Management’s Discussion and Analysis of Financial Condition and Results of Operations |
27 | ||||
| Item 7A. |
45 | |||||
| Item 8. |
46 | |||||
| Item 9. |
Changes in and Disagreements with Accountants on Accounting and Financial Disclosure |
85 | ||||
| Item 9A. |
85 | |||||
| Item 9B. |
86 | |||||
| PART III | ||||||
| Item 10. |
87 | |||||
| Item 11. |
87 | |||||
| Item 12. |
Security Ownership of Certain Beneficial Owners and Management and Related Stockholder Matters |
87 | ||||
| Item 13. |
Certain Relationships and Related Transactions, and Director Independence |
88 | ||||
| Item 14. |
88 | |||||
| PART IV | ||||||
| Item 15. |
89 | |||||
| OTHER ITEMS | ||||||
| 90 | ||||||
| 90 | ||||||
- 3 -
Table of Contents
In this Annual Report on Form 10-K, we use the terms “Edgewater Technology,” “Edgewater,” “our Company,” “the Company,” “we,” “our,” and “us” to refer to Edgewater Technology, Inc. and its wholly-owned subsidiaries. A listing of our wholly-owned subsidiaries is included as Exhibit 21.1 to this Annual Report on Form 10-K (“Form 10-K”).
| ITEM 1. | BUSINESS |
AVAILABLE INFORMATION: Background
Edgewater Technology, Inc. maintains executive offices located at 200 Harvard Mill Square, Suite 210, Wakefield, MA 01880-3209. Our telephone number is (781) 246-3343. Our stock is traded on the NASDAQ Global Market under the symbol “EDGW.” Our Internet address is www.edgewater.com. We make available, free of charge, on the Investor Relations section of our website, our Annual Reports on Form 10-K, Quarterly Reports on Form 10-Q, Current Reports on Form 8-K and all amendments to those reports as soon as reasonably practicable after such material is electronically filed with the Securities and Exchange Commission (the “SEC”). Copies are also available, without charge, from Edgewater Technology, Inc., Attn: Investor Relations, 200 Harvard Mill Square, Suite 210, Wakefield, MA 01880-3209 or by emailing ir@edgewater.com. Alternatively, reports filed with the SEC may be viewed or obtained at the SEC Public Reference Room at 100 F Street, NE, Washington, D.C. 20459, or the SEC’s Internet site at www.sec.gov. You may obtain information on the operation of the Public Reference Room by calling the SEC at 1-800-SEC-0330. We do not intend for information contained in our website to be part of this Annual Report on Form 10-K.
Overview
Edgewater Technology, Inc. helps the C-suite drive transformational change through its unique selection of business and technology services and channel-based solutions.
Classic consulting disciplines (such as business advisory, process improvement, organizational change management, M&A due diligence, and domain expertise) are blended with technical services (such as digital transformation, technical roadmaps, data and analytics services, custom development and system integration) to help organizations leverage investments in legacy IT assets to create new digital business models.
Delivering both on premise and in the cloud, Edgewater offers two major channel-based services. In the Oracle channel, Edgewater Ranzal provides Business Analytics solutions leveraging Oracle EPM, BI and Big Data technologies. In the Microsoft channel, Edgewater Fullscope delivers Dynamics AX ERP, Business Intelligence and CRM solutions primarily in the manufacturing space.
Our Services
Edgewater offers a full spectrum of services and expertise to ensure the success of our engagement. Our consulting services are consolidated into two major synergistic offerings: (1) Classic Consulting and (2) Product-Based Consulting.
- 4 -
Table of Contents
The following diagram illustrates these offerings:
Edgewater has the proven expertise to plan, deliver and manage integration services that improve performance and maximize business results. We focus on deploying new systems and unlocking the value of the existing corporate assets. This proven expertise enables us to bring complex technologies and systems together while minimizing risk, leveraging our clients’ technology investments and delivering tailored solutions.
Below are Edgewater’s service categories with sample services:
| ¡ | Classic consulting services |
| ¡ | Digital Transformation; |
| ¡ | CFO/CIO advisory services; |
| ¡ | Business improvement roadmaps; |
| ¡ | Organizational change management; |
| ¡ | Program/project management; |
| ¡ | Business process rejuvenation and integrated social media best practices; |
| ¡ | Specialized operational, due diligence and technology management expertise to mergers and acquisitions, private equity and venture capital; |
| ¡ | Strategic advice, costing, estimates to complete, failing or failed programs or project initiatives; |
| ¡ | Independent package selection and Request for Information or Proposal process design and implementation; |
| ¡ | Domain Expertise; |
| ¡ | Technical architecture, roadmaps and design; |
| ¡ | Strategic technology selections; |
| ¡ | Data Analytics and Reporting; |
| ¡ | Custom component design and implementation; |
| ¡ | Customer intelligence solutions using web/mobile analytics combined with social intelligence; |
| ¡ | Cloud architecture, integration and phasing solutions; |
| ¡ | On-going support services; and |
- 5 -
Table of Contents
| ¡ | Infrastructure optimization and redesign, disaster recovery and business continuity specialized design and assistance. |
| ¡ | Product-based consulting services |
| ¡ | Business transformation through the use of packaged software solutions; |
| ¡ | Enterprise Performance Management with Oracle budgeting, planning, consolidation and strategic finance both on premise and in the cloud; |
| ¡ | Big Data; |
| ¡ | Enterprise Resource Planning with Microsoft Dynamics AX targeted in process and discrete manufacturing verticals such as CPG, IEM, Chemical, Pharmaceuticals and Food and Beverage, both on premise and in the cloud; |
| ¡ | Customer relationship management with Microsoft Dynamics CRM both on premise and in the cloud; |
| ¡ | Industry specific platform and best practice solutions; |
| ¡ | Blended solutions; Microsoft CRM/XRM and specialized custom solutions; |
| ¡ | Business intelligence analytics; |
| ¡ | Design, development and introduction of IP that helps “verticalize” channel product stacks; and |
| ¡ | Support and training services. |
In addition to the above services, the Company also provides synergistic services in the area of data management and analytics. Examples of such services include the following:
| ¡ | Enterprise information management services |
| ¡ | Provide for data related matters: master data management, data governance, logical and physical data base design, data warehouse strategies and design; |
| ¡ | Provide practical data architectures and roadmaps to support transactional systems and enterprise performance management through advanced analytics; and |
| ¡ | Provide forms of data manipulation, transformation and quality services. |
| ¡ | Analytics services |
| ¡ | Advise on lead derivation of key financial and operational performance indicators and correlate their measurement, visualization and action for a given organization; |
| ¡ | Advise on opportunities for the use of predictive techniques, external data and benchmarks to improve business performance measurement and forecasting; |
| ¡ | Advise on the creation and adoption of analytics architectures, roadmaps and supporting organizations; and |
| ¡ | Advise, design and roadmap analytics-based near real-time to real-time alerting strategies and implementations. |
Our consultants are expected to travel and to be onsite with the customer to provide the highest level of service and support in all of these endeavors. We provide varying degrees of customer project assistance and will incorporate customer resources for technology transfer or cost optimization purposes. Independent teams and proper project process and delineation provide conflict-free transition points among all key service offerings as well as independent entry points. Leads for all offerings are internally driven with assistance from the respective vendors for software product solutions.
Customers
Our strategic acquisitions have helped enhance our service and product offerings, increase and diversify our customer base and reduce our reliance on individually significant customers. Service revenue from our five largest customers, as a percentage of total service revenue, was 11.8%, 17.8% and 16.5% for the years ended December 31, 2015, 2014 and 2013, respectively. No single customer represented 10% or more of total revenue
- 6 -
Table of Contents
during the years ended December 31, 2015, 2014 or 2013. See “Item 1A. — Risk Factors — Our results can be subject to variability as work is completed for a limited number of significant customers, and our results of operations and financial condition could be negatively affected by the loss of a major customer or significant project or the failure to collect a large account receivable.” During 2015, we recorded service revenue from 667 customers, of which 139 were new customers, as compared to recording service revenue from 403 customers in 2014, of which 83 were new customers. We recorded service revenue from 387 customers in 2013, of which 92 were new customers. Total customers served and new customers added during 2015 benefited from the acquisitions of substantially all of the assets of Zero2Ten, Inc. (“Zero2Ten”), Branchbird LLC (“Branchbird”) and M2 Dynamics Inc. (“M2 Dynamics”). Specifically, the higher volume and lower cost revenue model of Zero2Ten was a driving force behind the yearly increase in these metrics.
Industry Dynamics and Opportunity
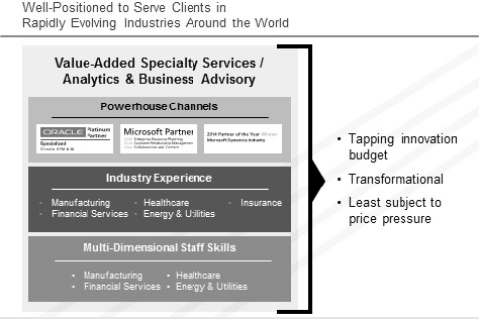
Industry Dynamics. In today’s rapidly shifting macro business environment, businesses are demanding that financial and operational strategies be implemented in the most efficient and complete manner possible. The classic providers, such as the large management consulting firms, large accounting firms and multinational integrators, tend to provide solution services exclusively on large complex platforms, encompassing many players of mixed experience levels and in a myriad of locations. Edgewater’s services are focused and quickly deployed onsite in a specialized solution package, more appropriate to today’s need for faster innovation rollout, pushed deeper into subsidiaries of multinational corporations as well as middle market growth companies.
Expenditures in the information technology market have become a critical success factor in every company’s successful growth. As such, IT expenditures are receiving the scrutiny of the “C-level” officers, when specifically focused on transformational change. Our C-level buyers are looking to purchase rapidly deployable, risk-managed, product-based technology solutions. These solutions maintain the ability for a company to differentiate itself from its competitors with proprietary business process, combined with the leverage of product customization. Edgewater assists clients with these solutions primarily in the Oracle Corporation (“Oracle”) and Microsoft Corporation (“Microsoft”) product channels, while providing the opportunity for a customer to customize its solutions through the utilization of its custom technology consulting services.
In addition, there are three drivers of incremental change for early adopters: big data and analytics, digital transformation, and large scale cloud adoption. The first driver provides deeper data sources, as well as external reference data to expand and improve enterprise analytics. Digital transformation offers platform agnostic near real-time input for transactions and corporate command and control, breaking the paper-based paradigm which has driven automation to date. The third driver, large scale cloud adoption, increases the penetration of the cloud-based delivery model into larger companies and typically on premise classical systems. These incremental change drivers are catalysts for opportunity in our product channels as well as for our classical consulting resources. Edgewater plans to aggressively exploit these opportunities via organic initiatives as well as strategic alternatives.
Companies typically turn to consulting firms, like Edgewater, to fill these internal project gaps for a number of reasons:
| ¡ | For deep industry, product, data and technical expertise; |
| ¡ | To obtain strategic consulting services in an accelerated timeframe; |
| ¡ | To mitigate their business risk with focused onsite project teams; |
| ¡ | To receive an outside objective perspective; |
| ¡ | To obtain EPM- and EIM-related services; |
| ¡ | To obtain product, services and IP related to ERP and CRM; |
| ¡ | To provide cloud architecture and on-ramping services; and/or |
| ¡ | To serve as an agent to plan, manage and implement change. |
- 7 -
Table of Contents
Industry Opportunity. Technology has become such an integral part of business that it requires skilled strategic management in its own right. Technology has become a key enabler to business change when the appropriate strategic steps, a meld of business process change and technology, are well laid out and thoughtfully executed. Strategic consulting firms deliver innovative thinking and in-depth vertical industry expertise, along with the ability to implement business process transformation through the judicious use of appropriate technologies. We have steadily enhanced our offerings to address the evolving need for strategic advisory and product-based consulting services and plan to continue to grow our competencies in these areas. Our goal is to provide a comprehensive continuum of focused business services, encompassing all facets of business, through the enablement of technology.
Competitive Strengths
Edgewater offers strategic consulting services designed to assist its clients in improving financial and operational performance across their enterprises. We develop business strategies and technology solutions that address their specific needs while providing them with increased competitive advantage. We believe that five core values differentiate us from our competition.
These values include the following:
| (1) | Delivery Excellence — Our history is built upon more than 20 years of proven methodology and well-defined process, in addition to continuous delivery of business and technology solutions that work. Our delivery excellence is a derivative of a well-defined business plan, highly-skilled consultants, strong technical expertise and established implementation and support methodologies. Most importantly, we use an iterative business and technology approach, with an emphasis on quality assurance and project management, to achieve rapid and successful deployment of our solutions. Our delivery history has contributed to our ability to build long-term customer relationships. |
| (2) | Vertical Expertise — We combine vertical industry knowledge with a broad base of key strategic technologies to serve our customers’ needs and deliver tailored and innovative strategies and solutions. We have developed core competencies in primary vertical markets such as: CPG/Manufacturing; Discrete and Process Manufacturing; Energy/Utilities; Healthcare; Hospitality; Insurance; Oil and Gas; Retail; Travel/Entertainment; and various Emerging Markets. |
| (3) | Technology Excellence — We deliver our services by blending proven strategic technologies and business practices to build scalable solutions providing a solid return on investment. Our team of professionals has the business and technology expertise to offer comprehensive strategies and solutions. Our areas of expertise include: |
| • | Classic consulting services; |
| • | EPM solutions in planning; |
| • | EPM budgeting; |
| • | EPM consolidation and strategic finance; |
| • | Microsoft Dynamics solutions in the area of CRM and ERP; |
| • | Data analytics; |
| • | Web analytics; |
| • | Big data; |
| • | Advanced data and infrastructure services; and |
| • | Specialized custom IT services. |
| (4) | Client Focus — Edgewater is positioned to provide its customers with onsite services. Edgewater’s client-centric model is well positioned to serve the needs of the Global 2000 for tight, highly-trained, product specialist project teams, as well as the upper middle market whose needs tend to span the full spectrum of our business/IT service offerings. |
- 8 -
Table of Contents
| (5) | Adherence to Operational Metrics — Since our inception in 1992, Edgewater’s original management team has built an organization that is defined by a record of operational excellence, tracking key performance indicators and well-defined operating metrics to manage our consulting resources, utilization and gross margin. |
Business Strategy
Our business strategy is to position our Company as one of the leading providers of transformational classic and product-based consulting services. We believe we can attain this strategic objective by delivering a range of blended solutions through a combination of industry specific classic consulting, advanced product–based software consulting and custom technology consulting services. Clients desire the personal attention provided by onsite industry, financial and strategic expertise buttressed with the ability to speed idea implementation with cost-effective advanced software package solutions. Our ability to begin our services dialogue at the strategy level in business vernacular all the way through specific software product request for proposal response provides a spectrum of sales opportunities with varying degrees of channel control and cost. This spectrum of engagement entry opportunities allows us to serve the upper middle market through the Global 2000 with an appropriate set of services.
The spectrum begins with pure consulting and ends with pure information technology. Smaller organizations such as middle-market companies, subsidiaries of Global 2000, private equity firms and venture capital firms will tend to start at the advisory and classic consulting level, while the Global 2000 tend to initially engage with product-based consulting services.
Additionally, we are able to strengthen our service offerings by focusing upon the development of intellectual property, not only in the area of patents and trademarks, as described below under “— Intellectual Property,” but with respect to the internal development of software. We are able to quickly execute on the internal development of intellectual property given the significant knowledge and expertise we maintain in our product-based consulting channels. We can leverage this intellectual property as a means to accelerate delivery of a solution and as a means to solidify and/or expand our presence in a vertical market.
Marketing, Sales and Strategic Alliances
Marketing. The primary goal of our marketing efforts is to generate sales opportunities by increasing our brand awareness, value proposition and overall domain expertise. Our marketing efforts continue to be closely aligned with our go-to-market strategy, while introducing specific offerings that address business and IT problems faced by our clients. We leverage the core competencies we have developed in delivering our services in key industries and horizontal offerings to increase the efficiency of our marketing efforts. Our marketing function utilizes comprehensive internet marketing strategies that involve integrated activities including, but not limited to: webinars, highly-targeted email campaigns distributed to prospect and client lists developed with specific demographics and attributes and social media outlets to promote our capabilities and services (e.g., both company-driven and domain-specific blogs, social networking and video sharing websites). By leveraging closely coupled internet marketing strategies to promote our services, we are able to reach a wider audience and communicate in a medium that has become more widely accepted and brings in quicker results from a sales and marketing perspective. We also gather key statistics from our websites, blogs, email campaigns and other social media outlets to test, measure and trace our marketing initiatives. This enables us to ensure we are reaching the right target audience with concise and compelling offerings to promote our capabilities. We also author white papers and contribute to articles in trade publications, attend events and participate in targeted industry conferences and tradeshows.
Our marketing department has embarked on an enterprise-wide initiative to bring recent acquisitions under a single master brand concept. Since some of our new offerings are not purely technology oriented, we are in the process of establishing our master brand as “Edgewater,” thus dropping the word “Technology” from our corporate identity.
- 9 -
Table of Contents
Sales. Our sales approach is to combine traditional sales with our strength in industries and technology. Our traditional sales function is composed of direct sales professionals and inside sales professionals. Both work closely with our practice directors to identify potential opportunities within each account. Using a consultative selling methodology, we identify target prospects and develop a pursuit plan for each key account. When contact with a target is established, we utilize a blended sales model to demonstrate our expertise, combining consultative selling with traditional sales methods. Once the customer has engaged us, our sales professionals maintain their relationships with the customer by working collaboratively with the consulting professionals who are assigned to the customer.
Strategic Alliances. As part of our sales and marketing effort, we have established working relationships with a number of companies, including: Informatica Corporation, Keyteach, Microsoft, Oracle, FAST, Cloudera, Hortonworks, SiteCore, Accelatis, and Webtrends. These alliances generally entail sharing sales leads, joint marketing efforts, making joint customer presentations, negotiating discounts on license fees or other charges and conducting similar activities. Our arrangements with many of these companies are informal and are not subject to definitive written agreements. For those companies with whom we do have definitive written agreements, those agreements are either terminable at will by either party or are for terms of one year or less. We believe we have been successful in establishing alliances with a strong group of companies who are either industry leaders or well-regarded new entrants.
Professional Recruitment, Retention and Development
Our success depends in part upon our ability to recruit and retain business and technology professionals with the high level of skills and experience needed to provide our specialty services. We believe that the combination of professional support, intellectual challenge, corporate culture and compensation we offer will continue to be attractive to these highly-skilled professionals. Our working environment also fosters collaboration, creativity and innovation. We believe that our employees are one of our most valuable assets.
Employees. As of December 31, 2015, Edgewater had 501 employees (excluding contractors). Of these employees, 394 were billable consultants and 107 were management and administrative personnel (composed of sales, marketing, human resources, finance, accounting, internal information systems and administrative support) and product development personnel. The average tenure of our employees is approximately 6 years and the average “years of experience” is approximately 23 years. Our employees are not represented by a collective bargaining agreement. We believe that our employee relations are strong.
Culture. We believe that our business culture is critically important in hiring and retaining qualified professionals. Our ability to provide effective multidisciplinary teams is dependent upon our ability to develop and sustain a business culture that is common across all disciplines and vertical practices throughout our Company. Our employees are talented and energetic professionals who come from a multitude of professional backgrounds. We believe that this creates an exciting, diverse and creative work environment for our employees.
Compensation. We have competitive compensation programs that have been structured to attract and retain highly-skilled professionals. Edgewater’s compensation programs include competitive base salaries, coupled with cash bonus and equity-based incentive opportunities. Compensation plans may be tied to the achievement of the Company’s financial performance or tied to individual and team performance goals.
Recruiting. We believe that our long-term success will depend upon our ability to attract, retain and motivate highly-skilled employees. Our recruitment department has traditionally conducted its own direct recruiting efforts and coordinated informal and search firm referrals. We believe that our business model, which results in an intellectually stimulating work environment, provides increased opportunities for professional development and a dynamic corporate culture, which enhances our ability to attract and retain top professionals.
Professional Development. We believe that providing our professionals with a wide variety of challenging projects, the opportunity to demonstrate ability and achieve professional advancement are keys to their retention.
- 10 -
Table of Contents
We work with our professionals to assist them with their professional development by offering internal and external learning opportunities. We encourage them to attain industry certifications which strengthen their expertise in both business and technology. We also believe that the working relationships they form on various project teams foster valuable formal and informal mentoring and knowledge sharing.
Competition
We operate in a competitive and rapidly changing market. We also compete with a variety of organizations that offer services similar to those we provide. Our clients often retain us on a non-exclusive, project-by-project basis. We compete with a number of different types of businesses, including:
Traditional management and strategy consulting firms that focus on advising “C”-level executives on organization and corporate strategy. Many of the traditional strategic consulting firms have added services in information technology.
Systems integration and IT consulting firms that design and implement technology solutions, including software installation, for departments and enterprises. These firms have grown in size and scope of services, including the provision of offshore software development services.
Information technology product and service vendors that offer technical consulting to support their own products. Many of these firms have also developed various alliances with systems integration and IT consulting firms to augment their own capabilities.
There is significant competition in the management and IT consulting services space. Mergers or consolidations in our market may create new, larger or better-capitalized competitors with enhanced abilities to attract and retain professionals. The following is a representative list of competitors in the IT and management consulting services space:
| ¡ | Technical Consulting/Systems integrators: Accenture, EDS, Ciber, Inc., IBM Global Services, Business and Decision Group, Caritor, Inc., CGI, and Perficient; |
| ¡ | Offshore software development firms: Aztec Software, Cognizant Technology Solutions, Infosys, Ventyx, Mahindra Satyam, Tata and Wipro; |
| ¡ | Management/Business Consulting firms: Bain & Company, Booz-Allen & Hamilton, Boston Consulting Group and McKinsey & Company; |
| ¡ | Enterprise Resource Planning firms: SAP, Oracle, Hitachi, Tribridge and Avanade; |
| ¡ | Enterprise Performance Management / Business Activity Monitoring / Business Intelligence providers: Deloitte & Touche, Huron, The Hackett Group, Hitachi Consulting Corporation, KPI Partners, KPMG, PricewaterhouseCoopers and Ernst & Young; and |
| ¡ | Computer hardware, software and service vendors: Hewlett-Packard, IBM, Oracle, Microsoft and SAP. |
We believe that the principal criteria considered by prospective clients when selecting a consulting firm include skills and capabilities of consultants, scope of services, project methodology and approach, technical and industry expertise, reputation and quality of past work, perceived value and a commitment to delivering a solution that works as intended. Due to our ongoing dedication and attention to all of the above characteristics, we believe that we are well positioned against our competitors in our marketplace.
Intellectual Property
We consider our intellectual property to be a valuable asset in a highly competitive industry. We also consider our intellectual property to be an important factor in building brand recognition for quality service and performance. Therefore, we have secured certain service marks for “Edgewater,” “Edgewater Consulting,”
- 11 -
Table of Contents
“Edgewater Technology,” “Edgewater Strategy Services,” “Edgewater Technology-Ranzal,” “Edgewater Ranzal” and “Edgewater Fullscope,” among others. We believe we have secured all rights to trademarks and trade names related to our business.
We rely on a combination of trade secret, copyright and trademark laws to protect our proprietary rights. In particular, we require each of our employees to sign an invention and non-disclosure agreement, which provides that they must maintain the confidentiality of our intellectual property and that any intellectual property that they develop while employed by us is the property of Edgewater. We have developed detailed tools, processes and methodologies which are used in developing software code, scripts, libraries, data models, applications, business processes, frameworks and other technology used within our Company and in customer engagements. See also “Item 1A. — Risk Factors” included elsewhere in this Form 10-K.
Potential Future Strategies, Transactions and Changes
Critical to our ability to create long-term stockholder value, the Company will continue to pursue internal growth initiatives and appropriate business combination transaction alternatives to achieve growth in revenues and profitability. From time to time, we have engaged and we may continue to engage in discussions with various persons regarding potential business combination transactions.
We believe that our current cash balances and our anticipated cash flow from our operations taken together will be adequate for our working capital needs for at least the next twelve months. However, our actual experience may differ significantly from our expectation, particularly if we pursue growth through business combination transactions. In addition, other future events may adversely or materially affect our business, expenses or prospects and could affect our available cash or the availability or cost of external financial resources.
We may, in the future, purchase common stock in the open market, in private transactions or otherwise, pursuant to board approved repurchase programs. See “Item 5. — Market for Registrant’s Common Equity, Related Stockholder Matters and Issuer Purchases of Equity Securities” included elsewhere in this Form 10-K. Any future purchases by us will depend on many factors, including, but not limited to, the market price of our common stock, our business strategy, our business and financial position and general economic and market conditions.
Directors and Executive Officers of the Registrant
| Name |
Age | Position with the Company | ||||
| Shirley Singleton |
64 | Chairman of the Board, President and Chief Executive Officer | ||||
| David Clancey |
60 | Executive Vice President, Chief Strategy Officer and Chief Technology Officer | ||||
| Timothy R. Oakes |
48 | Chief Financial Officer, Chief Accounting Officer, Treasurer and Corporate Secretary | ||||
| Robin Ranzal-Knowles |
48 | President, Edgewater Technology-Ranzal, Inc. | ||||
| Kristin Zaepfel |
52 | Vice President, Human Resources | ||||
| Paul Flynn |
66 | Independent Director | ||||
| Paul Guzzi |
73 | Independent Director | ||||
| Nancy Leaming |
69 | Independent Director | ||||
| Michael Loeb |
60 | Independent Director | ||||
| Wayne Wilson |
67 | Lead Independent Director | ||||
Ms. Singleton currently serves as our Chairman, a position she was elected to in July 2005. Ms. Singleton co-founded Edgewater Technology (Delaware), Inc. (“Edgewater Delaware”) in 1992 and served as President of
- 12 -
Table of Contents
Edgewater Delaware from 1992 until January 2002. Ms. Singleton has served as President and Chief Executive Officer of our Company (the parent company of Edgewater Delaware) from January 2002 to the present. Prior to co-founding Edgewater Delaware, Ms. Singleton held various management positions from 1982 to 1992 at Logica North America and attained the position of Vice President and General Manager of the Northeast region. Ms. Singleton serves on the Technical Oversight Committee for Partners Healthcare, the Board of Trustees for the North Shore Medical Center and the board of The Commonwealth Institute. Ms. Singleton has served as a Director of our Company since June 2001.
Mr. Clancey has served as Executive Vice President, Chief Strategy Officer and Chief Technology Officer of our Company since June 2006. Before assuming his current title, Mr. Clancey served as our Executive Vice President — Chief Technology Officer from 2001 to 2006 and as Edgewater Delaware’s Senior Vice President —Chief Technology Officer from 1992 until 2001. Mr. Clancey co-founded Edgewater Delaware in 1992 with Ms. Singleton. Prior to co-founding Edgewater Delaware, Mr. Clancey was a Systems Architect and Chief Technology Officer at Logica North America.
Mr. Oakes has served as Chief Financial Officer, Treasurer and Corporate Secretary of our Company since September 2009 and Chief Accounting Officer of our Company since July 2008. Mr. Oakes joined our Company as a Director of Finance in August 2004. Prior to joining Edgewater, Mr. Oakes was a Senior Director of Finance at Symmetricom, Inc. from September 2001 to August 2004. Prior to Symmetricom, Mr. Oakes held various financial management and operational reporting positions with companies in the biotechnology, manufacturing and consulting services industries.
Ms. Ranzal-Knowles has served as President of Edgewater Technology-Ranzal, Inc., a subsidiary of the Company (“Ranzal”), since October 2004. Prior to joining Edgewater, Ms. Ranzal-Knowles was the founder, owner and President of Ranzal and Associates, Inc., from March 1996 to October 2004.
Ms. Zaepfel has served as Vice President of Human Resources of our Company since September 2003. Prior to joining our Company, Ms. Zaepfel served as Senior Vice President of Human Resources for Xchange, Inc. from 1998 to 2003. Ms. Zaepfel has also held various Human Resources positions at such organizations as HPR, Inc., Mellon Bank Corporation and The Boston Company.
Mr. Flynn currently serves as Executive Vice President and Commercial Loan Officer at People’s United Bank, a position he has held since June 30, 2011. From 2007 to June 2011, Mr. Flynn was an Executive Vice President and Commercial Loan Officer at Danversbank. From 2000 to 2007, Mr. Flynn was an Executive Vice President of RBS Business Capital, a division of Citizens Financial Group. From 1986 to 2000, Mr. Flynn was an Executive Vice President for the United States Trust Company. Prior to his time at the United States Trust Company, Mr. Flynn was a Senior Vice President for Patriot Bank, N.A. from 1981 to 1986. From 1977 to 1981, Mr. Flynn was an Assistant Vice President at Chase Commercial Corporation and from 1974 to 1977 Mr. Flynn was an Audit Manager with New England Merchants Bank. Mr. Flynn serves as a Director of the Business Development Corporation of New England. Mr. Flynn was elected as a Director of our Company in July 2005.
Mr. Guzzi served as the President and Chief Executive Officer of the Greater Boston Chamber of Commerce from 1996 to 2015. From 1995 to 1996, Mr. Guzzi was Vice President of State and Community Affairs for Boston College. Prior to his position at Boston College, Mr. Guzzi was a consultant for Heidrick & Struggles, an international recruitment firm from 1994 to 1995. From 1991 to 1993, Mr. Guzzi served as a Vice President at Data General Corporation. Prior to his position at Data General Corporation, Mr. Guzzi was a Senior Vice President at Wang Laboratories from 1981 to 1991. Mr. Guzzi was a State Representative in the Massachusetts Legislature from 1971 to 1974 and the Massachusetts Secretary of State from 1975 to 1978. Mr. Guzzi serves as a Trustee of the Citi Center for the Performing Arts and the Vice Chairman of Blue Cross Blue Shield of Massachusetts. Mr. Guzzi is also a Board member of the Partners HealthCare Corporation and serves as an Advisory Board member for The Boston Club. Mr. Guzzi has served as a Director of our Company since April 2004.
- 13 -
Table of Contents
Ms. Leaming has been an independent consultant since 2005. From June 2003 to June 2005, Ms. Leaming was the Chief Executive Officer and President of Tufts Health Plan, a provider of healthcare insurance. Prior to that, Ms. Leaming served as Tufts Health Plan’s President and Chief Operating Officer from 1998 to 2003, the Chief Operating Officer from 1995 to 1998 and the Chief Operating Officer/Chief Financial Officer from 1986 to 1995. Prior to joining Tufts Health Plan, Ms. Leaming held a variety of management positions in managed care and banking, including Chief Financial Officer of Matthew Thornton Health Plan. Ms. Leaming currently serves as a director of Biogen Idec and Hologic, Inc. Ms. Leaming joined our Board in December 2005.
Mr. Loeb has been the President and CEO of Loeb Enterprises, a New York-based business development lab, since 2005. Mr. Loeb was the President and Chief Executive Officer of the Synapse Group, Inc., a wholly-owned subsidiary of Time Warner, from 1997 to December 2005. Prior to co-founding the Synapse Group, Inc. and becoming its President in 1991, Mr. Loeb had an eight-year career at Time Warner, where he held a number of positions including Consumer Marketing Director for Sports Illustrated and Vice President of Consumer Marketing of Entertainment Weekly. At Time Warner, he also helped introduce SI for Kids. Mr. Loeb was also responsible for starting the direct response division of Deutsch Agency immediately prior to co-founding the Synapse Group, Inc. Mr. Loeb has served as a Director of our Company since April 2000.
Mr. Wilson currently serves as our Lead Independent Director, a position he was elected to in September 2005. Mr. Wilson has been an independent business advisor since 2002. From 1995 to 2002, Mr. Wilson served in various roles, including President, Chief Operating Officer and Chief Financial Officer at PC Connection, Inc., a Fortune 1000 direct marketer of information technology products and services. From 1986 until 1995, he was a partner in the assurance and advisory services practice of Deloitte & Touche LLP. Mr. Wilson also serves as a director of ARIAD Pharmaceuticals, Inc. and FairPoint Communications, Inc. He previously served as a director of Cytyc Corporation and Hologic, Inc. Mr. Wilson has served as a Director of our Company since May 2003.
- 14 -
Table of Contents
| ITEM 1A. | RISK FACTORS |
In addition to other information contained in this Form 10-K, the following risk factors should be carefully considered in evaluating Edgewater and its business because such factors could have a significant impact on our business, operating results and financial condition. These risk factors could cause actual results to materially differ from those projected in any forward-looking statements.
Our business could be adversely affected by a significant or prolonged economic downturn. Our results of operations are affected by the level of business activity of our customers, which in turn is affected by the level of economic activity in the industries and markets that they serve. A decline in the level of business activity of our customers has had and could continue to have a material adverse effect on our revenue and profit margin. Future economic conditions could cause some customers to reduce or defer their expenditures for consulting services. We have implemented and will continue to implement cost-savings initiatives to manage our expenses as a percentage of revenue. However, current and future cost-management initiatives may not be sufficient to avoid reductions in our margins if the economic environment should weaken for a prolonged period.
Our lack of long-term customer contracts reduces the predictability of our revenues because our current contracts may be canceled on short notice and without penalty. Our customers generally retain us on a project-by-project basis, rather than under long-term contracts. As a result, a customer may not engage us for further services once a project is complete. If a significant customer or a number of customers terminate, significantly reduce, or modify their contracts with us, our results of operations would be materially and adversely affected. Consequently, future revenue should not be predicted or anticipated based on the number of customers we have or the number and size of our existing projects. If a customer were to postpone, modify or cancel a project, we would be required to shift our consultants to other projects to minimize the impact on our operating results. We cannot provide assurance that we will be successful in efficiently and effectively shifting our consultants to new projects in the event of project terminations, which could result in reduced service revenue and lower gross margins. If we experience unexpected changes or variability in our revenue, we could experience variations in our quarterly operating results and our actual results may differ materially from the amounts planned and our operating profitability may be reduced or eliminated.
We have significant fixed operating costs, which may be difficult to adjust in response to unanticipated fluctuations in revenue. A high percentage of our operating expenses, particularly salary expense, rent, depreciation expense and amortization of intangible assets, is fixed in advance of any particular quarter. As a result, an unanticipated decrease in the number or average size of, or unanticipated delay in the scheduling for, our projects may cause significant variations in operating results in any particular quarter and could have a material adverse effect on operations for that quarter. An unanticipated termination or decrease in size or scope of a significant project, a customer’s decision not to proceed with a project we anticipated or the completion during the quarter of several significant customer projects could require us to maintain underutilized employees and could have a material adverse effect on our business, financial condition and results of operations.
If we fail to satisfy our customers’ expectations, our existing and continuing business could be adversely affected. Our sales and marketing strategy emphasizes our belief that we have highly referenceable accounts. Therefore, if we fail to satisfy the expectations of our customers, we could damage our reputation and our ability to retain existing customers and attract new customers. In addition, if we fail to deliver and perform on our engagements, we could be liable to our customers for breach of contract. Although most of our contracts limit the amount of any damages to the fees we receive, we could still incur substantial cost, negative publicity and diversion of management resources to defend a claim, and as a result, our business results could suffer.
We may have lower margins, or lose money, on fixed-price contracts. In 2015, 2014 and 2013, fixed-price contracts represented approximately 13.0%, 5.7% and 5.2%, respectively, of our total service revenue. We assume greater financial risk on fixed-price contracts than on time-and-materials or retainer-based engagements, and we cannot assure you that we will be able to successfully price our larger fixed-price contracts. If we fail to
- 15 -
Table of Contents
accurately estimate the resources and time required for an engagement, fail to manage customer expectations effectively or fail to complete fixed-price engagements within planned budgets, on time and to our customers’ satisfaction, we could be exposed to cost overruns, potentially leading to lower gross profit margins or even losses on these engagements.
Competition in the IT and management consulting services market is intense and, therefore, we may lose projects to, or face pricing pressure from, our competitors or prospective customers’ internal IT departments or international outsourcing firms. The market for IT and management consulting providers is highly competitive. In many cases, we compete for specialty IT services work with in-house technical staff, software product companies with extended service organizations and other international IT and management consulting firms, including offshore outsourcing firms. In addition, there are many small, boutique technology management consulting firms who have developed services similar to those offered by us. We believe that competition will continue to be strong and may increase in the future, especially if our competitors continue to reduce their price for IT and management consulting services. Such pricing pressure could have a material impact on our revenues and margins and limit our ability to provide competitive services.
Our target market is rapidly evolving and is subject to continuous technological change. As a result, our competitors may be better positioned to address these developments or may react more favorably to these changes, which could have a material adverse effect on our business. We compete on the basis of a number of factors, many of which are beyond our control. Existing or future competitors may develop or offer IT and management consulting services that provide significant technological, creative, performance, price or other advantages over the services we offer.
Some of our competitors have longer operating histories and significantly greater financial, technical, marketing and managerial resources than we do. There are relatively low barriers of entry into our business. We currently have no patented or other proprietary technology that would preclude or inhibit competitors from entering the IT services market. Therefore, we must rely on the skill of our personnel and the quality of our customer service. The costs to start an IT and management consulting services firm are low. We expect that we will continue to face additional competition from new entrants into the market in the future, offshore providers and larger integrators and we are subject to the risk that our employees may leave us and may start competing businesses. Any one or more of these factors could have a material impact on our business.
Our results can be subject to variability as work is completed for a limited number of significant customers, and our results of operations and financial condition could be negatively affected by the loss of a major customer or significant project or the failure to collect a large account receivable. We have in the past derived, and may in the future derive, a significant portion of our service revenue from a limited number of customers. From year-to-year, revenue from one or more of our customers may exceed 10% of our total service revenue. The loss of a major customer or large project could materially and adversely affect our results of operations. In 2015 and 2014, our top five customers represented 11.8% and 17.8% of our 2015 and 2014 service revenues, respectively. The future receipt of significant commitments from new or existing customers could create future risks such as those described above concerning customer concentration.
We perform varying amounts of work for specific customers from year-to-year. A major customer in one year may not use our services in another year. In addition, we may derive revenue from a major customer that constitutes a large portion of a particular quarter’s total revenue. If we lose any major customers or any of our customers cancel or significantly reduce a large project’s scope, our results of operations and financial condition could be materially and adversely affected. Further, if we fail to collect a large accounts receivable balance, we could be subjected to a material adverse impact on financial results and a decrease in cash flow.
Our business could be adversely affected by local political, social, legal, tax, regulatory or environmental requirements. The local business risks in different cities, states and countries in which we or our current or potential customers operate could have a material impact on our financial condition, results of operations and
- 16 -
Table of Contents
growth prospects. We sell our classic consulting and product-based consulting services in different cities, states and countries and may increasingly become exposed to changing political, social, legal, tax, regulatory and environmental requirements at the local, national or international level. Also, new policies or measures by governments, whether fiscal, tax, regulatory, environmental or other competitive changes, may lead to an increase in additional or unplanned expenditures, discourage our customers or potential customers from purchasing our services and ultimately adversely affect our financial condition, results of operations and growth prospects.
If customers view offshore development as a viable alternative to our service offerings, our pricing, revenue, margins and profitability may be negatively affected. In recent years, international IT service firms have been founded in countries such as India and China, which have well-educated and technically-trained workforces available at wage rates that are substantially lower than U.S. wage rates. While traditionally we have not competed with offshore development, the offshore model has matured and offers an alternative choice when companies evaluate their IT consulting needs. To counteract the alternative of going offshore for IT consulting services, we are focusing on advisory and product-based service offerings, including design and strategy consulting engagements, which are more difficult for offshore development firms to replicate. If we are unable to continually evolve our service offerings or the rate of acceptance of offshore development advances beyond current levels, then our pricing and revenue could be adversely affected.
Because we rely on highly-trained and experienced personnel to design and build complex systems for our customers, an inability to retain existing employees and attract new qualified employees would impair our ability to provide our services to existing and new customers. Our future success depends in large part on our ability to attract new qualified employees and retain existing highly-trained and experienced technical consultants, project management consultants, business analysts and sales and marketing professionals of various experience levels. If we fail to attract new employees or retain our existing employees, we may be unable to complete existing projects or bid for new projects of similar size, which could adversely affect our revenues. While attracting and retaining experienced employees is critical to our business and growth strategy, maintaining our current employee base may also be particularly difficult. Even if we are able to grow and expand our employee base, the additional resources required to attract new employees and retain existing employees may adversely affect our operating margins.
We depend on our key personnel, and the loss of their services may adversely affect our business. We believe that our success depends on the continued employment of the senior management team and other key personnel. This dependence is particularly important to our business because personal relationships are a critical element in obtaining and maintaining customer engagements. If one or more members of the senior management team or other key personnel were unable or unwilling to continue in their present positions, our business could be seriously harmed. Furthermore, other companies seeking to develop in-house business capabilities may hire away some of our key personnel.
Our business could be adversely affected by material changes to our strategic relationship with Oracle America, Inc. Our EPM-related service offering derives a substantial portion of its revenues from a channel relationship with Oracle. This relationship involves Oracle assisted lead generation support with respect to the business intelligence services provided in connection with our EPM-related service offerings. This relationship is governed by an Oracle Partner Network Agreement, which is subject to annual renewal. A failure to renew this relationship, or a material modification or change in Oracle’s partner approach or its contract terms, for any reason, could have a material adverse impact on our results of operations.
Our business could be adversely affected by material changes to our strategic relationship with Microsoft Corporation. Our ERP- and CRM-related product and service offerings derive a substantial portion of revenues from a channel relationship with Microsoft. This relationship involves Microsoft-assisted lead generation support with respect to the services provided by Fullscope. This relationship is governed by a Microsoft Partner Agreement, which is subject to annual renewal. A failure to renew this relationship, or a material modification or
- 17 -
Table of Contents
change in Microsoft’s partner approach or its contract terms, for any reason, could have a material adverse impact on our results of operations.
Past or future business combination transactions or other strategic alternatives could disrupt our ongoing business, distract our management and employees, increase our expenses and adversely affect our business. We have, in the past, realized growth, in part, through acquisitions, and we anticipate that a portion of our future growth may be accomplished through one or more business combination transactions or other strategic alternatives. The ultimate success of any such transactions will depend upon, among other things, our ability to integrate acquired personnel, operations, products and technologies into our organization effectively, to retain and motivate key personnel of acquired businesses and to retain customers of acquired businesses. We cannot assure you that we will be successful in this regard or that we will be able to identify suitable opportunities, successfully grow acquired businesses, integrate acquired personnel and operations successfully or utilize our cash or equity securities as acquisition currency on acceptable terms to complete any such business combination transactions. These difficulties could disrupt our ongoing business, distract our management and employees, increase our expenses and materially and adversely affect our results of operations. Any such transactions would involve certain other risks, including the reduction of cash and/or working capital, the assumption of additional liabilities, potentially dilutive issuances of equity securities and diversion of management’s attention from operating activities.
We may not be able to protect our intellectual property rights or we may infringe upon the intellectual property rights of others, which could adversely affect our business. Our future success will depend, in part, upon our intellectual property rights and our ability to protect these rights. We do not have any patents or patent applications pending. Existing trade secret and copyright laws afford us only limited protection. Third parties may attempt to disclose, obtain or use our solutions or technologies. This is particularly true in foreign countries where laws or law enforcement practices may not protect our proprietary rights as fully as in the United States. Others may independently develop and obtain patents or copyrights for technologies that are similar or superior to our technologies. If that happens, we may need to license these technologies and we may not be able to obtain licenses on reasonable terms, if at all. If we are unsuccessful in any future intellectual property litigation, we may be forced to do one or more of the following:
| ¡ | Cease selling or using technology or services that incorporate the challenged intellectual property; |
| ¡ | Obtain a license, which may not be available on reasonable terms or at all, to use the relevant technology; |
| ¡ | Configure services to avoid infringement; and |
| ¡ | Refund license fees or other payments that we have previously received. |
Generally, we develop software applications for specific customer engagements. Issues relating to ownership of and rights to use software applications and frameworks can be complicated. Also, we may have to pay economic damages in these disputes, which could adversely affect our results of operations and financial condition.
Fluctuations in our quarterly revenues and operating results may lead to increased volatility of our stock. Our quarterly revenues and operating results can sometimes be volatile. We believe comparisons of prior period operating results cannot be relied upon as indicators of future performance. If our revenues or our operating results in any future period fall below the expectations of securities analysts and investors, the market price of our securities would likely decline.
Factors that may cause our quarterly results to fluctuate in the future include the following:
| ¡ | Variability in market demand for IT and management consulting services; |
| ¡ | General economic or stock market conditions unrelated to our operating performance; |
| ¡ | Length of the sales cycle associated with our service offerings; |
| ¡ | Product launch delays; |
- 18 -
Table of Contents
| ¡ | Unanticipated variations in the size, budget, number or progress toward completion of our engagements; |
| ¡ | Unanticipated termination of a major engagement, a customer’s decision not to proceed with an engagement we anticipated or the completion or delay during a quarter of several major customer engagements; |
| ¡ | Efficiency with which we utilize our employees, or utilization, including our ability to transition employees from completed engagements to new engagements; |
| ¡ | Our ability to manage our operating costs, a large portion of which are fixed in advance of any particular quarter; |
| ¡ | Changes in pricing policies by us or our competitors; |
| ¡ | Seasonality and cyclicality, including the effects of lower utilization rates during periods with disproportionately high holiday and vacation usage experience; |
| ¡ | The timing of customer year-end periods and the impact of spending relative to such year-end periods; |
| ¡ | Our ability to manage future growth; and |
| ¡ | Costs of attracting, retaining and training skilled personnel. |
Some of these factors are within our control, while others are outside of our control.
Volatility of our stock price could result in expensive class action litigation. If our common stock suffers from volatility like the securities of other technology and consulting companies, we could be subject to securities class action litigation similar to that which has been brought against other companies following periods of volatility in the market price of their common stock. The process of defending against these types of claims, regardless of their merit, is costly and often creates a considerable distraction to senior management. Any future litigation could result in substantial additional costs and could divert our resources and senior management’s attention. This could harm our productivity and profitability and potentially adversely affect our stock price.
We may be required to record additional impairment charges against the carrying value of our goodwill and other intangible assets in future quarters. As of December 31, 2015, we had recorded goodwill and intangible assets with a net book value of $41.9 million. We test for impairment at least annually and whenever evidence of impairment exists. We have in the past recorded impairment charges against the carrying value of our goodwill and intangible assets. The carrying value of our goodwill and intangible asset values are measured using a variety of factors, including values of comparable companies, overall stock market and economic data and our own projections of future financial performance. We may be required in the future to record additional impairment charges that could have a material adverse effect on our reported results.
Our operating results could be adversely affected by fluctuations in the value of the U.S. dollar against foreign currencies. As a result of our acquisitions and the international expansion of our EPM-related business, a portion of our revenues and operating expenses are, and will be, denominated in currencies other than the U.S. dollar. As a result, these revenues and operating expenses are affected by fluctuating foreign currency exchange rates. An increase in the U.S. dollar relative to other currencies in which we have revenues will cause our revenues to be lower than with a stable exchange rate. Changes in exchange rates between other foreign currencies and the U.S. dollar can affect the recorded levels of our assets, liabilities and expenses relating to our operations. The primary foreign currencies in which we have exchange rate fluctuation exposure are the Canadian dollar, the euro, the British pound and the South African rand. Exchange rates between these currencies and U.S. dollars have fluctuated significantly in recent years, particularly as the current global financial crisis has unfolded, and may continue to do so in the future. We cannot predict the impact of future exchange rate fluctuations on our operating results.
The activities of activist shareholders could be disruptive and costly, and these actions could result in the replacement of members of our Board of Directors and could cause uncertainty about the direction of our business. We have encountered activist shareholders from time-to-time, and the attention required to address activist shareholders can be costly and time-consuming, disrupt our operations and divert the attention of
- 19 -
Table of Contents
management and our employees from executing our strategic plan. Perceived uncertainties as to our future direction as a result of changes to composition of the Board of Directors may lead to the perception of a change in the direction of the business, instability or lack of continuity which may be exploited by our competitors, cause concern to our current or potential clients, and make it more difficult to attract and retain qualified personnel.
The increased emphasis on a cloud strategy may give rise to risks that could harm our business. Our cloud strategy requires continued investment in product development and cloud operations and could alter the way in which we price and deliver our products and services. Further, the additional focus on the decisions of cloud versus “on premise” solutions by our customers could lead to project start delays.
| ITEM 1B. | UNRESOLVED STAFF COMMENTS |
None.
| ITEM 2. | PROPERTIES |
We lease 66,027 square feet (33,000 of which was included in the partial lease abandonment recorded in the fourth quarter of 2011) of office space for our corporate headquarters located at 200 Harvard Mill Square, Suite 210, Wakefield, Massachusetts 01880-3209. We also have office facilities in Alabama, Georgia, New Hampshire, New York, Illinois, Montreal and London.
Our corporate and satellite offices are all leased properties. We do not own any real estate. Our existing properties satisfy our current operating needs; however, we will seek additional space in the event our existing properties are unable to meet our operating requirements in the future.
| ITEM 3. | LEGAL PROCEEDINGS |
The Company is involved in legal proceedings, claims, and litigation arising in the ordinary course of business not specifically discussed herein. We have not formed an opinion that an unfavorable outcome in any of the actions is either “probable” or “remote” and are unable to estimate the magnitude or range of any potential loss. Also refer to “Item 8. — Financial Statements and Supplementary Data — Notes to Consolidated Financial Statements — Note 13 — Commitments and Contingencies” included elsewhere in this Annual Report on Form 10-K, which is incorporated herein by reference.
| ITEM 4. | MINE SAFETY DISCLOSURES |
Not applicable.
- 20 -
Table of Contents
| ITEM 5. | MARKET FOR REGISTRANT’S COMMON EQUITY, RELATED STOCKHOLDER MATTERS AND ISSUER PURCHASES OF EQUITY SECURITIES |
Stock Price Information
Our common stock, which has a par value of $0.01 per share, trades on the NASDAQ Global Market under the symbol “EDGW.” On March 7, 2016, there were approximately 1,467 holders of record of our common stock, and approximately 11.9 million shares of our common stock were outstanding. The number of record holders indicated above does not reflect persons or entities that hold their shares of stock in nominee or “street” name through various bankers or brokerage firms.
The following table sets forth the range of high and low trading prices for our common stock as reported by the NASDAQ Global Market for each quarter in 2014 and 2015 and the first quarter of 2016 (through March 7, 2016).
| High | Low | |||||||
| FISCAL 2014: |
||||||||
| First Quarter |
$ | 7.35 | $ | 5.00 | ||||
| Second Quarter |
8.88 | 6.69 | ||||||
| Third Quarter |
7.79 | 5.60 | ||||||
| Fourth Quarter |
8.20 | 6.36 | ||||||
| FISCAL 2015: |
||||||||
| First Quarter |
$ | 7.70 | $ | 6.56 | ||||
| Second Quarter |
7.50 | 6.76 | ||||||
| Third Quarter |
7.50 | 6.21 | ||||||
| Fourth Quarter |
8.28 | 7.14 | ||||||
| FISCAL 2016: |
||||||||
| First Quarter |
$ | 8.23 | $ | 6.66 | ||||
| (through March 7, 2016) |
||||||||
Recent Sales of Unregistered Securities
None.
Issuer Purchases of Equity Securities
In December 2007, our Board of Directors (the “Board”) authorized a stock repurchase program for up to $5.0 million of common stock on the open market or through privately negotiated transactions from time-to-time through December 31, 2008 (the “Stock Repurchase Program”). The Board subsequently amended the Stock Repurchase Program, authorizing both an increase to and an extension of the Stock Repurchase Program. The Stock Repurchase Program, as amended, had a maximum purchase value of shares of $23.1 million (the “Purchase Authorization”) and was set to expire on September 19, 2014 (the “Repurchase Period”). On September 18, 2014, we announced that the Board had approved an extension of the Repurchase period to September 25, 2015, and on September 17, 2015, we announced that the Board had approved a further extension of the Repurchase Period to September 23, 2016.
The timing and amount of the purchases will be based upon market conditions, securities law considerations and other factors. The Stock Repurchase Program does not obligate the Company to acquire a specific number of shares in any period and may be modified, suspended, extended or discontinued at any time, without prior notice.
- 21 -
Table of Contents
The following table provides information with respect to purchases of our common stock during the quarter ended December 31, 2015:
Issuer Purchases of Equity Securities
| Period | Total Number of Shares Purchased |
Average Price Paid Per Share |
Total Number of Shares Purchased as Part of Publicly Announced Plans or Programs |
Maximum Dollar Value of Shares that May Yet Be Purchased Under the Plans or Programs |
||||||||||||
| October 1 – 31, 2015 |
- | $ | - | - | $ | 8,759,800 | ||||||||||
| November 1 – 30, 2015 |
3,250 | 7.95 | 3,250 | 8,733,963 | ||||||||||||
| December 1 – 31, 2015 |
- | - | - | 8,733,963 | ||||||||||||
| Total |
3,250 | $ | 7.95 | 3,250 | $ | 8,733,963 | ||||||||||
- 22 -
Table of Contents
Performance Graph
The following chart compares the cumulative total stockholder return and total return analysis, respectively, of our common stock with the cumulative total return on the NASDAQ Composite US Index, the S&P 600 IT Services Index and self-selected peer groups in the technology consulting industry for the five-year period beginning on December 31, 2010 (the closing sale price of our common stock on this date was $2.35) and ending on December 31, 2015, assuming a $100 investment in each and assuming the reinvestment of dividends. We did not pay any dividends during the period. Refer to the footnotes below the graph for a listing of the companies included in our peer groups.
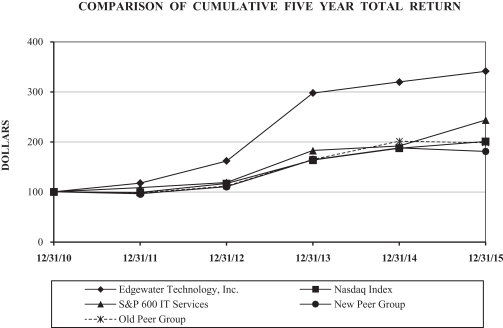
| Company Name / Index |
Base Period 12/31/10 |
INDEXED RETURNS Years Ending |
||||||||||||||||||||||
| 12/31/11 | 12/31/12 | 12/31/13 | 12/31/14 | 12/31/15 | ||||||||||||||||||||
| Edgewater Technology, Inc. |
100 | 117.45 | 161.70 | 297.45 | 319.36 | 340.85 | ||||||||||||||||||
| Nasdaq Index |
100 | 99.17 | 116.48 | 163.21 | 187.27 | 200.31 | ||||||||||||||||||
| S&P 600 IT Services |
100 | 108.51 | 118.95 | 182.41 | 191.77 | 243.35 | ||||||||||||||||||
| New Peer Group (1) |
100 | 96.14 | 110.41 | 164.22 | 187.64 | 180.72 | ||||||||||||||||||
| Old Peer Group (2) |
100 | 97.63 | 111.41 | 165.02 | 201.17 | 197.82 | ||||||||||||||||||
| (1) | Our self-selected peer group in 2015 consists of the following companies: L-3 Communications Holdings Inc., Huron Consulting Group Inc., Navigant Consulting Inc., ICF International Inc., Resources Connection Inc., Perficient Inc., The Hackett Group, Inc., Ciber, Inc., CRA International Inc., Information Services Group, Inc. and Cartesian, Inc. |
| (2) | Our self-selected peer group in 2014 consists of the following companies: Cartesian, Inc. (formerly Management Network Group); Ciber, Inc; The Hackett Group; L-3 Communications Holding, Inc.; Perficient, Inc.; and Sapient Corporation. |
During 2015, we elected to change the composition of our self-selected peer group companies to eliminate Sapient Corporation, based on its 2015 divestiture. As a result we have removed Sapient Corporation from our 2015 peer group and replaced it with Huron Consulting Group Inc., Navigant Consulting Inc., ICF International Inc., Resource Connection Inc., CRA International Inc. and Information Services Group Inc.
- 23 -
Table of Contents
We believe that the companies included in our peer groups are comparable to our Company as they provide similar IT consulting services and expertise to their customers.
The above Performance Graph and related information shall not be deemed “soliciting material” or to be “filed” with the Securities and Exchange Commission, nor shall such information be incorporated by reference into any future filing under the Securities Act of 1933 or Securities Exchange Act of 1934, each as amended, except to the extent that we specifically incorporate it by reference into such filing.
Other Stockholder Matters
We have not paid dividends in the past and intend to retain any earnings to finance the expansion and operations of our business. We do not anticipate paying any cash dividends with regard to cash generated through our normal operations in the foreseeable future. The trading price of our common stock is subject to wide fluctuations in response to quarterly variations in operating results, announcements of acquisitions, performance by our competitors and other market events or factors. In addition, the stock market has, from time-to-time, experienced price and volume fluctuations, which have particularly affected the market price of many professional service companies and which often have been unrelated to the operating performance of these companies. These broad market fluctuations may adversely affect the market price of our common stock.
- 24 -
Table of Contents
| ITEM 6. | SELECTED FINANCIAL DATA |
The selected consolidated financial data presented below have been derived from our audited consolidated financial statements and have been prepared in accordance with United States generally accepted accounting principles. We believe that this information should be read in conjunction with our audited consolidated financial statements and accompanying notes and “Item 7. — Management’s Discussion and Analysis of Financial Condition and Results of Operations” included elsewhere in this Annual Report on Form 10-K.
| Year Ended December 31, | ||||||||||||||||||||
| 2015 | 2014 | 2013 | 2012 | 2011 | ||||||||||||||||
| (In Thousands, Except per Share Data) | ||||||||||||||||||||
| Consolidated Statements of Operations Data: |
||||||||||||||||||||
| Total revenue |
$ | 116,704 | $ | 112,989 | $ | 103,556 | $ | 100,881 | $ | 102,443 | ||||||||||
| Cost of revenue |
77,114 | 71,623 | 65,984 | 65,602 | 63,746 | |||||||||||||||
|
|
|
|
|
|
|
|
|
|
|
|||||||||||
| Gross profit |
39,590 | 41,366 | 37,572 | 35,279 | 38,697 | |||||||||||||||
| Operating expenses: |
||||||||||||||||||||
| Selling, general and administrative |
34,592 | 34,145 | 31,636 | 31,563 | 32,307 | |||||||||||||||
| Direct acquisition costs |
1,754 | - | - | - | - | |||||||||||||||
| Consent solicitation expenses |
495 | - | - | - | - | |||||||||||||||
| Lease abandonment expense (1) (2) |
- | 400 | - | - | 2,230 | |||||||||||||||
| Fullscope embezzlement loss recovery |
(250 | ) | (1,529 | ) | - | - | - | |||||||||||||
| Depreciation and amortization |
1,517 | 928 | 1,225 | 1,801 | 2,846 | |||||||||||||||
|
|
|
|
|
|
|
|
|
|
|
|||||||||||
| Total operating expenses |
38,108 | 33,944 | 32,861 | 33,364 | 37,383 | |||||||||||||||
|
|
|
|
|
|
|
|
|
|
|
|||||||||||
| Operating income |
1,482 | 7,422 | 4,711 | 1,915 | 1,314 | |||||||||||||||
| Other expense, net |
2,013 | 181 | 92 | 67 | 127 | |||||||||||||||
|
|
|
|
|
|
|
|
|
|
|
|||||||||||
| (Loss) Income before taxes |
(531 | ) | 7,241 | 4,619 | 1,848 | 1,187 | ||||||||||||||
| Tax provision (benefit) (3) (4) |
3,529 | 3,177 | (30,089 | ) | 401 | 843 | ||||||||||||||
|
|
|
|
|
|
|
|
|
|
|
|||||||||||
| Net (loss) income |
$ | (4,060 | ) | $ | 4,064 | $ | 34,708 | $ | 1,447 | $ | 344 | |||||||||
|
|
|
|
|
|
|
|
|
|
|
|||||||||||
| Net (loss) income per share: |
||||||||||||||||||||
| Basic net (loss) income per share |
$ | (0.35 | ) | $ | 0.37 | $ | 3.21 | $ | 0.13 | $ | 0.03 | |||||||||
|
|
|
|
|
|
|
|
|
|
|
|||||||||||
| Weighted average shares, basic |
11,505 | 11,131 | 10,813 | 11,180 | 12,038 | |||||||||||||||
|
|
|
|
|
|
|
|
|
|
|
|||||||||||
| Diluted net (loss) income per share |
$ | (0.35 | ) | $ | 0.31 | $ | 2.88 | $ | 0.13 | $ | 0.03 | |||||||||
|
|
|
|
|
|
|
|
|
|
|
|||||||||||
| Weighted average shares, diluted |
11,505 | 13,090 | 12,031 | 11,589 | 12,048 | |||||||||||||||
|
|
|
|
|
|
|
|
|
|
|
|||||||||||
| (1) | In December 2011, the Company abandoned certain excess office space within its corporate headquarters in Wakefield, Massachusetts. As a result of the abandonment of such space, the Company recorded a non-cash operating charge of approximately $2.2 million. |
| (2) | In June 2014, as part of our recurring assessment of underlying assumptions, the Company recognized a $400 thousand non-cash expenditure related to the elimination of estimated future sublease income. |
| (3) | During the year ended December 31, 2015, in connection with our routine, periodic assessment of the estimated future realizability of the carrying value of our net deferred tax assets, we recorded a $3.0 million non-cash charge related to an increase in the valuation allowance recorded against the carrying value of our deferred tax assets. Additionally, we recorded a $633 thousand non-cash charge associated with the impairment of a certain state net operating loss carryforward. |
| (4) | During the year ended December 31, 2013, in connection with our routine, periodic assessment of the estimated future realizability of the carrying value of our net deferred tax assets, we reversed $36.2 million of the previously recorded valuation allowance recorded against the carrying value of our deferred tax assets. |
- 25 -
Table of Contents
| As of December 31, | ||||||||||||||||||||
| 2015 | 2014 | 2013 | 2012 | 2011 | ||||||||||||||||
| (In Thousands) | ||||||||||||||||||||
| Consolidated Balance Sheet Data: |
||||||||||||||||||||
| Cash, cash equivalents and marketable securities |
$ | 11,981 | $ | 26,768 | $ | 20,321 | $ | 16,651 | $ | 10,333 | ||||||||||
| Accounts receivable, net |
27,753 | 24,654 | 19,842 | 18,281 | 23,307 | |||||||||||||||
| Goodwill and intangibles, net |
41,900 | 12,529 | 13,005 | 13,243 | 14,128 | |||||||||||||||
| Deferred tax assets, net |
24,032 | 27,170 | 30,272 | 6 | - | |||||||||||||||
| All other assets |
1,758 | 2,292 | 2,627 | 3,608 | 3,430 | |||||||||||||||
|
|
|
|
|
|
|
|
|
|
|
|||||||||||
| Total assets |
$ | 107,424 | $ | 93,413 | $ | 86,067 | $ | 51,789 | $ | 51,198 | ||||||||||
|
|
|
|
|
|
|
|
|
|
|
|||||||||||
| Accrued contingent earnout obligations |
$ | 10,540 | $ | - | $ | - | $ | - | $ | 231 | ||||||||||
| Revolving credit facility |
5,000 | - | - | - | - | |||||||||||||||
| All other liabilities |
18,500 | 18,384 | 17,481 | 19,114 | 19,254 | |||||||||||||||
| Stockholders’ equity |
73,384 | 75,029 | 68,586 | 32,675 | 31,713 | |||||||||||||||
|
|
|
|
|
|
|
|
|
|
|
|||||||||||
| Total liabilities and stockholders’ equity |
$ | 107,424 | $ | 93,413 | $ | 86,067 | $ | 51,789 | $ | 51,198 | ||||||||||
|
|
|
|
|
|
|
|
|
|
|
|||||||||||
| Outstanding shares of common stock |
11,859 | 11,440 | 11,049 | 10,897 | 11,311 | |||||||||||||||
|
|
|
|
|
|
|
|
|
|
|
|||||||||||
- 26 -
Table of Contents
| ITEM 7. | MANAGEMENT’S DISCUSSION AND ANALYSIS OF FINANCIAL CONDITION AND RESULTS OF OPERATIONS |
You should read the following summary together with the more detailed business information and consolidated financial statements and related notes that appear elsewhere in this annual report and in the documents that we incorporate by reference into this annual report. This annual report may contain certain “forward-looking” information within the meaning of the Private Securities Litigation Reform Act of 1995. This information involves risks and uncertainties. Our actual results may differ materially from the results discussed in the forward-looking statements. Factors that might cause such a difference include, but are not limited to, those discussed in “Item 1A. — Risk Factors” and under “Special Note Regarding Forward-Looking Statements.”
Overview
Edgewater Technology, Inc. helps the C-suite drive transformational change through its unique selection of business and technology services and channel-based solutions.
Classic consulting disciplines (such as business advisory, process improvement, organizational change management, M&A due diligence, and domain expertise) are blended with technical services (such as digital transformation, technical roadmaps, data and analytics services, custom development and system integration) to help organizations leverage investments in legacy IT assets to create new digital business models.
Delivering both on premise and in the cloud, Edgewater offers two major channel-based services. In the Oracle channel, Edgewater Ranzal provides Business Analytics solutions leveraging Oracle EPM, BI and Big Data technologies. In the Microsoft channel, Edgewater Fullscope delivers Dynamics AX ERP, Business Intelligence and CRM solutions primarily in the manufacturing space.
Factors Influencing Our Results of Operations
Revenue.
The Company derives its service revenue from time and materials-based contracts, fixed-price contracts and retainer-based arrangements. Time and materials-based contracts represented 82.3% of service revenue for the year ended December 31, 2015. Revenue under time and materials contracts is recognized as services are rendered and performed at contractually agreed upon rates. Fixed-price contracts represented 13.0% of service revenue for the year ended December 31, 2015. Revenue pursuant to fixed-price contracts is recognized under the proportional performance method of accounting. Retainer-based contracts represented 4.7% of service revenue for the year ended December 31, 2015. Revenue under retainer-based contracts is recognized ratably over the contract period, as outlined within the respective contract.
Provisions for estimated profits or losses on incomplete projects are made on a contract-by-contract basis and are recognized in the period in which such profits or losses are determined. The Company did not recognize any loss contracts during the years ended December 31, 2015, 2014 or 2013. On many projects, we are reimbursed for out-of-pocket expenses such as airfare, lodging and meals. These reimbursements are included as a component of revenue and cost of revenue. The aggregate amount of reimbursed expenses will fluctuate depending on the location of our customers, the total number of our projects that require travel and whether our arrangements with our customers provide for the reimbursement of travel and other project-related expenses.
With the offering of a product-based consulting model, software revenue will continue to be a meaningful portion of our revenues. Software revenue, driven by resales of Microsoft Dynamics AX product, represented 9.3%, 7.2% and 11.2% of revenue for the years ended December 31, 2015, 2014 and 2013, respectively. Software and maintenance revenue are recognized upon delivery, except in the infrequent situation where the Company provides maintenance services, in which case the related maintenance is recognized ratably over the
- 27 -
Table of Contents
maintenance period (while the software revenue is recognized upon delivery). Software revenue is expected to fluctuate between quarters, dependent on our customers’ demand for such third-party off-the-shelf software. Fluctuations in software revenue may have an impact upon our periodic operating performance, including gross margin.
Operating Expenses.
The largest portion of our operating expenses consists of cash and non-cash compensation and benefits associated with our project consulting personnel and related expenses. Non-cash compensation includes share-based compensation expense arising from restricted stock and option grants to employees. Project personnel expenses also consist of payroll costs and related benefits associated with our professional staff. Other related expenses include travel, subcontracting costs, third-party vendor payments and non-billable expenses associated with the delivery of services to our customers. We consider the relationship between project personnel expenses and revenue to be an important measure of our operating performance. The relationship between project personnel expenses and revenue is driven largely by the chargeability of our consultant base, the prices we charge our customers and the non-billable costs associated with securing new customer engagements and developing new service offerings. The remainder of our recurring operating expenses consists of expenses associated with the development of our business and the support of our customer-serving professionals, such as professional development and recruiting, marketing and sales, and management and administrative support. Professional development and recruiting expenses consist primarily of recruiting and training, content development and delivery costs. Marketing and sales expenses consist primarily of the costs associated with the development and maintenance of our marketing materials and programs. Management and administrative support expenses consist primarily of the costs associated with operations, including finance, information systems, human resources, facilities (including the rent of office space) and other administrative support for project personnel.
The Company regularly reviews our fees for services, professional compensation and overhead costs to ensure that our services and compensation are competitive within the industry and that our overhead costs are balanced with our revenue levels. In addition, we monitor the progress of customer projects with customer senior management. The Company manages the activities of our professionals by closely monitoring engagement schedules and staffing requirements. However, a rapid decline in the demand for the professional services that we provide could result in lower utilization of our professionals than we planned. In addition, because most of our customer engagements are terminable by our customers without penalty, an unanticipated termination of a customer project could require us to maintain underutilized employees. While professional staff levels must be adjusted to reflect active engagements, the Company must also maintain a sufficient number of consulting professionals to oversee existing customer engagements and to participate in sales activities to secure new customer assignments.
Direct Acquisition Costs. The Company incurred $1.8 million of direct acquisition costs related to the acquisitions of substantially all of the assets of Zero2Ten, Branchbird and M2 Dynamics in the year ended December 31, 2015. During the first quarter of 2015, the Company incurred approximately $613 thousand of direct acquisition costs associated with the March 13, 2015 Zero2Ten acquisition. During the third quarter of 2015, the Company incurred approximately $340 thousand of direct acquisition costs associated with the August 17, 2015 Branchbird acquisition. During the fourth quarter of 2015, the Company incurred approximately $801 thousand of direct acquisition costs associated with the December 21, 2015 M2 Dynamics acquisition. Incurred expenses included investment banking fees, legal fees, accounting and other professional fees directly associated with completion of the acquisitions.
Consent Solicitation Expense. During the fourth quarter 2015, the Company incurred $495 thousand of legal and advisory expenses in connection with its defense against a consent solicitation. No such expenses were incurred in the years ended December 31, 2014 or 2013.
- 28 -
Table of Contents
Fullscope Embezzlement Expenses. Beginning in fiscal 2010, we incurred certain non-routine professional service-related expenses associated with our identification of embezzlement activities at Fullscope, one of our wholly-owned subsidiaries (the “Fullscope Embezzlement Issue”). We incurred a majority of our embezzlement-related expenses during fiscal 2010 in connection with our identification and investigation of the embezzlement activity.
During the second quarter of 2015, the Company released the remaining balance of $250 thousand which had been held in escrow in the event it was necessary to cover any potential future sales and use tax exposure that arose from subsequent state inquiry or audit. As no exposure was identified, the remaining balance was remitted to the former Fullscope stockholders during the second quarter of 2015. Simultaneously, the Company reversed the remaining estimated sales and use tax reserve, in the amount of $250 thousand, that had previously been established to account for estimated potential exposure from sales and use tax audits. This reversal resulted in a gain recognized within the Fullscope embezzlement costs (loss recovery) line on our condensed consolidated statement of comprehensive income (loss). As of December 31, 2015, there are no remaining balances held in escrow or the sales and use tax reserve.
Adjustments to Fair Value of Contingent Consideration. The Company remeasures the estimated carrying value of contingent consideration each quarter, with any changes (income or expense) in the estimated fair value recorded as an operating expense. Accretion of the contingent earnout liability is classified as interest expense on the consolidated statements of comprehensive income (loss). As of December 31, 2015, the Company had $10.5 million accrued in connection with the contingent earnout obligations associated with the Zero2Ten, Branchbird, and M2 Dynamics acquisitions. As of December 31, 2014 and 2013, the Company had no ongoing contingent consideration obligations.
Growth Through Acquisitions.
The Company’s goal is to position itself as one of the leading providers of transformational classic and product-based consulting services in North America by growing its customer base, leveraging its industry expertise to enhance its service offerings and continuing to make disciplined strategic acquisitions. Previous acquisitions, including, but not limited to its acquisitions of Zero2Ten, Branchbird and M2 Dynamics, have further expanded its geographical footprint, increased its vertical expertise and provided more scale to our organization. The Company will continue to evaluate the possibility of growth through acquisition in future years.
Company Performance Measurement Systems and Metrics.
The Company’s management monitors and assesses its operating performance by evaluating key metrics and indicators on an ongoing basis. For example, we regularly review performance information related to annualized revenue per billable consultant, periodic consultant utilization rates, gross profit margins, average bill rates and billable employee headcount. Edgewater has also developed internal Enterprise Performance Management systems which aid us in measuring our operating performance and consultant utilization rates. The matching of sales opportunities to available skill sets in our consultant base is one of our greatest challenges, and therefore, we monitor consultant utilization closely. These metrics, along with other operating and financial performance metrics, are used in evaluating management’s overall performance. These metrics and indicators are discussed in more detail under “Results for the Year Ended December 31, 2015, Compared to Results for the Year Ended December 31, 2014,” included elsewhere in this Annual Report on Form 10-K.
Critical Accounting Policies
Our consolidated financial statements are prepared in accordance with accounting principles generally accepted in the United States of America (“GAAP”). These accounting principles require us to make certain estimates, judgments and assumptions. We believe that the estimates, judgments and assumptions upon which we
- 29 -
Table of Contents
rely are reasonable based upon information available to us at the time that they are made. These estimates, judgments and assumptions can affect the reported amounts of assets and liabilities as of the date of the financial statements, as well as the reported amounts of revenues and expenses during the periods presented. To the extent there are differences between these estimates, judgments or assumptions and actual results, our financial statements may be affected. The accounting policies that we believe are the most critical to aid in fully understanding and evaluating our reported financial results include the following:
| • | Income Taxes and Valuation of Deferred Tax Assets; |
| • | Revenue Recognition; |
| • | Allowance for Doubtful Accounts; |
| • | Goodwill, Other Intangible Assets and Impairment of Long-Lived Assets; |
| • | Purchase Price Allocation; and |
| • | Valuation of Contingent Earnout Consideration. |
Senior management has reviewed these critical accounting policies and related disclosures with our Audit Committee. See “Item 8. — Financial Statements and Supplementary Data — Notes to Consolidated Financial Statements” included elsewhere herein, which contains additional information regarding our accounting policies and other disclosures required by GAAP. We have identified the policies listed below as critical to our business operations and the understanding of our results of operations.
Income Taxes and Valuation of Deferred Tax Assets. In determining our current income tax provision, we assess temporary differences resulting from different treatments of items for tax and accounting purposes. These differences result in deferred tax assets and liabilities, which are recorded in our consolidated balance sheets. We evaluate the realizability of our deferred tax assets and assess the need for a valuation allowance on an ongoing basis. In evaluating our deferred tax assets, we consider whether it is more likely than not that the deferred income tax assets will be realized. The ultimate realization of our deferred tax assets depends upon generating sufficient future taxable income prior to the expiration of the tax attributes. In assessing the need for a valuation allowance, we must project future levels of taxable income. This assessment requires significant judgment. Recovery of the deferred tax assets is dependent on achieving such projections and failure to do so would result in an increase in the valuation allowance in a future period. We have net deferred tax assets that have arisen primarily as a result of timing differences, net operating loss carryforwards and tax credits. Our ability to realize a deferred tax asset is based on our ability to generate sufficient future taxable income. As is our practice, we assess, on a routine periodic basis, the estimated future realizability of the gross carrying value of our net deferred tax assets on a more likely than not basis. Our periodic assessments take into consideration both positive evidence (future profitability projections for example) and negative evidence (historical cumulative loss position for example) as it relates to evaluating the future recoverability of our deferred tax assets.
As of December 31, 2015, the gross carrying value of the Company’s net deferred tax assets was $28.5 million. This amount consisted of approximately $14.2 million in federal NOL carryforwards, $0.5 million in state NOL carryforwards, $2.1 million in available federal credits, $3.1 million in future tax benefits related to share-based compensation expense and $8.6 million in net deferred tax assets related to other temporary differences.
The Company maintained a $4.5 million and $1.5 million valuation allowance against the gross carrying value of its net deferred tax assets as of December 31, 2015 and 2014, respectively.
During the year ended December 31, 2015, in connection with our periodic review of the estimated future realizability of our net deferred tax attributes, we recorded a non-cash tax charge of $3.0 million in connection with an increase to the previously established valuation allowance recorded against the gross carrying value of our net deferred tax assets, increasing the previously established valuation allowance to $4.5 million.
During the year ended December 31, 2013, in connection with our periodic review of the estimated future realizability of our net deferred tax attributes, we recorded a non-cash tax benefit of $36.2 million in connection
- 30 -
Table of Contents
with a decrease to the previously established valuation allowance recorded against the gross carrying value of our net deferred tax assets, reducing the previously established valuation allowance to $1.5 million.
The establishment of a valuation allowance against the gross carrying value of our net deferred tax assets does not prohibit or limit the Company’s ability to realize a tax benefit in future periods. All existing deferred tax assets, net operating loss carryforwards and credits will be fully available to reduce certain future federal and state income tax obligations.
The Company considers scheduled reversals of deferred tax liabilities, projected future taxable income, ongoing tax planning strategies and other matters, including the period over which our deferred tax assets will be recoverable, in assessing the need for and the amount of the valuation allowance. In the event that actual results differ from these estimates, or we adjust these estimates in the future periods, further adjustments to our valuation allowance may be recorded, which could materially impact our financial position and net (loss) income in the period of the adjustment.
Revenue Recognition. Our Company recognizes revenue primarily through the provision of consulting services and the resale of third-party, off-the-shelf software and maintenance.
We recognize revenue by providing consulting services under written service contracts with our customers. The service contracts we enter into generally fall into three specific categories: time and materials, fixed-price and retainer. Time and materials-based contracts represented 82.3%, 90.2% and 91.8% of service revenue for the years ended December 31, 2015, 2014 and 2013, respectively. Revenue related to our service offerings is recognized as the services are performed and amounts are earned. When a customer enters into a time and materials, fixed-price or a periodic retainer-based contract, we recognize revenue in accordance with our evaluation of the deliverables in each contract. If the deliverables represent separate units of accounting, we then measure and allocate the consideration from the arrangement to the separate units, based on reliable evidence of fair value for each deliverable.
Revenue under time and materials contracts is recognized as services are rendered and performed at contractually agreed upon rates. Revenue pursuant to fixed-price contracts is recognized under the proportional performance method of accounting. Over the course of a fixed-price contract, we routinely evaluate whether revenue and profitability should be recognized in the current period. We estimate the proportional performance on our fixed-price contracts on a monthly basis utilizing hours incurred to date as a percentage of total estimated hours to complete the project. This method is used because reasonably dependable estimates of costs and revenue earned can be made, based on historical experience and milestones identified in any particular contract. If we do not have a sufficient basis to measure progress toward completion, revenue is recognized upon completion of performance, subject to any warranty provisions or other project management assessments as to the status of work performed.
If our initial estimates of the resources required or the scope of work to be performed on a fixed-price contract are inaccurate, or we do not manage the project properly within the planned time period, a provision for estimated losses on incomplete projects is made. Any known or probable losses on projects are charged to operations in the period in which such losses are determined. A formal project review process takes place quarterly, although projects are evaluated on an ongoing basis. Management reviews the estimated total direct costs on each contract to determine if the estimated amounts are accurate, and estimates are adjusted as needed in the period revised estimates are made. No material losses were recognized on fixed-price contracts during the years ended December 31, 2015, 2014 or 2013.
We also perform services on a periodic retainer basis under infrastructure service contracts, which include monthly hosting and support services. Revenue under periodic retainer-based contracts is recognized ratably over the contract period, as outlined within the respective contract. In the event additional services are required, above the minimum retained or contracted amount, then such services are billed on a time and materials basis.
- 31 -
Table of Contents
Typically, the Company provides warranty services on its fixed-price contracts related to providing customers with the ability to have any “design flaws” remedied and/or have our Company “fix” routine defects. The warranty services, as outlined in the respective contracts, are provided for a specific period of time after a project is complete. The Company values the warranty services based upon historical labor hours incurred for similar services at standard billing rates. Revenue related to the warranty provisions within our fixed-price contracts is recognized as the services are performed or the revenue is earned. The warranty period is typically for a 30-60 day period after the project is complete.
We consider amounts to be earned once evidence of an arrangement has been obtained, services are delivered, fees are fixed or determinable and collectability is reasonably assured. We establish billing terms at the time at which the project deliverables and/or milestones are agreed. Our standard payment terms are 30 days from invoice date. Out-of-pocket reimbursable expenses charged to customers are reflected as revenue.
Customer prepayments, even if nonrefundable, are deferred (classified as deferred revenue) and recognized over future periods as services are performed. As of December 31, 2015 and 2014, the Company recorded a deferred liability of approximately $406 thousand and $338 thousand, respectively, which is included in the financial statement caption of “deferred revenue” related to customer prepayments.
Software revenue represents the resale of certain third-party off-the-shelf software and related maintenance and is recorded on a gross basis provided we act as a principal in the transaction, whereby we have credit risk and we set the price to the end user. In the event we do not meet the requirements to be considered a principal in the software sale transaction and act as an agent, software revenue will be recorded on a net basis. Revenue from software resale arrangements represented 9.3%, 7.2% and 11.2% of total revenue for the years ended December 31, 2015, 2014 and 2013, respectively.
Prior to the second quarter of 2013, we recorded substantially all of our software resale revenue on a gross basis (reporting the revenue and cost from the transaction in our consolidated statement of comprehensive income (loss)). However, beginning in the second quarter of 2013, due to changes in the nature of the terms of certain of our Microsoft Dynamics AX software resale arrangements (primarily risk of credit loss and ability to establish pricing), we began to recognize a portion of our software resale revenue on a net basis (reporting only the net profit from the transaction as revenue in our consolidated statement of comprehensive income (loss)). We expect this trend to continue and also anticipate that the number of new software resale arrangements subject to these terms may increase in future periods.
The majority of the software sold by the Company is delivered electronically. For software that is delivered electronically, we consider delivery to have occurred when the customer either (a) takes possession of the software via a download (that is, when the customer takes possession of the electronic data on its hardware), or (b) has been provided with access codes that allow the customer to take immediate possession of the software on its hardware pursuant to an agreement or purchase order for the software.
The Company enters into multiple element arrangements which typically include software, post-contract support (or maintenance), and consulting services. Consistent with the software described above, maintenance that is in the form of a pass through transaction is recognized upon delivery of the software, as all related warranty and maintenance is performed by the primary software vendor and not the Company. Maintenance fee revenue for the Company’s software products, which is inconsequential in all years presented, is recognized ratably over the term of the arrangements, which are generally for a one-year period. The Company has established Vendor Specific Objective Evidence (“VSOE”) with respect to the services provided, for which revenue is recognized as the services are performed.
Allowance for Doubtful Accounts. The Company maintains an allowance for doubtful accounts related to its accounts receivable that have been deemed to have a high risk of collectability. Management reviews its accounts receivable balances on a monthly basis to determine if any receivables are potentially uncollectible.
- 32 -
Table of Contents
Management further analyzes historical collection trends and changes in its customer payment patterns, customer concentration and credit worthiness when evaluating the adequacy of its allowance for doubtful accounts. The Company includes any accounts receivable balances that are deemed to be potentially uncollectible, along with a general reserve, in its overall allowance for doubtful accounts.
Billed and unbilled receivables that are specifically identified as being at risk are provided for with a charge to revenue or bad debts as appropriate in the period the risk is identified.
Based on the information available, management believes the allowance for doubtful accounts is adequate; however, future write-offs could exceed the recorded allowance.
Goodwill, Other Intangible Assets and Impairment of Long-Lived Assets. Business acquisitions typically result in goodwill and other intangible assets, and the recorded values of those assets may become impaired in the future. The determination of the value of such intangible assets requires us to make estimates and assumptions that affect our consolidated financial statements. Goodwill has an indefinite useful life and is not amortized but is evaluated for impairment annually, on December 2, or whenever events or changes in circumstances indicate that the carrying value may not be recoverable. We record intangible assets at fair value at the time of acquisition. Our intangible assets consist primarily of non-compete arrangements, customer relationships and trade names and trademarks. We amortize our intangible assets that have finite lives using either the straight-line method or based on estimated future cash flows to approximate the pattern in which the economic benefit of the asset will be utilized.
Goodwill is tested annually for impairment at the reporting unit level utilizing the “fair value” methodology. Factors the Company considers important that could trigger an interim review for impairment include, but are not limited to, the following:
| ¡ | Significant underperformance relative to historical or projected future operating results; |
| ¡ | Significant changes in the manner of its use of acquired assets or the strategy for its overall business; |
| ¡ | Significant negative industry or economic trends; |
| ¡ | Significant decline in its stock price for a sustained period; and |
| ¡ | Significant decline in market capitalization relative to net book value. |
Goodwill is evaluated for impairment using the two-step process. The first step is to compare the fair value of the reporting unit to the carrying amount of the reporting unit (the “First Step”). If the carrying amount exceeds the fair value, a second step must be followed to calculate impairment (the “Second Step”). Otherwise, if the fair value of the reporting unit exceeds the carrying amount, the goodwill is not considered to be impaired as of the measurement date. In its review of the carrying value of the goodwill, the Company determines fair values for the reporting units using the Income Approach, or more specifically the Discounted Cash Flow Method, and the Market Approach, utilizing both the Guideline Company Method and the Comparable Transactions Method. These valuation methods require management to project revenues, operating expenses, working capital investment, capital spending and cash flows for the reporting units over a multiyear period, as well as determine the weighted average cost of capital to be used as a discount rate.
Long-lived assets, specifically our tangible and intangible assets other than goodwill, held and used are reviewed for impairment whenever events or changes in circumstances indicate that their net book value may not be entirely recoverable. When such factors and circumstances exist, we compare the projected undiscounted future cash flows associated with the related asset or group of assets over their estimated useful lives against their respective carrying amounts. Impairment, if any, is based on the excess of the carrying amount over the fair value of those assets and is recorded in the period in which the determination was made. Any resulting impairment losses recorded by the Company could have an adverse impact on our results of operations by either decreasing net income or increasing net loss.
- 33 -
Table of Contents
On December 2, 2015, the Company performed its annual review for impairment. Based upon the valuation approaches described above, the Company determined that the current carrying value of its goodwill had not been impaired. For purposes of its annual impairment test, the Company performed its review based upon three individual reporting units which also constitute our three operating segments. The Company aggregates our three individual reporting units into one reportable segment based upon similar economic characteristics and other operating similarities.
Goodwill amounted to $29.9 million and $12.0 million as of December 31, 2015 and 2014, respectively. Other net intangible assets amounted to $12.0 million and $480 thousand as of December 31, 2015 and 2014, respectively.
Results of Operations
The following table sets forth, for the periods presented, selected statements of operations data as a percentage of total revenue:
| Year Ended December 31, | ||||||||||||
| 2015 | 2014 | 2013 | ||||||||||
| Revenue: |
||||||||||||
| Service revenue |
84.7 | % | 85.5 | % | 81.7 | % | ||||||
| Software revenue |
9.3 | % | 7.2 | % | 11.2 | % | ||||||
| Reimbursable expenses |
6.0 | % | 7.3 | % | 7.1 | % | ||||||
|
|
|
|
|
|
|
|||||||
| Total revenue |
100.0 | % | 100.0 | % | 100.0 | % | ||||||
| Cost of revenue: |
||||||||||||
| Project and personnel costs |
55.1 | % | 52.2 | % | 50.9 | % | ||||||
| Software costs |
5.0 | % | 3.9 | % | 5.7 | % | ||||||
| Reimbursable expenses |
6.0 | % | 7.3 | % | 7.1 | % | ||||||
|
|
|
|
|
|
|
|||||||
| Total cost of revenue |
66.1 | % | 63.4 | % | 63.7 | % | ||||||
|
|
|
|
|
|
|
|||||||
| Gross profit |
33.9 | % | 36.6 | % | 36.3 | % | ||||||
| Operating expenses: |
||||||||||||
| Selling, general and administrative |
29.6 | % | 30.2 | % | 30.5 | % | ||||||
| Direct acquisition costs |
1.5 | % | - | % | - | % | ||||||
| Consent solicitation expenses |
0.4 | % | - | % | - | % | ||||||
| Lease abandonment charge |
- | % | 0.3 | % | - | % | ||||||
| Fullscope embezzlement loss recovery |
(0.2 | )% | (1.3 | )% | - | % | ||||||
| Depreciation and amortization |
1.3 | % | 0.8 | % | 1.2 | % | ||||||
|
|
|
|
|
|
|
|||||||
| Total operating expenses |
32.6 | % | 30.0 | % | 31.7 | % | ||||||
|
|
|
|
|
|
|
|||||||
| Operating income |
1.3 | % | 6.6 | % | 4.6 | % | ||||||
| Other expense, net |
1.8 | % | 0.2 | % | 0.1 | % | ||||||
|
|
|
|
|
|
|
|||||||
| Loss (income) before taxes |
(0.5 | )% | 6.4 | % | 4.5 | % | ||||||
| Tax provision (benefit) |
3.0 | % | 2.8 | % | (29.0 | )% | ||||||
|
|
|
|
|
|
|
|||||||
| Net (loss) income |
(3.5 | )% | 3.6 | % | 33.5 | % | ||||||
|
|
|
|
|
|
|
|||||||
Results for the Year Ended December 31, 2015 Compared to Results for the Year Ended December 31, 2014
Total Revenue. Total revenue increased by $3.7 million, or 3.3%, to $116.7 million for the year ended December 31, 2015 from $113.0 million for the year ended December 31, 2014. Service revenue increased by $2.2 million, or 2.3%, to $98.8 million for the year ended December 31, 2015 from $96.6 million for the year ended December 31, 2014.
- 34 -
Table of Contents
Service revenue growth during the year ended December 31, 2015 was driven by the strategic acquisitions the Company completed during the year. The acquisition of Zero2Ten aided our Microsoft Dynamics offering and capitalized on the movement to the cloud, while our Branchbird and M2 Dynamics acquisitions continued our investment in growth within the Oracle product offering. The timing of the M2 Dynamics acquisition, which closed on December 21, 2015, significantly limited the revenue we recognized attributable to this acquisition.
The decline in billable consultant utilization was driven by temporary delays in project starts. Project start delays represent instances where signed contracts exist, however the initial project kick-off has been delayed. These delays were experienced predominantly within our EPM/BI service offerings. The effect of the project start delays essentially pushed out the timing of revenue recognition into 2016. Billable consultant utilization was 69.5% during the year ended December 31, 2015 compared to 76.7% during the year ended December 31, 2014. Billable headcount increased during 2015 as a direct result of our acquisitions (while our core billable consultant base remained constant). The M2 Dynamics acquisition, which closed on December 21, 2015, included 39 billable consultants. Total billable headcount, excluding contractors, increased by 70, to 394 as of December 31, 2015, compared to 324 as of December 31, 2014.
Despite the project start delays noted during 2015, the Company experienced strong sales activity and increased pipeline across all entities of the organization.
Annualized service revenue per billable consultant, as adjusted for utilization, was consistent at $359 thousand during each of the years ended December 31, 2015 and 2014. Periodic fluctuations in our annualized service revenue per billable consultant metric typically reflect changes in the mix of our service offering revenue generated by our current engagements.
Total revenue in 2015 increased through the combination of our service revenue and software revenue growth. While our software revenue is volatile and subject to the timing of customer purchasing cycles, the increase in 2015 software revenue is largely attributable to the Microsoft Dynamics CRM cloud related revenue contributed by the strong performance of Zero2Ten after the acquisition date in March of 2015.
During the year ended December 31, 2015, software revenue totaled $10.9 million, or 9.3% of total revenue, compared to software revenue of $8.1 million, or 7.2% of total revenue, in the year ended December 31, 2014. Our software revenue is primarily related to our resale of Microsoft Dynamics software, cloud-based licenses and maintenance. Software revenue is expected to fluctuate on an annual period to period basis dependent upon our customers’ demand for such third-party off-the-shelf software. We anticipate that software revenue will continue to represent a meaningful portion of annual revenues in future years. Because of this, we believe that periodic fluctuations in the amount of software revenue recognized by the Company may have a material impact upon our gross margins.
Generally, we are reimbursed for our out-of-pocket expenses incurred in connection with our customers’ consulting projects. Reimbursable expense revenue decreased to $7.0 million for the year ended December 31, 2015 compared to $8.3 million for the year ended December 31, 2014. The aggregate amount of reimbursable expenses will fluctuate from period-to-period depending on the number of billable consultants as well the location of our customers, the general fluctuation of travel costs, such as airfare, and the number of our projects that require travel.
During 2015, we recorded service revenue from 667 customers, of which 139 were new customers, as compared to recording service revenue from 403 customers in 2014, of which 83 were new customers. We recorded service revenue from 387 customers in 2013, of which 92 were new customers. Total customers served and new customers added during 2015 benefited from the acquisitions of substantially all of the assets of Zero2Ten, Branchbird and M2 Dynamics. Specifically, the higher volume and lower cost revenue model of Zero2Ten was a driving force behind the yearly increase in these metrics.
- 35 -
Table of Contents
Cost of Revenue. Cost of revenue primarily consists of project personnel costs principally related to salaries, payroll taxes, employee benefits and travel expenses for personnel dedicated to customer projects. These costs represent the most significant expense we incur in providing our services. In total, cost of revenue increased by $5.5 million, or 7.7%, to $77.1 million in 2015, as compared to $71.6 million in 2014.
The primary drivers of the 2015 increase in total cost of revenue, on an absolute dollar basis, were related to an increase in salary- and fringe-related expenses (primarily associated with the increase in billable consultant headcount attributable to the acquisitions), an increase in software expense (in line with the software revenue growth noted above), and an increase in contractor expense (as the number of contractors utilized increased by 14 compared to the year ended December 31, 2014). The Company had 48 active contractors at December 31, 2015 compared to 34 active contractors at December 31, 2014. These increases were partially offset by a reduction in billable consultant bonuses (driven by the decreased utilization rate) and a decrease in reimbursable expenses (a function of the timing and location of our customer mix).
During 2015, the Company increased billable consultant headcount as a result of its acquisitions (while the core billable consultant base remained constant). There remain scenarios under which it is more advantageous to leverage third-party contractors. We have in the past (and will continue to do so in the future) utilized contractors as a means to support project delivery needs during periods of growth or for highly specialized skill sets. The Company has a strong pipeline and the kickoff of previously delayed projects will require a level of billable consultants that we believe is in line with the headcount growth realized during 2015. The Company has made the decision to utilize external contractors in the short term (sacrificing some margin) to maintain a flexible workforce and more easily respond to customer demand without being required to carry the additional burden of full-time employee salary-related costs.
Project and personnel costs represented 55.1% and 52.2% of total revenue during the years ended December 31, 2015 and 2014, respectively. The periodic change, as a percentage of total revenue, is primarily related to the increase in comparative compensation-related expenses (salaries and fringe-related expenses) associated with the growth in the billable consultant base. The increase in salary and fringe expense was partially offset by the decrease in billable consultant bonus based on service revenue performance.
Software costs amounted to $5.8 million during the year ended December 31, 2015 compared to $4.4 million during the year ended December 31, 2014. The increase in the 2015 software costs is primarily driven by the sale of Microsoft Dynamics CRM (via the performance of the Zero2Ten business) combined with the timing of our Dynamics AX software resale arrangements (which we have historically highlighted as being volatile). Software costs are expected to fluctuate depending on our customers’ demand for software.
Reimbursable expenses decreased in 2015, to $7.0 million, as compared to $8.3 million in 2014. The aggregate amount of reimbursable expenses will fluctuate from year-to-year depending on the location of our customers, the general fluctuation of travel costs, such as airfare, and the number of our projects that require travel.
Gross Profit. Gross profit in 2015 decreased by $(1.8) million, or (4.3)%, to $39.6 million, as compared to $41.4 million in 2014. Gross profit, as a percentage of total revenue (which we generally refer to as gross margin) decreased to 33.9%, as compared to 36.6% in 2014.
The comparative year-over-year decrease in total gross margin is primarily attributable to the decrease in billable consultant utilization. The combination of increased salary and salary-related expense (driven by the acquisitions) combined with the decreased billable consultant utilization (driven by the project start delays in 2015) negatively impacted gross margin, despite the growth in total revenue.
Service revenue gross margin of 35.0% in the year ended December 31, 2015 decreased from service revenue gross margin of 39.0% in 2014. This decrease is similarly a factor of the decreased billable consultant utilization.
- 36 -
Table of Contents
We anticipate that software revenue will continue to be a meaningful part of our revenue in future periods. Additionally, our future gross margins may continue to be influenced by the recognition of our software revenue. We believe that our software revenue mix will continue to shift between arrangements under which we will report software revenue on either a gross or net basis (dependent upon the underlying circumstances of each individual resale arrangement). Changes in the nature of the terms of certain of our Microsoft Dynamics AX software resale arrangements as described in “Revenue” above will, in certain situations, extend the timing of the recognition period of the gross margin on software sales (from full, immediate recognition of the gross margin on the transaction to recognition of the gross margin on the transaction spread evenly over a three-year period) due to payment terms being spread over a multiple year period and result in a reduction in the amount of the software gross margin to be recognized by the Company.
Selling, General and Administrative (“SG&A”) Expense. SG&A expense in 2015 increased to $34.6 million compared with SG&A expense of $34.1 million in 2014. SG&A expense, as a percentage of total revenue, was 29.6% and 30.2% in 2015 and 2014, respectively.
The increase in SG&A expense during the year ended December 31, 2015 is primarily the result of increased salary and salary-related expenses associated with the Zero2Ten, Branchbird and M2 Dynamics acquisitions closed during 2015.
Direct Acquisition Costs. The Company incurred $1.8 million of direct acquisition costs related to the acquisitions of Zero2Ten, Branchbird and M2 Dynamics in the year ended December 31, 2015. During the first quarter of 2015, the Company incurred approximately $613 thousand of direct acquisition costs associated with the March 13, 2015 Zero2Ten acquisition. During the third quarter of 2015, the Company incurred approximately $340 thousand of direct acquisition costs associated with the August 17, 2015 Branchbird acquisition. During the fourth quarter of 2015, the Company incurred approximately $801 thousand of direct acquisition costs associated with the December 21, 2015 M2 Dynamics acquisition. Incurred expenses included investment banking fees, legal fees, accounting and other professional fees directly associated with completion of the acquisitions.
Consent Solicitation Expense. During the fourth quarter 2015, we incurred $495 thousand of legal and advisory expenses in connection with its defense against a consent solicitation. No such expenses were incurred in the years ended December 31, 2014 or 2013.
Lease Abandonment charge. During the second quarter of 2014, in connection with the quarterly assessment of our lease abandonment charge assumptions (associated with the 2011 abandonment of certain excess corporate facilities), the Company determined that an elimination of the estimated sub-lease income was warranted and, as a result, the Company has recorded a non-cash operating expense of $400 thousand.
Fullscope Embezzlement Loss Recovery. During the second quarter of 2014, the Company reached an agreement with the former Fullscope stockholders settling the Company’s outstanding escrow claims associated with the Fullscope acquisition (the “Settlement Agreement”). Approximately $1.5 million of the settlement proceeds were recorded as a “loss recovery” gain and are included, as a reduction in operating expenses, within the Fullscope embezzlement costs (loss recovery) on our condensed consolidated statement of comprehensive income (loss) during the quarter ended June 30, 2014. During the quarter ended June 30, 2015, the remaining escrow balance was released and the Company simultaneously concluded that a reserve was no longer necessary and therefore reversed $250 thousand that had been previously reserved for potential sales and use tax penalties and interest from subsequent state inquiry or audit.
Depreciation and Amortization Expense. Depreciation and amortization expense increased by $589 thousand, or 63.5%, to $1.5 million, as compared to $928 thousand in 2014. Amortization expense increased to $899 thousand in 2015, as compared to $302 thousand in 2014. The increase in amortization expense during 2015 is the result of amortization expense associated with the intangible assets identified in connection
- 37 -
Table of Contents
with the Zero2Ten, Branchbird and M2 Dynamics acquisitions. The Company recognizes amortization expense over the periods in which it expects to realize the economic benefit.
Operating Income. The Company’s 2015 operating income decreased by $(5.9) million, to $1.5 million, compared to $7.4 million in 2014. The 2015 decrease in operating income was primarily attributable to the decline in billable consultant utilization (due to the project start delays in 2015), the direct acquisition costs associated with the Zero2Ten, Branchbird and M2 Dynamics acquisitions, legal and advisory fees associated with the consent solicitation contest and the impact of the prior-year recovery of $1.5 million in previously recorded Fullscope embezzlement-related expenses.
Other Expense, Net. Other expense, net totaled $2.0 million during 2015 compared to $181 thousand in 2014. The expenses in 2015 primarily represent accretion of the contingent earnout obligations related to the Zero2Ten, Branchird and M2 Dynamics acquisitions. The 2015 amount also includes the net impact of foreign currency exchange (gains)/losses recognized by the Company. The expenses in 2014 represent the net amount of the foreign currency exchange (gains)/losses recognized by the Company.
Income Tax Provision (Benefit). We recorded an income tax provision of $3.5 million and $3.2 million during the years ended December 31, 2015 and 2014, respectively. Our 2015 and 2014 periodic income tax provision amounts were derived based upon federal and state income taxes (at statutory rates), foreign income taxes, changes in deferred tax assets and liabilities (and their related valuation allowance), uncertain tax positions and interest and penalties.
The Company’s effective income tax rate was 664.6% and 43.9% for the years ended December 31, 2015 and 2014, respectively. Our 2015 effective income tax rate includes non-cash charges associated with the impairment of a certain state net operating loss carryforward and a $3.0 million increase to the valuation allowance applied against the carrying value of our deferred tax attributes. Our 2014 effective income tax rate includes a reduction of income tax expense associated with the reversal of uncertain tax positions (and related interest and penalties) and an increase in deferred tax expense associated with the revaluation of the carrying value of our deferred tax attributes in connection with a realignment of our tax structure. We anticipate that our tax realignment will reduce our future blended state income tax rates, reducing the future economic benefit expected to be realized from our deferred tax attributes at the time of their reversal.
We have net deferred tax assets that have arisen primarily as a result of timing differences, net operating loss carryforwards and tax credits. Our ability to realize a deferred tax asset is based on our ability to generate sufficient future taxable income. As is our practice, we assess, on a routine periodic basis, the estimated future realizability of the gross carrying value of our net deferred tax assets on a more likely than not basis. Our periodic assessments take into consideration both positive evidence (future profitability projections for example) and negative evidence (historical cumulative loss position for example) as it relates to evaluating the future recoverability of our deferred tax assets.
During the fourth quarter of 2015, in connection with our periodic review of the carrying value of our net deferred tax assets, we recorded a non-cash charge of $3.0 million in connection with an increase to the previously established valuation allowance recorded against the gross carrying value of our net deferred tax assets. Subsequent to this adjustment, the recorded valuation allowance against the total gross carrying value of our net deferred tax assets totaled $4.5 million.
The Company considers scheduled reversals of deferred tax liabilities, projected future taxable income, ongoing tax planning strategies and other matters, including the period over which our deferred tax assets will be recoverable, in assessing the need for and the amount of the valuation allowance. In the event that actual results differ from these estimates, or we adjust these estimates in the future periods, further adjustments to our valuation allowance may be recorded, which could materially impact our financial position and net income (loss) in the period of the adjustment.
- 38 -
Table of Contents
Net (Loss) Income. Net loss in 2015 totaled $(4.1) million as compared to net income of $4.1 million in 2014. The change in net income during the comparative fiscal periods is primarily related to the $3.6 million in non-cash charges associated with the Company’s deferred tax assets and associated valuation allowance, the decline in billable consultant utilization (do to the project start delays in 2015), the direct acquisition costs associated with the acquisitions we completed during 2015, legal and advisory fees associated with the consent solicitation contest and the absence of the prior year recovery of $1.5 million in previously recorded Fullscope embezzlement-related expenses.
Results for the Year Ended December 31, 2014 Compared to Results for the Year Ended December 31, 2013
Total Revenue. Total revenue increased by $9.4 million, or 9.1%, to $113.0 million for the year ended December 31, 2014 from $103.6 million for the year ended December 31, 2013. Service revenue increased by $12.0 million, or 14.2%, to $96.6 million for the year ended December 31, 2014 from $84.6 million for the year ended December 31, 2013.
On a year-over-year basis, the increase in service revenue is reflective of the growth we experienced across each of our service offerings in 2014, leading to a comparative increase in billable consultant utilization and an increase in billable consultant headcount. Billable consultant utilization was 76.7% during the year ended December 31, 2014 compared to 72.4% during the year ended December 31, 2013. Billable headcount, excluding contractors, increased by 11, to 324 as of December 31, 2014, compared to 313 as of December 31, 2013.
The growth in 2014 service revenue and the associated increase in utilization was driven by the improved pipeline activity and project signings during the latter stages of 2013 and throughout 2014, which positioned the Company for a strong 2014. In an effort to manage the increased project load, the Company made the decision to leverage external contractors. The use of external contractors increased during the second half of 2014, in an effort to maintain an appropriately scaled workforce necessary to support the delivery demands associated with the growth in our 2014 service revenue.
Total revenue in 2014 increased through the strength of our service revenue growth. Service revenue growth was significant enough to overcome the decrease in comparative year-over-year software revenue. While our software revenue is volatile and subject to the timing of customer purchasing cycles, the decrease in 2014 software revenue is largely attributable to the absence of $2.5 million in PI2-related software revenue recognized during 2013.
The existence of intellectual property (IP) design and build capabilities in our strategic offerings mix has had a positive impact on our lead generation and overall sales activity.
Annualized service revenue per billable consultant, as adjusted for utilization, was consistent at $359 thousand during each of the years ended December 31, 2014 and 2013. Periodic fluctuations in our annualized service revenue per billable consultant metric typically reflect changes in the mix of our service offering revenue generated by our current engagements.
During the year ended December 31, 2014, software revenue totaled $8.1 million, or 7.2% of total revenue, compared to software revenue of $11.6 million, or 11.2% of total revenue, in the year ended December 31, 2013. Our software revenue is primarily related to our resale of Microsoft Dynamics AX ERP software and maintenance. Software revenue is expected to fluctuate on an annual period to period basis dependent upon our customers’ demand for such third-party off-the-shelf software.
In June 2012, Microsoft purchased the Company’s internally developed PI2 software and intellectual property (the “PI2 Solution”) for an aggregate purchase price of $3.25 million. The sale of the PI2 Solution was a significant multiple element contract. This contract included $3.25 million of license consideration and subsequent development and training services. At the time of the sale, we determined that the license did not
- 39 -
Table of Contents
have stand-alone value without the services, and accordingly we accounted for the license and related services as one unit. The Company recognized $2.5 million in PI2 license revenue in the year ended December 31, 2013. The PI2 Solution arrangement was completed during the fourth quarter of 2013 and therefore no future revenue has been generated from the PI2 Solution.
Generally, we are reimbursed for our out-of-pocket expenses incurred in connection with our customers’ consulting projects. Reimbursable expense revenue increased to $8.3 million for the year ended December 31, 2014 compared to $7.4 million for the year ended December 31, 2013. The aggregate amount of reimbursable expenses will fluctuate from period-to-period depending on the number of billable consultants as well the location of our customers, the general fluctuation of travel costs, such as airfare, and the number of our projects that require travel.
The number of customers the Company served during the year ended December 31, 2014 totaled 403, as compared to 387 customers during the year ended December 31, 2013. During the year ended December 31, 2014, we secured first-time engagements with a total of 83 new customers, compared to 92 new customer engagements during 2013.
Cost of Revenue. Cost of revenue primarily consists of project personnel costs principally related to salaries, payroll taxes, employee benefits and travel expenses for personnel dedicated to customer projects. These costs represent the most significant expense we incur in providing our services. In total, cost of revenue increased by $5.7 million, or 8.5%, to $71.6 million in 2014, as compared to $66.0 million in 2013.
The primary drivers of the 2014 increase in total cost of revenue, on an absolute dollar basis, were related to an increase in salary- and fringe-related expenses (primarily associated with the increase in billable consultant headcount), an increase in expense associated with billable consultant revenue share programs (which is directly attributable to the growth in 2014 service revenue) and an increase in contractor expense (as the number of contractors utilized increased by 15 compared to the year ended December 31, 2013). The Company had 34 active contractors at December 31, 2014 compared to 19 active contractors at December 31, 2013.
During the second half of 2014 we increased our reliance on external contractors as a direct result of increased project delivery demands associated with the growth in service revenue. We have in the past (and will continue to do so in the future) utilized contractors as a means to support project delivery needs during periods of growth. The Company has made the decision to utilize external contractors in the short term (sacrificing some margin) to maintain a flexible workforce and more easily respond to customer demand without being required to carry the additional burden of full time employee salary-related costs. The Company maintained 324 billable consultants (excluding contractors) as of the December 31, 2014, compared to 313 billable consultants (excluding contractors) as of December 31, 2013.
Project and personnel costs represented 52.2% and 50.9% of total revenue during the years ended December 31, 2014 and 2013, respectively. The periodic change, as a percentage of total revenue, is primarily related to the increase in comparative compensation-related expenses (salaries and fringe-related expenses) associated with the growth in the billable consultant base and the increase in contractor reliance, partially offset by increased service revenue.
Software costs amounted to $4.4 million during the year ended December 31, 2014 compared to $5.9 million during the year ended December 31, 2013. The decrease in the 2014 software costs is the combined effect of the prior year recognition of PI2-related license revenue and the change in mix of Dynamics AX software resale arrangements being reported on a net basis, as described in more detail above.
Reimbursable expenses increased in 2014, to $8.3 million, as compared to $7.4 million in 2013. The aggregate amount of reimbursable expenses will fluctuate from year-to-year depending on the location of our customers, the general fluctuation of travel costs, such as airfare, and the number of our projects that require travel.
- 40 -
Table of Contents
Gross Profit. Gross profit in 2014 increased by $3.8 million, or 10.1%, to $41.4 million, as compared to $37.6 million in 2013. Gross profit, as a percentage of total revenue (which we generally refer to as gross margin) increased to 36.6%, as compared to 36.3% in 2013.
The comparative year-over-year increase in total gross margin is primarily attributable to the growth in service revenue (as reflected in the 2014 improvement in billable consultant utilization and growth in headcount), which was partially offset by the increased salary-related expenses (resulting from headcount growth), contractor expense and the increase in billable consultant revenue share (directly related to service revenue growth). Service revenue growth, and the associated gross margin generated from the growth, was significant enough to offset the loss of $2.2 million in PI2-related margin contribution recognized during the year ended December 31, 2013.
Service revenue gross margin of 39.0% in the year ended December 31, 2014 increased from service revenue gross margin of 37.7% in 2013. The improvement in our 2014 service revenue gross margin was driven primarily by our 2014 service revenue growth, combined with the year-over-year improvement in our billable consultant utilization rate.
Selling, General and Administrative (“SG&A”) Expense. SG&A expense in 2014 increased to $34.2 million compared with SG&A expense of $31.6 million in 2013. SG&A expense, as a percentage of total revenue, was 30.2% and 30.5% in 2014 and 2013, respectively.
From a comparability perspective, the increase in SG&A expense during the year ended December 31, 2014 is primarily the result of increased salary-related expenses (inclusive of the incremental bonus and commission expense associated with the improvement in financial performance).
Lease Abandonment charge. During the second quarter of 2014, in connection with the quarterly assessment of our lease abandonment charge assumptions (associated with the 2011 abandonment of certain excess corporate facilities), the Company determined that an elimination of the estimated sub-lease income was warranted and, as a result, the Company has recorded a non-cash operating expense of $400 thousand.
Fullscope Embezzlement Loss Recovery. During the second quarter of 2014, the Company reached an agreement with the former Fullscope stockholders settling the Company’s outstanding escrow claims associated with the Fullscope acquisition (the “Settlement Agreement”). Approximately $1.5 million of the settlement proceeds were recorded as a “loss recovery” gain and are included, as a reduction in operating expenses, within the Fullscope embezzlement costs (loss recovery) on our condensed consolidated statement of comprehensive income (loss) during the quarter ended June 30, 2014. As of December 31, 2014, the escrow account had a remaining balance of $250 thousand to cover any potential future sales and use tax exposure that could have arisen from subsequent state inquiry or audit.
Depreciation and Amortization Expense. Depreciation and amortization expense decreased by $(297) thousand, or (24.2)%, to $928 thousand, as compared to $1.2 million in 2013. Amortization expense decreased to $302 thousand in 2014, as compared to $411 thousand in 2013. The decrease in amortization expense during 2014 is the result of a reduction in the amortization expense associated with the intangible assets identified in connection with the Fullscope acquisition. The Company recognizes amortization expense over the periods in which it expects to realize the economic benefit.
Operating Income. The Company’s 2014 operating income increased by $2.7 million, to $7.4 million, compared to $4.7 million in 2013. The 2014 improvement in operating income was primarily attributable to the significant growth in service revenue and associated improvement in billable consultant utilization, combined with the recovery of $1.5 million in previously recorded Fullscope embezzlement-related expenses. These improvements were partially offset by the increase in billable consultant salary-related expenses (including billable consultant revenue share expenses), the decrease in software margin contribution and the non-cash lease abandonment charge in connection with the change in future sublease assumptions, as described above.
- 41 -
Table of Contents
Other Expense, Net. Other expense, net totaled $181 thousand during 2014 compared to $92 thousand in 2013. These expenses primarily represent the net amount of the foreign currency exchange (gains)/losses recognized by the Company during the respective fiscal years.
Income Tax Provision (Benefit). We recorded an income tax provision of $3.2 million and an income tax benefit of $(30.1) million during the years ended December 31, 2014 and 2013, respectively. Our 2014 and 2013 periodic income tax provision amounts were derived based upon federal and state income taxes (at statutory rates), foreign income taxes, changes in deferred tax assets and liabilities (and their related valuation allowance), uncertain tax positions and interest and penalties.
The most significant change impacting our 2013 reported income tax amount related to the reversal of the majority of our previously established valuation allowance against the carrying value of our deferred tax assets. The reversal, which resulted in a tax benefit during the fourth quarter of 2013, totaled $36.2 million and represented the majority of our previously established valuation allowance.
The Company’s effective income tax rate was 43.9% for the year ended December 31, 2014. The Company’s effective income tax rate, prior to the consideration of any changes in the valuation allowance applied against our deferred tax assets was 6.5% in the year ended December 31, 2013. Our 2014 effective income tax rate includes a reduction of income tax expense associated with the reversal of uncertain tax positions (and related interest and penalties) and an increase in deferred tax expense associated with the revaluation of the carrying value of our deferred tax attributes in connection with a realignment of our tax structure. We anticipate that our tax realignment will reduce our future blended state income tax rates, reducing the future economic benefit expected to be realized from our deferred tax attributes at the time of their reversal.
Net Income. Net income in 2014 decreased to $4.1 million as compared to $34.7 million in 2013. The decrease in net income during the comparative fiscal periods is primarily related to the 2013 reversal of a majority of the Company’s previously established valuation allowance against the carrying value of deferred tax attributes. To a lesser extent, the decrease in reported net income during 2014 is also attributable to the comparative increase in 2014 service revenue and the reported $1.5 million loss recovery in connection with the Fullscope Settlement Agreement, which were offset by the decrease in software revenue (and the associated margin contribution), the increase in contractor expense and the increase in the Company’s effective income tax rate (as described above).
Liquidity and Capital Resources
The following table summarizes our cash flow activities for the periods indicated:
| Year Ended December 31 | ||||||||||||
| 2015 | 2014 | 2013 | ||||||||||
| (In Thousands) | ||||||||||||
| Cash flows provided by (used in): |
||||||||||||
| Operating activities |
$ | 3,261 | $ | 5,768 | $ | 4,733 | ||||||
| Investing activities |
(24,467 | ) | (260 | ) | (807 | ) | ||||||
| Financing activities |
6,451 | 976 | (266 | ) | ||||||||
| Effects of exchange rates |
(32 | ) | (37 | ) | 10 | |||||||
|
|
|
|
|
|
|
|||||||
| Total cash (used in) provided by: |
$ | (14,787 | ) | $ | 6,447 | $ | 3,670 | |||||
|
|
|
|
|
|
|
|||||||
As of December 31, 2015, we had cash and cash equivalents of $12.0 million, a $14.8 million decrease from the December 31, 2014 balance of $26.8 million. The primary drivers of the decrease in cash during 2015 are the Zero2Ten, Branchbird and M2 Dynamics acquisitions. Cash consideration paid in connection with the 2015 acquisitions totaled $24.1 million. Additionally, cash decreases were attributed to bonus and commission
- 42 -
Table of Contents
payments related to the Company’s 2014 performance-based incentive programs and premium payments associated with the renewal of annual insurance policies. The Company partially offset these cash outflows through the recurring collection of customer receivables and through the draw down of $5.0 million from our Revolving Credit Facility. Additionally, the earnout agreements entered into in connection with the acquisitions of Zero2Ten, Branchbird and M2 Dynamics may require significant cash payments upon the completion of the earnout periods in 2016 and 2017.
Working capital, which is defined as current assets less current liabilities, decreased $19.1 million, to $15.4 million, as of December 31, 2015, as compared to $34.5 million as of December 31, 2014.
Historically, we have used our operating cash flows, available cash and periodic sales of our common stock to finance ongoing operations and business combinations. We believe that our cash and cash equivalents will be sufficient to finance our working capital needs for at least the next twelve months. We periodically reassess the adequacy of our liquidity position, taking into consideration current and anticipated operating cash flow, anticipated capital expenditures, and possible business combinations. The pace at which we will either generate or consume cash will be dependent upon future operations and the level of demand for our services on an ongoing basis. See “Item 1. — Business, Potential Future Strategies, Transactions and Changes.”
Cash flow from operating activities is driven by collections of fees for our consulting services, reselling of software products and the collection of royalties on software products sold to a third party. Cash used in operations predominantly relates to employee compensation, payments to third party software providers, rent expense and professional fees.
Accrued payroll and related liabilities fluctuate from period to period based on the timing of our normal payroll cycle and the timing of variable compensation payments. Annual components of our variable compensation plans are paid in the first quarter of the following year, causing fluctuations in cash flow from quarter to quarter.
Accounts payable and accrued expenses are most significantly affected by the timing of payments required to be made to third-party software providers in connection with the resale of software products to our customers. While a significant portion of our software sales have historically occurred at the end of the second quarter, the Zero2Ten acquisition is expected to minimize the fluctuations between quarters. Zero2Ten focuses on smaller dollar, higher volume, Dynamics CRM deals, which we do not expect to be influenced by the similar seasonality experience within the Dynamics AX product offering.
Net cash provided by operating activities was $3.3 million in 2015, as compared to net cash provided by operating activities of $5.8 million in 2014 and net cash provided by operating activities of $4.7 million in 2013. The primary components of operating cash flows during 2015 were associated with the contribution of total revenue growth combined with the impact of non-cash charges of $7.9 million (primarily reversal of deferred tax assets, accretion of contingent earnout, depreciation and amortization and amortization of stock-based compensation). The primary components of operating cash flows during 2014 were associated with improved operating performance and receipt of the $1.9 million settlement of the Fullscope acquisition-related escrow, partially offset by the payment of bonus and commissions under our performance-based bonus programs. Additionally, cash flow from operations was influenced by non-cash charges of $5.3 million (primarily changes in deferred income taxes, depreciation, amortization, stock-based compensation expense and changes in lease abandonment assumptions). The primary components of operating cash flow during 2013 were net income of $34.7 million less $(30.4) million related to the reversal of the valuation allowance against the Company’s deferred tax assets and, to a lesser extent, non-cash charges of $3.0 million (consisting primarily of depreciation and amortization, provision for bad debts, and stock-based compensation), partially offset by the increase in accounts receivable of $1.5 million.
- 43 -
Table of Contents
For the year ended December 31, 2015, net cash used in investing activities was $(24.5) million compared to net cash used in investing activities of $(260) thousand in 2014 and net cash used in investing activities of $(807) thousand in 2013. Cash used in investing activities in the year ended December 31, 2015 consisted of the Zero2Ten acquisition, the Branchbird acquisition and the M2 Dynamics acquisition and, to a lesser extent, the purchases of property and equipment. The 2014 uses of cash were driven by the purchase of property and equipment. For the year ended December 31, 2013, net cash used in operating activities was driven by the acquisition of intellectual property and the purchase of property and equipment. Cash used in investing activities in 2014 and 2013 also included capitalized software development costs related to software to be used in the Microsoft Dynamics AX environment.
All capital expenditures are discretionary as the Company currently has no long-term commitments for capital expenditures.
Net cash provided by financing activities was $6.5 million in 2015 and $976 thousand in 2014 compared to net cash used in financing activities of $(266) thousand in 2013. The 2015 activity was driven by the drawdown of funds on the existing credit agreement of $5.0 million. The 2014 and 2013 activities were driven by the repurchase of common stock in the amount of $(967) thousand and $(1.5) million, respectively, returning excess cash balances that were not being invested in organic operations or strategic acquisitions to stockholders, and offset by proceeds received from our employees related to our Employee Stock Purchase Plan and the exercise of employee stock options.
As a result of the above, our combined cash, cash equivalents, and marketable securities (decreased) increased by $(14.8) million, $6.4 million, and $3.7 million in 2015, 2014, and 2013, respectively. The aggregate of our cash, cash equivalents and marketable securities was $12.0 million, $26.8 million, and $20.3 million as of December 31, 2015, 2014, and 2013, respectively.
In September 2013, the Company entered into a secured revolving credit facility (the “Credit Facility”). The Credit Facility was modified through an amendment in December 2015, which increased the borrowing base to $15 million (from the previous $10 million) with an additional accordion feature that allows the Company to request an additional $5.0 million as needed, extending the total credit facility borrowing capacity to $20 million over its three-year term. The Credit Facility is secured by substantially all assets of the Company and its domestic subsidiaries, and is subject to normal covenants. Under the terms of the Credit Facility, any advances will accrue interest at a variable per annum rate of interest equal to the LIBOR Rate plus 1.5%. Interest is due and payable, in arrears, on a monthly basis. The Company will be obligated to pay an annual commitment fee of 0.15% on the daily undrawn balance of the facility. Any amounts outstanding under the Credit Facility will be due on December 21, 2018. The Company has drawn down $5.0 million of this balance as of December 31, 2015.
Off Balance Sheet Arrangements, Contractual Obligations and Contingent Liabilities and Commitments
We do not have any off-balance sheet arrangements that have or are reasonably likely to have a current or future effect on our financial condition, changes in financial condition, revenues or expenses, results of operations, liquidity, capital expenditures or capital resources that are material to investors.
We lease office space under noncancellable operating lease arrangements through 2020. Lease payments were approximately $2.1 million, $1.8 million and $1.7 million for the years ended December 31, 2015, 2014 and 2013, respectively.
- 44 -
Table of Contents
Annual future minimum payments required under operating leases that have an initial or remaining noncancellable lease term in excess of one year and existing purchase obligations are as follows:
| Payments Due By Period | ||||||||||||||||||||
| Contractual Obligations |
Total | Less Than 1 Year |
1 – 3 Years |
3 – 5 Years |
More Than 5 Years |
|||||||||||||||
| (In thousands) | ||||||||||||||||||||
| Contingent earnout agreements |
$ | 10,540 | $ | 7,072 | $ | 3,468 | $ | - | $ | - | ||||||||||
| Line of credit |
$ | 5,000 | $ | - | $ | 5,000 | $ | - | $ | - | ||||||||||
| Operating leases |
$ | 2,711 | $ | 1,521 | $ | 1,106 | $ | 84 | $ | - | ||||||||||
|
|
|
|
|
|
|
|
|
|
|
|||||||||||
| Total |
$ | 18,251 | $ | 8,593 | $ | 9,574 | $ | 84 | $ | - | ||||||||||
|
|
|
|
|
|
|
|
|
|
|
|||||||||||
Recently Issued Accounting Pronouncements
Refer to “Item 8. — Financial Statements and Supplementary Data — Notes to Consolidated Financial Statements — Note 2 — Summary of Significant Accounting Policies” included elsewhere herein for a discussion of recent accounting changes.
| ITEM 7A. | QUANTITATIVE AND QUALITATIVE DISCLOSURES ABOUT MARKET RISK |
Our primary financial instruments include investments in money market funds that are sensitive to market risks and interest rates. The investment portfolio is used to preserve our capital until it is required to fund operations, strategic acquisitions or distributions to stockholders. None of our market-risk sensitive instruments is held for trading purposes. We did not purchase derivative financial instruments in 2015 or 2014. Should interest rates on the Company’s investments fluctuate by 10% the impact would not be material to the Company’s financial condition, results of operations or cash flows.
For the last three years, the impact of inflation and changing prices has not been material on revenues or income from continuing operations.
- 45 -
Table of Contents
| ITEM 8. | FINANCIAL STATEMENTS AND SUPPLEMENTARY DATA |
(a) Consolidated Financial Statements:
The following consolidated financial statements are included in this Form 10-K:
- 46 -
Table of Contents
Report of Independent Registered Public Accounting Firm
Board of Directors and Stockholders
Edgewater Technology, Inc.
Wakefield, Massachusetts
We have audited the accompanying consolidated balance sheets of Edgewater Technology, Inc. (the “Company”) as of December 31, 2015 and 2014 and the related consolidated statements of comprehensive income (loss), stockholders’ equity, and cash flows for each of the three years in the period ended December 31, 2015. These financial statements are the responsibility of the Company’s management. Our responsibility is to express an opinion on these financial statements based on our audits.
We conducted our audits in accordance with the standards of the Public Company Accounting Oversight Board (United States). Those standards require that we plan and perform the audit to obtain reasonable assurance about whether the financial statements are free of material misstatement. An audit includes examining, on a test basis, evidence supporting the amounts and disclosures in the financial statements, assessing the accounting principles used and significant estimates made by management, as well as evaluating the overall financial statement presentation. We believe that our audits provide a reasonable basis for our opinion.
In our opinion, the consolidated financial statements referred to above present fairly, in all material respects, the financial position of Edgewater Technology, Inc. at December 31, 2015 and 2014, and the results of its operations and its cash flows for each of the three years in the period ended December 31, 2015, in conformity with accounting principles generally accepted in the United States of America.
We also have audited, in accordance with the standards of the Public Company Accounting Oversight Board (United States), Edgewater Technology Inc.’s internal control over financial reporting as of December 31, 2015, based on criteria established in Internal Control — Integrated Framework (2013) issued by the Committee of Sponsoring Organizations of the Treadway Commission (COSO) and our report dated March 11, 2016 expressed an unqualified opinion thereon.
/s/ BDO USA, LLP
Boston, Massachusetts
March 11, 2016
- 47 -
Table of Contents
Report of Independent Registered Public Accounting Firm
Board of Directors and Stockholders
Edgewater Technology, Inc.
Wakefield, Massachusetts
We have audited Edgewater Technology, Inc.’s internal control over financial reporting as of December 31, 2015, based on criteria established in Internal Control — Integrated Framework (2013) issued by the Committee of Sponsoring Organizations of the Treadway Commission (the COSO criteria). Edgewater Technology, Inc.’s management is responsible for maintaining effective internal control over financial reporting and for its assessment of the effectiveness of internal control over financial reporting, included in the accompanying Item 9A, Controls and Procedures. Our responsibility is to express an opinion on the company’s internal control over financial reporting based on our audit.
We conducted our audit in accordance with the standards of the Public Company Accounting Oversight Board (United States). Those standards require that we plan and perform the audit to obtain reasonable assurance about whether effective internal control over financial reporting was maintained in all material respects. Our audit included obtaining an understanding of internal control over financial reporting, assessing the risk that a material weakness exists, and testing and evaluating the design and operating effectiveness of internal control based on the assessed risk. Our audit also included performing such other procedures as we considered necessary in the circumstances. We believe that our audit provides a reasonable basis for our opinion.
A company’s internal control over financial reporting is a process designed to provide reasonable assurance regarding the reliability of financial reporting and the preparation of financial statements for external purposes in accordance with generally accepted accounting principles. A company’s internal control over financial reporting includes those policies and procedures that (1) pertain to the maintenance of records that, in reasonable detail, accurately and fairly reflect the transactions and dispositions of the assets of the company; (2) provide reasonable assurance that transactions are recorded as necessary to permit preparation of financial statements in accordance with generally accepted accounting principles, and that receipts and expenditures of the company are being made only in accordance with authorizations of management and directors of the company; and (3) provide reasonable assurance regarding prevention or timely detection of unauthorized acquisition, use, or disposition of the company’s assets that could have a material effect on the financial statements.
Because of its inherent limitations, internal control over financial reporting may not prevent or detect misstatements. Also, projections of any evaluation of effectiveness to future periods are subject to the risk that controls may become inadequate because of changes in conditions, or that the degree of compliance with the policies or procedures may deteriorate.
As indicated in the accompanying Item 9A, Management’s Report on Internal Control over Financial Reporting, management’s assessment of and conclusion on the effectiveness of internal control over financial reporting did not include the internal controls of the M2 Dynamics, Inc. which was acquired on December 21, 2015 and included in the consolidated balance sheet of Edgewater Technology, Inc. as of December 31, 2015, and the related consolidated statement of comprehensive income (loss), stockholders’ equity and cash flows for the year then ended. M2 Dynamics Inc. constituted approximately 19.1% of consolidated assets as of December 31, 2015, and approximately 0.2% and 2.9% of consolidated revenues and consolidated net loss, respectively, for the year then ended. Management did not assess the effectiveness of internal control over financial reporting of this acquisitions because of the timing of the acquisition which was completed on December 21, 2015. Our audit of internal control over financial reporting of Edgewater Technology, Inc. also did not include an evaluation of the internal control over financial reporting of M2 Dynamics Inc.
In our opinion, Edgewater Technology, Inc. maintained, in all material respects, effective internal control over financial reporting as of December 31, 2015, based on the COSO criteria.
- 48 -
Table of Contents
We also have audited, in accordance with the standards of the Public Company Accounting Oversight Board (United States), the consolidated balance sheets of Edgewater Technology, Inc. as of December 31, 2015 and 2014, and the related consolidated statements of comprehensive income (loss), stockholders’ equity, and cash flows for each of the three years in the period ended December 31, 2015 and our report dated March 11, 2016 expressed an unqualified opinion thereon.
/s/ BDO USA, LLP
Boston, Massachusetts
March 11, 2016
- 49 -
Table of Contents
EDGEWATER TECHNOLOGY, INC.
(In Thousands, Except Per Share Data)
| December 31, | ||||||||
| 2015 | 2014 | |||||||
| ASSETS | ||||||||
| Current assets: |
||||||||
| Cash and cash equivalents |
$ | 11,981 | $ | 26,768 | ||||
| Accounts receivable, net of allowance of $150 |
27,753 | 24,654 | ||||||
| Prepaid expenses and other current assets |
704 | 1,053 | ||||||
|
|
|
|
|
|||||
| Total current assets |
40,438 | 52,475 | ||||||
| Property and equipment, net |
824 | 1,029 | ||||||
| Intangible assets, net |
11,990 | 480 | ||||||
| Goodwill |
29,910 | 12,049 | ||||||
| Deferred tax assets, net |
24,032 | 27,170 | ||||||
| Other assets |
230 | 210 | ||||||
|
|
|
|
|
|||||
| Total assets |
$ | 107,424 | $ | 93,413 | ||||
|
|
|
|
|
|||||
| LIABILITIES AND STOCKHOLDERS’ EQUITY | ||||||||
| Current liabilities: |
||||||||
| Accounts payable |
$ | 586 | $ | 315 | ||||
| Accrued liabilities |
15,486 | 16,142 | ||||||
| Short-term portion of contingent earnout consideration |
7,072 | - | ||||||
| Deferred revenue |
2,428 | 1,516 | ||||||
|
|
|
|
|
|||||
| Total current liabilities |
25,572 | 17,973 | ||||||
| Revolving credit facility |
5,000 | - | ||||||
| Long-term portion of contingent earnout consideration |
3,468 | - | ||||||
| Other liabilities |
- | 411 | ||||||
|
|
|
|
|
|||||
| Total liabilities |
34,040 | 18,384 | ||||||
| Commitments and contingencies (Note 13) |
||||||||
| Stockholders’ equity: |
||||||||
| Preferred stock, $0.01 par value; 2,000 shares authorized, no shares issued or outstanding |
- | - | ||||||
| Common stock, $0.01 par value; 48,000 shares authorized, 29,736 shares issued and 11,862 and 11,440 shares outstanding as of December 31, 2015 and 2014, respectively |
297 | 297 | ||||||
| Paid-in capital |
210,324 | 210,989 | ||||||
| Treasury stock, at cost, 17,874 and 18,296 shares at December 31, 2015 and 2014, respectively |
(116,464 | ) | (119,878 | ) | ||||
| Accumulated other comprehensive loss |
(554 | ) | (220 | ) | ||||
| Accumulated deficit |
(20,219 | ) | (16,159 | ) | ||||
|
|
|
|
|
|||||
| Total stockholders’ equity |
73,384 | 75,029 | ||||||
|
|
|
|
|
|||||
| Total liabilities and stockholders’ equity |
$ | 107,424 | $ | 93,413 | ||||
|
|
|
|
|
|||||
See notes to consolidated financial statements.
- 50 -
Table of Contents
EDGEWATER TECHNOLOGY, INC.
CONSOLIDATED STATEMENTS OF COMPREHENSIVE INCOME (LOSS)
(In Thousands, Except Per Share Data)
| Year Ended December 31, | ||||||||||||
| 2015 | 2014 | 2013 | ||||||||||
| Revenue: |
||||||||||||
| Service revenue |
$ | 98,827 | $ | 96,604 | $ | 84,616 | ||||||
| Software revenue |
10,859 | 8,118 | 11,587 | |||||||||
| Reimbursable expenses |
7,018 | 8,267 | 7,353 | |||||||||
|
|
|
|
|
|
|
|||||||
| Total revenue |
116,704 | 112,989 | 103,556 | |||||||||
| Cost of revenue: |
||||||||||||
| Project and personnel costs |
64,258 | 58,912 | 52,741 | |||||||||
| Software costs |
5,838 | 4,444 | 5,890 | |||||||||
| Reimbursable expenses |
7,018 | 8,267 | 7,353 | |||||||||
|
|
|
|
|
|
|
|||||||
| Total cost of revenue |
77,114 | 71,623 | 65,984 | |||||||||
|
|
|
|
|
|
|
|||||||
| Gross profit |
39,590 | 41,366 | 37,572 | |||||||||
| Operating expenses: |
||||||||||||
| Selling, general and administrative |
34,592 | 34,145 | 31,636 | |||||||||
| Direct acquisition costs |
1,754 | - | - | |||||||||
| Consent solicitation expenses |
495 | - | - | |||||||||
| Lease abandonment charge |
- | 400 | - | |||||||||
| Fullscope embezzlement loss recovery |
(250 | ) | (1,529 | ) | - | |||||||
| Depreciation and amortization |
1,517 | 928 | 1,225 | |||||||||
|
|
|
|
|
|
|
|||||||
| Total operating expenses |
38,108 | 33,944 | 32,861 | |||||||||
|
|
|
|
|
|
|
|||||||
| Operating income |
1,482 | 7,422 | 4,711 | |||||||||
| Other expense, net |
2,013 | 181 | 92 | |||||||||
|
|
|
|
|
|
|
|||||||
| (Loss) income before income taxes |
(531 | ) | 7,241 | 4,619 | ||||||||
| Tax provision (benefit) |
3,529 | 3,177 | (30,089 | ) | ||||||||
|
|
|
|
|
|
|
|||||||
| Net (loss) income |
$ | (4,060 | ) | $ | 4,064 | $ | 34,708 | |||||
|
|
|
|
|
|
|
|||||||
| Comprehensive (loss) income: |
||||||||||||
| Currency translation adjustment |
(334 | ) | (66 | ) | (31 | ) | ||||||
|
|
|
|
|
|
|
|||||||
| Total comprehensive (loss) income |
$ | (4,394 | ) | $ | 3,998 | $ | 34,677 | |||||
|
|
|
|
|
|
|
|||||||
| (Loss) income per share: |
||||||||||||
| Basic net (loss) income per share of common stock |
$ | (0.35 | ) | $ | 0.37 | $ | 3.21 | |||||
|
|
|
|
|
|
|
|||||||
| Diluted net (loss) income per share of common stock |
$ | (0.35 | ) | $ | 0.31 | $ | 2.88 | |||||
|
|
|
|
|
|
|
|||||||
| Shares used in computing basic net (loss) income per share of common stock |
11,505 | 11,131 | 10,813 | |||||||||
|
|
|
|
|
|
|
|||||||
| Shares used in computing diluted net (loss) income per share of common stock |
11,505 | 13,090 | 12,031 | |||||||||
|
|
|
|
|
|
|
|||||||
See notes to consolidated financial statements.
- 51 -
Table of Contents
EDGEWATER TECHNOLOGY, INC.
CONSOLIDATED STATEMENTS OF STOCKHOLDERS’ EQUITY
(In Thousands)
|
Common Stock |
Paid-in Capital |
Treasury Stock |
Accumulated Other Comprehensive Loss |
Retained (Deficit) |
Total Stockholders’ Equity |
|||||||||||||||||||||||||||
| Shares | Amount | Shares | Amount | |||||||||||||||||||||||||||||
| BALANCE, January 1, 2013 |
29,736 | $ | 297 | $ | 213,238 | (18,839 | ) | $ | (125,806 | ) | $ | (123 | ) | $ | (54,931 | ) | $ | 32,675 | ||||||||||||||
| Issuance of common stock related to employee stock plans |
- | - | (2,855 | ) | 517 | 4,133 | - | - | 1,278 | |||||||||||||||||||||||
| Repurchases of common stock |
- | - | - | (365 | ) | (1,513 | ) | - | - | (1,513 | ) | |||||||||||||||||||||
| Share-based compensation expense |
- | - | 1,469 | - | - | - | - | 1,469 | ||||||||||||||||||||||||
| Currency translation adjustment |
- | - | - | - | - | (31 | ) | - | (31 | ) | ||||||||||||||||||||||
| Net income |
- | - | - | - | - | - | 34,708 | 34,708 | ||||||||||||||||||||||||
|
|
|
|
|
|
|
|
|
|
|
|
|
|
|
|
|
|||||||||||||||||
| BALANCE, December 31, 2013 |
29,736 | 297 | 211,852 | (18,687 | ) | (123,186 | ) | (154 | ) | (20,223 | ) | 68,586 | ||||||||||||||||||||
| Issuance of common stock related to employee stock plans |
- | - | (2,375 | ) | 534 | 4,275 | - | - | 1,900 | |||||||||||||||||||||||
| Repurchases of common stock |
- | - | - | (143 | ) | (967 | ) | - | - | (967 | ) | |||||||||||||||||||||
| Share-based compensation expense |
- | - | 1,512 | - | - | - | - | 1,512 | ||||||||||||||||||||||||
| Currency translation adjustment |
- | - | - | - | - | (66 | ) | - | (66 | ) | ||||||||||||||||||||||
| Net income |
- | - | - | - | - | - | 4,064 | 4,064 | ||||||||||||||||||||||||
|
|
|
|
|
|
|
|
|
|
|
|
|
|
|
|
|
|||||||||||||||||
| BALANCE, December 31, 2014 |
29,736 | 297 | $ | 210,989 | (18,296 | ) | (119,878 | ) | (220 | ) | (16,159 | ) | 75,029 | |||||||||||||||||||
| Issuance of common stock related to employee stock plans |
- | - | (2,258 | ) | 468 | 3,746 | - | - | 1,488 | |||||||||||||||||||||||
| Repurchases of common stock |
- | - | - | (46 | ) | (332 | ) | - | - | (332 | ) | |||||||||||||||||||||
| Share-based compensation expense |
- | - | 1,593 | - | - | - | - | 1,593 | ||||||||||||||||||||||||
| Currency translation adjustment |
- | - | - | - | - | (334 | ) | - | (334 | ) | ||||||||||||||||||||||
| Net loss |
(4,060 | ) | (4,060 | ) | ||||||||||||||||||||||||||||
|
|
|
|
|
|
|
|
|
|
|
|
|
|
|
|
|
|||||||||||||||||
| BALANCE, December 31, 2015 |
29,736 | $ | 297 | $ | 210,324 | (17,874 | ) | $ | (116,464 | ) | $ | (554 | ) | $ | (20,219 | ) | $ | 73,384 | ||||||||||||||
|
|
|
|
|
|
|
|
|
|
|
|
|
|
|
|
|
|||||||||||||||||
See notes to consolidated financial statements.
- 52 -
Table of Contents
EDGEWATER TECHNOLOGY, INC.
CONSOLIDATED STATEMENTS OF CASH FLOWS
(In Thousands)
| Year Ended December 31, | ||||||||||||
| 2015 | 2014 | 2013 | ||||||||||
| CASH FLOWS FROM OPERATING ACTIVITIES: |
||||||||||||
| Net (loss) income |
$ | (4,060 | ) | $ | 4,064 | $ | 34,708 | |||||
| Adjustments to reconcile net (loss) income to net cash provided by operating activities: |
||||||||||||
| Depreciation and amortization |
1,708 | 1,142 | 1,552 | |||||||||
| Provision for doubtful accounts |
67 | - | (100 | ) | ||||||||
| Deferred income taxes |
3,137 | 3,102 | (30,358 | ) | ||||||||
| Share-based compensation |
1,593 | 1,512 | 1,469 | |||||||||
| Excess tax benefits from stock options |
(295 | ) | (43 | ) | 31 | |||||||
| Lease abandonment |
- | (400 | ) | - | ||||||||
| (Gain) loss on disposal of fixed assets |
(10 | ) | - | 9 | ||||||||
| Accretion of contingent earnout consideration |
1,710 | - | - | |||||||||
| Changes in operating accounts, net of acquisitions: |
||||||||||||
| Accounts receivable |
1,548 | (4,839 | ) | (1,508 | ) | |||||||
| Prepaid expenses and other current assets |
(286 | ) | (119 | ) | 476 | |||||||
| Other assets |
(8 | ) | 44 | (5 | ) | |||||||
| Accounts payable |
100 | (364 | ) | 87 | ||||||||
| Accrued liabilities |
(1,697 | ) | 1,867 | (374 | ) | |||||||
| Deferred revenue |
(246 | ) | (198 | ) | (1,254 | ) | ||||||
|
|
|
|
|
|
|
|||||||
| Net cash provided by operating activities |
3,261 | 5,768 | 4,733 | |||||||||
|
|
|
|
|
|
|
|||||||
| CASH FLOWS FROM INVESTING ACTIVITIES: |
||||||||||||
| Net cash used to acquire Zero2Ten |
(4,643 | ) | - | - | ||||||||
| Net cash used to acquire Branchbird |
(2,755 | ) | - | - | ||||||||
| Net cash used to acquire M2 Dynamics |
(16,736 | ) | - | - | ||||||||
| Acquisition of intellectual property |
- | - | (200 | ) | ||||||||
| Capitalization of product development costs |
- | (40 | ) | (296 | ) | |||||||
| Purchases of property and equipment |
(333 | ) | (220 | ) | (311 | ) | ||||||
|
|
|
|
|
|
|
|||||||
| Net cash used in investing activities |
(24,467 | ) | (260 | ) | (807 | ) | ||||||
|
|
|
|
|
|
|
|||||||
| CASH FLOWS FROM FINANCING ACTIVITIES: |
||||||||||||
| Proceeds from employee stock purchase plans and stock option exercises |
1,488 | 1,900 | 1,278 | |||||||||
| Borrowings under revolving credit facility |
5,000 | |||||||||||
| Excess tax benefits from stock options |
295 | 43 | (31 | ) | ||||||||
| Purchases of treasury stock |
(332 | ) | (967 | ) | (1,513 | ) | ||||||
|
|
|
|
|
|
|
|||||||
| Net cash provided by (used in) financing activities |
6,451 | 976 | (266 | ) | ||||||||
|
|
|
|
|
|
|
|||||||
| Effects of exchange rates on cash |
(32 | ) | (37 | ) | 10 | |||||||
| Net increase in cash and cash equivalents |
(14,787 | ) | 6,447 | 3,670 | ||||||||
| CASH AND CASH EQUIVALENTS, beginning of period |
26,768 | 20,321 | 16,651 | |||||||||
|
|
|
|
|
|
|
|||||||
| CASH AND CASH EQUIVALENTS, end of period |
$ | 11,981 | $ | 26,768 | $ | 20,321 | ||||||
|
|
|
|
|
|
|
|||||||
| SUPPLEMENTAL DISCLOSURES OF CASH FLOW INFORMATION: |
||||||||||||
| Cash paid for interest |
$ | 18 | $ | 16 | $ | - | ||||||
|
|
|
|
|
|
|
|||||||
| Cash paid for income taxes |
$ | 208 | $ | 606 | $ | 266 | ||||||
|
|
|
|
|
|
|
|||||||
| NON-CASH INVESTING AND FINANCING ACTIVITIES: |
||||||||||||
| Issuance of restricted stock awards |
$ | 728 | $ | 678 | $ | 1,051 | ||||||
|
|
|
|
|
|
|
|||||||
See notes to consolidated financial statements.
- 53 -
Table of Contents
EDGEWATER TECHNOLOGY, INC.
NOTES TO CONSOLIDATED FINANCIAL STATEMENTS
| 1. | NATURE OF BUSINESS AND BASIS OF PRESENTATION: |
Edgewater Technology, Inc. (“Edgewater”, the “Company”, “we”, or “our”), headquartered in Wakefield, Massachusetts, helps the C-suite drive transformational change through its unique selection of business and technology services and channel-based solutions.
Classic consulting disciplines (such as business advisory, process improvement, organizational change management, M&A due diligence, and domain expertise) are blended with technical services (such as digital transformation, technical roadmaps, data and analytics services, custom development and system integration) to help organizations leverage investments in legacy IT assets to create new digital business models.
Delivering both on premise and in the cloud, Edgewater offers two major channel-based services. In the Oracle channel, Edgewater Ranzal provides Business Analytics solutions leveraging Oracle EPM, BI and Big Data technologies. In the Microsoft channel, Edgewater Fullscope delivers Dynamics AX ERP, Business Intelligence and CRM solutions primarily in the manufacturing space.
| 2. | SUMMARY OF SIGNIFICANT ACCOUNTING POLICIES: |
The accompanying consolidated financial statements reflect the application of certain significant accounting policies as described in this note and elsewhere in the accompanying consolidated financial statements and notes.
Basis of Presentation –
The consolidated financial statements include the accounts of Edgewater and its wholly-owned subsidiaries. All intercompany transactions have been eliminated in consolidation.
The Company considers events or transactions that occur after the balance sheet date but before the financial statements are issued to provide additional evidence relative to certain estimates or to identify matters that require additional disclosure. The Company did not identify any recognizable events during this period.
Use of Estimates –
Our consolidated financial statements are prepared in accordance with accounting principles generally accepted in the United States of America. These accounting principles require management to make certain estimates, judgments and assumptions that affect the reported amounts of assets, liabilities and disclosure of contingent assets and liabilities at the date of the financial statements and the reported amount of revenues and expenses during the reporting period. These estimates, judgments and assumptions used in preparing the accompanying consolidated financial statements are based upon management’s evaluation of the relevant facts and circumstances as of the date of the consolidated financial statements. Although the Company regularly assesses these estimates, judgments and assumptions used in preparing these consolidated financial statements, actual results could differ from those estimates. Changes in estimates are recorded in the period in which they become known.
Cash and Cash Equivalents –
Cash and cash equivalent balances consist of deposits and investments in money market funds. All highly liquid investments with remaining maturities of three months or less at the date of purchase are considered cash equivalents. The Company’s cash equivalents consisted of $4.1 million in money market funds as of December 31, 2014. The Company had no such cash equivalents as of December 31, 2015.
- 54 -
Table of Contents
EDGEWATER TECHNOLOGY, INC.
NOTES TO CONSOLIDATED FINANCIAL STATEMENTS-(Continued)
| 2. | SUMMARY OF SIGNIFICANT ACCOUNTING POLICIES (Continued): |
Property and Equipment –
Property and equipment are stated at cost, net of accumulated depreciation and amortization. Property and equipment are depreciated on a straight-line basis over the estimated useful lives of the assets, which range from three to ten years. Additions that extend the lives of the assets are capitalized, while repairs and maintenance costs are expensed as incurred.
Product Development Costs –
The Company periodically develops software modules to be used within the Microsoft Dynamics AX environment. Capitalization of qualified software development costs begins upon the establishment of technological feasibility. Amortization of capitalized software development costs, which is recorded as a component of cost of revenue, is provided on a product-by-product basis, beginning upon commercial release of the product, and continuing over the remaining estimated economic life of the product, not to exceed three years. At each balance sheet date, the Company evaluates the unamortized capitalized software development costs for potential impairment by comparing the net unamortized balance to the net realizable value of the products. The Company capitalized a total of $40 thousand in software development costs during the year ended December 31, 2014. No such software development costs were capitalized during the year ended December 31, 2015. Amortization expense of $191 thousand, $214 thousand and $327 thousand has been recorded (within software costs on the consolidated statements of comprehensive income (loss)) during the years ended December 31, 2015, 2014 and 2013, respectively.
Impairment of Long-Lived Assets –
The Company evaluates its long-lived assets for impairment whenever events or changes in circumstances indicate that the carrying amount of such assets may not be recoverable. Impairment is generally assessed by a comparison of cash flows expected to be generated by an asset to its carrying value. If such assets are considered to be impaired, the impairment to be recognized is measured by the amount by which the carrying amount of the asset exceeds its fair value.
Goodwill and Intangible Assets –
Goodwill has an indefinite useful life and is not amortized but is evaluated for impairment annually (the “Annual Impairment Test”) or whenever events or changes in circumstances indicate that the carrying value may not be recoverable. Intangible assets consist primarily of non-compete arrangements, customer relationships and trade names and trademarks. Intangible assets that have finite lives are amortized using either the straight-line method or based on estimated future cash flows to approximate the pattern in which the economic benefit of the asset will be utilized. Amortization is recorded over the estimated useful lives ranging from 1.5 to 6 years and is further described in Note 7.
The Company engages in business activities in one reportable segment, which combines management consulting, technical knowledge, and enterprise management solutions to develop custom technology and business process solutions. The Company has three reporting units (which also constitute our operating segments) for purposes of its allocation of goodwill and performance of its impairment evaluation. The Company aggregates our three individual operating segments into one reportable segment based upon similar economic characteristics and other operating similarities.
- 55 -
Table of Contents
EDGEWATER TECHNOLOGY, INC.
NOTES TO CONSOLIDATED FINANCIAL STATEMENTS-(Continued)
| 2. | SUMMARY OF SIGNIFICANT ACCOUNTING POLICIES (Continued): |
Goodwill is tested for impairment annually at the reporting unit level utilizing the “fair value” methodology. The annual measurement date is December 2. Factors the Company considers important that could trigger an interim review for impairment include, but are not limited to, the following:
| ¡ | Significant under-performance relative to historical or projected future operating results; |
| ¡ | Significant changes in the manner of its use of acquired assets or the strategy for its overall business; |
| ¡ | Significant negative industry or economic trends; |
| ¡ | Significant decline in its stock price for a sustained period; and |
| ¡ | Its market capitalization relative to net book value. |
Goodwill is evaluated for impairment using a two-step process. The first step is to compare the fair value of the reporting unit to the carrying amount of the reporting unit (the “First Step”). If the carrying amount exceeds the fair value, a second step must be followed to calculate potential impairment (the “Second Step”). Otherwise, if the fair value of the reporting unit exceeds the carrying amount, the goodwill is not considered to be impaired as of the measurement date. In its review of the carrying value of the goodwill, the Company determines fair values for the reporting unit using the Income Approach, or more specifically the Discounted Cash Flow Method, and the Market Approach, utilizing the Guideline Company Method. These valuation methods require management to project revenues, operating expenses, working capital investment, capital spending and cash flows for the reporting unit over a multi-year period, as well as determine the weighted average cost of capital to be used as a discount rate. The 2015 analysis confirmed that fair values exceeded carrying values, and therefore no impairment existed, and accordingly, a second step analysis was not deemed necessary.
Revenue Recognition –
Our Company recognizes revenue primarily through the provision of consulting services and the resale of third-party, off the shelf software and maintenance.
We recognize revenue by providing consulting services under written service contracts with our customers. The service contracts we enter into generally fall into three specific categories: time and materials, fixed-price and retainer.
We consider amounts to be earned once evidence of an arrangement has been obtained, services are delivered, fees are fixed or determinable and collectability is reasonably assured. We establish billing terms at the time at which the project deliverables and milestones are agreed. Our standard payment terms are 30 days from invoice date. Out-of-pocket reimbursable expenses charged to customers are reflected as revenue.
When a customer enters into a time and materials, fixed-price or a periodic retainer-based contract, the Company recognizes revenue in accordance with its evaluation of the deliverables in each contract. If the deliverables represent separate units of accounting, the Company then measures and allocates the consideration from the arrangement to the separate units, based on vendor specific objective evidence (“VSOE”) of the value for each deliverable.
The revenue under time and materials contracts is recognized as services are rendered and performed at contractually agreed upon rates. Revenue pursuant to fixed-price contracts is recognized under the proportional performance method of accounting. We routinely evaluate whether revenue and profitability should be recognized in the current period. We estimate the proportional performance on our fixed-price contracts on a monthly basis utilizing hours incurred to date as a percentage of total estimated hours to complete the project. This method is used because reasonably dependable estimates of costs and revenue earned can be made, based on
- 56 -
Table of Contents
EDGEWATER TECHNOLOGY, INC.
NOTES TO CONSOLIDATED FINANCIAL STATEMENTS-(Continued)
| 2. | SUMMARY OF SIGNIFICANT ACCOUNTING POLICIES (Continued): |
historical experience and milestones identified in any particular contract. If we do not have a sufficient basis to measure progress toward completion, revenue is recognized upon completion of performance, subject to any warranty provisions or other project management assessments as to the status of work performed.
Estimates of total project costs are continuously monitored during the term of an engagement. There are situations where the number of hours to complete projects may exceed our original estimate, as a result of an increase in project scope, unforeseen events that arise, or the inability of the client or the delivery team to fulfill their responsibilities. Accordingly, recorded revenues and costs are subject to revision throughout the life of a project based on current information and historical trends. Such revisions may result in increases or decreases to revenue and income and are reflected in the consolidated financial statements in the periods in which they are first identified.
If our initial estimates of the resources required or the scope of work to be performed on a contract are inaccurate, or we do not manage the project properly within the planned time period, a provision for estimated losses on incomplete projects is made. Any known or probable losses on projects are charged to operations in the period in which such losses are determined. A formal project review process takes place quarterly, although projects are evaluated on an ongoing basis. Management reviews the estimated total direct costs on each contract to determine if the estimated amounts are accurate, and estimates are adjusted as needed in the period identified. No material losses were recognized on contracts during the years ended December 31, 2015, 2014 or 2013.
We also perform services on a monthly retainer basis under infrastructure service contracts, which include monthly hosting and support services. Revenue under periodic retainer-based contracts is recognized ratably over the contract period, as outlined within the respective contract. In the event additional services are required, above the minimum retained or contracted amount, then such services are billed on a time and materials basis.
Typically, the Company provides warranty services on its fixed-price contracts related to providing customers with the ability to have any “design flaws” remedied and/or have our Company “fix” routine defects. The warranty services, as outlined in the respective contracts, are provided for a specific period of time after a project is complete. The Company values the warranty services based upon historical labor hours incurred for similar services at standard billing rates. Revenue related to the warranty provisions within our fixed-price contracts is recognized as the services are performed or the revenue is earned. The warranty period is typically for a 30-60 day period after the project is complete.
Customer prepayments, even if nonrefundable, are deferred (classified as deferred revenue) and recognized over future periods as services are performed.
Software revenue represents the resale of certain third-party off-the-shelf software and maintenance and is recorded on a gross basis provided we act as a principal in the transaction, which we have determined based upon several factors including, but not limited to, the fact that we have credit risk and we set the price to the end user. In the event we do not meet the requirements to be considered a principal in the software sale transaction and act as an agent, software revenue will be recorded on a net basis.
Prior to the second quarter of 2013, we recorded substantially all of our software resale revenue on a gross basis (reporting the revenue and cost from the transaction in our consolidated statement of comprehensive income (loss)). However, beginning in the second quarter of 2013, due to changes in the nature of the terms of certain of our Microsoft Dynamics AX software resale arrangements (primarily the risk of credit loss and ability to establish pricing), we began to recognize a portion of our software resale revenue on a net basis (reporting only the net profit from the transaction as revenue in our consolidated statement of comprehensive income (loss)).
- 57 -
Table of Contents
EDGEWATER TECHNOLOGY, INC.
NOTES TO CONSOLIDATED FINANCIAL STATEMENTS-(Continued)
| 2. | SUMMARY OF SIGNIFICANT ACCOUNTING POLICIES (Continued): |
The majority of the software sold by the Company is delivered electronically. For software that is delivered electronically, we consider delivery to have occurred when the customer either (a) takes possession of the software via a download (that is, when the customer takes possession of the electronic data on its hardware), or (b) has been provided with access codes that allow the customer to take immediate possession of the software on its hardware pursuant to an agreement or purchase order for the software.
The Company enters into multiple element arrangements which typically include software, post-contract support (or maintenance), and consulting services. Consistent with the software described above, maintenance that is in the form of a pass through transaction is recognized upon delivery of the software, as all related warranty and maintenance is performed by the primary software vendor and not the Company. Maintenance fee revenue for the Company’s software products, which is inconsequential in all years presented, is recognized ratably over the term of the arrangements, which are generally for a one-year period. The Company has established VSOE with respect to the services provided based on the price charged when the services are sold separately. The Company has established VSOE for maintenance based upon the stated renewal rate.
In June 2012, Microsoft purchased the Company’s internally developed PI2 software and intellectual property (the “PI2 Solution”) for an aggregate purchase price of $3.25 million. The sale of the PI2 Solution was a significant multiple element contract. This contract includes $3.25 million of license consideration and subsequent development and training services. At the time of the sale, we determined that the license did not have stand-alone value without the services, and accordingly we accounted for the license and related services as one unit. Since June 2012, we have recognized the license revenue over the period the expected services are to be performed.
The Company recognized $2.5 million in PI2-related software revenue during the year ended December 31, 2013. As of December 31, 2013, there was no future PI2-related software revenue expected to be recognized as the Company had completed all deliverables required under the associated Microsoft services contracts.
Allowance for Doubtful Accounts –
The Company maintains an allowance for doubtful accounts related to its accounts receivable that have been deemed to have a high risk of uncollectability. Management reviews its accounts receivable balances on a monthly basis to determine if any receivables are potentially uncollectible. Management further analyzes historical collection trends and changes in its customer payment patterns, customer concentration and credit worthiness when evaluating the adequacy of its allowance for doubtful accounts. The Company includes any accounts receivable balances that are deemed to be potentially uncollectible, along with a general reserve, in its overall allowance for doubtful accounts.
Billed and unbilled receivables that are specifically identified as being at risk are provided for with a charge to revenue or bad debts as appropriate in the period the risk is identified.
Based on the information available, management believes the allowance for doubtful accounts is adequate; however, future write-offs could exceed the recorded allowance.
Cost of Services –
Our cost of services is composed primarily of project personnel costs, including direct salaries, payroll taxes, employee benefits, contractor costs and travel expenses for personnel dedicated to customer projects. These costs represent the most significant expense we incur in providing our services.
- 58 -
Table of Contents
EDGEWATER TECHNOLOGY, INC.
NOTES TO CONSOLIDATED FINANCIAL STATEMENTS-(Continued)
| 2. | SUMMARY OF SIGNIFICANT ACCOUNTING POLICIES (Continued): |
Consent Solicitation Expense —
During the fourth quarter 2015, the Company incurred $495 thousand of legal and advisory expenses in connection with its defense against a consent solicitation. No such expenses were incurred in the years ended December 31, 2014 or 2013.
Other Expense, Net –
The following table represents the components of other expense, net:
| Year Ended December 31, | ||||||||||||
| 2015 | 2014 | 2013 | ||||||||||
| (In Thousands) | ||||||||||||
| Interest expense (income), net |
$ | 18 | $ | 15 | $ | (2 | ) | |||||
| Accretion of contingent earnout consideration |
$ | 1,710 | $ | - | $ | - | ||||||
| Loss on foreign exchange transactions |
$ | 285 | $ | 166 | $ | 94 | ||||||
|
|
|
|
|
|
|
|||||||
| Other expense, net |
$ | 2,013 | $ | 181 | $ | 92 | ||||||
|
|
|
|
|
|
|
|||||||
Provision for Taxes –
In determining our current income tax provision, we assess temporary differences resulting from different treatments of items for tax and accounting purposes. These differences result in deferred tax assets and liabilities, which are recorded in our consolidated balance sheets. We evaluate the realizability of our deferred tax assets and assess the need for a valuation allowance on an ongoing basis. In evaluating our deferred tax assets, we consider whether it is more likely than not that the deferred income tax assets will be realized. The ultimate realization of our deferred tax assets depends upon generating sufficient future taxable income during the periods in which our temporary differences either become deductible or expire. This assessment requires significant judgment.
Any future changes in the valuation allowance could result in additional income tax expense (benefit) and reduce or increase stockholders’ equity, and such changes could have a significant impact upon our earnings in the future.
Income tax reserves are based on a determination of whether and how much of a tax benefit taken by the Company in its tax filings or positions is more likely than not realized based on the technical merits of the position. Potential interest and penalties associated with such uncertain tax position is recorded as a component of the income tax provision.
- 59 -
Table of Contents
EDGEWATER TECHNOLOGY, INC.
NOTES TO CONSOLIDATED FINANCIAL STATEMENTS-(Continued)
| 2. | SUMMARY OF SIGNIFICANT ACCOUNTING POLICIES (Continued): |
Earnings Per Share –
A reconciliation of net (loss) income and weighted average shares used in computing basic and diluted net income per share is as follows:
| Year Ended December 31, | ||||||||||||
| 2015 | 2014 | 2013 | ||||||||||
| (In Thousands, Except Per Share Data) |
||||||||||||
| Basic net (loss) income per share: |
||||||||||||
| Net (loss) income applicable to common shares |
$ | (4,060 | ) | $ | 4,064 | $ | 34,708 | |||||
|
|
|
|
|
|
|
|||||||
| Weighted average common shares outstanding |
11,505 | 11,131 | 10,813 | |||||||||
|
|
|
|
|
|
|
|||||||
| Basic (loss) net income per share of common stock |
$ | (0.35 | ) | $ | 0.37 | $ | 3.21 | |||||
|
|
|
|
|
|
|
|||||||
| Diluted net (loss) income per share: |
||||||||||||
| Net (loss) income applicable to common shares |
$ | (4,060 | ) | $ | 4,064 | $ | 34,708 | |||||
|
|
|
|
|
|
|
|||||||
| Weighted average common shares outstanding |
11,505 | 11,131 | 10,813 | |||||||||
| Dilutive effects of stock options and restricted stock awards |
- | 1,959 | 1,218 | |||||||||
|
|
|
|
|
|
|
|||||||
| Weighted average common shares, assuming dilutive effect of stock options |
11,505 | 13,090 | 12,031 | |||||||||
|
|
|
|
|
|
|
|||||||
| Diluted net (loss) income per share of common stock |
$ | (0.35 | ) | $ | 0.31 | $ | 2.88 | |||||
|
|
|
|
|
|
|
|||||||
Share-based awards, inclusive of all grants made under the Company’s equity plans, for which either the stock option exercise price, or the fair value of the restricted share award, exceeds the average market price over the period, have an anti-dilutive effect on earnings per share, and accordingly, are excluded from the diluted computations for all periods presented. Had such shares been included, shares for the diluted computation would have increased by approximately 63 thousand, 47 thousand and 507 thousand in the years ended December 31, 2015, 2014 and 2013, respectively. As of December 31, 2015 and 2014, there were approximately 3.9 million and 3.9 million share-based awards outstanding under the Company’s equity plans, respectively. Options to purchase 1.9 million shares of common stock that were outstanding during the year ended December 31, 2015 were not included in the computation of diluted net loss per share due to the reported periodic loss.
Concentrations of Credit Risk –
Financial instruments that potentially subject the Company to significant concentration of market or credit risk consist principally of cash equivalent instruments and accounts receivable. The Company places its cash balances with reputable financial institutions. Trade receivables potentially subject the Company to credit risk. The Company extends credit to its customers based upon an evaluation of the customer’s financial condition and credit history and generally does not require collateral.
Cash and cash equivalents are maintained at financial institutions and, at times, balances may exceed federally insured limits. We have never experienced any losses related to these balances.
The Company has historically incurred minimal credit losses. No customer balances were in excess of 10% of the Company’s total receivables balance as of December 31, 2015 or 2014.
- 60 -
Table of Contents
EDGEWATER TECHNOLOGY, INC.
NOTES TO CONSOLIDATED FINANCIAL STATEMENTS-(Continued)
| 2. | SUMMARY OF SIGNIFICANT ACCOUNTING POLICIES (Continued): |
For the years ended December 31, 2015, 2014 and 2013, no customer represented 10% or more of the Company’s total revenue or total service revenue. For the years ended December 31, 2015, 2014 and 2013, our five largest customers represented 11.8%, 17.8% and 16.5% of our service revenue in the aggregate, respectively.
Comprehensive Income (Loss) –
Other comprehensive income (loss) consists of periodic currency translation adjustments.
Share-Based Compensation –
The Company recognizes the total fair value of share-based awards as compensation expense, over the requisite employee service period (generally the vesting period of the grant). The Company has used the Black-Scholes option-pricing model to compute the estimated fair value of stock option grants on the date of the award. The Black-Scholes option-pricing model includes assumptions regarding dividend yields, expected volatility, expected option term and risk-free interest rates. The Company estimates expected volatility based upon historical volatility. The risk-free interest rate is based on the U.S. Treasury yield curve in effect at the time of grant. Restricted stock awards are valued at the price of our common stock on the date of the award.
The assumptions used in computing the fair value of share-based awards reflect management’s best estimates but involve uncertainties relating to market and other conditions, many of which are outside of the Company’s control. As a result, if other assumptions or estimates had been used, the share-based compensation expense that was recorded for the years ended December 31, 2015, 2014, and 2013 could have been materially different. Furthermore, if different assumptions are used in future periods, share-based compensation expense could be materially impacted in the future.
Foreign Currency Translation —
The financial statements for Edgewater’s non-U.S. operations use the local currency as the functional currency and are translated to U.S. dollars. For assets and liabilities, the year-end rate is used. For revenues, expenses, gains and losses, the average rate for the period is used. Unrealized currency adjustments in our financial statements are accumulated in equity as a component of accumulated other comprehensive income (loss). Realized net gains (losses) on foreign currency transactions are immaterial and are reflected in earnings.
Recent Accounting Pronouncements —
In May 2014, the Financial Accounting Standards Board (FASB) issued Accounting Standards Update No. 2014-09, Revenue from Contracts with Customers (Topic 606) (ASU 2014-09). ASU 2014-09 outlines a single comprehensive model for entities to use in accounting for revenue arising from contracts with customers and supersedes most current revenue recognition guidance, including industry-specific guidance. This new guidance is effective for annual reporting periods (including interim reporting periods within those periods) beginning after December 15, 2016; early adoption is not permitted. Entities have the option of using either a full retrospective or a modified approach to adopt the guidance. In July 2015, the FASB voted to defer the effective date of this ASU by one year for reporting periods beginning after December 15, 2017, with early adoption permitted as of the original effective date. As a result, the new effective date for the Company will be January 1, 2018. This update could have an impact on the timing and amounts of revenue recognized. Management is currently assessing the impact the adoption of this ASU will have on the Company’s consolidated financial statements.
- 61 -
Table of Contents
EDGEWATER TECHNOLOGY, INC.
NOTES TO CONSOLIDATED FINANCIAL STATEMENTS-(Continued)
| 2. | SUMMARY OF SIGNIFICANT ACCOUNTING POLICIES (Continued): |
In August 2014, FASB issued Accounting Standards Update No. 2014-15, “Disclosure of Uncertainties about an Entity’s Ability to Continue as a Going Concern” (ASU 2014-15), to provide guidance on management’s responsibility in evaluating whether there is substantial doubt about a company’s ability to continue as a going concern and to provide related footnote disclosures. ASU 2014-15 applies to all entities and is effective for annual periods ending after December 15, 2016, and interim periods thereafter, with early adoption permitted. The adoption of ASU 2014-15 is not expected to have a material impact on our financial position, results of operations or cash flows.
In September 2015, FASB issued Accounting Standards Update No. 2015-16, “Simplifying the Accounting for Measurement-Period Adjustments” (ASU 2015-16), to recognize adjustments to provisional amounts that are identified during the measurement period in the reporting period in which the adjustment amounts are determined. ASU 2015-16 applies to all entities and is effective, for all public business entities, for annual periods beginning after December 15, 2015, and interim periods within those years. The adoption of ASU 2015-16 is not expected to have a material impact on our financial position, results of operations or cash flows.
In November 2015, FASB issued Accounting Standards Update No. 2015-17, Income Taxes (Topic 740) Balance Sheet Classification of Deferred Taxes (ASU 2015-17). ASU 2015-17 requires entities to present deferred tax assets and deferred tax liabilities as noncurrent in a classified balance sheet. The ASU simplifies the current guidance, which requires entities to separately present deferred tax assets and deferred tax liabilities as current and noncurrent in a classified balance sheet. The guidance in ASU 2015-17 is required for annual reporting periods beginning after December 15, 2016, including interim periods within the reporting period. We early adopted the provisions of this ASU during the fourth quarter of fiscal year 2015 and applied it retrospectively. The adoption of ASU 2015-17 resulted in the reclassification of $2.0 million of current deferred tax assets to noncurrent deferred tax assets as of December 31, 2015. We retrospectively adjusted the December 31, 2014 consolidated balance sheet and related disclosures to reflect the reclassification of $1.2 million of current deferred tax assets to noncurrent deferred tax assets. Adoption of this standard did not impact results of operations, retained earnings, or cash flows in the current or previous interim and annual reporting periods.
In February 2016, FASB issued ASU No. 2016-02, Leases (Topic 842), which requires companies that are lessees to recognize a right-of-use asset and lease liability for most leases that do not meet the definition of a short-term lease. For income statement purposes, leases will continue to be classified as either operating or financing. Classification will be based on criteria that are largely similar to those applied in current lease accounting. This standard will result in extensive qualitative and quantitative disclosure changes. This standard will be effective for annual reporting periods beginning after December 15, 2018, including interim periods within that reporting period. The Company is currently evaluating the impact of this ASU on its financial position and results of operations.
| 3. | BUSINESS COMBINATIONS: |
M2 Dynamics Inc. (“M2 Dynamics”): On December 21, 2015, the Company acquired substantially all of the assets and certain liabilities of M2 Dynamics Inc., pursuant to the terms of an Asset Purchase Agreement (the “M2 Dynamics Acquisition”). Headquartered in Irvine, California, M2 Dynamics is an Oracle Platinum Partner providing Oracle Enterprise Performance Management (“EPM”) and Business Intelligence (“BI”) solutions and services, primarily to the West Coast and southern regions of the United States. M2 Dynamics will join the Company’s Edgewater Ranzal business in providing clients with information technology consultancy services specializing in Business Analytics and encompassing EPM, BI and Big Data solutions.
- 62 -
Table of Contents
EDGEWATER TECHNOLOGY, INC.
NOTES TO CONSOLIDATED FINANCIAL STATEMENTS-(Continued)
| 3. | BUSINESS COMBINATIONS (Continued): |
The Company initially estimated total fair value of the purchase price consideration to be $19.8 million. The initial cash consideration paid at close consisted of the $16.1 million base purchase price plus $596 thousand attributable to a net working capital adjustment. The initial cash consideration paid by the Company was increased by $3.0 million, representing the adjusted fair value estimate of additional contingent earnout consideration that may be earned M2 Dynamics, which is described in more detail below.
The Company, as of December 31, 2015, has accrued $3.1 million in potential future contingent earnout consideration payable to M2 Dynamics related to the completion of the one-year earnout period. The maximum amount of contingent earnout consideration that M2 Dynamics can earn during the earnout period is capped at $6.6 million.
In addition to the above payments, the Company incurred approximately $801 thousand in direct transaction costs, which was expensed (within direct acquisition costs on the consolidated statement of comprehensive income (loss)) as incurred.
The M2 Dynamics measurement period is expected to be complete during the first quarter of 2016.
In connection with the M2 Dynamics Acquisition, the Company made certain preliminary estimates related to the fair value of assets acquired, liabilities assumed, contingent earnout consideration, identified intangibles and goodwill.
The Company performed a preliminary estimate of fair value allocation of the purchase price among assets, liabilities and identified intangible assets. The preliminary allocation of the purchase price was as follows:
| Total | Life (In Years) | |||||||
| (In Thousands) | ||||||||
| Accounts receivable |
$ | 2,878 | ||||||
| Other assets |
21 | |||||||
| Accounts payable and accrued expenses |
(866 | ) | ||||||
| Customer relationships |
7,700 | 6 Years | ||||||
| Goodwill (deductible for tax purposes) |
10,038 | |||||||
|
|
|
|||||||
| Total purchase price |
$ | 19,771 | ||||||
|
|
|
|||||||
The M2 Dynamics Acquisition was accounted for as a purchase transaction, and accordingly, the results of comprehensive income (loss), commencing December 21, 2015, are included in the Company’s accompanying consolidated statement of comprehensive income (loss).
The Company recorded total revenues of $247 thousand and a net loss of $(118) thousand in its statement of comprehensive income (loss) for the year ended December 31, 2015 related to the M2 Dynamics business.
- 63 -
Table of Contents
EDGEWATER TECHNOLOGY, INC.
NOTES TO CONSOLIDATED FINANCIAL STATEMENTS-(Continued)
| 3. | BUSINESS COMBINATIONS (Continued): |
The following table sets forth supplemental pro forma financial information that assumes the acquisition of M2 Dynamics was completed at the beginning of 2015. The information for the year ended December 31, 2015 includes the historical results of Edgewater and M2 Dynamics. The pro forma results include estimates and assumptions regarding the amortization of intangible assets recognized as part of the acquisition and income taxes. The pro forma results, as presented, are not necessarily indicative of the results that would have occurred if the acquisition had occurred on the date indicated, or that may result in the future.
| Unaudited December 31, |
||||||||
| 2015 | 2014 | |||||||
| (In Thousands) | ||||||||
| Pro forma revenue |
$ | 129,522 | $ | 122,956 | ||||
|
|
|
|
|
|||||
| Pro forma net (loss) income |
(2,679 | ) | 3,565 | |||||
|
|
|
|
|
|||||
| Pro forma basic net (loss) income per share |
$ | (0.23 | ) | $ | 0.32 | |||
|
|
|
|
|
|||||
| Pro forma diluted net (loss) income per share |
$ | (0.23 | ) | $ | 0.27 | |||
|
|
|
|
|
|||||
Acquisition of Branchbird LLC (“Branchbird”): On August 17, 2015, the Company acquired substantially all of the assets and liabilities of Branchbird, pursuant to the terms of an Asset Purchase Agreement (the “Branchbird Acquisition”). Headquartered in Chicago, Illinois, Branchbird delivers Big Data solutions to their clients utilizing the Oracle Endeca and Big Data Discovery (BDD) products. The Branchbird Acquisition extends Ranzal’s presence in the Midwest.
The Company determined the total allocable purchase price consideration to be $4.2 million. The initial cash consideration paid at closing was $2.7 million, net of $19 thousand attributable to a net working capital adjustment. The initial consideration paid by the Company was increased by $1.4 million, representing our initial estimate of the fair value of additional contingent earnout consideration that may be earned by Branchbird, which is described in more detail below. In addition to the above payments, the Company incurred approximately $340 thousand in direct transaction costs, which were expensed (within direct acquisition costs on the consolidated statement of comprehensive income (loss)) during the year ended December 31, 2015.
An earnout agreement was entered into in connection with the Branchbird Acquisition under which Branchbird is eligible to receive additional contingent consideration. Contingent earnout consideration to be paid, if any, to Branchbird will be based upon the achievement of certain performance measures (and is not impacted by continued employment status of Branchbird owners) over two consecutive one-year earnout periods, concluding on August 16, 2017. The Company has estimated the fair value of this obligation on the date of acquisition to be $1.4 million. The maximum amount of contingent earnout consideration that can be earned by Branchbird is capped at $2.4 million. As of December 31, 2015, the Company has recorded an accrual of $1.5 million related to Branchbird contingent earnout consideration.
In connection with the Branchbird Acquisition, the Company made certain estimates related to the fair value of assets acquired, liabilities assumed, contingent earnout consideration, identified intangibles and goodwill.
- 64 -
Table of Contents
EDGEWATER TECHNOLOGY, INC.
NOTES TO CONSOLIDATED FINANCIAL STATEMENTS-(Continued)
| 3. | BUSINESS COMBINATIONS (Continued): |
The Company performed a fair value allocation of the purchase price among assets, liabilities and identified intangible assets. The preliminary allocation of the purchase price was as follows:
| Total | Life (In Years) | |||||||
| (In Thousands) | ||||||||
| Accounts receivable |
$ | 540 | ||||||
| Other assets |
16 | |||||||
| Accounts payable and accrued expenses |
(86 | ) | ||||||
| Customer relationships |
2,100 | 5 | ||||||
| Goodwill (deductible for tax purposes) |
1,613 | |||||||
|
|
|
|||||||
| Total purchase price |
$ | 4,183 | ||||||
|
|
|
|||||||
The Branchbird Acquisition was accounted for as a purchase transaction, and accordingly, the results of operations, commencing August 17, 2015, are included in the Company’s accompanying consolidated statement of comprehensive income (loss). Pro forma financial information related to the Branchbird Acquisition is not presented as the effect of this acquisition was not material to the Company.
Acquisition of Zero2Ten, Inc. (“Zero2Ten”): On March 13, 2015, the Company acquired substantially all of the assets and liabilities of Zero2Ten, pursuant to the terms of an Asset Purchase Agreement (the “Zero2Ten Acquisition”). Headquartered in Alpharetta, Georgia, Zero2Ten is a specialty solution provider of Microsoft’s CRM Cloud product. Zero2Ten has delivered its services to organizations across various vertical markets with an emphasis on manufacturing. The acquisition of Zero2Ten continues our investment in service offerings that complement the Microsoft Dynamics product suite.
The Company determined the total allocable purchase price consideration to be $9.0 million. The initial cash consideration paid at closing was $4.5 million. The cash paid at closing consisted of the $5.0 million purchase price less $457 thousand attributable to a net working capital adjustment. The initial consideration paid by the Company was increased by $4.4 million, representing our initial estimate of the fair value estimate of additional contingent earnout consideration that may be earned by Zero2Ten, which is described in more detail below. In addition to the above payments, the Company incurred approximately $613 thousand in direct transaction costs, which were expensed (within direct acquisition costs on the consolidated statement of comprehensive income (loss)) during the year ended December 31, 2015.
An earnout agreement was entered into in connection with the Zero2Ten Acquisition under which Zero2Ten is eligible to receive additional contingent consideration. Contingent earnout consideration to be paid, if any, to Zero2Ten will be based upon the achievement of certain performance measures (and is not impacted by continued employment status of Zero2Ten shareholders) over two consecutive one-year earnout periods, concluding on March 13, 2017. The Company has estimated the fair value of this obligation on the date of acquisition to be $4.4 million. The maximum amount of contingent earnout consideration that can be earned by Zero2Ten is capped at $8.6 million. As of December 31, 2015, the Company has recorded an accrual of $5.9 million related to Zero2Ten contingent earnout consideration.
In connection with the Zero2Ten Acquisition, the Company made certain estimates related to the fair value of assets acquired, liabilities assumed, contingent earnout consideration, identified intangibles and goodwill.
- 65 -
Table of Contents
EDGEWATER TECHNOLOGY, INC.
NOTES TO CONSOLIDATED FINANCIAL STATEMENTS-(Continued)
| 3. | BUSINESS COMBINATIONS (Continued): |
The Company performed a fair value allocation of the purchase price among assets, liabilities and identified intangible assets. The allocation of the purchase price was as follows:
| Total | Life (In Years) | |||||||
| (In Thousands) | ||||||||
| Accounts receivable |
$ | 1,596 | ||||||
| Other assets |
142 | |||||||
| Deferred revenue |
(1,158 | ) | ||||||
| Accounts payable and accrued expenses |
(580 | ) | ||||||
| Customer relationships |
2,800 | 5 | ||||||
| Goodwill (deductible for tax purposes) |
6,210 | |||||||
|
|
|
|||||||
| Total purchase price |
$ | 9,010 | ||||||
|
|
|
|||||||
The Zero2Ten Acquisition was accounted for as a purchase transaction, and accordingly, the results of operations, commencing March 13, 2015, are included in the Company’s accompanying consolidated statement of comprehensive income (loss). Pro forma financial information related to the Zero2Ten Acquisition is not presented as the effect of this acquisition was not material to the Company.
| 4. | FAIR VALUE MEASUREMENTS: |
The following valuation hierarchy is used for disclosure of the inputs to valuation used to measure fair value. This hierarchy prioritizes the inputs into three broad levels as follows:
| ¡ | Level 1 inputs are quoted prices (unadjusted) in active markets for identical assets or liabilities. |
| ¡ | Level 2 inputs are quoted prices for similar assets and liabilities in active markets or inputs that are observable for the asset or liability, either directly or indirectly through market corroboration, for substantially the full term of the financial instrument. |
| ¡ | Level 3 inputs are unobservable inputs based on our own assumptions used to measure assets and liabilities at fair value. |
A financial asset’s or liability’s classification within the hierarchy is determined based on the lowest level input that is significant to the fair value measurement.
As of December 31, 2015, the Company’s only financial assets and liabilities required to be measured on a recurring basis were its contingent earnout obligations. As of December 31, 2014 and 2013, the Company’s only financial assets and liabilities required to be measured on a recurring basis were its money market investments.
- 66 -
Table of Contents
EDGEWATER TECHNOLOGY, INC.
NOTES TO CONSOLIDATED FINANCIAL STATEMENTS-(Continued)
| 4. | FAIR VALUE MEASUREMENTS (Continued): |
The following table represents the Company’s fair value hierarchy for its financial assets and liabilities required to be measured on a recurring basis:
| Basis of Fair Value Measurements | ||||||||||||||||
| Balance | Quoted Prices in Active Markets for Identical Items (Level 1) |
Significant Other Observable Inputs (Level 2) |
Significant Unobservable Inputs (Level 3) |
|||||||||||||
| (In Thousands) | ||||||||||||||||
| Balance at December 31, 2015: |
||||||||||||||||
| Financial liabilities: |
||||||||||||||||
| Contingent earnout consideration |
$ | 10,540 | $ | - | $ | - | $ | 10,540 | ||||||||
|
|
|
|
|
|
|
|
|
|||||||||
| Total financial liabilities |
$ | 10,540 | $ | - | $ | - | $ | 10,540 | ||||||||
|
|
|
|
|
|
|
|
|
|||||||||
| Balance at December 31, 2014: |
||||||||||||||||
| Financial assets: |
||||||||||||||||
| Money market investment |
$ | 4,084 | $ | 4,084 | $ | - | $ | - | ||||||||
|
|
|
|
|
|
|
|
|
|||||||||
| Total financial assets |
$ | 4,084 | $ | 4,084 | $ | - | $ | - | ||||||||
|
|
|
|
|
|
|
|
|
|||||||||
No financial instruments were transferred into or out of Level 3 classification during the year ended December 31, 2015.
The Company has classified its net liability for contingent earnout considerations relating to its Zero2Ten, Branchbird and M2 Dynamics Acquisitions within Level 3 of the fair value hierarchy because the fair value is determined using significant unobservable inputs, which included probability weighted cash flows. A description of these acquisitions is included within Note 3. The contingent earnout payments for each acquisition are based on the achievement of certain revenue and earnings before interest, taxes, depreciation and amortization targets.
A reconciliation of the beginning and ending Level 3 net liabilities for the nine-month period ended December 31, 2015 is as follows:
| Fair Value Measurements Using Significant Unobservable Inputs (Level 3) |
||||
| (In Thousands) | ||||
| Balance at December 31, 2014 |
$ | - | ||
| Initial estimate of fair value related to Zero2Ten contingent earnout consideration |
4,367 | |||
| Initial estimate of fair value related to Branchbird contingent earnout consideration |
1,428 | |||
| Initial estimate of fair value related to M2 Dynamics contingent earnout consideration |
3,035 | |||
| Accretion of contingent earnout consideration (included within other expense, net) |
1,710 | |||
|
|
|
|||
| Ending balance at December 31, 2015 |
$ | 10,540 | ||
|
|
|
|||
- 67 -
Table of Contents
EDGEWATER TECHNOLOGY, INC.
NOTES TO CONSOLIDATED FINANCIAL STATEMENTS-(Continued)
| 4. | FAIR VALUE MEASUREMENTS (Continued): |
As of December 31, 2015 and December 31, 2014, the fair values of our other financial instruments, which include cash and cash equivalents, accounts receivable and accounts payable, approximate the carrying amounts of the respective asset and/or liability due to the short-term nature of these financial instruments. Borrowings under the Company’s revolving credit facility approximate fair value due to their market rate of interest.
| 5. | ACCOUNTS RECEIVABLE: |
Included in accounts receivable are unbilled amounts totaling approximately $4.8 million and $2.4 million at December 31, 2015 and 2014, respectively, which relate to services performed during the year and billed in the subsequent year. The Company maintains allowances for potential losses which management believes are adequate to absorb any probable losses to be incurred in realizing the accounts receivable amounts recorded in the accompanying consolidated financial statements.
The following are the changes in the allowance for doubtful accounts:
| Year Ended December 31, | ||||||||||||
| 2015 | 2014 | 2013 | ||||||||||
| (In Thousands) | ||||||||||||
| Balance at beginning of year |
$ | 150 | $ | 150 | $ | 250 | ||||||
| Provisions for doubtful accounts |
56 | 47 | 39 | |||||||||
| Charge-offs, net of recoveries |
(56 | ) | (47 | ) | (139 | ) | ||||||
|
|
|
|
|
|
|
|||||||
| Balance at end of year |
$ | 150 | $ | 150 | $ | 150 | ||||||
|
|
|
|
|
|
|
|||||||
| 6. | PROPERTY AND EQUIPMENT: |
Components of property and equipment consisted of the following:
| December 31, | ||||||||
| 2015 | 2014 | |||||||
| (In Thousands) | ||||||||
| Furniture, fixtures and equipment |
$ | 1,683 | $ | 1,553 | ||||
| Computer equipment and software |
1,365 | 1,210 | ||||||
| Leasehold improvements |
3,024 | 3,045 | ||||||
|
|
|
|
|
|||||
| 6,072 | 5,808 | |||||||
| Less accumulated depreciation and amortization |
(5,248 | ) | (4,779 | ) | ||||
|
|
|
|
|
|||||
| Total |
$ | 824 | $ | 1,029 | ||||
|
|
|
|
|
|||||
Depreciation expense related to property and equipment for the years ended December 31, 2015, 2014 and 2013 totaled approximately $618 thousand, $626 thousand and $814 thousand, respectively. The Company disposed of $238 thousand, $378 thousand and $345 thousand of equipment that was no longer in use during 2015, 2014 and 2013, respectively. A gain on disposal of property and equipment of $10 thousand was recognized in the year ended December 31, 2015. A loss on disposal of property and equipment of $9 thousand was recognized in the year ended December 31, 2013. No gain or loss on disposal was recognized during the year ended December 31, 2014.
- 68 -
Table of Contents
EDGEWATER TECHNOLOGY, INC.
NOTES TO CONSOLIDATED FINANCIAL STATEMENTS-(Continued)
| 7. | GOODWILL AND INTANGIBLE ASSETS: |
The changes in the carrying amount of goodwill are as follows:
| Goodwill | ||||
| (In Thousands) | ||||
| Balance at January 1, 2014 |
$ | 12,049 | ||
| Adjustments to goodwill in 2014 |
- | |||
|
|
|
|||
| Balance at December 31, 2014 |
12,049 | |||
| Increases to goodwill in 2015 related to the Zero2Ten, Branchbird and M2 Dynamics Acquisitions |
17,861 | |||
|
|
|
|||
| Balance at December 31, 2015 |
$ | 29,910 | ||
|
|
|
|||
Cumulative goodwill impairment charges of $54.6 million (related to impairments recognized in 2002 and 2008) are reflected in the ending goodwill balance at December 31, 2015.
As of December 31, 2015, the net carrying amount of intangible assets consists of amounts related to business combination transactions consummated by the Company in 2015 and capitalized internally developed software costs.
Other net intangibles amounted to $12.0 million and $480 thousand as of December 31, 2015 and 2014, respectively. Below is a summary of the Company’s identifiable intangible assets that are subject to amortization:
|
|
|
|||||||||||||||
| December 31, 2015 | ||||||||||||||||
| Gross Carrying Amount |
Impairment Charges |
Accumulated Amortization |
Net Carrying Amount |
|||||||||||||
| (In Thousands) | ||||||||||||||||
| Identifiable intangibles: |
||||||||||||||||
| Non-compete agreements |
$ | 3,860 | $ | - | $ | 3,860 | $ | - | ||||||||
| Customer relationships |
22,978 | - | 11,187 | 11,791 | ||||||||||||
| Capitalized product development costs |
1,139 | - | 940 | 199 | ||||||||||||
|
|
|
|
|
|
|
|
|
|||||||||
| $ | 27,977 | $ | - | $ | 15,987 | $ | 11,990 | |||||||||
|
|
|
|
|
|
|
|
|
|||||||||
|
|
|
|||||||||||||||
| December 31, 2014 | ||||||||||||||||
| Gross Carrying Amount |
Impairment Charges |
Accumulated Amortization |
Net Carrying Amount |
|||||||||||||
| (In Thousands) | ||||||||||||||||
| Identifiable intangibles: |
||||||||||||||||
| Non-compete agreements |
$ | 3,860 | $ | - | $ | 3,822 | $ | 38 | ||||||||
| Customer relationships |
10,378 | - | 10,330 | 48 | ||||||||||||
| Capitalized product development costs |
1,139 | - | 745 | 394 | ||||||||||||
|
|
|
|
|
|
|
|
|
|||||||||
| $ | 15,377 | $ | - | $ | 14,897 | $ | 480 | |||||||||
|
|
|
|
|
|
|
|
|
|||||||||
- 69 -
Table of Contents
EDGEWATER TECHNOLOGY, INC.
NOTES TO CONSOLIDATED FINANCIAL STATEMENTS-(Continued)
| 7. | GOODWILL AND INTANGIBLE ASSETS (Continued): |
The intangible assets were identified and valued by the Company. The original estimated useful lives of the acquired identifiable intangible assets are as follows:
| Non-compete agreements |
4 to 5 years | |
| Customer relationships |
4 to 6 years | |
| Capitalized product development costs |
3 years |
Intangible assets are amortized assuming no expected residual value over the periods in which the economic benefit of these assets is consumed. Customer relationships are amortized on an accelerated method based on the proportional relationship of projected future discounted cash flows. The weighted average amortization period for all intangible assets subject to amortization was 5.4 years, 0.5 years and 1.5 years as of December 31, 2015, 2014 and 2013, respectively. Amortization expense related to all intangible assets was $899 thousand, $302 thousand and $738 thousand in 2015, 2014 and 2013, respectively.
Amortization of $191 thousand, $214 thousand and $327 thousand related to capitalized software development costs were included within cost of revenue (specifically within software expense) on the consolidated statements of comprehensive income (loss) for the years ended December 31, 2015, 2014 and 2013, respectively.
Estimated annual amortization expense for the next five years ending December 31, which encompasses the remaining useful life of the intangible assets, is as follows:
| Amortization Expense |
||||
| (In Thousands) | ||||
| 2016 |
$ | 3,612 | ||
| 2017 |
2,804 | |||
| 2018 |
2,240 | |||
| 2019 |
1,712 | |||
| 2020 |
1,057 | |||
| 2021 and thereafter |
565 | |||
|
|
|
|||
| Total |
$ | 11,990 | ||
|
|
|
|||
- 70 -
Table of Contents
EDGEWATER TECHNOLOGY, INC.
NOTES TO CONSOLIDATED FINANCIAL STATEMENTS-(Continued)
| 8. | ACCRUED EXPENSES AND OTHER LIABILITIES: |
Components of accrued expenses consisted of the following:
| December 31, | ||||||||
| 2015 | 2014 | |||||||
| (In Thousands) | ||||||||
| Accrued bonuses |
2,939 | 4,268 | ||||||
| Accrued payroll related liabilities |
2,423 | 2,055 | ||||||
| Accrued vacation |
2,272 | 2,106 | ||||||
| Accrued commissions |
1,496 | 3,012 | ||||||
| Accrued software expense |
1,284 | 820 | ||||||
| Accrued contractor fees |
1,132 | 589 | ||||||
| Accrued professional service fees |
1,016 | 203 | ||||||
| Short-term portion of lease abandonment accrual |
437 | 609 | ||||||
| Deferred rent |
220 | 400 | ||||||
| Income tax related accruals |
318 | 107 | ||||||
| Other accrued expenses |
1,949 | 1,973 | ||||||
|
|
|
|
|
|||||
| Total |
$ | 15,486 | $ | 16,142 | ||||
|
|
|
|
|
|||||
Other long-term liabilities consisted of the Company’s long-term portion of lease abandonment accrual as of December 31, 2014.
| 9. | INCOME TAXES: |
General overview:
The Company is subject to U.S. federal tax as well as income tax in multiple states and local and foreign jurisdictions. The Company’s 2004 through 2014 tax years are open and may be subject to examination by these taxing authorities. Such examinations, if any, could result in challenges to tax positions taken and, accordingly, we may record adjustments to our tax provision based on the outcome of such matters.
The Company has elected to recognize interest and penalties related to income tax matters as a part of the income tax provision (benefit).
For the year ended December 31, 2015, we recorded an income tax provision of $3.5 million compared to an income tax provision of $3.2 million and an income tax benefit of $(30.1) million in the years ended December 31, 2014 and 2013, respectively. The income tax provision recorded during 2015 includes non-cash charges associated with the impairment of a certain state income net operating loss carryforward and a $3.0 million increase to the valuation allowance provided against the carrying value of our deferred tax attributes. The significant tax benefit recognized during 2013 related to the reversal of the majority of the valuation allowance provided against the carrying value of our deferred tax assets.
Deferred tax asset valuation allowance:
As of December 31, 2015, we had gross deferred tax assets of $28.5 million. Our deferred tax assets have arisen as a result of timing differences (primarily generated in connection with historical goodwill and intangible asset impairment charges), net operating loss carryforwards and tax credits. These assets represent amounts that we are able to use to reduce our future taxable income.
- 71 -
Table of Contents
EDGEWATER TECHNOLOGY, INC.
NOTES TO CONSOLIDATED FINANCIAL STATEMENTS-(Continued)
| 9. | INCOME TAXES (Continued): |
We maintained a valuation allowance of $4.5 million and $1.5 million against the carrying value of our gross deferred tax attributes as of December 31, 2015 and 2014, respectively. Prior to December 31, 2013, we maintained a full valuation allowance on our deferred tax assets, reducing the carrying value of these assets on our balance sheet to zero.
We assess the realizability of our deferred tax assets and assess the need for a valuation allowance on an ongoing basis. The periodic assessment of the net carrying value of our deferred tax assets under the applicable accounting rules is judgmental. We are required to consider all available positive and negative evidence in evaluating the likelihood that we will be able to realize the benefit of our deferred tax assets in the future. Such evidence includes scheduled reversals of deferred tax liabilities, projected future taxable income, tax planning strategies and the results of recent operations. Since this evaluation requires consideration of events that may occur some years into the future, there is significant judgment involved, and our conclusion could be materially different should certain of our expectations not transpire.
When assessing all available evidence, we consider the extent to which we have generated pre-tax income or losses over the most recent three-year period to be an important piece of objective evidence. Beginning in 2010, we maintained a full valuation allowance against our net deferred tax assets primarily due to the fact that we had essentially been in a cumulative pre-tax loss position over the most recent three-year period. While there had been a trend of positive evidence that had been strengthening in subsequent years, it was not sufficiently persuasive to outweigh the negative evidence provided by our cumulative pre-tax loss position. During the year ended December 31, 2013, we emerged from a cumulative three year pre-tax loss position, which removed this important piece of negative evidence from our evaluation.
Our assessment for the year ended December 31, 2013 considered the following positive and negative evidence. Based on this evidence, we concluded that it was more likely than not that we would generate sufficient pre-tax income in future periods to utilize substantially all of our deferred tax assets.
Positive Evidence:
| ¡ | We had generated U.S.-based pre-tax income of more than $8.2 million over the previous three years and had utilized some of our available tax assets to reduce tax liabilities that would have otherwise arisen in those periods. |
| ¡ | The majority of our federal net operating loss carryforwards do not expire until 2020. |
| ¡ | Our financial performance had continued to improve. We had reported steady growth in operating income over the previous three years and believed that our financial performance would continue to improve. |
| ¡ | Our forecasts of future taxable income indicated that our pre-tax income and taxable income would increase in the future. |
Negative Evidence:
| ¡ | In the absence of a cumulative loss in the previous three years, the remaining negative evidence consists of our accumulated deficit. |
After consideration of this evidence, we determined that it was unlikely that the losses incurred prior to the year ended December 31, 2011 would be repeated and as a result, we did not place significant weight on the negative evidence provided by our pre-2011 losses.
- 72 -
Table of Contents
EDGEWATER TECHNOLOGY, INC.
NOTES TO CONSOLIDATED FINANCIAL STATEMENTS-(Continued)
| 9. | INCOME TAXES (Continued): |
We believed that our positive evidence was strong. The improved financial performance in previous years was an objectively verifiable piece of positive evidence and was the result of a number of factors that had been present to a greater or lesser extent in prior years but had only gathered sufficient weight during 2013 to deliver objectively verifiable, consistent taxable income.
In light of the fact that the majority of our federal NOLs expire in 2020, a key consideration in our analysis was the Company’s projections of future taxable income. In performing our analysis, we utilized the most updated plans and projections that we used to manage our underlying business and calculated the utilization of our deferred tax assets under a number of scenarios.
The Company, during its 2014 period assessment of the need for a valuation allowance against the carrying value of deferred tax assets, noted that the same historical positive and negative evidence contemplated in our 2013 analysis, in conjunction with the continued improvement in operating performance during 2014, provided the Company with strengthening positive evidence supporting that a full valuation allowance was not required.
During our 2015 periodic assessment of the need for a valuation allowance against the carrying value of our deferred tax assets, we noted a shift in objectively verifiable trends which lessened the strength of our previously identified positive evidence. Specifically, during our assessment, we noted the following positive and negative evidence:
Positive Evidence:
| ¡ | We had generated U.S.-based pre-tax income of more than $8.8 million over the previous three years and had utilized some of our available tax assets to reduce tax liabilities that would have otherwise arisen in those periods. |
| ¡ | Our forecasts of future taxable income indicated that our pre-tax income and taxable income would increase in the future. |
Negative Evidence:
| ¡ | We are reporting a loss in U.S.-based profit before income taxes during 2015 as a result we did not utilize a significant amount of our federal and state net operating loss carryforwards in 2015 as originally expected. |
| ¡ | The majority of our federal net operating loss carryforwards expire in 2020, reducing the time period over which the Company has to generate sufficient income to realize future benefit from the loss carryforward amounts. |
| ¡ | The Company did not achieve 100% of its plans and/or projections in 2015. |
| ¡ | Our forecasts have increased risk associated with operations of newly acquired businesses. |
The Company, in connection with its determination of the future utilization of deferred tax assets, considered various future profitability scenarios. This analysis noted that there existed risk and uncertainty that the Company would be able to fully realize future economic benefit from all of the gross carrying value of its deferred tax attributes based upon the forecasted profitability. Accordingly, the Company recorded an increase of $3.0 million in the valuation allowance applied against the carrying value of its deferred tax assets, reducing the net carrying value to the more likely than not anticipated future economic benefit to be realized from the assets.
Realization of our deferred tax assets is dependent on our generating sufficient taxable income in future periods. Although we believe it is more likely than not that future taxable income would be sufficient to allow us
- 73 -
Table of Contents
EDGEWATER TECHNOLOGY, INC.
NOTES TO CONSOLIDATED FINANCIAL STATEMENTS-(Continued)
| 9. | INCOME TAXES (Continued): |
to recover substantially all of the value of our deferred tax assets, realization is not assured and future events could cause us to change our judgment. In the event that actual results differ from our estimates, or we adjust these estimates in the future periods, further adjustments to our valuation allowance may be recorded, which could materially impact our financial position and net income (loss) in the period of the adjustment.
Income tax provision (benefit):
Significant components of the Company’s income tax provision (benefit) consisted of the following:
| Year Ended December 31, | ||||||||||||
| 2015 | 2014 | 2013 | ||||||||||
| (In Thousands) | ||||||||||||
| Current tax expense: |
||||||||||||
| Federal |
$ | - | $ | - | $ | - | ||||||
| State |
161 | 377 | 234 | |||||||||
| Foreign |
264 | 68 | 95 | |||||||||
|
|
|
|
|
|
|
|||||||
| 425 | 445 | 329 | ||||||||||
| Deferred tax expense (benefit): |
||||||||||||
| Federal |
(544 | ) | 2,092 | 5,088 | ||||||||
| State |
476 | 709 | 748 | |||||||||
| Foreign |
205 | 301 | - | |||||||||
| Change in valuation allowance |
3,000 | - | (36,226 | ) | ||||||||
|
|
|
|
|
|
|
|||||||
| 3,137 | 3,102 | (30,390 | ) | |||||||||
| Unrecognized tax benefit |
(33 | ) | (370 | ) | (28 | ) | ||||||
|
|
|
|
|
|
|
|||||||
| Income tax provision (benefit) |
$ | 3,529 | $ | 3,177 | $ | (30,089 | ) | |||||
|
|
|
|
|
|
|
|||||||
The components of (loss) income before income taxes are as follows:
| Year Ended December 31, | ||||||||||||
| 2015 | 2014 | 2013 | ||||||||||
| Domestic |
$ | (1,875 | ) | $ | 6,259 | $ | 4,477 | |||||
| Foreign |
1,344 | 982 | 142 | |||||||||
|
|
|
|
|
|
|
|||||||
| (Loss) income before income taxes |
$ | (531 | ) | $ | 7,241 | $ | 4,619 | |||||
|
|
|
|
|
|
|
|||||||
In general, it is the practice and intention of the Company to reinvest the earnings of its foreign subsidiary in those operations. However, as of December 31, 2015 the Company’s foreign subsidiary is in a cumulative loss position which results in the tax basis of the subsidiary exceeding its book basis. As a result, no deferred tax asset is necessary to record in the financial statements as this temporary difference is not expected to reverse in the foreseeable future.
- 74 -
Table of Contents
EDGEWATER TECHNOLOGY, INC.
NOTES TO CONSOLIDATED FINANCIAL STATEMENTS-(Continued)
| 9. | INCOME TAXES (Continued): |
The differences in income taxes determined by applying the statutory federal tax rate of 34% to income from continuing operations before income taxes and the amounts recorded in the accompanying consolidated statements of comprehensive income (loss) result from the following:
| Year Ended December 31, | ||||||||||||||||||||||||
| 2015 | 2014 | 2013 | ||||||||||||||||||||||
| Amount | Rate | Amount | Rate | Amount | Rate | |||||||||||||||||||
| (Dollar Amounts In Thousands) | ||||||||||||||||||||||||
| Income tax at statutory rate |
$ | (195 | ) | 34.0 | % | $ | 2,468 | 34.0 | % | $ | 1,570 | 34.0 | % | |||||||||||
| Add (deduct): |
||||||||||||||||||||||||
| State income taxes, net of federal tax benefit |
484 | (84.4 | ) | 556 | 7.7 | 243 | 5.2 | |||||||||||||||||
| Tax rate difference on foreign income taxes |
(36 | ) | 6.2 | 26 | 0.4 | 47 | 1.0 | |||||||||||||||||
| Tax effect of rate change on deferred tax assets |
- | 0.0 | 252 | 3.5 | (169 | ) | (3.6 | ) | ||||||||||||||||
| Non-deductible items |
155 | (27.1 | ) | 112 | 1.6 | 98 | 2.1 | |||||||||||||||||
| Net decrease in deferred tax attributes |
- | - | 183 | 2.5 | 4,370 | 94.6 | ||||||||||||||||||
| Increase (Decrease) in valuation allowance against certain deferred tax assets |
3,000 | (523.8 | ) | - | - | (36,226 | ) | (784.3 | ) | |||||||||||||||
| Unrecognized tax benefits |
(33 | ) | 5.8 | (370 | ) | (5.1 | ) | (28 | ) | (0.6 | ) | |||||||||||||
| Other, net |
154 | (27.0 | ) | (50 | ) | (0.7 | ) | 6 | 0.1 | |||||||||||||||
|
|
|
|
|
|
|
|
|
|
|
|
|
|||||||||||||
| $ | 3,529 | (616.3 | )% | $ | 3,177 | 43.9 | % | $ | (30,089 | ) | (651.5 | )% | ||||||||||||
|
|
|
|
|
|
|
|
|
|
|
|
|
|||||||||||||
Deferred income taxes:
Deferred income taxes reflect the net tax effects of temporary differences between the carrying amounts of assets and liabilities for financial reporting purposes and the amounts used for income tax purposes. Significant components of the Company’s deferred tax assets and liabilities as of December 31, 2015 and 2014 are as follows:
| December 31, | ||||||||
| 2015 | 2014 | |||||||
| (In Thousands) | ||||||||
| Deferred income tax assets: |
||||||||
| Net operating loss carryforwards and credits |
$ | 16,753 | $ | 17,539 | ||||
| Acquired intangible assets |
6,517 | 6,444 | ||||||
| Reserves and accruals |
2,115 | 1,565 | ||||||
| Share-based compensation |
3,092 | 2,877 | ||||||
| Depreciation |
397 | 407 | ||||||
|
|
|
|
|
|||||
| Total deferred income tax assets |
28,874 | 28,832 | ||||||
| Deferred income tax liabilities: |
||||||||
| Acquired intangible assets |
(180 | ) | (18 | ) | ||||
| Other |
(162 | ) | (144 | ) | ||||
|
|
|
|
|
|||||
| Total deferred income tax liabilities |
(342 | ) | (162 | ) | ||||
| Valuation allowance |
(4,500 | ) | (1,500 | ) | ||||
|
|
|
|
|
|||||
| Deferred income tax asset, net |
$ | 24,032 | $ | 27,170 | ||||
|
|
|
|
|
|||||
- 75 -
Table of Contents
EDGEWATER TECHNOLOGY, INC.
NOTES TO CONSOLIDATED FINANCIAL STATEMENTS-(Continued)
| 9. | INCOME TAXES (Continued): |
As of December 31, 2015, the Company elected to early adopt the provisions of FASB Accounting Standards Update No. 2015-17, Income Taxes (Topic 740) Balance Sheet Classification of Deferred Taxes (ASU 2015-17). The adoption of ASU 2015-17 resulted in the reclassification of $2.0 million of current deferred tax assets to noncurrent deferred tax assets as of December 31, 2015. We retrospectively adjusted the December 31, 2014 consolidated balance sheet and related disclosures to reflect the reclassification of $1.2 million of current deferred tax assets to noncurrent deferred tax assets. Adoption of this standard did not impact results of operations, retained earnings, or cash flows in the current or previous interim and annual reporting periods.
Significant deferred tax attributes and current activity within the Company’s deferred tax accounts included the following:
Net Operating Loss Carryforwards and Credits: As of December 31, 2015, we had net operating loss carryforwards for both federal and state income tax purposes of approximately $50.1 million and alternative minimum and worker’s opportunity credits of approximately $2.1 million, which expire at various intervals through 2030. However, $35.8 million of the Company’s federal net operating loss carryforwards and $1.0 million of worker’s opportunity tax credits are set to expire in 2020.
Not included in the federal net operating loss carryforwards are $1.8 million of excess tax deductions from stock option exercises during fiscal 2015, 2014 and 2013. Pursuant to the guidance on accounting for stock-based compensation, the deferred tax asset relating to excess tax benefits from these exercises was not recognized for financial statement purposes. The future benefit from these deductions will be recorded as a credit to additional paid-in capital when taxes payable are reduced on the income tax return.
Additionally, the Internal Revenue Code contains provisions that limit the amount of net operating loss and tax credit carryforwards available to be used in any given year in the event of certain circumstances, including significant changes in ownership interests. These limitations may result in the expiration of our historical net operating loss carryforwards and tax credits prior to their utilization. The Company has various tax-effected net operating loss carryforwards for state income tax purposes of approximately $471 thousand which expire at various intervals through 2035.
- 76 -
Table of Contents
EDGEWATER TECHNOLOGY, INC.
NOTES TO CONSOLIDATED FINANCIAL STATEMENTS-(Continued)
| 9. | INCOME TAXES (Continued): |
Annual changes to the deferred tax valuation allowance are as follows:
| Year Ended December 31, | ||||||||||||
| 2015 | 2014 | 2013 | ||||||||||
| (In Thousands) | ||||||||||||
| Balance, beginning of year |
$ | 1,500 | $ | 1,500 | $ | 37,726 | ||||||
| Additions |
3,000 | - | - | |||||||||
| Reductions, net |
- | - | (36,226 | ) | ||||||||
|
|
|
|
|
|
|
|||||||
| Balance, end of year |
$ | 4,500 | $ | 1,500 | $ | 1,500 | ||||||
|
|
|
|
|
|
|
|||||||
Unrecognized tax benefits:
In accordance with our evaluation of unrecognized tax benefits, we have established a liability representing our estimated amount of unrecognized tax benefits, plus an additional provision for penalties and interest. A reconciliation of the beginning and ending balances of the total amounts of gross unrecognized tax benefits is as follows:
| Year Ended December 31, | ||||||||||||
| 2015 | 2014 | 2013 | ||||||||||
| (In Thousands) | ||||||||||||
| Gross unrecognized tax benefits, beginning of year |
$ | 9 | $ | 108 | $ | 140 | ||||||
| Increase in tax position in current year |
- | - | - | |||||||||
| Settlement/Expiration of statute |
- | - | (32 | ) | ||||||||
| De-recognition through administrative policy |
(9 | ) | (99 | ) | - | |||||||
|
|
|
|
|
|
|
|||||||
| Gross unrecognized tax benefits, end of year |
$ | - | $ | 9 | $ | 108 | ||||||
|
|
|
|
|
|
|
|||||||
The Company’s policy is to recognize accrued interest and penalties related to unrecognized tax benefits and income tax liabilities, when applicable, as part of income tax expense in its consolidated statements of comprehensive income (loss). As of December 31, 2015, there was no accrual for interest and penalties. Accrued interest and penalties totaled $49 thousand as of December 31, 2014.
As of December 31, 2015, we no longer maintain an accrual associated with unrecognized tax benefits. We do not expect our unrecognized tax benefits to change significantly over the next twelve months.
| 10. | EMPLOYEE BENEFIT PLANS: |
The Company has a 401(k) tax deferred savings plan that is available to all employees who satisfy certain minimum hour requirements each year (the “Plan”). The Company matches 30% of each participant’s annual contribution under the Plan, up to 6% of each participant’s annual base salary. Contributions by the Company to the Plan were approximately $684 thousand, $592 thousand and $550 thousand in each of the years ended December 31, 2015, 2014 and 2013.
| 11. | EMPLOYEE SHARE-BASED COMPENSATION PLANS: |
Overview
The total fair value of share-based awards is recognized as a compensation expense, over the requisite employee service period (generally the vesting period of the grant). The Company has used the Black-Scholes
- 77 -
Table of Contents
EDGEWATER TECHNOLOGY, INC.
NOTES TO CONSOLIDATED FINANCIAL STATEMENTS-(Continued)
| 11. | EMPLOYEE SHARE-BASED COMPENSATION PLANS (Continued): |
option-pricing model to compute the estimated fair value of share-based awards on the date of grant. The Black-Scholes option pricing model includes assumptions regarding dividend yields, expected volatility, expected option term and risk-free interest rates. Expected volatility is estimated based upon a combination of historical and implied volatility. The risk-free interest rate is based on the U.S. treasury yield curve in effect at the time of grant.
Share-Based Compensation Plans
The Company has five share-based compensation plans which are described below: the Amended and Restated 1996 Stock Option Plan (“1996 Plan”), the Amended and Restated 2000 Stock Option Plan (“2000 Plan”), the 2003 Equity Incentive Plan (“2003 Plan”), the 2008 Omnibus Incentive Plan (“2008 Plan”), and the 2012 Omnibus Incentive Plan (“2012 Plan”), collectively the “Equity Plans.” Specifics related to each plan are as follows:
1996 Plan: Grants for shares under the 1996 Plan were limited to 15% of the Company’s outstanding common stock. The only grants outstanding under the 1996 Plan are non-qualified stock option grants, with total qualified stock option grants under the 1996 Plan limited to 650,000 shares of the Company’s common stock. No grants of qualified stock options were ever issued under the 1996 Plan. The 1996 Plan expired on June 30, 2006; thus, no further grants have been awarded after June 30, 2006, but options awarded prior to that date remain outstanding subject to the terms of the 1996 Plan and any related option agreements.
2000 Plan: The 2000 Plan provides for grants of non-qualified stock options of the Company’s common stock. The 2000 Plan is limited to grants covering up to 4.0 million shares of the Company’s common stock.
2003 Plan: The 2003 Plan provides for grants of non-qualified stock options and awards of restricted shares of the Company’s common stock. The 2003 Plan is limited to stock option grants and restricted stock awards covering up to 500,000 shares of the Company’s common stock. The 2003 Plan expired on May 22, 2013; thus, no further grants have been awarded after May 22, 2013, but options awarded prior to that date remain outstanding subject to the terms of the 2003 Plan and any related option agreements.
2008 Plan: The 2008 Plan provides for a broad range of awards, including stock options and awards of restricted shares of the Company’s common stock. The 2008 Plan authorizes the issuance of 1.5 million shares of the Company’s common stock. The 2008 Plan became effective on June 11, 2008.
2012 Plan: The 2012 Plan provides for a broad range of awards, including stock options and awards of restricted shares of the Company’s common stock. The 2012 Plan authorizes the issuance of 1.1 million shares of the Company’s common stock. The 2012 Plan became effective on June 6, 2012.
As of December 31, 2015, there are 100,175; 21,702; and 28,197 shares available for future grant under the 2000 Plan, 2008 Plan, and 2012 Plan, respectively. No shares were available for issuance under the 1996 Plan, as it expired on June 30, 2006 or the 2003 Plan, as it expired on May 22, 2013.
The Equity Plans provide that the exercise price of the stock options will be determined based upon the fair market value of the Company’s common stock on the NASDAQ Global Market System as of the date of grant. Options granted to officers and employees generally vest in three-, four- or five-year periods, dependent upon the plan or award, and expire on the seventh anniversary of the grant date. Annual options granted to non-employee members of the Company’s Board of Directors generally vest in equal quarterly increments and expire on the fifth anniversary of the grant date, and option grants issued upon their initial election to the Company’s Board of Directors vest in equal one-third increments as of the date of grant and the first and second anniversary of the date of grant.
- 78 -
Table of Contents
EDGEWATER TECHNOLOGY, INC.
NOTES TO CONSOLIDATED FINANCIAL STATEMENTS-(Continued)
| 11. | EMPLOYEE SHARE-BASED COMPENSATION PLANS (Continued): |
During the years ended December 31, 2015 and 2014, the Company granted options to purchase 304,000 and 352,500 shares of common stock, respectively, principally as part of a long-term incentive program and in connection with the Company’s Board of Directors compensation program. The fair value of each option award is estimated on the date of grant using the Black-Scholes option pricing model utilizing the assumptions noted in the following table. Expected volatility is based upon historical volatility of the Company’s common stock. The expected life (period of time the award will be outstanding) was estimated using the historical exercise behavior of the Company’s employees. The risk-free interest rate is based on the U.S. Treasury yield curve in effect at the time of grant. The Company applied an estimated forfeiture rate of 22.5% (in all periods presented) to the calculated fair value of each option. The applied forfeiture rate utilized by the Company was based upon the historical forfeiture experience of the Equity Plans.
The share-based compensation expense and its classification in the statements of comprehensive income (loss) were as follows:
| Year Ended December 31, | ||||||||||||
| 2015 | 2014 | 2013 | ||||||||||
| (In Thousands) | ||||||||||||
| Project and personnel costs |
$ | 191 | $ | 242 | $ | 276 | ||||||
| Selling, general and administrative |
1,402 | 1,270 | 1,193 | |||||||||
|
|
|
|
|
|
|
|||||||
| Total share-based compensation expense |
$ | 1,593 | $ | 1,512 | $ | 1,469 | ||||||
|
|
|
|
|
|
|
|||||||
The fair value of each option award granted during 2015, 2014 and 2013, was based upon the following weighted-average assumptions:
| Year Ending December 31, | ||||||||||||
| 2015 | 2014 | 2013 | ||||||||||
| Expected volatility |
46.6 | % | 48.0 | % | 47.5 | % | ||||||
| Expected dividend yield |
- | % | - | % | - | % | ||||||
| Expected life (in years) |
3.63 | 3.69 | 3.75 | |||||||||
| Risk-free interest rate |
1.1 | % | 0.8 | % | 0.4 | % | ||||||
The weighted-average grant-date fair value of all options granted (excluding restricted share awards) during the years ended December 31, 2015, 2014 and 2013 was $2.50, $2.53 and $1.51 per share, respectively.
- 79 -
Table of Contents
EDGEWATER TECHNOLOGY, INC.
NOTES TO CONSOLIDATED FINANCIAL STATEMENTS-(Continued)
| 11. | EMPLOYEE SHARE-BASED COMPENSATION PLANS (Continued): |
A summary of stock option activity under the Equity Plans (excluding restricted share awards) is presented below:
| Stock Options: |
Shares Under Options |
Weighted Average Exercise Price Per Share |
Weighted Average Remaining Contractual Term (Years) |
Aggregate Intrinsic Value |
||||||||||||
| (In Thousands) | ||||||||||||||||
| Outstanding at January 1, 2014 |
4,009,028 | 3.89 | ||||||||||||||
| Granted |
352,500 | 6.92 | ||||||||||||||
| Exercised |
(346,189 | ) | 3.69 | |||||||||||||
| Forfeited or expired |
(280,106 | ) | 8.45 | |||||||||||||
|
|
|
|
|
|||||||||||||
| Outstanding at December 31, 2014 |
3,735,233 | $ | 3.85 | 3.51 | $ | 13,667 | ||||||||||
| Granted |
304,000 | 7.05 | ||||||||||||||
| Exercised |
(259,549 | ) | 3.21 | |||||||||||||
| Forfeited or expired |
(29,901 | ) | 3.80 | |||||||||||||
|
|
|
|
|
|||||||||||||
| Outstanding at December 31, 2015 |
3,749,783 | $ | 4.15 | 2.93 | $ | 14,456 | ||||||||||
|
|
|
|
|
|
|
|
|
|||||||||
| Vested and expected to vest at December 31, 2015 |
3,616,886 | $ | 4.07 | 2.83 | $ | 11,974 | ||||||||||
|
|
|
|
|
|
|
|
|
|||||||||
| Exercisable at December 31, 2015 |
3,159,129 | $ | 3.71 | 2.44 | $ | 13,582 | ||||||||||
|
|
|
|
|
|
|
|
|
|||||||||
The total intrinsic value of stock options exercised during 2015, 2014 and 2013 was approximately $1.0 million, $1.2 million and $639 thousand, respectively.
2003 Equity Incentive Plan, 2008 Omnibus Incentive Plan, and 2012 Omnibus Incentive Plan — Restricted Share Awards
The 2003 Plan, the 2008 Plan, and 2012 Plan also authorize the granting of restricted share awards to officers, employees and certain non-employee members of the Board of Directors (the “Restricted Share Plans”). Restricted share awards are made at prices determined by the Compensation Committee of the Company’s Board of Directors (the “Compensation Committee”) and are compensatory in nature. Employees granted restricted share awards are required to provide consideration for the shares at the share price set by the Compensation Committee, which historically has equaled the par value per share of the Company’s common stock ($0.01 per share). Shares of restricted stock generally vest over a 5-year period, during which time the Company has the right to repurchase any unvested shares at the amount paid if the relationship between the employee and the Company ceases. As of December 31, 2015, 168 thousand restricted share awards were subject to repurchase by the Company under the restricted stock agreements. The Company records compensation expense related to restricted share awards on a straight-line basis over the vesting term of the award.
During the years ended December 31, 2015, 2014 and 2013, the Company issued 91,000, 84,800 and 131,380 restricted share awards, respectively, to employees at a purchase price of $0.01 per share. Additionally, the Company recognized share-based compensation expense of $557 thousand, $386 thousand and $178 thousand during the years ended December 31, 2015, 2014 and 2013, respectively related to restricted share awards.
- 80 -
Table of Contents
EDGEWATER TECHNOLOGY, INC.
NOTES TO CONSOLIDATED FINANCIAL STATEMENTS-(Continued)
| 11. | EMPLOYEE SHARE-BASED COMPENSATION PLANS (Continued): |
A summary of non-vested restricted share activity under the Restricted Share Plans is presented below:
| Restricted Share Awards: |
Non-vested Restricted Shares |
Weighted Average Grant Date Fair Value |
||||||
| Non-vested at January 1, 2014 |
126,190 | $ | 4.13 | |||||
| Granted |
84,800 | 7.01 | ||||||
| Vested |
(57,272 | ) | (4.49 | ) | ||||
|
|
|
|
|
|||||
| Non-vested at December 31, 2014 |
153,718 | $ | 5.57 | |||||
| Granted |
91,000 | 7.00 | ||||||
| Vested |
(76,601 | ) | (5.54 | ) | ||||
|
|
|
|
|
|||||
| Non-vested at December 31, 2015 |
168,117 | $ | 6.36 | |||||
|
|
|
|
|
|||||
| Expected to vest at December 31, 2015 |
168,117 | $ | 6.36 | |||||
|
|
|
|
|
|||||
The total fair value of stock awards vested during the years ended December 31, 2015, 2014 and 2013 was $422 thousand, $797 thousand and $55 thousand, respectively.
Employee Stock Purchase Plan
In June 2008, in connection with the Company’s Annual Meeting of Stockholders, the stockholders of the Company approved, and the Company adopted, the Edgewater Technology, Inc. 2008 Employee Stock Purchase Plan (the “2008 ESPP”). The 2008 ESPP became effective on October 1, 2008. The 2008 ESPP, which was amended in June 2011 and June 2015, allows a maximum of 1,700,000 shares of the Company’s common stock to be purchased by Edgewater employees.
The 2008 ESPP offers eligible employees the option to purchase the Company’s common stock at 85% of the lower of the closing price, as quoted on NASDAQ, on either the first trading day or the last trading day of the quarterly purchase period. Enrollment periods occur on January 1 and July 1. Purchases occur every three months. The 2008 ESPP is designed to qualify for certain tax benefits for employees under section 423 of the Internal Revenue Code.
During the years ended December 31, 2015, 2014 and 2013, the Company issued 114,431; 103,401 and 135,100 shares, respectively, to employees under the 2008 ESPP.
The fair value of each 2008 ESPP offering was estimated on the date of grant using the Black-Scholes option pricing model that uses the weighted-average assumptions noted in the following table. The risk-free interest rate is based on the U.S. Treasury yield curve in effect at the time of grant. Expected volatility was based on historical volatility.
| Year Ended December 31, | ||||||||||||
| 2015 | 2014 | 2013 | ||||||||||
| Expected volatility |
32.0 | % | 47.2 | % | 42.7 | % | ||||||
| Expected dividend yield |
- | % | - | % | - | % | ||||||
| Expected life (in years) |
0.25 | 0.25 | 0.25 | |||||||||
| Risk-free interest rate |
0.0 | % | 0.0 | % | 0.1 | % | ||||||
- 81 -
Table of Contents
EDGEWATER TECHNOLOGY, INC.
NOTES TO CONSOLIDATED FINANCIAL STATEMENTS-(Continued)
| 11. | EMPLOYEE SHARE-BASED COMPENSATION PLANS (Continued): |
The weighted-average fair value of the shares issued under the 2008 ESPP in 2015, 2014 and 2013, based upon the assumptions in the preceding table, was $1.54, $1.75 and $1.05, respectively.
Compensation Expense
As of December 31, 2015, unrecognized compensation expense, net of estimated forfeitures, related to the unvested portion of all share-based compensation arrangements was approximately $1.7 million and is expected to be recognized over a weighted average period of 1.2 years.
The Company is using previously purchased treasury shares for all shares issued for options, restricted share awards and 2008 ESPP issuances. Shares may also be issued from authorized but unissued shares.
| 12. | CAPITAL STOCK: |
Common and Preferred Stock-
The Company’s stockholders had authorized 48.0 million shares of common stock available for issuance as of December 31, 2015 and 2014, and had 2.0 million shares of preferred stock available for issuance as of December 31, 2015 and 2014.
Stock Repurchase Program-
In December 2007, our Board of Directors (the “Board”) authorized a stock repurchase program for up to $5.0 million of common stock on the open market or through privately negotiated transactions from time-to-time through December 31, 2008 (the “Stock Repurchase Program”). The Board subsequently amended the Stock Repurchase Program, authorizing both an increase to and an extension of the Stock Repurchase Program. The Stock Repurchase Program, as amended, had a maximum purchase value of shares of $23.1 million (the “Purchase Authorization”) and was set to expire on September 19, 2014 (the “Repurchase Period”). On September 18, 2014, we announced that the Board had approved an extension of the Repurchase Period to September 25, 2015, and on September 17, 2015, we announced that the Board had approved a further extension of the Repurchase Period to September 23, 2016.
The timing and amount of the purchases will be based upon market conditions, securities law considerations and other factors. The Stock Repurchase Program does not obligate the Company to acquire a specific number of shares in any period and may be modified, suspended, extended or discontinued at any time, without prior notice.
The Company repurchased a total of 46 thousand and 143 thousand shares of common stock during the years ended December 31, 2015 and 2014, respectively, at an aggregate purchase price of $332 thousand and $967 thousand, respectively.
- 82 -
Table of Contents
EDGEWATER TECHNOLOGY, INC.
NOTES TO CONSOLIDATED FINANCIAL STATEMENTS-(Continued)
| 13. | COMMITMENTS AND CONTINGENCIES: |
Commitments. We lease office space and certain equipment under operating leases that expire at various times through 2020. Future minimum lease payments required under operating leases that have initial or remaining non-cancelable lease terms in excess of one year as of December 31, 2015, were as follows:
| Year Ending December 31, | Abandoned Lease |
Operating Leases |
||||||
| (In Thousands) | ||||||||
| 2016 |
$ | 411 | $ | 1,110 | ||||
| 2017 |
- | 377 | ||||||
| 2018 |
- | 382 | ||||||
| 2019 |
- | 347 | ||||||
| Thereafter |
- | 84 | ||||||
|
|
|
|
|
|||||
| $ | 411 | $ | 2,300 | |||||
|
|
|
|
|
|||||
Rent payments under operating leases were $2.1 million, $1.8 million and $1.7 million for the years ended December 31, 2015, 2014 and 2013, respectively.
Contingencies. We are sometimes a party to litigation incidental to our business. We believe that these routine legal proceedings will not have a material adverse effect on our financial position. We are not involved in any legal proceedings which would be material to our consolidated financial statements. We maintain insurance in amounts with coverages and deductibles that we believe are reasonable. However, there can be no assurance that such coverages will continue to be available on reasonable terms or will be available in sufficient amounts to cover possible claims that may arise in the future, or that our insurers will not disclaim coverage as to any future claim. The successful assertion of one or more claims against the Company that exceed available insurance coverages or changes in the Company’s insurance policies, including premium increases or the imposition of a large deductible or co-insurance requirements, could have a material adverse effect on the Company’s business, results of operations and financial condition.
The Company had approximately $58 thousand of unrecognized tax benefits, penalties and interest expense related to uncertain tax positions as of December 31, 2014. The Company had no unrecognized tax benefits, penalties or interest expense related to uncertain tax positions as of December 31, 2015.
| 14. | REVOLVING CREDIT FACILITY |
In September 2013, the Company entered into a secured revolving credit facility (the “Credit Facility”). The Credit Facility was modified through an amendment in December 2015, which increased the borrowing base to $15 million (from the previous $10 million) with an additional accordion feature that allows the Company to request an additional $5.0 million as needed, extending the total credit facility borrowing capacity to $20 million over its three-year term. The Credit Facility is collateralized by substantially all assets of the Company and its domestic subsidiaries, and is subject to certain financial covenants. Under the terms of the Credit Facility, any advances will accrue interest at a variable per annum rate of interest equal to the LIBOR Rate plus 1.5%. Interest is due and payable, in arrears, on a monthly basis. The Company will be obligated to pay an annual commitment fee of 0.15% on the daily undrawn balance of the facility. Any amounts outstanding under the Credit Facility will be due on December 21, 2018. The Company has drawn down $5.0 million of this balance as of December 31, 2015.
| 15. | SALE OF INTELLECTUAL PROPERTY |
In June 2012, Microsoft purchased Edgewater Fullscope’s PI2 software and intellectual property for an aggregate of $3.25 million. The sale of PI2 also included services and represents a significant multiple element
- 83 -
Table of Contents
EDGEWATER TECHNOLOGY, INC.
NOTES TO CONSOLIDATED FINANCIAL STATEMENTS-(Continued)
| 15. | SALE OF INTELLECTUAL PROPERTY (Continued) |
contract which the Company entered into during the second quarter of 2012. This contract includes $3.25 million of license consideration and subsequent development and training services. We determined that the license did not have stand-alone value without the services, and thus the license and services were accounted for as one unit, with revenue associated with the Microsoft IP Sale recognized in direct proportion to the actual periodic services performed, as compared to the anticipated development services to be performed over the duration of the agreement. We allocated revenue to each element in the multiple-element arrangement based on the element’s respective fair value, with the fair value determined by the price charged when that element is sold separately. We recognized $2.5 million and $788 thousand of license-related revenue, reported as Software revenue in our consolidated statement of comprehensive income (loss), during the years ended December 31, 2013 and 2012, respectively. We completed all deliverable required in the PI2-related services contracts as of December 31, 2013. Accordingly, no PI2-related software or service revenue will be recognized after December 31, 2013.
| 16. | GEOGRAPHIC INFORMATION |
Net sales to unaffiliated customers by geographic area were as follows:
| For the Years Ending December 31, | ||||||||||||
| 2015 | 2014 | 2013 | ||||||||||
| United States |
$ | 100,730 | $ | 103,446 | $ | 91,767 | ||||||
| Canada |
11,377 | 6,572 | 7,512 | |||||||||
| Other International |
4,598 | 2,971 | 4,278 | |||||||||
|
|
|
|
|
|
|
|||||||
| Total Revenue |
$ | 116,704 | $ | 112,989 | $ | 103,556 | ||||||
|
|
|
|
|
|
|
|||||||
Substantially all of the Company’s long-lived assets are located within the United States.
| 17. | UNAUDITED SUPPLEMENTARY QUARTERLY FINANCIAL INFORMATION: |
The following tables set forth certain unaudited supplementary quarterly financial information for the years ended December 31, 2015 and 2014. The quarterly operating results are not necessarily indicative of future results of operations.
| 2015 | ||||||||||||||||||||
| 1st Quarter | 2nd Quarter | 3rd Quarter | 4th Quarter | Total | ||||||||||||||||
| (In Thousands, Except Per Share Data) | ||||||||||||||||||||
| Total revenue |
$ | 26,578 | $ | 30,527 | $ | 31,184 | $ | 28,415 | $ | 116,704 | ||||||||||
| Gross profit |
$ | 7,645 | $ | 10,413 | $ | 11,756 | $ | 9,776 | $ | 39,590 | ||||||||||
| Net (loss) income |
$ | (940 | ) | $ | 494 | $ | 1,027 | $ | (4,641 | )(1) | $ | (4,060 | ) | |||||||
| Basic (loss) income per share |
$ | (0.08 | ) | $ | 0.04 | $ | 0.09 | $ | (0.40 | ) | $ | (0.35 | ) | |||||||
| Diluted (loss) income per share |
$ | (0.08 | ) | $ | 0.04 | $ | 0.08 | $ | (0.40 | ) | $ | (0.35 | ) | |||||||
| 2014 | ||||||||||||||||||||
| 1st Quarter | 2nd Quarter | 3rd Quarter | 4th Quarter | Total | ||||||||||||||||
| (In Thousands, Except Per Share Data) | ||||||||||||||||||||
| Total revenue |
$ | 27,614 | $ | 29,222 | $ | 28,729 | $ | 27,424 | $ | 112,989 | ||||||||||
| Gross profit |
$ | 10,107 | $ | 10,886 | $ | 10,416 | $ | 9,957 | $ | 41,366 | ||||||||||
| Net income |
$ | 711 | $ | 1,721 | $ | 976 | $ | 656 | $ | 4,064 | ||||||||||
| Basic income per share |
$ | 0.06 | $ | 0.15 | $ | 0.09 | $ | 0.06 | $ | 0.37 | ||||||||||
| Diluted income per share |
$ | 0.06 | $ | 0.13 | $ | 0.08 | $ | 0.05 | $ | 0.31 | ||||||||||
| (1) | The Company’s fourth quarter 2015 net loss includes $3.6 million of expense associated with the increase to the valuation allowance applied against the carrying value of its deferred tax attributes and the impairment of certain state net operating loss carryforwards. |
- 84 -
Table of Contents
| ITEM 9. | CHANGES IN AND DISAGREEMENTS WITH ACCOUNTANTS ON ACCOUNTING AND FINANCIAL DISCLOSURE |
None.
| ITEM 9A. | CONTROLS AND PROCEDURES |
Evaluation of Disclosure Controls and Procedures
We maintain disclosure controls and procedures, which we have designed to ensure that material information related to the Company, including our consolidated subsidiaries, is properly identified and evaluated on a regular basis and disclosed in accordance with all applicable laws and regulations. In response to applicable laws and regulations, we reviewed our disclosure controls and procedures. We also established a disclosure committee, which consists of certain members of our senior management. The President and Chief Executive Officer and the Chief Financial Officer of Edgewater Technology, Inc. (its principal executive officer and principal financial officer, respectively) have concluded, based on their evaluations as of the end of the period covered by this Report, that the Company’s disclosure controls and procedures are effective to ensure that information required to be disclosed by the Company in the reports filed or submitted by it under the Securities Exchange Act of 1934, as amended, is recorded, processed, summarized and reported within the time periods specified in the Securities and Exchange Commission rules and forms, and include controls and procedures designed to ensure that information required to be disclosed by the Company in such reports is accumulated and communicated to the Company’s management as appropriate to allow timely decisions regarding required disclosure.
Management’s Report on Internal Control over Financial Reporting
Our management is responsible for establishing and maintaining adequate internal control over financial reporting, as such term is defined in Exchange Act Rules 13a-15(f) and 15d-15(f). In fulfilling this responsibility, estimates and judgments by management are required to assess the expected benefits and related costs of control procedures. The objectives of internal control include providing management with reasonable, but not absolute, assurance that assets are safeguarded against loss from unauthorized use or disposition, and that transactions are executed in accordance with management’s authorization and recorded properly to permit the preparation of consolidated financial statements in conformity with accounting principles generally accepted in the United States of America. Under the supervision and with the participation of our management, including our principal executive officer and principal financial officer, we conducted an evaluation of the effectiveness of our internal control over financial reporting based on the framework in Internal Control — Integrated Framework (2013) issued by the Committee of Sponsoring Organizations of the Treadway Commission. Based on our assessment under those criteria, management concluded that the Company’s internal control over financial reporting was effective as of December 31, 2015.
Management’s assessment of and conclusion on the effectiveness of internal control over financial reporting did not include the internal controls of the M2 Dynamics, Inc. acquisition completed during fiscal 2015. This excluded acquisition constituted approximately 19.1% of consolidated assets as of December 31, 2015, and approximately 0.2% and 2.9% of consolidated revenues and consolidated net loss, respectively, for the year then ended. Management did not assess the effectiveness of internal control over financial reporting of this acquisition because of the timing of the acquisition, which was completed during fiscal 2015.
The attestation report concerning the effectiveness of our internal control over financial reporting as of December 31, 2015 issued by BDO USA, LLP, an independent registered public accounting firm, appears in Item 8 of this Annual Report on Form 10-K.
- 85 -
Table of Contents
Changes in Controls and Procedures
There were no changes in the Company’s internal control over financial reporting, as such term is defined in Rules 13a-15(f) and 15d-15(f) under the Exchange Act during the quarter ended December 31, 2015 that have materially affected, or are reasonably likely to materially affect, our internal control over financial reporting.
| ITEM 9B. | OTHER INFORMATION |
None.
- 86 -
Table of Contents
| ITEM 10. | DIRECTORS, EXECUTIVE OFFICERS AND CORPORATE GOVERNANCE |
Information required by Part III of the Annual Report on Form 10-K is omitted from this report because we will file a definitive proxy statement in accordance with Regulation 14A of the SEC’s rules on or before April 29, 2016. These items include:
| (a) | The information called for by Item 10 of the Annual Report on Form 10-K involving Item 401 of Regulation S-K is incorporated by reference to the material under the captions “Election of Directors — Nominees for Election” and “Executive Officers” in our proxy statement for our Annual Meeting of Stockholders to be held on June 15, 2016. |
| (b) | The information called for by Item 10 of the Annual Report on Form 10-K involving Item 405 of Regulation S-K is incorporated by reference to the material under the caption “Stock Ownership — Section 16 (a) Beneficial Ownership Reporting Compliance” in our proxy statement for our Annual Meeting of Stockholders to be held on June 15, 2016. |
| (c) | The information called for by Item 10 of the Annual Report on Form 10-K involving Item 406 of Regulation S-K is incorporated by reference to the material under the caption “Corporate Governance — Code of Ethics” in our proxy statement for our Annual Meeting of Stockholders to be held on June 15, 2016. |
| (d) | The information called for by Item 10 of the Annual Report on Form 10-K involving paragraphs (c)(3), (d)(4) and (d)(5) of Item 407 of Regulation S-K is incorporated by reference to the material under caption “Corporate Governance — Board and Board Committee Matters” in our proxy statement for our Annual Meeting of Stockholders to be held on June 15, 2016. |
| ITEM 11. | EXECUTIVE COMPENSATION |
The information called for by Item 11 of the Annual Report on Form 10-K for management remuneration involving Item 402 of Regulation S-K and paragraphs (e)(4) and (e)(5) of Item 407 of Regulation S-K is incorporated herein by reference to the material under the captions “Corporate Governance — Compensation of Outside Directors”, “Corporate Governance — Outside Directors Compensation Table for 2015,” “Corporate Governance — Compensation Committee Interlocks and Insider Participation,” “Compensation Committee Report,” “Compensation Discussion and Analysis” and “Compensation of Named Executive Officers” in our proxy statement for our Annual Meeting of Stockholders to be held on June 15, 2016.
The “Compensation Committee Report” contained in our proxy statement shall not be deemed “soliciting material” or “filed” with the SEC or otherwise subject to the liabilities of Section 18 of the Securities Exchange Act of 1934, nor shall it be deemed incorporated by reference in any filings under the Securities Act of 1933 or the Exchange Act, except to the extent we specifically request that such information be treated as soliciting material or specifically incorporate such information by reference into a document filed under the Securities Act or Exchange Act.
| ITEM 12. | SECURITY OWNERSHIP OF CERTAIN BENEFICIAL OWNERS AND MANAGEMENT AND RELATED STOCKHOLDER MATTERS |
The information called for by Item 12 of the Annual Report on Form 10-K involving Item 201(d) of Regulation S-K and Item 403 of Regulation S-K for the securities authorized under equity compensation plans and security ownership of certain beneficial owners and management, respectively, is incorporated herein by reference to the material under the captions “Equity Compensation Plans” and “Stock Ownership — Beneficial Ownership of Certain Stockholders, Directors and Executive Officers,” respectively, in our proxy statement for our Annual Meeting of Stockholders to be held on June 15, 2016.
- 87 -
Table of Contents
| ITEM 13. | CERTAIN RELATIONSHIPS AND RELATED TRANSACTIONS, AND DIRECTOR INDEPENDENCE |
The information called for by Item 13 of the Annual Report on Form 10-K involving Item 404 of Regulation S-K and Item 407(a) of Regulation S-K is incorporated herein by reference to the material under the captions “Certain Relationships and Related Transactions” and “Corporate Governance — Board and Board Committee Matters” in our proxy statement for our Annual Meeting of Stockholders to be held on June 15, 2016.
| ITEM 14. | PRINCIPAL ACCOUNTING FEES AND SERVICES |
The information called for by Item 9(e) of Schedule 14A is incorporated herein by reference to the material under the captions “Corporate Governance — Board and Board Committee Matters — Audit Committee”, “Policy on Audit Committee Pre-Approval of Audit and Non-Audit Services of Independent Auditor” and “Audit Fees and Non-Audit Services” in our proxy statement for our Annual Meeting of Stockholders to be held on June 15, 2016.
- 88 -
Table of Contents
| ITEM 15. | EXHIBITS, FINANCIAL STATEMENT SCHEDULES |
| 1. | Financial Statements required by Item 15 are included and indexed in Part II, Item 8. | |||
| 2. | Financial Statement Schedules included in Part IV of this report. Schedule II is omitted because the information is included in the Notes to Consolidated Financial Statements. All other schedules under the accounting regulations of the SEC are not required under the related instructions or are inapplicable and, thus have been omitted. | |||
| 3. | See “Exhibit Index” on the following pages. | |||
- 89 -
Table of Contents
Pursuant to the requirements of Section 13 or 15(d) of the Securities Exchange Act of 1934, the registrant has duly caused this report to be signed on its behalf by the undersigned, thereunto duly authorized, in the Town of Wakefield, Commonwealth of Massachusetts, on March 11, 2016.
| Edgewater Technology, Inc. |
| /s/ SHIRLEY SINGLETON |
| Shirley Singleton Chairman, President and Chief Executive Officer |
Pursuant to the requirements of the Securities Exchange Act of 1934, this report has been signed below by the following persons on behalf of the registrant and in the capacities and on the dates indicated.
KNOW ALL PERSONS BY THESE PRESENTS, that each person whose signature appears below appoints jointly and severally, Shirley Singleton and Timothy R. Oakes and each one of them, his or her attorneys-in-fact, each with the power of substitution, for him or her in any and all capacities, to sign any and all amendments to this Annual Report on Form 10-K and to file the same, with exhibits thereto and other documents in connection therewith, with the SEC, hereby ratifying and confirming all that each said attorneys-in-fact, or his substitute or substitutes, may do or cause to be done by virtue hereof.
| Name |
Title |
Date | ||
| /s/ SHIRLEY SINGLETON Shirley Singleton |
Chairman, President and Chief Executive Officer (Principal Executive Officer) |
March 11, 2016 | ||
| /s/ TIMOTHY R. OAKES Timothy R. Oakes |
Chief Financial Officer (Principal Financial and Accounting Officer) |
March 11, 2016 | ||
| /s/ PAUL E. FLYNN Paul E. Flynn |
Director |
March 11, 2016 | ||
| /s/ PAUL GUZZI Paul Guzzi |
Director |
March 11, 2016 | ||
| /s/ NANCY L. LEAMING Nancy Leaming |
Director |
March 11, 2016 | ||
| /s/ MICHAEL R. LOEB Michael R. Loeb |
Director |
March 11, 2016 | ||
| /s/ WAYNE WILSON Wayne Wilson |
Director |
March 11, 2016 | ||
- 90 -
Table of Contents
| (a) 3. | Exhibits |
EXHIBIT INDEX
| Exhibit Number |
Description | |
| 2.1 | Asset Purchase Agreement, dated as of March 13, 2015, by and among Edgewater Technology-Zero2Ten, Inc., Zero 2 Ten, Inc., Zero2Ten EMEA Limited, and Paul A. Colella, Ryan Casey, David T. Kohar and Adam Spurr (Incorporated by reference from Exhibit 2.1 to the Company’s Form 8-K filed with the SEC on March 17, 2015).* | |
| 2.2 | Earnout Agreement, dated as of March 13, 2015, by and among Edgewater Technology-Zero2Ten, Inc. and Zero 2 Ten, Inc. (Incorporated by reference from Exhibit 2.2 to the Company’s Form 8-K filed with the SEC on March 17, 2015). | |
| 2.3 | Asset Purchase Agreement, dated as of August 17, 2015, by and among Edgewater Technology-Branchbird, Inc., Branchbird LLC, and Andrew Oh, Patrick Rafferty and Dan Brock (Incorporated by reference from Exhibit 2.1 to the Company’s Form 8-K filed with the SEC on August 19, 2015).* | |
| 2.4 | Earnout Agreement, dated as of August 17, 2015, by and among Edgewater Technology-Branchbird, Inc. and Branchbird LLC (Incorporated by reference from Exhibit 2.2 to the Company’s Form 8-K filed with the SEC on August 19, 2015). | |
| 2.5 | Asset Purchase Agreement, dated as of December 21, 2015, by and among Edgewater Technology-M2, Inc., M2 Dynamics Inc. and Michael A. Kember, Brian Grimes, Darlene Finn and the Rambeau Living Trust dated March 9, 2013 (Incorporated by reference from Exhibit 2.1 to the Company’s Form 8-K filed with the SEC on December 22, 2015).* | |
| 2.6 | Earnout Agreement, dated as of December 21, 2015, by and among Edgewater Technology-M2, Inc. and M2 Dynamics Inc. (Incorporated by reference from Exhibit 2.2 to the Company’s Form 8-K filed with the SEC on December 22, 2015). | |
| 3.1 | Restated Certificate of Incorporation of the Company (Incorporated by reference from Exhibit 3.1 to the Company’s Form 10-Q filed with the SEC on May 13, 2011). | |
| 3.2 | Amended and Restated By-Laws of the Company, as amended to date (Incorporated by reference from Exhibit 3.1 to the Company’s Form 8-K filed with the SEC on September 28, 2007). | |
| 4.1 | Form of certificate evidencing ownership of common stock of the Company (Incorporated by reference from Exhibit 4.1 to the Company’s Form 10-K for the year ended December 31, 2013). | |
| 10.1 | Form of Director Indemnification Agreement between the Company and each of its directors and executive officers (Incorporated by reference from Exhibit 10.1 to the Company’s Form 10-K for the year ended December 31, 2011 filed with the SEC on March 12, 2012). (1) | |
| 10.2 | Edgewater Technology, Inc. Amended and Restated 1996 Stock Option Plan, most recently amended, effective March 20, 2002 (Incorporated by reference from Exhibit 10.48 to the Company’s Form 10-K for the year ended December 31, 2001 filed with the SEC on March 27, 2002). (1) | |
| 10.3 | Edgewater Technology, Inc. Amended and Restated 2000 Stock Option Plan, as amended (Incorporated by reference from Exhibit 10.4 to the Company’s Form 10-Q for the quarter ended June 30, 2012 filed with the SEC on August 6, 2012). (1) | |
- 91 -
Table of Contents
| (a) 3. | Exhibits-(Continued) |
EXHIBIT INDEX
| Exhibit Number |
Description | |
| 10.4 | Edgewater Technology, Inc. 2008 Employee Stock Purchase Plan, as amended (Incorporated by reference from Appendix A to the Company’s Proxy Statement on Schedule 14A (File No. 000-20971) filed on April 22, 2015). (1) | |
| 10.5 | Edgewater Technology, Inc. 2003 Equity Incentive Plan (Incorporated by reference to Exhibit 4.10 of Form S-8 (File No. 333-106325), filed with the SEC on June 20, 2003). (1) | |
| 10.6 | Third Amendment to Lease between Edgewater Technology (Delaware), Inc. and Harvard Mills Limited Partnership, dated March 21, 2006 and effective as of May 3, 2006 for Edgewater Technology, Inc.’s corporate headquarters at 20 Harvard Mill Square, Wakefield, Massachusetts. (Incorporated by reference from Exhibit 99.1 to the Company’s Form 8-K filed with the SEC on May 3, 2006). | |
| 10.7 | Employment Agreement by and among the Company, Edgewater Technology (Delaware), Inc. (“Edgewater Delaware”) and Shirley Singleton dated as of June 12, 2007, which supersedes and terminates that certain employment agreement dated as of June 12, 2003 by and between Edgewater Delaware and Shirley Singleton (Incorporated by reference from Exhibit 10.1 to the Company’s Form 8-K filed with the SEC on June 15, 2007). (1) | |
| 10.8 | Employment Agreement by and among the Company, Edgewater Technology (Delaware), Inc. (“Edgewater Delaware”) and David Clancey dated as of June 12, 2007, which supersedes and terminates that certain employment agreement dated as of June 12, 2003 by and between Edgewater Delaware and David Clancey (Incorporated by reference from Exhibit 10.2 to the Company’s Form 8-K filed with the SEC on June 15, 2007). (1) | |
| 10.9 | Restated Change in Control Agreement by and among the Company and Timothy R. Oakes, dated as of December 4, 2013 (Incorporated by reference from Exhibit 10.3 to the Company’s Form 8-K filed with the SEC on December 6, 2013). (1) | |
| 10.10 | Edgewater Technology, Inc. 2008 Omnibus Incentive Plan (Incorporated by reference to Exhibit 10.1 of Form S-8 (File No. 333-153740) filed with the SEC on September 30, 2008). (1) | |
| 10.11 | Restated Change in Control Agreement by and among the Company and Robin Ranzal Knowles, dated as of December 4, 2013 (Incorporated by reference from Exhibit 10.4 to the Company’s Form 8-K filed with the SEC on December 6, 2013). (1) | |
| 10.12 | Second Amendment to Employment Agreement by and among Edgewater Technology, Inc. and Shirley Singleton, dated as of December 4, 2013 (Incorporated by reference from Exhibit 10.1 to the Company’s Form 8-K filed with the SEC on December 6, 2013). (1) | |
| 10.13 | Second Amendment to Employment Agreement by and among Edgewater Technology, Inc. and David Clancey, dated as of December 4, 2013 (Incorporated by reference from Exhibit 10.2 to the Company’s Form 8-K filed with the SEC on December 6, 2013). (1) | |
- 92 -
Table of Contents
| (a) 3. | Exhibits-(Continued) |
EXHIBIT INDEX
| Exhibit Number |
Description | |
| 10.14 | Edgewater Technology, Inc. 2012 Omnibus Incentive Plan (Incorporated by reference from Exhibit 99.2 to the Company’s Form 8-K filed with the SEC on June 8, 2012). (1) | |
| 10.15 | Form of Non-Qualified Stock Option Agreement (Employee) under the 2012 Omnibus Incentive Plan (Incorporated by reference from Exhibit 99.3 to the Company’s Form 8-K filed with the SEC on June 8, 2012). (1) | |
| 10.17 | Form of Non-Qualified Stock Option Agreement (Non-Employee Director) under the 2012 Omnibus Incentive Plan (Incorporated by reference from Exhibit 99.4 to the Company’s Form 8-K filed with the SEC on June 8, 2012). (1) | |
| 10.18 | Form of Non-Qualified Stock Option Agreement (Executive) under the 2012 Omnibus Incentive Plan (Incorporated by reference from Exhibit 99.2 to the Company’s Form 8-K filed with the SEC on September 28, 2012). (1) | |
| 10.19 | First Amendment to Employment Agreement by and among Edgewater Technology, Inc. and Shirley Singleton dated as of December 17, 2010, which amends that certain employment agreement dated as of June 12, 2007 (Incorporated by reference from Exhibit 10.1 to the Company’s Form 8-K filed with the SEC on December 22, 2010). (1) | |
| 10.20 | First Amendment to Employment Agreement by and among Edgewater Technology, Inc. and David Clancey dated as of December 17, 2010, which amends that certain employment agreement dated as of June 12, 2007 (Incorporated by reference from Exhibit 10.2 to the Company’s Form 8-K filed with the SEC on December 22, 2010). (1) | |
| 10.21 | Loan Agreement, dated as of September 23, 2013, among Edgewater Technology, Inc., its subsidiaries listed therein and RBS Citizens, N.A. (Incorporated herein by reference to Exhibit 10.1 to the Company’s Form 8-K filed with the Securities and Exchange Commission on September 25, 2013). | |
| 10.22 | Amendment No. 1 to Loan Agreement and Joinder, dated as of December 21, 2015, to Loan Agreement, dated as of September 23, 2013, among Edgewater Technology, Inc., its subsidiaries listed therein and Citizens Bank, N.A. (Incorporated by reference from Exhibit 10.1 to the Company’s Form 8-K filed with the SEC on December 22, 2015). | |
| 10.23 | Form of Stock Purchase Agreement under the Edgewater Technology, Inc. 2012 Omnibus Incentive Plan (Version for Executive Officers with Employment Agreements) (Incorporated by reference from Exhibit 10.1 to the Company’s Form 10-Q for the quarter ended March 31, 2013). (1) | |
| 10.24 | Form of Stock Purchase Agreement under the Edgewater Technology, Inc. 2012 Omnibus Incentive Plan (Version for Employees without Employment Agreements) (Incorporated by reference from Exhibit 10.2 to the Company’s Form 10-Q for the quarter ended March 31, 2013). (1) | |
| 10.25 | Form of Stock Purchase Agreement under the Edgewater Technology, Inc. 2012 Omnibus Incentive Plan (Version for Non-Employee Directors) (Incorporated by reference from Exhibit 10.1 to the Company’s Form 10-Q for the quarter ended June 30, 2013). (1) | |
- 93 -
Table of Contents
| (a) 3. | Exhibits-(Continued) |
EXHIBIT INDEX
| Exhibit Number |
Description | |
| 21.1 | Subsidiaries of Edgewater Technology, Inc.+ | |
| 23.1 | Consent of BDO USA, LLP, Independent Registered Public Accounting Firm.+ | |
| 24.1 | Power of Attorney (See Signature Page).+ | |
| 31.1 | 13a-14 Certification — President and Chief Executive Officer+ | |
| 31.2 | 13a-14 Certification — Chief Financial Officer+ | |
| 32 | Section 1350 Certification+ | |
| 101 | Interactive Data Files Pursuant to Rule 405 of Regulation S-T: (i) Consolidated Balance Sheets as of December 31, 2015 and 2014, (ii) Consolidated Statements of Comprehensive Income (Loss) for the years ended December 31, 2015, 2014 and 2013, (iii) Consolidated Statements of Stockholders Equity for the years ended December 31, 2015, 2014 and 2013, (iv) Consolidated Statements of Cash Flows for the years ended December 31, 2015, 2014 and 2013 and (v) Notes to the Consolidated Financial Statements.+ | |
| (1) | This agreement is a management contract or compensatory plan or arrangement required to be filed as an exhibit to this Annual Report on Form 10-K pursuant to Item 15(b). |
| * | Pursuant to Item 601(b)(2) of Regulation S-K, the Company agrees to furnish supplementally a copy of any omitted schedules to this agreement to the SEC upon its request. |
| + | Filed herewith. |
- 94 -