Attached files
| file | filename |
|---|---|
| EX-32 - EX-32 - EDGEWATER TECHNOLOGY INC/DE/ | d374983dex32.htm |
| EX-31.2 - EX-31.2 - EDGEWATER TECHNOLOGY INC/DE/ | d374983dex312.htm |
| EX-31.1 - EX-31.1 - EDGEWATER TECHNOLOGY INC/DE/ | d374983dex311.htm |
| EX-10.1 - EX-10.1 - EDGEWATER TECHNOLOGY INC/DE/ | d374983dex101.htm |
Table of Contents
UNITED STATES
SECURITIES AND EXCHANGE COMMISSION
Washington, D.C. 20549
FORM 10-Q
| ☒ | Quarterly report pursuant to Section 13 or 15 (d) of the Securities Exchange Act of 1934 |
For the quarterly period ended March 31, 2017
or
| ☐ | Transition report pursuant to Section 13 or 15 (d) of the Securities Exchange Act of 1934 |
for the transition period from to
Commission file number: 000-20971
EDGEWATER TECHNOLOGY, INC.
(Exact Name of Registrant as Specified in its Charter)
| Delaware | 71-0788538 | |
| (State or Other Jurisdiction of Incorporation or Organization) |
(I.R.S. Employer Identification No.) | |
| 200 Harvard Mill Square, Suite 210 Wakefield, MA |
01880-3209 | |
| (Address of Principal Executive Offices) | (Zip Code) | |
Registrant’s telephone number, including area code: (781) 246-3343
Indicate by check mark whether the registrant (1) has filed all reports required to be filed by Section 13 or 15(d) of the Securities Exchange Act of 1934 during the preceding 12 months (or for such shorter period that the registrant was required to file such reports), and (2) has been subject to such filing requirements for the past 90 days. Yes ☒ No ☐
Indicate by check mark whether the registrant has submitted electronically and posted on its corporate Web site, if any, every Interactive Data File required to be submitted and posted pursuant to Rule 405 of Regulation S-T (§232.405 of this chapter) during the preceding 12 months (or for such shorter period that the registrant was required to submit and post such files). Yes ☒ No ☐
Indicate by check mark whether the registrant is a large accelerated filer, an accelerated filer, a non-accelerated filer, smaller reporting company, or an emerging growth company. See the definitions of “large accelerated filer,” “accelerated filer,” “smaller reporting company”, and “emerging growth company” in Rule 12b-2 of the Exchange Act (check one):
| Large accelerated filer | ☐ | Accelerated filer | ☒ | |||
| Non-accelerated filer | ☐ (Do not check if smaller reporting company) | Smaller Reporting company | ☐ | |||
| Emerging Growth Company | ||||||
If an emerging growth company, indicate by check mark if the registrant has elected not to use the extended transition period for complying with any new or revised financial accounting standards provided pursuant to Section 13(a) of the Exchange Act. ☐
Indicate by check mark whether the registrant is a shell company (as defined in Rule 12b-2 of the Exchange Act). Yes ☐ No ☒
The number of shares of Common Stock of the Registrant, par value $.01 per share, outstanding at May 1, 2017 was 13,439,400.
Table of Contents
EDGEWATER TECHNOLOGY, INC.
FORM 10-Q FOR THE QUARTER ENDED MARCH 31, 2017
2
Table of Contents
PART I – FINANCIAL INFORMATION
EDGEWATER TECHNOLOGY, INC.
UNAUDITED CONDENSED CONSOLIDATED BALANCE SHEETS
(In Thousands, Except Per Share Data)
| March 31, 2017 |
December 31, 2016 |
|||||||
| ASSETS |
||||||||
| Current assets: |
||||||||
| Cash and cash equivalents |
$ | 17,674 | $ | 19,693 | ||||
| Accounts receivable, net of allowance of $150 |
25,366 | 25,661 | ||||||
| Prepaid expenses and other current assets |
1,781 | 1,208 | ||||||
|
|
|
|
|
|||||
| Total current assets |
44,821 | 46,562 | ||||||
| Property and equipment, net |
536 | 623 | ||||||
| Intangible assets, net |
7,677 | 8,378 | ||||||
| Goodwill |
29,983 | 29,983 | ||||||
| Deferred tax assets, net |
23,627 | 19,031 | ||||||
| Other assets |
227 | 228 | ||||||
|
|
|
|
|
|||||
| Total assets |
$ | 106,871 | $ | 104,805 | ||||
|
|
|
|
|
|||||
| LIABILITIES AND STOCKHOLDERS’ EQUITY |
||||||||
| Current liabilities: |
||||||||
| Accounts payable |
$ | 587 | $ | 634 | ||||
| Accrued liabilities |
13,717 | 13,497 | ||||||
| Contingent earnout consideration |
8,929 | 8,089 | ||||||
| Deferred revenue |
1,922 | 1,811 | ||||||
|
|
|
|
|
|||||
| Total current liabilities |
25,155 | 24,031 | ||||||
| Revolving credit facility |
5,000 | 5,000 | ||||||
|
|
|
|
|
|||||
| Total liabilities |
30,155 | 29,031 | ||||||
| Stockholders’ equity: |
||||||||
| Preferred stock, $.01 par value; 2,000 shares authorized, no shares issued or outstanding |
— | — | ||||||
| Common stock, $.01 par value; 48,000 shares authorized, 29,736 shares issued as of March 31, 2017 and December 31, 2016, 13,388 and 12,878 shares outstanding as of March 31, 2017 and December 31, 2016, respectively |
297 | 297 | ||||||
| Paid-in capital |
205,611 | 207,445 | ||||||
| Treasury stock, at cost, 16,348 and 16,858 shares at March 31, 2017 and December 31, 2016, respectively |
(104,262 | ) | (108,335 | ) | ||||
| Accumulated other comprehensive loss |
(582 | ) | (580 | ) | ||||
| Retained deficit |
(24,348 | ) | (23,053 | ) | ||||
|
|
|
|
|
|||||
| Total stockholders’ equity |
76,716 | 75,774 | ||||||
|
|
|
|
|
|||||
| Total liabilities and stockholders’ equity |
$ | 106,871 | $ | 104,805 | ||||
|
|
|
|
|
|||||
See notes to the unaudited condensed consolidated financial statements.
3
Table of Contents
EDGEWATER TECHNOLOGY, INC.
UNAUDITED CONDENSED CONSOLIDATED STATEMENTS OF COMPREHENSIVE LOSS
(In Thousands, Except Per Share Data)
| Three Months Ended March 31, |
||||||||
| 2017 | 2016 | |||||||
| Revenue: |
||||||||
| Service revenue |
$ | 25,135 | $ | 28,215 | ||||
| Software revenue |
2,531 | 2,029 | ||||||
| Reimbursable expenses |
1,464 | 1,654 | ||||||
|
|
|
|
|
|||||
| Total revenue |
29,130 | 31,898 | ||||||
| Cost of revenue: |
||||||||
| Project and personnel costs |
16,286 | 18,240 | ||||||
| Software costs |
1,392 | 1,254 | ||||||
| Reimbursable expenses |
1,464 | 1,654 | ||||||
|
|
|
|
|
|||||
| Total cost of revenue |
19,142 | 21,148 | ||||||
|
|
|
|
|
|||||
| Gross profit |
9,988 | 10,750 | ||||||
| Operating expenses: |
||||||||
| Selling, general and administrative |
9,938 | 9,886 | ||||||
| Named executive officer severance |
3,371 | — | ||||||
| Consent solicitation expense |
666 | 58 | ||||||
| Change in fair value of contingent earnout consideration |
604 | — | ||||||
| Direct acquisition costs |
— | 430 | ||||||
| Depreciation and amortization |
808 | 1,004 | ||||||
|
|
|
|
|
|||||
| Total operating expenses |
15,387 | 11,378 | ||||||
|
|
|
|
|
|||||
| Operating loss |
(5,399 | ) | (628 | ) | ||||
| Other expense, net |
233 | 625 | ||||||
|
|
|
|
|
|||||
| Loss before income taxes |
(5,632 | ) | (1,253 | ) | ||||
| Tax benefit |
(2,945 | ) | (490 | ) | ||||
|
|
|
|
|
|||||
| Net loss |
$ | (2,687 | ) | $ | (763 | ) | ||
|
|
|
|
|
|||||
| Comprehensive loss: |
||||||||
| Currency translation adjustments |
(2 | ) | 54 | |||||
|
|
|
|
|
|||||
| Total comprehensive loss |
$ | (2,689 | ) | $ | (709 | ) | ||
|
|
|
|
|
|||||
| Net loss per share: |
||||||||
| Basic net loss per share of common stock |
$ | (0.21 | ) | $ | (0.06 | ) | ||
|
|
|
|
|
|||||
| Diluted net loss per share of common stock |
$ | (0.21 | ) | $ | (0.06 | ) | ||
|
|
|
|
|
|||||
| Shares used in computing basic net loss per share of common stock |
12,971 | 11,790 | ||||||
|
|
|
|
|
|||||
| Shares used in computing diluted net loss per share of common stock |
12,971 | 11,790 | ||||||
|
|
|
|
|
|||||
See notes to the unaudited condensed consolidated financial statements.
4
Table of Contents
EDGEWATER TECHNOLOGY, INC.
UNAUDITED CONDENSED CONSOLIDATED STATEMENTS OF CASH FLOWS
(In Thousands)
| Three Months Ended March 31, |
||||||||
| 2017 | 2016 | |||||||
| CASH FLOWS FROM OPERATING ACTIVITIES: |
||||||||
| Net loss |
$ | (2,687 | ) | $ | (763 | ) | ||
| Adjustments to reconcile net loss to net cash used in operating activities, excluding the impact of acquisitions: |
||||||||
| Depreciation and amortization |
811 | 1,049 | ||||||
| Share-based compensation expense |
510 | 477 | ||||||
| Deferred income taxes |
(3,204 | ) | (622 | ) | ||||
| Accretion of contingent earnout consideration |
236 | 733 | ||||||
| Change in fair value of contingent earnout consideration |
604 | — | ||||||
| Recovery of doubtful accounts |
— | (29 | ) | |||||
| Excess tax benefit from stock options |
— | 101 | ||||||
| Changes in operating accounts, net of acquisition: |
||||||||
| Accounts receivable |
275 | (1,146 | ) | |||||
| Prepaid expenses and other current assets |
(572 | ) | (1,614 | ) | ||||
| Accounts payable |
(47 | ) | 375 | |||||
| Accrued liabilities and other liabilities |
220 | (3,339 | ) | |||||
| Deferred revenue |
111 | (375 | ) | |||||
|
|
|
|
|
|||||
| Net cash used in operating activities |
(3,743 | ) | (5,153 | ) | ||||
|
|
|
|
|
|||||
| CASH FLOWS FROM INVESTING ACTIVITIES: |
||||||||
| Net cash used to acquire M2 Dynamics |
— | (93 | ) | |||||
| Purchases of property and equipment |
(19 | ) | (43 | ) | ||||
|
|
|
|
|
|||||
| Net cash used in investing activities |
(19 | ) | (136 | ) | ||||
|
|
|
|
|
|||||
| CASH FLOWS FROM FINANCING ACTIVITIES: |
||||||||
| Proceeds from employee stock plans and stock option exercises |
1,730 | 1,317 | ||||||
| Excess tax benefit from stock options |
— | (101 | ) | |||||
|
|
|
|
|
|||||
| Net cash provided by financing activities |
1,730 | 1,216 | ||||||
|
|
|
|
|
|||||
| Effects of exchange rates on cash |
13 | 59 | ||||||
|
|
|
|
|
|||||
| Net decrease in cash and cash equivalents |
(2,019 | ) | (4,014 | ) | ||||
| CASH AND CASH EQUIVALENTS, beginning of period |
19,693 | 11,981 | ||||||
|
|
|
|
|
|||||
| CASH AND CASH EQUIVALENTS, end of period |
$ | 17,674 | $ | 7,967 | ||||
|
|
|
|
|
|||||
| SUPPLEMENTAL DISCLOSURES OF CASH FLOW INFORMATION: |
||||||||
| Cash paid for income taxes |
$ | 40 | $ | 40 | ||||
|
|
|
|
|
|||||
| Issuance of restricted stock awards |
$ | — | $ | — | ||||
|
|
|
|
|
|||||
See notes to the unaudited condensed consolidated financial statements.
5
Table of Contents
EDGEWATER TECHNOLOGY, INC.
NOTES TO UNAUDITED CONDENSED CONSOLIDATED FINANCIAL STATEMENTS
1. ORGANIZATION:
Edgewater Technology, Inc. helps the C-suite drive transformational change through its unique selection of business and technology services and channel-based solutions.
Classic consulting disciplines (such as business advisory, process improvement, organizational change management, M&A due diligence, and domain expertise) are blended with technical services (such as digital transformation, technical roadmaps, data and analytics services, custom development and system integration) to help organizations leverage investments in legacy IT assets to create new digital business models.
The Company delivers product based consulting in both the Enterprise Performance Management (“EPM”) and Enterprise Resource Planning (“ERP”) areas both on premise and in the cloud. Within the EPM offering, our Oracle channel, Edgewater Ranzal, provides Business Analytics solutions leveraging Oracle EPM, Business Intelligence (“BI”) and Big Data technologies. Within the ERP offering, our Microsoft channel, Edgewater Fullscope delivers Dynamics AX ERP, Business Intelligence and CRM solutions primarily in the manufacturing space.
In this Quarterly Report on Form 10-Q (the “Form 10-Q”), we use the terms “Edgewater,” “Edgewater Technology,” “we,” “our Company,” “the Company,” “our” and “us” to refer to Edgewater Technology, Inc. and its wholly-owned subsidiaries, which are described in our 2016 Annual Report on Form 10-K, as filed with the Securities and Exchange Commission (the “SEC”) on March 15, 2017 (the “2016 Form 10-K”).
2. BASIS OF PRESENTATION:
The accompanying unaudited condensed consolidated financial statements have been prepared by Edgewater pursuant to the rules and regulations of the SEC regarding interim financial reporting. Certain information and note disclosures normally included in annual financial statements prepared in accordance with accounting principles generally accepted in the United States of America have been omitted pursuant to those rules and regulations, although we believe that the disclosures made are adequate to ensure the information presented is not misleading.
The accompanying unaudited condensed consolidated financial statements reflect all adjustments (which were of a normal, recurring nature) that, in the opinion of management, are necessary to present fairly our financial position, results of operations and cash flows as of and for the interim periods presented. All intercompany transactions have been eliminated in the accompanying unaudited condensed consolidated financial statements. These financial statements should be read in conjunction with the audited financial statements and notes thereto included in our 2016 Form 10-K.
The results of operations for the three months ended March 31, 2017 are not necessarily indicative of the results to be expected for any future period or the full fiscal year. Our revenue and earnings may fluctuate from quarter-to-quarter based on factors within and outside our control, including variability in demand for information technology professional services, the length of the sales cycle associated with our service offerings, the number, size and scope of our projects and the efficiency with which we utilize our employees.
Other comprehensive loss consists of net loss plus or minus any currency translation adjustments.
3. BUSINESS COMBINATIONS:
M2 Dynamics Inc. (“M2 Dynamics”): On December 21, 2015, the Company acquired substantially all of the assets and certain liabilities of M2 Dynamics Inc., pursuant to the terms of an Asset Purchase Agreement (the “M2 Dynamics Acquisition”). Headquartered in Irvine, California, M2 Dynamics is an Oracle Platinum Partner providing Oracle EPM and BI solutions and services, primarily to the West Coast and southern regions of the United States. M2 Dynamics has joined the Company’s Edgewater Ranzal business in providing clients with information technology consultancy services specializing in Business Analytics and encompassing EPM, BI and Big Data solutions.
The Company initially estimated total fair value of the purchase price consideration to be $19.8 million. The initial cash consideration paid at close consisted of the $16.1 million base purchase price plus $596 thousand attributable to a net working capital adjustment. The initial cash consideration paid by the Company was increased by $3.0 million, representing the adjusted fair value estimate of additional contingent earnout consideration that may be earned by M2 Dynamics, which is described in more detail below.
6
Table of Contents
During the quarter ended March 31, 2016, the Company increased total purchase price consideration of the M2 Dynamics Acquisition, resulting in an increase to the carrying value of goodwill, by $93 thousand. The increase is attributable to the final true-up of excess net working capital delivered by M2 Dynamics at the closing of the transaction.
An earnout agreement was entered into in connection with the M2 Dynamics Acquisition under which M2 Dynamics is eligible to receive additional contingent consideration. Contingent earnout consideration to be paid, if any, to M2 Dynamics will be based upon the achievement of certain performance measures (and is not impacted by continued employment status of M2 Dynamics owners) over a one-year earnout period, concluding on December 21, 2016. The maximum amount of contingent earnout consideration that can be earned by M2 Dynamics is capped at $6.6 million. During the three-month periods ended March 31, 2017 and December 31, 2016, the Company recorded changes in fair value of the estimated earnout consideration to be achieved (as a result of better than forecasted financial performance). These changes in estimate resulted in an expense of $651 thousand and $662 thousand, respectively, (which was recorded as a component of change in fair value of contingent earnout consideration in the accompanying condensed consolidated statements of comprehensive income).
In December 2016, M2 Dynamics completed its twelve-month earnout period, during which certain performance measurements were achieved. Accordingly, M2 Dynamics will receive additional contingent consideration related to the earnout period in the amount of $5.1 million. This additional contingent consideration was paid during the second quarter of 2017.
In addition to the above payments, the Company incurred approximately $430 thousand and $801 thousand in direct transaction costs, which were expensed (within direct acquisition costs on the consolidated statement of comprehensive income (loss)) in the years ended December 31, 2016 and 2015, respectively.
In connection with the M2 Dynamics Acquisition, the Company made certain preliminary estimates related to the fair value of assets acquired, liabilities assumed, contingent earnout consideration, identified intangibles and goodwill.
The Company performed a fair value allocation of the purchase price among assets, liabilities and identified intangible assets. The final allocation of the purchase price was as follows:
| Total | Life (In Years) | |||||||
| (In Thousands) | ||||||||
| Accounts receivable |
$ | 2,878 | ||||||
| Other assets |
21 | |||||||
| Accounts payable and accrued expenses |
(866 | ) | ||||||
| Customer relationships |
7,700 | 6 Years | ||||||
| Goodwill (deductible for tax purposes) |
10,038 | |||||||
|
|
|
|||||||
| Total purchase price |
$ | 19,771 | ||||||
|
|
|
|||||||
The M2 Dynamics Acquisition was accounted for as a purchase transaction, and accordingly, the results of comprehensive income (loss), commencing December 21, 2015, are included in the Company’s accompanying consolidated statement of comprehensive income (loss).
Acquisition of Branchbird LLC (“Branchbird”): On August 17, 2015, the Company acquired substantially all of the assets and liabilities of Branchbird, pursuant to the terms of an Asset Purchase Agreement (the “Branchbird Acquisition”). Headquartered in Chicago, Illinois, Branchbird delivers Big Data solutions to their clients utilizing the Oracle Endeca and Big Data Discovery (BDD) products. The Branchbird Acquisition extends Ranzal’s presence in the Midwest.
The Company determined the total allocable purchase price consideration to be $4.2 million. The initial cash consideration paid at closing was $2.7 million, net of $19 thousand attributable to a net working capital adjustment. The initial consideration paid by the Company was increased by $1.4 million, representing our initial estimate of the fair value of additional contingent earnout consideration that may be earned by Branchbird, which is described in more detail below. In addition to the above payments, the Company incurred approximately $340 thousand in direct transaction costs, which were expensed (within direct acquisition costs on the consolidated statement of comprehensive income (loss)) during the year ended December 31, 2015.
An earnout agreement was entered into in connection with the Branchbird Acquisition under which Branchbird is eligible to receive additional contingent consideration. Contingent earnout consideration to be paid, if any, to Branchbird will be based upon the achievement of certain performance measures (and is not impacted by continued employment status of Branchbird owners) over two consecutive one-year earnout periods, concluding on August 16, 2017. The maximum amount of contingent earnout consideration that can be earned by Branchbird is capped at $2.4 million. The Company continually examines actual results in comparison to financial metrics utilized in the earnout calculation and assesses the carrying value of the contingent earnout consideration. During the three-month period ended December 31, 2016, the Company recorded a change in fair value of the estimated earnout consideration to be
7
Table of Contents
achieved (as a result of lower than forecasted revenue performance). This change in estimate resulted in a reversal of $221 thousand (which was recorded as a component of change in fair value of contingent earnout consideration in the accompanying condensed consolidated statements of comprehensive income). Also, during the three-month period ended June 30, 2016, the Company recorded a change in fair value of the estimated earnout consideration to be achieved (as a result of lower than forecasted revenue performance). This change in estimate resulted in a reversal of $798 thousand (which was recorded as a component of change in fair value of contingent earnout consideration in the accompanying condensed consolidated statements of comprehensive income). As of March 31, 2017, the Company had recorded an accrual of $797 thousand related to Branchbird contingent earnout consideration.
In connection with the Branchbird Acquisition, the Company made certain estimates related to the fair value of assets acquired, liabilities assumed, contingent earnout consideration, identified intangibles and goodwill.
The Company performed a fair value allocation of the purchase price among assets, liabilities and identified intangible assets. The final allocation of the purchase price was as follows:
| Total | Life (In Years) | |||||||
| (In Thousands) | ||||||||
| Accounts receivable |
$ | 540 | ||||||
| Other assets |
16 | |||||||
| Accounts payable and accrued expenses |
(86 | ) | ||||||
| Customer relationships |
2,100 | 5 | ||||||
| Goodwill (deductible for tax purposes) |
1,613 | |||||||
|
|
|
|||||||
| Total purchase price |
$ | 4,183 | ||||||
|
|
|
|||||||
The Branchbird Acquisition was accounted for as a purchase transaction, and accordingly, the results of operations, commencing August 17, 2015, are included in the Company’s accompanying consolidated statement of comprehensive income (loss). Pro forma financial information related to the Branchbird Acquisition is not presented as the effect of this acquisition was not material to the Company.
Acquisition of Zero2Ten, Inc. (“Zero2Ten”): On March 13, 2015, the Company acquired substantially all of the assets and liabilities of Zero2Ten, pursuant to the terms of an Asset Purchase Agreement (the “Zero2Ten Acquisition”). Headquartered in Alpharetta, Georgia, Zero2Ten is a specialty solution provider of Microsoft’s CRM Cloud product. Zero2Ten has delivered its services to organizations across various vertical markets with an emphasis on manufacturing. The acquisition of Zero2Ten continues our investment in service offerings that complement the Microsoft Dynamics product suite.
The Company determined the total allocable purchase price consideration to be $9.0 million. The initial cash consideration paid at closing was $4.5 million. The cash paid at closing consisted of the $5.0 million purchase price less $457 thousand attributable to a net working capital adjustment. The initial consideration paid by the Company was increased by $4.4 million, representing its initial estimate of the fair value estimate of additional contingent earnout consideration that may be earned by Zero2Ten, which is described in more detail below. In addition to the above payments, the Company incurred approximately $613 thousand in direct transaction costs, which were expensed (within direct acquisition costs on the consolidated statement of comprehensive income (loss)) during the year ended December 31, 2015.
An earnout agreement was entered into in connection with the Zero2Ten Acquisition under which Zero2Ten is eligible to receive additional contingent consideration. Contingent earnout consideration to be paid, if any, to Zero2Ten will be based upon the achievement of certain performance measures (and is not impacted by continued employment status of Zero2Ten shareholders) over two consecutive one-year earnout periods, concluding on March 13, 2017.
In March 2016, Zero2Ten completed its first twelve-month earnout period, during which certain performance measurements were achieved. Accordingly, Zero2Ten received additional contingent consideration related to the first earnout period in the amount of $3.9 million.
During the three-month periods ended March 31, 2017, December 31, 2016 and June 30, 2016, we reversed $47 thousand, $238 thousand and $130 thousand, respectively, of accrued contingent earnout consideration (reported as a part of change in fair value of contingent earnout consideration in our condensed consolidated statements of comprehensive income) associated with the completion of the first earnout period and the projected completion of the second earnout period, as it was determined that current forecasts are slightly below those originally utilized in determining the fair value of the contingent earnout consideration.
In March 2017, Zero2Ten completed its second twelve-month earnout period, during which certain performance measurements were achieved. Accordingly, Zero2Ten will receive additional contingent consideration related to the first earnout period in the amount of $3.0 million. This additional contingent consideration is expected to be paid during the second quarter of 2017.
8
Table of Contents
In connection with the Zero2Ten Acquisition, the Company made certain estimates related to the fair value of assets acquired, liabilities assumed, contingent earnout consideration, identified intangibles and goodwill.
The Company performed a fair value allocation of the purchase price among assets, liabilities and identified intangible assets. The final allocation of the purchase price was as follows:
| Total | Life (In Years) | |||||||
| (In Thousands) | ||||||||
| Accounts receivable |
$ | 1,596 | ||||||
| Other assets |
142 | |||||||
| Deferred revenue |
(1,158 | ) | ||||||
| Accounts payable and accrued expenses |
(580 | ) | ||||||
| Customer relationships |
2,800 | 5 | ||||||
| Goodwill (deductible for tax purposes) |
6,210 | |||||||
|
|
|
|||||||
| Total purchase price |
$ | 9,010 | ||||||
|
|
|
|||||||
The Zero2Ten Acquisition was accounted for as a purchase transaction, and accordingly, the results of operations, commencing March 13, 2015, are included in the Company’s accompanying consolidated statement of comprehensive income (loss). Pro forma financial information related to the Zero2Ten Acquisition is not presented as the effect of this acquisition was not material to the Company.
4. REVENUE RECOGNITION:
Our Company recognizes revenue primarily through the provision of consulting services and the resale of third-party, off-the-shelf software and maintenance.
We recognize revenue by providing consulting services under written service contracts with our customers. The service contracts we enter into generally fall into three specific categories: time and materials, fixed-price and retainer.
We consider amounts to be earned once evidence of an arrangement has been obtained, services are delivered, fees are fixed or determinable and collectability is reasonably assured. We establish billing terms at the time at which the project deliverables and milestones are agreed. Our standard payment terms are 30 days from invoice date. Out-of-pocket reimbursable expenses charged to customers are reflected as revenue.
When a customer enters into a time and materials, fixed-price or a periodic retainer-based contract, the Company recognizes revenue in accordance with its evaluation of the deliverables in each contract. If the deliverables represent separate units of accounting, the Company then measures and allocates the consideration from the arrangement to the separate units, based on vendor specific objective evidence (“VSOE”) of the value for each deliverable.
The revenue under time and materials contracts is recognized as services are rendered and performed at contractually agreed upon rates. Revenue pursuant to fixed-price contracts is recognized under the proportional performance method of accounting. We routinely evaluate whether revenue and profitability should be recognized in the current period. We estimate the proportional performance on our fixed-price contracts on a monthly basis utilizing hours incurred to date as a percentage of total estimated hours to complete the project. This method is used because reasonably dependable estimates of costs and revenue earned can be made, based on historical experience and milestones identified in any particular contract. If we do not have a sufficient basis to measure progress toward completion, revenue is recognized upon completion of performance, subject to any warranty provisions or other project management assessments as to the status of work performed.
Estimates of total project costs are continually monitored during the term of an engagement. There are situations where the number of hours to complete projects may exceed our original estimate, as a result of an increase in project scope, unforeseen events that arise, or the inability of the client or the delivery team to fulfill their responsibilities. Accordingly, recorded revenues and costs are subject to revision throughout the life of a project based on current information and historical trends. Such revisions may result in increases or decreases to revenue and income and are reflected in the consolidated financial statements in the periods in which they are first identified.
9
Table of Contents
If our initial estimates of the resources required or the scope of work to be performed on a contract are inaccurate, or we do not manage the project properly within the planned time period, a provision for estimated losses on incomplete projects is made. Any known or probable losses on projects are charged to operations in the period in which such losses are determined. A formal project review process takes place quarterly, although projects are evaluated on an ongoing basis. Management reviews the estimated total direct costs on each contract to determine if the estimated amounts are accurate, and estimates are adjusted as needed in the period identified. No material losses were recognized on contracts during the three-month periods ended March 31, 2017 or 2016.
We also perform services on a monthly retainer basis under infrastructure service contracts, which include monthly hosting and support services. Revenue under periodic retainer-based contracts is recognized ratably over the contract period, as outlined within the respective contract. In the event additional services are required, above the minimum retained or contracted amount, then such services are billed on a time and materials basis.
Typically, the Company provides warranty services on its fixed-price contracts related to providing customers with the ability to have any “design flaws” remedied and/or have our Company “fix” routine defects. The warranty services, as outlined in the respective contracts, are provided for a specific period of time after a project is complete. The Company values the warranty services based upon historical labor hours incurred for similar services at standard billing rates. Revenue related to the warranty provisions within our fixed-price contracts is recognized as the services are performed or the revenue is earned. The warranty period is typically for a 30-60 day period after the project is complete.
Customer prepayments, even if nonrefundable, are deferred (classified as deferred revenue) and recognized over future periods as services are performed.
Software revenue represents the resale of certain third-party off-the-shelf software and maintenance and is recorded on a gross basis provided we act as a principal in the transaction, which we have determined based upon several factors including, but not limited to, the fact that we have credit risk and we set the price to the end user. In the event we do not meet the requirements to be considered a principal in the software sale transaction and act as an agent, software revenue will be recorded on a net basis.
Prior to the second quarter of 2013, we recorded substantially all of our software resale revenue on a gross basis (reporting the revenue and cost from the transaction in our consolidated statement of comprehensive income (loss)). However, beginning in the second quarter of 2013, due to changes in the nature of the terms of certain of our Microsoft Dynamics AX software resale arrangements, we began to recognize a portion of our software resale revenue on a net basis (reporting only the net profit from the transaction as revenue in our consolidated statement of comprehensive income (loss)). It is expected that the mix of software revenue we report on a gross verses net basis will continue to fluctuate in future periods.
The majority of the software sold by the Company is delivered electronically. For software that is delivered electronically, we consider delivery to have occurred when the customer either (a) takes possession of the software via a download (that is, when the customer takes possession of the electronic data on its hardware), or (b) has been provided with access codes that allow the customer to take immediate possession of the software on its hardware pursuant to an agreement or purchase order for the software.
The Company enters into multiple element arrangements which typically include software, post-contract support (or maintenance), and consulting services. Consistent with the software described above, maintenance that is in the form of a pass through transaction is recognized upon delivery of the software, as all related warranty and maintenance is performed by the primary software vendor and not the Company. Maintenance fee revenue for the Company’s software products, which is inconsequential in all years presented, is recognized ratably over the term of the arrangements, which are generally for a one-year period. The Company has established VSOE with respect to the services provided based on the price charged when the services are sold separately. The Company has established VSOE for maintenance based upon the stated renewal rate.
5. SHARE-BASED COMPENSATION:
Share-based compensation expense under all of the Company’s share-based plans was $510 thousand and $477 thousand for the three-month periods ended March 31, 2017 and 2016, respectively.
Cash received from the employee stock purchase plan (“ESPP”) and through stock option exercises was $1.7 million and $1.3 million during the three-month periods ended March 31, 2017 and 2016, respectively. As of March 31, 2017, unrecognized compensation expense, net of estimated forfeitures, related to the unvested portion of all share-based compensation arrangements was approximately $354 thousand and is expected to be recognized over a weighted-average period of 0.9 years.
The Company intends to use previously purchased treasury shares for shares issued for options, restricted share awards and ESPP purchases. Shares may also be issued from authorized but unissued share reserves.
10
Table of Contents
6. INCOME TAXES:
The Company recorded tax benefits of $(2.9) million and $(490) thousand for the three-month periods ended March 31, 2017 and 2016, respectively. The reported tax benefits for the three-month periods ended March 31, 2017 and 2016, are based upon estimated annual effective tax rates of 52.3% and 39.1%, respectively. The effective tax rates reflected our combined Federal and state income tax rates, foreign income tax provisions and the recognition of U.S. deferred tax liabilities for differences between the book and tax basis of goodwill.
We assess the realizability of our deferred tax assets and assess the need for a valuation allowance on an ongoing basis. The periodic assessment of the net carrying value of our deferred tax assets under the applicable accounting rules is highly judgmental. We are required to consider all available positive and negative evidence in evaluating the likelihood that we will be able to realize the benefit of our deferred tax assets in the future. Such evidence includes scheduled reversals of deferred tax liabilities, projected future taxable income, tax planning strategies and the results of recent operations. Since this evaluation requires consideration of events that may occur some years into the future, there is significant judgment involved, and our conclusion could be materially different should certain of our expectations not transpire.
When assessing all available evidence, we consider the extent to which we have generated pre-tax income or losses over the most recent three-year period to be an important piece of objective evidence. As of March 31, 2017 and December 31, 2016, the recorded deferred tax asset valuation allowance balance was $8.2 million.
Our policy is to classify interest and penalties related to unrecognized tax benefits as income tax expense. This policy has been consistently applied in all periods. No such amounts were recognized in the three-month periods ended March 31, 2017 or 2016. We have reviewed the tax positions taken, or to be taken, in our tax returns for all tax years currently open to examination by a taxing authority. We have identified no uncertain tax positions for which it is reasonably possible that the total amount of unrecognized tax benefits will significantly increase or decrease within the twelve months ending March 31, 2018. We remain subject to examination until the statute of limitations expires for each respective tax jurisdiction.
The Company adopted the recent Accounting Standards Update related to stock-based compensation during the three-month period ended March 31, 2017. This adoption had an impact on the tax treatment for stock option exercises during the quarter (as well as a cumulative adjustment for prior period activity). In connection with the adoption of this standard, all excess tax benefits and tax deficiencies will be recognized in the statement of comprehensive income in the period in which they occur. The Company recognized $241 thousand of tax expense related to current period stock option exercises and the Company has also recorded a $1.4 million cumulative adjustment to retained earnings to present the impact of prior period activity in accordance with the newly adopted standard.
7. FAIR VALUE MEASUREMENT:
We utilize the following valuation hierarchy for disclosure of the inputs to valuation used to measure fair value. This hierarchy prioritizes the inputs into three broad levels as follows:
| • | Level 1 inputs are quoted prices (unadjusted) in active markets for identical assets or liabilities. |
| • | Level 2 inputs are quoted prices for similar assets and liabilities in active markets or inputs that are observable for the asset or liability, either directly or indirectly through market corroboration, for substantially the full term of the financial instrument. |
| • | Level 3 inputs are unobservable inputs based on our own assumptions used to measure assets and liabilities at fair value. |
A financial asset or liability’s classification within the hierarchy is determined based upon the lowest level input that is significant to the fair value measurement.
As of March 31, 2017 and December 31, 2016, our only financial assets and liabilities required to be measured on a recurring basis were our contingent earnout consideration liabilities.
11
Table of Contents
The following table represents the Company’s fair value hierarchy for its financial assets and liabilities required to be measured on a recurring basis:
| Basis of Fair Value Measurements | ||||||||||||||||
| Balance | Quoted Prices in Active Markets for Identical Items (Level 1) |
Significant Other Observable Inputs (Level 2) |
Significant Unobservable Inputs (Level 3) |
|||||||||||||
| (In Thousands) | ||||||||||||||||
| Balance at March 31, 2017: |
||||||||||||||||
| Financial liabilities: |
||||||||||||||||
| Contingent earnout consideration |
$ | 8,929 | $ | — | $ | — | $ | 8,929 | ||||||||
|
|
|
|
|
|
|
|
|
|||||||||
| Total financial liabilities |
$ | 8,929 | $ | — | $ | — | $ | 8,929 | ||||||||
|
|
|
|
|
|
|
|
|
|||||||||
| Balance at December 31, 2016: |
||||||||||||||||
| Financial liabilities: |
||||||||||||||||
| Contingent earnout consideration |
$ | 8,089 | $ | — | $ | — | $ | 8,089 | ||||||||
|
|
|
|
|
|
|
|
|
|||||||||
| Total financial liabilities |
$ | 8,089 | $ | — | $ | — | $ | 8,089 | ||||||||
|
|
|
|
|
|
|
|
|
|||||||||
No financial instruments were transferred into or out of Level 3 classification during the three- month period ended March 31, 2017.
The Company has classified its net liability for contingent earnout considerations relating to its Zero2Ten, Branchbird and M2 Dynamics Acquisitions within Level 3 of the fair value hierarchy because the fair value is determined using significant unobservable inputs, which included probability weighted cash flows. A description of these acquisitions is included within Note 3. The contingent earnout payments for each acquisition are based on the achievement of certain revenue and earnings before interest, taxes, depreciation and amortization targets.
A reconciliation of the beginning and ending Level 3 net liabilities for the three-month period ended March 31, 2017 is as follows:
| Fair Value Measurements Using Significant Unobservable Inputs (Level 3) |
||||
| (In Thousands) | ||||
| Balance at December 31, 2016 |
$ | 8,089 | ||
| Accretion of contingent earnout consideration (included within other expense, net) |
236 | |||
| Change in fair value of contingent earnout consideration (included within selling, general and administrative expense) |
604 | |||
|
|
|
|||
| Ending balance at March 31, 2017 |
$ | 8,929 | ||
|
|
|
|||
As of March 31, 2017 and December 31, 2016, the fair values of our other financial instruments, which include cash and cash equivalents, accounts receivable and accounts payable, approximate the carrying amounts of the respective asset and/or liability due to the short-term nature of these financial instruments.
8. GOODWILL AND INTANGIBLE ASSETS:
There have been no changes to the Company’s goodwill balance. Our annual goodwill and intangible assets measurement date is December 2.
We amortize our intangible assets that have finite lives using either the straight-line method or based on estimated future cash flows to approximate the pattern in which the economic benefit of the asset will be utilized. Amortization expense was $698 thousand and $858 thousand during the three-month periods ended March 31, 2017 and 2016, respectively. This amortization expense relates to certain non-competition covenants and customer lists, which expire at various times through 2021.
12
Table of Contents
The Company recorded amortization from capitalized internally developed software (intellectual property) (reported as part of Cost of Revenue—software cost) of $3 thousand and $45 thousand during the three- month periods ended March 31, 2017 and 2016, respectively.
Estimated annual amortization expense of our intangible assets (including amortization expense associated with capitalized software costs) for the current year and the following four years ending December 31, is as follows:
| Amortization Expense |
||||
| (In Thousands) | ||||
| 2017 |
$ | 2,804 | ||
| 2018 |
$ | 2,240 | ||
| 2019 |
$ | 1,712 | ||
| 2020 |
$ | 1,057 | ||
| 2021 and beyond |
$ | 565 | ||
9. ACCRUED EXPENSES AND OTHER LIABILITIES:
Accrued liabilities as of March 31, 2017 and December 31, 2016 consisted of the following:
| March 31, 2017 |
December 31, 2016 |
|||||||
| (In Thousands) | ||||||||
| Accrued bonuses |
$ | 2,890 | $ | 3,053 | ||||
| Accrued payroll related liabilities |
3,524 | 2,614 | ||||||
| Accrued vacation |
2,926 | 2,243 | ||||||
| Accrued commissions |
1,150 | 2,537 | ||||||
| Accrued software expense |
813 | 844 | ||||||
| Accrued contractor fees |
395 | 455 | ||||||
| Accrued professional service fees |
404 | 344 | ||||||
| Deferred rent |
73 | 74 | ||||||
| Income tax related accruals |
373 | 166 | ||||||
| Other accrued expenses |
1,169 | 1,167 | ||||||
|
|
|
|
|
|||||
| Total |
$ | 13,717 | $ | 13,497 | ||||
|
|
|
|
|
|||||
13
Table of Contents
10. NET LOSS PER SHARE:
A reconciliation of net loss and weighted average shares used in computing basic and diluted net loss per share is as follows:
| Three Months Ended March 31, |
||||||||
| 2017 | 2016 | |||||||
| Basic net loss per share: |
||||||||
| Net loss applicable to common shares |
$ | (2,687 | ) | $ | (763 | ) | ||
|
|
|
|
|
|||||
| Weighted average common shares outstanding |
12,971 | 11,790 | ||||||
|
|
|
|
|
|||||
| Basic net loss per share of common stock |
$ | (0.21 | ) | $ | (0.06 | ) | ||
|
|
|
|
|
|||||
| Diluted net loss per share: |
||||||||
| Net loss applicable to common shares |
$ | (2,687 | ) | $ | (763 | ) | ||
|
|
|
|
|
|||||
| Weighted average common shares outstanding |
12,971 | 11,790 | ||||||
| Dilutive effects of stock options |
— | — | ||||||
|
|
|
|
|
|||||
| Weighted average common shares, assuming dilutive effect of stock options |
12,971 | 11,790 | ||||||
|
|
|
|
|
|||||
| Diluted net loss per share of common stock |
$ | (0.21 | ) | $ | (0.06 | ) | ||
|
|
|
|
|
|||||
Share-based awards, inclusive of all grants made under the Company’s equity plans, for which either the stock option exercise price or the fair value of the restricted share award exceeds the average market price over the period, have an anti-dilutive effect on earnings per share, and accordingly, are excluded from the diluted computations for all periods presented. Had such shares been included, shares for the diluted computation would have increased by approximately 194 and 109 thousand in the three-month periods ended March 31, 2017 and 2016, respectively. As of March 31, 2017 and 2016, there were approximately 2.5 million and 3.7 million share-based awards outstanding, respectively, under the Company’s equity plans. Options to purchase 1.7 million shares of common stock that were outstanding during the three months ended March 31, 2017 and 2016 were not included in the computation of diluted net loss per share due to the reported periodic loss.
11. STOCK REPURCHASE PROGRAM:
In December 2007, our Board of Directors (the “Board”) authorized a stock repurchase program for up to $5.0 million of common stock on the open market or through privately negotiated transactions from time-to-time through December 31, 2008 (the “Stock Repurchase Program”). The Board subsequently amended the Stock Repurchase Program, authorizing both an increase to and an extension of the Stock Repurchase Program. The Stock Repurchase Program, as amended, had a maximum purchase value of shares of $23.1 million (the “Purchase Authorization”) and was set to expire on September 23, 2016 (the “Repurchase Period”). On September 23, 2016, we announced that the Board had approved an extension of the Repurchase Period to September 22, 2017.
The timing and amount of the purchases will be based upon market conditions, securities law considerations and other factors. The Stock Repurchase Program does not obligate the Company to acquire a specific number of shares in any period and may be modified, suspended, extended or discontinued at any time, without prior notice.
The Company did not repurchase any shares of common stock during the three-month periods ended March 31, 2017 or 2016.
12. REVOLVING LINE OF CREDIT:
In September 2013, the Company entered into a secured revolving credit facility (the “Credit Facility”). The Credit Facility was modified through an amendment in December 2015, which increased the borrowing base to $15 million (from the previous $10 million) with an additional accordion feature that allows the Company to request an additional $5.0 million as needed, extending the total credit facility borrowing capacity to $20 million over its three-year term. The Credit Facility is collateralized by substantially all assets of the Company and its domestic subsidiaries, and is subject to certain financial covenants. The Company was in compliance with the financial covenants (which are related to interest coverage and leverage) as of March 31, 2016. Under the terms of the Credit Facility, any advances will accrue interest at a variable per annum rate of interest equal to the LIBOR Rate plus 1.5%. Interest is due and payable, in arrears, on a monthly basis. The Company will be obligated to pay an annual commitment fee of 0.15% on the daily undrawn balance of the facility. Any amounts outstanding under the Credit Facility will be due on December 21, 2018. The Company had drawn down $5.0 million of this balance as of March 31, 2017.
14
Table of Contents
13. GEOGRAPHIC INFORMATION
Total revenue to unaffiliated customers by geographic area were as follows:
| For the Three-Months Ended March 31, | ||||||||
| 2017 | 2016 | |||||||
| United States |
$ | 25,100 | $ | 26,445 | ||||
| Canada |
2,876 | 3,750 | ||||||
| Other International |
1,154 | 1,703 | ||||||
|
|
|
|
|
|||||
| Total Revenue |
$ | 29,130 | $ | 31,898 | ||||
|
|
|
|
|
|||||
Substantially all of the Company’s long-lived assets are located within the United States.
14. SEGMENT INFORMATION
In accordance with the provisions of Topic 280, Segment Reporting to the FASB ASC (“ASC 280”), the Company determined that it has three operating segments (Enterprise Performance Management (“EPM”), Enterprise Resource Planning (“ERP”) and Classic Consulting).
The EPM segment provides Business Analytics solutions leveraging Oracle EPM, BI and Big Data technologies. The ERP segment delivers Dynamics AX ERP, Business Intelligence and CRM solutions, primarily in the manufacturing space. The Classic Consulting segment provides business advisory services that are blended with technical services to help organizations leverage investments in legacy IT assets to create new digital business models.
The Company’s chief operating decision maker evaluates performance using several factors, of which the primary financial measures are revenue and operating segment operating income. The accounting policies of the operating segments are the same as those described in Note 2 “Summary of Significant Accounting Policies”.
Segment information for the three-month periods ended March 31, 2017 and 2016 were as follows:
| EPM | ERP | Classic Consulting | Corporate | Consolidated | ||||||||||||||||
| (In Thousands) | ||||||||||||||||||||
| March 31, 2017 |
||||||||||||||||||||
| Total revenue |
$ | 14,308 | $ | 11,350 | $ | 3,472 | $ | — | $ | 29,130 | ||||||||||
| Operating income (loss) |
$ | 899 | $ | 929 | $ | (25 | ) | $ | (7,202 | ) | $ | (5,399 | ) | |||||||
| Depreciation and amortization expense |
$ | 562 | $ | 198 | $ | 3 | $ | 45 | $ | 808 | ||||||||||
| March 31, 2016 |
||||||||||||||||||||
| Total revenue |
$ | 16,506 | $ | 10,836 | $ | 4,556 | $ | — | $ | 31,898 | ||||||||||
| Operating income (loss) |
$ | 1,640 | $ | 285 | $ | 977 | $ | (3,530 | ) | $ | (628 | ) | ||||||||
| Depreciation and amortization expense |
$ | 720 | $ | 190 | $ | 46 | $ | 48 | $ | 1,004 | ||||||||||
The Company is not disclosing total assets for each of its reportable segments, as total assets by reportable segment is not a key metric provided to the Company’s chief operating decision maker.
15
Table of Contents
ITEM 2. MANAGEMENT’S DISCUSSION AND ANALYSIS OF FINANCIAL CONDITION AND RESULTS OF OPERATIONS
The following information should be read in conjunction with the information contained in the Unaudited Condensed Consolidated Financial Statements and notes thereto appearing elsewhere in this Quarterly Report on Form 10-Q. This Quarterly Report on Form 10-Q contains forward-looking statements that involve risks and uncertainties. See “Risk Factors” and “Special Note Regarding Forward-Looking Statements” included elsewhere herein. We use the terms “we,” “our,” “us,” “Edgewater” and “the Company” in this report to refer to Edgewater Technology, Inc. and its wholly-owned subsidiaries.
Edgewater Technology, Inc. helps the C-suite drive transformational change through its unique selection of business and technology services and channel-based solutions.
Classic consulting disciplines (such as business advisory, process improvement, organizational change management, M&A due diligence, and domain expertise) are blended with technical services (such as digital transformation, technical roadmaps, data and analytics services, custom development and system integration) to help organizations leverage investments in legacy IT assets to create new digital business models.
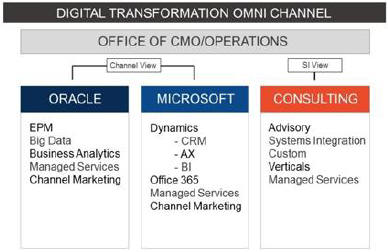
Delivering both on premise and in the cloud, Edgewater offers two major channel-based services. In the Oracle channel, Edgewater Ranzal provides Business Analytics solutions leveraging Oracle EPM, BI and Big Data technologies. In the Microsoft channel, Edgewater Fullscope delivers Dynamics AX ERP, Business Intelligence and CRM solutions primarily in the manufacturing space.
Our Services
Edgewater offers a full spectrum of services and expertise to ensure the success of our engagements. Our consulting services are categorized into two different components: (1) Channel View and (2) Systems Integration View.
The following diagram illustrates these offerings:
Edgewater has the proven expertise to plan, deliver and manage integration services that improve performance and maximize business results. We focus on deploying new systems and unlocking the value of the existing corporate assets. This proven expertise enables us to bring complex technologies and systems together while minimizing risk, leveraging our clients’ technology investments and delivering tailored solutions.
16
Table of Contents
Factors Influencing Our Results of Operations
Revenue. The Company derives its service revenue from time and materials-based contracts, fixed-price contracts and retainer-based arrangements. Time and materials-based contracts represented 84.2% of service revenue for the three-month period ended March 31, 2017. Time and materials-based contracts represented 80.9% of service revenue for the three-month period ended March 31, 2016. Revenue under time and materials contracts is recognized as services are rendered and performed at contractually agreed upon rates. Fixed-price contracts represented 8.7% of service revenue for the three-month period ended March 31, 2017. Fixed-price contracts represented 14.7% of service revenue for the three-month period ended March 31, 2016. Revenue pursuant to fixed-price contracts is recognized under the proportional performance method of accounting. Retainer-based contracts represented 7.1% of service revenue during the three-month period ended March 31, 2017. Retainer-based contracts represented 4.4% of service revenue during the three-month period ended March 31, 2016. Revenue under retainer-based contracts is recognized ratably over the contract period, as outlined within the respective contract.
Estimates of total project costs are continually monitored during the term of an engagement. There are situations where the number of hours to complete projects may exceed (or be less than) our original estimate, because of an increase (or decrease) in project scope, unforeseen events that arise, or the inability of the client or the delivery team to fulfill their responsibilities. Accordingly, recorded revenues and costs are subject to revision throughout the life of a project based on current information and historical trends. Such revisions may result in increases or decreases to revenue and income and are reflected in the consolidated financial statements in the periods in which they are first identified.
We anticipate that software revenue will continue to be a significant portion of our revenues. Our reported software revenue represents the resale of certain third-party off-the-shelf software and related maintenance (primarily relates to the resale of Microsoft Dynamics AX product) and has historically been recorded on a gross basis provided we act as principal in the transaction, whereby we have credit risk and we set the price to the end user. In the event we do not meet the requirements to be considered a principal in the software sale transaction and act as an agent, software revenue is recorded on a net basis.
Software revenue is recognized upon delivery, except in the infrequent situation where the Company provides maintenance services, in which case the related maintenance is recognized ratably over the maintenance period (while the software revenue is recognized upon delivery). Software revenue is expected to fluctuate between quarters, dependent on our customers’ demand for such third-party off-the-shelf software. Fluctuations in software revenue may have an impact upon our periodic operating performance, including gross margin.
Operating Expenses. The largest portion of our operating expenses consists of cash and non-cash compensation and benefits associated with our project consulting personnel and related expenses. Non-cash compensation includes share-based compensation expense arising from restricted stock and option grants to employees. Project personnel expenses also consist of payroll costs and related benefits associated with our professional staff. Other related expenses include travel, subcontracting costs, third-party vendor payments and non-billable expenses associated with the delivery of services to our customers. We consider the relationship between project personnel expenses and revenue to be an important measure of our operating performance. The relationship between project personnel expenses and revenue is driven largely by the chargeability of our consultant base, the prices we charge our customers and the non-billable costs associated with securing new customer engagements and developing new service offerings. The remainder of our recurring operating expenses consists of expenses associated with the development of our business and the support of our customer-serving professionals, such as professional development and recruiting, marketing and sales, and management and administrative support. Professional development and recruiting expenses consist primarily of recruiting and training, content development and delivery costs. Marketing and sales expenses consist primarily of the costs associated with the development and maintenance of our marketing materials and programs. Management and administrative support expenses consist primarily of the costs associated with operations, including finance, information systems, human resources, facilities (including the rent of office space) and other administrative support for project personnel.
The Company regularly reviews its fees for services, professional compensation and overhead costs to ensure that its services and compensation are competitive within the industry and that its overhead costs are balanced with its revenue levels. In addition, we monitor the progress of customer projects with customer senior management. The Company manages the activities of its professionals by closely monitoring engagement schedules and staffing requirements. However, a rapid decline in the demand for the professional services that we provide could result in lower utilization of our professionals than we planned. In addition, because most of our customer engagements are terminable by our customers without penalty, an unanticipated termination of a customer project could require us to maintain underutilized employees. While professional staff levels must be adjusted to reflect active engagements, the Company must also maintain a sufficient number of consulting professionals to oversee existing customer engagements and to participate in sales activities to secure new customer assignments.
17
Table of Contents
Named Executive Officer Severance. The Company incurred $3.4 million of expense associated with the termination of two Named Executive Officers of the Company during the three-month period ended March 31, 2017. During the three-months ended March 31, 2017 the Company terminated without cause the employment of the Chairman, President, and Chief Executive Officer as well as the Executive Vice President and Chief Strategy and Technology Officer. The severance expense associated with these terminations include salary and salary related expenses (including bonus) as well as the expense associated with the acceleration of stock award vesting.
Direct Acquisition Costs. The Company incurred $430 thousand of direct acquisition costs related to the acquisition of substantially all of the assets of M2 Dynamics in the three-month period ended March 31, 2016. Incurred expenses included investment banking fees, legal fees, accounting and other professional fees directly associated with completion of the acquisitions. No such expenses were incurred in the period ended March 31, 2017.
Adjustments to Fair Value of Contingent Consideration. The Company remeasures the estimated carrying value of contingent consideration each quarter, with any changes (income or expense) in the estimated fair value recorded as an operating expense. During the three-month period ended March 31, 2017 the Company recorded an increase to the fair value of contingent earnout consideration (recorded within selling, general and administrative expense) of $604 thousand. This adjustment was related to the finalization of the M2 Dynamics and Zero2Ten earnout calculations. No adjustments were made to the anticipated earnouts during the three-month period ended March 31, 2016. Accretion of the contingent earnout liability is classified as other expense on the consolidated statements of comprehensive loss. As of March 31, 2017 and December 31, 2016, the Company had $8.9 million and $8.1 million, respectively, accrued in connection with the contingent earnout obligations associated with the Zero2Ten, Branchbird, and M2 Dynamics Acquisitions.
Company Performance Measurement Systems and Metrics. The Company’s management monitors and assesses its operating performance by evaluating key metrics and indicators on an ongoing basis. For example, we regularly review performance information related to annualized revenue per billable consultant, periodic consultant utilization rates, gross profit margins, average bill rates and billable employee headcount. Edgewater has also developed internal Enterprise Performance Management systems which aid us in measuring our operating performance and consultant utilization rates. The matching of sales opportunities to available skill sets in our consultant base is one of our greatest challenges and therefore, we monitor consultant utilization closely. These metrics, along with other operating and financial performance metrics, are used in evaluating management’s overall performance. These metrics and indicators are discussed in more detail under “Results for the Three Months Ended March 31, 2017, Compared to Results for the Three Months Ended March 31, 2016,” included elsewhere in this Quarterly Report on Form 10-Q.
Results for the Three Months Ended March 31, 2017, Compared to Results for the Three Months Ended March 31, 2016
The financial information that follows has been rounded in order to simplify its presentation. The amounts and percentages below have been calculated using the detailed financial information contained in the unaudited condensed consolidated financial statements, the notes thereto, and the other financial data included in this Quarterly Report on Form 10-Q.
18
Table of Contents
The following table sets forth the percentage of total revenue of items included in our unaudited condensed consolidated statements of comprehensive loss:
| Three Months Ended March 31, |
||||||||
| 2017 | 2016 | |||||||
| Revenue: |
||||||||
| Service revenue |
86.3 | % | 88.4 | % | ||||
| Software revenue |
8.7 | % | 6.4 | % | ||||
| Reimbursable expenses |
5.0 | % | 5.2 | % | ||||
|
|
|
|
|
|||||
| Total revenue |
100.0 | % | 100.0 | % | ||||
| Cost of revenue: |
||||||||
| Project and personnel costs |
55.9 | % | 57.2 | % | ||||
| Software costs |
4.8 | % | 3.9 | % | ||||
| Reimbursable expenses |
5.0 | % | 5.2 | % | ||||
|
|
|
|
|
|||||
| Total cost of revenue |
65.7 | % | 66.3 | % | ||||
|
|
|
|
|
|||||
| Gross profit |
34.3 | % | 33.7 | % | ||||
| Operating expenses: |
||||||||
| Selling, general and administrative |
34.1 | % | 31.2 | % | ||||
| Named executive officer severance |
11.6 | % | — | % | ||||
| Consent solicitation expense |
2.3 | % | — | % | ||||
| Change in fair value of contingent earnout |
2.1 | % | — | % | ||||
| Direct acquisition |
— | % | 1.3 | % | ||||
| Depreciation and amortization |
2.7 | % | 3.2 | % | ||||
|
|
|
|
|
|||||
| Total operating expenses |
52.8 | % | 35.7 | % | ||||
|
|
|
|
|
|||||
| Operating loss |
(18.5 | )% | (2.0 | )% | ||||
| Other expense, net |
(0.8 | )% | (1.9 | )% | ||||
|
|
|
|
|
|||||
| Loss before income taxes |
(19.3 | )% | (3.9 | )% | ||||
| Income tax benefit |
(10.1 | )% | (1.5 | )% | ||||
|
|
|
|
|
|||||
| Net loss |
(9.2 | )% | (2.4 | )% | ||||
|
|
|
|
|
|||||
Revenue. Total revenue decreased by $(2.8) million, or (8.7)%, to $29.1 million during the three-month period ended March 31, 2017, compared to total revenue of $31.9 million in the three-month period ended March 31, 2016. Service revenue decreased by $(3.1) million, or (10.9)%, to $25.1 million during the three-month period ended March 31, 2017, compared to service revenue of $28.2 million in the three-month period ended March 31, 2016.
Service revenue was negatively affected by the channel disruption surrounding the vendor push to the adoption of cloud-based technologies and our customers’ decision processes around moving to cloud-based solutions. While our 2015 acquisitions of M2 Dynamics, Branchbird and Zero2Ten have strengthened the Company’s cloud based offerings in both the EPM and ERP markets, we are still experiencing delays in customer purchasing. Additionally, the first quarter of 2016 was positively affected by the timing of customer initiated project start delays in the second half of 2015 (serving to increase the active project base during the first quarter, a time when our customers have historically been focused on year-end closing procedures rather than beginning new consulting engagements).
As we experience a transition within our EPM and ERP channels from on-premise to hybrid to cloud-based solutions we may experience a disruption in the timing of our customer purchasing habits. This transition may cause fluctuations in our service and software revenue and related margin contributions in the coming periods. Because of this, we believe that periodic fluctuations in the amount of revenue recognized by the Company may have a material impact upon our gross margins.
Billable consultant utilization increased to 74.3% in the three-month period ended March 31, 2017 compared to 72.7% in the three-month period ended March 31, 2016. While billable consultant utilization has increased, the billable headcount base has decreased by 40, to 341 (excluding contractors) compared to 381 (excluding contractors) at March 31, 2016.
19
Table of Contents
On a sequential quarterly basis, billable consultant utilization increased to 74.3% from 72.7% in the fourth quarter of 2016. The decrease in sequential quarterly service revenue is driven by the impact that the year-end 2016 holiday schedule has on the sales cycle (sales activity has gained traction in the latter stages of the three-month period ended March 31, 2017, which will translate to service revenue during the second and third quarters of 2017).
Annualized service revenue per billable consultant, as adjusted for utilization, was $365 thousand and $358 thousand during the three-month periods ended March 31, 2017 and 2016, respectively. The periodic fluctuations in our annualized service revenue per billable consultant metric continue to reflect the changes in the mix of our service offering revenue generated by our current engagements.
During the three-month period ended March 31, 2017, software revenue totaled $2.5 million, or 8.7% of total revenue, compared to software revenue of $2.0 million, or 6.4% of total revenue, in the three-month period ended March 31, 2016. Our software revenue is primarily related to our resale of Microsoft Dynamics software, cloud-based licenses and maintenance. Software revenue is expected to fluctuate on a period-to-period basis dependent upon our customers’ demand for such third-party off-the-shelf software. We anticipate that software revenue will continue to represent a meaningful portion of revenues in future years. Because of this, we believe that periodic fluctuations in the amount of software revenue recognized by the Company may have a material impact upon our gross margins.
Generally, we are reimbursed for our out-of-pocket expenses incurred in connection with our customers’ consulting projects. Reimbursed expense revenue was $1.5 million and $1.7 million for the three-month periods ended March 31, 2017 and 2016, respectively. The aggregate amount of reimbursed expenses will fluctuate from period-to-period depending on the number of billable consultants as well the location of our customers, the general fluctuation of travel costs, such as airfare, and the number of our projects that require travel.
The number of customers the Company served during the three-month period ended March 31, 2017 totaled 468, as compared to 536 customers during the three-month period ended March 31, 2016. During the first three months of 2017, we secured first-time engagements with a total of 23 new customers, compared to 35 new customer engagements during the first three months of 2016.
Cost of Revenue. Cost of revenue primarily consists of project personnel costs principally related to salaries, payroll taxes, employee benefits, software costs and travel expenses for personnel dedicated to customer projects. These costs represent the most significant expense we incur in providing our services. In total, cost of revenue decreased by $(2.0) million, or (9.5)%, to $19.1 million for the three-month period ended March 31, 2017, compared to $21.1 million in the comparable 2016 quarterly period.
The primary drivers of the 2017 year-over-year decrease in total cost of revenue during the three-month period ended March 31, 2017, on an absolute dollar basis, were related to decreases in salary- and fringe-related expenses (primarily associated with the decrease in billable consultant headcount from our strategic headcount management efforts), combined with a decrease in contractor expense (we continually evaluate our use of third party contractors and that level of use is expected to fluctuate based on the specific skill sets and staffing requirements of our customer mix). The Company maintained 341 billable consultants (excluding contractors) as of the quarter ended March 31, 2017, compared to 381 billable consultants (excluding contractors) at the end of the first quarter of 2016.
Project and personnel costs represented 55.9% of total revenue during the three-month period ended March 31, 2017, as compared to 57.2% of total revenue during the three-month period ended March 31, 2016.
The decrease in project and personnel costs during the three-month period ended March 31, 2017, as a percentage of total revenue, was driven by the decrease in billable consultant headcount over the comparable periods.
Software costs amounted to $1.4 million during the three-month period ended March 31, 2017. Software costs amounted to $1.3 million during the three-month period ended March 31, 2016. Software costs are expected to fluctuate between quarters depending on our customers’ demand for software. Reimbursable expenses were $1.5 million and $1.7 million for the three-month periods ended March 31, 2017 and 2016, respectively.
Gross Profit. During the three-month period ended March 31, 2017, total gross profit decreased $(762) thousand, or (7.1)%, to $10.0 million, compared to gross profit of $10.8 million in the three-month period ended March 31, 2016. For purposes of further analysis, we refer to gross profit as a percentage of revenue generally as gross margin.
20
Table of Contents
Total gross margin, as a percentage of total revenue, was 34.3% and 33.7% in the three-month periods ended March 31, 2017 and 2016, respectively. The year-over-year quarterly decrease in revenue contribution was offset by the decrease in salary and salary-related expenses (primarily associated with the decreased billable headcount).
Service revenue gross margins were 35.2% in the first quarter of 2017, compared to 35.4% in the first quarter of 2016. The decrease in service revenue gross margin for the three-month period ended March 31, 2017 was similarly related to the decrease in service revenue, as described above.
We anticipate that software revenue will continue to be a meaningful part of our revenue in future periods. Additionally, our future gross margins may continue to be influenced by the recognition of our software revenue. We believe that our software revenue mix will continue to shift between arrangements under which we will report software revenue on either a gross or net basis (dependent upon the underlying circumstances of each individual resale arrangement). Changes in the nature of the terms of certain of our Microsoft Dynamics AX software resale arrangements as described in “Revenue” above will, in certain situations, extend the timing of the recognition period of the gross margin on software sales (from full, immediate recognition of the gross margin on the transaction to recognition of the gross margin on the transaction spread evenly over a three-year period) due to payment terms being spread over a multiple year period and result in a reduction in the amount of the software gross margin to be recognized by the Company.
Selling, General and Administrative (“SG&A”) Expenses. The Company’s recurring selling, general and administrative expenses were consistent in both periods presented. As a percentage of total revenue, SG&A expenses were 34.1% during the three-month period ended March 31, 2017, compared to 31.2% in the three-month period of 2016. On an absolute dollar-basis, SG&A expenses increased by $52 thousand, or 0.5%, to $9.9 million in the three-month period ended March 31, 2017, compared to SG&A expenses of $9.9 million in the three-month period ended March 31, 2016.
Named Executive Officer Severance. During the three-month period ended March 31, 2017, the Company terminated the employment of the former Chairman, President, and Chief Executive Officer and the former Chief Strategy and Technology Officer. In connection with these terminations, the Company incurred $3.4 million of severance related expenses. These expenses were associated with contractually agreed upon salary, bonus and acceleration of vesting of stock-based compensation awards.
Consent Solicitation Expense. During the three-month period ended March 31, 2017, we incurred $666 thousand of legal and advisory expenses in connection with defense against a consent solicitation. During the three-month period ended March 31, 2016, we incurred $58 thousand of legal and advisory expenses in connection with defense against a consent solicitation.
Change in Fair Value of Contingent Earnout Consideration. The Company continually examines actual results in comparison to financial metrics utilized in each of our earnout calculations and assesses the carrying value of the contingent earnout consideration. During the three-month period ended March 31, 2017, the Company recorded changes in fair value of the estimated earnout consideration to be achieved (as a result of higher achievement of financial targets than initially forecasted) which resulted in $604 thousand of expense. During the three-month period ended March 31, 2016, the Company recorded no such expense.
Direct Acquisition Costs. During the first quarter of 2016, the Company incurred approximately $430 thousand of direct acquisition costs associated with the December 2015 acquisition of M2 Dynamics. Incurred expenses included investment banking fees, legal fees, accounting and other professional fees directly associated with completion of the acquisition. During the three-month period ended March 31, 2017, the Company recorded no such expense.
Depreciation and Amortization Expense. Depreciation and amortization expense decreased $(196) thousand, or (19.5)%, to $808 thousand in the three-month period ended March 31, 2017 as compared to $1.0 million in the three-month peirod ended March 31, 2016. The decrease in amortization expense during the first quarter of 2017 is primarily the result of the timing of amortization expense associated with the intangible assets identified in connection with the Zero2Ten, Branchbird and M2 Dynamics acquisitions. The Company recognizes amortization expense over the periods in which it expects to realize the economic benefit.
Depreciation expense was $110 thousand and $146 thousand in the three-month periods ended March 31, 2017 and 2016, respectively.
Operating Loss. Operating loss was $(5.4) million in the first quarter of 2017, compared to operating loss of $(628) thousand in the comparable 2016 quarterly period.
The 2017 first quarter change in operating loss is primarily attributable to the severance related expenses associated with the terminations of the Company’s former Chairman, President and Chief Executive Officer as well as the former Executive Vice President and Chief Strategy and Technology Officer, the decrease in service revenue and the expenses associated with the consent solicitation process.
21
Table of Contents
Other Expense, Net. Other expense, net, totaled $233 thousand during the three-month period ended March 31, 2017, while other expense, net, totaled $625 thousand during the comparable 2016 period. Other expense, net, for the three-months ended March 31, 2017 primarily represents the accretion of the contingent earnout liability recognized in connection with the Zero2Ten, and Branchbird Acquisitions and also includes periodic foreign currency exchange gains and losses. Other expense, net, for the three-months ended March 31, 2016 primarily represents the accretion of the contingent earnout liability recognized in connection with the Zero2Ten, Branchbird and M2 Acquisitions and also includes periodic foreign currency exchange gains and losses.
Income Tax Benefit. We recorded a benefit from income taxes of $(2.9) million during the three-month period ended March 31, 2017. We recorded a benefit from income taxes of $(490) thousand during the three-month period ended March 31, 2016. Our periodic income tax benefit amounts are derived based upon an estimated annual effective income tax rate, inclusive of federal and state income taxes, of 52.3% and 39.1% during the three-month periods ended March 31, 2017 and 2016, respectively.
Reported income tax expense also includes expense amounts attributable to foreign income taxes, the recognition of U.S. deferred tax liabilities for differences between the book and tax basis of goodwill and interest and penalties.
We have deferred tax assets that have arisen primarily as a result of timing differences, net operating loss carryforwards and tax credits. Our ability to realize a deferred tax asset is based on our ability to generate sufficient future taxable income. We assess, on a routine periodic basis, the estimated future realizability of the gross carrying value of our deferred tax assets on a more likely than not basis. Our periodic assessments take into consideration both positive evidence (future profitability projections for example) and negative evidence (accumulated deficit) as it relates to evaluating the future recoverability of our deferred tax assets.
The Company considers scheduled reversals of deferred tax liabilities, projected future taxable income, ongoing tax planning strategies and other matters, including the period over which our deferred tax assets will be recoverable, in assessing the need for and the amount of the valuation allowance. In the event that actual results differ from these estimates, or we adjust these estimates in the future periods, further adjustments to our valuation allowance may be recorded, which could materially impact our financial position and net income in the period of the adjustment.
Net Loss. We generated a net loss of $(2.7) million during the three-month period ended March 31, 2017, compared to a net loss of $(763) thousand during the three-month period ended March 31, 2016. The 2017 first quarter net loss is primarily attributable to the impact of the severance expenses related to the Company’s termination of employment of two executive officers during the first quarter of 2017, combined with the decrease in service revenue and the expenses incurred related to the consent solicitation process.
Operating Segments. Total revenue within our EPM operating segment decreased $(2.2) million, or (13.3)%, to $14.3 million in the three-month period ended March 31, 2017 compared to $16.5 million in the three-month period ended March 31, 2016. The decrease in EPM total revenue was driven primarily by the channel disruption associated with the emphasis of cloud based solutions by channel partners. Total revenue within our ERP operating segment increased by $514 thousand, or 4.7%, to $11.4 million in the three-month period ended March 31, 2017 compared to $10.8 million in the three-month period ended March 31, 2016. The increase in ERP revenue was driven primarily by the timing of engagements and the billable hours performed. Total revenue within our Classic Consulting segment decreased $(1.1) million, or (23.8)%, to $3.5 million in the three-month period ended March 31, 2017 compared to $4.6 million in the three-month period ended March 31, 2016. The decrease in Classic Consulting was driven principally by the decrease in billable consultant utilization specific to the Classic Consulting segment.
Operating income within our EPM operating segment decreased $(741) thousand, or (45.2)%, to $899 thousand in the three-month period ended March 31, 2017 compared to $1.6 million in the three-month period ended March 31, 2016. The decrease in operating income was driven principally by the decrease in total revenue (which was driven by the channel disruption of the transition to cloud based solutions). Operating income within our ERP operating segment increased by $644 thousand, or 226%, to $929 thousand in the three-month period ended March 31, 2017 compared to $285 thousand in the three-month period ended March 31, 2016. The increase in operating income was due in part to the increased revenue contribution noted above. Operating income within our Classic Consulting operating segment decreased by $(1.0) million, or (102.6)%, to $(25) thousand in the three-month period ended March 31, 2017 compared to $977 thousand in the three-month period ended March 31, 2016. The decrease in operating income was driven primarily by the decrease in billable consultant utilization (specifically within Classic Consulting).
22
Table of Contents
Liquidity and Capital Resources
The following table summarizes our cash flow activities for the periods indicated:
| Three Months Ended March 31, |
||||||||
| 2017 | 2016 | |||||||
| (In Thousands) | ||||||||
| Cash flows (used in) provided by: |
||||||||
| Operating activities |
$ | (3,743 | ) | $ | (5,153 | ) | ||
| Investing activities |
(19 | ) | (136 | ) | ||||
| Financing activities |
1,730 | 1,216 | ||||||
| Effects of exchange rates on cash |
13 | 59 | ||||||
|
|
|
|
|
|||||
| Total cash used in the period |
$ | (2,019 | ) | $ | (4,014 | ) | ||
|
|
|
|
|
|||||
As of March 31, 2017, we had cash and cash equivalents of $17.7 million, a $2.0 million decrease from the December 31, 2016 balance of $19.7 million. The primary drivers of the decrease in cash during the first quarter of 2017 are the bonus and commission payments related to the Company’s 2016 performance-based incentive programs, the funding of an additional payroll cycle during the first quarter and premium payments associated with the renewal of annual insurance policies. The Company partially offset these cash outflows through the recurring collection of customer receivables.
The earnout agreements entered into in connection with the acquisitions of Zero2Ten, Branchbird and M2 Dynamics may require significant cash payments upon the completion of the earnout periods in 2017. Payments related to earnout period performance are expected to be made in the second and fourth quarters of 2017. The amounts of these payments will be determined by the financial performance of the acquired entities. As of March 31, 2017, the Company had accrued $8.9 million of contingent earnout consideration.
Working capital, which is defined as current assets less current liabilities, decreased to $19.7 million as of March 31, 2017, as compared to $22.5 million as of December 31, 2016.
Historically, we have used our operating cash flows, available cash, available funds under our credit facility and periodic sales of our common stock to finance ongoing operations and business combinations. We believe that our cash and cash equivalents will be sufficient to finance our working capital needs for at least the next twelve months. We periodically reassess the adequacy of our liquidity position, taking into consideration current and anticipated operating cash flow, anticipated capital expenditures, and possible business combinations. The pace at which we will either generate or consume cash will be dependent upon future operations and the level of demand for our services on an ongoing basis.
Cash flow from operating activities is driven by collections of fees for our consulting services and the reselling of software products. Cash used in operations predominantly relates to employee compensation and payments to third-party software providers. Accrued payroll and related liabilities fluctuate from period to period based on the timing of our normal payroll cycle and the timing of variable compensation payments. Annual components of our variable compensation plans are paid in the first quarter of the following year, causing fluctuations in cash flow from quarter to quarter.
Accounts payable and accrued expenses are most significantly affected by the timing of payments required to be made to third-party software providers in connection with the resale of software products to our customers. Historically, a significant portion of our software sales has occurred at the end of the second quarter.
Net cash used in operating activities was $(3.7) million for the three-month period ended March 31, 2017, as compared to net cash used by operating activities of $(5.2) million for the three-month period ended March 31, 2016. The primary components of operating cash flows during the first three months of 2017 were driven by the payment of bonus and commissions under our 2016 performance-based bonus programs, the funding of an additional payroll cycle in the quarter and the timing of payments related to annual insurance-related premiums and third-party software expenses. Additionally, cash from operations was influenced by non-cash activity of $(1.0) million (primarily changes in deferred tax assets and changes in fair value of contingent earnout consideration, partially offset by depreciation and amortization and stock-based compensation). The primary components of operating cash flows during the first three months of 2016 were driven by the payment of bonus and commissions under our 2015 performance-based bonus programs, the funding of an additional payroll cycle in the quarter and the timing of payments related to annual insurance-related premiums and third-party software expenses. Additionally, cash from operations was influenced by non-cash charges of $1.7 million (primarily changes in deferred income taxes, depreciation, amortization, stock-based compensation expense and accretion of contingent earnout consideration).
23
Table of Contents
Net cash used in investing activities was $(19) thousand during the three-month period ended March 31, 2017, compared to net cash used in investing activities of $(136) thousand in the three-month period ended March 31, 2016. Cash used in investing activities in the three-month period ended March 31, 2017 consisted of payments associated with the purchases of property and equipment. Cash used in investing activities in the three-month period ended March 31, 2016 consisted of payments associated with the M2 Acquisition and, to a lesser extent, the purchases of property and equipment.
All capital expenditures are discretionary as the Company currently has no long-term commitments for capital expenditures.
Net cash provided by financing activities was $1.7 million in the three-month period ended March 31, 2017, compared to net cash provided by financing activities of $1.2 million in the three-month period ended March 31, 2016. The 2017 and 2016 cash flows provided by financing activities are attributable to proceeds associated with our Employee Stock Purchase Plan and stock option exercises.
In September 2013, the Company entered into a secured revolving credit facility (the “Credit Facility”). The Credit Facility was modified through an amendment in December 2015, which increased the borrowing base to $15 million (from the previous $10 million) with an additional accordion feature that allows the Company to request an additional $5.0 million as needed, extending the total credit facility borrowing capacity to $20 million over its three-year term. The Credit Facility is secured by substantially all assets of the Company and its domestic subsidiaries, and is subject to normal covenants. Under the terms of the Credit Facility, any advances will accrue interest at a variable per annum rate of interest equal to the LIBOR Rate plus 1.5%. Interest is due and payable, in arrears, on a monthly basis. The Company will be obligated to pay an annual commitment fee of 0.15% on the daily undrawn balance of the facility. Any amounts outstanding under the Credit Facility will be due on December 21, 2018. The Company had drawn down $5.0 million of this balance as of March 31, 2017.
Acquisitions, Earnout Payments and Commitments
Acquisition of M2 Dynamics: As more fully described in “Item 1 – Financial Statements – Notes to the Unaudited Condensed Consolidated Financial Statements – Note 3”, included elsewhere herein, an earnout agreement was entered into in connection with the M2 Dynamics Acquisition under which M2 Dynamics is eligible to receive additional contingent consideration. Contingent earnout consideration to be paid, if any, to M2 Dynamics will be based upon the achievement of certain performance measures over one twelve-month earnout period, concluding in December 2016. Based upon initial fair value estimates, the Company has recorded contingent earnout consideration described above of $5.1 million. The earnout payment of $5.1 million was made to M2 Dynamics during the second quarter of 2017.
Acquisition of Branchbird: As more fully described in “Item 1 – Financial Statements – Notes to the Unaudited Condensed Consolidated Financial Statements – Note 3”, included elsewhere herein, an earnout agreement was entered into in connection with the Branchbird Acquisition under which Branchbird is eligible to receive additional contingent consideration. Contingent earnout consideration to be paid, if any, to Branchbird will be based upon the achievement of certain performance measures over two consecutive twelve-month earnout periods, concluding in August 2017. Based upon initial fair value estimates, the Company has recorded contingent earnout consideration described above of $797 thousand. The maximum amount of contingent earnout consideration that can be earned by Branchbird is capped at $2.4 million.
Acquisition of Zero2Ten: As more fully described in “Item 1 – Financial Statements – Notes to the Unaudited Condensed Consolidated Financial Statements – Note 3”, included elsewhere herein, an earnout agreement was entered into in connection with the Zero2Ten Acquisition under which Zero2Ten is eligible to receive additional contingent consideration. Contingent earnout consideration to be paid, if any, to Zero2Ten will be based upon the achievement of certain performance measures over two consecutive twelve-month earnout periods, concluding in March 2017. Based upon initial fair value estimates, the Company has recorded contingent earnout consideration described above of $3.0 million. The maximum amount of contingent earnout consideration that can be earned by Zero2Ten is capped at $8.6 million.
Off Balance Sheet Arrangements
We do not have any off-balance sheet arrangements that have or are reasonably likely to have a current or future effect on our financial condition, changes in financial condition, revenues or expenses, results of operations, liquidity, capital expenditures or capital resources that are material to investors.
24
Table of Contents
Critical Accounting Policies and Estimates
We prepare our unaudited condensed consolidated financial statements in conformity with accounting principles generally accepted in the United States of America. As such, we are required to make certain estimates, judgments and assumptions that we believe are reasonable based upon the information available. These estimates and assumptions affect the reported amounts of assets and liabilities at the date of the financial statements and the reported amounts of revenues and expenses during the periods presented. We reaffirm the critical accounting policies and estimates as reported in our 2016 Annual Report on Form 10-K, which was filed with the Securities and Exchange Commission on March 15, 2017.
Recent Accounting Pronouncements
In March 2016, the FASB issued ASU No. 2016-09, Improvements to Employee Share-Based Payment Accounting. This update was issued as part of the FASB’s simplification initiative and affects all entities that issue share-based payment awards to their employees. The amendments in this update address, among other things, the recognition of excess tax benefits and deficiencies associated with share-based payments, the classification of those excess tax benefits on the statement of cash flows, an accounting policy election for forfeitures, the amount an employer can withhold to cover income taxes and still qualify for equity classification and the classification of those taxes paid on the statement of cash flows. In connection with the adoption of this standard, all excess tax benefits and tax deficiencies will be recognized in the statement of comprehensive income in the period in which they occur. The Company recognized $241 thousand of tax expense related to current period stock option exercises and the Company has also recorded a $1.4 million cumulative adjustment to retained earnings to present the impact of prior period activity in accordance with the newly adopted standard.
We operate in a rapidly changing environment that involves certain risks and uncertainties, some of which are beyond our control. You should carefully review and consider the information regarding certain risk factors that could materially affect our business, financial condition or future results set forth under “Part I – Item 1A – Risk Factors” in our Annual Report on Form 10-K, for the year ended December 31, 2016, which was filed with the Securities and Exchange Commission on March 15, 2017 and in this Quarterly Report on Form 10-Q under “Special Note Regarding Forward-Looking Statements.”
25
Table of Contents
SPECIAL NOTE REGARDING FORWARD-LOOKING STATEMENTS
Some of the statements in this Quarterly Report on Form 10-Q and elsewhere constitute forward-looking statements under Section 27A of the Securities Act of 1933, as amended, and Section 21E of the Securities Exchange Act of 1934, as amended. These statements involve known and unknown risks, uncertainties and other factors that may cause results, levels of activity, growth, performance, tax consequences or achievements to be materially different from any future results, levels of activity, growth, performance, tax consequences or achievements expressed or implied by such forward-looking statements. Such factors include, among other things, those listed below, as well as those further set forth under the heading “Risk Factors” in our 2016 Annual Report on Form 10-K as filed with the SEC on March 15, 2017.
Factors that may cause actual results, goals, targets or objectives to differ materially from those contemplated, projected, forecasted, estimated, anticipated, planned or budgeted in such forward-looking statements include, among others, the following possibilities: (1) failure to obtain new customers or retain significant existing customers; (2) the loss of one or more key executives and/or employees; (3) changes in industry trends, such as a decline in the demand for Enterprise Resource Planning and Enterprise Performance Management solutions, custom development and system integration services and/or declines in industry-wide information technology spending, whether on a temporary or permanent basis and/or delays by customers in initiating new projects or existing project milestones; (4) inability to execute upon growth objectives, including new services and growth in entities acquired by our Company; (5) adverse developments and volatility involving geopolitical or technology market conditions; (6) unanticipated events or the occurrence of fluctuations or variability in the Company’s critical accounting policies; (7) delays in, or the failure of, our sales pipeline being converted to billable work and recorded as revenue; (8) termination by clients of their contracts with us or inability or unwillingness of clients to pay for our services, which may impact our accounting assumptions; (9) inability to recruit and retain professionals with the high level of information technology skills and experience needed to provide our services; (10) failure to expand outsourcing services to generate additional revenue; (11) any changes in ownership of the Company or otherwise that would result in a limitation of the net operating loss carry forward under applicable tax laws; (12) the possibility that activist stockholders may wage proxy or consent contests or gain representation on or control of our Board of Directors, causing uncertainty about the direction of our business; (13) difficulties and costs associated with transitioning to the cloud; and/or (14) the failure of the marketplace to embrace advisory and product-based consulting services.
Although we believe that the expectations in the forward-looking statements are reasonable, we cannot guarantee future results, levels of activity, performance, growth, earnings per share or achievements. However, neither we nor any other person assumes responsibility for the accuracy and completeness of such statements. Except as otherwise required, we undertake no obligation to update any of the forward-looking statements after the date of this Form 10-Q to conform such statements to actual results.
ITEM 3. QUANTITATIVE AND QUALITATIVE DISCLOSURES ABOUT MARKET RISK
Our primary financial instruments include investments in money market funds that are sensitive to market risks and interest rates. The investment portfolio is used to preserve our capital until it is required to fund operations, strategic acquisitions or distributions to stockholders. None of our market-risk sensitive instruments are held for trading purposes. We did not purchase derivative financial instruments in the three-month periods ended March 31, 2017 or 2016. Should interest rates on the Company’s investments fluctuate by 10% the impact would not be material to the financial condition, results of operations or cash flows.
The impact of inflation and changing prices has not been material on revenue or income from continuing operations during the three-month periods ended March 31, 2017 and 2016.
ITEM 4. CONTROLS AND PROCEDURES
Evaluation of Disclosure Controls and Procedures
We maintain disclosure controls and procedures, which we have designed to ensure that material information related to the Company, including our consolidated subsidiaries, is properly identified and evaluated on a regular basis and disclosed in accordance with all applicable laws and regulations. The Chairman, Interim President and Interim Chief Executive Officer and the Chief Financial Officer of Edgewater Technology, Inc. (its principal executive officer and principal financial officer, respectively) have concluded, based on their evaluations of the Company’s disclosure controls and procedures as of the end of the period covered by this report, that the Company’s disclosure controls and procedures are effective to ensure that information required to be disclosed by the Company in the reports filed or submitted by it under the Securities Exchange Act of 1934, as amended, is recorded, processed, summarized and reported within the time periods specified in the Securities and Exchange Commission rules and forms, and include controls and procedures designed to ensure that information required to be disclosed by the Company in such reports is accumulated and communicated to the Company’s management as appropriate to allow timely decisions regarding required disclosure.
26
Table of Contents
Changes in Controls and Procedures
There were no changes in our internal control over financial reporting, as such term is defined in Rules 13a-15(f) and 15d-15(f) under the Exchange Act, during the period covered by this report that have materially affected, or are reasonably likely to materially affect, our internal control over financial reporting.
The Company is involved in legal proceedings, claims, and litigation arising in the ordinary course of business not specifically discussed herein.
As discussed in “Part I—Item 1A—Risk Factors” of our Annual Report on Form 10-K for the year ended December 31, 2016 and herein under “Special Note Regarding Forward-Looking Statements,” investors should be aware of certain risks, uncertainties and assumptions in our business. We encourage you to refer to our Annual Report on Form 10-K to carefully consider these risks, uncertainties and assumptions.
ITEM 2. UNREGISTERED SALES OF EQUITY SECURITIES AND USE OF PROCEEDS
In December 2007, our Board of Directors (the “Board”) authorized a stock repurchase program for up to $5.0 million of common stock on the open market or through privately negotiated transactions from time-to-time through December 31, 2008 (the “Stock Repurchase Program”). The Board subsequently amended the Stock Repurchase Program, authorizing both an increase to and an extension of the Stock Repurchase Program. The Stock Repurchase Program, as amended, had a maximum purchase value of shares of $23.1 million (the “Purchase Authorization”) and was set to expire on September 23, 2016 (the “Repurchase Period”). On September 23, 2016, we announced that the Board had approved an extension of the Repurchase period to September 22, 2017.
The timing and amount of the purchases will be based upon market conditions, securities law considerations and other factors. The Stock Repurchase Program does not obligate the Company to acquire a specific number of shares in any period and may be modified, suspended, extended or discontinued at any time, without prior notice.
The following table provides information with respect to purchases of our common stock during the quarter ended March 31, 2017:
Issuer Purchases of Equity Securities
| Period |
Total Number of Shares Purchased |
Average Price Paid Per Share |
Total Number of Shares Purchased as Part of Publicly Announced Plans or Programs |
Maximum Dollar Value of Shares that May Yet Be Purchased Under the Plans or Programs |
||||||||||||
| January 1 – 31, 2017 |
— | $ | — | — | $ | 8,733,963 | ||||||||||
| February 1 – 28, 2017 |
— | $ | — | — | $ | 8,733,963 | ||||||||||
| March 1 – 31, 2017 |
— | $ | — | — | $ | 8,733,963 | ||||||||||
|
|
|
|
|
|
|
|
|
|||||||||
| Total |
— | $ | — | — | $ | 8,733,963 | ||||||||||
|
|
|
|
|
|
|
|
|
|||||||||
ITEM 3. DEFAULTS UPON SENIOR SECURITIES
None.
27
Table of Contents
ITEM 4. MINE SAFETY DISCLOSURES
Not applicable.
On the dates indicated below, the Company entered into an Indemnification Agreement with each of the directors of the Company elected by written consent of stockholders, effective as of February 16, 2017 (the “Indemnification Agreement”). The Indemnification Agreement provides indemnity including the advancement of expenses, to the director against liabilities incurred in the performance of his duties to the fullest extent permitted by the General Corporation Law of the State of Delaware. The foregoing description of the Indemnification Agreement is qualified in its entirety by reference to the form of the Indemnification Agreement, a copy of which is filed as Exhibit 10.1 to this Quarterly Report on Form 10-Q and incorporated herein by reference.
| Name |
Title |
Date of Agreement | ||
| Matthew Carpenter |
Director | February 16, 2017 | ||
| Frederick DiSanto |
Director | February 16, 2017 | ||
| Jeffrey Rutherford |
Chairman of the Board, Interim President and Interim Chief Executive Officer | February 16, 2017 | ||
| Kurtis Wolf |
Director | February 16, 2017 |
| 3.1 | Amended and Restated By-Laws of the Company, as amended to date (Incorporated by reference from Exhibit 3.2 to the Company’s Annual Report on Form 10-K for the fiscal year ended December 31, 2016). | |
| 10.1 | Form of Indemnification Agreement between Edgewater Technology, Inc. and each of its directors and executive officers* | |
| 31.1 | 13a-14 Certification – Chairman, Interim President and Interim Chief Executive Officer* | |
| 31.2 | 13a-14 Certification – Chief Financial Officer* | |
| 32 | Section 1350 Certification** | |
| 101 | Interactive Data Files Pursuant to Rule 405 of Regulation S-T: (i) Unaudited Condensed Consolidated Balance Sheets as of March 31, 2017 and December 31, 2016, (ii) Unaudited Condensed Consolidated Statements of Comprehensive Loss for the Three Months ended March 31, 2017 and 2016, (iii) Unaudited Condensed Consolidated Statements of Cash Flows for the Three Months ended March 31, 2017 and 2016 and (iv) Notes to Unaudited Condensed Consolidated Financial Statements.* | |
| *- | Filed herewith. |
| **- | Furnished herewith. |
28
Table of Contents
Pursuant to the requirements of the Securities Exchange Act of 1934, as amended, the registrant has duly caused this report to be signed on its behalf by the undersigned thereunto duly authorized.
| EDGEWATER TECHNOLOGY, INC. | ||||
| Date: May 5, 2017 | /s/ JEFFREY RUTHERFORD | |||
| Jeffrey Rutherford | ||||
| Chairman, Interim President and Interim Chief Executive Officer | ||||
| (Principal Executive Officer) | ||||
| Date: May 5, 2017 | /s/ TIMOTHY R. OAKES | |||
| Timothy R. Oakes | ||||
| Chief Financial Officer | ||||
| (Principal Financial and Accounting Officer) | ||||
29