Attached files
| file | filename |
|---|---|
| 8-K - 8-K - RAIT Financial Trust | d97311d8k.htm |
| Exhibit 99.1
|

Investor Presentation
September 2015
Cira Centre, 2929 Arch Street, 17th
Floor, Philadelphia, PA 19104 | 215.243.9000 | rait.com
|
|
Disclosure Notices
| 2 |
|
This document and the related presentation may contain forward-looking statements within the meaning of the Private Securities Litigation Reform Act of 1995. These forward-looking statements include, but are not limited to, statements about: RAIT Financial Trust’s (“RAIT”) plans, objectives, expectations and intentions with respect to future operations; projected dividends, net income (loss) allocable to common shares and adjustments thereto, cash available for distribution (“CAD”), and weighted average shares outstanding; and other statements that are not historical facts.
Forward-looking statements are sometimes identified by the words “project,” “assume,” “may”, “will”, “should”, “potential”, “predict”, “continue”, “guide”, “target” or other similar words or expressions. These forward-looking statements are based upon the current beliefs and expectations of RAIT’s management and are inherently subject to significant business, economic and competitive uncertainties and contingencies, many of which are difficult to predict and generally not within RAIT’s control. In addition, these forward-looking statements are subject to assumptions with respect to future business strategies and decisions that are subject to change. RAIT does not guarantee that the assumptions underlying such forward looking statements are free from errors. Actual results may differ
materially from the anticipated results discussed in these forward-looking statements.
The following factors, among others, could cause actual results to differ materially from the anticipated results or other expectations expressed in the forward- looking statements: whether dilution from our outstanding convertible senior notes or warrants or equity compensation will occur; whether we will be able to achieve our assumed loan originations, property acquisitions, gains on property sales, growth in rental revenue and levels of loan repayments; the timing and amount of investments, repayments and asset sales and capital raised; our ability to use leverage; changes in the expected yield of investments and the overall conditions in commercial real estate and the economy generally; and the risk factors and other disclosure contained in filings by RAIT with the Securities and Exchange Commission (“SEC”), including, without limitation, RAIT’s most recent annual and quarterly reports filed with SEC. RAIT’s SEC filings are available on RAIT’s website at www.rait.com.
You are cautioned not to place undue reliance on these forward-looking statements, which speak only as of the date of this presentation. All subsequent written and oral forward-looking statements attributable to RAIT or any person acting on its behalf are expressly qualified in their entirety by the cautionary statements contained or referred to in this document and the related presentation. Except to the extent required by applicable law or regulation, RAIT undertakes no obligation to update these forward-looking statements to reflect events or circumstances after the date of this presentation or to reflect the occurrence of unanticipated events.
This document and the related presentation may contain non-U.S. generally accepted accounting principles (“GAAP”) financial measures. A reconciliation of these non-GAAP financial measures to the most directly comparable GAAP financial measure is included in this document and/or RAIT’s most recent annual and quarterly reports.
This presentation is for informational purposes only and does not constitute an offer to sell or a solicitation of an offer to buy any securities of RAIT or Independence Realty Trust, Inc. (“IRT”), a RAIT consolidated and managed multifamily equity REIT.
|
|
About RAIT
| 3 |
|
RAIT Financial Trust (“RAIT”) (NYSE: RAS), is a multi-strategy commercial real estate company that utilizes a vertically integrated platform focused on lending, owning and managing commercial real estate assets nationwide.
IPO – January 1998
Scalable, “in-house”, commercial real estate platform with over 900 employees (includes property management)
RAIT is organized as an internally-managed REIT with $4.8 billion of assets under management
Offices - Philadelphia, New York, Chicago, Dallas & Charlotte
Quarterly common dividend per share of $0.18, or $0.72 annualized, which would represent a13.4% yield(1)
Seasoned executive team with strong real estate experience
1) Based on a $5.38 stock price as of September 17, 2015 and assumes dividends continue at historical rates.
|
|
Sustainable Cash-Flowing Businesses
| 4 |
|
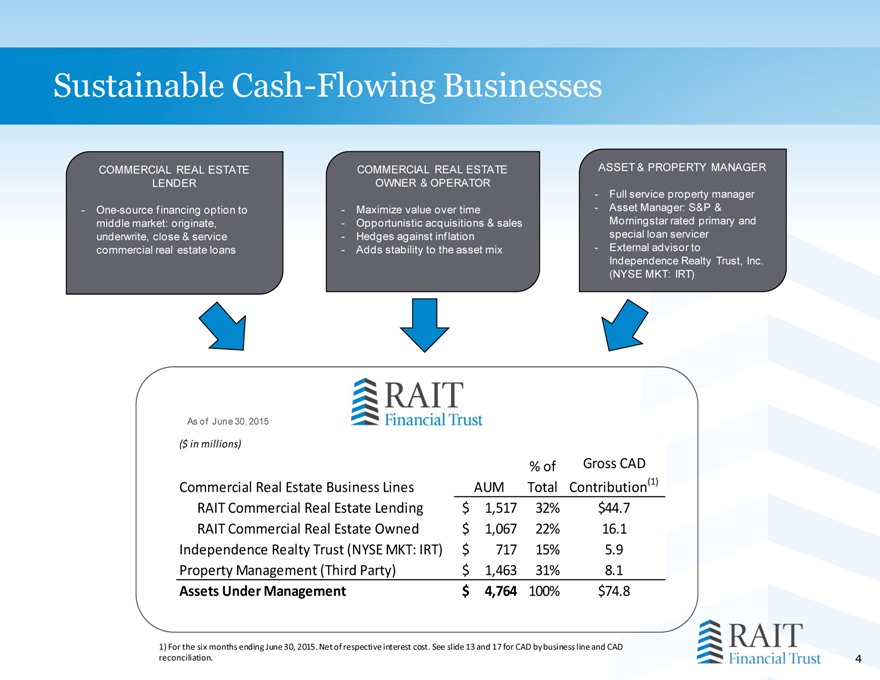
COMMERCIAL REAL ESTATE OWNER & OPERATOR
Maximize value over time
Opportunistic acquisitions & sales
Hedges against inflation
Adds stability to the asset mix
COMMERCIAL REAL ESTATE LENDER
One-source financing option to middle market: originate, underwrite, close & service commercial real estate loans
ASSET & PROPERTY MANAGER
Full service property manager
Asset Manager: S&P & Morningstar rated primary and special loan servicer
External advisor to Independence Realty Trust, Inc. (NYSE MKT: IRT)
As of June 30, 2015
($ in millions)
Commercial Real Estate Business Lines
AUM
% of Total
Gross CAD Contribution(1)
RAIT Commercial Real Estate Lending
$1,517
32%
$44.7
RAIT Commercial Real Estate Owned
$1,067
22%
16.1
Independence Realty Trust (NYSE MKT: IRT)
$717
15%
5.9
Property Management (Third Party)
$1,463
31%
8.1
Assets Under Management
$4,764
100%
$74.8
1) For the six months ending June 30, 2015. Net of respective interest cost. See slide 13 and 17 for CAD by business line and CAD reconciliation.
|
|
Commercial Real Estate Lender
| 5 |
|
$0
$150
$300
$450
$600
$750
$900
$1,050
$1,200
FY 2012
FY 2013
FY 2014
Q1 & Q2 2015
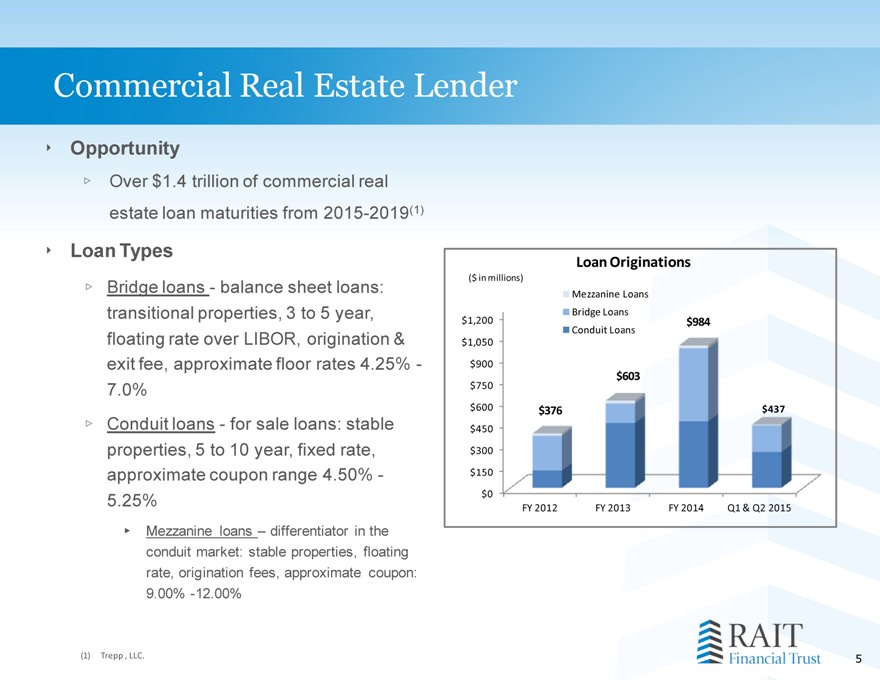
$437
Mezzanine Loans
Bridge Loans
$984
$376
$603
($ in millions)
Loan Originations
Opportunity
Over $1.4 trillion of commercial real estate loan maturities from 2015-2019(1)
Loan Types
Bridge loans - balance sheet loans: transitional properties, 3 to 5 year, floating rate over LIBOR, origination & exit fee, approximate floor rates 4.25% - 7.0%
Conduit loans for sale loans: stable properties, 5 to 10 year, fixed rate, approximate coupon range 4.50% - 5.25%
Mezzanine loans – differentiator in the conduit market: stable properties, floating rate, origination fees, approximate coupon: 9.00% -12.00%
Trepp , LLC.
|
|
Credit Profile – Q2 2015 Loan Originations
| 6 |
|
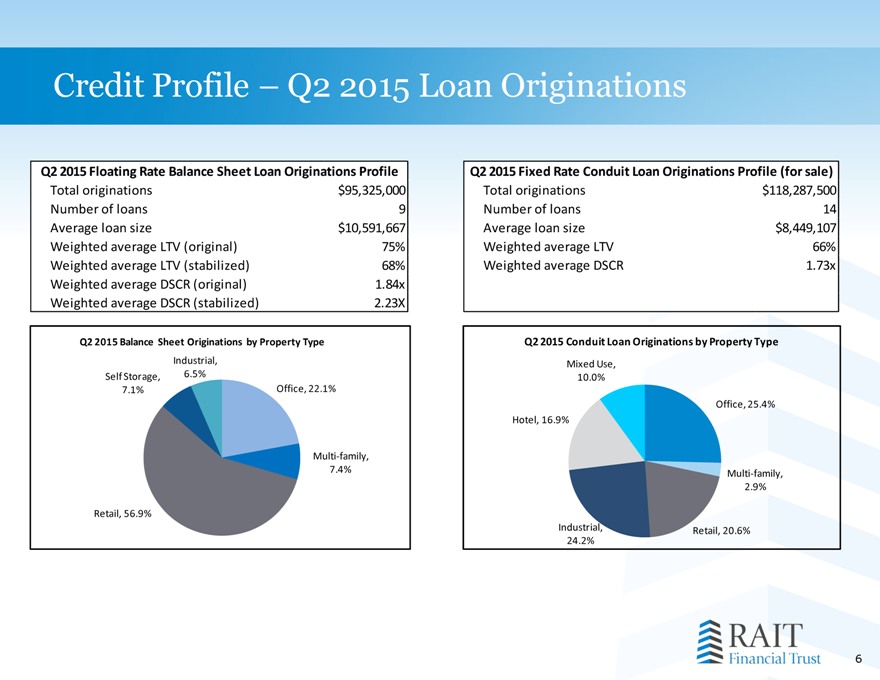
Office, 22.1%
Multi-family, 7.4%
Retail, 56.9%
Self Storage, 7.1%
Industrial, 6.5%
Q2 2015 Balance Sheet Originations by Property Type
Office, 25.4%
Multi-family, 2.9%
Retail, 20.6%
Industrial, 24.2%
Hotel, 16.9%
Mixed Use, 10.0%
Q2 2015 Conduit Loan Originations by Property Type
Total originations
$95,325,000
Number of loans
9
Average loan size
$10,591,667
Weighted average LTV (original)
75%
Weighted average LTV (stabilized)
68%
Weighted average DSCR (original)
1.84x
Weighted average DSCR (stabilized)
2.23X
Q2 2015 Floating Rate Balance Sheet Loan Originations Profile
Total originations
$118,287,500
Number of loans
14
Average loan size
$8,449,107
Weighted average LTV
66%
Weighted average DSCR
1.73x
Q2 2015 Fixed Rate Conduit Loan Originations Profile (for sale)
|
|
CRE Loan Portfolio Statistics
| 7 |
|
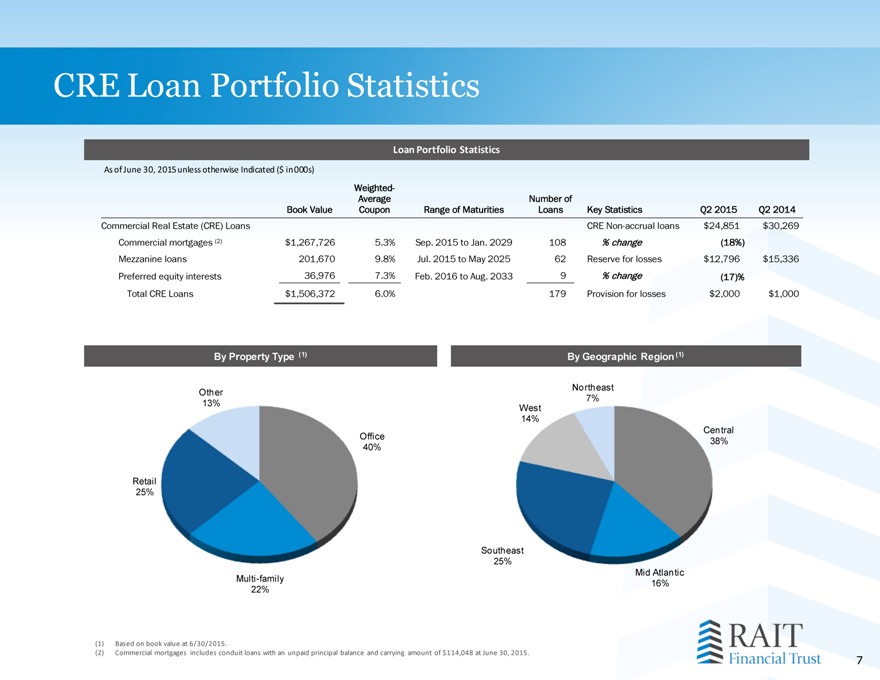
By Property Type (1)
By Geographic Region (1)
Loan Portfolio Statistics
As of June 30, 2015 unless otherwise Indicated ($ in 000s)
| (1) |
|
Based on book value at 6/30/2015. |
(2) Commercial mortgages includes conduit loans with an unpaid principal balance and carrying amount of $114,048 at June 30, 2015.
Book Value
Weighted- Average Coupon
Range of Maturities
Number of
Loans
Key Statistics
Q2 2015
Q2 2014
Commercial Real Estate (CRE) Loans
CRE Non-accrual loans
$24,851
$30,269
Commercial mortgages
| (2) |
|
$1,267,726
5.3%
Sep. 2015 to Jan. 2029
108
% change
(18%)
Mezzanine loans
201,670
9.8%
Jul. 2015 to May 2025
62
Reserve for losses
$12,796
$15,336
Preferred equity interests
36,976
7.3%
Feb. 2016 to Aug. 2033
9
% change
(17)%
Total CRE Loans
$1,506,372
6.0%
179
Provision for losses
$2,000
$1,000
Central
38%
Mid Atlantic
16%
Southeast
25%
West
14%
Northeast
7%
Office
40%
Multi-family
22%
Retail
25%
Other
13%
|
|
Commercial Real Estate Owner
| 8 |
|
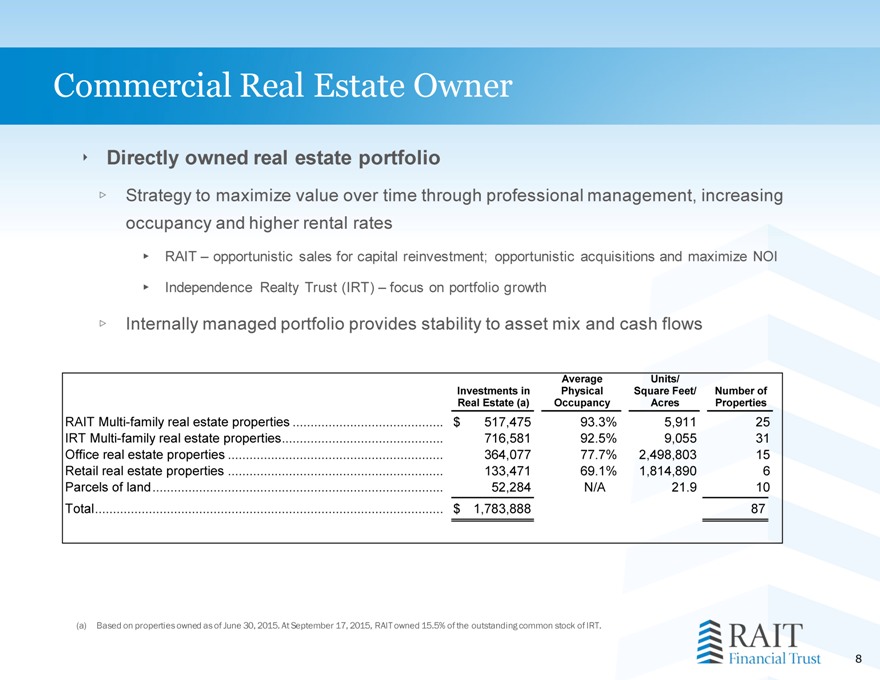
Directly owned real estate portfolio Strategy to maximize value over time through professional management, increasing occupancy and higher rental rates RAIT – opportunistic sales for capital reinvestment; opportunistic acquisitions and maximize NOI
Independence Realty Trust (IRT) – focus on portfolio growth
Internally managed portfolio provides stability to asset mix and cash flows (a)
Based on properties owned as of June 30, 2015. At September 17, 2015, RAIT owned 15.5% of the outstanding common stock of IRT.
Investments in Real Estate (a)
Average
Physical
Occupancy
Units/
Square Feet/
Acres
Number of
Properties
RAIT Multi-family real estate properties
$
517,475
93.3%
5,911
25
IRT Multi-family real estate properties
716,581
92.5%
9,055
31
Office real estate properties
364,077
77.7%
2,498,803
15
Retail real estate properties
133,471
69.1%
1,814,890
| 6 |
|
Parcels of land
52,284
N/A
21.9
10
Total
$
1,783,888
87
|
|
Directly Owned Commercial Real Estate Portfolio Statistics – RAIT & IRT
9
| (a) |
|
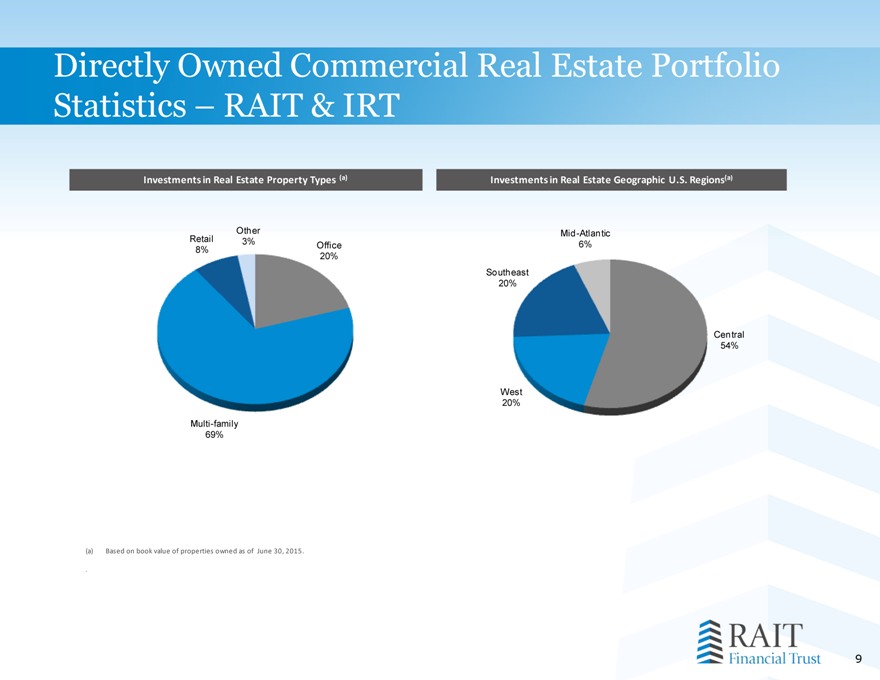
Based on book value of properties owned as of June 30, 2015. |
.
Investments in Real Estate Property Types (a)
Investments in Real Estate Geographic U.S. Regions (a)
Office
20%
Multi-family
69%
Retail
8%
Other
3%
Central
54%
West
20%
Southeast
20%
Mid-Atlantic
6%
|
|
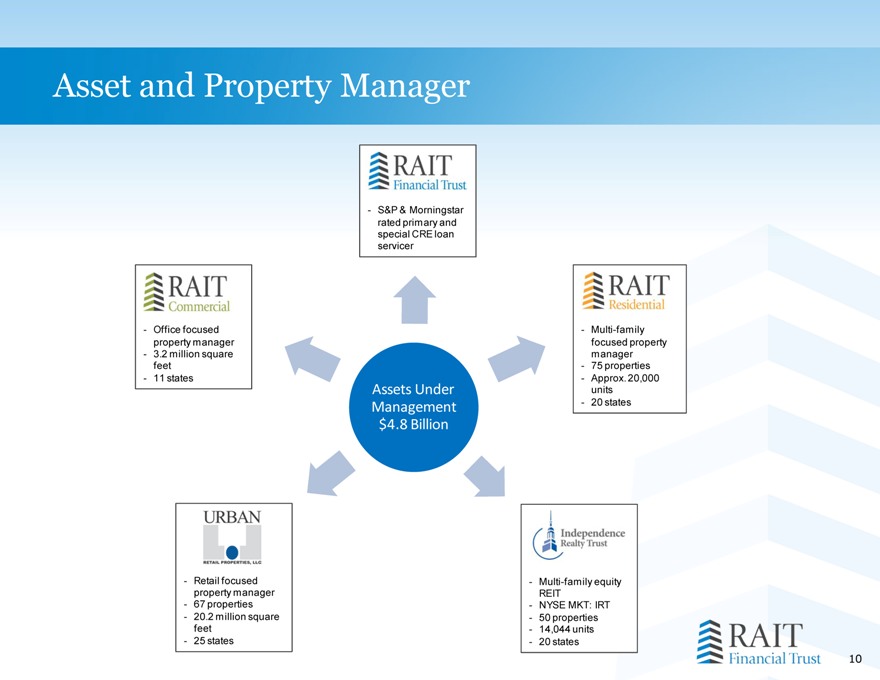
Assets Under Management $4.8 Billion
Asset and Property Manager
10
-
Multi-family focused property manager
-
75 properties
-
Approx. 20,000 units
-
20 states
-
Office focused property manager
-
3.2 million square feet
-
11 states
-
S&P & Morningstar rated primary and special CRE loan servicer
-
Multi-family equity REIT
-
NYSE MKT: IRT
-
50 properties
-
14,044 units
-
20 states
-
Retail focused property manager
-
67 properties
-
20.2 million square feet
-
25 states
|
|
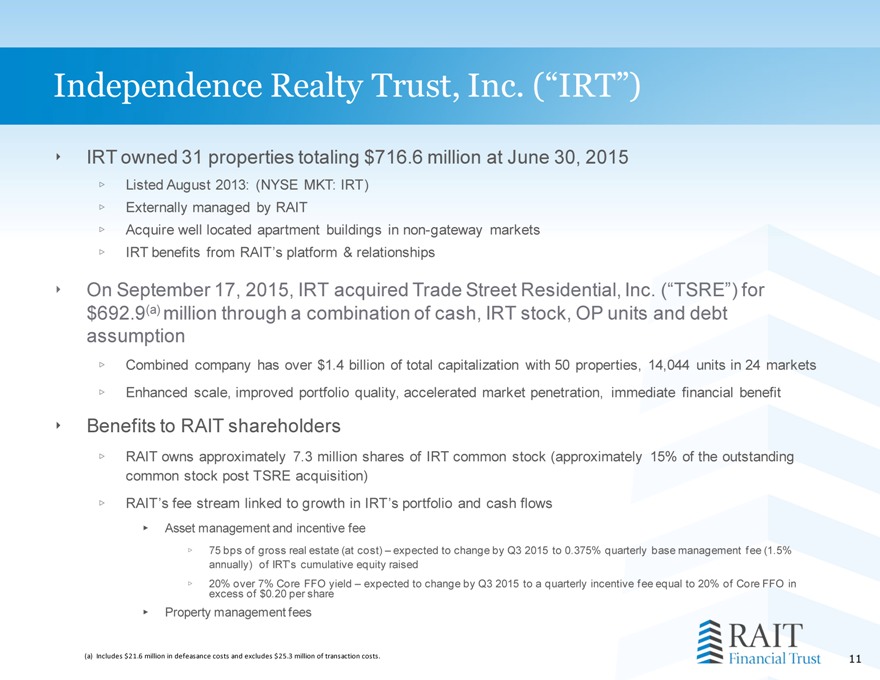
Independence Realty Trust, Inc. (“IRT”)
11
IRT owned 31 properties totaling $716.6 million at June 30, 2015
Listed August 2013: (NYSE MKT: IRT)
Externally managed by RAIT
Acquire well located apartment buildings in non-gateway markets
IRT benefits from RAIT’s platform & relationships
On September 17, 2015, IRT acquired Trade Street Residential, Inc. (“TSRE”) for $692.9
| (a) |
|
million through a combination of cash, IRT stock, OP units and debt assumption
Combined company has over $1.4 billion of total capitalization with 50 properties, 14,044 units in 24 markets
Enhanced scale, improved portfolio quality, accelerated market penetration, immediate financial benefit
Benefits to RAIT shareholders
RAIT owns approximately 7.3 million shares of IRT common stock (approximately 15% of the outstanding common stock post TSRE acquisition)
RAIT’s fee stream linked to growth in IRT’s portfolio and cash flows
Asset management and incentive fee
75 bps of gross real estate (at cost) –
expected to change by Q3 2015 to 0.375% quarterly base management fee (1.5% annually) of IRT’s cumulative equity raised 20% over 7% Core FFO yield – expected to change by Q3 2015 to a quarterly incentive fee equal to 20% of Core FFO in excess of $0.20 per share
Property management fees
(a) Includes $21.6 million in defeasance costs and excludes $25.3 million of transaction costs.
|
|
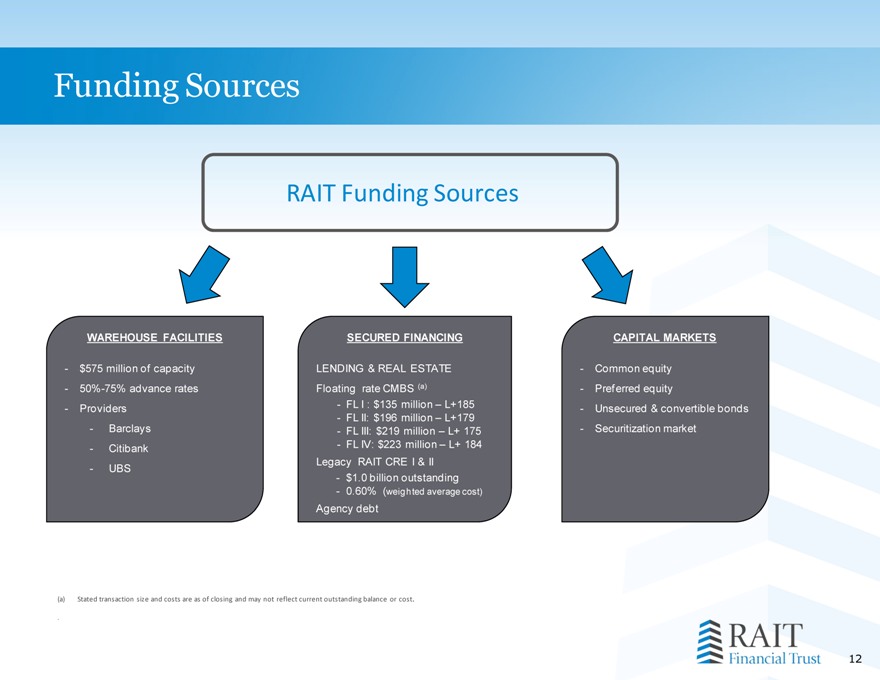
Funding Sources
12
SECURED FINANCING
LENDING & REAL ESTATE
Floating rate CMBS
| (a) |
|
-
FL I : $135 million – L+185
-
FL II: $196 million – L+179
-
FL III: $219 million – L+ 175
-
FL IV: $223 million – L+ 184
Legacy RAIT CRE I & II
-
$1.0 billion outstanding
-
0.60% (weighted average cost)
Agency debt
WAREHOUSE FACILITIES
-
$575 million of capacity
-
50%-75% advance rates
-
Providers
-
Barclays
-
Citibank
-
UBS
CAPITAL MARKETS
-
Common equity
-
Preferred equity
-
Unsecured & convertible bonds
-
Securitization market
RAIT Funding Sources
| (a) |
|
Stated transaction size and costs are as of closing and may not reflect current outstanding balance or cost.
.
|
|
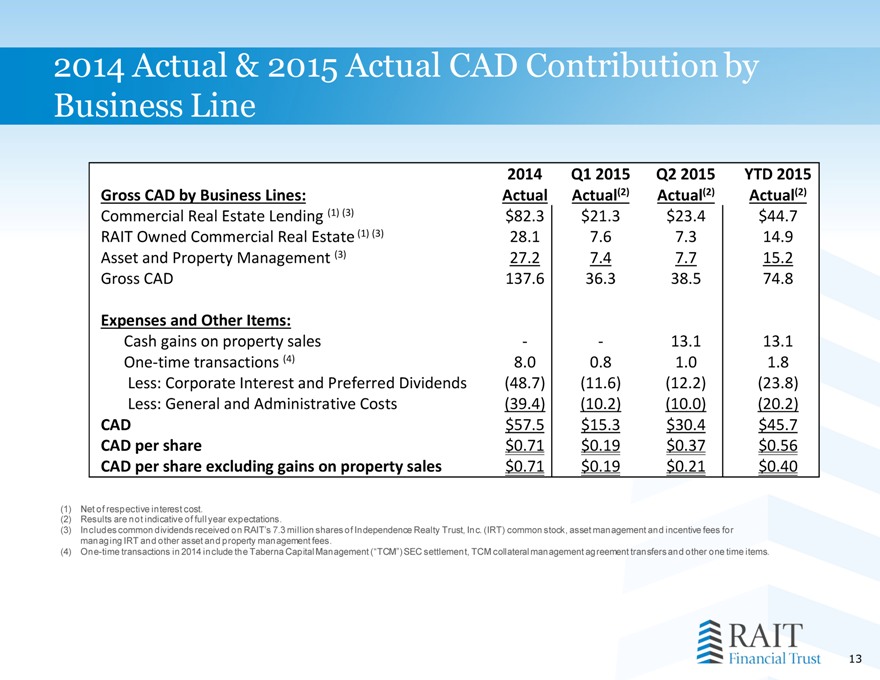
2014 Actual & 2015 Actual CAD Contribution by Business Line
13
| (1) |
|
Net of respective interest cost.
| (2) |
|
Results are not indicative of full year expectations.
| (3) |
|
Includes common dividends received on RAIT’s 7.3 million shares of Independence Realty Trust, Inc. (IRT) common stock, asset management and incentive fees for managing IRT
and other asset and property management fees.
| (4) |
|
One-time transactions in 2014 include the Taberna
Capital Management (“TCM”) SEC settlement, TCM collateral management agreement transfers and other one time items.
Gross CAD by Business Lines:
2014
Actual
Q1 2015
Actual
| (2) |
|
Q2 2015
Actual
| (2) |
|
YTD 2015
Actual
| (2) |
|
Commercial Real Estate Lending
| (1) |
|
(3) |
$82.3
$21.3
$23.4
$44.7
RAIT Owned Commercial Real Estate
| (1) |
|
(3) |
28.1
7.6
7.3
14.9
Asset and Property Management
| (3) |
|
27.2
7.4
7.7
15.2
Gross CAD
137.6
36.3
38.5
74.8
Expenses and Other Items:
Cash gains on property sales
-
-
13.1
13.1
One-time transactions
| (4) |
|
8.0
0.8
1.0
1.8
Less: Corporate Interest and Preferred Dividends
(48.7)
(11.6)
(12.2)
(23.8)
Less: General and Administrative Costs
(39.4)
(10.2)
(10.0)
(20.2)
CAD
$57.5
$15.3
$30.4
$45.7
CAD per share
$0.71
$0.19
$0.37
$0.56
CAD per share excluding gains on property sales
$0.71
$0.19
$0.21
$0.40
|
|
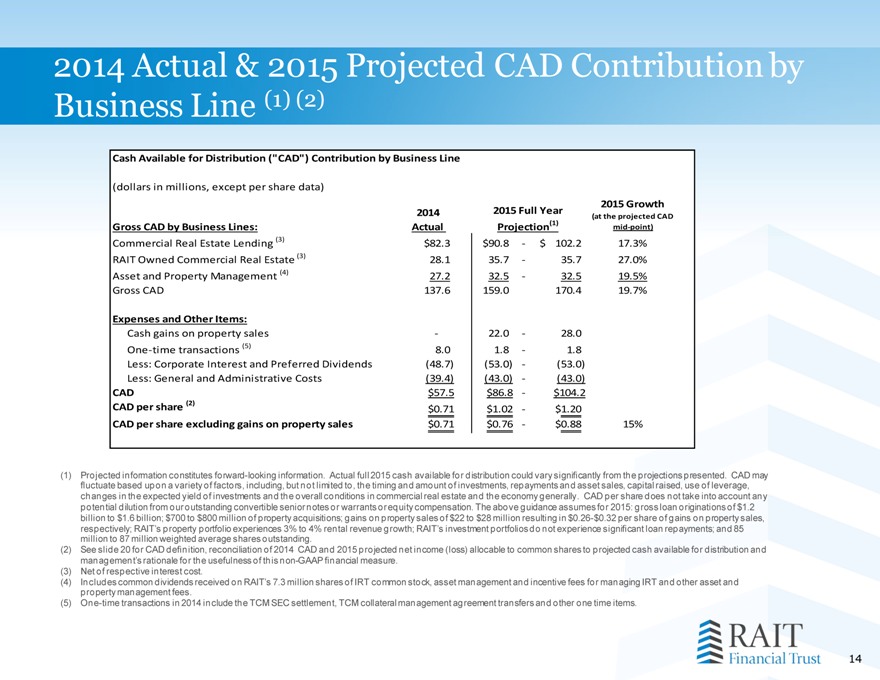
2014 Actual & 2015 Projected CAD Contribution by Business Line (1) (2)
14
| (1) |
|
Projected information constitutes forward-looking information. Actual full 2015 cash available for distribution could vary significantly from the projections presented. CAD may
fluctuate based upon a variety of factors, including, but not limited to, the timing and amount of investments, repayments and asset sales, capital raised, use of leverage, changes in
the expected yield of investments and the overall conditions in commercial real estate and the economy generally. CAD per share
does not take into account any potential dilution
from our outstanding convertible senior notes or warrants or equity compensation. The above guidance assumes for 2015: gross loan originations of $1.2 billion to $1.6 billion; $700
to $800 million of property acquisitions; gains on property sales of $22 to $28 million resulting in $0.26-$0.32 per share of gains on property sales, respectively; RAIT’s property
portfolio experiences 3% to 4% rental revenue growth; RAIT’s investment portfolios do not experience significant loan repayments; and 85 million to 87 million weighted average
shares outstanding.
| (2) |
|
See slide 20 for CAD definition, reconciliation of 2014 CAD and 2015 projected net income (loss) allocable to common shares to projected cash
available for distribution and
management’s rationale for the usefulness of this non-GAAP financial measure.
| (3) |
|
Net of respective interest cost.
| (4) |
|
Includes common dividends received on RAIT’s 7.3 million shares of IRT common stock, asset management and incentive fees for managing IRT and other asset and property
management fees.
| (5) |
|
One-time transactions in 2014 include the TCM SEC settlement, TCM collateral management agreement transfers and other one time items.
Cash Available for Distribution (“CAD”) Contribution by Business Line
(dollars in millions, except per share data)
Gross CAD by Business Lines:
2014
Actual
2015 Growth
(at the projected CAD
mid-point)
Commercial Real Estate Lending
| (3) |
|
$82.3
$90.8
-
102.2
$
17.3%
RAIT Owned Commercial Real Estate
| (3) |
|
28.1
35.7
-
35.7
27.0%
Asset and Property Management
| (4) |
|
27.2
32.5
-
32.5
19.5%
Gross CAD
137.6
159.0
170.4
19.7%
Expenses and Other Items:
Cash gains on property sales
-
22.0
-
28.0
One-time transactions
| (5) |
|
8.0
1.8
-
1.8
Less: Corporate Interest and Preferred Dividends
(48.7)
(53.0)
-
(53.0)
Less: General and Administrative Costs
(39.4)
(43.0)
-
(43.0)
CAD
$57.5
$86.8
-
$104.2
CAD per share
| (2) |
|
$0.71
$1.02
-
$1.20
CAD per share excluding gains on property sales
$0.71
$0.76
-
$0.88
15%
2015 Full Year
Projection
| (1) |
|
|
|
RAIT Highlights & Goals
15
Growth & stability through a multi-strategy approach Utilize RAIT’s core, integrated, real estate platform and management expertise to maximize shareholder value by investing in and growing RAIT’s core business lines and expand RAIT’s assets under management.
Focus on growth in RAIT’s core businesses
Commercial real estate lending
Commercial real estate ownership
Asset and property management
Opportunistic property sales
Target a mid-teen CAD return
|
|
16
Appendix
|
|
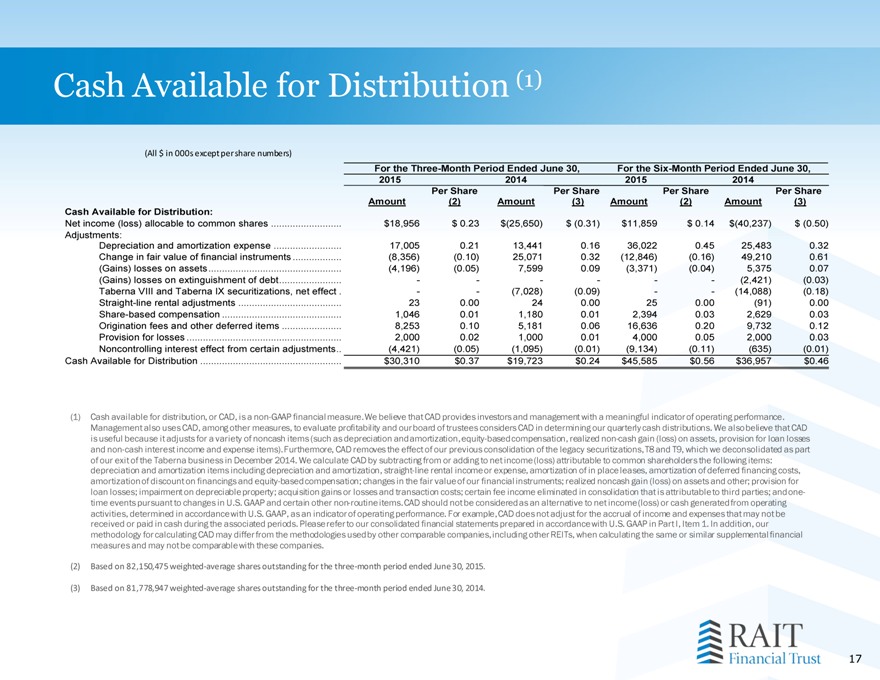
Cash Available for Distribution
| (1) |
|
17
| (1) |
|
Cash available for distribution, or CAD, is a non-GAAP financial measure. We believe that CAD provides investors and management with a meaningful indicator of operating performance. Management also uses CAD, among other measures, to evaluate profitability and our board of trustees considers CAD in determining our quarterly cash distributions. We also believe that CAD is useful because it adjusts for a variety of noncash items (such as depreciation and amortization, equity-based compensation, realized non-cash gain (loss) on assets, provision for loan losses and non-cash interest income and expense items). Furthermore, CAD removes the effect of our previous consolidation of the legacy securitizations, T8 and T9, which we deconsolidated as part of our exit of the Taberna business in December 2014. We calculate CAD by subtracting from or adding to net income (loss) attributable to common shareholders the following items: depreciation and amortization items including depreciation and amortization, straight-line rental income or expense, amortization of in place leases, amortization of deferred financing costs, amortization of discount on financings and equity-based compensation; changes in the fair value of our financial instruments; realized noncash gain (loss) on assets and other; provision for loan losses; impairment on depreciable property; acquisition gains or losses and transaction costs; certain fee income eliminated in consolidation that is attributable to third parties; and one-time events pursuant to changes in U.S. GAAP and certain other non-routine items. CAD should not be considered as an alternative to net income (loss) or cash generated from operating activities, determined in accordance with U.S. GAAP, as an indicator of operating performance. For example, CAD does not adjust for the accrual of income and expenses that may not be received or paid in cash during the associated periods. Please refer to our consolidated financial statements prepared in accordance with U.S. GAAP in Part I, Item 1. In addition, our methodology for calculating CAD may differ from the methodologies used by other comparable companies, including other REITs, when calculating the same or similar supplemental financial measures and may not be comparable with these companies.
| (2) |
|
Based on 82,150,475 weighted-average shares outstanding for the three-month period ended June 30, 2015.
| (3) |
|
Based on 81,778,947 weighted-average shares outstanding for the three-month period ended June 30, 2014.
(All $ in 000s except per share numbers)
For the Three-Month Period Ended June 30,
For the Six-Month Period Ended June 30,
2015
2014
2015
2014
Amount
Per Share
| (2) |
|
Amount
Per Shar
| (3) |
|
Amount
Per Share
| (2) |
|
Amount
Per Share
| (3) |
|
Cash Available for Distribution:
Net income (loss) allocable to common shares
$18,956
$ 0.2
$(25,650
$ (0.31
$11,859
$ 0.1
$(40,237
$ (0.50)
Adjustments:
Depreciation and amortization expense
17,005
0.2
13,44
0.1
36,022
0.4
25,48
0.32
Change in fair value of financial instruments
(8,356)
(0.10
25,07
0.3
(12,846)
(0.16
49,21
0.61
(Gains) losses on assets
(4,196)
(0.05
7,59
0.0
(3,371)
(0.04
5,37
0.07
(Gains) losses on extinguishment of debt
-
-
(2,421
(0.03)
Taberna VIII and Taberna IX securitizations, net effect
-
(7,028
(0.09
-
(14,088
(0.18)
Straight-line rental adjustments
23
0.0
| 2 |
|
0.0
25
0.0
(91
0.00
Share-based compensation
1,046
0.0
1,18
0.0
2,394
0.0
2,62
0.03
Origination fees and other deferred items
8,253
0.1
5,18
0.0
16,636
0.2
9,73
0.12
Provision for losses
2,000
0.0
1,00
0.0
4,000
0.0
2,00
0.03
Noncontrolling interest effect from certain adjustments
(4,421)
(0.05
(1,095
(0.01
(9,134)
(0.11
(635
(0.01)
Cash Available for Distribution
$30,310
$0.3
$19,72
$0.2
$45,585
$0.5
$36,95
$0.46
|
|
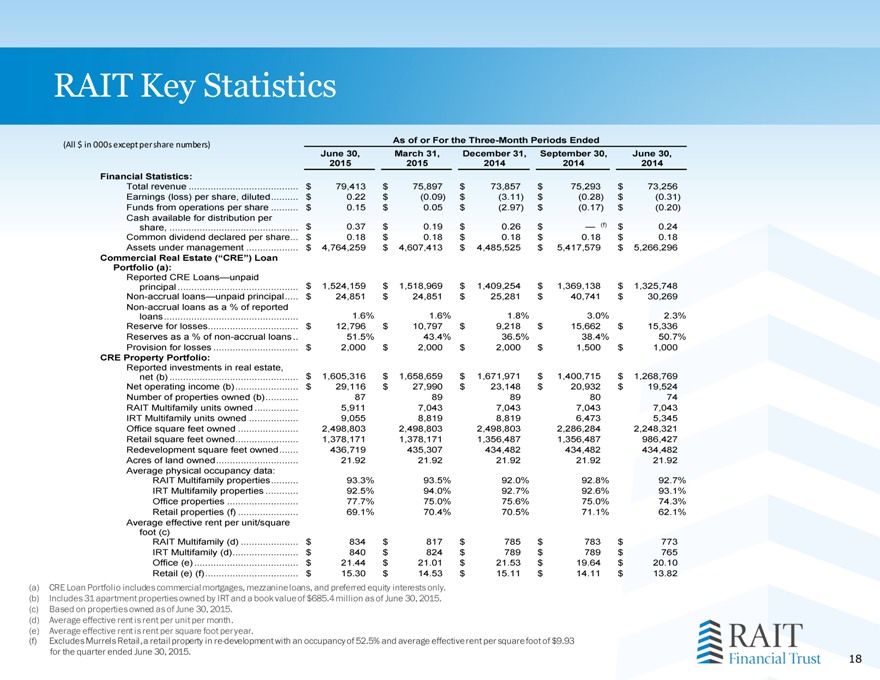
RAIT Key Statistics
18
(All $ in 000s except per share numbers)
| (a) |
|
CRE Loan Portfolio includes commercial mortgages, mezzanine loans, and preferred equity interests only.
| (b) |
|
Includes 31 apartment properties owned by IRT and a book value of $685.4 million as of June 30, 2015.
| (c) |
|
Based on properties owned as of June 30, 2015.
| (d) |
|
Average effective rent is rent per unit per month.
| (e) |
|
Average effective rent is rent per square foot per year.
| (f) |
|
Excludes Murrels
Retail, a retail property in re-development with an occupancy of 52.5% and average effective rent per square foot of $9.93
for the quarter ended June 30, 2015.
.
As of or For the Three-Month Periods Ended
June 30,
2015
March 31,
2015
December 31,
2014
September 30,
2014
June 30,
2014
Financial Statistics:
Total revenue .
$
79,413
$
75,897
$
73,857
$
75,293
$
73,256
Earnings (loss) per share, diluted
$
0.22
$
(0.09)
$
(3.11)
$
(0.28)
$
(0.31)
Funds from operations per share
$
0.15
$
0.05
$
(2.97)
$
(0.17)
$
(0.20)
Cash available for distribution per
share,
$
0.37
$
0.19
$
0.26
$
—
| (f) |
|
$
0.24
Common dividend declared per share
$
0.18
$
0.18
$
0.18
$
0.18
$
0.18
Assets under management
$
4,764,259
$
4,607,413
$
4,485,525
$
5,417,579
$
5,266,296
Commercial Real Estate (“CRE”) Loan
Portfolio (a):
Reported CRE Loans—unpaid
principal
$
1,524,159
$
1,518,969
$
1,409,254
$
1,369,138
$
1,325,748
Non-accrual loans—unpaid principal
$
24,851
$
24,851
$
25,281
$
40,741
$
30,269
Non-accrual loans as a % of reported
loans
1.6%
1.6%
1.8%
3.0%
2.3%
Reserve for losses
.
$
12,796
$
10,797
$
9,218
$
15,662
$
15,336
Reserves as a % of non-accrual loans .
51.5%
43.4%
36.5%
38.4%
50.7%
Provision for losses
$
2,000
$
2,000
$
2,000
$
1,500
$
1,000
CRE Property Portfolio:
Reported investments in real estate,
net (b)
$
1,605,316
$
1,658,659
$
1,671,971
$
1,400,715
$
1,268,769
Net operating income (b)
$
29,116
$
27,990
$
23,148
$
20,932
$
19,524
Number of properties owned (b) .
87
89
89
80
74
RAIT Multifamily units owned
5,911
7,043
7,043
7,043
7,043
IRT Multifamily units owned
9,055
8,819
8,819
6,473
5,345
Office square feet owned .
2,498,803
2,498,803
2,498,803
2,286,284
2,248,321
Retail square feet owned
1,378,171
1,378,171
1,356,487
1,356,487
986,427
Redevelopment square feet owned
.
436,719
435,307
434,482
434,482
434,482
Acres of land owned .
21.92
21.92
21.92
21.92
21.92
Average physical occupancy data:
RAIT Multifamily properties
93.3%
93.5%
92.0%
92.8%
92.7%
IRT Multifamily properties .
92.5%
94.0%
92.7%
92.6%
93.1%
Office properties
77.7%
75.0%
75.6%
75.0%
74.3%
Retail properties (f) .
69.1%
70.4%
70.5%
71.1%
62.1%
Average effective rent per unit/square
foot (c)
RAIT Multifamily (d)
$
834
$
817
$
785
$
783
$
773
IRT Multifamily (d)
$
840
$
824
$
789
$
789
$
765
Office (e) .
$
21.44
$
21.01
$
21.53
$
19.64
$
20.10
Retail (e) (f)
$
15.30
$
14.53
$
15.11
$
14.11
$
13.82
|
|
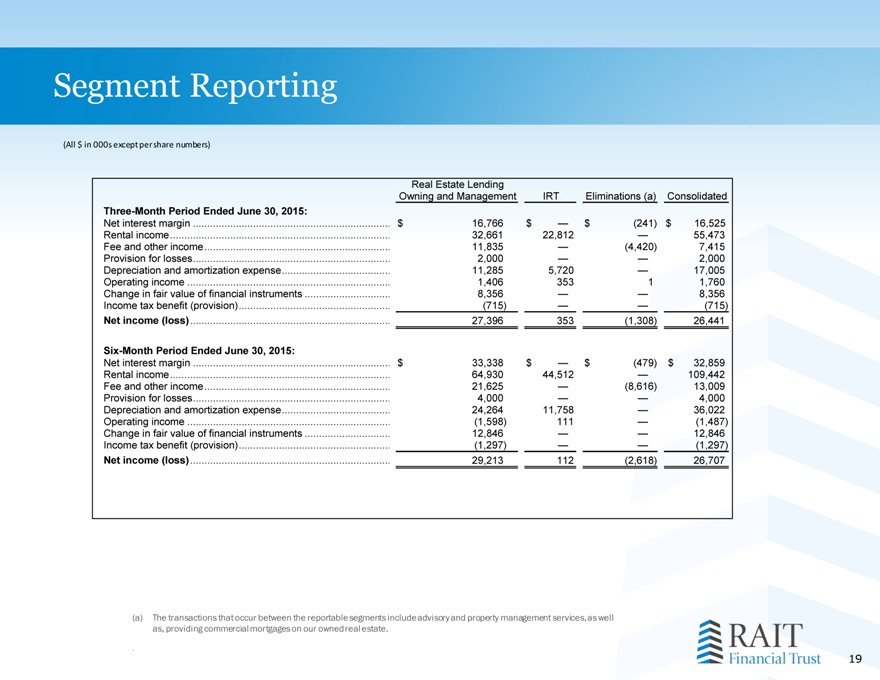
Segment Reporting
19
(All $ in 000s except per share numbers)
| (a) |
|
The transactions that occur between the reportable segments include advisory and property management services, as well as,
providing commercial mortgages on our owned real estate.
.
Real Estate Lending
Owning and Management
IRT
Eliminations (a)
Consolidated
Three-Month Period Ended June 30, 2015:
Net interest margin .
$
16,766
$
—
$
(241
$ 16,525
Rental income .
32,661
22,812
—
55,473
Fee and other income
11,835
—
(4,420
7,415
Provision for losses
.
2,000
—
—
2,000
Depreciation and amortization expense
.
11,285
5,720
—
17,005
Operating income
1,406
353
| 1 |
|
1,760
Change in fair value of financial instruments .
8,356
—
—
8,356
Income tax benefit (provision)
(715)
—
—
(715)
Net income (loss)
27,396
353
(1,308
26,441
Six-Month Period Ended June 30, 2015:
Net interest margin .
$
33,338
$
—
$
(479
$ 32,859
Rental income .
64,930
44,512
—
109,442
Fee and other income
21,625
—
(8,616
13,009
Provision for losses
.
4,000
—
—
4,000
Depreciation and amortization expense
.
24,264
11,758
—
36,022
Operating income
(1,598)
111
—
(1,487)
Change in fair value of financial instruments .
12,846
—
—
12,846
Income tax benefit (provision)
(1,297)
—
—
(1,297)
Net income (loss)
29,213
112
(2,618
26,707
|
|
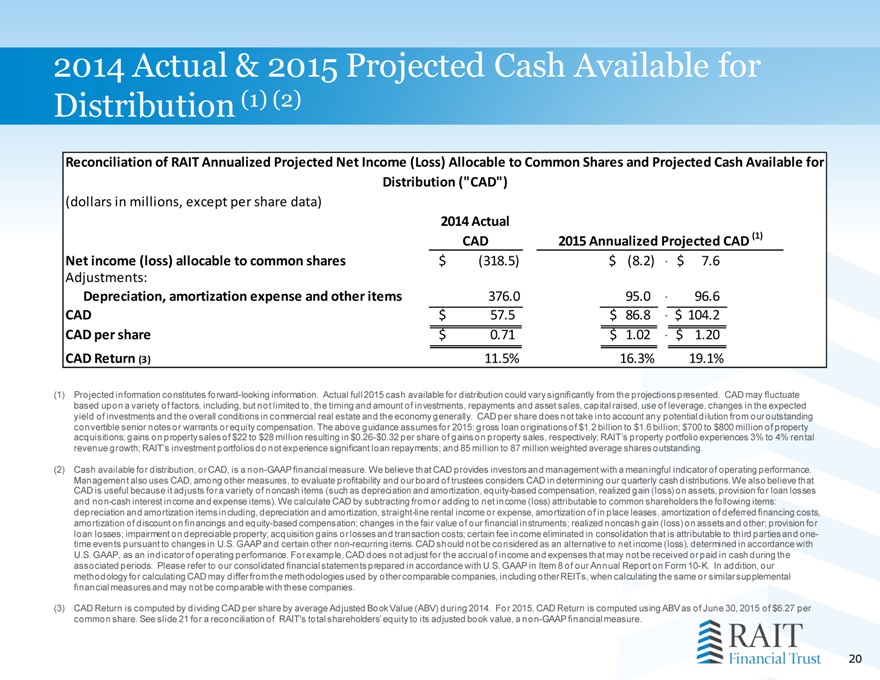
2014 Actual & 2015 Projected Cash Available for Distribution (1) (2)
20
| (1) |
|
Projected information constitutes forward-looking information. Actual full 2015 cash available for distribution could vary significantly from the projections presented. CAD may fluctuate based upon a variety of factors, including, but not limited to, the timing and amount of investments, repayments and asset sales, capital raised, use of leverage, changes in the expected yield of investments and the overall conditions in commercial real estate and the economy generally. CAD per share does not take into account any potential dilution from our outstanding convertible senior notes or warrants or equity compensation. The above guidance assumes for 2015: gross loan originations of $1.2 billion to $1.6 billion; $700 to $800 million of property acquisitions; gains on property sales of $22 to $28 million resulting in $0.26-$0.32 per share of gains on property sales, respectively; RAIT’s property portfolio experiences 3% to 4% rental revenue growth; RAIT’s investment portfolios do not experience significant loan repayments; and 85 million to 87 million weighted average shares outstanding.
| (2) |
|
Cash available for distribution, or CAD, is a non-GAAP financial measure. We believe that CAD provides investors and management with a meaningful indicator of operating performance. Management also uses CAD, among other measures, to evaluate profitability and our board of trustees considers CAD in determining our quarterly cash distributions. We also believe that CAD is useful because it adjusts for a variety of noncash items (such as depreciation and amortization, equity-based compensation, realized gain (loss) on assets, provision for loan losses and non-cash interest income and expense items). We calculate CAD by subtracting from or adding to net income (loss) attributable to common shareholders the following items: depreciation and amortization items including, depreciation and amortization, straight-line rental income or expense, amortization of in place leases, amortization of deferred financing costs, amortization of discount on financings and equity-based compensation; changes in the fair value of our financial instruments; realized noncash gain (loss) on assets and other; provision for loan losses; impairment on depreciable property; acquisition gains or losses and transaction costs; certain fee income eliminated in consolidation that is attributable to third parties and one-time events pursuant to changes in U.S. GAAP and certain other non-recurring items. CAD should not be considered as an alternative to net income (loss), determined in accordance with U.S. GAAP, as an indicator of operating performance. For example, CAD does not adjust for the accrual of income and expenses that may not be received or paid in cash during the associated periods. Please refer to our consolidated financial statements prepared in accordance with U.S. GAAP in Item 8 of our Annual Report on Form 10-K. In addition, our methodology for calculating CAD may differ from the methodologies used by other comparable companies, including other REITs, when calculating the same or similar supplemental financial measures and may not be comparable with these companies.
| (3) |
|
CAD Return is computed by dividing CAD per share by average Adjusted Book Value (ABV) during 2014. For 2015, CAD Return is computed using ABV as of June 30, 2015 of $6.27 per common share. See slide 21 for a reconciliation of RAIT’s total shareholders’ equity to its adjusted book value, a non-GAAP financial measure. (dollars in millions, except per share data)
2014 Actual
CAD
Net income (loss) allocable to common shares
(318.5)
$
(8.2)
$
7.6
$
Adjustments:
Depreciation, amortization expense and other items
376.0
95.0
96.6
CAD
57.5
$
86.8
$
104.2
$
CAD per share
0.71
$
1.02
$
1.20
$
CAD Return
| (3) |
|
11.5%
16.3%
19.1%
2015 Annualized Projected CAD
| (1) |
|
Reconciliation of RAIT Annualized Projected Net Income (Loss) Allocable to Common Shares and Projected Cash Available for
Distribution (“CAD”)
|
|
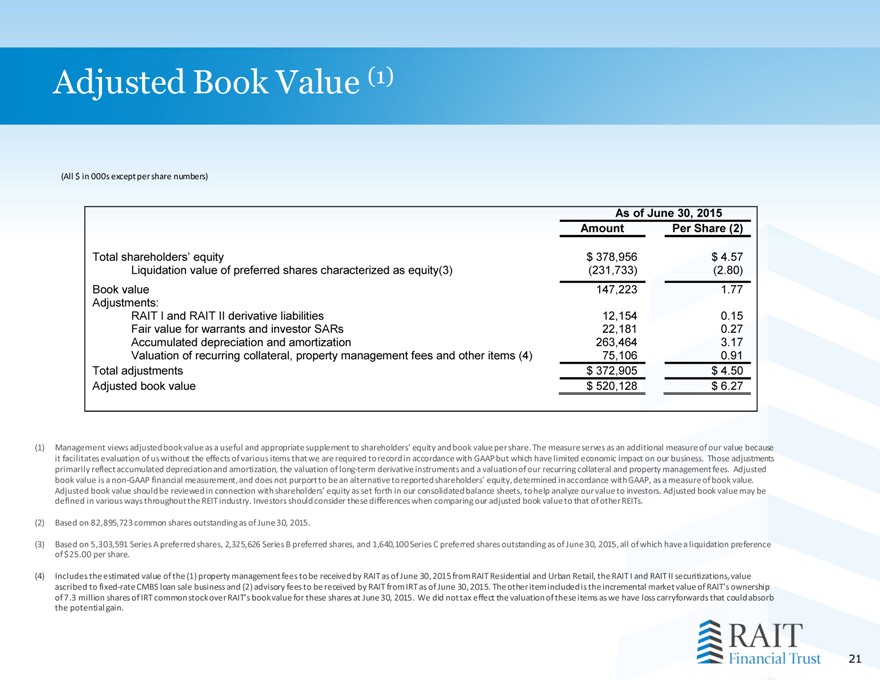
Adjusted Book Value (1)
21
(1) Management views adjusted book value as a useful and appropriate supplement to shareholders’ equity and book value per share. The measure serves as an additional measure of our value because it facilitates evaluation of us without the effects of various items that we are required to record in accordance with GAAP but which have limited economic impact on our business. Those adjustments primarily reflect accumulated depreciation and amortization, the valuation of long-term derivative instruments and a valuation of our recurring collateral and property management fees. Adjusted book value is a non-GAAP financial measurement, and does not purport to be an alternative to reported shareholders’ equity, determined in accordance with GAAP, as a measure of book value. Adjusted book value should be reviewed in connection with shareholders’ equity as set forth in our consolidated balance sheets, to help analyze our value to investors. Adjusted book value may be defined in various ways throughout the REIT industry. Investors should consider these differences when comparing our adjusted book value to that of other REITs.
| (2) |
|
Based on 82,895,723 common shares outstanding as of June 30, 2015. |
(3) Based on 5,303,591 Series A preferred shares, 2,325,626 Series B preferred shares, and 1,640,100 Series C preferred shares outstanding
as of June 30, 2015, all of which have a liquidation preference of
$25.00 per share.
| (4) |
|
Includes the estimated value of the (1) property management fees to be received by RAIT as of June 30, 2015 from RAIT Residential and Urban Retail, the RAIT I and RAIT II securitizations, value ascribed to fixed-rate CMBS loan sale business and (2) advisory fees to be received by RAIT from IRT as of June 30, 2015. The other item included is the incremental market value of RAIT’s ownership of 7.3 million shares of IRT common stock over RAIT’s book value for these shares at June 30, 2015. We did not tax effect the valuation of these items as we have loss carryforwards that could absorb the potential gain. (All $ in 000s except per share numbers)
As of June 30, 2015
Amount
Per Share (2)
Total shareholders’ equity
$ 378,956
$ 4.57
Liquidation value of preferred shares characterized as equity(3)
(231,733)
(2.80)
Book value
147,223
1.77
Adjustments:
RAIT I and RAIT II derivative liabilities
12,154
0.15
Fair value for warrants and investor SARs
22,181
0.27
Accumulated depreciation and amortization
263,464
3.17
Valuation of recurring collateral, property management fees and other items (4)
75,106
0.91
Total adjustments
$ 372,905
$ 4.50
Adjusted book value
$ 520,128
$ 6.27