Attached files
Table of Contents
UNITED STATES
SECURITIES AND EXCHANGE COMMISSION
Washington, D.C. 20549
FORM 10-K
(Mark One)
| þ | ANNUAL REPORT PURSUANT TO SECTION 13 OR 15(d) OF THE SECURITIES EXCHANGE ACT OF 1934 |
For the fiscal year ended December 31, 2010
| ¨ | TRANSITION REPORT PURSUANT TO SECTION 13 OR 15(d) OF THE SECURITIES EXCHANGE ACT OF 1934 |
For the transition period from to
Commission file number 1-14760
RAIT FINANCIAL TRUST
(Exact name of registrant as specified in its charter)
| Maryland | 23-2919819 | |
| (State or other jurisdiction of incorporation or organization) |
(IRS Employer Identification No.) | |
| 2929 Arch Street, 17th Floor Philadelphia, PA |
19104 | |
| (Address of principal executive offices) | (Zip Code) |
Registrant’s telephone number, including area code: (215) 243-9000
Securities registered pursuant to Section 12(b) of the Act:
| Title of Each Class |
Name of Each Exchange on Which Registered | |
| Common Shares of Beneficial Interest | New York Stock Exchange | |
| 7.75% Series A Cumulative Redeemable | ||
| Preferred Shares of Beneficial Interest | New York Stock Exchange | |
| 8.375% Series B Cumulative Redeemable | ||
| Preferred Shares of Beneficial Interest | New York Stock Exchange | |
| 8.875% Series C Cumulative Redeemable | ||
| Preferred Shares of Beneficial Interest | New York Stock Exchange |
Securities registered pursuant to Section 12(g) of the Act: None
Indicate by check mark if the registrant is a well-known seasoned issuer, as defined in Rule 405 of the Securities Act. Yes ¨ No þ
Indicate by check mark if the registrant is not required to file reports pursuant to Section 13 or Section 15(d) of the Exchange Act. Yes ¨ No þ
Indicate by check mark whether the registrant (1) has filed all reports required to be filed by Section 13 or 15(d) of the Securities Exchange Act of 1934 during the preceding 12 months (or for such shorter period that the registrant was required to file such reports), and (2) has been subject to such filing requirements for the past 90 days. Yes þ No ¨
Indicate by check mark whether the registrant has submitted electronically and posted on its corporate website, if any, every Interactive Date File required to be submitted and posted pursuant to Rule 405 of Regulation S-T during the preceding 12 months (or for shorter period that the registrant was required to submit and post such files). Yes ¨ No ¨
Indicate by check mark if disclosure of delinquent filers pursuant to Item 405 of Regulation S-K is not contained herein, and will not be contained, to the best of registrant’s knowledge, in definitive proxy or information statements incorporated by reference in Part III of this Form 10-K or any amendment to this Form 10-K. þ
Indicate by check mark whether the registrant is a large accelerated filer, an accelerated filer, a non-accelerated filer, or a smaller reporting company. See the definitions of “large accelerated filer”, “accelerated filer” and “smaller reporting company” in Rule 12b-2 of the Exchange Act.
| Large accelerated filer | ¨ | Accelerated filer | þ | |||||
| Non-accelerated filer | ¨ | (Do not check if a smaller reporting company) | Smaller reporting company | ¨ | ||||
Indicate by check mark whether the registrant is a shell company (as defined in Rule 12b-2 of the Exchange Act). Yes ¨ No þ
The aggregate market value of the common shares of the registrant held by non-affiliates of the registrant, based upon the closing price of such shares on June 30, 2010 of $1.87, was approximately $156,000,000.
As of February 22, 2011, 110,948,903 common shares of beneficial interest, par value $0.01 per share, of the registrant were outstanding.
DOCUMENTS INCORPORATED BY REFERENCE
Portions of the proxy statement for registrant’s 2011 Annual Meeting of Shareholders are incorporated by reference in Part III of this Form 10-K.
Table of Contents
Table of Contents
The Securities and Exchange Commission, or SEC, encourages companies to disclose forward-looking information so that investors can better understand a company’s future prospects and make informed investment decisions. This report contains or incorporates by reference such “forward-looking statements” within the meaning of Section 27A of the Securities Act of 1933, as amended, or Securities Act, and Section 21E of the Securities Exchange Act of 1934, as amended, or Exchange Act.
Words such as “anticipates,” “estimates,” “expects,” “projects,” “intends,” “plans,” “believes” and words and terms of similar substance used in connection with any discussion of future operating or financial performance identify forward-looking statements. Unless we have indicated otherwise, or the context otherwise requires, references in this report to “RAIT,” “we,” “us,” and “our” or similar terms, are to RAIT Financial Trust and its subsidiaries.
We claim the protection of the safe harbor for forward-looking statements provided in the Private Securities Litigation Reform Act of 1995. These statements may be made directly in this report and they may also be incorporated by reference in this report to other documents filed with the SEC, and include, but are not limited to, statements about future financial and operating results and performance, statements about our plans, objectives, expectations and intentions with respect to future operations, products and services, and other statements that are not historical facts. These forward-looking statements are based upon the current beliefs and expectations of our management and are inherently subject to significant business, economic and competitive uncertainties and contingencies, many of which are difficult to predict and generally beyond our control. In addition, these forward-looking statements are subject to assumptions with respect to future business strategies and decisions that are subject to change. Actual results may differ materially from the anticipated results discussed in these forward-looking statements.
The risk factors discussed and identified in item 1A of this report and in other of our public filings with the SEC, among others, could cause actual results to differ materially from the anticipated results or other expectations expressed in the forward-looking statements. We caution you not to place undue reliance on these forward-looking statements, which speak only as of the date of this report. All subsequent written and oral forward-looking statements attributable to us or any person acting on our behalf are expressly qualified in their entirety by the cautionary statements contained or referred to in this section. Except to the extent required by applicable law or regulation, we undertake no obligation to update these forward-looking statements to reflect events or circumstances after the date of this filing or to reflect the occurrence of unanticipated events.
1
Table of Contents
| Item 1. | Business |
Our Company
We are a vertically integrated commercial real estate company capable of originating, investing in, managing, servicing, trading and advising on commercial real estate-related assets. We offer a comprehensive set of debt financing options to the commercial real estate industry along with fixed income trading and advisory services. We also own and manage a portfolio of commercial real estate properties and manage real estate-related assets for third parties. We are a self-managed and self-advised Maryland real estate investment trust, or REIT, formed in August 1997, that commenced operations in January 1998.
Our investments consist primarily of the following asset classes:
| • | commercial mortgages, mezzanine loans, other loans and preferred equity interests; |
| • | investments in real estate or in entities that own commercial real estate; and |
| • | investments in debt securities issued by real estate companies, including trust preferred securities, or TruPS, and subordinated debentures, mortgage-backed securities, including commercial mortgage-backed securities, or CMBS, unsecured REIT notes and other real estate-related debt. |
Our revenue is generated primarily from:
| • | interest income from our investments, net of any financing costs, or net interest margin; |
| • | rental income from our owned real estate assets; and |
| • | fee income generated from: |
| • | originating, servicing and managing assets, |
| • | fixed income trading services, |
| • | advisory services, and |
| • | other brokerage-related services. |
During 2010, we continued to adapt to current business conditions resulting in improved financial and operating performance, as indicated by our reported net income and REIT taxable income. We saw generally continued improvement in the credit and operating performance of our core commercial real estate portfolios. We also entered into various transactions intended to deleverage our balance sheet and enable us to focus on opportunities in financing and owning commercial real estate. These transactions included repurchasing our convertible senior notes and CDO notes payable at discounts and converting non-performing commercial real estate loans to owned properties. For further discussion of our performance and these transactions, see Item 7— “Management’s Discussion and Analysis of Financial Condition and Results of Operations.”
Business Strategy
Our objective is to provide our shareholders with total returns over time while managing the risks associated with our investment strategy. The core components of our business strategy are described in more detail below.
Provide commercial real estate financing. We provide a comprehensive set of debt financing options to the commercial real estate industry, including commercial mortgages, mezzanine loans, other loans and preferred equity interests. As discussed below, the size of our loan portfolio decreased in 2010, primarily due to our conversion of loans to owned real estate assets and repayments by existing borrowers. See “Our Investment Portfolio- Commercial mortgages, mezzanine loans, other loans and preferred equity interest” below for a description of the investment portfolio resulting from this strategy.
2
Table of Contents
Own commercial real estate. Our ownership of commercial real estate has grown recently as we have restructured loans in response to credit events to take control of properties where we believe we can continue to generate or enhance our risk-adjusted returns. During 2010, our efforts to stabilize these properties contributed to increased overall occupancy from 69.8% at December 31, 2009 to 79.2% at December 31, 2010. We continue to expand our internal multifamily property management capabilities through our subsidiary Jupiter Communities, LLC, or Jupiter Communities, and our internal office property management capabilities through our subsidiary CRP Commercial Services, LLC, or CRP Commercial Services. See “Our Investment Portfolio- Investments in real estate” below for a description of the investment portfolio resulting from this strategy.
We have financed our owned commercial real estate portfolio through secured mortgages held by either third party lenders or our commercial real estate securitizations. See “Financing Strategy” below.
Manage our portfolio of debt securities issued by real estate companies. Included in our assets are debt securities issued by real estate companies. As noted above, we have not sought to originate new investments in this portfolio in order to focus on commercial real estate loans and properties. We continue to manage the debt securities remaining in our portfolio and earn senior management fees. See “Our Investment Portfolio- Investment in debt securities” below for a description of the investment portfolio resulting from this strategy.
Generate fee income. We manage a portfolio of real estate related assets. As of December 31, 2010, we had $3.8 billion of assets under management. Assets under management are comprised of our consolidated assets and assets we manage but do not consolidate. At December 31, 2010, we served as the collateral manager on five securitizations that are collateralized by U.S. commercial real estate investments, TruPS and various real-estate related debt securities. We also service our U.S. commercial real estate investments. We have been added to Standard & Poor’s select servicer list as a commercial mortgage primary servicer and special servicer. We generate fee income from our asset management efforts, primarily from serving as collateral manager. During the year ended December 31, 2010, we sold or delegated our rights as collateral manager on eight other securitizations collateralized by U.S. and European TruPS and various real-estate related debt securities which resulted in a reduction in the amount of our assets under management and a corresponding reduction in the amount of collateral management fees earned.
In 2010, we continued to seek to increase fee income generated by our registered broker-dealer subsidiary, RAIT Securities, LLC, or RAIT Securities, by expanding our fixed income trading services primarily in riskless principal transactions and initiating a money-market securities trading platform for investors.
Financing Strategy. We have financed a substantial portion of our portfolio investments through borrowing and securitization strategies that seek to match the payment terms, interest rate and maturity dates of our financings with the payment terms, interest rate and maturity dates of those investments. We seek to mitigate interest rate risk through derivative instruments. We own junior debt tranches and equity of a number of the securitizations which finance our investment portfolios.
We financed a majority of our commercial real estate loan portfolio through two non-recourse loan securitizations, RAIT CRE CDO I, Ltd., or RAIT I, and RAIT Preferred Funding II, Ltd., or RAIT II, which aggregate $1.85 billion of loan capacity. RAIT I and RAIT II are among the five securitizations referenced above where we serve as collateral manager. These financing structures have reinvestment rights that permit us to replace maturing loan collateral with new loans up through the fifth year anniversary of each financing in November 2011 and June 2012. We retained all of the most junior debt tranche (BB rated) and all of the preferred equity issued by these consolidated securitizations and have acquired various other securities issued by these securitizations. RAIT I and RAIT II continue to meet all their performance tests and we continue to receive distributions on our retained interests as well as our collateral management fees.
We finance our acquisitions of real estate through a combination of secured mortgage financing provided by third party financial institutions and existing financing provided by RAIT I and RAIT II. During 2010, we acquired $123.1 million of direct real estate investments upon conversion of $141.2 million of commercial real estate loans, generally retaining the existing financing provided by RAIT I and RAIT II.
3
Table of Contents
We financed most of our debt securities portfolio in a series of non-recourse debt securities securitizations which provided long-dated, interest-only, match funded financing to the TruPS and subordinated debenture investments. As of December 31, 2010, we retained a controlling interest in two securitizations, Taberna Preferred Funding VIII, Ltd., or Taberna VIII and Taberna Preferred Funding IX, Ltd., or Taberna IX, which are consolidated entities. During 2010, due to the credit performance of the underlying collateral, Taberna VIII and Taberna IX are failing several of the over-collateralization tests and as such, interest payments are being re-directed from the lower tranches of debt securities to repay principal of senior tranches of debt securities issued by the securitizations. During 2010, $37.9 million of interest was re-directed to repay principal in these securitizations. While our retained interests in these securitizations currently do not generate cash flow for our retained interests, we continue to act as collateral manager and receive collateral management fees.
See Item 7—“Management’s Discussion and Analysis of Financial Condition and Results of Operations-Securitization Summary” for further discussion of our securitizations.
Our Investment Portfolio
Our consolidated investment portfolio is currently comprised of the following asset classes:
Commercial mortgages, mezzanine loans, other loans and preferred equity interests. We own and originate senior long-term mortgage loans, short-term bridge loans, subordinated, or “mezzanine,” financing and preferred equity interests. These assets are in most cases “non-recourse” or limited recourse loans secured by commercial real estate assets or real estate entities. This means that we look primarily to the assets securing the payment of the loan, subject to certain standard exceptions. We may from time to time acquire existing commercial real estate loans from third parties who have originated such loans, including banks, other institutional lenders or third-party investors. Where possible, we seek to maintain direct lending relationships with borrowers, as opposed to investing in loans controlled by third party lenders.
The tables below describe certain characteristics of our commercial mortgages, mezzanine loans, other loans and preferred equity interests as of December 31, 2010 (dollars in thousands):
| Book Value | Weighted- Average Coupon |
Range of Maturities | Number of Loans |
|||||||||||||
| Commercial Real Estate (CRE) Loans |
||||||||||||||||
| Commercial mortgages |
$ | 708,232 | 6.7 | % | Mar. 2011 to Dec. 2020 | 43 | ||||||||||
| Mezzanine loans |
375,337 | 9.5 | % | Mar. 2011 to Nov. 2038 | 109 | |||||||||||
| Preferred equity interests |
80,681 | 9.8 | % | Nov. 2011 to Aug. 2025 | 22 | |||||||||||
| Total CRE Loans |
1,164,250 | 7.8 | % | 174 | ||||||||||||
| Other loans |
56,423 | 6.3 | % | Mar. 2011 to Oct. 2016 | 5 | |||||||||||
| Total investments in loans |
$ | 1,220,673 | 7.7 | % | 179 | |||||||||||
We currently have limited capacity to originate new investments. However, we are focusing on this asset class as economic conditions improve and our lending capacity increases.
4
Table of Contents
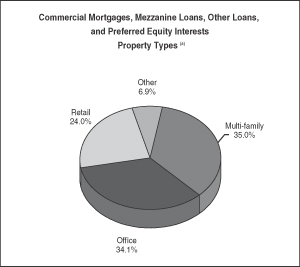
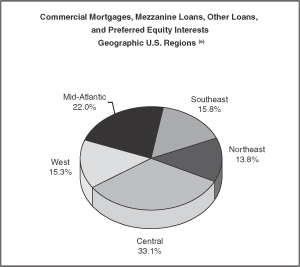
The charts below describe the property types and the geographic breakdown of our commercial mortgages, mezzanine loans, other loans, and preferred equity interests as of December 31, 2010:
|
|
| (a) | Based on book value. |
Investments in real estate. We generate a return on our real estate investments through rental income and other sources of income from the operations of our real estate investments. By owning real estate, we also participate in any increase in the value of the real estate in addition to current income. We finance our real estate holdings through a combination of secured mortgage financing provided by financial institutions and existing financing provided by our two CRE loan securitizations. During 2010, we acquired $123.1 million of real estate investments upon conversion of $141.2 million of commercial real estate loans, typically retaining the existing financing provided by our two CRE loan securitizations.
The table below describes certain characteristics of our investments in real estate as of December 31, 2010 (dollars in thousands, except average effective rent):
| Investments in Real Estate (a) |
Average Physical Occupancy |
Units/ Square Feet/ Acres |
Number of Properties |
Average Effective Rent (b) | ||||||||||||||||||||
| For the Year Ended December 31, 2010 |
For the Year Ended December 31, 2009 |
|||||||||||||||||||||||
| Multi-family real estate properties (a) (c) |
$ | 575,983 | 85.5 | % | 8,311 | 33 | $ | 728 | $ | 646 | ||||||||||||||
| Office real estate properties (d) |
203,308 | 67.8 | % | 1,632,978 | 9 | 18.02 | 23.79 | |||||||||||||||||
| Retail real estate properties (d) |
39,989 | 58.8 | % | 1,116,112 | 2 | 9.39 | 10.84 | |||||||||||||||||
| Parcels of land |
22,208 | — | 7.3 | 3 | — | — | ||||||||||||||||||
| Total |
$ | 841,488 | 79.2 | % | 47 | |||||||||||||||||||
| (a) | Investments in real estate include $48.9 million of assets held for sale as of December 31, 2010. |
| (b) | Based on operating performance for the year ended December 31, 2010. |
| (c) | Average effective rent is rent per unit per month. |
| (d) | Average effective rent is rent per square foot per year. |
5
Table of Contents
We expect this asset category to increase in size as we may find it desirable to protect or enhance our risk-adjusted returns by taking control of properties underlying our commercial real estate loans when restructuring or otherwise exercising our remedies regarding underperforming loans.
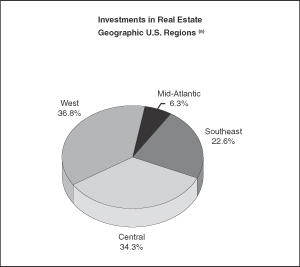
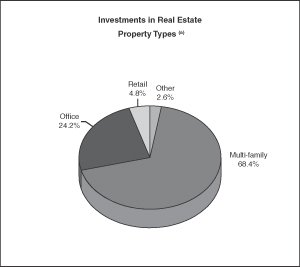
The charts below describe the property types and the geographic breakdown of our investments in real estate as of December 31, 2010:
|
|
| (a) | Based on book value. |
Investment in debt securities—TruPS and Subordinated Debentures. Historically, we provided REITs and real estate operating companies the ability to raise subordinated debt capital through TruPS and subordinated debentures. TruPS are long-term instruments, with maturities ranging from 5 to 30 years, which are priced based on short-term variable rates, such as the three-month London Inter-Bank Offered Rate, or LIBOR. TruPS are unsecured and generally contain minimal financial and operating covenants. We financed most of our debt securities portfolio in a series of non-recourse securitizations which provided long-dated, interest-only, match funded financing to the TruPS and subordinated debenture investments. As of December 31, 2010, we retained a controlling interest in two such securitizations—Taberna VIII and Taberna IX, which are consolidated entities. All of the collateral assets for the debt securities and the related non-recourse securitization financing obligations are presented at fair value in our consolidated financial statements. During 2010, due to the non-recourse nature of these entities and the recent credit performance of the underlying collateral, we received only our senior collateral management fees from these two securitizations.
6
Table of Contents
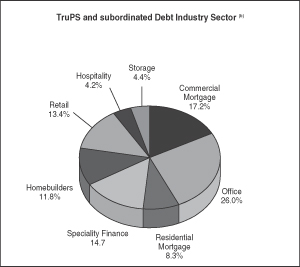
The table below describes our investment in TruPS and subordinated debentures as included in our consolidated financial statements as of December 31, 2010 (dollars in thousands):
| Issuer Statistics | ||||||||||||||||
| Industry Sector |
Estimated Fair Value |
Weighted- Average Coupon |
Weighted Average Ratio of Debt to Total Capitalization |
Weighted Average Interest Coverage Ratio |
||||||||||||
| Commercial Mortgage |
$ | 92,183 | 2.6 | % | 62.4 | % | 1.5x | |||||||||
| Office |
139,972 | 7.8 | % | 61.2 | % | 2.2x | ||||||||||
| Residential Mortgage |
44,478 | 2.3 | % | 79.5 | % | 2.4x | ||||||||||
| Specialty Finance |
79,220 | 4.3 | % | 86.0 | % | 1.7x | ||||||||||
| Homebuilders |
63,427 | 7.8 | % | 61.7 | % | 1.1x | ||||||||||
| Retail |
72,257 | 3.8 | % | 83.8 | % | 1.2x | ||||||||||
| Hospitality |
22,459 | 6.2 | % | 83.0 | % | 2.9x | ||||||||||
| Storage |
23,564 | 8.0 | % | 60.6 | % | 2.2x | ||||||||||
| Total |
$ | 537,560 | 5.0 | % | 70.5 | % | 1.8x | |||||||||
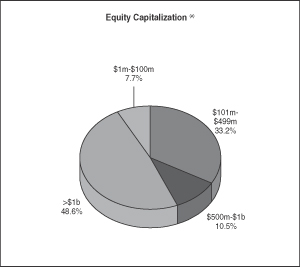
The chart below describes the equity capitalization of our investment in TruPS and subordinated debentures as included in our consolidated financial statements as of December 31, 2010:
|
|
| (a) | Based on the most recent information available to management as provided by our TruPS issuers or through public filings. |
| (b) | Based on estimated fair value. |
Investment in debt securities—Other Real Estate Related Debt Securities. We have invested, and expect to continue to invest, in CMBS, unsecured REIT notes and other real estate-related debt securities.
Unsecured REIT notes are publicly traded debentures issued by large public reporting REITs and other real estate companies. These debentures generally pay interest semi-annually. These companies are generally rated investment grade by one or more nationally recognized rating agencies.
7
Table of Contents
CMBS generally are multi-class debt or pass-through certificates secured or backed by single loans or pools of mortgage loans on commercial real estate properties. Our CMBS investments may include loans and securities that are rated investment grade by one or more nationally-recognized rating agencies, as well as both unrated and non-investment grade loans and securities.
The table and the chart below describe certain characteristics of our real estate-related debt securities as of December 31, 2010 (dollars in thousands):
| Investment Description |
Estimated Fair Value |
Weighted- Average Coupon |
Weighted- Average Years to Maturity |
Book Value | ||||||||||||
| Unsecured REIT note receivables |
$ | 62,490 | 6.6 | % | 6.7 | $ | 61,000 | |||||||||
| CMBS receivables |
77,142 | 5.7 | % | 33.0 | 158,868 | |||||||||||
| Other securities |
28,259 | 2.8 | % | 31.8 | 119,077 | |||||||||||
| Total |
$ | 167,891 | 4.8 | % | 28.0 | $ | 338,945 | |||||||||
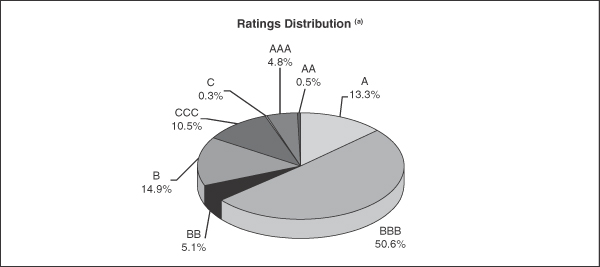
| (a) | S&P Ratings as of December 31, 2010. |
Certain REIT and Investment Company Act Limits On Our Strategies
REIT Limits
We conduct our operations so as to qualify as a REIT. Our subsidiary, Taberna Realty Finance Trust, or Taberna, is also a REIT and we cause Taberna to conduct its operations to qualify as a REIT. For a discussion of the tax implications of our and Taberna’s REIT status to us and our shareholders, see “Material U.S. Federal Income Tax Considerations” contained in Exhibit 99.1 to this Annual Report on Form 10-K. To qualify as a REIT, we and Taberna must continually satisfy various tests regarding sources of income, nature and diversification of assets, amounts distributed to shareholders and the ownership of common shares. In order to satisfy these tests, we and Taberna may be required to forgo investments that might otherwise be made. Accordingly, compliance with the REIT requirements may hinder our or Taberna’s investment performance. These requirements include the following:
| • | For each of ourselves and Taberna, at least 75% of total assets and 75% of gross income must be derived from qualifying real estate assets, whether or not such assets would otherwise represent our or |
8
Table of Contents
| Taberna’s best investment alternative. For example, since neither TruPS nor investments in the debt or equity of securitizations are qualifying real estate assets, to the extent that we have historically invested in such assets, or may do so in the future, Taberna (and we, to the extent that we invest in such assets) must hold substantial investments in qualifying real estate assets, including mortgage loans and CMBS, which may have lower yields than such investments. Also, at least 95% of each of our and Taberna’s gross income in each taxable year, excluding gross income from prohibited transactions, must be derived from some combination of income that qualifies under the 75% gross income test described above, as well as other dividends, interest, and gain from the sale or disposition of shares or securities, which need not have any relation to real property. |
| • | A REIT’s net income from prohibited transactions is subject to a 100% penalty tax. In general, prohibited transactions are sales or other dispositions of property, other than foreclosure property, but including any mortgage loans, held in inventory or primarily for sale to customers in the ordinary course of business. The prohibited transaction tax may apply to any sale of assets to a CDO and to any sale of CDO securities, and therefore may limit our and Taberna’s ability to sell assets to or equity in CDOs and other assets. |
| • | Overall, no more than 25% of the value of a REIT’s assets may consist of securities of one or more taxable REIT subsidiaries, or TRSs. Taberna Capital LLC, or Taberna Capital, RAIT Securities LLC, or RAIT Securities, Jupiter Communities, RAIT Securities (U.K.) Ltd., or RAIT Securities UK, RAIT Capital Ltd., Taberna Funding LLC, or Taberna Funding, Taberna Equity Funding, Ltd., or Taberna Equity Funding, and Taberna’s non-U.S. corporate subsidiaries are TRSs. Taberna’s ability to invest in CDOs that are structured as TRSs and to grow or expand the fee-generating businesses of Taberna Capital and RAIT Securities, as well as the business of Taberna Funding, RAIT Securities UK, RAIT Capital Ltd. and future TRSs Taberna may form, will be limited by Taberna’s need to meet this 25% test, which may adversely affect distributions Taberna pays to us. |
| • | The REIT provisions of the Internal Revenue Code limit our and Taberna’s ability to hedge mortgage-backed securities, preferred securities and related borrowings. Except to the extent provided by the regulations promulgated by the U.S. Treasury Department, or the Treasury regulations, any income from a hedging transaction we or Taberna enter into in the normal course of business primarily to manage risk of interest rate or price changes or currency fluctuations with respect to borrowings made or to be made, or ordinary obligations incurred or to be incurred, to acquire or carry real estate assets, which is clearly identified as specified in the Treasury regulations before the close of the day on which it was acquired, originated, or entered into, including gain from the sale or disposition of such a transaction, will not constitute gross income for purposes of the 95% gross income test (and will generally constitute non-qualifying income for purposes of the 75% gross income test). To the extent that we or Taberna enter into other types of hedging transactions, the income from those transactions is likely to be treated as non- qualifying income for purposes of both of the gross income tests. As a result, we or Taberna might have to limit use of advantageous hedging techniques or implement those hedges through TRSs. This could increase the cost of our or Taberna’s hedging activities or expose it or us to greater risks associated with changes in interest rates than we or it would otherwise want to bear. |
There are other risks arising out of our and Taberna’s need to comply with REIT requirements. See Item 1A—“Risk Factors-Tax Risks” below.
Investment Company Act Limits
We seek to conduct our operations so that we are not required to register as an investment company. Under Section 3(a)(1) of the Investment Company Act, a company is not deemed to be an “investment company” if:
| • | it neither is, nor holds itself out as being, engaged primarily, nor proposes to engage primarily, in the business of investing, reinvesting or trading in securities; and |
9
Table of Contents
| • | it neither is engaged nor proposes to engage in the business of investing, reinvesting, owning, holding or trading in securities and does not own or propose to acquire “investment securities” having a value exceeding 40% of the value of its total assets on an unconsolidated basis, which we refer to as the 40% test. “Investment securities” excludes U.S. government securities and securities of majority-owned subsidiaries that are not themselves investment companies and are not relying on the exception from the definition of investment company under Section 3(c)(1) or Section 3(c)(7) of the Investment Company Act. |
We rely on the 40% test. Because we are a holding company that conducts our businesses through wholly-owned or majority-owned subsidiaries, the securities issued by our subsidiaries that are excepted from the definition of “investment company” under Section 3(c)(1) or Section 3(c)(7) of the Investment Company Act, together with any other investment securities we may own, may not have a combined value in excess of 40% of the value of our total assets on an unconsolidated basis. In fact, based on the relative value of our investment in Taberna, on the one hand, and our investment in RAIT Partnership, L.P., or RAIT Partnership, on the other hand, we can comply with the 40% test only if Taberna satisfies the 40% test on which it relies (or another exemption other than Section 3(c)(1) or 3(c)(7)) and RAIT Partnership complies with Section 3(c)(5)(c) or 3(c)(6), the exemptions upon which it relies (or another exemption other than Section 3(c)(1) or 3(c)(7)). This requirement limits the types of businesses in which we may engage through our subsidiaries.
None of RAIT, RAIT Partnership or Taberna has received a no-action letter from the SEC regarding whether it complies with the Investment Company Act or how its investment or financing strategies fit within the exclusions from regulation under the Investment Company Act that it is using. To the extent that the SEC provides more specific or different guidance regarding, for example, the treatment of assets as qualifying real estate assets or real estate-related assets, we may be required to adjust these investment and financing strategies accordingly. See Item 1A—“Risk Factors- Other Regulatory and Legal Risks of Our Business- Loss of our Investment Company Act exemption would affect us adversely.”
Competition
We are subject to significant competition in all aspects of our business. Existing industry participants and potential new entrants compete with us for the available supply of investments suitable for origination or acquisition, as well as for debt and equity capital. We compete with many third parties engaged in real estate finance and investment activities, including other REITs, specialty finance companies, savings and loan associations, banks, mortgage bankers, insurance companies, mutual funds, institutional investors, investment banking firms, lenders, governmental bodies and other entities. With respect to our investments in real estate, we face significant competition from other owners, operators and developers of properties, many of which own properties similar to ours in markets where we operate. Competition may increase, and other companies and funds with investment objectives similar to ours may be organized in the future. Some of these competitors have, or in the future may have, substantially greater financial resources than we do and generally may be able to accept more risk. They may also enjoy significant competitive advantages that result from, among other things, a lower cost of capital and enhanced operating efficiencies. In addition, competition may lead us to pay a greater portion of the origination fees that we expect to collect in our future origination activities to third-party investment banks and brokers that introduce borrowers to us in order to continue to generate new business from these sources.
Employees
As of February 15, 2011, we had 405 employees and believe our relationships with our employees to be good. None of our employees is covered by a collective bargaining agreement.
10
Table of Contents
Available Information
We file annual, quarterly and current reports, proxy statements and other information with the SEC. The public may read and copy any materials we file with the SEC at the SEC’s Public Reference Room at 100 F Street, NE., Washington, DC 20549. The public may obtain information on the operation of the Public Reference Room by calling the SEC at 1-800-SEC-0330. The SEC maintains an internet site that contains reports, proxy and information statements, and other information regarding issuers that file electronically with the SEC. The internet address of the SEC site is http://www.sec.gov. Our internet address is http://www.raitft.com. We make our SEC filings available free of charge on or through our internet website as soon as reasonably practicable after we electronically file such material with, or furnish it to, the SEC. We are not incorporating by reference in this report any material from our website.
| Item 1A. | Risk Factors |
This section describes material risks affecting our business. In addition, in connection with the forward-looking statements that appear in this annual report, we urge you to review carefully not only the factors discussed below but also the cautionary statements referred to in “Forward-Looking Statements.”
Risks Related to Our Business
Global recessionary economic conditions and adverse developments in the credit markets have had, and may continue to have, an adverse effect on our investments and our operating results, including reduced availability of financing to us and for refinancing to our borrowers, payment defaults and other credit risks in our investments, decreases in the fair value of our assets and decreases in the cash flow we receive from our investments.
Global recessionary economic conditions and adverse developments in the credit markets have substantially reduced or eliminated the availability of financing for most real estate sectors in which we and the companies we finance operate. This has reduced, and may continue to reduce, the amount of capital we have available to make new investments, contributing to the reduction of our assets under management, and the reduction of income and fees derived from our investments. These conditions and developments have adversely affected many real estate sectors in which the companies we finance operate, resulting in increasing credit risk relating to, and payment defaults in, our investments. This has reduced, and may continue to reduce, the revenue and cash flow we receive from our investments and the fair value of our investments and has resulted in, and may continue to cause, material asset impairment of these investments. Our response to current economic conditions has required, and may continue to require, us to change our business strategy, including the types of investments we make, how we finance them and our dividend policies, from our historical approaches.
Our business requires a substantial amount of liquidity to fund investments, to pay expenses and to acquire and hold assets. As REITs, we must distribute at least 90% of REIT taxable income to our respective shareholders, determined without regard to the deduction for dividends paid and excluding net capital gain, which substantially limits our ability to accumulate cash from our operations. Developments in the capital markets have substantially reduced the debt capital and equity capital available to us and has adversely affected our ability to make investments.
With respect to debt capital, we believe many of the types of financing arrangements we used historically will not be available for investments of the type we have originated historically for the foreseeable future, including repurchase agreements for short term financing and securitizations for long term financing of our investments. Our continued use of secured bank financing will depend on our ability to negotiate renewals of our current lines of credit as they mature and to obtain new secured bank financing on acceptable terms. We have historically issued debt securities to one or more institutional investors from time to time as market conditions permitted, particularly our TruPS and our 6.875% convertible senior notes, or the convertible senior notes. Our opportunities to issue additional debt may be limited for the foreseeable future.
11
Table of Contents
With respect to equity capital, we believe the market for our common shares and preferred shares has contracted and may continue to be limited. We may not be able to obtain the amounts of capital on the terms we seek through issuances of our equity securities, which may cause dilution to current holders of our common shares.
We are seeking, and expect we will continue to seek, alternative financing arrangements in response to current market conditions, including joint venture and co-investment opportunities. We cannot assure you that we will be able to develop these financing sources on acceptable terms, or at all. We may need to obtain capital in smaller increments to attempt to match fund any investment we desire to make to the financing source to the extent economically feasible. Our rate of originating new assets may decline under alternative financing arrangements which may result in lower fee income and cash flow for distribution and a reduction in our assets under management.
The failure to secure financing on acceptable terms or in sufficient amounts has reduced, and may continue to reduce, our taxable income by limiting our ability to originate loans and other investments and reducing our fee income and increasing our financing expense. A reduction in our net taxable income could impair our liquidity and our ability to pay distributions to our shareholders. We cannot assure you that any, or sufficient, funding or capital will be available to us in the future on terms that are acceptable to us.
Our reliance on significant amounts of debt to finance investments may subject us to obligations to make significant balloon payments upon maturity, upon the exercise of any applicable put rights, particularly the April 15, 2012 put date under our convertible senior notes, or otherwise, an increased risk of loss, reduce our return on investments, reduce our ability to pay distributions to our shareholders and possibly result in the foreclosure of any assets subject to secured financing.
We have historically incurred a significant amount of debt to finance our investments, which could compound losses and reduce our ability to pay distributions to our shareholders. Changes in market conditions have caused, and may continue to cause, availability of financing to decrease and the cost of financing to increase relative to the income that we can derive from investments, which has impaired, and may continue to impair, the returns we can achieve and our ability to pay distributions to our shareholders. Our debt service payments reduce the net income available for distributions to our shareholders. Most of our assets are pledged as collateral for borrowings. In addition, the assets of the securitizations that we consolidate collateralize the debt obligations of the securitizations and are not available to satisfy our other creditors. To the extent that we fail to meet debt service obligations, we risk the loss of some or all of our respective assets to foreclosure or sale to satisfy these debt obligations. Currently, our declaration of trust and bylaws do not impose any limitations on the extent to which we may leverage our respective assets.
We are subject to the risks normally associated with debt financing, including the risk that our cash flows will be insufficient to meet required principal and interest payments and the risk that we will be unable to refinance our existing indebtedness when it becomes due, or that the terms of such refinancing will not be as favorable as the terms of our existing indebtedness. Included in our debt instruments are provisions providing for the lump sum payment of significant amounts of principal, whether upon maturity, upon the exercise of any applicable put rights or otherwise, which we refer to as balloon payments. Most of our debt provides for balloon payments that are payable at maturity. If collateral underlying our secured credit facilities defaults or otherwise fails to meet specified conditions, we may have to repay that facility to the extent it was secured by that collateral. Holders of our convertible senior notes may require us to repurchase all or a portion of the convertible senior notes at a purchase price equal to the principal amount plus accrued and unpaid interest (including additional interest), if any, on the convertible senior notes on April 15, 2012 and successive put dates. Our ability to make these payments when due will depend upon several factors, which may not be in our control. These factors include our liquidity or our ability to convert assets owned by us into liquidity on or prior to such put or maturity dates and the amount by which we have been able to reduce indebtedness prior to such put or maturity date though exchanges, refinancing, extensions, collateralization or other similar transactions (any of which
12
Table of Contents
transactions may also have the effect of reducing liquidity or liquid assets). Our ability to accomplish these goals will be affected by various factors existing at the relevant time, such as the state of the national and regional economies, local real estate conditions, available interest rate levels, the lease terms for and equity in any related collateral, our financial condition and the operating history of the collateral. If we are unable to pay, redeem, restructure, refinance, extend or otherwise enter into transactions to satisfy any of our debt, this could result in defaults under, and acceleration of, our debt and we may be required to sell assets in significant amounts and at times when market conditions are not favorable, which could result in our incurring significant losses.
We may seek to acquire, redeem, restructure, refinance or otherwise enter into transactions to satisfy our debt which may include any combination of material payments of cash, issuances of our debt and/or equity securities, sales or exchanges of our assets or other methods.
We are aware that our convertible senior notes, CDO notes payable and other indebtedness are currently trading at discounts to their respective face amounts. In order to reduce future cash interest payments, as well as future principal amounts due upon any applicable put dates, at maturity or upon redemption, or to otherwise benefit RAIT, we may, from time to time, purchase such convertible senior notes, CDO notes payable or other indebtedness for cash, in exchange for our equity or debt securities, or for any combination of cash and our equity or debt securities, in each case in open market purchases, privately negotiated transactions, exchange offers and consent solicitations or otherwise. We will evaluate any such transactions in light of then-existing market conditions, contractual restrictions and other factors, taking into account our current liquidity and prospects for future access to capital. The amounts involved in any such transactions, individually or in the aggregate, may be material and may materially reduce our liquidity or reduce or eliminate our ability to convert assets into liquidity. Any material issuances of our equity securities may have a material dilutive effect on our current shareholders.
If our securitizations secured primarily by commercial real estate loans, RAIT I and RAIT II, were to fail to meet their performance tests, including over-collateralization requirements, our cash flow would be materially reduced.
The terms of the securitizations we have structured generally provide that the principal amount of assets must exceed the principal balance of the related securities issued by them by a certain amount, commonly referred to as “over-collateralization.” The securitization terms provide that, if delinquencies and/or losses exceed specified levels based on the analysis by the rating agencies (or any financial guaranty insurer) of the characteristics of the assets collateralizing the securities issued in the securitization, the required level of over-collateralization may be increased or may be prevented from decreasing as would otherwise be permitted if losses or delinquencies did not exceed those levels. In addition, a failure by a securitization to satisfy an over-collateralization test typically results in accelerated distributions to the holders of the senior debt securities issued by the securitization entity. Our equity holdings and, when we acquire debt interests in securitizations, our debt interests, and our subordinated management fees, if any, are subordinate in right of payment to the other classes of debt securities issued by the securitization entity. Other tests (based on delinquency levels or other criteria) may restrict our ability to receive cash distributions from assets collateralizing the securities issued by the securitization entity or our ability to effectively manage the assets held in the securitizations. We cannot assure you that any performance test will be satisfied.
We currently receive a substantial portion of our cash flow from RAIT I and RAIT II through cash flow received through our retained interests in these securitizations and management fees paid to us for managing these securitizations. If either or both of these securitizations were to fail to meet their respective overcollateralization or other tests, our cash flow would be materially reduced.
13
Table of Contents
The reinvestments periods for RAIT I and RAIT II will expire in 2011 and 2012, respectively.
RAIT I and RAIT II each include reinvestment periods that allows us to reinvest principal repayments from collateral in eligible investments. These reinvestment periods end on the fifth anniversary of each financing in November 2011 and June 2012, respectively. Following the conclusion of the reinvestment period in RAIT I and RAIT II, our ability to finance new assets within these securitizations will be significantly reduced.
The failure of the Taberna securitizations in which we hold retained interests, Taberna VIII and Taberna IX, to meet their performance tests has reduced, and we expect will continue to reduce, our cash flow generated by these securitizations.
Our remaining consolidated Taberna securitizations, Taberna VIII and Taberna IX, have not passed some of their overcollateralization tests and have accelerated distributions to senior debt resulting in the cessation of distributions on the subordinated debt and equity we hold in these securitizations and our subordinated management fees from these securitizations. This has resulted in a substantial reduction in the cash flow we receive from these securitizations and we do not expect these securitizations to meet these tests for the foreseeable future. As a result, our cash flows from these transactions will remain limited to the senior management fees paid by those transactions for the foreseeable future.
We receive collateral management fees pursuant to collateral management agreements for services we provide as the collateral manager of RAIT I, RAIT II, Taberna Preferred Funding I, Ltd., or Taberna I, Taberna VIII and Taberna IX. If a collateral management agreement is terminated or if the securities serving as collateral for a securitization are prepaid or go into default, the collateral management fees will be reduced or eliminated.
We receive collateral management fees pursuant to collateral management agreements for acting as the collateral manager of RAIT I, RAIT II, Taberna I, Taberna VIII and Taberna IX. If all the notes issued by a securitization for which one of our subsidiaries acts as collateral manager are redeemed, or if the collateral management agreement is otherwise terminated, we will no longer receive collateral management fees from that subsidiary with respect to that securitization. In general, a collateral management agreement may be terminated both with and without cause at the direction of holders of a specified supermajority in principal amount of the notes issued by the securitization. Furthermore, such fees are based on the total amount of collateral held by the securitizations. If the securities serving as collateral for a securitization are prepaid or go into default, we will receive lower collateral management fees than expected or the collateral management fees may be eliminated.
In addition, collateral management agreements typically provide that if certain over-collateralization tests are failed, the collateral management agreement may be terminated by a vote of the security holders resulting in our loss of management fees from these securitizations.
If any of our securitizations fail to meet overcollateralization tests relevant to the most senior debt issued and outstanding by the securitization, an event of default may occur under that securitization. If that occurs, our ability to manage the securitization may be terminated and our ability to attempt to cure any defaults in the securitization would be limited, which would increase the likelihood of a reduction or elimination of cash flow and returns to us in those securitizations for an indefinite time.
Our investments in securitizations are exposed to greater uncertainty and risk of loss than investments in higher grade securities in these securitizations.
When we securitize assets such as commercial mortgage loans, mezzanine loans and TruPS, the various tranches of investment grade and non-investment grade debt obligations and equity securities have differing priorities and rights to the cash flows of the underlying assets being securitized. We structured our securitization transactions to enable us to place debt and equity securities with investors in the capital markets at various
14
Table of Contents
pricing levels based on the credit position created for each tranche of debt and equity securities. The higher rated debt tranches have priority over the lower rated debt securities and the equity securities issued by the particular securitization entity with respect to payments of interest and principal using the cash flows from the collateral assets. The relative cost of capital increases as each tranche of capital becomes further subordinated, as does the associated risk of loss if cash flows from the assets are insufficient to repay fully interest and principal or pay dividends.
Since we own in many cases the “BBB,” “BB,” “B” and unrated debt and equity classes of securitizations, we are in a “first loss” position because the rights of the securities that we hold are subordinate in right of payment and in liquidation to the rights of higher rated debt securities issued by the securitization entities. Accordingly, we have incurred and may in the future incur significant losses when investing in these securities. In the event of default, we may not be able to recover all of our respective investments in these securities. In addition, we may experience significant losses if the underlying portfolio has been overvalued or if the values subsequently decline and, as a result, less collateral is available to satisfy interest, principal and dividend payments due on the related securities. The prices of lower credit quality securities are generally less sensitive to interest rate changes than higher rated investments, but are more sensitive to economic downturns or developments specific to a particular issuer. The current recessionary economic conditions have caused a decline in the price of lower credit quality securities because the ability of obligors on the underlying assets to make principal, interest and dividend payments may be impaired. In addition, existing credit support in a number of the securitizations in which we have invested have been, and may in the future be, insufficient to protect us against loss of our investments in these securities. A number of the securitizations in which we have invested have suffered events of default or other events resulting in the termination for the foreseeable future of any distributions on the subordinated securities we hold.
Representations and warranties made by us in loan sales and securitizations may subject us to liability that could result in loan losses and could harm our operating results and, therefore distributions we make to our shareholders.
In connection with securitizations, we make representations and warranties regarding the assets transferred into securitization trusts. The trustee in the securitizations has recourse to us with respect to the breach of these representations and warranties. While we generally have recourse to loan originators for any such breaches, the originators may not be able to honor their obligations. We generally attempt to limit the potential remedies of the trustee to the potential remedies we have against the originators from whom we acquired the assets. However, in some cases, the remedies available to the trustee may be broader than those available to us against the originators of the assets and, in the event the trustee enforces its remedies against us, we may not always be able to enforce whatever remedies are available to us against the originators of the loans. Furthermore, if we discover, prior to the securitization of an asset, that there is any fraud or misrepresentation with respect to it and the originator fails to repurchase the asset, then we may not be able to sell the asset or may have to sell it at a discount.
Our financing arrangements contain covenants that restrict our operations, and any default under these arrangements would inhibit our ability to grow our business, increase revenue and pay distributions to our shareholders.
Our financing arrangements contain restrictions, covenants and events of default. Failure to meet or satisfy any of these covenants could result in an event of default under these agreements. These agreements may contain cross- default provisions so that an event of default under one agreement will trigger an event of default under other agreements. Defaults generally give our lenders the right to declare all amounts outstanding under their particular credit agreement to be immediately due and payable, and enforce their rights by foreclosing on or otherwise liquidating collateral pledged under these agreements.
These restrictions may interfere with our ability to obtain financing or to engage in other business activities. Furthermore, our default under any of our financing arrangements could have a material adverse effect on our business, financial condition, liquidity and results of operations and our ability to make distributions to our shareholders.
15
Table of Contents
We operate in a highly competitive market which may harm our business, financial condition, liquidity and results of operations.
Historically, we have been subject to significant competition in all of our business lines. We compete with many third parties engaged in finance and real estate investment activities, including other REITs, specialty finance companies, savings and loan associations, banks, mortgage bankers, insurance companies, mutual funds, institutional investors, investment banking firms and broker-dealers, property managers, investment advisors, lenders, governmental bodies and other entities. Some of these competitors have, or in the future may have, substantially greater financial resources than we do and generally may be able to accept more risk. As such, they have the ability to make larger loans and to reduce the risk of loss from any one loan by having a more diversified loan portfolio. They may also enjoy significant competitive advantages that result from, among other things, a lower cost of, and greater access to, capital and enhanced operating efficiencies. An increase in the general availability of funds to lenders, or a decrease in the amount of borrowing activity, may increase competition for making loans and may reduce obtainable yields or increase the credit risk inherent in the available loans.
Competition may limit the number of suitable investment opportunities offered to us. It may also result in higher prices, lower yields and a narrower spread of yields over our borrowing costs, making it more difficult for us to acquire new investments on attractive terms and reducing the fee income we realize from the origination, structuring and management of securitizations. It may also make it more difficult to obtain appreciation interests and increase the price, and thus reduce potential yields, on discounted loans we acquire.
We face significant competition in our investments in real estate from other owners, operators and developers of properties, many of which own properties similar to ours in markets where we operate. Such competition may affect our ability to attract and retain tenants and reduce the rents we are able to charge. These competing properties may have vacancy rates higher than our properties, which may result in their owners being willing to rent space at lower rental rates than we would or providing greater tenant improvement allowances or other leasing concessions. This combination of circumstances could adversely affect our revenues and financial performance.
Loss of our management team or the ability to attract and retain key employees could harm our business.
The real estate finance business is very labor-intensive. We depend on our management team to manage our investments and attract customers for financing by, among other things, developing relationships with issuers, financial institutions and others. The market for skilled personnel is highly competitive and has historically experienced a high rate of turnover. Due to the nature of our business, we compete for qualified personnel not only with companies in our business, but also in other sectors of the financial services industry. Competition for qualified personnel may lead to increased hiring and retention costs. We cannot guarantee that we will be able to attract or retain qualified personnel at reasonable costs or at all. If we are unable to attract or retain a sufficient number of skilled personnel at manageable costs, it could impair our ability to manage our investments and execute our investment strategies successfully, thereby reducing our earnings.
Our subsidiary Taberna Capital Management, LLC, or TCM, is named as a defendant in a lawsuit and the adverse resolution of this matter could have a material adverse effect on our financial condition and results of operations.
RAIT subsidiary Taberna Capital Management, LLC is one of fifteen defendants in a lawsuit by the Federal Deposit Insurance Corporation, as Receiver for Riverside National Bank of Florida. The action, now titled FDIC v. The McGraw-Hill Companies, Inc., Moody’s Investors Service, Inc., Fitch, Inc., Taberna Capital Management, LLC, Cohen & Company Financial Management, LLC f/k/a Cohen Bros. Financial Management LLC, FTN Financial Capital Markets, Keefe Bruyette & Woods, Inc., Merrill Lynch, Pierce, Fenner & Smith, Inc., JPMorgan Chase & Co., J.P. Morgan Securities Inc., Citigroup Global Markets, Credit Suisse Securities
16
Table of Contents
(USA) LLC, ABN Amro, Inc., Cohen & Company, and SunTrust Robinson Humphrey, Inc., asserts claims in connection with Riverside’s purchase of certain CDO securities, including securities from the Taberna Preferred Funding II, IV, and V CDOs. An adverse resolution of the litigation could have a material adverse effect on our financial condition and results of operations. For further information, see “Legal Proceedings.”
Our board of trustees may change our policies without shareholder consent.
Our board of trustees determines our policies and, in particular, our investment policies. Our board of trustees may amend our policies or approve transactions that deviate from these policies without a vote of or notice to our shareholders. Policy changes could adversely affect the market price of our shares and our ability to make distributions. Our board of trustees cannot take any action to disqualify us as a REIT or to otherwise revoke our election to be taxed as a REIT without the approval of a majority of our outstanding voting shares.
Our organizational documents do not limit our ability to enter into new lines of business, and we may enter into new businesses, make future strategic investments or acquisitions or enter into joint ventures, each of which may result in additional risks and uncertainties in our business.
Our organizational documents do not limit us to our current business lines. Accordingly, we may pursue growth through strategic investments, acquisitions or joint ventures, which may include entering into new lines of business. In addition, we expect opportunities will arise to acquire other companies, including REITs, managers of investment products or originators of real estate debt. To the extent we make strategic investments or acquisitions, enter into joint ventures, or enter into a new line of business, we will face numerous risks and uncertainties, including risks associated with:
| • | the required investment of capital and other resources, |
| • | the possibility that we have insufficient expertise to engage in such activities profitably or without incurring inappropriate amounts of risk, |
| • | combining or integrating operational and management systems and controls and |
| • | compliance with applicable regulatory requirements including those required under the Internal Revenue Code and the Investment Company Act. |
Entry into certain lines of business may subject us to new laws and regulations with which we are not familiar, or from which we are currently exempt, and may lead to increased litigation and regulatory risk. If a new business generates insufficient revenue or if we are unable to efficiently manage our expanded operations, our results of operations will be adversely affected. In the case of joint ventures, we are subject to additional risks and uncertainties in that we may be dependent upon, and subject to liability, losses or reputation damage relating to, systems, controls and personnel that are not under our control.
We engage in transactions with related parties and our policies and procedures regarding these transactions may be insufficient to address any conflicts of interest that may arise.
Under our code of business conduct, we have established procedures regarding the review, approval and ratification of transactions which may give rise to a conflict of interest between us and any employee, officer, trustee, their immediate family members, other businesses under their control and other related persons. In the ordinary course of our business operations, we have ongoing relationships and have engaged in transactions with several related entities. These procedures may not be sufficient to address any conflicts of interest that may arise.
Quarterly results may fluctuate and may not be indicative of future quarterly performance.
Our quarterly operating results could fluctuate; therefore, you should not rely on past quarterly results to be indicative of our performance in future quarters. Factors that could cause quarterly operating results to fluctuate include, among others, variations in our investment origination volume, variations in the timing of repayments of
17
Table of Contents
debt financing, variations in the amount of time between our receipt of the proceeds of a securities offering and our investment of those proceeds in loans or real estate, market conditions that result in increased cost of funds, the degree to which we encounter competition in our markets, general economic conditions and other factors referred to elsewhere in this section.
The organization and management of our sponsored REIT or any other other investment vehicles we may manage may create conflicts of interest.
We acquired Independence Realty Trust, Inc., or the sponsored REIT, a development stage, non-traded public REIT, and certain of its affiliates, in January 2011. We expect the sponsored REIT will be managed by us and will not be listed on a major exchange. We may in the future manage other third party funds or other investment vehicles. The sponsored REIT, along with any new investment vehicles we may manage, will hold assets that we determine should be acquired by them and doing so may create conflicts of interest, including between investors in the sponsored REIT and any new investment vehicles and our shareholders, since many investment opportunities that are suitable for us may also be suitable for the sponsored REIT and any new investment vehicles. Additionally, our management and other real estate and debt finance professionals may face conflicts of interest in allocating their time among RAIT and the sponsored REIT and any new investment vehicles. Although as a company we will seek to make these decisions in a manner that we believe is fair and consistent with the operative legal documents governing these investment vehicles, the transfer or allocation of these assets may give rise to investor dissatisfaction or litigation or regulatory enforcement actions. Appropriately dealing with conflicts of interest is complex and difficult and our reputation could be damaged if we fail to deal appropriately with one or more potential or actual conflicts of interest. Regulatory scrutiny of, or litigation in connection with, conflicts of interest would have a material adverse effect on our reputation which would materially adversely affect our business and our ability to attract investors for future vehicles.
Our ability to raise capital and attract investors in our sponsored REIT is critical to its success and its ability to grow depends on our ability to attract a sales force in any affiliated licensed broker dealer responsible for such capital raising.
The sponsored REIT will depend upon our ability to attract purchasers of equity interests, which will depend largely upon the efforts of the sales force in any affiliated licensed broker dealer responsible for such capital raising. Our ability to grow our sponsored REIT will depend on our ability to retain and motivate our sales force and other key personnel and to strategically recruit, retain and compensate new personnel. However, we may not be successful in our efforts to recruit, retain and motivate the required personnel as the market for qualified professionals is extremely competitive. If we do not retain an effective sales force, or our sales professionals join competitors or form competing companies, it could result in the loss of significant investment opportunities, which would have a material adverse impact on our sponsored REIT and any benefits we may obtain from our sponsored REIT.
Risks Related to Our Investments
Payment defaults and other credit risks in our investment portfolio have arisen, and may continue to increase, which has caused, and may continue to cause, adverse effects on our cash flow, net income and ability to make distributions.
Global economic conditions and adverse developments in the credit markets have led to business contraction, liquidity issues and other problems for many of the companies we finance. As a result, payment defaults and other credit risks in our investment portfolio have occurred, and may continue to occur, which has reduced, and may continue to reduce, our cash flow, net income and ability to make distributions.
Our portfolio of TruPS has been adversely affected by, and may continue to be adversely affected by, economic developments affecting the business sectors in which our borrowers operate, including homebuilders, residential mortgage providers, commercial mortgage providers, office, specialty finance, retail, hospitality and
18
Table of Contents
storage, resulting in a substantial reduction in their fair value which adversely affects our financial performance and a substantial decrease in the cash flow we receive from the securitizations holding TruPS. We cannot assure you that the fair value we reflect for any asset or liability in any particular reporting period will not change adversely in a subsequent reporting period.
We may need to increase our loan loss reserves against our portfolios of commercial real estate investments due to general business and economic conditions and increased credit and liquidity risks which would reduce our earnings. Our portfolio of commercial real estate investments has been adversely affected by, and may continue to be adversely affected by, economic developments affecting the business sectors in which our borrowers operate, including multi-family, office, and retail, including reductions in the value of commercial real estate generally and the reduced availability of refinancing for commercial real estate investments as they mature. We cannot assure you that the loan loss reserves we adopt in any particular reporting period will be sufficient or will not increase in a subsequent reporting period.
We may not realize gains or income from investments and have realized, and may continue to realize, losses from some of our investments.
We seek to generate both current income and capital appreciation. However, our investments may not appreciate in value and, in fact, a substantial portion of our investments have declined, and may continue to decline, in value. In addition, some of the financings that we originated and the loans and securities in which we invest have defaulted, and may continue to be in default on interest and/or principal payments. Accordingly, we may not be able to realize gains or income from investments and may realize losses. Any gains that we do realize may not be sufficient to offset any other losses we experience. Any income that we realize may not be sufficient to offset our respective expenses.
Uninsured and underinsured losses may affect the value of, or our return from, our real estate.
Our properties, and the properties underlying our loans, have comprehensive insurance in amounts we believe are sufficient to permit the replacement of the properties in the event of a total loss, subject to applicable deductibles. There are, however, certain types of losses, such as earthquakes, floods, hurricanes and terrorism that may be uninsurable or not economically insurable. Also, inflation, changes in building codes and ordinances, environmental considerations and other factors might make it impractical to use insurance proceeds to replace a damaged or destroyed property. If any of these or similar events occurs, it may reduce our return from an affected property and the value of our investment.
Real estate with environmental problems may create liability for us.
The existence of hazardous or toxic substances on a property will adversely affect its value and our ability to sell or borrow against the property. Contamination of real estate by hazardous substances or toxic wastes not only may give rise to a lien on that property to assure payment of the cost of remediation, but also can result in liability to us as owner, operator or lender for that cost. Many environmental laws can impose liability whether we know of, or are responsible for, the contamination. In addition, if we arrange for the disposal of hazardous or toxic substances at another site, we may be liable for the costs of cleaning up and removing those substances from the site, even if we neither own nor operate the disposal site. Environmental laws may require us to incur substantial expenses, and may materially limit our use of our properties and our ability to make distributions to our shareholders. In addition, future or amended laws, or more stringent interpretations or enforcement policies with respect to existing environmental requirements, may increase our exposure to environmental liability.
Our investment portfolio may have material geographic, sector, property-type and sponsor concentrations.
We may have material geographic concentrations related to our investments in commercial real estate loans and properties. The REITs and real estate operating companies in whose securities we invest in may also have
19
Table of Contents
material geographic concentrations related to their investments in real estate, loans secured by real estate or other investments. We also have material concentrations in the property types that comprise our commercial loan portfolio and in the industry sectors that comprise our unsecured securities portfolio. We have material concentrations in the property types that comprise our commercial loan portfolio. We also have material concentrations in the sponsors of properties that comprise our commercial loan portfolio. Where we have any kind of concentration risk in our investments, an adverse development in that area of concentration could reduce the value of our investment and our return on that investment and, if the concentration affects a material amount of our investments, impair our ability to execute our investment strategies successfully, reduce our earnings and reduce our ability to make distributions.
Our due diligence efforts before making an investment may not identify all the risks related to that investment.
Before originating a loan or investment for, or making a loan to or investment in, an entity, we will assess the strength and skills of the entity’s management and other factors that we believe will determine the success of the loan or investment. In making the assessment and otherwise conducting customary due diligence, we expect to rely on the available resources and, in some cases, an investigation by third parties. This process is particularly important and subjective with respect to newly organized entities because there may be little or no information publicly available about the entities. As a result, there can be no assurance that the due diligence processes we conduct will uncover all relevant facts or that any investment will be successful.
Our investments are relatively illiquid which may make it difficult for us to sell such investments if the need arises and any sales may be at a loss to us.
Our commercial real estate loans and our investments in real estate are relatively illiquid investments and we may be unable to vary our portfolio promptly in response to changing economic, financial and investment conditions or dispose of these assets quickly or at all in the event we need additional liquidity. We make and hold investments in securities issued by private companies and other illiquid investments. A portion of these investments may be subject to legal and other restrictions on resale or will otherwise be less liquid than publicly traded securities. The illiquidity of these investments may make it difficult for us to sell such investments if the need arises and may impair the value of these investments. Any sales of investments we make may result in our recognizing a loss on the sale.
Our subordinated real estate investments such as mezzanine loans and preferred equity interests in entities owning real estate involve increased risk of loss.
We invest in mezzanine loans and other forms of subordinated financing, such as investments consisting of preferred equity interests in entities owning real estate. Because of their subordinate position, these subordinated investments carry a greater credit risk than senior lien financing, including a substantially greater risk of non-payment. If a borrower defaults on our subordinated investment or on debt senior to us, our subordinated investment will be satisfied only after the senior debt is paid off, which may result in our being unable to recover the full amount, or any, of our investment. A decline in the real estate market could adversely affect the value of the property so that the aggregate outstanding balances of senior liens may exceed the value of the underlying property.
Where debt senior to our investment exists, the presence of inter-creditor arrangements may limit our ability to amend our loan documents, assign our loans, accept prepayments, exercise our remedies (through “standstill” periods) and control decisions made in bankruptcy proceedings relating to borrowers. Bankruptcy and borrower litigation can significantly increase the time needed for us to acquire underlying collateral in the event of a default, during which time the collateral may decline in value. In addition, there are significant costs and delays associated with the foreclosure process. In the event of a default on a senior loan, we may elect to make payments, if we have the right to do so, in order to prevent foreclosure on the senior loans. When we originate or acquire a subordinated investment, we may not have the right to service senior loans. The servicers of the senior
20
Table of Contents
loans are responsible to the holders of those loans, whose interests will likely not coincide with ours, particularly in the event of a default. Accordingly, the senior loans may not be serviced in a manner advantageous to us. It is also possible that, in some cases, a “due on sale” clause included in a senior mortgage, which accelerates the amount due under the senior mortgage in case of the sale of the property, may apply to the sale of the property if we foreclose, increasing our risk of loss.
We have loans that are not collateralized by recorded or perfected liens on the real estate underlying our loans. Some of the loans not collateralized by liens are secured instead by deeds-in-lieu of foreclosure, also known as “pocket deeds.” A deed-in-lieu of foreclosure is a deed executed in blank that the holder is entitled to record immediately upon a default in the loan. Loans that are not collateralized by recorded or perfected liens are subordinate not only to existing liens encumbering the underlying property, but also to future judgments or other liens that may arise as well as to the claims of general creditors of the borrower. Moreover, filing a deed-in-lieu of foreclosure with respect to these loans will usually constitute an event of default under any related senior debt. Any such default would require us to assume or pay off the senior debt in order to protect our investment. Furthermore, in a borrower’s bankruptcy, we will have materially fewer rights than secured creditors and, if our loan is secured by equity interests in the borrower, fewer rights than the borrower’s general creditors. Our rights also will be subordinate to the lien-like rights of the bankruptcy trustee. Moreover, enforcement of our loans against the underlying properties will involve a longer, more complex, and likely, more expensive legal process than enforcement of a mortgage loan. In addition, we may lose lien priority in many jurisdictions, to persons who supply labor and materials to a property. For these and other reasons, the total amount that we may recover from one of our investments may be less than the total amount of that investment or our cost of an acquisition of an investment.
Acquisitions of loans may involve increased risk of loss.
When we acquire existing loans, they are subject to general risks described in this section. When we acquire loans at a discount from both the outstanding balances of the loans and the appraised value of the properties underlying the loans; the loans typically are in default under the original loan terms or other requirements and are subject to forbearance agreements. A forbearance agreement typically requires a borrower to pay to the lender all revenue from a property after payment of the property’s operating expenses in return for the lender’s agreement to withhold exercising its rights under the loan documents. Acquiring loans at a discount involves a substantially higher degree of risk of non-collection than loans that conform to institutional underwriting criteria. We do not acquire a loan unless material steps have been taken toward resolving problems with the loan, or its underlying property.
Financing with high loan-to-value ratios may involve increased risk of loss.
A loan-to-value ratio is the ratio of the amount of our financing, plus the amount of any senior indebtedness, to the appraised value of the property underlying the loan. Most of our financings have loan-to-value ratios in excess of 80% and many have loan-to-value ratios in excess of 90%. We expect to continue to hold loans with high loan-to-value ratios. By reducing the margin available to cover fluctuations in property value, a high loan-to-value ratio increases the risk that, upon default, the amount obtainable from the sale of the underlying property may be insufficient to repay the financing.
Preferred equity investments in REITs and real estate operating companies may involve a greater risk of loss than traditional debt financing and specific risks relating to particular issuers.
We have invested, and may continue to invest in preferred securities, other than TruPS, of REITs and real estate operating companies, depending upon our ability to finance such assets directly or indirectly in accordance with our financing strategy. Preferred equity investments involve a higher degree of risk than traditional debt financing due to a variety of factors, including that such investments are subordinate to debt and are not secured by property underlying the investment. Furthermore, should an issuer of preferred equity default on our
21
Table of Contents
investment, we would only be able to proceed against the issuer, and not the property owned by the issuer. In most cases, a preferred equity holder has no recourse against an issuer for a failure to pay stated dividends; rather, unpaid dividends typically accrue and the preferred shareholder maintains a liquidation preference in the event of a liquidation of the issuer of the preferred securities. An issuer may not have sufficient assets to satisfy any liquidation preference to which we may be entitled. As a result, we may not recover some or all of our investments in preferred equity securities.
The commercial mortgage loans in which we invest and the commercial mortgage loans underlying the CMBS in which we invest are subject to delinquency, foreclosure and loss, which could result in losses to us that may result in reduced earnings or losses and negatively affect our ability to pay distributions to our shareholders.
We hold substantial portfolios of commercial mortgage loans and CMBS which are secured by multi-family or other commercial property and are subject to risks of delinquency and foreclosure. The ability of a borrower to repay a non-recourse loan secured by an income-producing property typically depends primarily upon the successful operation of such property rather than upon the existence of independent income or assets of the borrower. If the net operating income of the property is reduced, the borrower’s ability to repay the loan may be impaired. Net operating income of an income-producing property can be affected by, among other things: tenant mix, success of tenant businesses, property management decisions, property location and condition, competition from comparable types of properties, changes in laws that increase operating expense or limit rents that may be charged, any need to address environmental contamination at the property, the occurrence of any uninsured casualty at the property, changes in national, regional or local economic conditions and/or specific industry segments, declines in regional or local real estate values, declines in regional or local rental or occupancy rates, increases in interest rates, real estate tax rates and other operating expenses, changes in governmental rules, regulations and fiscal policies, including environmental legislation, acts of God, terrorism, social unrest and civil disturbances.
In the event of any default under a commercial mortgage loan held directly by us, we will bear a risk of loss of principal to the extent of any deficiency between the value of the collateral and the principal and accrued interest of the mortgage loan, which could have a material adverse effect on its cash flow from operations. In the event of the bankruptcy of a commercial mortgage loan borrower, the mortgage loan to such borrower will be deemed to be secured only to the extent of the value of the underlying collateral at the time of bankruptcy (as determined by the bankruptcy court), and the lien securing the mortgage loan will be subject to the avoidance powers of the bankruptcy trustee or debtor-in-possession to the extent the lien is unenforceable under state law.
Foreclosure of a commercial mortgage loan can be an expensive and lengthy process, which could have a substantial negative effect on our anticipated return on the foreclosed mortgage loan. CMBS evidence interests in or are secured by a single commercial mortgage loan or a pool of commercial mortgage loans. Accordingly, the mortgage-backed securities in which we invest are subject to all of the risks of the underlying mortgage loans.
If we are unable to improve the performance of commercial real estate properties we take control of in connection with restructurings, workouts and foreclosures of investments, our financial performance may be adversely affected.
We have taken control of an increasing number of the properties underlying our commercial real estate investments in connection with restructurings, workouts and foreclosures of these investments. If we are unable to improve the performance of these properties from their performance under their prior owners, our cash flow may be adversely affected if the properties’ cash flow is insufficient to support payments due on any related debt. Any properties we consolidate may be required to be reflected at lower values on our financial statements.
We may need to make significant capital improvements to our properties in order to remain competitive.
Our investments in real estate may face competition from newer, more updated properties. In order to remain competitive, we may need to make significant capital improvements to these properties. In addition, in the event we need to re-lease a property, we may need to make significant tenant improvements.
22
Table of Contents
Lease expirations, lease defaults and lease terminations may adversely affect our revenue.
Lease expirations, lease defaults and lease terminations may result in reduced revenue from our real estate if the lease payments received from replacement tenants are less than the lease payments received from the expiring, defaulting or terminating tenants. In addition, lease defaults by one or more significant tenants, lease terminations by tenants following events causing significant damage to the property or takings by eminent domain, or the failure of tenants under expiring leases to elect to renew their leases, could cause us to experience long periods with reduced or no revenue from a property and to incur substantial capital expenditures in order to obtain replacement tenants. See Item 2-“Properties,” for a ten-year lease expiration schedule for our non-residential properties as of December 31, 2010.
Risks Relating to the Fair Value of Our Assets and Liabilities
A portion of our assets and liabilities are recorded at fair value as determined in good faith by our management and, as a result, there may be uncertainty as to the value of these investments.
We reflect certain investments in securities, certain CDO notes payable, certain derivative instruments and other assets and liabilities at fair value in our balance sheet, with all changes in fair value recorded in earnings. Most of these investments are securities or other assets that are not publicly traded. The fair value of securities and other investments that are not publicly traded may not be readily determinable. We value these investments quarterly at fair value as determined in good faith by our management. Because such valuations are inherently uncertain, may fluctuate over short periods of time and may be based on estimates, our determinations of fair value may differ materially from the values that would have been used if a ready market for these investments existed. If our determinations regarding the fair value of these investments are not realized, we could record a loss upon their disposal.
When we acquire properties through the foreclosure of commercial real estate loans, we may recognize losses if the fair value of the property internally determined upon such acquisition is less than the previous carrying amount of the foreclosed loan.
We periodically acquire properties through the foreclosure of commercial real estate loans. Upon acquisition, we value the real estate property and its related assets and liabilities. The fair values are determined based primarily upon discounted cash flow or capitalization rate models, the use of which requires critical assumptions including discount rates, capitalization rates, vacancy rates and growth rates based, in part, on the properties’ operating history and third party data. We may recognize losses if the fair value of the property internally determined upon acquisition is less than the previous carrying amount of the foreclosed loan.
The fair value of our assets that we record at their fair value under the fair value option may decline, which may have an adverse effect on our financial statements.
The fair value of our investments and related debt and interest rate hedge instruments that we record on our financial statements at their fair value under FASB ASC Topic 825, may decline, which may have an adverse effect on our financial statements. These investments consist primarily of our portfolio of TruPS and subordinated debentures.
The fair value of our CDO notes payable issued by our consolidated Taberna securitizations has declined more significantly than the fair value of the assets collateralizing those securitizations and, if the fair value of the CDO notes payable increases to approximate that of the underlying assets, that would materially reduce our earnings and shareholders’ equity.
Through December 31, 2010 the cumulative effect of the fair value adjustments recorded on each financial asset and liability selected for the fair value option resulted in a net increase in shareholders’ equity of $344.2 million, principally as a result of adjustments in the fair value of our CDO notes payable and other liabilities.
23
Table of Contents
This increase in shareholders’ equity may reverse through earnings as an unrealized loss in the future. For example, in the event our CDO notes payable were to recover some or all of their value sooner than any recovery of the value of the securities collateralizing them, the net difference in the respective recoveries could materially reduce earnings and our shareholders’ equity. Under current market conditions and the volatility in interest rates and the credit performance of our underlying collateral, we cannot assure you that there will not be further significant fluctuations in the fair value of our assets and liabilities, which could materially reduce earnings and our shareholders’ equity.
Interest rate changes may reduce the value of our investments.
Changes in interest rates affect the market value of our investment portfolio. In general, the market value of a loan will change in inverse relation to an interest rate change where a loan has a fixed interest rate or only limited interest rate adjustments. Accordingly, in a period of rising interest rates, the market value of such a loan will decrease. Moreover, in a period of declining interest rates, real estate loans with rates that are fixed or variable only to a limited extent may have less value than other income-producing securities due to possible prepayments. Interest rate changes will also affect the return we obtain on new loans. In particular, during a period of declining rates, our reinvestment of loan repayments may be at lower rates than we obtained in prior investments or on the repaid loans. Also, increases in interest rates on debt we incur may not be reflected in increased rates of return on the investments funded through such debt, which would reduce our return on those investments. Accordingly, interest rate changes may materially affect the total return on our investment portfolio, which in turn will affect the amount available for distribution to shareholders.
The value of our investments depends on conditions beyond our control.
Our investments include loans secured directly or indirectly by real estate, interests in entities whose principal or sole assets are real estate or direct ownership of real estate. As a result, the value of these investments depends primarily upon the value of the real estate underlying these investments which is affected by numerous factors beyond our control including general and local economic conditions, neighborhood values, competitive overbuilding, weather, casualty losses, occupancy rates and other factors beyond our control. The value of this underlying real estate may also be affected by factors such as the costs of compliance with use, occupancy and similar regulations, potential or actual liabilities under applicable environmental laws, changes in interest rates and the availability of financing. Income from a property will be reduced if a significant number of tenants are unable to pay rent or if available space cannot be rented on favorable terms. Operating and other expenses of this underlying real estate, particularly significant expenses such as mortgage payments, insurance, real estate taxes and maintenance costs, generally do not decrease when income decreases and, even if revenue increases, operating and other expenses may increase faster than revenues.
Any investment may also be affected by a borrower’s failure to comply with the terms of our investment, its bankruptcy, insolvency or reorganization or its properties becoming subject to foreclosure proceedings, all of which may require us to become involved in expensive and time-consuming litigation. Some of our investments defer some portion of our return to loan maturity or the mandatory redemption date. The borrower’s ability to satisfy these deferred obligations may depend upon its ability to obtain suitable refinancing or to otherwise raise a substantial amount of cash. These risks may be subject to the same considerations we describe in this “Risks Related to Our Investments” section.
Risks Relating to Our Use of Derivatives and Hedging Instruments
Our hedging transactions may not insulate us from interest rate risk, which could cause volatility in our earnings.
Subject to limits imposed by our desire to maintain our qualification as a REIT, we enter into hedging transactions to limit exposure to changes in interest rates. We are therefore exposed to risks associated with such transactions. We have entered into, and expect to continue to enter into, interest rate swap agreements. We may
24
Table of Contents
also use instruments such as forward contracts and interest rate caps, currency swaps, collars and floors to seek to hedge against fluctuations in the relative values of portfolio positions from changes in market interest rates. Hedging against a decline in the values of portfolio positions does not eliminate the possibility of fluctuations in the values of such positions or prevent losses if the values of such positions decline. However, such hedging can establish other positions designed to gain from those same developments, thereby offsetting the decline in the value of such portfolio positions. Such hedging transactions may also limit the opportunity for gain if the values of the portfolio positions should increase. Moreover, it may not be possible to hedge against an interest rate fluctuation that is so generally anticipated that we would not be able to enter into a hedging transaction at an acceptable price.
The success of hedging transactions undertaken by us will depend on our ability to structure and execute effective hedges for the assets we hold and, to a degree, on our ability to anticipate interest rate or currency value fluctuations, the expected life of our assets or other factors. Our failure to do so may result in poorer overall investment performance than if we had not engaged in such hedging transactions. In addition, the degree of correlation between price movements of the instruments used in a hedging strategy and price movements in the portfolio positions being hedged may vary. Moreover, for a variety of reasons, we may not establish a perfect correlation between such hedging instruments and the portfolio holdings being hedged. Any such imperfect correlation may prevent us from achieving the intended hedge and expose us to risk of loss.
Changes in fair value can be caused by changes in interest rates that are not fully hedged. To the extent that we fail to hedge fully against adverse fluctuations in interest rates, our earnings will be reduced or we could have losses.
While we use hedging to mitigate certain risks, our failure to completely insulate the portfolios from those risks may cause greater volatility in our earnings.
Hedging instruments often are not traded on regulated exchanges, guaranteed by an exchange or its clearing house, or regulated by any U.S. or foreign governmental authorities and involve risks of default by the hedging counterparty and illiquidity.
Subject to maintaining our qualification as a REIT, part of our investment strategy involves entering into puts and calls on securities or indices of securities, interest rate swaps, caps and collars, including options and forward contracts, and interest rate lock agreements, principally Treasury lock agreements, to seek to hedge against mismatches between the cash flows from our assets and the interest payments on our liabilities. Hedging instruments often are not traded on regulated exchanges, guaranteed by an exchange or its clearing house, or regulated by any U.S. or foreign governmental authorities. Consequently, there are no requirements with respect to record keeping, financial responsibility or segregation of customer funds and positions. Furthermore, the enforceability of agreements underlying derivative transactions may depend on compliance with applicable statutory and commodity and other regulatory requirements and, depending on the identity of the counterparty, applicable international requirements. Legislation was passed to create a clearing house for hedging instruments and require the posting of cash collateral based on the fair value of any hedging instruments. While the Legislature has not issued final rules, we believe that hedging instruments in-place prior to this legislation will not be impacted.
The business failure of a counterparty with whom we enter into a hedging transaction will most likely result in a default. Default by a party with whom we entered into a hedging transaction may result in the loss of unrealized profits and force us to cover our resale commitments, if any, at the then current market price. Although generally we seek to reserve the right to terminate our hedging positions, we may not always be able to dispose of or close out a hedging position without the consent of the hedging counterparty, and we may not be able to enter into an offsetting contract in order to cover our risk. A liquid secondary market may not exist for hedging instruments purchased or sold, and we may have to maintain a position until exercise or expiration, which could result in losses.
25
Table of Contents
In July 2010, the U.S. Congress enacted the Dodd Frank Wall Street Reform and Consumer Protection Act, or the Dodd-Frank Act. The Dodd-Frank Act may impose significant requirements on hedging instruments we use. While the full impact of the Dodd-Frank Act cannot be assessed until implementing regulations are adopted, the Dodd-Frank Act’s requirements may have a significant effect on our use of hedging instruments, which may have an adverse effect on our business.
Our ability to enter into hedging transactions at commercially reasonable rates may be limited by developments relating to the counterparties we used historically and economic and credit market conditions generally.
Most of the counterparties under our outstanding hedging instruments are affiliates of investment banks that have subsequently been acquired by other financial institutions. We cannot assure you that as our outstanding hedges reach their termination dates or as we seek to enter into new hedging transactions, that our historical counterparties or other institutions with acceptable credit ratings will enter into hedging transactions with us on commercially reasonable terms or at all. While most of our hedging instruments have termination dates in 2014 or later, we have hedges that will terminate in each year prior to 2014. If we cannot enter into interest rate hedges on commercially reasonable terms, our exposure to interest rate risk will increase. The risk of defaults by our counterparties may increase as the markets for hedging transactions shrink and become more volatile.
We may enter into hedging instruments that could expose us to unexpected losses in the future.
We may enter into hedging instruments that would require us to fund cash payments in the future under certain circumstances, for example, upon the early termination of the instrument caused by an event of default or other early termination event, or the decision by a counterparty to request margin securities it is contractually owed under the terms of the instrument. The amount due would be equal to the unrealized loss of the open positions with the counterparty and could also include other fees and charges. These losses will be reflected in our financial results of operations, and our ability to fund these obligations will depend on the liquidity of our assets and access to capital at the time, and the need to fund these obligations could adversely impact our financial condition.
We may enter into derivative contracts that could expose us to contingent liabilities in the future.
Part of our investment strategy involves entering into derivative contracts like the interest rate swaps we use to limit our exposure to interest rate movements. Most of our derivative contracts require us to fund cash payments upon the early termination of a derivative agreement caused by an event of default or other early termination event. The amount due would be equal to the unrealized loss of the open swap positions with the respective counterparty and could also include other fees and charges. In addition, some of these derivative arrangements require that we maintain specified percentages of cash collateral with the counterparty to fund potential liabilities under the derivative contract. We may have to make cash payments in order to maintain the required percentage of collateral with the counterparty. These economic losses would be reflected in our results of operations, and our ability to fund these obligations would depend on the liquidity of our respective assets and access to capital at the time. The need to fund these obligations could adversely impact our financial condition. Our due diligence may not reveal all of an entity’s liabilities and may not reveal other weaknesses in the entity’s business.
Tax Risks
In January 2011, our board announced it would continue its approach of considering whether to declare a dividend on the common shares related to our annual REIT distribution requirements once a full year of REIT taxable income is available; any such dividend may be partially in stock. The board reserves the right to change this approach at any time in its sole discretion.
To qualify as a REIT, we are required to make distributions to shareholders, first to preferred shareholders and then to common shareholders, in an amount at least equal to 90% of our annual REIT taxable income. In January 2011, our board announced it would continue its approach of considering whether to declare a dividend
26
Table of Contents
on the common shares related to our annual REIT distribution requirements once a full year of REIT taxable income is available. The board reserves the right to change this approach at any time in its sole discretion. The board’s determination will include analyzing whether RAIT should use IRS Revenue Procedure 2010-12 which permits publicly-traded REITs to distribute stock in partial satisfaction of their REIT distribution requirements if stated conditions are met, including that at least 10% of the aggregate declared distribution be paid in cash and that shareholders be permitted to elect whether to receive cash or stock subject to the limit set by the REIT on the cash to be distributed in the aggregate to all shareholders. The board expects to continue to review and determine the dividends on RAIT’s preferred shares on a quarterly basis.
We may fail to qualify as a REIT, and such failure to qualify would have significant adverse consequences on the value of our common shares. In addition, if we fail to qualify as a REIT, our dividends will not be deductible, and the entity will be subject to corporate-level tax on its net taxable income, which would reduce the cash available to make distributions.
We believe that we have been organized and operated in a manner that will allow us to qualify as a REIT. We have not requested or plan to request a ruling from the IRS that we or Taberna qualify as a REIT and any statements in our filings with the SEC are not binding on the IRS or any court. Qualification as a REIT involves the application of highly technical and complex Internal Revenue Code provisions, for which there are only limited judicial and administrative interpretations. The determination of various factual matters and circumstances not entirely within our control may also affect our abilities to qualify as a REIT. In order to qualify as a REIT, we must satisfy a number of requirements, including requirements regarding the composition of our respective assets and sources of our respective gross income. Also, we must make distributions to our respective shareholders aggregating annually at least 90% of our respective net taxable incomes, excluding net capital gains. In addition, our ability to satisfy the requirements to qualify as a REIT depends in part on the actions of third parties over which we have no control or limited influence, including in cases where we own an equity interest in an entity that is classified as a partnership or REIT for U.S. federal income tax purposes. As an example, to the extent we invest in preferred equity securities of other REIT issuers, our qualification as a REIT will depend upon the continued qualification of such issuers as REITs under the Internal Revenue Code. Accordingly, unlike other REITs, we may be subject to additional risk regarding our ability to qualify and maintain our qualification as a REIT. The reduction in our rate of originating new assets, operations and liquidity may adversely impact RAIT’s ability to meet REIT requirements and we may be less able to make changes to our investment portfolio to adjust our respective REIT qualifying assets and income depending on our ability to deploy capital and maintain assets under management.
There can be no assurance that we will be successful in operating in a manner that will allow us to qualify as a REIT. In addition, legislation, new regulations, administrative interpretations or court decisions may adversely affect our investors, our ability to qualify as a REIT or the desirability of an investment in a REIT relative to other investments.
If we fail to qualify as a REIT or lose our qualification as a REIT at any time, we or it will face serious tax consequences that would substantially reduce the funds available for distribution to its shareholders (in the case of Taberna, primarily us) for each of the years involved because:
| • | we would not be allowed a deduction for distributions to our respective shareholders in computing taxable income and would be subject to U.S. federal income tax at regular corporate rates; |
| • | we also could be subject to the U.S. federal alternative minimum tax and possibly increased state and local taxes; and |
| • | unless statutory relief provisions apply, we could not elect to be taxed as a REIT for four taxable years following the year of disqualification. |
In addition, if we fail to qualify as a REIT, such entity will not be required to make distributions to its shareholders, and all distributions to shareholders will be subject to tax as regular corporate dividends to the extent of current and accumulated earnings and profits.
27
Table of Contents
Complying with REIT requirements may cause us to forgo otherwise attractive opportunities.
To qualify as a REIT, we must continually satisfy various tests regarding sources of income, nature and diversification of assets, amounts distributed to shareholders and the ownership of common shares. In order to satisfy these tests, we may be required to forgo investments that might otherwise be made. Accordingly, compliance with the REIT requirements may hinder our investment performance.
In particular, at least 75% of our total assets at the end of each calendar quarter must consist of real estate assets, government securities, and cash or cash items. For this purpose, “real estate assets” generally include interests in real property, such as land, buildings, leasehold interests in real property, stock of other entities that qualify as REITs, interests in mortgage loans secured by real property, investments in stock or debt instruments during the one-year period following the receipt of new capital and regular or residual interests in a real estate mortgage investment conduit, or REMIC. In addition, the amount of securities of a single issuer that we hold must generally not exceed either 5% of the value of such issuer’s gross assets or 10% of the vote or value of such issuer’s outstanding securities.
Certain of the assets that we hold or intend to hold, including TruPS and unsecured loans to REITs or other entities, will not be qualified real estate assets for the purposes of the REIT asset tests. In addition, although preferred equity securities of REITs (which would not include TruPS) should generally be treated as qualified real estate assets, this will require that (i) they are treated as equity for U.S. tax purposes, and (ii) their issuers maintain their qualification as REITs. CMBS should generally qualify as real estate assets. However, to the extent that we own non-REMIC collateralized mortgage obligations or other debt instruments secured by mortgage loans (rather than by real property) or secured by non-real estate assets, or debt securities issued by corporations that are not secured by mortgages on real property, those securities will likely not be qualifying real estate assets for purposes of the REIT asset tests.
We generally will be treated as the owner of any assets that collateralize a securitization transaction to the extent that we retain all of the equity of the securitization entity and do not make an election to treat such securitization entity as a TRS, as described in further detail below.
As noted above, in order to comply with the REIT asset tests and 75% gross income test, at least 75% of each of our total assets and 75% of gross income must be derived from qualifying real estate assets, whether or not such assets would otherwise represent our best investment alternative.
A REIT’s net income from prohibited transactions is subject to a 100% penalty tax. In general, prohibited transactions are sales or other dispositions of property, other than foreclosure property, but including any mortgage loans, held in inventory or primarily for sale to customers in the ordinary course of business. The prohibited transaction tax may apply to any sale of assets to a securitization and to any sale of securitization securities, and therefore may limit our ability to sell assets to or equity in securitizations and other assets.
It may be possible to reduce the impact of the prohibited transaction tax and the holding of assets not qualifying as real estate assets for purposes of the REIT asset tests by conducting certain activities, holding non-qualifying REIT assets or engaging in securitization transactions through our TRSs, subject to certain limitations as described below. To the extent that we engage in such activities through TRSs, the income associated with such activities may be subject to full U.S. federal corporate income tax.
28
Table of Contents
Neither TruPS nor equity in corporate entities, such as issuers of securitizations that hold TruPS, will qualify as real estate assets for purposes of the REIT asset tests and the income generated by such investments generally will not qualify as real estate-related income for the REIT gross income tests. We and Taberna must continue to invest in qualifying real estate assets, such as mortgage loans and debt securities secured by real estate, to maintain its REIT qualification, and these assets typically generate less attractive returns than TruPS which could result in reduced returns to Taberna, and therefore to our shareholders.
Neither TruPS nor equity in corporate entities, such as issuers of securitizations, that hold TruPS will qualify as real estate assets for purposes of the REIT asset tests that Taberna must meet on a quarterly basis to maintain its qualification as a REIT. We use the term “securitizations” to refer to either the issuer of securitizations or the securitizations themselves, where the context makes the reference clear. The income received from Taberna’s investments in TruPS or in corporate entities holding TruPS generally will not qualify as real estate-related income for purposes of the REIT gross income tests. If Taberna fails to make sufficient investments in qualifying real estate assets, Taberna will likely fail to maintain its REIT qualification, which could cause Taberna to be subject to significant taxes and RAIT to fail to maintain its REIT qualification and be subject to significant taxes. REIT qualifying investments typically are lower yielding than Taberna’s expected returns on TruPS. Accordingly, maintaining sufficient amounts of REIT qualifying investments could result in reduced returns to Taberna, and therefore to our shareholders.
Furthermore, if income inclusions from Taberna’s foreign taxable REIT subsidiaries, or TRSs, which are securitizations are determined not to qualify for the REIT 95% gross income test, Taberna could fail to qualify as a REIT, or even if it did not fail to qualify as a REIT, Taberna could be subject to a penalty tax. In addition, Taberna would need to invest in sufficient qualifying assets, or sell some of its interests in its foreign TRSs which are securitizations to ensure that the income recognized by Taberna from its foreign TRSs which are securitizations does not exceed 5% of Taberna’s gross income. See “We or Taberna may lose our or its REIT qualification or be subject to a penalty tax if the Internal Revenue Service, or IRS, successfully challenges our or its characterization of income from our or its foreign TRSs which are securitizations.” Any reduction in Taberna’s net taxable income would have an adverse effect on its liquidity, and its ability to pay distributions to us.
Each of our qualifications as a REIT and exemption from U.S. federal income tax with respect to certain assets may be dependent on the issuers of the REIT securities in which we invest maintaining their REIT qualification and the accuracy of legal opinions rendered to or statements made by the issuers of securities, including securitizations, in which we invest.
When purchasing securities issued by REITs, we may rely on opinions of counsel for the issuer of such securities, or statements made in related offering documents, for purposes of determining whether such issuer qualifies as a REIT for U.S. federal income tax purposes and whether such securities represent debt or equity securities for U.S. federal income tax purposes, and therefore to what extent those securities constitute REIT real estate assets for purposes of the REIT asset tests and produce income which qualifies under the 75% REIT gross income test. In addition, when purchasing securitization equity, we may rely on opinions of counsel regarding the qualification of the securitization for exemption from U.S. corporate income tax. The inaccuracy of any such opinions or statements may adversely affect our REIT qualification and/or result in significant corporate-level tax. In addition, if the issuer of any REIT equity securities in which we invest were to fail to maintain its qualification as a REIT, the securities of such issuer held by us will fail to qualify as real estate assets for purposes of maintaining REIT qualification and the income generated by such securities will not represent qualifying income for purposes of the 75% REIT gross income test and therefore could cause us to fail to qualify as a REIT.
29
Table of Contents
We or Taberna may lose our or its REIT qualification or be subject to a penalty tax if the Internal Revenue Service, or IRS, successfully challenges our or its characterization of income from foreign TRSs which are securitizations.
We and Taberna are required to include in income, in certain cases, even without the receipt of actual distributions, earnings from foreign TRSs that are securitizations or other foreign corporations that are not qualified REIT subsidiaries. Taberna treats, and we intend to treat, certain of these income inclusions as qualifying income for purposes of the 95% gross income test applicable to REITs but not for purposes of the REIT 75% gross income test. The provisions that set forth what income is qualifying income for purposes of the 95% gross income test provide that gross income derived from dividends, interest and certain other classes of passive income qualify for purposes of the 95% gross income test. Income inclusions from equity investments in our and Taberna’s foreign TRSs are technically neither dividends nor any of the other enumerated categories of income specified in the 95% gross income test for U.S. federal income tax purposes, and there is no clear precedent with respect to the qualification of such income. However, based on advice of counsel, we and Taberna intend to treat such inclusions, to the extent distributed by a foreign TRS in the year it was accrued, as qualifying income for purposes of the 95% gross income test. Nevertheless, because this income does not meet the literal requirements of the REIT provisions, the IRS might take the position that such income is not qualifying income. In the event that such income was determined not to qualify for the 95% gross income test, we or Taberna could fail to qualify as a REIT. Even if such income does not cause us or Taberna to fail to qualify as a REIT because of certain relief provisions, we or Taberna would be subject to a penalty tax with respect to such income because such income, together with other non-qualifying income earned by us or Taberna, has exceeded and will exceed 5% of its gross income. This penalty tax, if applicable, would be calculated by multiplying the amount by which our or Taberna’s non-qualifying income exceeds 5% of our or Taberna’s total gross income by a fraction intended to reflect our or Taberna’s profitability. In addition, if such income were determined not to qualify for the 95% gross income test, we or Taberna would need to invest in sufficient qualifying assets, or sell some interests in foreign TRSs which are securitizations or other foreign corporations that are not qualified REIT subsidiaries to ensure that the income recognized by us or Taberna from foreign TRSs which are securitizations or such other foreign corporations does not exceed 5% of our or Taberna’s gross income.
Taberna’s other foreign TRSs, RAIT Capital Ltd., or RAIT Capital (which has been inactive since June 2010), and RAIT Securities (U.K.) Ltd., or RAIT Securities UK, intend to operate in a manner so that their earnings will not be required to be included in Taberna’s income until such earnings are actually distributed by such foreign TRSs. In the event the IRS were to successfully challenge such characterization of the operations of RAIT Capital or RAIT Securities UK, and Taberna is required to recognize income earned by RAIT Capital or RAIT Securities UK on a current basis or otherwise recognize additional income with respect to such TRSs, Taberna could fail to qualify as a REIT or be subject to the penalty tax described above.
We have federal and state tax obligations.
Even if we qualify as REITs for U.S. federal income tax purposes, we will be required to pay U.S. federal, state and local taxes on income and property. In addition, our domestic TRSs are fully taxable corporations that will be subject to taxes on their income, and they may be limited in their ability to deduct interest payments made to us. We also will be subject to a 100% penalty tax on certain amounts if the economic arrangements among us and TRSs are not comparable to similar arrangements among unrelated parties or if we receive payments for inventory or property held for sale to customers in the ordinary course of business. We may be taxable at the highest corporate income tax rate on a portion of the income arising from a taxable mortgage pool that is allocable to shares held by “disqualified organizations.” In addition, under certain circumstances we could be subject to a penalty tax for failure to meet certain REIT requirements but nonetheless maintains its qualification as a REIT. For example, we may be required to pay a penalty tax with respect to income earned in connection with securitization equity in the event such income is determined not to be qualifying income for purposes of the REIT 95% gross income test but we are otherwise able to remain qualified as a REIT. To the extent that we or the TRSs are required to pay U.S. federal, state or local taxes, we will have less to distribute to shareholders.
30
Table of Contents
Failure to make required distributions would subject us to tax, which would reduce the ability to pay distributions to our shareholders.
In order to qualify as a REIT, we must distribute to our and its shareholders each calendar year at least 90% of REIT taxable income, determined without regard to the deduction for dividends paid and excluding net capital gain. To the extent that we satisfy the 90% distribution requirement, but distribute less than 100% of net taxable income, we or Taberna will be subject to U.S. federal corporate income tax. In addition, we will incur a 4% nondeductible excise tax on the amount, if any, by which our or its distributions in any calendar year are less than the sum of:
| • | 85% of ordinary income for that year; |
| • | 95% of capital gain net income for that year; and |
| • | 100% undistributed taxable income from prior years. |
We intend to distribute our and its net income to our and its shareholders in a manner intended to satisfy the 90% distribution requirement and to avoid both corporate income tax and the 4% nondeductible excise tax. There is no requirement that Taberna’s domestic TRSs, such as Taberna Capital, RAIT Securities and Taberna Funding, distribute their after-tax net income to Taberna and such TRSs may, to the extent consistent with maintaining Taberna’s qualification as a REIT, determine not to make any current distributions to Taberna. However, Taberna’s non-U.S. TRSs, such as Taberna Equity Funding, Ltd., and Taberna’s consolidated securitization subsidiaries (but not RAIT Capital or RAIT Securities UK), will generally be deemed to distribute their earnings to Taberna on an annual basis for U.S. federal income tax purposes, regardless of whether such TRSs actually distribute their earnings.
Our taxable income may substantially exceed our net income as determined by GAAP because, for example, expected capital losses will be deducted in determining its GAAP net income, but may not be deductible in computing its taxable income. GAAP net income may also be reduced to the extent we have to “markdown” the value of assets to reflect their current value. Prior to the sale of such assets, those mark-downs do not comparably reduce taxable income. In addition, we may invest in assets including the equity of securitization entities that generate taxable income in excess of economic income or in advance of the corresponding cash flow from the assets. This taxable income may arise for us in the following ways:
| • | Repurchase of our debt at a discount, including our convertible senior notes or CDO notes payable, will generally result in our recognizing REIT taxable income in the form of cancellation of indebtedness income generally equal to the amount of the discount. Recent legislation permits the deferral of taxes coming about through debt buybacks at a discount in certain circumstances. |
| • | Origination of loans with appreciation interests may be deemed to have original issue discount for federal income tax purposes. Original issue discount is generally equal to the difference between an obligation’s issue price and its stated redemption price at maturity. This “discount” must be recognized as income over the life of the loan even though the corresponding cash will not be received until maturity. |
| • | Our loan terms may provide for both an interest “pay” rate and “accrual” rate. When this occurs, we recognize interest based on the sum of the pay rate and the accrual rate, but only receive cash at the pay rate until maturity of the loan, at which time all accrued interest is due and payable. |
| • | Our loans or unconsolidated real estate may contain provisions whereby the benefit of any principal amortization of the underlying senior debt inures to us. We recognize this benefit as income as the amortization occurs, with no related cash receipts until repayment of our loan. |
| • | Sales or other dispositions of investments in real estate, as well as significant modifications to loan terms may result in timing differences between income recognition and cash receipts. |
31
Table of Contents
Although some types of taxable income are excluded to the extent they exceed 5% of our net income in determining the 90% distribution requirement, we will incur corporate income tax and the 4% nondeductible excise tax with respect to any taxable income items if we do not distribute those items on an annual basis. As a result of the foregoing, we may generate less cash flow than taxable income in a particular year. In that event, we may be required to use cash reserves, incur debt, or liquidate non-cash assets at rates or times that we or it regard as unfavorable in order to satisfy the distribution requirement and to avoid U.S. federal corporate income tax and the 4% deductible excise tax in that year.
Generally, dividends payable in stock are not treated as dividends for purposes of the deduction for dividends, or as taxable dividends to the recipient. A complex set of rules applies when a distribution is made partially in stock and partially in cash and different shareholders receive different proportions of each. The Internal Revenue Service, in Revenue Procedure 2010-12, has given guidance with respect to certain stock distributions by publicly traded REITS (and RICs). That Revenue Procedure applies to distributions made on or after January 1, 2008 and declared with respect to a taxable year ending on or before December 31, 2011. It provides that publicly-traded REITS can distribute stock (common shares in our case) to satisfy their REIT distribution requirements if stated conditions are met. These conditions include that at least 10% of the aggregate declared distributions be paid in cash and the shareholders be permitted to elect whether to receive cash or stock, subject to the limit set by the REIT on the cash to be distributed in the aggregate to all shareholders. RAIT did not use this Revenue Procedure with respect to any distributions for its 2010 taxable year, but has the option to do so for distributions with respect to 2011.
If our or Taberna’s securitizations or Taberna’s subsidiaries, RAIT Capital or RAIT Securities UK, are subject to U.S. federal income tax at the entity level, it would greatly reduce the amounts those entities would have available to distribute to us or Taberna and pay their creditors.
Taberna’s consolidated securitization subsidiaries are organized as Cayman Islands companies, and we may own similar foreign securitization’s in the future. There is a specific exemption from U.S. federal income tax for non-U.S. corporations that restrict their activities in the United States to trading stock and securities (or any activity closely related thereto) for their own account whether such trading (or such other activity) is conducted by the corporation or its employees through a resident broker, commission agent, custodian or other agent. We and Taberna intend that the consolidated securitization subsidiaries and any other non-U.S. securitizations that are TRSs will rely on that exemption or otherwise operate in a manner so that they will not be subject to U.S. federal income tax on their net income at the entity level. RAIT Capital is a wholly-owned subsidiary of Taberna organized under the laws of Ireland that, until May 2010, provided sub-advisory services to Taberna Capital and received a fee from Taberna Capital for its services. It has been inactive since June 2010. RAIT Securities UK is a wholly-owned subsidiary of Taberna organized under the laws of the United Kingdom that is expected to originate securities and to receive origination fees from issuers in connection with its origination activities. RAIT Capital intended, and RAIT Securities UK intends, to operate in a manner so that they will not be subject to U.S. federal income tax on their net income. If the IRS were to succeed in challenging the tax treatment of our or Taberna’s securitizations, RAIT Capital or RAIT Securities UK, it could greatly reduce the amount that those securitizations, RAIT Capital and RAIT Securities UK would have available to distribute to their shareholders and to pay to their creditors. Any reduced distributions would reduce amounts available for distribution to our shareholders.
Our and Taberna’s ownership of and relationship with TRSs will be limited, and a failure to comply with the limits would jeopardize our and its REIT qualification and may result in the application of a 100% excise tax.
A REIT may own up to 100% of the stock of one or more TRSs. A TRS may hold assets and earn income that would not be qualifying assets or income if held or earned directly by a REIT. Both the subsidiary and the REIT must jointly elect to treat the subsidiary as a TRS. A corporation of which a TRS directly or indirectly owns more than 35% of the voting power or value of the stock will automatically be treated as a TRS. Overall, no more than 25% (20% for taxable years prior to 2009) of the value of a REIT’s assets may consist of stock or
32
Table of Contents
securities of one or more TRSs. In addition, the TRS rules limit the deductibility of interest paid or accrued by a TRS to its parent REIT to assure that the TRS is subject to an appropriate level of corporate taxation. The rules also impose a 100% excise tax on certain transactions between a TRS and its parent REIT that are not conducted on an arm’s-length basis.
Taberna Capital, RAIT Securities, Taberna Funding and any domestic TRSs that we own or that we or Taberna acquire in the future will pay U.S. federal, state and local income tax on their taxable income, and their after-tax net income will be available for distribution but will not be required to be distributed.
The value of the securities that we or Taberna hold in TRSs may not be subject to precise valuation. Accordingly, there can be no assurance that we or Taberna will be able to comply with the 25% limitation discussed above or avoid application of the 100% excise tax discussed above.
Compliance with REIT requirements may limit our ability to hedge effectively.
The REIT provisions of the Internal Revenue Code limit our ability to hedge mortgage-backed securities, preferred securities and related borrowings. Except to the extent provided by the regulations promulgated by the U.S. Treasury Department, or the Treasury regulations, any income from a hedging transaction we enter into in the normal course of business primarily to manage risk of interest rate or price changes or currency fluctuations with respect to borrowings made or to be made, or ordinary obligations incurred or to be incurred, to acquire or carry real estate assets, which is clearly identified as specified in the Treasury regulations before the close of the day on which it was acquired, originated, or entered into, including gain from the sale or disposition of such a transaction, will not constitute gross income for purposes of the 95% gross income test (and will generally constitute non-qualifying income for purposes of the 75% gross income test). To the extent that we enter into other types of hedging transactions, the income from those transactions is likely to be treated as non-qualifying income for purposes of both of the gross income tests. As a result, we might have to limit use of advantageous hedging techniques or implement those hedges through TRSs. This could increase the cost of our hedging activities or expose it or us to greater risks associated with changes in interest rates than we or it would otherwise want to bear.
We may be subject to adverse legislative or regulatory tax changes that could reduce the market price of our common shares.
At any time, the U.S. federal income tax laws or regulations governing REITs or the administrative interpretations of those laws or regulations may be amended. We cannot predict when or if any new U.S. federal income tax law, regulation or administrative interpretation, or any amendment to any existing U.S. federal income tax law, regulation or administrative interpretation, will be adopted, promulgated or become effective and any such law, regulation or interpretation may take effect retroactively. We could be adversely affected by any such change in, or any new, U.S. federal income tax law, regulation or administrative interpretation.
Origination fees we receive will not be REIT qualifying income.
We must satisfy two gross income tests annually to maintain qualification as a REIT. First, at least 75% of our gross income for each taxable year must consist of defined types of income that we derive, directly or indirectly, from investments relating to real property or mortgages on real property or temporary investment income. Qualifying income for purposes of that 75% gross income test generally includes:
| • | rents from real property, |
| • | interest on debt secured by mortgages on real property or on interests in real property, and |
| • | dividends or other distributions on and gain from the sale of shares in other REITs. |
33
Table of Contents
Second, in general, at least 95% of our gross income for each taxable year must consist of income that is qualifying income for purposes of the 75% gross income test, dividends, other types of interest, gain from the sale or disposition of stock or securities, income from certain interest rate hedging contracts, or any combination of the foregoing. Gross income from any origination fees we obtain or from our sale of property that we hold primarily for sale to customers in the ordinary course of business is excluded from both income tests.
Any origination fees we receive will not be qualifying income for purposes of the 75% or 95% gross income tests applicable to REITs under the Internal Revenue Code. We typically receive initial payments, or “points,” from borrowers as commitment fees or additional interest. So long as the payment is for the use of money, rather than for other services provided by us, we believe that this income should not be classified as non-qualifying origination fees. However, the Internal Revenue Service may seek to reclassify this income as origination fees instead of commitment fees or interest. If we cannot satisfy the Internal Revenue Code’s income tests as a result of a successful challenge of our classification of this income, we may not qualify as a REIT.
A portion of the dividends we distribute may be deemed a return of capital for federal income tax purposes.
The amount of dividends we distribute to our common and preferred shareholders in a given quarter may not correspond to our taxable income for such quarter. Consequently, a portion of the dividends we distribute may be deemed a return of capital for federal income tax purposes, and will not be taxable but will reduce shareholders’ basis in the underlying common or preferred shares.
Our ability to use TRSs, and consequently our ability to establish fee-generating businesses and invest in securitizations, will be limited by the election made by us to be taxed as a REIT, which may adversely affect returns to our shareholders.
Overall, no more than 25% of the value of a REIT’s assets may consist of securities of one or more TRSs. Taberna Capital, RAIT Securities, RAIT Capital, RAIT Securities (U.K.) Ltd., which we refer to as RAIT Securities UK, Taberna Funding LLC, which we refer to as Taberna Funding, Taberna Equity Funding and our non-U.S. corporate subsidiaries are TRSs. We expect to own interests in additional TRSs in the future, particularly in connection with our securitization transactions. However, our ability to invest in securitizations that are structured as TRSs and to expand the fee-generating businesses of Taberna Capital and RAIT Securities, as well as the business of Taberna Funding, RAIT Securities UK and future TRSs we may form, will be limited by our and Taberna’s need to meet this 25% test, which may adversely affect distributions we pay to our shareholders.
If Taberna fails to qualify as a REIT, then we also would very likely fail to qualify as a REIT.
Taberna is a REIT subject to all of the risks discussed above with respect to RAIT. If Taberna fails to qualify as a REIT, then we also would very likely fail to qualify as a REIT, because the income we receive from, and assets we hold through, Taberna make up a significant portion of our total income and assets and materially affect our ability to meet REIT qualification tests.
Other Regulatory and Legal Risks of Our Business
Our reputation, business and operations could be adversely affected by regulatory compliance failures.
Potential regulatory action poses a significant risk to our reputation and thereby to our business. Our business is subject to extensive regulation in the United States and in the other countries in which our investment activities occur. We operate our business so as to comply with the Internal Revenue Code’s REIT rules and regulations and so as to remain exempt from registration as an investment company under the Investment Company Act. The SEC and the Financial Industry Regulatory Authority, or FINRA, oversee the activities of our broker dealer subsidiaries. In addition, we are subject to regulation under the Exchange Act, the Investment
34
Table of Contents
Advisers Act and various other statutes. A number of our investing activities, such as our lending business, are subject to regulation by various U.S. state regulators. In the United Kingdom, we are subject to regulation by the U.K. Financial Services Authority. With respect to our operations and investments in other countries, we are subject to a variety of regulatory regimes that vary country by country. Each of the regulatory bodies with jurisdiction over us has regulatory powers dealing with many aspects of our business, including the authority to grant, and in specific circumstances to cancel, permissions to carry on particular businesses. A failure to comply with the obligations imposed by any of the regulations binding on us or to maintain any of the licenses required to be maintained by us could result in investigations, sanctions and reputation damage.
Loss of our Investment Company Act exemption would affect us adversely.
We seek to conduct our operations so that we are not required to register as an investment company. Under Section 3(a)(1) of the Investment Company Act, a company is not deemed to be an “investment company” if:
| • | it neither is, nor holds itself out as being, engaged primarily, nor proposes to engage primarily, in the business of investing, reinvesting or trading in securities; and |
| • | it neither is engaged nor proposes to engage in the business of investing, reinvesting, owning, holding or trading in securities and does not own or propose to acquire “investment securities” having a value exceeding 40% of the value of its total assets on an unconsolidated basis, which we refer to as the 40% test. “Investment securities” excludes U.S. government securities and securities of majority-owned subsidiaries that are not themselves investment companies and are not relying on the exception from the definition of investment company under Section 3(c)(1) or Section 3(c)(7) of the Investment Company Act. |
We rely on the 40% test. Because we are a holding company that conducts our businesses through wholly-owned or majority-owned subsidiaries, the securities issued by our subsidiaries that are excepted from the definition of “investment company” under Section 3(c)(1) or Section 3(c)(7) of the Investment Company Act, together with any other investment securities we may own, may not have a combined value in excess of 40% of the value of our total assets on an unconsolidated basis. In fact, based on the relative value of our investment in Taberna, on the one hand, and our investment in RAIT Partnership, on the other hand, we can comply with the 40% test only if Taberna satisfies the 40% test on which it relies (or another exemption other than Section 3(c)(1) or 3(c)(7)) and RAIT Partnership complies with Section 3(c)(5)(c) or 3(c)(6), the exemptions upon which it relies (or another exemption other than Section 3(c)(1) or 3(c)(7)). This requirement limits the types of businesses in which we may engage through our subsidiaries.
Because RAIT Partnership and the two wholly-owned subsidiaries through which we hold 100% of the partnership interests in RAIT Partnership—RAIT General, Inc. and RAIT Limited, Inc.—will not be relying on Section 3(c)(1) or 3(c)(7) for their respective Investment Company Act exemptions, our investments therein will not constitute “investment securities” for purposes of the 40% test, if RAIT Partnership is otherwise exempt from the Investment Company Act.
RAIT Partnership, our subsidiary that holds, directly and through wholly-owned or majority-owned subsidiaries, a substantial portion of our assets, intends to conduct its operations so that it is not required to register as an investment company in reliance on the exemption from Investment Company Act regulation provided under Section 3(c)(5)(c). RAIT Partnership may also from time to time rely on the exemption from Investment Company Act regulation provided under Section 3(c)(6).
Any entity relying on Section 3(c)(5)(c) for its Investment Company Act exemption must have at least 55% of its portfolio invested in qualifying assets (which in general must consist of mortgage loans, mortgage backed securities that represent the entire ownership in a pool of mortgage loans and other liens on and interests in real estate) and another 25% of its portfolio invested in other real estate-related assets. Based on no-action letters issued by the Staff of the SEC, we classify our investments in mortgage loans as qualifying assets, as long as the loans are “fully secured” by an interest in real estate. That is, if the loan-to-value ratio of the loan is equal to or
35
Table of Contents
less than 100%, then we consider the loan to be a qualifying asset. We do not consider loans with loan-to-value ratios in excess of 100% to be qualifying assets that come within the 55% basket, but only real estate-related assets that come within the 25% basket. Based on a no-action letter issued by the Staff of the SEC, we treat most of our mezzanine loans as qualifying assets because we usually obtain a first lien position on the entire ownership interest of a special purpose entity, or SPE, that owns only real property, or that owns the entire ownership interest in a second SPE that owns only real property, and otherwise comes within the conditions of the no-action letter and we treat any remaining mezzanine loans as real estate-related assets that come within the 25% basket. The treatment of other investments as qualifying assets and real estate-related assets, including equity investments in subsidiaries, is based on the characteristics of the underlying asset, in the case of a directly held investment, or the characteristics of the assets of the subsidiary, in the case of equity investments in subsidiaries.
Any entity relying on Section 3(c)(6) for its Investment Company Act exemption must be primarily engaged, directly or through majority-owned subsidiaries, in one or more specified businesses, including a business described in Section 3(c)(5)(c), or in one or more of such businesses (from which not less than 25% of its gross income during its last fiscal year was derived), together with an additional business or businesses other than investing, reinvesting, owning, holding or trading in securities.
Taberna, like RAIT, is a holding company that conducts its operations through subsidiaries. Accordingly, we intend to monitor Taberna’s holdings such that it will satisfy the 40% test. Similar to securities issued to us, the securities issued to Taberna by its subsidiaries that are excepted from the definition of “investment company” by Section 3(c)(1) or 3(c)(7) of the Investment Company Act, together with any other investment securities Taberna may own, may not have a combined value in excess of 40% of the value of its total assets on an unconsolidated basis. This requirement limits the types of businesses in which Taberna may engage through these subsidiaries.
We make the determination of whether an entity is a majority-owned subsidiary of RAIT, RAIT Partnership or Taberna. The Investment Company Act defines a majority-owned subsidiary of a person as a company 50% or more of the outstanding voting securities of which are owned by such person, or by another company which is a majority-owned subsidiary of such person. The Investment Company Act further defines voting securities as any security presently entitling the owner or holder thereof to vote for the election of directors of a company. We treat companies, including future CDO subsidiaries, in which we own at least a majority of the outstanding voting securities as majority-owned subsidiaries for purposes of the 40% test. Neither RAIT, RAIT Partnership nor Taberna has requested the SEC to approve our treatment of any company as a majority-owned subsidiary and the SEC has not done so. If the SEC were to disagree with our treatment of one or more companies, including CDO issuers, as majority-owned subsidiaries, we would need to adjust our respective investment strategies and invest our respective assets in order to continue to pass the 40% test. Any such adjustment in its investment strategy could have a material adverse effect on Taberna and us.
A majority of Taberna’s subsidiaries are limited by the provisions of the Investment Company Act and the rules and regulations promulgated thereunder with respect to the assets in which they can invest to avoid being regulated as an investment company. In particular, Taberna’s subsidiaries that issue CDOs generally rely on Rule 3a-7, an exemption from the Investment Company Act provided for certain structured financing vehicles that pool income-producing assets and issue securities backed by those assets. Such structured financings may not engage in portfolio management practices resembling those employed by mutual funds. Accordingly, each Taberna CDO subsidiary that relies on Rule 3a-7 is subject to an indenture which contains specific guidelines and restrictions limiting the discretion of the CDO issuer. Accordingly, the indenture prohibits the CDO issuer from acquiring and disposing of assets primarily for the purpose of recognizing gains or decreasing losses resulting from market value changes. Certain sales and purchases of assets, such as dispositions of collateral that has gone into default or is at risk of imminent default, may be made so long as they do not violate the guidelines contained in each indenture and are not based primarily on changes in market value. The proceeds of permitted dispositions may be reinvested in collateral that is consistent with the credit profile of the CDO under specific and predetermined guidelines. In addition, absent obtaining further guidance from the SEC,
36
Table of Contents
substitutions of assets may not be made solely for the purpose of enhancing the investment returns of the holders of the equity securities issued by the CDO issuer. As a result of these restrictions, Taberna’s CDO subsidiaries may suffer losses on their assets and Taberna may suffer losses on its investments in its CDO subsidiaries.
If the combined value of the investment securities issued to Taberna by its subsidiaries that are excepted by Section 3(c)(1) or 3(c)(7) of the Investment Company Act, together with any other investment securities Taberna may own, exceeds 40% of Taberna’s total assets on an unconsolidated basis, Taberna may be required either to substantially change the manner in which it conducts its operations or to rely on Section 3(c)(1) or 3(c)(7) to avoid having to register as an investment company, either of which could have an adverse effect on Taberna and us. If Taberna were to rely on Section 3(c)(1) or 3(c)(7), then we would no longer comply with our own exemption from registration as an investment company.
None of RAIT, RAIT Partnership or Taberna has received a no-action letter from the SEC regarding whether it complies with the Investment Company Act or how its investment or financing strategies fit within the exclusions from regulation under the Investment Company Act that it is using. To the extent that the SEC provides more specific or different guidance regarding, for example, the treatment of assets as qualifying real estate assets or real estate-related assets, we may be required to adjust these investment and financing strategies accordingly. Any additional guidance from the SEC could provide additional flexibility to us and Taberna, or it could further inhibit the ability of Taberna and our combined company to pursue our respective investment and financing strategies which could have a material adverse effect on us. See Item 1-“Business-Certain REIT and Investment Company Act Limits On Our Strategies-Investment Company Act Limits.”
Our ownership limitation may restrict business combination opportunities.
To qualify as a REIT under the Internal Revenue Code, no more than 50% in value of our outstanding capital shares may be owned, directly or indirectly, by five or fewer individuals during the last half of each taxable year. To preserve our REIT qualification, our declaration of trust generally prohibits any person from owning more than 8.3% or, with respect to our original promoter, Resource America, Inc., 15%, of our outstanding common shares and provides that:
| • | A transfer that violates the limitation is void. |
| • | A transferee gets no rights to the shares that violate the limitation. |
| • | Shares acquired that violate the limitation transfer automatically to a trust whose trustee has all voting and other rights. |
| • | Shares in the trust will be sold and the record holder will receive the net proceeds of the sale. |
The ownership limitation may discourage a takeover or other transaction that our shareholders believe to be desirable.
Preferred shares may prevent change in control.
Our declaration of trust authorizes our board of trustees to issue preferred shares, to establish the preferences and rights of any preferred shares issued, to classify any unissued preferred shares and reclassify any previously classified but unissued preferred shares, without shareholder approval. The issuance of preferred shares could delay or prevent a change in control, apart from the ownership limitation, even if a majority of our shareholders want control to change.
Maryland anti-takeover statutes may restrict business combination opportunities.
As a Maryland REIT, we are subject to various provisions of Maryland law which impose restrictions and require that specified procedures be followed with respect to the acquisition of “control shares” representing at least ten percent of our aggregate voting power and certain takeover offers and business combinations, including,
37
Table of Contents
but not limited to, combinations with persons who own one-tenth or more of our outstanding shares. While we have elected to “opt out” of the control share acquisition statute, our board of trustees has the right to rescind the election at any time without notice to our shareholders.
If our subsidiaries that are registered investment advisers fail to comply with the Investment Advisers Act, this could have an adverse effect on our ability to manage securitizations.
Our subsidiaries, RAIT Securities, RAIT Partnership, and TCM, are registered investment advisers under the Investment Advisers Act of 1940, or the Investment Advisers Act, and, as such, are supervised by the Securities and Exchange Commission, or the SEC. We registered RAIT Securities, RAIT Partnership and TCM under the Investment Advisers Act so that they could manage increasing numbers of securitizations or otherwise provide advisory services. The Investment Advisers Act requires registered investment advisors to comply with numerous obligations, including record-keeping requirements, operational procedures and disclosure obligations. Such subsidiaries may also be registered with various states and thus, subject to the oversight and regulation by such states’ regulatory agencies. If we do not comply with these requirements, it could have an adverse effect on our ability to manage our securitizations.
Our failure to maintain a broker-dealer license in the various jurisdictions in which we do business could have a material adverse effect on our business, financial condition, liquidity and results of operations.
FINRA has granted our membership application for a broker-dealer license for our subsidiary, RAIT Securities, LLC, or RAIT Securities. We also are required to maintain licenses with state securities regulators. Failure to maintain RAIT Securities’ licenses as a broker- dealer with FINRA and applicable state regulators would prevent us from originating securities and supplementing our revenue with origination fees paid to RAIT Securities by the issuers of those securities or engaging in trading and advisory services. In that event, we may need to engage a third-party broker-dealer to act as an originator and to permit a third-party broker-dealer to retain origination fees. If RAIT Securities is unable to receive origination fees or engage in trading and advisory services, it would have less cash available for distribution to RAIT.
Our failure to obtain a broker-dealer license in the various jurisdictions in which any affiliated licensed broker dealer responsible for the capital raising for our sponsored REIT could have a material adverse effect on our sponsored REIT and our ability to derive benefits from our sponsored REIT.
If our subsidiary that is regulated by the United Kingdom Financial Services Authority fails to comply with applicable regulatory requirements, this could have an adverse effect on our ability to originate securities and receive origination fees in foreign jurisdictions.
Our subsidiary, RAIT Securities UK, is subject to extensive government regulation, primarily by the United Kingdom Financial Services Authority under the U.K. Financial Services and Markets Act of 2000. Failure of RAIT Securities UK to comply with applicable regulatory requirements would prevent us from originating securities and supplementing our revenue with origination fees paid to RAIT Securities UK by the issuers of those securities. In that event, we may need to engage a third-party permitted by applicable regulations to act as an originator and to permit this third-party to retain origination fees. If RAIT Securities UK is unable to receive origination fees, it would have less cash available for distribution to RAIT.
| Item 1B. | Unresolved Staff Comments |
None.
38
Table of Contents
| Item 2. | Properties |
Our principal executive office is located in Philadelphia, Pennsylvania. We lease office space pursuant to a lease agreement that expires in April 2016. As of December 31, 2010 the future minimum cash payments due under this lease are as follows by fiscal year: 2011 through 2015—$0.4 million per year and $0.1 million for the remaining term of the lease.
We lease office space in New York, New York pursuant to a lease agreement that has a ten year term. This lease expires in March 2016. As of December 31, 2010, the future minimum cash payments due under this lease are as follows by fiscal year: 2011 through 2015—$0.9 million per year and $0.2 million for the remaining term of the lease.
We lease office space in Chicago, Illinois pursuant to a lease agreement that has a five year term. This lease expires in April 2014. As of December 31, 2010, the future minimum cash payments due under this lease are $0.1 million per each fiscal year through the remaining term of the lease.
For our investments in real estate, the leases for our multi-family properties are generally one-year or less and leases for our office and retail properties are operating leases. The following table represents a ten-year lease expiration schedule for our non-residential properties as of December 31, 2010.
| Year of Lease Expiration (December 31,) |
Number of Leases Expiring during the Year |
Rentable Square Feet Subject to Expiring Leases |
Final Annualized Rent under Expiring Leases (in 000’s) (a) |
Final Annualized Rent per Square Foot under Expiring Leases |
Percentage of Total Final Annualized Base Rent Under Expiring Leases |
Cumulative Total | ||||||||||||||||||
| 2011 |
143 | 376,814 | $ | 4,615 | $ | 12.25 | 17.4 | % | 17.4 | % | ||||||||||||||
| 2012 |
47 | 257,696 | 3,914 | 15.19 | 14.8 | % | 32.2 | % | ||||||||||||||||
| 2013 |
41 | 364,456 | 4,777 | 13.11 | 18.0 | % | 50.2 | % | ||||||||||||||||
| 2014 |
17 | 65,176 | 822 | 12.61 | 3.1 | % | 53.3 | % | ||||||||||||||||
| 2015 |
23 | 188,347 | 1,965 | 10.43 | 7.4 | % | 60.7 | % | ||||||||||||||||
| 2016 |
8 | 37,521 | 828 | 22.07 | 3.1 | % | 63.8 | % | ||||||||||||||||
| 2017 |
5 | 100,868 | 1,676 | 16.62 | 6.3 | % | 70.1 | % | ||||||||||||||||
| 2018 |
2 | 58,661 | 1,205 | 20.55 | 4.5 | % | 74.6 | % | ||||||||||||||||
| 2019 |
3 | 46,188 | 485 | 10.49 | 1.8 | % | 76.4 | % | ||||||||||||||||
| 2020 |
4 | 11,014 | 199 | 18.07 | 0.8 | % | 77.2 | % | ||||||||||||||||
| 2021 and thereafter |
2 | 256,299 | 6,032 | 23.53 | 22.8 | % | 100.0 | % | ||||||||||||||||
| Total |
295 | 1,763,040 | $ | 26,518 | $ | 15.04 | 100.0 | % | ||||||||||||||||
| (a) | “Final Annualized Rent” for each lease scheduled to expire represents the cash rental rates of the respective tenants for the final month prior to expiration multiplied by 12. |
For a description of our investments in real estate, see Item 1—“Business—Our Investment Portfolio—Investments in real estate” and Item 8—“Financial Statements and Supplementary Data—Schedule III.”
| Item 3. | Legal Proceedings |
Riverside National Bank of Florida Litigation
Our subsidiary Taberna Capital Management, LLC is one of fifteen defendants in a lawsuit by the Federal Deposit Insurance Corporation, as Receiver for Riverside National Bank of Florida. The lawsuit was originally commenced by Riverside on August 6, 2009 in the Supreme Court of the State of New York, County of Kings, and subsequently discontinued without prejudice and refiled in New York County on November 13, 2009. On April 16, 2010, the Office of the Comptroller of the Currency closed Riverside and named the FDIC as receiver and thus as successor-in-interest to Riverside as plaintiff in the action. On June 3, 2010, the defendants removed
39
Table of Contents
the case to the United States District Court for the Southern District of New York. The action, now titled FDIC v. The McGraw-Hill Companies, Inc., Moody’s Investors Service, Inc., Fitch, Inc., Taberna Capital Management, LLC, Cohen & Company Financial Management, LLC f/k/a Cohen Bros. Financial Management LLC, FTN Financial Capital Markets, Keefe Bruyette & Woods, Inc., Merrill Lynch, Pierce, Fenner & Smith, Inc., JPMorgan Chase & Co., J.P. Morgan Securities Inc., Citigroup Global Markets, Credit Suisse Securities (USA) LLC, ABN Amro, Inc., Cohen & Company, and SunTrust Robinson Humphrey, Inc., asserts claims in connection with Riverside’s purchase of certain CDO securities, including securities from the Taberna Preferred Funding II, IV, and V CDOs. Riverside alleges that offering materials issued in connection with the CDOs it purchased did not adequately disclose the process by which the rating agencies rated each of the securities. Riverside also alleges, among other things, that the offering materials should have disclosed an alleged conflict of interest of the rating agencies as well as the role that the rating agencies played in structuring each CDO. Riverside seeks damages in excess of $132 million, rescission of its purchases of the securities at issue, an accounting of certain amounts received by the defendants together with the imposition of a constructive trust, and punitive damages of an unspecified amount.
On June 25, 2010, the federal court directed the parties to refile papers supporting and opposing the defendants’ motions to dismiss, which had been filed in state court but not argued or decided. On August 20, 2010, the court granted the FDIC’s motion for substitution of counsel and to stay the action for 90 days, and on October 28, 2010, it granted an additional 90-day stay at the FDIC’s request. On January 20, 2011, the court granted a third motion by the FDIC to stay the action until April 29, 2011. Defendants must refile their motions to dismiss or answer Plaintiff’s complaint by May 2, 2011. An adverse resolution of the litigation could have a material adverse effect on our financial condition and results of operations.
Routine Litigation
We are involved from time to time in litigation on various matters, including disputes with tenants of owned properties, disputes arising out of agreements to purchase or sell properties and disputes arising out of our loan portfolio. Given the nature of our business activities, these lawsuits are considered routine to the conduct of our business. The result of any particular lawsuit cannot be predicted, because of the very nature of litigation, the litigation process and its adversarial nature, and the jury system. We do not expect that the liabilities, if any, that may ultimately result from such routine legal actions will have a material adverse effect on our consolidated financial position, results of operations or cash flows.
| Item 4. | Reserved |
40
Table of Contents
| Item 5. | Market for Our Common Equity, Related Shareholder Matters and Issuer Purchases of Equity Securities |
Our common shares trade on the New York Stock Exchange, or the NYSE, under the symbol “RAS.” We have adopted a Code of Business Conduct and Ethics, which we refer to as the Code, for our trustees, officers and employees intended to satisfy New York Stock Exchange listing standards and the definition of a “code of ethics” set forth in Item 406 of Regulation S-K. We also have adopted Trust Governance Guidelines and charters for the audit, compensation and nominating and governance committees of the board of trustees intended to satisfy New York Stock Exchange listing standards. The Code, these guidelines, these charters and charters of other committees of our board of trustees are available on our website at http://www.raitft.com. Any information relating to amendments to the Code or waivers of a provision of the Code required to be disclosed pursuant to Item 5.05 of Form 8-K will be disclosed through our website.
MARKET PRICE OF AND DIVIDENDS ON OUR COMMON SHARES
The following table shows the high and low reported sales prices per common share on the NYSE composite transactions reporting system and the quarterly cash dividends declared per common share for the periods indicated. For further discussion of our dividend policies, see Item 7—“Management’s Discussion and Analysis of Financial Condition and Results of Operations-REIT Taxable Income.” Past price performance is not necessarily indicative of likely future performance. Because the market price of our common shares will fluctuate, you are urged to obtain current market prices for our common shares.
| Price Range of Common Shares |
Dividends Declared |
|||||||||||
| High | Low | |||||||||||
| 2009 |
||||||||||||
| First Quarter |
$ | 3.03 | $ | 0.45 | — | |||||||
| Second Quarter |
2.06 | 1.10 | — | |||||||||
| Third Quarter |
3.45 | 0.99 | — | |||||||||
| Fourth Quarter |
3.00 | 1.24 | — | |||||||||
| 2010 |
||||||||||||
| First Quarter |
$ | 2.33 | $ | 1.01 | — | |||||||
| Second Quarter |
4.75 | 1.83 | — | |||||||||
| Third Quarter |
2.34 | 1.30 | — | |||||||||
| Fourth Quarter |
2.42 | 1.50 | — | |||||||||
| 2011 |
||||||||||||
| First Quarter (through February 22, 2011) |
$ | 3.78 | $ | 2.19 | $ | 0.03 | ||||||
As of February 22, 2011, there were 110,948,903 of our common shares outstanding held by 685 holders of record.
Our Series A Cumulative Redeemable Preferred Shares, or Series A Preferred Shares, are listed on the NYSE and traded under the symbol “RAS PrA.” The Series A Preferred Shares were issued in the first and second quarter of 2004. RAIT declared a dividend per share of $0.0625 on the Series A Preferred Shares for the first quarter of 2004, representing the pro ration of the specified quarterly dividend for the quarter for the period during which the Series A Preferred Shares were outstanding in the quarter. In each subsequent quarter, RAIT has declared and paid the specified dividend per share of $0.484375. No dividends are currently in arrears on the Series A Preferred Shares.
Our Series B Cumulative Redeemable Preferred Shares, or Series B Preferred Shares, are listed on the NYSE and traded under the symbol “RAS PrB.” The Series B Preferred Shares were issued in the fourth quarter
41
Table of Contents
of 2004. RAIT declared a dividend per share of $0.4952957 on the Series B Preferred Shares for the fourth quarter of 2004 representing the pro ration of the specified dividend for the quarter for the period during which the Series B Preferred Shares were outstanding in the quarter. In each subsequent quarter, RAIT has declared and paid the specified dividend per share of $0.5234375. No dividends are currently in arrears on the Series B Preferred Shares.
Our Series C Cumulative Redeemable Preferred Shares, or Series C Preferred Shares, are listed on the NYSE and traded under the symbol “RAS PrC.” The Series C Preferred Shares were issued in the third quarter of 2007. RAIT declared a dividend per share of $0.523872 on the Series C Preferred Shares for the third quarter of 2007 representing the pro ration of the specified dividend for the quarter for the period during which the Series C Preferred Shares were outstanding in the quarter. In each subsequent quarter, RAIT has declared and paid the specified dividend per share of $0.5546875. No dividends are currently in arrears on the Series C Preferred Shares.
PERFORMANCE GRAPH
The following graph compares the index of the cumulative total shareholder return on our common shares for the measurement period commencing December 31, 2005 and ending December 31, 2010 with the cumulative total returns of the National Association of Real Estate Investment Trusts (NAREIT) Mortgage REIT index, the NAREIT Equity index and the S&P 500 Index. The following graph assumes that each index was 100 on the initial day of the relevant measurement period and that all dividends were reinvested.
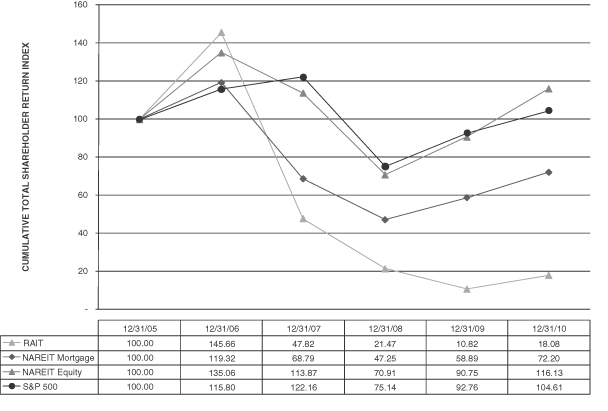
42
Table of Contents
In the performance graph included in our annual report for the fiscal year ended December 31, 2009, we included the NAREIT Hybrid REIT index. NAREIT discontinued the NAREIT Hybrid REIT index on December 17, 2010 and so we are unable to continue to include this index. We have added the NAREIT Equity REIT index to the performance graph.
| Item 6. | Selected Financial Data |
The following selected financial data information should be read in conjunction with Item 7—“Management’s Discussion and Analysis of Financial Condition and Results of Operations,” and our consolidated financial statements, including the notes thereto, included elsewhere herein (dollars in thousands, except share and per share data).
| As of and For the Years Ended December 31 | ||||||||||||||||||||
| 2010 | 2009 | 2008 | 2007 | 2006 | ||||||||||||||||
| Operating Data: |
||||||||||||||||||||
| Net interest margin |
$ | 62,813 | $ | 126,375 | $ | 206,001 | $ | 194,621 | $ | 76,806 | ||||||||||
| Rental income |
72,373 | 44,637 | 17,425 | 11,291 | 12,639 | |||||||||||||||
| Total revenue |
153,428 | 197,510 | 244,783 | 231,637 | 103,832 | |||||||||||||||
| Real estate operating expenses |
(56,824 | ) | (41,399 | ) | (14,781 | ) | (9,958 | ) | (9,198 | ) | ||||||||||
| Provision for losses |
(38,307 | ) | (226,567 | ) | (162,783 | ) | (21,721 | ) | (2,499 | ) | ||||||||||
| Asset impairments |
— | (46,015 | ) | (67,052 | ) | (517,452 | ) | — | ||||||||||||
| Total expenses |
(170,749 | ) | (384,451 | ) | (319,623 | ) | (686,660 | ) | (34,720 | ) | ||||||||||
| Change in fair value of financial instruments |
45,840 | 1,563 | (552,437 | ) | — | — | ||||||||||||||
| Income (loss) from continuing operations |
110,590 | (440,141 | ) | (617,130 | ) | (435,991 | ) | 74,704 | ||||||||||||
| Net income (loss) allocable to common shares |
98,152 | (441,203 | ) | (443,246 | ) | (379,588 | ) | 67,839 | ||||||||||||
| Earnings (loss) per share from continuing operations |
||||||||||||||||||||
| Basic |
$ | 1.13 | $ | (6.76 | ) | $ | (6.96 | ) | $ | (6.16 | ) | $ | 2.11 | |||||||
| Diluted |
$ | 1.11 | $ | (6.76 | ) | $ | (6.96 | ) | $ | (6.16 | ) | $ | 2.09 | |||||||
| Earnings (loss) per share: |
||||||||||||||||||||
| Basic |
$ | 1.13 | $ | (6.77 | ) | $ | (6.99 | ) | $ | (6.18 | ) | $ | 2.31 | |||||||
| Diluted |
$ | 1.11 | $ | (6.77 | ) | $ | (6.99 | ) | $ | (6.18 | ) | $ | 2.29 | |||||||
| Balance Sheet Data: |
||||||||||||||||||||
| Investments in mortgages and loans, net |
$ | 1,149,419 | $ | 1,380,957 | $ | 5,468,064 | $ | 6,378,050 | $ | 5,922,550 | ||||||||||
| Investments in real estate |
841,488 | 738,235 | 350,487 | 117,238 | 61,432 | |||||||||||||||
| Investments in securities |
705,451 | 694,897 | 1,920,883 | 3,827,800 | 5,138,311 | |||||||||||||||
| Total assets |
2,993,432 | 3,094,976 | 8,151,450 | 11,057,580 | 12,060,506 | |||||||||||||||
| Total indebtedness |
1,838,177 | 2,077,123 | 6,102,890 | 10,040,925 | 10,452,191 | |||||||||||||||
| Total liabilities |
2,074,902 | 2,325,055 | 6,882,109 | 10,474,982 | 10,739,829 | |||||||||||||||
| Total equity |
918,530 | 769,921 | 1,269,341 | 582,598 | 1,320,677 | |||||||||||||||
| As of and For the Years Ended December 31 | ||||||||||||||||||||
| 2010 | 2009 | 2008 | 2007 | 2006 | ||||||||||||||||
| Other Data: |
||||||||||||||||||||
| Common shares outstanding, at period end, including unvested restricted share awards |
105,900,570 | 74,420,598 | 64,842,571 | 61,018,231 | 52,151,412 | |||||||||||||||
| Book value per share |
$ | 7.11 | $ | 8.08 | $ | 14.09 | $ | 6.81 | $ | 20.54 | ||||||||||
| Ratio of earnings to fixed charges and preferred share dividends |
1.9x | — | (1) | — | (1) | — | (1) | 1.9x | ||||||||||||
| Dividends declared per share |
$ | — | (2) | $ | — | $ | 1.27 | $ | 2.56 | $ | 2.70 | |||||||||
43
Table of Contents
| (1) | The ratio of earnings to fixed charges and preferred share dividends for the years ended December 31, 2009, 2008 and 2007 is deficient by $453.8 million, $630.8 million and $447.8 million, respectively. |
| (2) | On January 10, 2011, our board of trustees declared a 2010 annual cash dividend on our common shares of $0.03 per common shares. The dividends were paid on January 31, 2011 to holders of record on January 21, 2011 and totaled $3.2 million. |
| Item 7. | Management’s Discussion and Analysis of Financial Condition and Results of Operations |
Overview
We are a vertically integrated commercial real estate company capable of originating, investing in, managing, servicing, trading and advising on commercial real estate-related assets. In 2010, we continued our progress in adapting RAIT to the current market environment. We are seeking to position RAIT for future growth in the area of its historical core competency, commercial real estate lending, while diversifying the revenue generated from our commercial real estate loans and properties and reducing or removing other non-core assets and activities.
In order to take advantage of market opportunities in the future, and to maximize shareholder value over time, we will continue to focus on:
| • | expanding RAIT’s commercial real estate revenue by investing in commercial real estate-related assets, managing and servicing investments for our own account or for others, providing property management services and providing our broker-dealer activities, including fixed-income trading and real estate advisory services; |
| • | creating value through investing in our commercial real estate properties and implementing cost savings programs to help maximize property value; |
| • | reducing our leverage while developing new financing sources; |
| • | managing our investment portfolios to reposition non-performing assets, increase our cash flows and ultimately recover the value of our assets; and |
| • | managing the size and cost structure of our business to match our operating environment. |
We generated net income allocable to common shares of $98.2 million, or $1.11 per common share-diluted, during the year ended December 31, 2010. The primary items affecting our operating performance were the following:
| • | Gains on debt extinguishments. During 2010, we repurchased $102.8 million of our convertible notes and $55.0 million of our CDO notes payable for total consideration of $85.4 million. The consideration was comprised of: cash of $27.7 million, the issuance of a $22.0 million convertible senior note and 18.9 million common shares. These transactions generated $71.6 million in gains on extinguishment of debt. See “Liquidity and Capital Resources-Capitalization” below for more information regarding these transactions. |
| • | Change in fair value of financial instruments. The net change in fair value of financial instruments, during 2010, increased net income by $45.8 million. Generally, the change in fair value of our financial assets, which are recorded at fair value under FASB ASC Topic 825, “Financial Instruments”, was the primary driver of this improvement with several of our assets improving. This is consistent with the general improvement in asset pricing throughout the financial sector during 2010. |
| • | Provision for losses. The provision for losses recorded during 2010 was $38.3 million. While we recorded additional provision for losses during 2010, we saw improvement in the performance of our portfolio of commercial real estate loans from prior years. During 2010, we converted $141.2 million of commercial real estate loans (9 loans) into $123.1 million of owned real estate properties (11 properties). |
We expect to continue to focus our efforts on enhancing our commercial real estate property portfolio and our commercial real estate loan portfolio, which are our primary investment portfolios. We are seeing signs of stabilization in these portfolios, including improved occupancy rates in our commercial real estate property
44
Table of Contents
portfolio and a reduction in our non-accrual loans and provision for losses in our commercial real estate loan portfolio throughout 2010. Although certain economic conditions are improving, some of our borrowers within our commercial real estate loan portfolio are under financial stress. Where it is likely to enhance our ultimate returns, we will consider restructuring loans or foreclosing on the underlying property. We have and expect to engage in workout activity with respect to our commercial real estate loans that may result in the conversion of some of the properties into owned real estate. We may take a non-cash charge to earnings at the time of any loan conversion to the extent the amount of our loan, reduced by any allowance for losses and certain other expenses, exceeds the fair value of the property at the time of the conversion. The conversion of loans to owned properties is reflected in the growing portion of our revenue derived from rental income as opposed to net interest margin.
We are seeking to develop new sources of fee income. As described below under “Securitization Summary,” in April 2010 we sold or delegated our collateral management rights and responsibilities relating to eight Taberna securitizations which will reduce our collateral management fees for managing securitizations going forward. We are seeking to enhance our fee income through management fees generated by our property management subsidiaries, Jupiter Communities and CRP Commercial Services, commissions and other fees generated by our broker/dealer subsidiary, RAIT Securities, as well as other potential new businesses. We may also generate fee income by developing arrangements with third parties to originate commercial real estate investments.
The following key statistics illustrate the transformation of our business through December 31, 2010 (dollars in thousands):
| For the Years Ended December 31 | ||||||||||||
| 2010 | 2009 | 2008 | ||||||||||
| Financial Statistics: |
||||||||||||
| Recourse debt maturing within 1-year |
$ | 41,489 | $ | 24,390 | $ | 55,161 | ||||||
| Assets under management |
$ | 3,837,526 | $ | 10,126,853 | $ | 14,181,883 | ||||||
| Debt to equity |
2.3x | 3.0x | 5.4x | |||||||||
| Total revenue |
$ | 153,428 | $ | 197,510 | $ | 244,783 | ||||||
| Earnings per share, diluted |
$ | 1.11 | $ | (6.77 | ) | $ | (6.99 | ) | ||||
| Commercial Real Estate (“CRE”) Loan Portfolio: |
||||||||||||
| Reported CRE Loans—unpaid principal |
$ | 1,173,141 | $ | 1,473,700 | $ | 2,053,752 | ||||||
| Non-accrual loans—unpaid principal |
$ | 122,306 | $ | 171,372 | $ | 186,040 | ||||||
| Non-accrual loans as a % of reported loans |
10.4 | % | 11.6 | % | 9.1 | % | ||||||
| Reserve for losses |
$ | 61,731 | $ | 86,609 | $ | 117,737 | ||||||
| Reserves as a % of non-accrual loans |
50.5 | % | 50.5 | % | 63.3 | % | ||||||
| Provision for losses |
$ | 38,307 | $ | 130,080 | $ | 107,360 | ||||||
| CRE Property Portfolio: |
||||||||||||
| Reported investments in real estate |
$ | 841,488 | $ | 738,235 | $ | 350,487 | ||||||
| Number of properties owned |
47 | 39 | 15 | |||||||||
| Multifamily units owned |
8,311 | 6,967 | 2,959 | |||||||||
| Office square feet owned |
1,632,978 | 1,324,368 | 933,418 | |||||||||
| Retail square feet owned |
1,116,112 | 1,095,452 | — | |||||||||
| Average Physical Occupancy Data: |
||||||||||||
| Multifamily |
85.5 | % | 77.7 | % | 79.7 | % | ||||||
| Office |
67.8 | % | 48.2 | % | 50.8 | % | ||||||
| Retail |
58.8 | % | 58.0 | % | — | |||||||
| Total |
79.2 | % | 69.8 | % | 72.5 | % | ||||||
45
Table of Contents
Trends That May Affect Our Business
The following trends may affect our business:
Credit, capital markets and liquidity risk. While there are signs of improvement from past years, we continue to see reduced availability of liquidity to finance assets similar to those in our investment portfolios which continues to impact our ability to finance new investments in our targeted asset classes. With respect to our borrowers, the market for financing sources, such as CMBS, for commercial real estate is constrained. This creates an increased risk of defaults upon the maturity of loans due to the lack of sources of refinancing.
Interest rate environment. Interest rates continued to experience volatility during 2010. Continued volatility in interest rates may impact the value of our investments and/or the net investment income generated by those investments in the future. We do not expect that an increase or decrease in interest rates would dramatically impact the net investment income generated by our commercial loan portfolios. We use floating rate line of credit borrowings and long-term floating rate CDO notes payable to finance our investments. To the extent the amount of fixed-rate commercial loans are not directly offset by matching fixed-rate CDO notes payable, we utilize interest rate derivative contracts to convert our floating rate liabilities into fixed-rate liabilities, effectively match funding our assets with our liabilities.
Our investments in debt securities are comprised of TruPS, subordinated debentures, unsecured debt securities and CMBS held by our consolidated CDO entities. These securities bear fixed and floating interest rates. A large portion of these fixed-rate securities are hybrid instruments, which convert to floating rate securities after a five or ten year fixed-rate period. We have financed these securities through the issuance of floating rate and fixed-rate CDO notes payable. A large portion of the CDO notes payable are floating rate instruments, and we use interest rate swaps to effectively convert this floating rate debt into fixed-rate debt during the period in which our investments in securities are paid at a fixed coupon rate. By using this interest rate hedging strategy, we believe we have effectively match-funded our assets with liabilities, and their cash flows, during the fixed-rate period of our investments in securities. An increase or decrease in interest rates will generally not impact our net investment income generated by our investments in securities. However, an increase or decrease in interest rates will affect the fair value of our investments in securities, which will generally be reflected in our financial statements as changes in the fair value of financial instruments.
Prepayment rates. Prepayment rates generally increase when interest rates fall and decrease when interest rates rise, but changes in prepayment rates are difficult to predict. Prepayment rates on our assets also may be affected by other factors, including, without limitation, conditions in the housing, real estate and financial markets, general economic conditions and the relative interest rates on adjustable-rate and fixed-rate loans. If interest rates begin to fall, triggering an increase in prepayment rates in our commercial loan portfolio and our net investment income may decrease. However, the lack of financing alternatives may cause loans to extend and provide an opportunity to increase the net investment income. While interest rates have increased during 2010, prepayment rates have not decreased due to the lack of mortgage financing in the current economic and credit environments.
Commercial real estate improved performance. We are seeing signs of improvement in the commercial real estate markets. The multi-family, office and retail sectors of commercial real estate are experiencing increased occupancy levels and increased rents as compared to historic levels in several markets throughout the United States, including those where we are invested.
Critical Accounting Estimates and Policies
We consider the accounting policies discussed below to be critical to an understanding of how we report our financial condition and results of operations because their application places the most significant demands on the judgment of our management.
46
Table of Contents
Our financial statements are prepared on the accrual basis of accounting in accordance with GAAP. The preparation of financial statements in conformity with GAAP requires management to make use of estimates and assumptions that affect the reported amounts of assets and liabilities, the disclosure of contingent assets and liabilities at the date of the financial statements and the reported amounts of revenue and expenses during the reporting periods. Actual results could differ from those estimates.
Revenue Recognition for Investment Income. We recognize interest income from investments in commercial mortgages, mezzanine loans, and other securities on a yield to maturity basis. Upon the acquisition of a loan at a discount, we assess the portions of the discount that constitute accretable yields and non-accretable differences. The accretable yield represents the excess of our expected cash flows from the loan over the amount we paid for the loan. That amount, the accretable yield, is accreted to interest income over the remaining life of the loan. Many of our commercial mortgages and mezzanine loans provide for the accrual of interest at specified rates which differ from current payment terms. Interest income is recognized on such loans at the accrual rate subject to management’s determination that accrued interest and outstanding principal are ultimately collectible.
For investments that we did not elect to record at fair value under FASB ASC Topic 825, “Financial Instruments”, origination fees and direct loan origination costs are deferred and amortized to net investment income, using the effective interest method, over the contractual life of the underlying loan security or loan, in accordance with FASB ASC Topic 310, “Receivables.”
For investments that we elected to record at fair value under FASB ASC Topic 825, origination fees and direct loan costs are recorded in income and are not deferred.
We recognize interest income from interests in certain securitized financial assets on an estimated effective yield to maturity basis. Management estimates the current yield on the amortized cost of the investment based on estimated cash flows after considering prepayment and credit loss experience.
Recognition of Rental Income. We generate rental income from tenant rent and other tenant-related activities at our consolidated real estate properties. For multi-family real estate properties, rental income is recorded when due from residents and recognized monthly as it is earned and realizable, under lease terms which are generally for periods of one year or less. For retail and office real estate properties, rental income is recognized on a straight-line basis from the later of the date of the commencement of the lease or the date of acquisition of the property subject to existing leases, which averages minimum rents over the terms of the leases. Leases also typically provide for tenant reimbursement of a portion of common area maintenance and other operating expenses to the extent that a tenant’s pro rata share of expenses exceeds a base year level set in the lease.
Recognition of Fees and other income. We generate fee and other income by (a) providing ongoing asset management services to investment portfolios under cancelable management agreements, (b) providing or arranging to provide financing to our borrowers, (c) property management services to third parties, and (d) providing fixed income trading and advisory services to our customers. We recognize revenue for these activities when the fees are fixed or determinable, are evidenced by an arrangement, collection is reasonably assured and the services under the arrangement have been provided. While we may receive asset management fees when they are earned, we eliminate earned asset management fees from securitizations we consolidate. During the years ended December 31, 2010, 2009 and 2008, we received $6.3 million, $16.1 million, and $23.2 million, respectively, of earned asset management fees, of which we eliminated $2.8 million, $7.0 million, and $12.2 million, respectively, associated with consolidated CDOs.
Investments in Loans. We invest in commercial mortgages, mezzanine loans, debt securities and other loans. We account for our investments in commercial mortgages, mezzanine loans and other loans at amortized cost. The carrying value of these investments is adjusted for origination discounts/premiums, nonrefundable fees and direct costs for originating loans which are amortized into income on a level yield basis over the terms of the loans.
47
Table of Contents
Allowance for Losses, Impaired Loans and Non-accrual Status. We maintain an allowance for losses on our investments in commercial mortgages, mezzanine loans and other loans. Management’s periodic evaluation of the adequacy of the allowance is based upon expected and inherent risks in the portfolio, the estimated value of underlying collateral, and current economic conditions. Management reviews loans for impairment and establishes specific reserves when a loss is probable and reasonably estimable under the provisions of FASB ASC Topic 310, “Receivables.” As part of the detailed loan review, we consider many factors about the specific loan, including payment history, asset performance, borrower’s financial capability and other characteristics. If any trends or characteristics indicate that it is probable that other loans, with similar characteristics to those of impaired loans, have incurred a loss, we consider whether an allowance for loss is needed pursuant to FASB ASC Topic 450, “Contingencies.” Management evaluates loans for non-accrual status each reporting period. A loan is placed on non-accrual status when the loan payment deficiencies exceed 90 days. Payments received for non-accrual or impaired loans are applied to principal until the loan is removed from non-accrual status or no longer impaired. Past due interest is recognized on non-accrual loans when they are removed from non-accrual status and are making current interest payments. The allowance for losses is increased by charges to operations and decreased by charge-offs (net of recoveries). Management charges off impaired loans when the investment is no longer realizable and legally discharged.
Investments in Real Estate. Investments in real estate are shown net of accumulated depreciation. We capitalize all costs related to the improvement of the real property and depreciate those costs on a straight-line basis over the useful life of the asset. We depreciate real property using the following useful lives: buildings and improvements—30 years; furniture, fixtures, and equipment—5 to 10 years; and tenant improvements—shorter of the lease term or the life of the asset. Costs for ordinary maintenance and repairs are charged to expense as incurred.
We acquire real estate assets either directly or through the conversion of our investments in loans into owned real estate. Acquisitions of real estate assets and any related intangible assets are recorded initially at fair value under FASB ASC Topic 805, “Business Combinations.” Fair value is determined by management based on market conditions and inputs at the time the asset is acquired. All expenses incurred to acquire a real estate asset are expensed as incurred.
Management reviews our investments in real estate for impairment whenever events or changes in circumstances indicate that the carrying amount of an asset may not be recoverable. The review of recoverability is based on an estimate of the future undiscounted cash flows (excluding interest charges) expected to result from the long-lived asset’s use and eventual disposition. These cash flows consider factors such as expected future operating income, trends and prospects, as well as the effects of leasing demand, competition and other factors. If impairment exists due to the inability to recover the carrying value of a long-lived asset, an impairment loss is recorded to the extent that the carrying value exceeds the estimated fair value of the property.
Investments in Securities. We account for our investments in securities under FASB ASC Topic 320, “Investments—Debt and Equity Securities”, and designate each investment security as a trading security, an available-for-sale security, or a held-to-maturity security based on our intent at the time of acquisition. Trading securities are recorded at their fair value each reporting period with fluctuations in fair value reported as a component of earnings. Available-for-sale securities are recorded at fair value with changes in fair value reported as a component of other comprehensive income (loss). We classify certain available-for-sale securities as trading securities when we elect to record them under the fair value option in accordance with FASB ASC Topic 825, “Financial Instruments.” See “Fair Value of Financial Instruments” below. Upon the sale of an available-for-sale security, the realized gain or loss on the sale will be recorded as a component of earnings in the respective period. Held-to-maturity investments are carried at amortized cost at each reporting period.
We account for investments in securities where the transfer meets the criteria as a financing under FASB ASC Topic 860, “Transfers and Servicing”, at amortized cost. Our investments in security-related receivables represent securities that were transferred to issuers of collateralized debt obligations, or CDOs, in which the transferors maintained some level of continuing involvement.
48
Table of Contents
We use our judgment to determine whether an investment in securities has sustained an other-than-temporary decline in value. If management determines that an investment in securities has sustained an other-than-temporary decline in its value, the investment is written down to its fair value by a charge to earnings, and we establish a new cost basis for the investment. Our evaluation of an other-than-temporary decline is dependent on the specific facts and circumstances. Factors that we consider in determining whether an other-than-temporary decline in value has occurred include: the estimated fair value of the investment in relation to our cost basis; the financial condition of the related entity; and the intent and ability to retain the investment for a sufficient period of time to allow for recovery of the fair value of the investment.
Transfers of Financial Assets. We account for transfers of financial assets under FASB ASC Topic 860, “Transfers and Servicing”, as either sales or financings. Transfers of financial assets that result in sales accounting are those in which (1) the transfer legally isolates the transferred assets from the transferor, (2) the transferee has the right to pledge or exchange the transferred assets and no condition both constrains the transferee’s right to pledge or exchange the assets and provides more than a trivial benefit to the transferor, and (3) the transferor does not maintain effective control over the transferred assets. If the transfer does not meet these criteria, the transfer is accounted for as a financing. Financial assets that are treated as sales are removed from our accounts with any realized gain (loss) reflected in earnings during the period of sale. Financial assets that are treated as financings are maintained on the balance sheet with proceeds received from the legal transfer reflected as securitized borrowings, or security-related receivables.
Derivative Instruments. We may use derivative financial instruments to hedge all or a portion of the interest rate risk associated with our borrowings. Certain of the techniques used to hedge exposure to interest rate fluctuations may also be used to protect against declines in the market value of assets that result from general trends in debt markets. The principal objective of such agreements is to minimize the risks and/or costs associated with our operating and financial structure as well as to hedge specific anticipated transactions.
In accordance with FASB ASC Topic 815, “Derivatives and Hedging”, we measure each derivative instrument (including certain derivative instruments embedded in other contracts) at fair value and record such amounts in our consolidated balance sheet as either an asset or liability. For derivatives designated as fair value hedges, derivatives not designated as hedges, or for derivatives designated as cash flow hedges associated with debt for which we elected the fair value option under FASB ASC Topic 825, “Financial Instruments”, the changes in fair value of the derivative instrument are recorded in earnings. For derivatives designated as cash flow hedges, the changes in the fair value of the effective portions of the derivative are reported in other comprehensive income. Changes in the ineffective portions of cash flow hedges are recognized in earnings.
Fair Value of Financial Instruments. In accordance with FASB ASC Topic 820, “Fair Value Measurements and Disclosures”, fair value is the price that would be received to sell an asset or paid to transfer a liability in an orderly transaction between market participants at the measurement date. Where available, fair value is based on observable market prices or parameters or derived from such prices or parameters. Where observable prices or inputs are not available, valuation models are applied. These valuation techniques involve management estimation and judgment, the degree of which is dependent on the price transparency for the instruments or market and the instruments’ complexity for disclosure purposes. Assets and liabilities recorded at fair value in the consolidated balance sheets are categorized based upon the level of judgment associated with the inputs used to measure their value. Hierarchical levels, as defined in FASB ASC Topic 820, “Fair Value Measurements and Disclosures” are directly related to the amount of subjectivity associated with the inputs to fair valuations of these assets and liabilities, and are as follows:
| • | Level 1: Valuations are based on unadjusted, quoted prices in active markets for identical assets or liabilities at the measurement date. The types of assets carried at level 1 fair value generally are equity securities listed in active markets. As such, valuations of these investments do not entail a significant degree of judgment. |
49
Table of Contents
| • | Level 2: Valuations are based on quoted prices for similar instruments in active markets or quoted prices for identical or similar instruments in markets that are not active or for which all significant inputs are observable, either directly or indirectly. |
Fair value assets and liabilities that are generally included in this category are unsecured REIT note receivables, commercial mortgage-backed securities, or CMBS, receivables and certain financial instruments classified as derivatives where the fair value is based on observable market inputs.
| • | Level 3: Inputs are unobservable inputs for the asset or liability, and include situations where there is little, if any, market activity for the asset or liability. In certain cases, the inputs used to measure fair value may fall into different levels of the fair value hierarchy. In such cases, the level in the fair value hierarchy within which the fair value measurement in its entirety falls has been determined based on the lowest level input that is significant to the fair value measurement in its entirety. Our assessment of the significance of a particular input to the fair value measurement in its entirety requires judgment, and considers factors specific to the asset. Generally, assets and liabilities carried at fair value and included in this category are trust preferred securities, or TruPS, and subordinated debentures, trust preferred obligations and CDO notes payable where observable market inputs do not exist. |
The availability of observable inputs can vary depending on the financial asset or liability and is affected by a wide variety of factors, including, for example, the type of investment, whether the investment is new, whether the investment is traded on an active exchange or in the secondary market, and the current market condition. To the extent that valuation is based on models or inputs that are less observable or unobservable in the market, the determination of fair value requires more judgment. Accordingly, the degree of judgment exercised by us in determining fair value is greatest for instruments categorized in level 3.
Fair value is a market-based measure considered from the perspective of a market participant who holds the asset or owes the liability rather than an entity-specific measure. Therefore, even when market assumptions are not readily available, our own assumptions are set to reflect those that management believes market participants would use in pricing the asset or liability at the measurement date. We use prices and inputs that management believes are current as of the measurement date, including during periods of market dislocation. In periods of market dislocation, the observability of prices and inputs may be reduced for many instruments. This condition could cause an instrument to be transferred from Level 1 to Level 2 or Level 2 to Level 3.
Many financial instruments have bid and ask prices that can be observed in the marketplace. Bid prices reflect the highest price that we and others are willing to pay for an asset. Ask prices represent the lowest price that we and others are willing to accept for an asset. For financial instruments whose inputs are based on bid-ask prices, we do not require that fair value always be a predetermined point in the bid-ask range. Our policy is to allow for mid-market pricing and adjusting to the point within the bid-ask range that results in our best estimate of fair value.
Fair value for certain of our Level 3 financial instruments is derived using internal valuation models. These internal valuation models include discounted cash flow analyses developed by management using current interest rates, estimates of the term of the particular instrument, specific issuer information and other market data for securities without an active market. In accordance with FASB ASC Topic 820, “Fair Value Measurements and Disclosures”, the impact of our own credit spreads is also considered when measuring the fair value of financial assets or liabilities, including derivative contracts. Where appropriate, valuation adjustments are made to account for various factors, including bid-ask spreads, credit quality and market liquidity. These adjustments are applied on a consistent basis and are based on observable inputs where available. Management’s estimate of fair value requires significant management judgment and is subject to a high degree of variability based upon market conditions, the availability of specific issuer information and management’s assumptions.
For further discussion on fair value of our financial instruments, see “Item 8. Financial Statements and Supplementary Data. Note 8: Fair Value of Financial Instruments.”
50
Table of Contents
Recent Accounting Pronouncements. On January 1, 2010, we adopted accounting standards classified under FASB ASC Topic 860, “Transfers and Servicing,” and accounting standards classified under FASB ASC Topic 810, “Consolidation”. The accounting standard classified under FASB Topic 860 eliminates the concept of a qualifying special purpose entity, changes the requirements for derecognizing financial assets, and requires additional disclosures about transfers of financial assets, including securitization transactions and continuing involvement with transferred financial assets. The accounting standard classified under FASB Topic 810 changes the determination of when a variable interest entity, or VIE, should be consolidated. Under this standard, the determination of whether to consolidate a VIE is based on the power to direct the activities of the VIE that most significantly impact the VIE’s economic performance together with either the obligation to absorb losses or the right to receive benefits that could be significant to the VIE, as well as the VIE’s purpose and design. The adoption of these standards did not have a material effect on our consolidated financial statements. See Note 9 for additional disclosures pertaining to VIEs.
On January 1, 2010, we adopted Accounting Standards Update (ASU) No. 2010-06, “Fair Value Measurements and Disclosures (Topic 820): Improving Disclosures about Fair Value Measurements.” This accounting standard requires new disclosures for significant transfers in and out of Level 1 and 2 fair value measurements and requires a description of the reasons for the transfer. This accounting standard also updates existing disclosures by providing fair value measurement disclosures for each class of assets and liabilities and provides disclosures about the valuation techniques and inputs used to measure fair value for both recurring and nonrecurring fair value measurements. For Level 3 fair value measurements, new disclosures will require entities to present information separately for purchases, sales, issuances, and settlements; however, these disclosures are effective for fiscal years beginning after December 15, 2010, and for interim periods within those fiscal years. The adoption of this standard did not have a material effect on our consolidated financial statements and management is currently evaluating the impact the new Level 3 fair value measurement disclosures may have on our consolidated financial statements.
In July 2010, the FASB issued ASU No. 2010-20, “Receivables (Topic 310): Disclosures about the Credit Quality of Financing Receivables and the Allowance for Credit Losses.” This accounting standard update is to provide additional information to assist financial statement users in assessing an entity’s credit risk exposures and evaluating the adequacy of its allowance for credit losses. Existing disclosure guidance is amended to require an entity to provide a greater level of disaggregated information about the credit quality of its financing receivables and its allowance for credit losses and to disclose credit quality indicators, past due information, and modifications of its financing receivables. The disclosures as of the end of a reporting period are effective for interim and annual reporting periods ending on or after December 15, 2010. The disclosures about activity that occurs during a reporting period are effective for interim and annual reporting periods beginning on or after December 15, 2010. The adoption of this standard did not have a material effect on our consolidated financial statements.
Performance Measures
Assets Under Management
We use assets under management, or AUM, as a tool to measure our financial and operating performance. The following defines this measure and describes its relevance to our financial and operating performance:
Assets under management represents the total assets that we own or are managing for third parties. While not all AUM generates fee income, it is an important operating measure to gauge our asset growth, volume of originations, size and scale of our operations and our financial performance. AUM includes our total investment portfolio and assets associated with unconsolidated CDOs for which we derive asset management fees. On April 22, 2010 as a result of the sale of our collateral management rights and responsibilities relating to eight Taberna securitizations to an affiliate of Fortress Investment Group, LLC, RAIT’s assets under management were reduced by $5.9 billion from December 31, 2009.
51
Table of Contents
The table below summarizes our assets under management as of December 31, 2010 and December 31, 2009 (dollars in thousands):
| Assets Under Management at December 31, 2010 |
Assets Under Management at December 31, 2009 |
|||||||
| Commercial real estate portfolio (1) |
$ | 1,976,815 | $ | 2,084,685 | ||||
| European portfolio (2) |
— | 1,878,601 | ||||||
| U.S. TruPS portfolio (3) |
1,860,112 | 6,162,790 | ||||||
| Other investments |
599 | 777 | ||||||
| Total |
$ | 3,837,526 | $ | 10,126,853 | ||||
| (1) | As of December 31, 2010 and December 31, 2009, our commercial real estate portfolio was comprised of $1.1 billion and $1.2 billion, respectively, of assets collateralizing RAIT I and RAIT II, $841.5 million and $738.2 million, respectively, of investments in real estate and $30.4 million and $106.6 million, respectively, of commercial mortgages, mezzanine loans and preferred equity interests that were not securitized. |
| (2) | Our European portfolio as of December 31, 2009 was comprised of assets collateralizing two securitizations we refer to as Taberna Europe I and Taberna Europe II. |
| (3) | Our U.S. TruPS portfolio as of December 31, 2009 was comprised of assets collateralizing Taberna I through Taberna IX, and includes TruPS and subordinated debentures, unsecured REIT note receivables, CMBS receivables, other securities, commercial mortgages and mezzanine loans. |
REIT Taxable Income
To qualify as a REIT, we are required to make annual distributions to our shareholders in an amount at least equal to 90% of our REIT taxable income, determined without regard to the deduction for dividends paid and excluding net capital gains. In addition, to avoid certain U.S. federal excise taxes, we are required to make distributions to our shareholders in an amount at least equal to 90% of our REIT taxable income for each year. Because we expect to make distributions based on the foregoing requirements, and not based on our earnings computed in accordance with GAAP, we expect that our distributions may at times be more or less than our reported earnings as computed in accordance with GAAP.
Our board of trustees monitors RAIT’s REIT taxable income and all available net operating losses not utilized in prior years. In January 2011, our board announced it would continue its approach of considering whether to declare a dividend on the common shares related to our annual REIT distribution requirements once a full year of our REIT taxable income is available. The board reserves the right to change this approach at any time in its sole discretion. The board expects to continue to review and determine the dividends on RAIT’s preferred shares on a quarterly basis. The board intends to declare a dividend, if any, in at least the amount necessary to maintain RAIT’s REIT status. The board will also consider the composition of any common dividends declared, including the option of paying a portion in cash and the balance in additional common shares. Generally, dividends payable in stock are not treated as dividends for purposes of the deduction for dividends, or as taxable dividends to the recipient. However, the Internal Revenue Service, in Revenue Procedure 2010-12, has given guidance with respect to certain stock distributions by publicly traded REITS. That Revenue Procedure applies to distributions made on or after January 1, 2008 and declared with respect to a taxable year ending on or before December 31, 2011. It provides that publicly-traded REITs can distribute stock (common shares in our case) to satisfy their REIT distribution requirements if stated conditions are met. These conditions include that at least 10% of the aggregate declared distributions be paid in cash and the shareholders be permitted to elect whether to receive cash or stock, subject to the limit set by the REIT on the cash to be distributed in the aggregate to all shareholders. The board expects to continue to review and determine the dividends on RAIT’s preferred shares on a quarterly basis. After the deduction for the dividend we paid on the common shares in January 2011 totaling $3.2 million and our use of $8.1 million of RAIT’s net operating loss carryforward from 2009, we have an estimated tax net operating loss carry-forward of approximately $27.4 million that may be used to offset our future REIT taxable income.
52
Table of Contents
Total taxable income and REIT taxable income are non-GAAP financial measurements, and do not purport to be an alternative to reported net income determined in accordance with GAAP as a measure of operating performance or to cash flows from operating activities determined in accordance with GAAP as a measure of liquidity. Our total taxable income represents the aggregate amount of taxable income generated by us and by our domestic and foreign TRSs. REIT taxable income is calculated under U.S. federal tax laws in a manner that, in certain respects, differs from the calculation of net income pursuant to GAAP. REIT taxable income excludes the undistributed taxable income of our domestic TRSs, which is not included in REIT taxable income until distributed to us. Subject to TRS value limitations, there is no requirement that our domestic TRSs distribute their earnings to us. REIT taxable income, however, generally includes the taxable income of our foreign TRSs because we will generally be required to recognize and report our taxable income on a current basis. Since we are structured as a REIT and the Internal Revenue Code requires that we distribute substantially all of our net taxable income in the form of distributions to our shareholders, we believe that presenting the information management uses to calculate REIT net taxable income is useful to investors in understanding the amount of the minimum distributions that we must make to our shareholders so as to comply with the rules set forth in the Internal Revenue Code. Because not all companies use identical calculations, this presentation of total taxable income and REIT taxable income may not be comparable to other similarly titled measures as determined and reported by other companies.
The table below reconciles the differences between reported net income (loss), total taxable income and estimated REIT taxable income for the three years ended December 31, 2010 (dollars in thousands):
| For the Years Ended December 31 | ||||||||||||
| 2010 | 2009 | 2008 | ||||||||||
| Net income (loss), as reported |
$ | 110,913 | $ | (440,981 | ) | $ | (619,185 | ) | ||||
| Add (deduct): |
||||||||||||
| Provision for losses |
38,307 | 226,567 | 145,584 | |||||||||
| Charge-offs on allowance for losses |
(47,787 | ) | (152,014 | ) | — | |||||||
| Domestic TRS book-to-total taxable income differences: |
||||||||||||
| Income tax provision (benefit) |
1,602 | (958 | ) | (2,137 | ) | |||||||
| Fees received and deferred in consolidation |
— | — | 1,080 | |||||||||
| Stock compensation, forfeitures and other temporary tax differences |
93 | 829 | 6,060 | |||||||||
| Capital losses not offsetting capital gains and other temporary tax differences |
(7,938 | ) | — | 32,059 | ||||||||
| Asset impairments, net of noncontrolling interests of $(85,800) for the year ended December 31, 2007 |
— | 46,015 | 67,052 | |||||||||
| Capital losses not offsetting capital gains and other temporary tax differences |
108 | 377,096 | — | |||||||||
| Change in fair value of financial instruments, net of noncontrolling interests (1) |
(45,840 | ) | (23,822 | ) | 346,401 | |||||||
| Amortization of intangible assets |
822 | 1,407 | 17,077 | |||||||||
| CDO investments aggregate book-to-taxable income differences (2) |
(50,768 | ) | (69,314 | ) | 111,338 | |||||||
| Accretion of (premiums) discounts |
— | 1,232 | (3,562 | ) | ||||||||
| Other book to tax differences |
5,347 | (2,520 | ) | 1,118 | ||||||||
| Total taxable income (loss) |
4,859 | (36,463 | ) | 102,885 | ||||||||
| Taxable (income) loss attributable to domestic TRS entities |
6,113 | (4,051 | ) | (21,278 | ) | |||||||
| Dividends paid by domestic TRS entities |
14,000 | 5,013 | 25,750 | |||||||||
| Deductible preferred dividends |
(13,641 | ) | — | (13,641 | ) | |||||||
| Estimated REIT taxable income (loss) (3) |
$ | 11,331 | $ | (35,501 | ) | $ | 93,716 | |||||
53
Table of Contents
| (1) | Change in fair value of financial instruments is reported net of allocation to noncontrolling interests of $(22,259) and $(206,036), for the years ended December 31, 2009 and 2008, respectively. |
| (2) | Amounts reflect the aggregate book-to-taxable income differences and are primarily comprised of (a) unrealized gains on interest rate hedges within CDO entities that Taberna consolidated, (b) amortization of original issue discounts and debt issuance costs and (c) differences in tax year-ends between Taberna and its CDO investments. |
| (3) | Before the deduction for the common dividend paid in January 2011 totaling $3.2 million and the use of $8.1 million of RAIT’s net operating loss carry-forward. As of December 31, 2010, RAIT has an estimated net operating loss carry-forward of approximately $27.4 million that may be used to offset its REIT taxable income in the future. |
For the year ended December 31, 2010, we declared a $0.03 per common share dividend in 2011. For tax reporting purposes, this dividend will be taxable to common shareholders in 2011. The preferred dividends that we paid in 2010 were classified as an ordinary dividend, including a qualified dividend component, for those shareholders who held our preferred shares for the entire year.
For the year ended December 31, 2009, we did not pay any common dividends. For tax reporting purposes, the preferred dividends that we paid in 2010 were classified as 100% return of capital for those shareholders who held our preferred shares for the entire year.
For the year ended December 31, 2008, we paid common dividends totaling $108.2 million, or $1.73 per common share, of which $0.46 was declared in 2007 and $1.27 was declared in 2008. For tax reporting purposes, the dividends that we paid in 2008 were classified as 92.0% ($1.5921) ordinary income and 8.0% ($0.1379) return of capital for those shareholders who held our common shares for the entire year.
Results of Operations
Year Ended December 31, 2010 Compared to Year Ended December 31, 2009
Revenue
Investment interest income. Investment interest income decreased $228.0 million, or 59.7%, to $154.0 million for the year ended December 31, 2010 from $382.0 million for the year ended December 31, 2009. This net decrease was primarily attributable to decreases in interest income of: $80.9 million resulting from the disposition of the Taberna III, Taberna IV, Taberna VI and Taberna VII securitizations in June 2009 and $106.5 million resulting from the disposition of the residential mortgage portfolio in July 2009. The remaining decrease primarily resulted from $141.2 million of commercial real estate loans that were converted to owned real estate since December 31, 2009, $348.9 million in total principal amount of investments on non-accrual status as of December 31, 2010 compared to $304.0 million as of December 31, 2009, and the reduction in short-term LIBOR of approximately 0.3% during the year ended December 31, 2010 compared to the year ended December 31, 2009.
Investment interest expense. Investment interest expense decreased $164.5 million, or 64.3%, to $91.1 million for the year ended December 31, 2010 from $255.6 million for the year ended December 31, 2009. This net decrease was primarily attributable to decreases in interest expense of: $43.6 million resulting from the disposition of the Taberna III, Taberna IV, Taberna VI and Taberna VII securitizations in June 2009 and $98.6 million resulting from the disposition of the residential mortgage portfolio in July 2009. The remaining decrease is primarily attributable to repurchases of our convertible senior notes of $102.8 million and the effect on our floating rate indebtedness from the reduction in short-term LIBOR of approximately 0.3% during the year ended December 31, 2010 compared to the year ended December 31, 2009.
Rental income. Rental income increased $27.8 million to $72.4 million for the year ended December 31, 2010 from $44.6 million for the year ended December 31, 2009. This increase was primarily attributable to: (i) $7.5 million of rental income from 13 new properties, with direct real estate investments of $143.6 million,
54
Table of Contents
acquired or consolidated since December 31, 2009; (ii) $16.0 million in rental income from properties that were acquired in 2009 and present for a full-year in 2010; and (iii) $4.2 million in rental income resulting from an increase in occupancy for properties present for a full year of operations in 2010.
Fee and other income. Fee and other income decreased $8.3 million, or 31.2%, to $18.2 million for the year ended December 31, 2010 from $26.5 million for the year ended December 31, 2009. We received $4.1 million and $3.5 million of fee income from our restructuring advisory and collateral management services, respectively, compared to $9.9 million and $9.1 million, respectively, for the year ended December 31, 2009. This decrease of $11.3 million is primarily attributable to the sale or delegation of our collateral management rights and responsibilities relating to eight Taberna securitizations during April 2010. These decreases were offset by an increase of $1.7 million of property management fees and reimbursement income associated with our property management activities, $1.0 million of income from trading activities at RAIT Securities, LLC, and $0.3 million of other income.
Expenses
Real estate operating expense. Real estate operating expense increased $15.4 million to $56.8 million for the year ended December 31, 2010 from $41.4 million for the year ended December 31, 2009. This increase was primarily attributable: (i) $4.5 million from 13 new properties, with direct real estate investments of $143.6 million, acquired or consolidated since December 31, 2009 and (ii) $10.3 million from properties that were acquired in 2009 and present for a full-year in 2010 and (iii) 0.7 million from properties that were acquired prior to 2009 and present for a full-year in 2010.
Compensation expense. Compensation expense increased $1.1 million, or 4.2%, to $28.7 million for the year ended December 31, 2010 from $27.6 million for the year ended December 31, 2009. This increase was primarily due to an increase in salary and bonus compensation costs of $2.1 million during the year ended December 31, 2010 associated with Jupiter Communities LLC. Jupiter Communities was acquired on May 1, 2009 and was present for a full-year in 2010. This increase was partially offset by lower salary, bonus and other compensation costs associated with our historical business activities.
General and administrative expense. General and administrative expense decreased $3.6 million, or 16.3%, to $18.2 million for the year ended December 31, 2010 from $21.8 million for the year ended December 31, 2009. This decrease is primarily due to a $1.8 million decrease in consulting and professional fees, a $0.7 million decrease in CDO related trustee and rating agency costs associated with the four Taberna CDOs that we deconsolidated in June 2009, and a $1.0 million decrease in rent expense.
Provision for losses. The provision for losses decreased by $188.3 million for the year ended December 31, 2010 to $38.3 million as compared to $226.6 million for the year ended December 31, 2009. This decrease was primarily attributable to $96.5 million of provision for losses related to our residential mortgage portfolio during the twelve-month period ended December 31, 2009. This portfolio of residential mortgages were sold in July 2009. The remaining decrease of $91.8 million is attributable to improved performance of our commercial real estate loan portfolio during 2010 as compared to 2009. At December 31, 2010, we had $122.3 million of commercial real estate loans on non-accrual, down from $171.4 million of commercial real estate non-accrual loans as of December 31, 2009. This reduction in non-accrual loans, combined with reduced 60-day or greater delinquencies in the commercial real estate loan portfolio year over year and improvements in commercial real estate fundamentals in 2010 reduced our provisions for loan losses during 2010. While we believe we have adequately reserved for the probable losses in our portfolio, we continually monitor our portfolio for evidence of loss and accrue additional provisions for loan losses as circumstances or conditions change.
Depreciation expense. Depreciation expense increased $8.1 million to $27.8 million for the year ended December 31, 2010 from $19.7 million for the year ended December 31, 2009. This increase was primarily attributable to 13 new properties, with direct real estate investments of $143.6 million, acquired or consolidated since December 31, 2009 as well as increased depreciation of capital expenditures since December 31, 2009 associated with our owned properties.
55
Table of Contents
Amortization of intangible assets. Intangible amortization represents the amortization of intangible assets acquired from Taberna on December 11, 2006 and Jupiter Communities on May 1, 2009. Amortization expense decreased $0.6 million, or 41.6%, to $0.8 million for the twelve-month period ended December 31, 2010 from $1.4 million for the twelve-month period ended December 31, 2009. This decrease resulted from a reduction of intangible assets by $6.2 million associated with the sale of our collateral management rights in eight Taberna securitizations during April 2010.
Other Income (Expense)
Gains (losses) on sale of assets. Gains on sale of assets were $11.6 million during the twelve-month period ended December 31, 2010. The gains on sale of assets are primarily attributable to the sale or delegation of our collateral management rights and responsibilities relating to eight Taberna securitizations to an affiliate of certain funds managed by an affiliate of Fortress Investment Group LLC for $16.5 million. These securitizations were not consolidated by us and were comprised of Taberna Preferred Funding II, Ltd. through Taberna Preferred Funding VII, Ltd., Taberna Europe CDO I, P.L.C., and Taberna Europe CDO II, P.L.C. This transaction generated a $7.9 million gain on sale of assets. In addition, we disposed of $11.4 million in total principal amount of unsecured REIT note receivables in our CRE securitizations and recorded a gain of $3.8 million. Losses on sales of assets were $376.8 million during the twelve-month period ended December 31, 2009. Losses on sale of assets are primarily attributable to the deconsolidation of the Taberna III, Taberna IV, Taberna VI and Taberna VII securitizations. On June 25, 2009, we sold all of our equity interests and a portion of our non-investment grade debt that we owned in these four securitizations and concluded that we were no longer the primary beneficiary of the securitizations and, therefore, we deconsolidated the securitizations in accordance with FASB ASC Topic 810, “Consolidation”. During the twelve-month period ended December 31, 2009, we sold all of our retained interests in our six residential mortgage securitizations and recorded losses on sales of assets of $61.8 million.
Gains on extinguishment of debt. Gains on extinguishment of debt during the twelve-month period ended December 31, 2010 are attributable to the repurchase of $102.8 million in aggregate principal amount of convertible senior notes and $55.0 million in aggregate principal amount of CDO notes payable. The aggregate debt was repurchased from the market for 18.9 million of our common shares, the issuance of a $22.0 million senior secured convertible note and $27.7 million of cash. As a result of these repurchases, we recorded gains on extinguishment of debt of $71.6 million.
Change in fair value of financial instruments. The change in fair value of financial instruments pertains to the majority of our assets within our investments in securities and any related CDO notes payable and derivative instruments used to finance such assets. During the twelve-month periods ended December 31, 2010 and 2009, the fair value adjustments we recorded were as follows (dollars in thousands):
| For the Year Ended December 31 |
||||||||
| Description |
2010 | 2009 | ||||||
| Change in fair value of trading securities and security-related receivables |
$ | 111,873 | $ | (158,273 | ) | |||
| Change in fair value of CDO notes payable, trust preferred obligations and other liabilities |
(26,882 | ) | 153,459 | |||||
| Change in fair value of derivatives |
(39,151 | ) | 6,377 | |||||
| Change in fair value of financial instruments |
$ | 45,840 | $ | 1,563 | ||||
Unrealized gain (loss) on interest rate hedges. Unrealized gain (loss) on interest rate hedges increased $0.6 million to $0.1 for the year ended December 31, 2010 from a loss of $0.5 million for the year ended December 31, 2009 primarily due to the sale of our residential mortgage portfolio in July 2009. That portfolio contained some hedging ineffectiveness that was expensed within this category and was not present during 2010.
56
Table of Contents
Income tax benefit (provision). We maintain several domestic and foreign TRS entities that are subject to U.S. federal, state and local income taxes and foreign taxes. For the year ended December 31, 2010, the total provision for income taxes was $1.6 million, an increase of $2.6 million from a benefit of $1.0 million for the year ended December 31, 2009. This increase of $2.6 million is attributable to a $2.5 million provision we recorded in connection with the settlement of an IRS audit associated with our Taberna Capital Management LLC subsidiary and certain transfer pricing deductions it made during 2006 through 2008. The settlement was reached in 2011 and was offset by the benefit of net operating losses generated by Taberna Capital during 2008. The settlement will require a net cash payment of approximately $0.3 million.
Discontinued operations. Income from discontinued operations increased $1.1 million to $0.3 million for the year ended December 31, 2010 compared to a loss of $0.8 million for the twelve-month period ended December 31, 2009 primarily due to the timing of properties acquired, sold or deconsolidated during the respective periods. Included in discontinued operations for the year ended December 31, 2010 are: (i) a loss of $2.9 million on a VIE that was deconsolidated in August 2010 offset by; (ii) a gain of $0.3 million on a property that was sold in March 2010; and (iii) a net gain of $1.0 million on two properties that were sold in December 2010.
Year Ended December 31, 2009 Compared to Year Ended December 31, 2008
Revenue
Investment interest income. Investment interest income decreased $309.3 million, or 44.7%, to $382.0 million for the year ended December 31, 2009 from $691.3 million for the year ended December 31, 2008. This net decrease was primarily attributable to decreases in interest income of: $111.7 million resulting from the disposition of the Taberna III, Taberna IV, Taberna VI and Taberna VII securitizations in June 2009 and $109.6 million resulting from the disposition of the residential mortgage portfolio in July 2009. The remaining decrease primarily resulted from $304.0 million in total principal amount of investments on non-accrual status as of December 31, 2009, 27 new properties, representing $515.5 million of investments in commercial loans, transitioned from loans to real estate owned since December 31, 2008 and the reduction in short-term LIBOR of approximately 2.2% during the year ended December 31, 2009 compared to the year ended December 31, 2008.
Investment interest expense. Investment interest expense decreased $229.7 million, or 47.3%, to $255.6 million for the year ended December 31, 2009 from $485.3 million for the year ended December 31, 2008. This net decrease was primarily attributable to decreases in interest expense of: $89.1 million resulting from the disposition of the Taberna III, Taberna IV, Taberna VI and Taberna VII securitizations in June 2009 and $101.5 million resulting from the disposition of the residential mortgage portfolio in July 2009. The remaining decrease is primarily attributable to $5.2 million resulting from repurchases of our convertible senior notes and the effect on our floating rate indebtedness from the reduction in short-term LIBOR of approximately 2.2% during the year ended December 31, 2009 compared to the year ended December 31, 2008.
Rental income. Rental income increased $27.2 million to $44.6 million for the year ended December 31, 2009 from $17.4 million for the year ended December 31, 2008. This increase was primarily attributable to 24 new properties, with direct real estate investments of $384.4 million, acquired or consolidated since December 31, 2008.
Fee and other income. Fee and other income increased $5.1 million, or 24.1%, to $26.5 million for the year ended December 31, 2009 from $21.4 million for the year ended December 31, 2008. We received $8.4 million of fee income from our restructuring advisory services, $6.2 million of property management fees and reimbursement income associated with our property management activities that we acquired in May 2009 offset by $7.5 million of lower origination fees from our domestic and European origination activities during the year ended December 31, 2009 as compared to 2008 and $2.0 million of decreased asset management fees resulting from decreased collateral performance in several of our managed CDOs.
57
Table of Contents
Expenses
Real estate operating expense. Real estate operating expense increased $26.6 million to $41.4 million for the year ended December 31, 2009 from $14.8 million for the year ended December 31, 2008. This increase was primarily attributable to 24 new properties, with direct real estate investments of $384.4 million, acquired or consolidated since December 31, 2008.
Compensation expense. Compensation expense decreased $2.2 million, or 7.5%, to $27.6 million for the year ended December 31, 2009 from $29.8 million for the year ended December 31, 2008. This decrease was primarily due to a reduction in salary and bonus compensation costs of $5.3 million during the year ended December 31, 2009 and lower stock-based compensation amortization of $3.4 million resulting from the vesting of certain restricted shares and phantom units subsequent to December 31, 2008 offset by $6.5 million of compensation costs associated with the property management activities that were acquired in May 2009.
General and administrative expense. General and administrative expense decreased $0.1 million, or 0.7%, to $21.8 million for the year ended December 31, 2009 from $21.9 million for the year ended December 31, 2008. This decrease was primarily due to a $0.5 million decrease in investment monitoring costs due to the termination of a shared services agreement in July 2008 and $1.3 million of lower consulting and professional fees in 2009 as compared to 2008 offset by $1.7 million of higher insurance and rent expenses.
Provision for losses. The provision for losses relates to our investments in our residential mortgages and commercial mortgage loan portfolios. The provision for losses increased by $63.8 million for the year ended December 31, 2009 to $226.6 million as compared to $162.8 million for the year ended December 31, 2008. This increase is due to increased delinquencies in our residential mortgage portfolios during our ownership period and an increase in our impaired loans within our commercial real estate loan portfolio. During the year ended December 31, 2009, we have transitioned 27 loans to real estate owned properties, with direct real estate investments of $416.7 million, including two properties that have been sold and one property held for sale, and realized losses of $98.8 million when these loans were converted from impaired loans to owned real estate. While we believe we have properly reserved for the probable losses in our portfolio, we continually monitor our portfolio for evidence of loss and accrue additional provisions for loan losses as circumstances or conditions change.
Asset impairments. For the year ended December 31, 2009, we recorded asset impairments totaling $46.0 million that were associated with certain investments in loans and available-for-sale securities for which we did not elect the fair value option under FASB ASC Topic 825, “Financial Instruments.” In making this determination, management considered the estimated fair value of the investments in relation to our cost bases, the financial condition of the related entity and our intent and ability to hold the investments for a sufficient period of time to recover our investments. For the identified investments, management believed full recovery was not likely and wrote down the investments to their then current recovery value, or estimated fair value. For the year ended December 31, 2008, we recorded asset impairments totaling $67.1 million that were associated with certain intangible assets and certain investments in loans, available-for-sale securities and other assets for which we did not elect the fair value option.
Depreciation expense. Depreciation expense increased $13.5 million to $19.7 million for the year ended December 31, 2009 from $6.2 million for the year ended December 31, 2008. This increase was primarily attributable to 24 new properties, with direct real estate investments of $384.4 million, acquired or consolidated since December 31, 2008 as well as increased depreciation of capital expenditures we added since December 31, 2008 associated with our owned properties.
Amortization of intangible assets. Intangible amortization represents the amortization of intangible assets acquired from Taberna on December 11, 2006 and Jupiter Communities on May 1, 2009. Amortization expense decreased $15.7 million to $1.4 million for the year ended December 31, 2009 from $17.1 million for the year ended December 31, 2008. This decrease resulted from the full amortization of some of the identified intangibles ($59.5 million had a useful life of 18 months or less).
58
Table of Contents
Other Income (Expense)
Interest and other income. Interest and other income increased $4.3 million to $5.6 million for the year ended December 31, 2009 from $1.3 million for the year ended December 31, 2008. This increase was primarily due to higher interest income attributable to cash deposits and non-operating income associated with the 24 new properties that we acquired or consolidated since December 31, 2008.
Gains (losses) on sale of assets. Gains (losses) on sale of assets were primarily attributable to the disposition of four Taberna securitizations and six residential mortgage securitizations. On June 25, 2009, we sold all of our retained interests and a portion of our non-investment grade debt in the four Taberna securitizations. On July 16, 2009, we sold all of our retained interests in our six residential mortgage securitizations. For the year ended December 31, 2009, we recorded losses on sale of assets of $313.8 million associated with the disposition of the Taberna securitizations and $61.8 million associated with the disposition of the residential mortgage portfolio.
Gains on extinguishment of debt. Gains on extinguishment of debt during the year ended December 31, 2009 were primarily attributable to the repurchase of $103.8 million in aggregate principal amount of convertible senior notes and $55.0 million in aggregate principal amount of CDO notes payable. The debt was repurchased from the market for a total purchase price of $60.7 million, including $2.2 million of accrued interest, and we recorded gains on extinguishment of debt of $97.8 million. On December 1, 2009, we completed an exchange offer for $34.0 million aggregate principal amount of convertible senior notes whereby we issued 8,126,000 of our common shares and paid $3.6 million of cash, including $0.5 million of accrued interest, as consideration. As a result of the exchange offer, we recorded gains on extinguishment of debt of $18.1 million.
Change in fair value of free-standing derivatives. The change in fair value of free-standing derivatives represents the earnings (loss) on (of) our first-dollar risk of loss associated with our warehouse facilities. During the year ended December 31, 2008, our warehouse agreements terminated with the respective financial institutions and we recorded a loss of $32.1 million on our warehouse deposits. We have no further obligations under these warehouse agreements and we have not entered into any new warehouse facilities subsequent to December 31, 2008.
Change in fair value of financial instruments. The change in fair value of financial instruments pertains to the financial assets, liabilities and derivatives as to which we have elected to record fair value adjustments under FASB ASC Topic 825, “Financial Instruments.” Our election to record these assets at fair value was effective on January 1, 2008, the effective date of the fair value option. Our election impacted the majority of our assets within our investments in securities and any related CDO notes payable and derivative instruments used to finance such assets. During the years ended December 31, 2009 and 2008, the fair value adjustments we recorded were as follows (dollars in thousands):
| For the Year Ended December 31 |
||||||||
| Description |
2009 | 2008 | ||||||
| Change in fair value of trading securities and security-related receivables |
$ | (158,273 | ) | $ | (1,737,305 | ) | ||
| Change in fair value of CDO notes payable, trust preferred obligations and other liabilities |
153,459 | 1,579,689 | ||||||
| Change in fair value of derivatives |
6,377 | (394,821 | ) | |||||
| Change in fair value of financial instruments |
$ | 1,563 | $ | (552,437 | ) | |||
Income tax benefit (provision). We maintain several domestic and foreign TRS entities that are subject to U.S. federal, state and local income taxes and foreign taxes. For the year ended December 31, 2009, the total benefit for income taxes was $1.0 million, a decrease of $1.1 million from a benefit of $2.1 million for the year ended December 31, 2008. The tax benefits were primarily attributable to operating losses at several of our domestic TRS entities during the years ended December 31, 2009 and 2008.
59
Table of Contents
Discontinued operations. Income (loss) from discontinued operations increased $1.3 million to a loss of $0.8 million for the year ended December 31, 2009 compared to a loss of $2.1 million for the year ended December 31, 2008 primarily due to the timing of properties acquired, sold or deconsolidated during the respective periods. Additionally, we recorded a $2.1 million loss on a VIE that was deconsolidated in March 2009 offset by a gain of $0.5 million on a property that was sold in July 2009.
Securitization Summary
Overview. We have used securitizations, mainly through CDOs, to match fund the interest rates and maturities of our assets with the interest rates and maturities of the related financing. This strategy has helped us reduce interest rate and funding risks on our portfolios for the long-term. To finance our investments in the foreseeable future, management will seek to structure match funded financing through reinvesting asset repayments in our existing securitizations, loan participations, bank lines of credit, joint-venture opportunities and other methods that preserve our capital while making investments that generate an attractive return.
A CDO is a securitization structure in which multiple classes of debt and equity are issued by a special purpose entity to finance a portfolio of assets. Cash flow from the portfolio of assets is used to repay the CDO liabilities sequentially, in order of seniority. The most senior classes of debt typically have credit ratings of “AAA” through “BBB–” and therefore can be issued at yields that are lower than the average yield of the securities backing the CDO. The debt tranches are typically rated based on portfolio quality, diversification and structural subordination. The equity securities issued by the CDO are the “first loss” piece of the capital structure, but they are entitled to all residual amounts available for payment after the obligations to the debt holders have been satisfied. Unlike typical securitization structures, the underlying assets in our CDO pool may be sold or repaid, subject to certain limitations, without a corresponding pay-down of the CDO debt, provided the proceeds are reinvested in qualifying assets.
We manage five CDO securitizations with varying amounts of retained or residual interests held by us. Four of these CDOs are consolidated in our financial statements as follows: RAIT I, RAIT II, Taberna VIII and Taberna IX. The assets and liabilities of RAIT 1 and RAIT II are presented at amortized cost in our consolidated financial statements. The assets and liabilities of Taberna VIII and Taberna IX are presented at fair value in our consolidated financial statements pursuant to the fair value option. We manage the fifth securitization, Taberna Preferred Funding I, Ltd., or Taberna I, but do not consolidate it in our financial statements because we are not the primary beneficiary of the securitization.
While, in general, our senior management fees from these CDOs are a priority ahead of senior debt service payments, these CDOs do contain interest coverage and overcollateralization triggers, or OC Triggers, that must be met in order for us to receive our subordinated management fees and our lower-rated debt or residual equity returns. If the interest coverage or OC Triggers are not met, in a given period, then the cash flows are redirected from lower rated tranches and used to repay the principal amounts to the senior tranches of CDO notes payable. These conditions and the re-direction of cash flow continue until the triggers are met by curing the underlying payment defaults, paying down the CDO notes payable or other actions permitted under the relevant CDO indenture.
On April 22, 2010, we sold or delegated our collateral management rights and responsibilities relating to eight Taberna securitizations with approximately $5.9 billion in total assets under management to an affiliate of certain funds managed by an affiliate of Fortress Investment Group LLC for $16.5 million. These securitizations were not consolidated by us and were comprised of Taberna Preferred Funding II, Ltd. through Taberna Preferred Funding VII, Ltd., Taberna Europe CDO I, P.L.C., and Taberna Europe CDO II, P.L.C. The transaction generated a $7.9 million in gain on sale of asset.
CDO Performance. As of the most recent payment information, the Taberna I, Taberna VIII and Taberna IX CDO securitizations that we manage were not passing all of their required interest coverage or OC Triggers and we received only senior asset management fees. While events of default do not currently exist in the CDO securitizations that we manage, we are unable to predict with certainty which CDOs, in the future, will
60
Table of Contents
experience events of default or which, if any, remedies the appropriate note holders may seek to exercise in the future. All applicable interest coverage and OC Triggers continue to be met for our two commercial real estate CDOs, RAIT I and RAIT II, and we continue to receive all of our management fees, interest and residual returns from these CDOs. During 2010, we reduced the amount of debt issued by our two commercial real estate securitizations, RAIT I and RAIT II, by cancelling $37.5 million in aggregate principal amount of non-recourse debt issued by those securitizations that we held.
A summary of the CDO investments in our consolidated securitizations as of the most recent payment information is as follows (dollars in millions):
| • | RAIT I—RAIT I has $1.0 billion of total collateral, of which $67.9 million is defaulted. The current O/C test is passing at 123.4% with an O/C trigger of 116.2%. We currently own $242.0 million of the securities issued by this CDO. We are currently receiving all distributions required by the terms of our retained interests in this securitization and are receiving all of our collateral management fees. |
| • | RAIT II—RAIT II has $820.0 million of total collateral, of which $29.3 million is defaulted. The current O/C test is passing at 115.1% with an O/C trigger of 111.7%. We currently own $229.7 million of the securities issued by this CDO. We are currently receiving all distributions required by the terms of our retained interests in this securitization and are receiving all of our collateral management fees. |
| • | Taberna VIII—Taberna VIII has $726.1 million of total collateral, of which $147.0 million is defaulted. The current overcollateralization (O/C) test is failing at 84.8% with an O/C trigger of 103.5%. We currently own $133.0 million of the securities issued by this CDO. We do not expect to receive any distributions from this securitization other than our senior management fees for the foreseeable future. |
| • | Taberna IX—Taberna IX has $695.4 million of total collateral, of which $223.2 million is defaulted. The current O/C test is failing at 72.9% with an O/C trigger of 105.4%. We currently own $186.5 million of the securities issued by this CDO. We do not expect to receive any distributions from this securitization other than our senior management fees for the foreseeable future. |
Generally, our investments in the subordinated notes and equity securities in our consolidated CDOs are subordinate in right of payment and in liquidation to the senior notes issued by the CDOs. We may also own common shares, or the non-economic residual interest, in certain of the entities above.
Liquidity and Capital Resources
Liquidity is a measure of our ability to meet potential cash requirements, including ongoing commitments to repay borrowings, fund and maintain investments, pay distributions and other general business needs. The disruption in the credit markets has reduced our liquidity and capital resources, limited our ability to originate new investments and has generally increased the cost of any new sources of capital over historical levels. Due to current market conditions, the cash flow to us from a number of the securitizations we sponsored has been reduced or eliminated. We are seeking to expand our use of secured lines of credit while developing other financing resources that will permit us to originate or acquire new investments to generate attractive returns while preserving our capital, such as loan participations and joint venture financing arrangements.
RAIT I and RAIT II, our consolidated securitizations collateralized by U.S. commercial real estate loans, continue to perform and make distributions on our retained interests and pay us management fees. In addition, the restricted cash in these securitizations from repayment of underlying loans and other sources can be used to make new investments held by those securitizations, including future funding commitments of existing investments. As we continue to recycle capital obtained from loan sales and loan repayments in these securitizations, we expect to reinvest the proceeds to fund commercial real estate loans. Distributions on our retained interests in RAIT I and RAIT II are our primary source of cash from our operations. We continue to explore strategies to generate liquidity from our investments in real estate and our investments in debt securities as we seek to focus on our commercial real estate lending platform.
61
Table of Contents
We believe our available cash and restricted cash balances, other financing arrangements, and cash flows from operations will be sufficient to fund our liquidity requirements for the next 12 months. Should our liquidity needs exceed our available sources of liquidity, we believe that we could sell assets to raise additional cash. We may not be able to obtain additional financing when we desire to do so, or may not be able to obtain desired financing on terms and conditions acceptable to us. If we fail to obtain additional financing, our ability to maintain or grow our business will be constrained.
Our primary cash requirements are as follows:
| • | to make investments and fund the associated costs; |
| • | to repay our indebtedness, including repurchasing or retiring our debt before it becomes due; |
| • | to pay our expenses, including compensation to our employees; |
| • | to pay U.S. federal, state, and local taxes of our TRSs; and |
| • | to distribute a minimum of 90% of our REIT taxable income and to make investments in a manner that enables us to maintain our qualification as a REIT. |
We intend to meet these liquidity requirements primarily through the following:
| • | the use of our cash and cash equivalent balances of $27.2 million as of December 31, 2010; |
| • | cash generated from operating activities, including net investment income from our investment portfolio, and fee income generated by our commercial real estate platform; |
| • | proceeds from the sales of assets; |
| • | proceeds from future borrowings; and |
| • | proceeds from future offerings of our common and preferred shares, including our COD sales agreement, SEDA and DRSPP Plan. |
Our two commercial real estate securitized financing arrangements, RAIT I and RAIT II, include a revolving credit option that allows us to repay the AAA rated debt tranches totaling $475.0 million as loan repayments occur, and then draw up to the available committed amounts through the fifth anniversary of each financing in November 2011 and June 2012, respectively. At December 31, 2010, these revolvers were fully utilized and had no additional capacity.
Our restricted cash balance was $176.7 million as of December 31, 2010. We have $64.7 million of restricted cash in RAIT I and RAIT II available to invest in qualifying commercial loans as of December 31, 2010, subject to $48.7 million of future funding commitments, leaving $16.0 million available to lend. This $64.7 million of restricted cash is not available to RAIT’s creditors or for other general trust purposes. As of December 31, 2010, $86.0 million of restricted cash was held by Taberna VIII and Taberna IX. This restricted cash reflects early prepayments of principal that cannot be used for any other general trust purposes.
Our convertible senior notes are redeemable for cash, at the option of the holder, in April 2012. We expect to acquire, redeem, restructure, refinance or otherwise enter into transactions to satisfy our convertible senior notes at or prior to the redemption date through transactions which may include any combination of payments of cash, issuances of our debt and/or equity securities, sales or exchanges of our assets or other methods. These transactions may have material effects on our liquidity and capital structure.
We are currently negotiating the terms of a joint venture with a potential co-investor that would originate conduit commercial real estate loans that would qualify for sale to CMBS securitizations sponsored by third parties. If the joint venture is established, it may be a source of additional liquidity for us. The joint venture may seek to increase its return through outside debt financing, including warehouse financing.
62
Table of Contents
Cash Flows
As of December 31, 2010 and 2009, we maintained cash and cash equivalents of $27.2 million and $25.0 million, respectively. Our cash and cash equivalents were generated from the following activities (dollars in thousands):
| For the Years Ended December 31 | ||||||||||||
| 2010 | 2009 | 2008 | ||||||||||
| Cash flows from operating activities |
$ | 15,448 | $ | 65,013 | $ | 141,998 | ||||||
| Cash flows from investing activities |
62,898 | 253,004 | 542,525 | |||||||||
| Cash flows from financing activities |
(76,150 | ) | (320,446 | ) | (785,047 | ) | ||||||
| Net change in cash and cash equivalents |
2,196 | (2,429 | ) | (100,524 | ) | |||||||
| Cash and cash equivalents at beginning of period |
25,034 | 27,463 | 127,987 | |||||||||
| Cash and cash equivalents at end of period |
$ | 27,230 | $ | 25,034 | $ | 27,463 | ||||||
Our principal source of cash flow historically has been from our investing activities. The cash inflow from our investing activities primarily resulted from $107.7 million in principal repayments on loans during the year ended December 31, 2010 as compared to $269.5 million during the year ended December 31, 2009. We received $23.3 million during the year ended December 31, 2010 in proceeds from the sale of other securities and $14.1 million in net proceeds from the sale of collateral management rights.
Our decreased cash inflow from operating activities is primarily due to the disposition of the Taberna III, Taberna IV, Taberna VI, and Taberna VII securitizations in June 2009 and from the disposition of the residential mortgage portfolio in July 2009. During 2009, the cash flow from operating activities from these securitizations were used to repay the principal outstanding on senior tranches of securitization debt.
The cash outflow from financing activities was driven by repurchases of convertible senior notes of $12.2 million, repayments on secured credit facilities and other indebtedness of $18.7 million, and repurchases or repayments of CDO notes payable of $50.7 million for the year ended December 31, 2010. These outflows were offset by proceeds from common share issuances of $21.8 million for the year ended December 31, 2010. The improvement in our cash flow from financing activities during the year ended December 31, 2010 is primarily due to a reduction in the repayments on residential mortgage-backed securities. This portfolio was sold in July 2009 and repayments on residential mortgage-backed securities were $223.3 million during the year ended December 31, 2009.
Capitalization
Debt Financing.
We maintain various forms of long-term financing arrangements. Generally, these financing agreements are collateralized by assets within CDOs or mortgage securitizations.
63
Table of Contents
The following table summarizes our total recourse and non-recourse indebtedness as of December 31, 2010:
| Description |
Unpaid Principal Balance |
Carrying Amount |
Weighted- Average Interest Rate |
Contractual Maturity | ||||||||||||
| Recourse indebtedness: |
||||||||||||||||
| Convertible senior notes (1) |
$ | 143,613 | $ | 143,474 | 6.9 | % | Apr. 2027 | |||||||||
| Secured credit facilities |
36,489 | 36,489 | 4.7 | % | Oct. 2011 to Dec. 2011 | |||||||||||
| Senior secured notes |
63,950 | 63,950 | 11.7 | % | Apr. 2014 | |||||||||||
| Loans payable on real estate |
19,922 | 19,922 | 5.5 | % | Apr. 2012 to Sept. 2013 | |||||||||||
| Junior subordinated notes, at fair value(2) |
38,052 | 4,422 | 5.2 | % | Oct. 2015 to Mar. 2035 | |||||||||||
| Junior subordinated notes, at amortized cost |
25,100 | 25,100 | 7.7 | % | Apr. 2037 | |||||||||||
| Total recourse indebtedness |
327,126 | 293,357 | 7.4 | % | ||||||||||||
| Non-recourse indebtedness: |
||||||||||||||||
| CDO notes payable, at amortized cost (3)(4) |
1,341,750 | 1,341,750 | 0.7 | % | 2045 to 2046 | |||||||||||
| CDO notes payable, at fair value (2)(3)(5) |
1,147,112 | 148,072 | 0.9 | % | 2037 to 2038 | |||||||||||
| Loans payable on real estate |
54,998 | 54,998 | 6.0 | % | Mar. 2011 to Aug. 2016 | |||||||||||
| Total non-recourse indebtedness |
2,543,860 | 1,544,820 | 0.9 | % | ||||||||||||
| Total indebtedness |
$ | 2,870,986 | $ | 1,838,177 | 1.6 | % | ||||||||||
| (1) | Our convertible senior notes are redeemable, at par at the option of the holder, in April 2012, April 2017, and April 2022. |
| (2) | Relates to liabilities which we elected to record at fair value under FASB ASC Topic 825. |
| (3) | Excludes CDO notes payable purchased by us which are eliminated in consolidation. |
| (4) | Collateralized by $1.8 billion principal amount of commercial mortgages, mezzanine loans, other loans and preferred equity interests. These obligations were issued by separate legal entities and consequently the assets of the special purpose entities that collateralize these obligations are not available to our creditors. |
| (5) | Collateralized by $1.3 billion principal amount of investments in securities and security-related receivables and loans, before fair value adjustments. The fair value of these investments as of December 31, 2010 was $870.1 million. These obligations were issued by separate legal entities and consequently the assets of the special purpose entities that collateralize these obligations are not available to our creditors. |
Recourse indebtedness refers to indebtedness that is recourse to our general assets, including the loans payable on real estate that are guaranteed by RAIT or RAIT Partnership. As indicated in the table above, our consolidated financial statements include recourse indebtedness of $293.4 million as of December 31, 2010. Non-recourse indebtedness consists of indebtedness of consolidated VIEs (i.e. CDOs and other securitization vehicles) and the loans payable on real estate which is recourse only to specific assets pledged as collateral to the lenders. The creditors of each consolidated VIE have no recourse to our general credit.
The current status or activity in our financing arrangements occurring as of or during the year ended December 31, 2010 is as follows:
Recourse Indebtedness
Convertible senior notes. On April 18, 2007, we issued and sold in a private offering to qualified institutional buyers, $425.0 million aggregate principal amount of 6.875% convertible senior notes due 2027, or the convertible senior notes. After deducting the initial purchaser’s discount and the estimated offering expenses, we received approximately $414.3 million of net proceeds. Interest on the convertible senior notes is paid semi-annually and the convertible senior notes mature on April 15, 2027.
64
Table of Contents
Prior to April 20, 2012, the convertible senior notes are not redeemable at RAIT’s option, except to preserve RAIT’s status as a REIT. On or after April 20, 2012, RAIT may redeem all or a portion of the convertible senior notes at a redemption price equal to the principal amount plus accrued and unpaid interest (including additional interest), if any. Convertible senior note holders may require RAIT to repurchase all or a portion of the convertible senior notes for cash at a purchase price equal to the principal amount plus accrued and unpaid interest (including additional interest), if any, on the convertible senior notes on April 15, 2012, April 15, 2017, and April 15, 2022, or upon the occurrence of certain change in control transactions prior to April 20, 2012.
Prior to April 15, 2026, upon the occurrence of specified events, the convertible senior notes will be convertible at the option of the holder at an initial conversion rate of 28.6874 shares per $1.0 million principal amount of convertible senior notes. The initial conversion price of $34.86 represents a 27.5% premium to the per share closing price of $27.34 on the date the offering was priced. Upon conversion of convertible senior notes by a holder, the holder will receive cash up to the principal amount of such convertible senior notes and, with respect to the remainder, if any, of the conversion value in excess of such principal amount, at the option of RAIT in cash or RAIT’s common shares. The initial conversion rate is subject to adjustment in certain circumstances. We include the convertible senior notes in earnings per share using the treasury stock method if the conversion value in excess of the par amount is considered in the money during the respective periods.
On January 1, 2009, we adopted accounting standards classified under FASB ASC Topic 470, “Debt”. Upon adoption, we recorded a retrospective discount on our issued and outstanding convertible senior notes of $2.0 million. This discount reflects the fair value of the embedded conversion option within the convertible debt instruments and was recorded as an increase to additional paid in capital. The fair value was calculated by discounting the cash flows required in the indenture relating to the convertible senior notes agreement by a discount rate that represents management’s estimate of our senior, unsecured, non-convertible debt borrowing rate at the time when the convertible senior notes were issued. The discount is being amortized to interest expense through April 15, 2012, the date at which holders of our convertible senior notes could require repayment. Upon adoption, all prior periods were restated to reflect the retroactive adoption of the standard and total discount amortization recorded through December 31, 2008 was $0.6 million.
During the year ended December 31, 2010, we repurchased from the market, a total of $102.8 million in aggregate principal amount of convertible notes for a total consideration of $72.6 million. The purchase price consisted of $12.4 million in cash, the issuance of 18.9 million common shares, and the issuance of a $22.0 million senior secured note. See “Senior Secured Notes” below. As a result of these transactions, we recorded gains on extinguishment of debt of $30.0 million, net of deferred financing costs and unamortized discounts that were written off.
During the year ended December 31, 2009, we repurchased from the market, a total of $103.8 million in aggregate principal amount of convertible notes for a total consideration of $54.5 million, including the issuance of a $43.0 million senior secured note. See “Senior Secured Note” below. During 2009, we also exchanged $34.0 million in aggregate principal amount of convertible notes for 8.1 million common shares and $3.1 million of cash, for total consideration of $14.0 million based on our closing stock price of $1.34 per share on December 29, 2009, the date our exchange offer was completed. See “Exchange Offer” below. As a result of these transactions, we recorded gains on extinguishment of debt of $64.9 million, net of deferred financing costs and unamortized discounts that were written off.
Secured credit facilities. As of December 31, 2010, we have borrowed an aggregate amount of $36.5 million under two secured credit facilities, each with a different bank. All of our secured credit facilities are secured by designated commercial mortgages and mezzanine loans. As of December 31, 2010, the first secured credit facility had an unpaid principal balance of $20.3 million which is payable in December 2011 under the current terms of this facility. As of December 31, 2010, the second secured credit facility had an unpaid principal balance of $16.2 million which is payable in October 2011 under the current terms of this facility. We currently expect to repay or extend these secured credit facilities.
65
Table of Contents
Senior secured notes. On March 25, 2010, pursuant to a securities exchange agreement, we acquired from a noteholder $47.0 million aggregate principal amount of our convertible senior notes for a total consideration of $31.2 million. The purchase price consisted of (a) our issuance of a $22.0 million senior secured convertible note, (b) our issuance of 1.5 million common shares, and (c) our payment of $6.0 million in cash. The senior secured convertible note is convertible into our common shares at the option of the holder. The conversion price is $3.50 per common share and the senior secured convertible note may be converted at any time during its term. We also paid $1.4 million of accrued and unpaid interest on the convertible senior notes through March 25, 2010. The holder of the senior secured convertible note converted $1.1 million principal amount of the senior secured convertible note into 0.3 million common shares effective May 5, 2010.
The senior secured convertible note bears interest at a rate of 10.0% per year. Interest accrues from March 25, 2010 and will be payable quarterly in arrears on January 15, April 15, July 15 and October 15 of each year, beginning July 15, 2010. The senior secured convertible note matures on April 20, 2014 unless previously prepaid in accordance with its terms prior to such date. The senior secured convertible note is fully and unconditionally guaranteed by two wholly-owned subsidiaries of RAIT, or the guarantors: RAIT Asset Holdings III Member, LLC, or RAHM3, and RAIT Asset Holdings III, LLC, or RAH3. RAHM3 is the sole member of RAH3 and has pledged the equity of RAH3 to secure its guarantee. RAH3’s assets consist of certain CDO notes payable issued by RAIT II.
On July 31, 2009, pursuant to a securities purchase agreement, we purchased from a note holder $98.3 million aggregate principal amount of our 6.875% Convertible Senior Notes due 2027, or the convertible senior notes, for a purchase price of $53.0 million. The purchase price consisted of (a) $43.0 million 12.5% senior secured note due 2014 issued by us, or the senior secured note, and (b) $10.0 million in cash. We also paid to the note holder $2.0 million of accrued and unpaid interest on the convertible senior notes through July 31, 2009.
The senior secured note bears interest at a rate of 12.5% per year and is payable quarterly in arrears on January 15, April 15, July 15 and October 15 of each year. The senior secured note matures on April 20, 2014 unless previously prepaid in accordance with its terms prior to such date. The senior secured note is fully and unconditionally guaranteed by two of our wholly owned subsidiaries, or the guarantors: RAIT Asset Holdings II Member, LLC, or RAHM, and RAIT Asset Holdings II, LLC, or RAH2. RAHM is the sole member of RAH2 and has pledged the equity of RAH2 to secure its guarantee. RAH2’s assets consist of $100.0 million in par amount of certain CDO notes payable issued by RAIT’s consolidated securitizations RAIT I, RAIT II, Taberna VIII and Taberna IX. The senior secured note is not convertible into equity securities of RAIT.
Junior subordinated notes, at fair value. On October 16, 2008, we issued $38.1 million principal amount of junior subordinated notes to a third party and received $15.5 million of net cash proceeds. Of the total amount of junior subordinated notes issued, $18.7 million has a fixed interest rate of 8.65% through March 30, 2015 with a floating rate of LIBOR plus 400 basis points thereafter and a maturity date of March 30, 2035. The remaining $19.4 million has a fixed interest rate of 9.64% and a maturity date of October 30, 2015. At issuance, we elected to record these junior subordinated notes at fair value under FASB ASC Topic 825, with all subsequent changes in fair value recorded in earnings.
On October 25, 2010, pursuant to a securities exchange agreement, we exchanged $18.7 million in aggregate principal amount of these junior subordinated notes with an interest rate of 8.7% for $18.7 million of junior subordinated notes with a reduced interest rate and provided $5.0 million of our convertible senior notes as collateral for the new junior subordinated notes. The new junior subordinated notes have a fixed rate of interest of 0.5% through March 30, 2015, thereafter with a floating rate of three-month LIBOR plus 400 basis points, with such floating rate not to exceed 7.0%. The maturity date remains the same at March 30, 2035. At issuance, we elected to record these junior subordinated notes at fair value under FASB ASC Topic 825, with all subsequent changes in fair value recorded in earnings.
As of December 31, 2010, we have $38.1 million unpaid principal associated with these junior subordinated notes. The fair value, or carrying amount, of this indebtedness was $4.4 million as of December 31, 2010.
66
Table of Contents
Junior subordinated notes, at amortized cost. On February 12, 2007, we formed Taberna Funding Capital Trust I which issued $25.0 million of trust preferred securities to investors and $0.1 million of common securities to us. The combined proceeds were used by Taberna Funding Capital Trust I to purchase $25.1 million of junior subordinated notes issued by us. The junior subordinated notes are the sole assets of Taberna Funding Capital Trust I and mature on April 30, 2037, but are callable, at our option, on or after April 30, 2012. Interest on the junior subordinated notes is payable quarterly at a fixed rate of 7.69% through April 2012 and thereafter at a floating rate equal to three-month LIBOR plus 2.50%.
Non-Recourse Indebtedness
CDO notes payable, at amortized cost. CDO notes payable at amortized cost represent notes issued by CDO entities which were used to finance the acquisition of unsecured REIT notes, CMBS securities, commercial mortgages, mezzanine loans, and other loans in our commercial real estate portfolio. Generally, CDO notes payable are comprised of various classes of notes payable, with each class bearing interest at variable or fixed rates. Both of our CRE CDOs are meeting all of their OC and IC trigger tests as of December 31, 2010.
During the year ended December 31, 2010, we repurchased, from the market, a total of $55.0 million in aggregate principal amount of CDO notes payable issued by RAIT I and RAIT II. The aggregate purchase price was $13.1 million and we recorded gains on extinguishment of debt of $42.0 million, net of deferred financing costs that were written off.
During the year ended December 31, 2009, we repurchased, from the market, a total of $55.0 million in aggregate principal amount of CDO notes payable issued by RAIT I and RAIT II. The aggregate purchase price was $4.0 million and we recorded gains on extinguishment of debt of $51.0 million.
CDO notes payable, at fair value. As of January 1, 2008, we adopted the fair value option, which is now classified under FASB ASC Topic 825, and elected to record CDO notes payable at fair value. These CDO notes payable are collateralized by trading securities, security-related receivables and loans. At adoption, we decreased the carrying amount of these CDO notes payable by $1.5 billion to reflect these liabilities at fair value in our financial statements. The fair value of these CDO notes payable increased (decreased) by $39.5 million and ($49.3) million for the years ended December 31, 2010 and 2009, respectively. The increase (decrease) was included in the change in fair value of financial instruments in our consolidated statements of operations as an expense (income), respectively.
Both of our Taberna consolidated CDOs are failing OC Trigger tests which cause a change to the priority of payments to the debt and equity holders of the respective securitizations. Upon the failure of an OC test, the indenture of each CDO requires cash flows that would otherwise have been distributed to us as equity distributions, or in some cases interest payments on our retained CDO notes payable, to be used to pay down sequentially the outstanding principal balance of the most senior note holders. The OC tests failures are due to defaulted collateral assets and credit risk securities. During the year ended December 31, 2010, $37.9 million of cash flows were re-directed from our retained interests in these CDOs and were used to repay the most senior holders of our CDO notes payable.
Loans payable on real estate. As of December 31, 2010 and 2009, we had $74.9 million and $81.9 million, respectively, of other indebtedness outstanding relating to loans payable on consolidated real estate and other loans. These loans are secured by specific consolidated real estate and commercial loans included in our consolidated balance sheet.
Trust preferred obligations. Trust preferred obligations finance subordinated debentures acquired by Trust VIEs that are consolidated by us for the portion of the total TruPS that are owned by entities outside of the consolidated group. These trust preferred obligations bear interest at either variable or fixed rates until maturity, generally 30 years from the date of issuance. The Trust VIE has the ability to prepay the trust preferred obligation at any time, without prepayment penalty, after five years. We do not control the timing or ultimate payment of the trust preferred obligations.
67
Table of Contents
As of January 1, 2008, we adopted the fair value option, which is now classified under FASB ASC Topic 825, and elected to record trust preferred obligations at fair value. At adoption, we decreased the carrying amount of the trust preferred obligations by $52.1 million to reflect these liabilities at fair value in our financial statements. The change in fair value of the trust preferred obligations was a decrease of $104.2 million for the year ended December 31, 2009 and was included in our consolidated statements of operations.
As of January 1, 2010, we adopted an accounting standard which changed the determination of the consolidation of VIEs. Accordingly, we deconsolidated these entities as of January 1, 2010 as we were not determined to be the primary beneficiary of the VIEs thereby reducing our assets and liabilities by $70.9 million.
Exchange Offers
On December 29, 2009, we completed an exchange offer to exchange convertible senior notes for common shares and cash. Holders of our convertible senior notes tendered $34.0 million aggregate principal amount of our convertible senior notes. Pursuant to the terms of the Exchange Offer, we issued 8.1 million common shares and paid $3.1 million of cash as consideration for the exchanges notes. For each $1.0 million principal amount of our convertible senior notes exchanged, the holder received the following: (i) 0.2 million common shares, (ii) a cash payment of $91.50 and (iii) accrued and unpaid interest on the convertible senior notes to, but excluding, the settlement date, paid in cash. As a result of the exchange offer, we recorded gains on extinguishment of debt of approximately $18.1 million.
Equity Financing.
Preferred Shares
In 2004, we issued 2.8 million shares of our 7.75% Series A Cumulative Redeemable Preferred Shares of Beneficial Interest, or Series A Preferred Shares, for net proceeds of $66.6 million. The Series A Preferred Shares accrue cumulative cash dividends at a rate of 7.75% per year of the $25.00 liquidation preference, equivalent to $1.9375 per year per share. Dividends are payable quarterly in arrears at the end of each March, June, September and December. The Series A Preferred Shares have no maturity date and we are not required to redeem the Series A Preferred Shares at any time. On or after March 19, 2009, we may, at our option, redeem the Series A Preferred Shares, in whole or part, at any time and from time to time, for cash at $25.00 per share, plus accrued and unpaid dividends, if any, to the redemption date.
In 2004, we issued 2.3 million shares of our 8.375% Series B Cumulative Redeemable Preferred Shares of Beneficial Interest, or Series B Preferred Shares, for net proceeds of $54.4 million. The Series B Preferred Shares accrue cumulative cash dividends at a rate of 8.375% per year of the $25.00 liquidation preference, equivalent to $2.09375 per year per share. Dividends are payable quarterly in arrears at the end of each March, June, September and December. The Series B Preferred Shares have no maturity date and we are not required to redeem the Series B Preferred Shares at any time. On or after October 5, 2009, we may, at our option, redeem the Series B Preferred Shares, in whole or part, at any time and from time to time, for cash at $25.00 per share, plus accrued and unpaid dividends, if any, to the redemption date.
On July 5, 2007, we issued 1.6 million shares of our 8.875% Series C Cumulative Redeemable Preferred Shares of Beneficial Interest, or the Series C Preferred Shares, in a public offering at an offering price of $25.00 per share. After offering costs, including the underwriters’ discount, and expenses of $1.7 million, we received $38.3 million of net proceeds. The Series C Preferred Shares accrue cumulative cash dividends at a rate of 8.875% per year of the $25.00 liquidation preference and are paid on a quarterly basis. The Series C Preferred Shares have no maturity date and we are not required to redeem the Series C Preferred Shares at any time. We may not redeem the Series C Preferred Shares before July 5, 2012, except for the special optional redemption to preserve our tax qualification as a REIT. On or after July 5, 2012, we may, at our option, redeem the Series C Preferred Shares, in whole or part, at any time and from time to time, for cash at $25.00 per share, plus accrued and unpaid dividends, if any, to the redemption date.
68
Table of Contents
On January 26, 2010, April 22, 2010, July 27, 2010 and October 28, 2010 our board of trustees declared quarterly cash dividends of $0.484375 per share on our 7.75% Series A Preferred Shares, $0.5234375 per share on our 8.375% Series B Preferred Shares and $0.5546875 per share on our 8.875% Series C Preferred Shares. The dividends were paid on March 31, 2010, June 30, 2010, September 30, 2010 and December 31, 2010. The quarterly dividends totaled $13.6 million.
On January 25, 2011, our board of trustees declared a first quarter 2011 cash dividend of $0.484375 per share on our 7.75% Series A Preferred Shares, $0.5234375 per share on our 8.375% Series B Preferred Shares and $0.5546875 per share on our 8.875% Series C Preferred Shares. The dividends will be paid on March 31, 2011 to holders of record on March 1, 2011.
Common Shares
- Share Repurchases
On July 24, 2007, our board of trustees adopted a share repurchase plan that authorizes us to purchase up to $75.0 million of RAIT common shares. Under the plan, we may make purchases, from time to time, through open market or privately negotiated transactions. We have not repurchased any common shares under this plan as of December 31, 2010.
On January 26, 2010, the compensation committee of the board, or the compensation committee, approved a cash payment to the board’s eight non-management trustees intended to constitute a portion of their respective 2010 annual non-management trustee compensation. The cash payment was subject to terms and conditions set forth in a letter agreement, or the letter agreement, between each of the non-management trustees and RAIT. The terms and conditions included a requirement that each trustee use a portion of the cash payment to purchase RAIT’s common shares in purchases that, individually and in the aggregate with all purchases made by all the other non-management trustees pursuant to their respective letter agreements, complied with Rule 10b-18 promulgated under the Securities Exchange Act of 1934, as amended. The aggregate amount required to be used by all of the non-management trustees to purchase common shares was $0.2 million and was used to purchase 0.2 million common shares, in the aggregate, in March 2010.
On January 25, 2011, the compensation committee approved a cash payment to the board’s eight non-management trustees intended to constitute a portion of their respective 2011 annual non-management trustee compensation. The cash payment was subject to terms and conditions set forth in a letter agreement, or the letter agreement, between each of the non-management trustees and RAIT. The terms and conditions included a requirement that each trustee use a portion of the cash payment to purchase RAIT’s common shares in purchases that, individually and in the aggregate with all purchases made by all the other non-management trustees pursuant to their respective letter agreements, complied with Rule 10b-18 promulgated under the Securities Exchange Act of 1934, as amended. The aggregate amount required to be used by all of the non-management trustees to purchase common shares was $0.2 million and was used to purchase 56,693 common shares, in the aggregate, in February 2011.
-Dividends
On January 10, 2011, the board of trustees declared a $0.03 dividend on our common shares to holders of record as of January 21, 2011. The dividend was paid on January 31, 2011 and totaled $3.2 million.
-Equity Compensation
On January 24, 2009, 19,020 phantom unit awards were redeemed for common shares. These phantom units were fully vested at the time of redemption.
On March 5, 2009, the compensation committee awarded 484,000 phantom units, valued at $0.3 million using our closing stock price of $0.50 per share, to various non-executive employees. The awards generally vest over three-year periods.
69
Table of Contents
On June 25, 2009, the compensation committee awarded 200,000 phantom units, valued at $0.2 million using our closing stock price of $1.19, to two non-executive employees. The awards generally vest over four-year periods.
On January 26, 2010, the compensation committee awarded 1,500,000 phantom units, valued at $1.9 million using our closing stock price of $1.27, to our executive officers. Half of these awards vested immediately and the remainder vests in one year. On January 26, 2010, the compensation committee awarded 500,000 phantom units, valued at $0.6 million using our closing stock price of $1.27, to our non-executive officer employees. These awards generally vest over three-year periods.
-Exchange Offer
On December 29, 2009, we completed an exchange offer to exchange $34.0 million of our convertible notes for common shares and cash. Pursuant to the terms of the Exchange Offer, we issued 8.1 million common shares and paid $3.1 million of cash as consideration for the exchanges notes. See “Exchange Offer” above.
-DRSPP
We implemented an amended and restated dividend reinvestment and share purchase plan, or DRSPP, effective as of March 13, 2008, pursuant to which we registered and reserved for issuance, in the aggregate, 18.8 million common shares. During the year ended December 31, 2010, we issued a total of 1.9 million common shares pursuant to the DRSPP at a weighted-average price of $2.28 per share and we received $4.4 million of net proceeds. As of December 31, 2010, 11.7 million common shares, in aggregate, remain available for issuance under the DRSPP.
-SEDA
On January 13, 2010, we entered into a standby equity distribution agreement, or the SEDA, with YA Global Master SPV Ltd., or YA Global, which is managed by Yorkville Advisors, LLC, whereby YA Global agreed to purchase up to $50.0 million, or the commitment amount, worth of newly issued RAIT common shares upon notices given by us, subject to the terms and conditions of the SEDA. The number of common shares issued or issuable pursuant to the SEDA, in the aggregate, cannot exceed 12.5 million common shares. The SEDA terminates automatically on the earlier of January 13, 2012 or the date YA Global has purchased $50.0 million worth of common shares under the SEDA. During the period from the effective date of the SEDA through December 31, 2010, 1.2 million common shares were issued pursuant to this arrangement at a weighted average price of $2.17 and we received $2.5 million of proceeds. As of December 31, 2010, 11.3 million common shares, in the aggregate, remain available for issuance under the SEDA.
-COD
On August 6, 2010, we entered into a Capital on Demand™ Sales Agreement, or the COD sales agreement, with JonesTrading Institutional Services LLC, or JonesTrading, pursuant to which we may issue and sell up to 17.5 million of our common shares from time to time through JonesTrading acting as agent and/or principal, subject to the terms and conditions of the COD sales agreement. During the period from the effective date of the COD sales agreement through December 31, 2010, 9.1 million common shares were issued pursuant to this arrangement at a weighted average price of $1.83 and we received $16.4 million of proceeds. From January 1, 2011 through February 22, 2011, 3.0 million common shares were issued pursuant to the COD sales agreement at a weighted average price of $3.07 and we received $9.0 million of proceeds. After reflecting the common shares issued through February 22, 2011, 5.5 million common shares, in the aggregate, remain available for issuance under the COD sales agreement.
70
Table of Contents
Acquisition of Non-Traded Public REIT
On January 20, 2011, we acquired a development stage, non-traded public REIT and subsequently changed its name to Independence Realty Trust, Inc., or Independence. We paid approximately $2.3 million for Independence and certain of its affiliated entities including the entity that serves as Independence’s external advisor. RAIT will be the sponsor of Independence’s offering and expects Independence to raise capital for investing in commercial real estate assets. We expect to incur expenses on Independence’s behalf in connection with this offering and our ability to be reimbursed for these expenses will be dependent on the terms and success of the offering. This disclosure is neither an offer nor a solicitation to purchase Independence’s securities.
Off-Balance Sheet Arrangements and Commitments
As of December 31, 2010 we did not have any off-balance sheet arrangements or commitments.
Contractual Commitments
The table below summarizes our contractual obligations as of December 31, 2010:
| Payment due by Period | ||||||||||||||||||||
| Total | Less Than 1 Year |
1-3 Years |
3-5 Years |
More Than 5 Years |
||||||||||||||||
| (dollars in thousands) | ||||||||||||||||||||
| Recourse indebtedness: |
||||||||||||||||||||
| Secured credit facilities |
$ | 36,489 | $ | 36,489 | $ | — | $ | — | $ | — | ||||||||||
| Loans payable on real estate |
19,922 | 5,000 | 14,922 | — | — | |||||||||||||||
| Senior secured notes |
63,950 | — | — | 63,950 | — | |||||||||||||||
| Convertible senior notes (1) |
143,613 | — | — | — | 143,613 | |||||||||||||||
| Junior subordinated notes |
63,152 | — | — | 19,381 | 43,771 | |||||||||||||||
| Total recourse indebtedness |
327,126 | 41,489 | 14,922 | 83,331 | 187,384 | |||||||||||||||
| Non-recourse indebtedness: |
||||||||||||||||||||
| Loans payable on real estate |
54,998 | 44 | — | 19,500 | 35,454 | |||||||||||||||
| CDO notes payable |
2,488,862 | — | — | — | 2,488,862 | |||||||||||||||
| Total non-recourse indebtedness |
2,543,860 | 44 | — | 19,500 | 2,524,316 | |||||||||||||||
| Total indebtedness |
2,870,986 | 41,533 | 14,922 | 102,831 | 2,711,700 | |||||||||||||||
| Interest payable (2)(3) |
1,229,494 | 130,755 | 214,246 | 170,549 | 713,944 | |||||||||||||||
| Operating lease obligations |
32,997 | 2,257 | 4,618 | 4,080 | 22,042 | |||||||||||||||
| Funding commitments to borrowers (4) |
63,637 | 28,228 | 22,227 | 219 | 12,963 | |||||||||||||||
| Total |
$ | 4,197,114 | $ | 202,773 | $ | 256,013 | $ | 277,679 | $ | 3,460,649 | ||||||||||
| (1) | Our convertible senior notes are redeemable, at par at the option of the holder, in April 2012, April 2017, and April 2022. |
| (2) | All variable-rate indebtedness assumes a 30-day LIBOR rate of 0.26% (the 30-day LIBOR rate at December 31, 2010). |
| (3) | Interest payable is comprised of interest expense related to our indebtedness and the interest cost of the hedges associated with indebtedness. Interest payments related to recourse indebtedness are due by period as follows: $23.8 million less than one year, $43.3 million one to three years, $29.5 million three to five years and $154.6 million more than five years. Interest payments related to non-recourse indebtedness are due by period as follows: $106.9 million less than one year, $170.9 million one to three years, $141.0 million three to five years and $559.4 million more than five years. |
| (4) | Amounts represent the commitments we have made to fund borrowers in our existing lending arrangements as of December 31, 2010. |
71
Table of Contents
| Item 7A. | Quantitative and Qualitative Disclosures About Market Risk |
Our exposure to market risk results primarily from changes in the credit risks of our portfolio and changes in interest rates. We are exposed to credit risk and interest rate risk related to our investments in commercial and mezzanine loans, debt instruments and TruPS.
Credit Risk Management
Credit risk is the risk of loss arising from adverse changes in a borrower’s ability to meet its financial obligations under agreed-upon terms. The degree of credit risk varies based on many factors including the concentration of the asset or transaction relative to our entire portfolio, the credit characteristics of the borrower, the contractual terms of a borrower’s agreements and the availability and quality of collateral.
Our senior management regularly evaluates and approves credit standards and oversees the credit risk management function related to our portfolio of investments. Our senior management’s responsibilities include ensuring the adequacy of our credit risk management infrastructure, overseeing credit risk management strategies and methodologies, monitoring conditions in real estate and other markets having an impact on our lending activities and evaluating and monitoring overall credit risk.
Credit Summary and Concentrations of Credit Risk
Our investment portfolios had the following key credit statistics as of December 31, 2010:
| • | Commercial real estate and other loans—We had 29 loans on non-accrual, with a carrying value of $143.2 million, or 11.7% of our commercial real estate loan portfolio. Our allowance for losses for our commercial loan portfolio was $69.7 million, or 48.7% of our non-accrual loans and pertained to 27 loans with an unpaid principal balance of $157.7 million. |
| • | Investments in debt securities—We record our investments in debt securities at fair value in our consolidated financial statements. As of December 31, 2010, we had 26 debt securities on non-accrual, with a carrying amount of $7.5 million and an unpaid principal balance of $205.6 million, or 1.1% of our investments in debt securities, based on carrying value. The unpaid principal balance of our investments in debt securities is $1.1 billion, of which our non-accrual debt securities represents approximately 17.9%, based on unpaid principal. |
In our normal course of business, we engage in lending activities with borrowers primarily throughout the United States. As of December 31, 2010, no single borrower or collateral issuer represented greater than 10% of our entire portfolio. The largest concentration by property type in our commercial and mezzanine portfolio was multi-family property, which made up approximately 35.0% of our commercial and mezzanine loan portfolio. The largest concentration by borrower type in our TruPS and subordinated debt portfolio was to issuers in the office market, which made up approximately 26.0% of our TruPS and subordinated debt portfolio. For further information on each of our portfolios, please refer to the portfolio summaries in Item 1—“Business”.
Interest Rate Risk Management
Interest rates may be affected by economic, geo-political, monetary and fiscal policy, market supply and demand and other factors generally outside our control, and such factors may be highly volatile. Our interest rate risk sensitive assets and liabilities and financial derivatives will be typically held for long-term investment and not held for sale purposes. Historically, we have used securitizations, primarily CDOs, to finance our investments to limit interest rate risk by matching the terms of our investment assets with the terms of our liabilities and, to the extent necessary, through the use of hedging instruments. We intend to reduce interest rate and funding risk, allowing us to focus on managing credit risk through our underwriting process and continual credit analysis.
72
Table of Contents
We make investments that are either floating rate or fixed rate. Our floating rate investments will generally be priced at a fixed spread over an index such as LIBOR that re-prices either quarterly or every 30 days. Given the frequency of future price changes in our floating rate investments, changes in interest rates are not expected to have a material effect on the value of these investments. Increases or decreases in LIBOR will have a corresponding increase or decrease in our interest income and the match-funded interest expense, thereby reducing the net earnings impact on our overall portfolio. Our net investment income is also protected from decreases in interest rates due to interest rate floors on our investments in commercial and mezzanine loans. In the event that long-term interest rates increase, the value of our fixed-rate investments would be diminished. We may consider hedging this risk in the future if the benefit outweighs the cost of the hedging strategy. Such changes in interest rates would not have a material effect on the income from these investments.
As of December 31, 2010, we use various interest rate swap agreements to hedge variable cash flows associated with CDO notes payable. These cash flow hedges have an aggregate notional value of $1.8 billion and are used to swap the variable cash flows associated with variable rate CDO notes payable into fixed-rate payments for five- and ten-year periods. As of December 31, 2010, the interest rate swaps had an aggregate liability fair value of $183.4 million. Changes in the fair value of the ineffective portions of interest rate swaps and interest rate swaps that were not designated as hedges under FASB ASC Topic 815, “Derivatives and Hedging” are recorded in earnings.
The following table summarizes the net investment income for a 12-month period, and the change in the net fair value of our investments and indebtedness assuming an instantaneous increase or decrease of 100 basis points in the LIBOR interest rate curve, both adjusted for the effects of our interest rate hedging activities (dollars in thousands):
| Assets (Liabilities) Subject to Interest Rate Sensitivity (Par Amount) |
100 Basis Point Increase |
100 Basis Point Decrease (a) |
||||||||||
| Investment income from variable-rate investments |
$ | 951,965 | $ | 9,520 | $ | (2,481 | ) | |||||
| Investment expense from variable-rate indebtedness |
(412,153 | ) | (4,122 | ) | 1,074 | |||||||
| Net investment income from variable-rate instruments |
$ | 539,812 | $ | 5,398 | $ | (1,407 | ) | |||||
| Fair value of fixed-rate investments |
$ | 1,438,641 | $ | (45,611 | ) | $ | 46,035 | |||||
| Fair value of fixed-rate indebtedness |
(2,392,237 | ) | 71,897 | (72,428 | ) | |||||||
| Net fair value of fixed-rate instruments |
$ | (953,596 | ) | $ | 26,286 | $ | (26,393 | ) | ||||
| (a) | Assumes the LIBOR interest rate will not decrease below the quoted LIBOR of 0.26% at December 31, 2010. |
We make investments that are denominated in U.S. dollars, or if made in another currency we may enter into currency swaps to convert the investment into a U.S. dollar equivalent. We may be unable to match the payment characteristics of the investment with the terms of the currency swap to fully eliminate all currency risk and such currency swaps may not be available on acceptable terms and conditions based upon a cost/benefit analysis.
73
Table of Contents
| Item 8. | Financial Statements and Supplementary Data. |
RAIT FINANCIAL TRUST
INDEX TO CONSOLIDATED FINANCIAL STATEMENTS
74
Table of Contents
Report of Independent Registered Public Accounting Firm
Board of Trustees
RAIT Financial Trust
We have audited the accompanying consolidated balance sheets of RAIT Financial Trust (a Maryland real estate investment trust) and subsidiaries (collectively RAIT Financial Trust or the Company) as of December 31, 2010 and 2009, and the related consolidated statements of operations, comprehensive income (loss), equity and cash flows for each of the three years in the period ended December 31, 2010. Our audits of the basic financial statements included the financial statement schedules listed in the index appearing under item 8. These financial statements and financial statement schedules are the responsibility of the Company’s management. Our responsibility is to express an opinion on these consolidated financial statements and financial statement schedules based on our audits.
We conducted our audits in accordance with the standards of the Public Company Accounting Oversight Board (United States). Those standards require that we plan and perform the audit to obtain reasonable assurance about whether the financial statements are free of material misstatement. An audit includes examining, on a test basis, evidence supporting the amounts and disclosures in the financial statements. An audit also includes assessing the accounting principles used and significant estimates made by management, as well as evaluating the overall financial statement presentation. We believe that our audits provide a reasonable basis for our opinion.
In our opinion, the consolidated financial statements referred to above present fairly, in all material respects, the financial position of RAIT Financial Trust as of December 31, 2010 and 2009, and the results of their operations and their cash flows for each of the three years in the period ended December 31, 2010 in conformity with accounting principles generally accepted in the United States of America. Also, in our opinion, the related financial statement schedules, when considered in relation to the basic consolidated financial statements taken as a whole, present fairly, in all material respects, the information set forth therein.
We also have audited, in accordance with the standards of the Public Company Accounting Oversight Board (United States), RAIT Financial Trust’s internal control over financial reporting as of December 31, 2010, based on criteria established in Internal Control—Integrated Framework issued by the Committee of Sponsoring Organizations of the Treadway Commission (COSO) and our report dated February 25, 2011 expressed an unqualified opinion.
/s/ GRANT THORNTON LLP
Philadelphia, Pennsylvania
February 25, 2011
75
Table of Contents
Report of Independent Registered Public Accounting Firm
Board of Trustees
RAIT Financial Trust
We have audited RAIT Financial Trust (a Maryland real estate investment trust) and subsidiaries’ (collectively RAIT Financial Trust or the Company) internal control over financial reporting as of December 31, 2010, based on criteria established in Internal Control-Integrated Framework issued by the Committee of Sponsoring Organizations of the Treadway Commission (COSO). RAIT Financial Trust’s management is responsible for maintaining effective internal control over financial reporting and for its assessment of the effectiveness of internal control over financial reporting, included in the accompanying Management’s Annual Report on Internal Control Over Financial Reporting. Our responsibility is to express an opinion on the Company’s internal control over financial reporting based on our audit.
We conducted our audit in accordance with the standards of the Public Company Accounting Oversight Board (United States). Those standards require that we plan and perform the audit to obtain reasonable assurance about whether effective internal control over financial reporting was maintained in all material respects. Our audit included obtaining an understanding of internal control over financial reporting, assessing the risk that a material weakness exists, testing and evaluating the design and operating effectiveness of internal control based on the assessed risk, and performing such other procedures as we considered necessary in the circumstances. We believe that our audit provides a reasonable basis for our opinion.
A company’s internal control over financial reporting is a process designed to provide reasonable assurance regarding the reliability of financial reporting and the preparation of financial statements for external purposes in accordance with generally accepted accounting principles. A company’s internal control over financial reporting includes those policies and procedures that (1) pertain to the maintenance of records that, in reasonable detail, accurately and fairly reflect the transactions and dispositions of the assets of the Company; (2) provide reasonable assurance that transactions are recorded as necessary to permit preparation of financial statements in accordance with generally accepted accounting principles, and that receipts and expenditures of the Company are being made only in accordance with authorizations of management and directors of the Company; and (3) provide reasonable assurance regarding prevention or timely detection of unauthorized acquisition, use, or disposition of the Company’s assets that could have a material effect on the financial statements.
Because of its inherent limitations, internal control over financial reporting may not prevent or detect misstatements. Also, projections of any evaluation of effectiveness to future periods are subject to the risk that controls may become inadequate because of changes in conditions, or that the degree of compliance with the policies or procedures may deteriorate.
In our opinion, RAIT Financial Trust maintained, in all material respects, effective internal control over financial reporting as of December 31, 2010, based on criteria established in Internal Control-Integrated Framework issued by COSO.
We also have audited, in accordance with the standards of the Public Company Accounting Oversight Board (United States), the consolidated balance sheets of RAIT Financial Trust and its subsidiaries as of December 31, 2010 and 2009, and the related consolidated statements of operations, comprehensive income (loss), equity, and cash flows for each of the three years in the period ended December 31, 2010 and our report dated February 25, 2011 expressed an unqualified opinion.
/s/ GRANT THORNTON LLP
Philadelphia, Pennsylvania
February 25, 2011
76
Table of Contents
Consolidated Balance Sheets
(Dollars in thousands, except share and per share information)
| As of December 31 | ||||||||
| 2010 | 2009 | |||||||
| Assets |
||||||||
| Investments in mortgages and loans, at amortized cost: |
||||||||
| Commercial mortgages, mezzanine loans, other loans and preferred equity interests |
$ | 1,219,110 | $ | 1,467,566 | ||||
| Allowance for losses |
(69,691 | ) | (86,609 | ) | ||||
| Total investments in mortgages and loans |
1,149,419 | 1,380,957 | ||||||
| Investments in real estate |
841,488 | 738,235 | ||||||
| Investments in securities and security-related receivables, at fair value |
705,451 | 694,897 | ||||||
| Cash and cash equivalents |
27,230 | 25,034 | ||||||
| Restricted cash |
176,723 | 156,167 | ||||||
| Accrued interest receivable |
37,138 | 37,625 | ||||||
| Other assets |
32,840 | 28,105 | ||||||
| Deferred financing costs, net of accumulated amortization of $9,943 and $7,290, respectively |
19,954 | 23,778 | ||||||
| Intangible assets, net of accumulated amortization of $1,777 and $82,929, respectively |
3,189 | 10,178 | ||||||
| Total assets |
$ | 2,993,432 | $ | 3,094,976 | ||||
| Liabilities and Equity |
||||||||
| Indebtedness ($152,494 and $234,433 at fair value, respectively) |
$ | 1,838,177 | $ | 2,077,123 | ||||
| Accrued interest payable |
19,925 | 17,432 | ||||||
| Accounts payable and accrued expenses |
25,089 | 21,889 | ||||||
| Derivative liabilities |
184,878 | 186,986 | ||||||
| Deferred taxes, borrowers’ escrows and other liabilities |
6,833 | 21,625 | ||||||
| Total liabilities |
2,074,902 | 2,325,055 | ||||||
| Equity: |
||||||||
| Shareholders’ equity: |
||||||||
| Preferred shares, $0.01 par value per share, 25,000,000 shares authorized; |
||||||||
| 7.75% Series A cumulative redeemable preferred shares, liquidation preference $25.00 per share, 2,760,000 shares issued and outstanding |
28 | 28 | ||||||
| 8.375% Series B cumulative redeemable preferred shares, liquidation preference $25.00 per share, 2,258,300 shares issued and outstanding |
23 | 23 | ||||||
| 8.875% Series C cumulative redeemable preferred shares, liquidation preference $25.00 per share, 1,600,000 shares issued and outstanding |
16 | 16 | ||||||
| Common shares, $0.01 par value per share, 200,000,000 shares authorized, 105,900,570 and 74,420,598 issued and outstanding, including 14,159 unvested restricted share awards at December 31, 2009 |
1,060 | 744 | ||||||
| Additional paid in capital |
1,691,681 | 1,630,428 | ||||||
| Accumulated other comprehensive income (loss) |
(127,602 | ) | (118,973 | ) | ||||
| Retained earnings (deficit) |
(647,110 | ) | (745,262 | ) | ||||
| Total shareholders’ equity |
918,096 | 767,004 | ||||||
| Noncontrolling interests |
434 | 2,917 | ||||||
| Total equity |
918,530 | 769,921 | ||||||
| Total liabilities and equity |
$ | 2,993,432 | $ | 3,094,976 | ||||
The accompanying notes are an integral part of these consolidated financial statements.
77
Table of Contents
Consolidated Statements of Operations
(Dollars in thousands, except share and per share information)
| For the Years Ended December 31 | ||||||||||||
| 2010 | 2009 | 2008 | ||||||||||
| Revenue: |
||||||||||||
| Investment interest income |
$ | 153,955 | $ | 381,979 | $ | 691,287 | ||||||
| Investment interest expense |
(91,142 | ) | (255,604 | ) | (485,286 | ) | ||||||
| Net interest margin |
62,813 | 126,375 | 206,001 | |||||||||
| Rental income |
72,373 | 44,637 | 17,425 | |||||||||
| Fee and other income |
18,242 | 26,498 | 21,357 | |||||||||
| Total revenue |
153,428 | 197,510 | 244,783 | |||||||||
| Expenses: |
||||||||||||
| Real estate operating expense |
56,824 | 41,399 | 14,781 | |||||||||
| Compensation expense |
28,732 | 27,578 | 29,804 | |||||||||
| General and administrative expense |
18,232 | 21,770 | 21,930 | |||||||||
| Provision for losses |
38,307 | 226,567 | 162,783 | |||||||||
| Asset impairments |
— | 46,015 | 67,052 | |||||||||
| Depreciation expense |
27,832 | 19,715 | 6,196 | |||||||||
| Amortization of intangible assets |
822 | 1,407 | 17,077 | |||||||||
| Total expenses |
170,749 | 384,451 | 319,623 | |||||||||
| Income (loss) before other income (expense), taxes and discontinued operations |
(17,321 | ) | (186,941 | ) | (74,840 | ) | ||||||
| Interest and other income |
422 | 5,643 | 1,315 | |||||||||
| Gains (losses) on sale of assets |
11,626 | (376,751 | ) | 806 | ||||||||
| Gains on extinguishment of debt |
71,575 | 115,869 | 42,572 | |||||||||
| Change in fair value of free-standing derivatives |
— | — | (37,203 | ) | ||||||||
| Change in fair value of financial instruments |
45,840 | 1,563 | (552,437 | ) | ||||||||
| Unrealized gains (losses) on interest rate hedges |
46 | (470 | ) | (407 | ) | |||||||
| Equity in income (loss) of equity method investments |
4 | (12 | ) | 927 | ||||||||
| Income (loss) before taxes and discontinued operations |
112,192 | (441,099 | ) | (619,267 | ) | |||||||
| Income tax benefit (provision) |
(1,602 | ) | 958 | 2,137 | ||||||||
| Income (loss) from continuing operations |
110,590 | (440,141 | ) | (617,130 | ) | |||||||
| Income (loss) from discontinued operations |
323 | (840 | ) | (2,055 | ) | |||||||
| Net income (loss) |
110,913 | (440,981 | ) | (619,185 | ) | |||||||
| Income (loss) allocated to preferred shares |
(13,641 | ) | (13,641 | ) | (13,641 | ) | ||||||
| Income (loss) allocated to noncontrolling interests |
880 | 13,419 | 189,580 | |||||||||
| Net income (loss) allocable to common shares |
$ | 98,152 | $ | (441,203 | ) | $ | (443,246 | ) | ||||
| Earnings (loss) per share—Basic: |
||||||||||||
| Continuing operations |
$ | 1.13 | $ | (6.76 | ) | $ | (6.96 | ) | ||||
| Discontinued operations |
— | (0.01 | ) | (0.03 | ) | |||||||
| Total earnings (loss) per share—Basic |
$ | 1.13 | $ | (6.77 | ) | $ | (6.99 | ) | ||||
| Weighted-average shares outstanding—Basic |
86,854,265 | 65,205,233 | 63,394,447 | |||||||||
| Earnings (loss) per share—Diluted: |
||||||||||||
| Continuing operations |
$ | 1.11 | $ | (6.76 | ) | $ | (6.96 | ) | ||||
| Discontinued operations |
— | (0.01 | ) | (0.03 | ) | |||||||
| Total earnings (loss) per share—Diluted |
$ | 1.11 | $ | (6.77 | ) | $ | (6.99 | ) | ||||
| Weighted-average shares outstanding—Diluted |
88,252,012 | 65,205,233 | 63,394,447 | |||||||||
| Distributions declared per common share |
$ | — | $ | — | $ | 1.27 | ||||||
The accompanying notes are an integral part of these consolidated financial statements.
78
Table of Contents
Consolidated Statements of Comprehensive Income (Loss)
(Dollars in thousands)
| For the Years Ended December 31 | ||||||||||||
| 2010 | 2009 | 2008 | ||||||||||
| Net income (loss) |
$ | 110,913 | $ | (440,981 | ) | $ | (619,185 | ) | ||||
| Other comprehensive income (loss): |
||||||||||||
| Change in fair value of interest rate hedges |
(50,638 | ) | 6,807 | (110,334 | ) | |||||||
| Reclassification adjustments associated with unrealized losses (gains) from interest rate hedges included in net income (loss) |
(46 | ) | 470 | 407 | ||||||||
| Realized (gains) losses on interest rate hedges reclassified to earnings |
46,111 | 45,476 | 31,307 | |||||||||
| Change in fair value of available-for-sale securities |
(359 | ) | (12,095 | ) | (42,460 | ) | ||||||
| Realized (gains) losses on available-for-sale securities reclassified to earnings |
(3,697 | ) | 44,275 | 20,961 | ||||||||
| Realized (gains) losses on sales of assets of VIEs |
— | 28,196 | — | |||||||||
| Total other comprehensive income (loss) |
(8,629 | ) | 113,129 | (100,119 | ) | |||||||
| Comprehensive income (loss) before allocation to noncontrolling interests |
102,284 | (327,852 | ) | (719,304 | ) | |||||||
| Allocation to noncontrolling interests |
880 | 12,742 | 187,793 | |||||||||
| Comprehensive income (loss) |
$ | 103,164 | $ | (315,110 | ) | $ | (531,511 | ) | ||||
The accompanying notes are an integral part of these consolidated financial statements.
79
Table of Contents
Consolidated Statements of Equity
(Dollars in thousands, except share information)
| Preferred Shares— Series A |
Par Value Preferred Shares— Series A |
Preferred Shares— Series B |
Par Value Preferred Shares— Series B |
Preferred Shares— Series C |
Par Value Preferred Shares— Series C |
Common Shares |
Par Value Common Shares |
Additional Paid In Capital |
Accumulated Other Comprehensive Income (Loss) |
Retained Earnings (Deficit) |
Total Shareholders’ Equity |
Noncontrolling Interests |
Total Equity |
|||||||||||||||||||||||||||||||||||||||||||
| Balance, January 1, 2008 |
2,760,000 | 28 | 2,258,300 | 23 | 1,600,000 | 16 | 60,792,791 | 607 | 1,577,975 | (440,039 | ) | (557,615 | ) | 580,996 | 1,602 | 582,598 | ||||||||||||||||||||||||||||||||||||||||
| Adjustment for adoption of the fair value option on January 1, 2008 |
— | — | — | — | — | — | — | — | — | 310,520 | 776,874 | 1,087,394 | 373,357 | 1,460,751 | ||||||||||||||||||||||||||||||||||||||||||
| Net loss |
— | — | — | — | — | — | — | — | — | — | (429,605 | ) | (429,605 | ) | (189,580 | ) | (619,185 | ) | ||||||||||||||||||||||||||||||||||||||
| Preferred dividends |
— | — | — | — | — | — | — | — | — | — | (13,641 | ) | (13,641 | ) | — | (13,641 | ) | |||||||||||||||||||||||||||||||||||||||
| Common dividends declared |
— | — | — | — | — | — | — | — | — | — | (80,073 | ) | (80,073 | ) | — | (80,073 | ) | |||||||||||||||||||||||||||||||||||||||
| Other comprehensive loss, net |
— | — | — | — | — | — | — | — | — | (101,906 | ) | — | (101,906 | ) | 1,787 | (100,119 | ) | |||||||||||||||||||||||||||||||||||||||
| Stock compensation expense |
— | — | — | — | — | — | 306,532 | 4 | 7,515 | — | — | 7,519 | — | 7,519 | ||||||||||||||||||||||||||||||||||||||||||
| Acquisition of noncontrolling interests |
— | — | — | — | — | — | — | — | — | — | — | — | 3,229 | 3,229 | ||||||||||||||||||||||||||||||||||||||||||
| Distributions to noncontrolling interests |
— | — | — | — | — | — | — | — | — | — | — | — | (138 | ) | (138 | ) | ||||||||||||||||||||||||||||||||||||||||
| Common shares issued, net |
— | — | — | — | — | — | 3,666,558 | 37 | 28,363 | — | — | 28,400 | — | 28,400 | ||||||||||||||||||||||||||||||||||||||||||
| Balance, December 31, 2008 |
2,760,000 | 28 | 2,258,300 | 23 | 1,600,000 | 16 | 64,765,881 | 648 | 1,613,853 | (231,425 | ) | (304,059 | ) | 1,079,084 | 190,257 | 1,269,341 | ||||||||||||||||||||||||||||||||||||||||
| Net loss |
— | — | — | — | — | — | — | — | — | — | (427,562 | ) | (427,562 | ) | (13,419 | ) | (440,981 | ) | ||||||||||||||||||||||||||||||||||||||
| Preferred dividends |
— | — | — | — | — | — | — | — | — | — | (13,641 | ) | (13,641 | ) | — | (13,641 | ) | |||||||||||||||||||||||||||||||||||||||
| Other comprehensive loss, net |
— | — | — | — | — | — | — | — | — | 112,452 | — | 112,452 | 677 | 113,129 | ||||||||||||||||||||||||||||||||||||||||||
| Stock compensation expense |
— | — | — | — | — | — | 214,186 | 2 | 3,716 | — | — | 3,718 | — | 3,718 | ||||||||||||||||||||||||||||||||||||||||||
| Acquisition of noncontrolling interests |
— | — | — | — | — | — | — | — | — | — | — | — | 433 | 433 | ||||||||||||||||||||||||||||||||||||||||||
| Deconsolidation of VIEs |
— | — | — | — | — | — | — | — | — | — | — | — | (175,031 | ) | (175,031 | ) | ||||||||||||||||||||||||||||||||||||||||
| Common shares issued, net |
— | — | — | — | — | — | 9,440,531 | 94 | 12,859 | — | — | 12,953 | — | 12,953 | ||||||||||||||||||||||||||||||||||||||||||
| Balance, December 31, 2009 |
2,760,000 | $ | 28 | 2,258,300 | $ | 23 | 1,600,000 | $ | 16 | 74,420,598 | $ | 744 | $ | 1,630,428 | $ | (118,973 | ) | $ | (745,262 | ) | $ | 767,004 | $ | 2,917 | $ | 769,921 | ||||||||||||||||||||||||||||||
| Net income |
— | — | — | — | — | — | — | — | — | — | 111,793 | 111,793 | (880 | ) | 110,913 | |||||||||||||||||||||||||||||||||||||||||
| Preferred dividends |
— | — | — | — | — | — | — | — | — | — | (13,641 | ) | (13,641 | ) | — | (13,641 | ) | |||||||||||||||||||||||||||||||||||||||
| Other comprehensive loss, net |
— | — | — | — | — | — | — | — | — | (8,629 | ) | — | (8,629 | ) | — | (8,629 | ) | |||||||||||||||||||||||||||||||||||||||
| Stock compensation expense |
— | — | — | — | — | — | 125,871 | 1 | 2,856 | — | — | 2,857 | — | 2,857 | ||||||||||||||||||||||||||||||||||||||||||
| Acquisition of noncontrolling interests |
— | — | — | — | — | — | — | — | (332 | ) | — | — | (332 | ) | (1,603 | ) | (1,935 | ) | ||||||||||||||||||||||||||||||||||||||
| Common shares issued, net |
— | — | — | — | — | — | 31,354,101 | 315 | 58,729 | — | — | 59,044 | — | 59,044 | ||||||||||||||||||||||||||||||||||||||||||
| Balance, December 31, 2010 |
2,760,000 | $ | 28 | 2,258,300 | $ | 23 | 1,600,000 | $ | 16 | 105,900,570 | $ | 1,060 | $ | 1,691,681 | $ | (127,602 | ) | $ | (647,110 | ) | $ | 918,096 | $ | 434 | $ | 918,530 | ||||||||||||||||||||||||||||||
The accompanying notes are an integral part of these consolidated financial statements.
80
Table of Contents
Consolidated Statements of Cash Flows
(Dollars in thousands)
| For the Years Ended December 31 |
||||||||||||
| 2010 | 2009 | 2008 | ||||||||||
| Operating activities: |
||||||||||||
| Net income (loss) |
$ | 110,913 | $ | (440,981 | ) | $ | (619,185 | ) | ||||
| Adjustments to reconcile net income (loss) to cash flow from operating activities: |
||||||||||||
| Provision for losses |
38,307 | 226,567 | 162,783 | |||||||||
| Share-based compensation expense |
2,949 | 3,830 | 7,206 | |||||||||
| Depreciation and amortization |
30,444 | 24,015 | 24,578 | |||||||||
| Amortization of deferred financing costs and debt discounts |
2,888 | 10,801 | 15,046 | |||||||||
| Accretion of discounts on investments |
(3,984 | ) | (5,355 | ) | (6,448 | ) | ||||||
| (Gains) losses on sale of assets |
(9,944 | ) | 378,414 | (806 | ) | |||||||
| Gains on extinguishment of debt |
(71,575 | ) | (115,869 | ) | (42,572 | ) | ||||||
| Change in fair value of financial instruments |
(45,840 | ) | (1,563 | ) | 552,437 | |||||||
| Unrealized (gains) losses on interest rate hedges |
(46 | ) | 470 | 407 | ||||||||
| Equity in (income) loss of equity method investments |
(4 | ) | 12 | (927 | ) | |||||||
| Asset impairments |
— | 46,015 | 67,052 | |||||||||
| Unrealized foreign currency (gains) losses on investments |
(90 | ) | (398 | ) | (5 | ) | ||||||
| Changes in assets and liabilities: |
||||||||||||
| Accrued interest receivable |
(185 | ) | (245 | ) | 10,199 | |||||||
| Other assets |
8,485 | (222 | ) | 30,091 | ||||||||
| Accrued interest payable |
(43,062 | ) | (56,224 | ) | 14,152 | |||||||
| Accounts payable and accrued expenses |
1,940 | (1,219 | ) | 578 | ||||||||
| Deferred taxes, borrowers’ escrows and other liabilities |
(5,748 | ) | (3,035 | ) | (72,588 | ) | ||||||
| Cash flow from operating activities |
15,448 | 65,013 | 141,998 | |||||||||
| Investing activities: |
||||||||||||
| Purchase and origination of securities for investment |
— | (836 | ) | (60,375 | ) | |||||||
| Proceeds from sales of other securities |
23,338 | 948 | — | |||||||||
| Purchase and origination of loans for investment |
(26,691 | ) | (30,990 | ) | (148,762 | ) | ||||||
| Principal repayments on loans |
107,717 | 269,530 | 656,916 | |||||||||
| Investment in Jupiter Communities |
— | (1,300 | ) | — | ||||||||
| Proceeds from sale of residential mortgages |
— | 16,204 | — | |||||||||
| Investments in real estate |
(20,798 | ) | (11,929 | ) | 4,959 | |||||||
| Proceeds from dispositions of real estate |
12,069 | 9,385 | 28,028 | |||||||||
| Proceeds from sale of collateral management rights |
14,105 | — | — | |||||||||
| (Increase) decrease in restricted cash and warehouse deposits |
(46,842 | ) | 1,992 | 61,759 | ||||||||
| Cash flow from investing activities |
62,898 | 253,004 | 542,525 | |||||||||
| Financing activities: |
||||||||||||
| Proceeds from repurchase agreements, secured credit facilities and other indebtedness |
— | — | 68,251 | |||||||||
| Repayments on repurchase agreements, secured credit facilities and other indebtedness |
(18,706 | ) | (28,064 | ) | (184,098 | ) | ||||||
| Repayments on residential mortgage-backed securities |
— | (223,335 | ) | (448,154 | ) | |||||||
| Proceeds from issuance of CDO notes payable |
— | — | 80,007 | |||||||||
| Repayments and repurchase of CDO notes payable |
(50,683 | ) | (38,532 | ) | (188,151 | ) | ||||||
| Repayments and repurchase of convertible senior notes |
(12,187 | ) | (28,988 | ) | (18,664 | ) | ||||||
| Acquisition of and distributions to noncontrolling interests in CDOs |
(1,935 | ) | — | (208 | ) | |||||||
| Payments for deferred costs |
(761 | ) | (839 | ) | (989 | ) | ||||||
| Common share issuance, net of costs incurred |
21,763 | 12,953 | 28,741 | |||||||||
| Distributions paid to preferred shares |
(13,641 | ) | (13,641 | ) | (13,641 | ) | ||||||
| Distributions paid to common shares |
— | — | (108,141 | ) | ||||||||
| Cash flow from financing activities |
(76,150 | ) | (320,446 | ) | (785,047 | ) | ||||||
| Net change in cash and cash equivalents |
2,196 | (2,429 | ) | (100,524 | ) | |||||||
| Cash and cash equivalents at the beginning of the period |
25,034 | 27,463 | 127,987 | |||||||||
| Cash and cash equivalents at the end of the period |
$ | 27,230 | $ | 25,034 | $ | 27,463 | ||||||
| Supplemental cash flow information: |
||||||||||||
| Cash paid for interest |
$ | 44,839 | $ | 248,226 | $ | 409,400 | ||||||
| Cash paid (refunds received) for taxes |
(1,401 | ) | (975 | ) | 2,721 | |||||||
| Non-cash decrease in trust preferred obligations |
— | (227,084 | ) | (91,166 | ) | |||||||
| Non-cash increase in investments in real estate from the conversion of loans |
123,087 | 416,751 | 237,439 | |||||||||
| Non-cash decrease in convertible senior notes from extinguishment of debt |
(32,934 | ) | (69,398 | ) | (22,168 | ) | ||||||
| Non-cash decrease in other indebtedness from extinguishment of debt |
— | — | (19,750 | ) | ||||||||
The accompanying notes are an integral part of these consolidated financial statements.
81
Table of Contents
Notes to Consolidated Financial Statements
As of December 31, 2010
(Dollars in thousands, except share and per share amounts)
NOTE 1: THE COMPANY
RAIT Financial Trust invests in and manages a portfolio of real-estate related assets and provides a comprehensive set of debt financing options to the real estate industry. References to “RAIT”, “we”, “us”, and “our” refer to RAIT Financial Trust and its subsidiaries, unless the context otherwise requires. We conduct our business through our subsidiaries, RAIT Partnership, L.P. and Taberna Realty Finance Trust, as well as through their respective subsidiaries. RAIT is a self-managed and self-advised Maryland real estate investment trust, or REIT. Taberna is also a Maryland REIT.
We finance a substantial portion of our investments through borrowing and securitization strategies seeking to match the maturities and terms of our financings with the maturities and terms of those investments, and to mitigate interest rate risk through derivative instruments.
We are subject to significant competition in all aspects of our business. Existing industry participants and potential new entrants compete with us for the available supply of investments suitable for origination or acquisition, as well as for debt and equity capital. We compete with many third parties engaged in real estate finance and investment activities, including other REITs, specialty finance companies, savings and loan associations, banks, mortgage bankers, insurance companies, mutual funds, institutional investors, investment banking firms, lenders, governmental bodies and other entities.
NOTE 2: SUMMARY OF SIGNIFICANT ACCOUNTING POLICIES
a. Basis of Presentation
The consolidated financial statements have been prepared by management in accordance with U.S. generally accepted accounting principles, or GAAP. In the opinion of management, all adjustments, consisting only of normal recurring adjustments, necessary to present fairly our consolidated financial position and consolidated results of operations, equity and cash flows are included. Certain prior period amounts have been reclassified to conform with the current period presentation.
b. Principles of Consolidation
The consolidated financial statements reflect our accounts and the accounts of our majority-owned and/or controlled subsidiaries. We also consolidate entities that are variable interest entities, or VIEs, where we have determined that we are the primary beneficiary of such entities. The portions of these entities that we do not own are presented as noncontrolling interests as of the dates and for the periods presented in the consolidated financial statements. All intercompany accounts and transactions have been eliminated in consolidation.
Under Financial Accounting Standards Board (FASB) Accounting Standards Codification (ASC) Topic 810, “Consolidation”, the determination of whether to consolidate a VIE is based on an evaluation as to who has both the power to direct the activities of the VIE that most significantly impact the VIE’s economic performance and either the obligation to absorb losses or the right to receive benefits that could be significant to the VIE. We define the power to direct the activities that most significantly impact the VIE’s economic performance as the ability to buy, sell, refinance, or recapitalize assets or entities, and solely control other material operating events or items of the respective entity. For our commercial mortgages, mezzanine loans, and preferred equity investments, certain rights we hold are protective in nature and would preclude us from having the power to direct the activities that most significantly impact the VIE’s economic performance. Assuming both criteria
82
Table of Contents
above are met, we would be considered the primary beneficiary and would consolidate the VIE. We will continually assess our involvement with VIEs and consolidate the VIEs when we are the primary beneficiary. See Note 9 for additional disclosures pertaining to VIEs.
c. Use of Estimates
The preparation of financial statements in conformity with GAAP requires management to make estimates and assumptions that affect the reported amounts of assets and liabilities, the disclosure of contingent assets and liabilities at the date of the financial statements and the reported amounts of revenue and expenses during the reporting periods. Actual results could differ from those estimates.
d. Cash and Cash Equivalents
Cash and cash equivalents include cash held in banks and highly liquid investments with maturities of three months or less when purchased.
e. Restricted Cash
Restricted cash consists primarily of proceeds from the issuance of CDO notes payable by CDO securitization entities that are restricted for the purpose of funding additional investments in securities subsequent to the balance sheet date. As of December 31, 2010 and 2009, we had $151,045 and $117,673, respectively, of restricted cash held by CDO securitization entities.
Restricted cash also includes tenant escrows and borrowers’ funds held by us to fund certain expenditures or to be released at our discretion upon the occurrence of certain pre-specified events, and to serve as additional collateral for borrowers’ loans. As of December 31, 2010 and 2009, we had $25,166 and $38,494, respectively, of tenant escrows and borrowers’ funds.
f. Investments in Loans
We invest in commercial mortgages, mezzanine loans, debt securities and other loans. We account for our investments in commercial mortgages, mezzanine loans and other loans at amortized cost. The carrying value of these investments is adjusted for origination discounts/premiums, nonrefundable fees and direct costs for originating loans which are amortized into income on a level yield basis over the terms of the loans.
g. Allowance for Losses, Impaired Loans and Non-accrual Status
We maintain an allowance for losses on our investments in commercial mortgages, mezzanine loans and other loans. Management’s periodic evaluation of the adequacy of the allowance is based upon expected and inherent risks in the portfolio, the estimated value of underlying collateral, and current economic conditions. Management reviews loans for impairment and establishes specific reserves when a loss is probable and reasonably estimable under the provisions of FASB ASC Topic 310, “Receivables.” As part of the detailed loan review, we consider many factors about the specific loan, including payment history, asset performance, borrower’s financial capability and other characteristics. If any trends or characteristics indicate that it is probable that other loans, with similar characteristics to those of impaired loans, have incurred a loss, we consider whether an allowance for loss is needed pursuant to FASB ASC Topic 450, “Contingencies.” Management evaluates loans for non-accrual status each reporting period. A loan is placed on non-accrual status when the loan payment deficiencies exceed 90 days. Payments received for non-accrual or impaired loans are applied to principal until the loan is removed from non-accrual status or no longer impaired. Past due interest is recognized on non-accrual loans when they are removed from non-accrual status and are making current interest payments. The allowance for losses is increased by charges to operations and decreased by charge-offs (net of recoveries). Management charges off impaired loans when the investment is no longer realizable and legally discharged.
83
Table of Contents
h. Investments in Real Estate
Investments in real estate are shown net of accumulated depreciation. We capitalize all costs related to the improvement of the real property and depreciate those costs on a straight-line basis over the useful life of the asset. We depreciate real property using the following useful lives: buildings and improvements—30 years; furniture, fixtures, and equipment—5 to 10 years; and tenant improvements—shorter of the lease term or the life of the asset. Costs for ordinary maintenance and repairs are charged to expense as incurred.
We acquire real estate assets either directly or through the conversion of our investments in loans into owned real estate. Acquisitions of real estate assets and any related intangible assets are recorded initially at fair value under FASB ASC Topic 805, “Business Combinations.” Fair value is determined by management based on market conditions and inputs at the time the asset is acquired. All expenses incurred to acquire a real estate asset are expensed as incurred.
Management reviews our investments in real estate for impairment whenever events or changes in circumstances indicate that the carrying amount of an asset may not be recoverable. The review of recoverability is based on an estimate of the future undiscounted cash flows (excluding interest charges) expected to result from the long-lived asset’s use and eventual disposition. These cash flows consider factors such as expected future operating income, trends and prospects, as well as the effects of leasing demand, competition and other factors. If impairment exists due to the inability to recover the carrying value of a long-lived asset, an impairment loss is recorded to the extent that the carrying value exceeds the estimated fair value of the property.
i. Investments in Securities
We account for our investments in securities under FASB ASC Topic 320, “Investments—Debt and Equity Securities”, and designate each investment security as a trading security, an available-for-sale security, or a held-to-maturity security based on our intent at the time of acquisition. Trading securities are recorded at their fair value each reporting period with fluctuations in fair value reported as a component of earnings. Available-for-sale securities are recorded at fair value with changes in fair value reported as a component of other comprehensive income (loss). We classify certain available-for-sale securities as trading securities when we elect to record them under the fair value option in accordance with FASB ASC Topic 825, “Financial Instruments.” See “m. Fair Value of Financial Instruments.” Upon the sale of an available-for-sale security, the realized gain or loss on the sale will be recorded as a component of earnings in the respective period. Held-to-maturity investments are carried at amortized cost at each reporting period.
We account for investments in securities where the transfer meets the criteria as a financing under FASB ASC Topic 860, “Transfers and Servicing”, at amortized cost. Our investments in security-related receivables represent securities that were transferred to issuers of collateralized debt obligations, or CDOs, in which the transferors maintained some level of continuing involvement.
We use our judgment to determine whether an investment in securities has sustained an other-than-temporary decline in value. If management determines that an investment in securities has sustained an other-than-temporary decline in its value, the investment is written down to its fair value by a charge to earnings, and we establish a new cost basis for the investment. Our evaluation of an other-than-temporary decline is dependent on the specific facts and circumstances. Factors that we consider in determining whether an other-than-temporary decline in value has occurred include: the estimated fair value of the investment in relation to our cost basis; the financial condition of the related entity; and the intent and ability to retain the investment for a sufficient period of time to allow for recovery of the fair value of the investment.
j. Transfers of Financial Assets
We account for transfers of financial assets under FASB ASC Topic 860, “Transfers and Servicing”, as either sales or financings. Transfers of financial assets that result in sales accounting are those in which (1) the transfer legally isolates the transferred assets from the transferor, (2) the transferee has the right to pledge or
84
Table of Contents
exchange the transferred assets and no condition both constrains the transferee’s right to pledge or exchange the assets and provides more than a trivial benefit to the transferor, and (3) the transferor does not maintain effective control over the transferred assets. If the transfer does not meet these criteria, the transfer is accounted for as a financing. Financial assets that are treated as sales are removed from our accounts with any realized gain (loss) reflected in earnings during the period of sale. Financial assets that are treated as financings are maintained on the balance sheet with proceeds received from the legal transfer reflected as securitized borrowings, or security-related receivables.
k. Revenue Recognition
| 1) | Investment interest income—We recognize interest income from investments in commercial mortgages, mezzanine loans, and other securities on a yield to maturity basis. Upon the acquisition of a loan at a discount, we assess the portions of the discount that constitute accretable yields and non-accretable differences. The accretable yield represents the excess of our expected cash flows from the loan over the amount we paid for the loan. That amount, the accretable yield, is accreted to interest income over the remaining life of the loan. Many of our commercial mortgages and mezzanine loans provide for the accrual of interest at specified rates which differ from current payment terms. Interest income is recognized on such loans at the accrual rate subject to management’s determination that accrued interest and outstanding principal are ultimately collectible. |
For investments that we do not elect to record at fair value under FASB ASC Topic 825, “Financial Instruments”, origination fees and direct loan origination costs are deferred and amortized to net investment income, using the effective interest method, over the contractual life of the underlying loan security or loan, in accordance with FASB ASC Topic 310, “Receivables.”
For investments that we elect to record at fair value under FASB ASC Topic 825, origination fees and direct loan costs are recorded in income and are not deferred.
We recognize interest income from interests in certain securitized financial assets on an estimated effective yield to maturity basis. Management estimates the current yield on the amortized cost of the investment based on estimated cash flows after considering prepayment and credit loss experience.
| 2) | Rental income—We generate rental income from tenant rent and other tenant-related activities at our consolidated real estate properties. For multi-family real estate properties, rental income is recorded when due from residents and recognized monthly as it is earned and realizable, under lease terms which are generally for periods of one year or less. For retail and office real estate properties, rental income is recognized on a straight-line basis from the later of the date of the commencement of the lease or the date of acquisition of the property subject to existing leases, which averages minimum rents over the terms of the leases. Leases also typically provide for tenant reimbursement of a portion of common area maintenance and other operating expenses to the extent that a tenant’s pro rata share of expenses exceeds a base year level set in the lease. |
| 3) | Fee and other income—We generate fee and other income by (a) providing ongoing asset management services to investment portfolios under cancelable management agreements, (b) providing or arranging to provide financing to our borrowers, (c) property management services to third parties, and (d) providing fixed income trading and advisory services to our customers. We recognize revenue for these activities when the fees are fixed or determinable, are evidenced by an arrangement, collection is reasonably assured and the services under the arrangement have been provided. While we may receive asset management fees when they are earned, we eliminate earned asset management fees from securitizations that we consolidate. During the years ended December 31, 2010, 2009 and 2008, we received $6,332, $16,114, and $23,228, respectively, of earned asset management fees, of which we eliminated $2,805, $7,011, and $12,158, respectively, associated with consolidated CDOs. |
85
Table of Contents
l. Derivative Instruments
We may use derivative financial instruments to hedge all or a portion of the interest rate risk associated with our borrowings. Certain of the techniques used to hedge exposure to interest rate fluctuations may also be used to protect against declines in the market value of assets that result from general trends in debt markets. The principal objective of such agreements is to minimize the risks and/or costs associated with our operating and financial structure as well as to hedge specific anticipated transactions.
In accordance with FASB ASC Topic 815, “Derivatives and Hedging”, we measure each derivative instrument (including certain derivative instruments embedded in other contracts) at fair value and record such amounts in our consolidated balance sheet as either an asset or liability. For derivatives designated as fair value hedges, derivatives not designated as hedges, or for derivatives designated as cash flow hedges associated with debt for which we elected the fair value option under FASB ASC Topic 825, “Financial Instruments”, the changes in fair value of the derivative instrument are recorded in earnings. For derivatives designated as cash flow hedges, the changes in the fair value of the effective portions of the derivative are reported in other comprehensive income. Changes in the ineffective portions of cash flow hedges are recognized in earnings.
m. Fair Value of Financial Instruments
In accordance with FASB ASC Topic 820, “Fair Value Measurements and Disclosures”, fair value is the price that would be received to sell an asset or paid to transfer a liability in an orderly transaction between market participants at the measurement date. Where available, fair value is based on observable market prices or parameters or derived from such prices or parameters. Where observable prices or inputs are not available, valuation models are applied. These valuation techniques involve management estimation and judgment, the degree of which is dependent on the price transparency for the instruments or market and the instruments’ complexity for disclosure purposes. Assets and liabilities recorded at fair value in the consolidated balance sheets are categorized based upon the level of judgment associated with the inputs used to measure their value. Hierarchical levels, as defined in FASB ASC Topic 820, “Fair Value Measurements and Disclosures” and directly related to the amount of subjectivity associated with the inputs to fair valuations of these assets and liabilities, are as follows:
| • | Level 1: Valuations are based on unadjusted, quoted prices in active markets for identical assets or liabilities at the measurement date. The types of assets carried at level 1 fair value generally are equity securities listed in active markets. As such, valuations of these investments do not entail a significant degree of judgment. |
| • | Level 2: Valuations are based on quoted prices for similar instruments in active markets or quoted prices for identical or similar instruments in markets that are not active or for which all significant inputs are observable, either directly or indirectly. |
Fair value assets and liabilities that are generally included in this category are unsecured REIT note receivables, commercial mortgage-backed securities, or CMBS, receivables and certain financial instruments classified as derivatives where the fair value is based on observable market inputs.
| • | Level 3: Inputs are unobservable inputs for the asset or liability, and include situations where there is little, if any, market activity for the asset or liability. In certain cases, the inputs used to measure fair value may fall into different levels of the fair value hierarchy. In such cases, the level in the fair value hierarchy within which the fair value measurement in its entirety falls has been determined based on the lowest level input that is significant to the fair value measurement in its entirety. Our assessment of the significance of a particular input to the fair value measurement in its entirety requires judgment, and considers factors specific to the asset. Generally, assets and liabilities carried at fair value and included in this category are trust preferred securities, or TruPS, and subordinated debentures, trust preferred obligations and CDO notes payable where observable market inputs do not exist. |
86
Table of Contents
The availability of observable inputs can vary depending on the financial asset or liability and is affected by a wide variety of factors, including, for example, the type of investment, whether the investment is new, whether the investment is traded on an active exchange or in the secondary market, and the current market condition. To the extent that valuation is based on models or inputs that are less observable or unobservable in the market, the determination of fair value requires more judgment. Accordingly, the degree of judgment exercised by us in determining fair value is greatest for instruments categorized in level 3.
Fair value is a market-based measure considered from the perspective of a market participant who holds the asset or owes the liability rather than an entity-specific measure. Therefore, even when market assumptions are not readily available, our own assumptions are set to reflect those that management believes market participants would use in pricing the asset or liability at the measurement date. We use prices and inputs that management believes are current as of the measurement date, including during periods of market dislocation. In periods of market dislocation, the observability of prices and inputs may be reduced for many instruments. This condition could cause an instrument to be transferred from Level 1 to Level 2 or Level 2 to Level 3.
Many financial instruments have bid and ask prices that can be observed in the marketplace. Bid prices reflect the highest price that we and others are willing to pay for an asset. Ask prices represent the lowest price that we and others are willing to accept for an asset. For financial instruments whose inputs are based on bid-ask prices, we do not require that fair value always be a predetermined point in the bid-ask range. Our policy is to allow for mid-market pricing and adjusting to the point within the bid-ask range that results in our best estimate of fair value.
Fair value for certain of our Level 3 financial instruments is derived using internal valuation models. These internal valuation models include discounted cash flow analyses developed by management using current interest rates, estimates of the term of the particular instrument, specific issuer information and other market data for securities without an active market. In accordance with FASB ASC Topic 820, “Fair Value Measurements and Disclosures”, the impact of our own credit spreads is also considered when measuring the fair value of financial assets or liabilities, including derivative contracts. Where appropriate, valuation adjustments are made to account for various factors, including bid-ask spreads, credit quality and market liquidity. These adjustments are applied on a consistent basis and are based on observable inputs where available. Management’s estimate of fair value requires significant management judgment and is subject to a high degree of variability based upon market conditions, the availability of specific issuer information and management’s assumptions.
n. Income Taxes
RAIT and Taberna have each elected to be taxed as a REIT and to comply with the related provisions of the Internal Revenue Code of 1986, as amended, or the Internal Revenue Code. Accordingly, we generally will not be subject to U.S. federal income tax to the extent of our distributions to shareholders and as long as certain asset, income and share ownership tests are met. If we were to fail to meet these requirements, we would be subject to U.S. federal income tax, which could have a material adverse impact on our results of operations and amounts available for distributions to our shareholders. Management believes that all of the criteria to maintain RAIT’s and Taberna’s REIT qualification have been met for the applicable periods, but there can be no assurance that these criteria will continue to be met in subsequent periods.
We maintain various taxable REIT subsidiaries, or TRSs, which may be subject to U.S. federal, state and local income taxes and foreign taxes. Current and deferred taxes are provided on the portion of earnings (losses) recognized by us with respect to our interest in domestic TRSs. Deferred income tax assets and liabilities are computed based on temporary differences between our GAAP consolidated financial statements and the federal and state income tax basis of assets and liabilities as of the consolidated balance sheet date. We evaluate the realizability of our deferred tax assets (e.g., net operating loss and capital loss carryforwards) and recognize a valuation allowance if, based on the available evidence, it is more likely than not that some portion or all of our
87
Table of Contents
deferred tax assets will not be realized. When evaluating the realizability of our deferred tax assets, we consider estimates of expected future taxable income, existing and projected book/tax differences, tax planning strategies available, and the general and industry specific economic outlook. This realizability analysis is inherently subjective, as it requires management to forecast our business and general economic environment in future periods. Changes in estimate of deferred tax asset realizability, if any, are included in income tax expense on the consolidated statements of operations.
From time to time, our TRSs generate taxable income from intercompany transactions. The TRS entities generate taxable revenue from fees for services provided to CDO entities. Some of these fees paid to the TRS entities are capitalized as deferred financing costs by the CDO entities. Certain CDO entities may be consolidated in our financial statements pursuant to FASB ASC Topic 810, “Consolidation.” In consolidation, these fees are eliminated when the CDO entity is included in the consolidated group. Nonetheless, all income taxes are accrued by the TRSs in the year in which the taxable revenue is received. These income taxes are not eliminated when the related revenue is eliminated in consolidation.
Certain TRS entities are domiciled in the Cayman Islands and, accordingly, taxable income generated by these entities may not be subject to local income taxation, but generally will be included in our income on a current basis, whether or not distributed. Upon distribution of any previously included income, no incremental U.S. federal, state, or local income taxes would be payable by us.
The TRS entities may be subject to tax laws that are complex and potentially subject to different interpretations by the taxpayer and the relevant governmental taxing authorities. In establishing a provision for income tax expense, we must make judgments and interpretations about the application of these inherently complex tax laws. Actual income taxes paid may vary from estimates depending upon changes in income tax laws, actual results of operations, and the final audit of tax returns by taxing authorities. Tax assessments may arise several years after tax returns have been filed.
Certain TRS entities were subject to ongoing tax examinations in various jurisdictions during 2010. The IRS examined Taberna Capital Management LLC’s, or TCM’s, federal income tax returns for the 2006 through 2008 tax years. TCM engaged the services of Taberna Capital (Bermuda), Ltd., or TCB, from June 2006 through June 2008 and RAIT Capital Ireland Ltd., or RCI, from July 2008 through June 30, 2010, to provide various sub-advisory services in connection with TCM’s management of various CDOs. Pursuant to transfer pricing studies prepared by an international accounting firm, TCM deducted the costs paid to TCB and RCI for their services from its income for federal income tax purposes. The IRS challenged the transfer pricing methodology applied in calculating these deductions. In February 2011, management and the IRS settled the TCM tax examinations for 2006, 2007 and 2008 for a net cash payment of $296. See Note 13—Income Taxes.
o. Share-Based Compensation
We account for our share-based compensation in accordance with FASB ASC Topic 718, “Compensation-Stock Compensation.” We measure the cost of employee and trustee services received in exchange for an award of equity instruments based on the grant-date fair value of the award and record compensation expense over the related vesting period.
p. Deferred Financing Costs, Intangible Assets and Goodwill
Costs incurred in connection with debt financing are capitalized as deferred financing costs and charged to interest expense over the terms of the related debt agreements, under the effective interest method.
Intangible assets on our consolidated balance sheets represent identifiable intangible assets acquired in business acquisitions. We amortize identified intangible assets to expense over their estimated lives using the straight-line method. We evaluate intangible assets for impairment as events and circumstances change, in
88
Table of Contents
accordance with FASB ASC Topic 360, “Property, Plant, and Equipment.” Due to market and economic conditions during 2008, management evaluated the carrying value of our intangible assets. Based upon that evaluation, management concluded certain intangible assets were impaired and recorded asset impairment expense of $29,059 during the year ended December 31, 2008. This charge was included in asset impairment expense in the accompanying consolidated statements of operations. We expect to record amortization expense of intangible assets of $560 each fiscal year for the period from 2011 through 2015 and $389 thereafter.
Goodwill on our consolidated balance sheet represented the amounts paid in excess of the fair value of the net assets acquired from business acquisitions accounted for under FASB ASC Topic 805, “Business Combinations.” Pursuant to FASB ASC Topic 350, “Intangibles-Goodwill and Other”, goodwill is not amortized to expense but rather is analyzed for impairment. We evaluate goodwill for impairment on an annual basis and as events and circumstances change, in accordance with FASB ASC Topic 350.
q. Recent Accounting Pronouncements
On January 1, 2010, we adopted accounting standards classified under FASB ASC Topic 860, “Transfers and Servicing,” and accounting standards classified under FASB ASC Topic 810, “Consolidation”. The accounting standard classified under FASB Topic 860 eliminates the concept of a qualifying special purpose entity, changes the requirements for derecognizing financial assets, and requires additional disclosures about transfers of financial assets, including securitization transactions and continuing involvement with transferred financial assets. The accounting standard classified under FASB Topic 810 changes the determination of when a VIE should be consolidated. Under this standard, the determination of whether to consolidate a VIE is based on the power to direct the activities of the VIE that most significantly impact the VIE’s economic performance together with either the obligation to absorb losses or the right to receive benefits that could be significant to the VIE, as well as the VIE’s purpose and design. The adoption of these standards did not have a material effect on our consolidated financial statements. See Note 9 for additional disclosures pertaining to VIEs.
On January 1, 2010, we adopted Accounting Standards Update (ASU) No. 2010-06, “Fair Value Measurements and Disclosures (Topic 820): Improving Disclosures about Fair Value Measurements.” This accounting standard requires new disclosures for significant transfers in and out of Level 1 and 2 fair value measurements and requires a description of the reasons for the transfer. This accounting standard also updates existing disclosures by providing fair value measurement disclosures for each class of assets and liabilities and provides disclosures about the valuation techniques and inputs used to measure fair value for both recurring and nonrecurring fair value measurements. For Level 3 fair value measurements, new disclosures will require entities to present information separately for purchases, sales, issuances, and settlements; however, these disclosures are effective for fiscal years beginning after December 15, 2010, and for interim periods within those fiscal years. The adoption of this standard did not have a material effect on our consolidated financial statements and management is currently evaluating the impact the new Level 3 fair value measurement disclosures may have on our consolidated financial statements.
In July 2010, the FASB issued ASU No. 2010-20, “Receivables (Topic 310): Disclosures about the Credit Quality of Financing Receivables and the Allowance for Credit Losses.” This accounting standard update is to provide additional information to assist financial statement users in assessing an entity’s credit risk exposures and evaluating the adequacy of its allowance for credit losses. Existing disclosure guidance is amended to require an entity to provide a greater level of disaggregated information about the credit quality of its financing receivables and its allowance for credit losses and to disclose credit quality indicators, past due information, and modifications of its financing receivables. The disclosures as of the end of a reporting period are effective for interim and annual reporting periods ending on or after December 15, 2010. The disclosures about activity that occurs during a reporting period are effective for interim and annual reporting periods beginning on or after December 15, 2010. The adoption of this standard did not have a material effect on our consolidated financial statements.
89
Table of Contents
NOTE 3: INVESTMENTS IN LOANS
Our investments in mortgages and loans are accounted for at amortized cost.
Investments in Commercial Mortgages, Mezzanine Loans, Other Loans and Preferred Equity Interests
The following table summarizes our investments in commercial mortgages, mezzanine loans, other loans and preferred equity interests as of December 31, 2010:
| Unpaid Principal Balance |
Unamortized (Discounts) Premiums |
Carrying Amount |
Number of Loans |
Weighted- Average Coupon (1) |
Range of Maturity Dates | |||||||||||||||||||
| Commercial Real Estate (CRE) Loans |
||||||||||||||||||||||||
| Commercial mortgages |
$ | 710,059 | $ | (1,827 | ) | $ | 708,232 | 43 | 6.7 | % | Mar. 2011 to Dec. 2020 | |||||||||||||
| Mezzanine loans |
381,218 | (5,881 | ) | 375,337 | 109 | 9.5 | % | Mar. 2011 to Nov. 2038 | ||||||||||||||||
| Preferred equity interests |
81,864 | (1,183 | ) | 80,681 | 22 | 9.8 | % | Nov. 2011 to Aug. 2025 | ||||||||||||||||
| Total CRE Loans |
1,173,141 | (8,891 | ) | 1,164,250 | 174 | 7.8 | % | |||||||||||||||||
| Other loans |
57,420 | (997 | ) | 56,423 | 5 | 6.3 | % | Mar. 2011 to Oct. 2016 | ||||||||||||||||
| Total Loans |
$ | 1,230,561 | $ | (9,888 | ) | $ | 1,220,673 | 179 | 7.7 | % | ||||||||||||||
| Deferred fees |
(1,563 | ) | — | (1,563 | ) | |||||||||||||||||||
| Total investments in loans |
$ | 1,228,998 | $ | (9,888 | ) | $ | 1,219,110 | |||||||||||||||||
| (1) | Weighted-average coupon is calculated on the unpaid principal amount of the underlying instruments which does not necessarily correspond to the carrying amount. |
The following table summarizes our investments in commercial mortgages, mezzanine loans, other loans and preferred equity interests as of December 31, 2009:
| Unpaid Principal Balance |
Unamortized (Discounts) Premiums |
Carrying Amount |
Number of Loans |
Weighted- Average Coupon (1) |
Range of Maturity Dates | |||||||||||||||||||
| Commercial Real Estate (CRE) Loans |
||||||||||||||||||||||||
| Commercial mortgages |
$ | 825,044 | $ | — | $ | 825,044 | 55 | 6.9 | % | Mar. 2010 to Mar. 2016 | ||||||||||||||
| Mezzanine loans |
424,183 | (2,378 | ) | 421,805 | 129 | 9.8 | % | Mar. 2010 to Nov. 2038 | ||||||||||||||||
| Preferred equity interests |
98,584 | — | 98,584 | 25 | 10.9 | % | May 2010 to Sept. 2021 | |||||||||||||||||
| Total CRE Loans |
1,347,811 | (2,378 | ) | 1,345,433 | 209 | 8.1 | % | |||||||||||||||||
| Other loans |
125,889 | (2,000 | ) | 123,889 | 9 | 5.2 | % | Mar. 2010 to Oct. 2016 | ||||||||||||||||
| Total Loans |
1,473,700 | (4,378 | ) | 1,469,322 | 218 | 7.9 | % | |||||||||||||||||
| Deferred fees |
(1,756 | ) | — | (1,756 | ) | |||||||||||||||||||
| Total investments in loans |
$ | 1,471,944 | $ | (4,378 | ) | $ | 1,467,566 | |||||||||||||||||
90
Table of Contents
| (1) | Weighted-average coupon is calculated on the unpaid principal amount of the underlying instruments which does not necessarily correspond to the carrying amount. |
During the years ended December 31, 2010 and 2009, we completed the conversion of nine and 27 commercial real estate loans with a carrying value of $141,235 and $515,517 to owned properties. During the years ended December 31, 2010 and 2009, we charged off $18,148 and $98,766, respectively, related to the conversion of commercial real estate loans to owned properties. See Note 5.
The following table summarizes the delinquency statistics of our commercial mortgages, mezzanine loans, other loans and preferred equity interests as of December 31, 2010 and 2009:
| Delinquency Status |
As of December 31, 2010 |
As of December 31, 2009 |
||||||
| 30 to 59 days |
$ | 27,978 | $ | 20,760 | ||||
| 60 to 89 days |
— | 82,685 | ||||||
| 90 days or more |
55,450 | 44,310 | ||||||
| In foreclosure or bankruptcy proceedings |
46,578 | 47,625 | ||||||
| Total |
$ | 130,006 | $ | 195,380 | ||||
As of December 31, 2010 and 2009, approximately $122,306 and $171,372, respectively, of our commercial mortgages and mezzanine loans were on non-accrual status and had a weighted-average interest rate of 8.8% and 9.7%, respectively. As of December 31, 2010, approximately $20,908 of other loans were on non-accrual status and had a weighted-average interest rate of 7.2%. There were no other loans on non-accrual status as of December 31, 2009.
The following table sets forth the maturities of our investments in commercial mortgages, mezzanine loans, other loans and preferred equity interests by year:
| 2011 |
$ | 685,317 | ||
| 2012 |
49,770 | |||
| 2013 |
35,580 | |||
| 2014 |
37,271 | |||
| 2015 |
134,406 | |||
| Thereafter |
288,217 | |||
| Total |
$ | 1,230,561 | ||
91
Table of Contents
Allowance For Losses And Impaired Loans
The following table provides a roll-forward of our allowance for losses for the years ended December 31, 2010, 2009 and 2008:
| For the Year Ended December 31, 2010 |
For the Year Ended December 31, 2009 |
For the Year Ended December 31, 2008 |
||||||||||||||||||||||||||||||||||
| Type of Derivative |
Commercial Mortgages, Mezzanine Loans and Other Loans |
Residential Mortgages and Mortgage- Related Receivables |
Total | Commercial Mortgages, Mezzanine Loans and Other Loans |
Residential Mortgages and Mortgage- Related Receivables |
Total | Commercial Mortgages, Mezzanine Loans and Other Loans |
Residential Mortgages and Mortgage- Related Receivables |
Total | |||||||||||||||||||||||||||
| Beginning balance |
$ | 86,609 | $ | — | $ | 86,609 | $ | 117,737 | $ | 54,236 | $ | 171,973 | $ | 14,575 | $ | 11,814 | $ | 26,389 | ||||||||||||||||||
| Provision |
38,307 | — | 38,307 | 130,080 | 96,487 | 226,567 | 107,360 | 55,423 | 162,783 | |||||||||||||||||||||||||||
| Charge-offs, net of recoveries |
(55,225 | ) | — | (55,225 | ) | (161,208 | ) | (23,066 | ) | (184,274 | ) | (4,198 | ) | (13,001 | ) | (17,199 | ) | |||||||||||||||||||
| Sale of residential mortgages and mortgage-related receivables |
— | — | — | — | (127,657 | ) | (127,657 | ) | — | — | — | |||||||||||||||||||||||||
| Ending balance |
$ | 69,691 | $ | — | $ | 69,691 | $ | 86,609 | $ | — | $ | 86,609 | $ | 117,737 | $ | 54,236 | $ | 171,973 | ||||||||||||||||||
As of December 31, 2010 and 2009, we identified 27 and 31, respectively, commercial mortgages, mezzanine loans and other loans with unpaid principal balances of $157,746 and $189,961, respectively, as impaired.
The average unpaid principal balance of total impaired loans was $176,484 and $207,042 during the year ended December 31, 2010 and 2009, respectively. We recorded interest income from impaired loans of $3,383, $3,203, and $7,895 for the years ended December 31, 2010, 2009 and 2008, respectively.
Asset Impairments
For the year ended December 31, 2008, we recorded asset impairments of $8,509 associated with certain investments in commercial and residential loans. In making this determination, management considered the estimated fair value of the investments to our cost basis, the financial condition of the related entity and our intent and ability to hold the investments for a sufficient period of time to recover our investments. For the identified investments, management believes full recovery is not likely and wrote down the investments to their estimated fair value.
92
Table of Contents
NOTE 4: INVESTMENTS IN SECURITIES
Our investments in securities and security-related receivables are accounted for at fair value. During 2009, we sold our residual interests in four CDOs and deconsolidated $1,141,400 of investments in securities. The following table summarizes our investments in securities as of December 31, 2010:
| Investment Description |
Amortized Cost |
Net Fair Value Adjustments |
Estimated Fair Value |
Weighted Average Coupon (1) |
Weighted Average Years to Maturity |
|||||||||||||||
| Trading securities |
||||||||||||||||||||
| TruPS |
$ | 695,501 | $ | (241,028 | ) | $ | 454,473 | 5.1 | % | 23.8 | ||||||||||
| Other securities |
10,000 | (10,000 | ) | — | 4.8 | % | 41.9 | |||||||||||||
| Total trading securities |
705,501 | (251,028 | ) | 454,473 | 5.1 | % | 24.0 | |||||||||||||
| Available-for-sale securities |
3,600 | (3,598 | ) | 2 | 2.1 | % | 31.9 | |||||||||||||
| Security-related receivables |
||||||||||||||||||||
| TruPS receivables |
111,199 | (28,112 | ) | 83,087 | 6.9 | % | 12.0 | |||||||||||||
| Unsecured REIT note receivables |
61,000 | 1,490 | 62,490 | 6.6 | % | 6.7 | ||||||||||||||
| CMBS receivables (2) |
158,868 | (81,726 | ) | 77,142 | 5.7 | % | 33.0 | |||||||||||||
| Other securities |
105,477 | (77,220 | ) | 28,257 | 2.8 | % | 30.9 | |||||||||||||
| Total security-related receivables |
436,544 | (185,568 | ) | 250,976 | 5.4 | % | 23.5 | |||||||||||||
| Total investments in securities |
$ | 1,145,645 | $ | (440,194 | ) | $ | 705,451 | 5.1 | % | 23.9 | ||||||||||
| (1) | Weighted-average coupon is calculated on the unpaid principal amount of the underlying instruments which does not necessarily correspond to the carrying amount. |
| (2) | CMBS receivables include securities with a fair value totaling $30,066 that are rated between “AAA” and “A-” by Standard & Poor’s, securities with a fair value totaling $40,086 that are rated “BBB+” and “B-” by Standard & Poor’s, securities with a fair value totaling $6,805 that are rated “CCC” by Standard & Poor’s and securities with a fair value totaling $185 that are rated “D” by Standard & Poor’s. |
A substantial portion of our gross unrealized losses is greater than 12 months.
The following table summarizes our investments in securities as of December 31, 2009:
| Investment Description |
Amortized Cost |
Net Fair Value Adjustments |
Estimated Fair Value |
Weighted Average Coupon (1) |
Weighted Average Years to Maturity |
|||||||||||||||
| Trading securities |
||||||||||||||||||||
| TruPS and subordinated debentures |
$ | 900,145 | $ | (429,039 | ) | $ | 471,106 | 4.5 | % | 24.7 | ||||||||||
| Other securities |
10,000 | (9,700 | ) | 300 | 4.8 | % | 42.9 | |||||||||||||
| Total trading securities |
910,145 | (438,739 | ) | 471,406 | 4.5 | % | 24.9 | |||||||||||||
| Available-for-sale securities |
3,600 | (3,510 | ) | 90 | 2.4 | % | 32.9 | |||||||||||||
| Security-related receivables |
||||||||||||||||||||
| TruPS and subordinated debenture receivables |
113,918 | (40,269 | ) | 73,649 | 6.8 | % | 12.6 | |||||||||||||
| Unsecured REIT note receivables |
68,049 | (2,656 | ) | 65,393 | 6.6 | % | 7.8 | |||||||||||||
| CMBS receivables (2) |
158,368 | (99,474 | ) | 58,894 | 6.0 | % | 34.3 | |||||||||||||
| Other securities |
93,419 | (67,954 | ) | 25,465 | 3.2 | % | 30.1 | |||||||||||||
| Total security-related receivables |
433,754 | (210,353 | ) | 223,401 | 5.7 | % | 23.4 | |||||||||||||
| Total investments in securities |
$ | 1,347,499 | $ | (652,602 | ) | $ | 694,897 | 4.9 | % | 24.5 | ||||||||||
93
Table of Contents
| (1) | Weighted-average coupon is calculated on the unpaid principal amount of the underlying instruments which does not necessarily correspond to the carrying amount. |
| (2) | CMBS receivables include securities with a fair value totaling $7,179 that are rated “BBB+” and “BB-” by Standard & Poor’s and securities with a fair value totaling $51,715 that are rated between “AAA” and “A-” by Standard & Poor’s. |
A substantial portion of our gross unrealized losses are greater than 12 months.
TruPS included above as trading securities include (a) investments in TruPS issued by VIEs of which we are not the primary beneficiary and which we do not consolidate and (b) transfers of investments in TruPS securities to us that were accounted for as a sale pursuant to FASB ASC Topic 860, “Transfers and Servicing.”
The following table summarizes the non-accrual status of our investments in securities:
| As of December 31, 2010 | As of December 31, 2009 | |||||||||||||||||||||||
| Principal /Par Amount on Non-accrual |
Weighted Average Coupon |
Fair Value | Principal /Par Amount on Non-accrual |
Weighted Average Coupon |
Fair Value | |||||||||||||||||||
| TruPS and TruPS receivables |
$ | 133,682 | 4.1 | % | $ | 5,581 | $ | 108,125 | 4.9 | % | $ | 26,400 | ||||||||||||
| Other securities |
42,754 | 2.8 | % | 976 | 24,500 | 3.1 | % | 370 | ||||||||||||||||
| CMBS receivables |
29,204 | 5.9 | % | 975 | — | — | — | |||||||||||||||||
The assets of our consolidated CDOs collateralize the debt of such entities and are not available to our creditors. As of December 31, 2010 and December 31, 2009, investment in securities of $806,700 and $888,681, respectively, in principal amount of TruPS and subordinated debentures, and $219,868 and $230,768, respectively, in principal amount of unsecured REIT note receivables and CMBS receivables, collateralized the consolidated CDO notes payable of such entities.
Asset Impairments
Management evaluates investments in securities for impairment as events and circumstances warrant and concluded that certain of these securities were other than temporarily impaired as management does not expect full recovery of our investment. Asset impairment expense of $46,015 and $28,234 was recorded for the years ended December 31, 2009 and 2008, respectively, related to available-for-sale securities and was included in asset impairments in our consolidated statements of operations. This impairment reduced the amortized cost basis of these available-for-sale securities.
NOTE 5: INVESTMENTS IN REAL ESTATE
The table below summarizes our investments in real estate:
| As of December 31, 2010 | As of December 31, 2009 | |||||||||||||||
| Book Value | Number of Properties |
Book Value | Number of Properties |
|||||||||||||
| Multi-family real estate properties |
$ | 602,183 | 33 | $ | 508,942 | 27 | ||||||||||
| Office real estate properties |
219,567 | 9 | 190,874 | 7 | ||||||||||||
| Retail real estate properties |
41,838 | 2 | 40,584 | 2 | ||||||||||||
| Parcels of land |
22,208 | 3 | 22,208 | 3 | ||||||||||||
| Subtotal |
885,796 | 47 | 762,608 | 39 | ||||||||||||
| Plus: Escrows and reserves |
2,296 | 1,175 | ||||||||||||||
| Less: Accumulated depreciation and amortization |
(46,604 | ) | (25,548 | ) | ||||||||||||
| Investments in real estate |
$ | 841,488 | $ | 738,235 | ||||||||||||
94
Table of Contents
As of December 31, 2010 and 2009, our investments in real estate were comprised of land of $179,280 and $159,317, respectively, and buildings and improvements of $706,516 and $603,291, respectively.
As of December 31, 2010, our investments in real estate of $841,488 are financed through $74,876 of mortgages held by third parties and $782,087 of mortgages held by our RAIT I and RAIT II CDO securitizations. Together, along with commercial real estate loans held by RAIT I and RAIT II, these mortgages serve as collateral for the CDO notes payable issued by the RAIT I and RAIT II CDO securitizations. All intercompany balances and interest charges are eliminated in consolidation.
Assets Held for Sale:
As of December 31, 2010, we have identified one property as asset held for sale. The carrying amount of this asset is $51,913 and liabilities related to this asset are $1,738. These amounts are included in the investments in real estate and indebtedness, accounts payable and accrued expenses, and deferred taxes, borrowers’ escrows and other liabilities financial statement captions. Liabilities related to assets held for sale exclude $42,958 of a first mortgage held by RAIT II that is eliminated in our consolidated balance sheet. See Note 15—Assets Held For Sale and Discontinued Operations.
Acquisitions:
During the year ended December 31, 2010, we converted nine loans with a carrying value of $141,235, relating to 10 multi-family properties and one office property, to owned real estate. Upon conversion, we recorded the 11 properties at fair value of $123,087. We previously held bridge or mezzanine loans with respect to these real estate properties.
As of January 1, 2010, we adopted an accounting standard which changed the determination of the consolidation of VIEs. Accordingly, we consolidated two office properties as of January 1, 2010 as we were determined to be the primary beneficiary of the VIEs. The fair value of the properties consolidated, net of their related liabilities at fair value, was $5,005 as of January 1, 2010.
The following table summarizes the aggregate estimated fair value of the assets and liabilities associated with the 13 properties acquired during the year ended December 31, 2010, on the respective date of each conversion, for the real estate accounted for under FASB ASC Topic 805.
| Description |
Estimated Fair Value |
|||
| Assets acquired: |
||||
| Investments in real estate |
$ | 144,990 | ||
| Cash and cash equivalents |
820 | |||
| Restricted cash |
2,019 | |||
| Other assets |
4,258 | |||
| Total assets acquired |
152,087 | |||
| Liabilities assumed: |
||||
| Loans payable on real estate |
16,714 | |||
| Accounts payable and accrued expenses |
4,800 | |||
| Other liabilities |
2,112 | |||
| Total liabilities assumed |
23,626 | |||
| Estimated fair value of net assets acquired |
$ | 128,461 | ||
95
Table of Contents
The following table summarizes the consideration transferred to acquire the real estate properties and the amounts of identified assets acquired and liabilities assumed at the respective conversion date:
| Description |
Estimated Fair Value |
|||
| Fair value of consideration transferred: |
||||
| Commercial real estate loans |
$ | 129,067 | ||
| Other considerations |
(606 | ) | ||
| Total fair value of consideration transferred |
$ | 128,461 | ||
During the year ended December 31, 2010, these investments contributed revenue of $10,522 and a net loss allocable to common shares of $520. During the year ended December 31, 2010, we did not incur any third-party acquisition-related costs.
Our consolidated unaudited pro forma information, after including the acquisition of real estate properties, is presented below as if the acquisitions occurred on January 1, 2009 and 2010, respectively. These pro forma results are not necessarily indicative of the results which actually would have occurred if the acquisition had occurred on the first day of the periods presented, nor does the pro forma financial information purport to represent the results of operations for future periods:
| Description |
For the Year Ended December 31, 2010 |
For the Year Ended December 31, 2009 |
||||||
| Total revenue, as reported |
$ | 153,428 | $ | 197,510 | ||||
| Pro forma revenue |
159,753 | 211,444 | ||||||
| Net income (loss) allocable to common shares, as reported |
98,152 | (441,203 | ) | |||||
| Pro forma net income (loss) allocable to common shares |
98,135 | (440,087 | ) | |||||
These amounts have been calculated after adjusting the results of the acquired businesses to reflect the additional depreciation that would have been charged assuming the fair value adjustments to our investments in real estate had been applied from January 1, 2009 and 2010, respectively, together with the consequential tax effects.
We have not yet completed the process of estimating the fair value of assets acquired and liabilities assumed. Accordingly, our preliminary estimates and the allocation of the purchase price to the assets acquired and liabilities assumed may change as we complete the process. In accordance with FASB ASC Topic 805, changes, if any, to the preliminary estimates and allocation will be reported in our financial statements retrospectively.
Dispositions:
During the year ended December 31, 2010, we disposed of four multi-family properties with a fair value of $20,080 and we deconsolidated one office property with a fair value of $13,588. As a result of these transactions, we recorded losses on sale of assets of $1,682.
NOTE 6: INDEBTEDNESS
We maintain various forms of long-term financing arrangements. Generally, these financing agreements are collateralized by assets within CDOs or mortgage securitizations.
96
Table of Contents
The following table summarizes our total recourse and non-recourse indebtedness as of December 31, 2010:
| Description |
Unpaid Principal Balance |
Carrying Amount |
Weighted- Average Interest Rate |
Contractual Maturity | ||||||||||
| Recourse indebtedness: |
||||||||||||||
| Convertible senior notes (1) |
$ | 143,613 | $ | 143,474 | 6.9 | % | Apr. 2027 | |||||||
| Secured credit facilities |
36,489 | 36,489 | 4.7 | % | Oct. 2011 to Dec. 2011 | |||||||||
| Senior secured notes |
63,950 | 63,950 | 11.7 | % | Apr. 2014 | |||||||||
| Loans payable on real estate |
19,922 | 19,922 | 5.5 | % | Apr. 2012 to Sept. 2013 | |||||||||
| Junior subordinated notes, at fair value (2) |
38,052 | 4,422 | 5.2 | % | Oct. 2015 to Mar. 2035 | |||||||||
| Junior subordinated notes, at amortized cost |
25,100 | 25,100 | 7.7 | % | Apr. 2037 | |||||||||
| Total recourse indebtedness |
327,126 | 293,357 | 7.4 | % | ||||||||||
| Non-recourse indebtedness: |
||||||||||||||
| CDO notes payable, at amortized cost (3)(4) |
1,341,750 | 1,341,750 | 0.7 | % | 2045 to 2046 | |||||||||
| CDO notes payable, at fair value (2)(3)(5) |
1,147,112 | 148,072 | 0.9 | % | 2037 to 2038 | |||||||||
| Loans payable on real estate |
54,998 | 54,998 | 6.0 | % | Mar. 2011 to Aug. 2016 | |||||||||
| Total non-recourse indebtedness |
2,543,860 | 1,544,820 | 0.9 | % | ||||||||||
| Total indebtedness |
$ | 2,870,986 | $ | 1,838,177 | 1.6 | % | ||||||||
| (1) | Our convertible senior notes are redeemable, at par at the option of the holder, in April 2012, April 2017, and April 2022. |
| (2) | Relates to liabilities which we elected to record at fair value under FASB ASC Topic 825. |
| (3) | Excludes CDO notes payable purchased by us which are eliminated in consolidation. |
| (4) | Collateralized by $1,771,643 principal amount of commercial mortgages, mezzanine loans, other loans and preferred equity interests. These obligations were issued by separate legal entities and consequently the assets of the special purpose entities that collateralize these obligations are not available to our creditors. |
| (5) | Collateralized by $1,327,464 principal amount of investments in securities and security-related receivables and loans, before fair value adjustments. The fair value of these investments as of December 31, 2010 was $870,889. These obligations were issued by separate legal entities and consequently the assets of the special purpose entities that collateralize these obligations are not available to our creditors. |
97
Table of Contents
The following table summarizes our total recourse and non-recourse indebtedness as of December 31, 2009:
| Description |
Unpaid Principal Balance |
Carrying Amount |
Weighted- Average Interest Rate |
Contractual Maturity | ||||||||||||
| Recourse indebtedness: |
||||||||||||||||
| Convertible senior notes (1) |
$ | 246,363 | $ | 245,885 | 6.9 | % | Apr. 2027 | |||||||||
| Secured credit facilities |
49,994 | 49,994 | 4.8 | % | Dec. 2009 to Apr. 2011 | |||||||||||
| Senior secured notes |
43,000 | 43,000 | 12.5 | % | Apr. 2014 | |||||||||||
| Loans payable on real estate |
17,500 | 17,500 | 4.8 | % | Apr. 2010 | |||||||||||
| Junior subordinated notes, at fair value (2) |
38,052 | 17,004 | 8.7 | % | Mar. 2015 to Mar. 2035 | |||||||||||
| Junior subordinated notes, at amortized cost |
25,100 | 25,100 | 7.7 | % | Apr. 2037 | |||||||||||
| Total recourse indebtedness |
420,009 | 398,483 | 7.3 | % | ||||||||||||
| Non-recourse indebtedness: |
||||||||||||||||
| CDO notes payable, at amortized cost (3)(4) |
1,396,750 | 1,396,750 | 0.7 | % | 2036 to 2045 | |||||||||||
| CDO notes payable, at fair value (2)(3)(5) |
1,185,061 | 146,557 | 0.9 | % | 2035 to 2038 | |||||||||||
| Loans payable on real estate |
64,461 | 64,461 | 5.6 | % | Aug. 2010 to Aug. 2016 | |||||||||||
| Trust preferred obligations, at fair value (2) |
132,375 | 70,872 | 1.9 | % | 2036 | |||||||||||
| Total non-recourse indebtedness |
2,778,647 | 1,678,640 | 0.9 | % | ||||||||||||
| Total indebtedness |
$ | 3,198,656 | $ | 2,077,123 | 1.8 | % | ||||||||||
| (1) | Our convertible senior notes are redeemable, at par at the option of the holder, in April 2012, April 2017, and April 2022. |
| (2) | Relates to liabilities which we elected to record at fair value under FASB ASC Topic 825. |
| (3) | Excludes CDO notes payable purchased by us which are eliminated in consolidation. |
| (4) | Collateralized by $1,787,563 principal amount of commercial mortgages, mezzanine loans, other loans and preferred equity interests. These obligations were issued by separate legal entities and consequently the assets of the special purpose entities that collateralize these obligations are not available to our creditors. |
| (5) | Collateralized by $1,444,033 principal amount of investments in securities and security-related receivables and loans, before fair value adjustments. The fair value of these investments as of December 31, 2009 was $827,417. These obligations were issued by separate legal entities and consequently the assets of the special purpose entities that collateralize these obligations are not available to our creditors. |
Recourse indebtedness refers to indebtedness that is recourse to our general assets, including the loans payable on real estate that are guaranteed by RAIT or RAIT Partnership. As indicated in the table above, our consolidated financial statements include recourse indebtedness of $293,357 as of December 31, 2010. Non-recourse indebtedness consists of indebtedness of consolidated VIEs (i.e. CDOs and other securitization vehicles) and the loans payable on real estate which are with recourse only to specific assets pledged as collateral to the lenders. The creditors of each consolidated VIE have no recourse to our general credit.
The current status or activity in our financing arrangements occurring as of or during the year ended December 31, 2010 is as follows:
Recourse Indebtedness
Convertible senior notes. On April 18, 2007, we issued and sold in a private offering to qualified institutional buyers, $425,000 aggregate principal amount of 6.875% convertible senior notes due 2027, or the
98
Table of Contents
convertible senior notes. After deducting the initial purchaser’s discount and the estimated offering expenses, we received approximately $414,250 of net proceeds. Interest on the convertible senior notes is paid semi-annually and the convertible senior notes mature on April 15, 2027.
Prior to April 20, 2012, the convertible senior notes are not redeemable at RAIT’s option, except to preserve RAIT’s status as a REIT. On or after April 20, 2012, RAIT may redeem all or a portion of the convertible senior notes at a redemption price equal to the principal amount plus accrued and unpaid interest (including additional interest), if any. Convertible senior note holders may require RAIT to repurchase all or a portion of the convertible senior notes at a purchase price equal to the principal amount plus accrued and unpaid interest (including additional interest), if any, on the convertible senior notes on April 15, 2012, April 15, 2017, and April 15, 2022, or upon the occurrence of certain change in control transactions prior to April 20, 2012.
Our convertible senior notes are redeemable, at the option of the holder, in April 2012. We expect to acquire, redeem, restructure, refinance or otherwise enter into transactions to satisfy our convertible senior notes which may include any combination of material payments of cash, issuances of our debt and/or equity securities, sales or exchanges of our assets or other methods.
Prior to April 15, 2026, upon the occurrence of specified events, the convertible senior notes will be convertible at the option of the holder at an initial conversion rate of 28.6874 shares per $1,000 principal amount of convertible senior notes. The initial conversion price of $34.86 represents a 27.5% premium to the per share closing price of $27.34 on the date the offering was priced. Upon conversion of convertible senior notes by a holder, the holder will receive cash up to the principal amount of such convertible senior notes and, with respect to the remainder, if any, of the conversion value in excess of such principal amount, at the option of RAIT in cash or RAIT’s common shares. The initial conversion rate is subject to adjustment in certain circumstances. We include the convertible senior notes in earnings per share using the treasury stock method if the conversion value in excess of the par amount is considered in the money during the respective periods.
On January 1, 2009, we adopted accounting standards classified under FASB ASC Topic 470, “Debt”. Upon adoption, we recorded a retrospective discount on our issued and outstanding convertible senior notes of $1,996. This discount reflects the fair value of the embedded conversion option within the convertible debt instruments and was recorded as an increase to additional paid in capital. The fair value was calculated by discounting the cash flows required in the indenture relating to the convertible senior notes agreement by a discount rate that represents management’s estimate of our senior, unsecured, non-convertible debt borrowing rate at the time when the convertible senior notes were issued. The discount will be amortized to interest expense through April 15, 2012, the date at which holders of our convertible senior notes could require repayment. Upon adoption, all prior periods were restated to reflect the retroactive adoption of the standard and total discount amortization recorded through December 31, 2008 was $607.
During the year ended December 31, 2010, we repurchased from the market, a total of $102,750 in aggregate principal amount of convertible notes for a total consideration of $72,637. The purchase price consisted of $12,357 in cash, the issuance of 18,915,000 common shares, and the issuance of a $22,000 senior secured note. See “Senior Secured Notes” below. As a result of these transactions, we recorded gains on extinguishment of debt of $29,974, net of deferred financing costs and unamortized discounts that were written off.
During the year ended December 31, 2009, we repurchased from the market, a total of $103,805 in aggregate principal amount of convertible notes for a total consideration of $54,519, including the issuance of a $43,000 senior secured note. See “Senior Secured Notes” below. During 2009, we also exchanged $34,000 in aggregate principal amount of convertible notes for 8,126,000 common shares and $3,111 of cash, for total consideration of $13,999 based on our closing stock price of $1.34 per share on December 29, 2009, the date our exchange offer was completed. See “Exchange Offer” below. As a result of these transactions, we recorded gains on extinguishment of debt of $64,898, net of deferred financing costs and unamortized discounts that were written off.
99
Table of Contents
Secured credit facilities. As of December 31, 2010, we have borrowed an aggregate amount of $36,489 under two secured credit facilities, each with a different bank. All of our secured credit facilities are secured by designated commercial mortgages and mezzanine loans. As of December 31, 2010, the first secured credit facility had an unpaid principal balance of $20,329 which is payable in December 2011 under the current terms of this facility. As of December 31, 2010, the second secured credit facility had an unpaid principal balance of $16,160 which is payable in October 2011 under the current terms of this facility.
Senior secured notes. On March 25, 2010, pursuant to a securities exchange agreement, we acquired from a noteholder $47,000 aggregate principal amount of our convertible senior notes for a total consideration of $31,240. The purchase price consisted of (a) our issuance of a $22,000 senior secured convertible note, (b) our issuance of 1,500,000 common shares, and (c) our payment of $6,000 in cash. The senior secured convertible note is convertible into our common shares at the option of the holder. The conversion price is $3.50 per common share and the senior secured convertible note may be converted at any time during its term. We also paid $1,427 of accrued and unpaid interest on the convertible senior notes through March 25, 2010. The holder of the senior secured convertible note converted $1,050 principal amount of the senior secured convertible note into 300,000 common shares effective May 5, 2010.
The senior secured convertible note bears interest at a rate of 10.0% per year. Interest accrues from March 25, 2010 and will be payable quarterly in arrears on January 15, April 15, July 15 and October 15 of each year, beginning July 15, 2010. The senior secured convertible note matures on April 20, 2014 unless previously prepaid in accordance with its terms prior to such date. The senior secured convertible note is fully and unconditionally guaranteed by two wholly-owned subsidiaries of RAIT, or the guarantors: RAIT Asset Holdings III Member, LLC, or RAHM3, and RAIT Asset Holdings III, LLC, or RAH3. RAHM3 is the sole member of RAH3 and has pledged the equity of RAH3 to secure its guarantee. RAH3’s assets consist of certain CDO notes payable issued by RAIT’s consolidated securitization, RAIT Preferred Funding II, LTD.
On July 31, 2009, pursuant to a securities purchase agreement, we purchased from a note holder $98,280 aggregate principal amount of our 6.875% Convertible Senior Notes due 2027, or the convertible senior notes, for a purchase price of $53,000. The purchase price consisted of (a) $43,000 12.5% senior secured note due 2014 issued by us, or the senior secured note, and (b) $10,000 in cash. We also paid to the note holder $1,989 of accrued and unpaid interest on the convertible senior notes through July 31, 2009.
The senior secured note bears interest at a rate of 12.5% per year and is payable quarterly in arrears on January 15, April 15, July 15 and October 15 of each year. The senior secured note matures on April 20, 2014 unless previously prepaid in accordance with its terms prior to such date. The senior secured note is fully and unconditionally guaranteed by two of our wholly owned subsidiaries, or the guarantors: RAIT Asset Holdings II Member, LLC, or RAHM, and RAIT Asset Holdings II, LLC, or RAH2. RAHM is the sole member of RAH2 and has pledged the equity of RAH2 to secure its guarantee. RAH2’s assets consist of $100,000 in par amount of certain CDO notes payable issued by RAIT’s consolidated securitizations RAIT I, RAIT II, Taberna VIII and Taberna IX. The senior secured note is not convertible into equity securities of RAIT.
Junior subordinated notes, at fair value. On October 16, 2008, we issued $38,052 principal amount of junior subordinated notes to a third party and received $15,459 of net cash proceeds. Of the total amount of junior subordinated notes issued, $18,671 has a fixed interest rate of 8.65% through March 30, 2015 with a floating rate of LIBOR plus 400 basis points thereafter and a maturity date of March 30, 2035. The remaining $19,380 has a fixed interest rate of 9.64% and a maturity date of October 30, 2015. At issuance, we elected to record these junior subordinated notes at fair value under FASB ASC Topic 825, with all subsequent changes in fair value recorded in earnings.
On October 25, 2010, pursuant to a securities exchange agreement, we exchanged $18,671 in aggregate principal amount of the junior subordinated notes with an interest rate of 8.7% for $18,671 of junior subordinated notes with a reduced interest rate and provided $5,000 of our convertible senior notes as collateral for the new
100
Table of Contents
junior subordinated notes. The new junior subordinated notes have a fixed rate of interest of 0.5% through March 30, 2015, thereafter with a floating rate of three-month LIBOR plus 400 basis points, with such floating rate not to exceed 7.0%. The maturity date remains the same at March 30, 2035. At issuance, we elected to record these junior subordinated notes at fair value under FASB ASC Topic 825, with all subsequent changes in fair value recorded in earnings.
As of December 31, 2010, we have $38,052 unpaid principal associated with these junior subordinated notes. The fair value, or carrying amount, of this indebtedness was $4,422 as of December 31, 2010.
Junior subordinated notes, at amortized cost. On February 12, 2007, we formed Taberna Funding Capital Trust I which issued $25,000 of trust preferred securities to investors and $100 of common securities to us. The combined proceeds were used by Taberna Funding Capital Trust I to purchase $25,100 of junior subordinated notes issued by us. The junior subordinated notes are the sole assets of Taberna Funding Capital Trust I and mature on April 30, 2037, but are callable, at our option, on or after April 30, 2012. Interest on the junior subordinated notes is payable quarterly at a fixed rate of 7.69% through April 2012 and thereafter at a floating rate equal to three-month LIBOR plus 2.50%.
Non-Recourse Indebtedness
CDO notes payable, at amortized cost. CDO notes payable at amortized cost represent notes issued by CDO entities which were used to finance the acquisition of unsecured REIT notes, CMBS securities, commercial mortgages, mezzanine loans, and other loans in our commercial real estate portfolio. Generally, CDO notes payable are comprised of various classes of notes payable, with each class bearing interest at variable or fixed rates. Both of our CRE CDOs are meeting all of their OC and IC trigger tests as of December 31, 2010.
During the year ended December 31, 2010, we repurchased, from the market, a total of $55,000 in aggregate principal amount of CDO notes payable issued by RAIT I and RAIT II. The aggregate purchase price was $13,081 and we recorded gains on extinguishment of debt of $41,961, net of deferred financing costs that were written off.
During the year ended December 31, 2009, we repurchased, from the market, a total of $55,000 in aggregate principal amount of CDO notes payable issued by RAIT I and RAIT II. The aggregate purchase price was $4,029 and we recorded gains on extinguishment of debt of $50,971.
CDO notes payable, at fair value. As of January 1, 2008, we adopted the fair value option, which is now classified under FASB ASC Topic 825, and elected to record CDO notes payable at fair value. These CDO notes payable are collateralized by trading securities, security-related receivables and loans. At adoption, we decreased the carrying amount of these CDO notes payable by $1,520,616 to reflect these liabilities at fair value in our financial statements. The fair value of these CDO notes payable increased (decreased) by $39,464 and ($49,280) for the years ended December 31, 2010 and 2009, respectively. The increase (decrease) was included in the change in fair value of financial instruments in our consolidated statements of operations as an expense (income), respectively.
Both of our Taberna consolidated CDOs are failing OC Trigger tests which cause a change to the priority of payments to the debt and equity holders of the respective securitizations. Upon the failure of an OC test, the indenture of each CDO requires cash flows that would otherwise have been distributed to us as equity distributions, or in some cases interest payments on our retained CDO notes payable, to be used to pay down sequentially the outstanding principal balance of the most senior note holders. The OC tests failures are due to defaulted collateral assets and credit risk securities. During the year ended December 31, 2010, $37,949 of cash flows were re-directed from our retained interests in these CDOs and were used to repay the most senior holders of our CDO notes payable.
101
Table of Contents
Loans payable on real estate. As of December 31, 2010 and 2009, we had $74,876 and $81,908, respectively, of other indebtedness outstanding relating to loans payable on consolidated real estate and other loans. These loans are secured by specific consolidated real estate and commercial loans included in our consolidated balance sheet.
Trust preferred obligations. Trust preferred obligations finance subordinated debentures acquired by Trust VIEs that are consolidated by us for the portion of the total TruPS that are owned by entities outside of the consolidated group. These trust preferred obligations bear interest at either variable or fixed rates until maturity, generally 30 years from the date of issuance. The Trust VIE has the ability to prepay the trust preferred obligation at any time, without prepayment penalty, after five years. We do not control the timing or ultimate payment of the trust preferred obligations.
As of January 1, 2008, we adopted the fair value option, which is now classified under FASB ASC Topic 825, and elected to record trust preferred obligations at fair value. At adoption, we decreased the carrying amount of the trust preferred obligations by $52,070 to reflect these liabilities at fair value in our financial statements. The change in fair value of the trust preferred obligations was a decrease of $104,179 for the year ended December 31, 2009 and was included in our consolidated statements of operations.
As of January 1, 2010, we adopted an accounting standard which changed the determination of the consolidation of VIEs. Accordingly, we deconsolidated these entities as of January 1, 2010 as we were not determined to be the primary beneficiary of the VIEs thereby reducing our assets and liabilities by $70,872.
Exchange Offers
On December 29, 2009, we completed an exchange offer to exchange convertible senior notes for common shares and cash. Holders of our convertible senior notes tendered $34,000 aggregate principal amount of our convertible senior notes. Pursuant to the terms of the Exchange Offer, we issued 8,126,000 common shares and paid $3,111 of cash as consideration for the exchanges notes. For each $1,000 principal amount of our convertible senior notes exchanged, the holder received the following: (i) 239 common shares, (ii) a cash payment of $91.50 and (iii) accrued and unpaid interest on the convertible senior notes to, but excluding, the settlement date, paid in cash. As a result of the exchange offer, we recorded gains on extinguishment of debt of approximately $18,120.
Maturity of Indebtedness
Generally, the majority of our indebtedness is payable in full upon the maturity or termination date of the underlying indebtedness. The following table displays the aggregate contractual maturities of our indebtedness by year:
| 2011 |
$ | 41,533 | ||
| 2012 |
14,922 | |||
| 2013 |
— | |||
| 2014 |
63,950 | |||
| 2015 |
38,881 | |||
| Thereafter (1) |
2,711,700 | |||
| Total |
$ | 2,870,986 | ||
| (1) | Includes $143,613 of our convertible senior notes which are redeemable, at par at the option of the holder, in April 2012, April 2017, and April 2022. |
NOTE 7: DERIVATIVE FINANCIAL INSTRUMENTS
We may use derivative financial instruments to hedge all or a portion of the interest rate risk associated with our borrowings. The principal objective of such arrangements is to minimize the risks and/or costs associated with our operating and financial structure as well as to hedge specific anticipated transactions. The counterparties
102
Table of Contents
to these contractual arrangements are major financial institutions with which we and our affiliates may also have other financial relationships. In the event of nonperformance by the counterparties, we are potentially exposed to credit loss. However, because of the high credit ratings of the counterparties, we do not anticipate that any of the counterparties will fail to meet their obligations.
Cash Flow Hedges
We have entered into various interest rate swap contracts to hedge interest rate exposure on floating rate indebtedness. We designate interest rate hedge agreements at inception and determine whether or not the interest rate hedge agreement is highly effective in offsetting interest rate fluctuations associated with the identified indebtedness. At designation, certain of these interest rate swaps had a fair value not equal to zero. However, we concluded, at designation, that these hedging arrangements were highly effective during their term using regression analysis and determined that the hypothetical derivative method would be used in measuring any ineffectiveness. At each reporting period, we update our regression analysis and, as of December 31, 2010, we concluded that these hedging arrangements were highly effective during their remaining term and used the hypothetical derivative method in measuring the ineffective portions of these hedging arrangements.
The following table summarizes the aggregate notional amount and estimated net fair value of our derivative instruments as of December 31, 2010 and December 31, 2009:
| As of December 31, 2010 | As of December 31, 2009 | |||||||||||||||
| Notional | Fair Value | Notional | Fair Value | |||||||||||||
| Cash flow hedges: |
||||||||||||||||
| Interest rate swaps |
$ | 1,786,698 | $ | (184,878 | ) | $ | 1,826,167 | $ | (186,986 | ) | ||||||
| Interest rate caps |
36,000 | 1,496 | 36,000 | 1,335 | ||||||||||||
| Net fair value |
$ | 1,822,698 | $ | (183,382 | ) | $ | 1,862,167 | $ | (185,651 | ) | ||||||
The following table summarizes the effect on income by derivative instrument type for the following periods:
| For the Year Ended December 31, 2010 |
For the Year Ended December 31, 2009 |
For the Year Ended December 31, 2008 |
||||||||||||||||||||||
| Type of Derivative |
Amounts Reclassified to Earnings for Effective Hedges— Gains (Losses) |
Amounts Reclassified to Earnings for Hedge Ineffectiveness— Gains (Losses) |
Amounts Reclassified to Earnings for Effective Hedges— Gains (Losses) |
Amounts Reclassified to Earnings for Hedge Ineffectiveness— Gains (Losses) |
Amounts Reclassified to Earnings for Effective Hedges— Gains (Losses) |
Amounts Reclassified to Earnings for Hedge Ineffectiveness— Gains (Losses) |
||||||||||||||||||
| Interest rate swaps |
$ | (46,111 | ) | $ | 46 | $ | (45,476 | ) | $ | (449 | ) | $ | (31,307 | ) | $ | (432 | ) | |||||||
| Currency options |
— | — | — | (21 | ) | — | 25 | |||||||||||||||||
| Total |
$ | (46,111 | ) | $ | 46 | $ | (45,476 | ) | $ | (470 | ) | $ | (31,307 | ) | $ | (407 | ) | |||||||
On January 1, 2008, we adopted the fair value option, which has been classified under FASB ASC Topic 825, “Financial Instruments”, for certain of our CDO notes payable. Upon the adoption of this standard, hedge accounting for any previously designated cash flow hedges associated with these CDO notes payable was discontinued and all changes in fair value of these cash flow hedges are recorded in earnings. As of December 31, 2010, the notional value associated with these cash flow hedges where hedge accounting was discontinued was $970,276 and had a liability balance with a fair value of $93,210. See Note 8: “Fair Value of Financial Instruments” for the changes in value of these hedges during the years ended December 31, 2010 and 2009. The change in value of these hedges was recorded as a component of the change in fair value of financial instruments in our consolidated statement of operations.
103
Table of Contents
Amounts reclassified to earnings associated with effective cash flow hedges are reported in investment interest expense and the fair value of these hedge agreements is included in other assets or derivative liabilities.
Free-Standing Derivatives
We have maintained warehouse arrangements with various investment banks through 2008. These warehouse arrangements were free-standing derivatives under FASB ASC Topic 815, “Derivatives and Hedging”. As such, our investment, or first-dollar risk of loss, was recorded at fair value each period with the change in fair value recorded in earnings.
During the year ended December 31, 2008, our remaining two warehouse facilities terminated. As such, we did not expect that we would recover our warehouse deposits. As a result, as of December 31, 2008, we fully accrued for the contingency of losing our $32,059 of warehouse deposits in other liabilities. The accrual was charged to earnings through the change in fair value of free-standing derivatives. Subsequent to December 31, 2008, we did not recover our warehouse deposit and charged off our deposits accordingly.
In addition, the option we provided a warehouse provider for us to provide credit default protection on two reference securities was terminated in May 2008 and we have no further obligation thereunder.
NOTE 8: FAIR VALUE OF FINANCIAL INSTRUMENTS
Fair Value of Financial Instruments
FASB ASC Topic 825, “Financial Instruments” requires disclosure of the fair value of financial instruments for which it is practicable to estimate that value. The fair value of investments in mortgages and loans, investments in securities, trust preferred obligations, CDO notes payable, convertible senior notes, junior subordinated notes and derivative assets and liabilities is based on significant observable and unobservable inputs. The fair value of cash and cash equivalents, restricted cash, secured credit facilities, senior secured notes, loans payable on real estate and other indebtedness approximates cost due to the nature of these instruments.
The following table summarizes the carrying amount and the fair value of our financial instruments as of December 31, 2010:
| Financial Instrument |
Carrying Amount |
Estimated Fair Value |
||||||
| Assets |
||||||||
| Commercial mortgages, mezzanine loans and other loans |
$ | 1,219,110 | $ | 1,155,262 | ||||
| Investments in securities and security-related receivables |
705,451 | 705,451 | ||||||
| Cash and cash equivalents |
27,230 | 27,230 | ||||||
| Restricted cash |
176,723 | 176,723 | ||||||
| Derivative assets |
1,496 | 1,496 | ||||||
| Liabilities |
||||||||
| Recourse indebtedness: |
||||||||
| Convertible senior notes |
143,474 | 115,968 | ||||||
| Secured credit facilities |
36,489 | 36,489 | ||||||
| Senior secured notes |
63,950 | 63,950 | ||||||
| Junior subordinated notes, at fair value |
4,422 | 4,422 | ||||||
| Junior subordinated notes, at amortized cost |
25,100 | 2,917 | ||||||
| Loans payable on real estate |
19,922 | 19,922 | ||||||
| Non-recourse indebtedness: |
||||||||
| CDO notes payable, at amortized cost |
1,341,750 | 837,398 | ||||||
| CDO notes payable, at fair value |
148,072 | 148,072 | ||||||
| Loans payable on real estate |
54,998 | 54,998 | ||||||
| Derivative liabilities |
184,878 | 184,878 | ||||||
104
Table of Contents
Fair Value Measurements
The following tables summarize information about our assets and liabilities measured at fair value on a recurring basis as of December 31, 2010, and indicate the fair value hierarchy of the valuation techniques utilized to determine such fair value:
| Assets: |
Quoted Prices in Active Markets for Identical Assets (Level 1) (a) |
Significant Other Observable Inputs (Level 2) (a) |
Significant Unobservable Inputs (Level 3) (a) |
Balance as of December 31, 2010 |
||||||||||||
| Trading securities |
||||||||||||||||
| TruPS |
$ | — | $ | — | $ | 454,473 | $ | 454,473 | ||||||||
| Other securities |
— | — | — | — | ||||||||||||
| Available-for-sale securities |
— | 2 | — | 2 | ||||||||||||
| Security-related receivables |
||||||||||||||||
| TruPS receivables |
— | — | 83,087 | 83,087 | ||||||||||||
| Unsecured REIT note receivables |
— | 62,490 | — | 62,490 | ||||||||||||
| CMBS receivables |
— | 77,142 | — | 77,142 | ||||||||||||
| Other securities |
— | 28,257 | — | 28,257 | ||||||||||||
| Derivative assets |
— | 1,496 | — | 1,496 | ||||||||||||
| Total assets |
$ | — | $ | 169,387 | $ | 537,560 | $ | 706,947 | ||||||||
| Liabilities: |
Quoted Prices in Active Markets for Identical Assets (Level 1) (a) |
Significant Other Observable Inputs (Level 2) (a) (b) |
Significant Unobservable Inputs (Level 3) (b) |
Balance as of December 31, 2010 |
||||||||||||
| Junior subordinated notes, at fair value |
$ | — | $ | — | $ | 4,422 | $ | 4,422 | ||||||||
| CDO notes payable, at fair value |
— | — | 148,072 | 148,072 | ||||||||||||
| Derivative liabilities |
— | 97,246 | 87,632 | 184,878 | ||||||||||||
| Total liabilities |
$ | — | $ | 97,246 | $ | 240,126 | $ | 337,372 | ||||||||
| (a) | During the year ended December 31, 2010, there were no transfers between Level 1 and Level 2. |
| (b) | During the year ended December 31, 2010, we determined that junior subordinated notes elected under the fair value option and certain derivative liabilities in Taberna VIII and Taberna IX should be categorized as a Level 3 liability due to the limited market activity for these financial instruments and increased reliance on management’s estimates and assumptions. |
The following tables summarize additional information about assets and liabilities that are measured at fair value on a recurring basis for which we have utilized level 3 inputs to determine fair value for the year ended December 31, 2010:
| Assets |
Trading Securities—TruPS and Subordinated Debentures |
Security-Related Receivables—TruPS and Subordinated Debenture Receivables |
Total Level 3 Assets |
|||||||||
| Balance, as of December 31, 2009 |
$ | 471,106 | $ | 73,649 | $ | 544,755 | ||||||
| Change in fair value of financial instruments |
194,442 | 12,719 | 207,161 | |||||||||
| Purchases and sales, net |
(140,203 | ) | (3,281 | ) | (143,484 | ) | ||||||
| Deconsolidation of VIEs |
(70,872 | ) | — | (70,872 | ) | |||||||
| Balance, as of December 31, 2010 |
$ | 454,473 | $ | 83,087 | $ | 537,560 | ||||||
105
Table of Contents
| Liabilities |
Trust Preferred Obligations |
CDO Notes Payable, at Fair Value |
Junior Subordinated Notes, at Fair Value |
Derivative Liabilities |
Total Level 3 Liabilities |
|||||||||||||||
| Balance, as of December 31, 2009 |
$ | 70,872 | $ | 146,557 | $ | — | $ | — | $ | 217,429 | ||||||||||
| Change in fair value of financial instruments |
— | 39,464 | — | — | 39,464 | |||||||||||||||
| Purchases and sales, net |
— | (37,949 | ) | — | — | (37,949 | ) | |||||||||||||
| Deconsolidation of VIEs |
(70,872 | ) | — | — | — | (70,872 | ) | |||||||||||||
| Transfer in from Level 2 to Level 3 (a) |
— | — | 4,422 | 87,632 | 92,054 | |||||||||||||||
| Balance, as of December 31, 2010 |
$ | — | $ | 148,072 | $ | 4,422 | $ | 87,632 | $ | 240,126 | ||||||||||
| (a) | During the year ended December 31, 2010, we determined that junior subordinated notes elected under the fair value option and certain derivative liabilities in Taberna VIII and Taberna IX should be categorized as a Level 3 liability due to the limited market activity for these financial instruments and increased reliance on management’s estimates and assumptions. |
Change in Fair Value of Financial Instruments
The following table summarizes realized and unrealized gains and losses on assets and liabilities for which we elected the fair value option within FASB ASC Topic 825, “Financial Instruments” as reported in change in fair value of financial instruments in the accompanying consolidated statements of operations:
| Description |
For the Year Ended December 31, 2010 |
For the Year Ended December 31, 2009 |
For the Year Ended December 31, 2008 |
|||||||||
| Change in fair value of trading securities and security-related receivables |
$ | 111,874 | $ | (158,273 | ) | $ | (1,737,305 | ) | ||||
| Change in fair value of CDO notes payable, trust preferred obligations and other liabilities |
(26,882 | ) | 153,459 | 1,579,689 | ||||||||
| Change in fair value of derivatives |
(39,152 | ) | 6,377 | (394,821 | ) | |||||||
| Change in fair value of financial instruments |
$ | 45,840 | $ | 1,563 | $ | (552,437 | ) | |||||
The changes in the fair value for the investment in securities, CDO notes payable, trust preferred obligations, and other liabilities for which the fair value option was elected for the years ended December 31, 2010, 2009 and 2008 was primarily attributable to changes in instrument specific credit risks. The changes in the fair value of derivatives for which the fair value option was elected for the years ended December 31, 2010, 2009 and 2008 was mainly due to changes in interest rates.
NOTE 9: VARIABLE INTEREST ENTITIES
On January 1, 2010, we adopted an accounting standard which provided guidance when to consolidate a VIE. Under the new standard, the determination of when to consolidate a VIE is based on the power to direct the activities of the VIE that most significantly impact the VIE’s economic performance together with either the obligation to absorb losses or the right to receive benefits that could be significant to the VIE. Upon adoption, we evaluated our investments under this new consolidation standard and the following changes in previous consolidation conclusions were made:
| • | TruPS Investment and Obligations—Previously, we held implicit interests in trusts which issued TruPS. Under the previous consolidation guidance, we were considered to be primary beneficiaries of the trusts and reported their assets and liabilities in our consolidated balance sheet. RAIT does not meet both criteria to be the primary beneficiary of these entities as we do not have the power to direct the activities of the underlying trusts. Therefore, we deconsolidated these entities as of January 1, 2010 thereby reducing our assets and liabilities by $70,872. |
106
Table of Contents
| • | Investments in Real Estate—We identified two properties to be VIEs that we previously did not consolidate as we were not previously the primary beneficiary: Willow Grove and Cherry Hill. We evaluated our interests in these real estate properties and determined that we are the primary beneficiary. Upon consolidation of these properties on January 1, 2010, we increased our assets and liabilities by $20,931. |
The following table presents the assets and liabilities of our consolidated VIEs as of each respective date. As of December 31, 2010, our consolidated VIEs were: Taberna Preferred Funding VIII, Ltd., Taberna Preferred Funding IX, Ltd, RAIT CRE CDO I, Ltd., RAIT Preferred Funding II, Ltd., Willow Grove and Cherry Hill.
| As of December 31, 2010 |
As of December 31, 2009 (a) |
|||||||
| Assets |
||||||||
| Investments in mortgages and loans, at amortized cost: |
||||||||
| Commercial mortgages, mezzanine loans, other loans and preferred equity interests |
$ | 1,913,089 | $ | 1,959,118 | ||||
| Allowance for losses |
(15,526 | ) | (13,647 | ) | ||||
| Total investments in mortgages and loans |
1,897,563 | 1,945,471 | ||||||
| Investments in real estate |
21,054 | — | ||||||
| Investments in securities and security-related receivables, at fair value |
705,455 | 694,809 | ||||||
| Cash and cash equivalents |
73 | 272 | ||||||
| Restricted cash |
151,045 | 117,322 | ||||||
| Accrued interest receivable |
55,105 | 38,397 | ||||||
| Deferred financing costs, net of accumulated amortization of $8,608 and $5,897, respectively |
17,999 | 20,132 | ||||||
| Total assets |
$ | 2,848,294 | $ | 2,816,403 | ||||
| Liabilities and Equity |
||||||||
| Indebtedness (including $148,072 and $217,429 at fair value, respectively) |
$ | 1,707,352 | $ | 1,794,339 | ||||
| Accrued interest payable |
34,745 | 21,855 | ||||||
| Accounts payable and accrued expenses |
1,450 | 232 | ||||||
| Derivative liabilities |
184,878 | 186,986 | ||||||
| Deferred taxes, borrowers’ escrows and other liabilities |
3,814 | 3,136 | ||||||
| Total liabilities |
1,932,239 | 2,006,548 | ||||||
| Equity: |
||||||||
| Shareholders’ equity: |
||||||||
| Accumulated other comprehensive income (loss) |
(123,316 | ) | (115,004 | ) | ||||
| RAIT Investment |
103,862 | 167,011 | ||||||
| Retained earnings (deficit) |
935,509 | 757,848 | ||||||
| Total shareholders’ equity |
916,055 | 809,855 | ||||||
| Total liabilities and equity |
$ | 2,848,294 | $ | 2,816,403 | ||||
| (a) | Includes the assets and liabilities described in the TruPS Investments and Obligations above. Based on the adoption of the accounting standard, these VIEs were deconsolidated as of January 1, 2010 and no longer appear in our consolidated financial statements. Upon deconsolidation, investments in securities and indebtedness both decreased by $70,872 as of January 1, 2010. |
The assets of the VIEs can only be used to settle obligations of the VIEs and are not available to our creditors. Certain amounts included in the table above are eliminated upon consolidation with other our subsidiaries that maintain investments in the debt or equity securities issued by these entities. We do not have
107
Table of Contents
any contractual obligation to provide the VIEs listed above with any financial support. We have not and do not intend to provide financial support to these VIEs that we were not previously contractually required to provide.
NOTE 10: SHAREHOLDERS’ EQUITY
Preferred Shares
In 2004, we issued 2,760,000 shares of our 7.75% Series A Cumulative Redeemable Preferred Shares of Beneficial Interest, or Series A Preferred Shares, for net proceeds of $66,600. The Series A Preferred Shares accrue cumulative cash dividends at a rate of 7.75% per year of the $25.00 liquidation preference, equivalent to $1.9375 per year per share. Dividends are payable quarterly in arrears at the end of each March, June, September and December. The Series A Preferred Shares have no maturity date and we are not required to redeem the Series A Preferred Shares at any time. On or after March 19, 2009, we may, at our option, redeem the Series A Preferred Shares, in whole or part, at any time and from time to time, for cash at $25.00 per share, plus accrued and unpaid dividends, if any, to the redemption date.
In 2004, we issued 2,258,300 shares of our 8.375% Series B Cumulative Redeemable Preferred Shares of Beneficial Interest, or Series B Preferred Shares, for net proceeds of $54,400. The Series B Preferred Shares accrue cumulative cash dividends at a rate of 8.375% per year of the $25.00 liquidation preference, equivalent to $2.09375 per year per share. Dividends are payable quarterly in arrears at the end of each March, June, September and December. The Series B Preferred Shares have no maturity date and we are not required to redeem the Series B Preferred Shares at any time. On or after October 5, 2009, we may, at our option, redeem the Series B Preferred Shares, in whole or part, at any time and from time to time, for cash at $25.00 per share, plus accrued and unpaid dividends, if any, to the redemption date.
On July 5, 2007, we issued 1,600,000 shares of our 8.875% Series C Cumulative Redeemable Preferred Shares of Beneficial Interest, or the Series C Preferred Shares, in a public offering at an offering price of $25.00 per share. After offering costs, including the underwriters’ discount, and expenses of $1,660, we received $38,340 of net proceeds. The Series C Preferred Shares accrue cumulative cash dividends at a rate of 8.875% per year of the $25.00 liquidation preference and are paid on a quarterly basis. The Series C Preferred Shares have no maturity date and we are not required to redeem the Series C Preferred Shares at any time. We may not redeem the Series C Preferred Shares before July 5, 2012, except for the special optional redemption to preserve our tax qualification as a REIT. On or after July 5, 2012, we may, at our option, redeem the Series C Preferred Shares, in whole or part, at any time and from time to time, for cash at $25.00 per share, plus accrued and unpaid dividends, if any, to the redemption date.
Common Shares
Share Repurchases:
On July 24, 2007, our board of trustees adopted a share repurchase plan that authorizes us to purchase up to $75,000 of RAIT common shares. Under the plan, we may make purchases, from time to time, through open market or privately negotiated transactions. We have not repurchased any common shares under this plan as of December 31, 2010.
On January 26, 2010, the compensation committee approved a cash payment to the board’s eight non-management trustees intended to constitute a portion of their respective 2010 annual non-management trustee compensation. The cash payment was subject to terms and conditions set forth in a letter agreement, or the letter agreement, between each of the non-management trustees and RAIT. The terms and conditions included a requirement that each trustee use a portion of the cash payment to purchase RAIT’s common shares in purchases that, individually and in the aggregate with all purchases made by all the other non-management trustees pursuant to their respective letter agreements, complied with Rule 10b-18 promulgated under the Securities Exchange Act of 1934, as amended. The aggregate amount required to be used by all of the non-management trustees to purchase common shares was $240 and was used to purchase 152,800 common shares, in the aggregate, in March 2010.
108
Table of Contents
On January 25, 2011, the compensation committee approved a cash payment to the board’s eight non-management trustees intended to constitute a portion of their respective 2011 annual non-management trustee compensation. The cash payment was subject to terms and conditions set forth in a letter agreement, or the letter agreement, between each of the non-management trustees and RAIT. The terms and conditions included a requirement that each trustee use a portion of the cash payment to purchase RAIT’s common shares in purchases that, individually and in the aggregate with all purchases made by all the other non-management trustees pursuant to their respective letter agreements, complied with Rule 10b-18 promulgated under the Securities Exchange Act of 1934, as amended. The aggregate amount required to be used by all of the non-management trustees to purchase common shares is $210 and was used to purchase 56,693 common shares, in the aggregate, in February 2011.
Share Issuances:
Dividend reinvestment and share purchase plan (DRSPP). We implemented an amended and restated dividend reinvestment and share purchase plan, or DRSPP, effective as of March 13, 2008, pursuant to which we registered and reserved for issuance, in the aggregate, 18,787,635 common shares. During the year ended December 31, 2010, we issued a total of 1,932,706 common shares pursuant to the DRSPP at a weighted-average price of $2.28 per share and we received $4,377 of net proceeds. As of December 31, 2010, 11,697,634 common shares, in aggregate, remain available for issuance under the DRSPP.
Standby Equity Distribution Agreement (SEDA). On January 13, 2010, we entered into a standby equity distribution agreement, or the SEDA, with YA Global Master SPV Ltd., or YA Global, which is managed by Yorkville Advisors, LLC, whereby YA Global agreed to purchase up to $50,000, or the commitment amount, worth of newly issued RAIT common shares upon notices given by us, subject to the terms and conditions of the SEDA. The number of common shares issued or issuable pursuant to the SEDA, in the aggregate, cannot exceed 12,500,000 common shares. The SEDA terminates automatically on the earlier of January 13, 2012 or the date YA Global has purchased $50,000 worth of common shares under the SEDA. During the period from the effective date of the SEDA through December 31, 2010, 1,152,984 common shares were issued pursuant to this arrangement at a weighted average price of $2.17 and we received $2,500 of proceeds. As of December 31, 2010, 11,347,016 common shares, in the aggregate, remain available for issuance under the SEDA.
After the first closing under the SEDA and thereafter prior to the termination of the SEDA, RAIT may from time to time request YA Global to purchase promissory notes issued by RAIT with a principal amount of up to $10,000. After considering each request in good faith, YA Global, in its sole discretion, will decide whether or not to purchase the notes. Any such notes purchased by YA Global will be on mutually acceptable terms and may include a provision that the notes be repaid with the proceeds of amounts delivered pursuant to the SEDA.
Capital on Demand™ Sales Agreement (COD). On August 6, 2010, we entered into a Capital on Demand™ Sales Agreement, or the COD sales agreement, with JonesTrading Institutional Services LLC, or JonesTrading, pursuant to which we may issue and sell up to 17,500,000 of our common shares from time to time through JonesTrading acting as agent and/or principal, subject to the terms and conditions of the COD sales agreement. During the period from the effective date of the COD sales agreement through December 31, 2010, 9,053,411 common shares were issued pursuant to this arrangement at a weighted average price of $1.83 and we received $16,400 of proceeds. From January 1, 2011 through February 22, 2011, 2,986,916 common shares were issued pursuant to the COD sales agreement at a weighted average price of $3.07 and we received $9,035 of proceeds. After reflecting the common shares issued through February 22, 2011, 5,459,673 common shares, in the aggregate, remain available for issuance under the COD sales agreement.
109
Table of Contents
Dividends
The following tables summarize the dividends we declared or paid during the years ended December 31, 2010 and 2009:
| March 31, 2010 |
June 30, 2010 |
September 30, 2010 |
December 31, 2010 |
For the Year Ended December 31, 2010 |
||||||||||||||||
| Series A Preferred Shares |
||||||||||||||||||||
| Date declared |
1/26/10 | 4/22/10 | 7/27/10 | 10/28/10 | ||||||||||||||||
| Record date |
3/1/10 | 6/1/10 | 9/1/10 | 12/1/10 | ||||||||||||||||
| Date paid |
3/31/10 | 6/30/10 | 9/30/10 | 12/31/10 | ||||||||||||||||
| Total dividend amount |
$ | 1,337 | $ | 1,337 | $ | 1,337 | $ | 1,337 | $ | 5,348 | ||||||||||
| Series B Preferred Shares |
||||||||||||||||||||
| Date declared |
1/26/10 | 4/22/10 | 7/27/10 | 10/28/10 | ||||||||||||||||
| Record date |
3/1/10 | 6/1/10 | 9/1/10 | 12/1/10 | ||||||||||||||||
| Date paid |
3/31/10 | 6/30/10 | 9/30/10 | 12/31/10 | ||||||||||||||||
| Total dividend amount |
$ | 1,182 | $ | 1,182 | $ | 1,182 | $ | 1,182 | $ | 4,728 | ||||||||||
| Series C Preferred Shares |
||||||||||||||||||||
| Date declared |
1/26/10 | 4/22/10 | 7/27/10 | 10/28/10 | ||||||||||||||||
| Record date |
3/1/10 | 6/1/10 | 9/1/10 | 12/1/10 | ||||||||||||||||
| Date paid |
3/31/10 | 6/30/10 | 9/30/10 | 12/31/10 | ||||||||||||||||
| Total dividend amount |
$ | 888 | $ | 888 | $ | 888 | $ | 888 | $ | 3,552 | ||||||||||
| Common shares |
||||||||||||||||||||
| Date declared |
— | — | — | — | ||||||||||||||||
| Record date |
— | — | — | — | ||||||||||||||||
| Date paid |
— | — | — | — | ||||||||||||||||
| Dividend per share |
— | — | — | $ | — | $ | — | |||||||||||||
| Total dividend declared |
— | — | — | $ | — | $ | — | |||||||||||||
| March 31, 2009 |
June 30, 2009 |
September 30, 2009 |
December 31, 2009 |
For the Year Ended December 31, 2009 |
||||||||||||||||
| Series A Preferred Shares |
||||||||||||||||||||
| Date declared |
1/27/09 | 4/8/09 | 7/28/09 | 10/27/09 | ||||||||||||||||
| Record date |
3/2/09 | 6/1/09 | 9/1/09 | 12/1/09 | ||||||||||||||||
| Date paid |
3/31/09 | 6/30/09 | 9/30/09 | 12/31/09 | ||||||||||||||||
| Total dividend amount |
$ | 1,337 | $ | 1,337 | $ | 1,337 | $ | 1,337 | $ | 5,348 | ||||||||||
| Series B Preferred Shares |
||||||||||||||||||||
| Date declared |
1/27/09 | 4/8/09 | 7/28/09 | 10/27/09 | ||||||||||||||||
| Record date |
3/2/09 | 6/1/09 | 9/1/09 | 12/1/09 | ||||||||||||||||
| Date paid |
3/31/09 | 6/30/09 | 9/30/09 | 12/31/09 | ||||||||||||||||
| Total dividend amount |
$ | 1,182 | $ | 1,182 | $ | 1,182 | $ | 1,182 | $ | 4,728 | ||||||||||
| Series C Preferred Shares |
||||||||||||||||||||
| Date declared |
1/27/09 | 4/8/09 | 7/28/09 | 10/27/09 | ||||||||||||||||
| Record date |
3/2/09 | 6/1/09 | 9/1/09 | 12/1/09 | ||||||||||||||||
| Date paid |
3/31/09 | 6/30/09 | 9/30/09 | 12/31/09 | ||||||||||||||||
| Total dividend amount |
$ | 888 | $ | 888 | $ | 888 | $ | 888 | $ | 3,552 | ||||||||||
| Common shares |
||||||||||||||||||||
| Date declared |
— | — | — | — | ||||||||||||||||
| Record date |
— | — | — | — | ||||||||||||||||
| Date paid |
— | — | — | — | ||||||||||||||||
| Dividend per share |
— | — | — | — | — | |||||||||||||||
| Total dividend declared |
— | — | — | — | — | |||||||||||||||
110
Table of Contents
On January 10, 2011, the board of trustees declared a $0.03 dividend on our common shares to holders of record as of January 21, 2011. The dividend was paid on January 31, 2011 and totaled $3.2 million.
On January 25, 2011, our board of trustees declared a first quarter 2011 cash dividend of $0.484375 per share on our 7.75% Series A Preferred Shares, $0.5234375 per share on our 8.375% Series B Preferred Shares and $0.5546875 per share on our 8.875% Series C Preferred Shares. The dividends will be paid on March 31, 2011 to holders of record on March 1, 2011.
NOTE 11: STOCK BASED COMPENSATION AND EMPLOYEE BENEFITS
We maintain the RAIT Financial Trust 2008 Incentive Award Plan (the “Incentive Award Plan”). The maximum aggregate number of common shares that may be issued pursuant to the Incentive Award Plan is 4,500,000. As of December 31, 2010, 680,147 common shares are available for issuance under this plan.
On January 8, 2008, the compensation committee awarded 324,200 phantom units, valued at $2,448 using our closing stock price of $7.55 on that date, to various non-executive employees. The awards generally vest over four year periods. On March 5, 2008, the compensation committee awarded 26,712 phantom units, valued at $175 using our closing stock price of $6.55 on that date, to trustees. These awards vested immediately. On August 7, 2008, the compensation committee awarded 24,927 phantom units, valued at $175 using our closing stock price of $7.02 on that date, to trustees. These awards vested immediately.
On March 5, 2009, the compensation committee awarded 484,000 phantom units, valued at $242 using our closing stock price of $0.50 on that date, to various non-executive employees. The awards generally vest over three-year periods.
On June 25, 2009, the compensation committee awarded 200,000 phantom units, valued at $238 using our closing stock price of $1.19 on that date, to two non-executive employees. The awards generally vest over four-year periods.
On January 26, 2010, the compensation committee awarded 1,500,000 phantom units, valued at $1,905 using our closing stock price of $1.27 on that date, to our executive officers. Half of these awards vested immediately and the remainder vests in one year from the date of grant. On January 26, 2010, the compensation committee awarded 500,000 phantom units, valued at $635 using our closing stock price of $1.27 on that date, to our non-executive officer employees. These awards generally vest over three-year periods.
During the years ended December 31, 2010, 2009 and 2008, there were 73,425, 21,805, and 29,943, respectively, phantom units redeemed for common shares and 216,086, 37,000, and 60,152 phantom units forfeited, respectively. At December 31, 2010 and 2009, there were 2,791,371 and 1,080,882, respectively, phantom units outstanding.
As part of the acquisition of Taberna on December 11, 2006, or the Taberna acquisition, we assumed 481,785 unvested restricted shares in exchange for the unvested restricted shares of Taberna’s employees that did not vest on the date of acquisition. The unvested restricted shares were accounted for under FASB ASC Topic 718, and the grant date fair value on December 11, 2006 of $16,559 (based on the closing price of $34.37 at December 11, 2006 of our common shares) was expensed over the remaining vesting provisions of the original awards. During the years ended December 31, 2010 and 2009, unvested restricted shares totaling 2,845 and 62,338, respectively, vested and were issued to the respective employees. During the year ended December 31, 2010, there were 11,314 unvested restricted shares forfeited. There were no unvested restricted shares forfeited during 2009. As of December 31, 2010 there were no unvested restricted shares outstanding. As of December 31, 2009, there were 14,159 unvested restricted shares outstanding.
As of December 31, 2010 and 2009, the deferred compensation cost relating to unvested awards was $723 and $2,642, respectively, relating to phantom units and restricted stock that had a weighted average remaining vesting period of 1.5 years and 1.6 years, respectively.
111
Table of Contents
Stock Options
We have granted to our officers, trustees and employees options to acquire common shares. The vesting period is determined by the compensation committee and the option term is generally ten years after the date of grant. As of December 31, 2010 and 2009, there were 168,800 options outstanding.
A summary of the options activity of the Incentive Award Plan is presented below.
| 2010 | 2009 | 2008 | ||||||||||||||||||||||
| Shares | Weighted Average Exercise Price |
Shares | Weighted Average Exercise Price |
Shares | Weighted Average Exercise Price |
|||||||||||||||||||
| Outstanding, January 1, |
168,800 | $ | 22.50 | 178,800 | $ | 21.84 | 215,300 | $ | 20.68 | |||||||||||||||
| Expired |
— | — | (10,000 | ) | 10.75 | (36,500 | ) | 15.00 | ||||||||||||||||
| Exercised |
— | — | — | — | — | — | ||||||||||||||||||
| Outstanding, December 31, |
168,800 | $ | 22.50 | 168,800 | $ | 22.50 | 178,800 | $ | 21.84 | |||||||||||||||
| Options exercisable at December 31, |
168,800 | 168,800 | 178,800 | |||||||||||||||||||||
| Options Outstanding | Options Exercisable | |||||||||||||||||||
| Range of Exercise Prices |
Number Outstanding at December 31, 2010 |
Weighted Average Remaining Contractual Life |
Weighted Average Exercise Price |
Number Outstanding at December 31, 2009 |
Weighted Average Exercise Price |
|||||||||||||||
| $13.65 |
7,000 | 0.1 years | $ | 13.65 | 7,000 | $ | 13.65 | |||||||||||||
| $19.21 – 19.85 |
20,000 | 1.4 years | 19.50 | 20,000 | 19.50 | |||||||||||||||
| $21.81 – 26.40 |
141,800 | 2.7 years | 23.36 | 141,800 | 23.36 | |||||||||||||||
| 168,800 | 2.5 years | $ | 22.50 | 168,800 | $ | 22.50 | ||||||||||||||
We did not grant options during the three years ended December 31, 2010.
During the years ended December 31, 2010, 2009 and 2008, we recorded compensation expense of $2,949, $3,830, and $7,206, respectively, associated with our stock based compensation.
Employee Benefits
401(k) Profit Sharing Plan
We maintain a 401(k) profit sharing plan (the RAIT 401(k) Plan) for the benefit of our eligible employees. The RAIT 401(k) Plan offers eligible employees the opportunity to make long-term investments on a regular basis through salary contributions, which are supplemented by our matching cash contributions and potential profit sharing payments. We provide a 4% cash match of the employee contributions and may pay an additional 2% of eligible compensation as discretionary cash profit sharing payments. Any matching contribution made by RAIT pursuant to the RAIT 401(k) Plan vests 33% per year of service.
During the years ended December 31, 2010, 2009 and 2008, we recorded $424, $296, and $642 of contributions which is included in compensation expense on the accompanying statement of operations.
Deferred Compensation
In June 2002, we established a supplemental executive retirement plan, or SERP, providing for retirement benefits to Betsy Z. Cohen, our former Chairman, as required by her employment agreement with us. Under the terms of the SERP Plan, Mrs. Cohen received various share and cash benefits from 2007 through 2009. Pursuant
112
Table of Contents
to the terms of the SERP Plan, Mrs. Cohen received her final cash benefit distribution of $4,390 through a lump-sum payment in January 2009. We recognized SERP compensation expense (benefit) of $798 for the year ended December 31, 2008.
NOTE 12: EARNINGS (LOSS) PER SHARE
The following table presents a reconciliation of basic and diluted earnings (loss) per share for the three years ended December 31, 2010:
| For the Years Ended December 31 | ||||||||||||
| 2010 | 2009 | 2008 | ||||||||||
| Income (loss) from continuing operations |
$ | 110,590 | $ | (440,141 | ) | $ | (617,130 | ) | ||||
| Income allocated to preferred shares |
(13,641 | ) | (13,641 | ) | (13,641 | ) | ||||||
| Income allocated to noncontrolling interests |
880 | 13,419 | 189,580 | |||||||||
| Income (loss) from continuing operations allocable to common shares |
97,829 | (440,363 | ) | (441,191 | ) | |||||||
| Income (loss) from discontinued operations |
323 | (840 | ) | (2,055 | ) | |||||||
| Net income (loss) allocable to common shares |
$ | 98,152 | $ | (441,203 | ) | $ | (443,246 | ) | ||||
| Weighted-average shares outstanding—Basic |
86,854,265 | 65,205,233 | 63,394,447 | |||||||||
| Dilutive securities under the treasury stock method |
1,397,747 | — | — | |||||||||
| Weighted-average shares outstanding—Diluted |
88,252,012 | 65,205,233 | 63,394,447 | |||||||||
| Earnings (loss) per share—Basic: |
||||||||||||
| Continuing operations |
$ | 1.13 | $ | (6.76 | ) | $ | (6.96 | ) | ||||
| Discontinued operations |
— | (0.01 | ) | (0.03 | ) | |||||||
| Total earnings (loss) per share—Basic |
$ | 1.13 | $ | (6.77 | ) | $ | (6.99 | ) | ||||
| Earnings (loss) per share—Diluted: |
||||||||||||
| Continuing operations |
$ | 1.11 | $ | (6.76 | ) | $ | (6.96 | ) | ||||
| Discontinued operations |
— | (0.01 | ) | (0.03 | ) | |||||||
| Total earnings (loss) per share—Diluted |
$ | 1.11 | $ | (6.77 | ) | $ | (6.99 | ) | ||||
For the years ended December 31, 2010, 2009 and 2008, securities convertible into 11,094,817, 15,612,224, and 13,109,658, common shares, respectively, were excluded from the earnings (loss) per share computations because their effect would have been anti-dilutive.
NOTE 13: INCOME TAXES
RAIT and Taberna have elected to be taxed as REITs under Sections 856 through 860 of the Internal Revenue Code. To maintain qualification as a REIT, we must meet certain organizational and operational requirements, including a requirement to distribute at least 90% of our ordinary taxable income to shareholders. We generally will not be subject to U.S. federal income tax on taxable income that is distributed to our shareholders. If RAIT or Taberna fails to qualify as a REIT in any taxable year, we will then be subject to U.S. federal income taxes on our taxable income at regular corporate rates, and we will not be permitted to qualify for treatment as a REIT for U.S. federal income tax purposes for four years following the year during which qualification is lost unless the Internal Revenue Service grants relief under certain statutory provisions. Such an event could materially adversely affect our net income and cash available for distributions to shareholders. However, we believe that both RAIT and Taberna will be organized and operated in such a manner as to qualify for treatment as a REIT, and both intend to operate in the foreseeable future in a manner so that both will qualify as a REIT. We may be subject to certain state and local taxes.
113
Table of Contents
Our TRS entities generate taxable revenue from fees for services provided to CDO entities. Some of these fees paid to the TRS entities are capitalized as deferred costs by the CDO entities. In consolidation, these fees are eliminated when the CDO entity is included in the consolidated group. Nonetheless, all income taxes are expensed and are paid by the TRSs in the year in which the revenue is received. These income taxes are not eliminated when the related revenue is eliminated in consolidation.
The components of the provision for income taxes as it relates to our taxable income from domestic TRSs during the years ended December 31, 2010, 2009 and 2008 includes the effects of our performance of a portion of its TRS services in a foreign jurisdiction that does not incur income taxes.
Certain TRS entities are domiciled in the Cayman Islands and, accordingly, taxable income generated by these entities may not be subject to local income taxation, but generally will be included in our income on a current basis as SubPart F income, whether or not distributed. Upon distribution of any previously included SubPart F income by these entities, no incremental U.S. federal, state, or local income taxes would be payable by us. Accordingly, no provision for income taxes has been recorded for these foreign TRS entities for the years ended December 31, 2010, 2009 and 2008.
The components of the income tax benefit (provision) as it relates to our taxable income (loss) from domestic and foreign TRSs during the years ended December 31, 2010, 2009 and 2008 were as follows:
| For the Year Ended December 31, 2010 | ||||||||||||||||
| Federal | State and Local | Foreign | Total | |||||||||||||
| Current benefit (provision) |
$ | (2,844 | ) | $ | (10 | ) | $ | (510 | ) | $ | (3,364 | ) | ||||
| Deferred benefit (provision) |
2,143 | 162 | (543 | ) | 1,762 | |||||||||||
| Income tax benefit (provision) |
$ | (701 | ) | $ | 152 | $ | (1,053 | ) | $ | (1,602 | ) | |||||
| For the Year Ended December 31, 2009 | ||||||||||||||||
| Federal | State and Local | Foreign | Total | |||||||||||||
| Current benefit (provision) |
$ | 1,085 | $ | — | $ | (1,210 | ) | $ | (125 | ) | ||||||
| Deferred benefit (provision) |
450 | 58 | 575 | 1,083 | ||||||||||||
| Income tax benefit (provision) |
$ | 1,535 | $ | 58 | $ | (635 | ) | $ | 958 | |||||||
| For the Year Ended December 31, 2008 | ||||||||||||||||
| Federal | State and Local | Foreign | Total | |||||||||||||
| Current benefit (provision) |
$ | 4,126 | $ | 231 | $ | (982 | ) | $ | 3,375 | |||||||
| Deferred benefit (provision) |
(1,004 | ) | (234 | ) | — | (1,238 | ) | |||||||||
| Income tax benefit (provision) |
$ | 3,122 | $ | (3 | ) | $ | (982 | ) | $ | 2,137 | ||||||
A reconciliation of the income tax benefit (provision) based upon the statutory tax rates to the effective rates is as follows for the years ended December 31, 2010, 2009 and 2008:
| For the Years Ended December 31 |
||||||||||||
| 2010 | 2009 | 2008 | ||||||||||
| Federal statutory rate |
$ | 22 | $ | 436 | $ | 15,832 | ||||||
| State statutory, net of federal benefit |
162 | 59 | — | |||||||||
| Change in valuation allowance |
(50 | ) | (1,879 | ) | (18,086 | ) | ||||||
| Permanent items |
(53 | ) | (724 | ) | (859 | ) | ||||||
| Foreign tax effects |
803 | 3,066 | 5,250 | |||||||||
| Transfer pricing adjustment (1) |
(2,503 | ) | — | — | ||||||||
| Other |
17 | — | — | |||||||||
| Income tax benefit (provision) |
$ | (1,602 | ) | $ | 958 | $ | 2,137 | |||||
114
Table of Contents
| (1) | In February 2011, management and the IRS settled tax examinations for 2006, 2007 and 2008 for a total cash payment of $296. These tax examinations related to certain transfer pricing adjustments for transactions between TCM and TCB during those years. While the total transfer pricing adjustment increased our tax expense by $2,503 during 2010, the net cash payment made to the IRS in February 2011 was $296, after utilization of net operating losses in these prior years. |
Significant components of our deferred tax assets (liabilities), at our TRSs, are as follows as of December 31, 2010 and 2009:
| Deferred tax assets (liabilities): |
As of December 31, 2010 |
As of December 31, 2009 |
||||||
| Net operating losses, at TRSs |
$ | 12,156 | $ | 11,984 | ||||
| Capital losses |
662 | 6,705 | ||||||
| Unrealized losses |
12,023 | 13,296 | ||||||
| Other |
2,251 | 371 | ||||||
| Total deferred tax assets (liabilities) |
27,092 | 32,356 | ||||||
| Valuation allowance |
(25,359 | ) | (31,273 | ) | ||||
| Net deferred tax assets (liabilities) |
$ | 1,733 | $ | 1,083 | ||||
As of December 31, 2010, we had $93,104 of federal and state net operating losses, $3,836 of foreign net operating losses and $1,892 of capital losses. The federal net operating losses will begin to expire in 2028, the state net operating losses will begin to expire in 2017 and the foreign operating losses have an indefinite carryforward period. TCM’s NOL for 2008 was reduced by $6,300 as a result of the IRS Transfer Pricing Adjustment, which as noted above resulted in a $296 net cash payment to the IRS. The capital losses will expire in 2012. We have concluded that it is more likely than not that $81,705 of federal and state net operating losses and all of the capital losses will not be utilized during their respective carry forward periods; and as such, we have established a valuation allowance against these deferred tax assets.
The accounting guidance for income taxes clarifies the accounting for uncertainty in income taxes, and prescribes a recognition threshold and measurement attribute for the financial statement recognition and measurement of a tax position taken or expected to be taken in a tax return. The guidance also provides rules on derecognition, classification, interest and penalties, accounting in interim periods, disclosure, and transition. We have no uncertain tax positions for the years ending December 31, 2010, 2009 and 2008.
NOTE 14: RELATED PARTY TRANSACTIONS
In the ordinary course of our business operations, we have ongoing relationships and have engaged in transactions with several related entities described below. All of these relationships and transactions were approved or ratified by a majority of our independent trustees as being on terms comparable to those available on an arm’s-length basis from an unaffiliated third party or otherwise not creating a conflict of interest.
Mrs. Betsy Z. Cohen retired as our Chairman of the Board and as a Trustee effective December 31, 2010. Mrs. Cohen, is the Chief Executive Officer and a director of The Bancorp, Inc., or Bancorp, and Chairman of the Board and Chief Executive Officer of its wholly-owned subsidiary, The Bancorp Bank, a commercial bank. Mrs. Cohen’s son, Daniel G. Cohen, was our chief executive officer from the date of the Taberna acquisition until his resignation from that position on February 22, 2009. Mr. Cohen was a trustee of RAIT from the date of the Taberna acquisition until his resignation from that position on February 26, 2010. Mr. Cohen is the Chairman of the Board of Bancorp and Chairman of its Executive Committee and Vice-Chairman of the Board of Bancorp Bank and Chairman of its Executive Committee. Scott F. Schaeffer is our Chairman and a Trustee and Chief
115
Table of Contents
Executive Officer and President. Mr. Schaeffer’s spouse is a director of Bancorp and she and Mr. Schaeffer own, in the aggregate, less than 1% of Bancorp’s outstanding common shares. Each transaction with Bancorp is described below:
a). Cash and Restricted Cash—We maintain checking and demand deposit accounts at Bancorp. As of December 31, 2010 and December 31, 2009, we had $72 and $410, respectively, of cash and cash equivalents and $985 and $1,601, respectively, of restricted cash on deposit at Bancorp. During the years ended December 31, 2010, 2009 and 2008, we received $53, $11, and $123, respectively, of interest income from Bancorp. Restricted cash held at Bancorp relates to borrowers’ escrows for taxes, insurance and capital reserves. Any interest earned on these deposits enures to the benefit of the specific borrower and not to us.
b). Office Leases—We sublease a portion of our downtown Philadelphia office space from Bancorp at an annual rental expense based upon the amount of square footage occupied. We have signed a sublease agreement with a third party for the remaining term of our sublease. Rent paid to Bancorp was $304, $300, and $340 for the years ended December 31, 2010, 2009 and 2008, respectively. Rent received for our sublease was $166 for the year ended December 31, 2010.
c). Participation Interests—We funded a $54,000 commercial mortgage during January 2008. At closing, Bancorp purchased a participation interest in this loan for a total commitment of $24,300. We also funded a $70,000 commercial mortgage during January 2008. At closing, Bancorp purchased a participation interest in this loan for a total commitment of $26,500, of which $22,500 was funded at closing. In November 2008, RAIT CRE CDO I, Ltd. purchased $19,268 of the outstanding loan balance of the second loan from Bancorp and RAIT Preferred Funding II, Ltd. purchased the remaining $3,232 outstanding from Bancorp. We paid Bancorp fees of $321 for its services in connection with the closing of these loans.
Mr. Cohen holds controlling positions in various companies with which we conduct business. Mr. Cohen serves as the Chairman of the board of directors, Chief Executive Officer and Chief Investment Officer of Institutional Financial Markets, Inc. or, IFMI, and as the Chairman of the board of managers, Chief Executive Officer and Chief Investment Officer of IFMI, LLC, or IFMI LLC, a majority owned subsidiary of IFMI. Each transaction between us and IFMI and IFMI LLC is described below:
a). Office Leases—We maintain sub-lease agreements for shared office space and facilities with IFMI. Rent expense during the years ended December 31, 2010, 2009 and 2008 relating to these leases was $50. Rent expense has been included in general and administrative expense in the accompanying consolidated statements of operations. Future minimum lease payments due over the remaining term of the lease are $258.
b). Shared Services—We previously paid IFMI for services relating to structuring and managing our investments in CMBS and RMBS. The agreement with IFMI for these services terminated on July 1, 2008 and we did not renew or extend this agreement. During the year ended December 31, 2008, we incurred total shared service expenses of $519. These shared service expenses have been included in general and administrative expense in the accompanying consolidated statements of operations.
c). Non-Competition Agreement—As part of the spin-off of Taberna from IFMI in April 2005 and before our acquisition of Taberna in December 2006, Taberna and IFMI entered into a three-year non-competition agreement that ended in April 2008. As part of our acquisition of Taberna, we valued this non-competition agreement as an amortizing intangible asset and the intangible asset has been fully amortized.
d). Common Shares— As of December 31, 2009, IFMI and its affiliate entities owned 510,434 of our common shares. During the year ended December 31, 2010, IFMI and its affiliates sold these shares and do not own any of our common shares as of December 31, 2010.
116
Table of Contents
e). Brokerage Services—During 2010, IFMI sold $7,000 in aggregate principal amount of debt securities to an unrelated third party using the broker-dealer services of RAIT Securities, LLC, for which we earned $38 in principal transaction income. During the year ended December 31, 2009 we repurchased $14,000 of our RAIT CRE CDO I notes payable rated BBB and $300 of CMBS receivables from a third party using the broker-dealer services of IFMI. IFMI received $113 of total principal transaction income in connection with these transactions.
f). Star Asia— Star Asia is an affiliate of IFMI. During 2010, Star Asia purchased $2,315 in aggregate principal of debt securities from an unrelated third party using the broker-dealer services of RAIT Securities, LLC, for which we did not earn any principal transaction income. In March 2009, Star Asia issued debt securities to a third party, upon which a subsequent exchange offer was entered into with Taberna Preferred Funding III, Ltd., or Taberna III, for $22,425 and Taberna Preferred Funding IV, Ltd., or Taberna IV, for $19,434. Taberna Capital Management is the collateral manager for Taberna III and Taberna IV. We received an opinion from an independent third party concluding that the transaction was fair from Taberna III and IV’s financial viewpoint. There were no fees earned by Taberna Capital Management or Star Asia. In June 2009 we sold our interests in Taberna III and Taberna IV.
g). Trust Preferred Securities—In October 2008, we re-purchased $25,000 principal amount of our TruPS that we issued from a third party using the broker-dealer services of IFMI, for which IFMI received $70 in principal transaction income.
h). Kleros Preferred Funding VIII, Ltd.—Kleros Preferred Funding VIII, Ltd., or Kleros VIII, is a securitization managed by IFMI. In June 2007, we purchased approximately $26,400 in par amount of bonds rated A through BBB issued by Kleros VIII, for a purchase price of approximately $23,997. As of December 31, 2010, the bonds have a current fair value of $0 and have been on non-accrual since December 31, 2007.
Edward E. Cohen, the spouse of Betsy Z. Cohen and father of Daniel G. Cohen, is the Chairman of Resource America, Inc, or Resource America. Jonathan Z. Cohen, the son of Betsy Z. Cohen and brother of Daniel G. Cohen, is the Chief Executive Officer of Resource America. During the year ended December 31, 2009, we repurchased $3,500 of our RAIT CRE CDO I notes payable rated BBB from a third party using the broker-dealer services of a subsidiary of Resource America. The Resource America subsidiary received $7 principal transaction income in connection with this transaction.
Brandywine Construction & Management, Inc., or Brandywine, is an affiliate of Edward E. Cohen. Brandywine provided real estate management services to two properties underlying our investments in real estate. During the years ended December 31, 2010, 2009 and 2008, Brandywine earned management fees of $92, $94, and $123, respectively. We believe that the management fees charged by Brandywine are comparable to those that could be obtained from unaffiliated third parties.
We had a $3,369 first mortgage loan secured by Pennsview Apartments that had a junior lien against it that was held by an entity controlled by Daniel G. Cohen. Our loan bore interest at a fixed rate of 8.0%, was to mature on March 29, 2008 and was paying in accordance with its terms. In March 2008, we transferred our first mortgage loan to another entity controlled by Mr. Cohen for $3,500, representing the outstanding principal balance of, and accrued interest on, the loan and an exit fee.
117
Table of Contents
NOTE 15: ASSETS HELD FOR SALE AND DISCONTINUED OPERATIONS
As of December 31, 2010, we had one property designated as held for sale. As of December 31, 2009, we had four properties designated as held for sale. The following table summarizes the consolidated balance sheet of the real estate properties classified as assets held for sale:
| As of December 31, 2010 |
As of December 31, 2009 |
|||||||
| Assets: |
||||||||
| Investments in real estate |
$ | 48,859 | $ | 79,790 | ||||
| Cash and cash equivalents |
386 | 1,069 | ||||||
| Other assets |
2,668 | 2,410 | ||||||
| Deferred financing costs, net |
— | 161 | ||||||
| Total assets held for sale |
$ | 51,913 | $ | 83,430 | ||||
| Liabilities: |
||||||||
| Other indebtedness |
$ | — | $ | 18,508 | ||||
| Accrued interest payable |
— | 62 | ||||||
| Accounts payable and accrued expenses |
1,039 | 1,667 | ||||||
| Other liabilities |
699 | 766 | ||||||
| Total liabilities related to assets held for sale (a) |
$ | 1,738 | $ | 21,003 | ||||
| (a) | Liabilities related to assets held for sale excludes a $42,958 first mortgage held by RAIT II that is eliminated in our consolidated balance sheet. |
For the years ended December 31, 2010, 2009 and 2008, income (loss) from discontinued operations relates to four real estate properties designated as held for sale and three real estate properties sold or deconsolidated since January 1, 2008. The following table summarizes revenue and expense information for real estate properties classified as discontinued operations:
| For the Years Ended December 31 | ||||||||||||
| 2010 | 2009 | 2008 | ||||||||||
| Rental income |
$ | 9,688 | $ | 9,471 | $ | 3,983 | ||||||
| Expenses: |
||||||||||||
| Real estate operating expenses |
5,895 | 6,695 | 4,797 | |||||||||
| General and administrative expense |
— | 19 | — | |||||||||
| Depreciation expense |
1,790 | 2,893 | 1,305 | |||||||||
| Total expenses |
7,685 | 9,607 | 6,102 | |||||||||
| Income (loss) before interest and other income |
2,003 | (136 | ) | (2,119 | ) | |||||||
| Interest and other income |
2 | 959 | 64 | |||||||||
| Income (loss) from discontinued operations |
2,005 | 823 | (2,055 | ) | ||||||||
| Gain (loss) from discontinued operations |
(1,682 | ) | (1,663 | ) | — | |||||||
| Total income (loss) from discontinued operations |
$ | 323 | $ | (840 | ) | $ | (2,055 | ) | ||||
Discontinued operations have not been segregated in the consolidated statements of cash flows. Therefore, amounts for certain captions will not agree with respective data in the consolidated statements of operations.
118
Table of Contents
NOTE 16: QUARTERLY FINANCIAL DATA (UNAUDITED)
The following table summarizes our quarterly financial data which, in the opinion of management, reflects all adjustments, consisting only of normal recurring adjustments, necessary for a fair presentation of our results of operations:
| For the Three-Month Periods Ended | ||||||||||||||||
| March 31 | June 30 | September 30 | December 31 | |||||||||||||
| 2010: |
||||||||||||||||
| Total revenue |
$ | 42,689 | $ | 37,137 | $ | 36,484 | $ | 37,118 | ||||||||
| Change in fair value of financial instruments |
16,437 | 4,446 | 14,237 | 10,720 | ||||||||||||
| Net income (loss) |
34,453 | 25,376 | 18,248 | 32,836 | ||||||||||||
| Net income (loss) allocable to common shares |
31,282 | 22,319 | 15,052 | 29,499 | ||||||||||||
| Total earnings (loss) per share—Basic (a) |
$ | 0.42 | $ | 0.28 | $ | 0.17 | $ | 0.29 | ||||||||
| Total earnings (loss) per share—Diluted (a) |
$ | 0.41 | $ | 0.27 | $ | 0.16 | $ | 0.29 | ||||||||
| 2009: |
||||||||||||||||
| Total revenue |
$ | 59,779 | $ | 57,831 | $ | 41,425 | $ | 38,475 | ||||||||
| Change in fair value of financial instruments |
(99,805 | ) | 91,357 | (3,808 | ) | 13,819 | ||||||||||
| Net income (loss) |
(148,414 | ) | (289,261 | ) | (21,789 | ) | 18,483 | |||||||||
| Net income (loss) allocable to common shares |
(144,232 | ) | (287,867 | ) | (24,692 | ) | 15,588 | |||||||||
| Total earnings (loss) per share—Basic (a) |
$ | (2.22 | ) | $ | (4.43 | ) | $ | (0.38 | ) | $ | 0.24 | |||||
| Total earnings (loss) per share—Diluted (a) |
$ | (2.22 | ) | $ | (4.43 | ) | $ | (0.38 | ) | $ | 0.24 | |||||
| (a) | The summation of quarterly per share amounts do not equal the full year amounts. |
NOTE 17: OTHER DISCLOSURES
Segments
We have identified one operating segment; accordingly we have determined that it has one reportable segment. As a group, our executive officers act as the Chief Operating Decision Maker (“CODM”). The CODM reviews operating results to make decisions about all investments and resources and to assess performance for the entire company. Our portfolio consists of one reportable segment, investments in real estate through the mechanism of lending and/or ownership. The CODM manages and reviews our operations as one unit. Resources are allocated without regard to the underlying structure of any investment, but rather after evaluating such economic characteristics as returns on investment, leverage ratios, current portfolio mix, degrees of risk, income tax consequences and opportunities for growth. We have no single customer that accounts for 10% or more of revenue.
Commitments and Contingencies
Unfunded Loan Commitments
Certain of our commercial mortgages and mezzanine loan agreements contain provisions whereby we are required to advance additional funds to our borrowers for capital improvements and upon the achievement of certain property operating hurdles. As of December 31, 2010, our incremental loan commitments are $63,637, which will be funded from either restricted cash held on deposit or revolving debt capacity dedicated for these purposes.
119
Table of Contents
Employment Agreements
We are party to employment agreements with certain executives that provide for compensation and certain other benefits. The agreements also provide for severance payments under certain circumstances.
Litigation
Riverside National Bank of Florida Litigation
RAIT subsidiary Taberna Capital Management, LLC is one of fifteen defendants in a lawsuit by the Federal Deposit Insurance Corporation, as Receiver for Riverside National Bank of Florida. The lawsuit was originally commenced by Riverside on August 6, 2009 in the Supreme Court of the State of New York, County of Kings, and subsequently discontinued without prejudice and refiled in New York County on November 13, 2009. On April 16, 2010, the Office of the Comptroller of the Currency closed Riverside and named the FDIC as receiver and thus as successor-in-interest to Riverside as plaintiff in the action. On June 3, 2010, the defendants removed the case to the United States District Court for the Southern District of New York. The action, now titled FDIC v. The McGraw-Hill Companies, Inc., Moody’s Investors Service, Inc., Fitch, Inc., Taberna Capital Management, LLC, Cohen & Company Financial Management, LLC f/k/a Cohen Bros. Financial Management LLC, FTN Financial Capital Markets, Keefe Bruyette & Woods, Inc., Merrill Lynch, Pierce, Fenner & Smith, Inc., JPMorgan Chase & Co., J.P. Morgan Securities Inc., Citigroup Global Markets, Credit Suisse Securities (USA) LLC, ABN Amro, Inc., Cohen & Company, and SunTrust Robinson Humphrey, Inc., asserts claims in connection with Riverside’s purchase of certain CDO securities, including securities from the Taberna Preferred Funding II, IV, and V CDOs. Riverside alleges that offering materials issued in connection with the CDOs it purchased did not adequately disclose the process by which the rating agencies rated each of the securities. Riverside also alleges, among other things, that the offering materials should have disclosed an alleged conflict of interest of the rating agencies as well as the role that the rating agencies played in structuring each CDO. Riverside seeks damages in excess of $132 million, rescission of its purchases of the securities at issue, an accounting of certain amounts received by the defendants together with the imposition of a constructive trust, and punitive damages of an unspecified amount.
On June 25, 2010, the federal court directed the parties to refile papers supporting and opposing the defendants’ motions to dismiss, which had been filed in state court but not argued or decided. On August 20, 2010, the court granted the FDIC’s motion for substitution of counsel and to stay the action for 90 days, and on October 28, 2010, it granted an additional 90-day stay at the FDIC’s request. On January 20, 2011, the court granted a third motion by the FDIC to stay the action until April 29, 2011. Defendants must refile their motions to dismiss or answer Plaintiff’s complaint by May 2, 2011. An adverse resolution of the litigation could have a material adverse effect on our financial condition and results of operations.
Routine Litigation
We are involved from time to time in litigation on various matters, including disputes with tenants of owned properties, disputes arising out of agreements to purchase or sell properties and disputes arising out of our loan portfolio. Given the nature of our business activities, these lawsuits are considered routine to the conduct of our business. The result of any particular lawsuit cannot be predicted, because of the very nature of litigation, the litigation process and its adversarial nature, and the jury system. We do not expect that the liabilities, if any, that may ultimately result from such routine legal actions will have a material adverse effect on our consolidated financial position, results of operations or cash flows.
120
Table of Contents
Lease Obligations
We lease office space in Philadelphia, New York City, and other locations. The annual minimum rent due pursuant to the leases for each of the next five years and thereafter is estimated to be as follows as of December 31, 2010:
| 2011 |
$ | 2,257 | ||
| 2012 |
2,188 | |||
| 2013 |
2,430 | |||
| 2014 |
2,063 | |||
| 2015 |
2,017 | |||
| Thereafter |
22,042 | |||
| Total |
$ | 32,997 | ||
Rent expense was $1,976, $2,990, and $1,977 for the years ended December 31, 2010, 2009, and 2008, respectively, and has been included in general and administrative expense or property operating expenses in the accompanying consolidated statements of operations.
NOTE 18: SUBSEQUENT EVENTS
Acquisition of Non-Traded Public REIT
On January 20, 2011, we acquired a development stage, non-traded public REIT and subsequently changed its name to Independence Realty Trust, Inc., or Independence. We paid approximately $2.3 million for Independence and certain of its affiliated entities including the entity that serves as Independence’s external advisor. RAIT will be the sponsor of Independence’s offering and expects Independence to raise capital for investing in commercial real estate assets. We expect to incur expenses on Independence’s behalf in connection with this offering and our ability to be reimbursed for these expenses will be dependent on the terms and success of the offering. This disclosure is neither an offer nor a solicitation to purchase Independence’s securities.
Convertible Senior Notes Repurchases
In February 2011, we repurchased $7,500 in aggregate principal amount of our convertible senior notes for a total consideration consisting of a cash payment of $6,613. We recorded a gain on the extinguishment of debt of $874, net of deferred financing costs and unamortized discounts that were written off.
Senior Secured Convertible Note Conversions
In February 2011, the holder of the senior secured convertible note converted $5,250 principal amount of the senior secured convertible note into 1,500,000 common shares.
121
Table of Contents
Schedule II
Valuation and Qualifying Accounts
For the Three Years Ended December 31, 2010
(Dollars in thousands)
| Balance, Beginning of Period |
Additions(a) | Deductions(b) | Balance, End of Period |
|||||||||||||
| For the year ended December 31, 2010 |
$ | 86,609 | $ | 38,307 | $ | (55,225 | ) | $ | 69,691 | |||||||
| For the year ended December 31, 2009 |
$ | 171,973 | $ | 226,567 | $ | (311,931 | ) | $ | 86,609 | |||||||
| For the year ended December 31, 2008 |
$ | 26,389 | $ | 162,783 | $ | (17,199 | ) | $ | 171,973 | |||||||
| (a) | For the year ended December 31, 2009 and 2008, additions include $96,487 and $55,423, respectively, associated with our residential mortgage portfolio. |
| (b) | For the year ended December 31, 2009 and 2008, deductions include $150,723 and $13,001, respectively, associated with our residential mortgage portfolio. |
122
Table of Contents
Schedule III
Real Estate and Accumulated Depreciation
As of December 31, 2010
(Dollars in thousands)
| Initial Cost | Cost of Improvements, net of Retirements |
Gross Carrying Amount |
Accumulated Depreciation- Building |
Encumbrances (Unpaid Principal) |
Year of Acquisition |
Life of Depreciation |
||||||||||||||||||||||||||||||||||||||
| Property Name |
Description | Location | Land | Building | Land | Building | Land(1) | Building(1) | ||||||||||||||||||||||||||||||||||||
| Willow Grove |
Land | Willow Grove, PA | $ | 307 | $ | — | $ | — | $ | — | $ | 307 | $ | — | $ | — | $ | — | 2001 | N/A | ||||||||||||||||||||||||
| Cherry Hill |
Land | Cherry Hill, NJ | 307 | — | — | — | 307 | — | — | — | 2001 | N/A | ||||||||||||||||||||||||||||||||
| Reuss |
Office | Milwaukee, WI | 4,080 | 36,720 | 10 | 12,642 | 4,090 | 49,362 | (9,794 | ) | (31,905 | ) (3) | 2004 | 30 | ||||||||||||||||||||||||||||||
| McDowell |
Office | Scottsdale, AZ | 9,803 | 55,523 | 5 | 2,946 | 9,808 | 58,469 | (5,280 | ) | (70,260 | ) (2) | 2007 | 30 | ||||||||||||||||||||||||||||||
| Stonecrest |
Multi-Family | Birmingham, AL | 5,858 | 23,433 | (31 | ) | (125 | ) | 5,827 | 23,308 | (1,911 | ) | (26,625 | ) (4) | 2008 | 30 | ||||||||||||||||||||||||||||
| Crestmont |
Multi-Family | Marietta, GA | 3,207 | 12,828 | 47 | 202 | 3,254 | 13,030 | (1,065 | ) | (13,667 | ) (2) | 2008 | 30 | ||||||||||||||||||||||||||||||
| Copper Mill |
Multi-Family | Austin, TX | 3,420 | 13,681 | 52 | 219 | 3,472 | 13,900 | (1,139 | ) | (14,709 | ) (2) | 2008 | 30 | ||||||||||||||||||||||||||||||
| Cumberland |
Multi-Family | Smyrna, GA | 3,194 | 12,776 | (94 | ) | 347 | 3,100 | 13,123 | (1,070 | ) | (13,536 | ) (2) | 2008 | 30 | |||||||||||||||||||||||||||||
| Heritage Trace |
Multi-Family | Newport News, VA |
2,642 | 10,568 | 77 | 132 | 2,719 | 10,700 | (881 | ) | (11,027 | ) (2) | 2008 | 30 | ||||||||||||||||||||||||||||||
| Mandalay Bay |
Multi-Family | Austin, TX | 5,363 | 21,453 | 99 | 418 | 5,462 | 21,871 | (1,788 | ) | (21,865 | ) (2) | 2008 | 30 | ||||||||||||||||||||||||||||||
| Oyster Point |
Multi-Family | Newport News, VA |
3,920 | 15,680 | 59 | 200 | 3,979 | 15,880 | (1,300 | ) | (16,837 | ) (2) | 2008 | 30 | ||||||||||||||||||||||||||||||
| Tuscany Bay |
Multi-Family | Orlando, FL | 7,002 | 28,009 | 122 | 520 | 7,124 | 28,529 | (2,331 | ) | (29,507 | ) (2) | 2008 | 30 | ||||||||||||||||||||||||||||||
| Prentiss Creek (8) |
Multi-Family | Downers Grove, IL |
10,166 | 40,665 | 184 | 798 | 10,350 | 41,463 | (2,954 | ) | (41,853 | ) (2) | 2008 | 30 | ||||||||||||||||||||||||||||||
| Colonial Parc |
Multi-Family | Little Rock, AR | 910 | 3,639 | — | 594 | 910 | 4,233 | (323 | ) | (9,172 | ) (2) | 2009 | 30 | ||||||||||||||||||||||||||||||
| Corey Landings |
Land | St. Pete Beach, FL | 21,595 | — | — | — | 21,595 | — | — | — | 2009 | N/A | ||||||||||||||||||||||||||||||||
| Sharpstown Mall |
Retail | Houston, TX | 6,737 | 26,948 | — | 3,027 | 6,737 | 29,975 | (1,744 | ) | (43,169 | ) (2) | 2009 | 30 | ||||||||||||||||||||||||||||||
| Belle Creek Apartments |
Multi-Family | Henderson, CO | 1,890 | 7,562 | — | 32 | 1,890 | 7,594 | (463 | ) | (15,224 | ) (2) | 2009 | 30 | ||||||||||||||||||||||||||||||
| Willows |
Multi-Family | Las Vegas, NV | 2,184 | 8,737 | — | 3 | 2,184 | 8,740 | (559 | ) | (11,800 | ) (2) | 2009 | 30 | ||||||||||||||||||||||||||||||
| Regency Meadows |
Multi-Family | Las Vegas, NV | 1,875 | 7,499 | — | 130 | 1,875 | 7,629 | (467 | ) | (10,127 | ) (2) | 2009 | 30 | ||||||||||||||||||||||||||||||
| Executive Center |
Office | Milwaukee, WI | 1,581 | 6,324 | 16 | 213 | 1,597 | 6,537 | (351 | ) | (8,620 | ) (2) | 2009 | 30 | ||||||||||||||||||||||||||||||
| Remington |
Multi-Family | Tampa, FL | 4,273 | 17,092 | — | 1,692 | 4,273 | 18,784 | (1,145 | ) | (24,750 | ) (2) | 2009 | 30 | ||||||||||||||||||||||||||||||
| Desert Wind |
Multi-Family | Phoenix, AZ | 2,520 | 10,080 | — | 16 | 2,520 | 10,096 | (561 | ) | (12,373 | ) (2) | 2009 | 30 | ||||||||||||||||||||||||||||||
| Eagle Ridge |
Multi-Family | Colton, CA | 3,198 | 12,792 | — | 335 | 3,198 | 13,127 | (739 | ) | (16,731 | ) (2) | 2009 | 30 | ||||||||||||||||||||||||||||||
| Emerald Bay |
Multi-Family | Las Vegas, NV | 6,500 | 26,000 | — | 96 | 6,500 | 26,096 | (1,452 | ) | (28,008 | ) (2) | 2009 | 30 | ||||||||||||||||||||||||||||||
| Grand Terrace |
Multi-Family | Colton, CA | 4,619 | 18,477 | — | 139 | 4,619 | 18,616 | (1,029 | ) | (23,470 | ) (2) | 2009 | 30 | ||||||||||||||||||||||||||||||
| Las Vistas |
Multi-Family | Phoenix, AZ | 2,440 | 9,760 | — | 14 | 2,440 | 9,774 | (545 | ) | (12,178 | ) (2) | 2009 | 30 | ||||||||||||||||||||||||||||||
| Penny Lane |
Multi-Family | Mesa, AZ | 1,540 | 6,160 | — | 34 | 1,540 | 6,194 | (347 | ) | (9,409 | ) (2) | 2009 | 30 | ||||||||||||||||||||||||||||||
| Sandal Ridge |
Multi-Family | Mesa, AZ | 1,980 | 7,920 | — | 83 | 1,980 | 8,003 | (449 | ) | (11,495 | ) (2) | 2009 | 30 | ||||||||||||||||||||||||||||||
| Long Beach Promenade |
Office | Long Beach, CA | 860 | 3,440 | — | — | 860 | 3,440 | (153 | ) | (5,225 | ) (2) | 2009 | 30 | ||||||||||||||||||||||||||||||
| Murrells Retail Associates |
Retail | Myrtle Beach, SC | — | 2,500 | — | 2,625 | — | 5,125 | (104 | ) | (23,173 | ) (2) | 2009 | 30 | ||||||||||||||||||||||||||||||
| Preserve @ Colony Lakes |
Multi-Family | Stafford, TX | 6,720 | 26,880 | — | 35 | 6,720 | 26,915 | (1,124 | ) | (34,425 | ) (5) | 2009 | 30 | ||||||||||||||||||||||||||||||
123
Table of Contents
| Initial Cost | Cost of Improvements, net of Retirements |
Gross Carrying Amount |
Accumulated |
Encumbrances (Unpaid Principal) |
Year of Acquisition |
Life of Depreciation |
||||||||||||||||||||||||||||||||||||||||
| Property Name |
Description | Location | Land | Building | Land | Building | Land(1) | Building(1) | ||||||||||||||||||||||||||||||||||||||
| English Aire/Lafayette Landing |
Multi-Family | Austin, TX | 3,440 | 13,760 | — | 1,002 | 3,440 | 14,762 | (648 | ) | (18,000 | ) (2) | 2009 | 30 | ||||||||||||||||||||||||||||||||
| Tresa at Arrowheads |
Multi-Family | Phoenix, AZ | 7,080 | 28,320 | — | 132 | 7,080 | 28,452 | (1,115 | ) | (36,675 | ) (2) | 2009 | 30 | ||||||||||||||||||||||||||||||||
| Madison Park & Southgreen |
Multi-Family | Indianapolis, IN | 1,260 | 5,040 | — | 250 | 1,260 | 5,290 | (196 | ) | (7,520 | ) (2) | 2009 | 30 | ||||||||||||||||||||||||||||||||
| Mineral Business Center |
Office | Denver, CO | 1,940 | 7,760 | — | 60 | 1,940 | 7,820 | (259 | ) | (11,058 | ) (2) | 2009 | 30 | ||||||||||||||||||||||||||||||||
| 1501 Yamato Road |
Office | Boca Raton, FL | 8,200 | 32,800 | — | 1,218 | 8,200 | 34,018 | (1,093 | ) | (50,582 | ) (2) | 2009 | 30 | ||||||||||||||||||||||||||||||||
| Blair Mill |
Office | Willow Grove, PA | 2,280 | 9,120 | — | — | 2,280 | 9,120 | (304 | ) | (10,098 | ) (6) | 2010 | 30 | ||||||||||||||||||||||||||||||||
| Pine Tree |
Office | Cherry Hill, NJ | 1,980 | 7,920 | — | — | 1,980 | 7,920 | (264 | ) | (10,551 | ) (7) | 2010 | 30 | ||||||||||||||||||||||||||||||||
| Ventura |
Multi-Family | Gainesville, FL | 1,913 | 7,650 | — | 203 | 1,913 | 7,853 | (194 | ) | (10,473 | ) (2) | 2010 | 30 | ||||||||||||||||||||||||||||||||
| Lexington |
Multi-Family | Jackson, MS | 3,168 | 12,672 | — | 10 | 3,168 | 12,682 | (353 | ) | (18,276 | ) (2) | 2010 | 30 | ||||||||||||||||||||||||||||||||
| Trails at Northpoint |
Multi-Family | Jackson, MS | 1,354 | 5,414 | — | 133 | 1,354 | 5,547 | (168 | ) | (7,809 | ) (2) | 2010 | 30 | ||||||||||||||||||||||||||||||||
| Silversmith |
Multi-Family | Jacksonville, FL | 1,048 | 4,191 | — | 204 | 1,048 | 4,395 | (136 | ) | (9,515 | ) (2) | 2010 | 30 | ||||||||||||||||||||||||||||||||
| Tiffany Square |
Office | Colorado Springs, CO |
2,400 | 9,600 | — | 124 | 2,400 | 9,724 | (187 | ) | (12,395 | ) (2) | 2010 | 30 | ||||||||||||||||||||||||||||||||
| Vista Lago |
Multi-Family | Kendall, FL | — | 10,500 | — | — | — | 10,500 | (146 | ) | (14,972 | ) (2) | 2010 | 30 | ||||||||||||||||||||||||||||||||
| Centrepoint |
Multi-Family | Tucson, AZ | 5,620 | 22,480 | — | — | 5,620 | 22,480 | (312 | ) | (29,150 | ) (2) | 2010 | 30 | ||||||||||||||||||||||||||||||||
| Regency Manor |
Multi-Family | Miami, FL | 2,320 | 9,280 | — | — | 2,320 | 9,280 | (52 | ) | — | 2010 | 30 | |||||||||||||||||||||||||||||||||
| Vista Springs |
Multi-Family | Moreno Valley, CA |
4,040 | 16,160 | — | — | 4,040 | 16,160 | (109 | ) | (18,749 | ) (2) | 2010 | 30 | ||||||||||||||||||||||||||||||||
| $ | 178,734 | $ | 675,813 | $ | 546 | $ | 30,703 | $ | 179,280 | $ | 706,516 | $ | (46,604 | ) | $ | (856,963 | ) | |||||||||||||||||||||||||||||
| (1) | The aggregate cost basis for federal income tax purposes of our investments in real estate approximates the carrying amount at December 31, 2010. |
| (2) | These encumbrances are held by our consolidated securitizations, RAIT I, RAIT II, Taberna 8, or Taberna 9. |
| (3) | Of these encumbrances, $12,500 is held by third parties and $19,405 is held by RAIT I and RAIT II. |
| (4) | Of these encumbrances, $19,500 is held by third parties and $7,125 is held by RAIT I. |
| (5) | Of these encumbrances, $26,400 is held by third parties and $8,025 is held by RAIT I. |
| (6) | Of these encumbrances, $7,422 is held by third parties and $2,676 is held by RAIT. |
| (7) | Of these encumbrances, $9,054 is held by third parties and $1,497 is held by RAIT. |
| (8) | As of December 31, 2010, we designated Prentiss Creek, formerly known as Autumn Grove, as asset held for sale. |
124
Table of Contents
| Investments in Real Estate |
For the Year Ended December 31, 2010 |
For the Year Ended December 31, 2009 |
||||||
| Balance, beginning of period |
$ | 762,608 | $ | 375,097 | ||||
| Additions during period: |
||||||||
| Acquisitions |
144,387 | 416,751 | ||||||
| Improvements to land and building |
12,469 | 6,004 | ||||||
| Deductions during period: |
||||||||
| Dispositions of real estate |
(20,080 | ) | (17,100 | ) | ||||
| Deconsolidation of real estate |
(13,588 | ) | (18,144 | ) | ||||
| Balance, end of period: |
$ | 885,796 | $ | 762,608 | ||||
| Accumulated Depreciation |
For the Year Ended December 31, 2010 |
For the Year Ended December 31, 2009 |
||||||
| Balance, beginning of period |
$ | 25,548 | $ | 11,762 | ||||
| Depreciation expense |
22,387 | 15,714 | ||||||
| Dispositions of real estate |
(1,331 | ) | (1,371 | ) | ||||
| Other |
— | (557 | ) | |||||
| Balance, end of period: |
$ | 46,604 | $ | 25,548 | ||||
125
Table of Contents
Schedule IV
Mortgage Loans on Real Estate
As of December 31, 2010
(Dollars in thousands)
(1) Summary of Commercial Mortgages, Mezzanine Loans, Other Loans and Preferred Equity Interests
| Description of mortgages |
Number of Loans |
Interest Rate | Maturity Date | Principal | Carrying Amount of Mortgages |
|||||||||||||||||||||||||||
| Lowest | Highest | Earliest | Latest | Lowest | Highest | |||||||||||||||||||||||||||
| Commercial mortgages |
||||||||||||||||||||||||||||||||
| Multi-family |
16 | 5.0 | % | 8.0 | % | 3/14/11 | 12/31/20 | $ | 4,944 | $ | 31,801 | $ | 282,030 | |||||||||||||||||||
| Office |
15 | 4.1 | % | 8.5 | % | 3/1/11 | 3/1/16 | 691 | 26,085 | 186,398 | ||||||||||||||||||||||
| Retail |
9 | 5.0 | % | 9.2 | % | 3/1/11 | 10/2/13 | 2,790 | 73,980 | 203,879 | ||||||||||||||||||||||
| Other |
3 | 6.0 | % | 8.5 | % | 3/1/11 | 7/30/14 | 2,225 | 30,000 | 35,925 | ||||||||||||||||||||||
| Subtotal |
43 | 4.1 | % | 9.2 | % | 3/1/11 | 12/31/20 | 691 | 73,980 | 708,232 | ||||||||||||||||||||||
| Mezzanine loans |
||||||||||||||||||||||||||||||||
| Multi-family |
46 | 2.1 | % | 15.0 | % | 3/1/11 | 11/25/38 | 100 | 12,152 | 91,964 | ||||||||||||||||||||||
| Office |
36 | 2.8 | % | 12.5 | % | 3/1/11 | 1/17/21 | 248 | 26,406 | 175,684 | ||||||||||||||||||||||
| Retail |
19 | 6.3 | % | 12.5 | % | 11/1/11 | 6/11/17 | 210 | 25,860 | 84,133 | ||||||||||||||||||||||
| Other |
8 | 3.8 | % | 12.5 | % | 3/1/11 | 8/31/21 | 550 | 17,451 | 23,555 | ||||||||||||||||||||||
| Subtotal |
109 | 2.1 | % | 15.0 | % | 3/1/11 | 11/25/38 | 100 | 26,406 | 375,336 | ||||||||||||||||||||||
| Preferred equity interests |
||||||||||||||||||||||||||||||||
| Multi-family |
7 | 4.0 | % | 11.9 | % | 10/1/12 | 8/18/25 | 884 | 12,800 | 32,733 | ||||||||||||||||||||||
| Office |
12 | 9.1 | % | 11.0 | % | 11/1/11 | 1/1/17 | 90 | 16,305 | 35,649 | ||||||||||||||||||||||
| Retail |
2 | 9.9 | % | 12.0 | % | 3/1/14 | 10/11/16 | 1,300 | 5,000 | 6,300 | ||||||||||||||||||||||
| Other |
1 | 17.0 | % | 17.0 | % | 9/4/21 | 9/4/21 | 6,000 | 6,000 | 6,000 | ||||||||||||||||||||||
| Subtotal |
22 | 4.0 | % | 17.0 | % | 11/1/11 | 8/18/25 | 90 | 16,305 | 80,682 | ||||||||||||||||||||||
| Other loans |
||||||||||||||||||||||||||||||||
| Multi-family |
1 | 7.2 | % | 7.2 | % | 3/1/11 | 3/1/11 | 10,273 | 10,635 | 20,908 | ||||||||||||||||||||||
| Office |
3 | 2.5 | % | 7.3 | % | 3/1/11 | 10/30/16 | 301 | 20,138 | 21,512 | ||||||||||||||||||||||
| Other |
1 | 4.0 | % | 4.0 | % | 8/1/13 | 8/1/13 | 15,000 | 15,000 | 14,003 | ||||||||||||||||||||||
| Subtotal |
5 | 2.5 | % | 7.3 | % | 3/1/11 | 10/30/16 | 301 | 20,138 | 56,423 | ||||||||||||||||||||||
| Total commercial mortgages, mezzanine loans, preferred equity interests and other loans |
179 | 2.1 | % | 17.0 | % | 3/1/11 | 11/25/38 | $ | 90 | $ | 73,980 | $ | 1,220,673 | |||||||||||||||||||
| (a) | The tax basis of the commercial mortgages, mezzanine loans, other loans and preferred equity interests approximates the carrying amount. |
| (b) | Reconciliation of carrying amount of commercial mortgages, mezzanine loans, other loans and preferred equity interests: |
126
Table of Contents
| For the Year Ended December 31, 2010 |
For the Year Ended December 31, 2009 |
|||||||
| Balance, beginning of period |
$ | 1,469,322 | $ | 2,048,233 | ||||
| Additions during period: |
||||||||
| Additional advances |
31,284 | 17,357 | ||||||
| Accretion of discount |
3,606 | 1,139 | ||||||
| Deductions during period: |
||||||||
| Collections of principal |
(107,717 | ) | (81,914 | ) | ||||
| Conversion of loans to real estate owned property and charge-offs |
(175,822 | ) | (459,491 | ) | ||||
| Deconsolidation of VIEs |
— | (56,002 | ) | |||||
| Balance, end of period: |
$ | 1,220,673 | $ | 1,469,322 | ||||
(a) Summary of Commercial Mortgages, Mezzanine Loans, Preferred Equity and Other Loans by Geographic Location:
| Location by State |
Number of Loans |
Interest Rate | Principal | Total Carrying Amount of Mortgages (a) |
||||||||||||||||||||
| Lowest | Highest | Lowest | Highest | |||||||||||||||||||||
| Texas |
35 | 3.8 | % | 14.5 | % | 350 | 25,860 | $ | 234,931 | |||||||||||||||
| Various States |
12 | 2.5 | % | 12.5 | % | 301 | 73,980 | 221,134 | ||||||||||||||||
| New York |
12 | 6.5 | % | 12.5 | % | 691 | 21,746 | 123,578 | ||||||||||||||||
| Florida |
9 | 5.0 | % | 12.0 | % | 750 | 31,801 | 119,497 | ||||||||||||||||
| California |
15 | 2.8 | % | 12.5 | % | 248 | 20,000 | 107,228 | ||||||||||||||||
| Pennsylvania |
11 | 5.0 | % | 15.0 | % | 599 | 21,343 | 59,710 | ||||||||||||||||
| North Carolina |
3 | 2.1 | % | 7.3 | % | 4,471 | 28,617 | 55,065 | ||||||||||||||||
| Tennessee |
6 | 4.0 | % | 17.0 | % | 1,110 | 22,113 | 40,089 | ||||||||||||||||
| Minnesota |
5 | 5.0 | % | 12.5 | % | 422 | 16,531 | 39,854 | ||||||||||||||||
| Colorado |
4 | 6.3 | % | 12.0 | % | 3,000 | 26,085 | 39,659 | ||||||||||||||||
| Massachusetts |
3 | 5.2 | % | 12.0 | % | 994 | 18,500 | 36,736 | ||||||||||||||||
| Wisconsin |
16 | 9.8 | % | 12.5 | % | 90 | 3,200 | 20,259 | ||||||||||||||||
| Ohio |
5 | 6.5 | % | 12.5 | % | 432 | 12,168 | 19,418 | ||||||||||||||||
| Georgia |
5 | 7.3 | % | 12.5 | % | 299 | 5,749 | 12,839 | ||||||||||||||||
| New Jersey |
5 | 5.0 | % | 12.5 | % | 550 | 4,813 | 11,293 | ||||||||||||||||
| Alabama |
2 | 5.0 | % | 5.0 | % | 2,635 | 7,195 | 9,829 | ||||||||||||||||
| Missouri |
1 | 4.1 | % | 4.1 | % | 8,845 | 8,845 | 8,845 | ||||||||||||||||
| Connecticut |
1 | 12.0 | % | 12.0 | % | 554 | 4,000 | 8,302 | ||||||||||||||||
| Arizona |
2 | 5.0 | % | 6.0 | % | 100 | 8,000 | 8,100 | ||||||||||||||||
| Arkansas |
1 | 7.4 | % | 7.4 | % | 7,701 | 7,701 | 7,701 | ||||||||||||||||
| Idaho |
1 | 6.5 | % | 6.5 | % | 6,348 | 6,348 | 6,348 | ||||||||||||||||
| Maryland |
4 | 6.1 | % | 14.5 | % | 339 | 2,500 | 5,870 | ||||||||||||||||
| Indiana |
4 | 12.0 | % | 12.5 | % | 369 | 2,812 | 5,826 | ||||||||||||||||
| Nevada |
1 | 5.0 | % | 5.0 | % | 5,061 | 5,061 | 5,061 | ||||||||||||||||
| Illinois |
2 | 11.0 | % | 12.5 | % | 210 | 3,595 | 3,805 | ||||||||||||||||
| Virginia |
5 | 12.0 | % | 12.5 | % | 120 | 2,000 | 2,840 | ||||||||||||||||
| Michigan |
2 | 12.0 | % | 12.5 | % | 625 | 1,300 | 1,925 | ||||||||||||||||
| Vermont |
1 | 11.5 | % | 11.5 | % | 1,067 | 1,067 | 1,067 | ||||||||||||||||
| South Carolina |
1 | 12.5 | % | 12.5 | % | 1,000 | 1,000 | 1,045 | ||||||||||||||||
| Mississippi |
1 | 12.5 | % | 12.5 | % | 820 | 820 | 820 | ||||||||||||||||
| South Dakota |
1 | 12.5 | % | 12.5 | % | 739 | 739 | 739 | ||||||||||||||||
| Delaware |
1 | 12.5 | % | 12.5 | % | 670 | 670 | 670 | ||||||||||||||||
| Louisiana |
1 | 12.5 | % | 12.5 | % | 344 | 344 | 344 | ||||||||||||||||
| Kentucky |
1 | 12.5 | % | 12.5 | % | 246 | 246 | 246 | ||||||||||||||||
| 179 | 2.1 | % | 17.0 | % | $ | 90 | $ | 73,980 | $ | 1,220,673 | ||||||||||||||
127
Table of Contents
| Item 9. | Changes in and Disagreements with Accountants on Accounting and Financial Disclosure |
None.
| Item 9A. | Controls and Procedures |
Disclosure Controls and Procedures
We maintain disclosure controls and procedures that are designed to ensure that information required to be disclosed in our reports under the Securities Exchange Act of 1934, as amended, or the Exchange Act, is recorded, processed, summarized, and reported within the time periods specified in the SEC’s rules and forms, and that such information is accumulated and communicated to our management, including our chief executive officer and our chief financial officer, as appropriate, to allow timely decisions regarding required disclosure. In designing and evaluating the disclosure controls and procedures, our management recognized that any controls and procedures, no matter how well designed and operated, can provide only reasonable assurance of achieving the desired control objectives, and our management necessarily was required to apply its judgment in evaluating the cost-benefit relationship of possible controls and procedures.
Under the supervision of our chief executive officer and chief financial officer and with the participation of our disclosure committee, we have carried out an evaluation of the effectiveness of our disclosure controls and procedures as of the end of the period covered by this report. Based upon that evaluation, our chief executive officer and chief financial officer concluded that our disclosure controls and procedures are effective at the reasonable assurance level.
Management’s Annual Report on Internal Control Over Financial Reporting
Our management is responsible for establishing and maintaining adequate internal control over financial reporting as defined in Rules 13a-15(f) and 15d-15(f) under the Exchange Act. Because of its inherent limitations, internal control over financial reporting may not prevent or detect misstatements. Projections of any evaluation of effectiveness to future periods are subject to the risks that controls may become inadequate because of changes in conditions, or that the degree of compliance with the policies or procedures may deteriorate.
Management assessed the effectiveness of our internal control over financial reporting as of December 31, 2010. In making this assessment, management used the criteria set forth by the Committee of Sponsoring Organizations of the Treadway Commission (COSO) in Internal Control-Integrated Framework. Based on this assessment, management believes that, as of December 31, 2010, our internal control over financial reporting is effective.
Our independent registered public accounting firm has issued an attestation report on our internal control over financial reporting. This report is included as part of Item 8 in this annual report on Form 10-K.
Changes in Internal Control Over Financial Reporting
There has been no change in our internal control over financial reporting that occurred during the three months ended December 31, 2010 that has materially affected, or is reasonably likely to materially affect, our internal control over financial reporting.
| Item 9B. | Other Information |
None.
128
Table of Contents
| Item 10. | Trustees, Executive Officers and Trust Governance |
The information required by this item will be set forth in our definitive proxy statement with respect to our 2011 annual meeting of shareholders to be filed on or before April 30, 2011, and is incorporated herein by reference.
| Item 11. | Executive Compensation |
The information required by this item will be set forth in our definitive proxy statement with respect to our 2011 annual meeting of shareholders, and is incorporated herein by reference.
| Item 12. | Security Ownership of Certain Beneficial Owners and Management and Related Shareholder Matters |
The information required by this item will be set forth in our definitive proxy statement with respect to our 2011 annual meeting of shareholders, and is incorporated herein by reference.
| Item 13. | Certain Relationships and Related Transactions and Trustee Independence |
The information required by this item will be set forth in our definitive proxy statement with respect to our 2011 annual meeting of shareholders, and is incorporated herein by reference.
| Item 14. | Principal Accounting Fees and Services |
The information required by this item will be set forth in our definitive proxy statement with respect to our 2011 annual meeting of shareholders, and is incorporated herein by reference.
129
Table of Contents
| Item 15. | Exhibits, Financial Statement Schedules |
(a) Listed below are all financial statements, financial statement schedules, and exhibits filed as part of this 10-K and herein included.
(1) Financial Statements
All other schedules are not applicable or are omitted since either (i) the required information is not material or (ii) the information required is included in the consolidated financial statements and notes thereto.
(2) Exhibits
The Exhibits furnished as part of this annual report on Form 10-K are identified in the Exhibit Index immediately following the signature pages of this annual report. Such Exhibit Index is incorporated herein by reference.
130
Table of Contents
Pursuant to the requirements of Section 13 or 15(d) of the Securities Exchange Act of 1934, the registrant has duly caused this report to be signed on its behalf by the undersigned, thereunto duly authorized.
| RAIT FINANCIAL TRUST | ||
| By: | /s/ SCOTT F. SCHAEFFER | |
| Scott F. Schaeffer Chairman of the Board, Chief Executive Officer and | ||
February 25, 2011
Pursuant to the requirements of the Securities Exchange Act of 1934, this report has been signed below by the following persons on behalf of the registrant and in the capacities and on the dates indicated.
| Name |
Capacity With RAIT Financial Trust |
Date | ||||
| By: | /s/ SCOTT F. SCHAEFFER Scott F. Schaeffer |
Chairman of the Board, Chief Executive Officer and President (Principal Executive Officer) |
February 25, 2011 | |||
| By: | /s/ JACK E. SALMON Jack E. Salmon |
Chief Financial Officer and Treasurer (Principal Financial Officer) |
February 25, 2011 | |||
| By: | /s/ JAMES J. SEBRA James J. Sebra |
Chief Accounting Officer (Principal Accounting Officer) |
February 25, 2011 | |||
| By: | /s/ EDWARD S. BROWN Edward S. Brown |
Trustee | February 25, 2011 | |||
| By: | /s/ FRANK A. FARNESI Frank A. Farnesi |
Trustee | February 25, 2011 | |||
| By: | /s/ S. KRISTIN KIM S. Kristin Kim |
Trustee | February 25, 2011 | |||
| By: | /s/ ARTHUR MAKADON Arthur Makadon |
Trustee | February 25, 2011 | |||
| By: | /s/ DANIEL PROMISLO Daniel Promislo |
Trustee | February 25, 2011 | |||
| By: | /s/ JOHN F. QUIGLEY, III John F. Quigley, III |
Trustee | February 25, 2011 | |||
| By: | /s/ MURRAY STEMPEL, III Murray Stempel, III |
Trustee | February 25, 2011 | |||
131
Table of Contents
| Exhibit |
Description of Documents | |
| 3.1 | Amended and Restated Declaration of Trust. (1) | |
| 3.1.1 | Articles of Amendment to Amended and Restated Declaration of Trust. (2) | |
| 3.1.2 | Articles of Amendment to Amended and Restated Declaration of Trust. (3) | |
| 3.1.3 | Certificate of Correction to the Amended and Restated Declaration of Trust. (4) | |
| 3.1.4 | Articles of Amendment to Amended and Restated Declaration of Trust. (5) | |
| 3.1.5 | Articles Supplementary relating to the 7.75% Series A Cumulative Redeemable Preferred Shares of Beneficial Interest (the “Series A Articles Supplementary”). (6) | |
| 3.1.6 | Certificate of Correction to the Series A Articles Supplementary. (6) | |
| 3.1.7 | Articles Supplementary relating to the 8.375% Series B Cumulative Redeemable Preferred Shares of Beneficial Interest. (7) | |
| 3.1.8 | Articles Supplementary relating to the 8.875% Series C Cumulative Redeemable Preferred Shares of Beneficial Interest. (8) | |
| 3.2 | By-laws (9). | |
| 4.1 | Form of Certificate for Common Shares of Beneficial Interest. (5) | |
| 4.2 | Form of Certificate for 7.75% Series A Cumulative Redeemable Preferred Shares of Beneficial Interest. (10) | |
| 4.3 | Form of Certificate for 8.375% Series B Cumulative Redeemable Preferred Shares of Beneficial Interest. (7) | |
| 4.4 | Form of Certificate for 8.875% Series C Cumulative Redeemable Preferred Shares of Beneficial Interest. (8) | |
| 4.5 | Indenture dated as of April 18, 2007 among RAIT Financial Trust (“RAIT”), as issuer, RAIT Partnership, L.P. and RAIT Asset Holdings, LLC, as guarantors, and Wells Fargo Bank, N.A., as trustee. (11) | |
| 4.6 | Registration Rights Agreement dated as of April 18, 2007 between RAIT and Bear, Stearns & Co. Inc. (11) | |
| 10.1 | Form of Indemnification Agreement. (1) | |
| 10.2.1 | Amended and Restated Employment Agreement dated as of December 11, 2006 between RAIT and Betsy Z. Cohen. (5) | |
| 10.2.2 | Amendment dated as of December 15, 2008 to Employment Agreement between RAIT and Betsy Z. Cohen. (12) | |
| 10.3.1 | RAIT Executive Pension Plan for Betsy Z. Cohen as amended and restated effective as of January 1, 2005. (5) | |
| 10.3.2 | Letter Amendment dated as of December 15, 2008 to RAIT Executive Pension Plan for Betsy Z. Cohen. (12) | |
| 10.3.3 | Termination Notice from Betsy Z. Cohen to RAIT Financial Trust dated as of November 4, 2010. (13) | |
| 10.3.4 | Consulting Agreement between RAIT Financial Trust and Betsy Z. Cohen dated as of November 4, 2010. (13) | |
132
Table of Contents
| Exhibit |
Description of Documents | |
| 10.4.1 | Second Amended and Restated Employment Agreement dated as of December 11, 2006 between RAIT and Scott F. Schaeffer. (5) | |
| 10.4.2 | Amendment dated as of December 15, 2008 to Employment Agreement between RAIT and Scott F. Schaeffer. (12) | |
| 10.4.3 | Amendment dated as of February 22, 2009 to Employment Agreement between RAIT and Scott F. Schaeffer. (14) | |
| 10.5.1 | Employment Agreement dated as of June 8, 2006 by and between RAIT, Daniel G. Cohen and, as to Section 7.14 thereof, Taberna. (15) | |
| 10.5.2 | Amendment dated as of December 15, 2008 to Employment Agreement between RAIT and Daniel G. Cohen. (12) | |
| 10.5.3 | Letter of Separation dated as of February 22, 2009 between RAIT and Daniel G. Cohen. (14) | |
| 10.6.1 | Employment Agreement dated as of June 8, 2006 by and between RAIT, Jack E. Salmon and, as to Section 7.14 thereof, Taberna. (15) | |
| 10.6.2 | Amendment dated as of December 15, 2008 to Employment Agreement between RAIT and Jack E. Salmon. (12) | |
| 10.7.1 | Employment Agreement dated as of June 8, 2006 by and between RAIT, Plamen Mitrikov and, as to Section 7.14 thereof, Taberna. (15) | |
| 10.7.2 | Letter Agreement dated as of August 7, 2008 by and between RAIT and Plamen M. Mitrikov. (16) | |
| 10.7.3 | Amendment dated as of December 15, 2008 to Employment Agreement between RAIT and Plamen Mitrikov. (12) | |
| 10.8.1 | Employment Agreement dated as of June 8, 2006 by and between RAIT, Raphael Licht and, as to Section 7.14 thereof, Taberna. (15) | |
| 10.8.2 | Amendment dated as of December 15, 2008 to Employment Agreement between RAIT and Raphael Licht.(17) | |
| 10.8.3 | Amendment dated as of February 22, 2009 to Employment Agreement between RAIT and Raphael Licht. (14) | |
| 10.9.1 | Employment Agreement dated as of May 22, 2007, by and between RAIT and James J. Sebra. (18) | |
| 10.9.2 | Amendment dated as of December 15, 2008 to Employment Agreement between RAIT and James J. Sebra.(17) | |
| 10.10.1 | Employment Agreement dated as of February 5, 2008 by and between RAIT and Ken R. Frappier. (19) | |
| 10.10.2 | Amendment dated as of December 15, 2008 to Employment Agreement between RAIT and Ken R. Frappier.(17) | |
| 10.11 | RAIT Phantom Share Plan (As Amended and Restated, Effective July 20, 2004) (the “PSP”). (20) | |
| 10.12 | RAIT Financial Trust 2008 Incentive Award Plan, as Amended and Restated May 20, 2008 (the “IAP”). (21) | |
| 10.13 | IAP Form of 2008 Cash Award Program Agreement. (21) | |
| 10.14 | IAP Form for Non-Employee Trustee Grants. (22) | |
| 10.15 | PSP Form for Non-Employee Trustee Grants. (22) | |
133
Table of Contents
| Exhibit |
Description of Documents | |
| 10.16 | PSP Form of Letter to Trustees regarding the redemption of Phantom Shares. (23) | |
| 10.17 | PSP Form of Letter to Trustees regarding the redemption of Phantom Shares. (17) | |
| 10.18 | IAP Form of Share Award Agreement with full vesting. (23) | |
| 10.19 | IAP Form of Unit Award to Cover Grants to Section 16 Officers adopted January 24, 2006. (24) | |
| 10.20 | IAP Form of Unit Award to Cover Grants to Certain Section 16 Officers granted October 24, 2006. (25) | |
| 10.21 | IAP Form of Unit Award to Cover Grants to Section 16 Officers adopted January 24, 2007. (26) | |
| 10.22 | IAP Form of Unit Award to Cover Grants to Non-Employee Trustees adopted July 19, 2005. (23) | |
| 10.23 | Taberna 2005 Equity Incentive Plan (“Taberna EIP”). (5) | |
| 10.24 | Taberna EIP Form of Restricted Share Award. (27) | |
| 10.25 | Form of Forfeiture Letters dated December 7, 2007. (28) | |
| 10.26 | Letter Amendment to Grants of Phantom Units to Executive Officers of RAIT under IAP. (12) | |
| 10.27 | Letter Amendment to Grants of Phantom Units to Non-Management Trustees under IAP. (17) | |
| 10.28.1 | Form of Letter Agreement between RAIT and each of its Non-Management Trustees dated March 2009. (29) | |
| 10.28.2 | Form of Letter Agreement between RAIT and each of its Non-Management Trustees dated as of January 26, 2010. (30) | |
| 10.28.3 | Form of Letter Agreement between RAIT and each of its Non-Management Trustees dated as of January 25, 2011. (31) | |
| 10.29 | IAP Form of Unit Award to Cover Grants to Compensation Committee Officers adopted January 26, 2010. (32) | |
| 10.31 | Assignment of Lease dated December 11, 2006 between RAIT and Taberna Capital Management, LLC. (27) | |
| 10.32 | Amendment No. 2 to lease dated as of November 1, 2005 between 450 Park LLC and Taberna. (27) | |
| 10.33 | Sublease Agreement dated as of April 1, 2006 between Cohen Brothers, LLC and Taberna Capital Management, LLC. (27) | |
| 10.34 | Notation of Guarantee by RAIT Partnership, L.P. and RAIT Asset Holdings, LLC as guarantors. (11) | |
| 10.35 | Master Repurchase Agreement dated as of September 19, 2008, as amended and restated as of October 27, 2008, between Wilmington Trust Company, as agent for Cedric LLC, as buyer, and Taberna Loan Holdings I, LLC, as seller (the “TLHI Agreement”). (33) | |
| 10.36 | Master Repurchase Agreement dated as of September 19, 2008 between Wilmington Trust Company, as agent for Cedric LLC, as buyer, and RAIT CRE Holdings, LLC, as seller (the “RAIT CRE Agreement”). (34) | |
| 10.37 | Parent Guarantee dated as of September 19, 2008 made by RAIT and Taberna in favor of Wilmington Trust CompaTrust Company, as agent for Cedric LLC, relating to the TLHI Agreement. (34) | |
| 10.38 | Parent Guarantee dated as of September 19, 2008 made by RAIT and Taberna in favor of Wilmington Trust Company, as agent for Cedric LLC relating to the RAIT CRE Agreement. (34) | |
134
Table of Contents
| Exhibit |
Description of Documents | |
| 10.39 | Securities Purchase Agreement dated June 25, 2009 among Taberna Realty Finance Trust and Taberna Equity Funding, Ltd., as sellers, Dynamic Credit Partners, LLC, as purchaser, and its affiliate Dynamic Credit Management, LLC. (35) | |
| 10.40 | Purchase and Sale Agreement dated as of July 15, 2009 between RAIT’s subsidiary, Taberna Loan Holdings I, LLC, as seller, and AG Park Lane I Corp., as buyer. (36) | |
| 10.41 | Securities Purchase Agreement dated as of July 31, 2009 between RAIT and Mr. Moses Marx. (37) | |
| 10.42 | Senior Secured Note dated July 31, 2009 issued by RAIT, as payor, to Mr. Moses Marx, as payee. (37) | |
| 10.43 | Standby Equity Distribution Agreement dated as of January 13, 2010 by and between YA Global Master SPV Ltd. and RAIT. (38) | |
| 10.44 | Exchange Agreement dated as of March 25, 2010 between RAIT and United Equities Commodities Company. (39) | |
| 10.45 | 10.0% Senior Secured Convertible Note due 2014 dated as of March 25, 2010 issued by RAIT, as payor, to United Equities Commodities Company, as payee. (39) | |
| 10.46 | Capital on Demand Sales Agreement dated as of August 6, 2010 between RAIT, RAIT Partnership, L.P., a Delaware limited partnership and JonesTrading Institutional Services LLC. (40) | |
| 12.1 | Statements regarding computation of ratios as of December 31, 2009.* | |
| 21.1 | List of Subsidiaries.* | |
| 23.1 | Consent of Grant Thornton LLP.* | |
| 31.1 | Rule 13a-14(a) Certification by the Chief Executive Officer of RAIT.* | |
| 31.2 | Rule 13a-14(a) Certification by the Chief Financial Officer of RAIT.* | |
| 32.1 | Section 1350 Certification by the Chief Executive Officer of RAIT.* | |
| 32.2 | Section 1350 Certification by the Chief Financial Officer of RAIT.* | |
| 99.1 | Material U.S. Federal Income Tax Considerations.* | |
| * | Filed herewith |
| (1) | Incorporated by reference to RAIT’s Registration Statement on Form S-11 (Registration No. 333-35077). |
| (2) | Incorporated by reference to RAIT’s Registration Statement on Form S-11 (Registration No. 333-53067). |
| (3) | Incorporated by reference to RAIT’s Registration Statement on Form S-2 (Registration No. 333-55518). |
| (4) | Incorporated by reference to RAIT’s Form 10-Q for the Quarterly Period ended March 31, 2002 (File No. 1-14760). |
| (5) | Incorporated by reference to RAIT’s Form 8-K as filed with the SEC on December 15, 2006 (File No. 1-14760). |
| (6) | Incorporated by reference to RAIT’s Form 8-K as filed with the SEC on March 18, 2004 (File No. 1-14760). |
| (7) | Incorporated by reference to RAIT’s Form 8-K as filed with the SEC on October 1, 2004 (File No. 1-14760). |
| (8) | Incorporated by reference to RAIT’s Form 8-A as filed with the SEC on June 29, 2007 (File No. 1-14760). |
| (9) | Incorporated by reference to RAIT’s Form 8-K as filed with the SEC on October 19, 2009 (File No. 1-14760). |
| (10) | Incorporated by reference to RAIT’s Form 8-K as filed with the SEC on March 22, 2004 (File No. 1-14760). |
| (11) | Incorporated by reference to RAIT’s Form 8-K as filed with the SEC on April 18, 2007 (File No. 1-14760). |
135
Table of Contents
| (12) | Incorporated by reference to RAIT’s Form 8-K as filed with the SEC on December 19, 2008 (File No. 1-14760). |
| (13) | Incorporated by reference to RAIT’s Form 10-Q for the quarterly period ended September 30, 2010 (File No. 1-14760). |
| (14) | Incorporated by reference to RAIT’s Form 8-K as filed with the SEC on February 23, 2009 (File No. 1-14760). |
| (15) | Incorporated by reference to RAIT’s Form 8-K as filed with the Securities and Exchange Commission (“SEC”) on June 13, 2006 (File No. 1-14760). |
| (16) | Incorporated by reference to RAIT’s Form 8-K as filed with the SEC on August 13, 2008 (File No. 1-14760). |
| (17) | Incorporated by reference to RAIT’s Form 10-K for the fiscal year ended December 31, 2008 (File No. 1-14760). |
| (18) | Incorporated by reference to RAIT’s Form 8-K as filed with the SEC on May 24, 2007 (File No. 1-14760). |
| (19) | Incorporated by reference to RAIT’s Form 8-K as filed with the SEC on February 11, 2008 (File No. 1-14760). |
| (20) | Incorporated by reference to RAIT’s Form 10-Q for the Quarterly Period ended June 30, 2004 (File No. 1-14760). |
| (21) | Incorporated by reference to RAIT’s Form 8-K as filed with the SEC on May 27, 2008 (File No. 1-14760). |
| (22) | Incorporated by reference to RAIT’s Form 10-Q for the Quarterly Period ended September 30, 2004 (File No. 1-14760). |
| (23) | Incorporated by reference to RAIT’s Form 8-K as filed with the SEC on July 25, 2005 (File No. 1-14760). |
| (24) | Incorporated by reference to RAIT’s Form 8-K as filed with the SEC on January 27, 2006 (File No. 1-14760). |
| (25) | Incorporated by reference to RAIT’s Form 8-K as filed with the SEC on October 30, 2006 (File No. 1-14760). |
| (26) | Incorporated by reference to RAIT’s Form 8-K as filed with the SEC on January 25, 2007 (File No. 1-14760). |
| (27) | Incorporated by reference to RAIT’s Form 10-K for the fiscal year ended December 31, 2006 (File No. 1-14760). |
| (28) | Incorporated by reference to RAIT’s Form 10-K for the fiscal year ended December 31, 2007 (File No. 1-14760). |
| (29) | Incorporated by reference to RAIT’s Form 8-K as filed with the SEC on March 12, 2009 (File No. 1-14760). |
| (30) | Incorporated by reference to RAIT’s Form 8-K as filed with the SEC on January 29, 2010 (File No. 1-14760). |
| (31) | Incorporated by reference to RAIT’s Form 8-K as filed with the SEC on January 28, 2011 (File No. 1-14760). |
| (32) | Incorporated by reference to RAIT’s Form 8-K as filed with the SEC on January 29, 2010 (File No. 1-14760). |
| (33) | Incorporated by reference to RAIT’s Form 8-K as filed with the SEC on October 31, 2008 (File No. 1-14760). |
| (34) | Incorporated by reference to RAIT’s Form 8-K as filed with the SEC on September 25, 2008 (File No. 1-14760). |
| (35) | Incorporated by reference to RAIT’s Form 8-K as filed with the SEC on June 29, 2009 (File No. 1-14760). |
| (36) | Incorporated by reference to RAIT’s Form 8-K as filed with the SEC on July 21, 2009 (File No. 1-14760). |
| (37) | Incorporated by reference to RAIT’s Form 8-K as filed with the SEC on August 3, 2009 (File No. 1-14760). |
| (38) | Incorporated by reference to RAIT’s Form 8-K as filed with the SEC on January 13, 2010 (File No. 1-14760). |
| (39) | Incorporated by reference to RAIT’s Form 8-K as filed with the SEC on March 25, 2010 (File No. 1-14760). |
| (40) | Incorporated by reference to RAIT’s Form 10-Q for the quarterly period ended June 30, 2010 (File No. 1-14760). |
136