Attached files
Table of Contents
UNITED STATES
SECURITIES AND EXCHANGE COMMISSION
WASHINGTON, D.C. 20549
FORM 10-Q
(Mark One)
| x | Quarterly Report Pursuant to Section 13 or 15(d) of the Securities Exchange Act of 1934 |
For the quarterly period ended March 31, 2011
or
| ¨ | Transition Report Pursuant to Section 13 or 15(d) of the Securities Exchange Act of 1934 |
For the transition period from to
Commission file number 1-14760
RAIT FINANCIAL TRUST
(Exact name of registrant as specified in its charter)
| Maryland | 23-2919819 | |
| (State or other jurisdiction of incorporation or organization) |
(I.R.S. Employer Identification No.) | |
| 2929 Arch Street, 17th Floor, Philadelphia, PA | 19104 | |
| (Address of principal executive offices) | (Zip Code) | |
(215) 243-9000
(Registrant’s telephone number, including area code)
Indicate by check mark whether the registrant (1) has filed all reports required to be filed by Section 13 or 15(d) of the Securities Exchange Act of 1934 during the preceding 12 months (or for such shorter period that the registrant was required to file such reports), and (2) has been subject to such filing requirements for the past 90 days. x Yes ¨ No
Indicate by check mark whether the registrant has submitted electronically and posted on its corporate Web site, if any, every Interactive Data File required to be submitted and posted pursuant to Rule 405 of Regulation S-T during the preceding 12 months (or for such shorter period that the registrant was required to submit and post such files). ¨ Yes ¨ No
Indicate by check mark whether the registrant is a large accelerated filer, an accelerated filer, a non-accelerated filer, or a smaller reporting company. See the definitions of “large accelerated filer”, “accelerated filer” and “smaller reporting company” in Rule 12b-2 of the Exchange Act.
Large accelerated filer ¨ Accelerated filer x Non-accelerated filer ¨ (Do not check if a smaller reporting company)
Smaller reporting company ¨
Indicate by check mark whether the registrant is a shell company (as defined in Rule 12b-2 of the Exchange Act). ¨ Yes x No
A total of 114,089,371 common shares of beneficial interest, par value $0.01 per share, of the registrant were outstanding as of May 4, 2011.
Table of Contents
RAIT FINANCIAL TRUST
| Page | ||||||
| PART I—FINANCIAL INFORMATION | ||||||
| Item 1. |
||||||
| Consolidated Balance Sheets as of March 31, 2011 and December 31, 2010 |
1 | |||||
| Consolidated Statements of Operations for the Three-Month Periods Ended March 31, 2011 and 2010 |
2 | |||||
| 3 | ||||||
| Consolidated Statements of Cash Flows for the Three-Month Periods Ended March 31, 2011 and 2010 |
4 | |||||
| 5 | ||||||
| Item 2. |
Management’s Discussion and Analysis of Financial Condition and Results of Operations |
25 | ||||
| Item 3. |
39 | |||||
| Item 4. |
39 | |||||
| PART II—OTHER INFORMATION | ||||||
| Item 1. |
40 | |||||
| Item 1A. |
40 | |||||
| Item 2. |
40 | |||||
| Item 6. |
41 | |||||
| 42 | ||||||
Table of Contents
| Item 1. | Financial Statements |
Consolidated Balance Sheets
(Unaudited and dollars in thousands, except share and per share information)
| As of March 31, 2011 |
As of December 31, 2010 |
|||||||
| Assets |
||||||||
| Investments in mortgages and loans, at amortized cost: |
||||||||
| Commercial mortgages, mezzanine loans, other loans and preferred equity interests |
$ | 1,190,576 | $ | 1,219,110 | ||||
| Allowance for losses |
(66,769 | ) | (69,691 | ) | ||||
| Total investments in mortgages and loans |
1,123,807 | 1,149,419 | ||||||
| Investments in real estate |
867,726 | 841,488 | ||||||
| Investments in securities and security-related receivables, at fair value |
718,937 | 705,451 | ||||||
| Cash and cash equivalents |
39,463 | 27,230 | ||||||
| Restricted cash |
179,308 | 176,723 | ||||||
| Accrued interest receivable |
37,764 | 37,138 | ||||||
| Other assets |
36,346 | 32,840 | ||||||
| Deferred financing costs, net of accumulated amortization of $10,559 and $9,943, respectively |
22,963 | 19,954 | ||||||
| Intangible assets, net of accumulated amortization of $1,917 and $1,777, respectively |
3,049 | 3,189 | ||||||
| Total assets |
$ | 3,029,363 | $ | 2,993,432 | ||||
| Liabilities and Equity |
||||||||
| Indebtedness (including $147,055 and $152,494 at fair value, respectively) |
$ | 1,830,617 | $ | 1,838,177 | ||||
| Accrued interest payable |
20,444 | 19,925 | ||||||
| Accounts payable and accrued expenses |
25,495 | 25,089 | ||||||
| Derivative liabilities |
164,127 | 184,878 | ||||||
| Deferred taxes, borrowers’ escrows and other liabilities |
20,852 | 6,833 | ||||||
| Total liabilities |
2,061,535 | 2,074,902 | ||||||
| Equity: |
||||||||
| Shareholders’ equity: |
||||||||
| Preferred shares, $0.01 par value per share, 25,000,000 shares authorized; |
||||||||
| 7.75% Series A cumulative redeemable preferred shares, liquidation preference $25.00 per share, 2,760,000 shares issued and outstanding |
28 | 28 | ||||||
| 8.375% Series B cumulative redeemable preferred shares, liquidation preference $25.00 per share, 2,258,300 shares issued and outstanding |
23 | 23 | ||||||
| 8.875% Series C cumulative redeemable preferred shares, liquidation preference $25.00 per share, 1,600,000 shares issued and outstanding |
16 | 16 | ||||||
| Common shares, $0.01 par value per share, 200,000,000 shares authorized, 114,083,141 and 105,900,570 issued and outstanding |
1,141 | 1,060 | ||||||
| Additional paid in capital |
1,721,730 | 1,691,681 | ||||||
| Accumulated other comprehensive income (loss) |
(114,514 | ) | (127,602 | ) | ||||
| Retained earnings (deficit) |
(644,562 | ) | (647,110 | ) | ||||
| Total shareholders’ equity |
963,862 | 918,096 | ||||||
| Noncontrolling interests |
3,966 | 434 | ||||||
| Total equity |
967,828 | 918,530 | ||||||
| Total liabilities and equity |
$ | 3,029,363 | $ | 2,993,432 | ||||
The accompanying notes are an integral part of these consolidated financial statements.
1
Table of Contents
Consolidated Statements of Operations
(Unaudited and dollars in thousands, except share and per share information)
| For the Three-Month Periods Ended March 31 |
||||||||
| 2011 | 2010 | |||||||
| Revenue: |
||||||||
| Interest income |
$ | 33,558 | $ | 41,330 | ||||
| Rental income |
21,290 | 16,075 | ||||||
| Fee and other income |
3,431 | 8,839 | ||||||
| Total revenue |
58,279 | 66,244 | ||||||
| Expenses: |
||||||||
| Interest expense |
23,367 | 25,470 | ||||||
| Real estate operating expense |
12,617 | 10,522 | ||||||
| Compensation expense |
6,544 | 8,052 | ||||||
| General and administrative expense |
4,968 | 4,890 | ||||||
| Provision for losses |
1,950 | 17,350 | ||||||
| Depreciation and amortization expense |
7,119 | 6,183 | ||||||
| Total expenses |
56,565 | 72,467 | ||||||
| Operating Income |
1,714 | (6,223 | ) | |||||
| Interest and other income (expense): |
||||||||
| Interest and other income (expense) |
83 | 82 | ||||||
| Gains (losses) on sale of assets |
1,415 | 3,924 | ||||||
| Gains (losses) on extinguishment of debt |
(537 | ) | 19,810 | |||||
| Change in fair value of financial instruments |
5,611 | 16,437 | ||||||
| Income (loss) before taxes and discontinued operations |
8,286 | 34,030 | ||||||
| Income tax benefit (provision) |
54 | (47 | ) | |||||
| Income (loss) from continuing operations |
8,340 | 33,983 | ||||||
| Income (loss) from discontinued operations |
791 | 470 | ||||||
| Net income (loss) |
9,131 | 34,453 | ||||||
| (Income) loss allocated to preferred shares |
(3,414 | ) | (3,406 | ) | ||||
| (Income) loss allocated to noncontrolling interests |
50 | 235 | ||||||
| Net income (loss) allocable to common shares |
$ | 5,767 | $ | 31,282 | ||||
| Earnings (loss) per share—Basic: |
||||||||
| Continuing operations |
$ | 0.04 | $ | 0.41 | ||||
| Discontinued operations |
0.01 | 0.01 | ||||||
| Total earnings (loss) per share—Basic |
$ | 0.05 | $ | 0.42 | ||||
| Weighted-average shares outstanding—Basic |
109,856,729 | 74,952,313 | ||||||
| Earnings (loss) per share—Diluted: |
||||||||
| Continuing operations |
$ | 0.04 | $ | 0.40 | ||||
| Discontinued operations |
0.01 | 0.01 | ||||||
| Total earnings (loss) per share—Diluted |
$ | 0.05 | $ | 0.41 | ||||
| Weighted-average shares outstanding—Diluted |
110,904,359 | 75,512,999 | ||||||
| Distributions declared per common share |
$ | 0.03 | $ | — | ||||
The accompanying notes are an integral part of these consolidated financial statements.
2
Table of Contents
Consolidated Statements of Comprehensive Income (Loss)
(Unaudited and dollars in thousands)
| For the Three-Month Periods Ended March 31 |
||||||||
| 2011 | 2010 | |||||||
| Net income (loss) |
$ | 9,131 | $ | 34,453 | ||||
| Other comprehensive income (loss): |
||||||||
| Change in fair value of interest rate hedges |
2,052 | (15,230 | ) | |||||
| Reclassification adjustments associated with unrealized losses (gains) from interest rate hedges included in net income (loss) |
— | 13 | ||||||
| Realized (gains) losses on interest rate hedges reclassified to earnings |
10,889 | 11,725 | ||||||
| Change in fair value of available-for-sale securities |
147 | (4,134 | ) | |||||
| Total other comprehensive income (loss) |
13,088 | (7,626 | ) | |||||
| Comprehensive income (loss) before allocation to noncontrolling interests |
22,219 | 26,827 | ||||||
| Allocation to noncontrolling interests |
50 | 235 | ||||||
| Comprehensive income (loss) |
$ | 22,269 | $ | 27,062 | ||||
The accompanying notes are an integral part of these consolidated financial statements.
3
Table of Contents
Consolidated Statements of Cash Flows
(Unaudited and dollars in thousands)
| For the Three-Month Periods Ended March 31 |
||||||||
| 2011 | 2010 | |||||||
| Operating activities: |
||||||||
| Net income (loss) |
$ | 9,131 | $ | 34,453 | ||||
| Adjustments to reconcile net income (loss) to cash flow from operating activities: |
||||||||
| Provision for losses |
1,950 | 17,350 | ||||||
| Share-based compensation expense |
259 | 1,671 | ||||||
| Depreciation and amortization |
7,119 | 6,803 | ||||||
| Amortization of deferred financing costs and debt discounts |
868 | 898 | ||||||
| Accretion of discounts on investments |
(305 | ) | (822 | ) | ||||
| (Gains) losses on sales of assets |
(1,415 | ) | (4,190 | ) | ||||
| (Gains) losses on extinguishment of debt |
537 | (19,810 | ) | |||||
| Change in fair value of financial instruments |
(5,611 | ) | (16,437 | ) | ||||
| Unrealized gains (losses) on interest rate hedges |
— | 13 | ||||||
| Equity in (income) loss of equity method investments |
— | (4 | ) | |||||
| Unrealized foreign currency (gains) losses on investments |
— | (434 | ) | |||||
| Changes in assets and liabilities: |
||||||||
| Accrued interest receivable |
(748 | ) | 3,656 | |||||
| Other assets |
(3,432 | ) | (2,554 | ) | ||||
| Accrued interest payable |
(10,810 | ) | (7,904 | ) | ||||
| Accounts payable and accrued expenses |
529 | (4,374 | ) | |||||
| Deferred taxes, borrowers’ escrows and other liabilities |
2,392 | (5,766 | ) | |||||
| Cash flow from operating activities |
464 | 2,549 | ||||||
| Investing activities: |
||||||||
| Proceeds from sales of other securities |
4,883 | 11,342 | ||||||
| Purchase and origination of loans for investment |
(5,172 | ) | (17,151 | ) | ||||
| Principal repayments on loans |
11,436 | 21,845 | ||||||
| Investments in real estate |
(14,225 | ) | (5,942 | ) | ||||
| Proceeds from dispositions of real estate |
— | 5,124 | ||||||
| Business acquisition |
(2,731 | ) | — | |||||
| (Increase) Decrease in restricted cash |
8,847 | (9,615 | ) | |||||
| Cash flow from investing activities |
3,038 | 5,603 | ||||||
| Financing activities: |
||||||||
| Repayments on secured credit facilities and other indebtedness |
(15,782 | ) | (1,807 | ) | ||||
| Repayments and repurchase of CDO notes payable |
(12,469 | ) | (2,956 | ) | ||||
| Proceeds from issuance of 7.0% convertible senior notes and other indebtedness |
115,000 | — | ||||||
| Repayments and repurchase of 6.875% convertible senior notes |
(86,336 | ) | (7,175 | ) | ||||
| Issuance (acquisition) of noncontrolling interests |
3,582 | (46 | ) | |||||
| Payments for deferred costs |
(6,369 | ) | (109 | ) | ||||
| Common share issuance, net of costs incurred |
17,738 | 853 | ||||||
| Distributions paid to preferred shares |
(3,414 | ) | (3,406 | ) | ||||
| Distributions paid to common shares |
(3,219 | ) | — | |||||
| Cash flow from financing activities |
8,731 | (14,646 | ) | |||||
| Net change in cash and cash equivalents |
12,233 | (6,494 | ) | |||||
| Cash and cash equivalents at the beginning of the period |
27,230 | 25,034 | ||||||
| Cash and cash equivalents at the end of the period |
$ | 39,463 | $ | 18,540 | ||||
| Supplemental cash flow information: |
||||||||
| Cash paid for interest |
$ | 9,722 | $ | 9,103 | ||||
| Cash paid (refunds received) for taxes |
85 | (554 | ) | |||||
| Non-cash increase in investments in real estate from the conversion of loans |
20,300 | 41,290 | ||||||
| Non-cash decrease in indebtedness from conversion to shares or debt extinguishments |
(6,914 | ) | (18,755 | ) | ||||
The accompanying notes are an integral part of these consolidated financial statements.
4
Table of Contents
Notes to Consolidated Financial Statements
As of March 31, 2011
(Unaudited and dollars in thousands, except share and per share amounts)
NOTE 1: THE COMPANY
RAIT Financial Trust invests in and manages a portfolio of real-estate related assets, including direct ownership of real estate properties, and provides a comprehensive set of debt financing options to the real estate industry. References to “RAIT”, “we”, “us”, and “our” refer to RAIT Financial Trust and its subsidiaries, unless the context otherwise requires. We conduct our business through our subsidiaries, RAIT Partnership, L.P. and Taberna Realty Finance Trust, or Taberna, as well as through their respective subsidiaries. RAIT is a self-managed and self-advised Maryland real estate investment trust, or REIT. Taberna is also a Maryland REIT.
We finance a substantial portion of our investments through borrowing and securitization strategies seeking to match the maturities and terms of our financings with the maturities and terms of those investments, and to mitigate interest rate risk through derivative instruments.
We are subject to significant competition in all aspects of our business. Existing industry participants and potential new entrants compete with us for the available supply of investments suitable for origination or acquisition, as well as for debt and equity capital. We compete with many third parties engaged in real estate finance and investment activities, including other REITs, specialty finance companies, savings and loan associations, banks, mortgage bankers, insurance companies, mutual funds, institutional investors, investment banking firms, lenders, governmental bodies and other entities.
NOTE 2: SUMMARY OF SIGNIFICANT ACCOUNTING POLICIES
a. Basis of Presentation
The accompanying unaudited interim consolidated financial statements have been prepared by management in accordance with U.S. generally accepted accounting principles, or GAAP. Certain information and footnote disclosures normally included in annual consolidated financial statements prepared in accordance with GAAP have been condensed or omitted pursuant to such rules and regulations, although we believe that the included disclosures are adequate to make the information presented not misleading. The unaudited interim consolidated financial statements should be read in conjunction with our audited financial statements as of and for the year ended December 31, 2010 included in our Annual Report on Form 10-K. In the opinion of management, all adjustments, consisting only of normal recurring adjustments, necessary to present fairly our consolidated financial position and consolidated results of operations and cash flows are included. The results of operations for the interim periods presented are not necessarily indicative of the results for the full year.
Certain prior period amounts have been reclassified to conform with the current period presentation. Previously, interest expense was included as part of net interest margin within total revenue. We have now classified interest expense as a component of expenses. Additionally, interest expense associated with third party financing provided on our owned real estate is included in interest expense whereas previously it was reflected within property operating expenses.
b. Principles of Consolidation
The consolidated financial statements reflect our accounts and the accounts of our majority-owned and/or controlled subsidiaries. We also consolidate entities that are variable interest entities, or VIEs, where we have determined that we are the primary beneficiary of such entities. The portions of these entities that we do not own are presented as noncontrolling interest as of the dates and for the periods presented in the consolidated financial statements. All intercompany accounts and transactions have been eliminated in consolidation.
Under Financial Accounting Standards Board (FASB) Accounting Standards Codification (ASC) Topic 810, “Consolidation”, the determination of whether to consolidate a VIE is based on the power to direct the activities of the VIE that most significantly impact the VIE’s economic performance together with either the obligation to absorb losses or the right to receive benefits that could be significant to the VIE. We define the power to direct the activities that most significantly impact the VIE’s economic performance as the ability to buy, sell, refinance, or recapitalize assets or entities, and solely control other material operating events or items of the respective entity. For our commercial mortgages, mezzanine loans, and preferred equity investments, certain rights we hold are protective in nature and would preclude us from having the power to direct the activities that most significantly impact the VIE’s economic performance. Assuming both criteria are met, we would be considered the primary beneficiary and would consolidate the VIE. We will continually assess our involvement with VIEs and consolidated the VIEs when we are the primary beneficiary. See Note 9 for additional disclosures pertaining to VIEs.
5
Table of Contents
RAIT Financial Trust
Notes to Consolidated Financial Statements
As of March 31, 2011
(Unaudited and dollars in thousands, except share and per share amounts)
c. Use of Estimates
The preparation of financial statements in conformity with GAAP requires management to make estimates and assumptions that affect the reported amounts of assets and liabilities, the disclosure of contingent assets and liabilities at the date of the financial statements and the reported amounts of revenue and expenses during the reporting periods. Actual results could differ from those estimates.
d. Investments in Loans
We invest in commercial mortgages, mezzanine loans, debt securities and other loans. We account for our investments in commercial mortgages, mezzanine loans and other loans at amortized cost. The carrying value of these investments is adjusted for origination discounts/premiums, nonrefundable fees and direct costs for originating loans which are amortized into income on a level yield basis over the terms of the loans.
e. Allowance for Losses, Impaired Loans and Non-accrual Status
We maintain an allowance for losses on our investments in commercial mortgages, mezzanine loans and other loans. Management’s periodic evaluation of the adequacy of the allowance is based upon expected and inherent risks in the portfolio, the estimated value of underlying collateral, and current economic conditions. Management reviews loans for impairment and establishes specific reserves when a loss is probable and reasonably estimable under the provisions of FASB ASC Topic 310, “Receivables.” As part of the detailed loan review, we consider many factors about the specific loan, including payment history, asset performance, borrower’s financial capability and other characteristics. If any trends or characteristics indicate that it is probable that other loans, with similar characteristics to those of impaired loans, have incurred a loss, we consider whether an allowance for loss is needed pursuant to FASB ASC Topic 450, “Contingencies.” Management evaluates loans for non-accrual status each reporting period. A loan is placed on non-accrual status when the loan payment deficiencies exceed 90 days. Payments received for non-accrual or impaired loans are applied to principal until the loan is removed from non-accrual status or no longer impaired. Past due interest is recognized on non-accrual loans when they are removed from non-accrual status and are making current interest payments. The allowance for losses is increased by charges to operations and decreased by charge-offs (net of recoveries). Management charges off impaired loans when the investment is no longer realizable and legally discharged.
f. Investments in Real Estate
Investments in real estate are shown net of accumulated depreciation. We capitalize all costs related to the improvement of the real property and depreciate those costs on a straight-line basis over the useful life of the asset. We depreciate real property using the following useful lives: buildings and improvements – 30 years; furniture, fixtures, and equipment – 5 to 10 years; and tenant improvements—shorter of the lease term or the life of the asset. Costs for ordinary maintenance and repairs are charged to expense as incurred.
We acquire real estate assets either directly or through the conversion of our investments in loans into owned real estate. Acquisitions of real estate assets and any related intangible assets are recorded initially at fair value under FASB ASC Topic 805, “Business Combinations.” Fair value is determined by management based on market conditions and inputs at the time the asset is acquired. All expenses incurred to acquire a real estate asset are expensed as incurred.
Management reviews our investments in real estate for impairment whenever events or changes in circumstances indicate that the carrying amount of an asset may not be recoverable. The review of recoverability is based on an estimate of the future undiscounted cash flows (excluding interest charges) expected to result from the long-lived asset’s use and eventual disposition. These cash flows consider factors such as expected future operating income, trends and prospects, as well as the effects of leasing demand, competition and other factors. If impairment exists due to the inability to recover the carrying value of a long-lived asset, an impairment loss is recorded to the extent that the carrying value exceeds the estimated fair value of the property.
g. Investments in Securities
We account for our investments in securities under FASB ASC Topic 320, “Investments—Debt and Equity Securities”, and designate each investment security as a trading security, an available-for-sale security, or a held-to-maturity security based on our intent at the time of acquisition. Trading securities are recorded at their fair value each reporting period with fluctuations in fair value reported as a component of earnings. Available-for-sale securities are recorded at fair value with changes in fair value reported as a component of other comprehensive income (loss). We classify certain available-for-sale securities as trading securities when we elect to record them under the fair value option in accordance with FASB ASC Topic 825, “Financial Instruments.” See “i. Fair Value of Financial Instruments.” Upon the sale of an available-for-sale security, the realized gain or loss on the sale will be recorded as a component of earnings in the respective period. Held-to-maturity investments are carried at amortized cost at each reporting period.
6
Table of Contents
RAIT Financial Trust
Notes to Consolidated Financial Statements
As of March 31, 2011
(Unaudited and dollars in thousands, except share and per share amounts)
We account for investments in securities where the transfer meets the criteria as a financing under FASB ASC Topic 860, “Transfers and Servicing”, at amortized cost. Our investments in security-related receivables represent securities that were transferred to issuers of collateralized debt obligations, or CDOs, in which the transferors maintained some level of continuing involvement.
We use our judgment to determine whether an investment in securities has sustained an other-than-temporary decline in value. If management determines that an investment in securities has sustained an other-than-temporary decline in its value, the investment is written down to its fair value by a charge to earnings, and we establish a new cost basis for the investment. Our evaluation of an other-than-temporary decline is dependent on the specific facts and circumstances. Factors that we consider in determining whether an other-than-temporary decline in value has occurred include: the estimated fair value of the investment in relation to our cost basis; the financial condition of the related entity; and the intent and ability to retain the investment for a sufficient period of time to allow for recovery of the fair value of the investment.
h. Revenue Recognition
| 1) | Interest income—We recognize interest income from investments in commercial mortgages, mezzanine loans, and other securities on a yield to maturity basis. Upon the acquisition of a loan at a discount, we assess the portions of the discount that constitute accretable yields and non-accretable differences. The accretable yield represents the excess of our expected cash flows from the loan over the amount we paid for the loan. That amount, the accretable yield, is accreted to interest income over the remaining life of the loan. Many of our commercial mortgages and mezzanine loans provide for the accrual of interest at specified rates which differ from current payment terms. Interest income is recognized on such loans at the accrual rate subject to management’s determination that accrued interest and outstanding principal are ultimately collectible. |
For investments that we did not elect to record at fair value under FASB ASC Topic 825, “Financial Instruments”, origination fees and direct loan origination costs are deferred and amortized to net investment income, using the effective interest method, over the contractual life of the underlying loan security or loan, in accordance with FASB ASC Topic 310, “Receivables.”
For investments that we elected to record at fair value under FASB ASC Topic 825, origination fees and direct loan costs are recorded in income and are not deferred.
We recognize interest income from interests in certain securitized financial assets on an estimated effective yield to maturity basis. Management estimates the current yield on the amortized cost of the investment based on estimated cash flows after considering prepayment and credit loss experience.
| 2) | Rental income—We generate rental income from tenant rent and other tenant-related activities at our consolidated real estate properties. For multi-family real estate properties, rental income is recorded when due from residents and recognized monthly as it is earned and realizable, under lease terms which are generally for periods of one year or less. For retail and office real estate properties, rental income is recognized on a straight-line basis from the later of the date of the commencement of the lease or the date of acquisition of the property subject to existing leases, which averages minimum rents over the terms of the leases. Leases also typically provide for tenant reimbursement of a portion of common area maintenance and other operating expenses to the extent that a tenant’s pro rata share of expenses exceeds a base year level set in the lease. |
| 3) | Fee and other income—We generate fee and other income through our various subsidiaries by (a) providing ongoing asset management services to investment portfolios under cancelable management agreements, (b) providing or arranging to provide financing to our borrowers, (c) property management services to third parties, and (d) providing fixed income trading and advisory services to our customers. We recognize revenue for these activities when the fees are fixed or determinable, are evidenced by an arrangement, collection is reasonably assured and the services under the arrangement have been provided. While we may receive asset management fees when they are earned, we eliminate earned asset management fee income from CDOs while such CDOs are consolidated. During the three-month periods ended March 31, 2011 and 2010, we received $1,298 and $3,671, respectively, of earned asset management fees associated with consolidated CDOs, of which we eliminated $959 and $1,016, respectively, of management fee income. |
i. Fair Value of Financial Instruments
7
Table of Contents
RAIT Financial Trust
Notes to Consolidated Financial Statements
As of March 31, 2011
(Unaudited and dollars in thousands, except share and per share amounts)
In accordance with FASB ASC Topic 820, “Fair Value Measurements and Disclosures”, fair value is the price that would be received to sell an asset or paid to transfer a liability in an orderly transaction between market participants at the measurement date. Where available, fair value is based on observable market prices or parameters or derived from such prices or parameters. Where observable prices or inputs are not available, valuation models are applied. These valuation techniques involve management estimation and judgment, the degree of which is dependent on the price transparency for the instruments or market and the instruments’ complexity for disclosure purposes. Assets and liabilities recorded at fair value in the consolidated balance sheets are categorized based upon the level of judgment associated with the inputs used to measure their value. Hierarchical levels, as defined in FASB ASC Topic 820, “Fair Value Measurements and Disclosures” and directly related to the amount of subjectivity associated with the inputs to fair valuations of these assets and liabilities, are as follows:
| • | Level 1: Valuations are based on unadjusted, quoted prices in active markets for identical assets or liabilities at the measurement date. The types of assets carried at level 1 fair value generally are equity securities listed in active markets. As such, valuations of these investments do not entail a significant degree of judgment. |
| • | Level 2: Valuations are based on quoted prices for similar instruments in active markets or quoted prices for identical or similar instruments in markets that are not active or for which all significant inputs are observable, either directly or indirectly. |
Fair value assets and liabilities that are generally included in this category are unsecured REIT note receivables, commercial mortgage-backed securities, or CMBS, receivables and certain financial instruments classified as derivatives where the fair value is based on observable market inputs.
| • | Level 3: Inputs are unobservable inputs for the asset or liability, and include situations where there is little, if any, market activity for the asset or liability. In certain cases, the inputs used to measure fair value may fall into different levels of the fair value hierarchy. In such cases, the level in the fair value hierarchy within which the fair value measurement in its entirety falls has been determined based on the lowest level input that is significant to the fair value measurement in its entirety. Our assessment of the significance of a particular input to the fair value measurement in its entirety requires judgment, and considers factors specific to the asset. Generally, assets and liabilities carried at fair value and included in this category are trust preferred securities, or TruPS, and subordinated debentures, trust preferred obligations and CDO notes payable where observable market inputs do not exist. |
The availability of observable inputs can vary depending on the financial asset or liability and is affected by a wide variety of factors, including, for example, the type of investment, whether the investment is new, whether the investment is traded on an active exchange or in the secondary market, and the current market condition. To the extent that valuation is based on models or inputs that are less observable or unobservable in the market, the determination of fair value requires more judgment. Accordingly, the degree of judgment exercised by us in determining fair value is greatest for instruments categorized in level 3.
Fair value is a market-based measure considered from the perspective of a market participant who holds the asset or owes the liability rather than an entity-specific measure. Therefore, even when market assumptions are not readily available, our own assumptions are set to reflect those that management believes market participants would use in pricing the asset or liability at the measurement date. We use prices and inputs that management believes are current as of the measurement date, including during periods of market dislocation. In periods of market dislocation, the observability of prices and inputs may be reduced for many instruments. This condition could cause an instrument to be transferred from Level 1 to Level 2 or Level 2 to Level 3.
Many financial instruments have bid and ask prices that can be observed in the marketplace. Bid prices reflect the highest price that we and others are willing to pay for an asset. Ask prices represent the lowest price that we and others are willing to accept for an asset. For financial instruments whose inputs are based on bid-ask prices, we do not require that fair value always be a predetermined point in the bid-ask range. Our policy is to allow for mid-market pricing and adjusting to the point within the bid-ask range that results in our best estimate of fair value.
Fair value for certain of our Level 3 financial instruments is derived using internal valuation models. These internal valuation models include discounted cash flow analyses developed by management using current interest rates, estimates of the term of the particular instrument, specific issuer information and other market data for securities without an active market. In accordance with FASB ASC Topic 820, “Fair Value Measurements and Disclosures”, the impact of our own credit spreads is also considered when measuring the fair value of financial assets or liabilities, including derivative contracts. Where appropriate, valuation adjustments are made to account for various factors, including bid-ask spreads, credit quality and market liquidity. These adjustments are applied on a consistent basis and are based on observable inputs where available. Management’s estimate of fair value requires significant management judgment and is subject to a high degree of variability based upon market conditions, the availability of specific issuer information and management’s assumptions.
8
Table of Contents
RAIT Financial Trust
Notes to Consolidated Financial Statements
As of March 31, 2011
(Unaudited and dollars in thousands, except share and per share amounts)
j. Income Taxes
RAIT and Taberna have each elected to be taxed as a REIT and to comply with the related provisions of the Internal Revenue Code of 1986, as amended, or the Internal Revenue Code. Accordingly, we generally will not be subject to U.S. federal income tax to the extent of our distributions to shareholders and as long as certain asset, income and share ownership tests are met. If we were to fail to meet these requirements, we would be subject to U.S. federal income tax, which could have a material adverse impact on our results of operations and amounts available for distributions to our shareholders. Management believes that all of the criteria to maintain RAIT’s and Taberna’s REIT qualification have been met for the applicable periods, but there can be no assurance that these criteria will continue to be met in subsequent periods.
We maintain various taxable REIT subsidiaries, or TRSs, which may be subject to U.S. federal, state and local income taxes and foreign taxes. Current and deferred taxes are provided on the portion of earnings (losses) recognized by us with respect to our interest in domestic TRSs. Deferred income tax assets and liabilities are computed based on temporary differences between our GAAP consolidated financial statements and the federal and state income tax basis of assets and liabilities as of the consolidated balance sheet date. We evaluate the realizability of our deferred tax assets (e.g., net operating loss and capital loss carryforwards) and recognize a valuation allowance if, based on the available evidence, it is more likely than not that some portion or all of our deferred tax assets will not be realized. When evaluating the realizability of our deferred tax assets, we consider estimates of expected future taxable income, existing and projected book/tax differences, tax planning strategies available, and the general and industry specific economic outlook. This realizability analysis is inherently subjective, as it requires management to forecast our business and general economic environment in future periods. Changes in estimate of deferred tax asset realizability, if any, are included in income tax expense on the consolidated statements of operations.
From time to time, our TRSs generate taxable income from intercompany transactions. The TRS entities generate taxable revenue from fees for services provided to CDO entities. Some of these fees paid to the TRS entities are capitalized as deferred financing costs by the CDO entities. Certain CDO entities may be consolidated in our financial statements pursuant to FASB ASC Topic 810, “Consolidation.” In consolidation, these fees are eliminated when the CDO entity is included in the consolidated group. Nonetheless, all income taxes are accrued by the TRSs in the year in which the taxable revenue is received. These income taxes are not eliminated when the related revenue is eliminated in consolidation.
Certain TRS entities are domiciled in the Cayman Islands and, accordingly, taxable income generated by these entities may not be subject to local income taxation, but generally will be included in our taxable income on a current basis, whether or not distributed. Upon distribution of any previously included income, no incremental U.S. federal, state, or local income taxes would be payable by us.
The TRS entities may be subject to tax laws that are complex and potentially subject to different interpretations by the taxpayer and the relevant governmental taxing authorities. In establishing a provision for income tax expense, we must make judgments and interpretations about the application of these inherently complex tax laws. Actual income taxes paid may vary from estimates depending upon changes in income tax laws, actual results of operations, and the final audit of tax returns by taxing authorities. Tax assessments may arise several years after tax returns have been filed. We review the tax balances of our TRS entities quarterly and as new information becomes available, the balances are adjusted as appropriate.
k. Recent Accounting Pronouncements
On January 1, 2010, we adopted Accounting Standards Update (ASU) No. 2010-06, “Fair Value Measurements and Disclosures (Topic 820): Improving Disclosures about Fair Value Measurements.” This accounting standard requires new disclosures for significant transfers in and out of Level 1 and 2 fair value measurements and describes the reasons for the transfer. This accounting standard also updates existing disclosures by providing fair value measurement disclosures for each class of assets and liabilities and provides disclosures about the valuation techniques and inputs used to measure fair value for both recurring and nonrecurring fair value measurements. For Level 3 fair value measurements new disclosures will require entities to present information separately for purchases, sales, issuances, and settlements. These disclosures are effective for fiscal years beginning after December 15, 2010, and for interim periods within those fiscal years. The adoption of this standard did not have a material effect on our consolidated financial.
On January 1, 2011, we adopted ASU No. 2010-29, “Disclosure of Supplementary Pro Forma Information for Business Combinations.” This accounting standard requires that if a public entity presents comparative financial statements, the entity should disclose revenue and earnings of the combined entity as though the business combination(s) that occurred during the current year had occurred as of the beginning of the comparable prior annual reporting period only. This accounting standard also expands the supplemental pro forma disclosures under FASB ASU Topic 805, “Business Combinations” to include a description of the nature and amount of material, nonrecurring pro forma adjustments directly attributable to the business combination included in the reported pro forma revenue and earnings. The adoption of this standard did not have a material effect on our consolidated financial statements.
9
Table of Contents
RAIT Financial Trust
Notes to Consolidated Financial Statements
As of March 31, 2011
(Unaudited and dollars in thousands, except share and per share amounts)
In April 2011, the FASB issued accounting standards classified under FASB ASC Topic 310, “Receivables”. This accounting standard amends existing guidance to provide additional guidance on the determination of whether a creditor has granted a concession and whether a debtor is experiencing financial difficulties for purposes of determining whether a restructuring constitutes a troubled debt restructuring. This standard is effective for the first interim or annual period beginning on or after June 15, 2011, and should be applied retrospectively to the beginning of the annual period of adoption. Management is currently evaluating the impact that this standard may have on our consolidated financial statements.
NOTE 3: INVESTMENTS IN LOANS
Investments in Commercial Mortgages, Mezzanine Loans, Other Loans and Preferred Equity Interests
The following table summarizes our investments in commercial mortgages, mezzanine loans, other loans and preferred equity interests as of March 31, 2011:
| Unpaid Principal Balance |
Unamortized (Discounts) Premiums |
Carrying Amount |
Number of Loans |
Weighted- Average Coupon (1) |
Range of Maturity Dates | |||||||||||||||||||
| Commercial Real Estate (CRE) Loans |
||||||||||||||||||||||||
| Commercial mortgages |
$ | 692,594 | $ | (4,067 | ) | $ | 688,527 | 42 | 6.7 | % | May 2011 to Dec. 2020 | |||||||||||||
| Mezzanine loans |
358,396 | (5,587 | ) | 352,809 | 103 | 9.2 | % | May 2011 to Nov. 2038 | ||||||||||||||||
| Preferred equity interests |
90,782 | (1,166 | ) | 89,616 | 23 | 10.1 | % | Nov. 2011 to Aug. 2025 | ||||||||||||||||
| Total CRE Loans |
1,141,772 | (10,820 | ) | 1,130,952 | 168 | 7.8 | % | |||||||||||||||||
| Other loans |
62,342 | (1,021 | ) | 61,321 | 5 | 6.7 | % | May 2011 to Oct. 2016 | ||||||||||||||||
| Total Loans |
$ | 1,204,114 | $ | (11,841 | ) | $ | 1,192,273 | 173 | 7.7 | % | ||||||||||||||
| Deferred fees |
(1,697 | ) | — | (1,697 | ) | |||||||||||||||||||
| Total investments in loans |
$ | 1,202,417 | $ | (11,841 | ) | $ | 1,190,576 | |||||||||||||||||
| (1) | Weighted-average coupon is calculated on the unpaid principal amount of the underlying instruments, which does not necessarily correspond to the carrying amount. |
During the three-month periods ended March 31, 2011 and 2010, we completed the conversion of one and four commercial real estate loans with a carrying value of $22,078 and $52,105 to real estate owned properties. During the three-month periods ended March 31, 2011 and 2010, we charged off $1,778 and $10,815, respectively, related to the conversion of commercial real estate loans to owned properties. See Note 5.
The following table summarizes the delinquency statistics of our commercial real estate loans as of March 31, 2011 and December 31, 2010:
| Delinquency Status |
As of March 31, 2011 |
As of December 31, 2010 |
||||||
| 30 to 59 days |
$ | 24,864 | $ | 27,978 | ||||
| 60 to 89 days |
— | — | ||||||
| 90 days or more |
59,890 | 55,450 | ||||||
| In foreclosure or bankruptcy proceedings |
41,370 | 46,578 | ||||||
| Total |
$ | 126,124 | $ | 130,006 | ||||
As of March 31, 2011 and December 31, 2010, approximately $121,054 and $122,306, respectively, of our commercial real estate loans were on non-accrual status and had a weighted-average interest rate of 8.4% and 8.8%, respectively. As of March 31, 2011 and December 31, 2010, approximately $19,501 and $20,908 of other loans were on non-accrual status and had a weighted-average interest rate of 7.2%.
10
Table of Contents
RAIT Financial Trust
Notes to Consolidated Financial Statements
As of March 31, 2011
(Unaudited and dollars in thousands, except share and per share amounts)
Allowance For Losses And Impaired Loans
The following table provides a roll-forward of our allowance for losses for our commercial mortgages, mezzanine loans, and other loans for the three-month periods ended March 31, 2011 and 2010:
| For the Three-Month Period Ended March 31, 2011 |
For the Three-Month Period Ended March 31, 2010 |
|||||||
| Beginning balance |
$ | 69,691 | $ | 86,609 | ||||
| Provision |
1,950 | 17,350 | ||||||
| Charge-offs, net of recoveries |
(4,872 | ) | (27,136 | ) | ||||
| Ending balance |
$ | 66,769 | $ | 76,823 | ||||
As of March 31, 2011 and December 31, 2010, we identified 24 and 27 commercial mortgages, mezzanine loans and other loans with unpaid principal balances of $144,266 and $157,746 as impaired.
The average unpaid principal balance of total impaired loans was $151,006 and $181,037 during the three-month periods ended March 31, 2011 and 2010. We recorded interest income from impaired loans of $506 and $1,314 for the three-month periods ended March 31, 2011 and 2010.
NOTE 4: INVESTMENTS IN SECURITIES
Our investments in securities and security-related receivables are accounted for at fair value. The following table summarizes our investments in securities as of March 31, 2011:
| Investment Description |
Amortized Cost |
Net Fair Value Adjustments |
Estimated Fair Value |
Weighted Average Coupon (1) |
Weighted Average Years to Maturity |
|||||||||||||||
| Trading securities |
||||||||||||||||||||
| TruPS |
$ | 690,501 | $ | (227,116 | ) | $ | 463,385 | 5.0 | % | 23.5 | ||||||||||
| Other securities |
10,000 | (10,000 | ) | — | 4.8 | % | 41.6 | |||||||||||||
| Total trading securities |
700,501 | (237,116 | ) | 463,385 | 5.0 | % | 23.8 | |||||||||||||
| Available-for-sale securities |
3,600 | (3,598 | ) | 2 | 2.1 | % | 31.6 | |||||||||||||
| Security-related receivables |
||||||||||||||||||||
| TruPS receivables |
111,199 | (28,503 | ) | 82,696 | 6.9 | % | 11.7 | |||||||||||||
| Unsecured REIT note receivables |
61,000 | 3,455 | 64,455 | 6.6 | % | 6.5 | ||||||||||||||
| CMBS receivables (2) |
153,868 | (71,707 | ) | 82,161 | 5.7 | % | 33.0 | |||||||||||||
| Other securities |
84,092 | (57,854 | ) | 26,238 | 2.9 | % | 29.2 | |||||||||||||
| Total security-related receivables |
410,159 | (154,609 | ) | 255,550 | 5.6 | % | 22.5 | |||||||||||||
| Total investments in securities |
$ | 1,114,260 | $ | (395,323 | ) | $ | 718,937 | 5.2 | % | 23.4 | ||||||||||
| (1) | Weighted-average coupon is calculated on the unpaid principal amount of the underlying instruments which does not necessarily correspond to the carrying amount. |
| (2) | CMBS receivables include securities with a fair value totaling $30,652 that are rated between “AAA” and “A-” by Standard & Poor’s, securities with a fair value totaling $42,452 that are rated “BBB+” and “B-” by Standard & Poor’s, securities with a fair value totaling $8,666 that are rated “CCC” by Standard & Poor’s and securities with a fair value totaling $393 that are rated “D” by Standard & Poor’s. |
A substantial portion of our gross unrealized losses is greater than 12 months.
TruPS included above as trading securities include (a) investments in TruPS issued by VIEs of which we are not the primary beneficiary and which we do not consolidate and (b) transfers of investments in TruPS securities to us that were accounted for as a sale pursuant to FASB ASC Topic 860, “Transfers and Servicing.”
The following table summarizes the non-accrual status of our investments in securities:
11
Table of Contents
RAIT Financial Trust
Notes to Consolidated Financial Statements
As of March 31, 2011
(Unaudited and dollars in thousands, except share and per share amounts)
| As of March 31, 2011 | As of December 31, 2010 | |||||||||||||||||||||||
| Principal /Par Amount on Non-accrual |
Weighted Average Coupon |
Fair Value | Principal /Par Amount on Non-accrual |
Weighted Average Coupon |
Fair Value | |||||||||||||||||||
| TruPS and TruPS receivables |
$ | 128,682 | 3.9 | % | $ | 4,669 | $ | 133,682 | 4.1 | % | $ | 5,581 | ||||||||||||
| Other securities |
22,358 | 3.1 | % | 2 | 42,754 | 2.8 | % | 976 | ||||||||||||||||
| CMBS receivables |
33,228 | 5.8 | % | 4,927 | 29,204 | 5.9 | % | 975 | ||||||||||||||||
The assets of our consolidated CDOs collateralize the debt of such entities and are not available to our creditors. As of March 31, 2011 and December 31, 2010, investment in securities of $801,700 and $806,700, respectively, in principal amount of TruPS and subordinated debentures, and $214,868 and $219,868, respectively, in principal amount of unsecured REIT note receivables and CMBS receivables, collateralized the consolidated CDO notes payable of such entities.
NOTE 5: INVESTMENTS IN REAL ESTATE
The table below summarizes our investments in real estate:
| As of March 31, 2011 | As of December 31, 2010 | |||||||||||||||
| Book Value | Number of Properties |
Book Value | Number of Properties |
|||||||||||||
| Multi-family real estate properties |
$ | 601,240 | 33 | $ | 602,183 | 33 | ||||||||||
| Office real estate properties |
246,869 | 10 | 219,567 | 9 | ||||||||||||
| Retail real estate properties |
43,147 | 2 | 41,838 | 2 | ||||||||||||
| Parcels of land |
22,208 | 3 | 22,208 | 3 | ||||||||||||
| Subtotal |
913,464 | 48 | 885,796 | 47 | ||||||||||||
| Plus: Escrows and reserves |
7,743 | 2,296 | ||||||||||||||
| Less: Accumulated depreciation and amortization |
(53,481 | ) | (46,604 | ) | ||||||||||||
| Investments in real estate |
$ | 867,726 | $ | 841,488 | ||||||||||||
As of March 31, 2011, our investments in real estate of $867,726 are financed through $75,546 of mortgages held by third parties and $815,614 of mortgages held by our consolidated securitizations. Together, along with commercial real estate loans held by these securitizations, these mortgages serve as collateral for the CDO notes payable issued by our consolidated securitizations. All intercompany balances and interest charges are eliminated in consolidation.
Assets Held for Sale:
As of March 31, 2011, we have identified one property as asset held for sale. The carrying amount of this asset is $48,859 and liabilities related to this asset are $1,584. These amounts are included in the investments in real estate and indebtedness, accounts payable and accrued expenses, and deferred taxes, borrowers’ escrows and other liabilities financial statement captions. Liabilities related to assets held for sale exclude $43,086 of a first mortgage held by RAIT II that is eliminated in our consolidated balance sheet. See Note 13—Assets Held For Sale and Discontinued Operations.
Acquisitions:
During the three-month period ended March 31, 2011, we converted one loan with a carrying value of $22,078, relating to one office property, to owned real estate. Upon conversion, we recorded the investment in real estate and related working capital acquired at fair value of $20,367. We previously held a bridge loan with respect to this real estate property.
The following table summarizes the aggregate estimated fair value of the assets and liabilities associated with the one property acquired during the three-month period ended March 31, 2011, on the respective date of each conversion, for the real estate accounted for under FASB ASC Topic 805.
| Description |
Estimated Fair Value |
|||
| Assets acquired: |
||||
| Investments in real estate |
$ | 20,300 | ||
| Cash and cash equivalents |
49 | |||
| Restricted cash |
297 | |||
| Other assets |
16 | |||
12
Table of Contents
RAIT Financial Trust
Notes to Consolidated Financial Statements
As of March 31, 2011
(Unaudited and dollars in thousands, except share and per share amounts)
| Description |
Estimated Fair Value |
|||
| Total assets acquired |
20,662 | |||
| Liabilities assumed: |
||||
| Accounts payable and accrued expenses |
174 | |||
| Other liabilities |
121 | |||
| Total liabilities assumed |
295 | |||
| Estimated fair value of net assets acquired |
$ | 20,367 | ||
The following table summarizes the consideration transferred to acquire the real estate properties and the amounts of identified assets acquired and liabilities assumed at the respective conversion date:
| Description |
Estimated Fair Value |
|||
| Fair value of consideration transferred: |
||||
| Commercial real estate loans |
$ | 20,300 | ||
| Other considerations |
67 | |||
| Total fair value of consideration transferred |
$ | 20,367 | ||
During the three-month period ended March 31, 2011, these investments contributed revenue of $496 and a net income allocable to common shares of $243. During the three-month period ended March 31, 2011, we did not incur any third-party acquisition-related costs.
Our consolidated unaudited pro forma information, after including the acquisition of real estate properties, is presented below as if the acquisition occurred on January 1, 2010. These pro forma results are not necessarily indicative of the results which actually would have occurred if the acquisition had occurred on the first day of the periods presented, nor does the pro forma financial information purport to represent the results of operations for future periods:
| Description |
For
the Three-Month Period Ended March 31, 2011 |
For
the Three-Month Period Ended March 31, 2010 |
||||||
| Total revenue, as reported |
$ | 58,279 | $ | 66,244 | ||||
| Pro forma revenue |
58,415 | 66,877 | ||||||
| Net income (loss) allocable to common shares, as reported |
5,767 | 31,282 | ||||||
| Pro forma net income (loss) allocable to common shares |
5,836 | 31,535 | ||||||
These amounts have been calculated after adjusting the results of the acquired businesses to reflect the additional depreciation that would have been charged assuming the fair value adjustments to our investments in real estate had been applied from January 1, 2010 together with the consequential tax effects.
We have not yet completed the process of estimating the fair value of assets acquired and liabilities assumed. Accordingly, our preliminary estimates and the allocation of the purchase price to the assets acquired and liabilities assumed may change as we complete the process. In accordance with FASB ASC Topic 805, changes, if any, to the preliminary estimates and allocation will be reported in our financial statements retrospectively.
Dispositions:
During the three-month period ended March 31, 2011, we did not dispose of any real estate properties. Subsequent to March 31, 2011, we completed the sale of the real estate property identified as held for sale as of March 31, 2011 and recorded a loss on sale of asset of $66.
NOTE 6: INDEBTEDNESS
We maintain various forms of short-term and long-term financing arrangements. Generally, these financing agreements are collateralized by assets within securitizations. The following table summarizes our total recourse and non-recourse indebtedness as of March 31, 2011:
13
Table of Contents
RAIT Financial Trust
Notes to Consolidated Financial Statements
As of March 31, 2011
(Unaudited and dollars in thousands, except share and per share amounts)
| Description |
Unpaid Principal Balance |
Carrying Amount |
Weighted- Average Interest Rate |
Contractual Maturity | ||||||||||||
| Recourse indebtedness: |
||||||||||||||||
| 7.0% convertible senior notes (2) |
$ | 115,000 | $ | 106,815 | 7.0 | % | Apr. 2031 | |||||||||
| 6.875% convertible senior notes (1) |
55,613 | 55,569 | 6.9 | % | Apr. 2027 | |||||||||||
| Secured credit facilities |
20,040 | 20,040 | 4.5 | % | Dec. 2011 | |||||||||||
| Senior secured notes |
58,700 | 58,700 | 11.8 | % | Apr. 2014 | |||||||||||
| Loans payable on real estate |
7,245 | 7,245 | 5.0 | % | Sept. 2013 | |||||||||||
| Junior subordinated notes, at fair value (3) |
38,052 | 4,422 | 5.2 | % | Oct. 2015 to Mar. 2035 | |||||||||||
| Junior subordinated notes, at amortized cost |
25,100 | 25,100 | 7.7 | % | Apr. 2037 | |||||||||||
| Total recourse indebtedness |
319,750 | 277,891 | 7.5 | % | ||||||||||||
| Non-recourse indebtedness: |
||||||||||||||||
| CDO notes payable, at amortized cost (4)(5) |
1,341,750 | 1,341,750 | 0.7 | % | 2045 to 2046 | |||||||||||
| CDO notes payable, at fair value (3)(4)(6) |
1,134,643 | 142,633 | 0.9 | % | 2037 to 2038 | |||||||||||
| Loans payable on real estate |
68,343 | 68,343 | 5.8 | % | Jun. 2011 to Mar. 2018 | |||||||||||
| Total non-recourse indebtedness |
2,544,736 | 1,552,726 | 0.9 | % | ||||||||||||
| Total indebtedness |
$ | 2,864,486 | $ | 1,830,617 | 1.7 | % | ||||||||||
| (1) | Our 6.875% convertible senior notes are redeemable, at par at the option of the holder, in April 2012, April 2017, and April 2022. |
| (2) | Our 7.0% convertible senior notes are redeemable, at par at the option of the holder, in April 2016, April 2021, and April 2026. |
| (3) | Relates to liabilities which we elected to record at fair value under FASB ASC Topic 825. |
| (4) | Excludes CDO notes payable purchased by us which are eliminated in consolidation. |
| (5) | Collateralized by $1,789,177 principal amount of commercial mortgages, mezzanine loans, other loans and preferred equity interests. These obligations were issued by separate legal entities and consequently the assets of the special purpose entities that collateralize these obligations are not available to our creditors. |
| (6) | Collateralized by $1,286,268 principal amount of investments in securities and security-related receivables and loans, before fair value adjustments. The fair value of these investments as of March 31, 2011 was $877,532. These obligations were issued by separate legal entities and consequently the assets of the special purpose entities that collateralize these obligations are not available to our creditors. |
Recourse indebtedness refers to indebtedness that is recourse to our general assets, including the loans payable on real estate that are guaranteed by RAIT or RAIT Partnership. As indicated in the table above, our consolidated financial statements include recourse indebtedness of $277,891 as of March 31, 2011. Non-recourse indebtedness consists of indebtedness of consolidated VIEs (i.e. CDOs and other securitization vehicles) and loans payable on real estate which is recourse only to specific assets pledged as collateral to the lenders. The creditors of each consolidated VIE have no recourse to our general credit.
The current status or activity in our financing arrangements occurring as of or during the three-month period ended March 31, 2011 is as follows:
Recourse Indebtedness
6.875% convertible senior notes. During the three-month period ended March 31, 2011, we repurchased $88,000 in aggregate principal amount of our 6.875% Convertible Senior Notes due 2027, or the 6.875% convertible senior notes, for a total cash consideration of $86,336. As a result of these transactions, we recorded losses on extinguishment of debt of $537, net of deferred financing costs and unamortized discounts that were written off.
Our 6.875% convertible senior notes are redeemable, at the option of the holder, in April 2012. We expect to acquire, redeem, refinance or otherwise enter into transactions to satisfy our 6.875% convertible senior notes which may include any combination of payments of cash, issuances of our debt and/or equity securities, sales or exchanges of our assets or other methods.
7.0% convertible senior notes. On March 21, 2011, we issued and sold in a public offering $115,000 aggregate principal amount of our 7.0% Convertible Senior Notes due 2031, or the 7.0% convertible senior notes. After deducting the underwriting discount and the estimated offering costs, we received approximately $109,000 of net proceeds. Interest on the 7.0% convertible senior notes is paid semi-annually and the 7.0% convertible senior notes mature on April 1, 2031.
Prior to April 5, 2016, the 7.0% convertible senior notes are not redeemable at RAIT’s option, except to preserve RAIT’s status as a REIT. On or after April 5, 2016, RAIT may redeem all or a portion of the 7.0% convertible senior notes at a redemption price equal to the principal amount plus accrued and unpaid interest. Holders of 7.0% convertible senior notes may require RAIT to repurchase all or a portion of the 7.0% convertible senior notes at a purchase price equal to the principal amount plus accrued and unpaid interest on April 1, 2016, April 1, 2021, and April 1, 2026, or upon the occurrence of certain defined fundamental changes.
The 7.0% convertible senior notes are convertible at the option of the holder at an initial conversion rate of 390.1677 common shares per $1,000 principal amount of 7.0% convertible senior notes (equivalent to an initial conversion price of $2.563 per common share).
14
Table of Contents
RAIT Financial Trust
Notes to Consolidated Financial Statements
As of March 31, 2011
(Unaudited and dollars in thousands, except share and per share amounts)
Upon conversion of 7.0% convertible senior notes by a holder, the holder will receive cash, our common shares or a combination of cash and our common shares, at our election. The initial conversion rate is subject to adjustment in certain circumstances. We include the 7.0% convertible senior notes in earnings per share using the treasury stock method if the conversion value in excess of the par amount is considered in the money during the respective periods.
According to FASB ASC Topic 470, “Debt”, we recorded a discount on our issued and outstanding 7.0% convertible senior notes of $8,228. This discount reflects the fair value of the embedded conversion option within the 7.0% convertible senior notes and was recorded as an increase to additional paid in capital. The fair value was calculated by discounting the cash flows required in the indenture relating to the 7.0% convertible senior notes agreement by a discount rate that represents management’s estimate of our senior, unsecured, non-convertible debt borrowing rate at the time when the 7.0% convertible senior notes were issued. The discount will be amortized to interest expense through April 1, 2016, the date at which holders of our 7.0% convertible senior notes could require repayment.
Secured credit facility. During the three-month period ending March 31, 2011, we prepaid a $16,160 secured credit facility that was maturing in October 2011. As of March 31, 2011, we have borrowed an aggregate amount of $20,040 under our remaining secured credit facility, which is payable in December 2011 under the current terms of this facility. Our secured credit facility is secured by designated commercial mortgages and mezzanine loans.
Senior secured convertible note. During the three-month period ended March 31, 2011, the holder of the senior secured convertible note converted $5,250 principal amount of the senior secured convertible note into 1,500,000 common shares. On April 26, 2011, we prepaid the remaining $15,700 principal amount of the 10.0% senior secured convertible note issued March 25, 2010.
Loans payable on real estate. During the three-month period ended March 31, 2011 we refinanced a first mortgage of $12,500 principal amount with a fixed rate of 5.8%, due in April 2012 that was associated with one of our owned real estate properties through non-recourse financing provided by a consolidated securitization.
Non-Recourse Indebtedness
CDO notes payable, at amortized cost. CDO notes payable at amortized cost represent notes issued by consolidated CDO entities which are used to finance the acquisition of unsecured REIT notes, CMBS securities, commercial mortgages, mezzanine loans, and other loans in our commercial real estate portfolio. Generally, CDO notes payable are comprised of various classes of notes payable, with each class bearing interest at variable or fixed rates. Both of our CRE CDOs are meeting all of their overcollateralization, or OC, and interest coverage, or IC, trigger tests as of March 31, 2011.
CDO notes payable, at fair value. Both of our Taberna consolidated CDOs are failing OC trigger tests which cause a change to the priority of payments to the debt and equity holders of the respective securitizations. Upon the failure of an OC test, the indenture of each CDO requires cash flows that would otherwise have been distributed to us as equity distributions, or in some cases interest payments on our retained CDO notes payable, to be used to pay down sequentially the outstanding principal balance of the most senior note holders. The OC tests failures are due to defaulted collateral assets and credit risk securities. During the three-month period ended March 31, 2011, $12,469 of cash flows were re-directed from our retained interests in these CDOs and were used to repay the most senior holders of our CDO notes payable.
Loans payable on real estate. During the three-month period ended March 31, 2011, we obtained a first mortgage on of one of our owned properties from the Federal National Mortgage Association. The new first mortgage has a principal balance of $13,400, 7 year term, and a 5.12% interest rate.
NOTE 7: DERIVATIVE FINANCIAL INSTRUMENTS
We may use derivative financial instruments to hedge all or a portion of the interest rate risk associated with our borrowings. The principal objective of such arrangements is to minimize the risks and/or costs associated with our operating and financial structure as well as to hedge specific anticipated transactions. The counterparties to these contractual arrangements are major financial institutions with which we and our affiliates may also have other financial relationships. In the event of nonperformance by the counterparties, we are potentially exposed to credit loss. However, because of the high credit ratings of the counterparties, we do not anticipate that any of the counterparties will fail to meet their obligations.
Cash Flow Hedges
We have entered into various interest rate swap contracts to hedge interest rate exposure on floating rate indebtedness. We designate interest rate hedge agreements at inception and determine whether or not the interest rate hedge agreement is highly effective in offsetting interest rate fluctuations associated with the identified indebtedness. At designation, certain of these interest rate
15
Table of Contents
RAIT Financial Trust
Notes to Consolidated Financial Statements
As of March 31, 2011
(Unaudited and dollars in thousands, except share and per share amounts)
swaps had a fair value not equal to zero. However, we concluded, at designation, that these hedging arrangements were highly effective during their term using regression analysis and determined that the hypothetical derivative method would be used in measuring any ineffectiveness. At each reporting period, we update our regression analysis and, as of March 31, 2011, we concluded that these hedging arrangements were highly effective during their remaining term and used the hypothetical derivative method in measuring the ineffective portions of these hedging arrangements.
The following table summarizes the aggregate notional amount and estimated net fair value of our derivative instruments as of March 31, 2011 and December 31, 2010:
| As of March 31, 2011 | As of December 31, 2010 | |||||||||||||||
| Notional | Fair Value | Notional | Fair Value | |||||||||||||
| Cash flow hedges: |
||||||||||||||||
| Interest rate swaps |
$ | 1,747,698 | $ | (164,127 | ) | $ | 1,786,698 | $ | (184,878 | ) | ||||||
| Interest rate caps |
36,000 | 1,341 | 36,000 | 1,496 | ||||||||||||
| Net fair value |
$ | 1,783,698 | $ | (162,786 | ) | $ | 1,822,698 | $ | (183,382 | ) | ||||||
For interest rate swaps that are considered effective hedges, we reclassified realized losses of $10,889 and $11,725 to earnings for the three-month periods ended March 31, 2011 and 2010. For interest rate swaps that are considered ineffective hedges, we reclassified unrealized losses of $13 to earnings for the three-month period ended March 31, 2010.
On January 1, 2008, we adopted the fair value option, which has been classified under FASB ASC Topic 825, “Financial Instruments”, for certain of our CDO notes payable. Upon the adoption of this standard, hedge accounting for any previously designated cash flow hedges associated with these CDO notes payable was discontinued and all changes in fair value of these cash flow hedges are recorded in earnings. As of March 31, 2011, the notional value associated with these cash flow hedges where hedge accounting was discontinued was $967,276 and had a liability balance with a fair value of $83,227. See Note 8: “Fair Value of Financial Instruments” for the changes in value of these hedges during the three-month periods ended March 31, 2011 and 2010. The change in value of these hedges was recorded as a component of the change in fair value of financial instruments in our consolidated statement of operations.
Amounts reclassified to earnings associated with effective cash flow hedges are reported in interest expense and the fair value of these hedge agreements is included in other assets or derivative liabilities.
NOTE 8: FAIR VALUE OF FINANCIAL INSTRUMENTS
Fair Value of Financial Instruments
FASB ASC Topic 825, “Financial Instruments” requires disclosure of the fair value of financial instruments for which it is practicable to estimate that value. The fair value of investments in mortgages and loans, investments in securities, CDO notes payable, convertible senior notes, junior subordinated notes and derivative assets and liabilities is based on significant observable and unobservable inputs. The fair value of cash and cash equivalents, restricted cash, secured credit facilities, senior secured notes, loans payable on real estate and other indebtedness approximates cost due to the nature of these instruments.
16
Table of Contents
RAIT Financial Trust
Notes to Consolidated Financial Statements
As of March 31, 2011
(Unaudited and dollars in thousands, except share and per share amounts)
The following table summarizes the carrying amount and the fair value of our financial instruments as of March 31, 2011:
| Financial Instrument |
Carrying Amount |
Estimated Fair Value |
||||||
| Assets |
||||||||
| Commercial mortgages, mezzanine loans and other loans |
$ | 1,190,576 | $ | 1,124,256 | ||||
| Investments in securities and security-related receivables |
718,937 | 718,937 | ||||||
| Cash and cash equivalents |
39,463 | 39,463 | ||||||
| Restricted cash |
179,308 | 179,308 | ||||||
| Derivative assets |
1,341 | 1,341 | ||||||
| Liabilities |
||||||||
| Recourse indebtedness: |
||||||||
| 7.0% convertible senior notes |
106,815 | 125,687 | ||||||
| 6.875% convertible senior notes |
55,569 | 54,657 | ||||||
| Secured credit facilities |
20,040 | 20,040 | ||||||
| Senior secured notes |
58,700 | 58,700 | ||||||
| Junior subordinated notes, at fair value |
4,422 | 4,422 | ||||||
| Junior subordinated notes, at amortized cost |
25,100 | 2,917 | ||||||
| Loans payable on real estate |
7,245 | 7,245 | ||||||
| Non-recourse indebtedness: |
||||||||
| CDO notes payable, at amortized cost |
1,341,750 | 921,840 | ||||||
| CDO notes payable, at fair value |
142,633 | 142,633 | ||||||
| Loans payable on real estate |
68,343 | 68,343 | ||||||
| Derivative liabilities |
164,127 | 164,127 | ||||||
Fair Value Measurements
The following tables summarize information about our assets and liabilities measured at fair value on a recurring basis as of March 31, 2011, and indicate the fair value hierarchy of the valuation techniques utilized to determine such fair value:
| Assets: |
Quoted Prices in Active Markets for Identical Assets (Level 1) (a) |
Significant Other Observable Inputs (Level 2) (a) |
Significant Unobservable Inputs (Level 3) ) (a) |
Balance as of March 31, 2011 |
||||||||||||
| Trading securities |
||||||||||||||||
| TruPS |
$ | — | $ | — | $ | 463,385 | $ | 463,385 | ||||||||
| Other securities |
— | — | — | — | ||||||||||||
| Available-for-sale securities |
— | 2 | — | 2 | ||||||||||||
| Security-related receivables |
||||||||||||||||
| TruPS receivables |
— | — | 82,696 | 82,696 | ||||||||||||
| Unsecured REIT note receivables |
— | 64,455 | — | 64,455 | ||||||||||||
| CMBS receivables |
— | 82,161 | — | 82,161 | ||||||||||||
| Other securities |
— | 26,238 | — | 26,238 | ||||||||||||
| Derivative assets |
— | 1,341 | — | 1,341 | ||||||||||||
| Total assets |
$ | — | $ | 174,197 | $ | 546,081 | $ | 720,278 | ||||||||
| Liabilities: |
Quoted Prices in Active Markets for Identical Assets (Level 1) (a) |
Significant Other Observable Inputs (Level 2) (a) |
Significant Unobservable Inputs (Level 3) ) (a) |
Balance as of March 31, 2011 |
||||||||||||
| Junior subordinated notes, at fair value |
$ | — | $ | — | $ | 4,422 | $ | 4,422 | ||||||||
| CDO notes payable, at fair value |
— | — | 142,633 | 142,633 | ||||||||||||
| Derivative liabilities |
— | 84,847 | 79,280 | 164,127 | ||||||||||||
| Total liabilities |
$ | — | $ | 84,847 | $ | 226,335 | $ | 311,182 | ||||||||
| (a) | During the three-month period ended March 31, 2011, there were no transfers between Level 1 and Level 2, as well as, there were no transfers into and out of Level 3. |
The following tables summarize additional information about assets and liabilities that are measured at fair value on a recurring basis for which we have utilized level 3 inputs to determine fair value for the three-month period ended March 31, 2011:
17
Table of Contents
RAIT Financial Trust
Notes to Consolidated Financial Statements
As of March 31, 2011
(Unaudited and dollars in thousands, except share and per share amounts)
| Assets |
Trading Securities—TruPS and Subordinated Debentures |
Security-Related Receivables—TruPS and Subordinated Debenture Receivables |
Total Level 3 Assets |
|||||||||
| Balance, as of December 31, 2010 |
$ | 454,473 | $ | 83,087 | $ | 537,560 | ||||||
| Change in fair value of financial instruments |
13,912 | (391 | ) | 13,521 | ||||||||
| Purchases |
— | — | — | |||||||||
| Sales |
(5,000 | ) | — | (5,000 | ) | |||||||
| Balance, as of March 31, 2011 |
$ | 463,385 | $ | 82,696 | $ | 546,081 | ||||||
| Liabilities |
Derivative Liabilities |
CDO Notes Payable, at Fair Value |
Junior Subordinated Notes, at Fair Value |
Total Level 3 Liabilities |
||||||||||||
| Balance, as of December 31, 2010 |
$ | 87,632 | $ | 148,072 | $ | 4,422 | $ | 240,126 | ||||||||
| Change in fair value of financial instruments |
(8,352 | ) | 7,031 | — | (1,321 | ) | ||||||||||
| Purchases |
— | — | — | — | ||||||||||||
| Sales |
— | — | — | — | ||||||||||||
| Principal repayments |
— | (12,470 | ) | — | (12,470 | ) | ||||||||||
| Balance, as of March 31, 2011 |
$ | 79,280 | $ | 142,633 | $ | 4,422 | $ | 226,335 | ||||||||
Change in Fair Value of Financial Instruments
The following table summarizes realized and unrealized gains and losses on assets and liabilities for which we elected the fair value option of FASB ASC Topic 825, “Financial Instruments” as reported in change in fair value of financial instruments in the accompanying consolidated statements of operations:
| Description |
For the Three-Month Period Ended March 31, 2011 |
For the Three-Month Period Ended March 31, 2010 |
||||||
| Change in fair value of trading securities and security-related receivables |
$ | 16,554 | $ | 47,745 | ||||
| Change in fair value of CDO notes payable, trust preferred obligations and other liabilities |
(7,031 | ) | (13,493 | ) | ||||
| Change in fair value of derivatives |
(3,912 | ) | (17,815 | ) | ||||
| Change in fair value of financial instruments |
$ | 5,611 | $ | 16,437 | ||||
The changes in the fair value for the investment in securities, CDO notes payable and other liabilities for which the fair value option was elected for the three-month periods ended March 31, 2011 and 2010 was primarily attributable to changes in instrument specific credit risks. The changes in the fair value of derivatives for which the fair value option was elected for the three-month periods ended March 31, 2011 and 2010 was mainly due to changes in interest rates.
18
Table of Contents
RAIT Financial Trust
Notes to Consolidated Financial Statements
As of March 31, 2011
(Unaudited and dollars in thousands, except share and per share amounts)
NOTE 9: VARIABLE INTEREST ENTITIES
The following table presents the assets and liabilities of our consolidated VIEs as of each respective date. As of March 31, 2011 our consolidated VIEs were: Taberna Preferred Funding VIII, Ltd., Taberna Preferred Funding IX, Ltd, RAIT CRE CDO I, Ltd., RAIT Preferred Funding II, Ltd., Willow Grove and Cherry Hill.
| As of March 31, 2011 |
As of December 31, 2010 |
|||||||
| Assets |
||||||||
| Investments in mortgages and loans, at amortized cost: |
||||||||
| Commercial mortgages, mezzanine loans, other loans and preferred equity interests |
$ | 1,919,547 | $ | 1,913,089 | ||||
| Allowance for losses |
(15,526 | ) | (15,526 | ) | ||||
| Total investments in mortgages and loans |
1,904,021 | 1,897,563 | ||||||
| Investments in real estate |
20,684 | 21,054 | ||||||
| Investments in securities and security-related receivables, at fair value |
718,942 | 705,455 | ||||||
| Cash and cash equivalents |
269 | 73 | ||||||
| Restricted cash |
142,847 | 151,045 | ||||||
| Accrued interest receivable |
57,118 | 55,105 | ||||||
| Deferred financing costs, net of accumulated amortization of $9,163 and $8,608, respectively |
17,444 | 17,999 | ||||||
| Total assets |
$ | 2,861,325 | $ | 2,848,294 | ||||
| Liabilities and Equity |
||||||||
| Indebtedness (including $142,633 and $148,072 at fair value, respectively) |
$ | 1,701,809 | $ | 1,707,352 | ||||
| Accrued interest payable |
38,286 | 34,745 | ||||||
| Accounts payable and accrued expenses |
1,697 | 1,450 | ||||||
| Derivative liabilities |
164,127 | 184,878 | ||||||
| Deferred taxes, borrowers’ escrows and other liabilities |
4,030 | 3,814 | ||||||
| Total liabilities |
1,909,949 | 1,932,239 | ||||||
| Equity: |
||||||||
| Shareholders’ equity: |
||||||||
| Accumulated other comprehensive income (loss) |
(110,375 | ) | (123,316 | ) | ||||
| RAIT Investment |
94,148 | 103,862 | ||||||
| Retained earnings |
967,603 | 935,509 | ||||||
| Total shareholders’ equity |
951,376 | 916,055 | ||||||
| Total liabilities and equity |
$ | 2,861,325 | $ | 2,848,294 | ||||
The assets of the VIEs can only be used to settle obligations of the VIEs and are not available to our creditors. Certain amounts included in the table above are eliminated upon consolidation with other RAIT subsidiaries that maintain investments in the debt or equity securities issued by these entities.
RAIT does not have any contractual obligation to provide the VIEs listed above with any financial support. RAIT has not provided and does not intend to provide financial support to these VIEs that we were not previously contractually required to provide.
NOTE 10: EQUITY
Preferred Shares
On January 25, 2011, our board of trustees declared a first quarter 2011 cash dividend of $0.484375 per share on our 7.75% Series A Preferred Shares, $0.5234375 per share on our 8.375% Series B Preferred Shares and $0.5546875 per share on our 8.875% Series C Preferred Shares. The dividends were paid on March 31, 2011 to holders of record on March 1, 2011 and totaled $3,406.
Common Shares
Dividends:
On January 10, 2011, the board of trustees declared a $0.03 dividend on our common shares to holders of record as of January 21, 2011. The dividend was paid on January 31, 2011 and totaled $3,204.
19
Table of Contents
RAIT Financial Trust
Notes to Consolidated Financial Statements
As of March 31, 2011
(Unaudited and dollars in thousands, except share and per share amounts)
Share Repurchases:
On January 25, 2011, the compensation committee approved a cash payment to the board’s eight non-management trustees intended to constitute a portion of their respective 2011 annual non-management trustee compensation. The cash payment was subject to terms and conditions set forth in a letter agreement, or the letter agreement, between each of the non-management trustees and RAIT. The terms and conditions included a requirement that each trustee use a portion of the cash payment to purchase RAIT’s common shares in purchases that, individually and in the aggregate with all purchases made by all the other non-management trustees pursuant to their respective letter agreements, complied with Rule 10b-18 promulgated under the Securities Exchange Act of 1934, as amended. The aggregate amount required to be used by all of the non-management trustees to purchase common shares is $210 and was used to purchase 56,693 common shares, in the aggregate, in February 2011.
Equity Compensation:
During the three-months ended March 31, 2011, 1,019,162 phantom unit awards were redeemed for common shares. These phantom units were fully vested at the time of redemption.
Dividend Reinvestment and Share Purchase Plan (DRSPP):
We implemented an amended and restated dividend reinvestment and share purchase plan, or DRSPP, effective as of March 13, 2008, pursuant to which we registered and reserved for issuance 18,787,635 common shares. During the three-month period ended March 31, 2011, we issued a total of 25,569 common shares pursuant to the DRSPP at a weighted-average price of $2.75 per share and we received $69 of net proceeds. As of March 31, 2011, 11,672,065 common shares, in aggregate, remain available for issuance under the DRSPP.
Capital on Demand™ Sales Agreement:
On August 6, 2010, we entered into a Capital on Demand™ Sales Agreement, or the COD sales agreement, with JonesTrading Institutional Services LLC, or JonesTrading, pursuant to which we may issue and sell up to 17,500,000 of our common shares from time to time through JonesTrading acting as agent and/or principal, subject to the terms and conditions of the COD sales agreement. For the three-month period ended March 31, 2011, 5,750,000 common shares were issued pursuant to this arrangement at a weighted average price of $3.20 and we received $18,232 of proceeds. As of March 31, 2011, 2,696,589 common shares, in the aggregate, remain available for issuance under the COD sales agreement.
20
Table of Contents
RAIT Financial Trust
Notes to Consolidated Financial Statements
As of March 31, 2011
(Unaudited and dollars in thousands, except share and per share amounts)
NOTE 11: EARNINGS (LOSS) PER SHARE
The following table presents a reconciliation of basic and diluted earnings (loss) per share for the three-month periods ended March 31, 2011 and 2010:
| For the Three-Month Periods Ended March 31 |
||||||||
| 2011 | 2010 | |||||||
| Income (loss) from continuing operations |
$ | 8,340 | $ | 33,983 | ||||
| (Income) loss allocated to preferred shares |
(3,414 | ) | (3,406 | ) | ||||
| (Income) loss allocated to noncontrolling interests |
50 | 235 | ||||||
| Income (loss) from continuing operations allocable to common shares |
4,976 | 30,812 | ||||||
| Income (loss) from discontinued operations |
791 | 470 | ||||||
| Net income (loss) allocable to common shares |
$ | 5,767 | $ | 31,282 | ||||
| Weighted-average shares outstanding—Basic |
109,856,729 | 74,952,313 | ||||||
| Dilutive securities under the treasury stock method |
1,047,630 | 560,686 | ||||||
| Weighted-average shares outstanding—Diluted |
110,904,359 | 75,512,999 | ||||||
| Earnings (loss) per share—Basic: |
||||||||
| Continuing operations |
$ | 0.04 | $ | 0.41 | ||||
| Discontinued operations |
0.01 | 0.01 | ||||||
| Total earnings (loss) per share—Basic |
$ | 0.05 | $ | 0.42 | ||||
| Earnings (loss) per share—Diluted: |
||||||||
| Continuing operations |
$ | 0.04 | $ | 0.40 | ||||
| Discontinued operations |
0.01 | 0.01 | ||||||
| Total earnings (loss) per share—Diluted |
$ | 0.05 | $ | 0.41 | ||||
For the three-month periods ended March 31, 2011 and 2010, securities convertible into 6,239,608 and 6,693,341 common shares, respectively, were excluded from the earnings (loss) per share computations because their effect would have been anti-dilutive.
NOTE 12: RELATED PARTY TRANSACTIONS
In the ordinary course of our business operations, we have ongoing relationships and have engaged in transactions with several related entities described below. All of these relationships and transactions were approved or ratified by our audit committee as being on terms comparable to those available on an arm’s-length basis from an unaffiliated third party or otherwise not creating a conflict of interest.
Mrs. Betsy Z. Cohen retired as our Chairman of the Board and as a Trustee effective December 31, 2010. Mrs. Cohen, is the Chief Executive Officer and a director of The Bancorp, Inc., or Bancorp, and Chairman of the Board and Chief Executive Officer of its wholly-owned subsidiary, The Bancorp Bank, a commercial bank. Mrs. Cohen’s son, Daniel G. Cohen, was our chief executive officer from the date of the Taberna acquisition until his resignation from that position on February 22, 2009. Mr. Cohen was a trustee of RAIT from the date of the Taberna acquisition until his resignation from that position on February 26, 2010. Mr. Cohen is the Chairman of the Board of Bancorp and Chairman of its Executive Committee and Vice-Chairman of the Board of Bancorp Bank and Chairman of its Executive Committee. Scott F. Schaeffer is our Chairman and a Trustee and Chief Executive Officer and President. Mr. Schaeffer’s spouse is a director of Bancorp and she and Mr. Schaeffer own, in the aggregate, less than 1% of Bancorp’s outstanding common shares. For transactions subsequent to March 22, 2011, the date we filed our proxy statement for our 2011 annual meeting of shareholders with the SEC, we expect to continue to consider Bancorp to be a related party due to Mr. Schaeffer’s spouse’s service as a director of Bancorp but no longer due to Mrs. Cohen’s and Mr. Cohen’s positions there. Each transaction with Bancorp is described below:
a). Cash and Restricted Cash—We maintain checking and demand deposit accounts at Bancorp. As of March 31, 2011 and December 31, 2010, we had $210 and $72, respectively, of cash and cash equivalents and $667 and $985, respectively, of restricted cash on deposit at Bancorp. We did not receive any interest income from the Bancorp during the three-month periods ended March 31, 2011 and 2010. Restricted cash held at Bancorp relates to borrowers’ escrows for taxes, insurance and capital reserves. Any interest earned on these deposits enures to the benefit of the specific borrower and not to us.
b). Office Leases—We sublease a portion of our downtown Philadelphia office space from Bancorp under a lease agreement extending through August 2014 at an annual rental expense based upon the amount of square footage occupied. We have signed a sublease agreement with a third party for the remaining term of our sublease. Rent paid to Bancorp was $84 and $68 for the three-month periods ended March 31, 2011 and 2010, respectively. Rent received for our sublease was $42 and $41 for the three-month periods ended March 31, 2011 and 2010.
21
Table of Contents
RAIT Financial Trust
Notes to Consolidated Financial Statements
As of March 31, 2011
(Unaudited and dollars in thousands, except share and per share amounts)
Mr. Cohen holds controlling positions in various companies with which we conduct business. Mr. Cohen serves as the Chairman of the board of directors, Chief Executive Officer and Chief Investment Officer of Institutional Financial Markets, Inc. or, IFMI, and as the Chairman of the board of managers, Chief Executive Officer and Chief Investment Officer of IFMI, LLC, or IFMI LLC, a majority owned subsidiary of IFMI. For transactions subsequent to March 22, 2011, the date we filed our proxy statement for our 2011 annual meeting of shareholders with the SEC, due to our remaining relationships with IFMI and our analysis of applicable SEC and accounting rules, we do not expect to treat IFMI or IFMI LLC as a related party. Each transaction between us and IFMI and IFMI LLC through March 31, 2011 is described below:
a). Office Leases—We maintain sub-lease agreements for shared office space and facilities with IFMI. Rent expense during the three-month periods ended March 31, 2011 and 2010, relating to these leases was $12 and $12, respectively. Rent expense has been included in general and administrative expense in the accompanying consolidated statements of operations. Future minimum lease payments due over the remaining term of the lease are $246.
b). Common Shares—As of December 31, 2009, IFMI and its affiliate entities owned 510,434 of our common shares. During the period ended March 31, 2010, IFMI sold 510,434 of our common shares and did not own any of our common shares as of March 31, 2011.
c). Kleros Preferred Funding VIII, Ltd.—Kleros Preferred Funding VIII, Ltd., or Kleros VIII, is a securitization managed by IFMI. In June 2007, we purchased approximately $26,400 in par amount of bonds rated A through BBB issued by Kleros VIII, for a purchase price of approximately $23,997. As of March 31, 2011, the bonds have a current fair value of $0 and have been placed on non-accrual status.
Brandywine Construction & Management, Inc., or Brandywine, is an affiliate of Edward E. Cohen, the spouse of Mrs. Cohen and father of Mr. Cohen. Brandywine provided real estate management services to two properties underlying our investments in real estate through February 2011. For transactions subsequent to March 22, 2011, the date we filed our proxy statement for our 2011 annual meeting of shareholders with the SEC, due to our remaining relationships with Brandywine and our analysis of applicable SEC and accounting rules, we do not expect to treat Brandywine as a related party. During the three-month periods ended March 31, 2011 and 2010, Brandywine earned management fees of $15 and $26, respectively. We believe that the management fees charged by Brandywine are comparable to those that could be obtained from unaffiliated third parties.
NOTE 13: ASSETS HELD FOR SALE AND DISCONTINUED OPERATIONS
As of March 31, 2011 and December 31, 2010, we had one property designated as held for sale. The following table summarizes the consolidated balance sheet of the real estate properties classified as assets held for sale:
| As of March 31, 2011 |
As of December 31, 2010 |
|||||||
| Assets: |
||||||||
| Investments in real estate |
$ | 48,859 | $ | 48,859 | ||||
| Cash and cash equivalents |
393 | 386 | ||||||
| Other assets |
2,695 | 2,668 | ||||||
| Deferred financing costs, net |
— | — | ||||||
| Total assets held for sale |
$ | 51,947 | $ | 51,913 | ||||
| Liabilities: |
||||||||
| Other indebtedness |
$ | — | $ | — | ||||
| Accrued interest payable |
— | — | ||||||
| Accounts payable and accrued expenses |
1,203 | 1,039 | ||||||
| Other liabilities |
381 | 699 | ||||||
| Total liabilities related to assets held for sale (a) |
$ | 1,584 | $ | 1,738 | ||||
| (a) | Liabilities related to assets held for sale excludes $43,086 and $42,958 of first mortgages held by RAIT II as of March 31, 2011 and December 31, 2010 that are eliminated in our consolidated balance sheet. |
For the three-month period ended March 31, 2011, income (loss) from discontinued operations relates to one real estate property designated as held for sale. For the three-month period ended March 31, 2010, income (loss) from discontinued operations relates to one real estate property designated as held for sale and three real estate properties that we have sold or deconsolidated since January 1, 2010. The following table summarizes revenue and expense information for real estate properties classified as discontinued operations:
| For the Three-Month Periods Ended March 31 |
||||||||
| 2011 | 2010 | |||||||
| Revenue: |
||||||||
| Rental income |
$ | 1,777 | $ | 2,530 | ||||
| Expenses: |
||||||||
| Real estate operating expenses |
985 | 1,706 | ||||||
| General and administrative expense |
1 | — | ||||||
22
Table of Contents
RAIT Financial Trust
Notes to Consolidated Financial Statements
As of March 31, 2011
(Unaudited and dollars in thousands, except share and per share amounts)
| For the Three-Month Periods Ended March 31 |
||||||||
| 2011 | 2010 | |||||||
| Depreciation expense |
— | 620 | ||||||
| Total expenses |
986 | 2,326 | ||||||
| Income (loss) before interest and other income |
791 | 204 | ||||||
| Interest and other income |
— | — | ||||||
| Income (loss) from discontinued operations |
791 | 204 | ||||||
| Gain (loss) on sale of assets |
— | 266 | ||||||
| Total income (loss) from discontinued operations |
$ | 791 | $ | 470 | ||||
Discontinued operations have not been segregated in the consolidated statements of cash flows. Therefore, amounts for certain captions will not agree with respective data in the consolidated statements of operations.
NOTE 14: COMMITMENTS AND CONTINGENCIES
Riverside National Bank of Florida Litigation
On August 6, 2009, Riverside National Bank of Florida commenced a lawsuit which named as defendants the three major credit rating agencies, various CDO sellers and collateral managers, including our subsidiary, Taberna Capital Management, LLC. The suit was filed in the Supreme Court of the State of New York, Kings County, and subsequently discontinued without prejudice and refiled in New York County on November 13, 2009. On April 16, 2010, the Office of the Comptroller of the Currency closed Riverside and named the Federal Deposit Insurance Corporation as receiver and thus as successor-in-interest to Riverside as plaintiff in the action, and the defendants subsequently removed the case to the United States District Court for the Southern District of New York. On April 22, 2011, following a series of stays requested by the FDIC, the FDIC voluntarily dismissed the action without prejudice. The claims asserted in this action were described in RAIT’s annual report on Form 10-K for the year ended December 31, 2010. RAIT believes that the FDIC plans to file a new lawsuit pursuing the same or substantially similar claims against an expanded list of defendants. If the FDIC files such a lawsuit, an adverse resolution of the litigation could have a material adverse effect on our financial condition and results of operations.
Routine Litigation
We are involved from time to time in litigation on various matters, including disputes with tenants of owned properties, disputes arising out of agreements to purchase or sell properties and disputes arising out of our loan portfolio. Given the nature of our business activities, these lawsuits are considered routine to the conduct of our business. The result of any particular lawsuit cannot be predicted, because of the very nature of litigation, the litigation process and its adversarial nature, and the jury system. We do not expect that the liabilities, if any, that may ultimately result from such routine legal actions will have a material adverse effect on our consolidated financial position, results of operations or cash flows.
NOTE 15: ACQUISITIONS
On January 20, 2011, we acquired a development stage, non-traded public REIT and subsequently changed its name to Independence Realty Trust, Inc., or Independence. We paid approximately $2.5 million for Independence and certain of its affiliated entities including the entity that serves as Independence’s external advisor and its dealer manager.
We are the external manager of Independence and expect Independence to raise capital for investing in multi-family commercial real estate assets through a public offering of its common stock. On April 8, 2011, Independence filed a registration statement for a public offering of its common stock with the SEC which has not yet become effective. We are the sponsor of Independence’s offering and we incurred expenses on Independence’s behalf in connection with this offering. Our ability to be reimbursed for these expenses will depend on the terms and success of the offering. This disclosure is neither an offer nor a solicitation to purchase securities issued by Independence.
23
Table of Contents
REPORT OF INDEPENDENT REGISTERED PUBLIC ACCOUNTING FIRM
Board of Trustees and Shareholders of RAIT Financial Trust
We have reviewed the accompanying consolidated balance sheet of RAIT Financial Trust and subsidiaries as of March 31, 2011 and the related consolidated statements of operations, other comprehensive income (loss) and cash flows for the three-month periods ended March 31, 2011 and 2010. These interim financial statements are the responsibility of the Company’s management.
We conducted our review in accordance with the standards of the Public Company Accounting Oversight Board (United States). A review of interim financial information consists principally of applying analytical procedures and making inquiries of persons responsible for financial and accounting matters. It is substantially less in scope than an audit conducted in accordance with the standards of the Public Company Accounting Oversight Board (United States), the objective of which is the expression of an opinion regarding the financial statements taken as a whole. Accordingly, we do not express such an opinion.
Based on our review, we are not aware of any material modifications that should be made to the accompanying financial statements for them to be in conformity with accounting principles generally accepted in the United States of America.
The Company adopted the new accounting standards classified under FASB ASC Topic 810, “Consolidation” for variable interest entities on January 1, 2010.
We have previously audited, in accordance with the standards of the Public Company Accounting Oversight Board (United States), the consolidated balance sheet as of December 31, 2010, and the related consolidated statements of operations, other comprehensive income (loss), shareholders’ equity and cash flows for the year then ended (not presented herein), and in our report dated February 25, 2011, we expressed an unqualified opinion on those consolidated financial statements.
| /s/ Grant Thornton LLP |
| Philadelphia, Pennsylvania May 5, 2011 |
24
Table of Contents
| Item 2. | Management’s Discussion and Analysis of Financial Condition and Results of Operations |
Forward-Looking Statements
In addition to historical information, this discussion and analysis contains forward-looking statements. These statements can be identified by the use of forward-looking terminology including “may,” “believe,” “will,” “expect,” “anticipate,” “estimate,” “continue” or similar words. These forward-looking statements are subject to risks and uncertainties, as more particularly set forth in our filings with the Securities and Exchange Commission, including those described in the “Forward Looking Statements” and “Risk Factors” sections of our Annual Report on Form 10-K for the year ended December 31, 2010, that could cause actual results to differ materially from those projected in the forward-looking statements. Readers are cautioned not to place undue reliance on these forward-looking statements, which reflect management’s analysis only as of the date hereof. We undertake no obligation to publicly revise or update these forward-looking statements to reflect events or circumstances that arise after the date of this report, except as may be required by applicable law.
Overview
We are a vertically integrated commercial real estate company capable of originating, investing in, managing, servicing, trading and advising on commercial real estate-related assets. We continue to progress in adapting RAIT to the current market environment. We are positioning RAIT for future growth in the area of its historical core competency, commercial real estate lending, while diversifying the revenue generated from our commercial real estate loans and properties and reducing or removing other non-core assets and activities.
In order to take advantage of market opportunities in the future, and to maximize shareholder value over time, we will continue to focus on:
| • | expanding RAIT’s commercial real estate revenue by investing in commercial real estate-related assets, managing and servicing investments for our own account or for others, providing property management services and providing our broker-dealer activities, including fixed-income trading and real estate advisory services; |
| • | creating value through investing in our commercial real estate properties and implementing cost savings programs to help maximize property value over time; |
| • | reducing our leverage while developing new financing sources; |
| • | managing our investment portfolios to reposition non-performing assets, increase our cash flows and ultimately recover the value of our assets over time; and |
| • | managing the size and cost structure of our business to match our operating environment. |
We generated net income allocable to common shares of $5.8 million, or $0.05 per common share-diluted, during the three-months ended March 31, 2011. The primary items affecting our performance were the following:
| • | Change in fair value of financial instruments. For the three months ended March 31, 2011, the net change in fair value of financial instruments increased net income by $5.6 million. Generally, the change in fair value of our financial assets, which are recorded at fair value under FASB ASC Topic 825, “Financial Instruments”, was the primary driver of this improvement with several of our assets improving. |
| • | Gains (losses) on debt extinguishments. During the three-months ended March 31, 2011, we repurchased $88.0 million of our 6.875% convertible senior notes for total cash consideration of $86.3 million. These transactions generated a loss on debt extinguishment of $0.5 million. See “Liquidity and Capital Resources-Capitalization” below for more information regarding these transactions. |
| • | Provision for losses. The provision for losses recorded during the three-months ended March 31, 2011, was $2.0 million. While we recorded additional provision for losses during the three-months ended March 31, 2011, we saw improvement in the performance of our portfolio of commercial real estate loans from prior quarters. |
We expect to continue to focus our efforts on enhancing our commercial real estate loan portfolio and our investments in real estate, which are our primary investment portfolios. Although economic conditions are improving, some of our borrowers within our commercial real estate loan portfolio are under financial stress. Where it is likely to enhance our ultimate returns, we will consider restructuring loans or foreclosing on the underlying property. During the three-months ended March 31, 2011, we converted one loan, comprised of a single property, into direct ownership. We expect to engage in ongoing workout activity with respect to our commercial real estate loans that may result in the conversion of the property into owned real estate. We may take a non-cash charge to earnings at the time of any loan conversion to the extent the amount of our loan, reduced by any allowance for losses and certain other expenses, exceeds the fair value of the property at the time of the conversion.
25
Table of Contents
Key Statistics
Set forth below are key statistics relating to our business through March 31, 2011 (dollars in thousands, except per share data):
| As of or For the Three-Month Periods Ended | ||||||||||||||||||||
| March 31, 2011 |
December 31, 2010 |
September 30, 2010 |
June 30, 2010 |
March 31, 2010 |
||||||||||||||||
| Financial Statistics: |
||||||||||||||||||||
| Recourse debt maturing within 1-year |
$ | 20,040 | $ | 41,489 | $ | 7,919 | $ | 9,919 | $ | 10,905 | ||||||||||
| Assets under management (a) |
$ | 3,822,534 | $ | 3,837,526 | $ | 3,901,342 | $ | 4,014,556 | $ | 9,911,824 | ||||||||||
| Debt to equity |
2.1x | 2.3x | 2.6x | 2.7x | 2.8x | |||||||||||||||
| Total revenue |
$ | 58,279 | $ | 59,057 | $ | 58,899 | $ | 60,370 | $ | 66,244 | ||||||||||
| Earnings per share, diluted |
$ | 0.05 | $ | 0.29 | $ | 0.16 | $ | 0.27 | $ | 0.41 | ||||||||||
| Commercial Real Estate (“CRE”) Loan Portfolio (b): |
||||||||||||||||||||
| Reported CRE Loans—unpaid principal |
$ | 1,149,169 | $ | 1,173,141 | $ | 1,216,875 | $ | 1,288,466 | $ | 1,305,816 | ||||||||||
| Non-accrual loans—unpaid principal |
$ | 121,054 | $ | 122,306 | $ | 143,212 | $ | 131,377 | $ | 132,978 | ||||||||||
| Non-accrual loans as a % of reported loans |
10.5 | % | 10.4 | % | 11.8 | % | 10.2 | % | 10.2 | % | ||||||||||
| Reserve for losses |
$ | 58,809 | $ | 61,731 | $ | 73,029 | $ | 70,699 | $ | 68,850 | ||||||||||
| Reserves as a % of non-accrual loans |
48.6 | % | 50.5 | % | 51.0 | % | 53.8 | % | 51.8 | % | ||||||||||
| Provision for losses |
$ | 1,950 | $ | 2,500 | $ | 10,813 | $ | 7,644 | $ | 17,350 | ||||||||||
| CRE Property Portfolio: |
||||||||||||||||||||
| Reported investments in real estate |
$ | 867,726 | $ | 841,488 | $ | 823,881 | $ | 803,548 | $ | 795,952 | ||||||||||
| Number of properties owned |
48 | 47 | 47 | 47 | 46 | |||||||||||||||
| Multifamily units owned |
8,311 | 8,311 | 8,231 | 7,893 | 7,893 | |||||||||||||||
| Office square feet owned |
1,786,908 | 1,632,978 | 1,634,997 | 1,732,626 | 1,550,401 | |||||||||||||||
| Retail square feet owned |
1,116,063 | 1,116,112 | 1,069,588 | 1,069,588 | 1,069,652 | |||||||||||||||
| Average physical occupancy data: |
||||||||||||||||||||
| Multifamily properties |
88.0 | % | 85.5 | % | 84.6 | % | 83.5 | % | 78.0 | % | ||||||||||
| Office properties |
70.7 | % | 67.8 | % | 52.5 | % | 55.5 | % | 54.2 | % | ||||||||||
| Retail properties |
56.3 | % | 58.8 | % | 57.7 | % | 58.7 | % | 60.1 | % | ||||||||||
| Total |
82.4 | % | 79.2 | % | 74.8 | % | 74.4 | % | 70.8 | % | ||||||||||
| (a) | On April 22, 2010 as a result of the sale of our collateral management rights and responsibilities relating to eight unconsolidated Taberna securitizations with $5.9 billion of assets to an affiliate of Fortress Investment Group, LLC, RAIT’s assets under management were reduced to $4.1 billion. |
| (b) | CRE Loan Portfolio includes commercial mortgages, mezzanine loans, and preferred equity interests only and does not include other loans. See Note 3-“Investments in Loans” in the Notes to Consolidated Financial Statements for information relating to all loans held by RAIT. |
Investors should read Management’s Discussion and Analysis of Financial Condition and Results of Operations in our Annual Report on Form 10-K for the fiscal year ended December 31, 2010, or the Annual Report, for a detailed discussion of the following items:
| • | Credit, capital markets and liquidity risk. |
| • | Interest rate environment. |
| • | Prepayment rates. |
| • | Commercial real estate lack of liquidity and reduced performance. |
26
Table of Contents
Our Investment Portfolio
Our consolidated investment portfolio is currently comprised of the following asset classes:
Commercial mortgages, mezzanine loans, other loans and preferred equity interests. We own and originate senior long-term mortgage loans, short-term bridge loans, subordinated, or “mezzanine,” financing and preferred equity interests. These assets are in most cases “non-recourse” or limited recourse loans secured by commercial real estate assets or real estate entities. This means that we look primarily to the assets securing the payment of the loan, subject to certain standard exceptions. We may from time to time acquire existing commercial real estate loans from third parties who have originated such loans, including banks, other institutional lenders or third-party investors. Where possible, we seek to maintain direct lending relationships with borrowers, as opposed to investing in loans controlled by third party lenders.
The tables below describe certain characteristics of our commercial mortgages, mezzanine loans, other loans and preferred equity interests as of March 31, 2011 (dollars in thousands):
| Book Value | Weighted- Average Coupon |
Range of Maturities | Number of Loans |
|||||||||||||
| Commercial Real Estate (CRE) Loans |
||||||||||||||||
| Commercial mortgages |
$ | 688,527 | 6.7 | % | May 2011 to Dec. 2020 | 42 | ||||||||||
| Mezzanine loans |
352,809 | 9.2 | % | May 2011 to Nov. 2038 | 103 | |||||||||||
| Preferred equity interests |
89,616 | 10.1 | % | Nov. 2011 to Aug. 2025 | 23 | |||||||||||
| Total CRE Loans |
1,130,952 | 7.8 | % | 168 | ||||||||||||
| Other loans |
61,321 | 6.7 | % | May 2011 to Oct. 2016 | 5 | |||||||||||
| Total investments in loans |
$ | 1,192,273 | 7.7 | % | 173 | |||||||||||
We currently have limited capacity to originate new investments. However, we are focusing on this asset class as economic conditions improve and our lending capacity increases.
The charts below describe the property types and the geographic breakdown of our commercial mortgages, mezzanine loans, other loans, and preferred equity interests as of March 31, 2011:
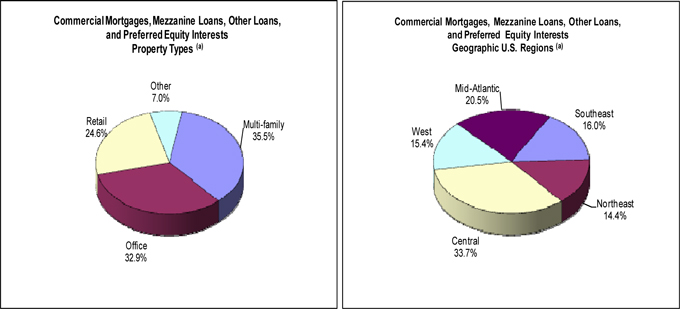
| (a) | Based on book value. |
Investments in real estate. We generate a return on our real estate investments through rental income and other sources of income from the operations of our real estate investments. By owning real estate, we also participate in any increase in the value of the real estate in addition to current income. We finance our real estate holdings through a combination of secured mortgage financing provided by financial institutions and existing financing provided by our two CRE loan securitizations. During the three-month period ended March 31, 2011, we acquired $20.3 million of real estate investments upon conversion of $22.1 million of commercial real estate loans, typically retaining the existing financing provided by our two CRE loan securitizations.
27
Table of Contents
The table below describes certain characteristics of our investments in real estate as of March 31, 2011 (dollars in thousands, except average effective rent):
| Investments in Real Estate (a) |
Average Physical Occupancy |
Units/ Square Feet/ Acres |
Number of Properties |
Average Effective Rent (b) |
||||||||||||||||
| Multi-family real estate properties (a) (c) |
$ | 570,849 | 88.0 | % | 8,311 | 33 | $ | 673 | ||||||||||||
| Office real estate properties (d) |
226,800 | 70.7 | % | 1,786,908 | 10 | 17.88 | ||||||||||||||
| Retail real estate properties (d) |
47,869 | 56.3 | % | 1,116,063 | 2 | 9.71 | ||||||||||||||
| Parcels of land |
22,208 | — | 7.3 | 3 | — | |||||||||||||||
| Total |
$ | 867,726 | 82.4 | % | 48 | |||||||||||||||
| (a) | Investments in real estate include $48.9 million of assets held for sale as of March 31, 2011. |
| (b) | Based on operating performance for the three-month period ended March 31, 2011. |
| (c) | Average effective rent is rent per unit per month. |
| (d) | Average effective rent is rent per square foot per year. |
We expect this asset category to increase in size as we may find it desirable to protect or enhance our risk-adjusted returns by taking control of properties underlying our commercial real estate loans when restructuring or otherwise exercising our remedies regarding underperforming loans.
The charts below describe the property types and the geographic breakdown of our investments in real estate as of March 31, 2011:
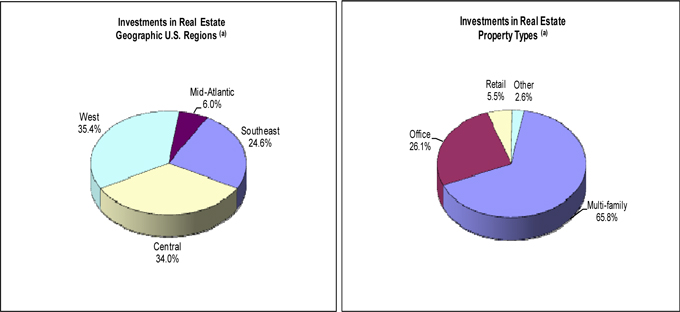
| (a) | Based on book value. |
Investment in debt securities—TruPS and Subordinated Debentures. Historically, we provided REITs and real estate operating companies the ability to raise subordinated debt capital through TruPS and subordinated debentures. TruPS are long-term instruments, with maturities ranging from 5 to 30 years, which are priced based on short-term variable rates, such as the three-month London Inter-Bank Offered Rate, or LIBOR. TruPS are unsecured and generally contain minimal financial and operating covenants. We financed most of our debt securities portfolio in a series of non-recourse securitizations which provided long-dated, interest-only, match funded financing to the TruPS and subordinated debenture investments. As of March 31, 2011, we retained a controlling interest in two such securitizations—Taberna VIII and Taberna IX, which are consolidated entities. All of the collateral assets for the debt securities and the related non-recourse securitization financing obligations are presented at fair value in our consolidated financial statements. During 2011, due to the non-recourse nature of these entities and the recent credit performance of the underlying collateral, we received only our senior collateral management fees from these two securitizations.
28
Table of Contents
The table below describes our investment in TruPS and subordinated debentures as included in our consolidated financial statements as of March 31, 2011 (dollars in thousands):
| Issuer Statistics | ||||||||||||||||
| Industry Sector |
Estimated Fair Value |
Weighted- Average Coupon |
Weighted Average Ratio of Debt to Total Capitalization |
Weighted Average Interest Coverage Ratio |
||||||||||||
| Commercial Mortgage |
$ | 102,911 | 2.7 | % | 65.4 | % | 2.4x | |||||||||
| Office |
137,736 | 7.8 | % | 59.4 | % | 2.2x | ||||||||||
| Residential Mortgage |
44,699 | 2.6 | % | 78.6 | % | 2.4x | ||||||||||
| Specialty Finance |
79,474 | 5.0 | % | 86.0 | % | 1.7x | ||||||||||
| Homebuilders |
63,073 | 7.8 | % | 62.9 | % | 1.0x | ||||||||||
| Retail |
72,135 | 4.0 | % | 84.9 | % | 1.3x | ||||||||||
| Hospitality |
22,694 | 6.3 | % | 80.3 | % | 2.8x | ||||||||||
| Storage |
23,359 | 8.0 | % | 60.6 | % | 2.5x | ||||||||||
| Total |
$ | 546,081 | 5.2 | % | 70.7 | % | 2.0x | |||||||||
The chart below describes the equity capitalization of our investment in TruPS and subordinated debentures as included in our consolidated financial statements as of March 31, 2011:
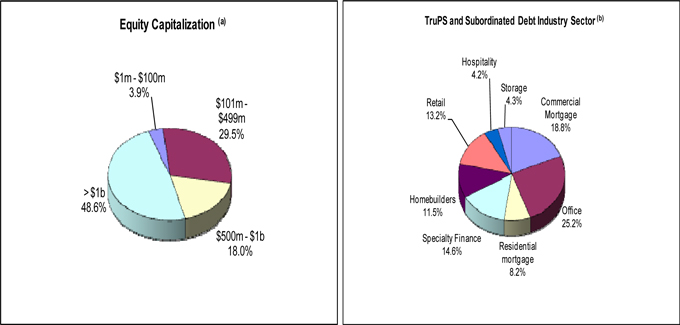
| (a) | Based on the most recent information available to management as provided by our TruPS issuers or through public filings. |
| (b) | Based on estimated fair value. |
Investment in debt securities—Other Real Estate Related Debt Securities. We have invested, and expect to continue to invest, in CMBS, unsecured REIT notes and other real estate-related debt securities.
Unsecured REIT notes are publicly traded debentures issued by large public reporting REITs and other real estate companies. These debentures generally pay interest semi-annually. These companies are generally rated investment grade by one or more nationally recognized rating agencies.
CMBS generally are multi-class debt or pass-through certificates secured or backed by single loans or pools of mortgage loans on commercial real estate properties. Our CMBS investments may include loans and securities that are rated investment grade by one or more nationally-recognized rating agencies, as well as both unrated and non-investment grade loans and securities.
29
Table of Contents
The table and the chart below describe certain characteristics of our real estate-related debt securities as of March 31, 2011 (dollars in thousands):
| Investment Description |
Estimated Fair Value |
Weighted- Average Coupon |
Weighted- Average Years to Maturity |
Book Value | ||||||||||||
| Unsecured REIT note receivables |
$ | 64,455 | 6.6 | % | 6.7 | $ | 61,000 | |||||||||
| CMBS receivables |
82,161 | 5.7 | % | 33.0 | 153,868 | |||||||||||
| Other securities |
26,240 | 2.9 | % | 30.7 | 97,692 | |||||||||||
| Total |
$ | 172,856 | 4.9 | % | 27.3 | $ | 312,560 | |||||||||
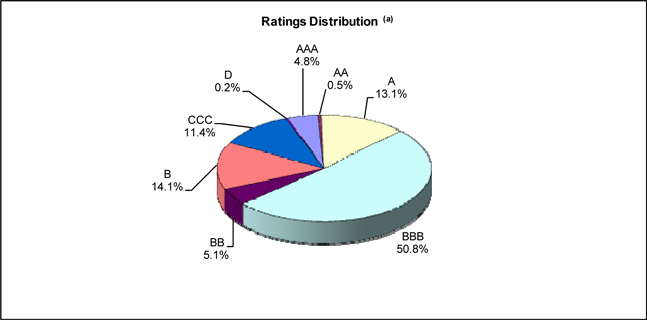
| (a) | S&P Ratings as of March 31, 2011. |
Independence Realty Trust, Inc.
On January 20, 2011, we acquired a development stage, non-traded public REIT and subsequently changed its name to Independence Realty Trust, Inc., or Independence. We paid approximately $2.5 million for Independence and certain of its affiliated entities including the entity that serves as Independence’s external advisor and its dealer manager.
We are the external manager of Independence and expect Independence to raise capital for investing in multi-family commercial real estate assets through a public offering of its common stock. On April 8, 2011, Independence filed a registration statement for a public offering of its common stock with the SEC which has not yet become effective. We are the sponsor of Independence’s offering and we incurred expenses on Independence’s behalf in connection with this offering. Our ability to be reimbursed for these expenses will depend on the terms and success of the offering. This disclosure is neither an offer nor a solicitation to purchase securities issued by Independence.
Securitization Summary
Overview. We have used securitizations, mainly through CDOs, to match fund the interest rates and maturities of our assets with the interest rates and maturities of the related financing. This strategy has helped us reduce interest rate and funding risks on our portfolios for the long-term. To finance our investments in the foreseeable future, management will seek to structure match funded financing through reinvesting asset repayments in our existing securitizations, loan participations, bank lines of credit, joint-venture opportunities and other methods that preserve our capital while making investments that generate an attractive return.
CDO Performance. Our CDOs contain interest coverage and overcollateralization triggers, or OC Triggers, that must be met in order for us to receive our subordinated management fees and our lower-rated debt or residual equity returns. If the interest coverage or OC Triggers are not met, in a given period, then the cash flows are redirected from lower rated tranches and used to repay the principal amounts to the senior tranches of CDO notes payable. These conditions and the re-direction of cash flow continue until the
30
Table of Contents
triggers are met by curing the underlying payment defaults, paying down the CDO notes payable or other actions permitted under the relevant CDO indenture.
As of the most recent payment information, the Taberna I, Taberna VIII and Taberna IX CDO securitizations that we manage were not passing all of their required interest coverage or OC Triggers and we received only senior asset management fees. While events of default do not currently exist in the CDO securitizations that we manage, we are unable to predict with certainty which CDOs, in the future, will experience events of default or which, if any, remedies the appropriate note holders may seek to exercise in the future. All applicable interest coverage and OC Triggers continue to be met for our two commercial real estate CDOs, RAIT I and RAIT II, and we continue to receive all of our management fees, interest and residual returns from these CDOs.
A summary of the CDO investments in our consolidated securitizations as of the most recent payment information is as follows (dollars in millions):
| • | RAIT I—RAIT I has $1.0 billion of total collateral, of which $67.7 million is defaulted. The current overcollateralization (O/C) test is passing at 123.7% with an O/C trigger of 116.2%. We currently own $242.0 million of the securities issued by this CDO. We are currently receiving all distributions required by the terms of our retained interests in this securitization and are receiving all of our collateral management fees. |
| • | RAIT II—RAIT II has $820.0 million of total collateral, of which $29.3 million is defaulted. The current O/C test is passing at 115.1% with an O/C trigger of 111.7%. We currently own $229.7 million of the securities issued by this CDO. We are currently receiving all distributions required by the terms of our retained interests in this securitization and are receiving all of our collateral management fees. |
| • | Taberna VIII—Taberna VIII has $628.1 million of total collateral, of which $74.5 million is defaulted. The current O/C test is failing at 88.0% with an O/C trigger of 103.5%. We currently own $133.0 million of the securities issued by this CDO. We do not expect to receive any distributions from this securitization other than our senior management fees for the foreseeable future. |
| • | Taberna IX—Taberna IX has $659.0 million of total collateral, of which $173.9 million is defaulted. The current O/C test is failing at 76.4% with an O/C trigger of 105.4%. We currently own $186.5 million of the securities issued by this CDO. We do not expect to receive any distributions from this securitization other than our senior management fees for the foreseeable future. |
Generally, our investments in the subordinated notes and equity securities in our consolidated CDOs are subordinate in right of payment and in liquidation to the senior notes issued by the CDOs. We may also own common shares, or the non-economic residual interest, in certain of the entities above.
Non-GAAP Financial Measures
Funds from Operations and Adjusted Funds from Operations
We believe that funds from operations, or FFO, and adjusted funds from operations, or AFFO, each of which are non-GAAP measures, are additional appropriate measures of the operating performance of a REIT and us in particular. We compute FFO in accordance with the standards established by the National Association of Real Estate Investment Trusts, or NAREIT, as net income or loss allocated to common shares (computed in accordance with GAAP), excluding real estate-related depreciation and amortization expense, gains or losses on sales of real estate and the cumulative effect of changes in accounting principles.
AFFO is a computation made by analysts and investors to measure a real estate company’s cash flow generated by operations. We calculate AFFO by adding to or subtracting from FFO: change in fair value of financial instruments; gains or losses on debt extinguishment; capital expenditures, net of any direct financing associated with those capital expenditures; straight-line rental effects; amortization of various deferred items and intangible assets; and share-based compensation.
Our calculation of AFFO differs from the methodology used for calculating AFFO by certain other REITs and, accordingly, our AFFO may not be comparable to AFFO reported by other REITs. Our management utilizes FFO and AFFO as measures of our operating performance, and believes they are also useful to investors, because they facilitate an understanding of our operating performance after adjustment for certain non-cash items, such as real estate depreciation, share-based compensation and various other items required by GAAP that may not necessarily be indicative of current operating performance and that may not accurately compare our operating performance between periods. Furthermore, although FFO, AFFO and other supplemental performance measures are defined in various ways throughout the REIT industry, we also believe that FFO and AFFO may provide us and our investors with an additional useful measure to compare our financial performance to certain other REITs.
Neither FFO nor AFFO is equivalent to net income or cash generated from operating activities determined in accordance with U.S. GAAP. Furthermore, FFO and AFFO do not represent amounts available for management’s discretionary use because of needed capital replacement or expansion, debt service obligations or other commitments or uncertainties. Neither FFO nor AFFO should be
31
Table of Contents
considered as an alternative to net income as an indicator of our operating performance or as an alternative to cash flow from operating activities as a measure of our liquidity.
Set forth below is a reconciliation of FFO and AFFO to net income (loss) allocable to common shares for the three-month periods ended March 31, 2011 and 2010 (in thousands, except share information):
| For the Three-Month Periods Ended March 31 |
||||||||
| 2011 | 2010 | |||||||
| Funds From Operations: |
||||||||
| Net income (loss) allocable to common shares |
$ | 5,767 | $ | 31,282 | ||||
| Adjustments: |
||||||||
| Real estate depreciation and amortization |
6,570 | 6,003 | ||||||
| Gains on the sale of real estate |
— | (266 | ) | |||||
| Funds From Operations |
$ | 12,337 | $ | 37,019 | ||||
| Weighted-average shares—diluted |
110,904,359 | 75,512,999 | ||||||
| Adjusted Funds From Operations: |
||||||||
| Funds From Operations |
$ | 12,337 | $ | 37,019 | ||||
| Adjustments: |
||||||||
| Change in fair value of financial instruments |
(5,611 | ) | (16,437 | ) | ||||
| (Gains) losses on debt extinguishment |
537 | (19,810 | ) | |||||
| Capital expenditures, net of direct financing |
(362 | ) | (158 | ) | ||||
| Straight-line rental adjustments |
(919 | ) | (26 | ) | ||||
| Amortization of deferred items and intangible assets |
673 | (1 | ) | |||||
| Share-based compensation |
259 | 1,671 | ||||||
| Adjusted Funds From Operations |
$ | 6,914 | $ | 2,258 | ||||
| Weighted-average shares—diluted |
110,904,359 | 75,512,999 | ||||||
Assets Under Management
Assets under management, or AUM, represent the total assets that we own or are managing for third parties. While not all AUM generates fee income, it is an important operating measure to gauge our asset growth, volume of originations, size and scale of our operations and our performance. AUM includes our total investment portfolio and assets associated with unconsolidated CDOs for which we derive asset management fees.
The table below summarizes our AUM as of March 31, 2011 and December 31, 2010 (dollars in thousands):
| AUM at March 31, 2011 |
AUM at December 31, 2010 |
|||||||
| Commercial real estate portfolio (1) |
$ | 1,986,418 | $ | 1,976,815 | ||||
| U.S. TruPS portfolio (2) |
1,836,116 | 1,860,711 | ||||||
| Total (3) |
$ | 3,822,534 | $ | 3,837,526 | ||||
| (1) | As of March 31, 2011 and December 31, 2010, our commercial real estate portfolio was comprised of $1.1 billion of assets collateralizing RAIT I and RAIT II, $867.7 million and $841.5 million, respectively, of investments in real estate and $28.5 million and $30.4 million, respectively, of commercial mortgages, mezzanine loans and preferred equity interests that were not securitized. |
| (2) | Our U.S. TruPS portfolio is comprised of assets collateralizing Taberna I, Taberna VIII, and Taberna IX, and includes TruPS and subordinated debentures, unsecured REIT note receivables, CMBS receivables, other securities, commercial mortgages and mezzanine loans. |
32
Table of Contents
Results of Operations
Three-Month Period Ended March 31, 2011 Compared to the Three-Month Period Ended March 31, 2010
Revenue
Interest income. Interest income decreased $7.7 million, or 18.8%, to $33.6 million for the three-month period ended March 31, 2011 from $41.3 million for the three-month period ended March 31, 2010. The decrease is primarily attributable to a $213.3 million decline in the unpaid principal balance of our investments in loans due to principal repayments, loan payoffs, and $110.2 million of commercial real estate loans transitioned to owned real estate. In addition, interest income declined due to sales and principal repayments of $40.4 million par amount on our investments in securities from March 31, 2010.
Rental income. Rental income increased $5.2 million to $21.3 million for the three-month period ended March 31, 2011 from $16.1 million for the three-month period ended March 31, 2010. Of this increase, $3.0 million of rental income was generated from six new properties, with direct real estate investments of $102.7 million, acquired or consolidated since March 31, 2010, $0.7 million of the increase is attributable to seven properties acquired or consolidated during the three months ended March 31, 2010 which were present for a full quarter of operations in 2011 and the remaining $1.5 million increase resulted from improved occupancy and rental rates at our owned properties acquired prior to January 1, 2010.
Fee and other income. Fee and other income decreased $5.4 million, or 61.2%, to $3.4 million for the three-month period ended March 31, 2011 from $8.8 million for the three-month period ended March 31, 2010. This decrease was primarily attributable to the reduction of collateral management fee income and restructuring fee income ($2.3 million and $2.5 million, respectively) that resulted from the sale or delegation of our collateral management rights and responsibilities on eight Taberna securitizations during April 2010 and a decline in restructuring activities associated with securities held by these securitizations.
Expenses
Interest expense. Interest expense decreased $2.1 million, or 8.3%, to $23.4 million for the three-month period ended March 31, 2011 from $25.5 million for the three-month period ended March 31, 2010. The decrease is primarily attributable to repurchases of $136.3 million of our 6.875% convertible senior notes since March 31, 2010, net of additional interest cost of $0.5 million associated with a $22.0 million senior secured note issued March 25, 2010.
Real estate operating expense. Real estate operating expense increased $2.1 million to $12.6 million for the three-month period ended March 31, 2011 from $10.5 million for the three-month period ended March 31, 2010. This increase was attributable to $1.7 million from six new properties, with direct real estate investments of $102.7 million, acquired or consolidated since March 31, 2010 and $0.4 million from seven properties acquired or consolidated during the three months ended March 31, 2010 which were present for a full quarter of operations in 2011.
Compensation expense. Compensation expense decreased $1.6 million, or 18.7%, to $6.5 million for the three-month period ended March 31, 2011 from $8.1 million for the three-month period ended March 31, 2010. This decrease was primarily due to a reduction in stock based compensation expense of $1.4 million for the three months ended March 31, 2011 as compared to the three months ended March 31, 2010. The decrease was the result of certain stock based awards granted to employees in January 2010 that vested immediately. Similar awards were not made in 2011.
General and administrative expense. General and administrative expense increased $0.1 million, or 1.6%, to $5.0 million for the three-month period ended March 31, 2011 from $4.9 million for the three-month period ended March 31, 2010. The increase is primarily attributable to $0.3 million of acquisition expenses related to our purchase of Independence Realty Trust, Inc., a development stage, non-traded public REIT in January 2011, $0.1 million of bank service and brokerage fees related to our broker-dealer RAIT Securities, LLC, and $0.1 million of rent. These expenses were partially offset by a $0.4 million decrease in professional service fees incurred for consulting, legal and audit services.
Provision for losses. The provision for losses relates to our investments in our commercial mortgage loan portfolios. The provision for losses decreased by $15.4 million for the three-month period ended March 31, 2011 to $2.0 million as compared to $17.4 million for the three-month period ended March 31, 2010. The decrease is attributable to the improved performance of our commercial real estate loan portfolio during 2011 as compared to 2010. At March 31, 2011 we had $121.1 million of commercial real estate loans on non-accrual, down from $133.0 million of commercial real estate non-accrual loans as of March 31, 2010. While we believe we have properly reserved for the probable losses in our portfolio, we continually monitor our portfolio for evidence of loss and accrue additional provisions for loan losses as circumstances or conditions change.
Depreciation and amortization expense. Depreciation expense increased $0.9 million to $7.1 million for the three-month period ended March 31, 2011 from $6.2 million for the three-month period ended March 31, 2010. This increase was primarily attributable to six new properties, with direct real estate investments of $102.7 million, acquired or consolidated since March 31, 2010. The increase
33
Table of Contents
is also driven by seven properties acquired or consolidated during the three months ended March 31, 2010 present for a full quarter during the three months ended March 31, 2011 and increased depreciation of capital expenditures associated with our other owned properties.
Interest and other income (expense)
Gains (Losses) on sale of assets. Gains on sale of assets were $1.4 million during the three-month period ended March 31, 2011. We recorded gains of $1.6 million as a result of the sale of certain bonds held in our consolidated Taberna securitizations, Taberna Preferred Funding VIII, Ltd. and Taberna Preferred Funding IX, Ltd. The gains were partially offset by $0.3 million of losses incurred from the disposition of two loans from our consolidated CRE securitizations.
Losses on extinguishment of debt. Losses on extinguishment of debt during the three-month period ended March 31, 2011 are attributable to the repurchase of $88.0 million in aggregate principal amount of our 6.875% convertible senior notes due April 2027. The notes were repurchased from the market for $86.3 million of cash. As a result of these repurchases, we recorded losses on extinguishment of debt of $0.5 million, including the write-off of associated deferred financing costs and debt discounts.
Change in fair value of financial instruments. The change in fair value of financial instruments pertains to the majority of our assets within our investments in securities and any related CDO notes payable and derivative instruments used to finance such assets. During the three-month periods ended March 31, 2011 and 2010, the fair value adjustments we recorded were as follows (dollars in thousands):
| Description |
For the Three-Month Period Ended March 31, 2011 |
For the Three-Month Period Ended March 31, 2010 |
||||||
| Change in fair value of trading securities and security-related receivables |
$ | 16,554 | $ | 47,745 | ||||
| Change in fair value of CDO notes payable, trust preferred obligations and other liabilities |
(7,031 | ) | (13,493 | ) | ||||
| Change in fair value of derivatives |
(3,912 | ) | (17,815 | ) | ||||
| Change in fair value of financial instruments |
$ | 5,611 | $ | 16,437 | ||||
Discontinued operations. Income from discontinued operations increased $0.3 million to $0.8 million for the three-month period ended March 31, 2011 compared to $0.5 million for the three-month period ended March 31, 2010. The increase is attributable to the timing of properties acquired, sold, or deconsolidated during the respective periods. Included in discontinued operations for the three months ended March 31, 2011 is $0.8 million net income from a property held for sale.
Liquidity and Capital Resources
Liquidity is a measure of our ability to meet potential cash requirements, including ongoing commitments to repay borrowings, fund and maintain investments, pay distributions and other general business needs. The disruption in the credit markets has reduced our liquidity and capital resources, limited our ability to originate new investments and has generally increased the cost of any new sources of capital over historical levels. Due to current market conditions, the cash flow to us from a number of the securitizations we sponsored has been reduced or eliminated. We are seeking to expand our use of secured lines of credit while developing other financing resources that will permit us to originate or acquire new investments to generate attractive returns while preserving our capital, such as loan participations and joint venture financing arrangements.
RAIT I and RAIT II, our consolidated securitizations collateralized by U.S. commercial real estate loans, continue to perform and make distributions on our retained interests and pay us management fees. In addition, the restricted cash in these securitizations from repayment of underlying loans and other sources can be used to make new investments held by those securitizations, including future funding commitments of existing investments. As we continue to recycle capital obtained from loan sales and loan repayments in these securitizations, we expect to reinvest the proceeds to fund commercial real estate loans. Distributions on our retained interests in RAIT I and RAIT II are our primary source of cash from our operations. We continue to explore strategies to generate liquidity from our investments in real estate and our investments in debt securities as we seek to focus on our commercial real estate lending platform.
We believe our available cash and restricted cash balances, other financing arrangements, and cash flows from operations will be sufficient to fund our liquidity requirements for the next 12 months. Should our liquidity needs exceed our available sources of liquidity, we believe that we could sell assets to raise additional cash. We may not be able to obtain additional financing when we desire to do so, or may not be able to obtain desired financing on terms and conditions acceptable to us. If we fail to obtain additional financing, our ability to maintain or grow our business will be constrained.
34
Table of Contents
Our primary cash requirements are as follows:
| • | to make investments and fund the associated costs; |
| • | to repay our indebtedness, including repurchasing or retiring our debt before it becomes due; |
| • | to pay our expenses, including compensation to our employees; |
| • | to pay U.S. federal, state, and local taxes of our TRSs; and |
| • | to distribute a minimum of 90% of our REIT taxable income and to make investments in a manner that enables us to maintain our qualification as a REIT. |
We intend to meet these liquidity requirements primarily through the following:
| • | the use of our cash and cash equivalent balances of $39.5 million as of March 31, 2011; |
| • | cash generated from operating activities, including net investment income from our investment portfolio, and fee income generated by our commercial real estate platform; |
| • | proceeds from the sales of assets; |
| • | proceeds from future borrowings; and |
| • | proceeds from future offerings of our common and preferred shares, including our COD sales agreement, SEDA and DRSPP Plan. |
Our two commercial real estate securitized financing arrangements, RAIT I and RAIT II, include a revolving credit option that allows us to repay the AAA rated debt tranches totaling $475.0 million as loan repayments occur, and then draw up to the available committed amounts through the fifth anniversary of each financing in November 2011 and June 2012, respectively. At March 31, 2011, these revolvers were fully utilized and had no additional capacity.
Our restricted cash balance was $179.3 million as of March 31, 2011. We have $57.5 million of restricted cash in RAIT I and RAIT II available to invest in qualifying commercial loans as of March 31, 2011, subject to $50.1 million of future funding commitments, leaving $7.4 million available to lend. This $57.5 million of restricted cash is not available to RAIT’s creditors or for other general trust purposes. As of March 31, 2011, $85.0 million of restricted cash was held by Taberna VIII and Taberna IX. This restricted cash reflects early prepayments of principal that cannot be used for any other general trust purposes.
We continue to focus on reducing our leverage and restructuring the terms of our debt. On March 21, 2011, we issued $115.0 million aggregate principal amount of 7.0% Convertible Senior Notes Due 2031, or the 7.0% convertible senior notes, in an underwritten public offering which included the full exercise of the overallotment option. During the three-month period ended March 31, 2011, we repurchased $88.0 million of our 6.875% convertible senior notes which give holders a put right in April 2012, leaving $55.6 million remaining outstanding, prepaid a $16.2 million secured credit facility that was maturing in October 2011 and refinanced a $12.5 million recourse first mortgage on an owned property with non-recourse financing. On April 26, 2011, we prepaid the remaining $15.7 million of our 10% senior secured convertible note. To accomplish these transactions described above, RAIT primarily used the proceeds of its issuance of 7.0% convertible senior notes.
Our 6.875% convertible senior notes are redeemable for cash, at the option of the holder, in April 2012. We expect to acquire, redeem, restructure, refinance or otherwise enter into transactions to satisfy our 6.875% convertible senior notes at or prior to the redemption date through transactions which may include any combination of payments of cash, issuances of our debt and/or equity securities, sales or exchanges of our assets or other methods. These transactions may have material effects on our liquidity and capital structure.
We are currently negotiating the terms of a joint venture with a potential co-investor that would originate conduit commercial real estate loans that would qualify for sale to CMBS securitizations sponsored by third parties. If the joint venture is established, it may be a source of additional liquidity for us. The joint venture may seek to increase its return through outside debt financing, including warehouse financing. We have already initiated efforts using our own resources to originate more of these loans.
Cash Flows
As of March 31, 2011 and 2010, we maintained cash and cash equivalents of approximately $39.5 million and $18.5 million, respectively. Our cash and cash equivalents were generated from the following activities (dollars in thousands):
| For the Three-Month Periods Ended March 31 |
||||||||
| 2011 | 2010 | |||||||
| Cash flow from operating activities |
$ | 464 | $ | 2,549 | ||||
| Cash flow from investing activities |
3,038 | 5,603 | ||||||
| Cash flow from financing activities |
8,731 | (14,646 | ) | |||||
| Net change in cash and cash equivalents |
12,233 | (6,494 | ) | |||||
| Cash and cash equivalents at beginning of period |
27,230 | 25,034 | ||||||
| Cash and cash equivalents at end of period |
$ | 39,463 | $ | 18,540 | ||||
Our principal source of cash flow historically has been our investing activities. The reduction in cash inflow from our investing activities primarily resulted from $11.3 million in principal repayments on loans during the three-month period ended March 31, 2011 as compared to $18.1 million during the three-month period ended March 31, 2010, a decrease in the proceeds received from the sales of other securities of $4.9 million for the three-month period ended March 31, 2011 as compared to $11.3 million for the three-month period ended March 31, 2010, and a decrease in the proceeds received from the disposition of real estate, as we had no sales for the three-month period ended March 31, 2011, as compared to $5.1 million for the three-month period ended March 31, 2010. These cash inflow activities were partially offset by increases in cash outflows for capital expenditures in our investments in real estate.
35
Table of Contents
Our decreased cash inflow from operating activities is primarily due to the impact of the economic environment on our business operations as accrued interest receivables increased from additional securities being on non-accrual status during the three-month period ended March 31, 2011 as compared to the three-month period ended March 31, 2010. This was partially offset by changes in our business focus to position RAIT for future growth by reductions in our indebtedness thereby decreasing our accrued interest payables and other general decreases in our accounts payable and accrued expenses from cost reductions.
The cash inflow from our financing activities during the three-month period ended March 31, 2011 as compared to the cash outflow during the three-month period ended March 31, 2010 is substantially due to the issuance of $115.0 million principal amount 7.0% convertible senior notes and the repurchase of $88.0 million principal amount 6.875% convertible senior notes. Other events that impacted our cash flows from financing activities was the repayment of one of our credit facilities, increased principal repayments on our CDO notes payables, and increased common share issuances during the three-month period ended March 31, 2011 as compared to the three-month period ended March 31, 2010.
Capitalization
We maintain various forms of short-term and long-term financing arrangements. Generally, these financing agreements are collateralized by assets within CDOs or mortgage securitizations. The following table summarizes our total recourse and non-recourse indebtedness as of March 31, 2011 (dollars in thousands):
| Description |
Unpaid Principal Balance |
Carrying Amount |
Weighted- Average Interest Rate |
Contractual Maturity | ||||||||||||
| Recourse indebtedness: |
||||||||||||||||
| 7.0% convertible senior notes (2) |
$ | 115,000 | $ | 106,815 | 7.0 | % | Apr. 2031 | |||||||||
| 6.875% convertible senior notes (1) |
55,613 | 55,569 | 6.9 | % | Apr. 2027 | |||||||||||
| Secured credit facilities |
20,040 | 20,040 | 4.5 | % | Dec. 2011 | |||||||||||
| Senior secured notes |
58,700 | 58,700 | 11.8 | % | Apr. 2014 | |||||||||||
| Loans payable on real estate |
7,245 | 7,245 | 5.0 | % | Sept. 2013 | |||||||||||
| Junior subordinated notes, at fair value (3) |
38,052 | 4,422 | 5.2 | % | Oct. 2015 to Mar. 2035 | |||||||||||
| Junior subordinated notes, at amortized cost |
25,100 | 25,100 | 7.7 | % | Apr. 2037 | |||||||||||
| Total recourse indebtedness |
319,750 | 277,891 | 7.5 | % | ||||||||||||
| Non-recourse indebtedness: |
||||||||||||||||
| CDO notes payable, at amortized cost (4)(5) |
1,341,750 | 1,341,750 | 0.7 | % | 2045 to 2046 | |||||||||||
| CDO notes payable, at fair value (3)(4)(6) |
1,134,643 | 142,633 | 0.9 | % | 2037 to 2038 | |||||||||||
| Loans payable on real estate |
68,343 | 68,343 | 5.8 | % | Jun. 2011 to Mar. 2018 | |||||||||||
| Total non-recourse indebtedness |
2,544,736 | 1,552,726 | 0.9 | % | ||||||||||||
| Total indebtedness |
$ | 2,864,486 | $ | 1,830,617 | 1.7 | % | ||||||||||
| (1) | Our 6.875% convertible senior notes are redeemable, at par at the option of the holder, in April 2012, April 2017, and April 2022. |
| (2) | Our 7.0% convertible senior notes are redeemable, at par at the option of the holder, in April 2016, April 2021, and April 2026. |
| (3) | Relates to liabilities which we elected to record at fair value under FASB ASC Topic 825. |
| (4) | Excludes CDO notes payable purchased by us which are eliminated in consolidation. |
| (5) | Collateralized by $1.8 billion principal amount of commercial mortgages, mezzanine loans, other loans and preferred equity interests. These obligations were issued by separate legal entities and consequently the assets of the special purpose entities that collateralize these obligations are not available to our creditors. |
| (6) | Collateralized by $1.3 billion principal amount of investments in securities and security-related receivables and loans, before fair value adjustments. The fair value of these investments as of March 31, 2011 was $877.5 million. These obligations were issued by separate legal entities and consequently the assets of the special purpose entities that collateralize these obligations are not available to our creditors. |
Recourse indebtedness refers to indebtedness that is recourse to our general assets, including the loans payable on real estate that are guaranteed by RAIT or RAIT Partnership. As indicated in the table above, our consolidated financial statements include recourse indebtedness of $277.9 million as of March 31, 2011. Non-recourse indebtedness consists of indebtedness of consolidated VIEs (i.e. CDOs and other securitization vehicles) and loans payable on real estate which is recourse only to specific assets pledged as collateral to the lenders. The creditors of each consolidated VIE have no recourse to our general credit.
The current status or activity in our financing arrangements occurring as of or during the three-month period ended March 31, 2011 is as follows:
Recourse Indebtedness
6.875% convertible senior notes. During the three-month period ended March 31, 2011, we repurchased $88.0 million in aggregate principal amount of our 6.875% Convertible Senior Notes due 2027, or the 6.875% convertible senior notes, for a total cash consideration of $86.3 million. As a result of these transactions, we recorded losses on extinguishment of debt of $0.5 million, net of deferred financing costs and unamortized discounts that were written off.
36
Table of Contents
Our 6.875% convertible senior notes are redeemable, at the option of the holder, in April 2012. We expect to acquire, redeem, refinance or otherwise enter into transactions to satisfy our 6.875% convertible senior notes which may include any combination of payments of cash, issuances of our debt and/or equity securities, sales or exchanges of our assets or other methods.
7.0% convertible senior notes. On March 21, 2011, we issued and sold in a public offering to qualified institutional buyers, $115.0 million aggregate principal amount of our 7.0% Convertible Senior Notes due 2031, or the 7.0% convertible senior notes. After deducting the underwriting discount and the estimated offering costs, we received approximately $109.0 million of net proceeds. Interest on the 7.0% convertible senior notes is paid semi-annually and the 7.0% convertible senior notes mature on April 1, 2031.
Prior to April 5, 2016, the 7.0% convertible senior notes are not redeemable at RAIT’s option, except to preserve RAIT’s status as a REIT. On or after April 5, 2016, RAIT may redeem all or a portion of the 7.0% convertible senior notes at a redemption price equal to the principal amount plus accrued and unpaid interest. Holders of 7.0% convertible senior notes may require RAIT to repurchase all or a portion of the 7.0% convertible senior notes at a purchase price equal to the principal amount plus accrued and unpaid interest on April 1, 2016, April 1, 2021, and April 1, 2026, or upon the occurrence of certain defined fundamental changes.
The 7.0% convertible senior notes are convertible at the option of the holder at an initial conversion rate of 390.1677 common shares per $1.0 million principal amount of 7.0% convertible senior notes (equivalent to an initial conversion price of $2.563 per common share). Upon conversion of 7.0% convertible senior notes by a holder, the holder will receive cash, our common shares or a combination of cash and our common shares, at our election. The initial conversion rate is subject to adjustment in certain circumstances. We include the 7.0% convertible senior notes in earnings per share using the treasury stock method if the conversion value in excess of the par amount is considered in the money during the respective periods.
According to FASB ASC Topic 470, “Debt”, we recorded a discount on our issued and outstanding 7.0% convertible senior notes of $8.2 million. This discount reflects the fair value of the embedded conversion option within the 7.0% convertible senior notes and was recorded as an increase to additional paid in capital. The fair value was calculated by discounting the cash flows required in the indenture relating to the 7.0% convertible senior notes agreement by a discount rate that represents management’s estimate of our senior, unsecured, non-convertible debt borrowing rate at the time when the 7.0% convertible senior notes were issued. The discount will be amortized to interest expense through April 1, 2016, the date at which holders of our 7.0% convertible senior notes could require repayment.
Secured credit facility. During the three-month period ending March 31, 2011, we prepaid a $16.2 million secured credit facility that was maturing in October 2011. As of March 31, 2011, we have borrowed an aggregate amount of $20.0 million under one secured credit facility, which is payable in December 2011 under the current terms of this facility. Our secured credit facility is secured by designated commercial mortgages and mezzanine loans.
Senior secured convertible note. During the three-month period ended March 31, 2011, the holder of the senior secured convertible note converted $5.3 million principal amount of the senior secured convertible note into 1,500,000 common shares. On April 26, 2011, we prepaid the remaining $15.7 million principal amount of the 10.0% senior secured convertible note issued March 25, 2010.
Loans payable on real estate. During the three-month period ended March 31, 2011 we refinanced a first mortgage of $12.5 million principal amount with a fixed rate of 5.8%, due in April 2012 that was associated with one of our owned real estate properties through non-recourse financing provided by a consolidated securitization.
Non-Recourse Indebtedness
CDO notes payable, at amortized cost. CDO notes payable at amortized cost represent notes issued by consolidated CDO entities which are used to finance the acquisition of unsecured REIT notes, CMBS securities, commercial mortgages, mezzanine loans, and other loans in our commercial real estate portfolio. Generally, CDO notes payable are comprised of various classes of notes payable, with each class bearing interest at variable or fixed rates. Both of our CRE CDOs are meeting all of their overcollateralization, or OC, and interest coverage, or IC, trigger tests as of March 31, 2011.
CDO notes payable, at fair value. Both of our Taberna consolidated CDOs are failing OC trigger tests which cause a change to the priority of payments to the debt and equity holders of the respective securitizations. Upon the failure of an OC test, the indenture of each CDO requires cash flows that would otherwise have been distributed to us as equity distributions, or in some cases interest payments on our retained CDO notes payable, to be used to pay down sequentially the outstanding principal balance of the most senior note holders. The OC tests failures are due to defaulted collateral assets and credit risk securities. During the three-month period ended
37
Table of Contents
March 31, 2011, $12.5 million of cash flows were re-directed from our retained interests in these CDOs and were used to repay the most senior holders of our CDO notes payable.
Loans payable on real estate. During the three-month period ended March 31, 2011, we obtained a first mortgage on one of our owned properties from the Federal National Mortgage Association. The new first mortgage has a principal balance of $13.4 million, a 7 year term, and a 5.12% interest rate.
Preferred Shares
On January 25, 2011, our board of trustees declared a first quarter 2011 cash dividend of $0.484375 per share on our 7.75% Series A Preferred Shares, $0.5234375 per share on our 8.375% Series B Preferred Shares and $0.5546875 per share on our 8.875% Series C Preferred Shares. The dividends were paid on March 31, 2011 to holders of record on March 1, 2011 and totaled $3.4 million.
Common Shares
Dividends:
On January 10, 2011, the board of trustees declared a $0.03 dividend on our common shares to holders of record as of January 21, 2011. The dividend was paid on January 31, 2011 and totaled $3.2 million.
Share Repurchases:
On January 25, 2011, the compensation committee approved a cash payment to the board’s eight non-management trustees intended to constitute a portion of their respective 2011 annual non-management trustee compensation. The cash payment was subject to terms and conditions set forth in a letter agreement, or the letter agreement, between each of the non-management trustees and RAIT. The terms and conditions included a requirement that each trustee use a portion of the cash payment to purchase RAIT’s common shares in purchases that, individually and in the aggregate with all purchases made by all the other non-management trustees pursuant to their respective letter agreements, complied with Rule 10b-18 promulgated under the Securities Exchange Act of 1934, as amended. The aggregate amount required to be used by all of the non-management trustees to purchase common shares is $0.2 million and was used to purchase 56,693 common shares, in the aggregate, in February 2011.
Equity Compensation:
During the three-months ended March 31, 2011, 1,019,162 phantom unit awards were redeemed for common shares. These phantom units were fully vested at the time of redemption.
Dividend Reinvestment and Share Purchase Plan (DRSPP):
We implemented an amended and restated dividend reinvestment and share purchase plan, or DRSPP, effective as of March 13, 2008, pursuant to which we registered and reserved for issuance 18,787,635 common shares. During the three-month period ended March 31, 2011, we issued a total of 25,569 common shares pursuant to the DRSPP at a weighted-average price of $2.75 per share and we received $0.1 million of net proceeds. As of March 31, 2011, 11,672,065 common shares, in aggregate, remain available for issuance under the DRSPP.
Capital on Demand™ Sales Agreement:
On August 6, 2010, we entered into a Capital on Demand™ Sales Agreement, or the COD sales agreement, with JonesTrading Institutional Services LLC, or JonesTrading, pursuant to which we may issue and sell up to 17,500,000 of our common shares from time to time through JonesTrading acting as agent and/or principal, subject to the terms and conditions of the COD sales agreement. For the three-month period ended March 31, 2011, 5,750,000 common shares were issued pursuant to this arrangement at a weighted average price of $3.20 and we received $18.2 million of proceeds. As of March 31, 2011, 2,696,589 common shares, in the aggregate, remain available for issuance under the COD sales agreement.
Off-Balance Sheet Arrangements and Commitments
Not applicable.
Critical Accounting Estimates and Policies
Our Annual Report on Form 10-K for the year ended December 31, 2010 contains a discussion of our critical accounting policies. On January 1, 2011 we adopted several new accounting pronouncements and revised our accounting policies as described below. See Note 2 in our unaudited consolidated financial statements as of March 31, 2011, as set forth herein. Management discusses our critical accounting policies and management’s judgments and estimates with our Audit Committee.
38
Table of Contents
Recent Accounting Pronouncements
On January 1, 2010, we adopted Accounting Standards Update (ASU) No. 2010-06, “Fair Value Measurements and Disclosures (Topic 820): Improving Disclosures about Fair Value Measurements.” This accounting standard requires new disclosures for significant transfers in and out of Level 1 and 2 fair value measurements and describes the reasons for the transfer. This accounting standard also updates existing disclosures by providing fair value measurement disclosures for each class of assets and liabilities and provides disclosures about the valuation techniques and inputs used to measure fair value for both recurring and nonrecurring fair value measurements. For Level 3 fair value measurements new disclosures will require entities to present information separately for purchases, sales, issuances, and settlements. These disclosures are effective for fiscal years beginning after December 15, 2010, and for interim periods within those fiscal years. The adoption of this standard did not have a material effect on our consolidated financial.
On January 1, 2011, we adopted ASU No. 2010-29, “Disclosure of Supplementary Pro Forma Information for Business Combinations.” This accounting standard requires that if a public entity presents comparative financial statements, the entity should disclose revenue and earnings of the combined entity as though the business combination(s) that occurred during the current year had occurred as of the beginning of the comparable prior annual reporting period only. This accounting standard also expands the supplemental pro forma disclosures under FASB ASU Topic 805, “Business Combinations” to include a description of the nature and amount of material, nonrecurring pro forma adjustments directly attributable to the business combination included in the reported pro forma revenue and earnings. The adoption of this standard did not have a material effect on our consolidated financial statements.
In April 2011, the FASB issued accounting standards classified under FASB ASC Topic 310, “Receivables”. This accounting standard amends existing guidance to provide additional guidance on the determination of whether a creditor has granted a concession and whether a debtor is experiencing financial difficulties for purposes of determining whether a restructuring constitutes a troubled debt restructuring. This standard is effective for the first interim or annual period beginning on or after June 15, 2011, and should be applied retrospectively to the beginning of the annual period of adoption. Management is currently evaluating the impact that this standard may have on our consolidated financial statements.
| Item 3. | Quantitative and Qualitative Disclosures about Market Risk |
Market risk is the exposure to loss resulting from changes in interest rates, commodity prices and equity prices. In pursuing our business plan, the primary market risks to which we are exposed are interest rate risk and credit risk. Changes in the general level of interest rates prevailing in the financial markets may affect the spread between our yield on invested assets and cost of funds and, in turn, our ability to make distributions or payments to our shareholders. In the event of a significant rising interest rate environment, defaults could increase and result in losses to us which adversely affect our operating results and liquidity. In the current global recession, defaults have increased and resulted in losses to us which have adversely affected, and we expect will continue to adversely affect, our operating results and liquidity.
There have been no material changes in Quantitative and Qualitative disclosures during the three-months ended March 31, 2011 from the disclosures included in our Annual Report on Form 10-K for the year ended December 31, 2010. Reference is made to Item 7A included in our Annual Report on Form 10-K for the year ended December 31, 2010.
| Item 4. | Controls and Procedures |
Disclosure Controls and Procedures
We maintain disclosure controls and procedures that are designed to ensure that information required to be disclosed in our reports under the Securities Exchange Act of 1934, as amended, or the Exchange Act, is recorded, processed, summarized, and reported within the time periods specified in the SEC’s rules and forms, and that such information is accumulated and communicated to our management, including our chief executive officer and our chief financial officer, as appropriate, to allow timely decisions regarding required disclosure. In designing and evaluating the disclosure controls and procedures, our management recognized that any controls and procedures, no matter how well designed and operated, can provide only reasonable assurance of achieving the desired control objectives, and our management necessarily was required to apply its judgment in evaluating the cost-benefit relationship of possible controls and procedures.
Under the supervision of our chief executive officer and chief financial officer and with the participation of our disclosure committee, we have carried out an evaluation of the effectiveness of our disclosure controls and procedures as of the end of the period covered by this report. Based upon that evaluation, our chief executive officer and chief financial officer concluded that our disclosure controls and procedures are effective at the reasonable assurance level.
39
Table of Contents
Changes in Internal Control Over Financial Reporting
There has been no change in our internal control over financial reporting that occurred during the three-month period ended March 31, 2011 that has materially affected, or is reasonably likely to materially affect, our internal control over financial reporting.
| Item 1. | Legal Proceedings |
Riverside National Bank of Florida Litigation
On August 6, 2009, Riverside National Bank of Florida commenced a lawsuit which named as defendants the three major credit rating agencies, various CDO sellers and collateral managers, including our subsidiary, Taberna Capital Management, LLC. The suit was filed in the Supreme Court of the State of New York, Kings County, and subsequently discontinued without prejudice and refiled in New York County on November 13, 2009. On April 16, 2010, the Office of the Comptroller of the Currency closed Riverside and named the Federal Deposit Insurance Corporation as receiver and thus as successor-in-interest to Riverside as plaintiff in the action, and the defendants subsequently removed the case to the United States District Court for the Southern District of New York. On April 22, 2011, following a series of stays requested by the FDIC, the FDIC voluntarily dismissed the action without prejudice. The claims asserted in this action were described in RAIT’s annual report on Form 10-K for the year ended December 31, 2010. RAIT believes that the FDIC plans to file a new lawsuit pursuing the same or substantially similar claims against an expanded list of defendants. If the FDIC files such a lawsuit, an adverse resolution of the litigation could have a material adverse effect on our financial condition and results of operations.
Routine Litigation
We are involved from time to time in litigation on various matters, including disputes with tenants of owned properties, disputes arising out of agreements to purchase or sell properties and disputes arising out of our loan portfolio. Given the nature of our business activities, these lawsuits are considered routine to the conduct of our business. The result of any particular lawsuit cannot be predicted, because of the very nature of litigation, the litigation process and its adversarial nature, and the jury system. We do not expect that the liabilities, if any, that may ultimately result from such routine legal actions will have a material adverse effect on our consolidated financial position, results of operations or cash flows.
| Item 1A. | Risk Factors |
There have not been any material changes from the risk factors previously disclosed in Item 1A—“Risk Factors” in our Annual Report on Form 10-K for the fiscal year ended December 31, 2010.
| Item 2. | Unregistered Sales of Equity Securities and Use of Proceeds |
The following table provides information regarding purchases made by or on behalf of RAIT or any “affiliated purchaser,” as defined in Rule 10b-18(a)(3) under the Securities Exchange Act of 1934, as amended, or the Exchange Act, of shares or other units of any class of RAIT’s equity securities that is registered by RAIT pursuant to section 12 of the Exchange Act.
Issuer Purchases of Equity Securities
| Period |
Total Number of Shares (or Units) Purchased |
Average Price Paid per Share (or Unit) |
Total Number of Shares (or Units) Purchased as Part of Publicly Announced Plans or Programs |
Maximum Number (or Approximate Dollar Value) of Shares (or Units) that May Yet Be Purchased Under the Plans or Programs |
||||||||||||
| 01/01/2011 to 01/31/2011 |
— | — | — | — | ||||||||||||
| 02/01/2011 to 02/28/2011 |
— | — | — | — | ||||||||||||
| 03/01/2011 to 03/31/2011 |
56,693 | (1) | $ | 3.6388 | (2) | 56,693 | (1) | — | ||||||||
| Total |
56,693 | (1) | $ | 3.6388 | (2) | 56,693 | (1)(3) | (1 | )(3) | |||||||
40
Table of Contents
| (1) | On January 25, 2011, the compensation committee of the board of trustees of RAIT approved a cash payment to its seven non-management trustees intended to constitute a portion of their respective 2011 annual non-management trustee compensation. RAIT’s non-management trustees were Edward S. Brown, Frank A. Farnesi, S. Kristin Kim, Arthur Makadon, Daniel Promislo, John F. Quigley III and Murray Stempel, III. The cash payment was subject to terms and conditions set forth in a letter agreement between each of the non-management trustees and RAIT. The terms and conditions included a requirement that each trustee use a portion of the cash payment to purchase RAIT’s common shares of beneficial interest, or common shares, in purchases that, individually and in the aggregate with all purchases made by all the other non-management trustees pursuant to their respective letter agreements, complied with Rule 10b-18 under the Exchange Act. The aggregate amount required to be used by all of the non-management trustees to purchase common shares was $210,000. RAIT filed a current report on Form 8-K with the SEC disclosing these letter agreements on January 28, 2011. This entire amount was used by the trustees to make purchases in open-market transactions of common shares on February 16, 2011, which we refer to as the trustee purchases, and no further purchases are required. With respect to these purchases, the trustees may be deemed to be affiliated purchasers and so the trustee purchases are reported in this table. While the compensation committee reserves the right to require purchases of RAIT’s equity securities as a condition of receiving cash payments as compensation in the future, no such payments are currently outstanding. |
| (2) | The price reported is the weighted average price of the trustee purchases. These shares were purchased in multiple transactions at prices ranging from $3.63 to $3.65, inclusive. |
| (3) | On July 24, 2007, our board of trustees adopted a share repurchase plan that authorizes us to purchase up to $75.0 million of RAIT common shares. Under the plan, we may make purchases, from time to time, through open market or privately negotiated transactions. We have not repurchased any common shares under this plan as of March 31, 2011. This share purchase plan was first disclosed in our quarterly report on Form 10-Q for the period ended June 30, 2007 filed with the SEC on August 8, 2007 and does not have an expiration date. |
| Item 6. | Exhibits |
| (a) | Exhibits |
The exhibits filed as part of this quarterly report on Form 10-Q are identified in the exhibit index immediately following the signature page of this Report. Such Exhibit Index is incorporated herein by reference.
41
Table of Contents
Pursuant to the requirements of the Securities Exchange Act of 1934, the registrant has duly caused this report to be signed on its behalf by the undersigned thereunto duly authorized.
| RAIT FINANCIAL TRUST (Registrant) | ||||||
| Date: May 5, 2011 | By: | /s/ Scott F. Schaeffer | ||||
| Scott F. Schaeffer, Chief Executive Officer and President | ||||||
| (On behalf of the registrant and as its Principal Executive Officer) | ||||||
| Date: May 5, 2011 | By: | /s/ Jack E. Salmon | ||||
| Jack E. Salmon, Chief Financial Officer and Treasurer | ||||||
| (On behalf of the registrant and as its Principal Financial Officer) | ||||||
| Date: May 5, 2011 | By: | /s/ James J. Sebra | ||||
| James J. Sebra, Senior Vice President and Chief Accounting Officer | ||||||
| (On behalf of the registrant and as its Principal Accounting Officer) | ||||||
42
Table of Contents
EXHIBIT INDEX
| Exhibit |
Description of Documents | |
| 3.1 |
Amended and Restated Declaration of Trust. (1) | |
| 3.1.1 |
Articles of Amendment to Amended and Restated Declaration of Trust. (2) | |
| 3.1.2 |
Articles of Amendment to Amended and Restated Declaration of Trust. (3) | |
| 3.1.3 |
Certificate of Correction to the Amended and Restated Declaration of Trust. (4) | |
| 3.1.4 |
Articles of Amendment to Amended and Restated Declaration of Trust. (5) | |
| 3.1.5 |
Articles Supplementary relating to the 7.75% Series A Cumulative Redeemable Preferred Shares of Beneficial Interest (the “Series A Articles Supplementary”). (6) | |
| 3.1.6 |
Certificate of Correction to the Series A Articles Supplementary. (6) | |
| 3.1.7 |
Articles Supplementary relating to the 8.375% Series B Cumulative Redeemable Preferred Shares of Beneficial Interest. (7) | |
| 3.1.8 |
Articles Supplementary relating to the 8.875% Series C Cumulative Redeemable Preferred Shares of Beneficial Interest. (8) | |
| 3.2 |
By-laws. (9) | |
| 4.1 |
Form of Certificate for Common Shares of Beneficial Interest. (5) | |
| 4.2 |
Form of Certificate for 7.75% Series A Cumulative Redeemable Preferred Shares of Beneficial Interest. (10) | |
| 4.3 |
Form of Certificate for 8.375% Series B Cumulative Redeemable Preferred Shares of Beneficial Interest. (7) | |
| 4.4 |
Form of Certificate for 8.875% Series C Cumulative Redeemable Preferred Shares of Beneficial Interest. (8) | |
| 4.5 |
Indenture dated as of April 18, 2007 among RAIT Financial Trust, as issuer, or RAIT, RAIT Partnership, L.P. and RAIT Asset Holdings, LLC, as guarantors, and Wells Fargo Bank, N.A., as trustee. (11) | |
| 4.6 |
Registration Rights Agreement dated as of April 18, 2007 between RAIT and Bear, Stearns & Co. Inc. (11) | |
| 4.7 |
Base Indenture dated as of March 21, 2011 between RAIT Financial Trust, as issuer, and Wells Fargo Bank, National Association., as trustee. (12) | |
| 4.8 |
Supplemental Indenture dated as of March 21, 2011 between RAIT Financial Trust, as issuer, and Wells Fargo Bank, National Association., as trustee. (12) | |
| 10.1 |
Form of Letter Agreement between RAIT and each of its Non-Management Trustees dated as of January 25, 2011. (13) | |
| 15.1 |
Awareness Letter from Independent Accountants. | |
| 31.1 |
Certification Pursuant to 13a-14 (a) under the Securities Exchange Act of 1934. | |
| 31.2 |
Certification Pursuant to 13a-14 (a) under the Securities Exchange Act of 1934. | |
| 32.1 |
Certification Pursuant to 18 U.S.C. Section 1350. | |
| 32.2 |
Certification Pursuant to 18 U.S.C. Section 1350. | |
43
Table of Contents
| (1) | Incorporated by reference to RAIT’s Registration Statement on Form S-11 (Registration No. 333-35077). |
| (2) | Incorporated by reference to RAIT’s Registration Statement on Form S-11 (Registration No. 333-53067). |
| (3) | Incorporated by reference to RAIT’s Registration Statement on Form S-2 (Registration No. 333-55518). |
| (4) | Incorporated by reference to RAIT’s Form 10-Q for the quarterly period ended March 31, 2002 (File No. 1-14760). |
| (5) | Incorporated by reference to RAIT’s Form 8-K as filed with the SEC on December 15, 2006 (File No. 1-14760). |
| (6) | Incorporated by reference to RAIT’s Form 8-K as filed with the SEC on March 18, 2004 (File No. 1-14760). |
| (7) | Incorporated by reference to RAIT’s Form 8-K as filed with the SEC on October 1, 2004 (File No. 1-14760). |
| (8) | Incorporated by reference to RAIT’s Form 8-A as filed with the SEC on June 29, 2007 (File No. 1-14760). |
| (9) | Incorporated by reference to RAIT’s Form 8-K as filed with the SEC on October 19, 2009 (File No. 1-14760). |
| (10) | Incorporated by reference to RAIT’s Form 8-K as filed with the SEC on March 22, 2004 (File No. 1-14760). |
| (11) | Incorporated by reference to RAIT’s Form 8-K as filed with the SEC on April 18, 2007 (File No. 1-14760). |
| (12) | Incorporated by reference to RAIT’s Form 8-K as filed with the SEC on March 22, 2011 (File No. 1-14760). |
| (13) | Incorporated by reference to RAIT’s Form 8-K as filed with the SEC on January 28, 2011 (File No. 1-14760). |
44