Attached files
| file | filename |
|---|---|
| EX-12.1 - EX-12.1 - RAIT Financial Trust | ras-ex121_919.htm |
| EX-32.2 - EX-32.2 - RAIT Financial Trust | ras-ex322_918.htm |
| EX-31.1 - EX-31.1 - RAIT Financial Trust | ras-ex311_915.htm |
| EX-32.1 - EX-32.1 - RAIT Financial Trust | ras-ex321_917.htm |
| EX-31.2 - EX-31.2 - RAIT Financial Trust | ras-ex312_916.htm |
UNITED STATES
SECURITIES AND EXCHANGE COMMISSION
WASHINGTON, D.C. 20549
FORM 10-Q
(Mark One)
|
x |
Quarterly Report Pursuant to Section 13 or 15(d) of the Securities Exchange Act of 1934 |
For the quarterly period ended September 30, 2015
or
|
¨ |
Transition Report Pursuant to Section 13 or 15(d) of the Securities Exchange Act of 1934 |
For the transition period from to
Commission File Number 1-14760
RAIT FINANCIAL TRUST
(Exact name of registrant as specified in its charter)
|
Maryland |
23-2919819 |
|
(State or other jurisdiction of incorporation or organization) |
(I.R.S. Employer Identification No.) |
|
|
|
|
2929 Arch Street, 17th Floor, Philadelphia, PA |
19104 |
|
(Address of principal executive offices) |
(Zip Code) |
(215) 243-9000
(Registrant’s telephone number, including area code)
Indicate by check mark whether the registrant (1) has filed all reports required to be filed by Section 13 or 15(d) of the Securities Exchange Act of 1934 during the preceding 12 months (or for such shorter period that the registrant was required to file such reports), and (2) has been subject to such filing requirements for the past 90 days. x Yes ¨ No
Indicate by check mark whether the registrant has submitted electronically and posted on its corporate Web site, if any, every Interactive Data File required to be submitted and posted pursuant to Rule 405 of Regulation S-T during the preceding 12 months (or for such shorter period that the registrant was required to submit and post such files). x Yes ¨ No
Indicate by check mark whether the registrant is a large accelerated filer, an accelerated filer, a non-accelerated filer, or a smaller reporting company. See the definitions of “large accelerated filer”, “accelerated filer” and “smaller reporting company” in Rule 12b-2 of the Exchange Act.
|
Large accelerated filer |
¨ |
Accelerated filer |
x |
|
|
|
|
|
|
Non-accelerated filer |
¨ (Do not check if a smaller reporting company) |
Smaller reporting company |
¨ |
Indicate by check mark whether the registrant is a shell company (as defined in Rule 12b-2 of the Exchange Act). ¨ Yes x No
A total of 91,235,358 common shares of beneficial interest, par value $0.03 per share, of the registrant were outstanding as of November 9, 2015.
TABLE OF CONTENTS
|
|
|
|
Page |
|
|
|
|
|
|
|
|
|
|
|
|
|
|
|
|
Item 1. |
|
1 |
|
|
|
|
|
|
|
|
Consolidated Balance Sheets as of September 30, 2015 and December 31, 2014 |
|
1 |
|
|
|
|
|
|
|
|
2 |
|
|
|
|
|
|
|
|
|
3 |
|
|
|
|
|
|
|
|
Consolidated Statement of Changes in Equity for the Nine-Month Period Ended September 30, 2015 |
|
4 |
|
|
|
|
|
|
|
Consolidated Statements of Cash Flows for the Nine-Month Periods Ended September 30, 2015 and 2014 |
|
5 |
|
|
|
|
|
|
|
|
6 |
|
|
|
|
|
|
|
Item 2. |
Management’s Discussion and Analysis of Financial Condition and Results of Operations |
|
42 |
|
|
|
|
|
|
Item 3. |
|
57 |
|
|
|
|
|
|
|
Item 4. |
|
57 |
|
|
|
|
|
|
|
|
|
|
|
|
|
|
|
|
|
Item 1. |
|
59 |
|
|
|
|
|
|
|
Item 1A. |
|
59 |
|
|
|
|
|
|
|
Item 6. |
|
60 |
|
|
|
|
|
|
|
|
|
61 |
RAIT Financial Trust
(Unaudited and dollars in thousands, except share and per share information)
|
|
|
As of September 30, 2015 |
|
|
As of December 31, 2014 |
|
||
|
Assets |
|
|
|
|
|
|
|
|
|
Investment in mortgages and loans: |
|
|
|
|
|
|
|
|
|
Commercial mortgages, mezzanine loans, and preferred equity interests |
|
$ |
1,588,097 |
|
|
$ |
1,392,436 |
|
|
Allowance for losses |
|
|
(14,646 |
) |
|
|
(9,218 |
) |
|
Total investment in mortgages and loans, at amortized cost |
|
|
1,573,451 |
|
|
|
1,383,218 |
|
|
Investments in real estate, net of accumulated depreciation of $188,581 and $168,480, respectively |
|
|
2,259,750 |
|
|
|
1,671,971 |
|
|
Investments in securities and security-related receivables, at fair value |
|
|
— |
|
|
|
31,412 |
|
|
Cash and cash equivalents |
|
|
92,652 |
|
|
|
121,726 |
|
|
Restricted cash |
|
|
159,200 |
|
|
|
124,220 |
|
|
Accrued interest receivable |
|
|
56,249 |
|
|
|
51,640 |
|
|
Other assets |
|
|
76,222 |
|
|
|
72,023 |
|
|
Deferred financing costs, net of accumulated amortization of $33,804 and $26,056, respectively |
|
|
29,806 |
|
|
|
27,802 |
|
|
Intangible assets, net of accumulated amortization of $22,316 and $13,911, respectively |
|
|
39,306 |
|
|
|
29,463 |
|
|
Total assets |
|
$ |
4,286,636 |
|
|
$ |
3,513,475 |
|
|
Liabilities and Equity |
|
|
|
|
|
|
|
|
|
Indebtedness |
|
$ |
3,199,981 |
|
|
$ |
2,615,666 |
|
|
Accrued interest payable |
|
|
13,748 |
|
|
|
10,269 |
|
|
Accounts payable and accrued expenses |
|
|
42,219 |
|
|
|
54,962 |
|
|
Derivative liabilities |
|
|
8,960 |
|
|
|
20,695 |
|
|
Deferred taxes, borrowers’ escrows and other liabilities |
|
|
188,797 |
|
|
|
144,733 |
|
|
Total liabilities |
|
|
3,453,705 |
|
|
|
2,846,325 |
|
|
Series D cumulative redeemable preferred shares, $0.01 par value per share, 4,000,000 shares authorized, 4,000,000 and 4,000,000 shares issued and outstanding, respectively |
|
|
83,787 |
|
|
|
79,308 |
|
|
Equity: |
|
|
|
|
|
|
|
|
|
Shareholders’ equity: |
|
|
|
|
|
|
|
|
|
Preferred shares, $0.01 par value per share, 25,000,000 shares authorized; |
|
|
|
|
|
|
|
|
|
7.75% Series A cumulative redeemable preferred shares, liquidation preference $25.00 per share, 8,069,288 shares authorized, 5,306,084 and 4,775,569 shares issued and outstanding |
|
|
53 |
|
|
|
48 |
|
|
8.375% Series B cumulative redeemable preferred shares, liquidation preference $25.00 per share, 4,300,000 shares authorized, 2,340,969 and 2,288,465 shares issued and outstanding |
|
|
23 |
|
|
|
23 |
|
|
8.875% Series C cumulative redeemable preferred shares, liquidation preference $25.00 per share, 3,600,000 shares authorized, 1,640,425 and 1,640,100 shares issued and outstanding |
|
|
17 |
|
|
|
17 |
|
|
Series E cumulative redeemable preferred shares, $0.01 par value per share, 4,000,000 shares authorized |
|
|
— |
|
|
|
— |
|
|
Common shares, $0.03 par value per share, 200,000,000 shares authorized, 90,898,034 and 82,506,606 issued and outstanding, respectively, including 742,764 and 541,575 unvested restricted common share awards, respectively |
|
|
2,727 |
|
|
|
2,473 |
|
|
Additional paid in capital |
|
|
2,082,695 |
|
|
|
2,025,683 |
|
|
Accumulated other comprehensive income (loss) |
|
|
(8,022 |
) |
|
|
(20,788 |
) |
|
Retained earnings (deficit) |
|
|
(1,674,412 |
) |
|
|
(1,633,911 |
) |
|
Total shareholders’ equity |
|
|
403,081 |
|
|
|
373,545 |
|
|
Noncontrolling interests |
|
|
346,063 |
|
|
|
214,297 |
|
|
Total equity |
|
|
749,144 |
|
|
|
587,842 |
|
|
Total liabilities and equity |
|
$ |
4,286,636 |
|
|
$ |
3,513,475 |
|
The accompanying notes are an integral part of these consolidated financial statements.
1
Consolidated Statements of Operations
(Unaudited and dollars in thousands, except share and per share information)
|
|
|
For the Three-Month Periods Ended September 30 |
|
|
For the Nine-Month Periods Ended September 30 |
|
||||||||||
|
|
|
2015 |
|
|
2014 |
|
|
2015 |
|
|
2014 |
|
||||
|
Revenue: |
|
|
|
|
|
|
|
|
|
|
|
|
|
|
|
|
|
Investment interest income |
|
$ |
24,468 |
|
|
$ |
33,273 |
|
|
$ |
71,823 |
|
|
$ |
102,882 |
|
|
Investment interest expense |
|
|
(8,021 |
) |
|
|
(7,636 |
) |
|
|
(22,517 |
) |
|
|
(22,342 |
) |
|
Net interest margin |
|
|
16,447 |
|
|
|
25,637 |
|
|
|
49,306 |
|
|
|
80,540 |
|
|
Rental income |
|
|
55,459 |
|
|
|
41,806 |
|
|
|
164,321 |
|
|
|
116,204 |
|
|
Fee and other income |
|
|
3,056 |
|
|
|
7,842 |
|
|
|
16,065 |
|
|
|
19,113 |
|
|
Total revenue |
|
|
74,962 |
|
|
|
75,285 |
|
|
|
229,692 |
|
|
|
215,857 |
|
|
Expenses: |
|
|
|
|
|
|
|
|
|
|
|
|
|
|
|
|
|
Interest expense |
|
|
19,574 |
|
|
|
13,910 |
|
|
|
58,930 |
|
|
|
38,756 |
|
|
Real estate operating expense |
|
|
25,918 |
|
|
|
20,874 |
|
|
|
77,674 |
|
|
|
58,655 |
|
|
Compensation expense |
|
|
7,137 |
|
|
|
7,187 |
|
|
|
19,813 |
|
|
|
23,118 |
|
|
General and administrative expense |
|
|
4,489 |
|
|
|
4,756 |
|
|
|
14,954 |
|
|
|
13,239 |
|
|
Acquisition expense |
|
|
12,901 |
|
|
|
816 |
|
|
|
14,843 |
|
|
|
1,408 |
|
|
Provision for loan losses |
|
|
1,850 |
|
|
|
1,500 |
|
|
|
5,850 |
|
|
|
3,500 |
|
|
Depreciation and amortization expense |
|
|
15,168 |
|
|
|
13,236 |
|
|
|
51,190 |
|
|
|
38,719 |
|
|
Total expenses |
|
|
87,037 |
|
|
|
62,279 |
|
|
|
243,254 |
|
|
|
177,395 |
|
|
Operating (Loss) Income |
|
|
(12,075 |
) |
|
|
13,006 |
|
|
|
(13,562 |
) |
|
|
38,462 |
|
|
Interest and other income (expense), net |
|
|
(380 |
) |
|
|
(21,464 |
) |
|
|
(1,016 |
) |
|
|
(21,449 |
) |
|
Gains (losses) on assets |
|
|
7,430 |
|
|
|
25 |
|
|
|
24,711 |
|
|
|
(5,350 |
) |
|
Gain on IRT merger with TSRE |
|
|
64,012 |
|
|
|
— |
|
|
|
64,012 |
|
|
|
— |
|
|
Gains (losses) on extinguishments of debt |
|
|
— |
|
|
|
— |
|
|
|
— |
|
|
|
2,421 |
|
|
Asset impairment |
|
|
(7,250 |
) |
|
|
— |
|
|
|
(7,250 |
) |
|
|
— |
|
|
TSRE financing extinguishment and employee separation expenses |
|
|
(27,508 |
) |
|
|
— |
|
|
|
(27,508 |
) |
|
|
— |
|
|
Change in fair value of financial instruments |
|
|
620 |
|
|
|
(10,223 |
) |
|
|
13,466 |
|
|
|
(59,433 |
) |
|
Income (loss) before taxes |
|
|
24,849 |
|
|
|
(18,656 |
) |
|
|
52,853 |
|
|
|
(45,349 |
) |
|
Income tax benefit (provision) |
|
|
(23 |
) |
|
|
2,194 |
|
|
|
(1,320 |
) |
|
|
2,454 |
|
|
Net income (loss) |
|
|
24,826 |
|
|
|
(16,462 |
) |
|
|
51,533 |
|
|
|
(42,895 |
) |
|
(Income) loss allocated to preferred shares |
|
|
(8,303 |
) |
|
|
(7,407 |
) |
|
|
(24,383 |
) |
|
|
(20,628 |
) |
|
(Income) loss allocated to noncontrolling interests |
|
|
(23,055 |
) |
|
|
603 |
|
|
|
(21,823 |
) |
|
|
20 |
|
|
Net income (loss) allocable to common shares |
|
$ |
(6,532 |
) |
|
$ |
(23,266 |
) |
|
$ |
5,327 |
|
|
$ |
(63,503 |
) |
|
Earnings (loss) per share-Basic: |
|
|
|
|
|
|
|
|
|
|
|
|
|
|
|
|
|
Earnings (loss) per share-Basic |
|
$ |
(0.07 |
) |
|
$ |
(0.28 |
) |
|
$ |
0.06 |
|
|
$ |
(0.78 |
) |
|
Weighted-average shares outstanding-Basic |
|
|
87,110,958 |
|
|
|
81,967,806 |
|
|
|
83,799,244 |
|
|
|
81,111,796 |
|
|
Earnings (loss) per share-Diluted: |
|
|
|
|
|
|
|
|
|
|
|
|
|
|
|
|
|
Earnings (loss) per share-Diluted |
|
$ |
(0.07 |
) |
|
$ |
(0.28 |
) |
|
$ |
0.06 |
|
|
$ |
(0.78 |
) |
|
Weighted average shares outstanding-Diluted |
|
|
87,110,958 |
|
|
|
81,967,806 |
|
|
|
85,645,609 |
|
|
|
81,111,796 |
|
The accompanying notes are an integral part of these consolidated financial statements.
2
Consolidated Statements of Comprehensive Income (Loss)
(Unaudited and dollars in thousands)
|
|
|
For the Three-Month Periods Ended September 30 |
|
|
For the Nine-Month Periods Ended September 30 |
|
||||||||||
|
|
|
2015 |
|
|
2014 |
|
|
2015 |
|
|
2014 |
|
||||
|
Net income (loss) |
|
$ |
24,826 |
|
|
$ |
(16,462 |
) |
|
$ |
51,533 |
|
|
$ |
(42,895 |
) |
|
Other comprehensive income (loss): |
|
|
|
|
|
|
|
|
|
|
|
|
|
|
|
|
|
Change in fair value of interest rate hedges |
|
|
(248 |
) |
|
|
221 |
|
|
|
(430 |
) |
|
|
(975 |
) |
|
Realized (gains) losses on interest rate hedges reclassified to earnings |
|
|
3,831 |
|
|
|
6,966 |
|
|
|
13,196 |
|
|
|
21,746 |
|
|
Total other comprehensive income |
|
|
3,583 |
|
|
|
7,187 |
|
|
|
12,766 |
|
|
|
20,771 |
|
|
Comprehensive income (loss) before allocation to noncontrolling interests |
|
|
28,409 |
|
|
|
(9,275 |
) |
|
|
64,299 |
|
|
|
(22,124 |
) |
|
Allocation to noncontrolling interests |
|
|
(23,055 |
) |
|
|
603 |
|
|
|
(21,823 |
) |
|
|
20 |
|
|
Comprehensive income (loss) |
|
$ |
5,354 |
|
|
$ |
(8,672 |
) |
|
$ |
42,476 |
|
|
$ |
(22,104 |
) |
The accompanying notes are an integral part of these consolidated financial statements.
3
Consolidated Statement of Changes in Equity
(Unaudited and dollars in thousands, except share information)
|
|
|
Preferred Shares— Series A |
|
|
Par Value Preferred Shares— Series A |
|
|
Preferred Shares— Series B |
|
|
Par Value Preferred Shares— Series B |
|
|
Preferred Shares— Series C |
|
|
Par Value Preferred Shares— Series C |
|
|
Common Shares |
|
|
Par Value Common Shares |
|
|
Additional Paid In Capital |
|
|
Accumulated Other Comprehensive Income (Loss) |
|
|
Retained Earnings (Deficit) |
|
|
Total Shareholders’ Equity |
|
|
Noncontrolling Interests |
|
|
Total Equity |
|
||||||||||||||
|
Balance, December 31, 2014 |
|
|
4,775,569 |
|
|
$ |
48 |
|
|
|
2,288,465 |
|
|
$ |
23 |
|
|
|
1,640,100 |
|
|
$ |
17 |
|
|
|
82,506,606 |
|
|
$ |
2,473 |
|
|
$ |
2,025,683 |
|
|
$ |
(20,788 |
) |
|
$ |
(1,633,911 |
) |
|
$ |
373,545 |
|
|
$ |
214,297 |
|
|
$ |
587,842 |
|
|
Net income (loss) |
|
— |
|
|
— |
|
|
— |
|
|
— |
|
|
— |
|
|
— |
|
|
— |
|
|
— |
|
|
— |
|
|
— |
|
|
|
29,710 |
|
|
|
29,710 |
|
|
|
21,823 |
|
|
|
51,533 |
|
||||||||||
|
Preferred dividends |
|
— |
|
|
— |
|
|
— |
|
|
— |
|
|
— |
|
|
— |
|
|
— |
|
|
— |
|
|
— |
|
|
— |
|
|
|
(19,445 |
) |
|
|
(19,445 |
) |
|
— |
|
|
|
(19,445 |
) |
|||||||||||
|
Preferred Series D discount amortization |
|
— |
|
|
— |
|
|
— |
|
|
— |
|
|
— |
|
|
— |
|
|
— |
|
|
— |
|
|
— |
|
|
— |
|
|
|
(4,938 |
) |
|
|
(4,938 |
) |
|
— |
|
|
|
(4,938 |
) |
|||||||||||
|
Common dividends declared |
|
— |
|
|
— |
|
|
— |
|
|
— |
|
|
— |
|
|
— |
|
|
— |
|
|
— |
|
|
— |
|
|
— |
|
|
|
(45,828 |
) |
|
|
(45,828 |
) |
|
— |
|
|
|
(45,828 |
) |
|||||||||||
|
Other comprehensive income (loss), net |
|
— |
|
|
— |
|
|
— |
|
|
— |
|
|
— |
|
|
— |
|
|
— |
|
|
— |
|
|
— |
|
|
|
12,766 |
|
|
— |
|
|
|
12,766 |
|
|
— |
|
|
|
12,766 |
|
|||||||||||
|
Share-based compensation |
|
— |
|
|
— |
|
|
— |
|
|
— |
|
|
— |
|
|
— |
|
|
— |
|
|
— |
|
|
|
3,553 |
|
|
— |
|
|
— |
|
|
|
3,553 |
|
|
— |
|
|
|
3,553 |
|
|||||||||||
|
Issuance of noncontrolling interests |
|
— |
|
|
— |
|
|
— |
|
|
— |
|
|
— |
|
|
— |
|
|
— |
|
|
— |
|
|
— |
|
|
— |
|
|
— |
|
|
— |
|
|
|
123,714 |
|
|
|
123,714 |
|
||||||||||||
|
Distribution to noncontrolling interests |
|
— |
|
|
— |
|
|
— |
|
|
— |
|
|
— |
|
|
— |
|
|
— |
|
|
— |
|
|
|
(1,000 |
) |
|
— |
|
|
— |
|
|
|
(1,000 |
) |
|
|
(14,434 |
) |
|
|
(15,434 |
) |
||||||||||
|
Deconsolidation of real estate owned property |
|
— |
|
|
— |
|
|
— |
|
|
— |
|
|
— |
|
|
— |
|
|
— |
|
|
— |
|
|
— |
|
|
— |
|
|
— |
|
|
— |
|
|
|
663 |
|
|
|
663 |
|
||||||||||||
|
Preferred shares issued, net |
|
|
530,515 |
|
|
|
5 |
|
|
|
52,504 |
|
|
— |
|
|
|
325 |
|
|
— |
|
|
— |
|
|
— |
|
|
|
13,056 |
|
|
— |
|
|
— |
|
|
|
13,061 |
|
|
— |
|
|
|
13,061 |
|
|||||||
|
Common shares issued for equity compensation |
|
— |
|
|
— |
|
|
— |
|
|
— |
|
|
— |
|
|
— |
|
|
|
385,322 |
|
|
|
14 |
|
|
|
(797 |
) |
|
— |
|
|
— |
|
|
|
(783 |
) |
|
— |
|
|
|
(783 |
) |
|||||||||
|
Common shares issued, net |
|
— |
|
|
— |
|
|
— |
|
|
— |
|
|
— |
|
|
— |
|
|
|
8,006,106 |
|
|
|
240 |
|
|
|
42,200 |
|
|
— |
|
|
— |
|
|
|
42,440 |
|
|
— |
|
|
|
42,440 |
|
|||||||||
|
Balance, September 30, 2015 |
|
|
5,306,084 |
|
|
$ |
53 |
|
|
|
2,340,969 |
|
|
$ |
23 |
|
|
|
1,640,425 |
|
|
$ |
17 |
|
|
|
90,898,034 |
|
|
$ |
2,727 |
|
|
$ |
2,082,695 |
|
|
$ |
(8,022 |
) |
|
$ |
(1,674,412 |
) |
|
$ |
403,081 |
|
|
$ |
346,063 |
|
|
$ |
749,144 |
|
The accompanying notes are an integral part of these consolidated financial statements.
4
Consolidated Statements of Cash Flows
(Unaudited and dollars in thousands)
|
|
|
For the Nine-Month Periods Ended September 30 |
|
|||||
|
|
|
2015 |
|
|
2014 |
|
||
|
Operating activities: |
|
|
|
|
|
|
|
|
|
Net income (loss) |
|
$ |
51,533 |
|
|
$ |
(42,895 |
) |
|
Adjustments to reconcile net income (loss) to cash flow from operating activities: |
|
|
|
|
|
|
|
|
|
Provision for loan losses |
|
|
5,850 |
|
|
|
3,500 |
|
|
Share-based compensation expense |
|
|
3,553 |
|
|
|
3,777 |
|
|
Depreciation and amortization |
|
|
51,190 |
|
|
|
38,719 |
|
|
Amortization of deferred financing costs and debt discounts |
|
|
13,103 |
|
|
|
7,728 |
|
|
Accretion of discounts on investments |
|
|
(2,716 |
) |
|
|
(4,719 |
) |
|
Amortization of above/below market leases |
|
|
(44 |
) |
|
|
— |
|
|
(Gains) losses on assets |
|
|
(24,711 |
) |
|
|
5,350 |
|
|
(Gains) losses on extinguishment of debt |
|
|
— |
|
|
|
(2,421 |
) |
|
TSRE financing extinguishment expenses |
|
|
23,219 |
|
|
|
— |
|
|
Gains on IRT merger with TSRE |
|
|
(64,012 |
) |
|
|
— |
|
|
Asset impairment |
|
|
7,250 |
|
|
|
— |
|
|
Change in fair value of financial instruments |
|
|
(13,466 |
) |
|
|
59,433 |
|
|
Provision (benefit) for deferred taxes |
|
|
851 |
|
|
|
(2,634 |
) |
|
Changes in assets and liabilities: |
|
|
|
|
|
|
|
|
|
(Decrease) in accrued interest receivable |
|
|
(2,305 |
) |
|
|
(7,882 |
) |
|
(Decrease) in other assets |
|
|
482 |
|
|
|
(15,626 |
) |
|
Increase (decrease) in accrued interest payable |
|
|
3,409 |
|
|
|
(14,580 |
) |
|
(Decrease) in accounts payable and accrued expenses |
|
|
(19,453 |
) |
|
|
21,611 |
|
|
Increase in other liabilities |
|
|
3,660 |
|
|
|
14,918 |
|
|
Origination of conduit loans |
|
|
(317,154 |
) |
|
|
(301,810 |
) |
|
Sales of conduit loans |
|
|
339,542 |
|
|
|
238,988 |
|
|
Net conduit loans (originated) sold |
|
|
22,388 |
|
|
|
(62,822 |
) |
|
Cash flow from operating activities |
|
|
59,781 |
|
|
|
1,457 |
|
|
Investing activities: |
|
|
|
|
|
|
|
|
|
Proceeds from sales or repayments of other securities |
|
|
31,241 |
|
|
|
8,973 |
|
|
Purchase and origination of loans for investment |
|
|
(362,574 |
) |
|
|
(394,109 |
) |
|
Principal repayments on loans |
|
|
169,611 |
|
|
|
134,521 |
|
|
Investments in real estate |
|
|
(44,079 |
) |
|
|
(238,648 |
) |
|
IRT's acquisition of TSRE, net of cash acquired |
|
|
(137,094 |
) |
|
|
— |
|
|
Proceeds from the disposition of real estate |
|
|
40,089 |
|
|
|
3,821 |
|
|
(Increase) decrease in restricted cash |
|
|
6,454 |
|
|
|
19,627 |
|
|
Cash flow from investing activities |
|
|
(296,352 |
) |
|
|
(465,815 |
) |
|
Financing activities: |
|
|
|
|
|
|
|
|
|
Repayments on secured credit facilities and loans payable on real estate |
|
|
(273,872 |
) |
|
|
(25,589 |
) |
|
Proceeds from secured credit facilities, term loans and loans payable on real estate |
|
|
488,725 |
|
|
|
102,318 |
|
|
Repayments and repurchase of CDO notes payable and floating rate CMBS transactions |
|
|
(222,955 |
) |
|
|
(174,397 |
) |
|
Proceeds from issuance of senior notes from floating rate CMBS transactions |
|
|
181,215 |
|
|
|
155,001 |
|
|
Proceeds from issuance of 4.0% convertible senior notes |
|
|
— |
|
|
|
16,750 |
|
|
Proceeds from issuance of senior notes |
|
|
— |
|
|
|
131,905 |
|
|
Repayments of senior secured notes |
|
|
(6,000 |
) |
|
|
— |
|
|
Net proceeds (repayments) related to conduit loan repurchase agreements |
|
|
(27,242 |
) |
|
|
357,550 |
|
|
Net proceeds (repayments) related to floating rate loan repurchase agreements |
|
|
126,389 |
|
|
|
(236,129 |
) |
|
Issuance of (distribution to) noncontrolling interests |
|
|
(15,577 |
) |
|
|
115,728 |
|
|
TSRE financing extinguishment expenses |
|
|
(23,219 |
) |
|
|
— |
|
|
Payments for deferred costs and convertible senior note hedges |
|
|
(10,935 |
) |
|
|
(12,313 |
) |
|
Preferred share issuance, net of costs incurred |
|
|
13,061 |
|
|
|
33,639 |
|
|
Common share issuance, net of costs incurred |
|
|
41,657 |
|
|
|
85,037 |
|
|
Distributions paid to preferred shareholders |
|
|
(19,445 |
) |
|
|
(17,244 |
) |
|
Distributions paid to common shareholders |
|
|
(44,305 |
) |
|
|
(39,978 |
) |
|
Cash flow from financing activities |
|
|
207,497 |
|
|
|
492,278 |
|
|
Net change in cash and cash equivalents |
|
|
(29,074 |
) |
|
|
27,920 |
|
|
Cash and cash equivalents at the beginning of the period |
|
|
121,726 |
|
|
|
88,847 |
|
|
Cash and cash equivalents at the end of the period |
|
$ |
92,652 |
|
|
$ |
116,767 |
|
The accompanying notes are an integral part of these consolidated financial statements.
5
Notes to Consolidated Financial Statements
As of September 30, 2015
(Unaudited and dollars in thousands, except share and per share amounts)
NOTE 1: THE COMPANY
RAIT Financial Trust invests in and manages a portfolio of real-estate related assets, including direct ownership of real estate properties, and provides a comprehensive set of debt financing options to the real estate industry. References to “RAIT”, “we”, “us”, and “our” refer to RAIT Financial Trust and its subsidiaries, unless the context otherwise requires. RAIT is a self-managed and self-advised Maryland real estate investment trust, or REIT.
We finance a substantial portion of our investments through borrowing and securitization strategies seeking to match the maturities and terms of our financings with the maturities and terms of those investments, and to mitigate interest rate risk through derivative instruments.
NOTE 2: SUMMARY OF SIGNIFICANT ACCOUNTING POLICIES
a. Basis of Presentation
The accompanying unaudited interim consolidated financial statements have been prepared by management in accordance with U.S. generally accepted accounting principles, or GAAP. Certain information and footnote disclosures normally included in annual consolidated financial statements prepared in accordance with GAAP have been condensed or omitted pursuant to such rules and regulations, although we believe that the included disclosures are adequate to make the information presented not misleading. The unaudited interim consolidated financial statements should be read in conjunction with our audited financial statements as of and for the year ended December 31, 2014 included in our Annual Report on Form 10-K. In the opinion of management, all adjustments, consisting only of normal recurring adjustments, necessary to present fairly our consolidated financial position and consolidated results of operations and cash flows are included. The results of operations for the interim periods presented are not necessarily indicative of the results for the full year.
Certain prior period amounts have been reclassified to conform with the current period presentation.
During the nine-month period ended September 30, 2015, we corrected the following errors that resulted in adjustments to the accompanying consolidated statement of operations that related to transactions completed in a prior period: (a) investment interest income includes the write-off of accrued interest receivable of $842 that was associated with investments in loans that was determined to be not collectible and (b) depreciation and amortization expense includes $708 associated with capital additions associated with our investment in real estate which were not properly eliminated previously and $(623) associated with the application of incorrect useful lives for certain real estate assets. We also recorded an adjustment to correct the deferred tax liability balance with an offset to goodwill for $2,257 related to our acquisition of Urban Retail Properties, LLC.
The Consolidated Statement of Cash Flows for the nine-month period ended September 30, 2015 includes the impact of correcting the reporting of certain activity that occurred in the six-month period ended June 30, 2015 and the three-month period ended March 31, 2015. Specifically, the correction eliminated the impact of a clerical error made in the determination of the amounts reported for the change in borrowers’ escrows within cash flows from operating activities and the related amounts reported for changes in restricted cash within cash flow from investing activities. The impact of this was a decrease to cash flows from operating activities and an increase to cash flows from investing activities of $69,028 for the six-month period ended June 30, 2015 ($18,194 of which related to the three-month period ended March 31, 2015). This correction had no impact to cash and cash equivalents as of June 30, 2015 (or March 31, 2015), nor did it impact any other consolidated financial statement amounts as of June 30, 2015 (or March 31, 2015) or for the six-month period ended June 30, 2015 (or the three-month period ended March 31, 2015).
During the nine-month period ended September 30, 2015, we corrected the Consolidated Statements of Cash Flows for the nine-month period ended September 30, 2014 as previously disclosed in our Annual Report on Form 10-K for the year ended December 31, 2014. The revision consisted of classifying the origination of conduit loans and the sale of conduit loans from cash flows from investing activities to cash flows from operating activities. The impact of this revision was a decrease to cash flows from operating activities and an increase to cash flows from investing activities of $62,822 for the period ended September 30, 2014. The revision had no impact to cash and cash equivalents as of September 30, 2014. In addition, the revision did not impact any other consolidated financial statement as of September 30, 2014 or for the nine-month or three-month periods ended September 30, 2014.
6
RAIT Financial Trust
Notes to Consolidated Financial Statements
As of September 30, 2015
(Unaudited and dollars in thousands, except share and per share amounts)
We evaluated these error corrections and determined, based on quantitative and qualitative factors, the changes were not material to the consolidated financial statements taken as a whole for any previously filed consolidated financial statements.
b. Principles of Consolidation
The consolidated financial statements reflect our accounts and the accounts of our majority-owned and/or controlled subsidiaries. We also consolidate entities that are variable interest entities, or VIEs, where we have determined that we are the primary beneficiary of such entities. The portions of these entities that we do not own are presented as noncontrolling interests as of the dates and for the periods presented in the consolidated financial statements. All intercompany accounts and transactions have been eliminated in consolidation.
Under Financial Accounting Standards Board (FASB) Accounting Standards Codification (ASC) Topic 810, “Consolidation”, the determination of whether to consolidate a VIE is based on the power to direct the activities of the VIE that most significantly impact the VIE’s economic performance together with either the obligation to absorb losses or the right to receive benefits that could be significant to the VIE. We define the power to direct the activities that most significantly impact the VIE’s economic performance as the ability to buy, sell, refinance, or recapitalize assets or entities, and solely control other material operating events or items of the respective entity. For our commercial mortgages, mezzanine loans, and preferred equity investments, certain rights we hold are protective in nature and would preclude us from having the power to direct the activities that most significantly impact the VIE’s economic performance. Assuming both criteria are met, we would be considered the primary beneficiary and would consolidate the VIE. We will continually assess our involvement with VIEs and consolidate the VIEs when we are the primary beneficiary. See Note 9 for additional disclosures pertaining to VIEs.
c. Use of Estimates
The preparation of financial statements in conformity with GAAP requires management to make estimates and assumptions that affect the reported amounts of assets and liabilities, the disclosure of contingent assets and liabilities at the date of the financial statements and the reported amounts of revenue and expenses during the reporting periods. The items that include significant estimates are fair value of financial instruments and allowance for losses. Actual results could differ from those estimates.
d. Investments in Loans
We invest in commercial mortgages, mezzanine loans, and preferred equity interests. We account for our investments in commercial mortgages, mezzanine loans and preferred equity interests at amortized cost. The carrying value of these investments is adjusted for origination discounts/premiums, nonrefundable fees and direct costs for originating loans which are amortized into income on a level yield basis over the terms of the loans.
e. Allowance for Losses, Impaired Loans and Non-accrual Status
We maintain an allowance for losses on our investments in commercial mortgages, mezzanine loans and preferred equity interests. Management’s periodic evaluation of the adequacy of the allowance is based upon expected and inherent risks in the portfolio, the estimated value of underlying collateral, and current economic conditions. Management reviews loans for impairment and establishes specific reserves when a loss is probable under the provisions of FASB ASC Topic 310, “Receivables.” A loan is impaired when it is probable that we may not collect all principal and interest payments according to the contractual terms. As part of the detailed loan review, we consider many factors about the specific loan, including payment history, asset performance, borrower’s financial capability and other characteristics. If any trends or characteristics indicate that it is probable that other loans, with similar characteristics to those of impaired loans, have incurred a loss, we consider whether an allowance for loss is needed pursuant to FASB ASC Topic 450, “Contingencies.” Management evaluates loans for non-accrual status each reporting period. A loan is placed on non-accrual status when the loan payment deficiencies exceed 90 days or if the collection of principal and interest in full is not probable. Payments received for non-accrual or impaired loans are applied to principal until the loan is removed from non-accrual status or no longer impaired. Past due interest is recognized on non-accrual loans when they are removed from non-accrual status and are making current interest payments. The allowance for losses is increased by charges to operations and decreased by charge-offs (net of recoveries). Management charges off loans when the investment is no longer realizable and legally discharged.
7
RAIT Financial Trust
Notes to Consolidated Financial Statements
As of September 30, 2015
(Unaudited and dollars in thousands, except share and per share amounts)
Investments in real estate are shown net of accumulated depreciation. We capitalize those costs that have been evaluated to improve the real property and depreciate those costs on a straight-line basis over the useful life of the asset. We depreciate real property using the following useful lives: buildings and improvements—30 to 40 years; furniture, fixtures, and equipment—5 to 10 years; and tenant improvements—shorter of the lease term or the life of the asset. Costs for ordinary maintenance and repairs are charged to expense as incurred.
Acquisitions of real estate assets and any related intangible assets are recorded initially at fair value under FASB ASC Topic 805, “Business Combinations.” Fair value is determined by management based on market conditions and inputs at the time the asset is acquired. The fair value of the real estate acquired is allocated to the acquired tangible assets, consisting of land, building and tenant improvements, and identified intangible assets and liabilities, consisting of the value of above-market and below-market leases for acquired in-place leases and the value of tenant relationships, based in each case on their fair values. Purchase accounting is applied to assets and liabilities associated with the real estate acquired. Transaction costs and fees incurred related to acquisitions are expensed as incurred.
Upon the acquisition of properties, we estimate the fair value of acquired tangible assets (consisting of land, building and improvements) and identified intangible assets and liabilities (consisting of above and below-market leases, in-place leases and tenant relationships), and assumed debt at the date of acquisition, based on the evaluation of information and estimates available at that date. In determining the fair value of the identified intangible assets and liabilities of an acquired property, above-market and below-market in-place lease values are recorded based on the present value (using an interest rate which reflects the risks associated with the leases acquired) of the differences between (i) the contractual amounts to be paid pursuant to the in-place leases and (ii) management’s estimate of fair market lease rates for the corresponding in-place leases, measured over a period equal to the remaining term of the lease. The capitalized above-market lease values and the capitalized below-market lease values are amortized as an adjustment to rental income over the lease term.
The aggregate value of in-place leases is determined by evaluating various factors, including an estimate of carrying costs during the expected lease-up periods, current market conditions and similar leases. In estimating carrying costs, management includes real estate taxes, insurance and other operating expenses, and estimates of lost rental revenue during the expected lease-up periods based on current market demand. Management also estimates costs to execute similar leases including leasing commissions, legal and other related costs. The value assigned to this intangible asset is amortized over the assumed lease up period.
Management reviews our investments in real estate for impairment whenever events or changes in circumstances indicate that the carrying amount of an asset may not be recoverable. The review of recoverability is based on an estimate of the future undiscounted cash flows (excluding interest charges) expected to result from the long-lived asset’s use and eventual disposition. These cash flows consider factors such as expected future operating income, trends and prospects, as well as the effects of leasing demand, competition and other factors. If impairment exists due to the inability to recover the carrying value of a long-lived asset, an impairment loss is recorded to the extent that the carrying value exceeds the estimated fair value of the property.
g. Revenue Recognition
|
|
1) |
Interest income—We recognize interest income from investments in commercial mortgages, mezzanine loans, and preferred equity interests on a yield to maturity basis. Many of our commercial mortgages and mezzanine loans provide for the accrual of interest at specified rates which differ from current payment terms. Interest income is recognized on such loans at the accrual rate subject to management’s determination that accrued interest and outstanding principal are ultimately collectible. Management will cease accruing interest on these loans when it determines that the interest income may not be collectible based on the ultimate value of the underlying collateral using discounted cash flow models and market based assumptions. Management will recognize interest on these loans on a cash basis. |
For investments that we did not elect to record at fair value under FASB ASC Topic 825, “Financial Instruments”, origination fees and direct loan origination costs are deferred and amortized to net investment income, using the effective interest method, over the contractual life of the underlying loan security or loan, in accordance with FASB ASC Topic 310, “Receivables.”
8
RAIT Financial Trust
Notes to Consolidated Financial Statements
As of September 30, 2015
(Unaudited and dollars in thousands, except share and per share amounts)
For investments that we elected to record at fair value under FASB ASC Topic 825, origination fees and direct loan costs are recorded in income and are not deferred.
We recognize interest income from interests in certain securitized financial assets on an estimated effective yield to maturity basis. Management estimates the current yield on the amortized cost of the investment based on estimated cash flows after considering prepayment and credit loss experience.
|
|
2) |
Rental income—We generate rental income from tenant rent and other tenant-related activities at our consolidated real estate properties. For multi-family real estate properties, rental income is recorded when due from residents and recognized monthly as it is earned and realizable, under lease terms which are generally for periods of one year or less. For retail and office real estate properties, rental income is recognized on a straight-line basis from the later of the date of the commencement of the lease or the date of acquisition of the property subject to existing leases, which averages minimum rents over the terms of the leases. For retail and office real estate properties, leases also typically provide for tenant reimbursement of a portion of common area maintenance and other operating expenses to the extent that a tenant’s pro rata share of expenses exceeds a base year level set in the lease. |
|
|
3) |
Fee and other income—We generate fee and other income through our various subsidiaries by (a) funding conduit loans for sale into unaffiliated commercial mortgage-backed securities, or CMBS, securitizations, (b) providing or arranging to provide financing to our borrowers, (c) providing ongoing asset management services to investment portfolios under cancelable management agreements, and (d) providing property management services to third parties. We recognize revenue for these activities when the fees are fixed or determinable, are evidenced by an arrangement, collection is reasonably assured and the services under the arrangement have been provided. While we may receive asset management fees when they are earned, we eliminate earned asset management fee income from securitizations while such securitizations are consolidated. |
h. Fair Value of Financial Instruments
In accordance with FASB ASC Topic 820, “Fair Value Measurements and Disclosures”, fair value is the price that would be received to sell an asset or paid to transfer a liability in an orderly transaction between market participants at the measurement date. Where available, fair value is based on observable market prices or parameters or derived from such prices or parameters. Where observable prices or inputs are not available, valuation models are applied. These valuation techniques involve management estimation and judgment, the degree of which is dependent on the price transparency for the instruments or market and the instruments’ complexity for disclosure purposes. Assets and liabilities recorded at fair value in the consolidated balance sheets are categorized based upon the level of judgment associated with the inputs used to measure their value. Hierarchical levels, as defined in FASB ASC Topic 820, “Fair Value Measurements and Disclosures” and directly related to the amount of subjectivity associated with the inputs to fair valuations of these assets and liabilities, are as follows:
|
|
• |
Level 1: Valuations are based on unadjusted, quoted prices in active markets for identical assets or liabilities at the measurement date. The types of assets carried at level 1 fair value generally are equity securities listed in active markets. As such, valuations of these investments do not entail a significant degree of judgment. |
|
|
• |
Level 2: Valuations are based on quoted prices for similar instruments in active markets or quoted prices for identical or similar instruments in markets that are not active or for which all significant inputs are observable, either directly or indirectly. |
Fair value assets and liabilities that are generally included in this category are unsecured REIT note receivables, commercial mortgage-backed securities, or CMBS, receivables and certain financial instruments classified as derivatives where the fair value is based primarily on observable market inputs.
|
|
• |
Level 3: Inputs are unobservable inputs for the asset or liability, and include situations where there is little, if any, market activity for the asset or liability. In certain cases, the inputs used to measure fair value may fall into different levels of the fair value hierarchy. In such cases, the level in the fair value hierarchy within which the fair value measurement in its entirety falls has been determined based on the lowest level input that is significant to the fair value measurement in its entirety. Our assessment of the significance of a particular input to the fair value measurement in its entirety requires judgment, and considers factors specific to the asset. Generally, assets and liabilities carried at fair value and included in this category were TruPS and subordinated debentures, trust preferred obligations and CDO notes payable where significant observable market inputs do not exist. |
9
RAIT Financial Trust
Notes to Consolidated Financial Statements
As of September 30, 2015
(Unaudited and dollars in thousands, except share and per share amounts)
The availability of observable inputs can vary depending on the financial asset or liability and is affected by a wide variety of factors, including, for example, the type of investment, whether the investment is new, whether the investment is traded on an active exchange or in the secondary market, and the current market condition. To the extent that valuation is based on models or inputs that are less observable or unobservable in the market, the determination of fair value requires more judgment. Accordingly, the degree of judgment exercised by us in determining fair value is greatest for instruments categorized in level 3.
Fair value is a market-based measure considered from the perspective of a market participant who holds the asset or owes the liability rather than an entity-specific measure. Therefore, even when market assumptions are not readily available, our own assumptions are set to reflect those that management believes market participants would use in pricing the asset or liability at the measurement date. We use prices and inputs that management believes are current as of the measurement
date, including during periods of market dislocation. In periods of market dislocation, the observability of prices and inputs may be reduced for many instruments. This condition could cause an instrument to be transferred from Level 1 to Level 2 or Level 2 to Level 3.
Many financial instruments have bid and ask prices that can be observed in the marketplace. Bid prices reflect the highest price that buyers in the market are willing to pay for an asset. Ask prices represent the lowest price that sellers in the market are willing to accept for an asset. For financial instruments whose inputs are based on bid-ask prices, we do not require that fair value always be a predetermined point in the bid-ask range. Our policy is to allow for mid-market pricing and adjusting to the point within the bid-ask range that results in our best estimate of fair value.
Fair value for certain of our Level 3 financial instruments is derived using internal valuation models. These internal valuation models include discounted cash flow analyses developed by management using current interest rates, estimates of the term of the particular instrument, specific issuer information and other market data for securities without an active market. In accordance with FASB ASC Topic 820, “Fair Value Measurements and Disclosures”, the impact of our own credit spreads is also considered when measuring the fair value of financial assets or liabilities, including derivative contracts. Where appropriate, valuation adjustments are made to account for various factors, including bid-ask spreads, credit quality and market liquidity. These adjustments are applied on a consistent basis and are based on observable inputs where available. Management’s estimate of fair value requires significant management judgment and is subject to a high degree of variability based upon market conditions, the availability of specific issuer information and management’s assumptions.
i. Deferred Financing Costs and Intangible Assets
Costs incurred in connection with debt financing are capitalized as deferred financing costs and charged to interest expense over the terms of the related debt agreements, under the effective interest method. Intangible assets on our consolidated balance sheets represent identifiable intangible assets acquired in business acquisitions. We amortize identified intangible assets to expense over their estimated lives using the straight-line method. We evaluate intangible assets for impairment as events and circumstances change, in accordance with FASB ASC Topic 360, “Property, Plant, and Equipment.” The gross carrying amount for our customer relationships was $19,149 as of September 30, 2015 and December 31, 2014. The gross carrying amount for our in-place leases, above market leases, and ground lease was $40,973 and $22,725 as of September 30, 2015 and December 31, 2014, respectively. The gross carrying amount for our trade name was $1,500 as of September 30, 2015 and December 31, 2014, respectively. The accumulated amortization for our intangible assets was $22,316 and $13,911 as of September 30, 2015 and December 31, 2014, respectively. We recorded amortization expense of $1,625 and $1,980 for the three-month periods ended September 30, 2015 and 2014, respectively, and $8,665 and $6,376 for the nine-month periods ended September 30, 2015 and 2014, respectively. Based on the intangible assets identified above, we expect to record amortization expense of intangible assets of $5,260 for the remainder of 2015, $9,033 for 2016, $3,859 for 2017, $3,190 for 2018, $3,015 for 2019 and $14,949 thereafter.
10
RAIT Financial Trust
Notes to Consolidated Financial Statements
As of September 30, 2015
(Unaudited and dollars in thousands, except share and per share amounts)
Goodwill on our consolidated balance sheet represented the amounts paid in excess of the fair value of the net assets acquired from business acquisitions accounted for under FASB ASC Topic 805, “Business Combinations.” Pursuant to FASB ASC Topic 350, “Intangibles-Goodwill and Other”, goodwill is not amortized to expense but rather is analyzed for impairment. We evaluate goodwill for impairment on an annual basis and as events and circumstances change, in accordance with FASB ASC Topic 350. As of September 30, 2015 and December 31, 2014, we have $8,757 and $11,014 of goodwill, respectively, that is included in Other Assets in the accompanying consolidated balance sheets. The change in goodwill is attributable to the correction discussed in the Basis of Presentation section within this Note above. As of September 30, 2015, we have determined that no triggering events occurred that would indicate an impairment on our goodwill.
k. Recent Accounting Pronouncements
On January 1, 2015, we adopted the accounting standard classified under FASB ASC Topic 205, “Presentation of Financial Statements”. This accounting standard amends existing guidance to change reporting requirements for discontinued operations by requiring the disposal of an entity to be reported in discontinued operations if the disposal represents a strategic shift that has or will have a major effect on an entity’s operations and financial results. This standard is effective for interim and annual reporting periods beginning on or after December 15, 2014. The adoption of this standard did not have a material effect on our consolidated financial statements.
In May 2014, the FASB issued an accounting standard classified under FASB ASC Topic 606, “Revenue from Contracts with Customers”. This accounting standard generally replaces existing guidance by requiring an entity to recognize the amount of revenue to which it expects to be entitled for the transfer of promised goods or services to customers. This standard is currently effective for annual reporting periods beginning after December 15, 2016. On July 9, 2015, the FASB affirmed its proposal to defer the effective date of this accounting standard by one year. Management is currently evaluating the impact that this standard may have on our consolidated financial statements.
In February 2015, the FASB issued an accounting standard classified under FASB ASC Topic 810, “Consolidation”. This accounting standard amends the consolidation analysis required under GAAP and requires management to reevaluate all previous consolidation conclusions. This standard considers limited partnerships as VIEs, unless the limited partners have either substantive kick-out or participating rights. The presumption that a general partner should consolidate a limited partnership has also been eliminated. The standard amends the effect that fees paid to a decision maker or service provider have on the consolidation analysis, as well as amends how variable interests held by a reporting entity’s related parties affect the consolidation conclusion. This standard also clarifies how to determine whether equity holders as a group have power over an entity. This standard is effective for interim and annual reporting periods beginning on or after December 15, 2015, with early adoption permitted. Management is currently evaluating the impact that this standard may have on our consolidated financial statements.
In April 2015, the FASB issued an accounting standard classified under FASB ASC Topic 835, “Interest”. This accounting standard amends existing guidance to change reporting requirements for debt issuance costs by requiring debt issuance costs to be presented on the balance sheet as a direct deduction from the debt liability. This standard is effective for interim and annual reporting periods beginning on or after December 15, 2015, with an early adoption permitted. Retrospective application to prior periods is required. Management does not expect that this accounting standard will have a significant impact on our consolidated financial statements.
In September 2015, the FASB issued an accounting standard classified under FASB ASC Topic 805, “Business Combinations”. This accounting standard amends existing guidance related to measurement period adjustments by requiring the adjustments to be recognized prospectively with disclosure of the impact of the adjustments had they been applied previously. This standard is effective for interim and annual reporting beginning after December 15, 2015, with early adoption permitted. As this standard only applies to measurement period adjustments that occur after the effective date, this standard is not expected to have a material impact on our consolidated financial statements.
11
RAIT Financial Trust
Notes to Consolidated Financial Statements
As of September 30, 2015
(Unaudited and dollars in thousands, except share and per share amounts)
Investments in Commercial Mortgages, Mezzanine Loans, and Preferred Equity Interests
The following table summarizes our investments in commercial mortgages, mezzanine loans, and preferred equity interests as of September 30, 2015:
|
|
|
Unpaid Principal Balance |
|
|
Unamortized (Discounts) Premiums |
|
|
Carrying Amount |
|
|
Number of Loans |
|
|
Weighted- Average Coupon (1) |
|
|
Range of Maturity Dates (3) |
|||||
|
Commercial Real Estate (CRE) |
|
|
|
|
|
|
|
|
|
|
|
|
|
|
|
|
|
|
|
|
|
|
|
Commercial mortgages (2) |
|
$ |
1,368,072 |
|
|
$ |
(14,436 |
) |
|
$ |
1,353,636 |
|
|
|
117 |
|
|
|
5.2 |
% |
|
Jan. 2016 to Jan. 2029 |
|
Mezzanine loans |
|
|
199,246 |
|
|
|
(1,005 |
) |
|
|
198,241 |
|
|
|
63 |
|
|
|
9.6 |
% |
|
Jul. 2015 to May 2025 |
|
Preferred equity interests |
|
|
37,362 |
|
|
|
(1 |
) |
|
|
37,361 |
|
|
|
9 |
|
|
|
6.3 |
% |
|
Feb. 2016 to Aug. 2033 |
|
Total CRE |
|
|
1,604,680 |
|
|
|
(15,442 |
) |
|
|
1,589,238 |
|
|
|
189 |
|
|
|
6.2 |
% |
|
|
|
Deferred fees, net |
|
|
(1,141 |
) |
|
|
|
|
|
|
(1,141 |
) |
|
|
|
|
|
|
|
|
|
|
|
Total |
|
$ |
1,603,539 |
|
|
$ |
(15,442 |
) |
|
$ |
1,588,097 |
|
|
|
|
|
|
|
|
|
|
|
|
(1) |
Weighted-average coupon is calculated on the unpaid principal balance, which does not necessarily correspond to the carrying amount. |
|
(2) |
Commercial mortgages includes six conduit loans with an unpaid principal balance and carrying amount of $62,986 a weighted-average coupon of 4.8% and maturity dates ranging from August 2020 through October 2025. These commercial mortgages are accounted for as loans held for sale. |
|
(3) |
Two mezzanine loans that are 90 days or more past due have a contractual maturity date of July 2015. |
The following table summarizes our investments in commercial mortgages, mezzanine loans, other loans and preferred equity interests as of December 31, 2014:
|
|
|
Unpaid Principal Balance |
|
|
Unamortized (Discounts) Premiums |
|
|
Carrying Amount |
|
|
Number of Loans |
|
|
Weighted- Average Coupon (1) |
|
|
Range of Maturity Dates |
|||||
|
Commercial Real Estate (CRE) |
|
|
|
|
|
|
|
|
|
|
|
|
|
|
|
|
|
|
|
|
|
|
|
Commercial mortgages (2) |
|
$ |
1,148,290 |
|
|
$ |
(14,519 |
) |
|
$ |
1,133,771 |
|
|
|
95 |
|
|
|
5.9 |
% |
|
Jan. 2015 to Jan. 2025 |
|
Mezzanine loans |
|
|
226,105 |
|
|
|
(1,602 |
) |
|
|
224,503 |
|
|
|
74 |
|
|
|
9.8 |
% |
|
Mar. 2015 to Jan. 2029 |
|
Preferred equity interests |
|
|
34,859 |
|
|
|
(1 |
) |
|
|
34,858 |
|
|
|
9 |
|
|
|
7.1 |
% |
|
Feb. 2016 to Aug. 2025 |
|
Total CRE |
|
|
1,409,254 |
|
|
|
(16,122 |
) |
|
|
1,393,132 |
|
|
|
178 |
|
|
|
6.5 |
% |
|
|
|
Deferred fees, net |
|
|
(696 |
) |
|
|
— |
|
|
|
(696 |
) |
|
|
|
|
|
|
|
|
|
|
|
Total |
|
$ |
1,408,558 |
|
|
$ |
(16,122 |
) |
|
$ |
1,392,436 |
|
|
|
|
|
|
|
|
|
|
|
|
(1) |
Weighted-average coupon is calculated on the unpaid principal amount of the underlying instruments, which does not necessarily correspond to the carrying amount. |
|
(2) |
Commercial mortgages includes 11 conduit loans with an unpaid principal balance and carrying amount of $93,925, a weighted-average coupon of 4.6% and maturity dates ranging from November 2019 through January 2025. These commercial mortgages are accounted for as loans held for sale. |
During the nine-month period ended September 30, 2015, we did not convert any commercial real estate loans to owned real estate property. During the nine-month period ended September 30, 2014, we completed the conversion of one commercial real estate loan with a carrying value of $28,588 to real estate owned property and we recorded a gain on asset of $112 as the value of the real estate exceeded the carrying amount of the converted loan. During the nine-month period ended September 30, 2014, we removed a loan with an unpaid principal balance of $5,500 from non-accrual status.
12
RAIT Financial Trust
Notes to Consolidated Financial Statements
As of September 30, 2015
(Unaudited and dollars in thousands, except share and per share amounts)
The following table summarizes the delinquency statistics of our commercial real estate loans as of September 30, 2015 and December 31, 2014:
|
|
|
As of September 30, 2015 |
|
|||||||||||||||||||||||||
|
Delinquency Status |
|
Current |
|
|
30 to 59 days |
|
|
60 to 89 days |
|
|
90 days or more |
|
|
In foreclosure or bankruptcy proceedings |
|
|
Total |
|
|
Non-accrual (a) |
|
|||||||
|
Commercial mortgages |
|
$ |
1,368,072 |
|
|
$ |
— |
|
|
$ |
— |
|
|
$ |
— |
|
|
$ |
— |
|
|
$ |
1,368,072 |
|
|
$ |
15,645 |
|
|
Mezzanine loans |
|
|
196,835 |
|
|
|
— |
|
|
|
— |
|
|
|
1,163 |
|
|
|
1,248 |
|
|
|
199,246 |
|
|
|
21,201 |
|
|
Preferred equity interests |
|
|
33,712 |
|
|
|
— |
|
|
|
— |
|
|
|
3,650 |
|
|
|
— |
|
|
|
37,362 |
|
|
|
3,650 |
|
|
Total |
|
$ |
1,598,619 |
|
|
$ |
— |
|
|
$ |
— |
|
|
$ |
4,813 |
|
|
$ |
1,248 |
|
|
$ |
1,604,680 |
|
|
$ |
40,496 |
|
|
|
|
|
|
|
|
|
|
|
|
|
|
|
|
|
|
|
|
|
|
|
|
|
|
|
|
|
|
|
|
a) Includes four loans that are current in accordance with their terms, however are impaired, and as a result are on non-accrual due to uncertainty over full collection of principal and interest. |
|
|||||||||||||||||||||||||||
|
|
|
As of December 31, 2014 |
|
|||||||||||||||||||||||||
|
Delinquency Status |
|
Current |
|
|
30 to 59 days |
|
|
60 to 89 days |
|
|
90 days or more (a) |
|
|
In foreclosure or bankruptcy proceedings (b) |
|
|
Total |
|
|
Non-Accrual |
|
|||||||
|
Commercial mortgages |
|
$ |
1,148,290 |
|
|
$ |
— |
|
|
$ |
— |
|
|
$ |
— |
|
|
$ |
— |
|
|
$ |
1,148,290 |
|
|
$ |
— |
|
|
Mezzanine loans |
|
|
202,919 |
|
|
|
— |
|
|
|
1,555 |
|
|
|
19,953 |
|
|
|
1,678 |
|
|
|
226,105 |
|
|
|
21,631 |
|
|
Preferred equity interests |
|
|
31,209 |
|
|
|
— |
|
|
|
— |
|
|
|
3,650 |
|
|
|
— |
|
|
|
34,859 |
|
|
|
3,650 |
|
|
Total |
|
$ |
1,382,418 |
|
|
$ |
— |
|
|
$ |
1,555 |
|
|
$ |
23,603 |
|
|
$ |
1,678 |
|
|
$ |
1,409,254 |
|
|
$ |
25,281 |
|
|
|
|
|
|
|
|
|
|
|
|
|
|
|
|
|
|
|
|
|
|
|
|
|
|
|
|
|
|
|
|
(a) Includes three loans that were current in accordance with their terms, however were 90 days or more delinquent prior to troubled debt restructurings. These loans were on non-accrual due to uncertainty over full collection of principal and interest. |
|
|||||||||||||||||||||||||||
|
(b) These loans were on non-accrual due to uncertainty over full collection of principal and interest. |
|
|||||||||||||||||||||||||||
As of September 30, 2015 and December 31, 2014, all of our commercial mortgages, mezzanine loans and preferred equity interests that were 90 days or more past due or in foreclosure were on non-accrual status. As of September 30, 2015 and December 31, 2014, $40,496 and $25,281, respectively, of our commercial real estate loans that were on non-accrual status and had a weighted-average interest rate of 6.3% and 5.8%, respectively. Also, as of September 30, 2015, two loans, with a recorded investment of $68,701 and a weighted average interest rate of 9.0%, were recognizing interest on the cash basis. Additionally, as of September 30, 2015, one loan, with an unpaid principal balance of $18,500, which had previously been restructured in a troubled debt restructuring, does not accrue interest in accordance with its restructured terms as it has the option to be prepaid at par.
13
RAIT Financial Trust
Notes to Consolidated Financial Statements
As of September 30, 2015
(Unaudited and dollars in thousands, except share and per share amounts)
Allowance For Loan Losses And Impaired Loans
We closely monitor our loans which require evaluation for loan loss in two categories: satisfactory and watchlist/impaired. Loans classified as impaired are generally loans which have credit weaknesses or whose credit quality has temporarily deteriorated or have been restructured in troubled debt restructuring. As of September 30, 2015 and December 31, 2014 we have classified our investment in loans by credit risk category as follows:
|
|
|
As of September 30, 2015 |
|
|||||||||||||
|
Credit Status |
|
Commercial Mortgages |
|
|
Mezzanine Loans |
|
|
Preferred Equity |
|
|
Total |
|
||||
|
Satisfactory |
|
$ |
1,352,427 |
|
|
$ |
156,545 |
|
|
$ |
29,416 |
|
|
$ |
1,538,388 |
|
|
Watchlist / Impaired |
|
|
15,645 |
|
|
|
42,701 |
|
|
|
7,946 |
|
|
|
66,292 |
|
|
Total |
|
$ |
1,368,072 |
|
|
$ |
199,246 |
|
|
$ |
37,362 |
|
|
$ |
1,604,680 |
|
|
|
|
As of December 31, 2014 |
|
|||||||||||||
|
Credit Status |
|
Commercial Mortgages |
|
|
Mezzanine Loans |
|
|
Preferred Equity |
|
|
Total |
|
||||
|
Satisfactory |
|
$ |
1,125,370 |
|
|
$ |
175,915 |
|
|
$ |
26,849 |
|
|
$ |
1,328,134 |
|
|
Watchlist / Impaired |
|
|
22,920 |
|
|
|
50,190 |
|
|
|
8,010 |
|
|
|
81,120 |
|
|
Total |
|
$ |
1,148,290 |
|
|
$ |
226,105 |
|
|
$ |
34,859 |
|
|
$ |
1,409,254 |
|
The following tables provide roll-forwards of our allowance for loan losses for our commercial mortgages, mezzanine loans and preferred equity interests for the three-month periods ended September 30, 2015 and 2014:
|
|
|
For the Three-Month Period Ended September 30, 2015 |
|
|||||||||||||
|
|
|
Commercial Mortgages |
|
|
Mezzanine Loans |
|
|
Preferred Equity |
|
|
Total |
|
||||
|
Beginning balance |
|
$ |
— |
|
|
$ |
11,470 |
|
|
$ |
1,326 |
|
|
$ |
12,796 |
|
|
Provision for loan losses |
|
|
3,154 |
|
|
|
(1,255 |
) |
|
|
(49 |
) |
|
|
1,850 |
|
|
Charge-offs, net of recoveries |
|
|
— |
|
|
|
— |
|
|
|
— |
|
|
|
— |
|
|
Ending balance |
|
$ |
3,154 |
|
|
$ |
10,215 |
|
|
$ |
1,277 |
|
|
$ |
14,646 |
|
|
|
|
For the Three-Month Period Ended September 30, 2014 |
|
|||||||||||||
|
|
|
Commercial Mortgages |
|
|
Mezzanine Loans |
|
|
Preferred Equity |
|
|
Total |
|
||||
|
Beginning balance |
|
$ |
— |
|
|
$ |
14,017 |
|
|
$ |
1,319 |
|
|
$ |
15,336 |
|
|
Provision for loan losses |
|
|
— |
|
|
|
1,132 |
|
|
|
368 |
|
|
|
1,500 |
|
|
Charge-offs, net of recoveries |
|
|
— |
|
|
|
(813 |
) |
|
|
(361 |
) |
|
|
(1,174 |
) |
|
Ending balance |
|
$ |
— |
|
|
$ |
14,336 |
|
|
$ |
1,326 |
|
|
$ |
15,662 |
|
14
RAIT Financial Trust
Notes to Consolidated Financial Statements
As of September 30, 2015
(Unaudited and dollars in thousands, except share and per share amounts)
The following tables provide roll-forwards of our allowance for loan losses for our commercial mortgages, mezzanine loans and preferred equity interests for the nine-month periods ended September 30, 2015 and 2014:
|
|
|
For the Nine-Month Period Ended September 30, 2015 |
|
|||||||||||||
|
|
|
Commercial Mortgages |
|
|
Mezzanine Loans |
|
|
Preferred Equity |
|
|
Total |
|
||||
|
Beginning balance |
|
$ |
— |
|
|
$ |
7,892 |
|
|
$ |
1,326 |
|
|
$ |
9,218 |
|
|
Provision for loan losses |
|
|
3,154 |
|
|
|
2,745 |
|
|
|
(49 |
) |
|
|
5,850 |
|
|
Charge-offs, net of recoveries |
|
|
— |
|
|
|
(422 |
) |
|
|
— |
|
|
|
(422 |
) |
|
Ending balance |
|
$ |
3,154 |
|
|
$ |
10,215 |
|
|
$ |
1,277 |
|
|
$ |
14,646 |
|
|
|
|
For the Nine-Month Period Ended September 30, 2014 |
|
|||||||||||||
|
|
|
Commercial Mortgages |
|
|
Mezzanine Loans |
|
|
Preferred Equity |
|
|
Total |
|
||||
|
Beginning balance |
|
$ |
— |
|
|
$ |
21,636 |
|
|
$ |
1,319 |
|
|
$ |
22,955 |
|
|
Provision for loan losses |
|
|
— |
|
|
|
3,132 |
|
|
|
368 |
|
|
|
3,500 |
|
|
Charge-offs, net of recoveries |
|
|
— |
|
|
|
(10,432 |
) |
|
|
(361 |
) |
|
|
(10,793 |
) |
|
Ending balance |
|
$ |
— |
|
|
$ |
14,336 |
|
|
$ |
1,326 |
|
|
$ |
15,662 |
|
Information related to those loans on our watchlist or considered to be impaired was as follows:
|
|
|
As of September 30, 2015 |
|
|||||||||||||
|
Watchlist/Impaired Loans |
|
Commercial Mortgages |
|
|
Mezzanine Loans |
|
|
Preferred Equity |
|
|
Total |
|
||||
|
Watchlist/Impaired loans expecting full recovery |
|
$ |
— |
|
|
$ |
14,000 |
|
|
$ |
4,296 |
|
|
$ |
18,296 |
|
|
Watchlist/Impaired loans with reserves |
|
|
15,645 |
|
|
|
28,701 |
|
|
|
3,650 |
|
|
|
47,996 |
|
|
Total Watchlist/Impaired Loans |
|
$ |
15,645 |
|
|
$ |
42,701 |
|
|
$ |
7,946 |
|
|
$ |
66,292 |
|
|
Allowance for losses |
|
$ |
3,154 |
|
|
$ |
10,215 |
|
|
$ |
1,277 |
|
|
$ |
14,646 |
|
|
|
|
As of December 31, 2014 |
|
|||||||||||||
|
Watchlist/Impaired Loans |
|
Commercial Mortgages |
|
|
Mezzanine Loans |
|
|
Preferred Equity |
|
|
Total |
|
||||
|
Watchlist/Impaired loans expecting full recovery |
|
$ |
22,920 |
|
|
$ |
40,559 |
|
|
$ |
4,360 |
|
|
$ |
67,839 |
|
|
Watchlist/Impaired loans with reserves |
|
|
— |
|
|
|
9,631 |
|
|
|
3,650 |
|
|
|
13,281 |
|
|
Total Watchlist/Impaired Loans (1) |
|
$ |
22,920 |
|
|
$ |
50,190 |
|
|
$ |
8,010 |
|
|
$ |
81,120 |
|
|
Allowance for losses |
|
$ |
— |
|
|
$ |
7,892 |
|
|
$ |
1,326 |
|
|
$ |
9,218 |
|
|
(1) |
As of December 31, 2014, this includes $5,500 of unpaid principal relating to previously identified TDRs that are on accrual status. |
The average unpaid principal balance and recorded investment of total impaired loans was $78,680 and $69,489 during the three-month periods ended September 30, 2015 and 2014, respectively, and $66,053 and $62,448 during the nine-month periods ended September 30, 2015 and 2014, respectively. We recorded interest income of $1,129 and $53 on loans that were impaired for the three-month periods ended September 30, 2015 and 2014, respectively. We recorded interest income of $2,882 and $938 on loans that were impaired for the nine-month periods ended September 30, 2015 and 2014, respectively.
We have evaluated restructurings of our commercial real estate loans to determine if the restructuring constitutes a troubled debt restructuring (TDR) under FASB ASC Topic 310, “Receivables”. During the nine-month period ended September 30, 2015, there were no restructurings of our commercial real estate loans that constituted a TDR. As of September 30, 2015, there were no TDRs that subsequently defaulted for restructurings that occurred within the previous 12 months.
15
RAIT Financial Trust
Notes to Consolidated Financial Statements
As of September 30, 2015
(Unaudited and dollars in thousands, except share and per share amounts)
Loan-to-Real Estate Conversion
In October 2015, we completed the conversion of one mezzanine loan with a carrying value of $13,462 to real estate owned property. The conversion will result in approximately $96,801 of real estate-related assets and $83,056 of debt being reflected on our consolidated balance sheets. We do not expect to record a gain or a loss upon the conversion.
NOTE 4: INVESTMENTS IN SECURITIES
Our investments in securities and security-related receivables are accounted for at fair value. On December 19, 2014, our subsidiary assigned or delegated its rights and responsibilities as collateral manager for the T8 and T9 securitizations, as referenced in our Annual Report on Form 10-K for the year ended December 31, 2014. As a result of the assignment and delegation, we determined that we are no longer the primary beneficiary of T8 and T9 and deconsolidated the two securitizations. During the first quarter of 2015, we sold all of our remaining securities with an aggregate fair value of $31,412 and we had no investments in securities as of September 30, 2015.
The following table summarizes our investments in securities as of December 31, 2014:
|
Investment Description |
|
Amortized Cost |
|
|
Gross Unrealized Gains |
|
|
Gross Unrealized Losses |
|
|
Estimated Fair Value |
|
|
Weighted Average Coupon (1) |
|
|
Weighted Average Years to Maturity |
|
||||||
|
Available-for-sale securities (2) |
|
$ |
210,600 |
|
|
$ |
2,053 |
|
|
$ |
(193,486 |
) |
|
$ |
19,167 |
|
|
|
3.5 |
% |
|
|
23.1 |
|
|
Security-related receivables |
|
|
|
|
|
|
|
|
|
|
|
|
|
|
|
|
|
|
|
|
|
|
|
|
|
Unsecured REIT note receivables |
|
|
10,000 |
|
|
|
995 |
|
|
|
0 |
|
|
|
10,995 |
|
|
|
6.7 |
% |
|
|
3.0 |
|
|
CMBS receivables (3) |
|
|
5,000 |
|
|
|
— |
|
|
|
(3,750 |
) |
|
|
1,250 |
|
|
|
5.7 |
% |
|
|
34.5 |
|
|
Total security-related receivables |
|
|
15,000 |
|
|
|
995 |
|
|
|
(3,750 |
) |
|
|
12,245 |
|
|
|
6.3 |
% |
|
|
13.5 |
|
|
Total investments in securities |
|
$ |
225,600 |
|
|
$ |
3,048 |
|
|
$ |
(197,236 |
) |
|
$ |
31,412 |
|
|
|
3.6 |
% |
|
|
22.7 |
|
|
(1) |
Weighted-average coupon is calculated on the unpaid principal amount of the underlying instruments, which does not necessarily correspond to the carrying amount. |
|
(2) |
As of December 31, 2014, this includes available-for-sale securities that are accounted for under the fair value option other than an available-for-sale security that has an amortized cost of $3,600 and a carrying value of $3,606. |
|
(3) |
CMBS receivables include securities with a fair value totaling $1,250 that are rated “D” by Standard & Poor’s. |
The following table summarizes the non-accrual status of our investments in securities:
|
|
|
As of December 31, 2014 |
|
|||||||||
|
|
|
Principal /Par Amount on Non- Accrual |
|
|
Weighted Average Coupon |
|
|
Fair Value |
|
|||
|
Other securities |
|
$ |
210,600 |
|
|
|
3.5 |
% |
|
$ |
17,120 |
|
|
CMBS receivables |
|
|
5,000 |
|
|
|
5.7 |
% |
|
|
1,250 |
|
The assets of our consolidated CDOs collateralize the debt of such entities and are not available to our creditors. As of December 31, 2014, investment in securities of $0 in principal amount of TruPS and subordinated debentures, and $10,000 in principal amount of unsecured REIT note receivables and CMBS receivables, collateralized the consolidated CDO notes payable of such entities.
16
RAIT Financial Trust
Notes to Consolidated Financial Statements
As of September 30, 2015
(Unaudited and dollars in thousands, except share and per share amounts)
NOTE 5: INVESTMENTS IN REAL ESTATE
The table below summarizes our investments in real estate:
|
|
|
Book Value |
|
|||||
|
|
|
As of September 30, 2015 |
|
|
As of December 31, 2014 |
|
||
|
Multi-family real estate properties (a) |
|
$ |
1,907,717 |
|
|
$ |
1,286,898 |
|
|
Office real estate properties |
|
|
356,149 |
|
|
|
370,114 |
|
|
Retail real estate properties |
|
|
133,911 |
|
|
|
132,117 |
|
|
Parcels of land |
|
|
50,554 |
|
|
|
51,322 |
|
|
Subtotal |
|
|
2,448,331 |
|
|
|
1,840,451 |
|
|
Less: Accumulated depreciation and amortization (a) |
|
|
(188,581 |
) |
|
|
(168,480 |
) |
|
Investments in real estate (b) |
|
$ |
2,259,750 |
|
|
$ |
1,671,971 |
|
|
(a) |
As of September 30, 2015, includes properties owned by Independence Realty Trust, Inc., or IRT, with a book value of $1,400,892 and accumulated depreciation of $35,304. As of December 31, 2014, includes properties owned by IRT, with a book value of $689,112 and accumulated depreciation of $23,376. |
|
(b) |
Investments in real estate includes one real estate asset held for sale by IRT as of September 30, 2015. This asset had a carrying amount of $3,283 and a fair value of $3,350. |
As of September 30, 2015 and December 31, 2014, our investments in real estate were comprised of land of $404,565 and $338,057, respectively, and investments in real estate and improvements of $2,043,766 and $1,502,394, respectively.
As of September 30, 2015, our investments in real estate of $2,259,750 were financed through $799,436 of mortgages or other debt held by third parties and $831,554 of mortgages held by our RAIT I and RAIT II CDO securitizations. As of December 31, 2014, our investments in real estate of $1,671,971 were financed through $641,874 of mortgages held by third parties and $878,856 of mortgages held by our RAIT I and RAIT II CDO securitizations. Together, along with commercial real estate loans held by RAIT I and RAIT II, these mortgages serve as collateral for the CDO notes payable issued by the RAIT I and RAIT II CDO securitizations. All intercompany balances and interest charges are eliminated in consolidation.
Acquisitions:
On September 17, 2015, Independence Realty Trust, Inc., or IRT, which we consolidate, completed the mergers, or the TSRE merger, with Trade Street Residential, Inc., or TSRE, whereby IRT acquired TSRE. Pursuant to the TSRE merger, (i) a subsidiary of IRT’s operating partnership, or IROP, merged into the operating partnership subsidiary of TSRE, or the TSR OP, with TSR OP continuing as the surviving entity, and (ii) TSRE merged with IRT’s subsidiary, with IRT’s subsidiary continuing as the surviving entity and a wholly-owned subsidiary of IRT. As a result of the TSRE merger, each outstanding share of common stock of TSRE was converted automatically into the right to receive (a) $3.80 in cash and (b) 0.4108 shares of common stock of IRT, plus cash in lieu of fractional shares. As a result, IRT issued approximately 15.1 million shares of common stock as equity consideration in the TSRE merger. Immediately prior to the TSRE merger, the third party holder of units of limited partnership interest of TSR OP, or TSR OP units, contributed all of its TSR OP units to IROP in exchange for 1,925,419 units of limited partnership interest of IROP, or IROP Units, plus cash in lieu of fractional IROP Units.
17
RAIT Financial Trust
Notes to Consolidated Financial Statements
As of September 30, 2015
(Unaudited and dollars in thousands, except share and per share amounts)
As a result of the TSRE merger, IRT acquired 19 multi-family properties. The fair value of the assets and liabilities that IRT acquired on September 17, 2015 was as follows:
|
Cash assumed |
$ |
2,685 |
|
|
Investments in real estate |
|
682,237 |
|
|
Accounts receivable and other assets |
|
6,123 |
|
|
Intangible assets |
|
7,471 |
|
|
Indebtedness |
|
(359,495 |
) |
|
Accounts payable and accrued expenses |
|
(7,581 |
) |
|
Accrued interest payable |
|
(130 |
) |
|
Other liabilities |
|
(3,662 |
) |
|
Total |
$ |
327,648 |
|
The fair value of the consideration that IRT transferred on September 17, 2015 was as follows:
|
Cash consideration for TSRE merger |
$ |
139,781 |
|
|
Equity consideration for TSRE merger |
|
123,855 |
|
|
Total |
$ |
263,636 |
|
As the fair value of the net assets acquired exceeded the fair value of the consideration transferred, IRT recognized a gain from a bargain purchase of $64,012. In determining whether a gain from a bargain purchase was appropriate, IRT reassessed whether it correctly identified all of the assets acquired and all of the liabilities assumed from TSRE.
The TSRE merger resulted in a gain as a result of the following: (i) the fair value of IRT’s common stock at closing was lower than the negotiated price set forth in the merger agreement relating to the TSRE merger (resulting in approximately $34 million of the gain), and (ii), the fair value of the 19 TSRE properties acquired, which was supported by appraisals and broker opinions of value received, was higher than the expectations that served as a basis for the negotiated purchase price (resulting in approximately $30 million of the gain, primarily due to the use of current, market-based capitalization rates).
The $359,495 of indebtedness acquired was comprised of $237,610 of indebtedness that IRT paid off immediately after the closing of the TSRE merger and $121,885 of indebtedness that remained on IRT’s balance sheet, which was recognized at fair value.
As part of the TSRE merger, IRT incurred $12,530 of acquisition expenses, which were recognized in earnings immediately. IRT also incurred $23,219 of expenses associated with extinguishing financing arrangements and $4,289 of expenses associated with employee separation.
18
RAIT Financial Trust
Notes to Consolidated Financial Statements
As of September 30, 2015
(Unaudited and dollars in thousands, except share and per share amounts)
The initial purchase accounting is based on IRT’s preliminary assessment, which may differ when final information becomes available. IRT believes that the information gathered to date provides a reasonable basis for estimating the fair values of assets acquired and liabilities assumed. IRT has received appraisals for all of the properties acquired and has performed fair value analyses for the liabilities assumed. IRT expects to complete the purchase accounting process as soon as practicable, but no later than one year from the date of acquisition.
On May 1, 2015, IRT acquired a 236-unit (unaudited) apartment residential community located in Indianapolis, Indiana. IRT acquired the property for an aggregate purchase price of $25,250 exclusive of closing costs. Upon acquisition, IRT recorded the investment in real estate, including any related working capital and intangible assets, at fair value of $25,250 and did not record a gain.
The following table summarizes the aggregate estimated fair value of the assets and liabilities associated with the 20 properties acquired during the nine-month period ended September 30, 2015 on the date of acquisition, which is accounted for under FASB ASC Topic 805.
|
Description |
|
Fair Value of Assets Acquired During the Nine-Month Period Ended September 30, 2015 |
|
|
|
Assets acquired: |
|
|
|
|
|
Investments in real estate |
|
$ |
707,268 |
|
|
Cash and cash equivalents |
|
|
2,685 |
|
|
Accounts receivable and other assets |
|
|
6,210 |
|
|
Intangible assets |
|
|
7,690 |
|
|
Total assets acquired |
|
$ |
723,853 |
|
|
Liabilities assumed: |
|
|
|
|
|
Indebtedness |
|
$ |
359,495 |
|
|
Accounts payable and accrued expenses |
|
|
8,069 |
|
|
Accrued interest payable |
|
|
130 |
|
|
Other liabilities |
|
|
3,764 |
|
|
Total liabilities assumed |
|
$ |
371,458 |
|
|
Estimated fair value of net assets acquired |
|
$ |
352,395 |
|
The following table summarizes the consideration transferred to acquire the previously mentioned real estate properties:
|
Description |
Estimated Fair Value |
|
|
|
Fair value of consideration transferred: |
|
|
|
|
Cash consideration for TSRE merger |
$ |
139,781 |
|
|
Equity consideration for TSRE merger |
|
123,855 |
|
|
Cash consideration for other property acquisitions |
|
24,746 |
|
|
Total |
$ |
288,382 |
|
During the nine-month period ended September 30, 2015, these investments contributed revenue of $3,811 and a net income allocable to common shares of $1,696.
19
RAIT Financial Trust
Notes to Consolidated Financial Statements
As of September 30, 2015
(Unaudited and dollars in thousands, except share and per share amounts)
The tables below present the revenue, net income and earnings per share effect of the acquired properties, as reported in our consolidated financial statements and on a pro forma basis as if the acquisitions occurred on January 1, 2014. These pro forma results are not necessarily indicative of the results which actually would have occurred if the acquisition had occurred on the first day of the periods presented, nor does the pro forma financial information purport to represent the results of operations for future periods.
|
Description |
|
For the ThreeMonth Period Ended September 30, 2015 |
|
|
For the ThreeMonth Period Ended September 30, 2014 |
|
||
|
Total revenue of real estate properties acquired, as reported |
|
$ |
3,214 |
|
|
$ |
0 |
|
|
Net income (loss) allocable to common shares of real estate properties acquired, as reported |
|
|
1,456 |
|
|
|
0 |
|
|
Earnings (loss) per share attributable to common shareholders of real estate properties acquired |
|
|
|
|
|
|
|
|
|
Basic and diluted—as reported |
|
|
0.02 |
|
|
|
0.00 |
|
|
Pro forma revenue of real estate property acquired (unaudited) |
|
|
16,735 |
|
|
|
15,033 |
|
|
Pro forma net income (loss) allocable to common shares of real estate property acquired (unaudited) |
|
|
4,794 |
|
|
|
2,980 |
|
|
Basic—as pro forma |
|
|
0.06 |
|
|
|
0.04 |
|
|
Diluted—as pro forma |
|
|
0.05 |
|
|
|
0.04 |
|
|
Description |
|
For the NineMonth Period Ended September 30, 2015 |
|
|
For the NineMonth Period Ended September 30, 2014 |
|
||
|
Total revenue of real estate properties acquired, as reported |
|
$ |
3,811 |
|
|
$ |
0 |
|
|
Net income (loss) allocable to common shares of real estate properties acquired, as reported |
|
|
1,696 |
|
|
|
0 |
|
|
Earnings (loss) per share attributable to common shareholders of real estate properties acquired |
|
|
|
|
|
|
|
|
|
Basic and diluted—as reported |
|
|
0.02 |
|
|
|
0.00 |
|
|
Pro forma revenue of real estate property acquired (unaudited) |
|
|
50,653 |
|
|
|
45,098 |
|
|
Pro forma net income (loss) allocable to common shares of real estate property acquired (unaudited) |
|
|
13,366 |
|
|
|
8,939 |
|
|
Basic and diluted—as pro forma |
|
|
0.16 |
|
|
|
0.11 |
|
During the nine-month period ended September 30, 2015, we updated our allocation for a real estate acquisition from a prior period. This resulted in $5,662 being allocated between buildings (decrease) and intangible assets (increase). The cumulative catch up effect of the allocation (based on the different useful lives) was an increase to net income of $72.
Dispositions:
During the nine-month period ended September 30, 2015, we disposed of three multi-family real estate properties and two parcels of land for a total sale price of $88,537. We recorded a gain on the sale of these assets of $24,711, which is included in the accompanying consolidated statements of operations during the nine-month period ended September 30, 2015, and deferred a gain on the sale for one of these assets of $3,111 which is classified within other liabilities and will be recognized under the installment method as the buyer’s initial investment was insufficient.
During the nine-month period ended September 30, 2015, we deconsolidated one multi-family real estate property with a total carrying value of $23,897 as we agreed to amend our consent rights in the related limited partnership agreement. We did not record a gain or loss on the deconsolidation of this property.
20
RAIT Financial Trust
Notes to Consolidated Financial Statements
As of September 30, 2015
(Unaudited and dollars in thousands, except share and per share amounts)
During the three-month period ended September 30, 2015, we recognized an impairment of a real estate asset of $7,250 as it was more likely than not we would dispose of the asset before the end of its previously estimated useful life and a portion of our recorded investment in that asset was determined to not be recoverable.
NOTE 6: INDEBTEDNESS
We maintain various forms of short-term and long-term financing arrangements. Generally, these financing agreements are collateralized by assets within securitizations.
The following table summarizes our total recourse and non-recourse indebtedness as of September 30, 2015:
|
Description |
|
Unpaid Principal Balance |
|
|
Carrying Amount |
|
|
Weighted- Average Interest Rate |
|
|
Contractual Maturity |
|||
|
Recourse indebtedness: |
|
|
|
|
|
|
|
|
|
|
|
|
|
|
|
7.0% convertible senior notes (1) |
|
$ |
34,066 |
|
|
$ |
33,784 |
|
|
|
7.0 |
% |
|
Apr. 2031 |
|
4.0% convertible senior notes (2) |
|
|
141,750 |
|
|
|
136,418 |
|
|
|
4.0 |
% |
|
Oct. 2033 |
|
7.625% senior notes |
|
|
60,000 |
|
|
|
60,000 |
|
|
|
7.6 |
% |
|
Apr. 2024 |
|
7.125% senior notes |
|
|
71,905 |
|
|
|
71,905 |
|
|
|
7.1 |
% |
|
Aug. 2019 |
|
Senior secured notes |
|
|
72,000 |
|
|
|
64,354 |
|
|
|
7.0 |
% |
|
Apr. 2017 to Apr. 2019 |
|
Junior subordinated notes, at fair value (3) |
|
|
18,671 |
|
|
|
11,193 |
|
|
|
4.3 |
% |
|
Mar. 2035 |
|
Junior subordinated notes, at amortized cost |
|
|
25,100 |
|
|
|
25,100 |
|
|
|
2.8 |
% |
|
Apr. 2037 |
|
CMBS facilities |
|
|
184,198 |
|
|
|
184,198 |
|
|
|
1.7 |
% |
|
Nov. 2015 to Jul. 2016 |
|
Total recourse indebtedness |
|
|
607,690 |
|
|
|
586,952 |
|
|
|
4.1 |
% |
|
|
|
Non-recourse indebtedness: |
|
|
|
|
|
|
|
|
|
|
|
|
|
|
|
Secured credit facilities (8) |
|
|
271,500 |
|
|
|
271,500 |
|
|
|
2.6 |
% |
|
September 2018 |
|
Term Loans (9) |
|
|
120,000 |
|
|
|
120,000 |
|
|
|
5.2 |
% |
|
September 2016 |
|
CDO notes payable, at amortized cost (4)(5) |
|
|
921,305 |
|
|
|
920,691 |
|
|
|
0.6 |
% |
|
2045 to 2046 |
|
CMBS securitizations (6) |
|
|
501,044 |
|
|
|
500,790 |
|
|
|
1.9 |
% |
|
May 2031 to December 2031 |
|
Loans payable on real estate (7) |
|
|
799,436 |
|
|
|
800,048 |
|
|
|
4.4 |
% |
|
Apr. 2016 to May 2040 |
|
Total non-recourse indebtedness |
|
|
2,613,285 |
|
|
|
2,613,029 |
|
|
|
2.30 |
% |
|
|
|
Total indebtedness |
|
$ |
3,220,975 |
|
|
$ |
3,199,981 |
|
|
|
2.80 |
% |
|
|
|
(1) |
Our 7.0% convertible senior notes are redeemable at par, at the option of the holder, in April 2016, April 2021, and April 2026. |
|
(2) |
Our 4.0% convertible senior notes are redeemable at par, at the option of the holder, in October 2018, October 2023, and October 2028. |
|
(3) |
Relates to liabilities which we elected to record at fair value under FASB ASC Topic 825. |
|
(4) |
Excludes CDO notes payable purchased by us which are eliminated in consolidation. |
|
(5) |
Collateralized by $1,431,232 principal amount of commercial mortgages, mezzanine loans, other loans and preferred equity interests. These obligations were issued by separate legal entities and consequently the assets of the special purpose entities that collateralize these obligations are not available to our creditors. |
|
(6) |
Collateralized by $620,034 principal amount of commercial mortgages loans and participation interests. These obligations were issued by separate legal entities and consequently the assets of the special purpose entities that collateralize these obligations are not available to our creditors. |
|
(7) |
Includes $563,721 of unpaid principal balance with a carrying amount of $564,333 of mortgage indebtedness that encumbers properties owned by IRT. The weighted-average interest rate is 3.8% and has a range of maturity dates from April 2016 to May 2025. |
|
(8) |
Floating rate at 245 basis points over 1-month LIBOR. As of September 30, 2015, 1-month LIBOR was 0.19%. Interest only payments are due monthly. |
|
(9) |
Floating rate at 500 basis points over 1-month LIBOR. As of September 30, 2015, 1-month LIBOR was 0.19%. Interest only payments are due monthly. |
21
RAIT Financial Trust
Notes to Consolidated Financial Statements
As of September 30, 2015
(Unaudited and dollars in thousands, except share and per share amounts)
The following table summarizes our total recourse and non-recourse indebtedness as of December 31, 2014:
|
Description |
|
Unpaid Principal Balance |
|
|
Carrying Amount |
|
|
Weighted- Average Interest Rate |
|
|
Contractual Maturity |
|||
|
Recourse indebtedness: |
|
|
|
|
|
|
|
|
|
|
|
|
|
|
|
7.0% convertible senior notes (1) |
|
$ |
34,066 |
|
|
$ |
33,417 |
|
|
|
7.0 |
% |
|
Apr. 2031 |
|
4.0% convertible senior notes (2) |
|
|
141,750 |
|
|
|
134,418 |
|
|
|
4.0 |
% |
|
Oct. 2033 |
|
7.625% senior notes |
|
|
60,000 |
|
|
|
60,000 |
|
|
|
7.6 |
% |
|
Apr. 2024 |
|
7.125% senior notes |
|
|
71,905 |
|
|
|
71,905 |
|
|
|
7.1 |
% |
|
Aug. 2019 |
|
Secured credit facilities |
|
|
18,392 |
|
|
|
18,392 |
|
|
|
2.7 |
% |
|
Oct. 2016 |
|
Senior secured notes |
|
|
78,000 |
|
|
|
68,314 |
|
|
|
7.0 |
% |
|
Apr. 2017 to Apr. 2019 |
|
Junior subordinated notes, at fair value (3) |
|
|
18,671 |
|
|
|
13,102 |
|
|
|
0.5 |
% |
|
Mar. 2035 |
|
Junior subordinated notes, at amortized cost |
|
|
25,100 |
|
|
|
25,100 |
|
|
|
2.7 |
% |
|
Apr. 2037 |
|
CMBS facilities |
|
|
85,053 |
|
|
|
85,053 |
|
|
|
2.5 |
% |
|
Nov. 2015 to Jul. 2016 |
|
Total recourse indebtedness |
|
|
532,937 |
|
|
|
509,701 |
|
|
|
4.0 |
% |
|
|
|
Non-recourse indebtedness: |
|
|
|
|
|
|
|
|
|
|
|
|
|
|
|
CDO notes payable, at amortized cost (4)(5) |
|
|
1,074,102 |
|
|
|
1,073,145 |
|
|
|
0.6 |
% |
|
2045 to 2046 |
|
CMBS securitizations (6) |
|
|
389,994 |
|
|
|
389,415 |
|
|
|
1.9 |
% |
|
Jan. 2029 to Dec 2031 |
|
Loans payable on real estate (7) |
|
|
641,874 |
|
|
|
643,405 |
|
|
|
4.6 |
% |
|
Sep. 2015 to Aug. 2040 |
|
Total non-recourse indebtedness |
|
|
2,105,970 |
|
|
|
2,105,965 |
|
|
|
2.1 |
% |
|
|
|
Total indebtedness |
|
$ |
2,638,907 |
|
|
$ |
2,615,666 |
|
|
|
2.6 |
% |
|
|
|
(1) |
Our 7.0% convertible senior notes are redeemable at par, at the option of the holder, in April 2016, April 2021, and April 2026. |
|
(2) |
Our 4.0% convertible senior notes are redeemable at par, at the option of the holder, in October 2018, October 2023, and October 2028. |
|
(3) |
Relates to liabilities which we elected to record at fair value under FASB ASC Topic 825. |
|
(4) |
Excludes CDO notes payable purchased by us which are eliminated in consolidation. |
|
(5) |
Collateralized by $1,572,126 principal amount of commercial mortgages, mezzanine loans, other loans and preferred equity interests. These obligations were issued by separate legal entities and consequently the assets of the special purpose entities that collateralize these obligations are not available to our creditors. |
|
(6) |
Excludes the RAIT FL1 junior notes, RAIT FL2 junior notes and RAIT FL3 junior notes purchased by us which are eliminated in consolidation. Collateralized by $490,863 principal amount of commercial mortgages loans and participation interests. These obligations were issued by separate legal entities and consequently the assets of the special purpose entities that collateralize these obligations are not available to our creditors. |
|
(7) |
Includes $360,902 of unpaid principal balance and carrying amount of $362,434 of third party mortgage indebtedness that encumbers properties owned by IRT. The weighted-average interest rate is 3.8% and has a range of maturity dates from April 2016 to January 2025. |
Recourse indebtedness refers to indebtedness that is recourse to our general assets, including the loans payable on real estate that are guaranteed by us. Non-recourse indebtedness consists of indebtedness of consolidated VIEs (i.e. securitization vehicles) and loans payable on real estate which is recourse only to specific assets pledged as collateral to the lenders. The creditors of each consolidated VIE have no recourse to our general credit.
The current status or activity in our financing arrangements occurring as of or during the nine-month period ended September 30, 2015 is as follows:
Recourse Indebtedness
7.0% convertible senior notes. The 7.0% convertible senior notes are convertible at the option of the holder at a current conversion rate of 173.6550 common shares per $1 principal amount of 7.0% convertible senior notes (equivalent to a current conversion price of $5.76 per common share). Upon conversion of 7.0% convertible senior notes by a holder, the holder will receive
22
RAIT Financial Trust
Notes to Consolidated Financial Statements
As of September 30, 2015
(Unaudited and dollars in thousands, except share and per share amounts)
cash, our common shares or a combination of cash and our common shares, at our election. We include the 7.0% convertible senior notes in diluted earnings per share using the if-converted method if the conversion value in excess of the par amount is considered in the money during the respective periods. On October 2, 2015 and October 5, 2015, holders of $2,010 of the 7.0% convertible notes exercised their option to convert their notes. At that time, the conversion rate was 167.8233 common shares per $1 principal amount. We elected to settle the conversion by issuing 337,324 common shares (plus cash in lieu of fractional shares).
4.0% convertible senior notes. The 4.0% convertible senior notes are convertible at the option of the holder at a current conversion rate of 108.5803 common shares per $1 principal amount of 4.0% convertible senior notes (equivalent to a current conversion price of $9.21 per common share). Upon conversion of 4.0% convertible senior notes by a holder, the holder will receive cash, our common shares or a combination of cash and our common shares, at our election. We include the 4.0% convertible senior notes in diluted earnings per share using the if-converted method if the conversion value in excess of the par amount is considered in the money during the respective periods.
7.625% senior notes. On April 14, 2014, we issued and sold in a public offering $60,000 aggregate principal amount of our 7.625% Senior Notes due 2024, or the 7.625% senior notes. After deducting the underwriting discount and the estimated offering costs, we received approximately $57,500 of net proceeds. Interest on the 7.625% senior notes is paid quarterly with a maturity date of April 15, 2024. The 7.625% senior notes are subject to redemption at our option, in whole or in part, at any time on or after April 15, 2017, at a redemption price equal to 100% of the principal amount of the notes to be redeemed, plus accrued and unpaid interest to, but excluding, the redemption date and are subject to repurchase by us at the option of the holders following a defined fundamental change, at a repurchase price equal to 101% of the principal amount of the notes to be repurchased, plus accrued and unpaid interest to, but excluding, the fundamental change repurchase date. The senior notes are not convertible into equity securities of RAIT. They contain financial covenants that are consistent with our other debt agreements.
7.125% senior notes. In August 2014, we issued and sold in a public offering $71,905 aggregate principal amount of our 7.125% Senior Notes due 2019, or the 7.125% senior notes. After deducting the underwriting discount and the estimated offering costs, we received approximately $69,209 of net proceeds. Interest on the 7.125% senior notes is paid quarterly with a maturity date of August 30, 2019. The 7.125% senior notes are subject to redemption at our option, in whole or in part, at any time on or after August 30, 2017, at a redemption price equal to 100% of the principal amount of the notes to be redeemed, plus accrued and unpaid interest to, but excluding, the redemption date and are subject to repurchase by us at the option of the holders following a defined fundamental change, at a repurchase price equal to 101% of the principal amount of the notes to be repurchased, plus accrued and unpaid interest to, but excluding, the fundamental change repurchase date. The senior notes are not convertible into equity securities of RAIT. They contain financial covenants that are consistent with our other debt agreements.
Secured credit facilities. On October 25, 2013, our subsidiary, IROP, the operating partnership of IRT, entered into a $20,000 secured revolving credit agreement, or the HNB credit agreement, with The Huntington National Bank to be used to acquire properties, for capital expenditures and for general corporate purposes. The HNB credit agreement has a 3-year term, bears interest at LIBOR plus 2.75% and contains customary financial covenants for this type of revolving credit agreement. IRT guaranteed IROP’s obligations under the HNB credit agreement. On September 9, 2014, IRT and IROP entered into an amendment to the IROP credit agreement that increased the lender’s maximum commitment under the credit agreement from $20,000 to $30,000, changed the interest rate from LIBOR plus 2.75% to LIBOR plus 2.50% and amended certain financial covenants. In connection with the TSRE merger, the HNB facility was terminated as of September 17, 2015.
Senior secured notes. On October 5, 2011, we entered into an exchange agreement with T8 pursuant to which we issued four senior secured notes, or the senior secured notes, with an aggregate principal amount equal to $100,000 to T8 in exchange for a portfolio of real estate related debt securities, or the exchanged securities, held by T8. The senior secured notes and the exchanged securities were determined to have approximately equivalent fair market value at the time of the exchange. Prior to December 19, 2014, T8 was a consolidated subsidiary and the senior secured notes and their related interest were eliminated in consolidation. When T8 was deconsolidated on December 19, 2014, these senior secured notes were no longer eliminated.
The senior secured notes were issued pursuant to an indenture agreement dated October 5, 2011 which contains customary events of default, including those relating to nonpayment of principal or interest when due and defaults based upon events of bankruptcy and insolvency. The senior secured notes are each $25,000 principal amount with a weighted average interest rate of 7.0% and have maturity dates ranging from April 2017 to April 2019. Interest is at a fixed rate and accrues from October 5, 2011 and is
23
RAIT Financial Trust
Notes to Consolidated Financial Statements
As of September 30, 2015
(Unaudited and dollars in thousands, except share and per share amounts)
payable quarterly in arrears on October 30, January 30, April 30 and July 30 of each year, beginning October 30, 2011. The senior secured notes are secured and are not convertible into equity securities of RAIT.
During the nine-month period ended September 30, 2015, we prepaid $6,000 of the senior secured notes. As of September 30, 2015 we have $72,000 of outstanding senior secured notes.
Junior subordinated notes, at fair value. On October 16, 2008, we issued two junior subordinated notes with an aggregate principal amount of $38,052 to a third party and received $15,459 of net cash proceeds. One junior subordinated note, which we refer to as the first $18,671 junior subordinated note, has a principal amount of $18,671, a fixed interest rate of 8.65% through March 30, 2015 with a floating rate of LIBOR plus 400 basis points thereafter and a maturity date of March 30, 2035. The second junior subordinated note, which we refer to as the $19,381 junior subordinated note, had a principal amount of $19,381, a fixed interest rate of 9.64% and a maturity date of October 30, 2015. At issuance, we elected to record these junior subordinated notes at fair value under FASB ASC Topic 825, with all subsequent changes in fair value recorded in earnings.
On October 25, 2010, pursuant to a securities exchange agreement, we exchanged and cancelled the first $18,671 junior subordinated note for another junior subordinated note, which we refer to as the second $18,671 junior subordinated note, in aggregate principal amount of $18,671 with a reduced interest rate and provided $5,000 of our 6.875% convertible senior notes as collateral for the second $18,671 junior subordinated note. This $18,671 junior subordinated note has a fixed rate of interest of 0.5% through March 30, 2015 and thereafter has a floating rate of three-month LIBOR plus 400 basis points, with such floating rate not to exceed 7.0%. The maturity date is March 30, 2035. At issuance, of these notes, we elected to record the second $18,671 junior subordinated note at fair value under FASB ASC Topic 825, with all subsequent changes in fair value recorded in earnings. The fair value, or carrying amount, of this indebtedness was $11,193 as of September 30, 2015.
CMBS facilities. As of September 30, 2015, we had $21,590 of outstanding borrowings under the amended and restated master repurchase agreement, or the Amended MRA. As of September 30, 2015, we were in compliance with all financial covenants contained in the Amended MRA.
As of September 30, 2015, we had $7,125 of outstanding borrowings under the $150,000 CMBS facility. As of September 30, 2015, we were in compliance with all financial covenants contained in the $150,000 CMBS facility.
As of September 30, 2015, we had $75,000 of outstanding borrowings under the $75,000 commercial mortgage facility. As of September 30, 2015, we were in compliance with all financial covenants contained in the $75,000 commercial mortgage facility.
As of September 30, 2015, we had $55,771 of outstanding borrowings under the $150,000 commercial mortgage facility. As of September 30, 2015, we were in compliance with all financial covenants contained in the $150,000 commercial mortgage facility.
As of September 30, 2015, we had $24,712 of outstanding borrowings under the $150,000 commercial mortgage facility. As of September 30, 2015, we were in compliance with all financial covenants contained in the $150,000 commercial mortgage facility.
Non-Recourse Indebtedness
Secured credit facilities. On September 17, 2015, IROP entered into a credit agreement with respect to a $325,000 senior secured credit facility, or the KeyBank senior facility. The KeyBank senior facility consists of a revolving line of credit in an amount of up to $125,000, or the revolver, and a term loan in an amount of no less than $200,000, or the term loan. Up to 10% of the revolver is available for swingline loans, and up to 10% of the revolver is available for the issuance of letters of credit. Additionally, IROP has the right to increase the aggregate amount of the KeyBank senior facility to up to $450,000. The KeyBank senior facility will mature on September 17, 2018, three years from its closing date, subject to the option of IROP to extend the KeyBank senior facility for two additional 12-month periods under certain circumstances. IROP may prepay the KeyBank senior facility, in whole or in part, at any time without fee or penalty, except for breakage costs associated with LIBOR borrowings. At IROP’s option, borrowings under the KeyBank senior facility will bear interest at a rate equal to either (i) the 1-month LIBOR rate plus a margin of 165 to 245 basis points, or (ii) a base rate plus a margin of 65 to 145 basis points. The applicable margin will be determined based upon IROP’s total leverage ratio. In addition, IROP will pay a fee of either 20 basis points (if greater than or equal to 50% of the revolver is used) or 25 basis points (if less than 50% of the revolver is used) on the unused portion of the revolver. The KeyBank senior facility requires monthly payments of interest only and does not require any mandatory prepayments. At September 30, 2015, amounts outstanding under the
24
RAIT Financial Trust
Notes to Consolidated Financial Statements
As of September 30, 2015
(Unaudited and dollars in thousands, except share and per share amounts)
KeyBank secured facility bear interest at 245 basis points over 1-month LIBOR. As of September 30, 2015, there was $53,500 of availability under the revolver and $0 of availability under the term loan.
Term loans. On September 17, 2015, IROP entered into a credit agreement with respect to a $120,000 senior interim term loan facility, or the KeyBank interim facility. The KeyBank interim facility is structured as a 364-day secured term loan facility (with a maturity extension option for an additional six months under certain circumstances) available in a single draw. IROP may prepay the KeyBank interim facility, in whole or in part, at any time without fee or penalty (other than as provided in a separate fee letter with the lenders), except for breakage costs associated with LIBOR borrowings. The KeyBank interim facility is secured by pledges of certain of the equity interests of IROP’s current and future subsidiaries and joint ventures (on a best-available basis to the extent such equity interests can be pledged pursuant to IRT’s existing debt agreements) and a pledge of the proceeds of all equity issuances by IRT. At IROP’s option, borrowings under the KeyBank interim facility will bear interest at a rate equal to either (i) the 1-month LIBOR rate plus a margin of 500 basis points, or (ii) a base rate plus a margin of 400 basis points. If IROP elects to extend its maturity, at IROP’s option, the KeyBank interim facility will bear interest at a rate equal to either (i) the 1-month LIBOR rate plus a margin of 650 basis points, or (ii) a base rate plus a margin of 550 basis points. The KeyBank interim facility requires monthly payments of interest only. IROP is required to reduce the principal amount outstanding under the KeyBank interim facility to no greater than $100,000 within six months of closing and must apply 100% of all net proceeds from equity issuances, sales of assets, or refinancings of assets towards repaying the KeyBank Interim Facility. At September 30, 2015, the KeyBank interim facility bears interest at 500 basis points over 1-month LIBOR and there was $0 of availability under the KeyBank interim facility.
CDO notes payable, at amortized cost. CDO notes payable at amortized cost represent notes issued by consolidated CDO securitizations which are used to finance the acquisition of unsecured REIT notes, CMBS securities, commercial mortgages, mezzanine loans, and other loans in our commercial real estate portfolio. Generally, CDO notes payable are comprised of various classes of notes payable, with each class bearing interest at variable or fixed rates. Both RAIT I and RAIT II are meeting all of their over collateralization, or OC, and interest coverage, or IC, trigger tests as of September 30, 2015.
CMBS securitizations. During the third quarter of 2015, RAIT exercised its right to unwind RAIT-FL1, thereby repaying all of the outstanding notes. As a result, as of September 30, 2015, RAIT 2013-FL1 Trust, or RAIT FL 1, had $0 of total collateral at par value.
As of September 30, 2015, our subsidiary, RAIT 2014-FL2 Trust, or RAIT FL 2, had $185,572 of total collateral at par value. RAIT FL2 had classes of investment grade senior notes with an aggregate principal balance outstanding of approximately $145,358 to investors. We currently own the unrated classes of junior notes, including a class with an aggregate principal balance of $40,214, and the equity, or the retained interests, of RAIT FL2. RAIT FL2 does not have OC triggers or IC triggers.
As of September 30, 2015, our subsidiary, RAIT 2014-FL3 Trust, or RAIT FL 3, had $215,178 of total collateral at par value. RAIT FL3 had classes of investment grade senior notes with an aggregate principal balance outstanding of approximately $177,792 to investors. We currently own the unrated classes of junior notes, including a class with an aggregate principal balance of $37,386, and the equity, or the retained interests, of RAIT FL3. RAIT FL3 does not have OC triggers or IC triggers.
As of September 30, 2015, our subsidiary, RAIT 2015-FL4 Trust, or RAIT FL 4, had $219,284 of total collateral at par value. RAIT FL4 had classes of investment grade senior notes with an aggregate principal balance outstanding of approximately $177,894 to investors. We currently own the unrated classes of junior notes, including a class with an aggregate principal balance of $41,390, and the equity, or the retained interests, of RAIT FL4. RAIT FL4 does not have OC triggers or IC triggers.
Loans payable on real estate. As of September 30, 2015 and December 31, 2014, we had $799,436 and $641,874, respectively, of other indebtedness outstanding relating to loans payable on consolidated real estate. These loans are secured by specific consolidated real estate and commercial loans included in our consolidated balance sheets.
During the nine-month period ended September 30, 2015, IRT obtained or assumed 8 first mortgages on its investment in real estate from third party lenders that have a total aggregate principal balance of $204,262, maturity dates ranging from March 2021 to May 2025, and interest rates ranging from 3.2% to 4.3%.
25
RAIT Financial Trust
Notes to Consolidated Financial Statements
As of September 30, 2015
(Unaudited and dollars in thousands, except share and per share amounts)
NOTE 7: DERIVATIVE FINANCIAL INSTRUMENTS
We may use derivative financial instruments to hedge all or a portion of the interest rate risk associated with our borrowings. The principal objective of such arrangements is to minimize the risks and/or costs associated with our operating and financial structure as well as to hedge specific anticipated transactions. The counterparties to these contractual arrangements are major financial institutions with which we and our affiliates may also have other financial relationships. In the event of nonperformance by the counterparties, we are potentially exposed to credit loss. However, because of the high credit ratings of the counterparties, we do not anticipate that any of the counterparties will fail to meet their obligations.
Interest Rate Swaps and Caps
We have entered into various interest rate swap contracts to hedge interest rate exposure on floating rate indebtedness. Also, on September 30, 2015, IRT entered into an interest cap contract to hedge its interest rate exposure on floating rate indebtedness.
We designate interest rate hedge agreements at inception and determine whether or not the interest rate hedge agreement is highly effective in offsetting interest rate fluctuations associated with the identified indebtedness. At designation, certain of these interest rate swaps had a fair value not equal to zero. However, we concluded, at designation, that these hedging arrangements were highly effective during their term using regression analysis and determined that the hypothetical derivative method would be used in measuring any ineffectiveness. At each reporting period, we update our regression analysis and, as of September 30, 2015, we concluded that these hedging arrangements were highly effective during their remaining term and used the hypothetical derivative method in measuring the ineffective portions of these hedging arrangements.
The following table summarizes the aggregate notional amount and estimated net fair value of our derivative instruments as of September 30, 2015 and December 31, 2014:
|
|
|
As of September 30, 2015 |
|
|
As of December 31, 2014 |
|
||||||||||||||||||
|
|
|
Notional |
|
|
Fair Value of Assets |
|
|
Fair Value of Liabilities |
|
|
Notional |
|
|
Fair Value of Assets |
|
|
Fair Value of Liabilities |
|
||||||
|
Cash flow hedges: |
|
|
|
|
|
|
|
|
|
|
|
|
|
|
|
|
|
|
|
|
|
|
|
|
|
Interest rate swaps |
|
$ |
345,988 |
|
|
$ |
- |
|
|
$ |
(8,960 |
) |
|
$ |
496,025 |
|
|
$ |
— |
|
|
$ |
(20,695 |
) |
|
Interest rate cap |
|
|
200,000 |
|
|
|
37 |
|
|
|
- |
|
|
|
- |
|
|
|
- |
|
|
|
- |
|
|
Net fair value |
|
$ |
545,988 |
|
|
$ |
37 |
|
|
$ |
(8,960 |
) |
|
$ |
496,025 |
|
|
$ |
— |
|
|
$ |
(20,695 |
) |
During the period October 1, 2015 through December 31, 2015, interest rate swap agreements relating to RAIT I and RAIT II with a notional amount of $52,268 and a weighted average strike rate of 5.1% as of September 30, 2015, will terminate in accordance with their terms.
For interest rate swaps and caps that are considered effective hedges, we reclassified realized losses of $3,831 and $6,966, respectively, to earnings for the three-month periods ended September 30, 2015 and 2014 and $13,196 and $21,746 for the nine-month periods ended September 30, 2015 and 2014.
Effective interest rate swaps and caps are reported in accumulated other comprehensive income and the fair value of these hedge agreements is included in other assets or derivative liabilities.
NOTE 8: FAIR VALUE OF FINANCIAL INSTRUMENTS
Fair Value of Financial Instruments
FASB ASC Topic 825, “Financial Instruments” requires disclosure of the fair value of financial instruments for which it is practicable to estimate that value. The fair value of investments in mortgages and loans, investments in securities, CDO notes payable, convertible senior notes, junior subordinated notes and derivative assets and liabilities is based on significant observable and unobservable inputs. The fair value of cash and cash equivalents, restricted cash, secured credit facilities, CMBS facilities and commercial mortgage facilities approximates cost due to the nature of these instruments.
26
RAIT Financial Trust
Notes to Consolidated Financial Statements
As of September 30, 2015
(Unaudited and dollars in thousands, except share and per share amounts)
The following table summarizes the carrying amount and the fair value of our financial instruments as of September 30, 2015:
|
Financial Instrument |
|
Carrying Amount |
|
|
Estimated Fair Value |
|
||
|
Assets |
|
|
|
|
|
|
|
|
|
Commercial mortgages, mezzanine loans, and preferred equity interests |
|
$ |
1,588,097 |
|
|
$ |
1,545,992 |
|
|
Cash and cash equivalents |
|
|
92,652 |
|
|
|
92,652 |
|
|
Restricted cash |
|
|
159,200 |
|
|
|
159,200 |
|
|
Derivative assets |
|
|
37 |
|
|
|
37 |
|
|
|
|
|
|
|
|
|
|
|
|
Liabilities |
|
|
|
|
|
|
|
|
|
Recourse indebtedness: |
|
|
|
|
|
|
|
|
|
7.0% convertible senior notes |
|
|
33,784 |
|
|
|
33,176 |
|
|
4.0% convertible senior notes |
|
|
136,418 |
|
|
|
113,227 |
|
|
7.625% senior notes |
|
|
60,000 |
|
|
|
51,456 |
|
|
7.125% senior notes |
|
|
71,905 |
|
|
|
62,730 |
|
|
Senior secured notes |
|
|
64,354 |
|
|
|
68,946 |
|
|
Secured credit facilities |
|
|
271,500 |
|
|
|
271,500 |
|
|
Term Loans |
|
|
120,000 |
|
|
|
120,000 |
|
|
Junior subordinated notes, at fair value |
|
|
11,193 |
|
|
|
11,193 |
|
|
Junior subordinated notes, at amortized cost |
|
|
25,100 |
|
|
|
12,063 |
|
|
CMBS facilities |
|
|
184,198 |
|
|
|
184,198 |
|
|
Non-recourse indebtedness: |
|
|
|
|
|
|
|
|
|
CDO notes payable, at amortized cost |
|
|
920,691 |
|
|
|
842,096 |
|
|
CMBS securitizations |
|
|
500,790 |
|
|
|
497,100 |
|
|
Loans payable on real estate |
|
|
800,048 |
|
|
|
814,963 |
|
|
Derivative liabilities |
|
|
8,960 |
|
|
|
8,960 |
|
|
Warrants and investor SARs |
|
|
22,590 |
|
|
|
22,590 |
|
27
RAIT Financial Trust
Notes to Consolidated Financial Statements
As of September 30, 2015
(Unaudited and dollars in thousands, except share and per share amounts)
The following table summarizes the carrying amount and the fair value of our financial instruments as of December 31, 2014:
|
Financial Instrument |
|
Carrying Amount |
|
|
Estimated Fair Value |
|
||
|
Assets |
|
|
|
|
|
|
|
|
|
Commercial mortgages, mezzanine loans, and preferred equity interests |
|
$ |
1,392,436 |
|
|
$ |
1,316,796 |
|
|
Investments in securities and security-related receivables |
|
|
31,412 |
|
|
|
31,412 |
|
|
Cash and cash equivalents |
|
|
121,726 |
|
|
|
121,726 |
|
|
Restricted cash |
|
|
124,220 |
|
|
|
124,220 |
|
|
Liabilities |
|
|
|
|
|
|
|
|
|
Recourse indebtedness: |
|
|
|
|
|
|
|
|
|
7.0% convertible senior notes |
|
|
33,417 |
|
|
|
41,901 |
|
|
4.0% convertible senior notes |
|
|
134,418 |
|
|
|
123,677 |
|
|
7.625% senior notes |
|
|
60,000 |
|
|
|
56,016 |
|
|
7.125% senior notes |
|
|
71,905 |
|
|
|
70,064 |
|
|
Secured credit facilities |
|
|
18,392 |
|
|
|
18,392 |
|
|
Junior subordinated notes, at fair value |
|
|
13,102 |
|
|
|
13,102 |
|
|
Junior subordinated notes, at amortized cost |
|
|
25,100 |
|
|
|
14,471 |
|
|
CMBS facilities |
|
|
55,956 |
|
|
|
55,956 |
|
|
Commercial mortgage facility |
|
|
29,097 |
|
|
|
29,097 |
|
|
Senior secured notes |
|
|
68,314 |
|
|
|
79,594 |
|
|
Non-recourse indebtedness: |
|
|
|
|
|
|
|
|
|
CDO notes payable, at amortized cost |
|
|
1,073,145 |
|
|
|
913,050 |
|
|
CMBS securitization |
|
|
389,415 |
|
|
|
389,771 |
|
|
Loans payable on real estate |
|
|
643,405 |
|
|
|
678,306 |
|
|
Derivative liabilities |
|
|
20,695 |
|
|
|
20,695 |
|
|
Warrants and investor SARs |
|
|
35,384 |
|
|
|
35,384 |
|
Fair Value Measurements
The following tables summarize information about our assets and liabilities measured at fair value on a recurring basis as of September 30, 2015, and indicate the fair value hierarchy of the valuation techniques utilized to determine such fair value:
|
Assets: |
|
Quoted Prices in Active Markets for Identical Assets (Level 1) (a) |
|
|
Significant Other Observable Inputs (Level 2) (a) |
|
|
Significant Unobservable Inputs (Level 3) (a) |
|
|
Balance as of September 30, 2015 |
|
||||
|
Available-for-sale securities |
|
$ |
— |
|
|
$ |
— |
|
|
$ |
— |
|
|
$ |
— |
|
|
Security-related receivables |
|
|
|
|
|
|
|
|
|
|
|
|
|
|
|
|
|
Unsecured REIT note receivables |
|
|
— |
|
|
|
— |
|
|
|
— |
|
|
|
— |
|
|
CMBS receivables |
|
|
— |
|
|
|
— |
|
|
|
— |
|
|
|
— |
|
|
Other securities |
|
|
— |
|
|
|
— |
|
|
|
— |
|
|
|
— |
|
|
Derivative assets |
|
|
— |
|
|
|
37 |
|
|
|
— |
|
|
|
37 |
|
|
Total assets |
|
$ |
— |
|
|
$ |
37 |
|
|
$ |
— |
|
|
$ |
37 |
|
28
RAIT Financial Trust
Notes to Consolidated Financial Statements
As of September 30, 2015
(Unaudited and dollars in thousands, except share and per share amounts)
|
Liabilities: |
|
Quoted Prices in Active Markets for Identical Assets (Level 1) (a) |
|
|
Significant Other Observable Inputs (Level 2) (a) |
|
|
Significant Unobservable Inputs (Level 3) (a) |
|
|
Balance as of September 30, 2015 |
|
||||
|
Junior subordinated notes, at fair value |
|
$ |
— |
|
|
$ |
— |
|
|
$ |
11,193 |
|
|
$ |
11,193 |
|
|
Derivative liabilities |
|
|
— |
|
|
|
8,960 |
|
|
|
— |
|
|
|
8,960 |
|
|
Warrants and investor SARs |
|
|
— |
|
|
|
— |
|
|
|
22,590 |
|
|
|
22,590 |
|
|
Total liabilities |
|
$ |
— |
|
|
$ |
8,960 |
|
|
$ |
33,783 |
|
|
$ |
42,743 |
|
|
(a) |
During the nine-month period ended September 30, 2015, there were no transfers between Level 1 and Level 2, as well as there were no transfers into and out of Level 3. |
The following tables summarize information about our assets and liabilities measured at fair value on a recurring basis as of December 31, 2014, and indicate the fair value hierarchy of the valuation techniques utilized to determine such fair value:
|
Assets: |
|
Quoted Prices in Active Markets for Identical Assets (Level 1) (a) |
|
|
Significant Other Observable Inputs (Level 2) (a) |
|
|
Significant Unobservable Inputs (Level 3) (a) |
|
|
Balance as of December 31, 2014 |
|
||||
|
Available-for-sale securities |
|
$ |
— |
|
|
$ |
19,167 |
|
|
$ |
— |
|
|
$ |
19,167 |
|
|
Security-related receivables |
|
|
|
|
|
|
|
|
|
|
|
|
|
|
|
|
|
Unsecured REIT note receivables |
|
|
— |
|
|
|
10,995 |
|
|
|
— |
|
|
|
10,995 |
|
|
CMBS receivables |
|
|
— |
|
|
|
1,250 |
|
|
|
— |
|
|
|
1,250 |
|
|
Other securities |
|
|
— |
|
|
|
— |
|
|
|
— |
|
|
|
— |
|
|
Derivative assets |
|
|
— |
|
|
|
— |
|
|
|
— |
|
|
|
— |
|
|
Total assets |
|
$ |
— |
|
|
$ |
31,412 |
|
|
$ |
— |
|
|
$ |
31,412 |
|
|
Liabilities: |
|
Quoted Prices in Active Markets for Identical Assets (Level 1) (a) |
|
|
Significant Other Observable Inputs (Level 2) (a) |
|
|
Significant Unobservable Inputs (Level 3) (a) |
|
|
Balance as of December 31, 2014 |
|
||||
|
Junior subordinated notes, at fair value |
|
$ |
— |
|
|
$ |
— |
|
|
$ |
13,102 |
|
|
$ |
13,102 |
|
|
Derivative liabilities |
|
|
— |
|
|
|
20,695 |
|
|
|
— |
|
|
|
20,695 |
|
|
Warrants and investor SARs |
|
|
— |
|
|
|
— |
|
|
|
35,384 |
|
|
|
35,384 |
|
|
Total liabilities |
|
$ |
— |
|
|
$ |
20,695 |
|
|
$ |
48,486 |
|
|
$ |
69,181 |
|
|
(a) |
During the year ended December 31, 2014, there were no transfers between Level 1 and Level 2, as well as there were no transfers into and out of Level 3. |
When estimating the fair value of our Level 3 financial instruments, management uses various observable and unobservable inputs. These inputs include yields, credit spreads, duration, effective dollar prices and overall market conditions on not only the exact financial instrument for which management is estimating the fair value, but also financial instruments that are similar or issued by the same issuer when such inputs are unavailable. Generally, an increase in the yields, credit spreads or estimated duration will decrease the fair value of our financial instruments. Due to the inherent uncertainty of determining the fair value of investments that do not have a readily available market value, the fair value, as determined by management, may fluctuate from period to period and any ultimate liquidation or sale of the investment may result in proceeds that may be significantly different than fair value.
29
RAIT Financial Trust
Notes to Consolidated Financial Statements
As of September 30, 2015
(Unaudited and dollars in thousands, except share and per share amounts)
The following table summarizes additional information about assets and liabilities that are measured at fair value on a recurring basis for which we have utilized level 3 inputs to determine fair value for the nine-month period ended September 30, 2015:
|
Liabilities |
|
Warrants and investor SARS |
|
|
Junior Subordinated Notes, at Fair Value |
|
|
Total Level 3 Liabilities |
|
|||
|
Balance, as of December 31, 2014 |
|
$ |
35,384 |
|
|
$ |
13,102 |
|
|
$ |
48,486 |
|
|
Change in fair value of financial instruments |
|
|
(12,794 |
) |
|
|
(1,909 |
) |
|
|
(14,703 |
) |
|
Purchases |
|
|
— |
|
|
|
— |
|
|
|
— |
|
|
Principal Repayments |
|
|
— |
|
|
|
— |
|
|
|
— |
|
|
Balance, as of September 30, 2015 |
|
$ |
22,590 |
|
|
$ |
11,193 |
|
|
$ |
33,783 |
|
Non-Recurring Fair Value Measurements
As of September 30, 2015, we measured a real estate asset at a fair value of $29,860 in our consolidated balance sheets as it was impaired. The valuation technique was discounted cash flows and was classified in Level 3 of the fair value hierarchy. The terminal capitalization rate and discount rate are the significant inputs to this valuation and were 9.5% and 10.5%, respectively
Our other non-recurring fair value measurements relate primarily to our commercial real estate loans that are considered impaired and for which we maintain an allowance for loss. In determining the allowance for losses, we estimate the fair value of the respective commercial real estate loan and compare that fair value to our total investment in the loan. When estimating the fair value of the commercial real estate loan, management uses discounted cash flow analyses and capitalization rates on the underlying property’s net operating income. The discounted cash flow analyses and capitalization rates are based on market information and comparable sales of similar properties.
The following tables summarize the valuation technique and the level of the fair value hierarchy for financial instruments that are not fair valued in the accompanying consolidated balance sheets but for which fair value is required to be disclosed. The fair value of cash and cash equivalents, restricted cash, secured credit facilities, term loans and CMBS facilities approximates cost due to the nature of these instruments and are not included in the tables below.
|
|
|
|
|
|
|
|
|
|
|
|
|
Fair Value Measurement |
|
|||||||
|
|
|
Carrying Amount as of September 30, 2015 |
|
|
Estimated Fair Value as of September 30, 2015 |
|
|
Valuation Technique |
|
Quoted Prices in Active Markets for Identical Assets (Level 1) |
|
|
Significant Other Observable Inputs (Level 2) |
|
Significant Unobservable Inputs (Level 3) |
|
||||
|
Commercial mortgages, mezzanine loans, other loans and preferred equity interests |
|
$ |
1,588,097 |
|
|
$ |
1,545,992 |
|
|
Discounted cash flows |
|
|
|
|
|
|
|
$ |
1,545,992 |
|
|
7.0% convertible senior notes |
|
|
33,784 |
|
|
|
33,176 |
|
|
Trading price |
|
|
33,176 |
|
|
|
|
|
|
|
|
4.0% convertible senior notes |
|
|
136,418 |
|
|
|
113,227 |
|
|
Trading price |
|
|
113,227 |
|
|
|
|
|
|
|
|
7.625% senior notes |
|
|
60,000 |
|
|
|
51,456 |
|
|
Trading price |
|
|
51,456 |
|
|
|
|
|
|
|
|
7.125% senior notes |
|
|
71,905 |
|
|
|
62,730 |
|
|
Trading price |
|
|
62,730 |
|
|
|
|
|
|
|
|
Senior secured notes |
|
|
64,354 |
|
|
|
68,946 |
|
|
Discounted cash flows |
|
|
|
|
|
|
|
|
68,946 |
|
|
Junior subordinated notes, at amortized cost |
|
|
25,100 |
|
|
|
12,063 |
|
|
Discounted cash flows |
|
|
|
|
|
|
|
|
12,063 |
|
|
CDO notes payable, at amortized cost |
|
|
920,691 |
|
|
|
842,096 |
|
|
Trading price |
|
|
842,096 |
|
|
|
|
|
|
|
|
CMBS securitizations |
|
|
500,790 |
|
|
|
497,100 |
|
|
Trading price |
|
|
497,100 |
|
|
|
|
|
|
|
|
Loans payable on real estate |
|
|
800,048 |
|
|
|
814,963 |
|
|
Discounted cash flows |
|
|
|
|
|
|
|
|
814,963 |
|
30
RAIT Financial Trust
Notes to Consolidated Financial Statements
As of September 30, 2015
(Unaudited and dollars in thousands, except share and per share amounts)
|
|
|
|
|
|
|
|
|
|
|
|
|
Fair Value Measurement |
|
|||||||||
|
|
|
Carrying Amount as of December 31, 2014 |
|
|
Estimated Fair Value as of December 31, 2014 |
|
|
Valuation Technique |
|
Quoted Prices in Active Markets for Identical Assets (Level 1) |
|
|
Significant Other Observable Inputs (Level 2) |
|
|
Significant Unobservable Inputs (Level 3) |
|
|||||
|
Commercial mortgages, mezzanine loans, other loans and preferred equity interests |
|
$ |
1,392,436 |
|
|
$ |
1,316,796 |
|
|
Discounted cash flows |
|
$ |
— |
|
|
$ |
— |
|
|
$ |
1,316,796 |
|
|
7.0% convertible senior notes |
|
|
33,417 |
|
|
|
41,901 |
|
|
Trading price |
|
|
41,901 |
|
|
|
— |
|
|
|
— |
|
|
4.0% convertible senior notes |
|
|
134,418 |
|
|
|
123,677 |
|
|
Trading price |
|
|
123,677 |
|
|
|
— |
|
|
|
— |
|
|
7.625% senior notes |
|
|
60,000 |
|
|
|
56,016 |
|
|
'Trading price |
|
|
56,016 |
|
|
|
— |
|
|
|
— |
|
|
7.125% senior notes |
|
|
71,905 |
|
|
|
70,064 |
|
|
Trading price |
|
|
70,064 |
|
|
|
— |
|
|
|
— |
|
|
Senior secured notes |
|
|
68,314 |
|
|
|
79,594 |
|
|
Discounted cash flows |
|
|
— |
|
|
|
— |
|
|
|
79,594 |
|
|
Junior subordinated notes, at amortized cost |
|
|
25,100 |
|
|
|
14,471 |
|
|
Discounted cash flows |
|
|
— |
|
|
|
— |
|
|
|
14,471 |
|
|
CDO notes payable, at amortized cost |
|
|
1,073,145 |
|
|
|
913,050 |
|
|
Trading price |
|
|
913,050 |
|
|
|
— |
|
|
|
— |
|
|
CMBS securitization |
|
|
389,415 |
|
|
|
389,771 |
|
|
Trading price |
|
|
389,771 |
|
|
|
— |
|
|
|
— |
|
|
Loans payable on real estate |
|
|
643,405 |
|
|
|
678,306 |
|
|
Discounted cash flows |
|
|
— |
|
|
|
— |
|
|
|
678,306 |
|
.
Change in Fair Value of Financial Instruments
The following table summarizes realized and unrealized gains and losses on assets and liabilities for which we elected the fair value option of FASB ASC Topic 825, “Financial Instruments” and derivatives as reported in change in fair value of financial instruments in the accompanying consolidated statements of operations:
|
|
|
For the Three-Month Periods Ended September 30 |
|
|
For the Nine-Month Periods Ended September 30 |
|
||||||||||
|
Description |
|
2015 |
|
|
2014 |
|
|
2015 |
|
|
2014 |
|
||||
|
Change in fair value of trading securities and security-related receivables |
|
$ |
— |
|
|
$ |
2,386 |
|
|
$ |
(173 |
) |
|
$ |
10,960 |
|
|
Change in fair value of CDO notes payable and trust preferred obligations |
|
|
1,673 |
|
|
|
(23,961 |
) |
|
|
1,909 |
|
|
|
(73,294 |
) |
|
Change in fair value of derivatives |
|
|
(644 |
) |
|
|
(702 |
) |
|
|
(1,064 |
) |
|
|
(12,413 |
) |
|
Change in fair value of warrants and investors SARs |
|
|
(409 |
) |
|
|
12,054 |
|
|
|
12,794 |
|
|
|
15,314 |
|
|
Change in fair value of financial instruments |
|
$ |
620 |
|
|
$ |
(10,223 |
) |
|
$ |
13,466 |
|
|
$ |
(59,433 |
) |
The changes in the fair value for the trading securities and security-related receivables, CDO notes payable, and other liabilities for which the fair value option was elected for the three-month and nine-month periods ended September 30, 2015 and 2014 was primarily attributable to changes in instrument specific credit risks. The changes in the fair value of the CDO notes payable for which the fair value option was elected was due to repayments at par because of OC failures when the CDO notes have a fair value of less than par. The changes in the fair value of derivatives for which the fair value option was elected for the three-month and nine-month periods ended September 30, 2015 and 2014 was mainly due to changes in interest rates. The changes in fair value of the warrants and investor SARs was due to changes in the reference stock price.
31
RAIT Financial Trust
Notes to Consolidated Financial Statements
As of September 30, 2015
(Unaudited and dollars in thousands, except share and per share amounts)
NOTE 9: VARIABLE INTEREST ENTITIES
The determination of when to consolidate a VIE is based on the power to direct the activities of the VIE that most significantly impact the VIE’s economic performance together with either the obligation to absorb losses or the right to receive benefits that could be significant to the VIE. We evaluated our investments and determined that, as of September 30, 2015 and December 31, 2014, our consolidated VIEs were: RAIT I, RAIT II, IRT, Willow Grove and Cherry Hill (RAIT VIE Properties). The following table presents the assets and liabilities of our consolidated VIEs as of each respective date.
|
|
|
As of September 30, 2015 |
|
|||||||||||||
|
|
|
RAIT Securitizations |
|
|
IRT |
|
|
RAIT VIE Properties |
|
|
Total |
|
||||
|
Assets |
|
|
|
|
|
|
|
|
|
|
|
|
|
|
|
|
|
Investments in mortgages and loans, at amortized cost: |
|
|
|
|
|
|
|
|
|
|
|
|
|
|
|
|
|
Commercial mortgages, mezzanine loans, other loans and preferred equity interests |
|
$ |
1,399,529 |
|
|
$ |
— |
|
|
$ |
— |
|
|
$ |
1,399,529 |
|
|
Allowance for losses |
|
|
421 |
|
|
|
— |
|
|
|
— |
|
|
|
421 |
|
|
Total investments in mortgages and loans |
|
|
1,399,950 |
|
|
|
— |
|
|
|
— |
|
|
|
1,399,950 |
|
|
Investments in real estate |
|
|
|
|
|
|
|
|
|
|
|
|
|
|
|
|
|
Investments in real estate |
|
|
— |
|
|
|
1,400,892 |
|
|
|
24,332 |
|
|
|
1,425,224 |
|
|
Accumulated depreciation |
|
|
— |
|
|
|
(35,304 |
) |
|
|
(4,479 |
) |
|
|
(39,783 |
) |
|
Total investments in real estate |
|
|
— |
|
|
|
1,365,588 |
|
|
|
19,853 |
|
|
|
1,385,441 |
|
|
Investments in securities and security-related receivables, at fair value |
|
|
— |
|
|
|
— |
|
|
|
— |
|
|
|
— |
|
|
Cash and cash equivalents |
|
|
— |
|
|
|
16,939 |
|
|
|
110 |
|
|
|
17,049 |
|
|
Restricted cash |
|
|
13,090 |
|
|
|
7,330 |
|
|
|
167 |
|
|
|
20,587 |
|
|
Accrued interest receivable |
|
|
75,238 |
|
|
|
— |
|
|
|
— |
|
|
|
75,238 |
|
|
Other assets |
|
|
11,068 |
|
|
|
5,153 |
|
|
|
7,457 |
|
|
|
23,678 |
|
|
Deferred financing costs |
|
|
|
|
|
|
|
|
|
|
|
|
|
|
|
|
|
Deferred financing costs |
|
|
26,028 |
|
|
|
11,493 |
|
|
|
345 |
|
|
|
37,866 |
|
|
Accumulated amortization |
|
|
(22,621 |
) |
|
|
(792 |
) |
|
|
(289 |
) |
|
|
(23,702 |
) |
|
Total deferred financing costs |
|
|
3,407 |
|
|
|
10,701 |
|
|
|
56 |
|
|
|
14,164 |
|
|
Intangible assets |
|
|
|
|
|
|
|
|
|
|
|
|
|
|
|
|
|
Intangible assets |
|
|
— |
|
|
|
15,287 |
|
|
|
— |
|
|
|
15,287 |
|
|
Accumulated amortization |
|
|
— |
|
|
|
(7,743 |
) |
|
|
— |
|
|
|
(7,743 |
) |
|
Total intangible assets |
|
|
— |
|
|
|
7,544 |
|
|
|
— |
|
|
|
7,544 |
|
|
Total assets |
|
$ |
1,502,753 |
|
|
$ |
1,413,255 |
|
|
$ |
27,643 |
|
|
$ |
2,943,651 |
|
|
Liabilities and Equity |
|
|
|
|
|
|
|
|
|
|
|
|
|
|
|
|
|
Indebtedness |
|
$ |
1,162,306 |
|
|
$ |
993,908 |
|
|
$ |
21,170 |
|
|
$ |
2,177,384 |
|
|
Accrued interest payable |
|
|
553 |
|
|
|
558 |
|
|
|
4,190 |
|
|
|
5,301 |
|
|
Accounts payable and accrued expenses |
|
|
3 |
|
|
|
18,724 |
|
|
|
3,267 |
|
|
|
21,994 |
|
|
Derivative liabilities |
|
|
7,993 |
|
|
|
— |
|
|
|
— |
|
|
|
7,993 |
|
|
Deferred taxes, borrowers’ escrows and other liabilities |
|
|
— |
|
|
|
5,610 |
|
|
|
3,462 |
|
|
|
9,072 |
|
|
Total liabilities |
|
|
1,170,855 |
|
|
|
1,018,800 |
|
|
|
32,089 |
|
|
|
2,221,744 |
|
|
Equity: |
|
|
|
|
|
|
|
|
|
|
|
|
|
|
|
|
|
Shareholders’ equity: |
|
|
|
|
|
|
|
|
|
|
|
|
|
|
|
|
|
Accumulated other comprehensive income (loss) |
|
|
(8,027 |
) |
|
|
5 |
|
|
|
— |
|
|
|
(8,022 |
) |
|
RAIT investment |
|
|
178,454 |
|
|
|
63,288 |
|
|
|
862 |
|
|
|
242,604 |
|
|
Retained earnings (deficit) |
|
|
161,471 |
|
|
|
(10,174 |
) |
|
|
(5,308 |
) |
|
|
145,989 |
|
|
Total shareholders’ equity |
|
|
331,898 |
|
|
|
53,119 |
|
|
|
(4,446 |
) |
|
|
380,571 |
|
|
Noncontrolling Interests |
|
|
— |
|
|
|
341,336 |
|
|
|
|
|
|
|
341,336 |
|
|
Total liabilities and equity |
|
$ |
1,502,753 |
|
|
$ |
1,413,255 |
|
|
$ |
27,643 |
|
|
$ |
2,943,651 |
|
32
RAIT Financial Trust
Notes to Consolidated Financial Statements
As of September 30, 2015
(Unaudited and dollars in thousands, except share and per share amounts)
|
|
|
As of December 31, 2014 |
|
|||||||||||||
|
|
|
RAIT Securitizations |
|
|
IRT |
|
|
RAIT VIE Properties |
|
|
Total |
|
||||
|
Assets |
|
|
|
|
|
|
|
|
|
|
|
|
|
|
|
|
|
Investments in mortgages and loans, at amortized cost: |
|
|
|
|
|
|
|
|
|
|
|
|
|
|
|
|
|
Commercial mortgages, mezzanine loans, other loans and preferred equity interests |
|
$ |
1,535,097 |
|
|
$ |
— |
|
|
$ |
— |
|
|
$ |
1,535,097 |
|
|
Allowance for losses |
|
|
(8,423 |
) |
|
|
— |
|
|
|
— |
|
|
|
(8,423 |
) |
|
Total investments in mortgages and loans |
|
|
1,526,674 |
|
|
|
— |
|
|
|
— |
|
|
|
1,526,674 |
|
|
Investments in real estate |
|
|
|
|
|
|
|
|
|
|
|
|
|
|
|
|
|
Investments in real estate |
|
|
— |
|
|
|
689,112 |
|
|
|
23,899 |
|
|
|
713,011 |
|
|
Accumulated depreciation |
|
|
— |
|
|
|
(23,376 |
) |
|
|
(3,686 |
) |
|
|
(27,062 |
) |
|
Total investments in real estate |
|
|
— |
|
|
|
665,736 |
|
|
|
20,213 |
|
|
|
685,949 |
|
|
Investments in securities and security-related receivables, at fair value |
|
|
10,995 |
|
|
|
— |
|
|
|
— |
|
|
|
10,995 |
|
|
Cash and cash equivalents |
|
|
— |
|
|
|
14,763 |
|
|
|
216 |
|
|
|
14,979 |
|
|
Restricted cash |
|
|
14,715 |
|
|
|
5,206 |
|
|
|
244 |
|
|
|
20,165 |
|
|
Accrued interest receivable |
|
|
74,904 |
|
|
|
— |
|
|
|
— |
|
|
|
74,904 |
|
|
Other assets |
|
|
136 |
|
|
|
2,270 |
|
|
|
6,908 |
|
|
|
9,314 |
|
|
Deferred financing costs |
|
|
|
|
|
|
|
|
|
|
|
|
|
|
|
|
|
Deferred financing costs |
|
|
26,028 |
|
|
|
3,429 |
|
|
|
346 |
|
|
|
29,803 |
|
|
Accumulated amortization |
|
|
(20,095 |
) |
|
|
(505 |
) |
|
|
(239 |
) |
|
|
(20,839 |
) |
|
Total deferred financing costs |
|
|
5,933 |
|
|
|
2,924 |
|
|
|
107 |
|
|
|
8,964 |
|
|
Intangible assets |
|
|
|
|
|
|
|
|
|
|
|
|
|
|
|
|
|
Intangible assets |
|
|
— |
|
|
|
7,597 |
|
|
|
— |
|
|
|
7,597 |
|
|
Accumulated amortization |
|
|
— |
|
|
|
(4,346 |
) |
|
|
— |
|
|
|
(4,346 |
) |
|
Total intangible assets |
|
|
— |
|
|
|
3,251 |
|
|
|
— |
|
|
|
3,251 |
|
|
Total assets |
|
$ |
1,633,357 |
|
|
$ |
694,150 |
|
|
$ |
27,688 |
|
|
$ |
2,355,195 |
|
|
Liabilities and Equity |
|
|
|
|
|
|
|
|
|
|
|
|
|
|
|
|
|
Indebtedness |
|
$ |
1,315,103 |
|
|
$ |
418,901 |
|
|
$ |
21,280 |
|
|
$ |
1,755,284 |
|
|
Accrued interest payable |
|
|
670 |
|
|
|
49 |
|
|
|
3,661 |
|
|
|
4,380 |
|
|
Accounts payable and accrued expenses |
|
|
3 |
|
|
|
8,353 |
|
|
|
3,290 |
|
|
|
11,646 |
|
|
Derivative liabilities |
|
|
20,051 |
|
|
|
— |
|
|
|
— |
|
|
|
20,051 |
|
|
Deferred taxes, borrowers’ escrows and other liabilities |
|
|
— |
|
|
|
3,813 |
|
|
|
2,950 |
|
|
|
6,763 |
|
|
Total liabilities |
|
|
1,335,827 |
|
|
|
431,116 |
|
|
|
31,181 |
|
|
|
1,798,124 |
|
|
Equity: |
|
|
|
|
|
|
|
|
|
|
|
|
|
|
|
|
|
Shareholders’ equity: |
|
|
|
|
|
|
|
|
|
|
|
|
|
|
|
|
|
Accumulated other comprehensive income (loss) |
|
|
(20,788 |
) |
|
|
— |
|
|
|
— |
|
|
|
(20,788 |
) |
|
RAIT investment |
|
|
114,207 |
|
|
|
71,024 |
|
|
|
743 |
|
|
|
185,974 |
|
|
Retained earnings (deficit) |
|
|
204,111 |
|
|
|
(16,728 |
) |
|
|
(4,236 |
) |
|
|
183,147 |
|
|
Total shareholders’ equity |
|
|
297,530 |
|
|
|
54,296 |
|
|
|
(3,493 |
) |
|
|
348,333 |
|
|
Noncontrolling Interests |
|
|
— |
|
|
|
208,738 |
|
|
|
— |
|
|
|
208,738 |
|
|
Total liabilities and equity |
|
$ |
1,633,357 |
|
|
$ |
694,150 |
|
|
$ |
27,688 |
|
|
$ |
2,355,195 |
|
The assets of the VIEs can only be used to settle obligations of the VIEs and are not available to our creditors. Certain amounts included in the table above are eliminated upon consolidation with our other subsidiaries that maintain investments in the debt or equity securities issued by these entities. We do not have any contractual obligation to provide the VIEs listed above with any financial support. We have not and do not intend to provide financial support to these VIEs that we were not previously contractually required to provide.
33
RAIT Financial Trust
Notes to Consolidated Financial Statements
As of September 30, 2015
(Unaudited and dollars in thousands, except share and per share amounts)
NOTE 10: SERIES D PREFERRED SHARES
On October 1, 2012, we entered into a Securities Purchase Agreement, or the purchase agreement, with ARS VI Investor I, LLC, or the investor, an affiliate of Almanac Realty Investors, LLC, or Almanac. During the period from the effective date of the purchase agreement through September 30, 2015, we sold to the investor on a private placement basis in four sales between October 2012 and March 2014 for an aggregate purchase price of $100,000, or the total commitment, the following securities, in the aggregate: (i) 4,000,000 Series D Cumulative Redeemable Preferred Shares of Beneficial Interest, par value $0.01 per share, of RAIT, or the Series D Preferred Shares, (ii) common share purchase warrants, or the warrants, exercisable for 9,931,000 of our common shares, or the common shares which have subsequently adjusted to 11,014,048 shares as of the date of filing this report), and (iii) common share appreciation rights, or the investor SARs, with respect to up to 6,735,667 common shares (which have subsequently adjusted to 7,470,241 shares as of the date of filing this report).
In September 2015, we amended the Securities Purchase Agreement with Almanac related to the Series D Preferred Shares. This amendment changed two of the covenants therein. As consideration for this amendment, we paid Almanac $450. We accounted for this amendment as a modification of the Series D Preferred Shares.
The warrants and investor SARs had an initial strike price of $6.00 per common share, subject to adjustment. As of the filing of this report, the strike price has adjusted to $5.41.
The warrants and investor SARs were both determined to be classified as liabilities and had a combined fair value of $22,590 as of September 30, 2015. The initial fair value of the warrants and investor SARs are recorded as a liability and re-measured at each reporting period until the warrants and investor SARs are settled. Changes in fair value will be recorded in earnings as a component of the change in fair value of financial instruments in the consolidated statement of operations.
The following table summarizes the sales activity of the Series D Preferred Shares from the effective date of the agreement through September 30, 2015:
|
Aggregate purchase price |
|
|
|
|
|
$ |
100,000 |
|
|
Initial value of warrants and investor SARs issued to-date |
|
|
(21,805 |
) |
|
|
|
|
|
Costs incurred |
|
|
(6,834 |
) |
|
|
|
|
|
Total discount |
|
|
|
|
|
|
(28,639 |
) |
|
Discount amortization to-date |
|
|
|
|
|
|
12,426 |
|
|
Carrying amount of Series D Preferred Shares |
|
|
|
|
|
$ |
83,787 |
|
NOTE 11: SHAREHOLDERS’ EQUITY
Preferred Shares
Dividends:
On February 10, 2015, our board of trustees declared a first quarter 2015 cash dividend of $0.484375 per share on our 7.75% Series A Preferred Shares, $0.5234375 per share on our 8.375% Series B Preferred Shares, $0.5546875 per share on our 8.875% Series C Preferred Shares and $0.4687500 per share on our Series D Preferred Shares. The dividends were paid on March 31, 2015 to holders of record on March 2, 2015 and totaled $6,296.
On May 20, 2015, our board of trustees declared a second quarter 2015 cash dividend of $0.484375 per share on our 7.75% Series A Preferred Shares, $0.5234375 per share on our 8.375% Series B Preferred Shares, $0.5546875 per share on our 8.875% Series C Preferred Shares and $0.4687500 per share on our Series D Preferred Shares. The dividends were paid on June 30, 2015 to holders of record on June 1, 2015 and totaled $6,569.
On July 28, 2015, our board of trustees declared a third quarter 2015 cash dividend of $0.484375 per share on our 7.75% Series A Preferred Shares, $0.5234375 per share on our 8.375% Series B Preferred Shares, $0.5546875 per share on our 8.875% Series C Preferred Shares and $0.4687500 per share on our Series D Preferred Shares. The dividends were be paid on September 30, 2015 to holders of record on September 1, 2015 and totaled $6,580.
34
RAIT Financial Trust
Notes to Consolidated Financial Statements
As of September 30, 2015
(Unaudited and dollars in thousands, except share and per share amounts)
On November 4, 2015, our board of trustees declared a fourth quarter 2015 cash dividend of $0.484375 per share on our 7.75% Series A Preferred Shares, $0.5234375 per share on our 8.375% Series B Preferred Shares, $0.5546875 per share on our 8.875% Series C Preferred Shares and $0.4687500 per share on our Series D Preferred Shares. The dividends will be paid on December 31, 2015 to holders of record on December 1, 2015.
At Market Issuance Sales Agreement (ATM):
On June 13, 2014, we entered into an At Market Issuance Sales Agreement, or the 2014 Preferred ATM agreement, with MLV & Co. LLC, or MLV, providing that, from time to time during the term of the 2014 Preferred ATM agreement, on the terms and subject to the conditions set forth therein, we may issue and sell through MLV, up to $150,000 aggregate amount of preferred shares.
With respect to each series of preferred shares, the maximum amount issuable is as follows: 4,000,000 Series A Preferred Shares, 1,000,000 Series B Preferred Shares, and 1,000,000 Series C Preferred Shares. Unless the 2014 Preferred ATM agreement is earlier terminated by MLV or us, the 2014 Preferred ATM agreement automatically terminates upon the issuance and sale of all of the Series A Preferred Shares, Series B Preferred Shares, and Series C Preferred Shares.
During the three-month period ended September 30, 2015, we issued a total of 2,493 Series A Preferred Shares pursuant to this agreement at a weighted-average price of $21.35 and we received $52 of net proceeds. During the nine-month period ended September 30, 2015, we issued a total of 530,515 Series A Preferred Shares pursuant to this agreement at a weighted-average price of $23.10 and we received $11,884 of net proceeds. During the three-month period ended September 30, 2015, we issued a total of 15,343 Series B Preferred Shares pursuant to this agreement at a weighted-average price of $22.01 per share and we received $328 of net proceeds. During the nine-month periods ended September 30, 2015, we issued a total of 52,504 Series B Preferred Shares pursuant to this agreement at a weighted-average price of $23.65 per share and we received $1,203 of net proceeds. During the three- and nine-month periods ended September 30, 2015, we issued 325 Series C Preferred Shares pursuant to this agreement at a weighted-average price of $22.90 and we received $7 of net proceeds.
As of September 30, 2015, 2,763,204 Series A Preferred Shares, 947,496 Series B Preferred Shares, and 999,675 Series C Preferred Shares remain available for issuance under the 2014 Preferred ATM agreement.
Common Shares
Dividends:
On March 16, 2015, the board of trustees declared a $0.18 dividend on our common shares to holders of record as of April 10, 2015. The dividend was paid on April 30, 2015 and totaled $14,773.
On June 22, 2015, the board of trustees declared a $0.18 dividend on our common shares to holders of record as of July 10, 2015. The dividend was paid on July 31, 2015 and totaled $14,775.
On September 17, 2015, the board of trustees declared a $0.18 dividend on our common shares to holders of record as of October 9, 2015. The dividend was paid on October 30, 2015 and totaled $16,276.
Equity Compensation:
On February 10, 2015, the compensation committee awarded 48,405 common share awards, valued at $350 using our closing stock price of $7.23, to the board’s non-management trustees. These awards vested immediately. On February 10, 2015, the compensation committee awarded 338,500 restricted common share awards, valued at $2,447 using our closing stock price of $7.23, to our executive officers and non-executive officer employees. These awards generally vest over three-year periods.
On February 10, 2015, the compensation committee awarded 1,177,500 stock appreciation rights, or SARs, valued at $1,126 based on Black-Scholes option pricing model at the date of grant, to our executive officers and non-executive officer employees. The SARs vest over a three-year period and may be exercised between the date of vesting and January 29, 2019, the expiration date of the SARs.
35
RAIT Financial Trust
Notes to Consolidated Financial Statements
As of September 30, 2015
(Unaudited and dollars in thousands, except share and per share amounts)
On March 31, 2015, the compensation committee adopted a 2015 Annual Incentive Compensation Plan, or the annual cash bonus plan, and made awards to three of our executive officers, or the eligible officers, setting forth the basis on which 2015 target cash bonus awards are earned. In addition, the compensation committee adopted a 2015 Long Term Incentive Plan, or the LTIP, and made awards to the eligible officers setting forth the basis on which the eligible officers could earn equity compensation for the years 2015 through 2018. Pursuant to the LTIP, each eligible officer was granted an initial long term equity award, consisting of both a performance share unit award for a three year performance period and an annual restricted share award vesting over a four year period. Three components of the performance share unit award have market conditions and had grant date fair values of $3.35, $3.26 and $2.17 per share. Both the annual cash bonus plan and the LTIP were adopted pursuant to our 2012 Incentive Award Plan. From the date of adoption through September 30, 2015, we recorded $244 of compensation expense related to the LTIP.
The total compensation awarded under our new short term annual cash bonus plan is at-risk and tied to pre-determined performance criteria. For 2015, 75% of the target cash bonus awards is payable based on the following objective performance goals and weightings; cash available for distribution per share of 35%, adjusted book value per share of 20% and return on equity at 20%. The amounts are earned based on our annual performance relative to threshold, target and maximum performance goals for these objective measures, with 50% of target incentive opportunity payable based on threshold performance achieved, 100% based on target performance achieved and 150% based on maximum performance achieved. The remaining 25% of the target cash bonus award is based on the achievement of various individual performance criterion that may be earned based on individual performance factors deemed relevant by the compensation committee.
The long term incentive plan is an equity program whereby long-term performance awards are granted each year and earned based on our performance over a three year period. Compensation awarded under the long term equity plan is based on predefined performance for 75% of the award, performance measures and weighting for the performance component of the 2015-2017 awards are based on the following objective performance measures relating to the total shareholder return (stock price appreciation plus aggregate dividends or TSR); TSR as compared to a peer group of public companies over the same period at 40%, TSR as compared to the TSR for the NAREIT Mortgage Index at 20%, company’s absolute TSR at 20%, and strategic objective at 20%. The remaining 25% of the compensation award is time-based vesting over three years.
Dividend Reinvestment and Share Purchase Plan (DRSPP):
We have a dividend reinvestment and share purchase plan, or DRSPP, under which we registered and reserved for issuance, in the aggregate, 10,500,000 common shares. During the nine-month period ended September 30, 2015, we issued a total of 6,106 common shares pursuant to the DRSPP at a weighted-average price of $6.29 per share and we received $38 of net proceeds. As of September 30, 2015, 7,764,433 common shares, in the aggregate, remain available for issuance under the DRSPP.
Capital on Demand™ Sales Agreement (COD):
On November 21, 2012, we entered into a Capital on Demand™ Sales Agreement, or the COD sales agreement, with JonesTrading Institutional Services LLC, or JonesTrading, pursuant to which we may issue and sell up to 10,000,000 of our common shares from time to time through JonesTrading acting as agent and/or principal, subject to the terms and conditions of the COD sales agreement. Unless the COD sales agreement is earlier terminated by JonesTrading or us, the COD sales agreement automatically terminates upon the issuance and sale of all of the common shares subject to the COD sales agreement. During the nine-month period ended September 30, 2015, we did not issue any common shares pursuant to this agreement. As of September 30, 2015, 7,918,919 common shares, in the aggregate, remain available for issuance under the COD sales agreement.
Common Share Public Offering:
On August 5, 2015, we completed an 8,000,000 common share offering at a net price of $5.40 per common share. After all transaction costs, our proceeds were $42,440.
Noncontrolling Interests
On January 29, 2014, IRT completed an underwritten public offering selling 8,050,000 shares of IRT common stock for $8.30 per share raising net proceeds of $62,718. We purchased 1,204,819 shares of common stock in the offering, at the public offering price, for which no underwriting discounts and commissions were paid to the underwriters. On July 21, 2014, IRT completed an
36
RAIT Financial Trust
Notes to Consolidated Financial Statements
As of September 30, 2015
(Unaudited and dollars in thousands, except share and per share amounts)
underwritten public offering selling 8,050,000 shares of IRT common stock for $9.50 per share raising net proceeds of $72,002. We purchased 300,000 shares of common stock in the offering, at the public offering price, for which no underwriting discounts and commissions were paid to the underwriters. On November 25, 2014, IRT completed an underwritten public offering selling 6,000,000 shares of IRT common stock for $9.60 per share raising net proceeds of $54,648. On September 17, 2015, IRT issued 15,110,994 shares of IRT common stock in connection with the TSRE merger. As of September 30, 2015 and December 31, 2014, we held 7,269,719 shares, respectively, of IRT common stock representing 15.5% and 22.9%, respectively, of the outstanding shares of IRT common stock. On September 17, 2015 IRT also issued 1,925,419 IROP units in connection with the TSRE merger. We consolidate IRT as it is a VIE and we are the primary beneficiary. See Note 5 for additional disclosure regarding the TSRE merger. See Note 9 for additional disclosures pertaining to VIEs.
NOTE 12: EARNINGS (LOSS) PER SHARE
The following table presents a reconciliation of basic and diluted earnings (loss) per share for the three-month and nine-month periods ended September 30, 2015 and 2014:
|
|
|
For the Three-Month |
|
|
For the Nine-Month |
|
||||||||||
|
|
|
Periods Ended September 30 |
|
|
Periods Ended September 30 |
|
||||||||||
|
|
|
2015 |
|
|
2014 |
|
|
2015 |
|
|
2014 |
|
||||
|
Net income (loss) |
|
$ |
24,826 |
|
|
$ |
(16,462 |
) |
|
$ |
51,533 |
|
|
$ |
(42,895 |
) |
|
(Income) loss allocated to preferred shares |
|
|
(8,303 |
) |
|
|
(7,407 |
) |
|
|
(24,383 |
) |
|
|
(20,628 |
) |
|
(Income) loss allocated to noncontrolling interests |
|
|
(23,055 |
) |
|
|
603 |
|
|
|
(21,823 |
) |
|
|
20 |
|
|
Net income (loss) allocable to common shares |
|
$ |
(6,532 |
) |
|
$ |
(23,266 |
) |
|
$ |
5,327 |
|
|
$ |
(63,503 |
) |
|
Weighted-average shares outstanding—Basic |
|
|
87,110,958 |
|
|
|
81,967,806 |
|
|
|
83,799,244 |
|
|
|
81,111,796 |
|
|
Dilutive securities |
|
|
— |
|
|
|
— |
|
|
|
1,846,365 |
|
|
|
— |
|
|
Weighted-average shares outstanding—Diluted |
|
|
87,110,958 |
|
|
|
81,967,806 |
|
|
|
85,645,609 |
|
|
|
81,111,796 |
|
|
Earnings (loss) per share—Basic: |
|
|
|
|
|
|
|
|
|
|
|
|
|
|
|
|
|
Earnings (loss) per share—Basic |
|
$ |
(0.07 |
) |
|
$ |
(0.28 |
) |
|
$ |
0.06 |
|
|
$ |
(0.78 |
) |
|
Earnings (loss) per share—Diluted: |
|
|
|
|
|
|
|
|
|
|
|
|
|
|
|
|
|
Earnings (loss) per share—Diluted |
|
$ |
(0.07 |
) |
|
$ |
(0.28 |
) |
|
$ |
0.06 |
|
|
$ |
(0.78 |
) |
For the three-month and nine-month periods ended September 30, 2015, securities convertible into 21,143,824 and 20,720,300 common shares, respectively, were excluded from the earnings (loss) per share computations because their effect would have been anti-dilutive. For the three-month and nine-month periods ended September 30, 2014, securities convertible into 31,456,338 and 31,539,962 common shares, respectively, were excluded from the earnings (loss) per share computations because their effect would have been anti-dilutive.
NOTE 13: RELATED PARTY TRANSACTIONS
In the ordinary course of our business operations, we have ongoing relationships and have engaged in transactions with the related entities described below. All of these relationships and transactions were approved or ratified by our audit committee as being on terms comparable to those available on an arm’s-length basis from an unaffiliated third party or otherwise not creating a conflict of interest.
Andrew M. Silberstein serves as a trustee on our board of trustees, as designated pursuant to the purchase agreement. Mr. Silberstein is an equity owner of Almanac and an officer of the investor and holds indirect equity interests in the investor. The transactions pursuant to the purchase agreement are described above in Note 10.
37
RAIT Financial Trust
Notes to Consolidated Financial Statements
As of September 30, 2015
(Unaudited and dollars in thousands, except share and per share amounts)
NOTE 14: SUPPLEMENTAL DISCLOSURE TO STATEMENT OF CASH FLOWS
The following are supplemental disclosures to the statements of cash flows for the six-month periods ended September 30, 2015 and 2014:
|
|
|
For the Nine-Month |
|
|||||
|
|
|
Periods Ended September 30 |
|
|||||
|
|
|
2015 |
|
|
2014 |
|
||
|
Cash paid for interest |
|
$ |
51,839 |
|
|
$ |
29,129 |
|
|
Cash paid (refunds received) for taxes |
|
|
283 |
|
|
|
191 |
|
|
Non-cash increase in investments in real estate from conversion of loans |
|
|
— |
|
|
|
35,180 |
|
|
Non-cash increase in non-controlling interest from property acquisition |
|
|
— |
|
|
|
3,362 |
|
|
Non-cash increase (decrease) in indebtedness from conversion to shares or debt extinguishments |
|
|
— |
|
|
|
(2,421 |
) |
|
Non-cash increase in indebtedness from the assumption of debt from property acquisitions |
|
|
121,885 |
|
|
|
129,660 |
|
|
Non-cash increase in other assets from business combination |
|
|
— |
|
|
|
7,302 |
|
Also, during the nine months ended September 30, 2015, we deconsolidated a real estate property which resulted in a non-cash decrease of $23,897 to investments in real estate, a non-cash increase of $4,791 to investment in mortgages, loans and preferred equity interests, and a non-cash decrease of $18,382 to indebtedness. During the nine months ended September 30, 2015, we sold 1 real estate property whose purchase price was financed by an existing RAIT loan on the property that was assumed by the buyer. This resulted in a non-cash decrease of $15,751 to investments in real estate and a non-cash increase of $18,000 to investment in commercial mortgages, mezzanine loans and preferred equity interests.
NOTE 15: SEGMENT REPORTING
As a group, our executive officers act as the Chief Operating Decision Maker (“CODM”). The CODM reviews operating results of our reportable segments to make decisions about investments and resources and to assess performance for each of these reportable segments. We conduct our business through the following reportable segments:
|
|
· |
Our real estate lending, owning and managing segment concentrates on lending, owning and managing commercial real estate assets throughout the United States. The form of our investment may range from first mortgage loans to equity ownership of a commercial real estate property. We manage our investments in-house through our asset management and property management professionals. |
|
|
· |
Our IRT segment concentrates on the ownership of apartment properties in opportunistic markets throughout the United States. As of September 30, 2015, IRT owns properties totaling $1,400,892 in gross real estate investments, before accumulated depreciation. |
38
RAIT Financial Trust
Notes to Consolidated Financial Statements
As of September 30, 2015
(Unaudited and dollars in thousands, except share and per share amounts)
|
|
|
Real Estate Lending Owning and Management |
|
|
IRT |
|
|
Taberna |
|
|
Eliminations (a) |
|
|
Consolidated |
|
|||||
|
Three-Month Period Ended September 30, 2015: |
|
|
|
|
|
|
|
|
|
|
|
|
|
|
|
|
|
|
|
|
|
Net interest margin |
|
$ |
16,690 |
|
|
$ |
- |
|
|
$ |
- |
|
|
$ |
(243 |
) |
|
$ |
16,447 |
|
|
Rental income |
|
|
29,967 |
|
|
|
25,492 |
|
|
|
— |
|
|
|
— |
|
|
|
55,459 |
|
|
Fee and other income |
|
|
7,932 |
|
|
|
— |
|
|
|
— |
|
|
|
(4,876 |
) |
|
|
3,056 |
|
|
Provision for losses |
|
|
1,850 |
|
|
|
— |
|
|
|
— |
|
|
|
— |
|
|
|
1,850 |
|
|
Depreciation and amortization expense |
|
|
10,464 |
|
|
|
4,704 |
|
|
|
— |
|
|
|
— |
|
|
|
15,168 |
|
|
Operating income |
|
|
(1,189 |
) |
|
|
(10,886 |
) |
|
|
— |
|
|
|
— |
|
|
|
(12,075 |
) |
|
Change in fair value of financial instruments |
|
|
620 |
|
|
|
— |
|
|
|
— |
|
|
|
— |
|
|
|
620 |
|
|
Income tax benefit (provision) |
|
|
(23 |
) |
|
|
— |
|
|
|
— |
|
|
|
— |
|
|
|
(23 |
) |
|
Net income (loss) |
|
$ |
498 |
|
|
$ |
25,636 |
|
|
$ |
- |
|
|
$ |
(1,308 |
) |
|
$ |
24,826 |
|
|
|
|
|
|
|
|
|
|
|
|
|
|
|
|
|
|
|
|
|
|
|
|
Three-Month Period Ended September 30, 2014: |
|
|
|
|
|
|
|
|
|
|
|
|
|
|
|
|
|
|
|
|
|
Net interest margin |
|
$ |
21,904 |
|
|
$ |
- |
|
|
$ |
7,148 |
|
|
$ |
(3,415 |
) |
|
$ |
25,637 |
|
|
Rental income |
|
|
28,757 |
|
|
|
13,049 |
|
|
|
— |
|
|
|
— |
|
|
|
41,806 |
|
|
Fee and other income |
|
|
9,891 |
|
|
|
— |
|
|
|
316 |
|
|
|
(2,365 |
) |
|
|
7,842 |
|
|
Provision for losses |
|
|
1,500 |
|
|
|
— |
|
|
|
— |
|
|
|
— |
|
|
|
1,500 |
|
|
Depreciation and amortization expense |
|
|
9,894 |
|
|
|
3,309 |
|
|
|
33 |
|
|
|
— |
|
|
|
13,236 |
|
|
Operating income |
|
|
8,328 |
|
|
|
(65 |
) |
|
|
6,648 |
|
|
|
(1,905 |
) |
|
|
13,006 |
|
|
Change in fair value of financial instruments |
|
|
12,493 |
|
|
|
— |
|
|
|
(22,716 |
) |
|
|
— |
|
|
|
(10,223 |
) |
|
Income tax benefit (provision) |
|
|
2,198 |
|
|
|
— |
|
|
|
(4 |
) |
|
|
— |
|
|
|
2,194 |
|
|
Net income (loss) |
|
$ |
24,381 |
|
|
$ |
(58 |
) |
|
$ |
(37,572 |
) |
|
$ |
(3,213 |
) |
|
$ |
(16,462 |
) |
|
(a) |
The transactions that occur between the reportable segments include advisory and property management services, as well as, providing commercial mortgages on our owned real estate. |
39
RAIT Financial Trust
Notes to Consolidated Financial Statements
As of September 30, 2015
(Unaudited and dollars in thousands, except share and per share amounts)
|
|
|
Real Estate Lending Owning and Management |
|
|
IRT |
|
|
Taberna |
|
|
Eliminations (a) |
|
|
Consolidated |
|
|||||
|
Nine-Month Period Ended September 30, 2015: |
|
|
|
|
|
|
|
|
|
|
|
|
|
|
|
|
|
|
|
|
|
Net interest margin |
|
$ |
50,028 |
|
|
$ |
- |
|
|
$ |
- |
|
|
$ |
(722 |
) |
|
$ |
49,306 |
|
|
Rental income |
|
|
94,454 |
|
|
|
69,867 |
|
|
|
— |
|
|
|
— |
|
|
|
164,321 |
|
|
Fee and other income |
|
|
29,557 |
|
|
|
— |
|
|
|
— |
|
|
|
(13,492 |
) |
|
|
16,065 |
|
|
Provision for losses |
|
|
5,850 |
|
|
|
— |
|
|
|
— |
|
|
|
— |
|
|
|
5,850 |
|
|
Depreciation and amortization expense |
|
|
34,728 |
|
|
|
16,462 |
|
|
|
— |
|
|
|
— |
|
|
|
51,190 |
|
|
Operating income |
|
|
(2,787 |
) |
|
|
(10,775 |
) |
|
|
— |
|
|
|
— |
|
|
|
(13,562 |
) |
|
Change in fair value of financial instruments |
|
|
13,466 |
|
|
|
— |
|
|
|
— |
|
|
|
— |
|
|
|
13,466 |
|
|
Income tax benefit (provision) |
|
|
(1,320 |
) |
|
|
— |
|
|
|
— |
|
|
|
— |
|
|
|
(1,320 |
) |
|
Net income (loss) |
|
$ |
29,711 |
|
|
$ |
25,748 |
|
|
$ |
- |
|
|
$ |
(3,926 |
) |
|
$ |
51,533 |
|
|
|
|
|
|
|
|
|
|
|
|
|
|
|
|
|
|
|
|
|
|
|
|
Nine-Month Period Ended September 30, 2014: |
|
|
|
|
|
|
|
|
|
|
|
|
|
|
|
|
|
|
|
|
|
Net interest margin |
|
$ |
71,251 |
|
|
$ |
- |
|
|
$ |
24,453 |
|
|
$ |
(15,164 |
) |
|
$ |
80,540 |
|
|
Rental income |
|
|
83,382 |
|
|
|
32,822 |
|
|
|
— |
|
|
|
— |
|
|
|
116,204 |
|
|
Fee and other income |
|
|
24,062 |
|
|
|
— |
|
|
|
932 |
|
|
|
(5,881 |
) |
|
|
19,113 |
|
|
Provision for losses |
|
|
3,500 |
|
|
|
— |
|
|
|
— |
|
|
|
— |
|
|
|
3,500 |
|
|
Depreciation and amortization expense |
|
|
29,955 |
|
|
|
8,664 |
|
|
|
100 |
|
|
|
— |
|
|
|
38,719 |
|
|
Operating income |
|
|
20,675 |
|
|
|
(145 |
) |
|
|
22,823 |
|
|
|
(4,891 |
) |
|
|
38,462 |
|
|
Change in fair value of financial instruments |
|
|
14,811 |
|
|
|
— |
|
|
|
(74,244 |
) |
|
|
— |
|
|
|
(59,433 |
) |
|
Income tax benefit (provision) |
|
|
2,970 |
|
|
|
— |
|
|
|
(516 |
) |
|
|
— |
|
|
|
2,454 |
|
|
Net income (loss) |
|
$ |
44,251 |
|
|
$ |
2,749 |
|
|
$ |
(81,149 |
) |
|
$ |
(8,746 |
) |
|
$ |
(42,895 |
) |
NOTE 16: COMMITMENTS AND CONTINGENCIES
We are involved from time to time in litigation on various matters, including disputes with tenants of owned properties, disputes arising out of agreements to purchase or sell properties and disputes arising out of our loan portfolio. Given the nature of our business activities, these lawsuits are considered routine to the conduct of our business. The result of any particular lawsuit cannot be predicted, because of the very nature of litigation, the litigation process and its adversarial nature, and the jury system. We do not expect that the liabilities, if any, that may ultimately result from such routine legal actions will have a material adverse effect on our consolidated financial position, results of operations or cash flows.
On September 16, 2014, Taberna Capital Management, LLC, or TCM, our subsidiary, reached an agreement in principle with the staff of the Securities and Exchange Commission, or the SEC, to resolve a non-public investigation initiated by SEC staff. Consistent with this agreement in principle, the SEC accepted an offer of settlement submitted by TCM and entered an order (administrative proceeding file no. 3-16776), or the order, on September 2, 2015. TCM consented to the entry of the order without admitting or denying the findings therein. The order, among other things, required TCM to pay disgorgement of $13.0 million, prejudgment interest of $2.0 million and a civil penalty of $6.5 million, aggregating to payments of $21.5 million. The aggregate amount of these payments was consistent with our prior disclosure regarding the agreement in principle referenced above. As previously disclosed, we took a charge of $21.5 million relating to this settlement in 2014. In connection with TCM’s offer of settlement, RAIT Financial Trust provided a written commitment, or the commitment, to the SEC which became effective the date of the order. The commitment provided, among other things, that RAIT would ensure the payment by TCM of the $21.5 million of payments referenced above, which payments were made September 3, 2015.
The individuals named in the order were one of the two former executive officers and the former employee of RAIT which RAIT previously disclosed had received “Wells Notices” from the SEC staff relating to the subject of such investigation. The former executive officer left RAIT as of December 31, 2014 and the former employee left RAIT in 2010. We have been informed that the SEC staff has notified the other former executive officer who received a Wells Notice that the staff has concluded its investigation as
40
RAIT Financial Trust
Notes to Consolidated Financial Statements
As of September 30, 2015
(Unaudited and dollars in thousands, except share and per share amounts)
to such former executive officer and that it does not intend to recommend that the SEC commence any enforcement action against such former executive officer.
41
Forward-Looking Statements
In addition to historical information, this discussion and analysis contains forward-looking statements. These statements can be identified by the use of forward-looking terminology including “may,” “believe,” “will,” “expect,” “anticipate,” “estimate,” “seek,” “continue” or similar words. These forward-looking statements are subject to risks and uncertainties that could cause actual results to differ materially from those projected in the forward-looking statements. These risks and uncertainties include, without limitation, those set forth in our filings with the Securities and Exchange Commission, including those described in the “Forward Looking Statements” and “Risk Factors” sections of our Annual Report on Form 10-K for the year ended December 31, 2014, and that we cannot assure you that we will be able to successfully implement the property sales program or achieve the expected results described in the Overview below. Readers are cautioned not to place undue reliance on these forward-looking statements, which reflect management’s analysis only as of the date hereof. We undertake no obligation to publicly revise or update these forward-looking statements to reflect events or circumstances that arise after the date of this report, except as may be required by applicable law.
Overview
We are a multi-strategy commercial real estate company that is a self-managed and self-advised Maryland real estate investment trust, or REIT. We use our vertically integrated platform to originate commercial real estate loans, acquire commercial real estate properties and invest in, manage and service commercial real estate assets. We offer a comprehensive set of debt financing options to the commercial real estate industry and provide asset and property management services. We also own and manage a portfolio of commercial real estate properties and manage real estate assets for third parties. We believe this approach delivers diversification to our investment portfolio blending the higher-yielding lending business with the stability and recurring income stream from owning and managing properties.
In order to take advantage of market opportunities in the future, and to maximize shareholder value over time, we will continue to focus on:
|
|
• |
|
expanding RAIT’s commercial real estate revenue by investing in commercial real estate-related assets, managing and servicing investments for our own account or for others, and providing property management services; |
|
|
• |
|
creating value through investing in our commercial real estate properties and implementing cost savings programs to help maximize property value over time; |
|
|
• |
|
identifying opportunities to generate gains through the sale of commercial real estate properties; |
|
|
• |
|
maintaining and expanding our sources of liquidity; |
|
|
• |
|
managing our leverage to provide risk-adjusted returns for our shareholders; and |
|
|
• |
|
managing our investment portfolios to reposition under-performing assets to seek to increase our cash flows and the value of our assets over time. |
Our implementation of these strategies has contributed to our loan production, improved performance in our owned real estate and our cash available for distribution, a non-GAAP financial measure. During the nine-month period ended September 30, 2015, we originated $675.1 million of commercial real estate loans, had conduit loan sales of $339.5 million and CRE loan repayments of $169.6 million, resulting in net loan growth of $166.0 million, despite volatility in the CMBS markets in the third quarter of 2015 discussed below. Our rental income increased due to the acquisition of 20 properties, less the sale of 3 properties and deconsolidation of 1 property since December 31, 2014 and improving occupancy and rental rates in our historical portfolio. Improving occupancy and rental rates in our historical portfolio also increased our rental income and net operating income. Our cash available for distribution, a non-GAAP financial measure, for the nine-month period ended September 30, 2015 increased to $0.83 per common share, including $0.07 per common share from property sales during the three-month period ended September 30, 2015, from $0.45 per common share for the comparable period in 2014. See “Non-GAAP Financial Measures” below for further disclosure regarding cash available for distribution. IRT completed its acquisition of TSRE in the third quarter of 2015. As IRT's external manager, in just over two years we have successfully grown IRT to 50 properties with over 14,000 units and total capitalization of $1.4 billion. This growth has led to an increasing recurrent fee stream to us for the services we provide to IRT. We generated GAAP net income allocable to common shares of $5.3 million, or $0.06 per common share-diluted, during the nine-month period ended September 30, 2015.
We will continue to seek to simplify our business and focus on our core strategy, commercial real estate lending. To do this we are accelerating the RAIT property sale program in order to recycle capital for reinvestment. We plan to sell a number of RAIT-owned properties over the next six months. We expect each of the sales to be accretive to our cash available for distribution, reduce leverage, and enable us to reallocate a significant amount of capital into the higher yielding lending business.
42
Set forth below are key statistics relating to our business through September 30, 2015 (dollars in thousands, except per share data):
|
|
|
As of or For the Three-Month Periods Ended |
|
||||||||||||||||||
|
|
|
September 30, |
|
|
|
June 30, |
|
|
March 31, |
|
|
December 31, |
|
|
September 30, |
|
|||||
|
|
|
2015 |
|
|
|
2015 |
|
|
2015 |
|
|
2014 |
|
|
2014 |
|
|||||
|
Financial Statistics: |
|
|
|
|
|
|
|
|
|
|
|
|
|
|
|
|
|
|
|
|
|
|
Total revenue |
|
$ |
74,962 |
|
|
|
$ |
79,020 |
|
|
$ |
75,710 |
|
|
$ |
73,832 |
|
|
$ |
75,285 |
|
|
Net interest margin |
|
$ |
16,447 |
|
|
|
$ |
16,525 |
|
|
$ |
16,334 |
|
|
$ |
22,569 |
|
|
$ |
25,637 |
|
|
Fee and other income |
|
$ |
3,056 |
|
|
|
$ |
7,415 |
|
|
$ |
5,594 |
|
|
$ |
5,167 |
|
|
$ |
7,842 |
|
|
Earnings (loss) per share, diluted |
|
$ |
(0.07 |
) |
|
|
$ |
0.22 |
|
|
$ |
(0.09 |
) |
|
$ |
(3.11 |
) |
|
$ |
(0.28 |
) |
|
Funds from operations per share |
|
$ |
(0.05 |
) |
|
|
$ |
0.15 |
|
|
$ |
0.05 |
|
|
$ |
(2.97 |
) |
|
$ |
(0.17 |
) |
|
Cash available for distribution per share |
|
$ |
0.27 |
|
|
|
$ |
0.37 |
|
|
$ |
0.19 |
|
|
$ |
0.26 |
|
|
-- |
|
|
|
Common dividend declared per share |
|
$ |
0.18 |
|
|
|
$ |
0.18 |
|
|
$ |
0.18 |
|
|
$ |
0.18 |
|
|
$ |
0.18 |
|
|
Assets under management |
|
$ |
5,820,702 |
|
|
|
$ |
4,764,259 |
|
|
$ |
4,607,413 |
|
|
$ |
4,485,525 |
|
|
$ |
5,417,579 |
|
|
Total gross assets |
|
$ |
4,475,217 |
|
|
|
$ |
3,754,148 |
|
|
$ |
3,741,103 |
|
|
$ |
3,681,955 |
|
|
$ |
3,912,032 |
|
|
Commercial Real Estate (“CRE”) Loan Portfolio (a): |
|
|
|
|
|
|
|
|
|
|
|
|
|
|
|
|
|
|
|
|
|
|
CRE Loans—unpaid principal |
|
$ |
1,604,680 |
|
|
|
$ |
1,524,159 |
|
|
$ |
1,518,969 |
|
|
$ |
1,409,254 |
|
|
$ |
1,369,138 |
|
|
CRE Loans—weighted average coupon |
|
|
6.2 |
% |
|
|
|
6.0 |
% |
|
|
6.6 |
% |
|
|
6.5 |
% |
|
|
6.6 |
% |
|
Gross loan production |
|
$ |
237,674 |
|
|
|
$ |
218,613 |
|
|
$ |
218,770 |
|
|
$ |
255,335 |
|
|
$ |
255,773 |
|
|
Non-accrual loans—unpaid principal |
|
$ |
40,496 |
|
|
|
$ |
24,851 |
|
|
$ |
24,851 |
|
|
$ |
25,281 |
|
|
$ |
40,741 |
|
|
Non-accrual loans as a % of reported loans |
|
|
2.5 |
% |
|
|
|
1.6 |
% |
|
|
1.6 |
% |
|
|
1.8 |
% |
|
|
3.0 |
% |
|
Reserve for losses |
|
$ |
14,646 |
|
|
|
$ |
12,796 |
|
|
$ |
10,797 |
|
|
$ |
9,218 |
|
|
$ |
15,662 |
|
|
Reserves as a % of non-accrual loans |
|
|
36.2 |
% |
|
|
|
51.5 |
% |
|
|
43.4 |
% |
|
|
36.5 |
% |
|
|
38.4 |
% |
|
Provision for losses |
|
$ |
1,850 |
|
|
|
$ |
2,000 |
|
|
$ |
2,000 |
|
|
$ |
2,000 |
|
|
$ |
1,500 |
|
|
CRE Property Portfolio: |
|
|
|
|
|
|
|
|
|
|
|
|
|
|
|
|
|
|
|
|
|
|
Reported investments in real estate, net (b) |
|
$ |
2,259,750 |
|
|
|
$ |
1,605,316 |
|
|
$ |
1,658,659 |
|
|
$ |
1,671,971 |
|
|
$ |
1,400,715 |
|
|
Net operating income (b) |
|
$ |
29,541 |
|
|
|
$ |
29,116 |
|
|
$ |
27,990 |
|
|
$ |
23,148 |
|
|
$ |
20,932 |
|
|
Number of properties owned (b) |
|
|
105 |
|
|
|
|
87 |
|
|
|
89 |
|
|
|
89 |
|
|
|
80 |
|
|
RAIT Multifamily units owned |
|
|
5,763 |
|
|
|
|
5,911 |
|
|
|
7,043 |
|
|
|
7,043 |
|
|
|
7,043 |
|
|
IRT Multifamily units owned |
|
|
14,044 |
|
|
|
|
9,055 |
|
|
|
8,819 |
|
|
|
8,819 |
|
|
|
6,473 |
|
|
Office square feet owned |
|
|
2,498,803 |
|
|
|
|
2,498,803 |
|
|
|
2,498,803 |
|
|
|
2,498,803 |
|
|
|
2,286,284 |
|
|
Retail square feet owned |
|
|
1,378,171 |
|
|
|
|
1,378,171 |
|
|
|
1,378,171 |
|
|
|
1,356,487 |
|
|
|
1,356,487 |
|
|
Redevelopment square feet owned |
|
|
436,719 |
|
|
|
|
436,719 |
|
|
|
435,307 |
|
|
|
434,482 |
|
|
|
434,482 |
|
|
Acres of land owned |
|
|
20.82 |
|
|
|
|
21.92 |
|
|
|
21.92 |
|
|
|
21.92 |
|
|
|
21.92 |
|
|
Average physical occupancy data: |
|
|
|
|
|
|
|
|
|
|
|
|
|
|
|
|
|
|
|
|
|
|
RAIT Multifamily properties |
|
|
93.8 |
% |
|
|
|
94.0 |
% |
|
|
93.0 |
% |
|
|
92.4 |
% |
|
|
93.1 |
% |
|
IRT Multifamily properties |
|
|
94.0 |
% |
|
|
|
93.6 |
% |
|
|
93.5 |
% |
|
|
91.9 |
% |
|
|
93.1 |
% |
|
Office properties |
|
|
77.9 |
% |
|
|
|
76.8 |
% |
|
|
75.2 |
% |
|
|
75.4 |
% |
|
|
74.3 |
% |
|
Retail properties (f) |
|
|
69.0 |
% |
|
|
|
69.6 |
% |
|
|
70.6 |
% |
|
|
70.8 |
% |
|
|
71.5 |
% |
|
Average effective rent per unit/square foot (c) |
|
|
|
|
|
|
|
|
|
|
|
|
|
|
|
|
|
|
|
|
|
|
RAIT Multifamily (d) |
|
$ |
841 |
|
|
|
$ |
826 |
|
|
$ |
812 |
|
|
$ |
806 |
|
|
$ |
805 |
|
|
IRT Multifamily (d) |
|
$ |
950 |
|
|
|
$ |
840 |
|
|
$ |
827 |
|
|
$ |
792 |
|
|
$ |
791 |
|
|
Office (e) |
|
$ |
21.31 |
|
|
|
$ |
21.16 |
|
|
$ |
21.01 |
|
|
$ |
20.48 |
|
|
$ |
18.96 |
|
|
Retail (e) (f) |
|
$ |
14.71 |
|
|
|
$ |
15.98 |
|
|
$ |
14.03 |
|
|
$ |
14.34 |
|
|
$ |
14.72 |
|
|
(a) |
CRE Loan Portfolio includes commercial mortgages, mezzanine loans, and preferred equity interests only. See Note 3-“Investments in Loans” in the Notes to Consolidated Financial Statements for information relating to all loans held by us. |
|
(b) |
Includes 50 apartment properties owned by IRT with a book value of $1.37 billion as of September 30, 2015. |
|
(c) |
Based on properties owned as of September 30, 2015. |
|
(d) |
Average effective rent is rent per unit per month. |
|
(e) |
Average effective rent is rent per square foot per year. |
|
(f) |
Excludes Murrels Retail, a retail property in re-development with an average occupancy of 53.6% and average effective rent per square foot of $9.67 for the quarter ended September 30, 2015. |
43
Investors should read Management’s Discussion and Analysis of Financial Condition and Results of Operations in our Annual Report on Form 10-K for the fiscal year ended December 31, 2014, or the Annual Report, for a detailed discussion of the following items:
|
|
• |
Commercial Real Estate Lending Environment. |
|
|
• |
Trends Relating to Originating and Financing Conduit Loans and Bridge Loans. |
|
|
• |
Trends Relating to Investments in Real Estate. |
|
|
• |
Interest rate environment. |
|
|
• |
Prepayment rates. |
|
|
• |
Commercial real estate performance. |
To supplement and update this disclosure, during the third quarter of 2015, CMBS market conditions were volatile which impacted the performance of our conduit lending business. Bonds spreads widened during the quarter, thereby impacting gain on sale within the conduit lending business. Our conduit lending strategy has been to sell our fixed rate loans frequently, thereby reducing exposure to bond spread volatility and credit risk. The widening of these spreads had the effect of reducing our fee income from sales of conduit loans though we earned $0.4 million of gains for this quarter and $6.1 million of gains during the nine months ended September 30, 2015.
Our Investment Portfolio
Our consolidated investment portfolio is currently comprised of the following asset classes:
Commercial mortgages, mezzanine loans, and preferred equity interests. We originate and own senior long-term conduit mortgage loans, short-term bridge loans, subordinated, or “mezzanine,” financing and preferred equity interests. These assets are in most cases “non-recourse” or limited recourse loans secured by commercial real estate assets or real estate entities. This means that we look primarily to the assets securing the loan for repayment, subject to certain standard exceptions. We originate loans that are eligible to be sold to securitizations issuing commercial mortgage backed securities, or CMBS, which we refer to as conduit loans. We may from time to time acquire existing commercial real estate loans from third parties who have originated such loans, including banks, other institutional lenders or third-party investors. Where possible, we seek to maintain direct lending relationships with borrowers, as opposed to investing in loans controlled by third party lenders.
The tables below describe certain characteristics of our commercial mortgages, mezzanine loans, and preferred equity interests as of September 30, 2015 (dollars in thousands):
|
|
|
Carrying Value |
|
|
Weighted- Average Coupon |
|
|
Range of Maturities (a) |
|
Number of Loans |
|
|||
|
Commercial Real Estate (CRE) Loans |
|
|
|
|
|
|
|
|
|
|
|
|
|
|
|
Commercial mortgages |
|
$ |
1,353,636 |
|
|
|
5.2 |
% |
|
Jan. 2016 to Jan. 2029 |
|
|
117 |
|
|
Mezzanine loans |
|
|
198,241 |
|
|
|
9.6 |
% |
|
Jul. 2015 to May 2025 |
|
|
63 |
|
|
Preferred equity interests |
|
|
37,361 |
|
|
|
6.3 |
% |
|
Feb. 2016 to Aug. 2033 |
|
|
9 |
|
|
Total investments in loans |
|
$ |
1,589,238 |
|
|
|
6.2 |
% |
|
|
|
|
189 |
|
|
|
(a) |
Two mezzanine loans that are 90 days or more past due have a contractual maturity date of July 2015. |
During the nine-month period ended September 30, 2015, we originated $675.1 million of CRE loans, had conduit loan sales of $339.5 million and CRE loan repayments of $169.6 million, resulting in net loan growth of $166.0 million.
44
The charts below describe the property types and the geographic breakdown of our commercial mortgages, mezzanine loans, other loans, and preferred equity interests as of September 30, 2015:
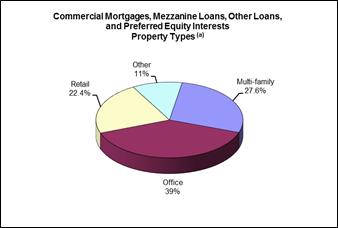
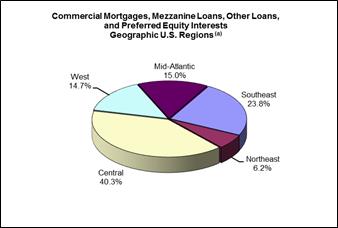
|
(a) |
Based on carrying amount. |
Investments in real estate. We invest in real estate properties, primarily multi-family properties, throughout the United States. The table below describes certain characteristics of our investments in real estate as of September 30, 2015 (dollars in thousands):
|
|
|
Investments in Real Estate (a) |
|
|
Average Physical Occupancy |
|
|
Units/ Square Feet/ Acres |
|
|
Number of Properties |
|
||||
|
RAIT Multi-family real estate properties |
|
$ |
506,825 |
|
|
|
93.8% |
|
|
|
5,763 |
|
|
|
24 |
|
|
IRT Multi-family real estate properties |
|
|
1,400,892 |
|
|
|
94.0% |
|
|
|
14,044 |
|
|
|
50 |
|
|
Office real estate properties |
|
|
356,149 |
|
|
|
77.9% |
|
|
|
2,498,803 |
|
|
|
17 |
|
|
Retail real estate properties |
|
|
133,911 |
|
|
|
69.0% |
|
|
|
1,814,890 |
|
|
|
6 |
|
|
Parcels of land |
|
|
50,554 |
|
|
N/A |
|
|
|
20.8 |
|
|
|
8 |
|
|
|
Total |
|
$ |
2,448,331 |
|
|
|
|
|
|
|
|
|
|
|
105 |
|
|
(a) |
Based on properties owned as of September 30, 2015. |
The charts below describe the property types and the geographic breakdown of our investments in real estate as of September 30, 2015:
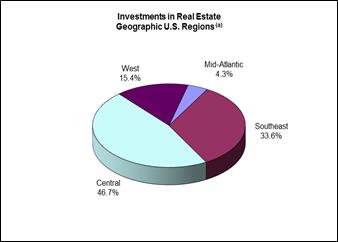
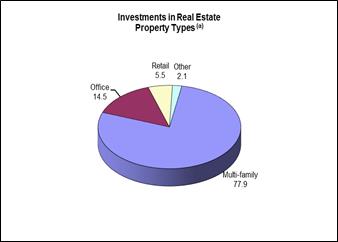
|
(a) |
Based on book value. |
45
Securitization Summary
Overview. We have used securitizations to match fund the interest rates and maturities of our assets with the interest rates and maturities of the related financing. This strategy has helped us reduce interest rate and funding risks on our loan portfolios. A securitization is a structure in which multiple classes of debt and equity are issued by a special purpose entity to finance a portfolio of assets. Cash flow from the portfolio of assets is used to repay the securitization liabilities sequentially, in order of seniority. The most senior classes of debt typically have credit ratings of “AAA” through “BBB–” and therefore can be issued at yields that are lower than the average yield of the loans collateralizing the securitization. The debt tranches are typically rated based on portfolio quality, diversification and structural subordination. The equity securities issued by the securitization are the “first loss” piece of the capital structure, but they are entitled to all residual amounts available for payment after the obligations to the debt holders have been satisfied. Our retained interests described below included in our investments in our consolidated securitizations are typically in such “first loss” piece. Historically, the stated maturity of the debt issued by a securitization we have sponsored and consolidated has been between 15 and 17 years. However, we expect the weighted average life of such debt to be shorter than the stated maturity due to the financial condition of the borrowers on the underlying loans and the characteristics of such loans, including the existence and frequency of exercise of any permitted prepayment, the prevailing level of interest rates, the actual default rate and the actual level of any recoveries on any defaulted loans. Debt issued by these securitizations is non-recourse to RAIT and payable solely from the payments by the borrowers on the loans collateralizing these securitizations. These assets are in most cases “non-recourse” or limited recourse loans secured by commercial real estate assets or real estate entities. This means that we look primarily to the assets securing the loan for repayment, subject to certain standard exceptions.
As of September 30, 2015, we have sponsored five securitizations with varying amounts of retained or residual interests held by us which we consolidate in our financial statements as follows: RAIT I, RAIT II, RAIT 2014-FL2 Trust, or RAIT FL2, RAIT 2014-FL3 Trust, or RAIT FL3 and RAIT 2014-FL4 Trust, or RAIT FL4. We refer to RAIT FL2, RAIT FL3 and RAIT FL4 as the FL securitizations. The assets and liabilities of these securitizations are presented at amortized cost in our consolidated financial statements. We originated substantially all of the loans collateralizing RAIT I, RAIT II and the FL securitizations. We serve as the collateral manager, servicer and special servicer on RAIT I and RAIT II and as servicer and special servicer for each of the FL securitizations.
Securitization Performance. RAIT I and RAIT II contain interest coverage triggers, or IC triggers, and over collateralization triggers, or OC triggers, which must be met in order for us to receive our subordinated management fees and our lower-rated debt or residual equity returns. If the IC triggers or OC triggers are not met in a given period, then the cash flows are redirected from lower rated tranches and used to repay the principal amounts to the senior tranches of CDO notes payable. These conditions and the re-direction of cash flow continue until the triggers are met by curing the underlying payment defaults, paying down the CDO notes payable or other actions permitted under the relevant securitization indenture. As of the most recent payment information, all applicable IC triggers and OC triggers are being met for our two commercial real estate securitizations, RAIT I and RAIT II, and we are receiving all of our management fees, interest and residual returns from these securitizations. The FL securitizations do not have IC triggers and OC triggers.
We expect repayment of the loans collateralizing RAIT I and RAIT II outside their contractual maturities to increase in 2015 through 2019. We expect this will reduce our returns from these securitizations and we will evaluate alternative strategies seeking to replace these returns. We expect to undertake a similar evaluation for any securitization we sponsor as the notes issued by such securitization approach their respective weighted average lives.
A summary of the investments in our consolidated securitizations as of the most recent payment information is as follows:
|
|
• |
RAIT I—RAIT I has $815.03 million of total collateral at par value, of which $23.7 million is defaulted. The current overcollateralization, or OC, test is passing at 130.2% with an OC trigger of 116.2%. We currently own $67.0 million of the securities that were originally rated investment grade and $200.0 million of the non-investment grade securities issued by this securitization. We are currently receiving all distributions required by the terms of our retained interests in this securitization and are receiving all of our collateral management fees. We pledged $31.6 million of the securities we own issued by RAIT I as collateral for a senior secured note we issued. |
|
|
• |
RAIT II—RAIT II has $629.6 million of total collateral at par value, of which $19.5 million is defaulted. The current OC test is passing at 124.7% with an OC trigger of 111.7%. We currently own $108.5 million of the securities that were originally rated investment grade and $140.7 million of the non-investment grade securities issued by this securitization. We are currently receiving all distributions required by the terms of our retained interests in this securitization and are receiving all of our collateral management fees. We pledged $75.1 million of the securities we own issued by RAIT II as collateral for a senior secured note we issued. |
46
|
|
• |
RAIT FL2—RAIT FL2 has $185.6 million of total collateral at par value, of which there is no collateral that is in default. RAIT FL2 does not have OC triggers or IC triggers. RAIT FL2, has classes of investment grade senior notes with an aggregate principal balance outstanding of approximately $145.4 million to investors. We currently own the unrated classes of junior notes, including a class with an aggregate principal balance of $40.2 million, and the equity, or the retained interests, of RAIT FL2. |
|
|
• |
RAIT FL3—RAIT FL3 has $216.1 million of total collateral at par value, of which there is no collateral that is in default. RAIT FL3 does not have OC triggers or IC triggers. RAIT FL3, has classes of investment grade senior notes with an aggregate principal balance outstanding of approximately $177.8 million to investors. We currently own the unrated classes of junior notes, including a class with an aggregate principal balance of $37.4 million, and the equity, or the retained interests, of RAIT FL3. |
|
|
• |
RAIT FL4—RAIT FL4 has $219.3 million of total collateral at par value, of which there is no collateral that is in default. RAIT FL4 does not have OC triggers or IC triggers. RAIT FL4, has classes of investment grade senior notes with an aggregate principal balance outstanding of approximately $177.9 million. We currently own the unrated classes of junior notes, including a class with an aggregate principal balance of $41.4 million, and the equity, or the retained interests, of RAIT FL4. |
Independence Realty Trust, Inc.
IRT common stock trades on the NYSE MKT under the symbol “IRT” with a closing price of $8.07 as of November 6, 2015. We currently hold 7,269,719 shares of IRT common stock representing 15.5% percent of the outstanding shares of IRT common stock as of November 6, 2015. We continue to consolidate IRT in our financial results as of September 30, 2015. For the nine-month period ended September 30, 2015, we reflected IRT’s operating results in our financial results, including $25.7 million of net income. As of September 30, 2015, IRT owned 50 multi-family properties with 14,044 units and a book value of $1.4 billion which were reflected on our balance sheet. For the nine-month period ended September 30, 2015, we earned $3.7 million of fees from IRT under our advisory agreement with IRT and received $3.9 million of distributions declared on our IRT common stock, both of which are eliminated in consolidation. We characterize IRT as one of our operating segments and break out its financial performance in our financial statements.
In January 2014, IRT completed an underwritten public offering of 8,050,000 shares of IRT common stock for total net proceeds of approximately $62.7 million. We purchased 1,204,819 shares of IRT common stock in this offering, at the public offering price, for which no underwriting discounts and commissions were paid to the underwriters. On July 21, 2014, IRT completed an underwritten public offering selling 8,050,000 shares of IRT common stock for $9.50 per share raising net proceeds of $72.0 million. We purchased 300,000 shares of common stock in the offering, at the public offering price, for which no underwriting discounts and commissions were paid to the underwriters. On November 25, 2014, IRT completed an underwritten public offering selling 6,000,000 shares of IRT common stock for $9.60 per share raising net proceeds of $54.6 million.
On September 17, 2015, IRT completed the mergers, or the TSRE merger, with Trade Street Residential, Inc., or TSRE. Pursuant to the TSRE merger, (i) a subsidiary of IROP merged into the operating partnership subsidiary of TSRE, or the TSR OP, with TSR OP continuing as the surviving entity, and (ii) TSRE merged with and an IRT’s subsidiary, with our subsidiary continuing as the surviving entity and a wholly-owned subsidiary of IRT. As a result of the TSRE merger, each outstanding share of common stock of TSRE was converted automatically into the right to receive (a) $3.80 in cash and (b) 0.4108 shares of common stock of IRT, plus cash in lieu of fractional shares. As a result, we issued approximately 15.1 million shares of common stock as equity consideration in the TSRE merger. Immediately prior to the TSRE merger, the third party holder of TSR OP units, contributed all of their TSR OP units to IROP in exchange for 1,925,419 units of limited partnership interest of IRT Operating Partnership (“IROP, or IROP Units”), plus cash in lieu of fractional IROP Units. As a result of the TSRE merger, we have over $1.4 billion of total capitalization and own 14,044 units across 50 properties. The net assets and results of operations of TSRE have been included in our condensed consolidated financial statements beginning September 17, 2015. See Note 5: Investments in Real Estate for further information.
47
Assets under management, or AUM, is an operating measure representing the total assets that we own or are managing for third parties. While not all AUM generates fee income, it is an important operating measure to gauge our asset growth, volume of originations, size and scale of our operations and our performance. AUM includes our total investment portfolio and assets associated with unconsolidated securitizations for which we derive asset management fees.
The table below summarizes our AUM as of September 30, 2015 and December 31, 2014 (dollars in thousands):
|
|
|
AUM as of September 30, 2015 |
|
|
AUM as of December 31, 2014 |
|
||
|
Commercial real estate loan portfolio (1) |
|
$ |
1,604,680 |
|
|
$ |
1,409,254 |
|
|
Investment in real estate (2) |
|
|
2,448,331 |
|
|
|
1,840,451 |
|
|
Property management (3) |
|
|
1,767,691 |
|
|
|
1,235,820 |
|
|
Total |
|
$ |
5,820,702 |
|
|
$ |
4,485,525 |
|
|
(1) |
As of September 30, 2015 and December 31, 2014, our commercial real estate portfolio was comprised of $577.9 million and $671.7 million, respectively, of assets collateralizing RAIT I and RAIT II and $406.7 million and $246.7 million, respectively, of commercial mortgages, mezzanine loans and preferred equity interests that were not securitized. As of September 30, 2015 and December 31, 2014, our commercial real estate portfolio was also comprised of $185.6 million and $196.1 million, respectively, of assets collateralizing RAIT FL2, $215.2 million and $215.2 million of assets collateralizing RAIT FL3 and $219.3 million and $0 million of assets collateralizing RAIT FL4. |
|
(2) |
As of September 30, 2015 and December 31, 2014, includes $1.4 billion and $689.1 million, respectively, of investments in real estate of IRT. |
|
(3) |
In the fourth quarter of 2013, we exercised our rights under a preferred equity investment we had made in Urban Retail Properties, LLC, or Urban Retail, to assume control of Urban Retail. We completed our acquisition of the equity of Urban Retail in March 2014. Urban Retail manages 63 properties with 19,668,831 square feet in 25 states as of September 30, 2015. In addition, on July 1, 2015 we exercised our rights under the operating agreement for our subsidiary, RAIT Residential, to acquire the 25% of its equity held by unaffiliated investors, making RAIT Residential our wholly owned subsidiary. RAIT Residential provides property management services to apartment properties, including IRT’s properties. |
Non-GAAP Financial Measures
Cash Available for Distribution
Cash available for distribution, or CAD, is a non-GAAP financial measure. We believe that CAD provides investors and management with a meaningful indicator of operating performance. Management also uses CAD, among other measures, to evaluate profitability and our board of trustees considers CAD in determining our quarterly cash distributions. We also believe that CAD is useful because it adjusts for a variety of noncash items (such as depreciation and amortization, equity-based compensation, realized non-cash gain (loss) on assets, provision for loan losses and non-cash interest income and expense items). Furthermore, CAD removes the effect of our previous consolidation of the legacy securitizations, T8 and T9, which we deconsolidated as part of our exit of the Taberna business in December 2014.
We calculate CAD by subtracting from or adding to net income (loss) attributable to common shareholders the following items: depreciation and amortization items including depreciation and amortization, straight-line rental income or expense, amortization of in place leases, amortization of deferred financing costs, amortization of discount on financings and equity-based compensation; changes in the fair value of our financial instruments; realized non-cash gain (loss) on assets and other; provision for loan losses; impairment on depreciable property; acquisition gains or losses and transaction costs; certain fee income eliminated in consolidation that is attributable to third parties; and one-time events pursuant to changes in U.S. GAAP and certain other non-routine items.
CAD should not be considered as an alternative to net income (loss) or cash generated from operating activities, determined in accordance with U.S. GAAP, as an indicator of operating performance. For example, CAD does not adjust for the accrual of income and expenses that may not be received or paid in cash during the associated periods. Please refer to our consolidated financial statements prepared in accordance with U.S. GAAP in Part I, Item 1. In addition, our methodology for calculating CAD may differ from the methodologies used by other comparable companies, including other REITs, when calculating the same or similar supplemental financial measures and may not be comparable with these companies.
48
Set forth below is a reconciliation of CAD to net income (loss) allocable to common shares for the three-month periods ended September 30, 2015 and 2014 (dollars in thousands, except share information):
|
|
|
For the Three-Month Period Ended September 30, 2015 |
|
|
For the Three-Month Period Ended September 30, 2014 |
|
||||||||||
|
|
|
Amount |
|
|
Per Share (1) |
|
|
Amount |
|
|
Per Share (2) |
|
||||
|
Cash Available for Distribution: |
|
|
|
|
|
|
|
|
|
|
|
|
|
|
|
|
|
Net income (loss) allocable to common shares |
|
$ |
(6,532 |
) |
|
$ |
(0.07 |
) |
|
$ |
(23,266 |
) |
|
$ |
(0.28 |
) |
|
Adjustments: |
|
|
|
|
|
|
|
|
|
|
|
|
|
|
|
|
|
Depreciation and amortization expense |
|
|
15,168 |
|
|
|
0.17 |
|
|
|
13,236 |
|
|
|
0.16 |
|
|
Change in fair value of financial instruments |
|
|
(620 |
) |
|
|
(0.01 |
) |
|
|
10,223 |
|
|
|
0.13 |
|
|
(Gains) losses on assets |
|
|
(1,030 |
) |
|
|
(0.01 |
) |
|
|
(25 |
) |
|
|
- |
|
|
TSRE financing extinguishment and employee separation expenses |
|
|
27,508 |
|
|
|
0.31 |
|
|
|
- |
|
|
|
- |
|
|
(Gain) loss on IRT merger with TSRE |
|
|
(64,012 |
) |
|
|
(0.73 |
) |
|
|
- |
|
|
|
- |
|
|
Taberna VIII and Taberna IX securitizations, net effect |
|
|
- |
|
|
|
- |
|
|
|
(6,975 |
) |
|
|
(0.09 |
) |
|
Straight-line rental adjustments |
|
|
(78 |
) |
|
|
- |
|
|
|
(238 |
) |
|
|
- |
|
|
Share-based compensation |
|
|
1,158 |
|
|
|
0.01 |
|
|
|
1,148 |
|
|
|
0.01 |
|
|
Acquisition Expenses |
|
|
12,901 |
|
|
|
0.15 |
|
|
|
- |
|
|
|
- |
|
|
Origination fees and other deferred items |
|
|
10,198 |
|
|
|
0.12 |
|
|
|
5,718 |
|
|
|
0.07 |
|
|
Provision for losses |
|
|
1,850 |
|
|
|
0.02 |
|
|
|
1,500 |
|
|
|
0.02 |
|
|
Asset impairment |
|
|
7,250 |
|
|
|
0.08 |
|
|
|
- |
|
|
|
- |
|
|
Noncontrolling interest effect of certain adjustments |
|
|
19,939 |
|
|
|
0.23 |
|
|
|
(1,716 |
) |
|
|
(0.02 |
) |
|
Cash Available for Distribution |
|
$ |
23,700 |
|
|
$ |
0.27 |
|
|
$ |
(395 |
) |
|
|
0.00 |
|
|
(1) |
Based on 87,110,958 weighted-average shares outstanding for the three-month period ended September 30, 2015. |
|
(2) |
Based on 81,967,806 weighted-average shares outstanding for the three-month period ended September 30, 2014. |
49
Set forth below is a reconciliation of CAD to net income (loss) allocable to common shares for the nine-month periods ended September 30, 2015 and 2014 (dollars in thousands, except share information):
|
|
|
For the Nine-Month Period Ended September 30, 2015 |
|
|
For the Nine-Month Period Ended September 30, 2014 |
|
||||||||||
|
|
|
Amount |
|
|
Per Share (1) |
|
|
Amount |
|
|
Per Share (2) |
|
||||
|
Cash Available for Distribution: |
|
|
|
|
|
|
|
|
|
|
|
|
|
|
|
|
|
Net income (loss) allocable to common shares |
|
$ |
5,327 |
|
|
$ |
0.06 |
|
|
$ |
(63,503 |
) |
|
$ |
(0.78 |
) |
|
Adjustments: |
|
|
|
|
|
|
|
|
|
|
|
|
|
|
|
|
|
Depreciation and amortization expense |
|
|
51,190 |
|
|
|
0.60 |
|
|
|
38,719 |
|
|
|
0.48 |
|
|
Change in fair value of financial instruments |
|
|
(13,466 |
) |
|
|
(0.16 |
) |
|
|
59,433 |
|
|
|
0.73 |
|
|
(Gains) losses on assets |
|
|
(4,401 |
) |
|
|
(0.05 |
) |
|
|
5,350 |
|
|
|
0.07 |
|
|
TSRE financing extinguishment and employee separation expenses |
|
|
27,508 |
|
|
|
0.33 |
|
|
|
- |
|
|
|
- |
|
|
(Gain) loss on IRT merger with TSRE |
|
|
(64,012 |
) |
|
|
(0.76 |
) |
|
|
- |
|
|
|
- |
|
|
(Gains) losses on extinguishment of debt |
|
|
- |
|
|
|
- |
|
|
|
(2,421 |
) |
|
|
(0.03 |
) |
|
Taberna VIII and Taberna IX securitizations, net effect |
|
|
- |
|
|
|
- |
|
|
|
(21,063 |
) |
|
|
(0.26 |
) |
|
Straight-line rental adjustments |
|
|
(53 |
) |
|
|
- |
|
|
|
(329 |
) |
|
|
- |
|
|
Share-based compensation |
|
|
3,553 |
|
|
|
0.04 |
|
|
|
3,777 |
|
|
|
0.05 |
|
|
Acquisition Expenses |
|
|
14,843 |
|
|
|
0.18 |
|
|
|
- |
|
|
|
- |
|
|
Origination fees and other deferred items |
|
|
24,891 |
|
|
|
0.30 |
|
|
|
15,450 |
|
|
|
0.19 |
|
|
Provision for losses |
|
|
5,850 |
|
|
|
0.07 |
|
|
|
3,500 |
|
|
|
0.04 |
|
|
Asset impairment |
|
|
7,250 |
|
|
|
0.09 |
|
|
|
- |
|
|
|
- |
|
|
Noncontrolling interest effect of certain adjustments |
|
|
10,805 |
|
|
|
0.13 |
|
|
|
(2,351 |
) |
|
|
(0.03 |
) |
|
Cash Available for Distribution |
|
$ |
69,285 |
|
|
$ |
0.83 |
|
|
$ |
36,562 |
|
|
$ |
0.45 |
|
|
(1) |
Based on 83,799,244 weighted-average shares outstanding for the nine-month period ended September 30, 2015. |
|
(2) |
Based on 81,111,796 weighted-average shares outstanding for the nine-month period ended September 30, 2014. |
Funds from Operations
We believe that funds from operations, or FFO, which is a non-GAAP measure, is an additional appropriate measure of the operating performance of a REIT. We compute FFO in accordance with the standards established by the National Association of Real Estate Investment Trusts, or NAREIT, as net income or loss allocated to common shares (computed in accordance with GAAP), excluding real estate-related depreciation and amortization expense, gains or losses on sales of real estate and the cumulative effect of changes in accounting principles. Our management utilizes FFO as a measure of our operating performance. FFO is not an equivalent to net income or cash generated from operating activities determined in accordance with U.S. GAAP. Furthermore, FFO does not represent amounts available for management’s discretionary use because of needed capital replacement or expansion, debt service obligations or other commitments or uncertainties. FFO should not be considered as an alternative to net income as an indicator of our operating performance or as an alternative to cash flow from operating activities as a measure of our liquidity.
Set forth below is a reconciliation of FFO to net income (loss) allocable to common shares for the three-month periods ended September 30, 2015 and 2014 (dollars in thousands, except share information):
|
|
|
For the Three-Month Period Ended September 30, 2015 |
|
|
For the Three-Month Period Ended September 30, 2014 |
|
||||||||||
|
|
|
Amount |
|
|
Per Share (1) |
|
|
Amount |
|
|
Per Share (2) |
|
||||
|
Funds From Operations: |
|
|
|
|
|
|
|
|
|
|
|
|
|
|
|
|
|
Net income (loss) allocable to common shares |
|
$ |
(6,532 |
) |
|
$ |
(0.07 |
) |
|
$ |
(23,266 |
) |
|
$ |
(0.28 |
) |
|
Adjustments: |
|
|
|
|
|
|
|
|
|
|
|
|
|
|
|
|
|
Real estate depreciation and amortization |
|
|
9,535 |
|
|
|
0.11 |
|
|
|
9,116 |
|
|
|
0.11 |
|
|
(Gains) losses on the sale of real estate |
|
|
(7,430 |
) |
|
|
(0.09 |
) |
|
|
(2 |
) |
|
|
(0.00 |
) |
|
Funds From Operations allocable to common shares |
|
$ |
(4,427 |
) |
|
$ |
(0.05 |
) |
|
$ |
(14,152 |
) |
|
$ |
(0.17 |
) |
50
|
(1) |
Based on 87,110,958 weighted-average shares outstanding for the three-month period ended September 30, 2015. |
|
(2) |
Based on 81,967,806 weighted-average shares outstanding for the three-month period ended September 30, 2014. |
Set forth below is a reconciliation of FFO to net income (loss) allocable to common shares for the nine-month periods ended September 30, 2015 and 2014 (dollars in thousands, except share information):
|
|
|
For the Nine-Month Period Ended September 30, 2015 |
|
|
For the Nine-Month Period Ended September 30, 2014 |
|
||||||||||
|
|
|
Amount |
|
|
Per Share (1) |
|
|
Amount |
|
|
Per Share (2) |
|
||||
|
Funds From Operations: |
|
|
|
|
|
|
|
|
|
|
|
|
|
|
|
|
|
Net income (loss) allocable to common shares |
|
$ |
5,327 |
|
|
$ |
0.06 |
|
|
$ |
(63,503 |
) |
|
$ |
(0.78 |
) |
|
Adjustments: |
|
|
|
|
|
|
|
|
|
|
|
|
|
|
|
|
|
Real estate depreciation and amortization |
|
|
30,979 |
|
|
|
0.37 |
|
|
|
27,250 |
|
|
|
0.34 |
|
|
(Gains) losses on the sale of real estate |
|
|
(24,711 |
) |
|
|
(0.29 |
) |
|
|
319 |
|
|
|
0.00 |
|
|
Funds From Operations allocable to common shares |
|
$ |
11,595 |
|
|
$ |
0.14 |
|
|
$ |
(35,934 |
) |
|
$ |
(0.44 |
) |
|
(1) |
Based on 83,799,244 weighted-average shares outstanding for the nine-month period ended September 30, 2015. |
|
(2) |
Based on 81,111,796 weighted-average shares outstanding for the nine-month period ended September 30, 2014. |
Adjusted Book Value
Management views adjusted book value as a useful and appropriate supplement to shareholders’ equity and book value. The measure serves as an additional performance measure of our value because it facilitates evaluation of us without the effects of various items that we are required to record in accordance with GAAP but which have limited economic impact on our business. Those adjustments primarily reflect the effect of consolidated securitizations where we do not currently receive cash flows on our retained interests, accumulated depreciation and amortization, the valuation of long-term derivative instruments and a valuation of our recurring collateral and property management fees. Adjusted book value is a non-GAAP financial measurement, and does not purport to be an alternative to reported shareholders’ equity, determined in accordance with GAAP, as a measure of book value. Adjusted book value should be reviewed in connection with shareholders’ equity as set forth in our consolidated balance sheets, to help analyze our value to investors. Adjusted book value may be defined in various ways throughout the REIT industry. Investors should consider these differences when comparing our adjusted book value to that of other REITs.
Set forth below is a reconciliation of adjusted book value to shareholders’ equity as of September 30, 2015 (dollars in thousands, except share information):
|
|
|
As of September 30, 2015 |
|
|||||
|
|
|
Amount |
|
|
Per Share (1) |
|
||
|
Total shareholders’ equity |
|
$ |
403,081 |
|
|
$ |
4.43 |
|
|
Liquidation value of preferred shares characterized as equity(2) |
|
|
(232,187 |
) |
|
|
(2.55 |
) |
|
Book value |
|
|
170,894 |
|
|
|
1.88 |
|
|
Adjustments: |
|
|
|
|
|
|
|
|
|
Derivative liabilities |
|
|
8,960 |
|
|
|
0.10 |
|
|
Fair value for warrants and investor SARs |
|
|
22,590 |
|
|
|
0.25 |
|
|
Accumulated depreciation and amortization |
|
|
283,690 |
|
|
|
3.12 |
|
|
Valuation of recurring collateral, property management fees |
|
|
98,193 |
|
|
|
1.08 |
|
|
Total adjustments |
|
|
413,433 |
|
|
|
4.55 |
|
|
Adjusted book value |
|
$ |
584,327 |
|
|
$ |
6.43 |
|
|
(1) |
Based on 90,898,034 common shares outstanding as of September 30, 2015. |
|
(2) |
Based on 5,306,084 Series A preferred shares, 2,340,969 Series B preferred shares, and 1,640,425 Series C preferred shares outstanding as of September 30, 2015, all of which have a liquidation preference of $25.00 per share. |
51
Three-Month Period Ended September 30, 2015 Compared to the Three-Month Period Ended September 30, 2014
Revenue
Net interest margin. Net interest margin decreased $9.3 million, or 36%, to $16.4 million for the three-month period ended September 30, 2015 from $25.7 million for the three-month period ended September 30, 2014. Investment interest income has decreased $4.8 million as a result of our exit from the Taberna business in December 2014 and $2.8 million as a result of non-routine items including our acquisition of Urban and the conversion of certain loans to real estate owned property. Investment interest expense has increased $3.1 million related to the RAIT FL3 securitization issued in October 2014 and the RAIT FL4 securitization issued in May 2015. This was partially offset by a $0.8 million reduction of interest expense related to our hedging activities.
Rental income. Rental income increased $13.7 million to $55.5 million for the three-month period ended September 30, 2015 from $41.8 million for the three-month period ended September 30, 2014. The increase is attributable to $11.5 million of rental income from 29 new properties acquired or consolidated since September 30, 2014, $3.4 million of rental income from six properties acquired during the three-month period ended September 30, 2014 present for a full quarter of operations in 2015 and $1.7 million of rental income from improved occupancy and rental rates in 2015 as compared to 2014 in the remaining properties. The increase was partially offset by a $3.0 million decrease of rental income related to six properties disposed of after September 30, 2014.
Fee and other income. Fee and other income decreased $4.7 million to $3.1 million for the three-month period ended September 30, 2015 from $7.8 million for the three-month period ended September 30, 2014. The decrease is attributable to $3.3 million of less conduit fee income generated during the three-month period ended September 30, 2015 as compared to the same period in 2014 and a decrease of $1.2 million of property management fee income due to the timing of leasing commissions during the three-month period ended September 30, 2015 as compared to the same period in 2014.
Expenses
Interest expense. Interest expense increased $5.7 million, or 41%, to $19.6 million for the three-month period ended September 30, 2015 from $13.9 million for the three-month period ended September 30, 2014. The increase is primarily attributable to $3.2 million of interest expense from the increase in our loans payable on real estate, $0.6 million from the 7.125% senior notes issued in August 2014, and $1.3 million related to our senior secured notes.
Real estate operating expense. Real estate operating expense increased $5.0 million to $25.9 million for the three-month period ended September 30, 2015 from $20.9 million for the three-month period ended September 30, 2014. The increase is attributable to $5.2 million of real estate operating expenses from 29 properties acquired or consolidated since September 30, 2014 and $1.4 million from six properties acquired during the three-month period ended September 30, 2014 present for a full quarter of operations in 2015. The increase was partially offset by a $1.5 million decrease of real estate operating expense related to six properties disposed of after September 30, 2014.
Compensation expense. Compensation expense decreased $0.1 million to $7.1 million for the three-month period ended September 30, 2015 from $7.2 million for the three-month period ended September 30, 2014.
General and administrative expense. General and administrative expense decreased $0.3 million to $4.5 million for the three-month period ended September 30, 2015 from $4.8 million for the three-month period ended September 30, 2014.
Acquisition expense. Acquisition expense increased $12.1 million to $12.9 million for the three-month period ended September 30, 2015 from $0.8 million for the three-month period ended September 30, 2014. These expenses were incurred in connection with the TSRE merger in which IRT acquired 19 properties during the three-month period ended September 30, 2015.
Depreciation and amortization expense. Depreciation and amortization expense increased $2.0 million to $15.2 million for the three-month period ended September 30, 2015 from $13.2 million for the three-month period ended September 30, 2014. The increase is attributable to $2.3 million of depreciation and amortization expense from 29 new properties acquired or consolidated since September 30, 2014 and $1.1 million from six properties acquired during the three-month period ended September 30, 2014 present for a full quarter of operations in 2015. The increase was partially offset by $0.8 million of depreciation expense related to six properties that were disposed of after September 30, 2014 along with a reduction of $0.7 million of depreciation expense in our same store portfolio.
52
Other income (expense). During the three-month period ended September 30, 2014, other income (expense) included a $21.5 million charge relating to the pending settlement agreement with the SEC. See Part II. Other Information—Item 1. Legal Proceedings.
Gains (losses) on assets. During the three-month period September 30, 2015, one real estate property and two parcels of land were sold resulting in a gain of $7,430.
Gain on IRT merger with TSRE. IRT recognized a $64 million gain from a bargain purchase on the TSRE merger during the three-month period ended September 30, 2015.
Asset impairment. During the three-month period September 30, 2015, one real estate property was impaired resulting in the recognition of impairment of $7,250.
TSRE financing extinguishment and employee separation expenses. In connection with the TSRE merger that occurred during the three-month period ended September 30, 2015, IRT incurred $27.5 million of financing extinguishment and employee separation expenses.
Change in fair value of financial instruments. During the three-month period ended September 30, 2015, the change in fair value of financial instruments increased our net income by $0.6 million. The fair value adjustments we recorded were as follows (dollars in thousands):
|
Description |
|
For the Three- Month Period Ended September 30, 2015 |
|
|
For the Three- Month Period Ended September 30, 2014 |
|
||
|
Change in fair value of trading securities and security-related receivables |
|
$ |
— |
|
|
$ |
2,386 |
|
|
Change in fair value of CDO notes payable and trust preferred obligations |
|
|
1,673 |
|
|
|
(23,961 |
) |
|
Change in fair value of derivatives |
|
|
(644 |
) |
|
|
(702 |
) |
|
Change in fair value of warrants and investor SARs |
|
|
(409 |
) |
|
|
12,054 |
|
|
Change in fair value of financial instruments |
|
$ |
620 |
|
|
$ |
(10,223 |
) |
The changes in the fair value for the trading securities and security-related receivables, CDO notes payable, and other liabilities for which the fair value option was elected for the three-month periods ended September 30, 2015 and 2014 was primarily attributable to changes in instrument specific credit risks. The changes in the fair value of the CDO notes payable for which the fair value option was elected was also due to required repayments at par of senior CDO notes due to OC failures when the CDO notes being repaid have a fair value of less than par. The changes in the fair value of derivatives for which the fair value option was elected for the three-month periods ended September 30, 2015 and 2014 was mainly due to changes in interest rates. The change in fair value of the warrants and investor SARs was due to changes in the reference stock price.
Income tax benefit (provision). Income tax benefit (provision) decreased as we expect the taxable REIT subsidiary that conducts our conduit loan operations to have taxable income for the foreseeable future and we removed the valuation allowance against a portion of its net operating loss carryforwards.
Nine-Month Period Ended September 30, 2015 Compared to the Nine-Month Period Ended September 30, 2014
Revenue
Net interest margin. Net interest margin decreased $31.2 million, or 39%, to $49.3 million for the nine-month period ended September 30, 2015 from $80.5 million for the nine-month period ended September 30, 2014. Investment interest income has decreased $15.3 million as a result of our exit from the Taberna business in December 2014, $13.2 million as a result of non-routine items including our acquisition of Urban and the conversion of certain loans to real estate owned property, and $1.5 million as a result of increased interest expense related to our CMBS facilities due to increased loan activity.
Rental income. Rental income increased $48.1 million to $164.3 million for the nine-month period ended September 30, 2015 from $116.2 million for the nine-month period ended September 30, 2014. The increase is attributable to $28.3 million of rental
53
income from 29 new properties acquired or consolidated since September 30, 2014, $18.5 million from 21 properties acquired during the nine-month period ended September 30, 2014 present for a full three quarters of operations in 2015 and $4.4 million from improved occupancy and rental rates in 2015 as compared to 2014 in the remaining properties. The increase was partially offset by $3.1 million of rental income related to seven properties that were disposed of in the nine-month period ending September 30, 2014 or 2015.
Fee and other income. Fee and other income decreased $3.0 million to $16.1 million for the nine-month period ended September 30, 2015 from $19.1 million for the nine-month period ended September 30, 2014. The decrease is primarily attributable to $1.3 million of less conduit fee income generated during the nine-month period ended September 30, 2015 as compared to the same period in 2014 and a $0.4 million decrease in property reimbursement income due to timing of leasing commissions during the nine-month period ended September 30, 2015 as compared to the same period in 2014.
Expenses
Interest expense. Interest expense increased $20.1 million, or 52%, to $58.9 million for the nine-month period ended September 30, 2014 from $38.8 million for the nine-month period ended September 30, 2014. The increase is primarily attributable to $11.1 million of interest expense from the increase in our loans payable on real estate, $1.3 million from the 7.625% senior notes issued in April 2014, $3.1 million from the 7.125% senior notes issued in August 2014, and $3.9 million related to our senior secured notes.
Real estate operating expense. Real estate operating expense increased $19.0 million to $77.7 million for the nine-month period ended September 30, 2015 from $58.7 million for the nine-month period ended September 30, 2014. Operating expenses increased $13.5 million primarily due to 29 new properties acquired or consolidated since September 30, 2014 and $8.4 million from 21 properties acquired during the nine-month period ended September 30, 2014 present for a full three quarters of operations in 2015. The increase was partially offset by $1.7 million of real estate operating expenses related to seven properties that were disposed of in the nine-month period ending September 30, 2014 or 2015 and a reduction of $1.2 million of real estate operating expense in our same store portfolio.
Compensation expense. Compensation expense decreased $3.3 million, or 14%, to $19.8 million for the nine-month period ended September 30, 2015 from $23.1 million for the nine-month period ended September 30, 2014. This decrease was primarily attributable to lower bonus accruals, salary costs and stock compensation expense for the nine-month period ended September 30, 2015 as compared to the nine-month period ended September 30, 2014.
General and administrative expense. General and administrative expense increased $1.8 million, or 7%, to $15.0 million for the nine-month period ended September 30, 2015 from $13.2 million for the nine-month period ended September 30, 2014. This increase was primarily attributable to an increase of $1.1 million in professional service fees and $0.7 million of insurance expense in the nine-month period ended September 30, 2015 as compared to the same period in 2014.
Acquisition expense. Acquisition expense increased $13.4 million to $14.8 million for the nine-month period ended September 30, 2015 from $1.4 million for the nine-month period ended September 30, 2014. These expenses were primarily incurred in connection with the TSRE merger in which IRT acquired 19 properties during the nine-month period ended September 30, 2015.
Depreciation and amortization expense. Depreciation and amortization expense increased $12.5 million to $51.2 million for the nine-month period ended September 30, 2015 from $38.7 million for the nine-month period ended September 30, 2014. The increase is attributable to $9.7 million of depreciation and amortization expense from 29 new properties acquired or consolidated since September 30, 2014, $ 3.1 million from 21 properties acquired during the nine-month period ended September 30, 2014 present for a full three quarters of operations in 2015, $1.1 million from our other consolidated properties and an increase in corporate depreciation and amortization of $0.1 million. The increase was partially offset by $1.5 million of depreciation expense related to seven properties that was disposed of in the nine-month period ending September 30, 2014 or 2015.
Other income (expense)
Other income (expense). During the nine-month period ended June 30, 2015, gains (losses) on assets was due to a gain on the disposition of one property. During the nine-month period ended September 30, 2014, other income (expense) included a $21.5 million settlement charge relating to the settlement agreement. See Part II. Other Information – Item 1. Legal Proceedings.
Gains (losses) on assets. During the nine-month period ended September 30, 2015, gains (losses) on assets consisted of a $24.7 million gain related to the disposition of six properties. During the nine-month period ended September 30, 2014, gains (losses) on assets included a $7.7 million loss on sale of asset held by T8 and T9 which resulted from the illiquid nature of the investment, a
54
$3.0 million charge off for certain assets that were disposed of and a $0.3 million loss related to the disposition of a real estate property. This was partially offset by a $5.7 million gain on property acquisitions as the fair value of the properties acquired exceeded the purchase price.
Gain on IRT merger with TSRE. IRT recognized a $64 million gain from a bargain purchase on the TSRE merger during the nine-month period ended September 30, 2015.
Gains (losses) on extinguishment of debt. During the nine-month period ended September 30, 2014, gains (losses) on extinguishment of debt was due to the repurchase of $5.8 million principal amount of RAIT I debt notes from the market for $3.4 million of cash.
Asset impairment. During the nine-month period September 30, 2015, one real estate property was impaired resulting in the recognition of impairment of $7,250.
TSRE financing extinguishment and employee separation expenses. In connection with the TSRE merger that occurred during the nine-month period ended September 30, 2015, IRT incurred $27.5 million of financing extinguishment and employee separation expenses.
Change in fair value of financial instruments. During the nine-month period ended September 30, 2015, the change in fair value of financial instruments increased our net income by $13.5 million. The fair value adjustments we recorded were as follows (dollars in thousands):
|
Description |
|
For the Nine- Month Period Ended September 30, 2015 |
|
|
For the Nine- Month Period Ended September 30, 2014 |
|
||
|
Change in fair value of trading securities and security-related receivables |
|
$ |
(173 |
) |
|
$ |
10,960 |
|
|
Change in fair value of CDO notes payable and trust preferred obligations |
|
|
1,909 |
|
|
|
(73,294 |
) |
|
Change in fair value of derivatives |
|
|
(1,064 |
) |
|
|
(12,413 |
) |
|
Change in fair value of warrants and investor SARs |
|
|
12,794 |
|
|
|
15,314 |
|
|
Change in fair value of financial instruments |
|
$ |
13,466 |
|
|
$ |
(59,433 |
) |
The changes in the fair value for the trading securities and security-related receivables, CDO notes payable, and other liabilities for which the fair value option was elected for the nine-month periods ended September 30, 2015 and 2014 was primarily attributable to changes in instrument specific credit risks. The changes in the fair value of the CDO notes payable for which the fair value option was elected was also due to required repayments at par of senior CDO notes due to OC failures when the CDO notes being repaid have a fair value of less than par. The changes in the fair value of derivatives for which the fair value option was elected for the nine-month periods ended September 30, 2015 and 2014 was mainly due to changes in interest rates. The change in fair value of the warrants and investor SARs was due to changes in the reference stock price.
Income tax benefit (provision). Income tax benefit (provision) decreased as we expect the taxable REIT subsidiary that conducts our conduit loan operations to have taxable income for the foreseeable future and we removed the valuation allowance against a portion of its net operating loss carryforwards.
Liquidity and Capital Resources
Liquidity is a measure of our ability to meet potential cash requirements, including ongoing commitments to repay borrowings, fund and maintain investments, pay dividends and other general business needs. We are seeking to expand sales of our securities, our ability to finance conduit loans and bridge loans through CMBS facilities, sales of conduit loans we originate to CMBS securitizations, our ability to sponsor additional securitizations similar to our FL securitizations and our use of other sources of short term financing and secured lines of credit. We are also seeking to develop other financing resources that will permit us to originate or acquire new investments to generate attractive returns while preserving our capital, such as joint venture financing arrangements and loan participations.
We believe our available cash and restricted cash balances, other financing arrangements, and cash flows from operations will be sufficient to fund our liquidity requirements for the next 12 months.
55
Our primary cash requirements are as follows:
|
|
• |
to make investments and fund the associated costs; |
|
|
• |
to repay our indebtedness, including repurchasing, redeeming or retiring our debt before it becomes due; |
|
|
• |
to pay our expenses, including compensation to our employees; |
|
|
• |
to pay U.S. federal, state, and local taxes of our taxable REIT subsidiaries; and |
|
|
• |
to distribute a minimum of 90% of our REIT taxable income and to make investments in a manner that enables us to maintain our qualification as a REIT. |
We intend to meet these liquidity requirements primarily through the following:
|
|
• |
the use of our cash and cash equivalent balances of $92.7 million as of September 30, 2015; |
|
|
• |
cash generated from operating activities, including net investment income from our investment portfolio, and fee income generated by our commercial real estate platform; |
|
|
• |
proceeds from the sales of assets, including the expected property sales described in Overview above; |
|
|
• |
proceeds from future borrowings, including our CMBS facilities and loan participations; and |
|
|
• |
proceeds from future offerings of our securities, including those through our DRSPP and ATM programs. |
Cash Flows
As of September 30, 2015 and 2014, we maintained cash and cash equivalents of approximately $92.7 million and $116.8 million, respectively. Our cash and cash equivalents were generated from the following activities (dollars in thousands):
|
|
|
For the Nine-Month Periods Ended September 30 |
|
|||||
|
|
|
2015 |
|
|
2014 |
|
||
|
Cash flow from operating activities |
|
$ |
59,781 |
|
|
$ |
1,457 |
|
|
Cash flow from investing activities |
|
|
(296,352 |
) |
|
|
(465,815 |
) |
|
Cash flow from financing activities |
|
|
207,497 |
|
|
|
492,278 |
|
|
Net change in cash and cash equivalents |
|
|
(29,074 |
) |
|
|
27,920 |
|
|
Cash and cash equivalents at beginning of period |
|
|
121,726 |
|
|
|
88,847 |
|
|
Cash and cash equivalents at end of period |
|
$ |
92,652 |
|
|
$ |
116,767 |
|
The cash outflow for investing activities for the nine-month period ended September 30, 2015 is substantially due to new investments in loans of $362.6 million which exceeded loan repayments of $169.6 million. We also had cash outflows of $137 million related to the TSRE merger. The cash outflow for investing activities for the nine-month period ended September 30, 2014 is substantially due to new investments in loans of $726.5 million which exceeded loan repayments and conduit loan sales of $381.2 million. We also had cash outflows of $237.2 million due to the acquisition of real estate properties and capital expenditures in our owned real estate assets.
Cash flow from operating activities for the nine-month period ended September 30, 2015, as compared to the same period in 2014, has increased due to more sales of conduit loans during the nine-month period ended September 30, 2015 offset by the timing of payments for various accounts payable and accrued liabilities.
The cash inflow from our financing activities during the nine-month period ended September 30, 2015 is primarily due to the issuance of our preferred shares and common shares, proceeds from our repurchase agreements, proceeds from RAIT FL4, and proceeds from secured credit facilities and loans payable on real estate. These cash inflows were partially offset by the outflows from the repayments on secured credit facilities and loans payable on real estate, the repayments and repurchases of our CDO notes payable and the repayments of our repurchase agreements during the nine-month period ended September 30, 2015.
As a REIT, we evaluate our dividend coverage based on our cash flow from operating activities, excluding acquisition expenses, the origination and sale of conduit loans, IRT’s TSRE employee separation expenses, and changes in assets and liabilities. During the nine-month period ended September 30, 2015, we paid distributions to our preferred shareholders, common shareholders, and non-controlling interests of $78.2 million and generated cash flows from operating activities, before acquisition expenses, origination and sale of conduit loans, IRT’s TSRE employee separation expenses, and changes in assets and liabilities of $70.7 million. The $7.5
56
million of excess distributions was funded through cash flows from the disposition of real estate assets, which is included in cash flows from investing activities in the consolidated statements of cash flows and totaled $20.3 million during the nine-month period ended September 30, 2015.
Capitalization
Refer to Note 6: Indebtedness and Note 11: Shareholders’ Equity in the Notes to Consolidated Financial Statements for information regarding our capitalization.
Off-Balance Sheet Arrangements and Commitments
There have been no material changes in off-balance sheet arrangements or commitments during the nine-month period ended September 30, 2015 from the disclosures included in our Annual Report on Form 10-K for the year ended December 31, 2014. Reference is made to Item 7 included in our Annual Report on Form 10-K for the year ended December 31, 2014.
Critical Accounting Estimates and Policies
Our Annual Report on Form 10-K for the year ended December 31, 2014 contains a discussion of our critical accounting policies. On January 1, 2015 we adopted a new accounting pronouncement and revised our accounting policies as described below. See Note 2 in the Notes to Consolidated Financial Statements. Management discusses our critical accounting policies and management’s judgments and estimates with the audit committee of our board of trustees.
There have been no material changes in quantitative and qualitative market risks during the six-month period ended September 30, 2015 from the disclosures included in our Annual Report on Form 10-K for the year ended December 31, 2014. Reference is made to Item 7A included in our Annual Report on Form 10-K for the year ended December 31, 2014.
Disclosure Controls and Procedures
We maintain disclosure controls and procedures that are designed to ensure that information required to be disclosed in our reports under the Securities Exchange Act of 1934, as amended, or the Exchange Act, is recorded, processed, summarized, and reported within the time periods specified in the SEC’s rules and forms, and that such information is accumulated and communicated to our management, including our chief executive officer and our chief financial officer, as appropriate, to allow timely decisions regarding required disclosure. In designing and evaluating the disclosure controls and procedures, our management recognized that any controls and procedures, no matter how well designed and operated, can provide only reasonable assurance of achieving the desired control objectives, and our management necessarily was required to apply its judgment in evaluating the cost-benefit relationship of possible controls and procedures.
Under the supervision of our chief executive officer and chief financial officer and with the participation of our disclosure committee, we have carried out an evaluation of the effectiveness of our disclosure controls and procedures as of the end of the period covered by this report. Based upon a previously identified material weakness in our internal control over financial reporting, as of December 31, 2014, related to the lack of sufficient qualified resources to ensure appropriate design and operating effectiveness of our internal controls over financial reporting, specifically our reconciliation controls, management review controls and controls over complex transaction and accounting estimates, our chief executive officer and chief financial officer concluded that our disclosure controls and procedures were not effective at September 30, 2015.
Management is in the process of remediating the material weakness described above. Management has enhanced its reconciliation controls, management review controls, and controls over complex transactions and accounting estimates by (i) supplementing its resources, (ii) upgrading its outsourced internal audit function, (iii) designing and documenting additional management review controls, and (iv) providing additional training to effectively perform reconciliation controls, management review controls and controls related to complex transactions and accounting estimates. Management is in the process of evaluating the operating effectiveness of these controls.
We also have made organizational changes and developed skills in our employees in order to strengthen and improve our internal control over financial reporting.
57
Management believes that these measures will remediate the previously identified material weakness. While we have completed our initial testing of these new controls and have concluded they are in place and operating as designed, we are monitoring their ongoing effectiveness, and will consider the material weakness remediated after the applicable remedial controls operate effectively for an additional period of time.
Changes in Internal Control Over Financial Reporting
Except as otherwise stated above, there were no changes in our internal control over financial reporting or in other factors during the quarter ended September 30, 2015, that have materially affected, or were reasonably likely to materially affect, our internal control over financial reporting.
58
General
We are involved from time to time in litigation on various matters, including disputes with tenants of owned properties, disputes arising out of agreements to purchase or sell properties and disputes arising out of our loan portfolio. Given the nature of our business activities, these lawsuits are considered routine to the conduct of our business. The result of any particular lawsuit cannot be predicted, because of the very nature of litigation, the litigation process and its adversarial nature, and the jury system. We do not expect that the liabilities, if any, that may ultimately result from such routine legal actions will have a material adverse effect on our consolidated financial position, results of operations or cash flows.
TCM SEC Settlement
On September 16, 2014, Taberna Capital Management, LLC, or TCM, our subsidiary, reached an agreement in principle with the staff of the Securities and Exchange Commission, or the SEC, to resolve a non-public investigation initiated by SEC staff. Consistent with this agreement in principle, the SEC accepted an offer of settlement submitted by TCM and entered an order (administrative proceeding file no. 3-16776), or the order, on September 2, 2015. TCM consented to the entry of the order without admitting or denying the findings therein. The order, among other things, required TCM to pay disgorgement of $13.0 million, prejudgment interest of $2.0 million and a civil penalty of $6.5 million, aggregating to payments of $21.5 million. The aggregate amount of these payments was consistent with our prior disclosure regarding the agreement in principle referenced above. As previously disclosed, we took a charge of $21.5 million relating to this settlement in 2014. In connection with TCM’s offer of settlement, RAIT Financial Trust provided a written commitment, or the commitment, to the SEC which became effective the date of the order. The commitment provided, among other things, that RAIT would ensure the payment by TCM of the $21.5 million of payments referenced above, which payments were made September 3, 2015.
The order also sets forth the terms of settlements with two individuals named in the order relating to the subject of such investigation. These individuals were one of the two former executive officers and the former employee of RAIT which RAIT previously disclosed had received “Wells Notices” from the SEC staff relating to the subject of such investigation. These individuals consented to the entry of the order without admitting or denying the findings therein. The order, among other things, imposed sanctions on, and required the payment of civil penalties by, each of these individuals. The former executive officer left RAIT as of December 31, 2014 and the former employee left RAIT in 2010. We have been informed that the SEC staff has notified the other former executive officer who received a Wells Notice that the staff has concluded its investigation as to such former executive officer and that it does not intend to recommend that the SEC commence any enforcement action against such former executive officer.
There have not been any material changes from the risk factors previously disclosed in Item 1A—“Risk Factors” in our Annual Report on Form 10-K for the fiscal year ended December 31, 2014.
Item 5. Other Information
The disclosure below is intended to satisfy any obligation of ours to provide disclosure pursuant to clause (d) of Item 5.02 “Departure of Directors or Certain Officers; Election of Directors; Appointment of Certain Officers; Compensatory Arrangements of Certain Officers” of Form 8-K.
Upon the recommendation of the nominating and governance committee, or the nominating and governance committee, of the board of trustees of RAIT Financial Trust, or the board, on November 4, 2015, the board increased the size of the board from eight trustees to nine trustees, elected Michael J. Malter to serve on the board and determined that Mr. Malter was an independent trustee in accordance with all relevant standards set forth in RAIT’s trust governance guidelines. Mr. Malter filled the vacancy on the board created by this increase in the size of the board. There is no arrangement pursuant to which Mr. Malter was selected as a trustee and there have been no transactions regarding Mr. Malter that are required to be disclosed pursuant to Item 404(a) of Regulation S-K. Mr. Malter was not named to any committees of the Board. Effective upon election, Mr. Malter became eligible to receive the standard compensation provided by RAIT to its other non-employee trustees, as most recently disclosed in RAIT’s proxy statement for its 2015 annual meeting of shareholders. Mr. Malter entered into the standard indemnification agreement with RAIT which RAIT offers to its executive officers and trustees. Such indemnification agreement was included as Exhibit 10.1 to RAIT’s annual report on Form 10-K for its fiscal year ended December 31, 2011 and is incorporated by reference herein.
59
Michael J. Malter, age 58, has served as a trustee of RAIT Financial Trust since November 2015. He is a retired investment banker having served in a variety of senior management positions at JPMorgan Chase & Co., or JPM, a financial services firm, and its predecessor firms from 1988 until 2005. He retired as the Co-Head of the Global Financial Institutions Group of JPM in 2005. From 2003 to 2005, he was responsible for oversight of JPM’s banking and investment banking activities with banks and other financial institutions; oversaw mergers and acquisitions assignments, strategic advisory work, capital raising, hedging and derivatives assignments and lending; and was a member of the management committee of JPM’s investment banking division. From 2001 to 2003, he was responsible for JPM’s structured finance businesses in North America and the investment grade capital markets and origination business and was a member of the management committee of the North American Credit Markets Division. In the period from 1988 to 2001, he held a series of management positions with JPM’s predecessors responsible for commercial mortgage loan origination, securitization and trading, asset-backed securities and conduit lending. Mr. Malter currently serves as a director or member of the advisory committee of four investment vehicles that each use Varadero Capital, L.P., an SEC registered investment adviser, as their respective investment manager. Several of these investment vehicles use strategies that focus primarily on investing in asset-backed securities, including investment- and non-investment-grade residential and commercial mortgage-backed securities and collateralized debt obligations.
The disclosure below is provided, at our option, regarding events which we deem of importance to our securities holders in accordance with Item 8.01 “Other Events” of Form 8-K.
Upon the recommendation of the nominating and governance committee, on November 4, 2015, the board amended and restated RAIT’s Trust Governance Guidelines. Such amendments included providing for the establishment of a risk management committee of the board, or the risk management committee. In addition, the board adopted a charter setting forth the responsibilities of the risk management committee and appointed the following board trustees previously determined to be independent trustees to serve as the risk management committee: S. Kristin Kim, chairman, Frank A. Farnesi and Murray Stempel, III.
On October 15, 2015, RAIT received a comment letter, or the comment letter, from the staff of the Division of Corporation Finance of the SEC. The comment letter consisted of two comments issued with respect to the staff’s review of the RAIT’s Form 10-K for the year ended December 31, 2014, or the 2014 annual report. The first comment requested that we revise our presentation of our reconciliation of FFO from net income (loss) allocable to common shares in future filings to clearly label FFO as FFO allocable to common shares. On October 29, 2015, we responded to the SEC that we would make the requested change in future filings. The second comment noted that we disclosed in the 2014 Annual Report on Form 10-k that we had recorded adjustments in our statement of operations for the year ended December 31, 2014 related to transactions completed in a prior period and requested information on the nature, facts and circumstances of these adjustments and our quantitative and qualitative analyses supporting our materiality judgments regarding any corrections of prior period errors. Our October 29, 2015 response to the SEC included the information and analyses requested by the staff and our conclusions regarding the immateriality of the adjustments. As with any company receiving a similar staff comment, we could be required to supplement, restate or otherwise make changes to our previously reported financial statements and other disclosures in order to ultimately address this comment. As of the date of filing of this report, we have not received a response from the staff to our analyses and our conclusions.
|
(a) |
Exhibits |
The exhibits filed as part of this quarterly report on Form 10-Q are identified in the exhibit index immediately following the signature page of this Report. Such Exhibit Index is incorporated herein by reference.
60
Pursuant to the requirements of the Securities Exchange Act of 1934, the registrant has duly caused this report to be signed on its behalf by the undersigned thereunto duly authorized.
|
|
|
RAIT FINANCIAL TRUST (Registrant) |
|
|
|
|
|
|
|
Date: November 9, 2015 |
|
By: |
/s/ Scott F. Schaeffer |
|
|
|
|
Scott F. Schaeffer, Chairman of the Board and |
|
|
|
|
(On behalf of the registrant and as its Principal Executive Officer) |
|
|
|
|
|
|
Date: November 9, 2015 |
|
By: |
/s/ James J. Sebra |
|
|
|
|
James J. Sebra, Chief Financial Officer and Treasurer |
|
|
|
|
(On behalf of the registrant and as its Principal Financial Officer and Principal Accounting Officer) |
61
|
Exhibit Number
|
Description of Documents
|
||
|
|
|
||
|
3.1.1 |
Amended and Restated Declaration of Trust of RAIT Financial Trust (“RAIT”). Incorporated by reference to RAIT’s Registration Statement on Form S-11 (Registration No. 333-35077). |
||
|
|
|
||
|
3.1.2 |
Articles of Amendment to Amended and Restated Declaration of Trust of RAIT. Incorporated by reference to RAIT’s Registration Statement on Form S-11 (Registration No. 333-53067). |
||
|
|
|
||
|
3.1.3 |
Articles of Amendment to Amended and Restated Declaration of Trust of RAIT. Incorporated by reference to RAIT’s Registration Statement on Form S-2 (Registration No. 333-55518). |
||
|
|
|
||
|
3.1.4 |
Certificate of Correction to the Amended and Restated Declaration of Trust of RAIT. Incorporated by reference to RAIT’s Form 10-Q for the Quarterly Period ended March 31, 2002 (File No. 1-14760). |
||
|
|
|
||
|
3.1.5 |
Articles of Amendment to Amended and Restated Declaration of Trust of RAIT. Incorporated by reference to RAIT’s Form 8-K as filed with the Securities and Exchange Commission (“SEC”) on December 15, 2006 (File No. 1-14760). |
||
|
|
|
||
|
3.1.6 |
Articles of Amendment to Amended and Restated Declaration of Trust of RAIT. Incorporated by reference to RAIT’s Form 8-K as filed with the SEC on July, 1 2011 (File No. 1-14760). |
||
|
|
|
||
|
3.1.7 |
Articles Supplementary (the “Series A Articles Supplementary”) relating to the 7.75% Series A Cumulative Redeemable Preferred Shares of Beneficial Interest (the “Series A Preferred Shares”) of RAIT. Incorporated by reference to RAIT’s Form 8-K as filed with the SEC on March 18, 2004 (File No. 1-14760). |
||
|
|
|
||
|
3.1.8 |
Certificate of Correction to the Series A Articles Supplementary. Incorporated by reference to RAIT’s Form 8-K as filed with the SEC on March 18, 2004 (File No. 1-14760). |
||
|
|
|
||
|
3.1.9 |
Articles Supplementary relating to the 8.375% Series B Cumulative Redeemable Preferred Shares of Beneficial Interest, (the “Series B Preferred Shares”) of RAIT. Incorporated by reference to RAIT’s Form 8-K as filed with the SEC on October 1, 2004 (File No. 1-14760). |
||
|
|
|
||
|
3.1.10 |
Articles Supplementary relating to the 8.875% Series C Cumulative Redeemable Preferred Shares of Beneficial Interest, (the “Series C Preferred Shares”) of RAIT. Incorporated by reference to RAIT’s Form 8-A as filed with the SEC on June 29, 2007 (File No. 1-14760). |
||
|
|
|
||
|
3.1.11 |
Articles Supplementary relating to Series A Preferred Shares, Series B Preferred Shares and Series C Preferred Shares. Incorporated by reference to RAIT’s Form 8-K as filed with the SEC on May 25, 2012 (File No. 1-14760). |
||
|
|
|
||
|
3.1.12 |
Certificate of Correction relating to Series A Preferred Shares, Series B Preferred Shares and Series C Preferred Shares. Incorporated by reference to RAIT’s Form 10-Q for the quarterly period ended June 30, 2012 (File No. 1-14760). |
||
|
|
|
||
|
3.1.13 |
Articles Supplementary (the “Series D Articles Supplementary”) relating to the Series D Cumulative Redeemable Preferred Shares of Beneficial Interest (the “Series D Preferred Shares”) of RAIT. Incorporated by reference to RAIT’s Form 8-K as filed with the SEC on October 4, 2012 (File No. 1-14760). |
||
|
|
|
||
|
3.1.14 |
Articles Supplementary relating to the Series E Cumulative Redeemable Preferred Shares of Beneficial Interest (the “Series E Preferred Shares”) of RAIT. Incorporated by reference to RAIT’s Form 8-K as filed with the SEC on December 4, 2012 (File No.1-14760). |
||
|
|
|
||
|
3.1.15 |
Amendment dated November 30, 2012 to the Series D Articles Supplementary. Incorporated by reference to RAIT’s Form 8-K as filed with the SEC on December 4, 2012 (File No.1-14760). |
||
|
|
|
||
|
3.1.16 |
Articles Supplementary relating to the Series A Preferred Shares. Incorporated by reference to RAIT’s Form 8-K as filed with the SEC on June 13, 2014 (File No. 1-14760). |
||
|
|
|
||
|
3.2.1 |
By-laws of RAIT. Incorporated by reference to RAIT’s Form 8-K as filed with the SEC on October 19, 2009 (File No. 1-14760). |
||
|
|
|
||
|
3.2.2 |
First Amendment to the Bylaws of RAIT. Incorporated by reference to RAIT’s Form 8-K as filed with the SEC on April 6, 2015 (File No. 1-14760). |
||
|
|
|
||
|
4.1.1 |
Form of Certificate for Common Shares of Beneficial Interest. Incorporated by reference to RAIT’s Form 8-K as filed with the SEC on July 1, 2011 (File No. 1-14760). |
||
|
|
|
||
|
4.1.2 |
Form of Certificate for the Series A Preferred Shares. Incorporated by reference to RAIT’s Form 8-K as filed with the SEC on March 22, 2004 (File No. 1-14760). |
||
62
|
Exhibit Number
|
Description of Documents
|
||
|
|
|
||
|
4.1.3 |
Form of Certificate for the Series B Preferred Shares. Incorporated by reference to RAIT’s Form 8-K as filed with the SEC on October 1, 2004 (File No. 1-14760). |
||
|
|
|
||
|
4.1.4 |
Form of Certificate for the Series C Preferred Shares. Incorporated by reference to RAIT’s Form 8-A as filed with the SEC on June 29, 2007 (File No. 1-14760). |
||
|
|
|
||
|
4.1.5 |
Form of Certificate for the Series D Preferred Shares. Incorporated by reference to RAIT’s Form 8-K as filed with the SEC on October 23, 2012 (File No. 1-14760). |
||
|
|
|
||
|
4.1.6 |
Form of Certificate for the Series E Preferred Shares. Incorporated by reference to RAIT’s Form 8-K as filed with the SEC on October 23, 2012 (File No. 1-14760). |
||
|
|
|
||
|
4.2.1 |
Base Indenture dated as of December 10, 2013 between RAIT, as issuer, and Wells Fargo Bank, National Association., as trustee. Incorporated by reference to RAIT’s Form 8-K as filed with the SEC on December 13, 2013 (File No. 1-14760). |
||
|
|
|
||
|
4.2.2 |
Supplemental Indenture dated as of December 10, 2013 between RAIT, as issuer, and Wells Fargo Bank, National Association., as trustee. Incorporated by reference to RAIT’s Form 8-K as filed with the SEC on December 13, 2013 (File No. 1-14760). |
||
|
|
|
||
|
4.2.3 |
Form of RAIT 4.00% Convertible Senior Note due 2033 (included in Exhibit 4.2.2). Incorporated by reference to RAIT’s Form 8-K as filed with the SEC on December 13, 2013 (File No. 1-14760). |
||
|
|
|
||
|
4.3.1 |
Base Indenture dated as of March 21, 2011 between RAIT, as issuer, and Wells Fargo Bank, National Association., as trustee. Incorporated by reference to RAIT’s Form 8-K as filed with the SEC on March 22, 2011 (File No. 1-14760). |
||
|
|
|
||
|
4.3.2 |
Supplemental Indenture dated as of March 21, 2011 between RAIT, as issuer, and Wells Fargo Bank, National Association., as trustee. Incorporated by reference to RAIT’s Form 8-K as filed with the SEC on March 22, 2011 (File No. 1-14760). |
||
|
|
|
||
|
4.4 |
Indenture dated as of October 5, 2011 between RAIT and Wilmington Trust, National Association, as trustee. Incorporated by reference to RAIT’s Form 10-Q for the quarterly period ended September 30, 2011 (File No. 1-14760). |
||
|
|
|
||
|
4.5.1 |
Registration Rights Agreement dated as of October 1, 2012 by and among RAIT and ARS VI Investor I, LLC (“ARS VI”). Incorporated by reference to RAIT’s Form 8-K as filed with the SEC on October 4, 2012 (File No. 1-14760). |
||
|
|
|
||
|
4.5.2 |
Amendment No. 1 to Registration Rights Agreement dated as of April 25, 2014 by and among RAIT and ARS VI. Incorporated by reference to RAIT’s Registration Statement on Form S-3 (Registration No. 333-195547). |
||
|
|
|
||
|
4.5.3 |
Common Share Purchase Warrant No.1 dated October 17, 2012 issued by RAIT to ARS VI. Incorporated by reference to RAIT’s Form 8-K as filed with the SEC on October 23, 2012 (File No. 1-14760). |
||
|
|
|
||
|
4.5.4 |
Common Share Appreciation Right No.1 dated October 17, 2012 issued by RAIT to ARS VI. Incorporated by reference to RAIT’s Form 8-K as filed with the SEC on October 23, 2012 (File No. 1-14760). |
||
|
|
|
||
|
4.5.5 |
Common Share Purchase Warrant No. 2 dated November 15, 2012 issued by RAIT to ARS VI. Incorporated by reference to RAIT’s Form 8-K as filed with the SEC on November 21, 2012 (File No.1-14760). |
||
|
|
|
||
|
4.5.6 |
Common Share Appreciation Right No. 2 dated November 15, 2012 issued by RAIT to ARS VI. Incorporated by reference to RAIT’s Form 8-K as filed with the SEC on November 21, 2012 (File No.1-14760). |
||
|
|
|
||
|
4.5.7 |
Common Share Purchase Warrant No. 3 dated December 18, 2012 issued by RAIT to ARS VI. Incorporated by reference to RAIT’s Form 8-K as filed with the SEC on December 18, 2012 (File No.1-14760). |
||
|
|
|
||
|
4.5.8 |
Common Share Appreciation Right No. 3 dated December 18, 2012 issued by RAIT to ARS VI. Incorporated by reference to RAIT’s Form 8-K as filed with the SEC on December 18, 2012 (File No.1-14760). |
||
|
|
|
||
|
4.5.9 |
Common Share Purchase Warrant No. 4 dated March 27, 2014 issued by RAIT Financial Trust to ARS VI. Incorporated by reference to RAIT’s Form 8-K as filed with the SEC on March 27, 2014 (File No. 1-14760). |
||
|
|
|
||
|
4.5.10 |
Common Share Appreciation Right No. 4 dated March 27, 2014 issued by RAIT Financial Trust to ARS VI. Incorporated by reference to RAIT’s Form 8-K as filed with the SEC on March 27, 2014 (File No. 1-14760). |
||
|
|
|
||
|
4.6.1 |
Base Indenture dated as of December 10, 2013 between RAIT, as issuer, and Wells Fargo Bank, National Association., as trustee. Incorporated by reference to RAIT’s Form 8-K as filed with the SEC on December 13, 2013 (File No. 1-14760). |
||
|
|
|
||
63
64
65