Attached files
| file | filename |
|---|---|
| EX-10.14 - EX-10.14 - RAIT Financial Trust | ras-ex1014_615.htm |
| EX-32.2 - EX-32.2 - RAIT Financial Trust | ras-ex322_8.htm |
| EX-32.1 - EX-32.1 - RAIT Financial Trust | ras-ex321_9.htm |
| EX-31.2 - EX-31.2 - RAIT Financial Trust | ras-ex312_7.htm |
| EX-31.1 - EX-31.1 - RAIT Financial Trust | ras-ex311_11.htm |
| EX-12.1 - EX-12.1 - RAIT Financial Trust | ras-ex121_6.htm |
| EX-10.19 - EX-10.19 - RAIT Financial Trust | ras-ex1019_611.htm |
| EX-10.18 - EX-10.18 - RAIT Financial Trust | ras-ex1018_610.htm |
| EX-10.17 - EX-10.17 - RAIT Financial Trust | ras-ex1017_612.htm |
| EX-10.16 - EX-10.16 - RAIT Financial Trust | ras-ex1016_613.htm |
| EX-10.15 - EX-10.15 - RAIT Financial Trust | ras-ex1015_614.htm |
UNITED STATES
SECURITIES AND EXCHANGE COMMISSION
WASHINGTON, D.C. 20549
FORM 10-Q
(Mark One)
|
☒ |
Quarterly Report Pursuant to Section 13 or 15(d) of the Securities Exchange Act of 1934 |
For the quarterly period ended June 30, 2017
or
|
☐ |
Transition Report Pursuant to Section 13 or 15(d) of the Securities Exchange Act of 1934 |
For the transition period from to
Commission File Number 1-14760
RAIT FINANCIAL TRUST
(Exact name of registrant as specified in its charter)
|
Maryland |
23-2919819 |
|
(State or other jurisdiction of incorporation or organization) |
(I.R.S. Employer Identification No.) |
|
|
|
|
Two Logan Square, 100 N. 18th Street, 23rd Floor, Philadelphia, PA |
19103 |
|
(Address of principal executive offices) |
(Zip Code) |
(215) 207-2100
(Registrant’s telephone number, including area code)
N/A
(Former name, former address and former fiscal year, if changed since last report)
Indicate by check mark whether the registrant (1) has filed all reports required to be filed by Section 13 or 15(d) of the Securities Exchange Act of 1934 during the preceding 12 months (or for such shorter period that the registrant was required to file such reports), and (2) has been subject to such filing requirements for the past 90 days. ☒ Yes ☐ No
Indicate by check mark whether the registrant has submitted electronically and posted on its corporate Web site, if any, every Interactive Data File required to be submitted and posted pursuant to Rule 405 of Regulation S-T during the preceding 12 months (or for such shorter period that the registrant was required to submit and post such files). ☒ Yes ☐ No
Indicate by check mark whether the registrant is a large accelerated filer, an accelerated filer, a non-accelerated filer, smaller reporting company, or an emerging growth company. See the definitions of “large accelerated filer,” “accelerated filer,” “smaller reporting company,” and “emerging growth company” in Rule 12b-2 of the Exchange Act.
|
Large accelerated filer |
☐ |
Accelerated filer |
☒ |
|
|
|
|
|
|
Non-accelerated filer |
☐ (Do not check if a smaller reporting company) |
Smaller reporting company |
☐ |
|
|
|
|
|
|
Emerging growth company |
☐ |
|
|
If an emerging growth company, indicate by check mark if the registrant has elected not to use the extended transition period for complying with any new or revised financial accounting standards provided pursuant to Section 13(a) of the Exchange Act. ☐
Indicate by check mark whether the registrant is a shell company (as defined in Rule 12b-2 of the Exchange Act). ☐ Yes ☒ No
A total of 93,105,742 common shares of beneficial interest, par value $0.03 per share, of the registrant were outstanding as of August 4, 2017.
TABLE OF CONTENTS
|
|
|
|
|
Page |
|
|
|
|
|
|
|
|
|
|
|
|
|
|
|
|
|
|
|
Item 1. |
|
|
1 |
|
|
|
|
|
|
|
|
|
|
Consolidated Balance Sheets as of June 30, 2017 and December 31, 2016 |
|
1 |
|
|
|
|
|
|
|
|
|
Consolidated Statements of Operations for the Three and Six Months Ended June 30, 2017 and 2016 |
|
2 |
|
|
|
|
|
|
|
|
|
|
3 |
|
|
|
|
|
|
|
|
|
|
Consolidated Statement of Changes in Equity for the Six Months Ended June 30, 2017 |
|
4 |
|
|
|
|
|
|
|
|
|
Consolidated Statements of Cash Flows for the Six Months Ended June 30, 2017 and 2016 |
|
5 |
|
|
|
|
|
|
|
|
|
|
6 |
|
|
|
|
|
|
|
|
Item 2. |
|
Management’s Discussion and Analysis of Financial Condition and Results of Operations |
|
50 |
|
|
|
|
|
|
|
Item 3. |
|
|
69 |
|
|
|
|
|
|
|
|
Item 4. |
|
|
69 |
|
|
|
|
|
|
|
|
|
|
|
|
|
|
|
|
|
|
|
|
Item 1. |
|
|
70 |
|
|
|
|
|
|
|
|
Item 1A. |
|
|
70 |
|
|
|
|
|
|
|
|
Item 2. |
|
|
72 |
|
|
|
|
|
|
|
|
Item 6. |
|
|
72 |
|
|
|
|
|
|
|
|
|
|
|
73 |
RAIT Financial Trust
(Unaudited and dollars in thousands, except share and per share information)
|
|
|
As of June 30, 2017 |
|
|
As of December 31, 2016 |
|
||
|
Assets |
|
|
|
|
|
|
|
|
|
Investment in mortgages and loans: |
|
|
|
|
|
|
|
|
|
Commercial mortgages, mezzanine loans, and preferred equity interests |
|
$ |
1,267,705 |
|
|
$ |
1,292,639 |
|
|
Allowance for loan losses |
|
|
(23,514 |
) |
|
|
(12,354 |
) |
|
Total investment in mortgages and loans, net (including $1,199,111 and $1,184,588 held by consolidated VIEs, respectively) |
|
|
1,244,191 |
|
|
|
1,280,285 |
|
|
Investments in real estate, net of accumulated depreciation of $35,359 and $138,214, respectively (including $106,005 and $192,070 held by consolidated VIEs, respectively) |
|
|
434,890 |
|
|
|
716,432 |
|
|
Cash and cash equivalents |
|
|
89,317 |
|
|
|
110,531 |
|
|
Restricted cash |
|
|
193,580 |
|
|
|
190,179 |
|
|
Accrued interest receivable |
|
|
32,141 |
|
|
|
36,271 |
|
|
Other assets |
|
|
36,753 |
|
|
|
53,878 |
|
|
Intangible assets, net of accumulated amortization of $8,776 and $22,230, respectively |
|
|
10,901 |
|
|
|
19,267 |
|
|
Total assets |
|
$ |
2,041,773 |
|
|
$ |
2,406,843 |
|
|
Liabilities and Equity |
|
|
|
|
|
|
|
|
|
Indebtedness, net of unamortized discounts, premiums and deferred financing costs of $30,637 and $36,892, respectively (including $1,185,657 and $1,288,258 held by consolidated VIEs, respectively) |
|
$ |
1,588,067 |
|
|
$ |
1,751,082 |
|
|
Accrued interest payable |
|
|
9,229 |
|
|
|
8,347 |
|
|
Accounts payable and accrued expenses |
|
|
15,157 |
|
|
|
20,016 |
|
|
Borrowers' escrows |
|
|
104,197 |
|
|
|
107,183 |
|
|
Deferred taxes and other liabilities |
|
|
37,535 |
|
|
|
60,864 |
|
|
Total liabilities |
|
|
1,754,185 |
|
|
|
1,947,492 |
|
|
Series D cumulative redeemable preferred shares, $0.01 par value per share, 4,000,000 shares authorized, 3,133,720 and 3,536,000 shares issued and outstanding, respectively |
|
|
75,654 |
|
|
|
81,581 |
|
|
Equity: |
|
|
|
|
|
|
|
|
|
Shareholders’ equity: |
|
|
|
|
|
|
|
|
|
Preferred shares, $0.01 par value per share, 25,000,000 shares authorized; |
|
|
|
|
|
|
|
|
|
7.75% Series A cumulative redeemable preferred shares, liquidation preference $25.00 per share, 8,069,288 shares authorized, 5,344,353 and 5,344,353 shares issued and outstanding, respectively |
|
|
53 |
|
|
|
53 |
|
|
8.375% Series B cumulative redeemable preferred shares, liquidation preference $25.00 per share, 4,300,000 shares authorized, 2,340,969 and 2,340,969 shares issued and outstanding, respectively |
|
|
23 |
|
|
|
23 |
|
|
8.875% Series C cumulative redeemable preferred shares, liquidation preference $25.00 per share, 3,600,000 shares authorized, 1,640,425 and 1,640,425 shares issued and outstanding, respectively |
|
|
17 |
|
|
|
17 |
|
|
Series E cumulative redeemable preferred shares, $0.01 par value per share, 4,000,000 shares authorized |
|
|
- |
|
|
|
- |
|
|
Common shares, $0.03 par value per share, 200,000,000 shares authorized 93,105,742 and 92,295,478 issued and outstanding, respectively, including 1,576,040 and 1,079,193 unvested restricted common share awards, respectively |
|
|
2,793 |
|
|
|
2,769 |
|
|
Additional paid in capital |
|
|
2,093,270 |
|
|
|
2,093,257 |
|
|
Retained earnings (deficit) |
|
|
(1,888,102 |
) |
|
|
(1,723,735 |
) |
|
Total shareholders’ equity |
|
|
208,054 |
|
|
|
372,384 |
|
|
Noncontrolling interests |
|
|
3,880 |
|
|
|
5,386 |
|
|
Total equity |
|
|
211,934 |
|
|
|
377,770 |
|
|
Total liabilities and equity |
|
$ |
2,041,773 |
|
|
$ |
2,406,843 |
|
The accompanying notes are an integral part of these consolidated financial statements.
1
Consolidated Statements of Operations
(Unaudited and dollars in thousands, except share and per share information)
|
|
|
For the Three Months Ended June 30, |
|
|
For the Six Months Ended June 30, |
|
||||||||||
|
|
|
2017 |
|
|
2016 |
|
|
2017 |
|
|
2016 |
|
||||
|
Revenue: |
|
|
|
|
|
|
|
|
|
|
|
|
|
|
|
|
|
Investment interest income |
|
$ |
14,882 |
|
|
$ |
23,519 |
|
|
$ |
32,532 |
|
|
$ |
49,321 |
|
|
Investment interest expense |
|
|
(10,546 |
) |
|
|
(9,125 |
) |
|
|
(20,319 |
) |
|
|
(18,445 |
) |
|
Net interest margin |
|
|
4,336 |
|
|
|
14,394 |
|
|
|
12,213 |
|
|
|
30,876 |
|
|
Property income |
|
|
16,946 |
|
|
|
29,666 |
|
|
|
37,011 |
|
|
|
59,721 |
|
|
Fee and other income |
|
|
1,531 |
|
|
|
1,914 |
|
|
|
3,192 |
|
|
|
4,028 |
|
|
Total revenue |
|
|
22,813 |
|
|
|
45,974 |
|
|
|
52,416 |
|
|
|
94,625 |
|
|
Expenses: |
|
|
|
|
|
|
|
|
|
|
|
|
|
|
|
|
|
Interest expense |
|
|
8,883 |
|
|
|
13,967 |
|
|
|
19,026 |
|
|
|
29,837 |
|
|
Real estate operating expense |
|
|
9,509 |
|
|
|
14,327 |
|
|
|
20,143 |
|
|
|
29,175 |
|
|
Property management expenses |
|
|
2,651 |
|
|
|
2,846 |
|
|
|
4,864 |
|
|
|
5,013 |
|
|
General and administrative expenses: |
|
|
|
|
|
|
|
|
|
|
|
|
|
|
|
|
|
Compensation expense |
|
|
3,529 |
|
|
|
3,862 |
|
|
|
7,016 |
|
|
|
7,487 |
|
|
Other general and administrative expense |
|
|
2,689 |
|
|
|
3,706 |
|
|
|
5,394 |
|
|
|
6,921 |
|
|
Total general and administrative expenses |
|
|
6,218 |
|
|
|
7,568 |
|
|
|
12,410 |
|
|
|
14,408 |
|
|
Acquisition and integration expenses |
|
|
67 |
|
|
|
70 |
|
|
|
239 |
|
|
|
179 |
|
|
Provision for loan losses |
|
|
20,863 |
|
|
|
1,344 |
|
|
|
22,398 |
|
|
|
2,669 |
|
|
Depreciation and amortization expense |
|
|
7,819 |
|
|
|
15,134 |
|
|
|
17,573 |
|
|
|
27,807 |
|
|
IRT internalization and management transition expenses |
|
|
- |
|
|
|
- |
|
|
|
736 |
|
|
|
- |
|
|
Shareholder activism expenses |
|
|
1,615 |
|
|
|
- |
|
|
|
2,309 |
|
|
|
- |
|
|
Total expenses |
|
|
57,625 |
|
|
|
55,256 |
|
|
|
99,698 |
|
|
|
109,088 |
|
|
Operating (Loss) Income |
|
|
(34,812 |
) |
|
|
(9,282 |
) |
|
|
(47,282 |
) |
|
|
(14,463 |
) |
|
Interest and other income (expense), net |
|
|
(153 |
) |
|
|
39 |
|
|
|
(139 |
) |
|
|
100 |
|
|
Gains (losses) on assets |
|
|
10,759 |
|
|
|
5,812 |
|
|
|
22,765 |
|
|
|
5,617 |
|
|
Gains (losses) on deconsolidation of properties |
|
|
- |
|
|
|
- |
|
|
|
(15,947 |
) |
|
|
- |
|
|
Gains (losses) on extinguishments of debt |
|
|
(1,598 |
) |
|
|
660 |
|
|
|
1,588 |
|
|
|
1,004 |
|
|
Asset impairment |
|
|
(85,809 |
) |
|
|
(3,864 |
) |
|
|
(93,233 |
) |
|
|
(7,786 |
) |
|
Goodwill impairment |
|
|
(8,342 |
) |
|
|
- |
|
|
|
(8,342 |
) |
|
|
- |
|
|
Change in fair value of financial instruments |
|
|
3,093 |
|
|
|
(1,592 |
) |
|
|
1,940 |
|
|
|
(5,680 |
) |
|
Income (loss) before taxes |
|
|
(116,862 |
) |
|
|
(8,227 |
) |
|
|
(138,650 |
) |
|
|
(21,208 |
) |
|
Income tax benefit (provision) |
|
|
(22 |
) |
|
|
1,756 |
|
|
|
227 |
|
|
|
2,749 |
|
|
Income (loss) from continuing operations |
|
|
(116,884 |
) |
|
|
(6,471 |
) |
|
|
(138,423 |
) |
|
|
(18,459 |
) |
|
Discontinued operations: |
|
|
|
|
|
|
|
|
|
|
|
|
|
|
|
|
|
Income (loss) from discontinued operations |
|
|
- |
|
|
|
32,876 |
|
|
|
- |
|
|
|
34,361 |
|
|
Net income (loss) |
|
|
(116,884 |
) |
|
|
26,405 |
|
|
|
(138,423 |
) |
|
|
15,902 |
|
|
(Income) loss allocated to preferred shares |
|
|
(8,817 |
) |
|
|
(8,615 |
) |
|
|
(17,343 |
) |
|
|
(17,135 |
) |
|
(Income) loss allocated to noncontrolling interests |
|
|
(56 |
) |
|
|
(25,370 |
) |
|
|
(76 |
) |
|
|
(24,191 |
) |
|
Net income (loss) allocable to common shares |
|
$ |
(125,757 |
) |
|
$ |
(7,580 |
) |
|
$ |
(155,842 |
) |
|
$ |
(25,424 |
) |
|
Amount attributable to common shares |
|
|
|
|
|
|
|
|
|
|
|
|
|
|
|
|
|
Net income (loss) available to common shares from continuing operations |
|
$ |
(125,757 |
) |
|
$ |
(14,115 |
) |
|
$ |
(155,842 |
) |
|
$ |
(33,478 |
) |
|
Net income (loss) available to common shares from discontinued operations |
|
|
- |
|
|
|
6,535 |
|
|
|
- |
|
|
|
8,054 |
|
|
Net income (loss) |
|
$ |
(125,757 |
) |
|
$ |
(7,580 |
) |
|
$ |
(155,842 |
) |
|
$ |
(25,424 |
) |
|
Earnings (loss) per share-Basic: |
|
|
|
|
|
|
|
|
|
|
|
|
|
|
|
|
|
Earnings (loss) per share from continuing operations |
|
$ |
(1.38 |
) |
|
$ |
(0.15 |
) |
|
$ |
(1.71 |
) |
|
$ |
(0.37 |
) |
|
Earnings (loss) per share from discontinued operations |
|
|
- |
|
|
|
0.07 |
|
|
|
- |
|
|
|
0.09 |
|
|
Earnings (loss) per share-Basic |
|
$ |
(1.38 |
) |
|
$ |
(0.08 |
) |
|
$ |
(1.71 |
) |
|
$ |
(0.28 |
) |
|
Weighted-average shares outstanding-Basic |
|
|
91,453,415 |
|
|
|
91,190,583 |
|
|
|
91,377,508 |
|
|
|
91,104,314 |
|
|
Earnings (loss) per share-Diluted: |
|
|
|
|
|
|
|
|
|
|
|
|
|
|
|
|
|
Earnings (loss) per share from continuing operations |
|
$ |
(1.38 |
) |
|
$ |
(0.15 |
) |
|
$ |
(1.71 |
) |
|
$ |
(0.37 |
) |
|
Earnings (loss) per share from discontinued operations |
|
|
- |
|
|
|
0.07 |
|
|
|
- |
|
|
|
0.09 |
|
|
Earnings (loss) per share-Diluted |
|
$ |
(1.38 |
) |
|
$ |
(0.08 |
) |
|
$ |
(1.71 |
) |
|
$ |
(0.28 |
) |
|
Weighted average shares outstanding-Diluted |
|
|
91,453,415 |
|
|
|
91,190,583 |
|
|
|
91,377,508 |
|
|
|
91,104,314 |
|
The accompanying notes are an integral part of these consolidated financial statements.
2
Consolidated Statements of Comprehensive Income (Loss)
(Unaudited and dollars in thousands)
|
|
|
For the Three Months Ended June 30, |
|
|
For the Six Months Ended June 30, |
|
||||||||||
|
|
|
2017 |
|
|
2016 |
|
|
2017 |
|
|
2016 |
|
||||
|
Net income (loss) |
|
$ |
(116,884 |
) |
|
$ |
26,405 |
|
|
$ |
(138,423 |
) |
|
$ |
15,902 |
|
|
Other comprehensive income (loss): |
|
|
|
|
|
|
|
|
|
|
|
|
|
|
|
|
|
Change in fair value of interest rate hedges |
|
|
— |
|
|
|
(36 |
) |
|
|
— |
|
|
|
(156 |
) |
|
Realized (gains) losses on interest rate hedges reclassified to earnings |
|
|
— |
|
|
|
1,656 |
|
|
|
— |
|
|
|
4,059 |
|
|
Total other comprehensive income (loss) from continuing operations |
|
|
— |
|
|
|
1,620 |
|
|
|
— |
|
|
|
3,903 |
|
|
Discontinued operations: |
|
|
|
|
|
|
|
|
|
|
|
|
|
|
|
|
|
Other comprehensive income (loss) from discontinued operations |
|
|
— |
|
|
|
(1,169 |
) |
|
|
— |
|
|
|
(1,187 |
) |
|
Total other comprehensive income (loss) |
|
|
— |
|
|
|
451 |
|
|
|
— |
|
|
|
2,716 |
|
|
Comprehensive income (loss) before allocation to noncontrolling interests |
|
|
(116,884 |
) |
|
|
26,856 |
|
|
|
(138,423 |
) |
|
|
18,618 |
|
|
Allocation to noncontrolling interests - net (income) loss |
|
|
(56 |
) |
|
|
(25,370 |
) |
|
|
(76 |
) |
|
|
(24,191 |
) |
|
Allocation to noncontrolling interests - other comprehensive (income) loss |
|
|
— |
|
|
|
1,011 |
|
|
|
— |
|
|
|
1,011 |
|
|
Comprehensive income (loss) allocable to common shares |
|
$ |
(116,940 |
) |
|
$ |
2,497 |
|
|
$ |
(138,499 |
) |
|
$ |
(4,562 |
) |
The accompanying notes are an integral part of these consolidated financial statements.
3
Consolidated Statement of Changes in Equity
(Unaudited and dollars in thousands, except share information)
|
|
|
Preferred Shares— Series A |
|
|
Par Value Preferred Shares— Series A |
|
|
Preferred Shares— Series B |
|
|
Par Value Preferred Shares— Series B |
|
|
Preferred Shares— Series C |
|
|
Par Value Preferred Shares— Series C |
|
|
Common Shares |
|
|
Par Value Common Shares |
|
|
Additional Paid In Capital |
|
|
Retained Earnings (Deficit) |
|
|
Total Shareholders’ Equity |
|
|
Noncontrolling Interests |
|
|
Total Equity |
|
|||||||||||||
|
Balance, December 31, 2016 |
|
|
5,344,353 |
|
|
$ |
53 |
|
|
|
2,340,969 |
|
|
$ |
23 |
|
|
|
1,640,425 |
|
|
$ |
17 |
|
|
|
92,295,478 |
|
|
$ |
2,769 |
|
|
$ |
2,093,257 |
|
|
$ |
(1,723,735 |
) |
|
$ |
372,384 |
|
|
$ |
5,386 |
|
|
$ |
377,770 |
|
|
Net income (loss) |
|
|
|
|
|
|
|
|
|
|
|
|
|
|
|
|
|
|
|
|
|
|
|
|
|
|
|
|
|
|
|
|
|
|
|
|
|
|
(138,499 |
) |
|
|
(138,499 |
) |
|
|
76 |
|
|
|
(138,423 |
) |
|
Preferred shares issued, net |
|
|
|
|
|
|
|
|
|
|
|
|
|
|
|
|
|
|
|
|
|
|
|
|
|
|
|
|
|
|
|
|
|
|
|
|
|
|
|
|
|
|
— |
|
|
|
|
|
|
|
— |
|
|
Preferred dividends |
|
|
|
|
|
|
|
|
|
|
|
|
|
|
|
|
|
|
|
|
|
|
|
|
|
|
|
|
|
|
|
|
|
|
|
|
|
|
(13,213 |
) |
|
|
(13,213 |
) |
|
|
|
|
|
|
(13,213 |
) |
|
Preferred Series D discount amortization |
|
|
|
|
|
|
|
|
|
|
|
|
|
|
|
|
|
|
|
|
|
|
|
|
|
|
|
|
|
|
|
|
|
|
|
|
|
|
(4,130 |
) |
|
|
(4,130 |
) |
|
|
|
|
|
|
(4,130 |
) |
|
Common dividends declared |
|
|
|
|
|
|
|
|
|
|
|
|
|
|
|
|
|
|
|
|
|
|
|
|
|
|
|
|
|
|
|
|
|
|
|
|
|
|
(8,525 |
) |
|
|
(8,525 |
) |
|
|
|
|
|
|
(8,525 |
) |
|
Other comprehensive income (loss), net |
|
|
|
|
|
|
|
|
|
|
|
|
|
|
|
|
|
|
|
|
|
|
|
|
|
|
|
|
|
|
|
|
|
|
|
|
|
|
— |
|
|
|
— |
|
|
|
|
|
|
|
— |
|
|
Share-based compensation |
|
|
|
|
|
|
|
|
|
|
|
|
|
|
|
|
|
|
|
|
|
|
|
|
|
|
995,277 |
|
|
|
30 |
|
|
|
1,054 |
|
|
|
|
|
|
|
1,084 |
|
|
|
|
|
|
|
1,084 |
|
|
Issuance of noncontrolling interests |
|
|
|
|
|
|
|
|
|
|
|
|
|
|
|
|
|
|
|
|
|
|
|
|
|
|
|
|
|
|
|
|
|
|
|
|
|
|
|
|
|
|
— |
|
|
|
66 |
|
|
|
66 |
|
|
Distribution to noncontrolling interests |
|
|
|
|
|
|
|
|
|
|
|
|
|
|
|
|
|
|
|
|
|
|
|
|
|
|
|
|
|
|
|
|
|
|
|
|
|
|
|
|
|
|
— |
|
|
|
(1,702 |
) |
|
|
(1,702 |
) |
|
Derecognition of noncontrolling interests |
|
|
|
|
|
|
|
|
|
|
|
|
|
|
|
|
|
|
|
|
|
|
|
|
|
|
|
|
|
|
|
|
|
|
|
|
|
|
|
|
|
|
— |
|
|
|
54 |
|
|
|
54 |
|
|
Common shares activity related to equity compensation |
|
|
|
|
|
|
|
|
|
|
|
|
|
|
|
|
|
|
|
|
|
|
|
|
|
|
(190,755 |
) |
|
|
(6 |
) |
|
|
(1,041 |
) |
|
|
|
|
|
|
(1,047 |
) |
|
|
|
|
|
|
(1,047 |
) |
|
Common shares issued, net |
|
|
|
|
|
|
|
|
|
|
|
|
|
|
|
|
|
|
|
|
|
|
|
|
|
|
5,742 |
|
|
|
|
|
|
|
|
|
|
|
|
|
|
|
— |
|
|
|
|
|
|
|
— |
|
|
Balance, June 30, 2017 |
|
|
5,344,353 |
|
|
$ |
53 |
|
|
|
2,340,969 |
|
|
$ |
23 |
|
|
|
1,640,425 |
|
|
$ |
17 |
|
|
|
93,105,742 |
|
|
$ |
2,793 |
|
|
$ |
2,093,270 |
|
|
$ |
(1,888,102 |
) |
|
$ |
208,054 |
|
|
$ |
3,880 |
|
|
$ |
211,934 |
|
The accompanying notes are an integral part of these consolidated financial statements.
4
Consolidated Statements of Cash Flows
(Unaudited and dollars in thousands)
|
|
|
For the Six Months Ended June 30, |
|
|||||
|
|
|
2017 |
|
|
2016 |
|
||
|
Operating activities: |
|
|
|
|
|
|
|
|
|
Net income (loss) |
|
$ |
(138,423 |
) |
|
$ |
15,902 |
|
|
Adjustments to reconcile net income (loss) to cash flow from operating activities: |
|
|
|
|
|
|
|
|
|
Provision for loan losses |
|
|
22,398 |
|
|
|
2,669 |
|
|
Share-based compensation expense |
|
|
1,054 |
|
|
|
2,607 |
|
|
Depreciation and amortization expense |
|
|
17,573 |
|
|
|
47,082 |
|
|
Amortization of deferred financing costs and debt discounts |
|
|
7,399 |
|
|
|
11,070 |
|
|
Deferral of loan origination fees and costs, net |
|
|
1,233 |
|
|
|
(2,059 |
) |
|
Amortization of above/below market leases |
|
|
(573 |
) |
|
|
(803 |
) |
|
(Gains) losses on assets |
|
|
(22,765 |
) |
|
|
(37,881 |
) |
|
(Gains) losses on extinguishments of debt |
|
|
(1,588 |
) |
|
|
(446 |
) |
|
Losses on deconsolidation of properties |
|
|
15,947 |
|
|
|
— |
|
|
(Gains) on IRT merger with TSRE |
|
|
— |
|
|
|
(91 |
) |
|
Asset impairment |
|
|
93,233 |
|
|
|
7,786 |
|
|
Goodwill impairment |
|
|
8,342 |
|
|
|
— |
|
|
Change in fair value of financial instruments |
|
|
(1,940 |
) |
|
|
5,680 |
|
|
Provision (benefit) for deferred taxes |
|
|
22 |
|
|
|
(2,841 |
) |
|
Changes in assets and liabilities: |
|
|
|
|
|
|
|
|
|
Decrease in accrued interest receivable |
|
|
4,132 |
|
|
|
5,195 |
|
|
Decrease (increase) in other assets |
|
|
3,749 |
|
|
|
(902 |
) |
|
Increase in accrued interest payable |
|
|
1,840 |
|
|
|
2,561 |
|
|
(Decrease) in accounts payable and accrued expenses |
|
|
(3,456 |
) |
|
|
(7,164 |
) |
|
(Decrease) increase in other liabilities |
|
|
(1,433 |
) |
|
|
1,807 |
|
|
Origination of conduit loans |
|
|
— |
|
|
|
(13,800 |
) |
|
Sales of conduit loans |
|
|
— |
|
|
|
21,377 |
|
|
Net conduit loans (originated) sold |
|
|
— |
|
|
|
7,577 |
|
|
Cash flows provided by operating activities |
|
|
6,744 |
|
|
|
57,749 |
|
|
Investing activities: |
|
|
|
|
|
|
|
|
|
Origination of loans for investment |
|
|
(263,464 |
) |
|
|
(55,584 |
) |
|
Principal repayments on loans |
|
|
274,615 |
|
|
|
175,016 |
|
|
Investments in real estate |
|
|
(3,630 |
) |
|
|
(15,250 |
) |
|
IRT's acquisition of TSRE, net of cash acquired |
|
|
— |
|
|
|
91 |
|
|
Proceeds from the disposition of real estate |
|
|
143,409 |
|
|
|
127,405 |
|
|
(Increase) decrease in restricted cash |
|
|
(8,789 |
) |
|
|
30,650 |
|
|
Cash flows provided by investing activities |
|
|
142,141 |
|
|
|
262,328 |
|
|
Financing activities: |
|
|
|
|
|
|
|
|
|
Repayments on secured credit facilities and loans payable on real estate |
|
|
(667 |
) |
|
|
(242,755 |
) |
|
Proceeds from secured credit facilities, term loans and loans payable on real estate |
|
|
— |
|
|
|
199,480 |
|
|
Repayments and repurchase of CDO notes payable and floating rate securitizations |
|
|
(369,346 |
) |
|
|
(322,887 |
) |
|
Net proceeds from issuance of CDO notes and floating rate securitizations |
|
|
276,894 |
|
|
|
22,559 |
|
|
Repurchase of convertible notes and senior notes |
|
|
— |
|
|
|
(47,614 |
) |
|
Repayments of senior secured notes |
|
|
(46,500 |
) |
|
|
(4,000 |
) |
|
Net proceeds (repayments) related to conduit loan repurchase agreements |
|
|
— |
|
|
|
(10,495 |
) |
|
Net proceeds related to floating rate loan repurchase agreements |
|
|
4,287 |
|
|
|
52,405 |
|
|
Proceeds from issuance of other indebtedness |
|
|
17,022 |
|
|
|
24,796 |
|
|
Distribution to noncontrolling interests |
|
|
(1,702 |
) |
|
|
(15,507 |
) |
|
Issuance of noncontrolling interests |
|
|
66 |
|
|
|
448 |
|
|
Payments for deferred costs |
|
|
(4,415 |
) |
|
|
(2,040 |
) |
|
Common share issuance, net of costs incurred |
|
|
(1,017 |
) |
|
|
(945 |
) |
|
Repurchase of Series D preferred shares |
|
|
(10,057 |
) |
|
|
— |
|
|
Distributions paid to preferred shareholders |
|
|
(17,937 |
) |
|
|
(15,795 |
) |
|
Distributions paid to common shareholders |
|
|
(16,727 |
) |
|
|
(16,728 |
) |
|
Cash flows (used in) financing activities |
|
|
(170,099 |
) |
|
|
(379,078 |
) |
|
Net change in cash and cash equivalents |
|
|
(21,214 |
) |
|
|
(59,001 |
) |
|
Net change in cash and cash equivalents from discontinued operations |
|
|
— |
|
|
|
(10,146 |
) |
|
Net change in cash and cash equivalents from continuing operations |
|
|
(21,214 |
) |
|
|
(48,855 |
) |
|
Cash and cash equivalents at the beginning of the period |
|
|
110,531 |
|
|
|
87,581 |
|
|
Cash and cash equivalents at the end of the period |
|
$ |
89,317 |
|
|
$ |
38,726 |
|
The accompanying notes are an integral part of these consolidated financial statements.
5
Notes to Consolidated Financial Statements
As of June 30, 2017
(Unaudited and dollars in thousands, except share and per share amounts)
NOTE 1: THE COMPANY
RAIT Financial Trust is an internally-managed real estate investment trust focused on providing commercial real estate financing throughout the United States. References to “RAIT”, “we”, “us”, and “our” refer to RAIT Financial Trust and its subsidiaries, unless the context otherwise requires. RAIT is a self-managed and self-advised Maryland real estate investment trust, or REIT.
We finance a substantial portion of our investments through borrowing and securitization strategies seeking to match the maturities and terms of our financings with the maturities and terms of those investments.
On December 20, 2016, the management internalization of one of our previously consolidated variable interest entities, Independence Realty Trust, Inc., or IRT, was completed pursuant to the September 27, 2016 securities and asset purchase agreement, or the IRT internalization agreement. The IRT management internalization consisted of two parts: (i) the sale to IRT of Independence Realty Advisors, LLC, or the IRT advisor, which was our subsidiary and IRT’s external advisor, and (ii) the sale to IRT of certain assets and IRT’s assumption of certain liabilities relating to our multifamily property management business, which we referred to as RAIT Residential, including property management contracts relating to apartment properties owned by ourselves, IRT, and third parties. The purchase price paid by IRT for the IRT management internalization was $43,000, subject to certain pro rations at closing. As part of the same agreement, we sold all of the 7,269,719 shares of IRT’s common stock owned by certain of our subsidiaries on October 5, 2016. See Note 16: Discontinued Operations for further information regarding the IRT management internalization and its effects on our financial statements.
NOTE 2: SUMMARY OF SIGNIFICANT ACCOUNTING POLICIES
a. Basis of Presentation
The accompanying unaudited interim consolidated financial statements have been prepared by management in accordance with U.S. generally accepted accounting principles, or GAAP. Certain information and footnote disclosures normally included in annual consolidated financial statements prepared in accordance with GAAP have been condensed or omitted pursuant to rules and regulations of the U.S. Securities and Exchange Commission. The unaudited interim consolidated financial statements should be read in conjunction with our audited financial statements as of and for the year ended December 31, 2016 included in our Annual Report on Form 10-K. In the opinion of management, all adjustments, consisting only of normal recurring adjustments, necessary to present fairly our consolidated financial position and consolidated results of operations and cash flows are included. The results of operations for the interim periods presented are not necessarily indicative of the results for the full year.
As of June 30, 2017, we began presenting our borrowers’ escrows liability as a separate line item on our consolidated balance sheets. This liability was previously presented within the deferred taxes, borrowers’ escrows and other liabilities line item on our consolidated balance sheets. We have conformed prior periods to reflect this change.
The Consolidated Statement of Operations for the six-month period ended June 30, 2016 includes the impact of correcting the reporting of certain activity that occurred in the three-month period ended March 31, 2016. Specifically, the correction adjusts a clerical error made in the determination of the amount of investment interest expense by increasing investment interest expense and decreasing interest expense by $1,424 for the three-month period ended March 31, 2016. This correction had no impact on any other periods. We evaluated this correction and determined, based on quantitative and qualitative factors, that the change was not material to the consolidated financial statements taken as a whole for any previously filed consolidated financial statements.
For the three and six months ended June 30, 2016, certain entities or distinguishable components of RAIT have been presented as discontinued operations. As of December 31, 2016, these discontinued operations were disposed of. See Note 16: Discontinued Operations for further information.
b. Principles of Consolidation
The consolidated financial statements reflect our accounts and the accounts of our majority-owned and/or controlled subsidiaries. We also consolidate entities that are variable interest entities, or VIEs, where we have determined that we are the primary
6
RAIT Financial Trust
Notes to Consolidated Financial Statements
As of June 30, 2017
(Unaudited and dollars in thousands, except share and per share amounts)
beneficiary of such entities. The portions of these entities that we do not own are presented as noncontrolling interests as of the dates and for the periods presented in the consolidated financial statements. All intercompany accounts and transactions have been eliminated in consolidation.
Under Financial Accounting Standards Board (FASB) Accounting Standards Codification (ASC) Topic 810, “Consolidation”, the determination of whether to consolidate a VIE is based on the power to direct the activities of the VIE that most significantly impact the VIE’s economic performance together with either the obligation to absorb losses or the right to receive benefits that could be significant to the VIE. We define the power to direct the activities that most significantly impact the VIE’s economic performance as the ability to buy, sell, refinance, or recapitalize assets or entities, and solely control other material operating events or items of the entity. For our commercial mortgages, mezzanine loans, and preferred equity investments, certain rights we hold are protective in nature and would preclude us from having the power to direct the activities that most significantly impact the VIE’s economic performance. Assuming both criteria are met, we would be considered the primary beneficiary and would consolidate the VIE. We will continually assess our involvement with VIEs and consolidate the VIEs when we are the primary beneficiary. See Note 8: Variable Interest Entities for additional disclosures pertaining to VIEs.
For entities that we do not consolidate, we account for our investment in them either under the equity method pursuant to ASC Topic 323, “Investments-Equity Method and Joint Ventures” or cost method pursuant to ASC Topic 325, “Investments – Other”.
c. Use of Estimates
The preparation of financial statements in conformity with GAAP requires management to make estimates and assumptions that affect the reported amounts of assets and liabilities, the disclosure of contingent assets and liabilities at the date of the financial statements and the reported amounts of revenue and expenses during the reporting periods. The items that include significant estimates are fair value of financial instruments and allowance for loan losses. Actual results could differ from those estimates.
d. Cash and Cash Equivalents
Cash and cash equivalents include cash held in banks and highly liquid investments with maturities of three months or less when purchased. Cash, including amounts restricted, may at times exceed the Federal Deposit Insurance Corporation deposit insurance limit of $250 per institution. We attempt to mitigate credit risk by placing cash and cash equivalents with major financial institutions. To date, we have not experienced any losses on cash and cash equivalents.
e. Restricted Cash
Restricted cash consists primarily of tenant escrows and borrowers’ funds held by us to fund certain expenditures or to be released at our discretion upon the occurrence of certain pre-specified events, and to serve as additional collateral for borrowers’ loans. As of June 30, 2017 and December 31, 2016, we had $112,311 and $121,395 of restricted cash, respectively, which primarily relates to tenant escrows and borrowers’ funds.
Restricted cash also includes proceeds from the issuance of CDO notes payable by securitizations that are restricted for the purpose of funding additional investments in securities subsequent to the balance sheet date. As of June 30, 2017 and December 31, 2016, we had $81,269 and $68,784, respectively, of restricted cash held by securitizations.
f. Investments in Commercial Mortgage Loans, Mezzanine Loans and Preferred Equity Interests
We invest in commercial mortgage loans, mezzanine loans and preferred equity interests. We account for our investments in commercial mortgage loans, mezzanine loans and preferred equity interests at amortized cost. The carrying value of these investments is adjusted for origination discounts/premiums, nonrefundable fees and direct costs for originating loans which are amortized into income on a level yield basis over the terms of the loans.
g. Allowance for Loan Losses, Impaired Loans and Non-accrual Status
We maintain an allowance for loan losses on our investments in commercial mortgages, mezzanine loans and preferred equity interests. Management’s periodic evaluation of the adequacy of the allowance is based upon expected and inherent risks in the
7
RAIT Financial Trust
Notes to Consolidated Financial Statements
As of June 30, 2017
(Unaudited and dollars in thousands, except share and per share amounts)
portfolio, the estimated value of underlying collateral, and current economic conditions. The credit quality of our loans is monitored via quantitative and qualitative metrics. Quantitatively we evaluate items such as the current debt service coverage ratio and annual net operating income of the underlying property. Qualitatively we evaluate items such as recent operating performance of the underlying property and history of the borrower’s ability to provide financial support. These items together are considered in developing our view of each loan’s risk rating, which are categorized as either impaired or satisfactory. Management reviews loans for impairment and establishes specific reserves when a loss is probable under the provisions of FASB ASC Topic 310, “Receivables.” A loan is impaired when it is probable that we may not collect all principal and interest payments according to the contractual terms. As part of the detailed loan review, we consider many factors about the specific loan, including payment history, asset performance, borrower’s financial capability and other characteristics. Management evaluates loans for non-accrual status each reporting period. A loan is placed on non-accrual status when the loan payment deficiencies exceed 90 days unless it is well secured and in the process of collection, or if the collection of principal and interest in full is not probable. Payments received for non-accrual loans are applied to principal until the loan is removed from non-accrual status. Loans are generally removed from non-accrual status when they are making current interest payments. The allowance for loan losses is increased by the provision for loan losses and decreased by charge-offs (net of recoveries). We charge off a loan when we determine that all commercially reasonable means of recovering the loan balance have been exhausted. This may occur at a variety of times, including when we receive cash or other assets in a pre-foreclosure sale or take control of the underlying collateral in full satisfaction of the loan upon foreclosure. We consider circumstances such as these to indicate that the loan collection process has ceased and that a loan is uncollectible.
h. Investments in Real Estate
Investments in real estate are shown net of accumulated depreciation. We capitalize those costs that have been determined to improve the real property and depreciate those costs on a straight-line basis over the useful life of the asset. We depreciate real property using the following useful lives: buildings and improvements—30 to 40 years; furniture, fixtures, and equipment—5 to 10 years; and tenant improvements—shorter of the lease term or the life of the asset. Costs for ordinary maintenance and repairs are charged to expense as incurred.
Acquisitions of real estate assets and any related intangible assets are recorded initially at fair value under FASB ASC Topic 805, “Business Combinations.” Fair value is determined by management based on market conditions and inputs at the time the asset is acquired. The fair value of the real estate acquired is allocated to the acquired tangible assets, consisting of land, building and tenant improvements, and identified intangible assets and liabilities, consisting of the value of above-market and below-market leases for acquired in-place leases and the value of tenant relationships, based in each case on their fair values. Purchase accounting is applied to assets and liabilities associated with the real estate acquired. Transaction costs and fees incurred related to acquisitions are expensed as incurred.
Upon the acquisition of properties, we estimate the fair value of acquired tangible assets (consisting of land, building and improvements) and identified intangible assets and liabilities (consisting of above and below-market leases, in-place leases and tenant relationships), and assumed debt at the date of acquisition, based on the evaluation of information and estimates available at that date. In determining the fair value of the identified intangible assets and liabilities of an acquired property, above-market and below-market in-place lease values are recorded based on the present value (using an interest rate that reflects the risks associated with the leases acquired) of the differences between (i) the contractual amounts to be paid pursuant to the in-place leases and (ii) management’s estimate of fair market lease rates for the corresponding in-place leases, measured over a period equal to the remaining term of the lease. The capitalized above-market lease values and the capitalized below-market lease values are amortized as an adjustment to property income over the lease term.
The aggregate value of in-place leases is determined by evaluating various factors, including an estimate of carrying costs during the expected lease-up periods, current market conditions and similar leases. In estimating carrying costs, management includes real estate taxes, insurance and other operating expenses, and estimates of lost rental revenue during the expected lease-up periods based on current market demand. Management also estimates costs to execute similar leases including leasing commissions, legal and other related costs. The value assigned to this intangible asset is amortized over the assumed lease up period.
Management reviews our investments in real estate for impairment whenever events or changes in circumstances indicate that the carrying amount of an asset may not be recoverable. The review of recoverability is based on an estimate of the future undiscounted cash flows (excluding interest charges) expected to result from the long-lived asset’s use and eventual disposition. These cash flows consider factors such as expected future operating income, trends and prospects, as well as the effects of leasing demand,
8
RAIT Financial Trust
Notes to Consolidated Financial Statements
As of June 30, 2017
(Unaudited and dollars in thousands, except share and per share amounts)
competition and other factors. If impairment exists due to the inability to recover the carrying value of a long-lived asset, an impairment loss is recorded to the extent that the carrying value exceeds the estimated fair value of the property. During the three and six months ended June 30, 2017, we recognized $81,444 and $88,868, respectively, of non-cash impairment charges on our real estate assets. Refer to Note 4: Investments in Real Estate for further discussion of the non-cash impairment charges.
i. Revenue Recognition
|
|
1) |
Interest income—We recognize interest income from investments in commercial mortgage loans, mezzanine loans, and preferred equity interests on a yield to maturity basis. Certain of our commercial mortgage loans, mezzanine loans and preferred equity interests provide for the accrual of interest at specified rates that differ from current payment terms. Interest income is recognized on such loans, the majority of which were originated prior to 2011, at the accrual rate subject to management’s determination that accrued interest and outstanding principal are ultimately collectible. Management will cease accruing interest on these loans when it determines that collection of the interest income is not probable based on the value of the underlying collateral using discounted cash flow models and market based assumptions. The accrued interest receivable associated with these loans as of June 30, 2017 and December 31, 2016 was $26,305 and $29,845, respectively. During the three months ended June 30, 2017, the accrued interest receivable of $3,636 related to one of these loans was determined to be uncollectible and was written off as a reduction to investment interest income. These loans are considered to be impaired when the total contractual amount owed exceeds the estimated value of the underlying collateral. Three of these loans, with an unpaid principal balance of $24,228 were considered to be impaired as of June 30, 2017. One of these loans, with an unpaid principal balance of $12,869 was considered to be impaired as of December 31, 2016. |
For investments that we do not elect to record at fair value under FASB ASC Topic 825, “Financial Instruments”, origination fees and direct loan origination costs are deferred and amortized to net investment income, using the effective interest method, over the contractual life of the underlying loan security or loan, in accordance with FASB ASC Topic 310, “Receivables.”
For investments that we elect to record at fair value under FASB ASC Topic 825, origination fees and direct loan costs are recorded in income and are not deferred.
|
|
2) |
Property income—We generate property income from tenant rent and other tenant-related activities at our consolidated real estate properties. For multifamily real estate properties, property income is recorded when due from residents and recognized monthly as it is earned and realizable, under lease terms which are generally for periods of one year or less. For retail and office real estate properties, property income is recognized on a straight-line basis from the later of the date of the commencement of the lease or the date of acquisition of the property subject to existing leases, which averages minimum rents over the terms of the leases. For retail and office real estate properties, leases also typically provide for tenant reimbursement of a portion of common area maintenance and other operating expenses to the extent that a tenant’s pro rata share of expenses exceeds a base year level set in the lease. |
|
|
3) |
Fee and other income—We generate fee and other income through our various subsidiaries by (a) funding conduit loans for sale into unaffiliated commercial mortgage-backed securities, or CMBS, securitizations, (b) providing or arranging to provide financing to our borrowers, (c) providing ongoing asset management services to investment portfolios under cancelable management agreements, and (d) providing property management services to third parties. We recognize revenue for these activities when the fees are fixed or determinable, are evidenced by an arrangement, collection is reasonably assured and the services under the arrangement have been provided. While we may receive asset management fees when they are earned, we eliminate earned asset management fee income from securitizations while such securitizations are consolidated. During the three and six months ended June 30, 2017, we earned $215 and $488, respectively, of asset management fees, which were eliminated as they were associated with consolidated securitizations. During the three and six months ended June 30, 2016, we earned $376 and $778, respectively, of asset management fees, which were eliminated as they were associated with consolidated securitizations. |
9
RAIT Financial Trust
Notes to Consolidated Financial Statements
As of June 30, 2017
(Unaudited and dollars in thousands, except share and per share amounts)
j. Fair Value of Financial Instruments
In accordance with FASB ASC Topic 820, “Fair Value Measurements and Disclosures”, fair value is the price that would be received to sell an asset or paid to transfer a liability in an orderly transaction between market participants at the measurement date. Where available, fair value is based on observable market prices or parameters or derived from such prices or parameters. Where observable prices or inputs are not available, valuation models are applied. These valuation techniques involve management estimation and judgment, the degree of which is dependent on the price transparency for the instruments or market and the instruments’ complexity for disclosure purposes. Assets and liabilities recorded at fair value in the consolidated balance sheets are categorized based upon the level of judgment associated with the inputs used to measure their value. Hierarchical levels, as defined in FASB ASC Topic 820, “Fair Value Measurements and Disclosures” and directly related to the amount of subjectivity associated with the inputs to fair valuations of these assets and liabilities, are as follows:
|
|
• |
Level 1: Valuations are based on unadjusted, quoted prices in active markets for identical assets or liabilities at the measurement date. The types of assets carried at Level 1 fair value generally are equity securities listed in active markets. As such, valuations of these investments do not entail a significant degree of judgment. |
|
|
• |
Level 2: Valuations are based on quoted prices for similar instruments in active markets or quoted prices for identical or similar instruments in markets that are not active or for which all significant inputs are observable, either directly or indirectly. Fair value assets and liabilities that are generally included in this category are derivatives where the fair value is based on observable market inputs. |
|
|
• |
Level 3: Inputs are unobservable inputs for the asset or liability, and include situations where there is little, if any, market activity for the asset or liability. In certain cases, the inputs used to measure fair value may fall into different levels of the fair value hierarchy. In such cases, the level in the fair value hierarchy within which the fair value measurement in its entirety falls has been determined based on the lowest level input that is significant to the fair value measurement in its entirety. Our assessment of the significance of a particular input to the fair value measurement in its entirety requires judgment, and considers factors specific to the asset or liability. |
The availability of observable inputs can vary depending on the financial asset or liability and is affected by a wide variety of factors, including, for example, the type of investment, whether the investment is new, whether the investment is traded on an active exchange or in the secondary market, and the current market condition. To the extent that valuation is based on models or inputs that are less observable or unobservable in the market, the determination of fair value requires more judgment. Accordingly, the degree of judgment exercised by us in determining fair value is greatest for instruments categorized in Level 3.
Fair value is a market-based measure considered from the perspective of a market participant who holds the asset or owes the liability rather than an entity-specific measure. Therefore, even when market assumptions are not readily available, our own assumptions are set to reflect those that management believes market participants would use in pricing the asset or liability at the measurement date. We use prices and inputs that management believes are current as of the measurement
date, including during periods of market dislocation. In periods of market dislocation, the observability of prices and inputs may be reduced for many instruments. This condition could cause an instrument to be transferred from Level 1 to Level 2 or Level 2 to Level 3.
Many financial instruments have bid and ask prices that can be observed in the marketplace. Bid prices reflect the highest price that buyers in the market are willing to pay for an asset. Ask prices represent the lowest price that sellers in the market are willing to accept for an asset. For financial instruments whose inputs are based on bid-ask prices, we do not require that fair value always be a predetermined point in the bid-ask range. Our policy is to allow for mid-market pricing and adjusting to the point within the bid-ask range that results in our best estimate of fair value.
10
RAIT Financial Trust
Notes to Consolidated Financial Statements
As of June 30, 2017
(Unaudited and dollars in thousands, except share and per share amounts)
Fair value for certain of our Level 3 financial instruments is derived using internal valuation models. These internal valuation models include discounted cash flow analyses developed by management using current interest rates, estimates of the term of the particular instrument, specific issuer information and other market data for securities without an active market. In accordance with FASB ASC Topic 820, “Fair Value Measurements and Disclosures”, the impact of our own credit spreads is also considered when measuring the fair value of financial assets or liabilities, including derivative contracts. Where appropriate, valuation adjustments are made to account for various factors, including bid-ask spreads, credit quality and market liquidity. These adjustments are applied on a consistent basis and are based on observable inputs where available. Management’s estimate of fair value requires significant management judgment and is subject to a high degree of variability based upon market conditions, the availability of specific issuer information and management’s assumptions.
k. Transfers of Financial Assets
We account for transfers of financial assets under FASB ASC Topic 860, “Transfers and Servicing”, as either sales or financings. Transfers of financial assets that result in sales accounting are those in which (1) the transfer legally isolates the transferred assets from the transferor, (2) the transferee has the right to pledge or exchange the transferred assets and no condition both constrains the transferee’s right to pledge or exchange the assets and provides more than a trivial benefit to the transferor, and (3) the transferor does not maintain effective control over the transferred assets. If the transfer does not meet these criteria, the transfer is accounted for as a financing. Financial assets that are treated as sales are removed from our accounts with any realized gain (loss) reflected in earnings during the period of sale. Financial assets that are treated as financings are maintained on the balance sheet with proceeds received from the legal transfer reflected as securitized borrowings or security-related receivables.
l. Deferred Financing Costs
Costs incurred in connection with debt financing are deferred and classified within indebtedness and charged to interest expense over the terms of the related debt agreements, under the effective interest method.
m. Intangible Assets
Intangible assets on our consolidated balance sheets represent identifiable intangible assets acquired in business acquisitions. We amortize identified intangible assets to expense over their estimated lives using the straight-line method. We evaluate intangible assets for impairment as events and circumstances change, in accordance with FASB ASC Topic 350, “Intangibles-Goodwill and Other.” The gross carrying amount for our customer relationships was $3,134 and $12,276 as of June 30, 2017 and December 31, 2016, respectively. The gross carrying amount for our in-place leases and above market leases was $16,543 and $26,122 as of June 30, 2017 and December 31, 2016, respectively. The gross carrying amount for our retail property manager’s trade name was $0 and $1,500 as of June 30, 2017 and December 31, 2016, respectively. The accumulated amortization for our intangible assets was $8,776 and $22,230 as of June 30, 2017 and December 31, 2016, respectively. We recorded amortization expense of $1,913 and $5,451 for the three months ended June 30, 2017 and 2016, respectively, and $4,560 and $7,773 for the six months ended June 30, 2017 and 2016, respectively. Based on the intangible assets identified above, we expect to record amortization expense of intangible assets of $1,604 for the remainder of 2017, $2,449 for 2018, $1,904 for 2019, $1,349 for 2020, $1,060 for 2021 and $2,535 thereafter. As a result of the declining profitability of our retail property manager subsidiary, which has been a product of the current challenges facing the retail property sector, we recognized non-cash impairment charges of $3,402 on our customer relationships and $963 on our retail property manager’s trade name during the three and six months ended June 30, 2017. These non-cash impairment charges are presented in asset impairment on our consolidated statements of operations.
n. Derivative Instruments
In accordance with FASB ASC Topic 815, “Derivatives and Hedging”, we measure each derivative instrument at fair value and record such amounts in our consolidated balance sheet as either an asset or liability. For derivatives designated as fair value hedges, derivatives not designated as hedges, or for derivatives designated as cash flow hedges associated with debt for which we elected the fair value option under FASB ASC Topic 825, “Financial Instruments”, the changes in fair value of the derivative instrument are recorded in earnings. For derivatives designated as cash flow hedges, the changes in the fair value of the effective portions of the derivative are reported in other comprehensive income. Changes in the ineffective portions of cash flow hedges, if any, are recognized in earnings.
11
RAIT Financial Trust
Notes to Consolidated Financial Statements
As of June 30, 2017
(Unaudited and dollars in thousands, except share and per share amounts)
The Chicago Mercantile Exchange (“CME”) and the London Clearing House (“LCH”) recently made amendments to their respective rules that resulted in the prospective accounting treatment of variation margin payments (certain daily payments that were historically accounted for as collateral) being considered settlements of their related derivatives. While the CME rule, which became effective in January 2017, is mandatory, the LCH rule allows a clearing member institution the option to adopt the rule changes on an individual contract or portfolio basis. As of June 30, 2017, $12,650 of notional amount of our derivative contracts were cleared on the LCH. During the second quarter of 2017, our LCH clearing member institution adopted the new rule change. As of June 30, 2017, $38 of variation margin payments related to these derivatives have been accounted for as settlements of the derivatives.
o. Goodwill
Goodwill on our consolidated balance sheet represented the amounts paid in excess of the fair value of the net assets acquired from business acquisitions accounted for under FASB ASC Topic 805, “Business Combinations.” Pursuant to FASB ASC Topic 350, “Intangibles-Goodwill and Other”, goodwill is not amortized to expense but rather is analyzed for impairment. We evaluate goodwill for impairment on an annual basis and as events and circumstances change, in accordance with FASB ASC Topic 350. As of June 30, 2017 and December 31, 2016, we had $0 and $8,342, respectively, of goodwill that is included in Other Assets in the accompanying consolidated balance sheets. As a result of the declining profitability of our retail property manager subsidiary, which has been a product of the current challenges facing the retail property sector, we concluded that a triggering event had occurred leading to a $8,342 non-cash impairment charge on our goodwill, which was recognized during the three and six months ended June 30, 2017. This non-cash impairment charge is presented in goodwill impairment on our consolidated statements of operations.
p. Income Taxes
RAIT, Taberna Realty Finance Trust, or TRFT, the RAIT Venture REITs, and IRT have each elected to be taxed as a REIT and to comply with the related provisions of the Internal Revenue Code of 1986, as amended, or the Internal Revenue Code. As of October 5, 2016, IRT was no longer consolidated by RAIT. Refer to Note 16: Discontinued Operations for further discussion of IRT. In February 2016 and January 2017, in conjunction with the ventures described in Note 5: Indebtedness and Note 8: Variable Interest Entities, we created two new entities that elected to be taxed as REITs, which we refer to as the RAIT Venture VIEs. These entities hold the FL-5 and FL-6 junior notes for the aforementioned ventures. Accordingly, we generally will not be subject to U.S. federal income tax to the extent of our dividends to shareholders and as long as certain asset, income and share ownership tests are met. If we were to fail to meet these requirements, we would be subject to U.S. federal income tax, which could have a material adverse impact on our results of operations and amounts available for dividends to our shareholders. Management believes that all of the criteria to maintain RAIT’s, TRFT’s, the RAIT Venture VIEs and, in the relevant period, IRT’s REIT qualification have been met for the applicable periods, but there can be no assurance that these criteria will continue to be met in subsequent periods.
We maintain various taxable REIT subsidiaries, or TRSs, which may be subject to U.S. federal, state and local income taxes and foreign taxes. Current and deferred taxes are provided on the portion of earnings (losses) recognized by us with respect to our interest in domestic TRSs. Deferred income tax assets and liabilities are computed based on temporary differences between our GAAP consolidated financial statements and the federal and state income tax basis of assets and liabilities as of the consolidated balance sheet date. We evaluate the realizability of our deferred tax assets (e.g., net operating loss and capital loss carryforwards) and recognize a valuation allowance if, based on the available evidence, it is more likely than not that some portion or all of our deferred tax assets will not be realized. When evaluating the realizability of our deferred tax assets, we consider estimates of expected future taxable income, existing and projected book/tax differences, tax planning strategies available, and the general and industry specific economic outlook. This realizability analysis is inherently subjective, as it requires management to forecast our business and general economic environment in future periods. Changes in estimates of deferred tax asset realizability, if any, are included in income tax expense on the consolidated statements of operations.
In prior years, our TRS entities generated taxable revenue primarily from (i) advisory fees for services provided to IRT, (ii) property management fees for services provided to RAIT properties, IRT properties and third-party properties, and (iii) fees and other income from our CMBS lending business. In the current year, our TRS entities generate taxable revenue primarily from (i) property management fees for services provided to RAIT properties and third-party properties, and (ii) fees and other income from our CMBS lending business. In consolidation, the advisory fees and property management fees related to IRT were eliminated through October 5, 2016 and property management fees related to RAIT properties were eliminated in their entirety. Nonetheless, all income taxes are
12
RAIT Financial Trust
Notes to Consolidated Financial Statements
As of June 30, 2017
(Unaudited and dollars in thousands, except share and per share amounts)
expensed and are paid by the TRSs in the year in which the revenue is received. These income taxes are not eliminated when the related revenue is eliminated in consolidation.
The TRS entities may be subject to tax laws that are complex and potentially subject to different interpretations by the taxpayer and the relevant governmental taxing authorities. In establishing a provision for income tax expense, we must make judgments and interpretations about the application of these inherently complex tax laws. Actual income taxes paid may vary from estimates depending upon changes in income tax laws, actual results of operations, and the final audit of tax returns by taxing authorities. Tax assessments may arise several years after tax returns have been filed. We review the tax balances of our TRS entities quarterly and, as new information becomes available, the balances are adjusted as appropriate.
As part of our change in strategic direction and to decrease administrative processes, during the year ended December 31, 2016, we moved our active TRS entities under a single holding company. We elected a November 30th taxable year end for the TRS holding company. We estimated the effective tax rate and current income tax liability as of December 31, 2016 by projecting activity for the full taxable year ended November 30, 2017. As we projected ordinary taxable income for the TRS holding company for its taxable year ended November 30, 2017, we recognized a current income tax liability as of December 31, 2016. During the six months ended June 30, 2017, we updated our projections for 2017 and are now projecting an ordinary loss position for taxable year 2017 for the TRS holding company. As a result, we reversed the current income tax liability accrued as of December 31, 2016, which generated a current income tax benefit of $249 during the six months ended June 30, 2017. During the three and six months ended June 30, 2017, a deferred income tax expense of $22 was also recognized related to insignificant activities occurring in our TRS entities during the period.
q. Shareholder Activism Expenses
During the three and six months ended June 30, 2017, we incurred additional expenses beyond those normally associated with soliciting proxies for our annual meeting of shareholders as a result of responding to an unsolicited and nonbinding externalization of management proposal as well as an activist campaign threatened by an activist investor. On May 26, 2017, we entered into a cooperation agreement with this investor pursuant to which, among other things, the investor agreed to terminate its proxy contest against us and withdraw the notice of proposed trustee candidates it submitted to us and we agreed to reimburse the investor $250 for the out-of-pocket expenses incurred by the investor in connection with its unsolicited and nonbinding externalization of management proposal and its activist campaign against us. Refer to Note 12: Related Party Transactions for further discussion. Our expenses as a result of responding to an unsolicited and nonbinding externalization of management proposal as well as an activist campaign threatened by an activist investor totaled $1,615 and $2,309 for the three and six months ended June 30, 2017, respectively, and are presented as shareholder activism expenses in our consolidated statements of operations.
r. Recent Accounting Pronouncements
We consider the applicability and impact of all accounting standards updates (ASUs) issued by the FASB. Accounting standards updates not listed below were assessed and determined to be either not applicable or are expected to have minimal impact on our consolidated financial position or results of operations.
Adopted within these Financial Statements
In March 2016, the FASB issued an accounting standard classified under FASB ASC Topic 815, “Derivatives and Hedging”. This accounting standard clarifies that a change in the counterparty to a derivative instrument that has been designated as the hedging instrument under Topic 815 does not, in and of itself, require dedesignation of that hedging relationship provided that all other hedge accounting criteria continue to be met. This standard was effective for financial statements issued for annual periods beginning after December 15, 2016, and interim periods within those fiscal years. This standard did not have an impact on our consolidated financial statements.
In March 2016, the FASB issued an accounting standard classified under FASB ASC Topic 815, “Derivatives and Hedging”. This accounting standard clarifies the requirements for assessing whether contingent call (put) options that can accelerate the payment of principal on debt instruments are clearly and closely related to their debt hosts. This accounting standard clarifies what steps are required when assessing whether the economic characteristics and risks of call (put) options are clearly and closely related to the economic characteristics and risks of their debt hosts, which is one of the criteria for bifurcating an embedded derivative.
13
RAIT Financial Trust
Notes to Consolidated Financial Statements
As of June 30, 2017
(Unaudited and dollars in thousands, except share and per share amounts)
Consequently, when a call (put) option is contingently exercisable, an entity does not have to assess whether the event that triggers the ability to exercise a call (put) option is related to interest rates or credit risks. This standard was effective for financial statements issued for annual periods beginning after December 15, 2016, and interim periods within those fiscal years. This standard did not have an impact on our consolidated financial statements.
In March 2016, the FASB issued an accounting standard classified under FASB ASC Topic 718, “Compensation – Stock Compensation”. This accounting standard simplifies several aspects of the accounting for share-based payment award transactions, including: (i) income tax consequences; (ii) classification of awards as either equity or liabilities; and (iii) classification on the statement of cash flows. This standard was effective for annual periods beginning after December 15, 2016, and interim periods within those annual periods. This standard did not have a material impact on our consolidated financial statements.
In October 2016, the FASB issued an accounting standard classified under FASB ASC Topic 810, “Consolidation”. The amendments in this accounting standard provide guidance on how a reporting entity that is the single decision maker of a VIE should treat indirect interests in the entity held through related parties that are under common control with the reporting entity when determining whether it is the primary beneficiary of that VIE. The amendments in this accounting standard do not change the characteristics of a primary beneficiary in current GAAP. A primary beneficiary of a VIE has both of the following characteristics: (i) the power to direct the activities of a VIE that most significantly impact the VIE’s economic performance and (ii) the obligation to absorb losses of the VIE that could potentially be significant to the VIE or the right to receive benefits from the VIE that could potentially be significant to the VIE. If a reporting entity satisfies the first characteristic of a primary beneficiary (such that it is the single decision maker of a VIE), the amendments in this accounting standard require that the reporting entity, in determining whether it satisfies the second characteristic of a primary beneficiary, to include all of its direct variable interest in a VIE and, on a proportionate basis, its indirect variable interest in a VIE held through related parties, including related parties that are under common control with the reporting entity. If after performing that assessment, a reporting entity that is the single decision maker of a VIE concludes that it does not have the characteristics of a primary beneficiary, the amendments continue to require that the reporting entity evaluate whether it and one or more of its related parties under common control, as a group, have the characteristics of a primary beneficiary. The amendments in this accounting standard were effective for fiscal years beginning after December 15, 2016, including interim periods within those fiscal years. This standard did not have an impact on our consolidated financial statements.
In January 2017, the FASB issued an accounting standard classified under FASB ASC Topic 350, “Intangibles – Goodwill and Other”. The amendments in this accounting standard removes step 2 of the goodwill impairment test, which requires a hypothetical purchase price allocation. As a result, a goodwill impairment will now be the amount by which a reporting unit’s carrying value exceeds its fair value, not to exceed the carrying amount of goodwill. The amendments in this accounting standard are effective for fiscal years beginning after December 15, 2019, including interim periods within those fiscal years. Early adoption of the amendments in this standard is permitted. This standard did not have an impact on our consolidated financial statements, however, we applied the guidance contained in this accountings standard in measuring the goodwill impairment referred to above in section O. Goodwill.
Not Yet Adopted Within These Financial Statements
In May 2014, the FASB issued an accounting standard classified under FASB ASC Topic 606, “Revenue from Contracts with Customers”. This accounting standard establishes a single comprehensive model for entities to use in accounting for revenue arising from contracts with customers and supersedes the most current revenue recognition guidance, including industry-specific guidance. This accounting standard generally replaces existing guidance by requiring an entity to recognize the amount of revenue to which it expects to be entitled for the transfer of promised goods or services to customers. This accounting standard applies to all contracts with customers, except those that are within the scope of other Topics in the FASB ASC. During 2016 and 2017, the FASB issued multiple amendments to this accounting standard that provide further clarification to this accounting standard. These standards amending FASB ASC Topic 606 are currently effective for annual reporting periods beginning after December 15, 2017. Management is currently evaluating the impact that these standards may have on our consolidated financial statements.
In January 2016, the FASB issued an accounting standard classified under FASB ASC Topic 825, “Financial Instruments”. This accounting standard addresses certain aspects of recognition, measurement, presentation, and disclosure of financial instruments. Among other things, the amendment (i) eliminates certain disclosure requirements for financial instruments measured at amortized cost; (ii) requires the use of the exit price notion when measuring the fair value of financial instruments for disclosure purposes; (iii) requires separate presentation, in other comprehensive income, of the change in fair value of a liability, when the fair value option has been elected, resulting from a change in the instrument-specific credit risk; and (iv) requires separate presentation of financial
14
RAIT Financial Trust
Notes to Consolidated Financial Statements
As of June 30, 2017
(Unaudited and dollars in thousands, except share and per share amounts)
instruments by measurement category and form. This standard is effective for annual periods beginning after December 15, 2017, including interim periods within those fiscal years. Early adoption is permitted for the separate presentation of changes in fair value due to changes in instrument-specific credit risk. Management is currently evaluating the impact that this standard may have on our consolidated financial statements.
In February 2016, the FASB issued an accounting standard classified under FASB ASC Topic 842, “Leases”. This accounting standard states that a lessee should recognize the assets and liabilities that arise from all leases with a term greater than 12 months. The core principle requires the lessee to recognize a liability to make lease payments and a "right-of-use" asset. The accounting applied by the lessor is relatively unchanged. Early application of the amendments in this standard is permitted. Management is currently evaluating the impact that this standard may have on our consolidated financial statements. The recognition of operating leases on the consolidated balance sheets is expected to be the most significant impact of the adoption of this accounting standard.
In June 2016, the FASB issued an accounting standard classified under FASB ASC Topic 326, “Financial Instruments-Credit Losses”. The amendments in this standard provide an approach based on expected losses to estimate credit losses on certain types of financial instruments. The amendments also modify the impairment model for available for sale debt securities and provides for a simplified accounting model for purchased financial assets with credit deterioration since their origination. The amendments in this standard expand the disclosure requirements regarding an entity’s assumptions, models, and methods for estimating the allowance for loan and lease losses. In addition, public business entities will need to disclose the amortized cost balance for each class of financial asset by credit quality indicator, disaggregated by the year of origination. This standard is effective for fiscal years beginning after December 15, 2019, including interim periods within those fiscal years. Early application of the guidance will be permitted for all entities for fiscal years beginning after December 15, 2018, including interim periods within those fiscal years. Management is currently evaluating the impact that this standard will have on our consolidated financial statements.
In August 2016, the FASB issued an accounting standard classified under FASB ASC Topic 230, “Statement of Cash Flows”. This accounting standard provides guidance on eight specific cash flow issues; (i) debt prepayment or debt extinguishment costs; (ii) settlement of zero-coupon debt instruments or other debt instruments with coupon interest rates that are insignificant in relation to the effective interest rate of the borrowing; (iii) contingent consideration payments made after a business combination; (iv) proceeds from the settlement of insurance claims; (v) proceeds from the settlement of corporate-owned life insurance policies, including bank-owned life insurance policies; (vi) distributions received from equity method investees; (vii) beneficial interests in securitization transactions; and (viii) separately identifiable cash flows and application of the predominance principle. The amendments are effective for fiscal years beginning after December 15, 2017, and interim periods within those fiscal years. Early adoption is permitted, including adoption in an interim period. Management is currently evaluating the impact that this standard may have on our consolidated statement of cash flows.
In October 2016, the FASB issued an accounting standard classified under FASB ASC Topic 740, “Income Taxes”. The amendments in this accounting standard provide that the current and deferred income tax consequences of an intra-entity transfer of an asset other than inventory should be recognized when the transfer occurs rather than when the asset has been sold to an outside party. Two common examples of assets included in the scope of this accounting standard are intellectual property and property, plant, and equipment. The amendments in this standard are effective for annual reporting periods beginning after December 15, 2017, including interim reporting periods within those annual reporting periods. Early adoption is permitted for all entities as of the beginning of an annual reporting period for which financial statements (interim or annual) have not been issued. The amendments in this accounting standard should be applied on a modified retrospective basis through a cumulative-effect adjustment directly to retained earnings as of the beginning of the period of adoption. Management is currently evaluating the impact that this standard may have on our consolidated financial statements.
In November 2016, the FASB issued an accounting standard classified under FASB ASC Topic 230, “Statement of Cash Flows”. The amendments in this accounting standard require that the statement of cash flows explain the change during the period in the total of cash, cash equivalents, and amounts generally described as restricted cash or restricted cash equivalents. Amounts generally described as restricted cash and restricted cash equivalents should be included with cash and cash equivalents when reconciling the beginning-of-period and end-of-period total amounts shown on the statement of cash flows. The amendments in this update are effective for fiscal years beginning after December 15, 2017, and interim periods within those fiscal years. Early adoption is permitted, including adoption in an interim period. Management is currently evaluating the impact that this standard may have on our consolidated financial statements.
15
RAIT Financial Trust
Notes to Consolidated Financial Statements
As of June 30, 2017
(Unaudited and dollars in thousands, except share and per share amounts)
In January 2017, the FASB issued an accounting standard classified under FASB ASC Topic 805, “Business Combinations’. The amendments in this accounting standard clarify the definition of a business by more clearly outlining the requirements for an integrated set of assets and activities to be considered a business and by establishing a practical framework to determine when the integrated set of assets and activities is a business. The amendments in this accounting standard are effective for fiscal years beginning after December 15, 2017, including interim periods within those fiscal years. Early adoption is permitted for transactions not yet reflected in the financial statements. Management expects that this standard will result in fewer acquisitions of real estate meeting the definition of a business and fewer acquisition-related costs being expensed in the period incurred.
In February 2017, the FASB issued an accounting standard classified under FASB ASC Subtopic 610-20, “Other Income – Gains and Losses from the Derecognition of Nonfinancial Assets”. The amendments in this accounting standard clarify what constitutes an “in substance nonfinancial asset” and changes the accounting for partial sales of nonfinancial assets to be more consistent with the accounting for a sale of a business. The amendments in this accounting standard are effective for fiscal years beginning after December 15, 2017, including interim periods within those fiscal years. Early adoption of the amendments in this standard is permitted. Management is currently evaluating the impact that these standards may have on our consolidated financial statements.
In May 2017, the FASB issued an accounting standard classified under FASB ASC Subtopic 718, “Compensation – Stock Compensation”. The amendments in this accounting standard are to provide guidance about which changes to the terms or conditions of a share-based payment award require an entity to apply modification accounting in Topic 718. The amendments in this accounting standard are effective for fiscal years beginning after December 15, 2017, including interim periods within those fiscal years. Early adoption of the amendments in this standard is permitted. Management is currently evaluating the impact that these standards may have on our consolidated financial statements.
In July 2017, the FASB issued an accounting standard classified under FASB ASC Subtopic 260, “Earnings per Share”, Subtopic 480, “Distinguishing Liabilities from Equity”, and Subtopic 815, “Derivatives and Hedging”. The amendments in this accounting standard change the classification analysis of certain equity-linked financial instruments (or embedded features) with down round features and recharacterize the indefinite deferral of certain provisions of Topic 480 to a scope exception. The amendments in this accounting standard are effective for fiscal years beginning after December 15, 2018, including interim periods within those fiscal years. Early adoption of the amendments in this standard is permitted. Management is currently evaluating the impact that this standard may have on our consolidated financial statements.
NOTE 3: INVESTMENTS IN COMMERCIAL MORTGAGE LOANS, MEZZANINE LOANS AND PREFERRED EQUITY INTERESTS
The following table summarizes our investments in commercial mortgage loans, mezzanine loans and preferred equity interests as of June 30, 2017:
|
|
|
Unpaid Principal Balance |
|
|
Unamortized (Discounts) Premiums |
|
|
Carrying Amount |
|
|
Number of Loans |
|
|
Weighted- Average Coupon (1) |
|
|
Range of Maturity Dates |
|||||
|
Commercial Real Estate (CRE) |
|
|
|
|
|
|
|
|
|
|
|
|
|
|
|
|
|
|
|
|
|
|
|
Commercial mortgage loans (2) |
|
$ |
1,158,504 |
|
|
$ |
(829 |
) |
|
$ |
1,157,675 |
|
|
|
94 |
|
|
|
6.0 |
% |
|
Jun. 2017 to Dec. 2025 |
|
Mezzanine loans |
|
|
72,420 |
|
|
|
45 |
|
|
|
72,465 |
|
|
|
18 |
|
|
|
10.0 |
% |
|
Apr. 2017 to May 2025 |
|
Preferred equity interests |
|
|
40,329 |
|
|
|
(1 |
) |
|
|
40,328 |
|
|
|
17 |
|
|
|
8.7 |
% |
|
Nov. 2018 to Jan. 2029 |
|
Total CRE (3) |
|
|
1,271,253 |
|
|
|
(785 |
) |
|
|
1,270,468 |
|
|
|
129 |
|
|
|
6.4 |
% |
|
|
|
Deferred fees and costs, net (4) |
|
|
(2,763 |
) |
|
|
- |
|
|
|
(2,763 |
) |
|
|
|
|
|
|
|
|
|
|
|
Total |
|
$ |
1,268,490 |
|
|
$ |
(785 |
) |
|
$ |
1,267,705 |
|
|
|
|
|
|
|
|
|
|
|
16
RAIT Financial Trust
Notes to Consolidated Financial Statements
As of June 30, 2017
(Unaudited and dollars in thousands, except share and per share amounts)
|
(1) |
Weighted-average coupon is calculated on the unpaid principal balance, which does not necessarily correspond to the carrying amount. |
|
(2) |
Commercial mortgage loans include one conduit loan with an unpaid principal balance and carrying amount of $16,801, a weighted-average coupon of 4.8%, and a maturity date of December 2025. This commercial mortgage loan is accounted for as a loan held for sale. |
|
(3) |
Includes $151,952 of cash flow loans, of which $94,986 are commercial mortgage loans, $21,171 are mezzanine loans and $35,795 are preferred equity interests. See Note 2: Summary of Significant Accounting Policies, (i) Revenue Recognition, for further discussion of our cash flow loans. |
|
(4) |
Includes $7,685 of deferred fees, net of $4,922 of deferred costs. |
The following table summarizes our investments in commercial mortgage loans, mezzanine loans and preferred equity interests as of December 31, 2016:
|
|
|
Unpaid Principal Balance |
|
|
Unamortized (Discounts) Premiums |
|
|
Carrying Amount |
|
|
Number of Loans |
|
|
Weighted- Average Coupon (1) |
|
|
Range of Maturity Dates |
|||||
|
Commercial Real Estate (CRE) |
|
|
|
|
|
|
|
|
|
|
|
|
|
|
|
|
|
|
|
|
|
|
|
Commercial mortgage loans (2) |
|
$ |
1,162,233 |
|
|
$ |
(852 |
) |
|
$ |
1,161,381 |
|
|
|
94 |
|
|
|
5.8 |
% |
|
Jan. 2017 to Dec. 2025 |
|
Mezzanine loans |
|
|
89,811 |
|
|
|
45 |
|
|
|
89,856 |
|
|
|
23 |
|
|
|
9.9 |
% |
|
Feb. 2017 to Jun. 2027 |
|
Preferred equity interests |
|
|
42,830 |
|
|
|
(1 |
) |
|
|
42,829 |
|
|
|
17 |
|
|
|
8.2 |
% |
|
Jan. 2017 to Jan. 2029 |
|
Total CRE (3) |
|
|
1,294,874 |
|
|
|
(808 |
) |
|
|
1,294,066 |
|
|
|
134 |
|
|
|
6.1 |
% |
|
|
|
Deferred fees and costs, net (4) |
|
|
(1,427 |
) |
|
|
— |
|
|
|
(1,427 |
) |
|
|
|
|
|
|
|
|
|
|
|
Total |
|
$ |
1,293,447 |
|
|
$ |
(808 |
) |
|
$ |
1,292,639 |
|
|
|
|
|
|
|
|
|
|
|
|
(1) |
Weighted-average coupon is calculated on the unpaid principal balance, which does not necessarily correspond to the carrying amount. |
|
(2) |
Commercial mortgage loans include two conduit loans with unpaid principal balances and carrying amounts totaling $20,181, a weighted-average coupon of 4.8%, and maturity dates ranging from June 2025 through December 2025. These commercial mortgage loans are accounted for as loans held for sale. |
|
(3) |
Includes $155,750 of cash flow loans, of which $98,784 are commercial mortgage loans, $21,171 are mezzanine loans and $35,795 are preferred equity interests. See Note 2: Summary of Significant Accounting Policies, (i) Revenue Recognition, for further discussion of our cash flow loans. |
|
(4) |
Includes $5,978 of deferred fees, net of $4,551 of deferred costs. |
17
RAIT Financial Trust
Notes to Consolidated Financial Statements
As of June 30, 2017
(Unaudited and dollars in thousands, except share and per share amounts)
A loan is placed on non-accrual status if it is delinquent for 90 days or more or if there is uncertainty over full collection of principal and interest, which generally includes our impaired loans that have reserves. The following table summarizes the delinquency statistics of our commercial real estate loans as of June 30, 2017 and December 31, 2016:
|
|
|
As of June 30, 2017 |
|
|||||||||||||||||||||||||
|
Delinquency Status |
|
Current |
|
|
30 to 59 days |
|
|
60 to 89 days |
|
|
90 days or more |
|
|
In foreclosure or bankruptcy proceedings |
|
|
Total |
|
|
Non-accrual (1) |
|
|||||||
|
Commercial mortgage loans |
|
$ |
1,107,427 |
|
|
$ |
— |
|
|
$ |
— |
|
|
$ |
51,077 |
|
|
$ |
— |
|
|
$ |
1,158,504 |
|
|
$ |
104,723 |
|
|
Mezzanine loans |
|
|
67,041 |
|
|
|
— |
|
|
|
— |
|
|
|
5,379 |
|
|
|
— |
|
|
|
72,420 |
|
|
|
13,681 |
|
|
Preferred equity interests |
|
|
40,329 |
|
|
|
— |
|
|
|
— |
|
|
|
— |
|
|
|
— |
|
|
|
40,329 |
|
|
|
3,650 |
|
|
Total |
|
$ |
1,214,797 |
|
|
$ |
— |
|
|
$ |
— |
|
|
$ |
56,456 |
|
|
$ |
— |
|
|
$ |
1,271,253 |
|
|
$ |
122,054 |
|
|
(1) |
Includes five loans that were current and one loan that is 60 to 89 days past due in accordance with their terms, but are on non-accrual due to uncertainty over whether we will fully collect principal and interest. |
|
|
|
As of December 31, 2016 |
|
|||||||||||||||||||||||||
|
Delinquency Status |
|
Current |
|
|
30 to 59 days |
|
|
60 to 89 days |
|
|
90 days or more |
|
|
In foreclosure or bankruptcy proceedings |
|
|
Total |
|
|
Non-Accrual (1) |
|
|||||||
|
Commercial mortgage loans |
|
$ |
1,111,898 |
|
|
$ |
50,335 |
|
|
$ |
— |
|
|
$ |
— |
|
|
$ |
— |
|
|
$ |
1,162,233 |
|
|
$ |
113,509 |
|
|
Mezzanine loans |
|
|
88,432 |
|
|
|
— |
|
|
|
— |
|
|
|
1,379 |
|
|
|
— |
|
|
|
89,811 |
|
|
|
1,379 |
|
|
Preferred equity interests |
|
|
42,830 |
|
|
|
— |
|
|
|
— |
|
|
|
— |
|
|
|
— |
|
|
|
42,830 |
|
|
|
6,150 |
|
|
Total |
|
$ |
1,243,160 |
|
|
$ |
50,335 |
|
|
$ |
— |
|
|
$ |
1,379 |
|
|
$ |
— |
|
|
$ |
1,294,874 |
|
|
$ |
121,038 |
|
(1) Includes five loans that are current and one loan that is 30 to 59 days past due in accordance with their terms, but are on non-accrual due to uncertainty over whether we will fully collect principal and interest.
As of June 30, 2017 and December 31, 2016, all of our commercial mortgage loans, mezzanine loans and preferred equity interests that were 90 days or more past due or in foreclosure were on non-accrual status. As of June 30, 2017 and December 31, 2016, $122,054 and $121,038, respectively, of our commercial real estate loans were on non-accrual status and had a weighted-average interest rate of 6.6% and 5.8%, respectively. Also, as of June 30, 2017 and December 31, 2016, three loans with an unpaid principal balance of $20,625 and a weighted average interest rate of 12.9% were recognizing interest on the cash basis. Additionally, as of June 30, 2017 and December 31, 2016, one loan, with an unpaid principal balance of $18,500, which had previously been restructured in a troubled debt restructuring, or TDR, did not accrue interest in accordance with its restructured terms as it has the option to be prepaid at par.
18
RAIT Financial Trust
Notes to Consolidated Financial Statements
As of June 30, 2017
(Unaudited and dollars in thousands, except share and per share amounts)
Allowance For Loan Losses And Impaired Loans
During the three and six months ended June 30, 2017, we recognized provision for loan losses of $20,863 and $22,398, which was related to loans originated prior to 2010. Our provision for loan losses during the three and six months ended June 30, 2017 was primarily driven by five loans where the borrower and/or property experienced an unfavorable event or events during the period, which resulted in probable, incurred losses.
We closely monitor our loans, which require evaluation for loan loss in two categories: satisfactory and watchlist. Loans classified as satisfactory are loans that are performing consistent with our expectations. Loans classified as watchlist are generally loans that have performed below our expectations, have credit weaknesses or in which the credit quality of the collateral has deteriorated. This is determined by evaluating quantitative factors including debt service coverage ratios, net operating income of the underlying collateral and qualitative factors such as current performance of the underlying collateral. We have classified our investments in loans by credit risk category as of June 30, 2017 and December 31, 2016 as follows:
|
|
|
As of June 30, 2017 |
|
|||||||||||||
|
Credit Status |
|
Commercial Mortgage Loans |
|
|
Mezzanine Loans |
|
|
Preferred Equity |
|
|
Total |
|
||||
|
Satisfactory |
|
$ |
1,039,281 |
|
|
$ |
27,370 |
|
|
$ |
33,622 |
|
|
$ |
1,100,273 |
|
|
Watchlist (1) |
|
$ |
119,223 |
|
|
$ |
45,050 |
|
|
$ |
6,707 |
|
|
|
170,980 |
|
|
Total |
|
$ |
1,158,504 |
|
|
$ |
72,420 |
|
|
$ |
40,329 |
|
|
$ |
1,271,253 |
|
|
|
(1) |
Includes $156,480 of loans that are considered to be impaired and $14,500 of loans that are not considered to be impaired. |
|
|
|
As of December 31, 2016 |
|
|||||||||||||
|
Credit Status |
|
Commercial Mortgage Loans |
|
|
Mezzanine Loans |
|
|
Preferred Equity |
|
|
Total |
|
||||
|
Satisfactory |
|
$ |
1,048,724 |
|
|
$ |
57,063 |
|
|
$ |
36,680 |
|
|
$ |
1,142,467 |
|
|
Watchlist (1) |
|
|
113,509 |
|
|
|
32,748 |
|
|
|
6,150 |
|
|
|
152,407 |
|
|
Total |
|
$ |
1,162,233 |
|
|
$ |
89,811 |
|
|
$ |
42,830 |
|
|
$ |
1,294,874 |
|
|
|
(1) |
Includes $152,407 of loans that are considered to be impaired. |
The following tables provide a roll-forward of our allowance for loan losses for our commercial mortgage loans, mezzanine loans and preferred equity interests for the three months ended June 30, 2017 and 2016:
|
|
|
For the Three Months Ended June 30, 2017 |
|
|||||||||||||
|
|
|
Commercial Mortgage Loans |
|
|
Mezzanine Loans |
|
|
Preferred Equity |
|
|
Total |
|
||||
|
Beginning balance |
|
$ |
10,979 |
|
|
$ |
852 |
|
|
$ |
1,700 |
|
|
$ |
13,531 |
|
|
Provision (benefit) for loan losses |
|
|
12,623 |
|
|
|
8,240 |
|
|
|
— |
|
|
|
20,863 |
|
|
Charge-offs, net of recoveries |
|
|
(10,880 |
) |
|
|
— |
|
|
|
— |
|
|
|
(10,880 |
) |
|
Ending balance |
|
$ |
12,722 |
|
|
$ |
9,092 |
|
|
$ |
1,700 |
|
|
$ |
23,514 |
|
|
|
|
For the Three Months Ended June 30, 2016 |
|
|||||||||||||
|
|
|
Commercial Mortgage Loans |
|
|
Mezzanine Loans |
|
|
Preferred Equity |
|
|
Total |
|
||||
|
Beginning balance |
|
$ |
3,328 |
|
|
$ |
12,040 |
|
|
$ |
2,797 |
|
|
$ |
18,165 |
|
|
Provision (benefit) for loan losses |
|
|
1,069 |
|
|
|
93 |
|
|
|
182 |
|
|
|
1,344 |
|
|
Charge-offs, net of recoveries |
|
|
— |
|
|
|
(1,272 |
) |
|
|
— |
|
|
|
(1,272 |
) |
|
Ending balance |
|
$ |
4,397 |
|
|
$ |
10,861 |
|
|
$ |
2,979 |
|
|
$ |
18,237 |
|
19
RAIT Financial Trust
Notes to Consolidated Financial Statements
As of June 30, 2017
(Unaudited and dollars in thousands, except share and per share amounts)
The following tables provide a roll-forward of our allowance for loan losses for our commercial mortgage loans, mezzanine loans and preferred equity interests for the six months ended June 30, 2017 and 2016:
|
|
|
For the Six Months Ended June 30, 2017 |
|
|||||||||||||
|
|
|
Commercial Mortgage Loans |
|
|
Mezzanine Loans |
|
|
Preferred Equity |
|
|
Total |
|
||||
|
Beginning balance |
|
$ |
10,640 |
|
|
|
— |
|
|
$ |
1,714 |
|
|
$ |
12,354 |
|
|
Provision (benefit) for loan losses |
|
|
13,322 |
|
|
|
9,090 |
|
|
|
(14 |
) |
|
|
22,398 |
|
|
Charge-offs, net of recoveries |
|
|
(11,240 |
) |
|
|
2 |
|
|
|
— |
|
|
|
(11,238 |
) |
|
Ending balance |
|
$ |
12,722 |
|
|
$ |
9,092 |
|
|
$ |
1,700 |
|
|
$ |
23,514 |
|
|
|
|
For the Six Months Ended June 30, 2016 |
|
|||||||||||||
|
|
|
Commercial Mortgage Loans |
|
|
Mezzanine Loans |
|
|
Preferred Equity |
|
|
Total |
|
||||
|
Beginning balance |
|
$ |
3,154 |
|
|
$ |
12,139 |
|
|
$ |
1,804 |
|
|
$ |
17,097 |
|
|
Provision (benefit) for loan losses |
|
|
1,243 |
|
|
|
251 |
|
|
|
1,175 |
|
|
|
2,669 |
|
|
Charge-offs, net of recoveries |
|
|
— |
|
|
|
(1,529 |
) |
|
|
— |
|
|
|
(1,529 |
) |
|
Ending balance |
|
$ |
4,397 |
|
|
$ |
10,861 |
|
|
$ |
2,979 |
|
|
$ |
18,237 |
|
Information on those loans considered to be impaired as of June 30, 2017 and December 31, 2016 was as follows:
|
|
|
As of June 30, 2017 |
|
|||||||||||||
|
Impaired Loans |
|
Commercial Mortgage Loans |
|
|
Mezzanine Loans |
|
|
Preferred Equity |
|
|
Total |
|
||||
|
Impaired loans expecting full recovery |
|
$ |
5,420 |
|
|
$ |
32,748 |
|
|
$ |
3,057 |
|
|
$ |
41,225 |
|
|
Impaired loans with reserves |
|
|
99,303 |
|
|
|
12,302 |
|
|
|
3,650 |
|
|
|
115,255 |
|
|
Total Impaired Loans (1) |
|
$ |
104,723 |
|
|
$ |
45,050 |
|
|
$ |
6,707 |
|
|
$ |
156,480 |
|
|
Allowance for loan losses |
|
$ |
12,722 |
|
|
$ |
9,092 |
|
|
$ |
1,700 |
|
|
$ |
23,514 |
|
|
(1) |
As of June 30, 2017, there was no unpaid principal relating to previously identified TDRs that are on accrual status. |
|
|
|
As of December 31, 2016 |
|
|||||||||||||
|
Impaired Loans |
|
Commercial Mortgage Loans |
|
|
Mezzanine Loans |
|
|
Preferred Equity |
|
|
Total |
|
||||
|
Impaired loans expecting full recovery |
|
$ |
— |
|
|
$ |
32,748 |
|
|
$ |
— |
|
|
$ |
32,748 |
|
|
Impaired loans with reserves |
|
|
113,509 |
|
|
|
— |
|
|
|
6,150 |
|
|
|
119,659 |
|
|
Total Impaired Loans (1) |
|
$ |
113,509 |
|
|
$ |
32,748 |
|
|
$ |
6,150 |
|
|
$ |
152,407 |
|
|
Allowance for loan losses |
|
$ |
10,640 |
|
|
$ |
— |
|
|
$ |
1,714 |
|
|
$ |
12,354 |
|
|
(1) |
As of December 31, 2016, there was no unpaid principal relating to previously identified TDRs that are on accrual status. |
The average unpaid principal balance and recorded investment of total impaired loans was $151,807 and $130,496 during the three months ended June 30, 2017 and 2016, respectively and $152,007 and $131,076 for the six months ended June 30, 2017 and 2016, respectively. We recorded interest income from impaired loans of $124 and $1,134 for the three months ended June 30, 2017 and 2016, respectively. We recorded interest income from impaired loans of $344 and $2,522 for the six months ended June 30, 2017 and 2016, respectively.
We have evaluated modifications to our commercial real estate loans to determine if the modification constitutes a troubled debt restructuring, or TDR, under FASB ASC Topic 310, “Receivables”. During the three and six months ended June 30, 2017, we determined that a restructuring of one commercial real estate loan with an unpaid principal balance of $6,009 constituted a TDR as the maturity date of the loan was extended and the borrower was determined to be experiencing financial difficulty. During the six months ended June 30, 2016, we determined that a restructuring of one commercial real estate loan with an unpaid principal balance of $15,645 constituted a TDR as the interest payment rate was decreased, although interest will continue to accrue on the original
20
RAIT Financial Trust
Notes to Consolidated Financial Statements
As of June 30, 2017
(Unaudited and dollars in thousands, except share and per share amounts)
contractual rate, subject to management’s determination that it is collectible, and will be owed upon maturity. As of June 30, 2017, there were no TDRs that subsequently defaulted for restructurings that had been entered into within the previous 12 months.
Loan-to-Real Estate Conversion
During the six months ended June 30, 2017, we completed the conversion of one commercial mortgage loan with a carrying value of $1,590 to real estate owned property. See Note 4: Investments in Real Estate for further information. We recognized a charge off of $360 upon conversion.
NOTE 4: INVESTMENTS IN REAL ESTATE
The table below summarizes our investments in real estate:
|
|
|
Book Value |
|
|||||
|
|
|
As of June 30, 2017 |
|
|
As of December 31, 2016 |
|
||
|
Multifamily real estate properties |
|
$ |
24,925 |
|
|
$ |
147,201 |
|
|
Office real estate properties |
|
|
232,858 |
|
|
|
397,769 |
|
|
Industrial real estate properties |
|
|
48,374 |
|
|
|
93,423 |
|
|
Retail real estate properties |
|
|
128,939 |
|
|
|
164,019 |
|
|
Parcels of land |
|
|
35,153 |
|
|
|
52,234 |
|
|
Subtotal |
|
|
470,249 |
|
|
|
854,646 |
|
|
Less: Accumulated depreciation and amortization |
|
|
(35,359 |
) |
|
|
(138,214 |
) |
|
Investments in real estate (1) |
|
$ |
434,890 |
|
|
$ |
716,432 |
|
|
|
(1) |
As of June 30, 2017, one of our multifamily properties, with a carrying amount of $5,932, and two of our parcels of land, with a carrying amount of $14,586, were considered held-for-sale. As of December 31, 2016, three of our multifamily properties, with a carrying amount of $62,428, and two of our parcels of land, with a carrying amount of $14,233, were considered held-for-sale. |
As of June 30, 2017 and December 31, 2016, our investments in real estate were comprised of land of $113,060 and $169,133, respectively, and buildings and improvements of $357,189 and $685,513, respectively.
As of June 30, 2017, our investments in real estate of $470,249 were financed through $135,123 of mortgage loans or other debt held by third parties and $497,244 of mortgage loans held by our RAIT I and RAIT II CDO securitizations. As of December 31, 2016, our investments in real estate of $854,646 were financed through $186,237 of mortgage loans or other debt held by third parties and $642,824 of mortgage loans held by our RAIT I and RAIT II CDO securitizations. Together, along with commercial real estate loans held by RAIT I and RAIT II, these mortgage loans serve as collateral for the CDO notes payable issued by the RAIT I and RAIT II CDO securitizations. All intercompany balances and interest charges are eliminated in consolidation.
21
RAIT Financial Trust
Notes to Consolidated Financial Statements
As of June 30, 2017
(Unaudited and dollars in thousands, except share and per share amounts)
During the six months ended June 30, 2017, we completed the conversion of one commercial loan with a carrying value of $1,590 to real estate.
The following table summarizes the aggregate estimated fair value of the assets and liabilities associated with the property acquired during the six months ended June 30, 2017, on the date of acquisition, for the real estate accounted for under FASB ASC Topic 805:
|
Description |
|
Fair Value of Assets Acquired During the Six Months Ended June 30, 2017 |
|
|
|
Assets acquired: |
|
|
|
|
|
Investments in real estate |
|
$ |
1,118 |
|
|
Cash and cash equivalents |
|
|
84 |
|
|
Restricted cash |
|
|
- |
|
|
Accounts receivable and other assets |
|
|
14 |
|
|
Intangible assets |
|
|
1,231 |
|
|
Total assets acquired |
|
|
2,447 |
|
|
Liabilities assumed: |
|
|
|
|
|
Indebtedness, net |
|
|
- |
|
|
Accounts payable and accrued expenses |
|
|
139 |
|
|
Other liabilities |
|
|
718 |
|
|
Total liabilities assumed |
|
|
857 |
|
|
Estimated fair value of net assets acquired |
|
$ |
1,590 |
|
The following table summarizes the consideration transferred to acquire the real estate properties and the amounts of identified assets acquired and liabilities assumed at the respective acquisition date:
|
Description |
Total Estimated Fair Value |
|
|
|
Fair value of consideration transferred: |
|
|
|
|
Investments in loans, accrued interest receivable and other assets |
$ |
1,590 |
|
|
Total |
$ |
1,590 |
|
The table below presents the revenue and net income (loss) allocable to common shares for the properties acquired during the six months ended June 30, 2017 as reported in our consolidated financial statements:
|
|
|
For the Three Months Ended |
|
|
For the Six Months Ended |
|
||||||||||
|
|
|
June 30, 2017 |
|
|
June 30, 2017 |
|
||||||||||
|
Property |
|
Total Revenue |
|
|
Net income (loss) allocable to common shares |
|
|
Total Revenue |
|
|
Net income (loss) allocable to common shares |
|
||||
|
Erieview Galleria |
|
$ |
426 |
|
|
$ |
(85 |
) |
|
$ |
453 |
|
|
$ |
(124 |
) |
|
Total |
|
$ |
426 |
|
|
$ |
(85 |
) |
|
$ |
453 |
|
|
$ |
(124 |
) |
22
RAIT Financial Trust
Notes to Consolidated Financial Statements
As of June 30, 2017
(Unaudited and dollars in thousands, except share and per share amounts)
The table below presents the revenue, net income (loss) allocable to common shares and earnings (loss) per share effect of the acquired properties on a pro forma basis as if the acquisitions occurred on January 1, 2016. These pro forma results are not necessarily indicative of the results that actually would have occurred if the acquisition had occurred on the first day of the periods presented, nor does the pro forma financial information purport to represent the results of operations for future periods.
|
|
|
For the Three Months Ended |
|
|
For the Six Months Ended |
|
||||||||||
|
|
|
June 30 |
|
|
June 30 |
|
||||||||||
|
Description |
|
2017 |
|
|
2016 |
|
|
2017 |
|
|
2016 |
|
||||
|
Pro forma total revenue (unaudited) |
|
$ |
22,813 |
|
|
$ |
46,313 |
|
|
$ |
52,736 |
|
|
$ |
95,276 |
|
|
Pro forma net income (loss) allocable to common shares (unaudited) |
|
|
(125,757 |
) |
|
|
(7,637 |
) |
|
|
(155,904 |
) |
|
|
(25,649 |
) |
|
Earnings (loss) per share attributable to common shareholders: |
|
|
|
|
|
|
|
|
|
|
|
|
|
|
|
|
|
Basic-as pro forma (unaudited) |
|
|
(1.38 |
) |
|
|
(0.08 |
) |
|
|
(1.71 |
) |
|
|
(0.28 |
) |
|
Diluted-as pro forma (unaudited) |
|
|
(1.38 |
) |
|
|
(0.08 |
) |
|
|
(1.71 |
) |
|
|
(0.28 |
) |
Property Sales:
During the six months ended June 30, 2017, we disposed of four multifamily properties, four office properties, one retail property and one parcel of land. We also recognized $62 of gains on sales related to properties sold in the prior year as we settled remaining amounts with the buyers. The below table summarizes the current year dispositions and also presents each property’s contribution to net income (loss) allocable to common shares, excluding the impact of the gain (loss) on sale:
|
|
|
|
|
|
|
|
|
|
|
|
|
|
|
Net income (loss) allocable to common shares |
|
|||||
|
Property Name |
|
Property Type |
|
Date of Sale |
|
Sale Price |
|
|
Gain (loss) on sale |
|
|
For the Three Months Ended June 30, 2017 |
|
|
For the Six Months Ended June 30, 2017 |
|
||||
|
Tuscany Bay |
|
Multifamily |
|
1/6/2017 |
|
$ |
36,650 |
|
|
$ |
7,657 |
|
|
$ |
(5 |
) |
|
$ |
2 |
|
|
Emerald Bay |
|
Multifamily |
|
3/8/2017 |
|
|
23,750 |
|
|
|
772 |
|
|
|
(46 |
) |
|
|
135 |
|
|
Tiffany Square |
|
Office |
|
3/9/2017 |
|
|
12,175 |
|
|
|
113 |
|
|
|
(3 |
) |
|
|
64 |
|
|
Oyster Point |
|
Multifamily |
|
3/28/2017 |
|
|
11,500 |
|
|
|
(82 |
) |
|
|
(16 |
) |
|
|
(14 |
) |
|
Executive Center |
|
Office |
|
3/31/2017 |
|
|
10,600 |
|
|
|
437 |
|
|
|
(16 |
) |
|
|
121 |
|
|
MGS |
|
Land |
|
3/31/2017 |
|
|
300 |
|
|
|
- |
|
|
|
- |
|
|
|
- |
|
|
100 E. Lancaster |
|
Office |
|
4/13/2017 |
|
|
4,575 |
|
|
|
14 |
|
|
|
17 |
|
|
|
76 |
|
|
UBS Tower |
|
Office |
|
5/9/2017 |
|
|
14,150 |
|
|
|
- |
|
|
|
(9 |
) |
|
|
(39 |
) |
|
South Plaza (Parcel Sale) |
|
Retail |
|
5/24/2017 |
|
|
11,478 |
|
|
|
1,481 |
|
|
|
213 |
|
|
|
443 |
|
|
South Terrace |
|
Multifamily |
|
6/30/2017 |
|
|
42,950 |
|
|
|
9,189 |
|
|
|
154 |
|
|
|
319 |
|
|
Total |
|
|
|
|
|
$ |
168,128 |
|
|
$ |
19,581 |
|
|
$ |
289 |
|
|
$ |
1,107 |
|
During the six months ended June 30, 2017, we also recognized a gain of $3,122 related to a sale of a multifamily property that occurred during the second quarter of 2015. This gain was deferred as the buyer’s initial investment was insufficient. As our loan, which financed the buyer’s acquisition of this property, was paid off during the six months ended June 30, 2017, we recognized the deferred gain.
In July 2017, we disposed of one multifamily property for $6,450. We do not expect to recognize a significant gain or loss on the sale of this asset.
Other Dispositions:
During the six months ended June 30, 2017, we incurred a non-cash loss on deconsolidation of properties of $15,947 relating to an industrial real estate portfolio containing ten properties with carrying value of $82,501 of investments in real estate and $81,941 of related cross-collateralized non-recourse debt as of December 31, 2016. During the six months ended June 30, 2017, the senior lender
23
RAIT Financial Trust
Notes to Consolidated Financial Statements
As of June 30, 2017
(Unaudited and dollars in thousands, except share and per share amounts)
foreclosed on the mortgage liens encumbering five of these industrial properties and disposed of the properties through auction processes. These five properties, including other assets, net of related liabilities, had an aggregate carrying value of $43,414. Upon foreclosure, we derecognized these net assets and extinguished related debt of $27,467 based on the proceeds received by the senior lender at the auctions. The difference between the net carrying value and the debt extinguished resulted in the non-cash loss noted above as full release of the remaining cross-collateralized non-recourse debt has not yet been received. The remaining five of these industrial properties have a carrying value of $38,516 of investments in real estate and $54,475 of related cross-collateralized non-recourse debt as of June 30, 2017.
In August of 2017, the senior lender foreclosed on the mortgage lien encumbering one of our industrial properties
that had an aggregate carrying value of $5,091. As a result, the senior lender or its assignee/designee now owns this property, subject to any redemption rights that we have under applicable state law, if any. This property along with four of our other industrial properties serve as collateral for a mortgage loan with an unpaid principal balance of $54,475.
Impairment:
During the three and six months ended June 30, 2017, we recognized non-cash impairment charges on real estate assets of $81,444 and $88,868, respectively, as it was more likely than not that we would dispose of the assets before the end of their previously estimated useful lives and a portion of our recorded investment in these assets was determined to not be recoverable.
During the three months ended June 30, 2017, we changed our investment approach on six of our real estate properties. These decisions to change our investment approach led to an expectation that the properties would be disposed of prior to the end of their useful life, which was concluded to be a triggering event requiring further analysis of the recoverability of these properties. As a result of the analysis performed, the aggregate carrying value of these properties of $172,236 was determined not to be fully recoverable, resulting in non-cash impairment charges totaling $74,514 as further described below. Subsequent to these non-cash impairment charges, these properties had an aggregate carrying value of $97,722.
Four of the properties noted above, consisting of an office property and a retail property in the Central region, and a retail property and a land parcel in the Southeast region, were previously in various stages of redevelopment with an aggregate carrying value of $102,155. During the quarter ended June 30, 2017, a decision was made to cease redevelopment efforts and market the properties for sale in their existing condition. The analysis performed, which included obtaining a broker opinion of value for each of the Central region properties and performing a discounted cash flow analysis for each of the Southeast region properties using market-based assumptions, resulted in non-cash impairment charges of $50,274.
For one office property in the Central region, which was previously planned to be held for use and currently not stabilized, a sales process was pursued for the property in its current condition. Based upon various offers that have been received to purchase the property, the carrying value of $39,218 was determined to not be fully recoverable, resulting in a non-cash impairment charge of $17,447.
Additionally, it was determined it was more likely than not that we would dispose of one retail property in the Mid-Atlantic region with a carrying value of $30,863, which was being held for investment, in the foreseeable future. The analysis performed, which included performing a discounted cash flow analysis using market-based assumptions, resulted in a non-cash impairment charge of $6,793.
During the three months ended June 30, 2017, we also continued execution on plans to market certain assets that had been identified for disposal in previous periods. The remaining $6,930 of non-cash impairment charges during the three months ended June 30, 2017 related to six of these other real estate assets, including one multifamily property, four office properties, and one land parcel and was recognized as a result of updated information obtained based upon purchase and sale agreements, letters of intent and broker opinions of value as these assets have progressed through different stages of the marketing and sales negotiation process.
During the six months ended June 30, 2017, we recognized an additional $7,424 of non-cash impairment charges related to four assets that had been identified for disposal in previous periods, including three office properties and one land parcel, and was recognized as a result of updated information obtained based upon purchase and sale agreements and letters of intent as these assets progressed through different stages of the marketing and sales negotiation process.
24
RAIT Financial Trust
Notes to Consolidated Financial Statements
As of June 30, 2017
(Unaudited and dollars in thousands, except share and per share amounts)
See Note 7: Fair Value of Financial Instruments for further information regarding our non-recurring fair value measurements.
NOTE 5: INDEBTEDNESS
We maintain various forms of short-term and long-term financing arrangements. Generally, these financing agreements are collateralized by assets within securitizations.
The following table summarizes our total recourse and non-recourse indebtedness as of June 30, 2017:
|
Description |
|
Unpaid Principal Balance |
|
|
Unamortized Discount/Premium and Deferred Financing Costs |
|
|
Carrying Amount |
|
|
Weighted- Average Interest Rate |
|
|
Contractual Maturity |
|
|||||
|
Recourse indebtedness: |
|
|
|
|
|
|
|
|
|
|
|
|
|
|
|
|
|
|
|
|
|
7.0% convertible senior notes (1) |
|
$ |
871 |
|
|
$ |
(39 |
) |
|
$ |
832 |
|
|
|
7.0 |
% |
|
Apr. 2031 (1) |
|
|
|
4.0% convertible senior notes (2) |
|
|
126,098 |
|
|
|
(5,033 |
) |
|
|
121,065 |
|
|
|
4.0 |
% |
|
Oct. 2033 (2) |
|
|
|
7.625% senior notes |
|
|
57,287 |
|
|
|
(1,600 |
) |
|
|
55,687 |
|
|
|
7.6 |
% |
|
Apr. 2024 |
|
|
|
7.125% senior notes |
|
|
70,731 |
|
|
|
(1,254 |
) |
|
|
69,477 |
|
|
|
7.1 |
% |
|
Aug. 2019 |
|
|
|
Senior secured notes |
|
|
15,500 |
|
|
|
(1,145 |
) |
|
|
14,355 |
|
|
|
7.2 |
% |
|
Oct. 2018 to Apr. 2019 |
|
|
|
Junior subordinated notes, at fair value (3) |
|
|
18,671 |
|
|
|
(6,147 |
) |
|
|
12,524 |
|
|
|
5.2 |
% |
|
Mar. 2035 |
|
|
|
Junior subordinated notes, at amortized cost |
|
|
25,100 |
|
|
|
— |
|
|
|
25,100 |
|
|
|
3.7 |
% |
|
Apr. 2037 |
|
|
|
Secured warehouse facilities |
|
|
30,708 |
|
|
|
(890 |
) |
|
|
29,818 |
|
|
|
3.5 |
% |
|
Nov. 2017 to Jul. 2018 |
|
|
|
Total recourse indebtedness |
|
|
344,966 |
|
|
|
(16,108 |
) |
|
|
328,858 |
|
|
|
5.4 |
% |
|
|
|
|
|
Non-recourse indebtedness: |
|
|
|
|
|
|
|
|
|
|
|
|
|
|
|
|
|
|
|
|
|
CDO notes payable, at amortized cost (4)(5) |
|
|
376,344 |
|
|
|
(5,965 |
) |
|
|
370,379 |
|
|
|
1.9 |
% |
|
Jun. 2045 to Nov. 2046 |
|
|
|
CMBS securitizations (6) |
|
|
721,441 |
|
|
|
(8,178 |
) |
|
|
713,263 |
|
|
|
3.3 |
% |
|
Jan. 2031 to June 2037 |
|
|
|
Loans payable on real estate (7) |
|
|
135,123 |
|
|
|
(436 |
) |
|
|
134,687 |
|
|
|
5.6 |
% |
|
June 2016 to Dec. 2021 |
|
|
|
Total non-recourse indebtedness |
|
|
1,232,908 |
|
|
|
(14,579 |
) |
|
|
1,218,329 |
|
|
|
3.1 |
% |
|
|
|
|
|
Other indebtedness (8) |
|
|
40,830 |
|
|
|
50 |
|
|
|
40,880 |
|
|
|
— |
|
|
|
— |
|
|
Total indebtedness |
|
$ |
1,618,704 |
|
|
$ |
(30,637 |
) |
|
$ |
1,588,067 |
|
|
|
3.6 |
% |
|
|
|
|
|
(1) |
Our 7.0% convertible senior notes are redeemable at par, at the option of the holder, in April 2021, and April 2026. |
|
(2) |
Our 4.0% convertible senior notes are redeemable at par, at the option of the holder, in October 2018, October 2023, and October 2028. |
|
(3) |
Relates to liabilities which we elected to record at fair value under FASB ASC Topic 825. |
(4) Excludes CDO notes payable purchased by us which are eliminated in consolidation.
|
(5) |
Collateralized by $769,303 principal amount of commercial mortgage loans, mezzanine loans, other loans and preferred equity interests, $418,486 of which is eliminated in consolidation. These obligations were issued by separate legal entities and consequently the assets of the special purpose entities that collateralize these obligations are not available to our creditors. |
|
(6) |
Collateralized by $870,085 principal amount of commercial mortgage loans and participation interests. These obligations were issued by separate legal entities and consequently the assets of the special purpose entities that collateralize these obligations are not available to our creditors. |
(7) One loan payable on real estate had a maturity date of June 2016. This loan is currently in default and is in the process of foreclosure. One loan payable on real estate had a maturity date of April 2017. This loan is currently in default and is in the process of foreclosure.
|
(8) |
Represents two 40% interests issued to an unaffiliated third party in two ventures to which we contributed the junior notes and equity of two floating rate securitizations. Together these ventures are referred to as the RAIT Venture VIEs. The first of these ventures, the 2016 RAIT Venture VIE, was formed in 2016. The second, the 2017 RAIT Venture VIE, was formed in 2017. We retained a 60% interest in these ventures, and, as a result of our controlling financial interest, we consolidated the ventures. We received approximately $41,689 of proceeds as a result of issuing these 40% interests, which have an unpaid principal balance of $40,830. These 40% interests have no stated maturity date and do not provide for mandatory redemption or any required return or interest payment. These interests of the ventures allocate the distributions on such junior notes and equity when made between the parties to the ventures. |
25
RAIT Financial Trust
Notes to Consolidated Financial Statements
As of June 30, 2017
(Unaudited and dollars in thousands, except share and per share amounts)
The following table summarizes our total recourse and non-recourse indebtedness as of December 31, 2016:
|
Description |
|
Unpaid Principal Balance |
|
|
Unamortized Discount and Deferred Finance Costs |
|
|
Carrying Amount |
|
|
Weighted- Average Interest Rate |
|
|
Contractual Maturity |
|
|||||
|
Recourse indebtedness: |
|
|
|
|
|
|
|
|
|
|
|
|
|
|
|
|
|
|
|
|
|
7.0% convertible senior notes (1) |
|
$ |
871 |
|
|
$ |
(40 |
) |
|
$ |
831 |
|
|
|
7.0 |
% |
|
Apr. 2031 (1) |
|
|
|
4.0% convertible senior notes (2) |
|
|
126,098 |
|
|
|
(5,827 |
) |
|
|
120,271 |
|
|
|
4.0 |
% |
|
Oct. 2033 (2) |
|
|
|
7.625% senior notes |
|
|
57,287 |
|
|
|
(1,719 |
) |
|
|
55,568 |
|
|
|
7.6 |
% |
|
Apr. 2024 |
|
|
|
7.125% senior notes |
|
|
70,731 |
|
|
|
(1,543 |
) |
|
|
69,188 |
|
|
|
7.1 |
% |
|
Aug. 2019 |
|
|
|
Senior secured notes |
|
|
62,000 |
|
|
|
(3,767 |
) |
|
|
58,233 |
|
|
|
7.0 |
% |
|
Apr. 2017 to Apr. 2019 |
|
|
|
Junior subordinated notes, at fair value (3) |
|
|
18,671 |
|
|
|
(6,849 |
) |
|
|
11,822 |
|
|
|
4.8 |
% |
|
Mar. 2035 |
|
|
|
Junior subordinated notes, at amortized cost |
|
|
25,100 |
|
|
|
— |
|
|
|
25,100 |
|
|
|
3.4 |
% |
|
Apr. 2037 |
|
|
|
Secured warehouse facilities |
|
|
26,421 |
|
|
|
(1,513 |
) |
|
|
24,908 |
|
|
|
3.1 |
% |
|
Nov. 2017 to Jan. 2018 |
|
|
|
Total recourse indebtedness |
|
|
387,179 |
|
|
|
(21,258 |
) |
|
|
365,921 |
|
|
|
5.5 |
% |
|
|
|
|
|
Non-recourse indebtedness: |
|
|
|
|
|
|
|
|
|
|
|
|
|
|
|
|
|
|
|
|
|
CDO notes payable, at amortized cost (4)(5) |
|
|
542,316 |
|
|
|
(7,815 |
) |
|
|
534,501 |
|
|
|
1.7 |
% |
|
Jun. 2045 to Nov. 2046 |
|
|
|
CMBS securitizations (6) |
|
|
647,921 |
|
|
|
(6,844 |
) |
|
|
641,077 |
|
|
|
3.1 |
% |
|
May 2031 to Dec. 2031 |
|
|
|
Loans payable on real estate (7) |
|
|
186,237 |
|
|
|
(569 |
) |
|
|
185,668 |
|
|
|
5.7 |
% |
|
Jun. 2016 to Dec. 2021 |
|
|
|
Total non-recourse indebtedness |
|
|
1,376,474 |
|
|
|
(15,228 |
) |
|
|
1,361,246 |
|
|
|
2.9 |
% |
|
|
|
|
|
Other indebtedness (8) |
|
|
24,321 |
|
|
|
(406 |
) |
|
|
23,915 |
|
|
|
— |
|
|
|
— |
|
|
Total indebtedness |
|
$ |
1,787,974 |
|
|
$ |
(36,892 |
) |
|
$ |
1,751,082 |
|
|
|
3.5 |
% |
|
|
|
|
|
(1) |
Our 7.0% convertible senior notes are redeemable at par, at the option of the holder, in April 2021, and April 2026. |
|
(2) |
Our 4.0% convertible senior notes are redeemable at par, at the option of the holder, in October 2018, October 2023, and October 2028. |
|
(3) |
Relates to liabilities which we elected to record at fair value under FASB ASC Topic 825. |
|
(4) |
Excludes CDO notes payable purchased by us which are eliminated in consolidation. |
|
(5) |
Collateralized by $950,554 principal amount of commercial mortgage loans, mezzanine loans, other loans and preferred equity interests, $535,041 of which is eliminated in consolidation. These obligations were issued by separate legal entities and consequently the assets of the special purpose entities that collateralize these obligations are not available to our creditors. |
|
(6) |
Collateralized by $789,421 principal amount of commercial mortgage loans and participation interests. These obligations were issued by separate legal entities and consequently the assets of the special purpose entities that collateralize these obligations are not available to our creditors. |
|
(7) |
One loan payable on real estate had a maturity date of June 2016. This loan is currently in default and is in the process of foreclosure. |
|
(8) |
Represents a 40% interest issued to an unaffiliated third party in a venture to which we contributed the junior notes and equity of a floating rate securitization. This venture is referred to as the 2016 RAIT Venture VIE. We retained a 60% interest in this venture, and, as a result of our controlling financial interest, we consolidated the venture. We received approximately $24,796 of proceeds as a result of issuing this 40% interest, which has an unpaid principal balance of $24,321. This 40% interest has no stated maturity date and does not provide for its mandatory redemption or any required return or interest payment. The venture interests allocate the distributions on such junior notes and equity when made between the parties to the venture. |
Recourse indebtedness refers to indebtedness that is recourse to our general assets, including the loans payable on real estate that are guaranteed by us. Non-recourse indebtedness consists of indebtedness of consolidated securitizations and loans payable on real estate which is recourse only to specific assets pledged as collateral to the lenders. The creditors of each consolidated securitization have no recourse to our general credit.
26
RAIT Financial Trust
Notes to Consolidated Financial Statements
As of June 30, 2017
(Unaudited and dollars in thousands, except share and per share amounts)
The current status or activity in our financing arrangements occurring as of or during the six months ended June 30, 2017 is as follows:
Recourse Indebtedness
7.0% convertible senior notes. The 7.0% convertible senior notes are convertible at the option of the holder at a current conversion rate of 195.0060 common shares per $1 principal amount of 7.0% convertible senior notes (equivalent to a current conversion price of $5.13 per common share). As of June 30, 2017, $871 of the 7.0% convertible notes remain outstanding. The 7.0% convertible senior notes are redeemable at par, at the option of the holder, in April 2021, and April 2026. During the six months ended June 30, 2017, there was no activity other than recurring interest during the current period. These notes do not contain financial covenants.
4.0% convertible senior notes. The 4.0% convertible senior notes are convertible at the option of the holder at a current conversion rate of 108.5803 common shares per $1 principal amount of 4.0% convertible senior notes (equivalent to a current conversion price of $9.21 per common share). As of June 30, 2017, $126,098 of the 4.0% convertible senior notes remain outstanding. The 4.0% convertible senior notes are redeemable at par, at the option of the holder, in October 2018, October 2023, and October 2028. During the six months ended June 30, 2017, there was no activity other than recurring interest during the current period. These notes do not contain financial covenants.
7.625% senior notes. As of June 30, 2017, $57,287 of the 7.625% senior notes remain outstanding. During the six months ended June 30, 2017, there was no activity other than recurring interest during the current period. These notes contain financial covenants including a maximum leverage ratio covenant and a minimum fixed charge ratio covenant. As of June 30, 2017, the leverage ratio, calculated in accordance with the indenture, was 77.6% as compared to a maximum leverage ratio not to exceed 80%, and for the preceding four quarters, the fixed charge coverage ratio, calculated in accordance with the indenture, was 2.74x as compared to a minimum fixed charge coverage ratio of no less than 1.20x.
7.125% senior notes. As of June 30, 2017, $70,731 of the 7.125% senior notes remain outstanding. During the six months ended June 30, 2017, there was no activity other than recurring interest during the current period. These notes contain financial covenants including a maximum leverage ratio covenant and a minimum fixed charge ratio covenant. As of June 30, 2017, the leverage ratio, calculated in accordance with the indenture, was 77.6% as compared to a maximum leverage ratio not to exceed 80%, and for the preceding four quarters, the fixed charge coverage ratio, calculated in accordance with the indenture, was 2.74x as compared to a minimum fixed charge coverage ratio of no less than 1.20x.
Senior secured notes. During the six months ended June 30, 2017, we repaid $3,500 of the senior secured notes. These notes do not contain financial covenants.
In January 2017, we redeemed $15,500 in principal amount of the 6.75% senior notes at a redemption price equal to the principal amount plus accrued and unpaid interest.
In March 2017, we redeemed $15,000 in principal amount of the 6.85% senior notes at a redemption price equal to the principal amount plus accrued and unpaid interest.
In April 2017, we redeemed $10,000 in principal amount of the 7.15% senior notes at a redemption price equal to the principal amount plus accrued and unpaid interest.
In June 2017, we redeemed $2,500 in principal amount of the 7.15% senior notes at a redemption price equal to the principal amount plus accrued and unpaid interest.
Junior subordinated notes, at fair value. At issuance, we elected to record the $18,671 junior subordinated notes at fair value under FASB ASC Topic 825, with all subsequent changes in fair value recorded in earnings. As of June 30, 2017, the fair value, or carrying amount, of this indebtedness was $12,524. These notes do not contain financial covenants.
Junior subordinated notes, at amortized cost. During the six months ended June 30, 2017, there was no activity other than recurring interest during the current period. These notes do not contain financial covenants.
27
RAIT Financial Trust
Notes to Consolidated Financial Statements
As of June 30, 2017
(Unaudited and dollars in thousands, except share and per share amounts)
Secured warehouse facilities. As of June 30, 2017, we had $0 of outstanding secured warehouse borrowings and $17,640 of outstanding commercial mortgage borrowings under the amended and restated master repurchase agreement, or the Amended MRA. The Amended MRA had a capacity of $200,000 with a limit of $100,000 for floating rate loans. In July 2016, this facility was amended decreasing the capacity to $150,000 and extending the maturity date to July 28, 2018. In June 2017, the financial covenants with respect to this facility were amended. As of June 30, 2017, we were in compliance with all financial covenants contained in the Amended MRA.
As of June 30, 2017, we had $0 of outstanding borrowings under the $150,000 secured warehouse facility. In June 2017, this facility was amended decreasing the capacity to $25,000. In June 2017, the financial covenants with respect to this facility were amended. As of June 30, 2017, we were in compliance with all financial covenants contained in the $25,000 secured warehouse facility.
As of June 30, 2017, we had $13,068 of outstanding borrowings under the $75,000 commercial mortgage facility. In July 2017, the financial covenants with respect to this facility were amended. As of June 30, 2017, we were in compliance with all financial covenants contained in the $75,000 commercial mortgage facility.
As of June 30, 2017, we had $0 of outstanding borrowings under the $150,000 commercial mortgage facility. In June 2017, this facility was amended increasing the capacity to $250,000. In June 2017, the financial covenants with respect to this facility were amended. As of June 30, 2017, we were in compliance with all financial covenants contained in the $250,000 commercial mortgage facility.
Non-Recourse Indebtedness
CDO notes payable, at amortized cost. CDO notes payable at amortized cost represent notes issued by consolidated CDO securitizations that are used to finance the acquisition of unsecured REIT notes, CMBS securities, commercial mortgage loans and mezzanine loans in our commercial real estate portfolio. Generally, CDO notes payable are comprised of various classes of notes payable, with each class bearing interest at variable or fixed rates. Both RAIT I and RAIT II are meeting all of their over collateralization, or OC, and interest coverage, or IC, trigger tests as of June 30, 2017.
CMBS securitizations. During the second quarter of 2017, RAIT exercised its right to unwind RAIT 2014-FL3 Trust, or RAIT FL3, thereby repaying all of the outstanding notes. As a result, as of June 30, 2017, RAIT FL3 had $0 of total collateral at par value.
As of June 30, 2017, our subsidiary, RAIT 2015-FL4 Trust, or RAIT FL4, had $104,284 of total collateral at par value, none of which was defaulted. RAIT FL4 had classes of investment grade senior notes with an aggregate principal balance outstanding of approximately $62,894 to investors. We currently own the unrated classes of junior notes, including a class with an aggregate principal balance of $41,390, and the equity, or the retained interests, of RAIT FL4. RAIT FL4 does not have OC triggers or IC triggers.
As of June 30, 2017, our subsidiary, RAIT 2015-FL5 Trust, or RAIT FL5, had $247,905 of total collateral at par value, none of which was defaulted. RAIT FL5 had classes of investment grade senior notes with an aggregate principal balance outstanding of approximately $187,102 to investors. We formed a venture, the 2016 RAIT Venture VIE, which currently owns the unrated classes of junior notes with an aggregate principal balance of $60,803, and the equity of RAIT FL5. We retained a 60% interest in the venture. RAIT FL5 does not have OC triggers or IC triggers.
As of June 30, 2017, our subsidiary, RAIT 2016-FL6 Trust, or RAIT FL6, had $235,823 of total collateral at par value, none of which was defaulted. RAIT FL6 had classes of investment grade senior notes with an aggregate principal balance outstanding of approximately $194,551 to investors. Upon closing, we retained $41,272 of the unrated classes of junior notes and equity of the FL6 issuer. In January 2017, we contributed the $41,272 junior notes and the equity of RAIT FL6 to a venture, the 2017 RAIT Venture VIE. We retained a 60% interest in the venture, and, as a result of our controlling financial interest, we consolidated the venture. We received approximately $16,893 of proceeds as a result of this contribution. RAIT FL6 does not have OC triggers or IC triggers.
On June 23, 2017, we closed a CMBS securitization transaction we refer to as RAIT FL7 collateralized by $342,373 of floating rate commercial mortgage loans and participation interests that we originated and that is non-recourse to us, except for certain
28
RAIT Financial Trust
Notes to Consolidated Financial Statements
As of June 30, 2017
(Unaudited and dollars in thousands, except share and per share amounts)
repurchase and other obligations related to customary representations, warranties and covenants concerning the collateral that we had made. In this CMBS securitization transaction, our subsidiary, RAIT 2017-FL7 Trust, or the FL7 issuer, issued classes of investment grade senior notes, or the FL7 senior notes, with an aggregate principal balance of approximately $276,894 to investors, representing an advance rate of approximately 80.9%. The FL7 senior notes bear interest at a weighted average rate equal to LIBOR plus 1.44%. The stated maturity of the FL7 notes is June 2037, unless redeemed or repaid prior thereto. At the closing of RAIT FL7, we retained the unrated classes of junior notes, or the FL7 junior notes, aggregating to a principal balance of $65,479 and the equity, or the retained interests, of the FL7 issuer. As of June 30, 2017, RAIT FL7 had $342,373 of total collateral at par value, none of which is defaulted and had classes of investment grade senior notes with an aggregate principal balance outstanding of approximately $276,894 to investors. Subject to certain conditions, beginning in June 2019 or upon defined tax events, the FL7 issuer may redeem the FL7 senior notes, in whole but not in part, at the direction of holders of FL7 junior notes, which we held as of June 30, 2017.
The junior notes that we have retained in our CMBS securitizations include the class of junior notes that is subject to the first dollar of loss.
Loans payable on real estate. As of June 30, 2017 and December 31, 2016, we had $135,123 and $186,237, respectively, of other indebtedness outstanding relating to loans payable on consolidated real estate. These loans are secured by specific consolidated real estate and commercial loans included in our consolidated balance sheets.
During the six months ended June 30, 2017, we repaid $22,981 of mortgage indebtedness as part of three property dispositions. We recognized $3,813 gains on extinguishments of debt related to two of these three dispositions as the properties were sold for less than their outstanding indebtedness and the outstanding indebtedness was deemed satisfied in full as a result of such sales.
During the six months ended June 30, 2017, we incurred a non-cash loss on deconsolidation of properties of $15,947 relating to an industrial real estate portfolio containing ten properties with a carrying value of $82,501 and $81,941 of related cross-collateralized non-recourse debt as of December 31, 2016. During the six months ended June 30, 2017, the senior lender foreclosed on the mortgage liens encumbering five of these industrial properties and disposed of the properties through auction processes. These five properties, including other assets, net of related liabilities, had an aggregate carrying value of $43,414. Upon foreclosure, we derecognized these net assets and extinguished related debt of $27,467 based on the proceeds received by the senior lender at the auctions. The difference between the net carrying value and the debt extinguished resulted in the non-cash loss noted above as full release of the remaining cross-collateralized non-recourse debt has not yet been received. The remaining five of these industrial properties have a carrying value of $38,516 and $54,475 of related cross-collateralized non-recourse debt as of June 30, 2017.
29
RAIT Financial Trust
Notes to Consolidated Financial Statements
As of June 30, 2017
(Unaudited and dollars in thousands, except share and per share amounts)
Generally, the majority of our indebtedness is payable in full upon the maturity or termination date of the underlying indebtedness. The following table displays the aggregate contractual maturities of our indebtedness on or before December 31 by year:
|
|
|
Recourse indebtedness |
|
|
Non-recourse indebtedness |
|
||
|
2017 (1) |
|
$ |
- |
|
|
$ |
72,825 |
|
|
2018 |
|
|
32,208 |
|
|
|
1,315 |
|
|
2019 |
|
|
84,731 |
|
|
|
1,387 |
|
|
2020 |
|
|
- |
|
|
|
1,455 |
|
|
2021 |
|
|
- |
|
|
|
25,980 |
|
|
Thereafter (2) |
|
|
228,027 |
|
|
|
1,129,946 |
|
|
Total |
|
$ |
344,966 |
|
|
$ |
1,232,908 |
|
|
(1) |
Non-recourse indebtedness includes $54,475 of indebtedness that had a maturity date of June 2016. This indebtedness was collateralized by ten industrial properties as of December 31, 2016. In February and March of 2017, the senior lender foreclosed on the mortgage liens encumbering five of these properties. In August of 2017, the senior lender foreclosed on the mortgage lien encumbering one more of these industrial properties and is in the process of foreclosing on the remaining four properties. Non-recourse indebtedness also includes one loan payable on real estate that had a maturity date of April 2017, collateralized by two industrial properties and two office properties. This loan is currently in default and is in the process of foreclosure. |
|
(2) |
Includes $871 of our 7.0% convertible senior notes that are redeemable, at par at the option of the holder in April 2021 and April 2026. Includes $126,098 of our 4.0% convertible senior notes that are redeemable, at par at the option of the holder in October 2018, October 2023, and October 2028. |
NOTE 6: DERIVATIVE FINANCIAL INSTRUMENTS
We may use derivative financial instruments to hedge all or a portion of the interest rate risk associated with our borrowings. The principal objective of such arrangements is to minimize the risks and/or costs associated with our operating and financial structure as well as to hedge specific anticipated transactions. While these instruments may impact our periodic cash flows, they benefit us by minimizing the risks and/or costs previously described. The counterparties to these contractual arrangements are major financial institutions with which we and our affiliates may also have other financial relationships. In the event of nonperformance by the counterparties, we are potentially exposed to credit loss. However, because of the high credit ratings of the counterparties, we do not anticipate that any of the counterparties will fail to meet their obligations, but there can be no assurance that they will meet such obligations.
Interest Rate Derivatives
We have entered into various interest rate swap contracts to hedge interest rate exposure on floating rate indebtedness.
We designate interest rate hedge agreements at inception and determine whether or not the interest rate hedge agreement is highly effective in offsetting interest rate fluctuations associated with the identified indebtedness. At designation, certain of these interest rate swaps had a fair value not equal to zero. However, we concluded, at designation, that these hedging arrangements were highly effective during their term using regression analysis and determined that the hypothetical derivative method would be used in measuring any ineffectiveness. At each reporting period, we update our regression analysis and, as of June 30, 2017, we concluded that these hedging arrangements were highly effective during their remaining term and used the hypothetical derivative method in measuring the ineffective portions of these hedging arrangements. As of December 31, 2016, all of our cash flow hedge interest rate swaps had reached maturity. As of June 30, 2017, no new cash flow hedge interest rate swaps have been entered into.
30
RAIT Financial Trust
Notes to Consolidated Financial Statements
As of June 30, 2017
(Unaudited and dollars in thousands, except share and per share amounts)
The following table summarizes the aggregate notional amount and estimated net fair value of our derivative instruments as of June 30, 2017 and December 31, 2016:
|
|
|
As of June 30, 2017 |
|
|
As of December 31, 2016 |
|
||||||||||||||||||
|
|
|
Notional |
|
|
Fair Value of Assets |
|
|
Fair Value of Liabilities |
|
|
Notional |
|
|
Fair Value of Assets |
|
|
Fair Value of Liabilities |
|
||||||
|
|
|
|
|
|
|
|
|
|
|
|
|
|
|
|
|
|
|
|
|
|
|
|
|
|
|
Interest rate caps |
|
$ |
28,960 |
|
|
$ |
85 |
|
|
$ |
- |
|
|
$ |
28,960 |
|
|
$ |
135 |
|
|
$ |
- |
|
|
Interest rate swaps |
|
|
12,650 |
|
|
|
- |
|
|
|
17 |
|
|
|
15,175 |
|
|
|
71 |
|
|
|
- |
|
|
Net fair value |
|
$ |
41,610 |
|
|
$ |
85 |
|
|
$ |
17 |
|
|
$ |
44,135 |
|
|
$ |
206 |
|
|
$ |
- |
|
Effective interest rate hedges are reported in accumulated other comprehensive income and the fair value of these hedge agreements is included in other assets or derivative liabilities.
For interest rate swaps that were considered effective hedges, we reclassified realized losses of $0 and $1,656 to earnings, within investment interest expense, for the three months ended June 30, 2017, and 2016, respectively and $0 and $4,059 for the six months ended June 30, 2017 and 2016.
Changes in fair value on our other interest rate derivatives are reported in change in fair value of financial instruments in the Consolidated Statements of Operations.
31
RAIT Financial Trust
Notes to Consolidated Financial Statements
As of June 30, 2017
(Unaudited and dollars in thousands, except share and per share amounts)
NOTE 7: FAIR VALUE OF FINANCIAL INSTRUMENTS
Fair Value of Financial Instruments
FASB ASC Topic 825, “Financial Instruments” requires disclosure of the fair value of financial instruments for which it is practicable to estimate that value. The fair value of investments in mortgages, loans, preferred equity interests, CDO notes payable, convertible senior notes, junior subordinated notes, warrants and investor share appreciation rights, or SARs, and derivative assets and liabilities is based on significant observable and unobservable inputs. The fair value of cash and cash equivalents, restricted cash, CMBS facilities, and other indebtedness approximates their carrying amount or unpaid principal balance due to the nature of these instruments.
The following table summarizes the carrying amount and the fair value of our financial instruments as of June 30, 2017:
|
Financial Instrument |
|
Carrying Amount |
|
|
Estimated Fair Value |
|
||
|
Assets |
|
|
|
|
|
|
|
|
|
Total investment in mortgages and loans, net |
|
$ |
1,244,191 |
|
|
$ |
1,192,723 |
|
|
Cash and cash equivalents |
|
|
89,317 |
|
|
|
89,317 |
|
|
Restricted cash |
|
|
193,580 |
|
|
|
193,580 |
|
|
Derivative assets |
|
|
85 |
|
|
|
85 |
|
|
|
|
|
|
|
|
|
|
|
|
Liabilities |
|
|
|
|
|
|
|
|
|
Recourse indebtedness: |
|
|
|
|
|
|
|
|
|
7.0% convertible senior notes |
|
|
832 |
|
|
|
590 |
|
|
4.0% convertible senior notes |
|
|
121,065 |
|
|
|
119,680 |
|
|
7.625% senior notes |
|
|
55,687 |
|
|
|
55,018 |
|
|
7.125% senior notes |
|
|
69,477 |
|
|
|
70,420 |
|
|
Senior secured notes |
|
|
14,355 |
|
|
|
15,783 |
|
|
Junior subordinated notes, at fair value |
|
|
12,524 |
|
|
|
12,524 |
|
|
Junior subordinated notes, at amortized cost |
|
|
25,100 |
|
|
|
13,995 |
|
|
CMBS facilities |
|
|
29,818 |
|
|
|
30,708 |
|
|
Non-recourse indebtedness: |
|
|
|
|
|
|
|
|
|
CDO notes payable, at amortized cost |
|
|
370,379 |
|
|
|
329,004 |
|
|
CMBS securitizations |
|
|
713,263 |
|
|
|
721,456 |
|
|
Loans payable on real estate |
|
|
134,687 |
|
|
|
137,583 |
|
|
Other indebtedness |
|
|
40,880 |
|
|
|
40,830 |
|
|
Derivative liabilities |
|
|
17 |
|
|
|
17 |
|
|
Warrants and investor SARs |
|
|
27,500 |
|
|
|
27,500 |
|
32
RAIT Financial Trust
Notes to Consolidated Financial Statements
As of June 30, 2017
(Unaudited and dollars in thousands, except share and per share amounts)
The following table summarizes the carrying amount and the fair value of our financial instruments as of December 31, 2016:
|
Financial Instrument |
|
Carrying Amount |
|
|
Estimated Fair Value |
|
||
|
Assets |
|
|
|
|
|
|
|
|
|
Total investment in mortgages and loans, net |
|
$ |
1,280,285 |
|
|
$ |
1,256,342 |
|
|
Cash and cash equivalents |
|
|
110,531 |
|
|
|
110,531 |
|
|
Restricted cash |
|
|
190,179 |
|
|
|
190,179 |
|
|
Derivative assets |
|
|
206 |
|
|
|
206 |
|
|
Liabilities |
|
|
|
|
|
|
|
|
|
Recourse indebtedness: |
|
|
|
|
|
|
|
|
|
7.0% convertible senior notes |
|
|
831 |
|
|
|
890 |
|
|
4.0% convertible senior notes |
|
|
120,271 |
|
|
|
116,861 |
|
|
7.625% senior notes |
|
|
55,568 |
|
|
|
53,231 |
|
|
7.125% senior notes |
|
|
69,188 |
|
|
|
69,118 |
|
|
Senior secured notes |
|
|
58,233 |
|
|
|
62,620 |
|
|
Junior subordinated notes, at fair value |
|
|
11,822 |
|
|
|
11,822 |
|
|
Junior subordinated notes, at amortized cost |
|
|
25,100 |
|
|
|
13,099 |
|
|
CMBS facilities |
|
|
24,908 |
|
|
|
26,421 |
|
|
Non-recourse indebtedness: |
|
|
|
|
|
|
|
|
|
CDO notes payable, at amortized cost |
|
|
534,501 |
|
|
|
477,032 |
|
|
CMBS securitizations |
|
|
641,077 |
|
|
|
646,642 |
|
|
Loans payable on real estate |
|
|
185,668 |
|
|
|
188,525 |
|
|
Other indebtedness |
|
|
23,915 |
|
|
|
24,321 |
|
|
Derivative liabilities |
|
|
- |
|
|
|
- |
|
|
Warrants and investor SARs |
|
|
30,400 |
|
|
|
30,400 |
|
Fair Value Measurements
The following tables summarize information about our assets and liabilities measured at fair value on a recurring basis as of June 30, 2017, and indicate the fair value hierarchy of the valuation techniques utilized to determine such fair value:
|
Assets: |
|
Quoted Prices in Active Markets for Identical Assets (Level 1) (1) |
|
|
Significant Other Observable Inputs (Level 2) (1) |
|
|
Significant Unobservable Inputs (Level 3) (1) |
|
|
Balance as of June 30, 2017 |
|
||||
|
Derivative assets |
|
$ |
— |
|
|
$ |
85 |
|
|
$ |
— |
|
|
$ |
85 |
|
|
Total assets |
|
$ |
— |
|
|
$ |
85 |
|
|
$ |
— |
|
|
$ |
85 |
|
|
Liabilities: |
|
Quoted Prices in Active Markets for Identical Assets (Level 1) (1) |
|
|
Significant Other Observable Inputs (Level 2) (1) |
|
|
Significant Unobservable Inputs (Level 3) (1) |
|
|
Balance as of June 30, 2017 |
|
||||
|
Junior subordinated notes, at fair value |
|
$ |
— |
|
|
$ |
— |
|
|
$ |
12,524 |
|
|
$ |
12,524 |
|
|
Derivative liabilities |
|
|
|
|
|
|
17 |
|
|
|
|
|
|
|
17 |
|
|
Warrants and investor SARs |
|
|
— |
|
|
|
— |
|
|
|
27,500 |
|
|
|
27,500 |
|
|
Total liabilities |
|
$ |
— |
|
|
$ |
17 |
|
|
$ |
40,024 |
|
|
$ |
40,041 |
|
|
(1) |
During the six months ended June 30, 2017, there were no transfers between Level 1 and Level 2, and there were no transfers into and/or out of Level 3. |
33
RAIT Financial Trust
Notes to Consolidated Financial Statements
As of June 30, 2017
(Unaudited and dollars in thousands, except share and per share amounts)
The following tables summarize information about our assets and liabilities measured at fair value on a recurring basis as of December 31, 2016, and indicate the fair value hierarchy of the valuation techniques utilized to determine such fair value:
|
Assets: |
|
Quoted Prices in Active Markets for Identical Assets (Level 1) (1) |
|
|
Significant Other Observable Inputs (Level 2) (1) |
|
|
Significant Unobservable Inputs (Level 3) (1) |
|
|
Balance as of December 31, 2016 |
|
||||
|
Derivative assets |
|
$ |
— |
|
|
$ |
206 |
|
|
$ |
— |
|
|
$ |
206 |
|
|
Total assets |
|
$ |
— |
|
|
$ |
206 |
|
|
$ |
— |
|
|
$ |
206 |
|
|
Liabilities: |
|
Quoted Prices in Active Markets for Identical Assets (Level 1) (1) |
|
|
Significant Other Observable Inputs (Level 2) (1) |
|
|
Significant Unobservable Inputs (Level 3) (1) |
|
|
Balance as of December 31, 2016 |
|
||||
|
Junior subordinated notes, at fair value |
|
$ |
— |
|
|
$ |
— |
|
|
$ |
11,822 |
|
|
$ |
11,822 |
|
|
Warrants and investor SARs |
|
|
— |
|
|
|
— |
|
|
|
30,400 |
|
|
|
30,400 |
|
|
Total liabilities |
|
$ |
— |
|
|
$ |
— |
|
|
$ |
42,222 |
|
|
$ |
42,222 |
|
|
(1) |
During the year ended December 31, 2016, there were no transfers between Level 1 and Level 2, and there were no transfers into and/or out of Level 3. |
When estimating the fair value of our Level 3 financial instruments, management uses various observable and unobservable inputs. These inputs include yields, credit spreads, duration, effective dollar prices and overall market conditions on not only the exact financial instrument for which management is estimating the fair value, but also financial instruments that are similar or issued by the same issuer when such inputs are unavailable. Generally, an increase in the yields, credit spreads or estimated duration will decrease the fair value of our financial instruments. Due to the inherent uncertainty of determining the fair value of investments that do not have a readily available market value, the fair value, as determined by management, may fluctuate from period to period and any ultimate liquidation or sale of the investment may result in proceeds that may be significantly different than fair value.
For the fair value of our junior subordinated notes, at fair value, and warrant and investor SARs classified as Level 3 liabilities, we estimate the fair value of these financial instruments using significant unobservable inputs. For the junior subordinated notes, at fair value, we use a discounted cash flow model as the valuation technique and the significant unobservable inputs as of June 30, 2017 include discount rates ranging from 10.9% to 11.2% and as of December 31, 2016 include discount rates ranging from 11.5% to 11.8%. For the warrants and investor SARs, we utilized a third party valuation firm who used a binomial model as the valuation technique and the significant unobservable inputs as of June 30, 2017 and December 31, 2016 include 49.0% and 51.0%, respectively, for the annual volatility of our common shares of beneficial interest over the term of the warrants and investor SARs, 9.5% and 10.0%, respectively, for the credit adjusted discount rate on our unsecured debt that may be issued in satisfaction of the warrants and investor SARs, and 13.2% and 10.0%, respectively, for the dividend rate and future dividend rate on our common shares of beneficial interest.
The following table summarizes additional information about assets and liabilities that are measured at fair value on a recurring basis for which we have utilized level 3 inputs to determine fair value for the six months ended June 30, 2017:
|
Liabilities |
|
Warrants and investor SARS |
|
|
Junior Subordinated Notes, at Fair Value |
|
|
Total Level 3 Liabilities |
|
|||
|
Balance, as of December 31, 2016 |
|
$ |
30,400 |
|
|
$ |
11,822 |
|
|
$ |
42,222 |
|
|
Change in fair value of financial instruments |
|
|
(2,900 |
) |
|
|
702 |
|
|
|
(2,198 |
) |
|
Purchases |
|
|
— |
|
|
|
— |
|
|
|
— |
|
|
Principal Repayments |
|
|
— |
|
|
|
— |
|
|
|
— |
|
|
Balance, as of June 30, 2017 |
|
$ |
27,500 |
|
|
$ |
12,524 |
|
|
$ |
40,024 |
|
34
RAIT Financial Trust
Notes to Consolidated Financial Statements
As of June 30, 2017
(Unaudited and dollars in thousands, except share and per share amounts)
The following table summarizes additional information about assets and liabilities that are measured at fair value on a recurring basis for which we have utilized level 3 inputs to determine fair value for the three months ended June 30, 2017:
|
Liabilities |
|
Warrants and investor SARS |
|
|
Junior Subordinated Notes, at Fair Value |
|
|
Total Level 3 Liabilities |
|
|||
|
Balance, as of March 31, 2017 |
|
$ |
30,900 |
|
|
$ |
12,482 |
|
|
$ |
43,382 |
|
|
Change in fair value of financial instruments |
|
|
(3,400 |
) |
|
|
42 |
|
|
|
(3,358 |
) |
|
Purchases |
|
|
— |
|
|
|
— |
|
|
|
— |
|
|
Principal Repayments |
|
|
— |
|
|
|
— |
|
|
|
— |
|
|
Balance, as of June 30, 2017 |
|
$ |
27,500 |
|
|
$ |
12,524 |
|
|
$ |
40,024 |
|
Non-Recurring Fair Value Measurements
As of June 30, 2017, we measured three real estate assets at a fair value of $65,900 in our consolidated balance sheets as they were impaired. The fair values were based on executed purchase and sale agreements for the real estate assets and were classified within Level 2 of the fair value hierarchy. The significant input was the purchase price agreed to with the potential buyer.
As of June 30, 2017, we measured one real estate asset at a fair value of $27,500 in our consolidated balance sheets as it was impaired. The fair value was based on an executed letter of intent for the real estate asset and was classified within Level 2 of the fair value hierarchy. The significant input was the purchase price agreed to with the potential buyer.
As of June 30, 2017, we measured one real estate asset at a fair value of $23,218 as it was impaired. The fair value was based on various offers received to purchase the property and was classified within Level 2 of the fair value hierarchy. The significant inputs were the purchase prices offered by the potential buyers.
As of June 30, 2017, we measured two real estate assets at a fair value of $40,300 in our consolidated balance sheets as they were impaired. The fair values were based on our broker’s opinion of value for the real estate assets and were classified within Level 3 of the fair value hierarchy. The significant inputs were the estimated fair value per linear foot of frontage of $11 for the land parcel and a terminal capitalization rate of 7.25% and a discount rate of 11.6% for the office property.
As of June 30, 2017, we measured three real estate assets at a fair value of $44,200 in our consolidated balance sheets as they were impaired. The fair values were based on a discounted cash flow valuation for the real estate assets and were classified within Level 3 of the fair value hierarchy. The significant inputs were the terminal capitalization rates of 7.4%, 6.7%, and 7.7% and discount rates of 10.5%, 8.6%, and 8.8%.
As of June 30, 2017, we measured our retail property manager reporting unit at a fair value of $1,975 in our consolidated balance sheets as it was impaired. The fair value was based on a discounted cash flow valuation for the reporting unit and was classified within Level 3 of the fair value hierarchy. The significant input was the discount rate of 18.0%.
Our other non-recurring fair value measurements relate primarily to our commercial real estate loans that are considered impaired and for which we maintain an allowance for loss. In determining the allowance for losses, we estimate the fair value of the respective commercial real estate loan and compare that fair value to our total investment in the loan. When estimating the fair value of the commercial real estate loan, management uses discounted cash flow analyses and capitalization rates on the underlying property’s net operating income. The discounted cash flow analyses and capitalization rates are based on market information and comparable sales of similar properties. These methodologies are classified in Level 3 of the fair value hierarchy.
35
RAIT Financial Trust
Notes to Consolidated Financial Statements
As of June 30, 2017
(Unaudited and dollars in thousands, except share and per share amounts)
Fair Value of Financial Instruments
The following tables summarize the valuation technique and the level of the fair value hierarchy for financial instruments that are not fair valued in the accompanying consolidated balance sheets but for which fair value is required to be disclosed. The fair value of cash and cash equivalents, restricted cash, secured credit facilities, CMBS facilities, commercial mortgage facilities and other indebtedness approximates cost due to the nature of these instruments and are not included in the tables below.
|
|
|
Carrying Amount as of June 30, 2017 |
|
|
Estimated Fair Value as of June 30, 2017 |
|
|
Valuation Technique |
|
Level in Fair Value Hierarchy |
||
|
Total investment in mortgages and loans, net |
|
$ |
1,244,191 |
|
|
$ |
1,192,723 |
|
|
Discounted cash flows |
|
Three |
|
7.0% convertible senior notes |
|
|
832 |
|
|
|
590 |
|
|
Trading price |
|
Two |
|
4.0% convertible senior notes |
|
|
121,065 |
|
|
|
119,680 |
|
|
Trading price |
|
Two |
|
7.625% senior notes |
|
|
55,687 |
|
|
|
55,018 |
|
|
Trading price |
|
Two |
|
7.125% senior notes |
|
|
69,477 |
|
|
|
70,420 |
|
|
Trading price |
|
Two |
|
Senior secured notes |
|
|
14,355 |
|
|
|
15,783 |
|
|
Discounted cash flows |
|
Three |
|
Junior subordinated notes, at amortized cost |
|
|
25,100 |
|
|
|
13,995 |
|
|
Discounted cash flows |
|
Three |
|
CDO notes payable, at amortized cost |
|
|
370,379 |
|
|
|
329,004 |
|
|
Discounted cash flows |
|
Three |
|
CMBS securitizations |
|
|
713,263 |
|
|
|
721,456 |
|
|
Discounted cash flows |
|
Three |
|
Loans payable on real estate |
|
|
134,687 |
|
|
|
137,583 |
|
|
Discounted cash flows |
|
Three |
|
Other indebtedness |
|
|
40,880 |
|
|
|
40,830 |
|
|
Discounted cash flows |
|
Three |
|
|
|
Carrying Amount as of December 31, 2016 |
|
|
Estimated Fair Value as of December 31, 2016 |
|
|
Valuation Technique |
|
Level in Fair Value Hierarchy |
||
|
Total investment in mortgages and loans, net |
|
$ |
1,280,285 |
|
|
$ |
1,256,342 |
|
|
Discounted cash flows |
|
Three |
|
7.0% convertible senior notes |
|
|
831 |
|
|
|
890 |
|
|
Trading price |
|
One |
|
4.0% convertible senior notes |
|
|
120,271 |
|
|
|
116,861 |
|
|
Trading price |
|
One |
|
7.625% senior notes |
|
|
55,568 |
|
|
|
53,231 |
|
|
Trading price |
|
One |
|
7.125% senior notes |
|
|
69,188 |
|
|
|
69,118 |
|
|
Trading price |
|
One |
|
Senior secured notes |
|
|
58,233 |
|
|
|
62,620 |
|
|
Discounted cash flows |
|
Three |
|
Junior subordinated notes, at amortized cost |
|
|
25,100 |
|
|
|
13,099 |
|
|
Discounted cash flows |
|
Three |
|
CDO notes payable, at amortized cost |
|
|
534,501 |
|
|
|
477,032 |
|
|
Discounted cash flows |
|
Three |
|
CMBS securitization |
|
|
641,077 |
|
|
|
646,642 |
|
|
Discounted cash flows |
|
Three |
|
Loans payable on real estate |
|
|
185,668 |
|
|
|
188,525 |
|
|
Discounted cash flows |
|
Three |
|
Other indebtedness |
|
|
23,915 |
|
|
|
24,321 |
|
|
Discounted cash flows |
|
Three |
The following table summarizes realized and unrealized gains and losses on assets and liabilities for which we elected the fair value option of FASB ASC Topic 825, “Financial Instruments” and derivatives as reported in change in fair value of financial instruments in the accompanying consolidated statements of operations:
|
|
|
For the Three Months Ended June 30, |
|
|
For the Six Months Ended June 30, |
|
||||||||||
|
Description |
|
2017 |
|
|
2016 |
|
|
2017 |
|
|
2016 |
|
||||
|
Change in fair value of junior subordinated notes |
|
$ |
(42 |
) |
|
$ |
(1,004 |
) |
|
$ |
(702 |
) |
|
$ |
(285 |
) |
|
Change in fair value of derivatives |
|
|
(265 |
) |
|
|
(388 |
) |
|
|
(258 |
) |
|
|
(2,295 |
) |
|
Change in fair value of warrants and investors SARs |
|
|
3,400 |
|
|
|
(200 |
) |
|
|
2,900 |
|
|
|
(3,100 |
) |
|
Change in fair value of financial instruments |
|
$ |
3,093 |
|
|
$ |
(1,592 |
) |
|
$ |
1,940 |
|
|
$ |
(5,680 |
) |
36
RAIT Financial Trust
Notes to Consolidated Financial Statements
As of June 30, 2017
(Unaudited and dollars in thousands, except share and per share amounts)
The changes in the fair value for the junior subordinated notes for which the fair value option was elected for the three and six months ended June 30, 2017 and 2016 was primarily attributable to changes in interest rates and instrument specific credit risks. The changes in the fair value of derivatives for the three and six months ended June 30, 2017 and 2016 was primarily attributable to changes in interest rates. The changes in fair value of the warrants and investor SARs for the three and six months ended June 30, 2017 and 2016 was primarily attributable to changes in the reference stock price and volatility.
NOTE 8: VARIABLE INTEREST ENTITIES
The determination of when to consolidate a VIE is based on the power to direct the activities of the VIE that most significantly impact the VIE’s economic performance together with either the obligation to absorb losses or the right to receive benefits that could be significant to the VIE. We evaluated our investments and determined that, as of June 30, 2017 and December 31, 2016, our consolidated VIEs were: RAIT I, RAIT II, our floating rate securitizations, RAIT VIE Properties (Willow Grove, Cherry Hill, McDowell, and five of our industrial properties) and the two ventures described in Note 5: Indebtedness (RAIT Venture VIEs).
We consolidate the securitizations that we sponsor as we have retained interests in these entities and control the significant decisions regarding the collateral in these entities, such as the approval of loan workouts. As of June 30, 2017, we consolidate the VIE properties as we own a majority of these entities and control the significant capital and operating decisions regarding the properties. As of June 30, 2017, we consolidate our two RAIT Venture VIEs (each of which consolidates a floating rate securitization) as we own a majority of these entities and control a majority of the significant decisions regarding the collateral in these entities, such as the approval of loan workouts.
37
RAIT Financial Trust
Notes to Consolidated Financial Statements
As of June 30, 2017
(Unaudited and dollars in thousands, except share and per share amounts)
The following tables present the assets and liabilities of our consolidated VIEs as of each respective date. Certain amounts included in the tables below are eliminated upon consolidation with our other subsidiaries that maintain investments in the debt or equity securities issued by these entities.
|
|
|
As of June 30, 2017 |
|
|||||||||||||
|
|
|
RAIT Securitizations |
|
|
RAIT VIE Properties |
|
|
RAIT Venture VIEs |
|
|
Total |
|
||||
|
Assets |
|
|
|
|
|
|
|
|
|
|
|
|
|
|
|
|
|
Investments in mortgages and loans, at amortized cost: |
|
|
|
|
|
|
|
|
|
|
|
|
|
|
|
|
|
Commercial mortgages, mezzanine loans, other loans and preferred equity interests |
|
$ |
1,177,966 |
|
|
$ |
— |
|
|
$ |
427,735 |
|
|
$ |
1,605,701 |
|
|
Allowance for losses |
|
|
(23,514 |
) |
|
|
— |
|
|
|
— |
|
|
|
(23,514 |
) |
|
Total investments in mortgages and loans |
|
|
1,154,452 |
|
|
|
— |
|
|
|
427,735 |
|
|
|
1,582,187 |
|
|
Investments in real estate |
|
|
|
|
|
|
|
|
|
|
|
|
|
|
|
|
|
Investments in real estate |
|
|
— |
|
|
|
114,609 |
|
|
|
— |
|
|
|
114,609 |
|
|
Accumulated depreciation |
|
|
— |
|
|
|
(8,604 |
) |
|
|
— |
|
|
|
(8,604 |
) |
|
Total investments in real estate |
|
|
— |
|
|
|
106,005 |
|
|
|
— |
|
|
|
106,005 |
|
|
Cash and cash equivalents |
|
|
— |
|
|
|
1,219 |
|
|
|
92 |
|
|
|
1,311 |
|
|
Restricted cash |
|
|
10,448 |
|
|
|
1,114 |
|
|
|
55,617 |
|
|
|
67,179 |
|
|
Accrued interest receivable |
|
|
48,764 |
|
|
|
— |
|
|
|
2,818 |
|
|
|
51,582 |
|
|
Other assets |
|
|
73 |
|
|
|
8,897 |
|
|
|
— |
|
|
|
8,970 |
|
|
Intangible assets |
|
|
|
|
|
|
|
|
|
|
|
|
|
|
|
|
|
Intangible assets |
|
|
— |
|
|
|
886 |
|
|
|
— |
|
|
|
886 |
|
|
Accumulated amortization |
|
|
— |
|
|
|
(341 |
) |
|
|
— |
|
|
|
(341 |
) |
|
Total intangible assets |
|
|
— |
|
|
|
545 |
|
|
|
— |
|
|
|
545 |
|
|
Total assets |
|
$ |
1,213,737 |
|
|
$ |
117,780 |
|
|
$ |
486,262 |
|
|
$ |
1,817,779 |
|
|
Liabilities and Equity |
|
|
|
|
|
|
|
|
|
|
|
|
|
|
|
|
|
Indebtedness, net |
|
$ |
1,019,996 |
|
|
$ |
169,778 |
|
|
$ |
479,948 |
|
|
$ |
1,669,722 |
|
|
Accrued interest payable |
|
|
951 |
|
|
|
15,819 |
|
|
|
1,364 |
|
|
|
18,134 |
|
|
Accounts payable and accrued expenses |
|
|
— |
|
|
|
5,235 |
|
|
|
— |
|
|
|
5,235 |
|
|
Derivative liabilities |
|
|
— |
|
|
|
— |
|
|
|
— |
|
|
|
— |
|
|
Deferred taxes, borrowers’ escrows and other liabilities |
|
|
— |
|
|
|
818 |
|
|
|
966 |
|
|
|
1,784 |
|
|
Total liabilities |
|
|
1,020,947 |
|
|
|
191,650 |
|
|
|
482,278 |
|
|
|
1,694,875 |
|
|
Equity: |
|
|
|
|
|
|
|
|
|
|
|
|
|
|
|
|
|
Shareholders’ equity: |
|
|
|
|
|
|
|
|
|
|
|
|
|
|
|
|
|
Preferred shares |
|
|
— |
|
|
|
— |
|
|
|
— |
|
|
|
— |
|
|
Additional paid in capital |
|
|
— |
|
|
|
— |
|
|
|
— |
|
|
|
— |
|
|
RAIT investment |
|
|
20,909 |
|
|
|
33,498 |
|
|
|
7,252 |
|
|
|
61,659 |
|
|
Retained earnings (deficit) |
|
|
171,881 |
|
|
|
(107,608 |
) |
|
|
(3,315 |
) |
|
|
60,958 |
|
|
Total shareholders’ equity |
|
|
192,790 |
|
|
|
(74,110 |
) |
|
|
3,937 |
|
|
|
122,617 |
|
|
Noncontrolling Interests |
|
|
— |
|
|
|
240 |
|
|
|
47 |
|
|
|
287 |
|
|
Total liabilities and equity |
|
$ |
1,213,737 |
|
|
$ |
117,780 |
|
|
$ |
486,262 |
|
|
$ |
1,817,779 |
|
38
RAIT Financial Trust
Notes to Consolidated Financial Statements
As of June 30, 2017
(Unaudited and dollars in thousands, except share and per share amounts)
|
|
|
As of December 31, 2016 |
|
|||||||||||||
|
|
|
RAIT Securitizations |
|
|
RAIT VIE Properties |
|
|
RAIT Venture VIE |
|
|
Total |
|
||||
|
Assets |
|
|
|
|
|
|
|
|
|
|
|
|
|
|
|
|
|
Investments in mortgages and loans, at amortized cost: |
|
|
|
|
|
|
|
|
|
|
|
|
|
|
|
|
|
Commercial mortgages, mezzanine loans, other loans and preferred equity interests |
|
$ |
1,409,758 |
|
|
$ |
— |
|
|
$ |
324,709 |
|
|
$ |
1,734,467 |
|
|
Allowance for losses |
|
|
— |
|
|
|
— |
|
|
|
— |
|
|
|
— |
|
|
Total investments in mortgages and loans |
|
|
1,409,758 |
|
|
|
— |
|
|
|
324,709 |
|
|
|
1,734,467 |
|
|
Investments in real estate |
|
|
|
|
|
|
|
|
|
|
|
|
|
|
|
|
|
Investments in real estate |
|
|
— |
|
|
|
223,722 |
|
|
|
— |
|
|
|
223,722 |
|
|
Accumulated depreciation |
|
|
— |
|
|
|
(31,652 |
) |
|
|
— |
|
|
|
(31,652 |
) |
|
Total investments in real estate |
|
|
— |
|
|
|
192,070 |
|
|
|
— |
|
|
|
192,070 |
|
|
Cash and cash equivalents |
|
|
— |
|
|
|
2,145 |
|
|
|
1 |
|
|
|
2,146 |
|
|
Restricted cash |
|
|
6,986 |
|
|
|
1,167 |
|
|
|
723 |
|
|
|
8,876 |
|
|
Accrued interest receivable |
|
|
56,974 |
|
|
|
— |
|
|
|
1,513 |
|
|
|
58,487 |
|
|
Other assets |
|
|
480 |
|
|
|
9,591 |
|
|
|
— |
|
|
|
10,071 |
|
|
Intangible assets |
|
|
|
|
|
|
|
|
|
|
|
|
|
|
|
|
|
Intangible assets |
|
|
— |
|
|
|
5,616 |
|
|
|
— |
|
|
|
5,616 |
|
|
Accumulated amortization |
|
|
— |
|
|
|
(3,740 |
) |
|
|
— |
|
|
|
(3,740 |
) |
|
Total intangible assets |
|
|
— |
|
|
|
1,876 |
|
|
|
— |
|
|
|
1,876 |
|
|
Total assets |
|
$ |
1,474,198 |
|
|
$ |
206,849 |
|
|
$ |
326,946 |
|
|
$ |
2,007,993 |
|
|
Liabilities and Equity |
|
|
|
|
|
|
|
|
|
|
|
|
|
|
|
|
|
Indebtedness, net |
|
$ |
1,244,507 |
|
|
$ |
230,510 |
|
|
$ |
323,485 |
|
|
$ |
1,798,502 |
|
|
Accrued interest payable |
|
|
1,903 |
|
|
|
14,306 |
|
|
|
854 |
|
|
|
17,063 |
|
|
Accounts payable and accrued expenses |
|
|
19 |
|
|
|
5,443 |
|
|
|
1 |
|
|
|
5,463 |
|
|
Derivative liabilities |
|
|
— |
|
|
|
— |
|
|
|
— |
|
|
|
— |
|
|
Deferred taxes, borrowers’ escrows and other liabilities |
|
|
— |
|
|
|
2,051 |
|
|
|
920 |
|
|
|
2,971 |
|
|
Total liabilities |
|
|
1,246,429 |
|
|
|
252,310 |
|
|
|
325,260 |
|
|
|
1,823,999 |
|
|
Equity: |
|
|
|
|
|
|
|
|
|
|
|
|
|
|
|
|
|
Shareholders’ equity: |
|
|
|
|
|
|
|
|
|
|
|
|
|
|
|
|
|
Accumulated other comprehensive income (loss) |
|
|
— |
|
|
|
— |
|
|
|
— |
|
|
|
— |
|
|
RAIT investment |
|
|
41,790 |
|
|
|
40,962 |
|
|
|
2,885 |
|
|
|
85,637 |
|
|
Retained earnings (deficit) |
|
|
185,979 |
|
|
|
(88,282 |
) |
|
|
(1,199 |
) |
|
|
96,498 |
|
|
Total shareholders’ equity |
|
|
227,769 |
|
|
|
(47,320 |
) |
|
|
1,686 |
|
|
|
182,135 |
|
|
Noncontrolling Interests |
|
|
— |
|
|
|
1,859 |
|
|
|
— |
|
|
|
1,859 |
|
|
Total liabilities and equity |
|
$ |
1,474,198 |
|
|
$ |
206,849 |
|
|
$ |
326,946 |
|
|
$ |
2,007,993 |
|
The assets of the VIEs can only be used to settle obligations of the VIEs and are not available to our creditors. The amounts that eliminate in consolidation include $406,590 of total investments in mortgage loans and $484,065 of indebtedness as of June 30, 2017 and $549,879 of total investments in mortgage loans and $510,244 of indebtedness as of December 31, 2016. We do not have any contractual obligation to provide the VIEs listed above with any financial support. We have not and do not intend to provide financial support to these VIEs that we were not previously contractually required to provide.
NOTE 9: SERIES D PREFERRED SHARES
On October 1, 2012, we entered into a Securities Purchase Agreement, or the purchase agreement, with ARS VI Investor I, LLC, or the investor, an affiliate of Almanac Realty Investors, LLC, or Almanac. During the period from the effective date of the purchase agreement through March 2014, we sold to the investor on a private placement basis in four separate sales between October 2012 and March 2014 for an aggregate purchase price of $100,000, or the total commitment, the following securities were issued: (i) 4,000,000 of our Series D Cumulative Redeemable Preferred Shares of Beneficial Interest, par value $0.01 per share, or the Series D preferred shares, (ii) common share purchase warrants, or the warrants, exercisable for 9,931,000 of our common shares, or the common shares (which have subsequently adjusted to 11,035,875 shares), and (iii) common share appreciation rights, or the investor SARs, with respect to up to 6,735,667 common shares (which have subsequently adjusted to 7,485,045 shares).
39
RAIT Financial Trust
Notes to Consolidated Financial Statements
As of June 30, 2017
(Unaudited and dollars in thousands, except share and per share amounts)
In September 2015, we amended the purchase agreement with Almanac related to the Series D preferred shares. This amendment changed two of the covenants therein. As consideration for this amendment, we paid Almanac $450. We accounted for this amendment as a modification of the Series D preferred shares.
On December 7, 2016, we entered into a securities repurchase agreement with Almanac whereby we agreed to repurchase and cancel 464,000 Series D preferred shares at par for a purchase price of $11,600 which resulted in a decrease from 4,000,000 Series D preferred shares issued and outstanding to 3,536,000 Series D preferred shares issued and outstanding.
On June 22, 2017, we entered into a securities repurchase agreement with Almanac whereby we agreed to repurchase and cancel 402,280 Series D preferred shares at par for a purchase price of $10,057 which resulted in a decrease from 3,536,000 Series D preferred shares issued and outstanding to 3,133,720 Series D preferred shares issued and outstanding.
The warrants and investor SARs had an initial strike price of $6.00 per common share, subject to adjustment. As of the date of the filing of this report, the strike price has adjusted to $5.40.
The warrants and investor SARs were both determined to be classified as liabilities and had a combined fair value of $27,500 as of June 30, 2017. The fair value of the warrants and investor SARs are recorded as a liability and re-measured at each reporting period until the warrants and investor SARs are settled. Changes in fair value will be recorded in earnings as a component of the change in fair value of financial instruments in the consolidated statement of operations.
The following table summarizes the sales activity of the Series D preferred shares from the effective date of the agreement through June 30, 2017:
|
Aggregate purchase price |
|
|
|
|
|
$ |
100,000 |
|
|
Repurchase |
|
|
|
|
|
$ |
(21,657 |
) |
|
Initial value of warrants and investor SARs issued to-date |
|
|
(21,805 |
) |
|
|
|
|
|
Costs incurred |
|
|
(6,834 |
) |
|
|
|
|
|
Total discount |
|
|
|
|
|
|
(28,639 |
) |
|
Discount amortization to-date |
|
|
|
|
|
|
25,950 |
|
|
Carrying amount of Series D preferred shares |
|
|
|
|
|
$ |
75,654 |
|
40
RAIT Financial Trust
Notes to Consolidated Financial Statements
As of June 30, 2017
(Unaudited and dollars in thousands, except share and per share amounts)
Preferred Shares
Dividends:
The following table summarizes the dividends we declared and paid on the preferred shares for the six months ended June 30, 2017:
|
|
|
March 31, 2017 |
|
|
June 30, 2017 |
|
||
|
Series A Preferred Shares |
|
|
|
|
|
|
|
|
|
Date declared |
|
2/15/2017 |
|
|
5/18/2017 |
|
||
|
Record date |
|
3/1/2017 |
|
|
6/1/2017 |
|
||
|
Date paid |
|
3/31/2017 |
|
|
6/30/2017 |
|
||
|
Total dividend amount |
|
$ |
2,589 |
|
|
$ |
2,589 |
|
|
Series B Preferred Shares |
|
|
|
|
|
|
|
|
|
Date declared |
|
2/15/2017 |
|
|
5/18/2017 |
|
||
|
Record date |
|
3/1/2017 |
|
|
6/1/2017 |
|
||
|
Date paid |
|
3/31/2017 |
|
|
6/30/2017 |
|
||
|
Total dividend amount |
|
$ |
1,225 |
|
|
$ |
1,225 |
|
|
Series C Preferred Shares |
|
|
|
|
|
|
|
|
|
Date declared |
|
2/15/2017 |
|
|
5/18/2017 |
|
||
|
Record date |
|
3/1/2017 |
|
|
6/1/2017 |
|
||
|
Date paid |
|
3/31/2017 |
|
|
6/30/2017 |
|
||
|
Total dividend amount |
|
$ |
910 |
|
|
$ |
910 |
|
|
Series D Preferred Shares |
|
|
|
|
|
|
|
|
|
Date declared |
|
2/15/2017 |
|
|
5/18/2017 |
|
||
|
Record date |
|
3/1/2017 |
|
|
6/1/2017 |
|
||
|
Date paid |
|
3/31/2017 |
|
|
6/30/2017 |
|
||
|
Total dividend amount |
|
$ |
1,879 |
|
|
$ |
1,879 |
|
On June 22, 2017, we entered into a securities repurchase agreement whereby we agreed to repurchase and cancel 402,280 Series D preferred shares. The Series D Preferred Shares had a $1,879 total dividend declared on May 18, 2017 with a record date of June 1, 2017 which included a $214 payment on June 23, 2017 and a $1,665 payment on June 30, 2017.
On August 2, 2017, the board of trustees declared a third quarter 2017 cash dividend of $0.484375 per share on RAIT’s 7.75% Series A Cumulative Redeemable Preferred Shares, $0.5234375 per share on RAIT’s 8.375% Series B Cumulative Redeemable Preferred Shares and $0.5546875 per share on RAIT’s 8.875% Series C Cumulative Redeemable Preferred Shares to holders of record as of September 1, 2017. The dividends are payable on October 2, 2017.
At Market Issuance Sales Agreement (ATM):
On June 13, 2014, we entered into an At Market Issuance Sales Agreement, or the 2014 Preferred ATM agreement, with MLV & Co. LLC, or MLV, providing that, from time to time during the term of the 2014 Preferred ATM agreement, on the terms and subject to the conditions set forth therein, we may issue and sell through MLV up to $150,000 aggregate amount of preferred shares.
With respect to each series of preferred shares, the maximum amount issuable is as follows: 4,000,000 Series A Preferred Shares, 1,000,000 Series B Preferred Shares, and 1,000,000 Series C Preferred Shares. Unless the 2014 Preferred ATM agreement is earlier terminated by MLV or us, the 2014 Preferred ATM agreement automatically terminates upon the issuance and sale of all of the Series A Preferred Shares, Series B Preferred Shares, and Series C Preferred Shares.
As of June 30, 2017, 2,724,935 Series A Preferred Shares, 947,496 Series B Preferred Shares, and 999,675 Series C Preferred Shares remain available for issuance under the 2014 Preferred ATM agreement.
41
RAIT Financial Trust
Notes to Consolidated Financial Statements
As of June 30, 2017
(Unaudited and dollars in thousands, except share and per share amounts)
Common Shares
Dividends:
During the three and six months ended June 30, 2017, we paid $26 and $305, respectively, of dividends on restricted common share awards that vested in each respective period.
On May 2, 2017, the board of trustees declared a $0.09 dividend on our common shares to holders of record as of May 26, 2017. The dividend was paid on June 15, 2017 and totaled $8,220.
On August 2, 2017, the board of trustees declared a $0.05 dividend on our common shares to holders of record as of August 25, 2017. The dividend is payable on September 15, 2017.
Equity Compensation:
On January 9, 2017, the compensation committee awarded 344,042 unvested restricted common share awards to one of our executive officers in order to satisfy the remaining portion of the 600,000 awards to be granted to the executive officer under a Binding Memorandum of Understanding dated September 26, 2016, or the MOU, contingent on the closing of the IRT internalization transaction. While a portion of the awards issued with respect to the MOU were granted on December 23, 2016 and this final portion on January 9, 2017, stock compensation expense of $2,068 related to all 600,000 awards was recorded in 2016 since the awards were authorized as of the December 20, 2016 IRT internalization transaction and no future service would be required after the grant date.
On February 14, 2017, the compensation committee awarded 332,500 unvested restricted common share awards, valued at $1,257 using our closing price of $3.78, to our non-executive officer employees. These awards vest over a three-year period.
On February 14, 2017, the compensation committee awarded 832,500 SARs, valued at $574 based on a Black-Scholes option pricing model at the date of grant, to our non-executive officer employees. The SARs vest over a three-year period and may be exercised between the date of vesting and February 14, 2022, the expiration date of the SARs.
On March 31, 2015, the compensation committee adopted a 2015 Annual Incentive Compensation Plan, or the annual cash bonus plan, setting forth the basis on which target cash bonus awards are earned. In addition, on March 31, 2015, the compensation committee adopted a 2015 Long Term Incentive Plan, or the 2015 LTIP, setting forth the basis on which the eligible officers could earn equity compensation that was directly linked to long-term performance. Pursuant to the 2015 LTIP, equity awards to eligible officers will consist of performance share unit (PSU) awards issued at the conclusion of a three year performance period based on RAIT’s performance relative to three long-term performance metrics established by the compensation committee. See Note 13: Share-Based Compensation and Employee Benefits in the 2016 Annual Report on Form 10-K for further details regarding these awards.
On April 26, 2017, the compensation committee made 2017 awards, or the 2017 awards, to the eligible executives pursuant to the annual cash bonus plan and the LTIP. The grant date for three of the eligible executives was April 26, 2017 and the grant date for the other eligible executive was June 22, 2017 for the 2017 awards. The LTIP awards consist of both a performance share unit award for a three year performance period commencing January 1, 2017 and ending December 31, 2019 and an annual restricted share award vesting over a four year period. Two components of the performance share unit award have market conditions and had April 26, 2017 grant date fair values of $1.18 and $0.90 per share and had June 22, 2017 grant date fair values of $0.23 and $0.15 per share.
On June 28, 2017, the compensation committee awarded 186,912 unvested common share awards, valued at $400 using our closing stock price of $2.14, to the board’s non-management trustees. These awards vest on December 31, 2017.
On June 28, 2017, the compensation committee awarded 70,093 common share awards, valued at $150 using our closing stock price of $2.14, to the board’s chairman. One-half of these awards vest immediately and one- half vest on December 31, 2017.
During the three and six months ended June 30, 2017, we recorded $710 and $1,054 of stock compensation expense.
42
RAIT Financial Trust
Notes to Consolidated Financial Statements
As of June 30, 2017
(Unaudited and dollars in thousands, except share and per share amounts)
Dividend Reinvestment and Share Purchase Plan (DRSPP):
We have a dividend reinvestment and share purchase plan, or DRSPP, under which we registered and reserved for issuance, in the aggregate, 10,500,000 common shares. During the six months ended June 30, 2017, we issued a total of 5,742 common shares pursuant to the DRSPP at a weighted-average price of $2.77 per share and we received $16 of net proceeds. As of June 30, 2017, 7,746,737 common shares, in the aggregate, remain available for issuance under the DRSPP.
Capital on Demand™ Sales Agreement (COD):
On November 21, 2012, we entered into a Capital on Demand™ Sales Agreement, or the COD sales agreement, with JonesTrading Institutional Services LLC, or JonesTrading, pursuant to which we may issue and sell up to 10,000,000 of our common shares from time to time through JonesTrading acting as agent and/or principal, subject to the terms and conditions of the COD sales agreement. Unless the COD sales agreement is earlier terminated by JonesTrading or us, the COD sales agreement automatically terminates upon the issuance and sale of all of the common shares subject to the COD sales agreement. During the six months ended June 30, 2017, we did not issue any common shares pursuant to this agreement. As of June 30, 2017, 7,918,919 common shares, in the aggregate, remain available for issuance under the COD sales agreement.
Shareholders’ Equity Attributable to Common Shares:
As of June 30, 2017, $(25,090) of total shareholders’ equity was attributable to common shares.
Non-Controlling Interests
RAIT Venture VIE:
During the six months ended June 30, 2017, the 2016 RAIT Venture VIE, which elected to be taxed as a REIT and that was formed in 2016 to hold the junior subordinated notes of FL-5, issued 125 Series A Preferred Shares at a public offering. The price was $1,000 per share and the 2016 RAIT Venture VIE received $66 of net proceeds. During the three and six months ended June 30, 2017, we paid $8 of dividends on preferred shares. Refer to Note 2: Summary of Significant Accounting Policies, (p) Income Taxes, and Note 5: Indebtedness for further discussion about this entity.
Deconsolidation of South Terrace:
On June 30, 2017, we sold our membership interest in South Terrace, a multifamily real estate property, to a subsidiary of IRT for $42,950 of cash and limited partnership units. The limited partnership units, which had a value of $1,654, were issued to our previous non-controlling interest holders in South Terrace. This transaction resulted in the distribution of $1,618 of our non-controlling interests. Refer to Note 12: Related Party Transactions for further discussion.
43
RAIT Financial Trust
Notes to Consolidated Financial Statements
As of June 30, 2017
(Unaudited and dollars in thousands, except share and per share amounts)
NOTE 11: EARNINGS (LOSS) PER SHARE
The following table presents a reconciliation of basic and diluted earnings (loss) per share for the three and six months ended June 30, 2017 and 2016:
|
|
|
|
|
|
|
|
|
|
|
|
|
|||||
|
|
|
For the Three Months Ended June 30, |
|
|
For the Six Months Ended June 30, |
|
||||||||||
|
|
|
2017 |
|
|
2016 |
|
|
2017 |
|
|
2016 |
|
||||
|
Income (loss) from continuing operations |
|
$ |
(116,884 |
) |
|
$ |
(6,471 |
) |
|
$ |
(138,423 |
) |
|
$ |
(18,459 |
) |
|
(Income) loss allocated to preferred shares |
|
|
(8,817 |
) |
|
|
(8,615 |
) |
|
|
(17,343 |
) |
|
|
(17,135 |
) |
|
(Income) loss allocated to noncontrolling interests |
|
|
(56 |
) |
|
|
971 |
|
|
|
(76 |
) |
|
|
2,116 |
|
|
Income (loss) from continuing operations allocable to common shares |
|
|
(125,757 |
) |
|
|
(14,115 |
) |
|
|
(155,842 |
) |
|
|
(33,478 |
) |
|
Total Income (loss) from discontinued operations |
|
|
— |
|
|
|
32,876 |
|
|
|
— |
|
|
|
34,361 |
|
|
(Income) loss from discontinued operations allocated to noncontrolling interests |
|
|
— |
|
|
|
(26,341 |
) |
|
|
— |
|
|
|
(26,307 |
) |
|
Income (loss) from discontinued operations allocable to common shares |
|
|
— |
|
|
|
6,535 |
|
|
|
— |
|
|
|
8,054 |
|
|
Net income (loss) allocable to common shares |
|
$ |
(125,757 |
) |
|
$ |
(7,580 |
) |
|
$ |
(155,842 |
) |
|
$ |
(25,424 |
) |
|
Weighted-average shares outstanding—Basic |
|
|
91,453,415 |
|
|
|
91,190,583 |
|
|
|
91,377,508 |
|
|
|
91,104,314 |
|
|
Dilutive securities |
|
|
— |
|
|
|
— |
|
|
|
— |
|
|
|
— |
|
|
Weighted-average shares outstanding—Diluted |
|
|
91,453,415 |
|
|
|
91,190,583 |
|
|
|
91,377,508 |
|
|
|
91,104,314 |
|
|
Earnings (loss) per share—Basic: |
|
|
|
|
|
|
|
|
|
|
|
|
|
|
|
|
|
Continuing operations |
|
$ |
(1.38 |
) |
|
$ |
(0.15 |
) |
|
$ |
(1.71 |
) |
|
$ |
(0.37 |
) |
|
Discontinued operations |
|
|
- |
|
|
|
0.07 |
|
|
|
- |
|
|
|
0.09 |
|
|
Earnings (loss) per share—Basic |
|
$ |
(1.38 |
) |
|
$ |
(0.08 |
) |
|
$ |
(1.71 |
) |
|
$ |
(0.28 |
) |
|
Earnings (loss) per share—Diluted: |
|
|
|
|
|
|
|
|
|
|
|
|
|
|
|
|
|
Continuing operations |
|
$ |
(1.38 |
) |
|
$ |
(0.15 |
) |
|
$ |
(1.71 |
) |
|
$ |
(0.37 |
) |
|
Discontinued operations |
|
|
- |
|
|
|
0.07 |
|
|
|
- |
|
|
|
0.09 |
|
|
Earnings (loss) per share—Diluted |
|
$ |
(1.38 |
) |
|
$ |
(0.08 |
) |
|
$ |
(1.71 |
) |
|
$ |
(0.28 |
) |
For the three and six months ended June 30, 2017, securities convertible into 27,290,962 and 27,349,674 common shares, respectively, were excluded from the earnings (loss) per share computations because their effect would have been anti-dilutive. For the three and six months ended June 30, 2016, securities convertible into 27,107,825 and 26,876,003 common shares, respectively, were excluded from the earnings (loss) per share computations because their effect would have been anti-dilutive.
NOTE 12: RELATED PARTY TRANSACTIONS
In the ordinary course of our business operations, we have ongoing relationships and have engaged in transactions with the related entities described below. All of these relationships and transactions were approved or ratified by our audit committee as being on terms comparable to those available from an unaffiliated third party or otherwise not creating a conflict of interest.
Almanac
Andrew M. Silberstein serves as a trustee on our board of trustees, as designated pursuant to the purchase agreement. Mr. Silberstein is an equity owner of Almanac and an officer of the investor and holds indirect equity interests in the investor. The transactions pursuant to the purchase agreement are described above in Note 9: Series D Preferred Shares.
Ballard Spahr LLP
As of June 27, 2017, Justin P. Klein has been appointed as a trustee on our board of trustees. Mr. Klein is a partner at Ballard Spahr LLP. RAIT has paid Ballard Spahr LLP $119 during the six months ended June 30, 2017 and $17 during the six months ended
44
RAIT Financial Trust
Notes to Consolidated Financial Statements
As of June 30, 2017
(Unaudited and dollars in thousands, except share and per share amounts)
June 30, 2016. The approximate dollar value of Mr. Klein’s interest in these fees was $1 for 2017 and $1 for 2016, based on Mr. Klein’s Ballard Spahr LLP partnership interest.
Highland Capital Management, L.P.
On May 26, 2017, RAIT entered into a cooperation agreement with Highland Capital Management, L.P. and its affiliates (Highland). Pursuant to the cooperation agreement with Highland, Highland, among other things, agreed to terminate its proxy contest against us and withdraw the notice of proposed trustee candidates it submitted to us and we agreed to reimburse Highland $250 for the out-of-pocket expenses incurred by Highland in connection with its activist campaign against us and its unsolicited and nonbinding externalization of management proposal.
IRT
As described in Note 16: Discontinued Operations, we deconsolidated IRT as of October 5, 2016. RAIT’s relationships with IRT are discussed below.
Fees and Expenses Received as IRT’s Former External Advisor
On December 20, 2016, in connection with IRT’s management internalization, we sold IRT’s Advisor and, therefore, these fees and expenses are no longer earned.
On September 25, 2015, we entered into the Second Amendment to the Second Amended and Restated Advisory Agreement. The Second Amendment amended the advisory agreement to extend its term to October 1, 2020, and to provide for compensation to us for periods subsequent to October 1, 2015, as follows:
|
|
• |
Quarterly base management fee of 0.375% of IRT’s cumulative equity raised; and |
|
|
• |
Quarterly incentive fee equal to 20% of IRT’s core funds from operations, or Core FFO, as defined in the advisory agreement, in excess of $0.20 per share. |
For the three and six months ended June 30, 2016, we earned $1,784 and $3,415 of asset management fees and $64 and $144 of incentive fees, which were eliminated in consolidation. As of June 30, 2017 and December 31, 2016, we had no amounts due from IRT related to the advisory agreement.
Property Management Fees Paid to Our Property Manager
On December 20, 2016, in connection with our management internalization, we sold our multifamily property management business to IRT, which included all of the property management agreements for IRT’s properties.
We had entered into property management agreements with IRT with respect to each of IRT’s properties. Pursuant to these property management agreements, IRT paid our multifamily property manager property management and construction management fees on a monthly basis up to 4.0% of the gross revenues from a property for each month. For the three and six months ended June 30, 2016, we earned $1,229 and $2,491 of property management and construction management fees, which were eliminated in consolidation. As of June 30, 2017 and December 31, 2016, we had no amounts due from IRT related to these property management agreements.
IRT Dividends and IRT Repurchase of its Common Stock
On October 5, 2016, we sold all 7,269,719 shares of IRT’s common stock that we owned to IRT.
For the three and six months ended June 30, 2016, we earned and subsequently received dividends of $1,308, and $2,617, respectively, which were eliminated in consolidation. As of June 30, 2017 and December 31, 2016, we had no amounts due from IRT related to our previous ownership of shares of IRT’s common stock.
45
RAIT Financial Trust
Notes to Consolidated Financial Statements
As of June 30, 2017
(Unaudited and dollars in thousands, except share and per share amounts)
Indebtedness
During the three and six months ended June 30, 2016, we earned $486 of interest from IRT related to $38,075 of mortgage indebtedness held by us. As of June 30, 2017 and December 31, 2016, we had no amounts due from IRT related to this mortgage indebtedness.
Other Transactions with IRT
On June 30, 2017, we sold South Terrace, a multifamily property, to IRT for $42,950. The sales price was supported by a recent appraisal provided by a third party commercial real estate information services firm. RAIT recognized a gain of $9,189 on the sale.
During the three months ended June 30, 2017, the joint shared services agreement between RAIT and IRT has ended. Pursuant to that shared services agreement, IRT reimbursed RAIT $340 and $727 for general and administrative services for the three and six months ended June 30, 2017, respectively. In addition, during the six months ended June 30, 2017, IRT reimbursed RAIT for $155 of general and administrative expenses that were paid on IRT’s behalf.
Pursuant to property management agreements with IRT with respect to RAIT’s multifamily properties, RAIT paid IRT $75 and $212 of property management fees for the three and six months ended June 30, 2017, respectively. This is reflected within real estate operating expense in our consolidated statements of operations.
Other
On December 20, 2016, Scott F. Schaeffer resigned from his position as Chief Executive Officer of RAIT and became the full-time Chief Executive Officer of IRT. On the same date, Scott F. Schaeffer entered into a one year consulting agreement with RAIT for which he will receive compensation of $375. For the three and six months ended June 30, 2017, $94 and $188, respectively, was earned and paid related to this consulting agreement, which is reflected in general and administrative expenses in our consolidated statements of operations. In accordance with the Memorandum of Understanding dated September 26, 2016, which memorialized the terms of Scott F. Schaeffer’s resignation, RAIT granted Scott F. Schaeffer 150,000 unvested shares of common stock on December 23, 2016, and made a $500 cash payment in January 2017. The shares vest 50% on the six month anniversary and 50% on the one year anniversary of the grant date.
In accordance with the Memorandum of Understanding dated September 26, 2016, which memorialized the terms of James J. Sebra’s resignation, he was owed a cash bonus, payable in 2017, equal to 25% of his cash bonus for the year ended December 31, 2016. During the three months ended June 30, 2017, this bonus of $110 was paid.
46
RAIT Financial Trust
Notes to Consolidated Financial Statements
As of June 30, 2017
(Unaudited and dollars in thousands, except share and per share amounts)
NOTE 13: SUPPLEMENTAL DISCLOSURE TO STATEMENT OF CASH FLOWS
The following are supplemental disclosures to the statements of cash flows for the six months ended June 30, 2017 and 2016:
|
|
|
For the Six Months Ended June 30, |
|
|||||
|
|
|
2017 |
|
|
2016 |
|
||
|
Cash paid for interest |
|
$ |
31,498 |
|
|
$ |
50,639 |
|
|
Cash paid for taxes |
|
|
203 |
|
|
|
199 |
|
|
Non-cash increase in investments in real estate, intangible assets, and other liabilities from conversion of loans |
|
|
1,590 |
|
|
|
1,499 |
|
|
Non-cash (decrease) in investments in real estate, restricted cash, other assets, intangible assets, accounts payable and accrued expenses, and other liabilities from deconsolidation of properties |
|
|
(43,025 |
) |
|
|
— |
|
|
Non-cash increase (decrease) in indebtedness from debt extinguishments |
|
|
(3,813 |
) |
|
|
— |
|
|
Non-cash increase (decrease) to noncontrolling interests from distribution of limited partnership units on South Terrace |
|
|
(1,618 |
) |
|
|
— |
|
|
Non-cash increase (decrease) in indebtedness from deconsolidation of properties |
|
|
(27,467 |
) |
|
|
— |
|
For a discussion of the non-cash changes in indebtedness and investments in real estate, restricted cash, other assets, intangible assets, accounts payable and accrued expenses, and other liabilities that occurred during the six months ended June 30, 2017, see Note 4: Investments in Real Estate and Note 5: Indebtedness.
NOTE 14: SEGMENT REPORTING
As a group, our executive officers act as the Chief Operating Decision Maker (“CODM”). The CODM reviews operating results of our reportable segments to make decisions about investments and resources and to assess performance for each of these reportable segments.
Historically, we have conducted our business through the following reportable segments:
|
|
• |
Our real estate lending, owning and managing segment concentrates on lending, owning and managing commercial real estate assets throughout the United States. The form of our investment may range from first mortgage loans to equity ownership of a commercial real estate property. We manage our investments internally through our asset management and property management professionals. |
|
|
• |
Prior to the deconsolidation of IRT in October 2016, our IRT segment concentrated on the ownership of apartment properties in opportunistic markets throughout the United States. |
As discussed in Note 16: Discontinued Operations, IRT is a discontinued operation. As a result, we only have one reportable segment that relates to our continuing operations.
NOTE 15: COMMITMENTS AND CONTINGENCIES
We are involved from time to time in litigation on various matters, including disputes with tenants of owned properties, disputes arising out of agreements to purchase or sell properties, disputes arising out of our loan portfolio, negligence, and similar tort claims related to owned properties or employment related disputes. Given the nature of our business activities, these lawsuits are considered routine to the conduct of our business. The result of any particular lawsuit cannot be predicted, because of the very nature of litigation, the litigation process and its adversarial nature, and the jury system. We do not expect that the liabilities, if any, that may ultimately result from such routine legal actions will have a material adverse effect on our consolidated financial position, results of operations or cash flows, but there is no assurance that such material adverse effect will not occur.
During the six months ended June 30, 2017, we settled a matter with a former employee for $175.
47
RAIT Financial Trust
Notes to Consolidated Financial Statements
As of June 30, 2017
(Unaudited and dollars in thousands, except share and per share amounts)
NOTE 16: DISCONTINUED OPERATIONS
As discussed in Note 1: The Company; on December 20, 2016, we completed the management internalization of one of our previously consolidated variable interest entities, IRT, pursuant to the IRT internalization agreement. The IRT management internalization consisted of two parts: (i) the sale of the IRT advisor, which was our subsidiary and IRT’s external advisor, and (ii) the sale of certain assets and the assumption of certain liabilities relating to our multifamily property management business which we referred to as RAIT Residential, including property management contracts relating to apartment properties owned by us, IRT, and third parties. The purchase price paid by IRT for the IRT management internalization was $43,000, subject to certain pro rations at closing. As part of the same agreement, we sold all of the 7,269,719 shares of IRT’s common stock owned by certain of our subsidiaries on October 5, 2016.
As the IRT internalization agreement resulted in our disposal of our investment in IRT, our advisory agreement with IRT and our multifamily property management business as well as a strategic shift in our operations and financial results, we concluded that these entities or distinguishable components of RAIT should be reported as discontinued operations as of September 30, 2016. As discussed in Note 14: Segment Reporting, IRT was part of our IRT segment. The IRT advisor and our multifamily property management business were part of our real estate lending, owning and managing segment.
Provided below are the statements of operations and summarized cash flow statement classified as discontinued operations. A balance sheet will not be included as there were no discontinued operations presented as of the balance sheet dates.
The table below presents the statements of operations of these entities or distinguishable components of RAIT that are discontinued operations for the three and six months ended June 30, 2017 and 2016:
|
|
|
For the Three Months Ended June 30, |
|
|
For the Six Months Ended June 30, |
|
||||||||||
|
|
|
2017 |
|
|
2016 |
|
|
2017 |
|
|
2016 |
|
||||
|
Revenue: |
|
|
|
|
|
|
|
|
|
|
|
|
|
|
|
|
|
Property income |
|
$ |
— |
|
|
$ |
38,233 |
|
|
$ |
— |
|
|
$ |
76,900 |
|
|
Fee and other income |
|
|
— |
|
|
|
861 |
|
|
|
— |
|
|
|
1,599 |
|
|
Total revenue |
|
|
— |
|
|
|
39,094 |
|
|
|
— |
|
|
|
78,499 |
|
|
Expenses: |
|
|
|
|
|
|
|
|
|
|
|
|
|
|
|
|
|
Interest expense |
|
|
— |
|
|
|
8,923 |
|
|
|
— |
|
|
|
18,635 |
|
|
Real estate operating expense |
|
|
— |
|
|
|
15,623 |
|
|
|
— |
|
|
|
31,481 |
|
|
Compensation expense |
|
|
— |
|
|
|
2,002 |
|
|
|
— |
|
|
|
3,875 |
|
|
General and administrative expense |
|
|
— |
|
|
|
1,092 |
|
|
|
— |
|
|
|
2,350 |
|
|
Acquisition expense |
|
|
— |
|
|
|
159 |
|
|
|
— |
|
|
|
319 |
|
|
Depreciation and amortization expense |
|
|
— |
|
|
|
7,672 |
|
|
|
— |
|
|
|
19,275 |
|
|
Total expenses |
|
|
— |
|
|
|
35,471 |
|
|
|
— |
|
|
|
75,935 |
|
|
Operating (Loss) Income |
|
|
— |
|
|
|
3,623 |
|
|
|
— |
|
|
|
2,564 |
|
|
Interest and other income (expense), net |
|
|
— |
|
|
|
— |
|
|
|
— |
|
|
|
— |
|
|
Gains (losses) on assets |
|
|
— |
|
|
|
29,811 |
|
|
|
— |
|
|
|
32,264 |
|
|
Gain (loss) on IRT merger with TSRE |
|
|
— |
|
|
|
— |
|
|
|
— |
|
|
|
91 |
|
|
TSRE financing extinguishment and employee separation expenses |
|
|
— |
|
|
|
— |
|
|
|
— |
|
|
|
— |
|
|
Gains (losses) on extinguishments of debt |
|
|
— |
|
|
|
(558 |
) |
|
|
— |
|
|
|
(558 |
) |
|
Net income (loss) from discontinued operations |
|
$ |
— |
|
|
$ |
32,876 |
|
|
$ |
— |
|
|
$ |
34,361 |
|
48
RAIT Financial Trust
Notes to Consolidated Financial Statements
As of June 30, 2017
(Unaudited and dollars in thousands, except share and per share amounts)
The table below summarizes the cash flows provided by operating, financing and investing activities of these entities or distinguishable components of RAIT that are discontinued operations for the six months ended June 30, 2017 and 2016:
|
|
|
For the Six Months Ended June 30, |
|
|||||
|
|
|
2017 |
|
|
2016 |
|
||
|
Cash flow from operating activities from discontinued operations |
|
$ |
— |
|
|
$ |
18,951 |
|
|
Cash flow from investing activities from discontinued operations |
|
|
— |
|
|
|
32,987 |
|
|
Cash flow from financing activities from discontinued operations |
|
|
— |
|
|
|
(62,084 |
) |
|
Net change in cash and cash equivalents from discontinued operations |
|
|
— |
|
|
|
(10,146 |
) |
|
Cash and cash equivalents at beginning of period - discontinued operations |
|
|
— |
|
|
|
38,305 |
|
|
Cash and cash equivalents at end of period - discontinued operations |
|
$ |
— |
|
|
$ |
28,159 |
|
NOTE 17: SUBSEQUENT EVENTS
We have evaluated subsequent events or transactions that have occurred after the consolidated balance sheet date of June 30, 2017, but prior to the filing of the consolidated financial statements with the SEC on this Quarterly Report on Form 10-Q. We have determined that, except as disclosed within this Note and other Notes, there are no subsequent events that require disclosure in this Quarterly Report on Form 10-Q.
49
Forward-Looking Statements
In addition to historical information, this discussion and analysis contains forward-looking statements. These statements can be identified by the use of forward-looking terminology including “may,” “believe,” “expect,” “anticipate,” “estimate,” “seek,” “target”, “continue” or similar words of a future or forward-looking nature. Our forward-looking statements include, but are not limited to, statements regarding RAIT’s plans, initiatives and expectations to (i) simplify its business model, (ii) focus on its core commercial real estate lending business, (iii) increase loan origination levels, when compared to 2016, as capital from non-lending related asset sales is re-deployed, (iv) deleverage by using cash generated by asset sales to repay debt, (v) divest RAIT’s legacy REO portfolio and existing property management operations and, ultimately, minimize REO holdings, (vi) significantly reduce its total expense base, (vii) continue to sell non-lending assets, (viii) enhance its long-term prospects and create value for its shareholders, (ix) whether and when RAIT will be able to recognize a gain, which will offset the non-cash loss on deconsolidation of properties reported for the six months ended June 30, 2017, and (x) consider additional strategies to support further growth in RAIT’s lending business, create a more durable balance sheet and enhance long-term shareholder value. Such forward-looking statements are based upon RAIT’s historical performance and its current plans, estimates, predictions and expectations and are not a representation that such plans, estimates, predictions or expectations will be achieved. Because such statements include risks, uncertainties and contingencies, actual results may differ materially from the expectations, intentions, beliefs, plans or predictions of the future expressed or implied by such forward-looking statements.
These forward-looking statements are subject to risks and uncertainties that could cause actual results to differ materially from those projected in the forward-looking statements. These risks and uncertainties include, without limitation, (i) whether RAIT will be able to continue to implement its strategy to transition RAIT to a more lender focused, simpler, and more cost-efficient business model, to deleverage and to generate enhanced returns for its shareholders; (ii) whether RAIT will be able to continue to divest RAIT’s legacy REO portfolio and existing property management operations and the majority of RAIT’s non-lending assets; (iii) whether anticipated cost savings from the internalization of IRT will be achieved; (iv) whether the divestiture of RAIT’s commercial real estate portfolio and other non-lending assets will lead to lower asset management costs and lower expenses; (v) whether RAIT will continue to be able to further reduce compensation and G&A expenses and indebtedness, including whether RAIT will be able to meet its 2017 targeted annual compensation and G&A expense goal of $25.0 million; (vi) whether RAIT’s changes to its Board composition and leadership and to its executive management team will lead to enhanced value for shareholders; (vii) whether RAIT will be able to create sustainable earnings and grow book value; (viii) whether RAIT will be able to successfully redeploy capital from non-lending related asset sales; (ix) whether RAIT will be able to increase loan origination levels or continue to gain access to warehouse lending facilities; (x) whether the disposition of non-core assets, reductions in debt levels and expected loan repayments will impact RAIT’s earnings and CAD; (xi) whether RAIT will continue to pay dividends and the amount of such dividends; (xii) whether RAIT will be able to organically increase reliance on match-funded asset-level debt; (xiii) overall conditions in commercial real estate and the economy generally; (xiv) whether market conditions will enable us to continue to implement our capital recycling and debt reduction plan involving selling properties and repurchasing or paying down our debt; (xv) whether we will be able to originate sufficient bridge loans; (xvi) changes in the expected yield of our investments; (xvii) changes in financial markets and interest rates, or to the business or financial condition of RAIT or its business; (xviii) whether RAIT will generate any CMBS gain on sale profits; (xix) whether RAIT will experience any first dollar losses on its retained interests in its securitizations; (xx) whether our management changes will be successfully implemented; (xxi) whether RAIT will be able to aggregate sufficient loans or whether market conditions will permit RAIT to complete future securitizations of floating rate loans; (xxii) whether and when RAIT will be able to recognize a gain, which will offset the non-cash loss on deconsolidation of properties reported for the six months ended June 30, 2017; (xxiii) whether RAIT will have any legal obligations on the non-recourse debt on its industrial real estate portfolio; (xxiv) the availability of financing and capital, including through the capital and securitization markets; (xxv) whether RAIT will need to recognize further impairment charges in future quarters and the effect of such charges on RAIT’s future operations, liquidity, cash flows from operating activities, or compliance with the financial covenants set forth in its debt instruments; and (xxvi) other factors described in RAIT’s Annual Report on Form 10-K, Quarterly Reports on Form 10-Q and other filings with the SEC. Readers are cautioned not to place undue reliance on these forward-looking statements, which reflect management’s analysis only as of the date hereof. We undertake no obligation to publicly revise or update these forward-looking statements to reflect events or circumstances that arise after the date of this report, except as may be required by applicable law.
Overview
We are an internally-managed Maryland real estate investment trust, or REIT, focused on providing commercial real estate financing throughout the United States. As explained below, we plan to continue to divest our non-lending businesses and assets, however, presently, we also own and manage a portfolio of commercial real estate properties and manage real estate assets for third parties.
50
During the six months ended June 30, 2017, we continued making progress transforming into a pure play commercial real estate lender. This previously announced strategy of transforming RAIT into a more focused, cost-efficient and lower leverage business began in 2016 and RAIT expects to continue to make further progress executing on its strategic transformation throughout 2017. Our transformational strategy remains focused on:
|
|
• |
concentrating RAIT’s business on our core middle-market CRE lending business; |
|
|
• |
divesting our legacy real estate owned, or REO, portfolio and ultimately minimizing our REO holdings; |
|
|
• |
divesting our commercial property management operations, including our Urban Retail property management business; |
|
|
• |
moving toward a more optimal capital structure and reducing our outstanding indebtedness; |
|
|
• |
reducing our total expense base; and |
|
|
• |
most importantly, reallocating capital into and growing our core middle market CRE lending activities. |
Our transition is ongoing and, once completed, is expected to result in a simpler, more cost efficient and lower leveraged business model that is focused on the core CRE business. We believe that we will be able to enhance shareholder value by delivering stable and repeatable risk-adjusted returns. We expect to accomplish that with a significantly lower expense base that matches our lending focused strategy with an appropriate capital structure and lower levels of debt.
We believe we made progress executing our strategy to return to our focus on CRE lending as follows:
|
|
• |
Commercial Real Estate (“CRE”) Lending Business |
|
|
o |
We originated $154.7 million of senior CRE loans during the quarter ended June 30, 2017, which represents a 567% increase from the $23.2 million in loans originated during the quarter ended June 30, 2016. |
|
|
o |
We originated $274.7 million of loans during the six-month period ended June 30, 2017, which represents a 331% increase from the $63.7 million in loans originated during the six-month period ended June 30, 2016, and surpasses total loan originations for all of 2016, which totaled $156.8 million. |
|
|
• |
CRE Property Portfolio and Property Sales |
|
|
o |
We sold 4 properties that generated gross proceeds of $73.2 million and $10.8 million in GAAP gains during the quarter ended June 30, 2017. |
|
|
o |
Since January 1, 2017, we have divested $211.5 million of our properties and reduced $173.6 million of our related indebtedness. |
|
|
o |
From January 1, 2016 through June 30, 2017, we have divested $549.4 million of our properties and reduced $469.5 million of our related indebtedness. |
|
|
• |
Reductions in Compensation & General and Administrative (“G&A”) Expense |
|
|
o |
We are currently on track to meet our 2017 targeted annual compensation and G&A expense goal of $25.0 million which would represent a 21% decline over 2016. |
|
|
o |
Our compensation and G&A expense declined by 18% for the quarter ended June 30, 2017 compared to the quarter ended June 30, 2016, and 14% for the six-months ended June 30, 2017 compared to the six months ended June 30, 2016. The decline in compensation and G&A expense is primarily due to a decrease in the number of employees and a decrease across multiple types of general and administrative expenses as part of our strategic transformation and transition to a simpler and more cost-efficient business model. |
|
|
• |
Debt Reductions |
|
|
o |
Total recourse debt, excluding our secured warehouse facilities, based on principal amount, declined by $14.5 million, or 4.4%, during the quarter ended June 30, 2017 and $103.2 million, or 24.7%, from January 1, 2016 through June 30, 2017. |
|
|
o |
We have no remaining recourse debt maturities in 2017. |
51
During the three months ended June 30, 2017, we generated GAAP net income (loss) allocable to common shares of $(125.8) million, or $(1.38) per common share-diluted, which was primarily caused by non-cash asset impairment charges and a provision for loan losses on legacy CRE loans. We incurred non-cash asset impairment charges of $85.8 million, which was primarily related to certain legacy properties where we changed our investment approach to these properties that led to an expectation that the properties would be disposed of prior to the end of their useful life. We also incurred a provision for loan losses of $20.9 million, which was primarily driven by five loans where the borrower and/or property experienced an unfavorable event or events during the period and goodwill impairment of $8.4 million related to our retail property manager, which was driven by the current challenges facing the retail property sector. During the three months ended June 30, 2016, we generated GAAP net income (loss) allocable to common shares of $(7.6) million, or $(0.08) per common share-diluted.
During the three months ended June 30, 2017, our cash available for distribution, or CAD, decreased to $(3.8) million, or $(0.04) per common share, which includes the non-cash effect of a $3.6 million write-off of accrued interest receivable related to a loan that was determined to be impaired during the period. CAD would have been $(0.1) million or $0.00 per share without this non-cash write-off. For the three months ended June 30, 2016, our CAD was $10.5 million, or $0.12 per common share. CAD is a non-GAAP financial measure. For management’s respective definitions and discussion of the usefulness of CAD to investors, analysts and management and a reconciliation of our reported net income (loss) to our CAD, see Part I, Item 2, “Management’s Discussion and Analysis of Financial Condition and Results of Operations-Non-GAAP Financial Measures.”
Trends That May Affect our Business
Investors should read Management’s Discussion and Analysis of Financial Condition and Results of Operations in our Annual Report on Form 10-K for the fiscal year ended December 31, 2016, or the Annual Report, for a detailed discussion of the following items:
|
|
• |
Trends relating to capital markets. |
|
|
• |
Trends relating to CRE debt market maturities. |
|
|
• |
Trends relating to originating and financing conduit loans and bridge loans. |
|
|
• |
Trends relating to investments in real estate. |
|
|
• |
Interest rate environment. |
|
|
• |
Prepayment rates. |
|
|
• |
Transitional impact of strategy. |
CRE Lending
We originate and own senior long-term conduit mortgage loans, short-term bridge loans, subordinated, or “mezzanine,” financing and preferred equity interests. These assets are in most cases “non-recourse” or limited recourse loans secured by commercial real estate assets or real estate entities. This means that we look primarily to the assets securing the loan for repayment, subject to certain standard exceptions. We originate loans that are eligible to be sold to securitizations issuing CMBS, which we refer to as conduit loans. We may from time to time acquire existing commercial real estate loans from third parties who have originated such loans, including banks, other institutional lenders or third-party investors. Where possible, we seek to maintain direct lending relationships with borrowers, as opposed to investing in loans controlled by third party lenders.
During the six months ended June 30, 2017, we originated $274.7 million of CRE loans and received CRE loan repayments of $274.6 million. The tables below describe certain characteristics of our commercial mortgage loans, mezzanine loans, and preferred equity interests as of June 30, 2017 (dollars in thousands):
|
|
|
Carrying Value |
|
|
Weighted- Average Coupon |
|
|
Range of Maturities |
|
Number of Loans |
|
|||
|
Commercial Real Estate (CRE) Loans |
|
|
|
|
|
|
|
|
|
|
|
|
|
|
|
Commercial mortgages |
|
$ |
1,157,675 |
|
|
|
6.0% |
|
|
Jun. 2017 to Dec. 2025 |
|
|
94 |
|
|
Mezzanine loans |
|
|
72,465 |
|
|
|
10.0% |
|
|
Apr. 2017 to May 2025 |
|
|
18 |
|
|
Preferred equity interests |
|
|
40,328 |
|
|
|
8.7% |
|
|
Nov. 2018 to Jan. 2029 |
|
|
17 |
|
|
Total investments in loans |
|
$ |
1,270,468 |
|
|
|
6.4% |
|
|
|
|
|
129 |
|
Certain of our commercial mortgage loans, mezzanine loans and preferred equity interests provide for the accrual of interest at specified rates that differ from current payment terms. We refer to these loans as cash flow loans, the vast majority of which were originated prior to 2011. Although a cash flow loan accrues interest at a stated rate, pursuant to forbearance or other agreements, the borrower is only required to pay interest each month at a minimum rate plus additional interest up to the stated rate to the extent of all cash flow from the property underlying the loan after the payment of property operating expenses. Please see Part I, Item 1,
52
“Financial Statements —Note 2: Summary of Significant Accounting Policies—Revenue Recognition” for further information on these loans. As of June 30, 2017, we held investments we characterized as cash flow loans, with a recorded investment (including accrued interest) of $178.6 million comprised of preferred equity interests totaling $50.8 million, bridge loans totaling $96.8 million and mezzanine loans totaling $31.0 million. Of these cash flow loans, $171.8 million were originated prior to 2011 and $6.8 million were originated in 2013.
As of June 30, 2017, our nonaccrual loans total $122.1 million and represent nine loans originated prior to 2008, up from $121.0 million as of December 31, 2016. We remain focused on working with our borrowers on these loans to either sell or refinance the underlying properties as expeditiously as possible. As of June 30, 2017, we had a loan loss reserve of $23.5 million, representing 19.3% of our nonaccrual loans and 1.8% of our total CRE loan portfolio. As of December 31, 2016, our loan loss reserve was $12.4 million, which represented 10.2% of our nonaccrual loans and 1.0% of our total CRE loan portfolio. During the three and six months ended June 30, 2017, we recognized provision for loan losses of $20.9 million and $22.4 million, which was related to our legacy CRE loans. Our provision for loan losses during the three months ended June 30, 2017 was primarily driven by five loans where the borrower and/or property experienced an unfavorable event or events during the period.
We finance our consolidated CRE loans on a long-term basis through securitizations. See Part I, Item 2, “Management’s Discussion and Analysis of Financial Condition and Results of Operations—Securitization Summary” for more information about our securitizations.
The charts below describe the property types and the geographic breakdown of our commercial mortgage loans, mezzanine loans, other loans, and preferred equity interests as of June 30, 2017:
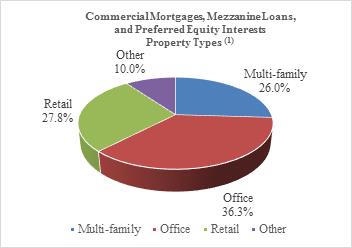

|
(1) |
Based on carrying amount. |
53
REO Portfolio
As described above, we continue to execute on our strategy of divesting our legacy REO portfolio and ultimately minimizing our REO holdings over time. During the six months ended June 30, 2017, we sold ten properties for $168.1 million which generated a $19.6 million GAAP gain. The proceeds from the sales were used to reduce debt, and the sales generated $13.4 million of net proceeds to us. We are expecting to dispose of additional REO properties with an aggregate gross cost (carrying value), as of June 30, 2017, of approximately $372.8 million ($355.0 million) during the remainder of 2017 and 2018. As of June 30, 2017, our real estate portfolio consisted of an aggregate gross cost (carrying value) of $470.2 million ($434.9 million), comprised of $232.8 million ($213.9 million) of office properties, $24.9 million ($19.3 million) of multifamily properties, $128.9 million ($120.7 million) of retail properties, $48.4 million ($45.8 million) of industrial properties, and $35.2 million ($35.2 million) of land.
During the three and six months ended June 30, 2017, we recognized non-cash impairment charges related to certain real estate assets of $81.4 million and $88.9 million, respectively, as it was more likely than not we would dispose of the assets before the end of their previously estimated useful lives and a portion of our recorded investment in these assets was determined to not be recoverable.
During the three months ended June 30, 2017, we changed our investment approach on six of our real estate properties. These decisions to change our investment approach led to an expectation that the properties would be disposed of prior to the end of their useful life, which was concluded to be a triggering event requiring further analysis of the recoverability of these properties. As a result of the analysis performed, the aggregate carrying value of these properties of $172.2 million was determined not to be fully recoverable, resulting in non-cash impairment charges totaling $74.5 million as further described below. Subsequent to these impairments, these properties had an aggregate carrying value of $97.7 million.
Four of the properties noted above, consisting of an office property and a retail property in the Central region, and a retail property and a land parcel in the Southeast region, were previously in various stages of redevelopment with an aggregate carrying value of $102.1 million. During the quarter ended June 30, 2017, a decision was made to cease redevelopment efforts and market the properties for sale in their existing condition. The analysis performed, which included obtaining a broker opinion of value for each of the Central region properties and performing a discounted cash flow analysis for each of the Southeast region properties using market-based assumptions, resulted in non-cash impairment charges of $50.3 million.
For one office property in the Central region, which was previously planned to be held for use and currently not stabilized, a sales process was pursued for the property in its current condition. Based upon various offers that have been received to purchase the property, the carrying value of $39.2 million was determined to not be fully recoverable, resulting in a non-cash impairment charge of $17.4 million.
Additionally, it was determined it was more likely than not that we would dispose of one retail property in the Mid-Atlantic region with a carrying value of $30.9 million, which was being held for investment, in the foreseeable future. The analysis performed, which included performing a discounted cash flow analysis using market-based assumptions, resulted in a non-cash impairment charge of $6.8 million.
During the three months ended June 30, 2017, we also continued execution on plans to market certain assets that had been identified for disposal in previous periods. The remaining $6.9 million of non-cash impairment charges during the three months ended June 30, 2017 related to six of these other real estate assets, including one multifamily property, four office properties, and one land parcel and was recognized as a result of updated information obtained based upon purchase and sale agreements, letters of intent and broker opinions of value as these assets have progressed through different stages of the marketing and sales negotiation process.
During the six months ended June 30, 2017, we recognized an additional $7.4 million of non-cash impairment charges related to four assets that had been identified for disposal in previous periods, including three office properties and one land parcel, and was recognized as a result of updated information obtained based upon purchase and sale agreements and letters of intent as these assets progressed through different stages of the marketing and sales negotiation process.
We are continuing to market for sale a majority of our real estate properties and the ultimate outcomes of the sales of those properties is dependent on current market conditions and demand specific to each individual property. As we identify properties for disposition, our decision to no longer hold them for investment may result in future non-cash impairment charges.
We have financed our portfolio of investments in commercial real estate through secured mortgages held by either third-party lenders or our commercial real estate securitizations.
54
During the six months ended June 30, 2017, we recognized a non-cash loss on deconsolidation totaling $15.9 million due to being divested of five properties relating to an industrial real estate portfolio that we owned. At December 31, 2016, this portfolio contained ten properties with a carrying value of $82.5 million and $81.9 million of related cross-collateralized non-recourse debt. In future periods as the lender of this debt divests the remaining assets in this portfolio, we expect to recognize a gain that will offset this loss. We do not believe we will have any further legal obligations under the non-recourse debt secured by this entire portfolio once these divestitures are completed. We became the owner of the portfolio in 2015 as a result of exercising our remedies under an $11.0 million subordinated mezzanine loan acquired in 2006. In 2016, we determined that this portfolio was not consistent with our new strategic direction and took a $10.0 million non-cash asset impairment charge against this portfolio. During the six months ended June 30, 2017, five of the properties from this industrial portfolio were divested through auction processes organized by the senior lender. These five properties had a carrying value of $43.4 million. Upon divestment of these properties, we derecognized these net assets and extinguished related debt of $27.5 million based on the proceeds received by the senior lender at the auctions. The difference between these amounts resulted in the non-cash loss described above. The remaining five industrial properties have a carrying value of $38.5 million and $54.5 million of related non-recourse debt at June 30, 2017. In August of 2017, the senior lender foreclosed on the mortgage lien encumbering one more of these remaining five industrial properties that had an aggregate carrying value of $5.1 million. As a result, the senior lender or its assignee/designee now owns this property, subject to any redemption rights that we have under applicable state law, if any. The senior lender is in process of foreclosing on the remaining four properties and we cannot predict the timing of when these dispositions will occur and their related impact to our consolidated financial statements.
The table below describes certain characteristics of our REO Portfolio as of June 30, 2017 (dollars in thousands). We invest in real estate properties, primarily multifamily properties, throughout the United States.
|
|
|
Investments in Real Estate (1) |
|
|
Average Physical Occupancy |
|
|
Units/ Square Feet/ Acres |
|
|
Number of Properties |
|
||||
|
Multifamily real estate properties |
|
$ |
24,925 |
|
|
|
92.9% |
|
|
|
364 |
|
|
|
2 |
|
|
Office real estate properties |
|
|
232,858 |
|
|
|
66.4% |
|
|
|
2,470,278 |
|
|
|
11 |
|
|
Industrial real estate properties |
|
|
48,374 |
|
|
|
77.1% |
|
|
|
1,009,586 |
|
|
|
7 |
|
|
Retail real estate properties |
|
|
128,939 |
|
|
|
66.3% |
|
|
|
2,023,455 |
|
|
|
8 |
|
|
Parcels of land |
|
|
35,153 |
|
|
N/A |
|
|
|
12.7 |
|
|
|
6 |
|
|
|
Total |
|
$ |
470,249 |
|
|
|
— |
|
|
|
|
|
|
|
34 |
|
|
|
(1) |
Based on properties owned as of June 30, 2017. |
The charts below describe the property types and the geographic breakdown of our investments in real estate as of June 30, 2017:
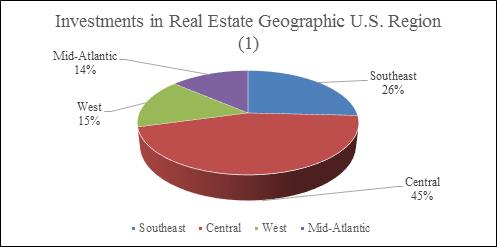
55
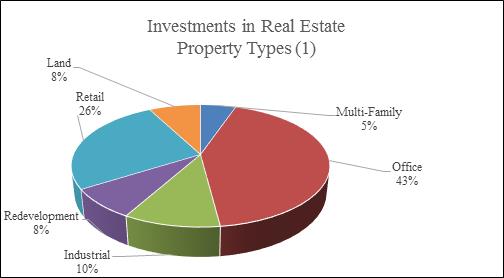
|
(1) |
Based on gross cost. |
Securitization Summary
Overview. We have used securitizations to match fund the interest rates and maturities of our assets with the interest rates and maturities of the related financing. This strategy has helped us reduce interest rate and funding risks on our portfolios for the long-term. A securitization is a structure in which multiple classes of debt and equity are issued by a special purpose entity to finance a portfolio of assets. Cash flow from the portfolio of assets is used to repay the securitization liabilities sequentially, in order of seniority. The most senior classes of debt typically have credit ratings of “AAA” through “BBB–” and therefore can be issued at yields that are lower than the average yield of the loans collateralizing the securitization. The debt tranches are typically rated based on portfolio quality, diversification and structural subordination. The equity securities issued by the securitization are the “first loss” piece of the capital structure, but they are entitled to all residual amounts available for payment after the obligations to the debt holders have been satisfied. Our retained interests described below included in our investments in our consolidated securitizations are typically in such “first loss” position. Historically, the stated maturity of the debt issued by a securitization we have sponsored and consolidated has been between 15 and 17 years. However, we expect the weighted average life of such debt to be shorter than the stated maturity due to the financial condition of the borrowers on the underlying loans and the characteristics of such loans, including the existence and frequency of exercise of any permitted prepayment, the prevailing level of interest rates, the actual default rate and the actual level of any recoveries on any defaulted loans. Debt issued by these securitizations is non-recourse to RAIT and payable solely from the payments by the borrowers on the loans collateralizing these securitizations. These assets are in most cases “non-recourse” or limited recourse loans secured by commercial real estate assets or real estate entities. This means that we look primarily to the assets securing the loan for repayment, subject to certain standard exceptions.
As of June 30, 2017, we had sponsored six securitizations with varying amounts of retained or residual interests held by us which we consolidate in our financial statements as follows: RAIT I, RAIT II, RAIT 2015-FL4 Trust, or RAIT FL4, RAIT 2015-FL5 Trust, or RAIT FL5, RAIT 2016-FL6 Trust, or RAIT-FL6 and RAIT 2017-FL7 Trust, or RAIT-FL7. We refer to RAIT FL4, RAIT FL5, RAIT FL6 and RAIT FL7 as the FL securitizations. We previously exercised our rights and unwound two other securitizations we had sponsored, RAIT 2013-FL1 Trust, or RAIT FL1, in 2015 and RAIT 2014-FL2 Trust, or RAIT FL2, in 2016. In addition, we exercised our rights and unwound RAIT FL3 in April 2017. The assets and liabilities of these securitizations are presented at amortized cost in our consolidated financial statements. We originated substantially all of the loans collateralizing RAIT I, RAIT II and the FL securitizations. We serve as the collateral manager, servicer and special servicer on RAIT I and RAIT II and as servicer and special servicer for each of the FL securitizations.
Over time, our returns on and cash flows from our retained interests in our securitizations generally decrease as the senior classes of debt bearing relatively lower interest rates are paid down by collateral pool payments and other proceeds leaving more junior classes of debt bearing relatively higher interest rates on the smaller collateral pool. As a result, we continue to evaluate strategies to manage the returns on our capital allocated to our retained interests in each of our securitizations consistent with our rights and obligations under our securitizations and relevant market conditions, which may include, without limitation, unwinding a securitization and rolling the remaining collateral over to a new securitization and may involve, where applicable, selling our
56
properties securing loans included in the collateral pool and repaying such loans. With respect to our floating rate CMBS securitizations described below, we have implemented a process of unwinding the FL securitizations when, because of loan repayments, the securitizations become inefficient.
Securitization Performance. RAIT I and RAIT II contain interest coverage triggers, or IC triggers, and over collateralization triggers, or OC triggers, that must be met in order for us to receive our subordinated management fees and our lower-rated debt or residual equity returns. If the IC triggers or OC triggers are not met in a given period, then the cash flows are redirected from lower rated tranches and used to repay the principal amounts to the senior tranches of CDO notes payable. These conditions and the re-direction of cash flow continue until the triggers are met by curing the underlying payment defaults, paying down the CDO notes payable, or other actions permitted under the relevant securitization indenture. As of the most recent payment information, all applicable IC triggers and OC triggers continue to be met for RAIT I and RAIT II, and we continue to receive all of our management fees, interest and residual returns from these securitizations. The FL securitizations do not have IC triggers and OC triggers.
Repayment of the loans collateralizing RAIT I and RAIT II outside their contractual maturities are expected to remain consistent with 2016 levels in the foreseeable future. In addition, we have 28 properties held for disposition with an aggregate gross cost of $374.6 million, and carrying value of $356.8 million, as of June 30, 2017. The related indebtedness of these properties is expected to be repaid with the proceeds of any sales, which primarily includes paying down the most senior notes outstanding issued by RAIT I and RAIT II, as applicable. We continue to evaluate our real estate portfolio to identify other possible properties to sell as part of our previously disclosed capital recycling and debt reduction plan. Because we own properties that are financed, in part, by loans collateralizing RAIT I and RAIT II, sales of our properties could result in a significant reduction of our securitization notes payable. These repayments have reduced our returns from these securitizations and we expect future repayments to continue to reduce these returns. We currently expect the remaining loans collateralizing RAIT II to be substantially repaid or otherwise disposed of by the end of 2017. We continue to implement our new strategic direction in order to seek to replace these returns.
If the CDO notes issued by RAIT I and RAIT II have not been redeemed in full prior to the distribution date occurring in November 2017, in the case of RAIT I, and August 2017, in the case of RAIT II, then an auction of the collateral assets of RAIT I or RAIT II, as relevant, will be conducted by the relevant trustee periodically thereafter and, if certain conditions set forth in the relevant indenture are satisfied, such collateral assets will be sold at the auction and the relevant CDO notes will be redeemed, in whole, but not in part, on such distribution date. Three auctions for RAIT I and one auction for RAIT II have been held but no sales occurred as not all of the conditions precedent were satisfied.
A summary of the investments in our consolidated securitizations as of the most recent payment information is as follows:
Our Legacy Securitizations
|
|
• |
RAIT I—RAIT I has $524.5 million of total collateral at par value, of which $43.4 million is defaulted. The current overcollateralization, or OC, test is passing at 141.3% with an OC trigger of 116.2%. We currently own $46.1 million of the securities that were originally rated investment grade and $200.0 million of the non-investment grade securities issued by this securitization. We are currently receiving all distributions required by the terms of our retained interests in this securitization and are receiving all of our collateral management fees. We pledged $22.9 million of the securities we own issued by RAIT I as collateral for a senior secured note we issued. |
|
|
• |
RAIT II—RAIT II has $276.8 million of total collateral at par value, of which $18.5 million is defaulted. The current OC test is passing at 155.0% with an OC trigger of 111.7%. We currently own $89.9 million of the securities that were originally rated investment grade and $140.7 million of the non-investment grade securities issued by this securitization. We are currently receiving all distributions required by the terms of our retained interests in this securitization and are receiving all of our collateral management fees. |
Our Floating Rate CMBS Securitizations
|
|
• |
RAIT FL3— During the second quarter of 2017, RAIT exercised its right to unwind RAIT 2014-FL3 Trust, or RAIT FL3, and satisfied the outstanding notes. We refinanced a majority of the $85.7 million of remaining loans through our warehouse financing arrangement. Loan repayments in RAIT FL3 decreased the efficiency of the securitization and by unwinding this securitization, we increased our returns on our remaining assets. |
57
|
|
• |
RAIT FL5—RAIT FL5 has $233.9 million of total collateral at par value, of which there is no collateral that is in default. RAIT FL5 does not have OC triggers or IC triggers. RAIT FL5, has classes of investment grade senior notes with an aggregate principal balance outstanding of approximately $173.1 million to investors. A venture, in which we have retained a 60% interest, owns the unrated classes of junior notes and the equity, or the retained interests, of RAIT FL5. The unrated classes of junior notes have an aggregate principal balance of $60.8 million. |
|
|
• |
RAIT FL6—RAIT FL6 has $200.3 million of total collateral at par value, none of which is in default. RAIT FL6 has classes of investment grade senior notes with an aggregate principal balance outstanding of approximately $159.0 million to investors. In January 2017, we contributed our junior notes and equity of RAIT FL6 to a venture. The venture, in which we have retained a 60% interest, owns the unrated classes of junior notes and the equity, or the retained interests, of RAIT FL6. We received approximately $17.0 million of capital as a result of this contribution. The unrated classes of junior notes have an aggregate principal balance of $41.3 million. |
|
|
• |
RAIT FL7— During the second quarter of 2017, we closed RAIT FL7. RAIT FL7 has $342.4 million of total collateral at par value, none of which is in default. RAIT FL7 does not have OC triggers or IC triggers. RAIT FL7, has classes of investment grade senior notes with an aggregate principal balance outstanding of approximately $276.9 million to investors. We currently own the unrated classes of junior notes, including a class with an aggregate principal balance of $65.5 million, and the equity, or the retained interests, of RAIT FL7. |
Assets Under Management
Assets under management, or AUM, is an operating measure representing the total assets that we own or are managing for third parties. While not all AUM generates fee income, it is an important operating measure to gauge our asset growth, volume of originations, size and scale of our operations and our performance.
The table below summarizes our AUM as of June 30, 2017 and December 31, 2016 (dollars in thousands):
|
|
|
AUM as of June 30, 2017 |
|
|
AUM as of December 31, 2016 |
|
||
|
Commercial real estate portfolio (1) |
|
$ |
1,741,502 |
|
|
$ |
2,159,152 |
|
|
Property management (2) |
|
|
1,428,993 |
|
|
|
1,416,072 |
|
|
Total |
|
$ |
3,170,495 |
|
|
$ |
3,575,224 |
|
|
(1) |
As of June 30, 2017 and December 31, 2016, our commercial real estate portfolio was comprised of $339.9 million and $411.7 million, respectively, of assets collateralizing RAIT I and RAIT II; $870.1 million and $789.4 million, respectively, of assets collateralizing our floating rate securitizations; $470.2 million and $854.6 million, respectively, of investments in real estate; and $61.3 million and $103.4 million, respectively, of commercial mortgage loans, mezzanine loans and preferred equity interests that were not securitized. |
|
(2) |
Urban Retail provides management and/or leasing services to 56 properties with 13,646,263 square feet in 20 states as of June 30, 2017. |
58
Three Months Ended June 30, 2017 Compared to the Three Months Ended June 30, 2016
The following table sets forth information regarding our consolidated results of operations for the three months ended June 30, 2017 and 2016.
|
|
|
For the Three Months Ended June 30, |
|
|||||||||||||
|
|
|
2017 |
|
|
2016 |
|
|
$ Variance |
|
|
% Variance |
|
||||
|
Revenue: |
|
|
|
|
|
|
|
|
|
|
|
|
|
|
|
|
|
Investment interest income |
|
$ |
14,882 |
|
|
$ |
23,519 |
|
|
$ |
(8,637 |
) |
|
|
-37 |
% |
|
Investment interest expense |
|
|
(10,546 |
) |
|
|
(9,125 |
) |
|
|
(1,421 |
) |
|
|
16 |
% |
|
Net interest margin |
|
|
4,336 |
|
|
|
14,394 |
|
|
|
(10,058 |
) |
|
|
-70 |
% |
|
Property income |
|
|
16,946 |
|
|
|
29,666 |
|
|
|
(12,720 |
) |
|
|
-43 |
% |
|
Fee and other income |
|
|
1,531 |
|
|
|
1,914 |
|
|
|
(383 |
) |
|
|
-20 |
% |
|
Total revenue |
|
|
22,813 |
|
|
|
45,974 |
|
|
|
(23,161 |
) |
|
|
-50 |
% |
|
Expenses: |
|
|
|
|
|
|
|
|
|
|
|
|
|
|
|
|
|
Interest expense |
|
|
8,883 |
|
|
|
13,967 |
|
|
|
(5,084 |
) |
|
|
-36 |
% |
|
Real estate operating expense |
|
|
9,509 |
|
|
|
14,327 |
|
|
|
(4,818 |
) |
|
|
-34 |
% |
|
Property management expenses |
|
|
2,651 |
|
|
|
2,846 |
|
|
|
(195 |
) |
|
|
-7 |
% |
|
General and administrative expenses: |
|
|
|
|
|
|
|
|
|
|
|
|
|
|
|
|
|
Compensation expense |
|
|
3,529 |
|
|
|
3,862 |
|
|
|
(333 |
) |
|
|
-9 |
% |
|
General and administrative expense |
|
|
2,689 |
|
|
|
3,706 |
|
|
|
(1,017 |
) |
|
|
-27 |
% |
|
Total general and administrative expenses |
|
|
6,218 |
|
|
|
7,568 |
|
|
|
(1,350 |
) |
|
|
-18 |
% |
|
Acquisition and integration expenses |
|
|
67 |
|
|
|
70 |
|
|
|
(3 |
) |
|
|
-4 |
% |
|
Provision for loan losses |
|
|
20,863 |
|
|
|
1,344 |
|
|
|
19,519 |
|
|
|
1452 |
% |
|
Depreciation and amortization expense |
|
|
7,819 |
|
|
|
15,134 |
|
|
|
(7,315 |
) |
|
|
-48 |
% |
|
IRT internalization and management transition expenses |
|
|
- |
|
|
|
- |
|
|
|
- |
|
|
N/M |
|
|
|
Shareholder activism expenses |
|
|
1,615 |
|
|
|
- |
|
|
|
1,615 |
|
|
N/M |
|
|
|
Total expenses |
|
|
57,625 |
|
|
|
55,256 |
|
|
|
2,369 |
|
|
|
4 |
% |
|
Operating (Loss) Income |
|
|
(34,812 |
) |
|
|
(9,282 |
) |
|
|
(25,530 |
) |
|
|
275 |
% |
|
Interest and other income (expense), net |
|
|
(153 |
) |
|
|
39 |
|
|
|
(192 |
) |
|
|
-492 |
% |
|
Gains (losses) on assets |
|
|
10,759 |
|
|
|
5,812 |
|
|
|
4,947 |
|
|
|
85 |
% |
|
Gains (losses) on deconsolidation of properties |
|
|
- |
|
|
|
- |
|
|
|
- |
|
|
N/M |
|
|
|
Gains (losses) on extinguishments of debt |
|
|
(1,598 |
) |
|
|
660 |
|
|
|
(2,258 |
) |
|
|
-342 |
% |
|
Asset impairment |
|
|
(85,809 |
) |
|
|
(3,864 |
) |
|
|
(81,945 |
) |
|
|
2121 |
% |
|
Goodwill impairment |
|
|
(8,342 |
) |
|
|
- |
|
|
|
(8,342 |
) |
|
N/M |
|
|
|
Change in fair value of financial instruments |
|
|
3,093 |
|
|
|
(1,592 |
) |
|
|
4,685 |
|
|
|
-294 |
% |
|
Income (loss) before taxes |
|
|
(116,862 |
) |
|
|
(8,227 |
) |
|
|
(108,635 |
) |
|
|
1320 |
% |
|
Income tax benefit (provision) |
|
|
(22 |
) |
|
|
1,756 |
|
|
|
(1,778 |
) |
|
|
-101 |
% |
|
Income from continuing operations |
|
|
(116,884 |
) |
|
|
(6,471 |
) |
|
|
(110,413 |
) |
|
|
1706 |
% |
|
Discontinued operations: |
|
|
|
|
|
|
|
|
|
|
|
|
|
|
|
|
|
Income (loss) from discontinued operations |
|
|
- |
|
|
|
32,876 |
|
|
|
(32,876 |
) |
|
|
-100 |
% |
|
Net income (loss) |
|
|
(116,884 |
) |
|
|
26,405 |
|
|
|
(143,289 |
) |
|
|
-543 |
% |
|
(Income) loss allocated to preferred shares |
|
|
(8,817 |
) |
|
|
(8,615 |
) |
|
|
(202 |
) |
|
|
2 |
% |
|
(Income) loss allocated to noncontrolling interests |
|
|
(56 |
) |
|
|
(25,370 |
) |
|
|
25,314 |
|
|
|
-100 |
% |
|
Net income (loss) allocable to common shares |
|
$ |
(125,757 |
) |
|
$ |
(7,580 |
) |
|
$ |
(118,177 |
) |
|
|
1559 |
% |
Revenue
Net interest margin. Net interest margin decreased $10.1 million, or 70%, to $4.3 million for the three months ended June 30, 2017 from $14.4 million for the three months ended June 30, 2016. Investment interest income decreased as a result of $517.3 million of loan repayments since July 1, 2016, partially offset by $362.1 million of loan originations for the same period. The decrease was also driven by the write off of $3.6 million of accrued interest receivable related to a loan whose interest income was determined to be not probable of collection based on the value of the underlying collateral using discounted cash flow models and market based assumptions. Investment interest expense increased due to the November 2016 issuance of $211.5 million of indebtedness in RAIT
59
FL6 and the January 2017 issuance of $16.5 million of other indebtedness related to our venture which holds the junior notes in RAIT FL6, partially offset by repayment of indebtedness secured by our loans.
Property income. Property income decreased $12.7 million to $16.9 million for the three months ended June 30, 2017 from $29.7 million for the three months ended June 30, 2016. The decrease is primarily attributable to the disposal of 22 properties since July 1, 2016, partially offset by the acquisition of 2 properties during the same period.
Fee and other income. Fee and other income decreased $0.4 million to $1.5 million for the three months ended June 30, 2017 from $1.9 million for the three months ended June 30, 2016. The decrease is primarily attributable to lower property management fees earned by our retail property management subsidiary.
Expenses
Interest expense. Interest expense decreased $5.1 million, or 36%, to $8.9 million for the three months ended June 30, 2017 from $14.0 million for the three months ended June 30, 2016. The decrease is attributable to $50.5 million of recourse debt reductions since July 1, 2016 and $123.4 million of repayments of indebtedness related to property dispositions.
Real estate operating expense. Real estate operating expense decreased $4.8 million, or 34%, to $9.5 million for the three months ended June 30, 2017 from $14.3 million for the three months ended June 30, 2016. The decrease is primarily attributable to the disposal of 22 properties since July 1, 2016, partially offset by the acquisition of 2 properties during the same period.
Property management expense. Property management expense decreased $0.2 million, or 7%, to $2.7 million for the three months ended June 30, 2017 from $2.8 million for the three months ended June 30, 2016.
Compensation expense. Compensation expense decreased $0.3 million to $3.5 million for the three months ended June 30, 2017 from $3.9 million for the three months ended June 30, 2016. The primary driver of the decrease was a decrease in the number of employees.
General and administrative expense. General and administrative expense decreased $1.0 million to $2.7 million for the three months ended June 30, 2017 from $3.7 million for the three months ended June 30, 2016. This decrease is primarily due to decreases across multiple types of general and administrative expenses as part of our strategic transformation and simpler business model.
Acquisition expense. Acquisition expense remained unchanged at $0.1 million for the three months ended June 30, 2017 compared to the three months ended June 30, 2016.
Provision for loan losses. Provision for loan losses increased $19.5 million to $20.9 million for the three months ended June 30, 2017 from $1.3 million for the three months ended June 30, 2016. During the three ended June 30, 2017, the provision for loan losses was related to loans originated prior to 2010 and was primarily driven by five loans where the borrower and/or property experienced an unfavorable event or events during the period, which resulted in probable, incurred losses.
Depreciation and amortization expense. Depreciation and amortization expense decreased $7.3 million, or 48%, to $7.8 million for the three months ended June 30, 2017 from $15.1 million for the three months ended June 30, 2016. The decrease is primarily attributable to the disposal of 22 properties since July 1, 2016, partially offset by the acquisition of 2 properties during the same period.
Shareholder activism expenses. During the three months ended June 30, 2017, we incurred $1.6 million of additional expenses beyond those normally associated with soliciting proxies for our annual meeting of shareholders as a result of responding to an activist campaign by an activist investor.
Other income (expense)
Gains (losses) on assets. During the three months ended June 30, 2017 the sale of one multifamily property and the partial sale of one retail property resulted in gains of $10.8 million.
Gains (losses) on extinguishment of debt. During the three months ended June 30, 2017, we recognized losses of $1.6 million on the extinguishment of our indebtedness, primarily due to the write-off of the unamortized deferred financing costs associated with the indebtedness.
60
Asset impairment. During the three months ended June 30, 2017, we recognized non-cash asset impairment charges of $85.8 million, which was primarily related to certain real estate assets where it was more likely than not that we would dispose of the assets before the end of their previously estimated useful lives and a portion of our recorded investment in these assets was determined to not be recoverable.
Goodwill impairment. During the three months ended June 30, 2017 we recognized a non-cash impairment charge related to goodwill of $8.3 million as our retail property manager has experienced declining profitability, which has been a product of the current challenges facing the retail property sector.
Change in fair value of financial instruments. During the three months ended June 30, 2017, the change in fair value of financial instruments increased our net income by $3.1 million. The fair value adjustments we recorded were as follows (dollars in thousands):
|
Description |
|
For the Three Months Ended June 30, 2017 |
|
|
For the Three Months Ended June 30, 2016 |
|
||
|
Change in fair value of junior subordinated notes |
|
$ |
(42 |
) |
|
$ |
(1,004 |
) |
|
Change in fair value of derivatives |
|
|
(265 |
) |
|
|
(388 |
) |
|
Change in fair value of warrants and investor SARs |
|
|
3,400 |
|
|
|
(200 |
) |
|
Change in fair value of financial instruments |
|
$ |
3,093 |
|
|
$ |
(1,592 |
) |
The changes in the fair value for the junior subordinated notes for which the fair value option was elected for the three months ended June 30, 2017 and 2016 was primarily attributable to changes in interest rates and instrument specific credit risks. The changes in the fair value of derivatives for the three months ended June 30, 2017 and 2016 was primarily attributable to changes in interest rates. The changes in the fair value of the warrants and investor SARs for the three months ended June 30, 2017 and 2016 was primarily attributable to changes in the reference stock price and volatility.
Income tax benefit (provision). During the three months ended June 30, 2017, the income tax provision related to insignificant activities occurring in our TRS entities during the period.
Income (loss) from discontinued operations. During the three months ended June 30, 2016, income (loss) from discontinued operations reflected recurring activity from our discontinued operations.
61
Six Months Ended June 30, 2017 Compared to the Six Months Ended June 30, 2016
The following table sets forth information regarding our consolidated results of operations for the six months ended June 30, 2017 and 2016.
|
|
|
For the Six Months Ended June 30, |
|
|||||||||||||
|
|
|
2017 |
|
|
2016 |
|
|
$ Variance |
|
|
% Variance |
|
||||
|
Revenue: |
|
|
|
|
|
|
|
|
|
|
|
|
|
|
|
|
|
Investment interest income |
|
$ |
32,532 |
|
|
$ |
49,321 |
|
|
$ |
(16,789 |
) |
|
|
-34 |
% |
|
Investment interest expense |
|
|
(20,319 |
) |
|
|
(18,445 |
) |
|
|
(1,874 |
) |
|
|
10 |
% |
|
Net interest margin |
|
|
12,213 |
|
|
|
30,876 |
|
|
|
(18,663 |
) |
|
|
-60 |
% |
|
Property income |
|
|
37,011 |
|
|
|
59,721 |
|
|
|
(22,710 |
) |
|
|
-38 |
% |
|
Fee and other income |
|
|
3,192 |
|
|
|
4,028 |
|
|
|
(836 |
) |
|
|
-21 |
% |
|
Total revenue |
|
|
52,416 |
|
|
|
94,625 |
|
|
|
(42,209 |
) |
|
|
-45 |
% |
|
Expenses: |
|
|
|
|
|
|
|
|
|
|
|
|
|
|
|
|
|
Interest expense |
|
|
19,026 |
|
|
|
29,837 |
|
|
|
(10,811 |
) |
|
|
-36 |
% |
|
Real estate operating expense |
|
|
20,143 |
|
|
|
29,175 |
|
|
|
(9,032 |
) |
|
|
-31 |
% |
|
Property management expenses |
|
|
4,864 |
|
|
|
5,013 |
|
|
|
(149 |
) |
|
|
-3 |
% |
|
General and administrative expenses: |
|
|
|
|
|
|
|
|
|
|
|
|
|
|
|
|
|
Compensation expense |
|
|
7,016 |
|
|
|
7,487 |
|
|
|
(471 |
) |
|
|
-6 |
% |
|
General and administrative expense |
|
|
5,394 |
|
|
|
6,921 |
|
|
|
(1,527 |
) |
|
|
-22 |
% |
|
Total general and administrative expenses |
|
|
12,410 |
|
|
|
14,408 |
|
|
|
(1,998 |
) |
|
|
-14 |
% |
|
Acquisition and integration expenses |
|
|
239 |
|
|
|
179 |
|
|
|
60 |
|
|
|
34 |
% |
|
Provision for loan losses |
|
|
22,398 |
|
|
|
2,669 |
|
|
|
19,729 |
|
|
|
739 |
% |
|
Depreciation and amortization expense |
|
|
17,573 |
|
|
|
27,807 |
|
|
|
(10,234 |
) |
|
|
-37 |
% |
|
IRT internalization and management transition expenses |
|
|
736 |
|
|
|
- |
|
|
|
736 |
|
|
N/M |
|
|
|
Shareholder activism expenses |
|
|
2,309 |
|
|
|
- |
|
|
|
2,309 |
|
|
N/M |
|
|
|
Total expenses |
|
|
99,698 |
|
|
|
109,088 |
|
|
|
(9,390 |
) |
|
|
-9 |
% |
|
Operating (Loss) Income |
|
|
(47,282 |
) |
|
|
(14,463 |
) |
|
|
(32,819 |
) |
|
|
227 |
% |
|
Interest and other income (expense), net |
|
|
(139 |
) |
|
|
100 |
|
|
|
(239 |
) |
|
|
-239 |
% |
|
Gains (losses) on assets |
|
|
22,765 |
|
|
|
5,617 |
|
|
|
17,148 |
|
|
|
305 |
% |
|
Gains (losses) on deconsolidation of properties |
|
|
(15,947 |
) |
|
|
- |
|
|
|
(15,947 |
) |
|
N/M |
|
|
|
Gains (losses) on extinguishments of debt |
|
|
1,588 |
|
|
|
1,004 |
|
|
|
584 |
|
|
|
58 |
% |
|
Asset impairment |
|
|
(93,233 |
) |
|
|
(7,786 |
) |
|
|
(85,447 |
) |
|
|
1097 |
% |
|
Goodwill impairment |
|
|
(8,342 |
) |
|
|
- |
|
|
|
(8,342 |
) |
|
N/M |
|
|
|
Change in fair value of financial instruments |
|
|
1,940 |
|
|
|
(5,680 |
) |
|
|
7,620 |
|
|
|
-134 |
% |
|
Income (loss) before taxes |
|
|
(138,650 |
) |
|
|
(21,208 |
) |
|
|
(117,442 |
) |
|
|
554 |
% |
|
Income tax benefit (provision) |
|
|
227 |
|
|
|
2,749 |
|
|
|
(2,522 |
) |
|
|
-92 |
% |
|
Income from continuing operations |
|
|
(138,423 |
) |
|
|
(18,459 |
) |
|
|
(119,964 |
) |
|
|
650 |
% |
|
Discontinued operations: |
|
|
|
|
|
|
|
|
|
|
|
|
|
|
|
|
|
Income (loss) from discontinued operations |
|
|
- |
|
|
|
34,361 |
|
|
|
(34,361 |
) |
|
|
-100 |
% |
|
Net income (loss) |
|
|
(138,423 |
) |
|
|
15,902 |
|
|
|
(154,325 |
) |
|
|
-970 |
% |
|
(Income) loss allocated to preferred shares |
|
|
(17,343 |
) |
|
|
(17,135 |
) |
|
|
(208 |
) |
|
|
1 |
% |
|
(Income) loss allocated to noncontrolling interests |
|
|
(76 |
) |
|
|
(24,191 |
) |
|
|
24,115 |
|
|
|
-100 |
% |
|
Net income (loss) allocable to common shares |
|
$ |
(155,842 |
) |
|
$ |
(25,424 |
) |
|
$ |
(130,418 |
) |
|
|
513 |
% |
Revenue
Net interest margin. Net interest margin decreased $18.7 million, or 60%, to $12.2 million for the six months ended June 30, 2017 from $30.9 million for the six months ended June 30, 2016. Investment interest income decreased $16.8 million as a result of a 17% decrease in the average investments in loans, as well as the write off of $3.6 million of accrued interest receivable related to a loan whose interest income was determined to be not probable of collection based on the value of the underlying collateral using discounted cash flow models and market based assumptions. Investment interest expense increased $1.9 million due to the November 2016 issuance of $211.5 million of indebtedness in RAIT FL6 and the January 2017 issuance of $16.5 million of other indebtedness related to our venture which holds the junior notes in RAIT FL6, partially offset by repayment of indebtedness secured by our loans.
62
Property income. Property income decreased $22.7 million to $37.0 million for the six months ended June 30, 2017 from $59.7 million for the six months ended June 30, 2016. The decrease is primarily attributable to the disposal of 22 properties since July 1, 2016, partially offset by the acquisition of 2 properties during the same period.
Fee and other income. Fee and other income decreased $0.8 million to $3.2 million for the six months ended June 30, 2017 from $4.0 million for the six months ended June 30, 2016. The decrease is primarily attributable to lower property management fees earned by our retail property management subsidiary.
Expenses
Interest expense. Interest expense decreased $10.8 million, or 36%, to $19.0 million for the six months ended June 30, 2017 from $29.8 million for the six months ended June 30, 2016. The decrease is attributable to $50.5 million of recourse debt reductions since July 1, 2016 and $123.4 million of repayments of indebtedness related to property dispositions.
Real estate operating expense. Real estate operating expense decreased $9.0 million to $20.1 million for the six months ended June 30, 2017 from $29.2 million for the six months ended June 30, 2016. The decrease is primarily attributable to the disposal of 22 properties since July 1, 2016, partially offset by the acquisition of 2 properties during the same period.
Compensation expense. Compensation expense decreased $0.5 million to $7.0 million for the six months ended June 30, 2017 from $7.5 million for the six months ended June 30, 2016. The primary driver of the decrease was a decrease in the number of employees.
General and administrative expense. General and administrative expense decreased $1.5 million to $5.4 million for the six months ended June 30, 2017 from $6.9 million for the six months ended June 30, 2016. This decrease is primarily due to decreases across multiple types of general and administrative expenses as part of our strategic transformation and simpler business model.
Acquisition expense. Acquisition expense remained unchanged at $0.2 million for the six months ended June 30, 2017 compared to the six months ended June 30, 2016.
Provision for loan losses. Provision for loan losses increased $19.7 million to $22.4 million for the six months ended June 30, 2017 from $2.7 million for the six months ended June 30, 2016. During the six ended June 30, 2017, the provision for loan losses was related to loans originated prior to 2010 and was primarily driven by five loans where the borrower and/or property experienced an unfavorable event or events during the period, which resulted in probable, incurred losses.
Depreciation and amortization expense. Depreciation and amortization expense decreased $10.2 million to $17.6 million for the six months ended June 30, 2017 from $27.8 million for the six months ended June 30, 2016. The decrease is primarily attributable to the disposal of 22 properties since July 1, 2016, partially offset by the acquisition of 2 properties during the same period.
Other income (expense)
Gains (losses) on assets. During the six months ended June 30, 2017 four multifamily properties, four office properties, one retail property and one parcel of land were sold resulting in gains of $19.6 million. A $3.1 million gain was also recognized during the six months ended June 30, 2017 relating to the sale of a multifamily property that occurred during the second quarter of 2015. The gain was deferred as the buyer’s initial investment was insufficient. As our loan, which financed the buyer’s acquisition of this property, was paid off during the six months ended June 30, 2017, we recognized the $3.1 million deferred gain.
Gains (losses) on deconsolidation of properties. During the six months ended June 30, 2017, we incurred a non-cash loss on deconsolidation of properties of $15.9 million relating to an industrial real estate portfolio which contained ten properties with a carrying value of $82.5 million and $81.9 million of related non-recourse debt as of December 31, 2016. During the six months ended June 30, 2017, the senior lender foreclosed on the mortgage liens encumbering five of these industrial properties that had an aggregate carrying value of $43.1 million as well as $0.3 million of intangible and other assets, net of accrued expenses and other liabilities, and $27.5 million of related non-recourse indebtedness as well as certain other assets and other liabilities.
Gains (losses) on extinguishment of debt. During the six months ended June 30, 2017, we recognized a gain on extinguishment of debt of $1.6 million. This includes a $4.1 million gain on the extinguishment of the mortgage indebtedness of two of our multifamily properties upon their sale as they were sold for less than their outstanding indebtedness and the outstanding indebtedness has been satisfied. This was offset by a loss on the extinguishment of debt of $2.5 million related to repurchases of our indebtedness, primarily driven by the write-off of the unamortized deferred financing costs associated with the indebtedness.
63
Asset impairment. During the six months ended June 30, 2017, we recognized non-cash asset impairment charges of $93.2 million, which was primarily related to real estate assets where it was more likely than not we would dispose of the assets before the end of their previously estimated useful lives and a portion of our recorded investment in these assets was determined to not be recoverable.
Goodwill impairment. During the six months ended June 30, 2017 we recognized a non-cash impairment charge related to goodwill of $8.3 million as our retail property manager has experienced declining profitability, which has been a product of the current challenges facing the retail property sector.
Change in fair value of financial instruments. During the six months ended June 30, 2017, the change in fair value of financial instruments increased our net income by $1.9 million. The fair value adjustments we recorded were as follows (dollars in thousands):
|
Description |
|
For the Six Months Ended June 30, 2017 |
|
|
For the Six Months Ended June 30, 2016 |
|
||
|
Change in fair value of junior subordinated notes |
|
$ |
(702 |
) |
|
$ |
(285 |
) |
|
Change in fair value of derivatives |
|
|
(258 |
) |
|
|
(2,295 |
) |
|
Change in fair value of warrants and investor SARs |
|
|
2,900 |
|
|
|
(3,100 |
) |
|
Change in fair value of financial instruments |
|
$ |
1,940 |
|
|
$ |
(5,680 |
) |
The changes in the fair value for the junior subordinated notes for which the fair value option was elected for the six months ended June 30, 2017 and 2016 was primarily attributable to changes in interest rates and instrument specific credit risks. The changes in the fair value of derivatives for the six months ended June 30, 2017 and 2016 was primarily attributable to changes in interest rates. The changes in the fair value of the warrants and investor SARs for the six months ended June 30, 2017 and 2016 was primarily attributable to changes in the reference stock price and volatility.
Income tax benefit (provision). During the six months ended June 30, 2017, the income tax benefit was driven by a reversal of the current income tax liability accrued as of December 31, 2016 as a result of updating our projections for 2017.
Non-GAAP Financial Measures
Cash Available for Distribution
Cash available for distribution, or CAD, is a non-GAAP financial measure. We believe that CAD provides investors and management with a meaningful indicator of operating performance. Management also uses CAD, among other measures, to evaluate profitability and our board of trustees considers CAD in determining our quarterly cash distributions. We also believe that CAD is useful to investors because it adjusts for a variety of noncash items (such as depreciation and amortization, equity-based compensation, provision for loan losses and non-cash interest income and expense items). In addition, the compensation committee of our board of trustees has used CAD as a metric in establishing quantitative performance-based awards for certain of our executive officers since 2015.
We calculate CAD by subtracting from or adding to net income (loss) attributable to common shareholders the following items: depreciation and amortization items including depreciation and amortization expense, straight-line rental income or expense, amortization of deferred financing costs, and amortization of discounts on financings; origination fees; equity-based compensation; changes in the fair value of our financial instruments; realized gains (losses) on assets; provision for loan losses; asset impairments; acquisition gains or losses and transaction costs; deferred income tax benefit (provision); certain fee income eliminated in consolidation that is attributable to third parties; and one-time events pursuant to changes in GAAP and certain other non-routine items.
CAD should not be considered as an alternative to net income (loss) or cash generated from operating activities, determined in accordance with GAAP, as an indicator of operating performance. For example, CAD does not adjust for the accrual of income and expenses that may not be received or paid in cash during the associated periods. Please refer to our consolidated financial statements prepared in accordance with GAAP in our most recent report on Form 10-K or Form 10-Q filed with the Securities and Exchange Commission. In addition, our methodology for calculating CAD may differ from the methodologies used by other comparable companies, including other REITs, when calculating the same or similar supplemental financial measures and may not be comparable with these companies.
64
Set forth below is a reconciliation of CAD to net income (loss) allocable to common shares for the three months ended June 30, 2017 and 2016 (dollars in thousands, except share information):
|
|
|
For the Three Months Ended June 30, 2017 |
|
|
For the Three Months Ended June 30, 2016 |
|
||||||||||
|
|
|
Amount |
|
|
Per Share (2) |
|
|
Amount |
|
|
Per Share (3) |
|
||||
|
Cash Available for Distribution (1): |
|
|
|
|
|
|
|
|
|
|
|
|
|
|
|
|
|
Net income (loss) allocable to common shares |
|
$ |
(125,757 |
) |
|
$ |
(1.38 |
) |
|
$ |
(7,580 |
) |
|
$ |
(0.08 |
) |
|
Adjustments: |
|
|
|
|
|
|
|
|
|
|
|
|
|
|
|
|
|
Depreciation and amortization expense |
|
|
7,819 |
|
|
|
0.08 |
|
|
|
15,134 |
|
|
|
0.17 |
|
|
Change in fair value of financial instruments |
|
|
(3,093 |
) |
|
|
(0.03 |
) |
|
|
1,592 |
|
|
|
0.02 |
|
|
(Gains) losses on assets |
|
|
(10,759 |
) |
|
|
(0.12 |
) |
|
|
(5,812 |
) |
|
|
(0.06 |
) |
|
(Gains) losses on deconsolidation of properties |
|
|
— |
|
|
|
— |
|
|
|
— |
|
|
|
— |
|
|
(Gains) losses on extinguishments of debt |
|
|
1,598 |
|
|
|
0.02 |
|
|
|
(660 |
) |
|
|
(0.01 |
) |
|
Deferred income tax (benefit) provision |
|
|
22 |
|
|
|
— |
|
|
|
(1,733 |
) |
|
|
(0.02 |
) |
|
Straight-line rental adjustments |
|
|
58 |
|
|
|
— |
|
|
|
(142 |
) |
|
|
— |
|
|
Share-based compensation |
|
|
710 |
|
|
|
0.01 |
|
|
|
954 |
|
|
|
0.01 |
|
|
Acquisition and integration expenses |
|
|
67 |
|
|
|
— |
|
|
|
70 |
|
|
|
— |
|
|
Origination fees and other deferred items |
|
|
8,476 |
|
|
|
0.09 |
|
|
|
5,911 |
|
|
|
0.06 |
|
|
Provision for losses |
|
|
20,863 |
|
|
|
0.23 |
|
|
|
1,344 |
|
|
|
0.01 |
|
|
IRT internalization and management transition expenses |
|
|
— |
|
|
|
— |
|
|
|
— |
|
|
|
— |
|
|
Shareholder activism expenses |
|
|
1,615 |
|
|
|
0.02 |
|
|
|
— |
|
|
|
— |
|
|
Asset impairment |
|
|
85,809 |
|
|
|
0.94 |
|
|
|
3,864 |
|
|
|
0.04 |
|
|
Goodwill impairment |
|
|
8,342 |
|
|
|
0.09 |
|
|
|
— |
|
|
|
— |
|
|
Net expenses associated with deconsolidation of properties |
|
|
475 |
|
|
|
0.01 |
|
|
|
— |
|
|
|
— |
|
|
Discontinued operations and noncontrolling interest effect of certain adjustments |
|
|
— |
|
|
|
— |
|
|
|
(2,405 |
) |
|
|
(0.02 |
) |
|
Cash Available for Distribution |
|
$ |
(3,755 |
) |
|
$ |
(0.04 |
) |
|
$ |
10,537 |
|
|
$ |
0.12 |
|
|
(1) |
For the three months ended June 30, 2017, CAD includes the non-cash effect of a $3.6 million write-off of accrued interest receivable related to a loan that was determined to be impaired during the period. CAD would have been $(0.1) million or $0.00 per share without the effect of this non-cash write-off. |
|
(2) |
Based on 91,453,415 weighted-average shares outstanding for the three months ended June 30, 2017. |
|
(3) |
Based on 91,190,583 weighted-average shares outstanding for the three months ended June 30, 2016. |
65
Set forth below is a reconciliation of CAD to net income (loss) allocable to common shares for the six months ended June 30, 2017 and 2016 (dollars in thousands, except share information):
|
|
|
For the Six Months Ended June 30, 2017 |
|
|
For the Six Months Ended June 30, 2016 |
|
||||||||||
|
|
|
Amount |
|
|
Per Share (2) |
|
|
Amount |
|
|
Per Share (3) |
|
||||
|
Cash Available for Distribution (1): |
|
|
|
|
|
|
|
|
|
|
|
|
|
|
|
|
|
Net income (loss) allocable to common shares |
|
$ |
(155,842 |
) |
|
$ |
(1.71 |
) |
|
$ |
(25,424 |
) |
|
$ |
(0.28 |
) |
|
Adjustments: |
|
|
|
|
|
|
|
|
|
|
|
|
|
|
|
|
|
Depreciation and amortization expense |
|
|
17,573 |
|
|
|
0.19 |
|
|
|
27,807 |
|
|
|
0.31 |
|
|
Change in fair value of financial instruments |
|
|
(1,940 |
) |
|
|
(0.02 |
) |
|
|
5,680 |
|
|
|
0.06 |
|
|
(Gains) losses on assets |
|
|
(22,765 |
) |
|
|
(0.25 |
) |
|
|
(5,617 |
) |
|
|
(0.06 |
) |
|
(Gains) losses on deconsolidation of properties |
|
|
15,947 |
|
|
|
0.18 |
|
|
|
— |
|
|
|
— |
|
|
(Gains) losses on extinguishment of debt |
|
|
(1,588 |
) |
|
|
(0.02 |
) |
|
|
(1,004 |
) |
|
|
(0.01 |
) |
|
Deferred income tax (benefit) provision |
|
|
22 |
|
|
|
— |
|
|
|
(2,841 |
) |
|
|
(0.03 |
) |
|
Straight-line rental adjustments |
|
|
177 |
|
|
|
— |
|
|
|
(560 |
) |
|
|
(0.01 |
) |
|
Share-based compensation |
|
|
1,054 |
|
|
|
0.01 |
|
|
|
2,022 |
|
|
|
0.02 |
|
|
Acquisition and integration expenses |
|
|
239 |
|
|
|
— |
|
|
|
179 |
|
|
|
— |
|
|
Origination fees and other deferred items |
|
|
20,164 |
|
|
|
0.22 |
|
|
|
12,842 |
|
|
|
0.14 |
|
|
Provision for losses |
|
|
22,398 |
|
|
|
0.25 |
|
|
|
2,669 |
|
|
|
0.03 |
|
|
IRT internalization and management transition expenses |
|
|
736 |
|
|
|
0.01 |
|
|
|
— |
|
|
|
— |
|
|
Shareholder activism expenses |
|
|
2,309 |
|
|
|
0.03 |
|
|
|
— |
|
|
|
— |
|
|
Asset impairment |
|
|
93,233 |
|
|
|
1.02 |
|
|
|
7,786 |
|
|
|
0.09 |
|
|
Goodwill impairment |
|
|
8,342 |
|
|
|
0.09 |
|
|
|
— |
|
|
|
— |
|
|
Net expenses associated with deconsolidation of properties |
|
|
1,348 |
|
|
|
0.02 |
|
|
|
— |
|
|
|
— |
|
|
Discontinued operations and noncontrolling interest effect of certain adjustments |
|
|
— |
|
|
|
— |
|
|
|
(123 |
) |
|
|
— |
|
|
Cash Available for Distribution |
|
$ |
1,407 |
|
|
$ |
0.02 |
|
|
$ |
23,416 |
|
|
$ |
0.26 |
|
|
(1) |
For the six months ended June 30, 2017, CAD includes the non-cash effect of a $3.6 million write-off of accrued interest receivable related to a loan that was determined to be impaired during the period. CAD would have been $5.0 million or $0.06 per share without the effect of this non-cash write-off |
|
(2) |
Based on 91,377,508 weighted-average shares outstanding for the six months ended June 30, 2017. |
|
(3) |
Based on 91,104,314 weighted-average shares outstanding for the six months ended June 30, 2016. |
Funds from Operations
We believe that funds from operations, or FFO, which is a non-GAAP financial measure, is an additional appropriate measure of the operating performance of a REIT and that such measure is useful to investors in assessing our operating performance. We compute FFO in accordance with the standards established by the National Association of Real Estate Investment Trusts, or NAREIT, as net income or loss allocated to common shares (computed in accordance with GAAP), excluding real estate-related depreciation expense, gains or losses on sales of real estate and the cumulative effect of changes in accounting principles. Our management utilizes FFO as a measure of our operating performance. FFO is not an equivalent to net income or cash generated from operating activities determined in accordance with GAAP. Furthermore, FFO does not represent amounts available for management’s discretionary use because of needed capital replacement or expansion, debt service obligations or other commitments or uncertainties. FFO should not be considered as an alternative to net income, as an indicator of our operating performance or as an alternative to cash flow from operating activities as a measure of our liquidity.
66
Set forth below is a reconciliation of FFO to net income (loss) allocable to common shares for the three months ended June 30, 2017 and 2016 (dollars in thousands, except share information):
|
|
|
For the Three Months Ended June 30, 2017 |
|
|
For the Three Months Ended June 30, 2016 |
|
||||||||||
|
|
|
Amount |
|
|
Per Share (1) |
|
|
Amount |
|
|
Per Share (2) |
|
||||
|
Funds From Operations: |
|
|
|
|
|
|
|
|
|
|
|
|
|
|
|
|
|
Net income (loss) allocable to common shares |
|
$ |
(125,757 |
) |
|
$ |
(1.38 |
) |
|
$ |
(7,580 |
) |
|
$ |
(0.08 |
) |
|
Adjustments: |
|
|
|
|
|
|
|
|
|
|
|
|
|
|
|
|
|
Real estate depreciation and amortization |
|
|
5,630 |
|
|
|
0.06 |
|
|
|
9,484 |
|
|
|
0.10 |
|
|
(Gains) losses on the sale of real estate |
|
|
(10,759 |
) |
|
|
(0.12 |
) |
|
|
(5,812 |
) |
|
|
(0.06 |
) |
|
Asset impairment |
|
|
81,444 |
|
|
|
0.90 |
|
|
|
3,864 |
|
|
|
0.04 |
|
|
Adjustments related to discontinued operations |
|
|
— |
|
|
|
- |
|
|
|
(3,832 |
) |
|
|
(0.04 |
) |
|
Funds From Operations allocable to common shares |
|
$ |
(49,442 |
) |
|
$ |
(0.54 |
) |
|
$ |
(3,876 |
) |
|
$ |
(0.04 |
) |
|
(1) |
Based on 91,453,415 weighted-average shares outstanding for the three months ended June 30, 2017. |
|
(2) |
Based on 91,190,583 weighted-average shares outstanding for the three months ended June 30, 2016. |
Set forth below is a reconciliation of FFO to net income (loss) allocable to common shares for the six months ended June 30, 2017 and 2016 (dollars in thousands, except share information):
|
|
|
For the Six Months Ended June 30, 2017 |
|
|
For the Six Months Ended June 30, 2016 |
|
||||||||||
|
|
|
Amount |
|
|
Per Share (1) |
|
|
Amount |
|
|
Per Share (2) |
|
||||
|
Funds From Operations: |
|
|
|
|
|
|
|
|
|
|
|
|
|
|
|
|
|
Net income (loss) allocable to common shares |
|
$ |
(155,842 |
) |
|
$ |
(1.71 |
) |
|
$ |
(25,424 |
) |
|
$ |
(0.28 |
) |
|
Adjustments: |
|
|
|
|
|
|
|
|
|
|
|
|
|
|
|
|
|
Real estate depreciation and amortization |
|
|
12,514 |
|
|
|
0.14 |
|
|
|
19,655 |
|
|
|
0.21 |
|
|
(Gains) losses on the sale of real estate |
|
|
(22,765 |
) |
|
|
(0.25 |
) |
|
|
(5,617 |
) |
|
|
(0.06 |
) |
|
Asset impairment |
|
|
88,868 |
|
|
|
0.97 |
|
|
|
7,786 |
|
|
|
0.09 |
|
|
Adjustments related to discontinued operations |
|
|
- |
|
|
|
- |
|
|
|
(3,007 |
) |
|
|
(0.03 |
) |
|
Funds From Operations allocable to common shares |
|
$ |
(77,225 |
) |
|
$ |
(0.85 |
) |
|
$ |
(6,607 |
) |
|
$ |
(0.07 |
) |
|
(1) |
Based on 91,377,508 weighted-average shares outstanding for the six months ended June 30, 2017. |
|
(2) |
Based on 91,104,314 weighted-average shares outstanding for the six months ended June 30, 2016. |
Liquidity and Capital Resources
Liquidity is a measure of our ability to meet potential cash requirements, including ongoing commitments to repay borrowings, fund and maintain investments, pay dividends and other general business needs.
We believe our available cash and restricted cash balances, proceeds from the sales of assets, other financing arrangements, and cash flows from operations will be sufficient to fund our liquidity requirements for the next 12 months.
Our primary cash requirements are as follows:
|
|
• |
to make investments and fund the associated costs; |
|
|
• |
to repay, repurchase or redeem our indebtedness; |
|
|
• |
to pay our expenses, including compensation to our employees; |
|
|
• |
to pay U.S. federal, state, and local taxes of our taxable REIT subsidiaries; and |
|
|
• |
to distribute a minimum of 90% of our REIT taxable income and to make investments in a manner that enables us to maintain our qualification as a REIT. |
We intend to meet these liquidity requirements primarily through the following:
|
|
• |
the use of our cash and cash equivalent balances of $89.3 million as of June 30, 2017; |
|
|
• |
cash generated from operating activities, including net investment income from our investment portfolio, and fee income generated by our commercial real estate platform; |
67
|
|
• |
cash generated from distributions on our retained interests we hold related to RAIT I and RAIT II; |
|
|
• |
proceeds from the sales of assets; |
|
|
• |
proceeds from future borrowings, including our secured warehouse facilities and loan participations; |
|
|
• |
proceeds from alternative sources of financing, such as joint ventures or sales of our retained interests in securitizations we sponsor; and |
|
|
• |
proceeds from future offerings of our securities, which may include those through our DRSPP and ATM programs. |
Our liquidity and capital resources are highly dependent upon our ability to monetize a majority of our real estate assets and our retained interests in RAIT I and RAIT II. To the extent the ultimate cash proceeds received is less than what we currently estimate, our liquidity and capital resources could be adversely affected.
Cash Flows
As of June 30, 2017 and 2016, we maintained cash and cash equivalents of approximately $89.3 million and $38.7 million, respectively. Our cash and cash equivalents were generated from the following activities (dollars in thousands):
|
|
|
For the Six Months Ended June 30, |
|
|||||
|
|
|
2017 |
|
|
2016 |
|
||
|
Cash flow from operating activities |
|
$ |
6,744 |
|
|
$ |
57,749 |
|
|
Cash flow from investing activities |
|
|
142,141 |
|
|
|
262,328 |
|
|
Cash flow from financing activities |
|
|
(170,099 |
) |
|
|
(379,078 |
) |
|
Net change in cash and cash equivalents |
|
|
(21,214 |
) |
|
|
(59,001 |
) |
|
Net change in cash and cash equivalents from discontinued operations |
|
|
— |
|
|
|
10,146 |
|
|
Cash and cash equivalents at beginning of period |
|
|
110,531 |
|
|
|
87,581 |
|
|
Cash and cash equivalents at end of period |
|
$ |
89,317 |
|
|
$ |
38,726 |
|
Cash flow from operating activities for the six months ended June 30, 2017, as compared to the same period in 2016, decreased $51.0 million primarily due to the effects of real estate asset sales, which has led to reduced property income, and loan payoffs exceeding new loan originations, which has led to reduced net interest margin.
The cash inflow for investing activities for the six months ended June 30, 2017 was primarily due to proceeds from the disposition of real estate of $143.4 million. The cash inflow for investing activities for the six months ended June 30, 2016 was substantially due to proceeds from property dispositions of $127.4 million as well as loan repayments of $175.0 million outpacing new investments in loans of $55.6 million.
The cash outflow from our financing activities during the six months ended June 30, 2017 was primarily due to repayments and repurchases of indebtedness of $416.5 million and distributions to shareholders of $34.7 million exceeding proceeds from the issuance of indebtedness of $298.2 million. The cash outflow from our financing activities during the six months ended June 30, 2016 was primarily due to repayments and repurchases of indebtedness of $617.3 million and distributions to shareholders and noncontrolling interests of $48.0 million exceeding proceeds from the issuance of indebtedness of $246.8 million.
As a REIT, we evaluate our dividend coverage based on our cash flow from operating activities, excluding acquisition and integration expenses, the origination and sale of conduit loans, and changes in assets and liabilities. During the six months ended June 30, 2017, we paid distributions to our preferred shareholders, common shareholders, and non-controlling interests of $34.7 million and generated cash flows from operating activities, before acquisition expenses, origination and sale of conduit loans, and changes in assets and liabilities of $2.2 million. The excess distributions were funded through cash flows from previously available cash and the disposition of real estate assets, which is included in cash flows from investing activities in the consolidated statement of cash flows and totaled $143.4 million for the six months ended June 30, 2017.
Capitalization
Refer to Note 5: Indebtedness, Note 9: Series D Preferred Shares, and Note 10: Shareholders’ Equity in the Notes to Consolidated Financial Statements, for information regarding our capitalization.
We may from time to time seek to retire, purchase or refinance our outstanding debt through cash purchases and/or exchanges for equity securities, debt securities (including debt convertible into equity securities), in open market purchases, privately negotiated transactions or otherwise. Such repurchases or exchanges, if any, will depend on prevailing market conditions, our liquidity
68
requirements, contractual restrictions and other factors. The impact of these capital transactions may be material to our consolidated financial statements.
Off-Balance Sheet Arrangements and Commitments
There have been no material changes in off-balance sheet arrangements or commitments during the three and six months ended June 30, 2017 from the disclosures included in our Annual Report on Form 10-K for the year ended December 31, 2016.
Critical Accounting Estimates and Policies
Our Annual Report on Form 10-K for the year ended December 31, 2016 contains a discussion of our critical accounting policies. On January 1, 2017, we adopted four new accounting pronouncements and revised our accounting policies. See Note 2 in the Notes to Consolidated Financial Statements. Management discusses our critical accounting policies and management’s judgments and estimates with the audit committee of our board of trustees.
There have been no material changes in quantitative and qualitative market risks during the six months ended June 30, 2017 from the disclosures included in our Annual Report on Form 10-K for the year ended December 31, 2016.
Disclosure Controls and Procedures
We maintain disclosure controls and procedures that are designed to ensure that information required to be disclosed in our reports under the Securities Exchange Act of 1934, as amended, or the Exchange Act, is recorded, processed, summarized, and reported within the time periods specified in the SEC’s rules and forms, and that such information is accumulated and communicated to our management, including our chief executive officer and our chief financial officer, as appropriate, to allow timely decisions regarding required disclosure. In designing and evaluating the disclosure controls and procedures, our management recognized that any controls and procedures, no matter how well designed and operated, can provide only reasonable assurance of achieving the desired control objectives, and our management necessarily was required to apply its judgment in evaluating the cost-benefit relationship of possible controls and procedures.
Under the supervision of our chief executive officer and chief financial officer and with the participation of our disclosure committee, we have carried out an evaluation of the effectiveness of our disclosure controls and procedures as of the end of the period covered by this report. Based upon that evaluation, our chief executive officer and chief financial officer concluded that our disclosure controls and procedures are effective at the reasonable assurance level.
Changes in Internal Control Over Financial Reporting
There has been no change in our internal control over financial reporting or in other factors during the quarter ended June 30, 2017, that have materially affected, or were reasonably likely to materially affect, our internal control over financial reporting.
69
General
We are involved from time to time in litigation on various matters, including disputes with tenants of owned properties, disputes arising out of agreements to purchase or sell properties, disputes arising out of our loan portfolio, negligence, and similar tort claims related to owned properties or employment related disputes. Given the nature of our business activities, these lawsuits are considered routine to the conduct of our business. The result of any particular lawsuit cannot be predicted, because of the very nature of litigation, the litigation process and its adversarial nature, and the jury system. We do not expect that the liabilities, if any, that may ultimately result from such routine legal actions will have a material adverse effect on our consolidated financial position, results of operations or cash flows.
There have not been any material changes from the risk factors previously disclosed in Item 1A—“Risk Factors” in our Annual Report on Form 10-K for the fiscal year ended December 31, 2016, other than the following:
The failure to realize the anticipated benefits of our transformation plan and execution of our strategy - including our transition to a more focused, cost-efficient and lower leveraged business concentrated on our core commercial real estate lending business - could adversely impact our business and financial results.
We are pursuing a comprehensive strategy and transformation initiative to drive long-term shareholder value. Pursuant to this initiative, which began in early 2016 and which we expect to continue to execute on throughout 2017, we are transforming into a more focused, cost-efficient and lower leveraged business concentrated on our core commercial real estate lending business. In connection with executing this strategy and transformation initiative, we have identified several key priorities designed to differentiate RAIT, improve our cost structure and enhance shareholder value over time by delivering stable and repeatable risk-adjusted returns. Our transformational strategy is focused on the following priorities: (i) concentrate our business on our core middle-market commercial real estate lending business; (ii) divest our legacy REO portfolio and ultimately minimize our REO holdings; (iii) divest our retail property management business; (iv) optimize our capital structure and reduce our outstanding indebtedness; (v) reduce our total expense base; and (vi) reallocate our capital and cash proceeds from divesting our non-core assets into growing our core middle-market commercial real estate lending activities.
As an organization, we may not have the capacity or ability to successfully accomplish all of the priorities we have identified for our strategy and transformation initiative in the timeframe we desire, or at all. In addition, the strategy may not yield the results we currently anticipate (or results that will exceed those that might be obtained under our prior strategy), particularly, if we fail to successfully execute on one or more of the priorities we have identified for our strategy, even if we successfully implement one or more other priorities. As a result, we may not be able to implement and realize the anticipated benefits from our strategy.
Events and circumstances, such as financial or unforeseen difficulties, market disruptions, delays and unexpected costs, may occur that could result in our not realizing desired outcomes. If we fail to implement our strategy in accordance with our expectations or achieve some or all of the expected benefits of these activities, it could have a material adverse effect on our competitive position, business, financial condition, results of operations and cash flows. In addition, even if we successfully implement our strategy, we still may not realize its anticipated benefits. Even if we implement our strategy in accordance with our expectations and the anticipated benefits are substantially realized, there may be consequences or business impacts that were not expected.
Additionally, our strategy will bring additional risks to the business such as an increased dependence on our core lending business, which could result in the existing risks associated with that business being magnified.
Further, as a result of our business transformation plan and the streamlining of our business contemplated thereby, we may experience a loss of continuity, loss of accumulated knowledge or loss of efficiency during transitional periods. The execution of our transformation plan can require a significant amount of management and other employees’ time and focus, which may divert attention from day-to-day operating activities and growing our business.
Our transformation plan contemplates that we will sell certain assets that are no longer central to our strategic objectives, such as our retail property management business. Our transformation plan also contemplates that we divest certain of our legacy REO holdings and, ultimately, minimize our REO holdings. Any such disposition or attempted disposition is subject to risks, including risks related to the terms and timing of such disposition, risks related to obtaining necessary government or regulatory approvals, risks
70
related to retained liabilities not subject to our control, and risks related to the need to provide transition services to the disposed business, which may result in the diversion of resources and focus.
As we execute on our plans to focus on our core commercial real estate lending business and divest assets unrelated to such business, we may be required to record material asset impairment charges, which, while non-cash in nature, could materially and adversely impact our ability to maintain a required ratio or meet a required test set forth in our debt instruments.
As RAIT continues to move forward with its strategy to transform itself into a more focused, cost-efficient and lower leveraged company concentrated on its core commercial real estate lending business, it intends to divest itself of various assets not related to its core commercial real estate lending business. Assets expected to be divested include RAIT’s legacy REO portfolio and its retail property management business. As RAIT identifies assets for divestment, RAIT may be required to record non-cash asset impairment charges which may be material. For the quarter ended June 30, 2017, RAIT incurred non-cash asset and goodwill impairment charges of $94.2 million primarily related to the carrying value of certain legacy properties as well as a reduction in the carrying value of RAIT’s retail property management business, reflective of the challenging retail environment. If RAIT needs to recognize further asset impairment charges in future quarters, such charges, while non-cash in nature, could materially and adversely impact our ability to maintain a required ratio or meet a required test set forth in our debt instruments.
Our failure to comply with the indentures or any other instruments or agreements governing any current or future indebtedness, or, if applicable, a failure to maintain a required ratio, meet a required test or comply with a financial covenant thereunder, could result in an event of default and related cross-defaults or an acceleration of our indebtedness that, if not cured or waived, could materially and adversely impact our liquidity, financial condition, results of operations and future prospects.
If an event of default was to be asserted under any of the indentures or any other instruments or agreements governing our current or future indebtedness, or, if applicable, a failure to maintain a required ratio, meet a required test or comply with a financial covenant thereunder, the holders of the defaulted debt could cause all amounts outstanding with respect to that debt to be due and payable immediately. We cannot assure you that our assets or cash flow would be sufficient to fully repay borrowings under such debt instruments if accelerated upon an event of default. In addition, any event of default or declaration of acceleration under any such debt instrument could also result in an event of default under one or more of our other debt instruments.
Management does not believe, based on RAIT’s own diligence and after consultation with RAIT’s outside legal counsel, that any events of default have occurred under the indentures, instruments and other agreements that govern our current indebtedness, nor do we believe that any cross-defaults have occurred thereunder or that acceleration of any of our indebtedness has occurred, including due to (a) our recently announced financial results, (b) the non-cash asset impairment charges RAIT recorded for the quarter ended June 30, 2017, (c) our on-going strategic transformation and the divestitures contemplated thereby of assets unrelated to our core commercial real estate lending business, or (d) other publicly-disclosed recent developments related to RAIT. However, there can be no assurance that the lenders under our indentures or any other instruments or agreements governing our current or future indebtedness will not assert that any recent developments, alone or in combination with future developments, give rise to an event of default under such indentures, instruments or other agreements. If an event of default were to be asserted and/or if an event of default was ultimately deemed to have occurred, RAIT's liquidity, financial condition, results of operations and future prospects could be materially and adversely impacted.
71
We withheld the following common shares to satisfy tax withholding obligations during the quarter ended June 30, 2017 arising from the vesting of restricted share awards made pursuant to the RAIT Financial Trust 2012 Incentive Award Plan. These common shares may be deemed to be “issuer purchases” of common shares that are required to be disclosed pursuant to this item.
|
Period |
|
Total Number of Shares Purchased |
|
|
Price Paid per Share |
|
|
Total Number of Shares Purchased as Part of Publicly Announced Plans or Programs |
|
|
Maximum Number (or Approximate Dollar Value) of Shares that May Yet Be Purchased Under the Plans or Programs |
|
||||
|
04/01/2017 to 04/30/2017 |
|
|
8,962 |
|
|
|
3.06 |
|
(1) |
|
8,962 |
|
|
|
- |
|
|
05/01/2017 to 05/31/2017 |
|
|
17,467 |
|
|
|
2.39 |
|
(1) |
|
17,467 |
|
|
|
- |
|
|
06/01/2017 to 06/30/2017 |
|
|
- |
|
|
|
- |
|
|
|
- |
|
|
|
- |
|
|
Total |
|
|
26,429 |
|
|
$ |
2.62 |
|
(1) |
|
26,429 |
|
|
|
- |
|
|
(1) |
The price reported is the average price paid per share using our closing stock price on the New York Stock Exchange on the vesting date of the relevant award. |
|
(2) |
The price reported is the weighted average price paid per share using our closing stock price on the New York Stock Exchange on the vesting date of the relevant awards. |
|
(a) |
Exhibits |
The exhibits filed as part of this quarterly report on Form 10-Q are identified in the exhibit index immediately following the signature page of this Report. Such Exhibit Index is incorporated herein by reference.
72
Pursuant to the requirements of the Securities Exchange Act of 1934, the registrant has duly caused this report to be signed on its behalf by the undersigned thereunto duly authorized.
|
|
|
RAIT FINANCIAL TRUST (Registrant) |
|
|
|
|
|
|
|
Date: August 9, 2017 |
|
By: |
/s/ Scott L.N. Davidson |
|
|
|
|
Scott L.N. Davidson, Chief Executive Officer and President |
|
|
|
|
(On behalf of the registrant and as its Principal Executive Officer) |
|
|
|
|
|
|
Date: August 9, 2017 |
|
By: |
/s/ Paul W. Kopsky, Jr. |
|
|
|
|
Paul W. Kopsky, Jr., Chief Financial Officer and Treasurer |
|
|
|
|
(On behalf of the registrant and as its Principal Financial Officer) |
|
Date: August 9, 2017 |
|
By: |
/s/ Alfred J. Dilmore |
|
|
|
|
Alfred J. Dilmore, Chief Accounting Officer |
|
|
|
|
(On behalf of the registrant and as its Principal Accounting Officer) |
73
|
Exhibit Number |
|
Description of Documents |
|
|
|
|
|
3.1.1 |
|
Amended and Restated Declaration of Trust of RAIT Financial Trust (“RAIT”). Incorporated by reference to RAIT’s Registration Statement on Form S-11 (Registration No. 333-35077). |
|
|
|
|
|
3.1.2 |
|
Articles of Amendment to Amended and Restated Declaration of Trust of RAIT. Incorporated by reference to RAIT’s Registration Statement on Form S-11 (Registration No. 333-53067). |
|
|
|
|
|
3.1.3 |
|
Articles of Amendment to Amended and Restated Declaration of Trust of RAIT. Incorporated by reference to RAIT’s Registration Statement on Form S-2 (Registration No. 333-55518). |
|
|
|
|
|
3.1.4 |
|
Certificate of Correction to the Amended and Restated Declaration of Trust of RAIT. Incorporated by reference to RAIT’s Form 10-Q for the Quarterly Period ended March 31, 2002 (File No. 1-14760). |
|
|
|
|
|
3.1.5 |
|
Articles of Amendment to Amended and Restated Declaration of Trust of RAIT. Incorporated by reference to RAIT’s Form 8-K as filed with the Securities and Exchange Commission (“SEC”) on December 15, 2006 (File No. 1-14760). |
|
|
|
|
|
3.1.6 |
|
Articles of Amendment to Amended and Restated Declaration of Trust of RAIT. Incorporated by reference to RAIT’s Form 8-K as filed with the SEC on July, 1 2011 (File No. 1-14760). |
|
|
|
|
|
3.1.7 |
|
Articles Supplementary (the “Series A Articles Supplementary”) relating to the 7.75% Series A Cumulative Redeemable Preferred Shares of Beneficial Interest (the “Series A Preferred Shares”) of RAIT. Incorporated by reference to RAIT’s Form 8-K as filed with the SEC on March 18, 2004 (File No. 1-14760). |
|
|
|
|
|
3.1.8 |
|
Certificate of Correction to the Series A Articles Supplementary. Incorporated by reference to RAIT’s Form 8-K as filed with the SEC on March 18, 2004 (File No. 1-14760). |
|
|
|
|
|
3.1.9 |
|
Articles Supplementary relating to the 8.375% Series B Cumulative Redeemable Preferred Shares of Beneficial Interest, (the “Series B Preferred Shares”) of RAIT. Incorporated by reference to RAIT’s Form 8-K as filed with the SEC on October 1, 2004 (File No. 1-14760). |
|
|
|
|
|
3.1.10 |
|
Articles Supplementary relating to the 8.875% Series C Cumulative Redeemable Preferred Shares of Beneficial Interest, (the “Series C Preferred Shares”) of RAIT. Incorporated by reference to RAIT’s Form 8-A as filed with the SEC on June 29, 2007 (File No. 1-14760). |
|
|
|
|
|
3.1.11 |
|
Articles Supplementary relating to Series A Preferred Shares, Series B Preferred Shares and Series C Preferred Shares. Incorporated by reference to RAIT’s Form 8-K as filed with the SEC on May 25, 2012 (File No. 1-14760). |
|
|
|
|
|
3.1.12 |
|
Certificate of Correction relating to Series A Preferred Shares, Series B Preferred Shares and Series C Preferred Shares. Incorporated by reference to RAIT’s Form 10-Q for the quarterly period ended June 30, 2012 (File No. 1-14760). |
|
|
|
|
|
3.1.13 |
|
Articles Supplementary (the “Series D Articles Supplementary”) relating to the Series D Cumulative Redeemable Preferred Shares of Beneficial Interest (the “Series D Preferred Shares”) of RAIT. Incorporated by reference to RAIT’s Form 8-K as filed with the SEC on October 4, 2012 (File No. 1-14760). |
|
|
|
|
|
3.1.14 |
|
Articles Supplementary relating to the Series E Cumulative Redeemable Preferred Shares of Beneficial Interest (the “Series E Preferred Shares”) of RAIT. Incorporated by reference to RAIT’s Form 8-K as filed with the SEC on December 4, 2012 (File No.1-14760). |
|
|
|
|
|
3.1.15 |
|
Amendment dated November 30, 2012 to the Series D Articles Supplementary. Incorporated by reference to RAIT’s Form 8-K as filed with the SEC on December 4, 2012 (File No.1-14760). |
|
|
|
|
|
3.1.16 |
|
Articles Supplementary relating to the Series A Preferred Shares. Incorporated by reference to RAIT’s Form 8-K as filed with the SEC on June 13, 2014 (File No. 1-14760). |
|
|
|
|
|
3.2.1
3.2.2
3.2.3 |
|
Amended and Restated Bylaws of RAIT Financial Trust, as adopted on November 16, 2016. Incorporated by reference to RAIT’s Form 8-K as filed with the SEC on November 17, 2016 (File No. 1-14760).
First Amendment to the Amended and Restated Bylaws of RAIT. Incorporated by reference to RAIT’s Form 8-K as filed with the SEC on June 28, 2017 (File No. 1-14760).
Second Amendment to the Amended and Restated Bylaws of RAIT. Incorporated by reference to RAIT’s Form 8-K as filed with the SEC on August 8, 2017 (File No. 1-14760). |
|
|
|
|
74
|
Exhibit Number |
|
Description of Documents |
|
|
Form of Certificate for Common Shares of Beneficial Interest. Incorporated by reference to RAIT’s Form 8-K as filed with the SEC on July 1, 2011 (File No. 1-14760). |
75
|
Number |
|
Description of Documents |
|
|
|
|
|
4.1.2 |
|
Form of Certificate for the Series A Preferred Shares. Incorporated by reference to RAIT’s Form 8-K as filed with the SEC on March 22, 2004 (File No. 1-14760). |
|
|
|
|
|
4.1.3 |
|
Form of Certificate for the Series B Preferred Shares. Incorporated by reference to RAIT’s Form 8-K as filed with the SEC on October 1, 2004 (File No. 1-14760). |
|
|
|
|
|
4.1.4 |
|
Form of Certificate for the Series C Preferred Shares. Incorporated by reference to RAIT’s Form 8-A as filed with the SEC on June 29, 2007 (File No. 1-14760). |
|
|
|
|
|
4.1.5 |
|
Form of Certificate for the Series D Preferred Shares. Incorporated by reference to RAIT’s Form 8-K as filed with the SEC on October 23, 2012 (File No. 1-14760). |
|
|
|
|
|
4.1.6 |
|
Form of Certificate for the Series E Preferred Shares. Incorporated by reference to RAIT’s Form 8-K as filed with the SEC on October 23, 2012 (File No. 1-14760). |
|
|
|
|
|
4.2.1 |
|
Base Indenture dated as of December 10, 2013 between RAIT, as issuer, and Wells Fargo Bank, National Association., as trustee. Incorporated by reference to RAIT’s Form 8-K as filed with the SEC on December 13, 2013 (File No. 1-14760). |
|
|
|
|
|
4.2.2 |
|
Supplemental Indenture dated as of December 10, 2013 between RAIT, as issuer, and Wells Fargo Bank, National Association., as trustee. Incorporated by reference to RAIT’s Form 8-K as filed with the SEC on December 13, 2013 (File No. 1-14760). |
|
|
|
|
|
4.2.3 |
|
Form of RAIT 4.00% Convertible Senior Note due 2033 (included in Exhibit 4.2.2). Incorporated by reference to RAIT’s Form 8-K as filed with the SEC on December 13, 2013 (File No. 1-14760). |
|
|
|
|
|
4.3.1 |
|
Base Indenture dated as of March 21, 2011 between RAIT, as issuer, and Wells Fargo Bank, National Association., as trustee. Incorporated by reference to RAIT’s Form 8-K as filed with the SEC on March 22, 2011 (File No. 1-14760). |
|
|
|
|
|
4.3.2 |
|
Supplemental Indenture dated as of March 21, 2011 between RAIT, as issuer, and Wells Fargo Bank, National Association., as trustee. Incorporated by reference to RAIT’s Form 8-K as filed with the SEC on March 22, 2011 (File No. 1-14760). |
|
|
|
|
|
4.4 |
|
Indenture dated as of October 5, 2011 between RAIT and Wilmington Trust, National Association, as trustee. Incorporated by reference to RAIT’s Form 10-Q for the quarterly period ended September 30, 2011 (File No. 1-14760). |
|
|
|
|
|
4.5.1 |
|
Registration Rights Agreement dated as of October 1, 2012 by and among RAIT and ARS VI Investor I, LLC (“ARS VI”). Incorporated by reference to RAIT’s Form 8-K as filed with the SEC on October 4, 2012 (File No. 1-14760). |
|
|
|
|
|
4.5.2 |
|
Amendment No. 1 to Registration Rights Agreement dated as of April 25, 2014 by and among RAIT and ARS VI. Incorporated by reference to RAIT’s Registration Statement on Form S-3 (Registration No. 333-195547). |
|
|
|
|
|
4.5.3 |
|
Common Share Purchase Warrant No.1 dated October 17, 2012 issued by RAIT to ARS VI. Incorporated by reference to RAIT’s Form 8-K as filed with the SEC on October 23, 2012 (File No. 1-14760). |
|
|
|
|
|
4.5.4 |
|
Common Share Appreciation Right No.1 dated October 17, 2012 issued by RAIT to ARS VI. Incorporated by reference to RAIT’s Form 8-K as filed with the SEC on October 23, 2012 (File No. 1-14760). |
|
|
|
|
|
4.5.5 |
|
Common Share Purchase Warrant No. 2 dated November 15, 2012 issued by RAIT to ARS VI. Incorporated by reference to RAIT’s Form 8-K as filed with the SEC on November 21, 2012 (File No.1-14760). |
|
|
|
|
|
4.5.6 |
|
Common Share Appreciation Right No. 2 dated November 15, 2012 issued by RAIT to ARS VI. Incorporated by reference to RAIT’s Form 8-K as filed with the SEC on November 21, 2012 (File No.1-14760). |
|
|
|
|
|
4.5.7 |
|
Common Share Purchase Warrant No. 3 dated December 18, 2012 issued by RAIT to ARS VI. Incorporated by reference to RAIT’s Form 8-K as filed with the SEC on December 18, 2012 (File No.1-14760). |
|
|
|
|
|
4.5.8 |
|
Common Share Appreciation Right No. 3 dated December 18, 2012 issued by RAIT to ARS VI. Incorporated by reference to RAIT’s Form 8-K as filed with the SEC on December 18, 2012 (File No.1-14760). |
|
|
|
|
|
4.5.9 |
|
Common Share Purchase Warrant No. 4 dated March 27, 2014 issued by RAIT Financial Trust to ARS VI. Incorporated by reference to RAIT’s Form 8-K as filed with the SEC on March 27, 2014 (File No. 1-14760). |
|
|
|
|
|
4.5.10 |
|
Common Share Appreciation Right No. 4 dated March 27, 2014 issued by RAIT Financial Trust to ARS VI. Incorporated by reference to RAIT’s Form 8-K as filed with the SEC on March 27, 2014 (File No. 1-14760). |
76
|
Number |
|
Description of Documents |
|
|
|
|
|
4.6.1 |
|
Base Indenture dated as of December 10, 2013 between RAIT, as issuer, and Wells Fargo Bank, National Association., as trustee. Incorporated by reference to RAIT’s Form 8-K as filed with the SEC on December 13, 2013 (File No. 1-14760). |
|
|
|
|
|
4.6.2 |
|
Supplemental Indenture dated as of December 10, 2013 between RAIT, as issuer, and Wells Fargo Bank, National Association., as trustee. Incorporated by reference to RAIT’s Form 8-K as filed with the SEC on December 13, 2013 (File No. 1-14760). |
|
|
|
|
|
4.6.3 |
|
Form of RAIT 4.00% Convertible Senior Note due 2033 (included in Exhibit 4.6.2). Incorporated by reference to RAIT’s Form 8-K as filed with the SEC on December 13, 2013 (File No. 1-14760). |
|
|
|
|
|
4.6.4 |
|
Second Supplemental Indenture, dated as of April 14, 2014, between RAIT Financial Trust, as issuer, and Wells Fargo Bank, National Association, as trustee. Incorporated by reference to RAIT’s Form 8-A as filed with the SEC on April 14, 2014. (File No. 1-14760). |
|
|
|
|
|
4.6.5 |
|
Form of 7.625% Senior Notes due 2024 (included as Exhibit A to Exhibit 4.6.4 hereto). |
|
|
|
|
|
4.6.6 |
|
Third Supplemental Indenture, dated as of August 14, 2014, between RAIT, as Issuer, and Wells Fargo Bank, National Association, as trustee. Incorporated by reference to RAIT’s Form 8-A as filed with the SEC on August 14, 2014. |
|
|
|
|
|
4.6.7 |
|
Form of 7.125% Senior Notes due 2019 (included as Exhibit A to Exhibit 4.6.6 hereto). |
|
|
|
|
|
|
|
Certain Instruments defining the rights of holders of long-term debt securities of the Registrant and its subsidiaries are omitted pursuant to Item 601(b)(4)(iii) of Regulation S-K. The Registrant hereby undertakes to furnish to the SEC, upon request, copies of any such instruments. |
|
10.1 |
|
Share Award Grant Agreement, dated January 9, 2017, by and between RAIT Financial Trust and Scott L. N. Davidson. Incorporated by reference to RAIT’s Form 10-K for the fiscal year ended December 31, 2016 (File No. 1-14760). |
|
|
|
|
|
10.2 |
|
Form of Share Appreciation Rights Award Agreement adopted under the RAIT 2012 Incentive Award Plan (“IAP”) on February 14, 2017. Incorporated by reference to RAIT’s Form 8-K as filed with the SEC on February 21, 2017. (File No. 1-14760). |
|
|
|
|
|
10.3 |
|
Form of Share Award Grant Agreement for participants other than non-management trustees adopted under the IAP on February 14, 2017. Incorporated by reference to RAIT’s Form 8-K as filed with the SEC on February 21, 2017. (File No. 1-14760). |
|
|
|
|
|
10.4 |
|
Offer Letter dated February 17, 2017 between RAIT Financial Trust and Paul W. Kopsky, Jr. Incorporated by reference to RAIT’s Form 8-K as filed with the SEC on February 21, 2017. (File No. 1-14760). |
|
|
|
|
|
10.5 |
|
Employment Agreement dated February 17, 2017 between RAIT Financial Trust and Paul W. Kopsky, Jr. Incorporated by reference to RAIT’s Form 8-K as filed with the SEC on February 21, 2017. (File No. 1-14760). |
|
|
|
|
|
10.6 |
|
Employment Agreement dated April 21, 2017 between RAIT Financial Trust and John J. Reyle. Incorporated by reference to RAIT’s Form 8-K as filed with the SEC on April 21, 2017. (File No. 1-14760). |
|
|
|
|
|
10.7 |
|
Employment Agreement dated April 21, 2017 between RAIT Financial Trust and Glenn Riis. Incorporated by reference to RAIT’s Form 10-Q for the Quarterly Period ended March 31, 2017 as filed with the SEC on May 5, 2017. (File No. 1-14760).
|
|
10.8 |
|
Cooperation Agreement dated May 25, 2017 by and among RAIT Financial Trust and Highland Capital Management, L.P. and each of the other persons set forth on the signature page of the Cooperation Agreement. Incorporated by reference to RAIT’s Form 8-K as filed with the SEC on May 26, 2017 (File No. 1-14760). |
|
10.9 |
|
Securities Repurchase Agreement dated as of June 22, 2017 by and among ARS VI Investor I, LP, RAIT Financial Trust, RAIT Partnership, L.P. Taberna Realty Finance Trust, and RAIT Asset Holdings IV, LLC. Incorporated by reference to RAIT’s Form 8-K as filed with the SEC on June 28, 2017 (File No. 1-14760). |
|
10.10 |
|
RAIT Financial Trust 2017 Incentive Award Plan, as Amended and Restated June 22, 2017 (the “IAP”). Incorporated by reference to RAIT’s Form 8-K as filed with the SEC on June 28, 2017 (File No. 1-14760). |
77
|
Number |
|
Description of Documents |
|
10.11
|
|
First Amendment to Guaranty dated June 26, 2017 among Barclays Bank PLC, as purchaser, and RAIT Financial Trust, as guarantor. Incorporated by reference to RAIT’s Form 8-K as filed with the SEC on June 30, 2017 (File No. 1-14760). |
|
10.12
|
|
Third Amendment to Guaranty dated June 26, 2017 among Barclays Bank PLC, as purchaser, and RAIT Financial Trust, as guarantor. Incorporated by reference to RAIT’s Form 8-K as filed with the SEC on June 30, 2017 (File No. 1-14760). |
|
10.13
|
|
Second Amendment dated as of June 29, 2017 to the Amended and Restated Guaranty dated as of July 28, 2014 made by RAIT Financial Trust, as guarantor, in favor of Citibank, N.A., acknowledged and agreed to by RAIT CMBS Conduit I, LLC and RAIT CRE Conduit III, LLC. Incorporated by reference to RAIT’s Form 8-K as filed with the SEC on June 30, 2017 (File No. 1-14760). |
|
10.14
|
|
RAIT 2017 Long Term Incentive Plan Form of Performance Share Unit Award Grant Agreement adopted April 26, 2017 under the IAP. Filed herewith. |
|
10.15 |
|
Form of Share Award Grant Agreement for executive officers adopted under the IAP on April 26, 2017. Filed herewith. |
|
10.16 |
|
RAIT 2017 Annual Incentive Compensation Plan Form of Target Cash Bonus Award Grant Agreement adopted under the IAP on April 26, 2017. Filed herewith. |
|
10.17 |
|
IAP Form of Share Award Grant Agreement for non-management trustees adopted June 28, 2017. Filed herewith. |
|
10.18 |
|
IAP Form of Share Award Grant Agreement for Chairman of the Board of Trustees adopted June 28, 2017. Filed herewith. |
|
10.19 |
|
IAP Notice of Amendment of Outstanding Grants under the IAP adopted June 28, 2017. Filed herewith. |
|
|
|
|
|
12.1 |
|
Statements regarding computation of ratios as of June 30, 2017, filed herewith. |
|
|
|
|
|
31.1 |
|
Rule 13a-14(a) Certification by the Chief Executive Officer of RAIT, filed herewith. |
|
|
|
|
|
31.2 |
|
Rule 13a-14(a) Certification by the Chief Financial Officer of RAIT, filed herewith. |
|
|
|
|
|
32.1 |
|
Section 1350 Certification by the Chief Executive Officer of RAIT, filed herewith. |
|
|
|
|
|
32.2 |
|
Section 1350 Certification by the Chief Financial Officer of RAIT, filed herewith. |
|
|
|
|
|
101 |
|
Pursuant to Rule 405 of Regulation S-T, the following financial information from RAIT’s Quarterly Report on Form 10-Q for the period ended June 30, 2017 is formatted in XBRL interactive data files: (i) Consolidated Statements of Operations for the three and six months ended June 30, 2017 and 2016; (ii) Consolidated Balance Sheets as of June 30, 2017 and December 31, 2016; (iii) Consolidated Statements of Comprehensive Income (Loss) for the three and six months ended June 30, 2017 and 2016; (iv) Consolidated Statement of Changes in Equity for the six months ended June 30, 2017; (v) Consolidated Statements of Cash Flows for the six months ended June 30, 2017 and 2016; and (vi) Notes to Unaudited Consolidated Financial Statements, filed herewith. |
78