Attached files
| file | filename |
|---|---|
| EXCEL - IDEA: XBRL DOCUMENT - CASCADE MICROTECH INC | Financial_Report.xls |
| EX-31.2 - EX-31.2 - CASCADE MICROTECH INC | d845533dex312.htm |
| EX-23.1 - EX-23.1 - CASCADE MICROTECH INC | d845533dex231.htm |
| EX-21.1 - EX-21.1 - CASCADE MICROTECH INC | d845533dex211.htm |
| EX-32.1 - EX-32.1 - CASCADE MICROTECH INC | d845533dex321.htm |
| EX-31.1 - EX-31.1 - CASCADE MICROTECH INC | d845533dex311.htm |
| EX-32.2 - EX-32.2 - CASCADE MICROTECH INC | d845533dex322.htm |
Table of Contents
UNITED STATES
SECURITIES AND EXCHANGE COMMISSION
WASHINGTON, D. C. 20549
FORM 10-K
| x | ANNUAL REPORT PURSUANT TO SECTION 13 OR 15(d) OF THE SECURITIES EXCHANGE ACT OF 1934 |
For the Fiscal Year Ended: December 31, 2014
OR
| ¨ | TRANSITION REPORT PURSUANT TO SECTION 13 OR 15(d) OF THE SECURITIES EXCHANGE ACT OF 1934 |
Commission File Number: 000-51072
CASCADE MICROTECH, INC.
(Exact name of registrant as specified in its charter)
| Oregon | 93-0856709 | |
| (State or other jurisdiction of incorporation or organization) |
(I.R.S. Employer Identification No.) | |
| 9100 S.W. Gemini Drive Beaverton, Oregon |
97008 | |
| (Address of principal executive offices) | (Zip Code) | |
| Registrant’s telephone number, including area code: (503) 601-1000 | ||
| Securities Registered pursuant to Section 12(b) of the Act: | ||
| Title of each class |
Name of each exchange on which registered | |
| Common Stock, $0.01 par value | NASDAQ Global Market |
Securities registered pursuant to Section 12(g) of the Act: None
Indicate by check mark if the Registrant is a well-known seasoned issuer, as defined in Rule 405 of the Securities Act. Yes ¨ No x
Indicate by check mark if the Registrant is not required to file reports pursuant to Section 13 or Section 15(d) of the Act. Yes ¨ No x
Indicate by check mark whether the registrant (1) has filed all reports required to be filed by Section 13 or 15(d) of the Securities Exchange Act of 1934 during the preceding 12 months (or for such shorter period that the registrant was required to file such reports), and (2) has been subject to such filing requirements for the past 90 days: Yes x No ¨
Indicate by check mark whether the registrant has submitted electronically and posted on its corporate Web site, if any, every Interactive Data File required to be submitted and posted pursuant to Rule 405 of Regulation S-T (§ 232.405 of this chapter) during the preceding 12 months (or for such shorter period that the registrant was required to submit and post such files). Yes x No ¨
Indicate by check mark if disclosure of delinquent filers pursuant to Item 405 of Regulation S-K is not contained herein, and will not be contained, to the best of registrant’s knowledge, in definitive proxy or information statements incorporated by reference in Part III of this Form 10-K, or any amendment to this Form 10-K. x
Indicate by check mark whether the registrant is a large accelerated filer, an accelerated filer, a non-accelerated filer or a smaller reporting company. See definition of “accelerated filer,” “large accelerated filer” and “smaller reporting company” in Rule 12b-2 of the Exchange Act.
| Large accelerated filer | ¨ | Accelerated filer | x | |||
| Non-accelerated filer | ¨ (Do not check if a smaller reporting company) | Smaller reporting company | ¨ | |||
Indicate by check mark whether the registrant is a shell company (as defined in Rule 12b-2 of the Act). Yes ¨ No x
The aggregate market value of the voting and non-voting common equity held by non-affiliates of the registrant was $197,039,129 computed by reference to the last sales price ($13.65) as reported by the NASDAQ Global Market, as of the last business day of the Registrant’s most recently completed second fiscal quarter (June 30, 2014).
The number of shares outstanding of the registrant’s common stock as of March 2, 2015 was 16,549,594 shares.
Documents Incorporated by Reference
Portions of the registrant’s definitive Proxy Statement for the 2015 Annual Shareholders’ Meeting are incorporated by reference into Part III.
Table of Contents
CASCADE MICROTECH, INC.
2014 FORM 10-K ANNUAL REPORT
1
Table of Contents
PART I
| ITEM 1. | BUSINESS |
Company Profile
Our mission is to enable the most challenging measurements required by the semiconductor community. We design, develop, manufacture and market advanced wafer probing, thermal and reliability solutions for the electrical measurement and testing of high performance semiconductor devices. Our products enable precision on-wafer measurement of integrated circuits and are often used in the early phases of the development of semiconductor processes where the accuracy and repeatability of measurements is critical to achieving yield from advanced process nodes. Many of our products are also used in production applications to test semiconductor devices prior to completion of the manufacturing process. We design, manufacture and assemble our products in Beaverton, Oregon, North St. Paul, Minnesota, Munich, Germany, and Dresden, Germany and maintain global sales, service and support centers in North America, Germany, Japan, Taiwan, China and Singapore.
We were incorporated in Oregon in 1984 and our shares began trading on the NASDAQ Stock Market in 2004, and now trade on the NASDAQ Global Market. Our principal executive offices are located at 9100 S.W. Gemini Drive, Beaverton, Oregon 97008.
We operate in two business segments: Systems and Probes. Sales of our probe stations, thermal subsystems and reliability test systems are included in the Systems segment and sales of our analytical probes and production probe cards are included in the Probes segment.
Industry Background
Mobile electronics, including cell phones, tablet devices and laptops, are the prevalent consumers of semiconductor devices and the demands of these portable/mobile devices in terms of reliability and performance continue to accelerate. According to Gartner, Inc. (“Gartner”), a leading industry research firm, mobile data traffic grew 71% in 2014 and is expected to grow 59% in 2015, driven by demand for mobile video. These trends are driving growth in semiconductor sales and development. Gartner estimates that total worldwide sales of semiconductors reached $340 billion in 2014, an increase of 7.9% from $315 billion in 2013, and is expected to increase 5.4% to $358 billion in 2015. In addition, Gartner estimates that the top 5 semiconductor vendors represented 41% of total sales in 2014, illustrating the concentration of the industry.
Over the next decade, we anticipate the following major trends in the semiconductor market:
| • | the continued drive to smaller geometries; |
| • | the drive for more advanced packaging technologies such as 3D/TSV (Through Silicon Via); |
| • | the need for higher bandwidth and increased content; |
| • | the continued integration of the physical interfaces in the semiconductor device package; and |
| • | the shift to 450 mm diameter wafers. |
We believe consumer demand for more data drives the semiconductor industry to increase device integration, which is largely associated with the move to smaller geometries and increased complexities, and increases the need to understand the reliability of new semiconductor devices. We believe this trend is the major driver of new device, process node, and semiconductor material development, and requires our customers to increase the testing of their products at the wafer level. The continued increase in wafer-level testing, and need for our customers to better understand how their products perform, increased demand for our products and supported our growth in 2014. We believe these trends have us well-positioned for continued growth in 2015 and beyond.
Advancements in manufacturing technologies, such as smaller semiconductor device elements, new materials and larger wafer sizes have permitted semiconductor manufacturers to achieve greater levels of functionality at a lower cost. These advancements in semiconductor manufacturing technologies have also led to increasing challenges in the design, manufacturing and testing of devices.
2
Table of Contents
Chips are measured and tested multiple times throughout the design and manufacturing process to ensure the integrity of the chip design and the quality of the manufacturing process. Our products enable the testing of chips during design, where precision and accuracy are required in performing diagnoses to improve the design and manufacturing of new products, and during production to monitor the quality of the manufacturing process, where rapid testing at high volumes requires reliability and repeatability to screen out defective parts prior to incurring further costs in packaging and shipping the parts. Our strong presence in engineering test segments also gives us enhanced visibility of new chip processes and applications, thus aiding our planning and development of next generation production tools.
We sell our solutions to most segments of the semiconductor industry, including manufacturers of wireless and wired, communications, microprocessors and other logic and memory devices. A substantial portion of our revenue is generated from sales of our probe stations and analytical probes to research and development laboratories of semiconductor manufacturers, as well as to fabless semiconductor companies and academic institutions. As a result, we sell to a geographically diverse customer base, with more than 65% of our annual revenues in each of the last three years generated from customers outside of North America, primarily in Taiwan, Japan, Korea, China, Singapore, Germany, France, the United Kingdom and other countries in Asia and Europe.
Sales of our products and our overall operating results depend, in significant part, on the level of capital expenditures related to semiconductor research and development, which in turn depends upon current and anticipated market demand for semiconductor devices. While our financial results are impacted by cycles within the semiconductor industry, we believe our business cycles are typically less pronounced than those of other semiconductor equipment companies. We believe this is due to our greater reliance on our customers’ research and development capital spending and usage of test consumables rather than on our customers spending purely to increase production capacity.
Products
We design, manufacture and sell multiple product lines, including probe stations, thermal subsystems, reliability test systems, analytical probes, production probe cards and various services and accessories. A probe station is typically used in conjunction with our analytical probes to test chips in wafer form, together forming a probing system. Thermal subsystems are an integral component of a probe station when testing over temperature is required. Analytical probes and production probe cards electrically connect test equipment to the devices under test and are sold as consumable test tooling, which are mounted into probe stations.
Probe Stations. Probing systems are required in the development of new generations of semiconductor processes and designs, and we expect that the demand for systems will continue to grow with the increasing complexity of new processes and designs. Process development complexities and costs have continually increased as each generation of semiconductor processes has required the integration of more layers of smaller chip elements incorporating a longer list of new materials. Probing systems are a fundamental tool for characterizing and verifying the electrical performance and reliability of the new chip elements.
We offer probe stations for 300 mm, 200 mm and 150 mm or smaller wafer sizes. Probe stations are highly configurable depending upon the size and type of wafer, the particular characteristics of the device design that the customer is testing, the required measurements, the temperatures at which the device is tested and the test equipment that the customer is using. Our probe stations are available in manual, semi- and fully-automated configurations. Our CM300 probe station, introduced in January, 2013, represents the first time the flexibility and accuracy of an analytical prober has been combined with the automation required to handle full cassettes of 300 mm wafers. Additionally, the CM300 is scalable from semi-automated to a cluster configuration (two fully- automated probers served by a shared Front Opening Universal Pod (“FOUP”) for silicon wafers and thermal control) in the field. The CM300 delivers new levels of capabilities to our traditional engineering market.
3
Table of Contents
In addition to sales of new probe stations, we also offer sales of used probe stations through our “SourceOne” certified pre-owned equipment program. Pre-owned equipment sales consist primarily of probe stations that have been traded-in by customers and reconditioned at one of our factories to meet current specifications. These probe stations are sold with the same support and one-year warranty as new probe stations, but at a lower price.
We believe that we have significant market share by revenue in probe stations and accessories worldwide. We believe we offer the widest product options and the best electrical measurement performance for most engineering test requirements.
Thermal Subsystems – Our thermal subsystems are designed and produced by ATT Systems, a wholly-owned subsidiary based in Munich, Germany, which we acquired in October 2013. ATT Systems produces thermal chuck systems used in probe stations, as well as specific systems for testing electronic components, hybrids, PCBs or other assemblies at the test site. Designed for thermal and mechanical stability and precision, our thermal subsystems offer the following ranges of modular solutions that can be used in new installations, as well as upgrades to existing equipment:
| • | A-Series: value-priced, air-cooled thermal chuck systems for a temperature range between -30°C and +400°C. The basic product offers an active-cooled chuck system without an external chiller for a temperature range between +25°C and +200°C at a lower price. |
| • | C-Series: air-cooled thermal chuck systems for applications where a wide temperature range between -60°C and +300°C is needed in a single system. |
| • | M-Series: designed for high power applications where a wide temperature range of between |
| • | -65°C and +300°C is needed. Each system contains a high-performance liquid-cooling unit. The optional Dry Air Kit and the Dew Point Control, which are available for the major prober systems, enable moisture free testing at low temperatures. |
| • | P-Series: line of peltier-based thermal chuck systems for a temperature range between -65°C and +150°C where high temperature uniformity is required. |
Reliability Test Systems – We acquired our reliability test products in July 2013 as part of the RTP Acquisition. Our reliability test products continue to be designed and manufactured in North St. Paul, Minnesota. The 1164 Reliability Test System is a modular and scalable test platform that can be used in a wide range of reliability test applications, including Electro Migration (EM), Stress Migration (SM), Time Dependent Dielectric Breakdown (TDDB), Stress Induced Leakage Current (SILC), Hot Carrier Injection (HCI) and Bias Temperature Instability (BTI). Each system consists of up to 64 individual application modules, which can be run in parallel and autonomously from one another, each paired with our unique Notebook Oven. Software analyzes the data gathered by the test products to statistically estimate failure times. In addition to the 1164 Reliability Test System, we also offer the Symphony Wafer Level Reliability (“WLR”) Test System which, when combined with either an automated or semi-automated probe station, and our Conductor software, provides users with the necessary tools for automated and unattended WRL testing to shorten product development cycles and enhance product quality. Test modules are common to both the 1164 and Symphony systems.
We believe these products offer the best throughput and lowest overall cost-of-test of any comparable reliability testing solutions.
Production Probe Cards. A production probe card temporarily connects one or more die or integrated circuits (“ICs”) on a wafer under test to a high-volume production tester. Probe cards are customized for each new chip type and physically wear out during usage in production testing; thus, probe cards are a consumable. Depending upon the test environment, production probe cards can last between several hundred thousand and several million contact cycles. Production probe card sales are driven by the number of times a device is tested, test parallelism, and device unit volumes.
4
Table of Contents
Our Pyramid Probe® card product line offers high frequency performance and is commonly used in testing chips for wireless applications. Factors driving wireless and radio frequency (“RF”) device probing include the growth of wireless consumer devices, such as smartphones, tablets, wearables, and the IoT (Internet of Things). The use of advanced packaging drives the desire for testing at the wafer level.
Analytical Probes. We offer over 50 different analytical probe models for engineering and production testing. Our Infinity series probes are designed with unique probe tips derived from our proprietary lithographic manufacturing technology, enabling superior electrical contacts on aluminum and copper pads. Analytical probes are used for a diverse set of applications including: device characterization, electrical simulation model development, failure analysis, and prototype design debugging. Our customer base for analytical probes includes universities, research institutes, semiconductor IDMs, semiconductor foundries, and fabless semiconductor companies. We continue to add new models of analytical probes that address measurements with higher complexities and at higher frequencies up to 1 THz.
Services and Support. In addition to routine installation services at the time of sale, we offer services to enable our customers to maintain and more effectively utilize our products and to enhance our customer relationships. In addition to traditional maintenance services, our applications engineers assist our customers in test methodologies to make advanced measurements on-wafer in both the lab and in fabrication.
During 2014, we launched the “MeasureOne” program, which creates a framework for collaboration with strategic business partners to offer test and measurement solutions to our customer base. Under the MeasureOne program, we collaborate with selected business partners that we consider leaders in measurement technologies to solve the measurement issues that our customers face in configuring and using various test equipment in their labs and production environments. As of December 31, 2014, our MeasureOne partners included Keysight Technologies and Dominion MicroProbes, Inc.
Customers
Our products are used by semiconductor manufacturers, test subcontractors, research organizations and designers. Fabless semiconductor suppliers do not manufacture their own semiconductors but they purchase our analytical probes and probe stations for research and development. They also purchase, or direct their foundries to purchase, our Pyramid Probe cards to test wafers manufactured for them. We have built strong relationships with our customers through frequent interactions over the past 30 years. To foster stronger customer relationships, we conduct analyses for the needs of our customers’ new labs or products, host seminars on topics such as measurement techniques and make proactive service calls. This close interaction has helped us build what we believe is a consistently loyal customer base. More than 1,000 companies purchased our products in 2014.
We believe our customers consider timely customer service and support to be an important aspect of our relationship. Our probe stations are installed at customer sites either by us, our manufacturers’ representatives or our distributors, depending on the complexity of the installation and the customer’s geographic location. We assist our customers in the selection, integration and use of our products through application engineering support. We also provide worldwide on-site training, seminars and telephone support. Our manufacturers’ representatives and distributors provide additional service and support.
In 2014, 2013 and 2012, no single customer accounted for 10% or more of our total revenues. Our top 10 customers accounted for approximately 34%, 33% and 29% of our total revenue in 2014, 2013 and 2012, respectively.
Segment and Enterprise-Wide Disclosures
See Note 18 of Notes to Consolidated Financial Statements included in Part II, Item 8 of this Form 10-K for certain financial information related to our segments and our enterprise-wide disclosures.
5
Table of Contents
Technology
We are a leading innovator in developing electrical measurement and production tools for on-wafer test. One of our stated growth strategies is to continue to develop next-generation technologies and to increase our value to our customers through providing Integrated Measurement Solutions. We have focused our research and development efforts on enabling our customers to make more precise electrical measurements in less time, on smaller and more densely packed devices, and with greater reliability over temperature.
Our core technologies include:
| • | Broadband/High-Frequency/High Speed Interconnects and Probing. In 1983, our founders created the first microwave analytical probes that enabled the first on-wafer 18 GHz measurements and accelerated the commercialization of gallium arsenide chips. Since then, we have continued to innovate. We use and maintain a wide variety of design, verification, fabrication and calibration technologies for high-frequency probes and interconnections. For example, we have developed a complete library of high-frequency circuit elements for our Pyramid Probe layouts, similar to passive element libraries for chip foundries. We believe that these technologies provide a competitive advantage by allowing us to more effectively design and commercialize production probe cards and analytical probes. |
| • | Precision On-Wafer Measurements. In 1993, we were first to commercialize a shielded probe station utilizing our patented MicroChamber technology that increased thermal measurement productivity by 10 times and current measurement resolutions by 1,000 times. Many of our engineering probe stations feature MicroChamber technology, which ensures a dark, electrically noise-free measurement environment to enable low-current measurements over a wide thermal range. Our engineering probe stations also incorporate our proprietary low-noise thermal chuck technologies that increase measurement integrity and reduce the time required to take precise measurements. In 2008, we introduced our Elite 300 probe station which improved low-current and low-voltage measurements. With our acquisition of SUSS MicroTec Test Systems GmbH (“SUSS Test”) in 2010, we further enhanced our technology capabilities to enable precise measurements at cryogenic temperatures and at various pressure levels. |
| • | Microfabrication. Since 1990, we have shipped products that utilize our proprietary lithographic manufacturing processes for depositing, lithographic patterning, etching and plating probe structures on flexible substrates that are similar to the processes used in making chips. Our proprietary Pyramid technology has been under development since 1992 and continues to evolve and improve. We continue to develop this technology and introduce new probe card and analytical probe designs using these proprietary technologies. At the center of a Pyramid Probe card, tester connections converge on the chips under test through our unique, lithographically defined microscopic probe tips and electrical interconnection wiring. Our processing continues to mature and evolve, enabling faster delivery times, larger probe areas, smaller tip dimensions and interconnects, and a wider range of test temperatures. As chip elements continue to shrink, we expect to be able to scale and evolve our lithographic processes to continue to meet our customers’ requirements. |
| • | Thermal Chuck Systems for Wafer Test. In October 2013, we acquired ATT Systems, which is a leader in the manufacturing of advanced thermal systems used in the testing of semiconductor wafers. These systems are used in wafer probing for engineering test, characterization, and production. This precise control over a wide thermal range enables measurements and tests over extended operating conditions and is a key part of the value proposition for semiconductor wafer test. As geometries have scaled and adoption of new devices, such as FinFETs and 3D structures, increase, the test over temperature and reliability testing at an extended high temperature range is becoming ever more important. We expect this trend for increased thermal test to continue. |
6
Table of Contents
Reliability Test Instrumentation. In July 2013, we acquired RTP, which specializes in package and WLR solutions for wafer process technologies and strengthens our position as a worldwide leader in the design, development and manufacture of advanced wafer probing solutions for the electrical measurement and test of semiconductor integrated circuits. We believe that the RTP technology will facilitate execution of our strategy of delivering Integrated Measurement Solutions that address emerging requirements at advanced semiconductor nodes, in part due to the complimentary nature of the reliability test products with our systems business of precision on-wafer measurements and the recently acquired thermal chuck systems for wafer test.
Sales, Marketing, Service and Support
We sell our probe stations, thermal subsystems, reliability test systems, analytical probes, and production probe cards through a combination of manufacturers’ representatives, distributors and direct sales people. Manufacturers’ representatives are independent third parties that agree to sell our products at our prices and on terms set by us, in return for a commission based on sales. We typically use manufacturers’ representatives in areas that we believe require greater levels of customer support than we can deliver from our own sales offices and where local language capabilities offer our customers an advantage. Distributors purchase our products and resell them at prices and upon terms set by the particular distributor. We typically use distributors where local regulations or business customs require more immediate service support or other local services. Finally, our direct sales force is made up of our salaried and commissioned employees.
We work closely with our customers to select the most appropriate product or solution which best fits their application. Sales of our engineering test solutions require significant interaction with our customers’ engineering labs and knowledge of their product and process development schedules and systems, as well as the ability to provide on-site demonstrations. We also may assist our customers in the design requirements for their products to enhance testability. Sales of our production test solutions require significant interaction with customer production test managers, knowledge of their specific product details and hands-on support, particularly for new customers. Our production customers generally undertake an extensive evaluation of new probe and prober technology before adoption. Our sales managers are experienced sales professionals with in-depth technical training, customer knowledge and industry expertise. The technical sophistication of our products requires us to provide substantial training to our manufacturers’ representatives, distributors and sales staff. We devote considerable effort and resources to developing a highly trained sales force that is responsive to our customers’ changing needs.
We focus our marketing efforts on developing a deep understanding of our customers’ processes and use cases such that our products and offerings are closely aligned with the emerging needs of advanced designers and manufacturers of semiconductor devices. Additionally, we focus on building awareness of our products among these customers. We market our products and capabilities by participating in trade shows, providing product and technical information in print and on our website, hosting technical and product seminars, advertising in trade publications and using direct mailings. In addition, our marketing staff performs market research and product planning. We also participate in joint sales and marketing activities with the leading complementary equipment and software suppliers to offer our customers complete test solutions. These relationships benefit us because they can lead to broader awareness and increased sales of our products.
Our Systems products are sold generally with a 12-month warranty. Customers may purchase an extended warranty from one to five years for certain products at the time of purchase. The extended warranty starts when the standard warranty ends. We also offer service contracts for some of our products of one year or more in duration, which can be purchased at any time after the expiration of any warranty. We employ service engineers in each of the four regions (Americas, Pacific Rim, Japan, Europe) in which we have sales and service divisions. We also contract with independent service representatives to provide product service in some foreign countries. Our Applications Engineers closely collaborate with our customers to help our customers optimize their use of our products in advanced applications. This collaboration enhances our early comprehension of emerging needs and affects our ability to address these needs with product features.
7
Table of Contents
Research and Development
Our industry is subject to rapid technological change and new product introductions and improvements. Our continued investment in research and development (“R&D”) and timely introduction of new products and services is critical to maintaining and improving our competitive position. Our growth depends upon our ability to rapidly develop new products that enable customers to improve their electrical, optical and mechanical measurements and increase their productivity. As a result, we expect to continue to devote substantial resources to research and development. Our research and development expense was $13.8 million in 2014 and $11.0 million in each of 2013 and 2012. We are currently devoting substantial resources to enhance the functionality of our probe stations and developing new products to expand our served markets. We are also devoting substantial R&D resources to production probe cards that enhance our capabilities in currently served markets as well as expanding into non-RF applications. Our product development is conducted against a Product Life Cycle process that requires rigor in achievement of observable milestones to exit each development phase; this process permits us to explore new product concepts quickly and make efficient use of both R&D and marketing resources.
On December 31, 2014, we employed 68 research and development engineers. We conduct research and development for all of our product lines at our facilities in Oregon, Minnesota and Germany.
Manufacturing and Assembly
Our manufacturing and assembly operations consist of the production of highly complex and sophisticated components and assemblies, some of which are customized to meet customers’ needs and specifications. We perform nearly all of our manufacturing and assembly at our facilities in Oregon, Minnesota and Germany. We outsource the manufacturing and assembly of some products and components to the extent we can purchase them at a cost that is lower than our cost to produce them, and still meet the expectations and requirements of our customers. We depend on limited source suppliers for some materials, components and subassemblies used in our products.
Our product design and manufacturing process activities emphasize accurate electrical measurements, precise and reliable mechanical components and assemblies and compliance with industry and governmental safety requirements. We prototype and test our new standard product designs and components to ensure high electrical signal integrity, mechanical accuracy and safety. In our manufacturing operations, we perform electrical, mechanical and chemical tests and use statistical process control methods, internally-developed manufacturing information systems and inspections of purchased components and products to monitor our product quality throughout the various stages of our manufacturing process.
Competition
The markets for our products are highly competitive. We anticipate that these markets will continually evolve and be subject to rapid technological change.
Probe Stations. Our primary competitors are Vector Semiconductor Co. Ltd., Signatone Corporation, MPI Corporation, Tokyo Seimitsu Co., LTD/Accretech, Tokyo Electron (“TEL”), The Micromanipulator Company Inc. and Wentworth Laboratories Inc., among others. We believe that the primary competitive factors in the probe station market are measurement accuracy and versatility, measurement speed, automation features, knowledge of measurement techniques, completeness of the measurement solutions, delivery time and price. We believe that we compete favorably with respect to these factors.
Thermal Subsystems. In the market for thermal subsystems, we compete principally against ERS Electronic, GmbH, Temptronic Environmental Test Chambers and Espec Corp. In addition, many of the probe station competitors identified above develop and produce their own thermal subsystems for
8
Table of Contents
use in their products. We believe the primary competitive factors in this market are thermal performance, reliability, flexibility and completeness of product offerings. We believe that we compete favorably in these areas.
Reliability Test Systems. Our reliability test products compete against a number of competitors including Qualitau, Inc., STAr Technologies, Inc., Reedholm Instruments Co. and Chiron technology Pte. Ltd. We believe the primary competitive factors in this market involve build quality, scalability and the ability to properly correlate results between package level and wafer level reliability. We believe our solutions complete favorably with respect to these factors.
Production Probe Cards. Competition in the non-memory production probe card market is fragmented and characterized by many suppliers offering products based on differing technologies. Our Pyramid Probe cards compete in the “advanced probe card” segment with product offerings of other probe card vendors, including Feinmetall GmbH, FormFactor Inc., Japan Electronic Materials Corporation, Micronics Japan Company, Ltd., Micro Square Technology Inc., Yokowo, SV Probe Inc., Technoprobe S.r.l., Tokyo Cathode Laboratory Company Ltd., Wentworth Laboratories Inc. and others. At least four probe card vendors, FormFactor Inc., Japan Electronic Materials Corporation, Micronics Japan Company, Ltd. and Yokowo, are also offering probe cards built using types of lithographic patterning. The high capital investment and other costs associated with the development of lithographically defined probe cards and the time and high cost of the customer evaluation process, represent a significant barrier to entry for this type of technology. We believe that the primary competitive factors in the production probe card market depend upon the type of integrated circuit being tested, but also include customer service, knowledge of measurement techniques, delivery time, price, probe card lifetime, chip damage, probe tip touch-down accuracy, speed and frequency of the probe card, number of chips contacted in parallel, number of probe tips and their layout, signal integrity, and frequency and effectiveness of any required cleaning. We believe that we compete favorably in the advanced probe card segment, and in probe cards for parallel testing of chips with densely-packed bond pads. We generally do not compete in applications that require very large probe areas, such as memory test applications.
Analytical Probes. Our primary competitor in the analytical probe market is GGB Industries Inc. Regional competitors include Yokowo and Technoprobe in Japan, and MPI/Allstron in Taiwan. We believe that the primary competitive factors in this market are breadth of probe types, probe frequency and electrical signal integrity, contact integrity and the related cleaning required, knowledge of measurement techniques, calibration support, delivery time and price. We believe that we compete favorably with respect to these factors.
Intellectual Property
A large part of our success depends on innovation and protecting proprietary technology. Our products do not depend on individual patents, but instead rely on a diverse intellectual property portfolio. We work actively both in the U.S. and internationally to ensure protection and enforcement of copyright, trademark, trade secret, and patent rights that apply to electrical measurement reliability and integrity, electrical shielding, and the Pyramid Probe contact structure and production process. As of December 31, 2014, we had approximately 200 active U.S. and foreign patents and approximately 100 pending patent applications. In addition, we regard certain processes, information and know-how that we have developed and used to design and manufacture our products as proprietary trade secrets.
We invest in innovation that focuses on emerging needs in advanced wafer probing solutions. We seek to protect our intellectual property as we develop solutions to meet the needs of the market, anticipate new technological trends, and seek to drive broad adoption of our products and services we create. Our policy is to seek patent protection when we believe we can achieve a significant business advantage from inventions involving new products and improvements to existing products as part of our ongoing engineering and research and development activities.
9
Table of Contents
While some types of intellectual property, like patents, expire or lapse, we believe our continuing product improvement and development is not materially dependent on any single patent. We continuously pursue protection of our development in new products, tools, and platforms as they evolve to meet market needs. We see significant opportunities to continue to grow our intellectual property as testing solutions demand higher quality, reliability and increasingly complex and high-speed measurements.
Seasonality
Typically, our revenue is lower in our fiscal first quarter than in our fiscal fourth quarter preceding it. In addition, as is typical in our industry, we recognize a large percentage of our quarterly revenue in the last month of the quarter. However, our seasonality can be affected by general economic trends and it should not be expected that historical revenue patterns will continue.
Employees
As of December 31, 2014, we had a total of 449 employees. Of these employees, 261 were located in the United States, 144 were in located in Germany, 12 were located in Singapore, 14 were located in Japan, 9 were located in Taiwan and 9 were located in other counties. Many of our employees are highly skilled and our future performance depends largely on our ability to continue to attract, train and retain qualified technical, sales, service, marketing and managerial personnel. None of our employees are subject to a collective bargaining agreement. However, certain employees at our manufacturing facility near Dresden, Germany, are represented by a works council. We have not experienced any work stoppages and consider our relations with our employees to be good.
Environmental Matters
As part of our manufacturing operations, we have handled and continue to handle materials that are considered hazardous or toxic under federal, state and local laws and regulations, and we are subject to environmental laws and regulations related to the sale, use, storage, discharge, disposal and human exposure to such materials. We believe we are in compliance with the environmental laws and regulations applicable to the conduct of our business and operations. However, there can be no assurance that violations of environmental laws or regulations will not occur in the future as a result of human error, equipment failure or other causes. The risk of a release of hazardous or toxic materials cannot be completely eliminated, and if such a release occurs, we could be held financially responsible for the cleanup or other consequences of the release. We are not aware of any releases of hazardous or toxic materials at any of our facilities that could reasonably be expected to result in any material liabilities to us.
Backlog
Our backlog consists of purchase orders and volume purchase agreements (VPA’s) we have received for products and services that we expect to ship and deliver or perform in the future. We recognize backlog for orders where the terms of sales, including price, configuration and payment terms, have been agreed upon. On December 31, 2014, our backlog was $39.3 million compared with $34.4 million on December 31, 2013. The increase in backlog as of December 31, 2014 compared to December 31, 2013, was driven by an increase in VPA’s for our production probe cards, analytical probes, and thermal subsystems.
We typically ship our products within twelve months of receipt of a customer’s order. Accordingly, we expect to deliver nearly our entire December 31, 2014 backlog in 2015. Customers may cancel or delay delivery on previously placed orders, although our standard terms and conditions include penalties for cancellations made close to the scheduled delivery date. As a result, the timing of the receipt of orders or the shipment of products could have a significant impact on our backlog at any date. In addition, a significant portion of our revenue is generated from orders received and products shipped within a quarter. For this and other reasons, the amount of backlog at any date is not necessarily indicative of revenue in future periods.
10
Table of Contents
Forward-Looking Statements
This Annual Report on Form 10-K and the documents incorporated herein by reference contain both historical information and forward-looking statements. In some cases, you can identify forward-looking statements by terminology, including “intend,” “could,” “may,” “will,” “should,” “expect,” “plan,” “anticipate,” “believe,” “estimate,” “predict,” “potential,” “future,” or “continue,” the negative of these terms or other comparable terminology. These statements are only predictions. All statements other than statements of historical fact made in this Annual Report on Form 10-K are forward-looking, including, among others, statements regarding:
| • | industry prospects and trends, and our ability to take advantage of those prospects and trends, including: the drive to smaller geometries, the drive for more compactness using 3D/TSV technology, the continued integration of the physical interfaces into the semiconductor device package, the shift to 450 mm diameter wafers, and the increased demand for hybrid and electric cars and other “green” technologies; |
| • | increasing demand for smartphones, tablets, set-top boxes and automotive electronics; |
| • | our growth strategies and prospects, including the continued growth of industry demand for our products; |
| • | the future capabilities, functionality and competitive advantages of our products and services; |
| • | results and benefits of the RTP Acquisition and the ATT Acquisition, the prospects for related markets served, the ability of those acquisitions to achieve anticipated goals, and the market position and advantages of related products; |
| • | our accounting and tax policies; |
| • | our future capital requirements; |
| • | the way our business cycles compare to those of our industry in general; |
| • | the anticipated growth in the demand for probing systems; |
| • | the significance of our probing station market share and product offering, and the results of our electrical measurement performance; |
| • | the continued strength of our relationships with customers; |
| • | our anticipated spending on research and development; |
| • | the seasonal fluctuations in our business; |
| • | the timing of product delivery and delivery of backlog; |
| • | our expectations regarding sublease income; |
| • | inventory valuations and potential write-downs; |
| • | our expectation that all accrued restructuring costs as of December 31, 2014 will be paid during 2015; |
| • | our anticipated fixed asset additions in 2015; and |
| • | our ability to meet cash requirements; |
A number of factors affect our operating results and could cause our actual future results to differ materially from those expressed or implied in such forward-looking statements, including, among others, cyclicality of the semiconductor industry; technological developments and competition in the semiconductor industry; potential customer concentration risks; our reliance on certain suppliers; risks associated with our international sales and operations; transactions affecting liquidity; and the risks discussed in Part I of this report entitled “Risk Factors.” These forward-looking statements are only predictions. Actual events or results may differ materially. In addition, historical information should not be considered an indicator of future performance. Please see Item 1A, “Risk Factors,” for a discussion of some of the uncertainties, risks and assumptions associated with these statements.
Although we believe that the expectations reflected in the forward-looking statements are reasonable, we do not guarantee future results, levels of activity, performance or achievements. In addition, we are under no duty to update any of the forward-looking statements after the date of this Annual Report on Form 10-K to conform these statements to actual results. These forward-looking statements are made in reliance upon the safe harbor provision of The Private Securities Litigation Reform Act of 1995.
11
Table of Contents
Where You Can Find More Information
We file annual, quarterly and current reports, proxy statements and other information with the Securities and Exchange Commission (“SEC”) under the Securities Exchange Act of 1934, Item 7A as amended (the “Exchange Act”). You can inspect and copy our reports, proxy statements, and other information filed with the SEC at the SEC’s Public Reference Room at 100 F Street, NE, Washington, D.C. 20549. Please call the SEC at 1-800-SEC-0330 for further information on the Public Reference Room. The SEC maintains a website at http://www.sec.gov where you can obtain some of our SEC filings. We also make available free of charge on our website at www.cascademicrotech.com our annual report on Form 10-K, quarterly reports on Form 10-Q, current reports on Form 8-K, and amendments to those reports filed or furnished pursuant to the Exchange Act as soon as reasonably practicable after they are filed electronically with the SEC. You can also obtain copies of these reports by contacting Investor Relations at 503-601-1000.
| ITEM 1A. | RISK FACTORS |
Our operating results have fluctuated in the past and are likely to fluctuate in the future, which could cause us to miss our guidance or analyst expectations and cause the trading price of our common stock to decline.
Our operating results have fluctuated in the past and are likely to continue to fluctuate. As a result, you should not rely on period-to-period comparisons of our financial results as an indication of our future performance. Factors that are likely to cause our revenue and operating results to fluctuate include:
| • | customer demand, which is influenced, in part, by conditions in the electronics and semiconductor industry, demand for products that use semiconductors and market acceptance of our products and those of our customers; |
| • | our geographic sales mix, product sales mix and average selling prices; |
| • | timing, cancellation or delay of customer orders; |
| • | seasonality of customer orders based on their purchasing cycles; |
| • | fluctuations in foreign currency exchange rates; |
| • | competition, such as competitive pressures on the price, performance and reliability of our products, the introduction or announcement of new products by us or our competitors and our competitors’ intellectual property rights, which could prevent us from introducing products that compete effectively with their products; |
| • | our production capacity and availability and cost of materials, components and subassemblies; |
| • | our ability to deliver reliable products in a timely manner, including as a result of fluctuations in yield on some of our product lines; |
| • | the amount and timing of operating expenses and capital expenditures related to the expansion of our operations and infrastructure; |
| • | the timing of revenue and expenses related to any acquisitions of technologies, products or businesses; and |
| • | our product development costs, including research and development and sales and marketing expenses associated with new products or product enhancements and the costs of transitioning to new or enhanced products. |
In particular, many of our more technically-advanced probing stations can have selling prices from $0.2 million to over $1.0 million. If there are unforeseen delays in shipment or customer acceptance of these more expensive and advanced systems, or of any other significant orders near the end of a quarter, the recognition of revenue on these orders could be delayed into the following period, significantly affecting both revenue and earnings for the quarter.
If our revenue or operating results fall below the expectations of analysts or investors, the market price of our common stock could decline substantially.
12
Table of Contents
Our operating results and financial condition may be adversely affected by volatile economic conditions.
Though the semiconductor industry’s cycle can be independent of the general economy, global economic conditions affect demand for semiconductor products and investment. The global economy and financial markets experienced disruption in 2009 and 2008, including, among other things, extreme volatility in security prices, severely diminished liquidity and credit availability and business failures. We are unable to predict the likely duration and severity of any future disruptions in financial markets, credit availability and adverse economic conditions throughout the world or in regions or countries that affect our business. These economic developments affect businesses such as ours and those of our customers, suppliers and business partners in a number of ways that could result in unfavorable consequences to us. Disruption and deterioration in economic conditions may reduce customer purchases of our products or the viability of our business partners, which could adversely affect our operating results and business.
The cyclicality of the semiconductor industry affects our operating results, and, as a result, we may experience reduced sales or operating losses in a semiconductor industry downturn.
The semiconductor industry is highly cyclical with recurring periods of wide fluctuations in product supply and demand. From time to time, this industry has experienced significant downturns, often in connection with, or in anticipation of, periods of oversupply, maturing product and technology cycles, excess inventories, geo-political changes and declines in general economic conditions. Our customers’ purchasing behavior in response to these cycles has been generally unpredictable. In the past, our operating results have been adversely affected by the cyclical downturns in the semiconductor industry.
Our business is heavily dependent on the level of research and development spending of our customers, the volume of semiconductor production by semiconductor manufacturers, particularly by wireless chip manufacturers, the development of new semiconductors and semiconductor designs and the overall financial strength of our customers. These factors in turn depend upon the current and anticipated market demand for semiconductors and the products incorporating them. Semiconductor manufacturers in particular are known to sharply curtail their capital expenditures when confronted with an industry downturn. Since we sell our systems to virtually all chip segments, our revenue may be affected by any significant segment weakness. We may not achieve or maintain our current or prior levels of revenue growth. Any factor adversely affecting the semiconductor industry in general, or the particular segments, regions or major customers of the industry that our products target, will adversely affect our ability to generate revenue and could cause us to experience operating losses.
Because we generally do not have a sufficient backlog of unfilled orders to meet our quarterly revenue targets, revenue in any quarter is substantially dependent upon customer orders received and fulfilled in that quarter.
Our revenue is difficult to forecast because we generally do not have a sufficient backlog of unfilled orders for our probe stations, thermal subsystems, reliability test systems, analytical probes and production probe cards to meet our quarterly revenue targets at the beginning of a quarter. Historically, a significant portion of our revenue in any quarter depends upon customer orders that we receive and fulfill in that quarter, which is typically weighted in the last month of the quarter. In addition, because our expense levels are based in part on our expectations as to future revenue and, to a large extent, are fixed in the short term, we might be unable to adjust spending in time to compensate for any unexpected shortfall in revenue. Accordingly, any significant shortfall in revenue in relation to our expectations and the expectations of analysts or investors could hurt our operating results and result in a decline in the price of our common stock.
13
Table of Contents
If we do not keep pace with technological developments in the semiconductor industry, especially the trend toward faster, smaller and lower-cost chips, our revenue and operating results could suffer as potential customers decide to adopt our competitors’ products.
We must continue to invest in research and development and certain manufacturing capabilities to maintain and improve our competitive position and to meet the testing needs of our customers. Our future growth depends, in significant part, on our ability to work effectively with, and anticipate the testing needs of, our customers and on our ability to develop and support new products and product enhancements to meet these needs on a timely and cost-effective basis. Our customers’ testing needs are becoming more challenging as the semiconductor industry continues to experience rapid technological change driven by the demand for complex chips that have smaller element sizes and at the same time are increasing in speed and functionality and becoming less expensive to produce. Our customers expect that they will be able to integrate our wafer probing products into their design and production processes as soon as they are deployed. To meet these expectations and remain competitive, we must continually design, develop and introduce on a timely basis new products and product enhancements with improved features. Successful product development and introduction on a timely basis require that we:
| • | design innovative and performance-enhancing features that differentiate our products from those of our competitors; |
| • | identify emerging technological trends in our target markets, including new engineering and production test strategies; |
| • | respond effectively to technological changes or product announcements by others; and |
| • | adjust to changing market conditions quickly and cost-effectively. |
If we are unable to timely predict industry changes, or if we are unable to modify our products on a timely basis, we might lose customers or market share, and our operating results could suffer. We cannot assure you that we will successfully develop and bring new products to market in a timely and cost-effective manner, that any product enhancement or new product developed by us will gain market acceptance or that products or technologies developed by others will not render our products or technologies obsolete or uncompetitive.
We may make business acquisitions, or other investments in technologies and products, that could be unsuccessful, costly and dilute shareholder value.
Our growth strategy includes our potential acquisition of, or making investments in, complementary technologies, products or businesses. In July 2013, we completed the RTP Acquisition and, in October 2013, we completed the ATT Acquisition. We may be unable to successfully complete or integrate any such transactions we may pursue or complete, including the RTP Acquisition and the ATT Acquisition, and our failure to do so could harm our business, operating results and financial condition. The success of any future acquisitions or investments will depend upon our ability to identify, negotiate, complete and integrate these transactions and, if necessary, to obtain satisfactory debt or equity financing to fund them. Any acquisitions or investments we undertake, including the RTP Acquisition and the ATT Acquisition, will involve numerous risks, which may include any of the following:
| • | disruption of our ongoing business, including diversion of management’s attention during negotiation of the transaction and during post-transaction integration; |
| • | costs, delays and difficulties of integrating any acquired company’s operations, products, technologies and personnel into our existing operations and organization; |
| • | difficulties in maintaining uniform and applicable standards, controls, procedures and policies; |
| • | adverse impact on earnings as a result of amortizing the acquired company’s intangible assets or impairment charges related to write-downs of goodwill related to an acquisition; |
| • | issuances of equity securities or the incurrence of debt to pay for acquisitions or investments, which may be dilutive to existing shareholders or increase our financial leverage and interest expense; |
14
Table of Contents
| • | potential loss of customers, suppliers, partners or key employees; |
| • | impact on our operating results or financial condition due to the timing of the acquisition or investment or failure to meet operating expectations for acquired businesses or investments; |
| • | assumption of unknown liabilities of the acquired company or becoming subject to adverse tax consequences; and |
| • | the entry into geographic or business markets in which we have little or no prior experience. |
Any acquisitions of or investments in technologies, products or businesses, including the RTP Acquisition and the ATT Acquisition, may not generate sufficient revenue to offset the associated costs of the acquisition or may result in other adverse effects that would harm our business, operating results and financial condition.
Intense competition in the semiconductor wafer probing business may reduce demand for our products and reduce our sales.
The markets for our products are highly competitive, and we expect competition to continue in the future. Our existing competitors or other potential competitors may have developed or may be developing technology of which we are unaware that may render our products uncompetitive. Some of our competitors have significantly greater financial, technical and marketing resources than we do. As a result, these competitors may be able to respond more quickly to new or emerging technologies and changes in customer requirements, to devote greater resources to the development, promotion and sale of their products or to deliver competitive products at lower prices. Increased competition could result in pricing pressures, reduced sales, margins or competitive position or failure to achieve or maintain widespread market acceptance of our products, any of which could prevent us from growing our business and adversely affect our operating results. Some of these competitors may use a strategy of intensive discounting to help maintain, or even increase, their revenue and customer base. Consolidation of competitors could result in new competitors, which may have stronger product lines, a more robust service infrastructure and the financial ability to increase discounts.
Consolidation of our customer base could adversely affect our revenues and results of operations.
Customers could be purchased by other companies or simply dissolve. This may mean that fewer customers could have greater leverage to obtain price concessions, thereby reducing margins. In addition, leading-edge chip technology development in the semiconductor industry has become so expensive that our customers are often teaming up to perform the development work, effectively shrinking our customer base or slowing their purchases of engineering tools.
We rely on a small number of customers for a significant portion of our revenue and to grow our business, and the deterioration or termination of any of these relationships would adversely affect our business.
Our top four customers accounted for a total of 22% and 17%, respectively, of our revenue in 2014 and 2013. Our customer base is less diversified in probes than in systems. Typically, our customers are not obligated by long-term contracts to purchase our products and may discontinue purchasing our products at any time. The semiconductor industry is highly concentrated and a small number of semiconductor manufacturers generally account for a substantial portion of the purchases of semiconductor test equipment, including our products. Consequently, our business and operating results would be materially, adversely affected by the loss of, or a material reduction in purchases by, any of our significant customers.
In addition, our ability to increase our revenue will depend in part upon our ability to obtain orders from new customers, Obtaining orders from new customers is difficult because semiconductor manufacturers typically select one vendor’s products for testing a particular new generation of chips. Once a manufacturer has selected a vendor, that manufacturer is more likely to continue to purchase products from that vendor for that generation of chips, as well as subsequent generations of chips.
15
Table of Contents
We therefore place great emphasis on relationships with our current customers because these customers are difficult to replace. In addition, we focus on leveraging our relationships with current customers to sell into additional engineering labs and production lines in the same company and similar groups in other companies. If we are unable to maintain our relationships with our existing significant customers or to obtain new customers that adopt and implement our products and technology, we will not be able to meet our revenue and growth targets, which could result in a decline in the price of our common stock.
Our revenues are largely based on the sale of a small number of product units.
We derive a substantial portion of our revenue from the sale of a relatively small number of products. Accordingly, our revenues, margins and other operating results could fluctuate significantly from quarter to quarter depending upon a variety of factors in addition to those described above, including:
| • | changes in the timing of orders and terms or acceptance of product shipments by our customers; |
| • | changes in the mix of products and services that we sell; |
| • | timing and market acceptance of our new product introductions; and |
| • | delays or problems in the planned introduction of new products, or in the performance of any such products following delivery to customers. |
As a result of these risks, we believe that quarter-to-quarter comparisons of our revenue and operating results may not be meaningful, and that these comparisons may not be an accurate indicator of our future performance.
If our relationships with our customers deteriorate, our product development activities could be harmed.
The success of our product development efforts depends in part upon our ability to anticipate market trends and to collaborate closely with our customers. Our relationships with our customers provide us with access to valuable information regarding manufacturing and process technology trends in the semiconductor industry, which enables us to better plan our product development activities. These relationships also provide us with opportunities to understand the performance and functionality requirements of our customers, which improve our ability to customize our products to fulfill their needs. If our relationships with our customers deteriorate, or if we are unable to develop similar collaborative relationships with important customers in the future, our long-term ability to produce commercially successful products could be adversely affected.
We obtain some of the materials, components and subassemblies used in our products from a single source or a limited group of suppliers. If these suppliers are unable to provide us with these items on a timely basis, we may be unable to manufacture our products or meet our customers’ needs.
We obtain some of the materials, components and subassemblies used in our products from a single source or a limited group of suppliers. From time to time, we may experience difficulties in obtaining these materials, components and subassemblies from some suppliers. In the future, one or more of our suppliers may declare bankruptcy or go out of business due to unusually weak business conditions or other factors or may otherwise be unable to adequately meet our needs, which could force us to source our products from different suppliers. The manufacture of some of the materials, components and subassemblies that we use in our products is a complex process, and in the event that we cannot obtain an adequate supply of these components it would be difficult and time-consuming to identify and qualify new suppliers. In addition, many of these suppliers are small companies that may be more susceptible to downturns in general economic conditions, thereby increasing the risks of product and shipment delays, increased costs or loss of suppliers.
16
Table of Contents
The delay in shipments from, or complete loss of, any one of these suppliers could prevent us from producing and shipping our products, resulting in delayed or lost orders for our products and damage to our customer relationships, which would harm our business and results of operations. In addition, a significant increase in the price of one or more of these materials, components or subassemblies could materially adversely affect our results of operations.
Any disruption in the operations of our manufacturing facilities could harm our business.
We manufacture most of our products in our facilities located in Oregon, Minnesota and Germany. Our manufacturing processes are complex and require sophisticated and costly equipment and specially designed facilities. As a result, any prolonged disruption in the operations of our facilities, whether due to technical or labor difficulties, relocation or destruction of or damage to the facilities as a result of an earthquake, fire or any other reason, could materially and adversely affect our business, financial condition and results of operations.
We rely on suppliers and contract manufacturers for the products we sell.
Reliance on suppliers and contract manufacturers raises several risks, including the possibility of defective parts, lack of availability and the possibility of increases in component costs. Manufacturing efficiencies and our profitability can be adversely affected by each of these risks. For instance, during October 2011, heavy rain in Thailand resulted in flooding at the manufacturing facility of a key supplier for one of our probing stations. If we had not been able to obtain the necessary materials and resources to build those stations at our facility in Beaverton, Oregon, our revenues and results of operations for the fourth quarter of 2011 and beyond could have been adversely impacted.
We must effectively manage our production capacity.
To meet rapidly changing demand in the markets we serve, we must effectively manage our resources and production capacity. During periods of decreasing demand for our products, we must be able to appropriately align our cost structure with prevailing market conditions and effectively manage our supply chain. Our ability to rapidly and effectively reduce our cost structure in response to such downturns is limited by the fixed nature of many of our expenses in the near term and by our need to continue our investment in next-generation product technology and to support and service our products. Conversely, when upturns occur in the markets we serve, we may have difficulty rapidly and effectively increasing our manufacturing capacity or procuring sufficient materials to meet any sudden increases in customer demand that could result in the loss of business to our competitors and harm our relationships with our customers. If we are not able to timely and appropriately adapt to changes in our business environment, our business, financial condition or results of operations may be materially and adversely affected.
In the future we may be required to record non-cash asset impairment charges related to our leased facilities and certain long-lived assets if their fair value is reduced below their carrying value on our balance sheet.
As of December 31, 2014, we had fixed assets, goodwill and intangible assets of $33.5 million recorded on our balance sheet. We assess our goodwill annually and we test other long-lived assets when an event occurs indicating the potential for impairment. We have recorded asset impairment charges in the past, and if we record an impairment charge as a result of these analyses in the future, it could have a material adverse impact on our results of operations.
In addition, we recorded restructuring charges in 2014 related to the consolidation of certain manufacturing, research and development operations at our corporate headquarters in Beaverton, Oregon, as well as the reorganization of business operations and our sales channel in Europe. We also recorded restructuring charges during 2013 and 2011 in connection with excess leased facilities, net of estimated sublease income that we believe could be reasonably obtained. If the real estate markets worsen and we are not able to sublease the properties as expected, additional charges will be recognized in the period such determination is made.
17
Table of Contents
In the future, we may incur accounting charges for excess or obsolete inventory.
One factor on which we compete is the ability to meet customer schedules for product shipments. In order to facilitate timely shipping, management forecasts demand, both in type and amount of products, and these forecasts are used to help determine inventory to be purchased. We also order materials based on our technology roadmap, which represents management’s assessment of technology that will be utilized in new products that we develop. If actual demand is lower than forecast with respect to the type or amount of products actually ordered, or both, our inventory levels may increase. As a result, there is a risk that we may have to incur material accounting charges for excess and obsolete inventory if the inventory cannot be used, which would adversely affect our financial results. Also, if we alter our technology or product development strategy, we may have inventory that may not be used under the new strategy, which may also result in material accounting charges.
Our growth could strain our personnel and infrastructure resources, and, if we are unable to implement appropriate controls and procedures to manage our growth, we may not be able to successfully implement our business plan.
Our growth has increased the complexity of our business and placed significant demands on our management, personnel, operational, financial and technical resources and on our internal control, management information and reporting systems, and any future growth will continue to do so. Our success will depend, in part, upon the ability of our senior management to manage this growth effectively. To manage the expected growth of our operations and personnel, we will need to:
| • | continue to improve our operational, financial and management controls and our reporting systems and procedures; |
| • | manage the growth of different product lines with different cost structures; and |
| • | recruit, train, manage and motivate our employees to support our expanded operations. |
Any inability to manage our growth effectively could adversely affect our revenue and profitability, the quality of our products and services, the timeliness and effectiveness of our product development efforts and our ability to retain key personnel. These factors could harm our business, operating results and financial condition.
A restructuring or reorganization could result in significant disruption of our business and our relationships with our employees, suppliers and customers could be adversely affected.
We may, in the future, undertake restructuring or reorganization activities in order to improve operating efficiencies and reduce operating costs. Such activities may require significant efforts, including the integration and consolidation of product manufacturing, research and development, sales and marketing efforts and general and administrative activities. These activities could result in the disruption of our business including relationships with employees, suppliers and customers, and result in charges and write-offs, all of which could adversely affect our operating results. There can be no assurance that such activities would be successful or reduce operating costs.
We face economic, political and other risks associated with our international sales and operations, which could materially harm our operating results.
Over the past three fiscal years, we have derived more than 65% of our annual revenue from sales outside the United States, primarily in Taiwan, Korea, Japan and other Asian countries and, to a lesser extent, Europe. We expect international sales to continue to represent a substantial portion of our revenue for the foreseeable future. In the past, the economic climate in some foreign markets, particularly in Asia, has at times quickly and dramatically changed, resulting in a negative effect on our operating results.
18
Table of Contents
Currently, we maintain seven international offices in Europe and Asia, and we may establish new international offices in the future. The risks we face in conducting business internationally include:
| • | difficulties and costs of staffing and managing international operations across different geographic areas as a result of distance, language and cultural differences; |
| • | the possible lack of financial, social and political stability in foreign countries, preventing overseas sales growth; |
| • | changes in the value of foreign currencies in relation to the U.S. dollar, our reporting currency; |
| • | changes in domestic or foreign law or policy resulting in the need to comply with potentially burdensome government controls, regulations, tariffs, embargoes or export and import license requirements; |
| • | shipping delays or disruptions; |
| • | restrictions on foreign ownership; |
| • | cash held at foreign bank accounts; |
| • | dependence on certain third parties to increase customer acquisition and sales, including dependence on channel partners with which we may not have extensive experience; |
| • | reduced protection for intellectual property rights in some countries; |
| • | overlapping of different tax regimes, and potentially adverse tax consequences, including the complexities of foreign value added or other tax systems and restrictions on the repatriation of cash and the investment of funds; |
| • | increased financial accounting and reporting burdens and complexities; |
| • | Shorter payable and longer receivable cycles and potential difficulties in enforcing contracts and collecting accounts receivable; |
| • | differing and more burdensome labor regulations and practices, including in Europe; |
| • | the effects of sudden outbreaks of epidemics in Asia and other parts of the world; and |
| • | the effects of terrorist attacks in the U.S. or elsewhere and any related conflicts or similar events worldwide. |
There have been significant fluctuations in the exchange rates between the dollar and the currencies of the countries in which we do business. While most of our international sales have been denominated in U.S. dollars, over 28% of our sales in 2014 were denominated in foreign currencies, In addition, most of our international operating expenses have been denominated in foreign currencies. As a result, a decrease in the value of the U.S. dollar relative to the foreign currencies could increase the relative costs of our overseas operations, which could reduce our operating margins. Significant unfavorable fluctuations in the exchange rates between the U.S. dollar and foreign currencies could cause us to lower our prices and thus reduce our profitability. In addition, fluctuations in exchange rates could cause customers to delay or cancel orders because of the increased cost of our products relative to those of our competitors who manufacture in other countries.
We may be exposed to uninsured risks if the type and amount of coverage we carry are not adequate, or if the insurance company is unable to honor claims.
We carry insurance in various types and amounts to insure against a range of business related risks. If the types of insurance or the insurance limits are not adequate to protect us against all claims, or the insurance company is not able to honor our claims, our results of operations and financial condition could be negatively affected.
19
Table of Contents
Failure to retain key managerial, technical, sales and marketing personnel, independent manufacturers’ representatives and distributors or to attract new key personnel could harm our business.
Our success depends on the continued services of our executive officers and other key management, technical, and sales and marketing personnel and on our ability to continue to attract, retain and motivate qualified personnel. The loss of key personnel could limit our ability to develop new products and adapt existing products to our customers’ evolving requirements and may result in lost sales and a diversion of management resources. In addition, much of our competitive advantage and intellectual property is based on the expertise, experience and know-how of our key personnel. To support our future growth, we will need to attract and retain additional qualified management, technical and sales and marketing employees. Competition for such personnel in our industry can be intense, and we cannot assure you that we will be successful in attracting and retaining such personnel.
Over half of our revenues are typically generated through independent manufacturers’ representatives and distributors, whose activities are not within our direct control. In addition, in some locations, our manufacturers’ representatives and distributors provide field service to our customers. A reduction in the sales or service efforts or financial viability of these manufacturers’ representatives or distributors, or a termination of our relationship with these representatives or distributors, would have a material adverse effect on our operating results and ability to support our customers.
Our customers’ evaluation processes can lead to lengthy sales cycles, during which we may incur significant costs that may not result in sales.
Our customers typically expend significant efforts in evaluating and qualifying our products prior to placing an order, particularly for orders of probe stations and production probe cards. This evaluation and qualification process frequently results in a lengthy sales cycle, typically ranging from three to 12 months and sometimes longer. During the period in which our customers are evaluating our products, we incur substantial sales, marketing, research and development expenses and expend significant management efforts. After completing this evaluation process, a potential customer may elect not to purchase our products. In addition, customer purchases are frequently subject to unplanned processing delays, particularly at our larger customers for which our products represent a very small percentage of their overall purchase activity.
Additional factors, some of which are partially or completely outside our control, that affect the length of time it takes us to complete a sale, include:
| • | the success of our sales force; |
| • | the history of previous sales to the customer; |
| • | the timing of final customer acceptance, particularly on new or custom products; |
| • | the complexity of the customer’s engineering or production processes; |
| • | the internal technical capabilities and sophistication of the customer; and |
| • | the capital expenditure budgets of the customer. |
The lengthy and unpredictable nature of our sales cycle could result in fluctuations in our operating results, which could fall below the expectations of analysts and investors for any particular period of time, and result in a decline in the price of our common stock.
If our products contain defects, our reputation would be damaged, and we could lose customers and revenue and incur warranty expenses.
The complexity and ongoing development of our products, as well as the inclusion in our products of components purchased from third parties, could lead to design, manufacturing or performance problems. Our products may contain defects which could cause our sales to decline, our reputation to be significantly damaged and our customers to be reluctant to buy our products, any or all of which could result in a decline in revenue, an increase in product returns, higher field service costs, the loss
20
Table of Contents
of existing customers or the failure to attract new customers. Our warranty charges totaled $0.9 million, $0.8 million and $0.9 million in 2014, 2013 and 2012, respectively. We may be unsuccessful in seeking reimbursement of a portion of our warranty expense from applicable vendors arising from purchased components, which could adversely affect our operating results.
If we fail to protect our proprietary technology and rights, competitors may be able to use our technologies, which would weaken our competitive position and could reduce our sales.
Our success and competitive position depend in significant part on the technically innovative features of our products, and, if we fail to protect our proprietary rights, our competitors might gain access to our technology. Although we rely in part on patent and trademark laws and on trade secrets to protect the proprietary technology used in our products, our patents may be challenged by third parties and held invalid, and any of our pending patent applications may not be approved. Additionally, we may not be able to develop additional proprietary technology that is patentable. Policing unauthorized use of our products is difficult, and we may not be able to prevent the misappropriation and unauthorized use of our technologies. In addition, our existing and future patents may not be sufficiently broad to protect our proprietary technologies, may not provide us with competitive advantages and may be circumvented by the designs of third parties. Certain of our patents will expire in the near future and such expirations will reduce our ability to assert claims against competitors or others who use similar technology.
Unauthorized parties may attempt to copy aspects of our products or to obtain and use information that we regard as proprietary. Others may independently develop or otherwise acquire similar or competing technologies or methods or design around our patents. Additionally, some of our proprietary technology cannot be effectively protected by patents. In these cases, we rely on trade secret laws and confidentiality agreements to protect our confidential and proprietary information, processes and technology. However, our confidential and proprietary information, processes and technology could be independently developed by, or otherwise become known to, third parties, which would weaken our competitive position and might reduce our sales.
Over the past three fiscal years, we have derived more than 65% of our annual revenue from products sold to customers outside of North America. The laws of some foreign countries do not protect our proprietary rights to the same extent as the laws of the U.S., and many companies have encountered substantial problems in protecting their proprietary rights against infringement in such countries. The manner in which we protect our proprietary rights may not be adequate in some foreign countries. Our failure to adequately protect our intellectual property in foreign countries would make it easier for competitors to copy or circumvent our product designs and sell competing products in those countries, which could adversely affect our revenue and cause us to lose customers.
Intellectual property infringement claims by or against us may result in litigation, the cost of which could be substantial and could prevent us from selling our products.
The semiconductor industry is characterized by uncertain and conflicting intellectual property claims, frequent litigation regarding patent and other intellectual property rights and vigorous protection and pursuit of these rights. Questions of infringement in the semiconductor industry involve highly technical and subjective analyses. Litigation may be necessary to determine the validity and scope of our proprietary rights or to defend against claims of infringement or invalidity by third parties, and we may not prevail in any litigation. Any such litigation, whether or not determined in our favor or settled, might be costly, could harm our reputation, could cause product shipment delays and could divert the efforts and attention of our management and technical personnel from our normal business operations.
An adverse outcome in any intellectual property litigation might result in the loss of our proprietary rights, subject us to significant liabilities, require us to spend significant resources to develop non-infringing technology, require us to seek licenses from third parties, prevent us from manufacturing and selling our products or require us to discontinue the use of certain technology in our products,
21
Table of Contents
any of which could have an adverse effect on our business, financial condition and results of operations. License agreements, if required, might not be available on terms acceptable to us or at all.
Our success depends on our continued investment in research and development, the level and effectiveness of which could reduce our profitability.
We intend to continue to make investments in research and development in seeking to sustain and improve our competitive position and meet our customers’ needs. These investments currently include enhancing our probe stations, refining probe fabrication processes and developing higher performance probe cards and analytical probes. To maintain our competitive position, we may need to increase our research and development investment, which could reduce our profitability. In addition, we cannot assure you that we will achieve a return on these investments, nor can we assure you that these investments will improve our competitive position or meet our customers’ needs.
We are subject to significant environmental regulations, which are costly to comply with and if we fail to comply with may result in significant costs and harm our business.
We are subject to a variety of federal, state and local laws, rules and regulations relating to the storage, use, discharge, disposal and human exposure to hazardous and toxic materials used in our thin-film fabrication facility and other manufacturing operations. The risk of a release of hazardous or toxic materials cannot be completely eliminated, and if such a release occurs, we could be held financially responsible for the cleanup or other consequences of the release. Failure to comply with environmental laws and regulations could result in enforcement actions, substantial liabilities and suspension of production or cessation of operations in extreme situations. Compliance with current or future environmental laws and regulations could restrict our ability to expand our facilities or build new facilities or require us to acquire additional expensive equipment, modify our manufacturing processes, or incur other substantial expenses which could harm our business, financial condition and results of operation.
In addition, many countries, including the United States and those in the European Union and China, have implemented directives that restrict the sale of new electrical and electronic equipment containing certain hazardous substances, require that certain metals used in products be from a conflict free source, or make producers of electrical and electronic equipment financially responsible for specified collection, recycling, treatment and disposal of past and future covered products. If it is determined that we do not comply with certain environmental or other regulations, we may suffer a loss of revenue, be unable to sell in certain markets or countries and suffer competitive disadvantage, and be required to take reserves for costs associated with compliance with these regulations
Environmental laws and regulations could become more stringent over time, imposing even greater compliance costs and increasing risks and penalties associated with violations, which could harm our business, financial condition and results of operation. There can be no assurance that violations of environmental laws or regulations will not occur in the future as a result of the inability to obtain permits, human error, equipment failure or other causes.
Regulations related to “conflict minerals” may force us to incur additional expenses, may make our supply chain more complex and may result in damage to our reputation with customers.
On August 22, 2012, under the Dodd-Frank Wall Street Reform and Consumer Protection Act of 2010, the SEC adopted new requirements for companies that use certain minerals and metals, known as conflict minerals, in their products, whether or not these products are manufactured by third parties. These requirements will require companies to conduct due diligence and disclose whether or not such minerals originate from the Democratic Republic of Congo and adjoining countries. The implementation of these new requirements could adversely affect the sourcing, availability and pricing of minerals used in the manufacture of semiconductor devices, including our products. In addition, we
22
Table of Contents
will incur additional costs to comply with the disclosure requirements, including costs related to determining the source of any of the relevant minerals and metals used in our products. Since our supply chain is complex, we may not be able to sufficiently verify the origins for these minerals and metals used in our products through the due diligence procedures that we implement, which may harm our reputation. In such event, we may also face difficulties in satisfying customers who require that all of the components of our products are certified as conflict mineral free.
Product liability claims may be asserted against us, resulting in costly litigation for which we may not have sufficient liability insurance.
Our customers may use our products in the testing of high-reliability semiconductors for critical applications such as telecommunications infrastructure, military, medical and aerospace equipment. Defects or other problems with the performance of our products could result in financial or other damages to our customers. In addition, some of our probe stations that use high-powered lasers or operate at high voltage or extreme temperatures may cause death or injury to persons utilizing such equipment due to undetected design or manufacturing defects or due to improper use or maintenance by our customers. Although our product invoices and sales contracts generally contain provisions designed to limit our exposure to product liability claims, existing or future laws or unfavorable judicial decisions could negate these provisions. Product liability litigation against us, even if it were unsuccessful, could be time consuming and costly to defend. Additionally, although we carry product liability insurance, in some circumstances it may not cover certain claims or be adequate to cover all claims.
Unanticipated changes in our tax rates or exposure to additional income tax liabilities could affect our profitability.
We are subject to income taxes in both the U.S. and various foreign jurisdictions, and our domestic and international tax liabilities are subject to the allocation of expenses in different jurisdictions. Our effective tax rate could be adversely affected by changes in the mix of earnings in countries with different statutory tax rates, changes in the valuation of deferred tax assets and changes in tax laws. In particular, the recoverability of deferred tax assets, which are predominantly in the U.S., is dependent on our ability to generate future taxable income in the U.S. In addition, the amount of income taxes we pay could be subject to ongoing audits in various jurisdictions and a material assessment by a governing tax authority could affect our profitability.
Change in control severance agreements with certain executive officers and the anti-takeover provisions of our charter documents and Oregon law may inhibit a takeover or change in our control that shareholders may consider beneficial.
Change in control severance agreements with certain executive officers and provisions of our articles of incorporation and bylaws and provisions of Oregon law may have the effect of delaying or preventing a merger or acquisition of us, making a merger or acquisition of us less desirable to a potential acquirer or preventing a change in our management, even if the shareholders consider the merger or acquisition favorable or if doing so would benefit our shareholders. In addition, these agreements and provisions could limit the price that investors would be willing to pay in the future for shares of our common stock. The following are examples of such provisions:
| • | We have a classified board of directors, which makes it more difficult for a group of shareholders to quickly change the composition of our board; |
| • | Our board of directors is authorized, without prior shareholder approval, to create and issue preferred stock with voting or other rights or preferences that could impede the success of any attempt to acquire us or change our control; |
| • | Members of our board of directors can only be removed for cause; |
| • | The board of directors may alter our bylaws without obtaining shareholder approval; |
| • | Shareholders are required to provide advance notice for nominations for election to the board of directors or for proposing matters to be acted upon at a shareholder meeting; and |
23
Table of Contents
| • | Any action that is taken by written consent of shareholders must be unanimous. |
We are also subject to the provisions of the Oregon Control Share Act and the Oregon Business Combination Act, each of which may have certain anti-takeover effects.
We rely on the security and integrity of our electronic data systems and our business could be damaged by a disruption, security breach or other compromise of these systems.
We rely on electronic data systems to operate and manage our business and to process, maintain, and safeguard information, including information belonging to our customers, partners, and personnel. These systems may be subject to failures or disruptions as a result of, among other things, natural disasters, accidents, power disruptions, telecommunications failures, new system implementations, acts of terrorism or war, physical security breaches, computer viruses, or other cyber security attacks. Such system failures or disruptions could subject us to downtimes and delays, compromise or loss of sensitive or confidential information or intellectual property, destruction or corruption of data, financial losses from remedial actions, liabilities to customers or other third parties, or damage to our reputation or customer relationships. Any of the foregoing could have a material adverse effect on our business, operating results and financial condition.
Internal control deficiencies or weaknesses that are not yet identified could emerge.
Over time we may identify and correct deficiencies or weaknesses in our internal controls and, where and when appropriate, report on the identification and correction of these deficiencies or weaknesses. Internal control procedures can provide only reasonable, and not absolute, assurance that deficiencies or weaknesses are identified. Deficiencies or weaknesses that have not been identified by us could emerge and the identification and correction of these deficiencies or weaknesses could adversely affect our operating results. If our internal controls over financial reporting are not considered effective, we may experience a loss of public confidence, which could adversely affect our business and stock price.
We may become subject to litigation that could have an adverse effect on our business.
From time to time, we may be subject to litigation or other administrative and governmental proceedings that could require significant management time and resources and cause us to incur expenses and, in the event of an adverse decision, pay damages in an amount or become subject to business limitations that could have a material adverse effect on our business, operating results and financial condition.
| ITEM 1B. | UNRESOLVED STAFF COMMENTS |
None
| ITEM 2. | PROPERTIES |
We maintain our corporate headquarters and Probes manufacturing in 90,000 square feet of leased space, including a clean room, at a site in Beaverton, Oregon. Our lease of this space expires between December 31, 2019 and March 31, 2020. Our Systems manufacturing is primarily performed at a 43,000 square foot leased facility near Dresden, Germany. Our lease of that facility expires December 31, 2017. We lease smaller manufacturing spaces in Munich, Germany and St. Paul, Minnesota, as well as sales and service offices in Japan, Germany, China, Taiwan and Singapore. In addition, we have 62,000 square feet of unused leased space in Beaverton, Oregon that we are attempting to sublease. The lease on the unused space expires December 31, 2015.
24
Table of Contents
| ITEM 3. | LEGAL PROCEEDINGS |
As of the date of filing this Form 10-K, we are not a party to any material legal proceedings. However, the semiconductor test industry is characterized by vigorous protection and pursuit of intellectual property rights and positions. To protect our intellectual property from infringement, we have, from time to time, initiated litigation against third parties and may be required to do so in the future. We cannot assure you that we shall be successful in future intellectual property litigation and this litigation often is protracted and expensive.
| ITEM 4. | MINE SAFETY DISCLOSURES |
Not applicable
PART II
| ITEM 5. | MARKET FOR THE REGISTRANT’S COMMON EQUITY, RELATED STOCKHOLDER MATTERS AND ISSUER PURCHASES OF EQUITY SECURITIES |
Stock Prices and Dividends
Our common stock trades under the symbol “CSCD” on the NASDAQ Global Market. The high and low sale price of our common stock by quarter for each of the eight quarters in the two-year period ended December 31, 2014 was as follows:
| 2013 |
High | Low | ||||||
| Quarter 1 |
$ | 8.00 | $ | 5.62 | ||||
| Quarter 2 |
7.19 | 6.26 | ||||||
| Quarter 3 |
9.18 | 6.50 | ||||||
| Quarter 4 |
11.17 | 8.88 | ||||||
| 2014 |
High | Low | ||||||
| Quarter 1 |
$ | 11.39 | $ | 8.71 | ||||
| Quarter 2 |
13.95 | 9.00 | ||||||
| Quarter 3 |
13.91 | 9.77 | ||||||
| Quarter 4 |
14.89 | 9.37 | ||||||
As of March 2, 2015, there were 37 shareholders of record and approximately 750 beneficial shareholders.
We have not declared or paid any cash dividends on our common stock in the past two years. We currently expect to retain any future earnings to fund the operation and expansion of our business, and do not currently expect to pay cash dividends in the foreseeable future.
Repurchases of Equity Securities
We made the following repurchases of our common stock during the fourth quarter of 2014:
| Total number of shares purchased |
Average price paid per share |
Total number of shares purchased as part of publicly announced plan |
Maximum dollar amount of shares that may yet be purchased under the plan |
|||||||||||||
| October 1 – October 31 |
3,900 | $ | 9.47 | 3,900 | $ | 2,540,857 | ||||||||||
| November 1 – November 30 |
— | — | — | 2,540,857 | ||||||||||||
| December 1 – December 31 |
— | — | — | 2,540,857 | ||||||||||||
|
|
|
|
|
|||||||||||||
| Total |
3,900 | $ | 9.47 | 3,900 | $ | 2,540,857 | ||||||||||
|
|
|
|
|
|||||||||||||
These shares were repurchased pursuant to a plan approved by our board of directors in November 2012 and amended in May 2014, which authorized the repurchase of up to a total of $4.0 million of our common stock from time to time in the open market or in privately negotiated transactions. The repurchase program does not have an expiration date.
25
Table of Contents
Stock Performance Graph
The SEC requires that registrants include in this report a line-graph presentation comparing cumulative five-year shareholder returns on an indexed basis, assuming a $100 initial investment and reinvestment of dividends. Our graph consists of (a) Cascade Microtech, Inc.; (b) the NASDAQ Composite Index and (c) a peer group index composed of Teradyne, Inc., FormFactor, Inc., Kulicke & Soffa Industries, Inc., Xcerra Corporation and Electro Scientific Industries, Inc. The peer group index utilizes the same methods of presentation and assumptions for the total return calculation as does Cascade Microtech, Inc. and the NASDAQ Composite Index. All companies in the peer group index are weighted in accordance with their market capitalizations.
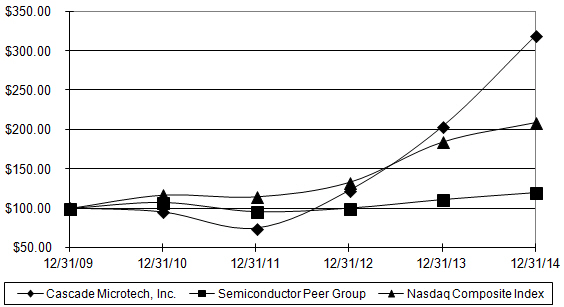
| Base | Indexed Returns | |||||||||||||||||||||||
| Period | Period Ended | |||||||||||||||||||||||
| Company/Index |
12/31/09 | 12/31/10 | 12/31/11 | 12/31/12 | 12/31/13 | 12/31/14 | ||||||||||||||||||
| Cascade Microtech, Inc. |
$ | 100.00 | $ | 94.98 | $ | 74.45 | $ | 122.27 | $ | 203.49 | $ | 319.00 | ||||||||||||
| Semiconductor Peer Group |
100.00 | 107.79 | 96.01 | 100.54 | 111.47 | 120.31 | ||||||||||||||||||
| NASDAQ Composite Index |
100.00 | 116.91 | 114.81 | 133.07 | 184.06 | 207.71 | ||||||||||||||||||
26
Table of Contents
| ITEM 6. | SELECTED FINANCIAL DATA |
The consolidated statement of operations and balance sheet data set forth below has been derived from our consolidated financial statements. The selected consolidated financial data set forth below should be read in conjunction with “Management’s Discussion and Analysis of Financial Condition and Results of Operations” and with the consolidated financial statements and notes thereto included elsewhere in this Form 10-K.
| For the Year Ended December 31, | ||||||||||||||||||||
| (In thousands, except per share amounts) |
2014 | 2013 | 2012 | 2011 | 2010 | |||||||||||||||
| Statement of Operations Data |
||||||||||||||||||||
| Revenue |
$ | 136,022 | $ | 120,010 | $ | 112,963 | $ | 104,610 | $ | 92,597 | ||||||||||
| Cost of sales |
65,708 | 65,286 | 63,012 | 63,194 | 57,151 | |||||||||||||||
|
|
|
|
|
|
|
|
|
|
|
|||||||||||
| Gross profit |
70,314 | 54,724 | 49,951 | 41,416 | 35,446 | |||||||||||||||
| Operating expenses: |
||||||||||||||||||||
| Research and development |
13,821 | 10,961 | 11,017 | 11,807 | 11,815 | |||||||||||||||
| Selling, general and administrative |
43,209 | 36,430 | 31,377 | 33,799 | 31,739 | |||||||||||||||
|
|
|
|
|
|
|
|
|
|
|
|||||||||||
| Total operating expenses |
57,030 | 47,391 | 42,394 | 45,606 | 43,554 | |||||||||||||||
|
|
|
|
|
|
|
|
|
|
|
|||||||||||
| Income (loss) from operations |
13,284 | 7,333 | 7,557 | (4,190 | ) | (8,108 | ) | |||||||||||||
| Other income (expense), net |
(620 | ) | (252 | ) | (749 | ) | 572 | 10 | ||||||||||||
|
|
|
|
|
|
|
|
|
|
|
|||||||||||
| Income (loss) from continuing operations before income taxes |
12,664 | 7,081 | 6,808 | (3,618 | ) | (8,098 | ) | |||||||||||||
| Provision (benefit) for income taxes |
2,734 | (6,337 | ) | 709 | 180 | 36 | ||||||||||||||
|
|
|
|
|
|
|
|
|
|
|
|||||||||||
| Income (loss) from continuing operations |
9,930 | 13,418 | 6,099 | (3,798 | ) | (8,134 | ) | |||||||||||||
| Loss from discontinued operations, net of tax |
— | — | — | (2,004 | ) | (2,205 | ) | |||||||||||||
|
|
|
|
|
|
|
|
|
|
|
|||||||||||
| Net income (loss) |
$ | 9,930 | $ | 13,418 | $ | 6,099 | $ | (5,802 | ) | $ | (10,339 | ) | ||||||||
|
|
|
|
|
|
|
|
|
|
|
|||||||||||
| Basic income (loss) per share from continuing operations |
$ | 0.61 | $ | 0.91 | $ | 0.43 | $ | (0.26 | ) | $ | (0.57 | ) | ||||||||
| Basic loss per share from discontinued operations |
— | — | — | (0.14 | ) | (0.15 | ) | |||||||||||||
|
|
|
|
|
|
|
|
|
|
|
|||||||||||
| Basic net income (loss) per share |
$ | 0.61 | $ | 0.91 | $ | 0.43 | $ | (0.40 | ) | $ | (0.72 | ) | ||||||||
|
|
|
|
|
|
|
|
|
|
|
|||||||||||
| Diluted income (loss) per share from continuing operations |
$ | 0.59 | $ | 0.89 | $ | 0.42 | $ | (0.26 | ) | $ | (0.57 | ) | ||||||||
| Diluted loss per share from discontinued operations |
— | — | — | (0.14 | ) | (0.15 | ) | |||||||||||||
|
|
|
|
|
|
|
|
|
|
|
|||||||||||
| Diluted net income (loss) per share |
$ | 0.59 | $ | 0.89 | $ | 0.42 | $ | (0.40 | ) | $ | (0.72 | ) | ||||||||
|
|
|
|
|
|
|
|
|
|
|
|||||||||||
| Shares used in basic per share calculations |
16,323 | 14,792 | 14,182 | 14,583 | 14,286 | |||||||||||||||
|
|
|
|
|
|
|
|
|
|
|
|||||||||||
| Shares used in diluted per share calculations |
16,828 | 15,150 | 14,390 | 14,583 | 14,286 | |||||||||||||||
|
|
|
|
|
|
|
|
|
|
|
|||||||||||
| December 31, | ||||||||||||||||||||
| Balance Sheet Data | 2014 | 2013 | 2012 | 2011 | 2010 | |||||||||||||||
| Cash and cash equivalents, short-term marketable securities and restricted cash |
$ | 39,794 | $ | 22,532 | $ | 24,318 | $ | 14,782 | $ | 24,445 | ||||||||||
| Working capital |
73,600 | 59,708 | 56,119 | 47,063 | 50,944 | |||||||||||||||
| Total assets |
128,381 | 118,511 | 85,280 | 83,064 | 84,545 | |||||||||||||||
| Long-term liabilities |
1,840 | 2,667 | 3,296 | 4,473 | 2,924 | |||||||||||||||
| Shareholders’ equity |
107,461 | 97,201 | 65,918 | 59,297 | 65,606 | |||||||||||||||
27
Table of Contents
| ITEM 7. | MANAGEMENT’S DISCUSSION AND ANALYSIS OF FINANCIAL CONDITION AND RESULTS OF OPERATIONS |
You should read the following discussion in conjunction with our consolidated financial statements and notes thereto appearing elsewhere in this Form 10-K. In addition to historical consolidated financial information, the following discussion and analysis contains forward-looking statements that involve risks, uncertainties and assumptions. Our actual results could differ materially from those anticipated by these forward-looking statements as a result of many factors, including those discussed under Item 1A, Part I, “Risk Factors,” and elsewhere in this Form 10-K. We do not guarantee future results, levels of activity, performance or achievements. We do not intend to update any of the forward-looking statements after the date of this document to conform them to actual results or to changes in our expectations.
Overview
Revenues increased to $136.0 million in 2014 compared to $120.0 million in 2013 as a result of increased revenue in both our Probes segment and our Systems segment. Gross margin increased to 51.7% in 2014 compared to 45.6% in 2013, as of result of an overall increase in unit sales, which increased factory utilization, and a shift in product mix, as we sold a higher number of Probes and products acquired through the acquisitions in 2013, relative to total sales. Net income decreased to $9.9 million in 2014 compared to $13.4 million in 2013, primarily as a result of a net tax expense of $2.7 million in 2014 compared to a net tax benefit of $6.3 million related to the reversal of a majority of our deferred tax valuation allowance in 2013. Our results for 2014 included acquisition-related credits of $0.6 million and restructuring charges of $1.2 million, compared to acquisition-related costs of $1.4 million and restructuring charges of $0.2 million in 2013.
Outlook for 2015
Looking forward to 2015, we expect continued growth as it appears that industry demand forecasted for our products will improve over the levels achieved in 2014.
2013 Acquisitions
On July 31, 2013, we acquired certain assets of the Reliability Test Product (“RTP”) division of Aetrium Incorporated for $1.9 million in cash and contingent consideration of $0.8 million, which was paid during 2014 (the “RTP Acquisition”). We believe the RTP Acquisition expands our product portfolio and served available market while leveraging our existing sales and service channel. For additional information about the RTP Acquisition, see Note 3 of Notes to Consolidated Financial Statements included in Part II, Item 8 of this Form 10-K.
On October 1, 2013, we acquired all of the outstanding shares of ATT Systems for consideration of (a) 9.6 million euro (or approximately $13.0 million), including cash acquired of approximately 0.4 million euro (or approximately $0.6 million); and (b) 1.6 million shares of our common stock with a value of $14.5 million (the “ATT Acquisition”). Approximately 8.8 million euro were paid at closing, 0.4 million euro were paid in October 2014, with the remaining 0.4 million euro to be paid in October 2015. In December 2013, a working capital adjustment totaling 0.2 million euro (or approximately $0.2 million) was made to increase the purchase price and was paid in January 2014. ATT Systems is a leader in the manufacturing of advanced thermal systems used in the testing of semiconductor wafers and provides enhanced thermal solutions for wafer testing over expanded temperatures that typically range from -65 to +400 degrees centigrade. We believe the acquisition strategically positions the combined company for future system development and access to larger markets. For additional information about the ATT Acquisition, see Note 3 of Notes to Consolidated Financial Statements included in Part II, Item 8 of this Form 10-K.
28
Table of Contents
Restructuring Charges
Restructuring charges of $1.2 million in 2014 related to the consolidation of certain manufacturing, research and development operations at our corporate headquarters in Beaverton, Oregon, as well as the reorganization of business operations and our sales channel in Europe. In 2013, we recorded $0.2 million in charges related to excess leased facilities. We did not have any restructuring charges in 2012.
Results of Operations
The following table sets forth our consolidated statement of operations data for the periods indicated as a percentage of revenue.(1)
| For the Year Ended December 31, | ||||||||||||
| 2014 | 2013 | 2012 | ||||||||||
| Statement of Operations Data |
||||||||||||
| Revenue |
100.0 | % | 100.0 | % | 100.0 | % | ||||||
| Cost of sales |
48.3 | 54.4 | 55.8 | |||||||||
|
|
|
|
|
|
|
|||||||
| Gross profit |
51.7 | 45.6 | 44.2 | |||||||||
| Operating expenses: |
||||||||||||
| Research and development |
10.2 | 9.1 | 9.8 | |||||||||
| Selling, general and administrative |
31.8 | 30.3 | 27.8 | |||||||||
|
|
|
|
|
|
|
|||||||
| Total operating expenses |
41.9 | 39.5 | 37.5 | |||||||||
|
|
|
|
|
|
|
|||||||
| Income from operations |
9.8 | 6.1 | 6.7 | |||||||||
| Other income (expense), net |
(0.5 | ) | (0.2 | ) | (0.7 | ) | ||||||
|
|
|
|
|
|
|
|||||||
| Income before income taxes |
9.3 | 5.9 | 6.0 | |||||||||
| Income tax expense (benefit) |
2.0 | (5.3 | ) | 0.6 | ||||||||
|
|
|
|
|
|
|
|||||||
| Net income |
7.3 | % | 11.2 | % | 5.4 | % | ||||||
|
|
|
|
|
|
|
|||||||
| (1) | Percentages may not add due to rounding. |
Certain financial information by segment was as follows (dollars in thousands):
| Year Ended December 31, 2014 |
Systems | Probes | Corporate Unallocated |
Total | ||||||||||||
| Revenue |
$ | 82,850 | $ | 53,172 | $ | — | $ | 136,022 | ||||||||
| Gross profit |
$ | 37,775 | $ | 32,539 | $ | — | $ | 70,314 | ||||||||
| Gross margin |
45.6 | % | 61.2 | % | — | 51.7 | % | |||||||||
| Income (loss) from operations |
$ | 7,553 | $ | 20,768 | $ | (15,037 | ) | $ | 13,284 | |||||||
| Year Ended December 31, 2013 |
||||||||||||||||
| Revenue |
$ | 79,229 | $ | 40,781 | $ | — | $ | 120,010 | ||||||||
| Gross profit |
$ | 33,177 | $ | 21,547 | $ | — | $ | 54,724 | ||||||||
| Gross margin |
41.9 | % | 52.8 | % | — | 45.6 | % | |||||||||
| Income (loss) from operations(1) |
$ | 9,794 | $ | 11,568 | $ | (14,029 | ) | $ | 7,333 | |||||||
| Year Ended December 31, 2012 |
||||||||||||||||
| Revenue |
$ | 74,368 | $ | 38,595 | $ | — | $ | 112,963 | ||||||||
| Gross profit |
$ | 29,391 | $ | 20,560 | $ | — | $ | 49,951 | ||||||||
| Gross margin |
39.5 | % | 53.3 | % | — | 44.2 | % | |||||||||
| Income (loss) from operations(1) |
$ | 9,651 | $ | 10,158 | $ | (12,252 | ) | $ | 7,557 | |||||||
| (1) | Amortization expense of $1.2 million and $0.7 million for the years ended December 31, 2013 and 2012, respectively, was reclassified from Corporate Unallocated to Systems to conform with the current year presentation. |
29
Table of Contents
Revenue
Revenue information was as follows (dollars in thousands):
| Year Ended December 31, | Dollar | |||||||||||||||
| Revenue |
2014 | 2013 | Change | % Change | ||||||||||||
| Systems |
$ | 82,850 | $ | 79,229 | $ | 3,621 | 4.6 | % | ||||||||
| Probes |
53,172 | 40,781 | 12,391 | 30.4 | % | |||||||||||
|
|
|
|
|
|
|
|||||||||||
| Total |
$ | 136,022 | $ | 120,010 | $ | 16,012 | 13.3 | % | ||||||||
|
|
|
|
|
|
|
|||||||||||
| Year Ended December 31, | Dollar | |||||||||||||||
| Revenue |
2013 | 2012 | Change | % Change | ||||||||||||
| Systems |
$ | 79,229 | $ | 74,368 | $ | 4,861 | 6.5 | % | ||||||||
| Probes |
40,781 | 38,595 | 2,186 | 5.7 | % | |||||||||||
|
|
|
|
|
|
|
|||||||||||
| Total |
$ | 120,010 | $ | 112,963 | $ | 7,047 | 6.2 | % | ||||||||
|
|
|
|
|
|
|
|||||||||||
Systems
The increase in Systems revenue in 2014, compared to 2013, was primarily attributable to a $10.9 million increase in sales related to our 2013 acquisitions. This increase was partially offset by decreased unit sales of 300mm stations.
The increase in Systems revenue in 2013, compared to 2012, was primarily attributable to $5.0 million in sales related to the RTP Acquisition and the ATT Acquisition, which we completed in July and October 2013, respectively. Excluding the effect of these acquisitions, the small decrease in revenue was the result of a decrease in unit sales partially offset by an increase in average selling price (“ASP”) due a decrease in discounts.
Sales of 300mm probe stations represented 21%, 31% and 26% of total Systems sales in 2014, 2013 and 2012, respectively.
Probes
The increase in Probes revenue in 2014, compared to 2013, was primarily the result of increases in unit sales of both production probe cards and analytical probes as there was no significant change in ASP’s. The increase in unit sales was driven by increased customer demand in the production RF market.
The increase in Probes revenue in 2013, compared to 2012, was primarily the result of an increase in sales volume, partially offset by a decrease in ASP due to changes in sales mix and changes in foreign currency exchange rates. We sold a higher number of lower-priced small core probes as a percentage of total sales in 2013 than in 2012 due to an increased number of design wins.
Cost of Sales and Gross Margin
Cost of sales includes purchased materials, fabrication, assembly, test, installation labor, overhead, customer-specific engineering costs, warranty costs, royalties and provision for inventory valuation reserves.
Cost of sales information was as follows (dollars in thousands):
| Year Ended December 31, | Dollar | |||||||||||||||
| Cost of Sales |
2014 | 2013 | Change | % Change | ||||||||||||
| Systems |
$ | 45,075 | $ | 46,052 | $ | (977 | ) | (2.1 | )% | |||||||
| Probes |
20,633 | 19,234 | 1,399 | 7.3 | % | |||||||||||
|
|
|
|
|
|
|
|||||||||||
| Total |
$ | 65,708 | $ | 65,286 | $ | 422 | 0.6 | % | ||||||||
|
|
|
|
|
|
|
|||||||||||
30
Table of Contents
| Year Ended December 31, | Dollar | |||||||||||||||
| Cost of Sales |
2013 | 2012 | Change | % Change | ||||||||||||
| Systems |
$ | 46,052 | $ | 44,977 | $ | 1,075 | 2.4 | % | ||||||||
| Probes |
19,234 | 18,035 | 1,199 | 6.6 | % | |||||||||||
|
|
|
|
|
|
|
|||||||||||
| Total |
$ | 65,286 | $ | 63,012 | $ | 2,274 | 3.6 | % | ||||||||
|
|
|
|
|
|
|
|||||||||||
Cost of sales was affected by changes in sales as discussed above combined with the factors that caused fluctuations in our gross margin (gross profit as a percentage of revenue), as discussed below.
Gross margins were as follows:
| Year Ended December 31, | ||||||||||||
| Gross Margins |
2014 | 2013 | 2012 | |||||||||
| Systems |
45.6 | % | 41.9 | % | 39.5 | % | ||||||
| Probes |
61.2 | % | 52.8 | % | 53.3 | % | ||||||
| Overall |
51.7 | % | 45.6 | % | 44.2 | % | ||||||
Systems
The increase in Systems gross margins in 2014, compared to 2013, was primarily due to our acquisitions during the second half of 2013. The gross margin of acquired product lines was 55.8%, which increased the average gross margin of all Systems products. Gross margin in 2014 was negatively impacted by the decrease in unit sales of 300mm stations, which decreased factory utilization and increased unabsorbed period expenses in cost of sales.
The increase in Systems gross margins in 2013, compared to 2012, was primarily due to a decrease in customer discounts, material costs, manufacturing variances and warranty costs, partially offset by an increase in inventory charges for excess and obsolete inventory. In addition, gross margins in 2013 were negatively impacted by purchase price allocation adjustments of $0.5 million related to valuing finished goods and work-in-process inventory acquired in connection with the RTP Acquisition and the ATT Acquisition at their estimated selling price less cost to sell. Accordingly, when this inventory was sold, it resulted in near zero gross margins.
Probes
The increase in Probes gross margins in 2014, compared to 2013, was primarily due to increased unit sales, which increased factory utilization, decreased unabsorbed period expenses, and decreased total fixed manufacturing overhead costs as a percentage of sales
The decrease in Probes gross margins in 2013, compared to 2012, was primarily due to changes in sales mix and foreign currency exchange rates, partially offset by higher sales volume, which resulted in lower unallocated fixed overhead costs recorded as a period expense in cost of sales.
Overall
The overall increase in gross margins in 2014, compared to 2013, was primarily attributable to product mix, as we sold a higher number of Probes relative to total sales. The increase in gross margin was also positively affected by sales of products acquired as part of our 2013 acquisitions as discussed above.
The overall increases in gross margins in 2013, compared to 2012, were the result of the fluctuations in Systems and Probes gross margins as discussed above.
31
Table of Contents
Research and Development
Research and development costs are expensed as incurred and include compensation and related expenses for personnel, materials, consultants and overhead.
Information regarding our research and development expense was as follows (dollars in thousands):
| Year Ended December 31, | Dollar | |||||||||||||||
| 2014 | 2013 | Change | % Change | |||||||||||||
| Research and development |
$ | 13,821 | $ | 10,961 | $ | 2,860 | 26.1 | % | ||||||||
| Year Ended December 31, | Dollar | |||||||||||||||
| 2013 | 2012 | Change | % Change | |||||||||||||
| Research and development |
$ | 10,961 | $ | 11,017 | $ | (56 | ) | (0.5 | )% | |||||||
The increase in research and development in 2014, compared to 2013, was primarily due to:
| • | a $1.7 million increase in salaries and benefits primarily related to headcount; |
| • | a $1.2 million increase in project-related expenses; |
| • | a $0.2 million increase in occupancy costs, and |
| • | a $0.1 million increase in stock-based compensation expenses; |
| • | partially offset by a $0.1 million increase in government grant reimbursements; and |
| • | a $0.2 million decrease in depreciation expense. |
The decrease in research and development in 2013, compared to 2012, was primarily due to:
| • | a $0.8 million decrease in project-related expenses; |
| • | partially offset by a $0.4 million decrease in government grant reimbursements; and |
| • | a $0.4 million increase in salaries and benefits related primarily to acquisitions. |
Selling, General and Administrative
Selling, general and administrative (“SG&A”) expense includes compensation and related expenses for personnel, travel, outside services, manufacturers’ representative commissions, intangible asset amortization and overhead incurred in our sales, marketing, customer support, management, legal and other professional and administrative support functions, as well as costs to operate as a public company.
Information regarding our SG&A expense was as follows (dollars in thousands):
| Year Ended December 31, | Dollar | |||||||||||||||
| 2014 | 2013 | Change | % Change | |||||||||||||
| Selling, general and administrative |
$ | 43,209 | $ | 36,430 | $ | 6,779 | 18.6 | % | ||||||||
| Year Ended December 31, | Dollar | |||||||||||||||
| 2013 | 2012 | Change | % Change | |||||||||||||
| Selling, general and administrative |
$ | 36,430 | $ | 31,377 | $ | 5,053 | 16.1 | % | ||||||||
The increase in SG&A in 2014, compared to 2013, was primarily due to:
| • | a $2.6 million increase in salaries and benefits primarily related to headcount; |
| • | a $1.5 million increase in amortization of purchased intangibles; |
| • | a $0.9 million increase in accrued restructuring costs; |
| • | a $0.9 million increase in selling expenses; and |
| • | a $0.7 million increase in stock-based compensation. |
The increase in SG&A expense in 2013, compared to 2012, was primarily due to:
| • | a $1.8 million increase in salaries and benefits; |
| • | a $0.9 million increase in acquisition-related costs; |
| • | a $0.6 million increase in travel, meals and entertainments expenses; |
| • | a $0.5 million increase in external sales commissions; |
32
Table of Contents
| • | a $0.4 million increase in amortization expense; |
| • | a $0.2 million increase in stock-based compensation; |
| • | a $0.2 million increase in accrued restructuring charges; and |
| • | a $0.2 million increase in software fees for business information systems. |
Other Income (Expense)
Other income (expense) typically includes interest income, interest expense, gains and losses on foreign currency forward contracts and foreign currency gains and losses. Other income (expense) may also include other miscellaneous non-operating gains and losses.
Other income (expense), net was comprised of the following (in thousands):
| Year Ended December 31, | ||||||||||||
| 2014 | 2013 | 2012 | ||||||||||
| Interest income, net |
$ | 29 | $ | 44 | $ | 52 | ||||||
| Foreign currency losses |
(3,629 | ) | (311 | ) | (950 | ) | ||||||
| Gains on foreign currency forward contracts |
3,016 | 90 | 166 | |||||||||
| Other |
(36 | ) | (75 | ) | (17 | ) | ||||||
|
|
|
|
|
|
|
|||||||
| $ | (620 | ) | $ | (252 | ) | $ | (749 | ) | ||||
|
|
|
|
|
|
|
|||||||
Interest income represents interest earned on cash and cash equivalents and investments in marketable securities.
Foreign currency gains and losses primarily result from a combination of changes in foreign currency exchange rates and the net value of monetary assets and liabilities denominated in yen, euro and other foreign currencies. The increase in foreign currency losses and gains on forward currency forward contracts in 2014 compared to 2013 were driven by the changes in exchange rates for the yen and euro.
Income Taxes
Information regarding our income tax expense was as follows (dollars in thousands):
| Year Ended December 31, | ||||||||||||
| 2014 | 2013 | 2012 | ||||||||||
| Income tax provision (benefit) |
$ | 2,734 | $ | (6,337 | ) | $ | 709 | |||||
| Income tax provision as a percentage of income from continuing operations |
21.6 | % | (89.5 | )% | 10.4 | % | ||||||
Generally, the provision for income taxes is the result of the mix of profits and losses earned by us and our subsidiaries in tax jurisdictions with a broad range of income tax rates and changes in tax reserves.
Our income tax expense in 2014 primarily related to tax expense on income in the U.S. and foreign tax jurisdictions, partially offset by a $1.2 million benefit related to foreign tax credits generated from a distribution of earnings from our subsidiary in Japan during the fourth quarter of 2014.
Our income tax benefit in 2013 primarily related to a $9.7 million decrease to our valuation allowance on deferred tax assets, partially offset by tax expense on income in foreign tax jurisdictions.
Our income tax expense in 2012 primarily represents the current tax expense on income in foreign tax jurisdictions, offset by a deferred tax benefit related to reserves and allowances in foreign jurisdictions.
As of December 31, 2014, the net deferred tax assets on our Consolidated Balance Sheets totaled $4.3 million and primarily related to tax credits and other temporary differences.
33
Table of Contents
Inflation
We do not believe that inflation had a material effect on our business, financial condition or results of operations in 2014, 2013 or 2012.
Liquidity and Capital Resources
Changes in our assets and liabilities as presented in our Consolidated Statements of Cash Flows do not equal the changes in such assets and liabilities as calculated from our Consolidated Balance Sheets due to the effects of fluctuating foreign currency exchange rates and acquisitions.
Net cash provided by operating activities in 2014 was $24.2 million and primarily consisted of our net income of $9.9 million, net non-cash charges of $7.5 million and net changes in our operating assets and liabilities as described below.
Accounts receivable, net decreased by $5.7 million to $20.8 million at December 31, 2014, compared to $26.5 million at December 31, 2013, primarily due to improved collections and a shift in overall product sales mix from Systems to Probes, which have a shorter collection cycle.
Inventories decreased by $0.3 million to $24.6 million at December 31, 2014, compared to $24.9 million at December 31, 2013. The decrease in inventory was primarily related to inventory charges of $1.8 million in 2014 for excess and obsolete inventory, and changes in foreign currency exchange rates, partially offset by increased purchases to support higher levels of expected sales. If our actual results are significantly different than our current expectations for 2015, we may incur additional charges to write down inventory in future periods.
Accrued liabilities increased by $0.6 million to $9.5 million at December 31, 2014, compared to $8.9 million at December 31, 2013, primarily due to a $1.1 million increase in accrued compensation and benefits related to accrued wages and incentive compensation plans, a $0.9 million net increase in accrued income taxes and sales tax payable, and a $0.5 million increase in accrued restructuring costs, partially offset by a $1.3 million decrease in contingent consideration related to the RTP acquisition, and a $0.6 million decrease in other accrued liabilities.
Long-term and short-term deferred revenue decreased by $0.7 million to $2.4 million at December 31, 2014, compared to $3.1 million at December 31, 2013, primarily due to the timing of customer deposits on product orders.
Other long-term liabilities decreased by $0.6 million to $1.5 million at December 31, 2014, compared to $2.1 million at December 31, 2013, primarily due to a decrease in accrued restructuring costs as they were transferred to a current liability due to their expected payment during 2015.
Fixed asset purchases of $4.9 million in 2014 primarily related to production-related equipment, research and development tools and leasehold improvements. We anticipate that cash used for fixed asset purchases for 2015 will be between $8 million and $9 million, depending on the timing of payments to vendors.
In November 2012, our Board of Directors authorized a stock repurchase program under which up to $2.0 million of our common stock could be repurchased from time to time in the open market or in privately negotiated transactions. In May 2014, our Board of Directors authorized an increase to the stock repurchase program of an additional $2.0 million. In 2014, we repurchased 115,156 shares of our common stock at a weighted-average price of $9.29 per share, or a total of $1.1 million. As of December 31, 2014, $2.5 million remained available for repurchase under the program. The repurchase program does not have an expiration date.
In August 2013, we entered into a line of credit agreement with JPMorgan Chase Bank, N.A. for a maximum $10.0 million line of credit facility (the “LOC”), which may be limited by a borrowing base.
34
Table of Contents
The LOC expires August 31, 2015 and contains a $2.5 million sublimit for letters of credit. Interest is based primarily on the London Interbank Offered Rate (“LIBOR”). The LOC contains restrictive and financial covenants. On December 31, 2014, no amounts were outstanding under the LOC, no letters of credit were outstanding, $10.0 million was available for borrowing and we were in compliance with all covenants.
We anticipate meeting our cash requirements for the next 12 months and for the foreseeable future from existing Cash and cash equivalents, Short-term marketable securities and Restricted cash, which totaled $39.8 million at December 31, 2014. In addition, we currently have $10 million available under the LOC as discussed above, which we plan to renew during 2015.
We continue to evaluate opportunities for acquisition and expansion and any such transactions, if consummated, may use a portion of our cash and marketable securities or may result in the issuance by us of debt or equity securities. Issuances of debt securities would increase our leverage and interest exposure; issuances of equity securities could dilute the ownership interest of our shareholders.
Contractual Commitments
The following is a summary of our contractual commitments and obligations as of December 31, 2014 (in thousands):
| Payments Due By Period | ||||||||||||||||||||
| Contractual Obligation |
Total | 2015 | 2016 and 2017 |
2018 and 2019 |
2020 and beyond |
|||||||||||||||
| Operating leases |
$ | 11,243 | $ | 3,605 | $ | 4,173 | $ | 2,868 | $ | 597 | ||||||||||
| Purchase order commitments (1) |
6,198 | 6,084 | 114 | — | — | |||||||||||||||
| Forward contracts |
25,292 | 25,292 | — | — | — | |||||||||||||||
| Additional consideration related to the ATT Acquisition |
456 | 456 | — | — | — | |||||||||||||||
|
|
|
|
|
|
|
|
|
|
|
|||||||||||
| $ | 43,189 | $ | 35,437 | $ | 4,287 | $ | 2,868 | $ | 597 | |||||||||||
|
|
|
|
|
|
|
|
|
|
|
|||||||||||
| (1) | Purchase order commitments primarily represent open orders for inventory. |
Critical Accounting Policies and the Use of Estimates
The preparation of financial statements in conformity with U.S. generally accepted accounting principles requires management to make estimates and assumptions that have become increasingly difficult to make in the current economic environment. These estimates and assumptions affect the reported amounts of assets and liabilities and disclosure of contingent assets and liabilities at the date of the financial statements and the reported amount of revenue and expenses during the reporting period. It is possible that the estimates we make may change in the future.
Revenue Recognition
Revenue from product sales to customers and distributors that do not have special acceptance criteria is recognized when a written purchase order has been obtained, the price is fixed and determinable, the product is shipped, title has transferred and collectability is reasonably assured. Generally, we ship our products with origin terms. For any shipments with destination terms, we defer revenue until delivery to the customer. Revenue from customers who have special acceptance criteria is not recognized until all acceptance criteria are satisfied. Revenue for installation services, consisting of assembly and testing, is recognized when the services are performed. Deferred revenue related to service contracts is recognized over the life of the contract, typically one to two years.
Our transactions may involve the sale of systems and services under multiple element arrangements. Revenue under multiple element arrangements is allocated based on the fair value of each element. A typical multiple element arrangement may include some or all of the following components: products, accessories, installation services, training and extended warranty contracts. The total sales price is allocated based on the relative fair value of each component.
35
Table of Contents
Allowance for Doubtful Accounts
The allowance for doubtful accounts is estimated based on past collection history and known trends with current customers. Our estimates for allowance for doubtful accounts are reviewed and updated on a quarterly basis. Changes to the reserve occur based upon changes in revenue levels, associated balances in accounts receivable and estimated changes in collectability. The current economic environment has increased both the risk of bad debt and the difficulty in estimating the allowance for doubtful accounts.
Valuation of Excess and Obsolete Inventory
We regularly analyze the value of our inventory based on a combination of factors including, but not limited to, the following: forecasted sales or usage, historical usage rates, estimated service period, product end-of-life dates, estimated current and future market values, service inventory requirements and new product introductions. Inventories are stated at the lower of standard cost (which approximates cost, computed on a first-in, first-out basis) or market and include materials, labor and manufacturing overhead. Inventory is reviewed for obsolescence and excess quantities each quarter based on the quantities on hand, historical usage, estimated future use, service requirements, planned changes to products and known trends in markets and technology. If circumstances related to our inventories change, our estimates of the value of inventory could materially change. Inventory reserve charges are recorded quarterly as a component of cost of sales and create a new cost basis for the inventory.
Goodwill Impairment
Goodwill is not amortized but rather is reviewed for impairment at least annually, or more frequently if a triggering event occurs. We first make a qualitative assessment of whether it is more likely than not that a reporting unit’s fair value is less than its carrying amount before applying the two-step goodwill impairment test. If the conclusion is that it is more likely than not that the fair value of a reporting unit is less than its carrying amount, we then perform a two-step goodwill impairment test. Under the first step, the fair value of the reporting unit is compared to its carrying value, and, if an indication of goodwill impairment exists in the reporting unit, the enterprise must perform step two of the impairment test (measurement). Under step two, an impairment loss is recognized for any excess of the carrying amount of the reporting unit’s goodwill as determined by allocating the fair value of the reporting unit in a manner similar to a purchase price allocation. The residual fair value after this allocation is the implied fair value of the reporting unit goodwill. If the fair value of the reporting unit exceeds its carrying value, step two does not need to be performed.
Goodwill of $12.8 million at December 31, 2014 relates to our acquisition of SUSS Test in January 2010, the RTP Acquisition in July 2013 and the ATT Acquisition in October 2013. This goodwill relates to our Systems segment and represents the value of assembled workforce and other intangible assets that do not qualify for separate recognition. Our goodwill assessment performed in the fourth quarters of 2014, 2013 and 2012 did not indicate impairment of goodwill.
Lives and Recoverability of Equipment and Other Long-Lived Assets
We evaluate the remaining lives and recoverability of equipment and other assets, including our intangible assets with definite lives, whenever events or changes in circumstances indicate that the carrying amount of the asset may not be recoverable. If there is an indication of impairment, we prepare an estimate of future, undiscounted cash flows expected to result from the use of the asset and its eventual disposition. If these cash flows are less than the carrying value of the asset, we adjust the carrying amount of the asset to its estimated fair value. Such reviews assess the fair value of the assets based upon estimates of discounted future cash flows that the assets are expected to generate. We did not record any impairment charges for long-lived assets during 2014, 2013 or 2012.
Warranty Liabilities
Warranty costs include labor to repair the product and replacement parts for defective items, as well as other costs incidental to warranty repairs. We estimate a liability for costs to repair or replace products under warranties ranging from 90 days to one-year and technical support costs when the related product revenue is recognized. The liability for product warranties is calculated as a
36
Table of Contents
percentage of sales. The percentage is based on historical actual product repair costs. Our estimated warranty costs are reviewed and updated on a quarterly basis. Changes to the reserve occur as volume, product mix and actual warranty costs fluctuate.
Deferred Tax Asset Valuation Allowance
We record deferred tax assets for the future tax benefit of research and development tax credits, foreign tax credits, net operating loss (“NOL”) carryforwards and certain temporary differences. A valuation allowance is recorded when management cannot reach the conclusion that it is more likely than not that the deferred tax assets will be realized.
We periodically evaluate the potential realization of our deferred income tax assets and, if necessary, record a valuation allowance to reduce the net carrying value of such assets to the amount expected to be realized. We assess the available positive and negative evidence to determine whether future taxable income will be sufficient to utilize existing deferred tax assets. For our 2013 assessment, significant consideration was given to the positive objective evidence of cumulative income for the three-year period ended December 31, 2013. Such objective evidence combined with other subjective evidence including industry trends, macroeconomic conditions and our projections for future growth, provided the basis for release of valuation allowance as of December 31, 2013.
At December 31, 2014, we had net deferred tax assets on our balance sheet totaling $4.3 million, primarily related to tax credit carryforwards and other temporary differences. At December 31, 2014, we did not have a valuation allowance against our deferred tax assets; however, we may record valuation allowances in the future.
Uncertainty in Income Taxes
We recognize the benefits of tax return positions in our financial statements if we determine that the positions are “more-likely-than-not” to be sustained by the taxing authority. Interest and penalties accrued on unrecognized tax benefits are recorded as tax expense within our financial statements. At December 31, 2014, we had total unrecognized tax benefits of $0.2 million. All unrecognized tax benefits would have an impact on the effective tax rate if recognized. The interest and penalties accrued on unrecognized tax benefits were insignificant.
Stock-Based Compensation
We recognize compensation expense for all share-based payment awards granted to our employees and directors, including stock options, restricted stock units and stock purchases related to our employee stock purchase plan, based on the estimated fair value of the award on the grant date. We use the Black-Scholes valuation model to estimate the fair value of stock option awards. The Black-Scholes model requires us to make assumptions regarding the risk-free interest rate, expected dividend yield, expected term and expected volatility over the expected term of the award. The assumptions used in calculating the fair value of share-based payment awards represent management’s best estimates, but these estimates involve inherent uncertainties and the application of expense could be materially different in the future.
Recent Accounting Guidance
See Note 2 in the Notes to Consolidated Financial Statements included in Item 8 of this Annual Report on Form 10-K for a discussion of accounting pronouncements issued but not yet adopted.
Off-Balance Sheet Arrangements
We do not have any off-balance sheet arrangements that have or are reasonably likely to have a material current or future effect on our financial condition, changes in financial condition, revenue or expenses, results of operations, liquidity, capital expenditures or capital resources.
37
Table of Contents
| ITEM 7A. | QUANTITATIVE AND QUALITATIVE DISCLOSURES ABOUT MARKET RISK |
Foreign Currency Exchange Risk
At times, we attempt to mitigate our currency exposures related to recorded transactions and the measurement of our subsidiaries’ net assets and results of operations using forward currency exchange contracts. The purpose of these contracts is to reduce the risk that our earnings and future cash flows of the underlying assets and liabilities will be adversely affected by changes in exchange rates. In some cases, we enter into forward sale or purchase contracts for foreign currencies to hedge specific receivables or payables. As of December 31, 2014, we had forward contracts outstanding for Japanese yen and euro totaling approximately $25.3 million, which matured in January 2015.
We do not enter into derivative financial instruments for speculative purposes. Our forward exchange contracts do not qualify for hedge accounting treatment and, accordingly, gains and losses on our forward exchange contracts are recognized currently as a component of other income (expense).
Interest Rate Risk
Our exposure to market risk from changes in interest rates relates primarily to our investments. The primary objective of our investment activities is to preserve principal while maximizing yields without significantly increasing risk. This is accomplished by investing in diversified investments, consisting only of investment-grade securities.
As of December 31, 2014, we held cash and cash equivalents, marketable securities and restricted cash and cash equivalents of $39.8 million. Based on the nature of our marketable securities, a decline in interest rates over time would reduce our interest income, but would not have a material impact on our results of operations, financial position or cash flows, as we have classified our securities as available-for-sale and, therefore, we may choose to sell or hold them as changes in the market occur. In addition, due to the nature of our marketable securities and cash equivalents, a decline in interest rates would not materially affect the fair value of our marketable securities or cash equivalents.
| ITEM 8. | FINANCIAL STATEMENTS AND SUPPLEMENTARY DATA |
The financial statements and notes thereto required by Item 8 begin on page F-1 of this Annual Report on Form 10-K. Unaudited quarterly financial data for each of the eight quarters in the two-year period ended December 31, 2014 was as follows:
| In thousands, except per share data |
1st Quarter | 2nd Quarter | 3rd Quarter | 4th Quarter | ||||||||||||
| 2014 |
||||||||||||||||
| Revenue(1) |
$ | 33,685 | $ | 32,995 | $ | 32,749 | $ | 36,593 | ||||||||
| Gross profit |
16,273 | 16,986 | 17,520 | 19,535 | ||||||||||||
| Income from operations |
2,602 | 2,928 | 3,614 | 4,140 | ||||||||||||
| Net income |
1,592 | 1,828 | 2,207 | 4,303 | ||||||||||||
| Basic net income per share(2) |
0.10 | 0.11 | 0.13 | 0.26 | ||||||||||||
| Diluted net income per share(2) |
0.10 | 0.11 | 0.13 | 0.25 | ||||||||||||
| 2013 |
||||||||||||||||
| Revenue |
$ | 27,471 | $ | 30,307 | $ | 28,197 | $ | 34,035 | ||||||||
| Gross profit |
11,543 | 14,275 | 13,418 | 15,488 | ||||||||||||
| Income from operations |
1,041 | 2,517 | 1,571 | 2,204 | ||||||||||||
| Net income(3) |
747 | 2,186 | 1,683 | 8,802 | ||||||||||||
| Basic net income per share(2) |
0.05 | 0.15 | 0.12 | 0.54 | ||||||||||||
| Diluted net income per share(2) |
0.05 | 0.15 | 0.11 | 0.53 | ||||||||||||
| (1) | Reflects a reduction of previously reported revenue and cost of sales of $0.1 million, $0.5 million and $0.7 million, respectively, for the quarters ended March 31, 2014, June 30, 2014 and September 30, 2014, for the elimination of certain intercompany sales and cost of sales from our consolidated results. The correction had no impact on reported gross profit, income from operations, net income or net income per share. |
| (2) | Quarterly per share amounts may not add to yearly totals due to rounding. |
| (3) | Net income in the fourth quarter of 2013 includes a $6.6 million tax benefit related primarily to the release of valuation allowance on deferred tax assets. |
38
Table of Contents
| ITEM 9. | CHANGES IN AND DISAGREEMENTS WITH ACCOUNTANTS ON ACCOUNTING AND FINANCIAL DISCLOSURE |
None.
| ITEM 9A. | CONTROLS AND PROCEDURES |
Management’s Report on Internal Control Over Financial Reporting
Our management is responsible for establishing and maintaining adequate internal control over financial reporting, as such term is defined in Rule 13a-15(f) under the Securities Exchange Act of 1934, as amended (the “Exchange Act”). Under the supervision and with the participation of our management, including our principal executive officer and principal financial officer, we conducted an evaluation of the effectiveness of our internal control over financial reporting based on the framework in Internal Control – Integrated Framework issued by the Committee of Sponsoring Organizations of the Treadway Commission (1992 COSO). Based on our evaluation under this framework, our management concluded that our internal control over financial reporting was effective as of December 31, 2014.
Changes in Internal Control Over Financial Reporting
There has been no change in our internal control over financial reporting that occurred during our last fiscal quarter that has materially affected, or is reasonably likely to materially affect, our internal control over financial reporting.
Disclosure Controls and Procedures
Our management has evaluated, under the supervision and with the participation of our Chief Executive Officer and Chief Financial Officer, the effectiveness of our disclosure controls and procedures as of the end of the period covered by this report pursuant to Exchange Act Rule 13a-15(b) under the Exchange Act. Based on that evaluation, our Chief Executive Officer and Chief Financial Officer have concluded that, as of the end of the period covered by this report, our disclosure controls and procedures are effective in ensuring that information required to be disclosed in our Exchange Act reports is (1) recorded, processed, summarized and reported in a timely manner, and (2) accumulated and communicated to our management, including our Chief Executive Officer and Chief Financial Officer, as appropriate to allow timely decisions regarding required disclosure.
Limitation on Effectiveness of Controls
Our management, including our Chief Executive Officer and Chief Financial Officer, do not expect that our disclosure controls and procedures or our internal control over financial reporting will prevent or detect all errors and all occurrences of fraud. A control system, no matter how well designed and operated, can provide only reasonable, not absolute, assurance that the objectives of the control systems are met. In addition, the design of a control system must reflect the fact that there are resource constraints, and the benefits of all controls must be considered relative to their costs. Control systems can be circumvented by the individual acts of some persons, by collusion of two or more people, or by management override of the control. In addition, over time, controls may become inadequate because of changes in conditions, or the degree of compliance with the policies or procedures may deteriorate. Because of the inherent limitations in all control systems, no evaluation of controls can provide absolute assurance that the control systems will detect all control issues, including instances of fraud, if any.
39
Table of Contents
Report of Independent Registered Public Accounting Firm
The Board of Directors and Shareholders
Cascade Microtech, Inc.
We have audited Cascade Microtech. and subsidiaries (the “Company”) internal control over financial reporting as of December 31, 2014, based on criteria established in Internal Control – Integrated Framework (1992) issued by the Committee of Sponsoring Organizations of the Treadway Commission (COSO). The Company’s management is responsible for maintaining effective internal control over financial reporting and for its assessment of the effectiveness of internal control over financial reporting, included in the accompanying Management’s Report on Internal Control over Financial Reporting. Our responsibility is to express an opinion on the Company’s internal control over financial reporting based on our audit.
We conducted our audit in accordance with the standards of the Public Company Accounting Oversight Board (United States). Those standards require that we plan and perform the audit to obtain reasonable assurance about whether effective internal control over financial reporting was maintained in all material respects. Our audit included obtaining an understanding of internal control over financial reporting, assessing the risk that a material weakness exists, and testing and evaluating the design and operating effectiveness of internal control based on the assessed risk. Our audit also included performing such other procedures as we considered necessary in the circumstances. We believe that our audit provides a reasonable basis for our opinion.
A company’s internal control over financial reporting is a process designed to provide reasonable assurance regarding the reliability of financial reporting and the preparation of financial statements for external purposes in accordance with generally accepted accounting principles. A company’s internal control over financial reporting includes those policies and procedures that (1) pertain to the maintenance of records that, in reasonable detail, accurately and fairly reflect the transactions and dispositions of the assets of the company; (2) provide reasonable assurance that transactions are recorded as necessary to permit preparation of financial statements in accordance with generally accepted accounting principles, and that receipts and expenditures of the company are being made only in accordance with authorizations of management and directors of the company; and (3) provide reasonable assurance regarding prevention or timely detection of unauthorized acquisition, use, or disposition of the company’s assets that could have a material effect on the financial statements.
Because of its inherent limitations, internal control over financial reporting may not prevent or detect misstatements. Also, projections of any evaluation of effectiveness to future periods are subject to the risk that controls may become inadequate because of changes in conditions, or that the degree of compliance with the policies or procedures may deteriorate.
In our opinion, the Company maintained, in all material respects, effective internal control over financial reporting as of December 31, 2014, based on criteria established in Internal Control – Integrated Framework (1992) issued by the Committee of Sponsoring Organizations of the Treadway Commission (COSO).
We also have audited, in accordance with the standards of the Public Company Accounting Oversight Board (United States), the consolidated balance sheets of the Company as of December 31, 2014 and 2013, and the related consolidated statements of operations, comprehensive income, shareholders’ equity and cash flows for each of the years in the three-year period ended December 31, 2014, and our report dated March 11, 2015 expressed an unqualified opinion on those consolidated financial statements.
/s/ KPMG LLP
Portland, Oregon
March 11, 2015
40
Table of Contents
| ITEM 9B. | OTHER INFORMATION |
None.
PART III
We have incorporated by reference into Part III the information that will appear in our definitive proxy statement for our 2015 Annual Meeting of Shareholders (the “Proxy Statement”), which will be filed within 120 days after the end of our year ended December 31, 2014 pursuant to Regulation 14A.
| ITEM 10. | DIRECTORS, EXECUTIVE OFFICERS AND CORPORATE GOVERNANCE |
Information with respect to directors and executive officers is included under “Election of Directors,” “Meetings and Committees of the Board of Directors,” “Executive Officers,” “Section 16(a) Beneficial Ownership Reporting Compliance,” “Audit Committee Financial Expert” and “Code of Ethics” in our Proxy Statement and is incorporated herein by reference.
| ITEM 11. | EXECUTIVE COMPENSATION |
Information with respect to executive compensation is included under “Director Compensation” and “Executive Compensation” in our Proxy Statement and is incorporated herein by reference.
| ITEM 12. | SECURITY OWNERSHIP OF CERTAIN BENEFICIAL OWNERS AND MANAGEMENT AND RELATED STOCKHOLDER MATTERS |
The information required by this item is included under “Equity Compensation Plan Information” and “Security Ownership of Certain Beneficial Owners and Management” in our Proxy Statement and is incorporated herein by reference.
| ITEM 13. | CERTAIN RELATIONSHIPS AND RELATED TRANSACTIONS, AND DIRECTOR INDEPENDENCE |
The information required by this item is included under “Certain Relationships and Related Transactions” and “Director Independence” in our Proxy Statement and is incorporated herein by reference.
| ITEM 14. | PRINCIPAL ACCOUNTING FEES AND SERVICES |
The information required by this item is included under “Ratification of Appointment of Independent Registered Public Accountants” in our Proxy Statement and is incorporated herein by reference.
41
Table of Contents
| ITEM 15. | EXHIBITS AND FINANCIAL STATEMENT SCHEDULES |
Financial Statements and Schedules
The Consolidated Financial Statements, together with the report thereon of KPMG LLP, are included on the pages indicated below:
Financial statement schedules have been omitted because they are not applicable or the required information is shown in the financial statements or notes thereto.
Exhibits
The following exhibits are filed herewith and this list is intended to constitute the exhibit index.
| Exhibit No. |
Description | |
| 2.1 | Asset Purchase Agreement dated as of September 22, 2011 by and among Cascade Microtech, Inc., Gryphics, Inc., R&D Sockets, Inc. and R&D Circuits Holdings LLC*. Incorporated by reference to Exhibit 2.1 to our Form 8-K as filed with the Securities and Exchange Commission on September 26, 2011. | |
| 2.2 | Agreement on the Sale and Transfer of All of the Shares in ATT Advance Temperature Test Systems GmbH dated October 1, 2013. Incorporated by reference to Exhibit 2.1 to our Form 8-K as filed with the Securities and Exchange Commission on October 3, 2013. | |
| 3.1 | Third Amended and Restated Articles of Incorporation of Cascade Microtech, Inc. Incorporated by reference to Exhibit 3.1 to our Form 8-K filed December 23, 2004. | |
| 3.2 | Second Amended and Restated Bylaws of Cascade Microtech, Inc., as amended March 31, 2006. Incorporated by reference to Exhibit 3.1 to our Form 10-Q for the quarterly period ended March 31, 2006 and filed with the Securities and Exchange Commission on May 10, 2006. | |
| 3.3 | Second Amendment to Second Amended and Restated Bylaws of Cascade Microtech, Inc. dated November 16, 2007. Incorporated by reference to Exhibit 3.1 to our Current Report on Form 8-K filed on November 21, 2007. | |
| 4.1 | Reference is made to Exhibit 3.1. | |
| 10.1* | Form of Indemnity Agreement between Cascade Microtech, Inc. and each of its Officers and Directors. Incorporated by reference to Exhibit 10.1 to our Registration Statement on Form S-1 filed on October 2, 2000. | |
| 10.2* | Cascade Microtech, Inc. 2000 Stock Incentive Plan, as amended. Incorporated by reference to Exhibit 10.1 to our Form 8-K as filed with the Securities and Exchange Commission on May 20, 2009. | |
| 10.3* | Cascade Microtech, Inc. 2010 Stock Incentive Plan, as amended, effective as of May 9, 2014. Incorporated by reference to Appendix A to our Definitive Proxy Statement on Schedule 14A for the 2014 Annual Meeting of Shareholders filed on April 7, 2014. | |
| 10.4* | Cascade Microtech, Inc. 2013 Employee Stock Purchase Plan. Incorporated by reference to Appendix B to our Definitive Proxy Statement on Schedule 14A for the 2013 Annual Meeting of Shareholders filed on April 8, 2013. | |
| 10.5* | Cascade Microtech, Inc. 2013 Employee Incentive Plan. Incorporated by reference to Exhibit 10.1 to our Form 10-Q for the quarterly period ended March 31, 2013 and filed May 8, 2013. | |
| 10.6* | Amended executive employment agreement dated July 6, 2013 between Cascade Microtech, Inc. and Michael D. Burger. Incorporated by reference to Exhibit 10.1 to our Form 10-Q for the quarterly period ended September 30, 2013 and filed November 7, 2013. | |
42
Table of Contents
| Exhibit No. |
Description | |
| 10.7* | Form of Amended and Restated Change in Control Severance Agreement for executive officers dated August 29, 2012 (together with an attached Appendix that lists material details by which the individual contracts, which are substantially identical in all material respects, differ from the form). Incorporated by reference to Exhibit 10.9 to our Form 10-K for the year ended December 31, 2012 and filed March 4, 2013. | |
| 10.8 | Lease Agreements I and II between Amberjack, Ltd. And Cascade Microtech, Inc. dated August 20, 1997, and Amendment No. 2 to Lease Agreement I dated July 23, 1998, and Amendment No. 2 to Lease Agreement II dated April 12, 1999. Incorporated by reference to Exhibit 10.9 to our Registration Statement on Form S-1 filed October 2, 2000. | |
| 10.9 | Third Amendment dated August 11, 2006 to Lease Agreement I dated August 20, 1997 between Amberjack, LTD. And Cascade Microtech, Inc. Incorporated by reference to Exhibit 10.2 to our Form 10-Q for the quarterly period ended September 30, 2006 and filed November 9, 2006. | |
| 10.10 | Third Amendment dated August 11, 2006 to Lease Agreement II dated August 20, 1997 between Amberjack, LTD. And Cascade Microtech, Inc. Incorporated by reference to Exhibit 10.3 to our Form 10-Q for the quarterly period ended September 30, 2006 and filed November 9, 2006. | |
| 10.11 | Assignment, Assumption and Amendment of Lease dated as of September 22, 2011 by and among Cascade Microtech, Inc. and R&D Sockets, Inc. Incorporated by reference to Exhibit 10.1 to our Form 8-K as filed with the Securities and Exchange Commission on September 26, 2011. | |
| 10.12 | Rental Agreement by and between Cascade Microtech Dresden GmbH and Süss Grundstücksverwaltungs GbR dated as of June 17, 2011. Incorporated by reference to Exhibit 10.3 to our Form 10-Q for the quarterly period ended June 30, 2011 and filed August 10, 2011. | |
| 10.13 | Line of Credit agreement dated August 8, 2013 between JPMorgan Chase Bank, N.A. and Cascade Microtech, Inc. Incorporated by reference to Exhibit 10.2 to our Form 10-Q for the quarterly period ended September 30, 2013 and filed November 7, 2013. | |
| 10.14 | Line of Credit Note dated August 8, 2013 between JPMorgan Chase Bank, N.A. and Cascade Microtech, Inc. Incorporated by reference to Exhibit 10.3 to our Form 10-Q for the quarterly period ended September 30, 2013 and filed November 7, 2013. | |
| 10.15 | Lease dated April 2, 1999 between Spieker Properties, L.P. and Cascade Microtech, Inc. Incorporated by reference to Exhibit 10.8 to our Form S-1 filed October 2, 2000. | |
| 10.16 | First amendment to Lease dated January 10, 2007, between Nimbus Center LLC and Cascade Microtech, Inc. Incorporated by reference to Exhibit 10.1 to our form 10-Q for the quarterly period ended March 31, 2014 and filed May 9, 2014. | |
| 10.17 | Second amendment to Lease dated February 25, 2013, between Nimbus Center LLC and Cascade Microtech, Inc. Incorporated by reference to Exhibit 10.2 to our form 10-Q for the quarterly period ended March 31, 2013 and filed May 8, 2013. | |
| 10.18 | Third amendment to Lease dated January 23, 2014, between Nimbus Center LLC and Cascade Microtech, Inc. Incorporated by reference to Exhibit 10.2 to our form 10-Q for the quarterly period ended March 31, 2014 and filed May 9, 2014. | |
| 10.19 | Fourth amendment to Lease dated March 31, 2014, between Nimbus Center LLC and Cascade Microtech, Inc. Incorporated by reference to Exhibit 10.3 to our form 10-Q for the quarterly period ended March 31, 2014 and filed May 9, 2014. | |
| 14.1 | Code of Ethics. Incorporated by reference to Exhibit 14 to our Form 10-K for the year ended December 31, 2004 and filed March 29, 2005. | |
| 21.1 | List of Subsidiaries. | |
| 23.1 | Consent of KPMG LLP. | |
| 31.1 | Certification of Chief Executive Officer pursuant to Rule 13a-14(a) or Rule 15d-14(a) of the Securities Exchange Act of 1934. | |
| 31.2 | Certification of Chief Financial Officer pursuant to Rule 13a-14(a) or Rule 15d-14(a) of the Securities Exchange Act of 1934. | |
| 32.1 | Certification of Chief Executive Officer pursuant to Rule 13a-14(b) or Rule 15d-14(b) of the Securities Exchange Act of 1934 and 18 U.S.C. Section 1350. | |
| 32.2 | Certification of Chief Executive Officer pursuant to Rule 13a-14(b) or Rule 15d-14(b) of the Securities Exchange Act of 1934 and 18 U.S.C. Section 1350. | |
| 101.INS | XBRL Instance Document. | |
| 101.SCH | XBRL Taxonomy Extension Schema Document. | |
| 101.CAL | XBRL Taxonomy Extension Calculation Linkbase Document. | |
| 101.DEF | XBRL Taxonomy Extension Definition Linkbase Document. | |
| 101.LAB | XBRL Taxonomy Extension Label Linkbase Document. | |
| 101.PRE | XBRL Taxonomy Extension Presentation Linkbase Document. | |
|
* Management or compensatory arrangement. | ||
43
Table of Contents
Pursuant to the requirements of Section 13 or 15(d) of the Securities Exchange Act of 1934, Cascade Microtech, Inc. has duly caused this report to be signed on its behalf by the undersigned, thereunto duly authorized on March 11, 2015:
| CASCADE MICROTECH, INC. | ||
| (Registrant) | ||
| By: | /s/ MICHAEL D. BURGER | |
| Michael D. Burger | ||
| Director, President and Chief Executive Officer | ||
| (Principal Executive Officer) | ||
Pursuant to the request of the Securities Exchange Act of 1934, this report has been signed below on behalf of the Registrant and in the capacities indicated on March 11, 2015.
| SIGNATURE |
TITLE | |
| /s/ MICHAEL D. BURGER |
Director, President and Chief Executive Officer | |
| Michael D. Burger | (Principal Executive Officer) | |
| /s/ JEFF KILLIAN |
Chief Financial Officer and Treasurer | |
| Jeff Killian | (Principal Financial and Accounting Officer) | |
| /s/ Dr. WILLIAM R. SPIVEY |
Chairman of the Board | |
| Dr. William R. Spivey | ||
| /s/ Dr. JOHN Y. CHEN |
Director | |
| Dr. John Y. Chen | ||
| /s/ J.D. DELAFIELD |
Director | |
| J.D. Delafield | ||
| /s/ RAYMOND A. LINK |
Director | |
| Raymond A. Link | ||
| /s/ MARTIN L. RAPP |
Director | |
| Martin L. Rapp | ||
| /s/ ERIC W. STRID |
Director | |
| Eric W. Strid | ||
44
Table of Contents
Report of Independent Registered Public Accounting Firm
The Board of Directors and Shareholders
Cascade Microtech, Inc.:
We have audited the accompanying consolidated balance sheets of Cascade Microtech, Inc. and subsidiaries (the “Company”) as of December 31, 2014 and 2013, and the related consolidated statements of operations, consolidated statements of comprehensive income, shareholders’ equity and cash flows for each of the years in the three-year period ended December 31, 2014. These consolidated financial statements are the responsibility of the Company’s management. Our responsibility is to express an opinion on these consolidated financial statements based on our audits.
We conducted our audits in accordance with the standards of the Public Company Accounting Oversight Board (United States). Those standards require that we plan and perform the audit to obtain reasonable assurance about whether the financial statements are free of material misstatement. An audit includes examining, on a test basis, evidence supporting the amounts and disclosures in the financial statements. An audit also includes assessing the accounting principles used and significant estimates made by management, as well as evaluating the overall financial statement presentation. We believe that our audits provide a reasonable basis for our opinion.
In our opinion, the consolidated financial statements referred to above present fairly, in all material respects, the financial position of Cascade Microtech, Inc. and subsidiaries as of December 31, 2014 and 2013, and the results of their operations and their cash flows for each of the years in the three-year period ended December 31, 2014, in conformity with U.S. generally accepted accounting principles.
We also have audited, in accordance with the standards of the Public Company Accounting Oversight Board (United States), the Company’s internal control over financial reporting as of December 31, 2014, based on criteria established in Internal Control – Integrated Framework (1992) issued by the Committee of Sponsoring Organizations of the Treadway Commission (COSO), and our report dated March 11, 2015 expressed an unqualified opinion on the effectiveness of the Company’s internal control over financial reporting.
/s/ KPMG LLP
Portland, Oregon
March 11, 2015
F-1
Table of Contents
Cascade Microtech, Inc.
(In thousands, except share par value)
| December 31, | ||||||||
| 2014 | 2013 | |||||||
| Assets |
||||||||
| Current Assets: |
||||||||
| Cash and cash equivalents |
$ | 38,107 | $ | 17,172 | ||||
| Short-term marketable securities |
1,626 | 4,278 | ||||||
| Restricted cash |
61 | 1,082 | ||||||
| Accounts receivable, net of allowances of $208 and $269 |
20,763 | 26,520 | ||||||
| Inventories |
24,642 | 24,884 | ||||||
| Prepaid expenses and other |
4,454 | 2,147 | ||||||
| Deferred income taxes |
3,027 | 2,268 | ||||||
|
|
|
|
|
|||||
| Total Current Assets |
92,680 | 78,351 | ||||||
| Fixed assets, net of accumulated depreciation of $28,407 and $27,730 |
8,100 | 6,403 | ||||||
| Goodwill |
12,823 | 14,471 | ||||||
| Purchased intangible assets, net of accumulated amortization of $5,324 and $5,228 |
12,572 | 16,937 | ||||||
| Deferred income taxes |
1,262 | 1,235 | ||||||
| Other assets |
944 | 1,114 | ||||||
|
|
|
|
|
|||||
| Total Assets |
$ | 128,381 | $ | 118,511 | ||||
|
|
|
|
|
|||||
| Liabilities and Shareholders’ Equity |
||||||||
| Current Liabilities: |
||||||||
| Accounts payable |
$ | 7,505 | $ | 7,229 | ||||
| Deferred revenue |
2,070 | 2,555 | ||||||
| Accrued liabilities |
9,505 | 8,859 | ||||||
|
|
|
|
|
|||||
| Total Current Liabilities |
19,080 | 18,643 | ||||||
| Deferred revenue |
329 | 548 | ||||||
| Other long-term liabilities |
1,511 | 2,119 | ||||||
|
|
|
|
|
|||||
| Total Liabilities |
20,920 | 21,310 | ||||||
| Shareholders’ Equity: |
||||||||
| Common stock, $0.01 par value. Authorized 100,000 shares; issued and outstanding: 16,466 and 16,218 |
165 | 162 | ||||||
| Additional paid-in capital |
111,480 | 107,908 | ||||||
| Accumulated other comprehensive income (loss) |
(3,127 | ) | 118 | |||||
| Accumulated deficit |
(1,057 | ) | (10,987 | ) | ||||
|
|
|
|
|
|||||
| Total Shareholders’ Equity |
107,461 | 97,201 | ||||||
|
|
|
|
|
|||||
| Total Liabilities and Shareholders’ Equity |
$ | 128,381 | $ | 118,511 | ||||
|
|
|
|
|
|||||
See accompanying Notes to Consolidated Financial Statements.
F-2
Table of Contents
Cascade Microtech, Inc.
Consolidated Statements of Operations
(In thousands, except per share amounts)
| For the Year Ended December 31, | ||||||||||||
| 2014 | 2013 | 2012 | ||||||||||
| Revenue |
$ | 136,022 | $ | 120,010 | $ | 112,963 | ||||||
| Cost of sales |
65,708 | 65,286 | 63,012 | |||||||||
|
|
|
|
|
|
|
|||||||
| Gross profit |
70,314 | 54,724 | 49,951 | |||||||||
| Operating expenses: |
||||||||||||
| Research and development |
13,821 | 10,961 | 11,017 | |||||||||
| Selling, general and administrative |
43,209 | 36,430 | 31,377 | |||||||||
|
|
|
|
|
|
|
|||||||
| Total operating expenses |
57,030 | 47,391 | 42,394 | |||||||||
|
|
|
|
|
|
|
|||||||
| Income from operations |
13,284 | 7,333 | 7,557 | |||||||||
| Other income (expense): |
||||||||||||
| Interest income, net |
29 | 44 | 52 | |||||||||
| Other, net |
(649 | ) | (296 | ) | (801 | ) | ||||||
|
|
|
|
|
|
|
|||||||
| Total other income (expense), net |
(620 | ) | (252 | ) | (749 | ) | ||||||
|
|
|
|
|
|
|
|||||||
| Income before income taxes |
12,664 | 7,081 | 6,808 | |||||||||
| Income tax expense (benefit) |
2,734 | (6,337 | ) | 709 | ||||||||
|
|
|
|
|
|
|
|||||||
| Net income |
9,930 | 13,418 | 6,099 | |||||||||
|
|
|
|
|
|
|
|||||||
| Basic net income per share |
$ | 0.61 | $ | 0.91 | $ | 0.43 | ||||||
|
|
|
|
|
|
|
|||||||
| Diluted net income per share |
$ | 0.59 | $ | 0.89 | $ | 0.42 | ||||||
|
|
|
|
|
|
|
|||||||
| Shares used in per share calculations: |
||||||||||||
| Basic |
16,323 | 14,792 | 14,182 | |||||||||
|
|
|
|
|
|
|
|||||||
| Diluted |
16,828 | 15,150 | 14,390 | |||||||||
|
|
|
|
|
|
|
|||||||
See accompanying Notes to Consolidated Financial Statements.
F-3
Table of Contents
Cascade Microtech, Inc.
Consolidated Statements of Comprehensive Income
(In thousands)
| For the Year Ended December 31, | ||||||||||||
| 2014 | 2013 | 2012 | ||||||||||
| Net income |
$ | 9,930 | $ | 13,418 | $ | 6,099 | ||||||
| Other comprehensive income (loss): |
||||||||||||
| Unrealized holding gains (losses), net of tax |
(3 | ) | 1 | (11 | ) | |||||||
| Change in cumulative translation adjustment, net of tax |
(3,242 | ) | 833 | 347 | ||||||||
|
|
|
|
|
|
|
|||||||
| (3,245 | ) | 834 | 336 | |||||||||
|
|
|
|
|
|
|
|||||||
| Comprehensive income |
$ | 6,685 | $ | 14,252 | $ | 6,435 | ||||||
|
|
|
|
|
|
|
|||||||
See accompanying Notes to Consolidated Financial Statements.
F-4
Table of Contents
Cascade Microtech, Inc.
Consolidated Statements of Shareholders’ Equity for The Years Ended December 31, 2014, 2013 and 2012
(In thousands)
| Additional Paid-In Capital |
Accumulated Other Comprehensive Income (Loss) |
Accumulated Deficit |
Total Shareholders’ Equity |
|||||||||||||||||||||
| Common Stock | ||||||||||||||||||||||||
| Shares | Amount | |||||||||||||||||||||||
| Balance at December 31, 2011 |
14,165 | $ | 142 | $ | 90,711 | $ | (1,052 | ) | $ | (30,504 | ) | $ | 59,297 | |||||||||||
| Common stock issued pursuant to stock plans |
307 | 3 | 395 | — | — | 398 | ||||||||||||||||||
| Common stock repurchased |
(273 | ) | (3 | ) | (1,329 | ) | — | — | (1,332 | ) | ||||||||||||||
| Value of vested restricted stock withheld for tax liability |
— | — | (339 | ) | — | — | (339 | ) | ||||||||||||||||
| Stock-based compensation |
— | — | 1,459 | — | — | 1,459 | ||||||||||||||||||
| Foreign currency translation, net of tax |
— | — | — | 347 | — | 347 | ||||||||||||||||||
| Unrealized holding loss on investments, net of tax |
— | — | — | (11 | ) | — | (11 | ) | ||||||||||||||||
| Net income |
— | — | — | — | 6,099 | 6,099 | ||||||||||||||||||
|
|
|
|
|
|
|
|
|
|
|
|
|
|||||||||||||
| Balance at December 31, 2012 |
14,199 | 142 | 90,897 | (716 | ) | (24,405 | ) | 65,918 | ||||||||||||||||
| Common stock issued pursuant to stock plans |
421 | 4 | 1,578 | — | — | 1,582 | ||||||||||||||||||
| Common stock repurchased |
(10 | ) | — | (58 | ) | — | — | (58 | ) | |||||||||||||||
| Common stock issued in connection with acquisition |
1,608 | 16 | 14,508 | — | — | 14,524 | ||||||||||||||||||
| Value of vested restricted stock withheld for tax liability |
— | — | (476 | ) | — | — | (476 | ) | ||||||||||||||||
| Stock-based compensation |
— | — | 1,614 | — | — | 1,614 | ||||||||||||||||||
| Reversal of tax benefit related to stock-based awards |
— | — | (155 | ) | — | — | (155 | ) | ||||||||||||||||
| Foreign currency translation, net of tax |
— | — | — | 833 | — | 833 | ||||||||||||||||||
| Unrealized holding gain on investments, net of tax |
— | — | — | 1 | — | 1 | ||||||||||||||||||
| Net income |
— | — | — | — | 13,418 | 13,418 | ||||||||||||||||||
|
|
|
|
|
|
|
|
|
|
|
|
|
|||||||||||||
| Balance at December 31, 2013 |
16,218 | 162 | 107,908 | 118 | (10,987 | ) | 97,201 | |||||||||||||||||
| Common stock issued pursuant to stock plans |
363 | 4 | 2,097 | — | — | 2,101 | ||||||||||||||||||
| Common stock repurchased |
(115 | ) | (1 | ) | (1,069 | ) | — | — | (1,070 | ) | ||||||||||||||
| Value of vested restricted stock withheld for tax liability |
— | — | (699 | ) | — | — | (699 | ) | ||||||||||||||||
| Stock-based compensation |
— | — | 2,482 | — | — | 2,482 | ||||||||||||||||||
| Tax benefit related to stock-based awards |
— | — | 761 | — | — | 761 | ||||||||||||||||||
| Foreign currency translation, net of tax |
— | — | — | (3,242 | ) | — | (3,242 | ) | ||||||||||||||||
| Unrealized holding loss on investments, net of tax |
— | — | — | (3 | ) | — | (3 | ) | ||||||||||||||||
| Net income |
— | — | — | — | 9,930 | 9,930 | ||||||||||||||||||
|
|
|
|
|
|
|
|
|
|
|
|
|
|||||||||||||
| Balance at December 31, 2014 |
16,466 | $ | 165 | $ | 111,480 | $ | (3,127 | ) | $ | (1,057 | ) | $ | 107,461 | |||||||||||
|
|
|
|
|
|
|
|
|
|
|
|
|
|||||||||||||
See accompanying Notes to Consolidated Financial Statements.
F-5
Table of Contents
Cascade Microtech, Inc.
Consolidated Statements of Cash Flows
(In thousands)
| For the Year Ended December 31, | ||||||||||||
| 2014 | 2013 | 2012 | ||||||||||
| Cash flows from operating activities: |
||||||||||||
| Net income |
$ | 9,930 | $ | 13,418 | $ | 6,099 | ||||||
| Adjustments to reconcile net income to net cash flows provided by operating activities, net of acquisitions: |
||||||||||||
| Depreciation |
3,335 | 3,661 | 3,547 | |||||||||
| Amortization |
3,011 | 1,522 | 1,082 | |||||||||
| Stock-based compensation |
2,482 | 1,614 | 1,459 | |||||||||
| Loss on write-down or disposal of long-lived assets |
45 | 8 | 4 | |||||||||
| Deferred income taxes |
(398 | ) | (7,176 | ) | (113 | ) | ||||||
| Excess tax benefits related to stock option exercises |
(853 | ) | — | — | ||||||||
| (Increase) decrease, net of effect of acquisitions, in: |
||||||||||||
| Accounts receivable, net |
5,371 | (4,606 | ) | 2,804 | ||||||||
| Inventories |
(1,063 | ) | 3,429 | (1,493 | ) | |||||||
| Prepaid expenses and other |
898 | 1,989 | 1,677 | |||||||||
| Increase (decrease), net of effect of acquisitions, in: |
||||||||||||
| Accounts payable |
44 | 657 | (177 | ) | ||||||||
| Deferred revenue |
(704 | ) | (788 | ) | (1,867 | ) | ||||||
| Accrued and other long-term liabilities |
2,105 | (1,483 | ) | (2,434 | ) | |||||||
|
|
|
|
|
|
|
|||||||
| Net cash provided by operating activities |
24,203 | 12,245 | 10,588 | |||||||||
| Cash flows from investing activities: |
||||||||||||
| Purchase of marketable securities |
(2,947 | ) | (15,312 | ) | (9,145 | ) | ||||||
| Proceeds from sale of marketable securities |
5,596 | 16,357 | 8,302 | |||||||||
| Decrease in restricted cash |
952 | 33 | 425 | |||||||||
| Purchase of fixed assets |
(4,856 | ) | (1,692 | ) | (1,767 | ) | ||||||
| Proceeds from sale of fixed assets and assets held for sale |
34 | 16 | 25 | |||||||||
| Cash paid for acquisitions, net of cash acquired |
(1,528 | ) | (13,253 | ) | — | |||||||
|
|
|
|
|
|
|
|||||||
| Net cash used in investing activities |
(2,749 | ) | (13,851 | ) | (2,160 | ) | ||||||
| Cash flows from financing activities: |
||||||||||||
| Principal payments on capital lease obligations |
— | (2 | ) | (16 | ) | |||||||
| Withholding taxes paid on net settlement of vested restricted stock units |
(699 | ) | (476 | ) | (339 | ) | ||||||
| Excess tax benefits related to stock option exercises |
853 | — | — | |||||||||
| Proceeds from issuances of common stock |
2,101 | 1,582 | 398 | |||||||||
| Cash paid for repurchase of common stock |
(1,070 | ) | (58 | ) | (1,332 | ) | ||||||
|
|
|
|
|
|
|
|||||||
| Net cash provided by (used in) financing activities |
1,185 | 1,046 | (1,289 | ) | ||||||||
| Effect of exchange rate changes on cash and cash equivalents |
(1,704 | ) | (195 | ) | 132 | |||||||
|
|
|
|
|
|
|
|||||||
| Increase (decrease) in cash and cash equivalents |
20,935 | (755 | ) | 7,271 | ||||||||
| Cash and cash equivalents: |
||||||||||||
| Beginning of year |
17,172 | 17,927 | 10,656 | |||||||||
|
|
|
|
|
|
|
|||||||
| End of year |
$ | 38,107 | $ | 17,172 | $ | 17,927 | ||||||
|
|
|
|
|
|
|
|||||||
| Supplemental disclosure of cash flow information: |
||||||||||||
| Cash paid for income taxes, net |
$ | 1,282 | $ | 566 | $ | 1,552 | ||||||
| Supplemental disclosure of non-cash information: |
||||||||||||
| Common stock issued in connection with acquisitions |
$ | — | $ | 14,524 | $ | — | ||||||
| Fair value of assets acquired from acquisitions, net of cash |
— | 35,209 | — | |||||||||
| Liabilities assumed from acquisitions |
— | 4,893 | — | |||||||||
| Payable for fixed assets |
525 | — | — | |||||||||
| Transfer from (to) inventory to (from) fixed assets |
(182 | ) | (94 | ) | 1,038 | |||||||
See accompanying Notes to Consolidated Financial Statements.
F-6
Table of Contents
Cascade Microtech, Inc.
Notes to Consolidated Financial Statements
NOTE 1. SUMMARY OF SIGNIFICANT ACCOUNTING POLICIES
Nature of Business
We design, develop, manufacture and market advanced wafer probing, thermal and reliability solutions for the electrical measurement and testing of high performance semiconductor devices. Our products enable precision on-wafer measurement of integrated circuits and are typically used in the early phases of the development of semiconductor processes where the accuracy and repeatability of measurements is critical to achieving yield from advanced process nodes. They are also used in production applications to test semiconductor devices prior to completion of the manufacturing process. We design, manufacture and assemble our products in Beaverton, Oregon, North St. Paul, Minnesota, Munich, Germany, and Dresden, Germany and maintain global sales, service and support centers in North America, Germany, Japan, Taiwan, China and Singapore.
Principles of Consolidation
The consolidated financial statements include the accounts of Cascade Microtech, Inc. and its wholly owned subsidiaries. All intercompany accounts and transactions have been eliminated in consolidation.
Use of Estimates in Financial Reporting
The preparation of financial statements in conformity with U.S. generally accepted accounting principles requires management to make estimates and assumptions that affect the reported amounts of assets and liabilities and disclosure of contingent assets and liabilities at the date of the financial statements, as well as revenues and expenses reported for the periods presented. On an on-going basis, we evaluate our estimates, including those related to revenue recognition, allowance for doubtful accounts, valuation of excess and obsolete inventory, lives and recoverability of equipment and other long-lived assets, goodwill impairment, warranty liabilities, deferred tax asset valuation allowance, unrecognized tax benefits, stock-based compensation, lease abandonment costs, contingencies and litigation. We base our estimates on historical experience and on various other assumptions that we believe to be reasonable under the circumstances, the results of which form the basis for making judgments about the carrying values of assets and liabilities that are not readily apparent from other sources. Actual results may differ from these estimates under different assumptions or conditions.
Cash and Cash Equivalents
We consider all highly liquid investments with an original maturity of three months or less to be cash equivalents. Our cash balances with financial institutions may exceed the deposit insurance limits. Included in cash and cash equivalents were cash equivalents of $6.6 million and $4.0 million at December 31, 2014 and 2013, respectively, which consisted primarily of money market funds, and are stated at cost, which approximates market value.
Marketable Securities
We classify our marketable securities as available-for-sale and, accordingly, record them at fair value. Unrealized holding gains and losses are excluded from earnings and are reported as a separate component of Shareholders’ equity until realized. Dividend and interest income is recognized when earned. Realized gains and losses are included in earnings and are derived using the specific identification method for determining the cost of securities sold.
We periodically evaluate whether declines in fair values of our investments below their cost are “other-than-temporary.” This evaluation consists of qualitative and quantitative factors regarding the severity and duration of the unrealized loss, as well as our ability and intent to hold the investment until a forecasted recovery occurs.
F-7
Table of Contents
Restricted Cash
Our restricted cash is held in accounts with banks that have issued guarantees to our customers for advance deposits on goods and services. The guarantees allow the banks to withdraw the restricted cash from our accounts and return the advanced deposit to the customer if goods are not delivered or services are not properly performed. All of the guarantees expire within 12 months of the balance sheet date and, accordingly, are recorded as a current asset in our Consolidated Balance Sheets.
Trade Accounts Receivable
Trade accounts receivable are recorded at their invoiced amount and do not bear interest. The allowance for doubtful accounts is our best estimate of the amount of probable credit losses in our existing accounts receivable. We determine our allowance for doubtful accounts utilizing historical collection percentages considering the aging of the accounts and known trends with current customers, including recent significant changes in their financial position.
Activity related to our allowance for doubtful accounts was as follows (in thousands):
| Balance, December 31, 2011 |
$ | 266 | ||
| Charges to costs and expenses |
133 | |||
| Write-offs |
(155 | ) | ||
| Recoveries |
101 | |||
|
|
|
|||
| Balance, December 31, 2012 |
345 | |||
| Charges to costs and expenses |
20 | |||
| Write-offs |
(96 | ) | ||
| Recoveries |
— | |||
|
|
|
|||
| Balance, December 31, 2013 |
269 | |||
| Charges to costs and expenses |
(50 | ) | ||
| Write-offs |
(14 | ) | ||
| Recoveries |
3 | |||
|
|
|
|||
| Balance, December 31, 2014 |
$ | 208 | ||
|
|
|
Inventories
Inventories are stated at the lower of standard cost, which approximates cost computed on a first-in, first-out basis, or market, and include materials, labor and manufacturing overhead. Demonstration goods, which are included as a component of finished goods, represent inventory that is used for customer demonstration purposes. This inventory is typically sold after 12 to 18 months. We analyze the carrying value of our inventory quarterly, considering a combination of factors including, but not limited to, the following: forecasted sales or usage, historical usage rates, estimated service period, product end-of-life dates, estimated current and future market values, service inventory requirements and new product introductions. We estimate market value based on factors including, but not limited to, replacement cost and estimated resale value with declines in value below cost being recorded quarterly as a component of cost of sales, therefore establishing a new cost basis for the inventory.
Inventory charges were as follows (in thousands):
| Year Ended December 31, | ||||||||||||
| 2014 | 2013 | 2012 | ||||||||||
| Inventory charges |
$ | 1,816 | $ | 1,559 | $ | 1,381 | ||||||
Fixed Assets
Equipment and leasehold improvements are stated at cost. Equipment under capital lease is recorded at the net present value of the future minimum lease payments at the inception of the lease. Maintenance and repairs are expensed as incurred. We do not accrue for the future cost of periodic major overhauls and planned maintenance of plant and equipment in annual or interim periods. Depreciation of owned equipment is provided using the straight-line method over the estimated useful lives of the assets, ranging from two to seven years. Amortization of equipment under capital leases and leasehold improvements is provided using the straight-line method over the life of the lease or the useful life of the asset, whichever is shorter. Fixed assets are reviewed for impairment as discussed below under “Accounting for the Impairment of Long-Lived Assets.” We did not capitalize any interest during 2014, 2013 or 2012.
F-8
Table of Contents
Goodwill
Goodwill represents the excess of the aggregate purchase price over the fair value of the net assets acquired
in a purchase business combination. Goodwill is not amortized but rather is reviewed for impairment at least annually, or more frequently if a triggering event occurs. We first make a qualitative assessment of whether it is more likely than not that a reporting unit’s fair value is less than its carrying amount before applying the two-step goodwill impairment test. If the conclusion is that it is more likely than not that the fair value of a reporting unit is less than its carrying amount, we then perform a two-step goodwill impairment test. Under the first step, the fair value of the reporting unit is compared to its carrying value, and, if an indication of goodwill impairment exists in the reporting unit, the enterprise must perform step two of the impairment test (measurement). Under step two, an impairment loss is recognized for any excess of the carrying amount of the reporting unit’s goodwill as determined by allocating the fair value of the reporting unit in a manner similar to a purchase price allocation. The residual fair value after this allocation is the implied fair value of the reporting unit goodwill. If the fair value of the reporting unit exceeds its carrying value, step two does not need to be performed.
Goodwill at December 31, 2014 relates to the following:
| • | our January 2010 acquisition of SUSS MicroTec Test Systems GmbH (“SUSS Test”); |
| • | our July 2013 acquisition of the Reliability Test Product (“RTP”) division of Aetrium Incorporated; and |
| • | our October 2013 acquisition of ATT Advanced Temperature Test Systems GmbH (“ATT Systems”). |
This goodwill relates to our Systems segment and represents the value of assembled workforce and other intangible assets that do not qualify for separate recognition. Our assessments performed in the fourth quarters of 2014, 2013 and 2012 did not indicate any impairment of goodwill.
Purchased Intangible Assets
Purchased intangible assets include various intangible assets acquired through business acquisitions. These assets are amortized using the straight-line method over their estimated useful lives of one to twelve years. Purchased intangible assets are reviewed for impairment as discussed below under “Accounting for the Impairment of Long-Lived Assets.”
Other Assets
Other long-term assets at December 31, 2014 and 2013 included $0.1 million and $0.3 million, respectively, of internally developed patents, net. These assets are amortized using the straight-line method over estimated useful lives of one to eight years and have no significant residual value. Patent amortization is included as a component of Selling, general and administrative expense. Patents are reviewed for impairment as discussed below under “Accounting for the Impairment of Long-Lived Assets.”
Accounting for the Impairment of Long-Lived Assets
Long-lived assets held and used by us, including fixed assets, patents and intangible assets with determinable lives, are reviewed for impairment whenever events or circumstances indicate that the carrying amount of assets may not be recoverable. We evaluate recoverability of assets to be held and used by comparing the carrying amount of an asset to future net undiscounted cash flows to be generated by the asset. If such assets are considered not to be recoverable, an impairment charge is recognized for the amount by which the carrying value of the assets exceeds the fair value of the assets. Such reviews assess the fair value of the assets based upon estimates of discounted future cash flows that the assets are expected to generate.
We did not record any impairment charges related to long-lived assets during 2014, 2013 or 2012.
Revenue Recognition
Revenue from product sales to customers and distributors that do not have special acceptance criteria is recognized when a written purchase order has been obtained, the price is fixed and determinable, the product is shipped, title has transferred and collectability is reasonably assured. Generally, we ship our products with origin terms. For any shipments with destination terms, we defer revenue until delivery to the customer. Revenue from customers who have special acceptance criteria beyond our standard terms and conditions is not recognized until all acceptance criteria are satisfied. Revenue for installation services, consisting of assembly and testing, is recognized when the services are performed.
F-9
Table of Contents
We sell our products to end-users through a combination of manufacturers’ representatives, distributors and direct sales people:
| • | manufacturers’ representatives are independent companies that agree to sell our products at our prices and on our terms and they are paid a commission based on a percentage of their sales of our products; |
| • | distributors purchase our products directly from us and pay us directly according to our standard terms and conditions; they then resell the products to end users at prices and terms set by them; and |
| • | the direct sales force consists of our salaried and commissioned employees. |
Our transactions may involve the sale of systems and services under multiple element arrangements. Revenue under multiple element arrangements is allocated based on the fair value of each element. A typical multiple element arrangement may include some or all of the following components: products, accessories, installation services and extended warranty contracts. The total sales price is allocated based on the relative fair value of each component. We record deferred revenue for service contracts and customer deposits. Deferred revenue related to service contracts and extended warranties is recognized over the life of the contract based on the stated contractual price, typically one to two years.
Taxes Collected from Customers and Remitted to Governmental Authorities
We account for tax assessed by a governmental authority that is directly imposed on a revenue-producing transaction (i.e., sales, use, value added) on a net (excluded from revenue) basis.
Shipping and Handling Costs
Shipping and handling costs are included as a component of Cost of sales.
Significant Customers
No customer in 2014, 2013 or 2012 accounted for 10% or more of our total revenues. At December 31, 2014 and 2013, no customers represented 10% or more of our gross accounts receivable balance.
Product Warranty
We estimate a liability for costs to repair or replace products under warranty for periods ranging from 90 days to one year when the related product revenue is recognized. The liability for product warranties is calculated as a percentage of sales. The percentage is based on historical product repair costs. The liability for product warranties is included in Accrued liabilities. Product warranty activity was as follows (in thousands):
| Warranty accrual, December 31, 2011 |
$ | 729 | ||
| Reductions for warranty charges |
(888 | ) | ||
| Additions to warranty reserve |
875 | |||
|
|
|
|||
| Warranty accrual, December 31, 2012 |
716 | |||
| Reductions for warranty charges |
(798 | ) | ||
| Additions to warranty reserve |
827 | |||
|
|
|
|||
| Warranty accrual, December 31, 2013 |
745 | |||
| Reductions for warranty charges |
(812 | ) | ||
| Additions to warranty reserve |
864 | |||
|
|
|
|||
| Warranty accrual, December 31, 2014 |
$ | 797 | ||
|
|
|
Additions to the warranty reserve in 2013 include accrued warranty costs of $0.2 million assumed with the acquisitions in 2013 as discussed in Note 3.
Advertising
Advertising costs, which are included as a component of Selling, general and administrative expense, are expensed as incurred and have been insignificant.
Research and Development
Research and development costs are expensed as incurred.
F-10
Table of Contents
Legal Costs
We may be a party to legal proceedings arising in the normal course of business. We accrue for certain legal costs, including attorney fees, and potential settlement claims related to various legal proceedings that are estimable and probable. If not estimable and probable, legal costs are expensed as incurred. Legal costs related to patents are included in Research and development expense. All other legal costs are included in Selling, general and administrative expense.
Forward Exchange Contracts
We enter into forward foreign currency exchange contracts, which typically expire within six months, to manage our exposure against foreign currency fluctuations in either the euro or Japanese yen. These foreign exchange contracts are not considered hedges and, as such, are recorded at fair value on the balance sheet with any changes in fair value included as Other income (expense), net in our Consolidated Statements of Operations. At December 31, 2014 and 2013, we had $25.3 million and $27.1 million, respectively, of forward exchange contracts outstanding. The unrealized gain (loss) on contracts outstanding was as follows (in thousands):
| December 31, | ||||||||
| 2014 | 2013 | |||||||
| Unrealized gain (loss) |
$ | 1,020 | $ | (437 | ) | |||
Income Taxes
Deferred income taxes are established for the difference between the financial reporting and income tax basis of assets and liabilities as well as operating loss and tax credit carryforwards. Deferred tax assets are reduced by a valuation allowance when, in the opinion of management, it is more likely than not that all or some portion of the deferred tax assets will not be realized. Deferred tax assets and liabilities are measured using enacted tax rates expected to apply to taxable income in the years in which those temporary differences are expected to be recovered or settled. The effect on deferred taxes of a change in tax rates is recognized in income in the period that includes the enactment date.
We recognize the benefits of tax return positions if we determine that the positions are “more-likely-than-not” to be sustained by the taxing authority. Interest and penalties accrued on unrecognized tax benefits are recorded as tax expense in the period incurred. We are subject to income taxes within the U.S. and foreign jurisdictions, and, in the ordinary course of business, there are transactions and calculations where the ultimate tax determination is uncertain. We report a liability (or contra asset) for unrecognized tax benefits resulting from uncertain tax positions taken, or expected to be taken, in a tax return.
Net Income Per Share
Basic net income per share is computed by dividing the net income attributed to common shareholders for the period by the weighted average number of shares of common stock outstanding during the period. Diluted net income per share incorporates the incremental shares issuable upon the assumed exercise of stock options and vesting of restricted stock units using the treasury stock method, if dilutive.
The following table reconciles the shares used in calculating basic net income per share and diluted net income per share (in thousands):
| Year Ended December 31, | ||||||||||||
| 2014 | 2013 | 2012 | ||||||||||
| Shares used to calculate basic net income per share |
16,323 | 14,792 | 14,182 | |||||||||
| Dilutive effect of outstanding options and restricted stock units (“RSUs”) |
505 | 358 | 208 | |||||||||
|
|
|
|
|
|
|
|||||||
| Shares used to calculate diluted net income per share |
16,828 | 15,150 | 14,390 | |||||||||
|
|
|
|
|
|
|
|||||||
| Securities not considered as they would have been antidilutive |
793 | 1,094 | 1,271 | |||||||||
|
|
|
|
|
|
|
|||||||
F-11
Table of Contents
Stock-Based Compensation
We calculate stock-based compensation expense utilizing fair value-based methodologies and recognize the expense on a straight-line basis over the vesting period of such awards. The fair value of stock option awards is based on the Black-Scholes option pricing model, and the fair value of restricted stock units and stock awards is based on the fair value of our common stock on the date of grant. Compensation expense recorded for awards that do not vest is reversed in the period that it is determined that the award will not vest.
Certain Risks and Uncertainties
Our future operating results and financial condition are subject to influences driven by rapid technological changes, a highly competitive industry, a lengthy sales cycle, and the cyclical nature of general economic conditions. Future operating results will depend on many factors, including demand for our products, the introduction and industry acceptance of new products and the level and timing of available shippable orders and backlog.
In addition, we rely on several suppliers to provide certain key components used in our products. Some of these items are available from only one supplier or a limited group of suppliers. Any disruption in the availability and delivery of these items could adversely affect our revenues and results of operations.
Segment Reporting
We operate in two business segments: Systems and Probes. Sales of our probe stations, reliability test systems and thermal subsystems are included in the Systems segment. Sales of our analytical probes and production probe cards are included in the Probes segment.
Foreign Currency Translation
The local currency is the functional currency for each of our foreign subsidiaries. Assets and liabilities are translated into U.S. dollars at current exchange rates, and sales and expenses are translated using average rates. Gains and losses from translation of assets and liabilities are included in Accumulated other comprehensive income (loss) in our Consolidated Balance Sheets.
NOTE 2. RECENT ACCOUNTING GUIDANCE
ASU 2014-17
In November 2014, the Financial Accounting Standards Board (“FASB”) issued Accounting Standards Update (“ASU”) 2014-17, “Business Combinations (Topic 805).” ASU 2014-17 addresses whether an acquired entity can reflect the acquirer’s accounting and reporting basis (pushdown accounting) in its separate financial statements. ASU 2014-17 became effective November 18, 2014. The adoption of ASU 2014-17 did not have any effect on our financial position, results of operations or cash flows.
ASU 2014-16
In November 2014, the FASB issued ASU 2014-16, “Derivatives and Hedging (Topic 815).” ASU 2014-16 addresses whether the host contract in a hybrid financial instrument issued in the form of a share should be accounted for as debt or equity. ASU 2014-16 is effective for annual periods and interim periods beginning after December 15, 2015. We do not currently have issued, nor are we investors in, hybrid financial instruments. Accordingly, we do not expect the adoption of ASU 2014-16 to have any effect on our financial position, results of operations or cash flows.
F-12
Table of Contents
ASU 2014-12
In June 2014, the FASB issued ASU 2014-12, “Compensation – Stock Compensation (Topic 718).” ASU 2014-12 addresses accounting for share-based payments when the terms of an award provide that a performance target could be achieved after the requisite service period. ASU 2014-12 indicates that, in such situations, the performance target should be treated as a performance condition and, accordingly, the performance target should not be reflected in estimating the grant-date fair value of the award. Instead, compensation cost should be recognized in the period in which it becomes probable that the performance target will be achieved. ASU 2014-12 is effective for annual periods and interim periods beginning after December 15, 2015. We do not expect the adoption of ASU 2014-12 to have a material effect on our financial position, results of operations or cash flows.
ASU 2014-09
In May 2014, the FASB issued ASU No. 2014-09, “Revenue from Contracts with Customers (Topic 606).” ASU 2014-09 clarifies the principles for recognizing revenue and develops a common revenue standard for GAAP and the International Accounting Standards Board. ASU 2014-09 is effective for annual and interim periods beginning on or after December 15, 2016. Early adoption is not permitted. The standard permits the use of either the retrospective or cumulative effect transition method. We are evaluating the effect that ASU 2014-09 will have on our consolidated financial statements and related disclosures. We have not yet selected a transition method nor have we determined the effect of the standard on our ongoing financial reporting.
ASU 2013-11
In July 2013, the FASB issued ASU No. 2013-11, “Presentation of an Unrecognized Tax Benefit When a Net Operating Loss Carryforward, a Similar Tax Loss, or a Tax Credit Carryforward Exists.” ASU 2013-11 amends the guidance related to the presentation of unrecognized tax benefits and allows for the reduction of a deferred tax asset for a net operating loss (“NOL”) carryforward whenever the NOL or tax credit carryforward would be available to reduce the additional taxable income or tax due if the tax position is disallowed. ASU 2013-11 is effective for annual and interim periods for fiscal years beginning after December 15, 2013, and early adoption is permitted. Since ASU 2013-11 relates only to the presentation of unrecognized tax benefits, our adoption of ASU 2013-11 in January 2014 did not have a material effect on our financial position, results of operations or cash flows.
NOTE 3. ACQUISITIONS
ATT Systems
On October 1, 2013, we acquired all of the outstanding shares of Advanced Temperature Test Systems GmbH (“ATT Systems”) for consideration of 9.6 million euro, or approximately $13.0 million, and 1.6 million shares of our common stock valued at $14.5 million. Approximately 8.8 million euro were paid at closing, 0.4 million euro was paid on October 1, 2014 and 0.4 million euro are to be paid on October 1, 2015. In addition, in December 2013, a working capital adjustment totaling 0.2 million euro, or approximately $0.2 million, was made as an adjustment to increase the purchase price and was paid in January 2014.
We believe the acquisition of ATT Systems (the “ATT Acquisition”) strategically positions the combined company for future system development and access to larger markets.
F-13
Table of Contents
The allocation of the purchase price for the ATT Acquisition was as follows (dollars in thousands):
| Assets: |
Useful Life | |||||||
| Cash |
$ | 559 | — | |||||
| Accounts receivable |
408 | — | ||||||
| Inventory |
2,585 | — | ||||||
| Prepaid expenses and other |
1,393 | — | ||||||
| Fixed assets |
137 | 3 years | ||||||
| Goodwill |
12,551 | — | ||||||
| Other intangible assets: |
||||||||
| Core technology |
10,266 | 6 years | ||||||
| Customer relationships |
3,377 | 8 years | ||||||
| Trademarks and tradenames |
1,216 | 10 years | ||||||
|
|
|
|||||||
| 14,859 | ||||||||
|
|
|
|||||||
| 32,492 | ||||||||
| Liabilities: |
||||||||
| Accounts payable |
518 | — | ||||||
| Accrued liabilities |
252 | — | ||||||
| Long-term deferred tax liability |
4,061 | 6 -10 years | ||||||
|
|
|
|||||||
| 4,831 | ||||||||
|
|
|
|||||||
| Net assets acquired |
$ | 27,661 | ||||||
|
|
|
|||||||
The key factors attributable to the creation of goodwill by the ATT Acquisition are the assembled workforce and our assessment regarding the ability of the business to generate cash flows beyond the lives of the finite-lived intangible assets. None of the goodwill or purchased intangibles are expected to be deductible for income tax purposes. The weighted average amortization period as of the date of closing for all intangible assets acquired is 6.8 years.
The long-term deferred tax liability relates to the difference between the fair value of the acquired net assets, excluding goodwill, and their respective carryover historical tax basis and will generally be amortized over the life of the acquired intangibles.
Transaction costs of $0.7 million were expensed as incurred as a component of Selling, general and administrative expenses.
ATT System’s results of operations have been included in our consolidated financial statements and Systems segment subsequent to the date of acquisition as follows (in thousands):
| Year Ended December 31, | ||||||||
| 2014 | 2013 | |||||||
| Revenue |
$ | 12,936 | $ | 3,778 | ||||
| Operating income |
2,749 | 448 | ||||||
The unaudited pro forma results of operations, as if the ATT Acquisition had occurred on January 1, 2012 were as follows (in thousands):
| Year Ended December 31, | ||||||||
| 2013 | 2012 | |||||||
| Pro forma revenue |
$ | 127,618 | $ | 118,508 | ||||
| Pro forma net income |
14,564 | 5,834 | ||||||
| Pro forma basic net income per share |
0.90 | 0.37 | ||||||
| Pro forma diluted net income per share |
0.88 | 0.36 | ||||||
F-14
Table of Contents
RTP
On July 31, 2013, we acquired certain assets of RTP for $1.9 million in cash (the “RTP Acquisition”), and contingent consideration of $0.8 million, which was paid during 2014. The fair value of the contingent consideration was determined to be $1.3 million as of the acquisition date and, accordingly, $0.5 million was credited to Selling, general and administrative expenses during 2014 as the liability was settled.
We believe the RTP Acquisition expands our product portfolio and served available market while leveraging our existing sales and service channel. The results of operations of the RTP Acquisition are included in our Systems segment.
The allocation of the purchase price for the RTP Acquisition was as follows (dollars in thousands):
| Useful Life | ||||||||
| Current assets |
$ | 1,198 | — | |||||
| Fixed assets |
17 | 2 years | ||||||
| Goodwill |
641 | — | ||||||
| Other intangible assets: |
||||||||
| Core technology |
930 | 5 years | ||||||
| Customer relationships |
490 | 12 years | ||||||
|
|
|
|||||||
| 1,420 | ||||||||
| Current liabilities |
(62 | ) | — | |||||
|
|
|
|||||||
| Net assets acquired |
$ | 3,214 | ||||||
|
|
|
|||||||
The key factor attributable to the creation of goodwill by the transaction is the assembled workforce. All of the goodwill and purchased intangibles are expected to be deductible for income tax purposes. The weighted average amortization period as of the date of closing for all intangible assets acquired is 7.4 years.
Transaction costs of $0.2 million associated with the RTP Acquisition were expensed as incurred as a component of Selling, general and administrative expenses.
RTP’s results of operations have been included in our consolidated financial statements and Systems segment subsequent to the date of acquisition as follows (in thousands):
| Year Ended December 31, | ||||||||
| 2014 | 2013 | |||||||
| Revenue |
$ | 2,954 | $ | 1,222 | ||||
| Operating loss |
595 | 40 | ||||||
Pro forma results of operations have not been presented because the effect of the acquisition was not material to prior period financial statements.
F-15
Table of Contents
NOTE 4. MARKETABLE SECURITIES
Certain information regarding our marketable securities was as follows (in thousands):
| December 31, | ||||||||
| 2014 | 2013 | |||||||
| Fair value: |
||||||||
| Corporate obligations |
$ | 1,620 | $ | 4,277 | ||||
| Corporate equities |
6 | 1 | ||||||
|
|
|
|
|
|||||
| $ | 1,626 | $ | 4,278 | |||||
|
|
|
|
|
|||||
| Cost: |
||||||||
| Corporate obligations |
$ | 1,620 | $ | 4,276 | ||||
| Corporate equities |
6 | 1 | ||||||
|
|
|
|
|
|||||
| $ | 1,626 | $ | 4,277 | |||||
|
|
|
|
|
|||||
| Fair value by maturity: |
||||||||
| Within one year |
$ | 1,620 | $ | 4,277 | ||||
| One to two years |
— | — | ||||||
| Corporate equities |
6 | 1 | ||||||
|
|
|
|
|
|||||
| $ | 1,626 | $ | 4,278 | |||||
|
|
|
|
|
|||||
| Gross unrealized holding gains: |
||||||||
| Corporate obligations |
$ | — | $ | 1 | ||||
| U.S. treasury and agency securities |
— | — | ||||||
|
|
|
|
|
|||||
| $ | — | $ | 1 | |||||
|
|
|
|
|
|||||
| Gross unrealized holding losses: |
||||||||
| Corporate obligations |
$ | — | $ | — | ||||
| U.S. treasury and agency securities |
— | — | ||||||
|
|
|
|
|
|||||
| $ | — | $ | — | |||||
|
|
|
|
|
|||||
Realized gains and losses on marketable securities were immaterial during 2014, 2013 and 2012.
NOTE 5. FAIR VALUE MEASUREMENTS
Various inputs are used in determining the fair value of our financial assets and liabilities and are summarized into three broad categories:
| • | Level 1 – quoted prices in active markets for identical securities; |
| • | Level 2 – other significant observable inputs, including quoted prices for similar securities, interest rates, credit risk, etc.; and |
| • | Level 3 – significant unobservable inputs, including our own assumptions in determining fair value. |
The inputs or methodology used for valuing securities are not necessarily an indication of the risk associated with investing in those securities.
The disclosures related to our financial assets and (liabilities) that are reported at fair value on a recurring basis are as follows (in thousands):
| December 31, 2014 | December 31, 2013 | |||||||||||||||
| Fair Value | Input Level | Fair Value | Input Level | |||||||||||||
| Marketable securities – corporate equities |
$ | 6 | Level 1 | $ | 1 | Level 1 | ||||||||||
| Marketable securities – corporate obligations |
$ | 1,620 | Level 2 | $ | 4,277 | Level 2 | ||||||||||
| Forward sale contracts for Japanese yen |
$ | 2,510 | Level 2 | $ | 523 | Level 2 | ||||||||||
| Forward purchase contract for euro |
$ | 726 | Level 2 | $ | 2,061 | Level 2 | ||||||||||
| Forward sale contract for euro |
$ | 22,056 | Level 2 | $ | 24,561 | Level 2 | ||||||||||
| Contingent consideration related to the RTP Acquisition |
$ | — | Level 3 | $ | (1,350 | ) | Level 3 | |||||||||
F-16
Table of Contents
The fair value of our marketable securities is determined based on quoted market prices for similar or identical securities. The fair value of our forward contracts is based on quoted market prices for similar securities and is used for the purpose of determining any gain or loss on our foreign currency positions. We do not record the full value of the forward contracts in our Condensed Consolidated Balance Sheets. We record the net unrealized gain or loss in our Consolidated Statements of Operations and as a component of Other income (expense).
The fair value of the contingent consideration related to the RTP Acquisition was determined based on the present value of probability weighted payments expected to be made under the terms of the agreement.
The carrying values of Cash and cash equivalents, Restricted cash, Accounts receivable, Prepaid expenses and other, Accounts payable and Accrued liabilities approximate fair value due to their short maturities.
No changes were made to our valuation techniques during 2014.
The following table summarizes our Level 3 activity for our contingent consideration liability (in thousands):
| Level 3 | ||||
| Balance at December 31, 2013 |
$ | 1,350 | ||
| Decrease in contingent consideration due to re-measurement |
(522 | ) | ||
| Payment of contingent consideration |
(828 | ) | ||
|
|
|
|||
| Balance at December 31, 2014 |
$ | — | ||
|
|
|
|||
NOTE 6. INVENTORIES
Inventories consisted of the following (in thousands):
| December 31, | ||||||||
| 2014 | 2013 | |||||||
| Raw materials |
$ | 14,120 | $ | 15,234 | ||||
| Work-in-process |
3,809 | 2,958 | ||||||
| Finished goods |
6,713 | 6,692 | ||||||
|
|
|
|
|
|||||
| $ | 24,642 | $ | 24,884 | |||||
|
|
|
|
|
|||||
NOTE 7. FIXED ASSETS
Fixed assets consisted of the following (in thousands):
| December 31, | ||||||||
| 2014 | 2013 | |||||||
| Equipment |
$ | 25,749 | $ | 25,673 | ||||
| Leasehold improvements |
9,220 | 8,253 | ||||||
| Construction in progress |
1,538 | 207 | ||||||
|
|
|
|
|
|||||
| 36,507 | 34,133 | |||||||
| Less accumulated depreciation |
(28,407 | ) | (27,730 | ) | ||||
|
|
|
|
|
|||||
| $ | 8,100 | $ | 6,403 | |||||
|
|
|
|
|
|||||
Depreciation expense was as follows (in thousands):
| Year Ended December 31, | ||||||||||||
| 2014 | 2013 | 2012 | ||||||||||
| Depreciation expense |
$ | 3,335 | $ | 3,661 | $ | 3,547 | ||||||
F-17
Table of Contents
NOTE 8. GOODWILL AND PURCHASED INTANGIBLE ASSETS
Goodwill
The change in goodwill was as follows (in thousands):
| Year Ended December 31, | ||||||||||||
| 2014 | 2013 | 2012 | ||||||||||
| Balance, beginning of period |
$ | 14,471 | $ | 990 | $ | 971 | ||||||
| Acquisition of RTP |
— | 641 | — | |||||||||
| Acquisition of ATT Systems |
— | 12,551 | — | |||||||||
| Effect of exchange rate changes |
(1,648 | ) | 289 | 19 | ||||||||
|
|
|
|
|
|
|
|||||||
| Balance, end of period |
$ | 12,823 | $ | 14,471 | $ | 990 | ||||||
|
|
|
|
|
|
|
|||||||
Intangible Assets
Intangible assets, net included the following (in thousands):
| December 31, | ||||||||
| 2014 | 2013 | |||||||
| Purchased Intangible Assets |
||||||||
| Customer relationships |
$ | 4,323 | $ | 7,198 | ||||
| Core technology |
12,481 | 13,728 | ||||||
| Trademarks and tradenames |
1,092 | 1,239 | ||||||
|
|
|
|
|
|||||
| 17,896 | 22,165 | |||||||
| Less accumulated amortization |
(5,324 | ) | (5,228 | ) | ||||
|
|
|
|
|
|||||
| $ | 12,572 | $ | 16,937 | |||||
|
|
|
|
|
|||||
| Patents |
||||||||
| Patents |
$ | 4,632 | $ | 4,632 | ||||
| Less accumulated amortization |
(4,540 | ) | (4,349 | ) | ||||
|
|
|
|
|
|||||
| $ | 92 | $ | 283 | |||||
|
|
|
|
|
|||||
Intangible asset amortization is a component of Selling, general and administrative expense and was as follows (in thousands):
| Year Ended December 31, | ||||||||||||
| 2014 | 2013 | 2012 | ||||||||||
| Intangible amortization |
$ | 3,011 | $ | 1,522 | $ | 1,082 | ||||||
The estimated amortization of intangible assets is as follows over the next five years and thereafter (in thousands):
| 2015 |
$ | 2,632 | ||
| 2016 |
2,340 | |||
| 2017 |
2,321 | |||
| 2018 |
2,244 | |||
| 2019 |
1,751 | |||
| Thereafter |
1,376 | |||
|
|
|
|||
| $ | 12,664 | |||
|
|
|
F-18
Table of Contents
NOTE 9. ACCRUED LIABILITIES
Accrued liabilities consisted of the following (in thousands):
| December 31, | ||||||||
| 2014 | 2013 | |||||||
| Accrued compensation and benefits |
$ | 3,606 | $ | 2,812 | ||||
| Accrued sales taxes and VAT |
276 | 470 | ||||||
| Accrued income taxes |
1,628 | 492 | ||||||
| Accrued warranty |
797 | 745 | ||||||
| Contingent consideration related to RTP acquisition |
— | 1,350 | ||||||
| Payable to seller related to ATT acquisition |
456 | 746 | ||||||
| Accrued restructuring costs |
1,959 | 1,163 | ||||||
| Other |
783 | 1,081 | ||||||
|
|
|
|
|
|||||
| $ | 9,505 | $ | 8,859 | |||||
|
|
|
|
|
|||||
NOTE 10. LINE OF CREDIT
In August 2013, we entered into a line of credit agreement with JPMorgan Chase Bank, N.A. for a maximum $10.0 million line of credit facility (the “LOC”), which may be limited by a borrowing base. The LOC expires August 31, 2015 and contains a $2.5 million sublimit for letters of credit. Interest is based primarily on the London Interbank Offered Rate (“LIBOR”). The LOC contains restrictive and financial covenants. At December 31, 2014, no amounts were outstanding under the LOC, no letters of credit were outstanding and $10.0 million was available for borrowing.
NOTE 11. TAX PROVISION
Domestic and foreign pre-tax income from continuing operations was as follows (in thousands):
| Year Ended December 31, | ||||||||||||
| 2014 | 2013 | 2012 | ||||||||||
| Domestic |
$ | 8,076 | $ | 5,619 | $ | 4,933 | ||||||
| Foreign |
4,588 | 1,462 | 1,875 | |||||||||
|
|
|
|
|
|
|
|||||||
| $ | 12,664 | $ | 7,081 | $ | 6,808 | |||||||
|
|
|
|
|
|
|
|||||||
The income tax expense (benefit) from continuing operations consisted of the following (in thousands):
| Year Ended December 31, | ||||||||||||
| 2014 | 2013 | 2012 | ||||||||||
| Current: |
||||||||||||
| Federal |
$ | 1,086 | $ | (253 | ) | $ | 13 | |||||
| State |
184 | (39 | ) | 32 | ||||||||
| Foreign |
1,862 | 1,039 | 752 | |||||||||
|
|
|
|
|
|
|
|||||||
| Total current |
3,132 | 747 | 797 | |||||||||
| Deferred: |
||||||||||||
| Federal |
133 | (5,912 | ) | — | ||||||||
| State |
46 | (928 | ) | — | ||||||||
| Foreign |
(577 | ) | (244 | ) | (88 | ) | ||||||
|
|
|
|
|
|
|
|||||||
| Total deferred |
(398 | ) | (7,084 | ) | (88 | ) | ||||||
|
|
|
|
|
|
|
|||||||
| Income tax (benefit) expense |
$ | 2,734 | $ | (6,337 | ) | $ | 709 | |||||
|
|
|
|
|
|
|
|||||||
F-19
Table of Contents
The income tax (benefit) provision varies from the amounts computed by applying the Federal statutory rate of 34% to income from continuing operations before income taxes as follows (in thousands):
| Year Ended December 31, | ||||||||||||
| 2014 | 2013 | 2012 | ||||||||||
| Federal income tax provision computed at statutory rates |
$ | 4,269 | $ | 2,407 | $ | 2,281 | ||||||
| Difference in foreign tax rate |
(405 | ) | 174 | (141 | ) | |||||||
| State income taxes, net of federal benefit |
142 | 140 | 27 | |||||||||
| Stock-based compensation |
142 | 966 | 96 | |||||||||
| Research and development tax credits |
(33 | ) | (256 | ) | 56 | |||||||
| Expiration of tax credits |
236 | 167 | 200 | |||||||||
| Foreign tax credits |
(2,527 | ) | (47 | ) | (136 | ) | ||||||
| Foreign dividend |
1,281 | — | — | |||||||||
| Change in valuation allowance |
(158 | ) | (9,656 | ) | (1,877 | ) | ||||||
| Unrecognized tax benefits |
8 | 9 | 9 | |||||||||
| Foreign earnings not permanently reinvested |
— | (207 | ) | (58 | ) | |||||||
| Domestic production deduction |
(251 | ) | — | — | ||||||||
| Other |
30 | (34 | ) | 252 | ||||||||
|
|
|
|
|
|
|
|||||||
| Provision for (benefit from) income taxes |
$ | 2,734 | $ | (6,337 | ) | $ | 709 | |||||
|
|
|
|
|
|
|
|||||||
Deferred Tax Assets and Liabilities
Significant components of deferred income tax assets and liabilities were as follows (in thousands):
| December 31, | ||||||||
| 2014 | 2013 | |||||||
| Current deferred tax assets: |
||||||||
| Reserves and allowances |
$ | 273 | $ | 420 | ||||
| Inventory |
1,037 | 1,019 | ||||||
| Accrued vacation and bonus |
664 | 435 | ||||||
| Unrealized loss on forward contracts |
856 | 132 | ||||||
| Other current deferred tax assets |
197 | 262 | ||||||
|
|
|
|
|
|||||
| Gross current deferred tax assets |
3,027 | 2,268 | ||||||
| Valuation allowance |
— | — | ||||||
|
|
|
|
|
|||||
| Net current deferred tax assets |
3,027 | 2,268 | ||||||
| Non-current deferred tax assets: |
||||||||
| Reserves and allowances |
182 | 174 | ||||||
| Federal and state net operating loss (“NOL”) carryforwards |
21 | 573 | ||||||
| Federal and state tax credits |
1,781 | 2,640 | ||||||
| Stock-based compensation |
565 | 506 | ||||||
| Intangibles |
1,278 | 1,225 | ||||||
| Other non-current deferred tax assets |
637 | 768 | ||||||
|
|
|
|
|
|||||
| Gross non-current deferred tax assets |
4,464 | 5,886 | ||||||
| Valuation allowance |
— | (158 | ) | |||||
|
|
|
|
|
|||||
| Net non-current deferred tax assets |
4,464 | 5,728 | ||||||
| Non-current deferred tax liabilities: |
||||||||
| Foreign earnings |
— | (536 | ) | |||||
| Intangibles |
(2,936 | ) | (3,843 | ) | ||||
| Other non-current deferred tax liabilities |
(266 | ) | (114 | ) | ||||
|
|
|
|
|
|||||
| Total non-current deferred tax liabilities |
(3,202 | ) | (4,493 | ) | ||||
|
|
|
|
|
|||||
| Non-current deferred tax assets, net |
1,262 | 1,235 | ||||||
|
|
|
|
|
|||||
| Net total deferred tax assets |
$ | 4,289 | $ | 3,503 | ||||
|
|
|
|
|
|||||
F-20
Table of Contents
Deferred tax assets arise from the tax benefit of amounts expensed for financial reporting purposes but not yet realized for tax purposes and from unutilized tax credits and NOL carry forwards. We evaluate our deferred tax assets on a regular basis to determine if a valuation allowance is required. To the extent it is determined that it is more likely than not that we will not realize the benefit of our deferred tax assets, we record a valuation allowance against deferred tax assets.
The total valuation allowance was as follows (in thousands):
| December 31, | ||||||||
| 2014 | 2013 | |||||||
| Valuation allowance |
$ | — | $ | 158 | ||||
The net decrease in the total valuation allowance was as follows (in thousands):
| Year Ended December 31, | ||||||||||||
| 2014 | 2013 | 2012 | ||||||||||
| Decrease in valuation allowance |
$ | (158 | ) | $ | (9,656 | ) | $ | (1,877 | ) | |||
The decrease in valuation allowance in 2014 was primarily related to utilization and expiration of state tax credits. The decrease in valuation allowance in 2013 was primarily related to release of the valuation allowance against U.S. deferred tax assets as of December 31, 2013 as it is more likely than not that these deferred tax assets will be realized. The decrease in valuation allowance in 2012 was primarily related to utilization of NOL carryforwards.
We had tax NOL and credit carryforwards as of December 31, 2014 as follows:
| Amount | Expiration Date |
|||||||
| Federal and state research and experimentation credit carryforwards |
$ | 1.8 million | 2014-2034 | |||||
| State NOL carryforwards |
0.8 million | 2016-2031 | ||||||
Unrecognized Tax Benefits
A reconciliation of unrecognized tax benefits was as follows (in thousands):
| Balance, December 31, 2011 |
$ | 141 | ||
| Increases due to tax positions taken during the current year |
— | |||
| Increases due to tax positions taken during a prior year |
9 | |||
|
|
|
|||
| Balance, December 31, 2012 |
150 | |||
| Increases due to tax positions taken during the current year |
9 | |||
| Increases due to tax positions taken during a prior year |
— | |||
|
|
|
|||
| Balance, December 31, 2013 |
159 | |||
| Increases due to tax positions taken during the current year |
— | |||
| Decreases due to tax positions taken during a prior year |
(5 | ) | ||
|
|
|
|||
| Balance, December 31, 2014 |
$ | 154 | ||
|
|
|
All of the unrecognized tax benefits at December 31, 2014 would have an impact on the effective tax rate if recognized. Interest and penalties in 2014, 2013 and 2012 were insignificant. Interest and penalties accrued on unrecognized tax benefits as of December 31, 2014 and 2013 were also insignificant.
The tax years that remained open to examination in our major taxing jurisdictions as of December 31, 2014 were as follows:
| Jurisdiction |
Open Tax Years | |||
| U.S. |
2011-2014 | |||
| Japan |
2008-2014 | |||
| Germany |
2010-2014 | |||
F-21
Table of Contents
Non-Repatriated Foreign Earnings
During the fourth quarter of 2014, we repatriated all of the distributable earnings of our subsidiary in Japan through a cash dividend totaling $2.5 million. The dividend included previously permanently reinvested earnings of $0.9 million. We did not provide for U.S. income taxes on the remaining undistributed earnings of our foreign subsidiaries because they were considered permanently reinvested outside of the U.S. as of December 31, 2014. Upon repatriation, some of these earnings would generate foreign tax credits, which may reduce the U.S. tax liability associated with any future foreign dividend. At December 31, 2014, the cumulative amount of earnings upon which U.S. income taxes have not been provided is approximately $8.0 million. The determination of the amount of unrecognized deferred U.S. income tax liability and foreign tax credit, if any, is not practicable to calculate.
NOTE 12. OTHER INCOME (EXPENSE), NET
Other income (expense), net consisted of the following (in thousands):
| Year Ended December 31, | ||||||||||||
| 2014 | 2013 | 2012 | ||||||||||
| Interest income, net |
$ | 29 | $ | 44 | $ | 52 | ||||||
| Foreign currency losses |
(3,629 | ) | (311 | ) | (950 | ) | ||||||
| Gains on foreign currency forward contracts |
3,016 | 90 | 166 | |||||||||
| Other |
(36 | ) | (75 | ) | (17 | ) | ||||||
|
|
|
|
|
|
|
|||||||
| $ | (620 | ) | $ | (252 | ) | $ | (749 | ) | ||||
|
|
|
|
|
|
|
|||||||
NOTE 13. STOCK-BASED COMPENSATION AND STOCK-BASED PLANS
Certain information regarding our stock-based compensation was as follows (in thousands, except per share amounts):
| Year Ended December 31, | ||||||||||||
| 2014 | 2013 | 2012 | ||||||||||
| Weighted average grant-date per share fair value of stock options granted |
$ | 5.58 | $ | 5.35 | $ | 2.56 | ||||||
| Total intrinsic value of stock options exercised |
377 | 523 | 4 | |||||||||
| Fair value of restricted shares vested |
2,309 | 1,398 | 1,236 | |||||||||
| Tax benefit realized from stock options exercised and restricted stock units (“RSUs”) released |
954 | 729 | 436 | |||||||||
| Tax benefit recognized in our Consolidated Statements of Operations related to stock-based compensation |
750 | 537 | 25 | |||||||||
Our stock-based compensation was included in our Consolidated Statements of Operations as follows (in thousands):
| Year Ended December 31, | ||||||||||||
| 2014 | 2013 | 2012 | ||||||||||
| Cost of sales |
$ | 234 | $ | 201 | $ | 165 | ||||||
| Research and development |
321 | 198 | 242 | |||||||||
| Selling, general and administrative |
1,927 | 1,215 | 1,052 | |||||||||
|
|
|
|
|
|
|
|||||||
| $ | 2,482 | $ | 1,614 | $ | 1,459 | |||||||
|
|
|
|
|
|
|
|||||||
F-22
Table of Contents
To determine the fair value of stock-based awards granted, we used the Black-Scholes option pricing model and the following weighted-average assumptions:
| Year Ended December 31, | ||||||
| 2014 | 2013 | 2012 | ||||
| Stock Option Plan |
||||||
| Risk-free interest rate |
1.8% | 1.1% - 1.8% | 0.8% - 1.2% | |||
| Expected dividend yield |
0.0% | 0.0% | 0.0% | |||
| Expected term |
6.25 years | 6.25 years | 6.5 years | |||
| Expected volatility |
61.2% | 60.6% - 61.0% | 58.2% - 59.4% | |||
| Employee Stock Purchase Plan |
||||||
| Risk-free interest rate |
0.1% | 0.8% | 0.1% - 0.2% | |||
| Expected dividend yield |
0.0% | 0.0% | 0.0% | |||
| Expected term |
6 months | 6 months | 6 months | |||
| Expected volatility |
35.4% - 37.8% | 24.5% - 31.5% | 40.1% - 54.3% | |||
The risk-free rate used is based on the U.S. Treasury yield over the expected term of the options granted. Our option pricing model utilizes the simplified method to estimate the expected term. The expected volatility for options granted pursuant to our stock incentive plans and for our employee stock purchase plan is calculated based on our historic volatility. We have not paid dividends in the past and we do not expect to pay dividends in the future and, therefore, the expected dividend yield is 0%.
We amortize stock-based compensation on a straight-line basis over the vesting period of the individual awards, which is the requisite service period, with estimated forfeitures considered. Shares to be issued upon the exercise of stock options will come from newly issued shares.
Stock Incentive Plans
Our stock incentive plans include our 2000 Stock Incentive Plan (the “2000 Plan”) and our 2010 Stock Incentive Plan (the “2010 Plan”) (together, the “Plans”) and provide for the granting of incentive stock options, nonqualified stock options and RSUs. Incentive stock options must be granted at an exercise price not less than 100% of the fair market value per share at the grant date. Nonqualified stock options granted or shares sold under the Plans cannot be granted or sold at a price less than 85% of the fair market value per share at the date of grant or sale. The contractual term of options granted under the Plans is ten years, and the right to exercise options granted generally vests 25% each year over four years. Grants of RSUs generally vest 25% each year over four years, or 50% each year over two years. Grants to outside Board members vest immediately upon grant. We have authorized a total of 3,000,000 shares of common stock for issuance under the 2000 Plan and 2,869,600 shares under the 2010 Plan.
At December 31, 2014, a total of 994,202 shares were available for future grants, and we had 2,306,705 shares of our common stock reserved for future issuance under the Plans.
Stock option activity for the year ended December 31, 2014 and other Plan information was as follows:
| Options Outstanding |
Weighted Average Exercise Price |
|||||||
| Outstanding at December 31, 2013 |
1,042,937 | $ | 6.52 | |||||
| Granted |
90,000 | 9.61 | ||||||
| Exercised |
(148,166 | ) | 9.90 | |||||
| Forfeited |
(67,992 | ) | 9.01 | |||||
|
|
|
|||||||
| Outstanding at December 31, 2014 |
916,779 | 6.10 | ||||||
|
|
|
|||||||
F-23
Table of Contents
Certain information regarding options outstanding as of December 31, 2014 was as follows:
| Options Outstanding |
Options Exercisable |
|||||||
| Number |
916,779 | 555,689 | ||||||
| Weighted-average exercise price |
$ | 6.10 | $ | 5.48 | ||||
| Aggregate intrinsic value |
$ | 7,803,203 | $ | 5,071,011 | ||||
| Weighted-average remaining contractual term (in years) |
6.38 | 5.36 | ||||||
RSU activity for the year ended December 31, 2014 was as follows:
| Restricted Stock Units |
Weighted Average Grant Date Per Share Fair Value |
|||||||
| Outstanding at December 31, 2013 |
409,403 | $ | 6.87 | |||||
| Granted |
226,400 | 10.47 | ||||||
| Vested |
(205,739 | ) | 7.04 | |||||
| Forfeited |
(34,340 | ) | 6.98 | |||||
|
|
|
|||||||
| Outstanding at December 31, 2014 |
395,724 | 8.83 | ||||||
|
|
|
|||||||
As of December 31, 2014, total unrecognized stock-based compensation related to outstanding, but unvested stock options and RSUs was $4.0 million, which will be recognized over the weighted average remaining vesting period of 2.2 years.
Employee Stock Purchase Plan
Our 2013 Employee Share Purchase Plan (the “2013 ESPP”) was approved by shareholders in May 2013. The terms of our 2013 ESPP provide for the sale and issuance of up to 1.0 million shares of our common stock. The 2013 ESPP replaced our 2004 Employee Share Purchase Plan (the “2004 ESPP”) for the six-month option period beginning on November 1, 2013.
Any eligible employee may participate in the 2013 ESPP by completing a subscription agreement which allows participants to have between 2% and 15% of their compensation withheld to purchase shares of common stock at 85% of the fair market value of a share of common stock on the enrollment date or on the exercise date, whichever is lower. No more than $12,500 can be withheld to purchase shares of common stock in each offering period. The exercise date is the last trading day of each offering period and participating employees are automatically enrolled in the new offering period.
The following information relates to our 2013 ESPP activity during 2014:
| Shares issued pursuant to the 2013 ESPP |
70,533 | |||
| Weighted average price of shares issued |
$ | 9.00 | ||
| Discount per share from the fair market value on the dates of purchase |
$ | 1.71 | ||
| Shares remaining available for purchase pursuant to the 2013 ESPP as of December 31, 2014 |
929,467 |
F-24
Table of Contents
NOTE 14. RELATED PARTY TRANSACTIONS
Significant related party transactions are described below.
FEI Company
One of the members of our Board of Directors, Mr. Raymond A. Link, is the Executive Vice President and Chief Financial Officer of FEI Company (“FEI”).
Information regarding our transactions with FEI is as follows (in thousands):
| Year Ended December 31, | ||||||||||||
| 2014 | 2013 | 2012 | ||||||||||
| Equipment and services purchased from FEI |
$ | 36 | $ | 33 | $ | 37 | ||||||
| Equipment sold to FEI |
5 | — | — | |||||||||
| December 31, | ||||||||
| 2014 | 2013 | |||||||
| Due to FEI |
$ | 10 | $ | 8 | ||||
| Due from FEI |
— | — | ||||||
Raytheon, Inc.
One of the members of our Board of Directors, Dr. William R. Spivey, is a member of the Board of Directors of Raytheon, Inc. (“Raytheon”).
Information regarding our transactions with Raytheon is as follows (in thousands):
| Year Ended December 31, | ||||||||||||
| 2014 | 2013 | 2012 | ||||||||||
| Equipment sold to Raytheon |
$ | 176 | $ | 607 | $ | 267 | ||||||
| December 31, | ||||||||
| 2014 | 2013 | |||||||
| Due from Raytheon |
$ | 21 | $ | 10 | ||||
Lam Research Corporation
One of the members of our Board of Directors, Dr. William R. Spivey, is a member of the Board of Directors of Lam Research Corporation (“Lam”). Dr. Spivey formerly served on the Board of Novellus Systems Inc. (“Novellus”), which was acquired by Lam in June 2012.
Information regarding our transactions with Lam is as follows (in thousands):
| Year Ended December 31, | ||||||||||||
| 2014 | 2013 | 2012 | ||||||||||
| Equipment sold to Lam |
$ | 388 | $ | — | $ | 21 | ||||||
| December 31, | ||||||||
| 2014 | 2013 | |||||||
| Due from Lam |
$ | 3 | $ | — | ||||
F-25
Table of Contents
NOTE 15. EMPLOYEE BENEFIT PLAN
We sponsor a 401(k) savings plan that allows eligible employees to contribute a certain percentage of their salary. We match 50% of each eligible employees’ contributions, up to a maximum of 3% of the employees’ earnings. Our matching contributions for the savings plan were as follows (in thousands):
| Year Ended December 31, | ||||||||||||
| 2014 | 2013 | 2012 | ||||||||||
| 401(k) matching contributions |
$ | 534 | $ | 412 | $ | 362 | ||||||
NOTE 16. COMMITMENTS AND CONTINGENCIES
Leases and Subleases
We lease automobiles, office space and manufacturing space under operating leases that expire at various dates through 2020. In addition to lease expense, we pay real property taxes, insurance and repair and maintenance expenses for our corporate office and manufacturing facilities. We recognize rent expense related to our operating leases based on a straight-line basis over the life of the lease, including any periods of free rent.
Future minimum lease payments under non-cancelable operating leases with initial or remaining terms in excess of one year are as follows (in thousands):
| Year Ending December 31, |
||||
| 2015 |
$ | 3,605 | ||
| 2016 |
2,088 | |||
| 2017 |
2,085 | |||
| 2018 |
1,418 | |||
| 2019 |
1,450 | |||
| Thereafter |
597 | |||
|
|
|
|||
| Total minimum lease payments |
$ | 11,243 | ||
|
|
|
|||
Lease expense was as follows (in thousands).
| Year Ended December 31, | ||||||||||||
| 2014 | 2013 | 2012 | ||||||||||
| Lease expense |
$ | 2,630 | $ | 2,656 | $ | 2,575 | ||||||
Legal Proceedings
We are involved in various claims and legal actions arising in the ordinary course of business. In the opinion of management, the ultimate disposition of existing matters will not have a material adverse effect on our financial position, results of operations or liquidity.
F-26
Table of Contents
NOTE 17. RESTRUCTURING
Restructuring charges in 2014 related to the consolidation of certain manufacturing, research and development operations at our corporate headquarters in Beaverton, Oregon, as well as the reorganization of business operations and the sales channel in Europe. As of December 31, 2014, these restructuring and consolidation activities were substantially complete,
Restructuring charges in 2013 were related to the integration and consolidation of manufacturing operations in 2011 which resulted in lease abandonment charges.
Summary
Restructuring charges were as follows (in thousands):
| Year Ended December 31, | ||||||||||||
| 2014 | 2013 | 2012 | ||||||||||
| Termination and severance related |
$ | 683 | $ | — | $ | — | ||||||
| Lease abandonment and termination |
553 | 227 | — | |||||||||
|
|
|
|
|
|
|
|||||||
| $ | 1,236 | $ | 227 | $ | — | |||||||
|
|
|
|
|
|
|
|||||||
Restructuring costs were included in our Consolidated Statements of Operations as follows (in thousands):
| Year Ended December 31, | ||||||||||||
| 2014 | 2013 | 2012 | ||||||||||
| Cost of sales |
$ | 154 | $ | — | $ | — | ||||||
| Selling, general and administrative |
1,082 | 227 | — | |||||||||
|
|
|
|
|
|
|
|||||||
| $ | 1,236 | $ | 227 | $ | — | |||||||
|
|
|
|
|
|
|
|||||||
The following tables summarize the charges, expenditures and write-offs and adjustments related to our restructuring accruals (in thousands):
| Year Ended December 31, 2014 |
Beginning Accrued Liability |
Charged to Expense, Net |
Expend- itures |
Write-Offs and Adjust- ments |
Ending Accrued Liability |
|||||||||||||||
| Termination and severance related |
$ | — | $ | 683 | $ | (375 | ) | $ | — | $ | 308 | |||||||||
| Lease abandonment |
2,129 | 553 | (1,031 | ) | — | 1,651 | ||||||||||||||
|
|
|
|
|
|
|
|
|
|
|
|||||||||||
| $ | 2,129 | $ | 1,236 | $ | (1,406 | ) | $ | — | $ | 1,959 | ||||||||||
|
|
|
|
|
|
|
|
|
|
|
|||||||||||
| Year Ended December 31, 2013 |
Beginning Accrued Liability |
Charged to Expense, Net |
Expend- itures |
Write-Offs and Adjust- ments |
Ending Accrued Liability |
|||||||||||||||
| Lease abandonment |
$ | 3,034 | $ | 227 | $ | (1,132 | ) | $ | — | $ | 2,129 | |||||||||
|
|
|
|
|
|
|
|
|
|
|
|||||||||||
| Year Ended December 31, 2012 |
Beginning Accrued Liability |
Charged to Expense, Net |
Expend- itures |
Write-Offs and Adjust- ments |
Ending Accrued Liability |
|||||||||||||||
| Termination and severance related |
$ | 10 | $ | — | $ | (10 | ) | $ | — | $ | — | |||||||||
| Lease abandonment |
4,137 | — | (1,103 | ) | — | 3,034 | ||||||||||||||
|
|
|
|
|
|
|
|
|
|
|
|||||||||||
| $ | 4,147 | $ | — | $ | (1,113 | ) | $ | — | $ | 3,034 | ||||||||||
|
|
|
|
|
|
|
|
|
|
|
|||||||||||
We expect all accrued restructuring costs will be paid by the end of 2015.
F-27
Table of Contents
NOTE 18. SEGMENT REPORTING AND ENTERPRISE-WIDE DISCLOSURES
The segment data below is presented in the same manner that management currently organizes the segments for assessing certain performance trends. Our Chief Operating Decision Maker monitors the revenue streams and the operating income of our Systems segment and our Probes segment. We do not track our assets on a segment level, and, accordingly, that information is not provided.
Revenue and operating income information by segment was as follows (dollars in thousands):
| Year Ended December 31, 2014 |
Systems | Probes | Corporate Unallocated |
Total | ||||||||||||
| Revenue |
$ | 82,850 | $ | 53,172 | $ | — | $ | 136,022 | ||||||||
| Gross profit |
$ | 37,775 | $ | 32,539 | $ | — | $ | 70,314 | ||||||||
| Gross margin |
45.6 | % | 61.2 | % | — | 51.7 | % | |||||||||
| Income (loss) from operations |
$ | 7,553 | $ | 20,768 | $ | (15,037 | ) | $ | 13,284 | |||||||
| Year Ended December 31, 2013 |
||||||||||||||||
| Revenue |
$ | 79,229 | $ | 40,781 | $ | — | $ | 120,010 | ||||||||
| Gross profit |
$ | 33,177 | $ | 21,547 | $ | — | $ | 54,724 | ||||||||
| Gross margin |
41.9 | % | 52.8 | % | — | 45.6 | % | |||||||||
| Income (loss) from operations(1) |
$ | 9,794 | $ | 11,568 | $ | (14,029 | ) | $ | 7,333 | |||||||
| Year Ended December 31, 2012 |
||||||||||||||||
| Revenue |
$ | 74,368 | $ | 38,595 | $ | — | $ | 112,963 | ||||||||
| Gross profit |
$ | 29,391 | $ | 20,560 | $ | — | $ | 49,951 | ||||||||
| Gross margin |
39.5 | % | 53.3 | % | — | 44.2 | % | |||||||||
| Income (loss) from operations(1) |
$ | 9,651 | $ | 10,158 | $ | (12,252 | ) | $ | 7,557 | |||||||
| (1) | Amortization expense of $1.2 million and $0.7 million for the years ended December 31, 2013 and 2012, respectively, was reclassified from Corporate Unallocated to Systems to conform with the current year presentation. |
No customer accounted for 10% or more of our total revenue in 2014, 2013 or 2012.
Our revenues by geographic area were as follows (in thousands):
| Year Ended December 31, | ||||||||||||
| 2014 | 2013 | 2012 | ||||||||||
| United States |
$ | 39,855 | $ | 37,662 | $ | 33,445 | ||||||
| Asia Pacific |
63,660 | 50,748 | 51,290 | |||||||||
| Europe |
30,076 | 28,334 | 25,718 | |||||||||
| Other |
2,431 | 3,266 | 2,510 | |||||||||
|
|
|
|
|
|
|
|||||||
| $ | 136,022 | $ | 120,010 | $ | 112,963 | |||||||
|
|
|
|
|
|
|
|||||||
Long-lived assets, exclusive of deferred income taxes, by geographic area were as follows (in thousands):
| December 31, | ||||||||
| 2014 | 2013 | |||||||
| United States |
$ | 9,334 | $ | 8,660 | ||||
| Asia Pacific |
304 | 339 | ||||||
| Europe |
24,801 | 29,926 | ||||||
|
|
|
|
|
|||||
| $ | 34,439 | $ | 38,925 | |||||
|
|
|
|
|
|||||
F-28
Table of Contents
NOTE 19. STOCK REPURCHASE PLANS
In February 2012, our Board of Directors authorized a stock repurchase program under which up to $1.0 million of our common stock could be repurchased from time to time in the open market or in privately negotiated transactions during the period through June 30, 2012. As of June 30, 2012, a total of 214,087 shares had been repurchased at a weighted-average price of $4.67 per share, for a total purchase price of $1.0 million. The program was terminated by its terms on June 30, 2012.
In November 2012, our Board of Directors authorized a stock repurchase program under which up to $2.0 million of our common stock could be repurchased from time to time in the open market or in privately negotiated transactions. In May 2014, our Board of Directors authorized an increase to the stock repurchase program of an additional $2.0 million. Information regarding repurchases made pursuant to this program is as follows (dollars in thousands, except per share amounts):
| Period |
Number of Shares |
Weighted average per share purchase price |
Total purchase price |
Amount remaining for repurchase |
||||||||||||
| Fourth quarter of 2012 |
59,006 | $ | 5.60 | $ | 332 | $ | 1,668 | |||||||||
| First quarter of 2013 |
9,800 | 5.87 | 58 | 1,610 | ||||||||||||
| First quarter of 2014 |
88,445 | 9.24 | 817 | 793 | ||||||||||||
| Second quarter of 2014 |
22,811 | 9.45 | 216 | 2,577 | ||||||||||||
| Fourth quarter of 2014 |
3,900 | 9.47 | 37 | 2,540 | ||||||||||||
|
|
|
|
|
|||||||||||||
| 183,962 | 7.94 | 1,460 | 2,540 | |||||||||||||
|
|
|
|
|
|||||||||||||
F-29