Attached files
Table of Contents
UNITED STATES
SECURITIES AND EXCHANGE COMMISSION
WASHINGTON, D.C. 20549
FORM 10-K
| x | ANNUAL REPORT PURSUANT TO SECTION 13 OR 15(d) OF THE SECURITIES EXCHANGE ACT OF 1934 |
For the Fiscal Year Ended: December 31, 2009
OR
| ¨ | TRANSITION REPORT PURSUANT TO SECTION 13 OR 15(d) OF THE SECURITIES EXCHANGE ACT OF 1934 |
Commission File Number: 000-51072
CASCADE MICROTECH, INC.
(Exact name of registrant as specified in its charter)
| Oregon | 93-0856709 | |
| (State or other jurisdiction of incorporation or organization) |
(I.R.S. Employer Identification No.) |
| 2430 N.W. 206th Avenue Beaverton, Oregon |
97006 | |
| (Address of principal executive offices) | (Zip Code) |
Registrant’s telephone number, including area code: (503) 601-1000
Securities Registered pursuant to Section 12(b) of the Act:
| Title of each class |
Name of each exchange on which registered | |
| Common Stock, $0.01 par value | NASDAQ Global Market |
Securities registered pursuant to Section 12(g) of the Act: None
Indicate by check mark if the Registrant is a well-known seasoned issuer, as defined in Rule 405 of the Securities Act. Yes ¨ No x
Indicate by check mark if the Registrant is not required to file reports pursuant to Section 13 or Section 15(d) of the Act. Yes ¨ No x
Indicate by check mark whether the registrant (1) has filed all reports required to be filed by Section 13 or 15(d) of the Securities Exchange Act of 1934 during the preceding 12 months (or for such shorter period that the registrant was required to file such reports), and (2) has been subject to such filing requirements for the past 90 days: Yes x No ¨
Indicate by check mark whether the registrant has submitted electronically and posted on its corporate Web site, if any, every Interactive Data File required to be submitted and posted pursuant to Rule 405 of Regulation S-T (§ 232.405 of this chapter) during the preceding 12 months (or for such shorter period that the registrant was required to submit and post such files). Yes ¨ No ¨
Indicate by check mark if disclosure of delinquent filers pursuant to Item 405 of Regulation S-K is not contained herein, and will not be contained, to the best of registrant’s knowledge, in definitive proxy or information statements incorporated by reference in Part III of this Form 10-K, or any amendment to this Form 10-K. ¨
Indicate by check mark whether the registrant is a large accelerated filer, an accelerated filer, a non-accelerated filer or a smaller reporting company. See definition of “accelerated filer,” “large accelerated filer” and “smaller reporting company” in Rule 12b-2 of the Exchange Act.
| Large accelerated filer | ¨ | Accelerated filer | ¨ | |||
| Non-accelerated filer | ¨ (Do not check if a smaller reporting company) | Smaller reporting company | x | |||
Indicate by check mark whether the registrant is a shell company (as defined in Rule 12b-2 of the Act). Yes ¨ No x
The aggregate market value of the voting and non-voting common equity held by non-affiliates of the registrant was $34,990,269, computed by reference to the last sales price ($3.65) as reported by the NASDAQ National Market System, as of the last business day of the Registrant’s most recently completed second fiscal quarter (June 30, 2009).
The number of shares outstanding of the registrant’s common stock as of March 1, 2010 was 14,238,022 shares.
Documents Incorporated by Reference
Portions of the registrant’s definitive Proxy Statement for the 2010 Annual Shareholders’ Meeting are incorporated by reference into Part III.
Table of Contents
2009 FORM 10-K ANNUAL REPORT
TABLE OF CONTENTS
1
Table of Contents
| ITEM 1. | BUSINESS |
Company Profile
We design, develop, manufacture and market advanced wafer probing and test socket solutions for the electrical measurement and testing of high performance chips. We design, manufacture and assemble our products in Oregon, Minnesota and Dresden, Germany (after our recent acquisition), with global sales, service and support centers in North America, Germany, Japan, Taiwan, China and Singapore.
Engineering probe stations provide precise and accurate measurement of semiconductor electrical characteristics during chip design or when optimizing the chip fabrication process. Our engineering probe stations are highly configurable and are typically sold with various accessories, including our analytical probes, as well as accessories from third parties. In addition, we design and build custom engineering probe stations to address the specific requirements of our customers and generate revenue through the sales of service contracts.
Our analytical probes are sold to serve as components of our engineering probe stations, or less often, to serve as components of test equipment manufactured by third parties. Our production probe cards are designed and sold for production test applications, ranging from very low current parametric testing to sophisticated, high speed radio frequency testing. Our test sockets are designed and sold for both production and engineering test applications, typically for high speed digital and radio frequency testing.
In January 2010, we acquired Suss MicroTec Test Systems GmbH (“Suss Test”), a wholly owned subsidiary of Suss MicroTec AG., based near Dresden, Germany. The acquisition of Suss Test, a long-time competitor in the market for engineering probe stations, provides us with an expanded portfolio of products as well as the engineering and technical resources to help to address complex emerging technologies.
Industry Background
During the last decade, growth in the computer, telecommunications, consumer and industrial electronics markets has increased demand for chips. However, the worldwide economic downturn that began in 2008 continued to have a negative affect on semiconductor sales in 2009. Despite the recession, the Semiconductor Industry Association (“SIA”) reports that 2009 worldwide semiconductor sales surpassed expectations. According to the SIA, total semiconductor sales for 2009 were $226.3 billion compared to $248.6 billion in 2008, a decline of 9%, significantly better than the predicted decline of 24%, showing healthy increases in November and December of 2009 compared to the same months of 2008. The SIA expects that 2010 total semiconductor sales will be higher than 2009.
To reduce the cost and increase the performance of electronic products, semiconductor chips have become smaller and faster and incorporate greater levels of functionality at a lower price. Advancements in manufacturing technologies, such as smaller chip elements, new materials and larger wafer sizes have permitted manufacturers to meet these requirements. However, these advancements in chip manufacturing technologies have led to increasing challenges in the design, manufacturing and testing of chips.
Chips are measured and tested multiple times throughout the design and manufacturing process to ensure the integrity of the chip design and the quality of the manufacturing process. Our products test chips during design, where precision and accuracy are required, and during production, where rapid testing at high volumes requires reliability and repeatability. Our strong presence in engineering test segments gives us high visibility of new chip processes and applications, thus aiding our planning and development of production tools.
2
Table of Contents
We sell our solutions to most segments of the semiconductor industry, including manufacturers of wireless, communications, microprocessors and other logic and memory chips. A substantial portion of our revenue is generated from sales of our engineering probe stations and analytical probes to research and development laboratories of semiconductor manufacturers as well as to fabless semiconductor companies and academic institutions. As a result, we sell to a geographically diversified customer base, with more than 60% typically generated from customers outside of North America, primarily in Japan, Taiwan, and other Asian countries and, to a lesser extent, Europe.
Sales of our engineering probe stations and our overall operating results depend, in significant part, on the level of capital expenditures related to semiconductor research and development, which in turn depends upon current and anticipated market demand for chips. While our financial results are impacted by cycles within the semiconductor industry, we believe our business cycles are typically less pronounced than those of other semiconductor equipment companies. We believe this is due to our greater reliance on our customers’ research and development capital spending and usage of test consumables rather than on our customers’ spending purely to increase production capacity.
Products
We design, manufacture and sell multiple product lines, including engineering probe stations, analytical probes, production probe cards, test sockets and various services. An engineering probe station is used in conjunction with our analytical probes to test chips in wafer form, together forming an engineering probing system. Analytical probes, production probe cards and test sockets electrically connect test equipment to the chips under test and are sold as consumable test tooling, which are mounted into production or engineering probe stations.
Engineering probing systems are required in the development of new generations of chip processes and designs, and we expect that the demand for engineering probing systems will continue to grow with the increasing complexity of new chip processes and designs. The process development complexities and costs have continually increased as each generation of semiconductor process has required the integration of more layers of smaller chip elements incorporating a longer list of new materials. Engineering probing systems are a basic tool for characterizing and verifying the electrical performance, reliability and repeatability of the new chip elements.
We believe that we have significant market share by revenue in engineering probing tools worldwide. We typically offer the widest product options and the highest electrical measurement performance for most engineering test requirements.
Engineering Probe Stations. We offer engineering probe stations for 300mm, 200mm and 150mm or smaller wafer sizes. Engineering probe stations are highly configurable depending upon the size and type of wafer, the particular characteristics of the chip that the customer is testing, the required measurements, the temperatures at which the chip is tested and the test equipment that the customer is using. Our engineering probe stations are available in either manual or semiautomatic versions. We also offer many probe station accessories, including thermal control systems, microscopes, lasers, cameras, special cables and connectors and other items.
In April 2009, our EDGE Flicker Noise Measurement System won Test & Measurement World’s “Best in Test” award. EDGE is the only flicker noise measurement system certified to provide accurate measurements from 1Hz to 30 MHz. Integration of the wafer probe station, instruments and accessories is serviced and supported by site surveys and pre- and post-measurement optimization.
In June 2009, we expanded the capabilities of our Tesla on-wafer power device characterization system, making it fully compatible with Agilent’s B1505 power analyzer and creating a solution for over temperature, low-contact resistance measurements of power devices up to 60 Amperes and 3000 Volts.
Our acquisition of Suss Test expands our portfolio of engineering probing products as well as provides more engineering and technical resources to develop and support complex emerging chip requirements. Suss Test products expand our products for testing chips for communications and computing, and expands our coverage of other chip testing, such as chips for high-brightness light-emitting diodes, or LEDs, micro-electromechanical systems, or MEMS, cryogenic temperatures and other chip types.
3
Table of Contents
Analytical Probes. We offer over 50 different analytical probe models for engineering and production testing. Our Infinity series probes are designed with unique probe tips derived from our proprietary lithographic manufacturing technology, enabling superior electrical contacts on aluminum and copper pads. While our analytical probes are used primarily for engineering test, several of our analytical probes are also used in production testing of some high-frequency devices. We continue to add new models of analytical probes that address measurements with higher complexities and at higher frequencies, most recently to 500 Ghz.
In June 2009, we announced our first complete engineering and production probing solution for 60-80 GHz RFIC manufacturing. With 25 contacts per quadrant, the durable multi-contact Unity-MW probe provides the capability to conveniently connect up to four 110 GHz RF signals per quadrant for the most comprehensive and consistent testing of phased arrays. Utilizing the production-proven Pyramid Probe® photo-lithographically defined tip technology, Pyramid-MW is the industry’s only dedicated 81 GHz probe card delivering repeatable, reliable measurements that ensure high-yield known good die (KGD) can be shipped. Our acquisition of Suss Test expands our offerings of analytical probes to include radio frequency (“RF”) probes for higher and lower temperatures and for higher powers.
Production Probe Cards. A production probe card temporarily connects one or more chips on a wafer under test to a production tester. Probe cards are customized for each new chip type and physically wear out during usage in production testing. Depending upon the test environment, production probe cards may last for several hundred thousand to roughly 1 to 2 million contact cycles. Production card sales are driven by production unit volumes and the various stages of the integrated circuits (“ICs”) being tested.
Our Pyramid Probe Card product line offers high electrical speed performance and is commonly used in wireless chip applications. Factors driving wireless and RF chip probing include the growth of wireless system applications, the trend to more thoroughly test these chips at the wafer level before assembling them into more expensive modules, and the trend to test more chips in parallel with one probe card, thus more efficiently employing the tester and autoprober equipment around the probe card.
Test Sockets. A test socket temporarily connects a packaged chip to a tester much like a probe card connects one or more chips on a wafer to a tester. Like probe cards, test sockets are production test consumables and have a finite lifetime. Test sockets are usually customized for each chip type tested. Our test socket product line also excels at high-speed chip applications.
During 2009, we expanded the Grypper line of device-footprint test sockets with the G40 Grypper and G80 Grypper. The new G40 Grypper test socket delivers robust, cost effective solutions for the most demanding engineering development, failure analysis and QA applications. Exclusive test socket technology accelerates engineering development and failure analysis/QA for ball grid array (“BGA”) devices in the application-specific integrated circuit (“ASIC”), field programmable grid array (“FPGA”) and embedded markets.
Services. In addition to routine installation services at the time of sale, we offer services to enable our customers to maintain and more effectively utilize our equipment and to enhance our customer relationships.
Customers and Geographic Information
Our products are used by semiconductor manufacturers, test subcontractors, research organizations and designers. Fabless semiconductor suppliers do not manufacture their own semiconductors but they purchase our analytical probes and engineering probe stations for research and development and purchase, or direct their foundries to purchase, our Pyramid Probe cards to test chips
4
Table of Contents
manufactured for them. We have built strong relationships with our customers through frequent interactions over the past 25 years. To foster stronger customer relationships, we conduct analyses for the needs of our customers’ new labs or products, host seminars on topics such as measurement techniques and make proactive service calls. This close interaction has helped us build a consistently loyal customer base. More than 800 customers purchased our products in 2009. Our top end-user customers during 2009 included (in alphabetical order): Avago Technologies, Canon, Cree, Epcos AG, Fujitsu, Global Foundries, Hitachi, IBM, Inari Technology, Infineon, Intel Corporation, King Abdullah University of Science and Technology, Peregrine Semiconductor, Qualcomm, RF Micro Devices, Sony, ST Microelectronics, Taiwan Semiconductor Manufacturing Company and Tokyo University.
We believe our customers consider timely customer service and support to be an important aspect of our relationship. Our engineering probe stations are installed at customer sites either by us, our manufacturers’ representatives or our distributors, depending on the complexity of the installation and the customer’s geographic location. We assist our customers in the selection, integration and use of our products through engineering support. We also provide worldwide on-site training, seminars and telephone support. Our manufacturers’ representatives and distributors provide additional service and support.
In 2009, 2008 and 2007, no single customer accounted for 10% or more of our total revenues. Our top 10 customers accounted for approximately 25%, 27% and 31% of our total revenue in each of 2009, 2008 and 2007, respectively.
International sales accounted for more than 63% of our total revenue in each of 2009, 2008 and 2007. The following table indicates which regions had revenues that totaled 10% or more of our total revenues in 2009, 2008 and 2007 (in thousands):
| Year Ended December 31, |
2009 | 2008 | 2007 | ||||||
| United States |
31.0 | % | 34.1 | % | 36.7 | % | |||
| Asia Pacific |
48.7 | % | 47.6 | % | 42.5 | % | |||
| Europe |
17.0 | % | 15.9 | % | 18.6 | % |
Long-lived assets, exclusive of long-term investments and deferred income taxes, by geographic area were as follows (in thousands):
| December 31, |
2009 | 2008 | ||||
| United States |
$ | 14,491 | $ | 16,712 | ||
| Asia Pacific |
949 | 674 | ||||
| Europe |
814 | 1,074 | ||||
| $ | 16,254 | $ | 18,460 | |||
Segments
The segment data below is presented in the same manner that management currently organizes the segments for assessing certain performance trends. Our Chief Operating Decision Maker (“CODM”) monitors the revenue streams and the gross profit of our Systems sales and our Probes and Sockets sales. Our CODM is a function carried out by our executive management team and approved by our board of directors. We do not track our operating expenses or assets on a segment level, and, accordingly, that information is not provided.
5
Table of Contents
Revenue and gross profit information by segment was as follows (dollars in thousands):
| Systems | Probes and Sockets |
Total | ||||||||||
| Year Ended December 31, 2009 |
||||||||||||
| Revenue |
$ | 28,951 | $ | 24,590 | $ | 53,541 | ||||||
| Gross Profit |
$ | 9,190 | $ | 10,511 | $ | 19,701 | ||||||
| Gross Margin |
31.7 | % | 42.7 | % | 36.8 | % | ||||||
| Year Ended December 31, 2008 |
||||||||||||
| Revenue |
$ | 40,870 | $ | 35,691 | $ | 76,561 | ||||||
| Gross Profit |
$ | 13,697 | $ | 18,387 | $ | 32,084 | ||||||
| Gross Margin |
33.5 | % | 51.5 | % | 41.9 | % | ||||||
| Year Ended December 31, 2007 |
||||||||||||
| Revenue |
$ | 56,349 | $ | 33,573 | $ | 89,922 | ||||||
| Gross Profit |
$ | 23,382 | $ | 17,739 | $ | 41,121 | ||||||
| Gross Margin |
41.5 | % | 52.8 | % | 45.7 | % | ||||||
Technology
We are a leading innovator in developing electrical measurement and production test tools. One of our stated growth strategies is to continue to develop next-generation technologies. We have focused our research and development efforts on enabling our customers to take more precise electrical measurements in less time, on smaller and more dense devices, and with more robustness. Our core technologies include:
| • | Broadband/High-Frequency/High Speed Interconnects and Probing. In 1983, our founders created the first microwave analytical probes that enabled the first on-wafer 18 GHz measurements and accelerated the commercialization of gallium arsenide chips. We use and maintain a wide variety of design, verification, fabrication and calibration technologies for high-frequency probes and interconnections. For example, we have developed a complete library of high-frequency circuit elements for our Pyramid Probe layouts, similar to passive element libraries for chip foundries. We believe that these technologies provide a competitive advantage by allowing us more effectively to design and commercialize production probe cards, test sockets and analytical probes. |
| • | Precise Low-Level Measurements. In 1993, we were first to commercialize a shielded probe station utilizing our patented MicroChamber technology that increased thermal measurement productivity by 10 times and current measurement resolutions by 1,000 times. Many of our engineering probe stations feature MicroChambers, which ensure a dark, electrically noise-free measurement environment to enable low-current measurements over a wide thermal range. Our engineering probe stations also incorporate our proprietary low-noise thermal chuck technologies that increase measurement integrity and reduce the time required to take precise measurements. These features, in turn, increase the number of chips that can be tested or measured in a given amount of time. In early 2008, we introduced our Elite 300 probe station, which implements our latest probe station technologies for improved low-current and low-voltage measurements. |
| • | Microfabrication. Since 1990, we have shipped products that utilize our proprietary lithographic manufacturing processes for depositing, lithographic patterning, etching and plating probe structures on flexible substrates that are similar to the processes used in making chips. Our proprietary Pyramid technology has been under development since 1992 and continues to evolve and improve. In early 2008, we introduced two parametric probe cards that we build on our new Pyramid Plus manufacturing process. At the center of a Pyramid Probe card, tester connections converge on the chips under test through our unique, lithographically defined microscopic probe tips and electrical interconnection wiring. Our processing continues to mature and evolve, enabling faster delivery times, larger probe areas, smaller tip dimensions and interconnects, and wider test temperature ranges. As chip elements continue to shrink, we expect to be able to scale and evolve our lithographic processes to continue to meet our customers’ requirements. Our socket products utilize unique stamping, laminating, drilling and robotic assembly processes to achieve high electrical performance and low costs. |
6
Table of Contents
Sales, Marketing and Service
We sell our engineering probe stations, analytical probes, production probe cards and test sockets through a combination of manufacturers’ representatives, distributors and direct sales people. Manufacturers’ representatives are independent third parties that agree to sell our products at our prices and on terms set by us, in return for a commission based on sales. We typically use manufacturers’ representatives in areas that we believe require greater levels of customer support than we can deliver from our own sales offices. Distributors purchase our products and resell them at prices and upon terms set by the particular distributor. We typically use distributors where local regulations or business customs require local stocking of service parts, more immediate service support or other local services. Finally, our direct sales force is made up of our salaried and commissioned employees.
In North America and Asia, excluding Japan, Singapore, China and Taiwan, we sell our products through manufacturers’ representatives and distributors. In Japan, we sell through Cascade Microtech Japan, K.K., our direct sales and service subsidiary. In Singapore, we sell through our branch office, Cascade Microtech Singapore. During 2006, we established direct sales offices in China and Taiwan. In most of Europe, we primarily sell our Systems products through distributors and manufacturers’ representatives and sell our Probes and Sockets products directly. We also sell our products directly in Germany, Austria and Switzerland through our German subsidiaries. In other countries, we typically sell through manufacturers’ representatives or distributors. Our sales managers oversee and manage these worldwide sales activities.
We work closely with our customers to select the most appropriate product or to configure a custom solution which best fits their applications. Sales of our engineering test solutions require significant interaction with our customers’ engineering labs and knowledge of their product development schedules and systems, as well as on-site demonstration capability. We also may assist our customers in the design requirements for their products to enhance testability. Sales of our production test solutions require significant interaction with customer production test managers, knowledge of their specific product details and hands-on support, particularly for new customers. Our production customers generally undertake an extensive evaluation of new probe technology before adoption. Our sales managers are experienced sales professionals with in-depth technical training, customer knowledge and industry expertise. The technical sophistication of our products requires substantial training for our manufacturers’ representatives, distributors and sales staff. We devote considerable effort and resources to developing a highly trained sales force that is responsive to our customers’ changing needs.
We focus our marketing efforts on building awareness of our products among designers and manufacturers of complex semiconductors and understanding their current and future needs. We market our products and capabilities by participating in trade shows, providing product and technical information in print and on our website, hosting technical and product seminars, advertising in trade publications and using direct mailings. In addition, our marketing staff performs market research and product planning. We also participate in joint sales and marketing activities with complementary equipment and software vendors to offer our customers complete test solutions. These relationships benefit us because they can lead to broader awareness and increased sales of our products.
Our products are sold generally with a 12-month warranty. Customers may purchase an extended warranty of 1-5 years at the time a probe station is purchased. The extended warranty starts when the 12-month warranty ends. We also offer service contracts for our products of one year or more in duration which can be purchased at any time after expiration of any warranty. We employ service engineers in each of the four regions (Americas, PacRim, Japan, Europe) in which we have sales and service divisions. We also contract with independent service representatives for product service in some foreign countries.
7
Table of Contents
Research and Development
Our industry is subject to rapid technological change and new product introductions and improvements. Our continued investment in research and development and timely introduction of new products and services is critical to maintaining and improving our competitive position. Our growth depends upon our ability to rapidly develop new products that enable customers to improve their electrical, optical and mechanical measurements and increase their productivity. As a result, we expect to continue to devote substantial resources to research and development. Our research and development expense was $8.4 million in 2009, $10.5 million in 2008 and $11.2 million in 2007. We are currently devoting substantial resources to projects such as releasing new probe and test socket products, developing new probe and test socket manufacturing processes, developing faster, higher-accuracy analytical probes and enhancing the functionality of our engineering probe stations. At December 31, 2009, we employed 43 research and development engineers. We conduct research and development for all of our product lines at our facilities in Beaverton, Oregon and Brooklyn Park, Minnesota.
Manufacturing and Assembly
Our manufacturing and assembly operations consist of the production of highly complex and sophisticated components and assemblies, some of which are customized to meet customers’ needs and specifications. We perform nearly all of our manufacturing and assembly in Beaverton, Oregon at our manufacturing facility within our headquarters building and at our Pyramid Probe microfabrication and assembly facility. We also have a manufacturing facility in Brooklyn Park, Minnesota, where we make our test sockets. We outsource the manufacturing and assembly of some products and components to the extent they can be purchased at a cost that is lower than the cost to produce internally, and still meet the expectations and requirements of our customers. We depend on limited source suppliers for some materials, components and subassemblies used in our products.
Our product design and manufacturing process activities emphasize accurate electrical measurements, precise and reliable mechanical components and assemblies and compliance with industry and governmental safety requirements. We prototype and test our new standard product designs and components to ensure high electrical signal integrity, mechanical accuracy and safety. In our manufacturing operations, we perform electrical, mechanical and chemical tests and use statistical process control methods, internally developed manufacturing information systems and inspections of purchased components and products to monitor our product quality throughout the various stages of our manufacturing process.
Competition
The markets for engineering probe stations, analytical probes and production probe cards are highly competitive. We anticipate that the markets for our products will continually evolve and be subject to rapid technological change.
Engineering Probe Stations. Our primary competitor in the engineering probe station market was Suss MicroTec AG until the recent acquisition of their test division (Suss Test) in January 2010. However, we also compete with Vector Semiconductor Co. Ltd., Lucas/Signatone Corporation, The Micromanipulator Company Inc. and Wentworth Laboratories Inc., among others. We believe that the primary competitive factors in the engineering probe station market are measurement accuracy and versatility, measurement speed, automation features, completeness of the measurement solutions, delivery time and price. We generally compete favorably with respect to these factors.
Analytical Probes. Our primary competitor in the analytical probe market is GGB Industries Inc. We believe that the primary competitive factors in this market are breadth of probe types, probe frequency and electrical signal integrity, contact integrity and the related cleaning required, calibration support, delivery time and price. We generally compete favorably with respect to these factors.
8
Table of Contents
Production Probe Cards. Competition in the non-memory production probe card market is fragmented and characterized by many suppliers offering products based on differing technologies. Our Pyramid Probe cards compete with product offerings of other probe card vendors including Feinmetall GmbH, FormFactor Inc., GGB Industries Inc., Japan Electronic Materials Corporation, Micronics Japan Company, Ltd., MicroProbe Inc., Micro Square Technology Inc., PHICOM Corporation, SV Probe Inc., Technoprobe S.r.l., Tokyo Cathode Laboratory Company Ltd., Wentworth Laboratories Inc. and others. At least four probe card vendors, FormFactor Inc., Japan Electronic Materials Corporation, Micronics Japan Company, Ltd. and PHICOM Corporation, are also offering probe cards built using types of lithographic patterning. The high capital investment and other costs associated with the development of lithographically defined probe cards and the time and high cost of customer evaluation, represent a significant barrier to entry for this type of technology. We believe that the primary competitive factors in the production probe market depend upon the type of chip being tested, but include customer service, delivery time, price, probe card lifetime, chip damage, probe tip touch-down accuracy, speed and frequency of the probe card, number of chips contacted in parallel, number of probe tips and their layout, signal integrity, and frequency and effectiveness of cleaning required. We believe that we compete favorably in probe cards for high frequencies and high-speed signals, and in probe cards for parallel testing of chips with densely-packed bond pads. We generally do not compete in applications that require very large probe areas, such as memory test.
Test Sockets. Our competition in test sockets is fragmented among several companies. Depending upon the application, we compete with Everett Charles Technologies, Ironwood Electronics, Johnstech International, Loranger International Corporation, Micronics Japan Company, Ltd., Plastronics and Interconnect Devices, Inc. We believe that the primary competitive factors include customer service, delivery time, price, socket lifetime, contact resistance stability, speed and frequency range of the socket, number and density of socket contacts, signal integrity and frequency and effectiveness of cleaning required. We believe that we compete favorably in test sockets for high frequencies and high-speed signals, and in test sockets for certain engineering applications. We generally do not compete in applications that require very low costs such as memory burn-in sockets.
Intellectual Property
Our success in large part depends on our proprietary technology. We do not depend on any one individual patent, instead relying on intellectual property, including patents and trade secrets, covering electrical measurement reliability and integrity, electrical shielding and the Pyramid Probe contact structure and production process. As of December 31, 2009, we had 166 issued patents and 30 pending patent applications in the U.S. and 51 issued foreign patents and 41 pending foreign patent applications. In addition, we regard certain of our processes, information and know-how that we have developed and used to design and manufacture our products as proprietary trade secrets.
One important group of our patents claims technology relating to electrical shielding and other inventions required to measure extremely small signals on wafers. Most of these U.S. patents will expire between 2012 and 2015. Another important group of our patents claims designs and construction methods for probe tips on Pyramid Probes. These patents will expire beginning in 2016.
Our policy is to seek patents where appropriate on inventions involving new products and improvements to existing products as part of our ongoing engineering and research and development activities. We cannot assure you that any of our pending patent applications will be approved, that we will develop additional proprietary technology that is patentable, that any patents owned by or issued to us will provide us with competitive advantages or that these patents will not be challenged by third parties. Furthermore, there can be no assurance that third parties will not design around our patents.
We also use certain patented technology of third parties in the manufacture of our products pursuant to license agreements. Pursuant to an agreement with Micronics Japan Company Ltd. and Hewlett-Packard Japan Ltd. (now Agilent Technologies), our subsidiary, Cascade Microtech Japan, Inc. and its affiliates, have been granted a non-exclusive worldwide license to make, have made, use, lease, sell or otherwise transfer certain products that make use of patented technology relating to electric circuit measurement equipment. In exchange for the rights granted under the license, we pay royalties to Micronics Japan Company Ltd. and Agilent Technologies based on the number of products sold or leased. These royalties were insignificant in 2009. Our license will expire upon the expiration of the patent covering the licensed technology, which will occur in June 2013.
9
Table of Contents
Seasonality
Typically, our revenue is lower in our fiscal first quarter than in our fiscal fourth quarter preceding it. In addition, as is typical in our industry, we recognize a large percentage of our quarterly revenue in the last month of the quarter. However, our seasonality can be affected by general economic trends and it should not be expected that historical revenue patterns will continue.
Employees
As of December 31, 2009, we had a total of 306 employees. Of these employees, 251 were located in North America, 13 were in located in Europe, 15 were located in Japan, 9 were located in Taiwan, and 18 were located in other Asian counties. Many of our employees are highly skilled and our future performance depends largely on our ability to continue to attract, train and retain qualified technical, sales, service, marketing and managerial personnel. None of our employees is subject to a collective bargaining agreement. We have not experienced any work stoppages and consider our relations with our employees to be good.
Environmental Matters
As part of our manufacturing operations, we have handled and continue to handle materials that are considered hazardous or toxic under federal, state and local laws and regulations, and we are subject to environmental laws and regulations related to the sale, use, storage, discharge, disposal and human exposure to such materials. We believe we are in material compliance with the environmental laws and regulations applicable to the conduct of our business and operations. However, there can be no assurance that violations of environmental laws or regulations will not occur in the future as a result of human error, equipment failure or other causes. The risk of a release of hazardous or toxic materials cannot be completely eliminated, and if such a release occurs, we could be held financially responsible for the cleanup or other consequences of the release. We are not aware of any releases at any of our facilities that could reasonably be expected to result in any material liabilities to us.
We are subject to potentially conflicting and changing regulatory agendas of political, business and environmental groups and governmental priorities concerning environmental laws and regulations. We may be required to incur substantial costs to comply with current or future environmental laws or regulations, and our operations, business or financial condition could be adversely affected by such requirements.
Backlog
Our backlog consists of purchase orders we have received for products and services with scheduled delivery dates that we expect to ship and deliver or perform in the future. At December 31, 2009, our backlog was $11.4 million compared with $11.9 million at December 31, 2008. We generally ship our products within two months of receipt of a customer’s purchase order. Accordingly, we expect to deliver nearly all of our December 31, 2009 backlog in 2010. Customers may cancel or delay delivery on previously placed orders, although our standard terms and conditions include penalties for cancellations made close to the scheduled delivery date. As a result, the timing of the receipt of orders or the shipment of products could have a significant impact on our backlog at any date. In addition, a significant portion of our revenue is generated from orders received and products shipped within a quarter. For this and other reasons, the amount of backlog at any date is not necessarily indicative of revenue in future periods.
Forward-Looking Statements
This Annual Report on Form 10-K and the documents incorporated herein by reference contain forward-looking statements within the meaning of the Private Securities Litigation Reform Act of 1995. All statements other than statements of historical fact made in this Annual Report on Form 10-K are forward-looking including, but not limited to, statements regarding industry prospects; future results of operations or financial position; our expectations and beliefs regarding future revenue growth; the future capabilities and functionality of our products and services, our strategies and intentions
10
Table of Contents
regarding acquisitions; the outcome of any litigation to which we are a party; our accounting and tax policies; our future strategies regarding investments, product offerings, research and development, market share, and strategic relationships and collaboration; our dividend policies; and our future capital requirements. These statements relate to future events or our future financial performance. In some cases, you can identify forward-looking statements by terminology, including “intend,” “could,” “may,” “will,” “should,” “expect,” “plan,” “anticipate,” “believe,” “estimate” “predict,” “potential,” “future,” or “continue,” the negative of these terms or other comparable terminology. These statements are only predictions. Actual events or results may differ materially from those expressed or implied in such forward-looking statements. In evaluating these statements, you should specifically consider various factors, including the risks identified in Item 1A below and from time to time in our other filings with the Securities and Exchange Commission. We do not intend to update any of the forward-looking statements after the date of this document to conform them to actual results or to changes in our expectations.
Where You Can Find More Information
We file annual, quarterly and current reports, proxy statements and other information with the Securities and Exchange Commission (“SEC”) under the Securities Exchange Act of 1934 as amended (the “Exchange Act”). You can inspect and copy our reports, proxy statements, and other information filed with the SEC at the SEC’s Public Reference Room at 100 F Street, NE, Washington, D.C. 20549. Please call the SEC at 1-800-SEC-0330 for further information on the Public Reference Room. The SEC maintains an Internet Web site at http://www.sec.gov where you can obtain some of our SEC filings. In addition, you can inspect our reports, proxy materials and other information at the offices of the NASDAQ Stock Market at 1735 K Street NW, Washington D.C. 20006. We also make available free of charge on our website at www.cascademicrotech.com our annual report on Form 10-K, quarterly reports on Form 10-Q, current reports on Form 8-K, and amendments to those reports filed or furnished pursuant to Section 13(a) or 15(d) of the Exchange Act as soon as reasonably practicable after they are filed electronically with the SEC. You can also obtain copies of these reports by contacting Investor Relations at 503-601-1000.
| ITEM 1A. | RISK FACTORS |
Our operating results have fluctuated in the past and are likely to fluctuate in the future, which could cause us to miss analyst expectations about these results and cause the trading price of our common stock to decline.
Our operating results have fluctuated in the past and are likely to continue to fluctuate. As a result, we believe that you should not rely on period-to-period comparisons of our financial results as an indication of our future performance. Factors that are likely to cause our revenue and operating results to fluctuate include:
| • | customer demand, which is influenced, in part, by conditions in the electronics and semiconductor industry, demand for products that use semiconductors and market acceptance of our products and those of our customers; |
| • | our geographic sales mix, product sales mix and average selling prices; |
| • | timing, cancellation or delay of customer orders; |
| • | seasonality, which has caused our first quarter revenue typically to decline compared to our fourth quarter revenue of the previous year; |
| • | fluctuations in foreign currency exchange rates; |
| • | competition, such as competitive pressures on the price, performance and reliability of our products, the introduction or announcement of new products by us or our competitors and our competitors’ intellectual property rights, which could prevent us from introducing products that compete effectively with their products; |
| • | our production capacity and availability and cost of materials, components and subassemblies; |
| • | our ability to deliver reliable products in a timely manner, including as a result of fluctuations in yield on some of our product lines; |
11
Table of Contents
| • | our customers’ decisions regarding the level and timing of research and development spending; |
| • | our product development costs, including research and development and sales and marketing expenses associated with new products or product enhancements and the costs of transitioning to new or enhanced products; and |
| • | economic conditions in the U.S. and the worldwide markets we serve. |
For example, a majority of our revenue in the last five years was derived from the research and development equipment spending of companies in the semiconductor industry or, to a much lesser extent, various research organizations, including universities, that conduct research that benefits the semiconductor industry. Our customers’ spending on research and development has been roughly proportional to the customers’ overall revenues. Historically, semiconductor industry revenues have been highly cyclical. According to industry data, the semiconductor industry has experienced four significant cyclical downturns since 1983. For example, our revenue increased approximately 37% from 1999 to 2000. In contrast our revenue decreased approximately 29% from 2001 to 2002 and 40% from 2007 to 2009 and increased approximately 27%, 14%, 15% and 6% from 2003 to 2004, 2004 to 2005, 2005 to 2006 and 2006 to 2007, respectively. Given this history, there is no reason to expect that our customers’ business and, therefore, their demand for our products, will be less cyclical in the future.
If our revenue or operating results fall below the expectations of analysts or investors, the market price of our common stock could decline substantially.
The cyclicality of the semiconductor industry affects our financial results, and, as a result, we may experience reduced sales or operating losses in a semiconductor industry downturn.
The semiconductor industry is highly cyclical with recurring periods of wide fluctuations in product supply and demand. From time to time, this industry has experienced significant downturns, often in connection with, or in anticipation of, periods of oversupply, maturing product and technology cycles, excess inventories and declines in general economic conditions. Our customers’ purchasing behavior in response to these cycles has been generally unpredictable. In the past, our operating results have been adversely affected by the cyclical downturns in the semiconductor industry.
Our business is heavily dependent on the level of research and development spending of our customers, the volume of semiconductor production by semiconductor manufacturers, the volume of production, particularly by wireless chip manufacturers, the development of new semiconductors and semiconductor designs and the overall financial strength of our customers, which, in turn, depend upon the current and anticipated market demand for semiconductors and the products incorporating them. Semiconductor manufacturers in particular are known to sharply curtail their capital expenditures when confronted with an industry downturn. Since we sell our engineering systems to virtually all chip segments, our revenue may be affected by any significant segment weakness. We may not achieve or maintain our current or prior levels of revenue growth. Any factor adversely affecting the semiconductor industry in general, or the particular segments, regions or major customers of the industry that our products target, will adversely affect our ability to generate revenue and could cause us to experience operating losses.
Some of our customers may experience sudden and unexpected changes in their financial condition, resulting in decreased sales and bad debts.
Global economic changes, or changes in the economic condition of a given region or country could lead to sudden and unexpected negative changes in the financial condition of our customers, including insolvency and bankruptcy. These changes could have a negative impact on our sales, make it more difficult to collect on receivables and result in bad debts.
12
Table of Contents
Consolidation of our customer base could adversely affect our revenues and results of operations.
Customers who have a weak market position could be purchased by other companies or simply dissolve. This may mean that an inordinate amount of leverage could be obtained by fewer customers to obtain price concessions thereby impacting margins negatively.
Because we generally do not have a sufficient backlog of unfilled orders to meet our quarterly revenue targets, revenue in any quarter is substantially dependent upon customer orders received and fulfilled in that quarter.
Our revenue is difficult to forecast because we generally do not have a sufficient backlog of unfilled orders for our engineering probe stations, analytical probes and production probe cards to meet our quarterly revenue targets at the beginning of a quarter. Historically, a significant portion of our revenue in any quarter depends upon customer orders that we receive and fulfill in that quarter. Furthermore, because our expense levels are based in part on our expectations as to future revenue and, to a large extent, are fixed in the short term, we might be unable to adjust spending in time to compensate for any unexpected shortfall in revenue. Accordingly, any significant shortfall in revenue in relation to our expectations and the expectations of analysts or investors could hurt our operating results and result in a decline in the price of our common stock.
As is the case with other companies in our industry, many of our customers defer purchasing decisions until late each quarter. As a result, we are significantly dependent upon the sale of our products in the third month of each quarter, and, if we do not generate enough revenue in the third month of each quarter to meet the earnings expectations of analysts or investors, the price of our common stock could decline.
As is the case with other companies in our industry, we have historically recognized a substantial portion of our revenue in the last month of each quarter because many of our customers defer purchasing decisions until late each quarter. Historically, we have often recognized more than 50% of our quarterly revenue in the third month of the quarter. We expect this trend to continue for the foreseeable future. As a result, our ability to meet the earnings expectations of analysts depends on our ability to not only generate customer orders in the third month of each quarter but also satisfy each of the various accounting requirements for recognizing the revenue generated by such sales prior to the end of the quarter. Moreover, our engineering probe stations typically range in price from $30,000 to $350,000 for a single unit, so a delay in the shipment of even one engineering probe station and the corresponding delay in recognition of revenue for the sale of probe stations, can have a very large impact on our quarterly results. If we are unable to generate a sufficient amount of sales during the last month of the quarter or if we are unable to recognize the revenue generated by sales made during this period, we could miss the earnings expectations of analysts or investors, which could cause the price of our common stock to decline.
We continue to devote significant effort and resources to the growth and development of our production probe cards and test sockets products, which has had, and could continue to have, an adverse effect on our operating margins.
Our future growth depends, in part, on continued market adoption of, and growing demand for, our production probe cards and test sockets. Large-scale market adoption of these products will depend on our ability to demonstrate the superior performance and cost effectiveness of these products to potential customers and on the continued growth of the market for high-speed or complex chips. Production customers are generally very risk-averse when adopting new technologies that could affect their production output, especially in the case of a sole source supplier. We have devoted significant resources to these products in the past few years. If our production probe cards and test sockets are not adopted in the market at a rate that is sufficient to offset the costs and resources that we devote to the development and promotion of these products, the future growth of our overall business and our operating margins would be adversely affected.
13
Table of Contents
If we do not keep pace with technological developments in the semiconductor industry, especially the trend toward faster, smaller and lower cost chips, our revenue and operating results could suffer as potential customers decide to adopt our competitors’ products.
We must continue to invest in research and development and certain manufacturing capabilities to improve our competitive position and to meet the testing needs of our customers. Our future growth depends, in significant part, on our ability to work effectively with and anticipate the testing needs of our customers and on our ability to develop and support new products and product enhancements to meet these needs on a timely and cost-effective basis. Our customers’ testing needs are becoming more challenging as the semiconductor industry continues to experience rapid technological change driven by the demand for complex chips that have smaller element sizes and at the same time are increasing in speed and functionality and becoming less expensive to produce. Our customers expect that they will be able to integrate our wafer probing products into their design and production processes as soon as they are deployed. Therefore, to meet these expectations and remain competitive, we must continually design, develop and introduce on a timely basis new products and product enhancements with improved features. Successful product development and introduction on a timely basis require that we:
| • | design innovative and performance-enhancing features that differentiate our products from those of our competitors; |
| • | identify emerging technological trends in our target markets, including new engineering and production test strategies; |
| • | respond effectively to technological changes or product announcements by others; and |
| • | adjust to changing market conditions quickly and cost-effectively. |
If we are unable to timely predict industry changes, or if we are unable to modify our products on a timely basis, we might lose customers or market share, and our operating results could suffer. We cannot assure you that we will successfully develop and bring new products to market in a timely and cost-effective manner, that any product enhancement or new product developed by us will gain market acceptance or that products or technologies developed by others will not render our products or technologies obsolete or uncompetitive.
For example, the 2001 to 2003 downturn in the semiconductor industry caused various chip manufacturers to readdress their respective strategies for converting existing 200mm wafer fabrication facilities to 300mm wafer fabrication or for building new 300mm wafer fabrication facilities. Some manufacturers, including some of our customers such as Texas Instruments, Motorola and ST Microelectronics, delayed, cancelled or postponed previously announced plans to convert to 300mm wafer fabrication. At the time, those delays impacted demand for our 300mm probe stations. Similarly, some large semiconductor suppliers may, in the future, shift to 450mm wafers. Past wafer-size transitions have been very costly, increasing the risk of delays. The timing of tool development by equipment suppliers has been very costly if it is too early or too late. If we fail to invest in new tool developments at the right time and including the right functionality or performance, our revenue and margins may be adversely affected.
We may make future acquisitions, which may be costly, difficult to integrate with our operations, divert management resources and dilute shareholder value.
As part of our business strategy, we may make acquisitions of, or investments in, companies, products or technologies that complement our current product offerings, enhance our technical capabilities, expand our operations into new markets or offer other growth opportunities. In January 2010, we acquired Suss Test. If we fail to successfully integrate Suss Test or any other acquired businesses, products or technologies, we would not achieve anticipated revenue and cost benefits. We may acquire companies, products or technologies in the future, which could pose risks to our operating results due to:
| • | difficulties assimilating the acquired operations, personnel, technologies or products into our company; |
14
Table of Contents
| • | diversion of management’s attention from our existing business; |
| • | adverse effects on relationships with our existing suppliers, customers or partners; and |
| • | the impairment of intangible assets or other long-lived assets acquired in the acquisition. |
Intense competition in the semiconductor wafer probing business may reduce demand for our products and reduce our sales.
The markets for our products are highly competitive, and we expect competition to continue in the future. We believe that our principal competitors are the major providers of probe stations, production probe cards and analytical probes. Our primary competitor in the probe station market was Suss MicroTec AG until the recent acquisition of Suss Test in January 2010, but we also compete with Vector Semiconductor Co. Ltd., Lucas/Signatone Corporation, The Micromanipulator Company Inc., and Wentworth Laboratories Inc., among others. Our Pyramid Probe cards compete with product offerings of other probe card vendors including Feinmetall GmbH, FormFactor Inc., GGB Industries Inc., Japan Electronic Materials Corporation, Mesatronics S.A., Micronics Japan Company, Ltd., MicroProbe, Inc., Micro Square Technology Inc., MJC Probe Inc., PHICOM Corporation, SV Probe, Technoprobe S.r.l., Tokyo Cathode Laboratory Company, Ltd., Wentworth Laboratories Inc. and others. At least five probe card vendors, FormFactor Inc., Japan Electronic Materials Corporation, Mesatronics S.A., Micronics Japan Company, Ltd., and PHICOM Corporation, are also offering probe cards built using types of lithographic patterning. Our primary competitor in the analytical probe market is GGB Industries. Our primary competitors in the test socket market are Interconnect Devices, Inc., Everett Charles Technologies, Ironwood Electronics, Johnstech International, Loranger International Corporation, Micronics Japan Company, Ltd., and Plastronics. These competitors or other potential competitors may have developed or may be developing technology of which we are unaware that may render our products uncompetitive. Some of our competitors have significantly greater financial, technical and marketing resources than we do. As a result, these competitors may be able to respond more quickly to new or emerging technologies and changes in customer requirements, to devote greater resources to the development, promotion and sale of their products or to deliver competitive products at lower prices. We cannot assure you that we will maintain our current competitive position or that our production probe cards will achieve widespread acceptance in the market. Finally, increased competition could result in pricing pressures, reduced sales, reduced margins or failure to achieve or maintain widespread market acceptance for our products, any of which could prevent us from growing our business. During 2010, some of these competitors may use a strategy of intense discounting to help maintain, or even increase, their revenue and customer base.
We obtain some of the materials, components and subassemblies used in our products from a single source or a limited group of suppliers. If these suppliers declare bankruptcy or are unable to provide us with these materials, components or subassemblies in adequate quantities and on a timely basis, we may be unable to manufacture our products or meet our customers’ needs.
We obtain some of the materials, components and subassemblies used in our products from a single source or a limited group of suppliers. Certain of our product purchases for 2009 were from sole source suppliers. Although we were not forced to delay shipment of any product due to delays in 2009 related to such suppliers, from time to time, we may experience difficulties in obtaining these materials, components and subassemblies from some suppliers. During 2010, one or more of our suppliers may declare bankruptcy or go out of business due to unusually weak business conditions, which could force us to source our products from different suppliers. The manufacture of some of the materials, components and subassemblies that we use in our products, such as thermal chucks and microscopes, is a complex process, and in the event that we cannot obtain an adequate supply of these components, it would be difficult and time-consuming to identify and qualify new suppliers. If some of the materials used in our lithographic probe manufacturing process become unavailable, it would be costly and time consuming to identify and qualify new suppliers. Moreover, many of these
15
Table of Contents
suppliers are small companies that may be more susceptible to downturns in general economic conditions and the rapid unplanned deterioration of sales, thereby increasing the risks of product and shipment delays, increased costs or loss of suppliers. Finally, we do not have written agreements with any of these suppliers to guarantee the supply of these products.
The delay in shipments from, or complete loss of, any one of these suppliers could prevent us from producing and shipping our products, resulting in delayed or lost orders for our products and damage to our customer relationships, which would harm our results of operations. Furthermore, a significant increase in the price of one or more of these materials, components or subassemblies could materially adversely affect our results of operations.
The deteriorating macroeconomic environment may cause some of our suppliers to discontinue the products we purchase, or suppliers may declare bankruptcy. If such suppliers are our single source, then we may need to delay our product shipments. If such suppliers were part of a limited group of suppliers, then we may experience price increases from the remaining suppliers.
We have long-lived assets, including fixed assets and intangible assets, recorded on our balance sheet. In the future, the fair value of certain long-lived assets may be reduced below their carrying value. If there has been an impairment of long-lived assets, we would be required to record non-cash asset impairment charges in future periods, which would adversely impact our results of operations.
In the fourth quarter of 2008, we recorded impairment charges of $27.7 million related to goodwill and certain intangible assets as the fair value of these assets was reduced below their carrying value. As of December 31, 2009, we had fixed assets, purchased intangible assets and patents of $15.7 million recorded on our balance sheets. We test our long-lived assets when an event occurs indicating the potential for impairment. If we record an impairment charge as a result of this analysis, it could have a material adverse impact on our results of operations.
We face economic, political and other risks associated with our international sales and operations, which could materially harm our operating results.
Since 2005 we have derived more than 60% of our annual revenue from sales outside the United States, primarily in Japan, other Asian countries and Europe. Geographic revenue for those regions that represented 10% or more of total sales in a given year was as follows (in thousands):
| Year Ended December 31, |
2009 | 2008 | 2007 | ||||||
| United States |
$ | 16,599 | $ | 26,079 | $ | 32,965 | |||
| Asia Pacific |
26,095 | 36,462 | 38,229 | ||||||
| Europe |
9,105 | 12,146 | 16,746 | ||||||
| Other |
1,742 | 1,874 | 1,982 | ||||||
| $ | 53,541 | $ | 76,561 | $ | 89,922 | ||||
We expect international sales to continue to represent a substantial portion of our revenue for the foreseeable future. In the past, the economic climate in some foreign markets, particularly in Asia, has quickly and dramatically changed, resulting in a negative effect on our operating results. For example, during the Asian economic crisis that began in 1998, we saw a 34% decline in revenue in 1998 compared to 1997 from Asia not including Japan. We saw a 41% decrease in revenue from the same region in 2003 compared to 2001.
Currently, we maintain 6 international offices in Europe and Asia, and we may establish new international offices in the future. If our gross margin from international operations does not exceed the expense of establishing and maintaining our international operations, our operating margins would be adversely affected. Additional risks we face in conducting business internationally include:
| • | difficulties and costs of staffing and managing international operations across different geographic areas; |
16
Table of Contents
| • | the possible lack of financial and political stability in foreign countries, preventing overseas sales growth; |
| • | changes in domestic or foreign law or policy resulting in the need to comply with potentially burdensome government controls, regulations, tariffs, embargoes or export license requirements; |
| • | longer payment cycles; |
| • | differing and more burdensome labor regulations and practices in Europe; |
| • | the aftermath of the war in Iraq or other armed conflicts in the Middle East; |
| • | the effects of sudden outbreaks of epidemics in Asia and other parts of the world; and |
| • | the effects of terrorist attacks in the U.S. and any related conflicts or similar events worldwide. |
The different cultures in countries where we do business often challenge us to meet or manage local expectations about how employees are hired, managed, compensated, or terminated. For example, most employees in Japan expect an organization wherein a manager’s direct reports are younger than the manager. In Europe, governments force the severance costs of a reduction in force action to be generally much higher than in the U.S.
Finally, there have been significant fluctuations in the exchange rates between the dollar and the currencies of countries in which we do business. While most of our international sales have been denominated in U.S. dollars, our international operating expenses have been denominated in foreign currencies. As a result, a decrease in the value of the U.S. dollar relative to the foreign currencies could increase the relative costs of our overseas operations, which could reduce our operating margins. Significant unfavorable fluctuations in the exchange rates between the U.S. dollar and foreign currencies could cause us to lower our prices and thus reduce our profitability. In addition, fluctuations in exchange rates could cause customers to delay or cancel orders because of the increased cost of our products relative to those of our competitors who manufacture in other countries. Other income (expense), net in 2009, 2008 and 2007 included the following currency related gains and losses (in thousands):
| Year Ended December 31, | ||||||||||||
| 2009 | 2008 | 2007 | ||||||||||
| Re-measurement related foreign currency gains (losses) |
$ | 198 | $ | 458 | $ | (254 | ) | |||||
| Gains (losses) on foreign currency forward contracts |
(140 | ) | (409 | ) | 238 | |||||||
We rely on independent manufacturers’ representatives and distributors for a significant portion of our revenue, and a disruption in our relationship with our manufacturers’ representatives or distributors would have a material adverse effect on our revenue.
More than 60% of our revenue for 2009 was generated through independent manufacturers’ representatives and distributors, whose activities are not within our direct control. In addition, in some locations, our manufacturers’ representatives and distributors provide field service to our customers. A reduction in the sales efforts or financial viability of these manufacturers’ representatives or distributors, or a termination of our relationship with these representatives or distributors, would have a material adverse effect on our sales, financial results and ability to support our customers. Our manufacturers representatives and distributors are not obligated to continue selling our products, and they may terminate their arrangements with us at any time with limited or no prior notice. If we make the business decision to terminate or modify our relationships with one or more of our independent manufacturers’ representatives, or if a manufacturers’ representative decides to disengage from us, and we do not effectively and efficiently manage such a change, we could lose sales to existing customers and fail to obtain new customers. Establishing alternative sales channels would consume substantial time and resources, decrease our revenue and increase our expenses.
17
Table of Contents
Failure to retain key managerial, technical, and sales and marketing personnel or to attract new key personnel could harm our business.
Our success depends on the continued services of our executive officers and other key management, technical, and sales and marketing personnel and on our ability to continue to attract, retain and motivate qualified personnel. Our executive officers and other key employees are able to exercise stock options and sell the underlying stock, which may reduce their incentive to continue their employment with us. The loss of key personnel could limit our ability to develop new products and adapt existing products to our customers’ evolving requirements and may result in lost sales and a diversion of management resources. Furthermore, much of our competitive advantage and intellectual property is based on the expertise, experience and know-how of our key personnel. Our former President and Chief Executive Officer left the Company in January 2010 and we are currently performing a search to find a replacement. In the transition period, our Lead Director, F. Paul Carlson, was appointed Chairman and Chief Executive Office until the appointment of a new Chief Executive Officer. We do not have employment agreements or non-competition agreements with any of our employees except for an employment agreement with our Chief Financial Officer. To support our future growth, we will need to attract and retain additional qualified management, technical and sales and marketing employees. Competition for such personnel in our industry can be intense, and we cannot assure you that we will be successful in attracting and retaining such personnel.
Our customers’ evaluation processes can lead to lengthy sales cycles, during which we may incur significant costs that may not result in sales.
Our customers typically expend significant efforts in evaluating and qualifying our products prior to placing an order, particularly for orders of engineering probe stations and production probe cards. This evaluation and qualification process frequently results in a lengthy sales cycle, typically ranging from three to 12 months and sometimes longer. During the period in which our customers are evaluating our products, we incur substantial sales, marketing, research and development expenses and expend significant management efforts. After completing this evaluation process, a potential customer may elect not to purchase our products. In addition, product purchases are frequently subject to unplanned processing and other delays, particularly with respect to larger customers for which our products represent a very small percentage of their overall purchase activity.
Additional factors, some of which are partially or completely outside our control, that affect the length of time it takes us to complete a sale, include:
| • | the efforts of our sales force; |
| • | the history of previous sales to the customer; |
| • | the complexity of the customer’s engineering or production processes; |
| • | the internal technical capabilities and sophistication of the customer; and |
| • | the capital expenditure budgets of the customer. |
The lengthy and unpredictable nature of our sales cycle could result in fluctuations in our operating results, which could fall below the expectations of analysts and investors for any particular period of time, and result in a decline in the price of our common stock.
If our products contain defects, our reputation would be damaged, and we could lose customers and revenue and incur warranty expenses.
The complexity and ongoing development of our products, as well as the inclusion in our products of components purchased from third parties, could lead to design, manufacturing or performance problems. Our products may contain defects which could cause our sales to decline, our reputation to be significantly damaged and our customers to be reluctant to buy our products, any or all of which could result in a decline in revenue, an increase in product returns, higher field service costs, the loss of existing customers or the failure to attract new customers. Our warranty expense totaled $453,000, $540,000, and $637,000, for 2009, 2008 and 2007, respectively. Although we are not currently
18
Table of Contents
seeking reimbursement from any vendors related to our warranty expense, we have in the past, and may again in the future, seek reimbursement from certain vendors. To the extent that we experience additional failures of purchased components that increase our warranty expenses that are not reimbursed by the vendor, our results of operations will be adversely affected.
If we fail to protect our proprietary technology and rights, competitors may be able to use our technologies, which would weaken our competitive position and could reduce our sales.
Our success and competitive position depend in significant part on the technically innovative features of our products, and, if we fail to protect our proprietary rights, our competitors might gain access to our technology. Although we rely in part on patent, trade secret and trademark laws to protect the proprietary technology used in our products, our patents may be challenged by third parties and held invalid, and any of our pending patent applications may not be approved. Additionally, we may not be able to develop additional proprietary technology that is patentable. Policing unauthorized use of our products is difficult, and we may not be able to prevent the misappropriation and unauthorized use of our technologies. Furthermore, our existing and future patents may not be sufficiently broad to protect our proprietary technologies, may not provide us with competitive advantages and may be circumvented by the designs of third parties.
Unauthorized parties may attempt to copy aspects of our products or to obtain and use information that we regard as proprietary. Others may independently develop or otherwise acquire similar or competing technologies or methods or design around our patents. Additionally, some of our proprietary technology cannot be effectively protected by patents. In these cases, we rely on trade secret laws and confidentiality agreements to protect our confidential and proprietary information, processes and technology. However, our confidential and proprietary information, processes and technology could be independently developed by, or otherwise become known to, third parties, which would weaken our competitive position and might reduce our sales.
Since 1997, we have derived more than 50% of our annual revenue from products sold to customers outside of North America. The laws of some foreign countries do not protect our proprietary rights to the same extent as the laws of the U.S., and many companies have encountered substantial problems in protecting their proprietary rights against infringement in such countries. The manner in which we protect our proprietary rights may not be adequate in some foreign countries. Our failure to adequately protect our intellectual property in foreign countries would make it easier for competitors to copy or circumvent our product designs and sell competing products in those countries, which could adversely affect our revenue and cause us to lose customers.
Intellectual property infringement claims by or against us may result in litigation, the cost of which could be substantial and could prevent us from selling our products.
The semiconductor industry is characterized by uncertain and conflicting intellectual property claims, frequent litigation regarding patent and other intellectual property rights and vigorous protection and pursuit of these rights. Questions of infringement in the semiconductor industry involve highly technical and subjective analyses. Litigation may be necessary to determine the validity and scope of our proprietary rights or to defend against claims of infringement or invalidity by third parties, and we may not prevail in any litigation. Any such litigation, whether or not determined in our favor or settled, might be costly, could harm our reputation, could cause product shipment delays and could divert the efforts and attention of our management and technical personnel from our normal business operations.
An adverse outcome in any intellectual property litigation might result in the loss of our proprietary rights, subject us to significant liabilities, require us to spend significant resources to develop non-infringing technology, require us to seek licenses from third parties, prevent us from manufacturing and selling our products or require us to discontinue the use of certain technology in our products, any of which could have an adverse effect on our business, financial condition and results of operations. License agreements, if required, might not be available on terms acceptable to us or at all.
19
Table of Contents
Our growth could strain our personnel and infrastructure resources, and, if we are unable to implement appropriate controls and procedures to manage our growth, we may not be able to successfully implement our business plan.
Our growth has placed, and will continue to place, significant demands on our management, operational, financial and technical resources and on our internal control, management information and reporting systems. Our success will depend, in part, upon the ability of our senior management to manage this growth effectively. To manage the expected growth of our operations and personnel, we will need to:
| • | continue to improve our operational, financial and management controls and our reporting systems and procedures; |
| • | manage the growth of different product lines with different cost structures; and |
| • | recruit, train, manage and motivate our employees to support our expanded operations. |
Our success depends on our continued investment in research and development, the level and effectiveness of which could reduce our profitability.
We will continue to make investments in research and development to sustain and improve our competitive position and meet our customers’ needs. These investments currently include refining Pyramid Probe fabrication processes, developing higher performance Pyramid Probe cards, test sockets and analytical probes and enhancing engineering probe stations for both 300mm and sub-300mm wafers. To maintain our competitive position, we may need to increase our research and development investment, which could reduce our profitability. In addition, we cannot assure you that we will achieve a return on these investments, nor can we assure you that these investments will improve our competitive position and meet our customers’ needs.
Any disruption in the operations of our manufacturing facilities could harm our business.
We manufacture most of our products in our facilities located in Beaverton, Oregon and Brooklyn Park, Minnesota, and, as a result of our acquisition of Suss Test in January 2010, we also manufacture certain products in Dresden, Germany. Our manufacturing processes are complex and require sophisticated and costly equipment and specially designed facilities. As a result, any prolonged disruption in the operations of our facilities, whether due to technical or labor difficulties, relocation or destruction of or damage to the facilities as a result of an earthquake, fire or any other reason, could materially and adversely affect our business, financial condition and results of operations.
We rely on suppliers and contract manufacturers for the products we sell.
Reliance on suppliers and contract manufacturers raises several risks, including the possibility of defective parts, lack of availability and the possibility of increases in component costs. Manufacturing efficiencies and our profitability can be adversely affected by each of these risks.
A reorganization could also result in significant disruption of our business and our relationships with our employees, suppliers and customers could be adversely affected.
During 2008, we restructured our business by eliminating the divisional structure and put in place a functional organization. Executives and managers that previously had divisional oversight roles were reassigned functional responsibilities in sales, marketing or operations. The restructuring, which also included the closure of our machine shop, closure of our sales and service office in England and move to outsourced manufacturing of 150mm systems, eliminated redundant divisional positions and lowered our cost structure through headcount reductions.
20
Table of Contents
In the future, we may make additional changes to our organizational structure to improve operating efficiencies and reduce operating costs. A reorganization requires significant efforts, including the integration of product manufacturing, research and development, sales and marketing efforts and general and administration activities. There can be no assurance that a reorganization would be successful or reduce operating costs.
We may fail to comply with environmental regulations, which could result in significant costs and harm our business.
We are subject to a variety of federal, state and local laws, rules and regulations relating to the storage, use, discharge, disposal and human exposure to hazardous and toxic materials used in our thin-film fabrication facility and other manufacturing operations. The risk of a release of hazardous or toxic materials cannot be completely eliminated, and if such a release occurs, we could be held financially responsible for the cleanup or other consequences of the release. We are not aware of any releases at any of our facilities that could reasonably be expected to result in any material liabilities to us. Our past, present or future failure to comply with environmental laws and regulations could result in enforcement actions, substantial liabilities and suspension of production or cessation of operations in extreme situations. Compliance with current or future environmental laws and regulations could restrict our ability to expand our facilities or build new facilities or require us to acquire additional expensive equipment, modify our manufacturing processes, or incur other substantial expenses which could harm our business, financial condition and results of operation.
For example, the European Parliament has finalized the RoHS Directive which restricts the sale of new electrical and electronic equipment containing certain hazardous substances, including lead. Although we believe a majority of our products, if not all, are exempt from this directive, where possible we have modified our manufacturing processes, eliminating lead from products we put on the market as required by the RoHS Directive.
In addition, China has implemented a RoHS Directive that became effective in 2007. This Directive is similar to the European RoHS Directive, except for the fact that the China Directive does not include exemptions. Based on current information available, we believe we will be able to comply with the China RoHS Directive. However, if it is determined that we do not comply with this Directive, we may suffer a loss of revenue, be unable to sell in certain markets or countries and suffer competitive disadvantage.
The European Parliament has also finalized the WEEE Directive, which makes producers of electrical and electronic equipment financially responsible for specified collection, recycling, treatment and disposal of past and future covered products. As a producer of industrial electronic equipment, we may incur financial responsibility for the collection, recycling, treatment or disposal of products covered under the WEEE Directive. Our products have been labeled in accordance with the WEEE Directive since before August 13, 2005, the WEEE implementation date. We determined the products we presently produce are exempt because they either meet the definition of “Large Scale Industrial Equipment,” or are passive or non-electrical accessories that do not function on their own. We have not incurred any costs or fees or penalties associated with non-compliance. Furthermore, none of our products have been delayed at a customs point-of-entry into an EU country or China in respect of the RoHS or WEEE Directives. Therefore, we have some confidence that we are interpreting the rules correctly. However, because the EU member states have not fully implemented the WEEE Directive, the nature and extent of the costs to comply and fees or penalties associated with non-compliance are still unknown at this time. Costs to comply with the WEEE Directive and similar future legislation, if applicable, may also include legal and regulatory costs and insurance costs. We may also be required to take reserves for costs associated with compliance with these regulations.
These environmental laws and regulations could become more stringent over time, imposing even greater compliance costs and increasing risks and penalties associated with violations, which could seriously harm our business, financial condition and results of operation. There can be no assurance that violations of environmental laws or regulations will not occur in the future as a result of the inability to obtain permits, human error, equipment failure or other causes.
21
Table of Contents
Product liability claims may be asserted against us, resulting in costly litigation for which we may not have sufficient liability insurance.
Our customers may use our products in the testing of high reliability semiconductors for critical applications such as telecommunications infrastructure, military, medical and aerospace equipment. Defects or other problems with the performance of our products could result in financial or other damages to our customers. In addition, some of our engineering probe stations that use high powered lasers or operate at high voltage or extreme temperatures may cause death or injury to persons utilizing such equipment due to undetected design or manufacturing defects or due to improper use or maintenance by our customers. Although our product invoices and sales contracts generally contain provisions designed to limit our exposure to product liability claims, existing or future laws or unfavorable judicial decisions could negate these provisions. Product liability litigation against us, even if it were unsuccessful, could be time consuming and costly to defend. Additionally, although we carry product liability insurance, in some circumstances it may not cover certain claims or be adequate to cover all claims.
We rely on a small number of customers for a significant portion of our revenue, and the termination of any of these relationships would adversely affect our business.
Our top four customers accounted for a total of 13% of our revenue in 2009 and 2008. Our customer base is less diversified in Probes and Sockets than in Stations. Our customers are not obligated by long-term contracts to purchase our products and may discontinue purchasing our products at any time. The semiconductor industry is highly concentrated and a small number of semiconductor manufacturers generally account for a substantial portion of the purchases of semiconductor test equipment, including our products. Consequently, our business and operating results would be materially, adversely affected by the loss of any of our significant customers.
In addition, our ability to increase our revenue will depend in part upon our ability to obtain orders from new customers, particularly customers of our production probe cards. Obtaining orders from new customers is difficult because semiconductor manufacturers typically select one vendor’s products for testing a particular new generation of chips. Once a manufacturer has selected a vendor, that manufacturer is more likely to continue to purchase products from that vendor for that generation of chips, as well as subsequent generations of chips. We therefore place great emphasis on relationships with our current customers because these customers are difficult to replace. In addition, we focus on leveraging our relationships with current customers to sell into additional engineering labs and production lines in the same company and similar groups in other companies. If we are unable to maintain our relationships with our existing significant customers or to obtain new customers that adopt and implement our products and technology, we will not be able to meet our revenue and growth targets, which could result in a decline in the price of our common stock.
Our employment costs in the short-term are, to a large extent, fixed, and therefore, any shortfall in sales would harm our operating results.
Our operating expense levels are based, in significant part, on our headcount. For a variety of reasons, particularly the high cost and disruption of layoffs, the costs of recruiting and training new personnel and product delivery and service commitments to our customers, our headcount in the short-term is, to a large extent, fixed. Accordingly, we may be unable to reduce employment costs in a timely manner to compensate for any shortfall in our sales or gross margins, which could materially harm our operating results.
22
Table of Contents
Unanticipated changes in our tax rates or exposure to additional income tax liabilities could affect our profitability.
We are subject to income taxes in both the U.S. and various foreign jurisdictions, and our domestic and international tax liabilities are subject to the allocation of expenses in different jurisdictions. Our effective tax rate could be adversely affected by changes in the mix of earnings in countries with different statutory tax rates, changes in the valuation of deferred tax assets and liabilities, changes in tax laws, including pending tax law changes, such as the benefit from export sales and the research and development credit by material audit assessments. In particular, the carrying value of deferred tax assets, which are predominantly in the U.S., is dependent on our ability to generate future taxable income in the U.S. In addition, the amount of income taxes we pay could be subject to ongoing audits in various jurisdictions and a material assessment by a governing tax authority could affect our profitability.
Our officers and directors and their affiliates will control the outcome of matters requiring shareholder approval.
As of March 1, 2010, our executive officers and directors and their affiliates beneficially owned approximately 26% of our outstanding shares of common stock. Consequently, these shareholders have substantial influence over the election of our directors and the outcome of corporate actions requiring shareholder approval, such as a merger or a sale of our company or a sale of all or substantially all of our assets. This concentration of voting power and control could have a significant effect in delaying, deferring or preventing an action that might otherwise be beneficial to our other shareholders and be disadvantageous to our shareholders with interests different from those of our officers, directors and affiliates. These shareholders will also have significant control over our business, policies and affairs. Additionally, this significant concentration of share ownership may adversely affect the trading price for our common stock because investors often perceive disadvantages in owning stock in companies with controlling shareholders.
The anti-takeover provisions of our charter documents and Oregon law may inhibit a takeover or change in our control that shareholders may consider beneficial.
Provisions of our articles of incorporation and bylaws and provisions of Oregon law may have the effect of delaying or preventing a merger or acquisition of us, making a merger or acquisition of us less desirable to a potential acquirer or preventing a change in our management, even if the shareholders consider the merger or acquisition favorable or if doing so would benefit our shareholders. In addition, these provisions could limit the price that investors would be willing to pay in the future for shares of our common stock. The following are examples of such provisions in our articles of incorporation or bylaws:
| • | We have a staggered board of directors, which will make it more difficult for a group of shareholders to quickly change the composition of our board. |
| • | Our board of directors is authorized, without prior shareholder approval, to create and issue preferred stock with voting or other rights or preferences that could impede the success of any attempt to acquire us or change our control, commonly referred to as “blank check” preferred stock. |
| • | Members of our board of directors can only be removed for cause. |
| • | The board of directors may alter our bylaws without obtaining shareholder approval. |
| • | Shareholders are required to provide advance notice for nominations for election to the board of directors or for proposing matters to be acted upon at a shareholder meeting. |
| • | Any action that is taken by written consent of shareholders must be unanimous. |
We are also subject to the provisions of the Oregon Control Share Act and the Oregon Business Combination Act, each of which may have certain anti-takeover effects.
23
Table of Contents
If our stock price is volatile, securities class action litigation may be brought against us, which could result in substantial costs.
In the past, securities class action litigation has often been brought against a company following periods of volatility in the market price of its securities, and newly public companies tend to experience more volatility in their stock price. We may be the target of such litigation in the future. Securities litigation may result in substantial costs and divert management’s attention and resources, which may seriously harm our business.
| ITEM 1B. | UNRESOLVED STAFF COMMENTS |
None
| ITEM 2. | PROPERTIES |
We maintain our corporate headquarters in Beaverton, Oregon. Our primary site contains corporate administration, sales and marketing, design, test, light manufacturing and assembly and various support functions in leased space totaling approximately 137,000 square feet in three adjacent buildings. This lease expires December 31, 2015. Our Pyramid Probe manufacturing is conducted in a 10,000 square foot clean room within a 58,817 square foot facility that we lease at a separate site in Beaverton, Oregon. Our lease of this facility expires December 31, 2014. Our test socket manufacturing is conducted in a 14,000 square foot facility that we lease in Brooklyn Park, Minnesota. We lease small sales and service offices in Japan, Germany, China, Taiwan and Singapore. As a result of the Suss Test acquisition in January 2010, we also lease a 12,700 square foot manufacturing and support facility near Dresden, Germany. Our lease of that facility expires December 31, 2012.
| ITEM 3. | LEGAL PROCEEDINGS |
As of the date of filing this Form 10-K, we are not a party to any material legal proceedings. However, the semiconductor test industry is characterized by vigorous protection and pursuit of intellectual property rights and positions. To protect our intellectual property from infringement, we have, from time to time, initiated litigation against third parties and may be required to do so in the future. We cannot assure you that we shall be successful in future intellectual property litigation and this litigation often is protracted and expensive.
| ITEM 4. | RESERVED |
24
Table of Contents
| ITEM 5. | MARKET FOR THE REGISTRANT’S COMMON EQUITY, RELATED STOCKHOLDER MATTERS AND ISSUER PURCHASES OF EQUITY SECURITIES |
Stock Prices and Dividends
Our common stock began trading on the NASDAQ National Market System under the symbol “CSCD” on December 15, 2004. The high and low closing sale price of our common stock by quarter for each of the eight quarters in the two-year period ended December 31, 2009 was as follows:
| 2009 |
High | Low | ||||
| Quarter 1 |
$ | 4.68 | $ | 1.84 | ||
| Quarter 2 |
4.50 | 2.40 | ||||
| Quarter 3 |
5.51 | 3.80 | ||||
| Quarter 4 |
5.59 | 4.24 | ||||
| 2008 |
High | Low | ||||
| Quarter 1 |
$ | 9.87 | $ | 7.36 | ||
| Quarter 2 |
8.25 | 6.58 | ||||
| Quarter 3 |
6.52 | 3.90 | ||||
| Quarter 4 |
4.15 | 1.90 | ||||
As of March 1, 2010, there were 61 shareholders of record and approximately 700 beneficial shareholders.
We have not declared or paid any cash dividends on our common stock in the past two years. We currently expect to retain any future earnings to fund the operation and expansion of our business, and therefore, we do not currently expect to pay cash dividends in the foreseeable future.
Use of Proceeds
We filed a registration statement on Form S-1, File No. 333-113256 for an initial public offering of common stock, which was declared effective by the Securities and Exchange Commission on December 15, 2004. In that offering, we sold an aggregate of 3.3 million shares of our common stock with net offering proceeds of $41.6 million. No payments were made to our directors or officers or their associates, holders of 10% or more of any class of our equity securities or to any affiliates.
As of December 31, 2009, we had used approximately $5.5 million of those proceeds for the repayment of indebtedness and $20.0 million, net of cash acquired, for our acquisitions of the eVue product line, Gryphics, Inc. and certain assets of Synatron GmbH.
In January 2010, we used approximately $6.3 million of cash proceeds for the purchase of the capital stock and certain related assets of Suss Test.
Equity Compensation Plan Information
See Item 12. for Equity Compensation Plan Information.
25
Table of Contents
Stock Performance Graph
The SEC requires that registrants include in this report a line-graph presentation comparing cumulative five-year shareholder returns on an indexed basis, assuming a $100 initial investment and reinvestment of dividends. Our graph consists of (a) Cascade Microtech, Inc.; (b) the NASDAQ Composite Index and (c) a peer group index composed of Teradyne, Inc., FormFactor, Inc., Kulicke & Soffa Industries, Inc., LTX-Credence Corporation, Electro Scientific Industries, Inc. and Keithley Instruments, Inc. The peer group index utilizes the same methods of presentation and assumptions for the total return calculation as does Cascade Microtech, Inc. and the Nasdaq Composite Index. All companies in the peer group index are weighted in accordance with their market capitalizations.
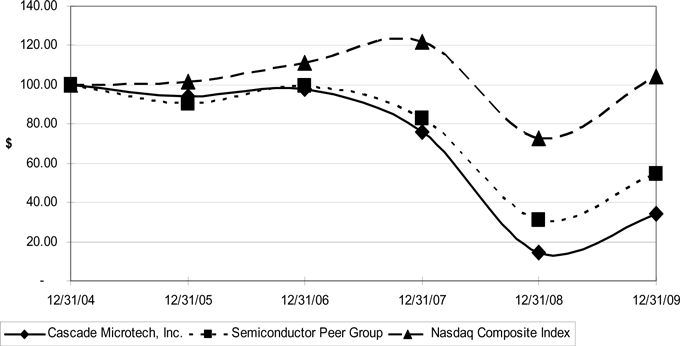
| Base Period 12/31/04 |
Indexed Returns Period Ended | |||||||||||||||||
| Company/Index |
12/31/05 | 12/31/06 | 12/31/07 | 12/31/08 | 12/31/09 | |||||||||||||
| Cascade Microtech, Inc. |
$ | 100.00 | $ | 94.04 | $ | 97.54 | $ | 75.87 | $ | 14.52 | $ | 34.10 | ||||||
| Semiconductor Peer Group |
100.00 | 90.49 | 99.52 | 83.03 | 31.24 | 54.34 | ||||||||||||
| NASDAQ Composite Index |
100.00 | 101.37 | 111.03 | 121.92 | 72.49 | 104.31 | ||||||||||||
26
Table of Contents
| ITEM 6. | SELECTED FINANCIAL DATA |
The consolidated statement of operations and balance sheet data set forth below have been derived from our consolidated financial statements. The selected consolidated financial data set forth below should be read in conjunction with “Management’s Discussion and Analysis of Financial Condition and Results of Operations” and with the consolidated financial statements and notes thereto included elsewhere in this Form 10-K.
| For the Year Ended December 31, | |||||||||||||||||
| IN THOUSANDS (except per share amounts) |
2009 | 2008 | 2007 | 2006 | 2005 | ||||||||||||
| Statement of Operations Data |
|||||||||||||||||
| Revenue |
$ | 53,541 | $ | 76,561 | $ | 89,922 | $ | 84,852 | $ | 73,637 | |||||||
| Cost of sales |
33,840 | 44,477 | 48,801 | 47,810 | 39,390 | ||||||||||||
| Gross profit |
19,701 | 32,084 | 41,121 | 37,042 | 34,247 | ||||||||||||
| Operating expenses: |
|||||||||||||||||
| Research and development |
8,372 | 10,473 | 11,241 | 8,949 | 6,968 | ||||||||||||
| Selling, general and administrative |
21,724 | 29,311 | 27,723 | 24,819 | 19,778 | ||||||||||||
| Amortization of purchased intangibles |
567 | 2,461 | 1,977 | 130 | — | ||||||||||||
| Asset impairment charges |
— | 27,701 | — | — | — | ||||||||||||
| Total operating expenses |
30,663 | 69,946 | 40,941 | 33,898 | 26,746 | ||||||||||||
| Income (loss) from operations |
(10,962 | ) | (37,862 | ) | 180 | 3,144 | 7,501 | ||||||||||
| Other income (expense), net |
407 | 1,038 | 1,336 | 1,961 | 1,991 | ||||||||||||
| Income (loss) before income taxes |
(10,555 | ) | (36,824 | ) | 1,516 | 5,105 | 9,492 | ||||||||||
| Provision (benefit) for income taxes |
(2,906 | ) | (2,247 | ) | 586 | 1,495 | 1,173 | ||||||||||
| Net income (loss) |
$ | (7,649 | ) | $ | (34,577 | ) | $ | 930 | $ | 3,610 | $ | 8,319 | |||||
| Basic net income (loss) per share attributed to common shareholders |
$ | (0.57 | ) | $ | (2.65 | ) | $ | 0.07 | $ | 0.31 | $ | 0.75 | |||||
| Diluted net income (loss) per share attributed to common shareholders |
$ | (0.57 | ) | $ | (2.65 | ) | $ | 0.07 | $ | 0.30 | $ | 0.70 | |||||
| Shares used in basic per share calculations |
13,319 | 13,071 | 12,550 | 11,482 | 11,055 | ||||||||||||
| Shares used in diluted per share calculations |
13,319 | 13,071 | 12,840 | 11,959 | 11,816 | ||||||||||||
| December 31, | |||||||||||||||||
| 2009 | 2008 | 2007 | 2006 | 2005 | |||||||||||||
| Balance Sheet Data |
|||||||||||||||||
| Cash, cash equivalents and short-term marketable securities |
$ | 32,854 | $ | 32,545 | $ | 29,421 | $ | 43,794 | $ | 50,346 | |||||||
| Working capital |
56,786 | 58,269 | 58,965 | 68,642 | 74,601 | ||||||||||||
| Total assets |
80,944 | 88,456 | 125,281 | 103,786 | 90,120 | ||||||||||||
| Current portion of capital lease obligations |
11 | 19 | 13 | — | 8 | ||||||||||||
| Long-term capital lease obligations, less current portion |
29 | 62 | 51 | — | — | ||||||||||||
| Other long-term liabilities |
2,596 | 2,669 | 5,763 | 1,370 | 1,100 | ||||||||||||
| Shareholders’ equity |
71,385 | 76,700 | 107,605 | 90,193 | 81,505 | ||||||||||||
27
Table of Contents
| ITEM 7. | MANAGEMENT’S DISCUSSION AND ANALYSIS OF FINANCIAL CONDITION AND RESULTS OF OPERATIONS |
You should read the following discussion in conjunction with our consolidated financial statements and notes thereto appearing elsewhere in this Form 10-K. In addition to historical consolidated financial information, the following discussion and analysis contains forward-looking statements that involve risks, uncertainties and assumptions. Our actual results could differ materially from those anticipated by these forward-looking statements as a result of many factors, including those discussed under Item 1A, Part I, “Risk Factors,” and elsewhere in this Form 10-K. We do not guarantee future results, levels of activity, performance or achievements. We do not intend to update any of the forward-looking statements after the date of this document to conform them to actual results or to changes in our expectations.
Overview
Revenues decreased to $53.5 million in 2009 compared to $76.6 million 2008 as uncertainty in the world economic environment impacted demand for semiconductors and semiconductor equipment. Consequently, gross margin decreased to 36.8% in 2009 compared to 41.9% in 2008 as certain fixed overhead costs were not recovered. However, in the second half of 2009, we saw mild, but continued, recovery in the semiconductor market as our revenues steadily increased from a low of $11.5 million in the first quarter of 2009, to $14.0 million and $15.5 million in the third and fourth quarters of 2009, respectively. Our focus on controlling costs resulted in a decrease in selling, general and administrative expenses of $7.6 million, or 25.9% to $21.7 million in 2009 compared to $29.3 million in 2008. Despite the decreases in revenue and gross margin in 2009 compared to 2008, cash, cash equivalents and marketable securities decreased by only $1.4 million to $33.6 million at December 31, 2009 from $35.0 million at December 31, 2008. While it is unclear when semiconductor and semiconductor equipment market conditions will return to the levels seen in 2007 and early 2008, we believe that the market is recovering and that our competitive position, products, technology and balance sheet remain strong.
Outlook for 2010
On January 28, 2010, we completed the acquisition of Suss Test, our primary competitor in the Systems business. The acquisition of Suss Test provides us with an expanded portfolio of products and should allow us to leverage the resources and core competencies of the combined companies in engineering and technology to address complex, emerging technologies. We believe that the acquisition of Suss Test combined with ongoing recovery in the market for semiconductors and semiconductor equipment will result in increased revenue for 2010 compared to 2009. Based on our current backlog, anticipated bookings and expected incremental revenue from the acquisition of Suss Test, we anticipate revenues will be in the range of $19 million to $23 million for the first quarter of 2010.
28
Table of Contents
Results of Operations
The following table sets forth our consolidated statement of operations data for the periods indicated as a percentage of revenue.(1)
| For the Year Ended December 31, | |||||||||
| 2009 | 2008 | 2007 | |||||||
| Statement of Operations Data |
|||||||||
| Revenue |
100.0 | % | 100.0 | % | 100.0 | % | |||
| Cost of sales |
63.2 | 58.1 | 54.3 | ||||||
| Gross profit |
36.8 | 41.9 | 45.7 | ||||||
| Operating expenses: |
|||||||||
| Research and development |
15.6 | 13.7 | 12.5 | ||||||
| Selling, general and administrative |
40.6 | 38.3 | 30.8 | ||||||
| Amortization of purchased intangibles |
1.1 | 3.2 | 2.2 | ||||||
| Asset impairments |
— | 36.2 | — | ||||||
| Total operating expenses |
57.3 | 91.4 | 45.5 | ||||||
| Income (loss) from operations |
(20.5 | ) | (49.5 | ) | 0.2 | ||||
| Other income, net |
0.8 | 1.4 | 1.5 | ||||||
| Income (loss) before income taxes |
(19.7 | ) | (48.1 | ) | 1.7 | ||||
| Provision (benefit) for income taxes |
(5.4 | ) | (2.9 | ) | 0.7 | ||||
| Net income (loss) |
(14.3 | )% | (45.2 | )% | 1.0 | % | |||
| (1) | Percentages may not add due to rounding. |
The following table summarizes revenue and gross profit for each of our segments (dollars in thousands):
| Systems | Probes and Sockets |
Total | ||||||||||
| Year Ended December 31, 2009 |
||||||||||||
| Revenue |
$ | 28,951 | $ | 24,590 | $ | 53,541 | ||||||
| Gross Profit |
$ | 9,190 | $ | 10,511 | $ | 19,701 | ||||||
| Gross Margin |
31.7 | % | 42.7 | % | 36.8 | % | ||||||
| Year Ended December 31, 2008 |
||||||||||||
| Revenue |
$ | 40,870 | $ | 35,691 | $ | 76,561 | ||||||
| Gross Profit |
$ | 13,697 | $ | 18,387 | $ | 32,084 | ||||||
| Gross Margin |
33.5 | % | 51.5 | % | 41.9 | % | ||||||
| Year Ended December 31, 2007 |
||||||||||||
| Revenue |
$ | 56,349 | $ | 33,573 | $ | 89,922 | ||||||
| Gross Profit |
$ | 23,382 | $ | 17,739 | $ | 41,121 | ||||||
| Gross Margin |
41.5 | % | 52.8 | % | 45.7 | % | ||||||
The segment data is not meant to represent stand alone divisional information. See Note 16 of Notes to Consolidated Financial Statements included in Item 8 of this Report on Form 10-K for additional information.
Revenue
Revenue decreased $23.1 million, or 30.1%, to $53.5 million in 2009 compared to $76.6 million in 2008 and decreased $13.3 million, or 14.9%, in 2008 compared to $89.9 million in 2007.
Systems
Revenue in Systems decreased $11.9 million, or 29.2%, to $29.0 million in 2009 compared to $40.9 million in 2008 and decreased $15.5 million, or 27.5%, in 2008 compared to $56.4 million in 2007.
29
Table of Contents
Certain financial information which contributed to the Systems revenue results was as follows:
| 2009 compared to 2008 |
2008 compared to 2007 |
|||||
| Percentage decrease in unit sales |
22.5 | % | 17.1 | % | ||
| Percentage decrease in average sales price |
14.2 | % | 18.3 | % |
We realized decreased unit sales in both our 300mm systems and our non-300mm systems in 2009 compared to 2008 and in 2008 compared to 2007 due to the global slow-down in semiconductor markets.
Average sales price was negatively affected in 2009 compared to 2008 and in 2008 compared to 2007 by changes in our sales mix, as fewer high-end 300mm systems were sold in relation to total system sales. Sales of 300mm systems represented 7.7%, 19.1% and 31.7% of total units sales in 2009, 2008 and 2007, respectively. Average sales price includes the sales price of any analytical probes, probe cards and accessories purchased with an engineering probe station.
Probes and Sockets
Revenue in Probes and Sockets decreased $11.1 million, or 31.1%, to $24.6 million in 2009 compared to $35.7 million in 2008 and increased $2.1 million, or 6.3%, in 2008 compared to $33.6 million in 2007.
The decrease in 2009 compared to 2008 was primarily the result of lower unit sales driven by the overall decrease in worldwide semiconductor production.
The increase in 2008 compared to 2007 was primarily due to new product introductions, new design wins in the RF and wireless market and continued focus on growth in market segments and applications other than our core RF business, especially in the parametric test market. Parametric test is the electrical verification of the wafer fabrication process quality and is used by semiconductor wafer fabs world-wide.
Cost of Sales and Gross Margin
Cost of sales includes purchased materials, fabrication, assembly, test, installation labor, overhead, customer-specific engineering costs, warranty costs, royalties and provision for inventory valuation reserves.
Cost of sales decreased $10.7 million, or 23.9%, to $33.8 million in 2009 compared to $44.5 million in 2008 and decreased $4.3 million, or 8.9%, in 2008 compared to $48.8 million in 2007. Gross margin (gross profit as a percentage of net sales) was 36.8%, 41.9% and 45.7% in 2009, 2008 and 2007, respectively. The decreases in cost of sales were primarily due to the decreases in sales, partially offset by lower gross margins.
Systems
The gross margin in Systems decreased to 31.7% in 2009 compared to 33.5% in 2008, primarily attributable to the overall decrease in sales volume and change in product mix. We sold fewer 300mm systems in relation to total system sales, which typically yield higher margins than non-300mm systems due to their higher average sales prices and sales of accessories. The decrease in gross margin due to volume and product mix were partially offset by decreases in salaries, benefits and overhead costs.
The gross margin in Systems decreased to 33.5% in 2008 from 41.5% in 2007, primarily due to the overall decrease in unit sales as unallocated fixed overhead costs and inventory reserve charges were recorded as a period expense in cost of sales. In addition, there was a shift in sales product mix to fewer 300mm systems, which typically yield higher gross margins and include more accessories.
30
Table of Contents
Probes and Sockets
The gross margin in Probes and Sockets decreased to 42.7% in 2009 compared to 51.5% in 2008, primarily due to the decrease in sales volume as production costs for Probes and Sockets have a higher component of fixed overhead than Systems. As sales volumes decline, unallocated fixed overhead costs recorded as a period expense in cost of sales increase. The impact of the decline in sales volume was partially offset by an overall reduction in salaries, benefits and overhead costs and improvement in yields on certain product lines.
The gross margin in Probes and Sockets decreased to 51.5% in 2008 from 52.8% in 2007, primarily due to lower than expected sales and production volume in the fourth quarter of 2008, as unallocated fixed overhead costs were recorded as a period expense in cost of sales. The decrease in fourth quarter production volume was partially offset by a gross margin in Probes and Sockets of 55.5% through the first three quarters of 2008 as efficiencies were achieved with the higher production volumes in those quarters.
Research and Development
Research and development costs are expensed as incurred and include compensation and related expenses for personnel, materials, consultants and overhead.
Research and development expenses decreased $2.1 million, or 20.1%, to $8.4 million in 2009 compared to $10.5 million in 2008 and decreased $0.7 million, or 6.8%, in 2008 compared to $11.2 million in 2007.
The decreases were due to the following:
| 2009 Compared to 2008 |
||||
| Decrease in wages and benefits due to lower headcount |
$ | (1,708,000 | ) | |
| Increase in consulting fees for R&D projects |
244,000 | |||
| Decrease in severance costs |
(232,000 | ) | ||
| Decrease in travel, meals and entertainment expenses |
(148,000 | ) | ||
| Decrease in allocated occupancy expenses |
(82,000 | ) | ||
| Decrease in recruiting expenses |
(124,000 | ) | ||
| Decrease in stock-based compensation |
(49,000 | ) | ||
| Other, net |
(1,000 | ) | ||
| $ | (2,100,000 | ) | ||
| 2008 Compared to 2007 |
||||
| Decrease in wages and benefits due to lower headcount |
$ | (494,000 | ) | |
| Decrease in production costs allocated to R&D |
(487,000 | ) | ||
| Increase in travel expenses |
130,000 | |||
| Increase in recruiting expenses |
132,000 | |||
| Other, net |
19,000 | |||
| $ | (700,000 | ) | ||
Selling, General and Administrative
Selling, general and administrative, or SG&A, expense includes compensation and related expenses for personnel, travel, outside services, manufacturers’ representative commissions, internally developed patent and trademark amortization and overhead incurred in our sales, marketing, customer support, management, legal and other professional and administrative support functions, as well as costs to operate as a public company.
31
Table of Contents
SG&A expense decreased $7.6 million, or 25.9%, to $21.7 million in 2009 compared to $29.3 million in 2008 and increased $1.6 million, or 5.7%, in 2008 compared to $27.7 million in 2007. The changes were due to the following:
| 2009 Compared to 2008 |
||||
| Decrease in wages and benefits due to lower headcount |
$ | (1,755,000 | ) | |
| Decrease in accounting and consulting fees |
(1,203,000 | ) | ||
| Decrease in internal and external sales commissions |
(529,000 | ) | ||
| Decrease in travel, meals and entertainment expenses |
(581,000 | ) | ||
| Decrease in recruiting and relocation expenses |
(165,000 | ) | ||
| Decrease in advertising, sales materials and event fees |
(435,000 | ) | ||
| Decrease in stock-based compensation |
(529,000 | ) | ||
| Increase in legal expenses |
313,000 | |||
| Decrease in freight and postage expenses |
(208,000 | ) | ||
| Decrease in severance and restructuring costs |
(451,000 | ) | ||
| Decrease in allocated occupancy expenses |
(222,000 | ) | ||
| Decrease in executive incentive compensation |
(189,000 | ) | ||
| Decrease in equipment repairs and maintenance |
(195,000 | ) | ||
| Decrease in departmental supplies |
(155,000 | ) | ||
| Decrease in loss on disposals of long-lived assets |
(396,000 | ) | ||
| Decrease in bad debt expense |
(836,000 | ) | ||
| Other, net |
(64,000 | ) | ||
| $ | (7,600,000 | ) | ||
| 2008 Compared to 2007 |
||||
| Decrease in external sales commissions |
$ | (995,000 | ) | |
| Increase in accounting fees |
375,000 | |||
| Increase in stock-based compensation expense |
285,000 | |||
| Increase in bad debt expense |
774,000 | |||
| Increase in severance costs |
346,000 | |||
| Increase in loss on disposals of long-lived assets |
440,000 | |||
| Increase in travel expenses |
177,000 | |||
| Increase in temporary services and consulting fees |
186,000 | |||
| Other, net |
12,000 | |||
| $ | 1,600,000 | |||
Amortization of Purchased Intangibles
Amortization of purchased intangibles includes amortization related to our prior acquisitions. Amortization expense decreased $1.9 million to $0.6 million in 2009 compared to $2.5 million in 2008 and increased $0.5 million in 2008 compared $2.0 million in 2007. The decrease in 2009 compared to 2008 was due to the asset impairment charge recorded in the fourth quarter of 2008. Net purchased intangibles totaled $1.9 million at December 31, 2009.
Asset Impairment
Asset impairment charges included the following (in thousands):
| Year Ended December 31, |
2008 | ||
| Goodwill |
$ | 17,406 | |
| Purchased intangible assets |
10,157 | ||
| Patents |
138 | ||
| $ | 27,701 | ||
During the fourth quarter of 2008, the semiconductor and semiconductor equipment markets continued to deteriorate and the trading price of our common stock declined significantly. Based on these factors, our annual impairment test of goodwill indicated that the implied fair value of our identified reporting units was less than the carrying value of goodwill at December 31, 2008. We also tested long-lived assets for impairment, which indicated that the fair value of certain long-lived assets
32
Table of Contents
were less than carrying value as of December 31, 2008. Accordingly, we recorded impairment charges of $27.7 million in the fourth quarter of 2008. See Note 1 of Notes to Consolidated Financial Statements included in Part II, Item 8 of this Annual Report on Form 10-K for additional information.
Other Income (Expense)
Other income (expense) typically includes interest income, interest expense, gains and losses on foreign currency forward contracts and foreign currency gains and losses. Other income (expense) can also include other miscellaneous non-operating gains and losses.
Other income (expense), net was comprised of the following (in thousands):
| Year Ended December 31, | ||||||||||||
| 2009 | 2008 | 2007 | ||||||||||
| Interest income, net |
$ | 314 | $ | 862 | $ | 1,455 | ||||||
| Foreign currency gains (losses) |
198 | 458 | (254 | ) | ||||||||
| Gains (losses) on foreign currency forward contracts |
(140 | ) | (409 | ) | 238 | |||||||
| Other |
35 | 127 | (103 | ) | ||||||||
| $ | 407 | $ | 1,038 | $ | 1,336 | |||||||
Interest income represents interest earned on cash and cash equivalents and investments in marketable securities. The decrease in 2009 compared to 2008 was primarily due to a decrease in interest rates on investments. The decrease in 2008 compared to 2007 was primarily due to lower cash, cash equivalent and marketable securities balances due to the use of $14.9 million, net of cash acquired, for the purchase of Gryphics, Inc. in April 2007 and the purchase of certain assets of Synatron GmbH in July 2007. In addition, interest rates were lower in 2008 compared to 2007.
Foreign currency gains and losses primarily result from a combination of changes in foreign currency exchange rates and the net value of monetary assets and liabilities denominated in yen, euro and other foreign currencies. 2009 included an adjustment for foreign currency re-measurement related to 2008, which increased other income in 2009 by $0.3 million.
Income Taxes
Our provision (benefit) for income taxes totaled $(2.9) million, or 27.5% of loss before income taxes, in 2009, $(2.2) million, or 6.1% of loss before income taxes, in 2008 and $0.6 million, or 38.7% of income before income taxes, in 2007. Generally, the provision for income taxes is the result of the mix of profits (losses) earned by us and our subsidiaries in tax jurisdictions with a broad range of income tax rates and changes in tax reserves. On a quarterly basis, we evaluate our provision for income tax expense (benefit) based on our projected results of operations for the full year and record an adjustment in the current quarter.
The income tax benefit for 2009 was primarily attributable to a tax relief act signed into law during the fourth quarter of 2009 that increased the carryback of our 2009 net operating losses from 2 to 5 years. The $1.6 million increase in income taxes receivable to $2.6 million at December 31, 2009, compared to $1.0 million at December 31, 2008, was a result of the income tax benefit recorded in the fourth quarter of 2009. We continued to record a valuation allowance against certain deferred tax assets generated from our net loss in 2009. The income tax benefit in 2009 differs from the statutory rate due to losses not benefited in certain tax jurisdictions.
The 2008 effective tax rate differed from the federal statutory rate due primarily to the full reserve we recorded against our domestic deferred tax assets and the goodwill write-off, which was not deductable for tax purposes.
The 2007 effective tax rate differed from federal statutory rates primarily due to benefits from research and experimental tax credits and non-taxable income for federal tax purposes, offset by non-deductible stock-based compensation, increases to tax expense related to additions to tax contingencies recorded during the year and an out-of-period tax adjustment related to inter-company sales and unrealized foreign currency gains and losses.
33
Table of Contents
Liquidity and Capital Resources
Net cash used in operating activities in 2009 was $142,000 and consisted of our net loss of $7.6 million, offset by net non-cash expenses of $6.4 million and net changes in our operating assets and liabilities as described below.
Accounts receivable, net decreased by $1.9 million to $10.9 million at December 31, 2009, compared to $12.8 million at December 31, 2008. The decrease in accounts receivable was primarily due to an increase in collection efforts during 2009.
Inventories decreased by $2.5 million to $16.6 million at December 31, 2009, compared to $19.1 million at December 31, 2008. The decrease in inventory was primarily attributable to a decrease in finished goods and demo equipment of $1.1 million, a decrease in raw materials of $0.6 million and an increase in inventory related reserves of $0.7 million. We believe that our inventory reserves at December 31, 2009 are adequate. However, if our actual results are significantly different than our current expectations for 2010, we may be required to increase reserves for inventory in future periods.
Accounts payable and accrued liabilities decreased by $2.0 million to $5.9 million at December 31, 2009, compared to $7.9 million at December 31, 2008 primarily due to an overall decrease in accrued compensation and benefits, inventory purchases and operating expenses.
Fixed asset purchases of $1.8 million in 2009 were primarily for socket production related equipment and sustaining on-going capital requirements. We anticipate fixed asset additions for 2010 of approximately $3.0 million, primarily for production related equipment, research and development tools and information technology.
Assets held for sale at December 31, 2008 were sold for $360,000 in the first quarter of 2009. The loss of $40,000 upon sale of these assets was included as a component of selling, general and administrative expenses.
Proceeds from the issuance of common stock of $0.5 million represented the sale of stock pursuant to our employee stock purchase plan and the exercise price of options exercised pursuant to our stock incentive plan.
We anticipate meeting our cash requirements for the next 12 months and for the foreseeable future from existing cash, short-term marketable securities and long-term marketable securities, which totaled $33.6 million at December 31, 2009.
In January 2010, we utilized $6.3 million of cash and cash equivalents for the purchase of Suss Test. See Note 18 of Notes to Consolidated Financial Statements for additional information.
We continue to evaluate opportunities for acquisition and expansion and any such transactions, if consummated, may use a portion of our cash and marketable securities.
Seasonality
Typically, our revenue is lower in our fiscal first quarter than in our fiscal fourth quarter preceding it. In addition, as is typical in our industry, we recognize a large percentage of our quarterly revenue in the last month of the quarter. However, our seasonality can be affected by general economic trends and it should not be expected that historical revenue patterns will continue.
34
Table of Contents
Contractual Commitments
The following is a summary of our contractual commitments and obligations as of December 31, 2009 (in thousands):
| Payments Due By Period | |||||||||||||||
| Contractual Obligation |
Total | 2010 | 2011 and 2012 |
2013 and 2014 |
2015 and beyond | ||||||||||
| Operating Leases |
$ | 14,003 | $ | 2,583 | $ | 4,990 | $ | 4,830 | $ | 1,600 | |||||
| Capital Leases |
40 | 13 | 25 | 2 | — | ||||||||||
| Purchase Order Commitments |
3,166 | 3,165 | 1 | — | — | ||||||||||
| Forward contracts |
7,387 | 7,387 | — | — | — | ||||||||||
| $ | 24,596 | $ | 13,148 | $ | 5,016 | $ | 4,832 | $ | 1,600 | ||||||
Purchase order commitments primarily represent open orders for inventory.
Critical Accounting Policies and the Use of Estimates
The preparation of financial statements in conformity with U.S. generally accepted accounting principles requires management to make estimates and assumptions that have become increasingly difficult to make in the current economic environment. These estimates and assumptions affect the reported amounts of assets and liabilities and disclosure of contingent assets and liabilities at the date of the financial statements and the reported amount of revenue and expenses during the reporting period. It is possible that the estimates we make may change in the future.
Revenue Recognition
Revenue from product sales to customers that do not have acceptance criteria, including product sales to distributors, is recognized when a written purchase order has been obtained, the product is shipped, title has transferred, no obligations remain and collectibility is reasonably assured. Generally, we ship our products with ex works terms. For any shipments with destination terms, we defer revenue until delivery to the customer. Revenue from customers who have acceptance criteria beyond our standard terms and conditions is deferred until all acceptance criteria are satisfied. Revenue for installation services, consisting of assembly and testing, and for systems shipped to integrators is also deferred. Deferred revenue related to service contracts is recognized over the life of the contract, typically one to two years. Deferred revenue for systems shipped to integrators is recognized upon shipment to the final customer.
Our transactions may involve the sale of systems and services under multiple element arrangements. Revenue under multiple element arrangements is allocated based on the fair value of each element. A typical multiple element arrangement may include some or all of the following components: products, accessories, installation services and extended warranty contracts. The total sales price is allocated based on the relative fair value of each component when sold separately.
Allowance for Doubtful Accounts
The allowance for doubtful accounts is estimated based on past collection history and known trends with current customers. Our estimates for allowance for doubtful accounts are reviewed and updated on a quarterly basis. Changes to the reserve occur based upon changes in revenue levels, associated balances in accounts receivable and estimated changes in collectability. The current economic environment has increased both the risk of bad debt and the difficulty in estimating the allowance for doubtful accounts. In the fourth quarter of 2008, we increased the allowance for doubtful accounts by $0.8 million, primarily for the specific reserve of receivables from one customer. In 2009, we had specific charges to the bad debt reserve of $61,000 and recoveries of previously reserved accounts of $69,000.
Valuation of Excess and Obsolete Inventory
We regularly analyze the value of our inventory based on a combination of factors including, but not limited to, the following: forecasted sales or usage, historical usage rates, estimated service period, product end-of-life dates, estimated current and future market values, service inventory requirements
35
Table of Contents
and new product introductions. Inventories are stated at the lower of standard cost, which approximates cost, computed on a first-in, first-out basis, or market and include materials, labor and manufacturing overhead. Inventory is reviewed for obsolescence and excess quantities on a quarterly basis, based on estimated future use of quantities on hand, which is determined based on past usage, planned changes to products and known trends in markets and technology. Because of the long-lived nature of many of our products, we maintain a supply of parts for use in future repairs and customer field service. As these service parts become older, we apply a higher write-down against the recorded balance, recognizing that the older the part, the less likely it will be used. If circumstances related to our inventories change, our estimates of the value of inventory could materially change. Inventory write-downs are recorded quarterly as a component of cost of sales.
Lives and Recoverability of Equipment and Other Long-Lived Assets
We evaluate the remaining lives and recoverability of equipment and other assets, including our intangible assets, other than goodwill, whenever events or changes in circumstances indicate that the carrying amount of the asset may not be recoverable. If there is an indication of impairment, we prepare an estimate of future, undiscounted cash flows expected to result from the use of the asset and its eventual disposition. If these cash flows are less than the carrying value of the asset, we adjust the carrying amount of the asset to its estimated fair value. Such reviews assess the fair value of the assets based upon estimates of discounted future cash flows that the assets are expected to generate. During 2008, based on the results of our testing, we recorded impairment charges of $10.2 million against purchased intangible assets and $0.1 million against patents. See Note 1 of Notes to Consolidated Financial Statements for additional information. We did not record any impairment charges for long-lived assets during 2009 or 2007.
Warranty Liabilities
Warranty costs include labor to repair the system and replacement parts for defective items, as well as other costs incidental to warranty repairs. We estimate a liability for costs to repair or replace products under warranties ranging from 90 days to one-year and technical support costs when the related product revenue is recognized. The products are sold without a right of return or price protection rights. The liability for product warranties is calculated as a percentage of sales. The percentage is based on historical actual product repair costs. Our estimated warranty costs are reviewed and updated on a quarterly basis. Changes to the reserve occur as volume, product mix and actual warranty costs fluctuate.
Deferred Tax Asset Valuation Allowance
We record deferred tax assets for the estimated future benefit of research and development tax credits, foreign tax credits, net operating loss carryforwards and other temporary differences to the extent management believes these assets will be realized. A valuation allowance is recorded when management can not reach the conclusion that it is more likely than not that the deferred tax assets will be realized. Based on this evaluation, in 2008, we recorded a $5.0 million charge to establish a full valuation allowance against our domestic deferred tax assets, and increased the valuation allowance against foreign deferred tax assets by $500,000. We continued to record a full valuation allowance against our domestic deferred tax assets and certain foreign deferred tax assets in 2009. The valuation allowance totaled $8.0 million and $7.6 million, respectively, at December 31, 2009 and 2008. At December 31, 2009, we had net deferred tax assets on our balance sheet totaling $0.2 million, primarily related to foreign jurisdictions. We may record additional valuation allowances in the future.
Uncertainty in Income Taxes
We recognize the benefits of tax return positions in our financial statements if we determine that the positions are “more-likely-than-not” to be sustained by the taxing authority. Interest and penalties accrued on unrecognized tax benefits are recorded as tax expense within our financial statements. At December 31, 2009, we had total unrecognized tax benefits of $135,000. All unrecognized tax benefits would have an impact on the effective tax rate if recognized. The interest and penalties accrued on unrecognized tax benefits were insignificant.
36
Table of Contents
Stock-Based Compensation
We recognize compensation expense for all share-based payment awards granted to our employees and directors, including stock options, restricted stock units and stock purchases related to our employee stock purchase plan, based on the estimated fair value of the award on the grant date. We use the Black-Scholes valuation model to estimate the fair value of stock option awards. The Black-Scholes model requires us to make assumptions regarding the risk-free interest rate, expected dividend yield, expected term and expected volatility over the expected term of the award. The assumptions used in calculating the fair value of share-based payment awards represent management’s best estimates, but these estimates involve inherent uncertainties and the application of expense could be materially different in the future.
Accounting Pronouncements Issued Not Yet Adopted
See Note 2 of Notes to Consolidated Financial Statements included in Item 8 of this Form 10-K for a discussion of accounting pronouncements issued not yet adopted.
Off-Balance Sheet Arrangements
We do not have any off-balance sheet arrangements that have or are reasonably likely to have a material current or future effect on our financial condition, changes in financial condition, revenue or expenses, results of operations, liquidity, capital expenditures or capital resources.
| ITEM 7A. | QUANTITATIVE AND QUALITATIVE DISCLOSURES ABOUT MARKET RISK |
Foreign Currency Exchange Risk
We sometimes attempt to mitigate our currency exposures for recorded transactions by using forward exchange contracts. The purpose of these activities is to reduce the risk that future cash flows of the underlying assets and liabilities will be adversely affected by changes in exchange rates. In some cases, we enter into forward sale or purchase contracts for foreign currencies, primarily the Japanese yen, to hedge specific receivables. As of December 31, 2009, we had contracts outstanding for the purchase of Japanese yen totaling approximately $1.7 million, which mature through June 2010. We also had one contract outstanding for the sale of euro that totaled approximately $5.7 million and matured in January 2010.
Historically, we have not attempted to mitigate the impact of foreign currency fluctuations on the remeasurement of our subsidiaries’ net assets and results of operations, nor do we enter into derivative financial instruments for speculative purposes.
Our forward exchange contracts do not qualify for hedge accounting treatment and, accordingly, gains and losses on our forward exchange contracts are recognized currently as a component of other income (expense).
Interest Rate Risk
Our exposure to market risk from changes in interest rates relates primarily to our investments. The primary objective of our investment activities is to preserve principal while maximizing yields without significantly increasing risk. This is accomplished by investing in diversified investments, consisting only of investment grade securities.
As of December 31, 2009, we held cash, cash equivalents and short-term marketable securities of $32.9 million and long-term marketable securities of $0.8 million, which consisted of floating rate corporate obligations. Based on the nature of our marketable securities, a decline in interest rates over time would reduce our interest income, but would not have a material impact on our results of operations, financial position or cash flows, as we have classified our securities as available-for-sale and, therefore, may choose to sell or hold them as changes in the market occur. A decrease in interest rates of one percent would cause a corresponding decrease in our annual interest income of approximately $0.3 million, assuming our December 31, 2009 balances remained constant. In addition, due to the nature of our highly liquid cash equivalents, a change in interest rates would not materially affect the fair market value of our cash and cash equivalents.
37
Table of Contents
| ITEM 8. | FINANCIAL STATEMENTS AND SUPPLEMENTARY DATA |
The financial statements and notes thereto required by this item begin on page F-1 of this document, as listed in Item 15 of Part IV. Unaudited quarterly financial data for each of the eight quarters in the two-year period ended December 31, 2009 was as follows:
| In thousands, except per share data |
1st Quarter | 2nd Quarter | 3rd Quarter | 4th Quarter | ||||||||||||
| 2009 |
||||||||||||||||
| Revenue |
$ | 11,469 | $ | 12,616 | $ | 13,971 | $ | 15,485 | ||||||||
| Gross profit |
3,855 | 4,781 | 5,493 | 5,572 | ||||||||||||
| Net loss |
(4,165 | ) | (1,576 | ) | (1,419 | ) | (489 | ) | ||||||||
| Basic and diluted net loss per share(1) |
(0.31 | ) | (0.12 | ) | (0.11 | ) | (0.04 | ) | ||||||||
| 2008 |
||||||||||||||||
| Revenue |
$ | 20,759 | $ | 19,287 | $ | 21,128 | $ | 15,387 | ||||||||
| Gross profit |
9,783 | 8,398 | 9,060 | 4,843 | ||||||||||||
| Net loss |
(16 | ) | (1,858 | ) | (1,291 | ) | (31,412 | ) | ||||||||
| Basic and diluted net loss per share(1) |
(0.00 | ) | (0.14 | ) | (0.10 | ) | (2.39 | ) | ||||||||
| (1) | Quarterly per share amounts may not add to yearly totals due to rounding. |
| ITEM 9. | CHANGES IN AND DISAGREEMENTS WITH ACCOUNTANTS ON ACCOUNTING AND FINANCIAL DISCLOSURE |
None.
| ITEM 9A(T). | CONTROLS AND PROCEDURES |
Management’s Report on Internal Control Over Financial Reporting
Our management is responsible for establishing and maintaining adequate internal control over financial reporting, as such term is defined in Exchange Act Rules 13a-15(f). Under the supervision and with the participation of our management, including our principal executive officer and principal financial officer, we conducted an evaluation of the effectiveness of our internal control over financial reporting based on the framework in Internal Control – Integrated Framework issued by the Committee of Sponsoring Organizations of the Treadway Commission (COSO). Based on our evaluation under this framework, our management concluded that our internal control over financial reporting was effective as of December 31, 2009.
Our independent registered public accounting firm, KPMG LLP, has issued an audit report on the effectiveness of our internal control over financial reporting as of December 31, 2009. Their report appears below.
Changes in Internal Control Over Financial Reporting
There has been no change in our internal control over financial reporting that occurred during our last fiscal quarter that has materially affected, or is reasonably likely to materially affect, our internal control over financial reporting.
38
Table of Contents
Disclosure Controls and Procedures
Our management has evaluated, under the supervision and with the participation of our Chief Executive Officer and Chief Financial Officer, the effectiveness of our disclosure controls and procedures as of the end of the period covered by this report pursuant to Rule 13a-15(b) under the Securities Exchange Act of 1934 (the “Exchange Act”). Based on that evaluation, our Chief Executive Officer and Chief Financial Officer have concluded that, as of the end of the period covered by this report, our disclosure controls and procedures are effective in ensuring that information required to be disclosed in our Exchange Act reports is (1) recorded, processed, summarized and reported in a timely manner, and (2) accumulated and communicated to our management, including our Chief Executive Officer and Chief Financial Officer, as appropriate to allow timely decisions regarding required disclosure.
Limitation on Effectiveness of Controls
Our management, including our Chief Executive Officer and Chief Financial Officer, do not expect that our disclosure controls and procedures or our internal control over financial reporting will prevent or detect all errors and all occurrences of fraud. A control system, no matter how well designed and operated, can provide only reasonable, not absolute, assurance that the objectives of the control systems are met. Further, the design of a control system must reflect the fact that there are resource constraints, and the benefits of all controls must be considered relative to their costs. Control systems can be circumvented by the individual acts of some persons, by collusion of two or more people, or by management override of the control. In addition, over time, controls may become inadequate because of changes in conditions, or the degree of compliance with the policies or procedures may deteriorate. Because of the inherent limitations in all control systems, no evaluation of controls can provide absolute assurance that the control systems will detect all control issues, including instances of fraud, if any.
39
Table of Contents
Report of Independent Registered Public Accounting Firm
The Board of Directors and Shareholders
Cascade Microtech, Inc.:
We have audited Cascade Microtech, Inc.’s (the “Company”) internal control over financial reporting as of December 31, 2009, based on criteria established in Internal Control - Integrated Framework issued by the Committee of Sponsoring Organizations of the Treadway Commission (COSO). The Company’s management is responsible for maintaining effective internal control over financial reporting and for its assessment of the effectiveness of internal control over financial reporting, included in the accompanying Management’s Report on Internal Control over Financial Reporting. Our responsibility is to express an opinion on the Company’s internal control over financial reporting based on our audit.
We conducted our audit in accordance with the standards of the Public Company Accounting Oversight Board (United States). Those standards require that we plan and perform the audit to obtain reasonable assurance about whether effective internal control over financial reporting was maintained in all material respects. Our audit included obtaining an understanding of internal control over financial reporting, assessing the risk that a material weakness exists, and testing and evaluating the design and operating effectiveness of internal control based on the assessed risk. Our audit also included performing such other procedures as we considered necessary in the circumstances. We believe that our audit provides a reasonable basis for our opinion.
A company’s internal control over financial reporting is a process designed to provide reasonable assurance regarding the reliability of financial reporting and the preparation of financial statements for external purposes in accordance with generally accepted accounting principles. A company’s internal control over financial reporting includes those policies and procedures that (1) pertain to the maintenance of records that, in reasonable detail, accurately and fairly reflect the transactions and dispositions of the assets of the company; (2) provide reasonable assurance that transactions are recorded as necessary to permit preparation of financial statements in accordance with generally accepted accounting principles, and that receipts and expenditures of the company are being made only in accordance with authorizations of management and directors of the company; and (3) provide reasonable assurance regarding prevention or timely detection of unauthorized acquisition, use, or disposition of the company’s assets that could have a material effect on the financial statements.
Because of its inherent limitations, internal control over financial reporting may not prevent or detect misstatements. Also, projections of any evaluation of effectiveness to future periods are subject to the risk that controls may become inadequate because of changes in conditions, or that the degree of compliance with the policies or procedures may deteriorate.
In our opinion, the Company maintained, in all material respects, effective internal control over financial reporting as of December 31, 2009, based on criteria established in Internal Control – Integrated Framework issued by the Committee of Sponsoring Organizations of the Treadway Commission (COSO).
We also have audited, in accordance with the standards of the Public Company Accounting Oversight Board (United States), the consolidated balance sheets of Cascade Microtech, Inc. and subsidiaries as of December 31, 2009 and 2008, and the related consolidated statements of operations, shareholders’ equity, and cash flows for each of the years in the three-year period ended December 31, 2009, and our report dated March 1, 2010 expressed an unqualified opinion on those consolidated financial statements.
| /s/ KPMG LLP |
| Portland, Oregon |
| March 1, 2010 |
40
Table of Contents
| ITEM 9B. | OTHER INFORMATION |
None.
We have incorporated by reference into Part III the information that will appear in our definitive proxy statement for our 2010 Annual Meeting of Shareholders (the “Proxy Statement”), which will be filed within 120 days after the end of our year ended December 31, 2009 pursuant to Regulation 14A.
| ITEM 10. | DIRECTORS, EXECUTIVE OFFICERS AND CORPORATE GOVERNANCE |
Information with respect to directors and executive officers is included under “Election of Directors,” “Meetings and Committees of the Board of Directors,” “Executive Officers,” “Section 16(a) Beneficial Ownership Reporting Compliance,” “Audit Committee Financial Expert” and “Code of Ethics” in our definitive proxy statement for our 2010 Annual Meeting of Shareholders and is incorporated herein by reference.
| ITEM 11. | EXECUTIVE COMPENSATION |
Information with respect to executive compensation is included under “Director Compensation” and “Executive Compensation” in our definitive proxy statement for our 2010 Annual Meeting of Shareholders and is incorporated herein by reference.
| ITEM 12. | SECURITY OWNERSHIP OF CERTAIN BENEFICIAL OWNERS AND MANAGEMENT AND RELATED STOCKHOLDER MATTERS |
Equity Compensation Plan Information
The following table summarizes equity securities authorized for issuance pursuant to compensation plans as of December 31, 2009.
| A | B | C | |||||||
| Plan Category |
Number of securities to be issued upon exercise of outstanding options, warrants and rights (1) |
Weighted average exercise price of outstanding options, warrants and rights |
Number of securities remaining available for future issuance under equity compensation plans excluding securities reflected in column A |
||||||
| Equity compensation plans approved by shareholders(3) |
897,189 | (1) | $ | 7.10 | 571,143 | (2) | |||
| Equity compensation plans not approved by shareholders(4) |
— | — | — | ||||||
| Total |
897,189 | $ | 7.10 | 571,143 | |||||
| (1) | Excludes purchase rights accruing under our 2004 Employee Stock Purchase Plan (the “Purchase Plan”) which had a shareholder approved reserve of 600,000 shares at December 31, 2009, which was increased to 700,000 shares in January 2010. Under the Purchase Plan, each eligible employee may purchase shares of our common stock at semi-annual intervals at a purchase price per share equal to 85% of the lower of (i) the fair market value of the common stock on the enrollment date for the offering period in which that semi-annual purchase date occurs or (ii) the fair market value on the semi-annual purchase date. |
| (2) | Represents 496,121 shares of common stock available for issuance under our 1993 Stock Incentive Plan and our 2000 Stock Incentive Plan combined and 75,022 shares of common stock available for purchase under our 2004 Employee Stock Purchase Plan. |
| (3) | Consists of our 1993 Stock Incentive Plan, 2000 Stock Incentive Plan and 2004 Employee Stock Purchase Plan. An additional 100,000 shares were added to the shares available for issuance pursuant to the 2004 Employee Stock Purchase Plan in January 2010. |
| (4) | We do not have any equity compensation plans or arrangements that have not been approved by shareholders. |
Additional information required by this item is included under “Security Ownership of Certain Beneficial Owners and Management” in our definitive proxy statement for our 2010 Annual Meeting of Shareholders and is incorporated herein by reference.
41
Table of Contents
| ITEM 13. | CERTAIN RELATIONSHIPS AND RELATED TRANSACTIONS, AND DIRECTOR INDEPENDENCE |
The information required by this item is included under “Certain Relationships and Related Transactions” and “Director Independence” in our definitive proxy statement for our 2010 Annual Meeting of Shareholders and is incorporated herein by reference.
| ITEM 14. | PRINCIPAL ACCOUNTANT FEES AND SERVICES |
The information required by this item is included in our Proxy Statement for our 2010 Annual Meeting of Shareholders and is incorporated herein by reference.
| ITEM 15. | EXHIBITS AND FINANCIAL STATEMENT SCHEDULES |
Financial Statements and Schedules
The Consolidated Financial Statements, together with the report thereon of KPMG LLP, are included on the pages indicated below:
Exhibits
The following exhibits are filed herewith and this list is intended to constitute the exhibit index. Exhibit numbers marked with an asterisk (*) represent management or compensatory arrangements.
| Exhibit No. |
Description | |
| 2.1 | Agreement and Plan of Merger by and among Cascade Microtech, Inc., Gryphics Acquisition Corporation and Gryphics, Inc., dated as of April 3, 2007. Incorporated by reference to our Current Report on Form 8-K filed on April 5, 2007. | |
| 3.1 | Third Amended and Restated Articles of Incorporation of Cascade Microtech, Inc. Incorporated by reference to Exhibit 3.1 to our Form 8-K filed December 23, 2004. | |
| 3.2 | Second Amended and Restated Bylaws of Cascade Microtech, Inc., as amended March 31, 2006. Incorporated by reference to Form 10-Q for the quarterly period ended March 31, 2006 and filed with the Securities and Exchange Commission on May 10, 2006. | |
| 3.3 | First Amendment to Second Amended and Restated Bylaws of Cascade Microtech, Inc. dated November 16, 2007. Incorporated by reference to our Current Report on Form 8-K filed on November 21, 2007. | |
| 4.1 | Reference is made to Exhibit 3.1 | |
| 10.1* | Form of Indemnity Agreement between Cascade Microtech, Inc. and each of its Officers and Directors. Incorporated by reference to Exhibit 10.1 to our Registration Statement on Form S-1, File No. 333-47100. | |
42
Table of Contents
| Exhibit No. |
Description | |
| 10.2* | Cascade Microtech, Inc. 1993 Stock Incentive Plan, as amended. Incorporated by reference to Exhibit 10.2 to our Registration Statement on Form S-1, File No. 333-47100. | |
| 10.3* | Cascade Microtech, Inc. 2000 Stock Incentive Plan, as amended. Incorporated by reference to Form 8-K as filed with the Securities and Exchange Commission on May 20, 2009. | |
| 10.4* | Cascade Microtech, Inc. 2004 Employee Stock Purchase Plan, as amended. Incorporated by reference to Exhibit 10.4 to our Form 10-K as filed with the Securities and Exchange Commission on March 10, 2009. | |
| 10.5* | Employment Agreement of Steven Sipowicz. Incorporated by reference to Exhibit 10.12 to our Registration Statement on Form S-1, File No. 333-113256. | |
| 10.6* | First Amendment to Executive Employment Agreement of Steven Sipowicz dated October 27, 2005. Incorporated by reference to Exhibit 10.2 to our Form 10-Q for the quarterly period ended September 30, 2005 and filed November 14, 2005. | |
| 10.7 | Lease Agreements I and II between Amberjack, Ltd. And Cascade Microtech, Inc. dated August 20, 1997, and Amendment No. 2 to Lease Agreement I dated July 23, 1998, and Amendment No. 2 to Lease Agreement II dated April 12, 1999. Incorporated by reference to Exhibit 10.9 to our Registration Statement on Form S-1, File No. 333-47100. | |
| 10.8 | Third Amendment dated August 11, 2006 to Lease Agreement I dated August 20, 1997 between Amberjack, LTD. And Cascade Microtech, Inc. Incorporated by reference to Exhibit 10.2 to our Form 10-Q for the quarterly period ended September 30, 2006 and filed November 9, 2006. | |
| 10.9 | Third Amendment dated August 11, 2006 to Lease Agreement II dated August 20, 1997 between Amberjack, LTD. And Cascade Microtech, Inc. Incorporated by reference to Exhibit 10.3 to our Form 10-Q for the quarterly period ended September 30, 2006 and filed November 9, 2006. | |
| 10.10 | Lease Agreement between Bermuda Trust (Singapore) Limited and Cascade Microtech, Inc. commencing December 12, 2003. Incorporated by reference to Exhibit 10.6 to our Registration Statement on Form S-1, File No. 333-113256. | |
| 10.11 | Patent License Agreement between Micronics Japan Co., Ltd, Hewlett Packard Japan, Ltd., and Cascade Microtech Japan, Inc. dated July 28, 1997. Incorporated by reference to Exhibit 10.14 to our Registration Statement on Form S-1, File No. 333-47100. | |
| 10.12 | Purchase Agreement between Intel Corporation and Cascade Microtech, Inc., dated April 12, 2003. Incorporated by reference to Exhibit 10.11 to our Registration Statement on Form S-1, File No. 333-113256. | |
| 10.13 | Shareholder Agreement by and among Cascade Microtech, Inc. and each of the shareholders of Gryphics, Inc. dated as of April 3, 2007. Incorporated by reference to our Current Report on Form 8-K filed on April 5, 2007. | |
| 10.14 | Lease Agreement Between Minnesota Industrial Properties Limited Partnership and Cascade Microtech, Inc. dated as of February 6, 2009. Incorporated by reference to Exhibit 10.1 to our Form 10-Q for the quarterly period ended March 31, 2009 and filed May 6, 2009. | |
| 10.15 | First Amendment of Lease Between Minnesota Industrial Properties Limited Partnership and Cascade Microtech, Inc. dated as of March 19, 2009. Incorporated by reference to Exhibit 10.2 to our Form 10-Q for the quarterly period ended March 31, 2009 and filed May 6, 2009. | |
| 10.16 | Sale and Purchase Agreement dated as of January 27, 2010 by and among Cascade Microtech, Inc., Cascade Microtech KK, SUSS MicroTec AG, SUSS MicroTec KK, and SUSS MicroTec Inc. Incorporated by reference to Exhibit 10.1 to Form 8-K filed on January 28, 2010. | |
| 14 | Code of Ethics. Incorporated by reference to Exhibit 14 to our Form 10-K for the year ended December 31, 2004 and filed March 29, 2005. | |
| 21 | List of Subsidiaries. | |
| 23 | Consent of KPMG LLP | |
| 31.1 | Certification of Chief Executive Officer pursuant to Rule 13a-14(a) or Rule 15d-14(a) of the Securities Exchange Act of 1934. | |
| 31.2 | Certification of Chief Financial Officer pursuant to Rule 13a-14(a) or Rule 15d-14(a) of the Securities Exchange Act of 1934. | |
| 32.1 | Certification of Chief Executive Officer pursuant to Rule 13a-14(b) or Rule 15d-14(b) of the Securities Exchange Act of 1934 and 18 U.S.C. Section 1350. | |
| 32.2 | Certification of Chief Executive Officer pursuant to Rule 13a-14(b) or Rule 15d-14(b) of the Securities Exchange Act of 1934 and 18 U.S.C. Section 1350. | |
43
Table of Contents
Pursuant to the requirements of Section 13 or 15(d) of the Securities Exchange Act of 1934, Cascade Microtech, Inc. has duly caused this report to be signed on its behalf by the undersigned, thereunto duly authorized on March 1, 2010:
| CASCADE MICROTECH, INC. | ||
| (Registrant) | ||
| By: | /s/ F. PAUL CARLSON | |
| F. Paul Carlson | ||
| Chairman of the Board and Chief Executive Officer | ||
| (Principal Executive Officer) | ||
Pursuant to the request of the Securities Exchange Act of 1934, this report has been signed below on behalf of the Registrant and in the capacities indicated on March 1, 2010.
| SIGNATURE |
TITLE | |||
| /s/ F. PAUL CARLSON |
Chairman of the Board and Chief Executive Officer | |||
| F. Paul Carlson | (Principal Executive Officer) | |||
| /s/ STEVEN SIPOWICZ |
Chief Financial Officer and Treasurer | |||
| Steven Sipowicz | (Principal Financial and Accounting Officer) | |||
| /s/ ERIC W. STRID |
Director and Chief Technical Officer | |||
| Eric W. Strid | ||||
| /s/ KEITH BARNES |
Director | |||
| Keith Barnes | ||||
| /s/ GEORGE P. O’LEARY |
Director | |||
| George P. O’Leary | ||||
| /s/ WILLIAM R. SPIVEY |
Director | |||
| William R. Spivey | ||||
| /s/ RAYMOND A. LINK |
Director | |||
| Raymond A. Link | ||||
44
Table of Contents
Report of Independent Registered Public Accounting Firm
The Board of Directors and Shareholders
Cascade Microtech, Inc.:
We have audited the accompanying consolidated balance sheets of Cascade Microtech, Inc. and subsidiaries (the “Company”) as of December 31, 2009 and 2008, and the related consolidated statements of operations, shareholders’ equity, and cash flows for each of the years in the three-year period ended December 31, 2009. In connection with our audits of the consolidated financial statements, we also have audited the accompanying consolidated financial statement schedule. These consolidated financial statements and financial statement schedule are the responsibility of the Company’s management. Our responsibility is to express an opinion on these consolidated financial statements and financial statement schedule based on our audits.
We conducted our audits in accordance with the standards of the Public Company Accounting Oversight Board (United States). Those standards require that we plan and perform the audit to obtain reasonable assurance about whether the financial statements are free of material misstatement. An audit includes examining, on a test basis, evidence supporting the amounts and disclosures in the financial statements. An audit also includes assessing the accounting principles used and significant estimates made by management, as well as evaluating the overall financial statement presentation. We believe that our audits provide a reasonable basis for our opinion.
In our opinion, the consolidated financial statements referred to above present fairly, in all material respects, the financial position of Cascade Microtech, Inc. and subsidiaries as of December 31, 2009 and 2008, and the results of their operations and their cash flows for each of the years in the three-year period ended December 31, 2009, in conformity with U.S. generally accepted accounting principles. Also, in our opinion, the related financial statement schedule, when considered in relation to the basic consolidated financial statements taken as a whole, presents fairly, in all material respects, the information set forth therein.
We also have audited, in accordance with the standards of the Public Company Accounting Oversight Board (United States), the Company’s internal control over financial reporting as of December 31, 2009, based on criteria established in Internal Control – Integrated Framework issued by the Committee of Sponsoring Organizations of the Treadway Commission (COSO), and our report dated March 1, 2010 expressed an unqualified opinion on the effectiveness of the Company’s internal control over financial reporting.
/s/ KPMG LLP
Portland, Oregon
March 1, 2010
F-1
Table of Contents
Consolidated Balance Sheets
(In thousands, except share par value)
| December 31, | ||||||||
| 2009 | 2008 | |||||||
| Assets |
||||||||
| Current Assets: |
||||||||
| Cash and cash equivalents |
$ | 19,471 | $ | 3,750 | ||||
| Short-term marketable securities |
13,383 | 28,795 | ||||||
| Accounts receivable, net of allowances of $974 and $1,029 |
10,877 | 12,801 | ||||||
| Inventories |
16,624 | 19,079 | ||||||
| Prepaid expenses and other |
763 | 1,367 | ||||||
| Taxes receivable |
2,589 | 1,003 | ||||||
| Deferred income taxes |
13 | 99 | ||||||
| Assets held for sale |
— | 400 | ||||||
| Total Current Assets |
63,720 | 67,294 | ||||||
| Long-term marketable securities |
750 | 2,465 | ||||||
| Fixed assets, net of accumulated depreciation of $17,775 and $14,769 |
12,010 | 13,580 | ||||||
| Purchased intangible assets, net of accumulated amortization of $1,733 and $1,166 |
1,858 | 2,425 | ||||||
| Deferred income taxes |
220 | 237 | ||||||
| Other assets, net of accumulated amortization of $3,094 and $3,397 |
2,386 | 2,455 | ||||||
| Total Assets |
$ | 80,944 | $ | 88,456 | ||||
| Liabilities and Shareholders’ Equity |
||||||||
| Current Liabilities: |
||||||||
| Current portion of capital leases |
$ | 11 | $ | 19 | ||||
| Accounts payable |
3,765 | 4,110 | ||||||
| Deferred revenue |
1,071 | 1,120 | ||||||
| Accrued liabilities |
2,087 | 3,776 | ||||||
| Total Current Liabilities |
6,934 | 9,025 | ||||||
| Capital leases, net of current portion |
29 | 62 | ||||||
| Deferred revenue |
56 | 313 | ||||||
| Other long-term liabilities |
2,540 | 2,356 | ||||||
| Total Liabilities |
9,559 | 11,756 | ||||||
| Shareholders’ Equity: |
||||||||
| Common stock, $0.01 par value. Authorized 100,000 shares; issued and outstanding: 13,459 and 13,164 |
135 | 132 | ||||||
| Additional paid-in capital |
85,584 | 83,213 | ||||||
| Accumulated other comprehensive income |
29 | 69 | ||||||
| Accumulated deficit |
(14,363 | ) | (6,714 | ) | ||||
| Total Shareholders’ Equity |
71,385 | 76,700 | ||||||
| Total Liabilities and Shareholders’ Equity |
$ | 80,944 | $ | 88,456 | ||||
See accompanying Notes to Consolidated Financial Statements.
F-2
Table of Contents
Consolidated Statements of Operations
(In thousands, except per share amounts)
| For the Year Ended December 31, | ||||||||||||
| 2009 | 2008 | 2007 | ||||||||||
| Revenue |
$ | 53,541 | $ | 76,561 | $ | 89,922 | ||||||
| Cost of sales |
33,840 | 44,477 | 48,801 | |||||||||
| Gross profit |
19,701 | 32,084 | 41,121 | |||||||||
| Operating expenses: |
||||||||||||
| Research and development |
8,372 | 10,473 | 11,241 | |||||||||
| Selling, general and administrative |
21,724 | 29,311 | 27,723 | |||||||||
| Amortization of purchased intangibles |
567 | 2,461 | 1,977 | |||||||||
| Asset impairment charges |
— | 27,701 | — | |||||||||
| 30,663 | 69,946 | 40,941 | ||||||||||
| Income (loss) from operations |
(10,962 | ) | (37,862 | ) | 180 | |||||||
| Other income (expense): |
||||||||||||
| Interest income, net |
314 | 862 | 1,455 | |||||||||
| Other, net |
93 | 176 | (119 | ) | ||||||||
| 407 | 1,038 | 1,336 | ||||||||||
| Income (loss) before income taxes |
(10,555 | ) | (36,824 | ) | 1,516 | |||||||
| Income tax expense (benefit) |
(2,906 | ) | (2,247 | ) | 586 | |||||||
| Net income (loss) |
$ | (7,649 | ) | $ | (34,577 | ) | $ | 930 | ||||
| Basic net income (loss) per share |
$ | (0.57 | ) | $ | (2.65 | ) | $ | 0.07 | ||||
| Diluted net income (loss) per share |
$ | (0.57 | ) | $ | (2.65 | ) | $ | 0.07 | ||||
| Shares used in per share calculations: |
||||||||||||
| Basic |
13,319 | 13,071 | 12,550 | |||||||||
| Diluted |
13,319 | 13,071 | 12,840 | |||||||||
See accompanying Notes to Consolidated Financial Statements.
F-3
Table of Contents
Consolidated Statements of Shareholders’ Equity for The Years Ended December 31, 2009, 2008 and 2007
(In thousands)
| Common Stock | Additional Paid-In Capital |
Accumulated Other Comprehensive Income (Loss) |
Retained Earnings (Deficit) |
Total Shareholders’ Equity |
|||||||||||||||||
| Shares | Amount | ||||||||||||||||||||
| Balance at December 31, 2006 |
11,717 | $ | 117 | $ | 63,144 | $ | (1 | ) | $ | 26,933 | $ | 90,193 | |||||||||
| Common stock issued pursuant to stock plans |
318 | 3 | 1,986 | — | — | 1,989 | |||||||||||||||
| Common stock issued for acquisition |
843 | 9 | 11,950 | — | — | 11,959 | |||||||||||||||
| Stock-based compensation |
— | — | 2,346 | — | — | 2,346 | |||||||||||||||
| Tax benefit related to stock options |
— | — | 142 | — | — | 142 | |||||||||||||||
| Unrealized holding gain on investments |
— | — | — | 46 | — | 46 | |||||||||||||||
| Net income |
— | — | — | — | 930 | 930 | |||||||||||||||
| Balance at December 31, 2007 |
12,878 | 129 | 79,568 | 45 | 27,863 | 107,605 | |||||||||||||||
| Common stock issued pursuant to stock plans |
286 | 3 | 1,395 | — | — | 1,398 | |||||||||||||||
| Value of vested restricted stock withheld for tax liability |
— | — | (59 | ) | — | — | (59 | ) | |||||||||||||
| Stock-based compensation |
— | — | 2,531 | — | — | 2,531 | |||||||||||||||
| Reversal of tax benefit related to stock options |
— | — | (222 | ) | — | — | (222 | ) | |||||||||||||
| Unrealized holding gain on investments |
— | — | — | 24 | — | 24 | |||||||||||||||
| Net loss |
— | — | — | — | (34,577 | ) | (34,577 | ) | |||||||||||||
| Balance at December 31, 2008 |
13,164 | 132 | 83,213 | 69 | (6,714 | ) | 76,700 | ||||||||||||||
| Common stock issued pursuant to stock plans |
295 | 3 | 546 | — | — | 549 | |||||||||||||||
| Value of vested restricted stock withheld for tax liability |
— | — | (161 | ) | — | — | (161 | ) | |||||||||||||
| Stock-based compensation |
— | — | 1,870 | — | — | 1,870 | |||||||||||||||
| Tax benefit related to stock options |
— | — | 116 | — | — | 116 | |||||||||||||||
| Unrealized holding loss on investments |
— | — | — | (40 | ) | — | (40 | ) | |||||||||||||
| Net loss |
— | — | — | — | (7,649 | ) | (7,649 | ) | |||||||||||||
| Balance at December 31, 2009 |
13,459 | $ | 135 | $ | 85,584 | $ | 29 | $ | (14,363 | ) | $ | 71,385 | |||||||||
See accompanying Notes to Consolidated Financial Statements.
F-4
Table of Contents
Consolidated Statements of Cash Flows
(In thousands)
| For the Year Ended December 31, | ||||||||||||
| 2009 | 2008 | 2007 | ||||||||||
| Cash flows from operating activities: |
||||||||||||
| Net income (loss) |
$ | (7,649 | ) | $ | (34,577 | ) | $ | 930 | ||||
| Adjustments to reconcile net income (loss) to net cash flows provided by (used in) operating activities, net of acquisitions: |
||||||||||||
| Depreciation and amortization |
4,348 | 5,867 | 4,688 | |||||||||
| Stock-based compensation, net |
1,870 | 2,531 | 2,346 | |||||||||
| Impairment charges |
— | 27,701 | — | |||||||||
| Loss on disposal of long-lived assets |
4 | 523 | 100 | |||||||||
| Loss on disposal of assets held for sale |
40 | 15 | — | |||||||||
| Deferred income taxes |
103 | (721 | ) | (1,457 | ) | |||||||
| (Increase) decrease, net of acquisitions, in: |
||||||||||||
| Accounts receivable, net |
1,924 | 5,394 | 441 | |||||||||
| Inventories |
2,455 | (471 | ) | (2,899 | ) | |||||||
| Income taxes receivable |
(1,586 | ) | (1,003 | ) | — | |||||||
| Prepaid expenses and other |
530 | 471 | 349 | |||||||||
| Increase (decrease), net of acquisitions, in: |
||||||||||||
| Accounts payable |
(345 | ) | (48 | ) | (2,251 | ) | ||||||
| Deferred revenue |
(306 | ) | (150 | ) | 200 | |||||||
| Accrued and other long-term liabilities |
(1,530 | ) | (1,625 | ) | 1,560 | |||||||
| Net cash provided by (used in) operating activities |
(142 | ) | 3,907 | 4,007 | ||||||||
| Cash flows from investing activities: |
||||||||||||
| Purchase of marketable securities |
(20,328 | ) | (47,483 | ) | (23,726 | ) | ||||||
| Proceeds from sale of marketable securities |
37,415 | 45,604 | 42,611 | |||||||||
| Purchase of fixed assets |
(1,768 | ) | (2,708 | ) | (9,440 | ) | ||||||
| Proceeds from sale of fixed assets and assets held for sale |
376 | 296 | 7 | |||||||||
| Investment in patents and other assets |
(315 | ) | (772 | ) | (1,042 | ) | ||||||
| Cash paid for acquisitions, net of cash acquired |
— | (1,096 | ) | (14,905 | ) | |||||||
| Net cash provided by (used in) investing activities |
15,380 | (6,159 | ) | (6,495 | ) | |||||||
| Cash flows from financing activities: |
||||||||||||
| Principal payments on capital lease obligations |
(21 | ) | (15 | ) | (3 | ) | ||||||
| Excess (reversal of) tax benefits related to stock options |
116 | (222 | ) | 142 | ||||||||
| Withholding taxes paid on net settlement of vested restricted stock units |
(161 | ) | (59 | ) | — | |||||||
| Proceeds from issuances of common stock |
549 | 1,398 | 1,989 | |||||||||
| Net cash provided by financing activities |
483 | 1,102 | 2,128 | |||||||||
| Increase (decrease) in cash and cash equivalents |
15,721 | (1,150 | ) | (360 | ) | |||||||
| Cash and cash equivalents: |
||||||||||||
| Beginning of year |
3,750 | 4,900 | 5,260 | |||||||||
| End of year |
$ | 19,471 | $ | 3,750 | $ | 4,900 | ||||||
| Supplemental disclosure of cash flow information: |
||||||||||||
| Cash paid for interest |
$ | 1 | $ | 2 | $ | 2 | ||||||
| Refunds received for income taxes, net |
1,626 | 1,176 | 1,425 | |||||||||
| Supplemental disclosure of non-cash information: |
||||||||||||
| Common stock issued in connection with Gryphics acquisition |
$ | — | $ | — | $ | 11,959 | ||||||
| Assets acquired with acquisitions |
— | — | 16,921 | |||||||||
| Liabilities acquired with acquisitions |
— | — | 4,962 | |||||||||
| Accrual of additional acquisition payment |
— | — | 1,000 | |||||||||
| Equipment acquired with capital lease |
— | 32 | 67 | |||||||||
| Increase in asset retirement obligation |
25 | — | — | |||||||||
See accompanying Notes to Consolidated Financial Statements.
F-5
Table of Contents
Notes to Consolidated Financial Statements
NOTE 1. SUMMARY OF SIGNIFICANT ACCOUNTING POLICIES
Nature of Business
We design, develop and manufacture advanced wafer probing and test socket solutions for the electrical measurement and testing of high performance chips. We design, manufacture and assemble our products in Oregon and Minnesota, with global sales, service and support centers in North America, Germany, Japan, Taiwan, China and Singapore.
Principles of Consolidation
The consolidated financial statements include the accounts of Cascade Microtech, Inc. and its wholly owned subsidiaries. All intercompany accounts and transactions have been eliminated.
The functional currency of our foreign subsidiaries is the U.S. dollar. Nonmonetary balance sheet items are remeasured at historical rates and monetary balance sheet items are remeasured at current rates. Exchange gains and losses from remeasurement of monetary assets and liabilities are recognized currently in our consolidated statements of operations.
Use of Estimates in Financial Reporting
The preparation of financial statements in conformity with U.S. generally accepted accounting principles requires management to make estimates and assumptions that have become increasingly difficult to make in the current economic environment. These estimates and assumptions affect the reported amounts of assets and liabilities and disclosure of contingent assets and liabilities at the date of the financial statements, as well as revenues and expenses reported for the periods presented. On an on-going basis, we evaluate our estimates, including those related to revenue recognition, allowance for doubtful accounts, valuation of excess and obsolete inventory, lives and recoverability of equipment and other long-lived assets, warranty liabilities, deferred tax asset valuation allowance, unrecognized tax benefits, stock-based compensation, contingencies and litigation. We base our estimates on historical experience and on various other assumptions that are believed to be reasonable under the circumstances, the results of which form the basis for making judgments about the carrying values of assets and liabilities that are not readily apparent from other sources. Actual results may differ from these estimates under different assumptions or conditions.
Cash and Cash Equivalents
Included in cash and cash equivalents were cash equivalents of $15.0 million and $76,000 at December 31, 2009 and 2008, respectively, which consisted of money market funds, and are stated at cost, which approximates market value. We consider all highly liquid investments with an original maturity of three months or less to be cash equivalents. Our cash balances with financial institutions may exceed the deposit insurance limits.
Marketable Securities
We classify our marketable securities as available-for-sale and, accordingly, record them at current market value. Unrealized holding gains and losses are excluded from earnings and are reported as a separate component of shareholders’ equity until realized. Dividend and interest income is recognized when earned. Realized gains and losses are included in earnings and are derived using the specific identification method for determining the cost of securities sold.
We periodically evaluate whether declines in fair values of our investments below their cost are “other-than-temporary.” This evaluation consists of qualitative and quantitative factors regarding the severity and duration of the unrealized loss, as well as our ability and intent to hold the investment until a forecasted recovery occurs.
F-6
Table of Contents
Trade Accounts Receivable
Trade accounts receivable are recorded at their invoiced amount and do not bear interest. The allowance for doubtful accounts is our best estimate of the amount of probable credit losses in our existing accounts receivable. We determine our allowance for doubtful accounts utilizing historical collection percentages considering the aging of the accounts and known trends with current customers, including recent significant changes in their financial position.
Charges to the allowance for doubtful accounts totaled $61,000, $828,000 and $67,000, respectively, in 2009, 2008 and 2007. Bad debt recoveries were insignificant in 2009, 2008 and 2007. The allowance for doubtful accounts totaled $1.0 million at December 31, 2009 and 2008. The allowance for doubtful accounts at December 31, 2009 and 2008 included a specific reserve of $766,000 for one customer that was recorded in the fourth quarter of 2008.
Inventories
Inventories are stated at the lower of standard cost, which approximates cost computed on a first-in, first-out basis, or market, and include materials, labor and manufacturing overhead. Demonstration goods, which are included as a component of finished goods, represent inventory that is used for customer demonstration purposes. This inventory is typically sold after 12 to 18 months. We analyze the carrying value of our inventory quarterly, considering a combination of factors including, but not limited to, the following: forecasted sales or usage, historical usage rates, estimated service period, product end-of-life dates, estimated current and future market values, service inventory requirements and new product introductions. We estimate market value based on factors including, but not limited to, replacement cost and estimated resale value. Inventory reserve charges totaled $854,000, $827,000 and $519,000, respectively, in 2009, 2008 and 2007.
Fair Value of Financial Instruments
The carrying value of cash and cash equivalents, accounts receivable, accounts payable and accrued liabilities approximate fair value due to their short maturities.
Fixed Assets
Equipment and leasehold improvements are stated at cost. Equipment under capital lease is recorded at the net present value of the future minimum lease payments at the inception of the lease. Maintenance and repairs are expensed as incurred. We do not accrue for the future cost of periodic major overhauls and planned maintenance of plant and equipment in annual or interim periods. Depreciation of owned equipment is provided using the straight-line method over the estimated useful lives of the assets, ranging from two to seven years. Amortization of equipment under capital leases and leasehold improvements is provided using the straight-line method over the life of the lease or the useful life of the asset, whichever is shorter. Fixed assets are reviewed for impairment as discussed below under “Accounting for the Impairment of Long-Lived Assets.” We did not capitalize any interest during 2009, 2008 or 2007.
Goodwill
All of our goodwill was written off in the fourth quarter of 2008 based on the results of our annual review of goodwill impairment, which indicated that the implied fair value of our identified reporting units was less than their carrying value at December 31, 2008. Accordingly, we recorded an impairment charge of $17.4 million in the fourth quarter of 2008 and, as of December 31, 2009 and 2008, we had no goodwill recorded on our balance sheet.
Purchased Intangible Assets
Purchased intangible assets include various intangible assets acquired through business acquisitions. These assets are amortized using the straight-line method over their estimated useful lives of one to ten years. Purchased intangible assets are reviewed for impairment as discussed below under “Accounting for the Impairment of Long-Lived Assets.”
F-7
Table of Contents
Other Assets
Other long-term assets at December 31, 2009 and 2008 included $1.9 million and $2.0 million, respectively, of internally developed patents. These assets are amortized using the straight-line method over estimated useful lives of one to eight years and have no significant residual value. Patents are reviewed for impairment as discussed below under “Accounting for the Impairment of Long-Lived Assets.”
Accounting for the Impairment of Long-Lived Assets
Long-lived assets held and used by us, including fixed assets, patents and intangible assets with determinable lives are reviewed for impairment whenever events or circumstances indicate that the carrying amount of assets may not be recoverable. We evaluate recoverability of assets to be held and used by comparing the carrying amount of an asset to future net undiscounted cash flows to be generated by the asset. If such assets are considered not to be recoverable, an impairment charge is recognized for the amount by which the carrying value of the assets exceeds the fair value of the assets. Such reviews assess the fair value of the assets based upon estimates of discounted future cash flows that the assets are expected to generate. In the fourth quarter of 2008, we performed our review of asset impairment and recorded a $10.2 million impairment charge against the purchased intangibles assets of Gryphics, Inc. and a $0.1 million impairment charge against our patents. Total asset impairment charges in 2008 were $27.7 million as follows (in thousands):
| Year Ended December 31, |
2008 | ||
| Goodwill |
$ | 17,406 | |
| Purchased intangible assets |
10,157 | ||
| Patents |
138 | ||
| $ | 27,701 | ||
We did not record any impairment charges during 2009 or 2007.
Revenue Recognition
We sell our products to the end-user through distributors, manufacturers’ representatives and integrators:
| • | distributors purchase our products directly from us and pay us directly according to our standard terms and conditions. They then resell the products to end users at prices and terms set by them; |
| • | manufacturers’ representatives are independent companies that agree to sell our products at our prices and on our terms and they are paid a commission based on a percentage of their sales of our products; and |
| • | integrators design and assemble application specific measurement solutions consisting of products from two or more companies. They typically do not purchase our products directly from us. The end user is billed directly and is liable to us for the purchase of the products. The integrator is paid a fee by the end user. |
Revenue from product sales to customers and distributors that do not have special acceptance criteria is recognized when a written purchase order has been obtained, the price is fixed and determinable, the product is shipped, title has transferred and collectibility is reasonably assured. Generally, we ship our products with ex works terms. For any shipments with destination terms, we defer revenue until delivery to the customer. Revenue from customers who have special acceptance criteria is not recognized until all acceptance criteria are satisfied. Revenue for installation services, consisting of assembly and testing, is recognized when the services are performed.
Our transactions may involve the sale of systems and services under multiple element arrangements. A typical multiple element arrangement may include some or all of the following: products, accessories, installation services or extended warranty contracts. For any arrangements with multiple elements, we recognize revenue only after we have determined that elements with stand-alone value have been delivered to customers and any undelivered elements have objective and reliable evidence of fair value.
F-8
Table of Contents
We record deferred revenue for service contracts and for custom engineering probe stations and other systems requiring special acceptance criteria from the customer. Deferred revenue related to service contracts is recognized over the life of the contract, typically one to two years. For systems shipped to integrators, no revenue is recognized until shipment to the end user. Deferred revenue related to shipped systems requiring acceptance by the customer is recognized upon receipt of such acceptance.
Sales Returns
Customers may return standard products for any reason within 30 days after delivery, provided that the return is received in its original condition, including all packing materials, for a refund, less a stocking charge. Custom products are non-refundable unless agreed to in writing by us. For certain products, we also provide for a credit against the purchase of future products. We recognize revenue for products with a right of return in accordance with the revenue recognition policies discussed above. Historically, sales returns have not been significant.
Shipping and Handling Costs
Shipping and handling costs are included as a component of cost of sales.
Significant Customers
No customer in 2009, 2008 or 2007 accounted for 10% or more of our total revenues. At December 31, 2009, two customers represented 7.9% and 7.3% of our gross accounts receivable balance. No other customers represented more than 5% of our gross accounts receivable balance except for the balance of one customer that we have fully reserved at December 31, 2009 and 2008.
Product Warranty
We estimate a liability for costs to repair or replace products under warranty for a period of approximately twelve months when the related product revenue is recognized. The products are sold without a right of return or price protection rights. The liability for product warranties is calculated as a percentage of sales. The percentage is based on historical actual product repair costs. The liability for product warranties is included in accrued liabilities on our consolidated balance sheet. Product warranty activity was as follows (in thousands):
| Warranty accrual, December 31, 2006 |
$ | 536 | ||
| Reductions for warranty charges |
(672 | ) | ||
| Additions to warranty reserve |
637 | |||
| Warranty accrual, December 31, 2007 |
501 | |||
| Reductions for warranty charges |
(728 | ) | ||
| Additions to warranty reserve |
540 | |||
| Warranty accrual, December 31, 2008 |
313 | |||
| Reductions for warranty charges |
(489 | ) | ||
| Additions to warranty reserve |
453 | |||
| Warranty accrual, December 31, 2009 |
$ | 277 | ||
Advertising
Advertising costs, which are included as a component of selling, general and administrative expense, are expensed as incurred and totaled $64,000, $172,000 and $251,000 in 2009, 2008 and 2007, respectively.
Research and Development
Research and development costs are expensed as incurred.
Forward Exchange Contracts
At times, we enter into forward foreign currency exchange contracts, which typically expire within six months, to manage our exposure against foreign currency fluctuations on purchases and sales denominated in either the euro or Japanese yen. These foreign exchange contracts are not considered hedges and, as such, are recorded at fair value on the balance sheet with any changes in fair value included as other income (expense), net on our statements of operations. At December 31, 2009 and 2008, we had $7.4 million and $1.2 million, respectively, of forward exchange contracts outstanding. The unrealized gain (loss) on contracts outstanding at December 31, 2009 and 2008 was $49,000 and $(118,000), respectively.
F-9
Table of Contents
Income Taxes
Deferred income taxes are established for the difference between the financial reporting and income tax basis of assets and liabilities as well as operating loss and tax credit carryforwards. Deferred tax assets are reduced by a valuation allowance when, in the opinion of management, it is more likely than not that some portion of the deferred tax assets will not be realized. Deferred tax assets and liabilities are measured using enacted tax rates expected to apply to taxable income in the years in which those temporary differences are expected to be recovered or settled. The effect on deferred taxes of a change in tax rates is recognized in income in the period that includes the enactment date.
During the fourth quarter of 2008, based on current and expected future financial performance, we determined that our deferred tax assets were not “more likely than not” to be recognized in future periods and we recorded a $5.5 million charge to increase the valuation allowance to $7.6 million. Net deferred tax assets totaled $233,000 and $336,000, respectively, at December 31, 2009 and 2008.
We recognize the benefits of tax return positions when it is determined that the positions are “more-likely-than-not” to be sustained by the taxing authority. Interest and penalties accrued on unrecognized tax benefits are recorded as tax expense in the period incurred. At December 31, 2009, we had total unrecognized tax benefits of $135,000. All unrecognized tax benefits would have an impact on the effective tax rate if recognized. The interest and penalties accrued on unrecognized tax benefits were insignificant.
Taxes Collected from Customers and Remitted to Governmental Authorities
We account for tax assessed by a governmental authority that is directly imposed on a revenue-producing transaction (i.e., sales, use, value added) on a net (excluded from revenue) basis.
Net Income (Loss) Per Share
Basic net income (loss) per share is computed by dividing the net income or loss attributed to common shareholders for the period by the weighted average number of shares of common stock outstanding during the period. Diluted net income (loss) per share incorporates the incremental shares issuable upon the assumed exercise of stock options and vesting of restricted stock units using the treasury stock method, if dilutive.
The following table reconciles the shares used in calculating basic net income (loss) per share to the shares used in calculating diluted net income (loss) per share (in thousands):
| Year Ended December 31, |
2009 | 2008 | 2007 | |||
| Shares used to calculate basic net income (loss) per share |
13,319 | 13,071 | 12,550 | |||
| Dilutive effect of outstanding stock options and restricted stock units |
— | — | 290 | |||
| Shares used to calculate diluted net income (loss) per share |
13,319 | 13,071 | 12,840 | |||
| Stock options and restricted stock units not considered as they would have been antidilutive |
1,396 | 1,545 | 871 | |||
Stock-Based Compensation
We calculate stock-based compensation expense utilizing fair value-based methodologies and recognize the expense over the vesting period of such awards. Compensation expense recorded for awards that do not vest is reversed in the period that it is determined that the award will not vest.
F-10
Table of Contents
Comprehensive Income (Loss)
Comprehensive income (loss) is defined as changes in shareholders’ equity exclusive of transactions with owners, such as capital contributions and dividends. Unrealized holding gains and losses on our available-for-sale marketable securities are included as a separate component of shareholders’ equity until realized. The differences between net income (loss) and comprehensive income (loss) for the periods presented are not material.
Reclassifications
Certain reclassifications have been made to the prior period financial statements to conform with the current period presentation.
Certain Risks and Uncertainties
Our future operating results and financial condition are subject to influences driven by rapid technological changes, a highly competitive industry, a lengthy sales cycle, and the cyclical nature of general economic conditions. Future operating results will depend on many factors, including demand for our products, the introduction and industry acceptance of new products and the level and timing of available shippable orders and backlog.
In addition, we rely on several suppliers to provide certain key components used in our products. Some of these items are available from only one supplier or a limited group of suppliers. Any disruption in the availability and delivery of these items could adversely affect our revenues and results of operations.
Segment Reporting
We operate in two business segments: Systems and Probes and Sockets. Sales of our engineering probe stations are included in the Systems segment and sales of our engineering probes, production probe cards and test sockets are included in the Probes and Sockets segment.
NOTE 2. ACCOUNTING PRONOUNCEMENTS ISSUED NOT YET ADOPTED
Codification
Effective July 1, 2009, the Financial Accounting Standards Board’s (“FASB”) Accounting Standards Codification (“ASC”) became the single official source of authoritative, nongovernmental generally accepted accounting principles (“GAAP”) in the United States. The historical GAAP hierarchy was eliminated and the ASC became the only level of authoritative GAAP, other than guidance issued by the Securities and Exchange Commission. Our accounting policies were not affected by the conversion to ASC.
ASU 2010-06
Accounting Standards Update (“ASU”) 2010-06, “Improving Disclosures about Fair Value Measurements,” requires new disclosures about recurring or nonrecurring fair-value measurements including significant transfers into or out of Level 1 and Level 2 fair-value classifications. It also requires information on purchases, sales, issuances and settlements on a gross basis in the reconciliation of Level 3 fair-value assets and liabilities. These disclosures are required for fiscal years beginning on or after December 15, 2009. The ASU also clarifies existing fair-value measurement disclosure guidance about the level of disaggregation, inputs and valuation techniques, which are required to be implemented in fiscal years beginning on or after December 15, 2010. Since the requirements of this ASU only relate to disclosure, the adoption of the guidance will not have any effect on our financial position, results of operations or cash flows.
F-11
Table of Contents
ASU 2009-14
ASU 2009-14, “Certain Revenue Arrangements that Include Software Elements,” amends ASC Subtopic 985-605, “Software-Revenue Recognition,” to exclude from its scope tangible products that contain both software and non-software components that function together to deliver a product’s essential functionality. The ASU is effective prospectively for revenue arrangements entered into or materially modified in fiscal years beginning on or after June 15, 2010. Early adoption is permitted. If a company elects early adoption and the period of adoption is not the beginning of its fiscal year, the requirements must be applied retrospectively to the beginning of the fiscal year. While we are still analyzing the effects of the adoption of ASU 2009-13, we do not believe that the adoption of ASU 2009-13 will have a material effect on our financial position, results of operations or cash flows.
ASU 2009-13
ASU 2009-13, “Multiple-Delivered Revenue Arrangements,” amends ASC Subtopic 650-25, “Revenue Recognition – Multiple Element Arrangements,” to eliminate the requirement that all undelivered elements have vendor-specific objective evidence (“VSOE”) or third-party evidence (“TPE”) before an entity can recognize the portion of an overall arrangement fee that is attributable to items that already have been delivered. In the absence of VSOE or TPE of fair value for one or more delivered or undelivered elements in a multiple element arrangement, entities will be required to estimate the selling prices of those elements. The overall arrangement fee will be allocated to each element (both delivered and undelivered items) based on their relevant selling prices, regardless of whether those selling prices are evidenced by VSOE or TPE or are based on the entity’s estimated selling price. Upon adoption, application of the “residual method” will no longer be permitted and entities will be required to disclose more information about their multiple-element revenue arrangements. The ASU is effective prospectively for revenue arrangements entered into or materially modified in fiscal years beginning on or after June 15, 2010. Early adoption is permitted. If a company elects early adoption and the period of adoption is not the beginning of its fiscal year, the requirements must be applied retrospectively to the beginning of the fiscal year. While we are still analyzing the effects of the adoption of ASU 2009-13, we do not believe that the adoption of ASU 2009-13 will have a material effect on our financial position, results of operations or cash flows.
ASU 2009-05
ASU 2009-05, “Fair Value Measurements and Disclosures (Topic 820) – Measuring Liabilities at Fair Value,” amends ASC Topic 820, “Fair Value Measurements,” to allow companies determining the fair value of a liability to use the perspective of an investor that holds the related obligation as an asset. The new guidance is effective for interim and annual periods beginning after August 27, 2009, and applies to all fair-value measurements of liabilities required by GAAP. No new fair-value measurements are required. We do not believe that the adoption of this ASU will have a material effect on our financial position, results of operations or cash flows.
SFAS No. 166
SFAS No. 166, “Accounting for Transfers of Financial Assets, an Amendment of FASB Statement No. 140,” was codified within ASC 860, “Transfers and Servicing,” and improves the relevance, representational faithfulness and comparability of the information that a reporting entity provides in its financial reports about a transfer of financial assets; the effects of a transfer on its financial position, financial performance, and cash flows; and a transferor’s continuing involvement in transferred financial assets. SFAS No. 166 is effective as of the beginning of an entity’s first annual reporting period that begins after November 15, 2009, for interim periods within that first annual reporting period and for interim and annual reporting periods thereafter. Earlier application is prohibited. SFAS No. 166 must be applied to transfers occurring on or after the effective date. We do not believe that the adoption of SFAS No. 166 will have a material effect on our financial position, results of operations or cash flows.
F-12
Table of Contents
NOTE 3. ACQUISITIONS
Gryphics, Inc.
In the second quarter of 2007, we acquired the outstanding capital stock of Gryphics, Inc. (“Gryphics”) for 842,753 shares of our common stock, with a fair market value of approximately $12.0 million, and cash of $13.7 million. In addition, we incurred approximately $0.3 million of acquisition costs. Gryphics specialized in the design, manufacture and marketing of high-performance socket products used for final production and evaluation testing of packaged semiconductor integrated circuits. Of the $26.0 million purchase price, $14.4 million was allocated to goodwill, $13.2 million was allocated to other intangible assets, $3.4 million was allocated to tangible assets and $5.0 million was allocated to deferred taxes and other liabilities. The results of operations from Gryphics have been included in our Probes and Sockets segment from the date of acquisition. All goodwill and intangible assets related to the Gryphics acquisition were written-off at December 31, 2008.
Synatron GmbH
In the third quarter of 2007, we terminated our distribution agreement and acquired certain assets and operations from our German distributor, Synatron GmbH (“Synatron”), for $1.8 million in cash plus nominal acquisition costs. In connection with the acquisition, we established a new subsidiary, Cascade Microtech, GmbH, which commenced operations as a direct sales and support office in Munich, Germany. Of the $1.8 million purchase price, $0.6 million was allocated to goodwill and $1.2 million was allocated to other intangible assets. An additional $0.1 million was paid to the seller in July 2008 upon meeting certain milestones pursuant to the agreement. The additional payment was recorded as goodwill in the third quarter of 2008. All goodwill related to the Synatron acquisition was written-off at December 31, 2008.
Pro forma results of operations are not included for any of the above acquisitions as they are not materially different from actual results of operations.
NOTE 4. MARKETABLE SECURITIES
Certain information regarding our marketable securities was as follows (in thousands):
| December 31, |
2009 | 2008 | ||||
| Fair market value: |
||||||
| Municipal obligations |
$ | 7,610 | $ | 31,260 | ||
| Corporate obligations |
4,465 | — | ||||
| U.S. agencies |
2,058 | — | ||||
| $ | 14,133 | $ | 31,260 | |||
| Cost: |
||||||
| Municipal obligations |
$ | 7,587 | $ | 31,153 | ||
| Corporate obligations |
4,461 | — | ||||
| U.S. agencies |
2,056 | — | ||||
| $ | 14,104 | $ | 31,153 | |||
| Fair market value by maturity: |
||||||
| Within one year |
$ | 13,383 | $ | 28,795 | ||
| One to two years |
750 | 2,465 | ||||
| $ | 14,133 | $ | 31,260 | |||
| Gross unrealized holding gains: |
||||||
| Municipal obligations |
$ | 23 | $ | 108 | ||
| Corporate obligations |
4 | — | ||||
| U.S. agencies |
2 | — | ||||
| $ | 29 | $ | 108 | |||
| Gross unrealized holding losses: |
||||||
| Municipal obligations |
$ | — | $ | 1 | ||
| Corporate obligations |
— | — | ||||
| U.S. agencies |
— | — | ||||
| $ | — | $ | 1 | |||
F-13
Table of Contents
Proceeds from the sale of available-for-sale marketable securities were $37.4 million and $45.6 million in 2009 and 2008, respectively. Realized gains and losses on marketable securities were immaterial during 2009, 2008 and 2007. At December 31, 2008 we determined that unrealized losses on our marketable securities were temporary based on the duration of the unrealized losses and on our ability to hold the marketable securities until maturity. At December 31, 2009, we had no unrealized losses on our marketable securities.
NOTE 5. FAIR VALUE MEASUREMENTS
Various inputs are used in determining the fair value of our financial assets and liabilities and are summarized into three broad categories:
| • | Level 1 – quoted prices in active markets for identical securities; |
| • | Level 2 – other significant observable inputs, including quoted prices for similar securities, interest rates, prepayment speeds, credit risk, etc.; and |
| • | Level 3 – significant unobservable inputs, including our own assumptions in determining fair value. |
The inputs or methodology used for valuing securities are not necessarily an indication of the risk associated with investing in those securities.
Following are the disclosures related to our financial assets (in thousands):
| December 31, | ||||||||||
| 2009 | 2008 | |||||||||
| Fair Value |
Input Level |
Fair Value |
Input Level | |||||||
| Marketable securities – municipal obligations |
$ | 7,610 | Level 2 | $ | 31,260 | Level 2 | ||||
| Marketable securities – corporate obligations |
$ | 4,465 | Level 2 | $ | — | — | ||||
| Marketable securities – U.S. agencies |
$ | 2,058 | Level 2 | $ | — | — | ||||
| Forward sale contracts for Japanese yen |
$ | 1,625 | Level 2 | $ | 1,321 | Level 2 | ||||
| Forward purchase contract for euros |
$ | 5,762 | Level 2 | $ | — | — | ||||
The fair value of our marketable securities is determined based on quoted market prices for similar securities. The fair value of our forward contracts is based on quoted market prices for similar securities and is used for the purpose of determining any gain or loss on our foreign currency positions. We do not record the value of the forward contracts on our balance sheet. We record the net unrealized gain or loss as a component of other income (expense), net on a quarterly basis.
NOTE 6. INVENTORIES
Inventories consisted of the following (in thousands):
| December 31, |
2009 | 2008 | ||||
| Raw materials |
$ | 9,780 | $ | 11,014 | ||
| Work-in-process |
1,179 | 1,271 | ||||
| Finished goods |
5,665 | 6,794 | ||||
| $ | 16,624 | $ | 19,079 | |||
F-14
Table of Contents
NOTE 7. FIXED ASSETS
Fixed assets consisted of the following (in thousands):
| December 31, |
2009 | 2008 | ||||||
| Equipment |
$ | 22,551 | $ | 20,404 | ||||
| Leasehold improvements |
7,005 | 6,636 | ||||||
| Construction in progress |
229 | 1,309 | ||||||
| 29,785 | 28,349 | |||||||
| Less accumulated depreciation |
(17,775 | ) | (14,769 | ) | ||||
| $ | 12,010 | $ | 13,580 | |||||
Depreciation expense was $3.3 million, $2.9 million and $2.3 million, respectively, in 2009, 2008 and 2007.
NOTE 8. PATENTS AND PURCHASED INTANGIBLE ASSETS
Included in other long-term assets on our balance sheet were internally developed patents as follows: (in thousands):
| December 31, |
2009 | 2008 | ||||||
| Patents |
$ | 4,949 | $ | 5,395 | ||||
| Accumulated amortization |
(3,094 | ) | (3,397 | ) | ||||
| $ | 1,855 | $ | 1,998 | |||||
Purchased intangible assets, net, included the following (in thousands):
| December 31, |
2009 | 2008 | ||||||
| Customer relationships |
$ | 2,465 | $ | 2,465 | ||||
| Accumulated amortization |
(1,178 | ) | (772 | ) | ||||
| 1,287 | 1,693 | |||||||
| Other |
1,126 | 1,126 | ||||||
| Accumulated amortization |
(555 | ) | (394 | ) | ||||
| 571 | 732 | |||||||
| Total purchased intangible assets, net |
$ | 1,858 | $ | 2,425 | ||||
Amortization expense of internally developed patents and purchased intangible assets totaled $1.0 million, $3.0 million and $2.4 million, respectively, in 2009, 2008 and 2007. Of the amortization expense, $458,000, $499,000 and $462,000, respectively, was for internally developed patents and was included as a component of selling, general and administrative expense.
The estimated amortization expense of purchased intangible assets is as follows over the next five years and thereafter (in thousands):
| 2010 |
$ | 525 | |
| 2011 |
525 | ||
| 2012 |
433 | ||
| 2013 |
285 | ||
| 2014 |
90 | ||
| Thereafter |
— | ||
| $ | 1,858 | ||
In addition, we expect amortization of internally developed patents to be approximately $0.4 million per year over the next five years.
F-15
Table of Contents
NOTE 9. ACCRUED LIABILITIES
Accrued liabilities consisted of the following (in thousands):
| December 31, |
2009 | 2008 | ||||
| Accrued compensation and benefits |
$ | 1,211 | $ | 2,037 | ||
| Accrued warranty |
277 | 313 | ||||
| Other |
599 | 1,426 | ||||
| $ | 2,087 | $ | 3,776 | |||
NOTE 10. INCOME TAXES
Domestic and foreign pre-tax income (loss) was as follows (in thousands):
| Year Ended December 31, |
2009 | 2008 | 2007 | ||||||||
| Domestic |
$ | (11,169 | ) | $ | (35,546 | ) | $ | 1,033 | |||
| Foreign |
614 | (1,278 | ) | 483 | |||||||
| $ | (10,555 | ) | $ | (36,824 | ) | $ | 1,516 | ||||
The income tax provision (benefit) consisted of the following (in thousands):
| Year Ended December 31, |
2009 | 2008 | 2007 | |||||||||
| Current: |
||||||||||||
| Federal |
$ | (3,084 | ) | $ | (763 | ) | $ | 1,786 | ||||
| State |
31 | 34 | 86 | |||||||||
| Foreign |
44 | 51 | 307 | |||||||||
| Total current |
(3,009 | ) | (678 | ) | 2,179 | |||||||
| Deferred: |
||||||||||||
| Federal |
— | (1,749 | ) | (1,365 | ) | |||||||
| State |
— | 51 | (208 | ) | ||||||||
| Foreign |
103 | 129 | (20 | ) | ||||||||
| Total deferred |
103 | (1,569 | ) | (1,593 | ) | |||||||
| Income tax provision (benefit) |
$ | (2,906 | ) | $ | (2,247 | ) | $ | 586 | ||||
The income tax provision (benefit) varies from the amounts computed by applying the Federal statutory rate of 34% to income before income taxes as follows (in thousands):
| Year Ended December 31, |
2009 | 2008 | 2007 | |||||||||
| Federal income tax provision (benefit) computed at statutory rates |
$ | (3,588 | ) | $ | (12,520 | ) | $ | 516 | ||||
| Difference in foreign tax rate |
(33 | ) | (87 | ) | (26 | ) | ||||||
| State income taxes, net of federal benefit |
31 | 12 | 42 | |||||||||
| Stock-based compensation |
196 | 457 | 429 | |||||||||
| Tax credits (R&D and foreign tax credit) |
(166 | ) | (151 | ) | (938 | ) | ||||||
| Expiration of tax credits |
221 | 259 | 259 | |||||||||
| Change in valuation allowance |
364 | 5,475 | 160 | |||||||||
| Tax exempt interest income |
(89 | ) | (259 | ) | (443 | ) | ||||||
| Unrecognized tax benefits |
73 | (355 | ) | 534 | ||||||||
| AMT credit |
302 | (477 | ) | — | ||||||||
| Goodwill impairment |
— | 4,898 | — | |||||||||
| Other |
(217 | ) | 501 | 53 | ||||||||
| Provision (benefit) for income taxes |
$ | (2,906 | ) | $ | (2,247 | ) | $ | 586 | ||||
In April 2009, we settled the IRS audit of our 2007 and 2006 tax returns. As a result of the settlement, we released tax contingencies and recorded an income tax benefit of $371,000. The income tax benefit was recorded as a discrete item in the second quarter of 2009.
F-16
Table of Contents
Significant components of deferred income tax assets and liabilities were as follows (in thousands):
| December 31, |
2009 | 2008 | ||||||
| Current deferred tax assets: |
||||||||
| Reserves and allowances |
$ | 592 | $ | 634 | ||||
| Inventory reserves |
1,270 | 1,032 | ||||||
| Accrued vacation |
67 | 191 | ||||||
| Deferred intercompany profit |
685 | 788 | ||||||
| Customer deposits |
20 | 352 | ||||||
| Other current deferred tax assets |
127 | 178 | ||||||
| Gross current deferred tax assets |
2,761 | 3,175 | ||||||
| Valuation allowance |
(2,735 | ) | (2,904 | ) | ||||
| Net current deferred tax assets |
26 | 271 | ||||||
| Current deferred tax liabilities: |
||||||||
| Loss on hedging activities |
(13 | ) | (172 | ) | ||||
| Current deferred tax assets, net |
13 | 99 | ||||||
| Non-current deferred tax assets: |
||||||||
| Reserves and allowances |
113 | 183 | ||||||
| Federal and state net operating loss carryforwards |
1,368 | 671 | ||||||
| Federal and state tax credits |
3,238 | 2,767 | ||||||
| Stock-based compensation |
858 | 605 | ||||||
| Other non-current deferred tax assets |
1,279 | 1,466 | ||||||
| Gross non-current deferred tax assets |
6,856 | 5,692 | ||||||
| Valuation allowance |
(5,253 | ) | (4,720 | ) | ||||
| Net non-current deferred tax assets |
1,603 | 972 | ||||||
| Non-current deferred tax liabilities: |
||||||||
| Patents |
(735 | ) | (735 | ) | ||||
| Other non-current deferred tax liabilities |
(648 | ) | — | |||||
| Total non-current deferred tax liabilities |
(1,383 | ) | (735 | ) | ||||
| Non-current tax assets (liabilities), net |
220 | 237 | ||||||
| Net total deferred tax assets |
$ | 233 | $ | 336 | ||||
Deferred tax assets arise from the tax benefit of amounts expensed for financial reporting purposes but not yet realized for tax purposes and from unutilized tax credits and net operating loss carry forwards. We evaluate our deferred tax assets on a regular basis to determine if a valuation allowance is required. To the extent it is determined that it is more likely than not that we will not realize the benefit of our deferred tax assets, we record a valuation allowance against deferred tax assets. Based on this evaluation, in 2009, we maintained a full valuation allowance against our domestic deferred tax assets and certain foreign deferred tax assets. The $0.4 million increase in our valuation allowance in 2009 resulted from the changes in our deferred tax assets and liabilities and the maintenance of the valuation allowance against deferred tax assets. In 2008, we recorded a $5.0 million charge to establish a full valuation allowance against our domestic deferred tax assets, and increased the valuation allowance against foreign deferred tax assets by $500,000. In 2007, we increased the valuation allowance against State of Oregon research credits by $25,000 and established a valuation allowance against a foreign net operating loss carryforward of $150,000.
The net increase in the total valuation allowance was $0.4 million, $5.5 million and $0.2 million, respectively, in 2009, 2008 and 2007. The valuation allowance as of December 31, 2009 and 2008 was $8.0 million and $7.6 million, respectively.
In 2009 and 2007, income tax benefits attributable to employee stock option transactions of $116,000 and $142,000, respectively, were allocated to shareholders’ equity. In 2008, income tax benefits of $222,000 attributable to employee stock option transactions, which were previously allocated to shareholders’ equity, were reversed.
F-17
Table of Contents
We had federal and state research and experimentation credit carryforwards of approximately $2.9 million at December 31, 2009 to offset against future taxable income. These carryforwards expire beginning 2010 through 2029.
A reconciliation of unrecognized tax benefits for 2009 and 2008 was as follows (in thousands):
| Balance, December 31, 2007 |
$ | 1,125 | ||
| Increases due to tax positions taken during a prior year |
618 | |||
| Decreases due to tax positions taken during a prior year |
(1,078 | ) | ||
| Balance, December 31, 2008 |
665 | |||
| Increases due to tax positions taken during a prior year |
15 | |||
| Decreases due to tax positions taken during a prior year |
(545 | ) | ||
| Balance, December 31, 2009 |
$ | 135 | ||
All of the $135,000 in unrecognized tax benefits at December 31, 2009 would have an impact on the effective tax rate if recognized. Interest and penalties refunded during 2009 and 2008 totaled $65,000 and $135,000, respectively. The interest and penalties accrued on unrecognized tax benefits as of December 31, 2009 were insignificant.
The tax years which remained open to examination in our major taxing jurisdictions as of December 31, 2009 were as follows:
| Jurisdiction |
Open Tax Years | |
| U.S. |
2006-2009 | |
| Japan |
2003-2009 | |
| United Kingdom |
2007-2008 | |
| Taiwan |
2008-2009 | |
| China |
2008-2009 | |
| Germany |
2008-2009 |
We did not provide for U.S. income taxes on the remaining undistributed earnings of foreign subsidiaries because they were considered permanently invested outside of the U.S. Upon repatriation, some of these earnings would generate foreign tax credits, which may reduce the U.S. tax liability associated with any future foreign dividend. At December 31, 2009, the cumulative amount of earnings upon which U.S. income taxes have not been provided is approximately $2.9 million.
NOTE 11. OTHER, NET
Other income (expense), net consisted of the following (in thousands):
| Year ended December 31, |
2009 | 2008 | 2007 | |||||||||
| Interest income, net |
$ | 314 | $ | 862 | $ | 1,455 | ||||||
| Foreign currency gains (losses) |
198 | 458 | (254 | ) | ||||||||
| Gains (losses) on foreign currency forward contracts |
(140 | ) | (409 | ) | 238 | |||||||
| Other |
35 | 127 | (103 | ) | ||||||||
| $ | 407 | $ | 1,038 | $ | 1,336 | |||||||
F-18
Table of Contents
NOTE 12. STOCK-BASED COMPENSATION AND STOCK-BASED PLANS
Certain information regarding our stock-based compensation was as follows (in thousands, except per share amounts):
| Year Ended December 31, |
2009 | 2008 | 2007 | ||||||
| Weighted average grant-date per share fair value of share options granted |
$ | 1.79 | $ | 4.46 | $ | 7.75 | |||
| Total intrinsic value of share options exercised |
22 | 301 | 1,575 | ||||||
| Fair value of restricted shares vested |
547 | 214 | 59 | ||||||
No stock-based compensation was capitalized as a part of an asset during the years ended December 31, 2009, 2008 or 2007.
Our stock-based compensation was included in our statements of operations as follows (in thousands):
| Year Ended December 31, |
2009 | 2008 | 2007 | ||||||
| Cost of sales |
$ | 289 | $ | 369 | $ | 432 | |||
| Research and development |
272 | 324 | 361 | ||||||
| Selling, general and administrative |
1,309 | 1,838 | 1,553 | ||||||
| $ | 1,870 | $ | 2,531 | $ | 2,346 | ||||
To determine the fair value of stock-based awards granted, we used the Black-Scholes option pricing model and the following weighted average assumptions:
| Year Ended December 31, |
2009 | 2008 | 2007 | |||
| Stock Option Plan |
||||||
| Risk-free interest rate |
2.3% | 2.7% | 4.5% | |||
| Expected dividend yield |
0.0% | 0.0% | 0.0% | |||
| Expected term |
6.5 years | 6.5 years | 6.5 years | |||
| Expected volatility |
58.1% | 54.2% | 48.3% | |||
| Employee Stock Purchase Plan |
||||||
| Risk-free interest rate |
0.2% - 0.7% | 1.9% - 2.5% | 4.3% - 5.1% | |||
| Expected dividend yield |
0.0% | 0.0% | 0.0% | |||
| Expected term |
6 months - 2 years | 6 months - 2 years | 6 months - 2 years | |||
| Expected volatility |
67.7% - 122.2% | 29.2% - 43.7% | 19.2% - 35.8% | |||
The risk-free rate used is based on the U.S. Treasury yield over the expected term of the options granted. Our option pricing model utilizes the simplified method to estimate the expected term. The expected volatility for options granted pursuant to our stock incentive plans is calculated based on a weighted average of our historic volatility and the historic volatility of a group of peer companies over the prior 6.5 year period. The expected volatility for our employee stock purchase plan is calculated based on our historical volatility. We have not paid dividends in the past and we do not expect to pay dividends in the future and, therefore, the expected dividend yield is 0%.
We amortize stock-based compensation on a straight-line basis over the vesting period of the individual awards, which is the requisite service period, with estimated forfeitures considered. Shares to be issued upon the exercise of stock options will come from newly issued shares.
F-19
Table of Contents
Stock Incentive Plans
Our stock incentive plans include our 1993 Stock Incentive Plan (the “1993 Plan”) and our 2000 Stock Incentive Plan (the “2000 Plan”) (together, the “Plans”) and provide for the granting of incentive stock options, nonqualified stock options and restricted stock units (“RSUs”). Incentive stock options must be granted at an exercise price not less than 100% of the fair market value per share at the grant date. Nonqualified stock options granted or shares sold under the Plans cannot be granted or sold at a price less than 85% of the fair market value per share at the date of grant or sale. The contractual term of options granted under the Plans is 10 years, and the right to exercise options granted generally vests as to 20% at the end of the first year and then as to 1.67% per month thereafter with full vesting occurring on the fifth anniversary. Grants of restricted stock units generally vest 25% each year over four years. The 1993 Plan expired during 2003 and any remaining unissued options were canceled. Options currently outstanding under the 1993 Plan will not be available for reissuance upon cancellation. We have authorized a total of 3.0 million shares of common stock for issuance under the 2000 Plan.
At December 31, 2009, 496,121 shares were available for future grants, and we had 1,869,077 shares of our common stock reserved for future issuance under the Plans.
Stock option activity for the year ended December 31, 2009 was as follows:
| Options Outstanding |
Weighted Average Exercise Price | |||||
| Outstanding at December 31, 2008 |
1,013,220 | $ | 10.22 | |||
| Granted |
309,080 | 3.11 | ||||
| Exercised |
(14,600 | ) | 3.80 | |||
| Forfeited |
(410,511 | ) | 11.91 | |||
| Outstanding at December 31, 2009 |
897,189 | 7.10 | ||||
Certain information regarding options outstanding as of December 31, 2009 was as follows:
| Options Outstanding |
Options Exercisable | |||||
| Number |
897,189 | 515,521 | ||||
| Weighted average exercise price |
$ | 7.10 | $ | 8.90 | ||
| Aggregate intrinsic value |
$ | 454,348 | $ | 26,403 | ||
| Weighted average remaining contractual term |
4.4 years | 3.6 years | ||||
The aggregate intrinsic value in the table above is based on our closing stock price of $4.58 on December 31, 2009, which would have been received by the optionees had all of the options with exercise prices less than $4.58 been exercised on that date.
RSU activity for the year ended December 31, 2009 was as follows:
| Restricted Stock Units |
Weighted Average Grant Date Per Share Fair Value | |||||
| Outstanding at December 31, 2008 |
424,762 | $ | 7.36 | |||
| Granted |
198,018 | 5.46 | ||||
| Vested |
(130,764 | ) | 4.75 | |||
| Forfeited |
(13,575 | ) | 6.05 | |||
| Outstanding at December 31, 2009 |
478,441 | 7.32 | ||||
As of December 31, 2009, total unrecognized stock-based compensation related to outstanding, but unvested stock options and RSUs was $2.5 million, which will be recognized over the weighted average remaining vesting period of 2.9 years.
F-20
Table of Contents
Stock Option Exchange
Effective January 29, 2009, we offered our U.S. employees, other than current members of our Board of Directors and our executive officers (the “Eligible Employees”), the ability to exchange outstanding stock options with an exercise price equal to or greater than $7.00 per share (the “Eligible Options”) for a lesser number of restricted stock units (the “Option Exchange”). Eligible Employees had until February 27, 2009 to exchange Eligible Options at a ratio of 5 options for every 1 RSU. Each RSU represents a contingent right to receive one share of our common stock upon vesting. The vesting is contingent on continued employment and will occur in four equal annual installments on the first through fourth anniversaries of the grant date, with full vesting occurring on the fourth anniversary of the grant date. A total of 77 employees participated in the Option Exchange, and a total of 169,590 stock options with a fair value of $70,000 were exchanged for a total of 33,918 RSUs with a fair value of $83,000, resulting in $13,000 of incremental expense to be recognized over the vesting period.
Employee Stock Purchase Plan
In February 2004, our board of directors approved the 2004 Employee Share Purchase Plan (the “2004 ESPP”). The terms of the 2004 ESPP provide for an annual increase in available shares of up to 100,000, upon board approval, beginning in 2006. In accordance with these terms, in January 2009, the number of shares of our common stock available for purchase under the 2004 ESPP was increased from 500,000 to 600,000. In addition, the Board of Directors authorized an amendment of the 2004 ESPP to reduce the offering period of the plan from two-years to six-months, and changed the enrollment date to the first trading day on or after May 1 and November 1 of each year. Modification of the ESPP resulted in incremental compensation expense of $54,000 in 2009.
Any eligible employee may participate in the 2004 ESPP by completing a subscription agreement which allows participants to have between 2% and 15% of their compensation withheld to purchase shares of common stock at 85% of the fair market value of a share of common stock on the enrollment date or on the exercise date, whichever is lower. No more than $12,500 can be withheld to purchase shares of common stock in each offering period. The exercise date is the last trading day of each offering period and participating employees are automatically enrolled in the new offering period. During the year ended December 31, 2009, we issued 186,797 shares pursuant to the 2004 ESPP at a weighted average price of $2.62 per share, which represented a weighted average discount of $1.33 per share from the fair market value on the dates of purchase, and 75,022 shares remained available for purchase as of December 31, 2009.
NOTE 13. RELATED PARTY TRANSACTIONS
FEI Company
During 2009 and 2007, we purchased certain equipment and services for $21,000 and $31,000, respectively, from FEI Company (“FEI”). There were no purchases from FEI in 2008. In addition, FEI purchased certain equipment from us for a total of $2,000, $14,000 and $3,000, respectively, during 2009, 2008 and 2007. At December 31, 2009 we had no outstanding receivables from FEI. At December 31, 2008 we had a receivable from FEI of $11,000. One of the members of our Board of Directors, Mr. Raymond A. Link, is the Executive Vice President and Chief Financial Officer of FEI.
Raytheon, Inc.
During 2009, 2008 and 2007, we did not purchase any equipment or services from Raytheon, Inc. However, Raytheon purchased certain equipment from us for a total of $382,000, $296,000 and $232,000, respectively, during 2009, 2008 and 2007. At December 31, 2009 and 2008, we had receivables from Raytheon, Inc. of $145,000 and $29,000, respectively. One of the members of our Board of Directors, Mr. William Spivey, is a member of the Board of Directors of Raytheon, Inc.
F-21
Table of Contents
NOTE 14. EMPLOYEE BENEFIT PLAN
We sponsor a 401(k) savings plan which allows eligible employees to contribute a certain percentage of their salary. We match 50% of eligible employees’ contributions, up to a maximum of 3% of the employees’ earnings. The 401(k) match was suspended during the first quarter of 2009. Our matching contribution for the savings plan was $22,000, $364,000 and $296,000 in 2009, 2008 and 2007, respectively.
NOTE 15. COMMITMENTS AND CONTINGENCIES
Leases and Subleases
We lease office and manufacturing space under operating leases that expire at various dates through 2015. In addition to lease expense, we pay real property taxes, insurance and repair and maintenance expenses for our corporate office and manufacturing facilities. We recognize rent expense related to our operating leases based on a straight-line basis over the life of the lease including any periods of free rent. We also have certain equipment under capital lease with a cost basis of $51,000 and accumulated depreciation of $19,000 at December 31, 2009.
Future minimum lease payments under non-cancelable operating leases and capital leases with initial or remaining terms in excess of one year are as follows (in thousands):
| Year Ending December 31, |
Operating | Capital | |||||
| 2010 |
$ | 2,583 | $ | 14 | |||
| 2011 |
2,646 | 14 | |||||
| 2012 |
2,344 | 13 | |||||
| 2013 |
2,388 | 2 | |||||
| 2014 |
2,442 | — | |||||
| Thereafter |
1,600 | — | |||||
| Total minimum lease payments |
$ | 14,003 | 43 | ||||
| Less amounts representing interest |
(3 | ) | |||||
| Present value of future minimum lease payments |
$ | 40 | |||||
Lease expense was $2.6 million, $2.8 million and $2.8 million, respectively, in 2009, 2008 and 2007. Depreciation expense related to capital leases was $10,000, $15,000 and $10,000, respectively, in 2009, 2008 and 2007.
Legal Proceedings
We are involved in various claims and legal actions arising in the ordinary course of business. In the opinion of management, the ultimate disposition of these matters will not have a material adverse effect on our financial position, results of operations or liquidity.
F-22
Table of Contents
NOTE 16. SEGMENT REPORTING AND ENTERPRISE-WIDE DISCLOSURES
The segment data below is presented in the same manner that management currently organizes the segments for assessing certain performance trends. Our Chief Operating Decision Maker monitors the revenue streams and the gross profit of our Systems sales and our Probes and Sockets sales. We do not track our operating expenses or assets on a segment level, and, accordingly, that information is not provided. Revenue and gross profit information by segment was as follows (dollars in thousands):
| Year Ended December 31, 2009 |
Systems | Probes and Sockets |
Total | |||||||||
| Revenue |
$ | 28,951 | $ | 24,590 | $ | 53,541 | ||||||
| Gross Profit |
$ | 9,190 | $ | 10,511 | $ | 19,701 | ||||||
| Gross Margin |
31.7 | % | 42.7 | % | 36.8 | % | ||||||
| Year Ended December 31, 2008 |
||||||||||||
| Revenue |
$ | 40,870 | $ | 35,691 | $ | 76,561 | ||||||
| Gross Profit |
$ | 13,697 | $ | 18,387 | $ | 32,084 | ||||||
| Gross Margin |
33.5 | % | 51.5 | % | 41.9 | % | ||||||
| Year Ended December 31, 2007 |
||||||||||||
| Revenue |
$ | 56,349 | $ | 33,573 | $ | 89,922 | ||||||
| Gross Profit |
$ | 23,382 | $ | 17,739 | $ | 41,121 | ||||||
| Gross Margin |
41.5 | % | 52.8 | % | 45.7 | % | ||||||
No customer accounted for 10% or more of our total revenue in 2009, 2008 or 2007.
Our revenues by geographic area were as follows (in thousands):
| Year Ended December 31, |
2009 | 2008 | 2007 | ||||||
| United States |
$ | 16,599 | $ | 26,079 | $ | 32,965 | |||
| Asia Pacific |
26,095 | 36,462 | 38,229 | ||||||
| Europe |
9,105 | 12,146 | 16,746 | ||||||
| Other |
1,742 | 1,874 | 1,982 | ||||||
| $ | 53,541 | $ | 76,561 | $ | 89,922 | ||||
Long-lived assets, exclusive of long-term investments and deferred income taxes, by geographic area were as follows (in thousands):
| December 31, |
2009 | 2008 | ||||
| United States |
$ | 14,491 | $ | 16,712 | ||
| Asia Pacific |
949 | 674 | ||||
| Europe |
814 | 1,074 | ||||
| $ | 16,254 | $ | 18,460 | |||
NOTE 17. RESTRUCTURING
In the third quarter of 2008, we closed our machine shop, eliminated the divisional infrastructure, and reorganized across functional lines. Machine shop equipment with a net book value of $0.7 million was transferred from fixed assets to assets held for sale. Sales of assets held for sale resulted in a gain of $0.2 million in 2008, which was included in selling, general and administrative expense. The remaining assets held for sale at December 31, 2008 were written down by $0.2 million to the lower of their carrying value or estimated fair value less cost to sell of $0.4 million. The write-down at December 31, 2008 was included in selling, general and administrative expense.
The closure of the machine shop and reorganization along functional lines resulted in a severance charge of $0.5 million, which was included in selling, general and administrative expense in 2008. All severance costs related to the restructuring in the third quarter of 2008 had been paid as of December 31, 2008.
F-23
Table of Contents
NOTE 18. SUBSEQUENT EVENTS
We have considered all events that have occurred subsequent to December 31, 2009 and through March 1, 2010, the issuance date of the financial statements as of and for the year ended December 31, 2009.
2004 ESPP
In January 2010, pursuant to the terms of the 2004 ESPP, and upon approval by our Board of Directors, the number of shares of our common stock available for purchase under the 2004 ESPP was increased from 600,000 to 700,000.
SUSS MicroTec Test Systems GmbH Acquisition
On January 27, 2010, we entered into a Sale and Purchase Agreement (the “Agreement”) with Suss MicroTec AG (the “Seller”). Pursuant to the terms of the Agreement, we agreed to acquire all of the outstanding capital stock of Suss MicroTec Test Systems GmbH, a wholly-owned subsidiary of Seller, along with certain related assets for a purchase price of 7.0 million euros (approximately $9.8 million), including cash in the amount of 4.5 million euros (approximately $6.3 million) and shares of our common stock valued at approximately 2.5 million euros (approximately $3.5 million) (the “Acquisition”). The final purchase price is subject to a post-closing purchase price adjustment. A portion of the purchase price will be held in escrow for up to 24 months and will be subject to claims by both us and the Seller under circumstances specified in the Agreement.
F-24
Table of Contents
Cascade Microtech, Inc.
Valuation and Qualifying Accounts
Years Ended December 31, 2009, 2008 and 2007
(In thousands)
| Column A |
Column B | Column C | Column D | Column E | |||||||||||||
| Description |
Balance at Beginning of Period |
Charged to Costs and Expenses |
Charged to Other Accounts - Describe (a) |
Deductions - Describe (b) |
Balance at End of Period | ||||||||||||
| Year Ended December 31, 2007: |
|||||||||||||||||
| Allowance for uncollectible accounts |
$ | 153 | $ | 67 | $ | (6 | ) | $ | (11 | ) | $ | 203 | |||||
| Inventory reserves |
$ | 1,943 | $ | 519 | $ | — | $ | (313 | ) | $ | 2,149 | ||||||
| Year Ended December 31, 2008: |
|||||||||||||||||
| Allowance for uncollectible accounts |
$ | 203 | $ | 828 | $ | — | $ | (2 | ) | $ | 1,029 | ||||||
| Inventory reserves |
$ | 2,149 | $ | 827 | $ | — | $ | (151 | ) | $ | 2,825 | ||||||
| Year Ended December 31, 2009: |
|||||||||||||||||
| Allowance for uncollectible accounts |
$ | 1,029 | $ | 61 | $ | — | $ | (116 | ) | $ | 974 | ||||||
| Inventory reserves |
$ | 2,825 | $ | 854 | $ | — | $ | (152 | ) | $ | 3,527 | ||||||
| (a) | Charges to this account relate to changes in foreign currency exchange rates. |
| (b) | Charges to the accounts included in this column are for the purposes for which the reserves were created. |
F-25