Attached files
| file | filename |
|---|---|
| EXCEL - IDEA: XBRL DOCUMENT - CARBO CERAMICS INC | Financial_Report.xls |
| EX-21 - EX-21 - CARBO CERAMICS INC | d839115dex21.htm |
| EX-32 - EX-32 - CARBO CERAMICS INC | d839115dex32.htm |
| EX-23 - EX-23 - CARBO CERAMICS INC | d839115dex23.htm |
| EX-95 - EX-95 - CARBO CERAMICS INC | d839115dex95.htm |
| EX-10.4 - EX-10.4 - CARBO CERAMICS INC | d839115dex104.htm |
| EX-31.1 - EX-31.1 - CARBO CERAMICS INC | d839115dex311.htm |
| EX-31.2 - EX-31.2 - CARBO CERAMICS INC | d839115dex312.htm |
| EX-10.24 - EX-10.24 - CARBO CERAMICS INC | d839115dex1024.htm |
UNITED STATES
SECURITIES AND EXCHANGE COMMISSION
Washington, D.C. 20549
Form 10-K
| x | ANNUAL REPORT PURSUANT TO SECTION 13 OR 15(D) OF THE SECURITIES EXCHANGE ACT OF 1934 |
For the fiscal year ended December 31, 2014
or
| ¨ | TRANSITION REPORT PURSUANT TO SECTION 13 OR 15(D) OF THE SECURITIES EXCHANGE ACT OF 1934 |
For the transition period from to
Commission File No. 001-15903
CARBO Ceramics Inc.
(Exact name of registrant as specified in its charter)
| DELAWARE | 72-1100013 | |
| (State or other jurisdiction of incorporation or organization) |
(I.R.S. Employer Identification Number) |
575 North Dairy Ashford
Suite 300
Houston, Texas 77079
(Address of principal executive offices)
(281) 921-6400
(Registrant’s telephone number)
Securities registered pursuant to Section 12(b) of the Act:
| Title of each class |
Name of each exchange on which registered | |
| Common Stock, par value $0.01 per share | New York Stock Exchange |
Securities registered pursuant to Section 12(g) of the Act: None
Indicate by check mark if the registrant is a well-known seasoned issuer, as defined in Rule 405 of the Securities Act. Yes x No ¨
Indicate by check mark if the registrant is not required to file reports pursuant to Section 13 or Section 15(d) of the Act. Yes ¨ No x
Indicate by check mark whether the registrant (1) has filed all reports required to be filed by Section 13 or 15(d) of the Securities Exchange Act of 1934 during the preceding 12 months (or for such shorter period that the registrant was required to file such reports), and (2) has been subject to such filing requirements for the past 90 days. Yes x No ¨
Indicate by check mark whether the registrant has submitted electronically and posted on its corporate Web site, if any, every Interactive Data File required to be submitted and posted pursuant to Rule 405 of Regulation S-T (§232.405 of this chapter) during the preceding 12 months (or for such shorter period that the registrant was required to submit and post such files). Yes x No ¨
Indicate by check mark if disclosure of delinquent filers pursuant to Item 405 of Regulation S-K is not contained herein, and will not be contained, to the best of registrant’s knowledge, in definitive proxy or information statements incorporated by reference in Part III of this Form 10-K or any amendment to this Form 10-K. x
Indicate by check mark whether the registrant is a large accelerated filer, an accelerated filer, a non-accelerated filer or a smaller reporting company. See the definitions of “large accelerated filer,” “accelerated filer” and “smaller reporting company” in Rule 12b-2 of the Exchange Act:
| Large accelerated filer | x | Accelerated filer | ¨ | |||
| Non-accelerated filer | ¨ (Do not check if a smaller reporting company) | Smaller reporting company | ¨ | |||
Indicate by check mark whether the registrant is a shell company (as defined in Rule 12b-2 of the Act). Yes ¨ No x
The aggregate market value of the Common Stock held by non-affiliates of the Registrant, based upon the closing sale price of the Common Stock on June 30, 2014, as reported on the New York Stock Exchange, was approximately $3,042,021,331. Shares of Common Stock held by each director and executive officer and each person who owns 10% or more of the outstanding Common Stock have been excluded in that such persons may be deemed to be affiliates. This determination of affiliate status is not necessarily a conclusive determination for other purposes.
As of February 17, 2015, the Registrant had 23,276,180 shares of Common Stock outstanding.
DOCUMENTS INCORPORATED BY REFERENCE
Portions of the Proxy Statement for Registrant’s Annual Meeting of Stockholders to be held May 19, 2015, are incorporated by reference in Part III.
TABLE OF CONTENTS
PART I
| Item 1. | Business |
General
CARBO Ceramics Inc. (the “Company” or “CARBO”) is an oilfield services technology company that generates revenue primarily through the sale of products and services to the oil and gas industry for production enhancement and environmental services.
Our production enhancement businesses promote increased Exploration and Production (“E&P) Operators’ production and Estimated Ultimate Recovery (“EUR”) by providing industry leading technology to Design, Build, and Optimize the FracTM. Our environmental services business is intended to protect E&P Operators’ assets, minimizes environmental risk, and lowers operating costs (LOE).
CARBO is the world’s largest supplier of ceramic proppant. The Company also sells sand and resin-coated sand. Originally, the Company participated in the sale of sand as a byproduct of its resin-coating operations. However, during 2014, the Company expanded its sand sales volumes and now sells sand independent of its resin-coating operations. The Company is the provider of the industry’s most popular fracture simulation software, and a provider of fracture design and consulting services, and a broad range of technologies for spill prevention, containment and countermeasures. The Company sells the majority of its products and services to operators of oil and natural gas wells and to oilfield service companies to help increase the production rates and the amount of oil and natural gas ultimately recoverable from these wells. The Company’s products and services are primarily used in the hydraulic fracturing of natural gas and oil wells. The Company was incorporated in 1987 in Delaware. As used herein, “Company”, “CARBO”, “we”, “our” and “us” may refer to the Company and/or its consolidated subsidiaries.
Hydraulic fracturing is the most widely used method of increasing production from oil and natural gas wells. The hydraulic fracturing process consists of pumping fluids down a natural gas or oil well at pressures sufficient to create fractures in the hydrocarbon-bearing rock formation. A granular material, called proppant, is suspended and transported in the fluid and fills the fracture, “propping” it open once high-pressure pumping stops. The proppant-filled fracture creates a conductive channel through which the hydrocarbons can flow more freely from the formation to the well and then to the surface.
There are three primary types of proppant that can be utilized in the hydraulic fracturing process: sand, resin-coated sand and ceramic. Sand is the least expensive proppant, resin-coated sand is more expensive and ceramic proppant is typically the most expensive. The higher initial cost of ceramic proppant is justified by the fact that the use of these proppants in certain well conditions results in an increase in the production rate of oil and natural gas, an increase in the total oil or natural gas that can be recovered from the well and, consequently, an increase in cash flow for the operators of the well. The increased production rates are primarily attributable to the higher strength and more uniform size and shape of ceramic proppant versus alternative materials.
The Company primarily manufactures six distinct ceramic proppants. Our newest proppant, KRYPTOSPHERETM HD, is a high-performance ceramic proppant engineered to deliver increased conductivity and durability in the highest closure stress wells. Even in challenging, high-cost environments such as deep water wells, KRYPTOSPHERETM HD retains its integrity and enables greater ultimate recovery from the reservoir.
CARBOHSP® and CARBOPROP® are high strength proppants designed primarily for use in deep oil and gas wells.
CARBOLITE®, CARBOECONOPROP® and CARBOHYDROPROP® are low-density ceramic proppants. CARBOLITE® is used in medium depth oil and gas wells, where higher production rates can be achieved due to the product’s uniform size and spherical shape. CARBOECONOPROP® was introduced to provide a lower cost ceramic to compete more directly with resin-coated sand and sand proppant, and CARBOHYDROPROP® was introduced to improve performance in “slickwater” fracture treatments.
1
During 2010, the Company began production of resin-coated ceramic (CARBOBOND® LITE®) and resin-coated sand (CARBOBOND®RCS) proppants. CARBOBOND®LITE® addresses a niche market in which oil and natural gas wells are subject to the risk of proppant flow-back. In the case of CARBOBOND®RCS, the Company made the strategic decision to offer a lower-cost, lower-conductivity alternative proppant in addition to its ceramic proppant products, thereby broadening its proppant suite of products.
CARBO NORTHERN WHITE is a frac sand that is used by operators that still value quality, but do not wish to pay the higher costs associated with ceramic or resin-coated sand proppants.
In addition, the Company manufactures CARBONRT®, a detectable proppant that utilizes a non-radioactive tracer material to assist operators in determining the locations of fractures in a natural gas or oil well. This tracer is added to the proppant granules during the manufacturing process, and can be added to most of the types of proppant that the Company sells.
In 2014, the Company also began sales of SCALEGUARD, a porous ceramic proppant that is infused with scale-inhibiting chemicals and placed throughout the fracture as part of the hydraulic fracturing process. The infused scale inhibitor in SCALEGUARD is designed to be released into the fracture only on contact with water and thereby reduce or eliminate expensive remedial maintenance programs.
The Company, through its wholly-owned subsidiary StrataGen, Inc., also sells fracture simulation software under the brand FracPro® and provides fracture design and consulting services to oil and natural gas companies under the brand StrataGen.
FracPro® provides a suite of stimulation software solutions to the industry that have marked capabilities for on-site real-time analysis. This has enabled recognition and remediation of potential stimulation problems. This stimulation software is tightly integrated with reservoir simulators, thus allowing for stimulation treatment and production optimization.
StrataGen, the specialized consulting team, consults and works with operators around the world to help optimize well placement, fracture treatment design and production enhancement. The broad range of expertise of the StrataGen consultants includes: fracture treatment design; completion support; on-site treatment supervision, quality control; post-treatment evaluation and optimization; reservoir and fracture studies; rock mechanics and software application and training.
Demand for most of the Company’s products and services depends primarily upon the demand for natural gas and oil and on the number of natural gas and oil wells drilled, completed or re-completed worldwide. More specifically, the demand for the Company’s products and services is dependent on the number of oil and natural gas wells that are hydraulically fractured to stimulate production.
Falcon Technologies and Services, Inc. (“Falcon Technologies”), a wholly-owned subsidiary of the Company, provides spill prevention, containment and countermeasure systems for the oil and gas industry. Falcon Technologies uses proprietary technology to provide products that are designed to enable its clients to extend the life of their storage assets, reduce the potential for hydrocarbon spills and provide containment of stored materials.
During the year ended December 31, 2014, the Company generated approximately 76% of its revenues in the United States and 24% in international markets.
Competition
As the demand for resin-coated and ceramic proppant was amplified by the large resource plays, the number of domestic and international competitors in the marketplace has increased. One of the Company’s worldwide proppant competitors is Saint-Gobain Proppants (“Saint-Gobain”). Saint-Gobain is a division of Compagnie de
2
Saint-Gobain, a large French glass and materials company. Saint-Gobain manufactures a variety of ceramic proppants that it markets in competition with some of the Company’s products. Saint-Gobain’s primary manufacturing facility is located in Fort Smith, Arkansas; and Bauxite, Arkansas. Saint-Gobain also manufactures ceramic proppant in China. Mineracao Curimbaba (“Curimbaba”), based in Brazil, is also a competitor and manufactures ceramic proppants that it markets in competition with some of the Company’s products. Imerys, S.A., a competitor based in France (“Imeyrs”), has begun to manufacture ceramic proppant in Andersonville, Georgia, and during 2013 acquired Wrens, Georgia-based ceramic proppant manufacturer Pyramax, LLC.
There are two major manufacturers of ceramic proppant in Russia. Borovichi Refractory Plant (“Borovichi”) located in Borovichi, Russia, and FORES Refractory Plant (“FORES”) located in Ekaterinburg, Russia. Although the Company has limited information about Borovichi and FORES, the Company believes that Borovichi primarily manufactures intermediate-density ceramic proppants and markets its products principally within Russia, and that FORES manufactures intermediate-density and low-density ceramic proppant lines and markets its products both inside and outside of Russia. The Company further believes that these companies have added manufacturing capacity in recent years and now provide a majority of the ceramic proppant used in Russia. The Company is also aware of an increasing number of manufacturers in China. Most of these companies produce intermediate-density ceramic proppants that are marketed both inside and outside of China. Chinese proppant imports into the United States increased beginning in 2010 and 2011, which contributed to an over-supply of ceramic proppant in 2012, 2013 and 2014.
Competition for CARBOHSP® and CARBOPROP® principally includes ceramic proppant manufactured by Saint-Gobain, Curimbaba and various producers located in China. The Company’s CARBOLITE®, CARBOECONOPROP® and CARBOHYDROPROP® products compete primarily with ceramic proppant produced by Saint-Gobain, Curimbaba and Imerys and with sand-based proppant for use in the hydraulic fracturing of medium depth natural gas and oil wells. At this time, there is not a comparable competitor’s product to the Company’s KRYPTOSPHERE HD.
The leading suppliers of mined sand are Unimin Corp., U.S. Silica Company, Fairmount Minerals Limited, Inc., Hi-Crush Partners LP, and Badger Mining Corp. The leading suppliers of resin-coated sand are Hexion (formerly known as Momentive Specialty Chemicals) and Santrol, a subsidiary of Fairmount Minerals.
The Company believes that some of the significant factors that influence a customer’s decision to purchase the Company’s ceramic proppant are (i) price/performance ratio, (ii) on-time delivery performance, (iii) technical support and (iv) proppant availability. The Company believes that its products are competitively priced and that its delivery performance is good. The Company also believes that its superior technical support has enabled it to persuade customers to use ceramic proppant in an increasingly broad range of applications and thus increased the overall market for the Company’s products. Over the past five years, the Company has increased its manufacturing and resin-coating capacity by 86% and plans to continue its strategy of adding capacity, as needed and as market conditions warrant, to meet anticipated future increases in sales demand.
Product Development
The Company continually conducts testing and development activities with respect to alternative raw materials to be used in the Company’s existing and alternative production methods. During 2013, the Company introduced a new ceramic proppant, KRYPTOSPHERETM HD, with increased strength and conductivity when compared to its traditional products. This new product is intended for use in ultra-high stress wells. The next phase for KRYPTOSPHERETM is applying this technology to the Company’s existing manufacturing footprint. Currently, the Company is retrofitting an existing plant with KRYPTOSPHERETM technology. For information regarding the Company’s research and development expenditures, see Note 1 to the “Notes to Consolidated Financial Statements.”
3
The Company is actively involved in the development of alternative products for use as proppant in the hydraulic fracturing process and is aware of others engaged in similar development activities. The Company believes that while there are potential specialty applications for these products, they will not significantly impact the use of ceramic proppants. The Company believes that the “know-how” and trade secrets necessary to efficiently manufacture a product of consistently high quality are difficult barriers to entry to overcome.
Customers and Marketing
The Company’s largest customers are participants in the petroleum pressure pumping industry. Specifically, Halliburton Energy Services, Inc. and Schlumberger Limited each accounted for more than 10% of the Company’s 2014 and 2013 revenues. However, the end users of the Company’s products are the operators of natural gas and oil wells that hire the pressure pumping service companies to hydraulically fracture wells. The Company works both with the pressure pumping service companies and with the operators of natural gas and oil wells to present the technical and economic advantages of using ceramic proppant. The Company generally supplies its customers with products on a just-in-time basis, as specified in individual purchase orders. Continuing sales of product depend on the Company’s direct customers and the well operators being satisfied with product quality, availability and delivery performance. In addition, continuing sales of product depend on a favorable level of activity in the natural gas and oil industries. The Company provides its software simulation products and consulting services directly to owners and/or operators of oil and gas wells and service companies.
The Company recognizes the importance of a technical marketing program in demonstrating long-term economic advantages when selling products and services that offer financial benefits over time. The Company has a broad technical sales force to advise end users on the benefits of using ceramic proppant and performing fracture simulation and consultation services.
Although the Company’s initial products were originally intended for use in deep, high-stress wells that require high-strength proppant, the Company believes that there is economic benefit to well operators of using ceramic proppant in shallower, lower-stress wells. The Company believes that its new product introductions and education-based technical marketing efforts have allowed it to expand sales in recent years and will continue to do so in the future.
The Company provides a variety of technical support services and has developed computer software that models the return on investment achievable by using the Company’s ceramic proppant versus alternatives in the hydraulic fracturing of a natural gas or oil well. In addition to the technical marketing effort, the Company from time to time engages in field trials to demonstrate the economic benefits of its products and validate the findings of its computer simulations. Periodically, the Company provides proppant to production companies for field trials, on a discounted basis, in exchange for a production company’s agreement to provide production data for direct comparison of the results of fracturing with ceramic proppant as compared to alternative proppants.
The Company’s international marketing efforts are conducted primarily through its sales offices in Dubai, United Arab Emirates; Alberta, Canada; Beijing, China; and Moscow, Russia, and through commissioned sales agents located in South America. The Company’s products and services are used worldwide by U.S. customers operating domestically and abroad, and by foreign customers. Sales outside the United States accounted for 24%, 21% and 23% of the Company’s sales for 2014, 2013 and 2012, respectively. The distribution of the Company’s international and domestic revenues is shown below, based upon the region in which the customer used the products and services:
| For the years ended December 31, | ||||||||||||
| 2014 | 2013 | 2012 | ||||||||||
| ($ in millions) | ||||||||||||
| Location |
||||||||||||
| United States |
$ | 491.0 | $ | 529.6 | $ | 500.1 | ||||||
| International |
157.3 | 137.8 | 145.4 | |||||||||
|
|
|
|
|
|
|
|||||||
| Total |
$ | 648.3 | $ | 667.4 | $ | 645.5 | ||||||
|
|
|
|
|
|
|
|||||||
4
Production Capacity
The Company believes that constructing adequate capacity ahead of demand while incorporating new technology to reduce manufacturing costs are important competitive strategies to increase its overall share of the market for proppant.
Between 2006 and 2011, the Company, in successive phases, completed construction of four ceramic proppant production lines at its manufacturing facility in Toomsboro, Georgia. The stated annual production capacity at this facility is 1.0 billion pounds per year.
During 2010, the Company began production from a resin-coating plant that was built within the existing manufacturing infrastructure of its New Iberia, Louisiana facility. The resin-coating plant is utilized to coat both ceramic proppant manufactured at other Company locations and raw frac sand. A second resin-coating production line at the facility was completed in 2012. The facility also functions as a distribution center. During 2012, the Company began to utilize its own CARBO Northern White sand in its sand processing facility in Marshfield, Wisconsin. This facility currently supplies raw frac sand to the proppant market. During 2014, the Company made a decision that it will not move forward with construction of a resin coating plant in Marshfield, Wisconsin.
During 2014, the Company completed construction of the first 250 million pound ceramic proppant production line in Millen, Georgia and the plant commenced operations. In addition, the Company began the construction on a second 250 million pound production line in Millen. However, due to current market conditions, the construction and completion of this second line has been temporarily suspended.
The following table sets forth the current stated capacity of each of the Company’s existing manufacturing and resin-coating facilities:
| Location |
Annual Capacity | |||
| (millions of pounds) | ||||
| Eufaula, Alabama |
275 | |||
| McIntyre, Georgia |
275 | |||
| Toomsboro, Georgia |
1,000 | |||
| Millen, Georgia |
250 | |||
| Luoyang, China |
100 | * | ||
| Kopeysk, Russia |
100 | |||
|
|
|
|||
| Total manufacturing capacity |
2,000 | |||
| New Iberia, Louisiana – resin-coating |
400 | ** | ||
|
|
|
|||
| Total current capacity |
2,400 | |||
| * | Given current business conditions, the Company expects to idle its plant in China during the first quarter of 2015. |
| ** | Processing activities at the New Iberia facility involve resin-coating of previously manufactured ceramic proppant substrate and raw frac sand. During 2013, the Company began manufacturing KRYPTOSPHERETM HD at its New Iberia facility. |
Once the second line at the Millen, Georgia facility has been completed, the Company’s ceramic manufacturing capacity will total 2.25 billion pounds. The construction of additional manufacturing capacity beyond these new facilities will be dependent on the expected future demand for the Company’s products, access to needed capital and the ability to obtain necessary environmental permits.
5
Long-Lived Assets By Geographic Area
Long-lived assets, consisting of net property, plant and equipment, goodwill, intangibles, and other long-term assets as of December 31 in the United States and other countries are as follows:
| 2014 | 2013 | 2012 | ||||||||||
| ($ in millions) | ||||||||||||
| Long-lived assets: |
||||||||||||
| United States |
$ | 578.5 | $ | 472.1 | $ | 422.3 | ||||||
| International (primarily China and Russia) |
18.1 | 35.5 | 36.7 | |||||||||
|
|
|
|
|
|
|
|||||||
| Total |
$ | 596.6 | $ | 507.6 | $ | 459.0 | ||||||
|
|
|
|
|
|
|
|||||||
Distribution
The Company maintains finished goods inventories at each of its manufacturing facilities and at remote stocking facilities. The North American remote stocking facilities consist of bulk storage silos with truck trailer loading facilities, as well as rail yards for direct transloading from rail car to tank trucks. International remote stocking sites are duty-free warehouses operated by independent owners. North American sites are typically supplied by rail, and international sites are typically supplied by container ship. In total, the Company leases approximately 1,950 rail cars for use in the distribution of its products and is under contract to add approximately 200 more railcars by the end of 2015. The price of the Company’s products sold for delivery in the lower 48 United States and Canada typically includes just-in-time delivery of proppant to the operator’s well site, which eliminates the need for customers to maintain an inventory of ceramic proppant. The Company expands its distribution network as needed, including rail car additions as well as increasing finished goods storage capacity at stocking locations. During the fourth quarter of 2012, the Company completed an expansion of its distribution facility in South Texas. Additionally, the Company is rationalizing its rail fleet to reduce reliance on the fleet as a form of storage, and expects to sublease or otherwise transfer railcars during 2015 to avoid the expansion of its fleet.
Raw Materials
Ceramic proppant is made from alumina-bearing ores (commonly referred to as clay, bauxite, bauxitic clay or kaolin, depending on the alumina content) that are readily available on the world market. Bauxite is largely used in the production of aluminum metal, refractory material and abrasives. The main known deposits of alumina-bearing ores in the United States are in Arkansas, Alabama and Georgia; other economically mineable known deposits are located in Australia, Brazil, China, Gabon, Guyana, India, Jamaica, Russia and Surinam.
For the production of CARBOHSP® and CARBOPROP® in the United States the Company uses bauxite, and has historically purchased its annual requirements at the seller’s current prices. The Company believes that its ability to purchase bauxite on the open market and current bauxite inventories will sufficiently provide for its bauxite needs in the United States during 2015.
The Company’s Eufaula, McIntyre, Toomsboro and Millen facilities primarily use locally mined kaolin for the production of CARBOLITE®, CARBOECONOPROP® and CARBOHYDROPROP®. The Company has entered into bi-lateral contracts that require a supplier to sell to the Company, and the Company to purchase from the supplier, at least fifty percent of the Eufaula facility’s and Millen facility’s annual kaolin requirements. The Eufaula contract runs through 2017, with options to extend this agreement for additional three year terms. The Millen contract, which commenced in July 2014, has an initial term of five years with options to extend the agreement for an additional five years. The Company has obtained ownership rights in acreage in Wilkinson County, Georgia, which contains in excess of a twelve year supply of kaolin for its Georgia facilities based on full capacity production rates. The Company has entered into a long-term agreement with a third party to mine and transport this material at a fixed price subject to annual adjustment. The agreement requires the Company to
6
utilize the third party to mine and transport a majority of the McIntyre and Toomsboro facility’s annual kaolin requirement. Overall, the Company estimates that its fee simple and leasehold mineral rights in the states of Alabama and Georgia contain approximately 19.1 million tons of kaolin suitable for use in production of the Company’s kaolin-based proppants.
The Company’s production facility in Luoyang, China, uses both kaolin and bauxite for the production of CARBOPROP® and CARBOLITE®. Certain of these materials are purchased under a short-term contract that stipulates fixed prices.
The Company’s production facility in Kopeysk, Russia currently uses bauxite for the production of CARBOPROP®. Bauxite is purchased under annual agreements that stipulate fixed prices for up to a specified quantity of material.
The Company continues to explore options for the purchase of high-quality raw materials for its sand business. In 2011, the Company secured a five-year contract with a supplier and consummated the purchase of two parcels of property containing sand reserves. During 2012, the Company began to utilize its own CARBO Northern White sand in its sand processing facility in Marshfield, Wisconsin, which supplies the Company’s resin-coating facility in New Iberia, Louisiana, as well as raw frac sand to the proppant market.
Ceramic Production Process
Ceramic proppants are made by grinding or dispersing ore to a fine powder, combining the powder into small pellets and firing the pellets in a rotary kiln. The Company uses three different methods to produce ceramic proppant.
The Company’s plants in McIntyre, Georgia; Kopeysk, Russia and Luoyang, China use a dry process, which utilizes clay, bauxite, bauxitic clay or kaolin. The raw material is ground, pelletized and screened. The manufacturing process is completed by firing the product in a rotary kiln.
The Company’s plants in Eufaula, Alabama, Toomsboro, Georgia, and Millen, Georgia, use a wet process, which starts with kaolin that is formed into slurry. The slurry is then pelletized in a dryer and the pellets are then fired in a rotary kiln.
The portion of the Company’s plant in New Iberia, Louisiana that manufactures ceramic proppant uses a new manufacturing process associated with the Company’s KRYPTOSPHERE product line. In addition, construction has begun to retrofit another of the Company’s plants with this new process.
The Company’s rotary kilns are primarily heated by the use of natural gas.
Patent Protection and Intellectual Property
The Company makes ceramic proppant and ceramic media used in foundry and scouring processes (the latter two items comprising a minimal volume of overall sales) by processes and techniques that involve a high degree of proprietary technology, some of which is protected by patents.
The Company owns multiple patents in the United States and various foreign countries that relate to different types of ceramic proppant and production methods used for ceramic proppant and media; however, production of products pursuant to these patents does not currently constitute a material portion of the Company’s output. The Company also owns multiple U.S. and foreign patents that relate to methods for the detection of subterranean fractures.
7
During 2014, the Company obtained two U.S. patents relating to its KRYPTOSPHERE manufacturing process, and expects these patents to provide assistance in the future sales of this product line.
The Company owns multiple U.S. patent applications (together with a number of counterpart applications pending in foreign jurisdictions). Each of the U.S. patent applications cover ceramic proppant, processes for making ceramic proppant, and detection of subterranean fractures. The applications are in various stages of the patent prosecution process, and patents may not issue on such applications in any jurisdiction for some time, if they issue at all.
Falcon Technologies owns two U.S. patents, which expire in 2026 and 2027 and relate to construction of secondary containment areas. In addition, Falcon Technologies owns a U.S. patent which expires in 2031 and relates to the construction of a polyurea-coated tank base. Falcon Technologies also owns multiple U.S patent applications (together with a number of counterpart applications pending in foreign jurisdictions), each of which relates to tank bases or methods of constructing secondary containment areas.
The Company believes that its patents have historically been important in enabling the Company to compete in the market to supply proppant to the natural gas and oil industry. The Company intends to enforce, and has in the past vigorously enforced, its patents. The Company may from time to time in the future be involved in litigation to determine the enforceability, scope and validity of its patent rights. In addition to patent rights, and perhaps more notably, the Company uses a significant amount of trade secrets, or “know-how,” and other proprietary information and technology in the conduct of its business. None of this “know-how” and technology is licensed from third parties.
Seasonality
Historically, the Company’s business has not been subject to regular material seasonality fluctuations. However, with the activity increase in resource plays in the northern and eastern United States, the Company has recently experienced higher levels of proppant sales activities during warmer weather periods and less during colder weather months. In addition, sales activities can be decreased by the spring snow and ice “break-up” in Canada, North Dakota, Montana, and the Northeast U.S., as well as the winter holidays in December and January.
Environmental and Other Governmental Regulations
The Company believes that its operations are in substantial compliance with applicable domestic and foreign federal, state and local environmental and safety laws and regulations.
Existing federal environmental requirements such as the Clean Air Act and the Clean Water Act, as amended, impose certain restrictions on air and water pollutants from the Company’s operations via permits and regulations. Those pollutants include volatile organic compounds, nitrogen oxides, sulfur dioxide, particulate matter, storm water and wastewater discharges and other by-products. In addition to meeting environmental requirements for existing operations, the Company must also demonstrate compliance with environmental regulations in order to obtain permits prior to any future expansion. The United States Environmental Protection Agency (“EPA”) and state programs require covered facilities to obtain individual permits or have coverage under an EPA general permit issued to groups of facilities. A number of federal and state agencies, including but not limited to, the EPA, the Texas Commission of Environmental Quality, the Louisiana Department of Environmental Quality, the Alabama Department of Environmental Management, the Wisconsin Department of Natural Resources, and the Georgia Environmental Protection Division, in states in which we do business, have environmental regulations applicable to our operations. Historically we have been able to obtain permits, where necessary, to build new facilities and modify existing facilities that allow us to continue compliant operations and obtaining these permits in a timely manner will continue to be an important factor in the Company’s ability to do so in the future.
8
Employees
As of December 31, 2014, the Company had 1,048 employees worldwide. In addition to the services of its employees, the Company employs the services of consultants as required. The Company’s employees are not represented by labor unions. There have been no work stoppages or strikes during the last three years that have resulted in the loss of production or production delays. The Company believes its relations with its employees are satisfactory.
Executive Officers of the Registrant
Gary A. Kolstad (age 56) was elected in June 2006, by the Company’s Board of Directors to serve as President and Chief Executive Officer and a Director of the Company. Mr. Kolstad previously served in a variety of positions over 21 years with Schlumberger. Mr. Kolstad became a Vice President of Schlumberger in 2001, where he last held the positions of Vice President, Oilfield Services – U.S. Onshore and Vice President, Global Accounts.
Ernesto Bautista III (age 43) joined the Company as a Vice President and Chief Financial Officer in January 2009. From July 2006 until joining the Company, Mr. Bautista served as Vice President and Chief Financial Officer of W-H Energy Services, Inc., a Houston, Texas based diversified oilfield services company (“W-H Energy”). From July 2000 to July 2006, he served as Vice President and Corporate Controller of W-H Energy. From September 1994 to May 2000, Mr. Bautista served in various positions at Arthur Andersen LLP, most recently as a manager in the assurance practice, specializing in emerging, high growth companies. Mr. Bautista is a certified public accountant in the State of Texas.
Don P. Conkle (age 50) was appointed Vice President, Marketing and Sales in October 2012. Mr. Conkle previously held a variety of domestic and international managerial positions in engineering, marketing and sales, and technology development over a 26 year period with Schlumberger. He served in the positions of Vice President of Stimulation Services from 2007 until 2009, as GeoMarket Manager (Qatar & Yemen) from 2009 until 2011 and as Production Group Marketing and Technology Director from 2011 until he joined the Company.
Roger Riffey (age 56) joined the Company in July 2006 as Director of Logistics and Customer Service. He was appointed Plant Manager of the Toomsboro, Georgia, facility in July 2010, and was named Vice President, Manufacturing in May 2013. Previously, Mr. Riffey held positions with Rio Tinto Energy in Special Projects, U.S. Borax as Global Logistics Manager and Kerr-McGee Coal Corporation as Manager of Marketing.
R. Sean Elliott (age 40) joined the Company in November 2007 as General Counsel, and was appointed as Corporate Secretary and Chief Compliance Officer in January 2008 and as a Vice President of the Company in May 2011. Previously, Mr. Elliott served as legal counsel to Aviall, Inc. (an international aviation company) from 2004 to 2007, where he last held the positions of Assistant General Counsel and Assistant Secretary. From 1999 until 2004, Mr. Elliott practiced law with Haynes and Boone, LLP, a Dallas, Texas-based law firm.
All officers are elected for one-year terms or until their successors are duly elected. There are no arrangements between any officer and any other person pursuant to which he was selected as an officer. There is no family relationship between any of the named executive officers or between any of them and the Company’s directors.
Forward-Looking Information
The Private Securities Litigation Reform Act of 1995 provides a “safe harbor” for forward-looking statements. This Form 10-K, the Company’s Annual Report to Shareholders, any Form 10-Q or any Form 8-K of the Company or any other written or oral statements made by or on behalf of the Company may include forward-looking statements which reflect the Company’s current views with respect to future events and financial performance. The words “believe”, “expect”, “anticipate”, “project”, “estimate”, “forecast”, “plan” or “intend”
9
and similar expressions identify forward-looking statements. Readers are cautioned not to place undue reliance on these forward-looking statements, each of which speaks only as of the date the statement was made. The Company undertakes no obligation to publicly update or revise any forward-looking statements, whether as a result of new information, future events or otherwise. The Company’s forward-looking statements are based on assumptions that we believe to be reasonable but that may not prove to be accurate. All of the Company’s forward-looking information is subject to risks and uncertainties that could cause actual results to differ materially from the results expected. Although it is not possible to identify all factors, these risks and uncertainties include the risk factors discussed below.
The Company’s results of operations could be adversely affected if its business assumptions do not prove to be accurate or if adverse changes occur in the Company’s business environment, including but not limited to:
| • | a potential decline in the demand for oil and natural gas; |
| • | potential declines or increased volatility in oil and natural gas prices that would adversely affect our customers, the energy industry or our production costs; |
| • | potential reductions in spending on exploration and development drilling in the oil and natural gas industry that would reduce demand for our products and services; |
| • | seasonal sales fluctuations; |
| • | an increase in competition in the proppant market, including imports from foreign countries; |
| • | logistical and distribution challenges relating to certain resource plays that do not have the type of infrastructure systems that are needed to efficiently support oilfield services activities; |
| • | the development of alternative stimulation techniques, such as extraction of oil or gas without fracturing; |
| • | increased governmental regulation of hydraulic fracturing; |
| • | increased regulation of emissions from our manufacturing facilities; |
| • | the development of alternative proppants for use in hydraulic fracturing; |
| • | general global economic and business conditions; |
| • | an increase in raw materials costs; |
| • | fluctuations in foreign currency exchange rates; and |
| • | the potential expropriation of assets by foreign governments. |
The Company’s results of operations could also be adversely affected as a result of worldwide economic, political and military events, including, but not limited to, war, terrorist activity or initiatives by the Organization of the Petroleum Exporting Countries (“OPEC”). For further information, see “Item 1A. Risk Factors.”
Available Information
The Company’s annual reports on Form 10-K, proxy statements, quarterly reports on Form 10-Q, current reports on Form 8-K and amendments to those reports filed or furnished pursuant to Section 13(a) or 15(d) of the Securities Exchange Act of 1934 (“Exchange Act”) are made available free of charge on the Company’s internet website at http://www.carboceramics.com as soon as reasonably practicable after such material is filed with, or furnished to, the Securities and Exchange Commission (“SEC”).
The public may read and copy any materials that the Company files with the SEC at the SEC’s Public Reference Room at 100 F Street, Room 1580, N.E., Washington, D.C. 20549. The public may obtain information on the operation of the Public Reference Room by calling the SEC at 1-800-SEC-0330. The SEC maintains an Internet site that contains reports, proxy and information statements, and other information regarding issuers that file electronically with the SEC, at http://www.sec.gov.
10
| Item 1A. | Risk Factors |
You should consider carefully the trends, risks and uncertainties described below and other information in this Form 10-K and subsequent reports filed with the SEC before making any investment decision with respect to our securities. If any of the following trends, risks or uncertainties actually occurs or continues, our business, financial condition or operating results could be materially adversely affected, the trading prices of our securities could decline, and you could lose all or part of your investment.
Our business and financial performance depend on the level of activity in the natural gas and oil industries.
Our operations are materially dependent upon the levels of activity in natural gas and oil exploration, development and production. More specifically, the demand for our products is closely related to the number of natural gas and oil wells completed in geologic formations where ceramic or resin-coated sand proppants are used in fracture treatments. These activity levels are affected by both short-term and long-term trends in natural gas and oil prices. In recent years, natural gas and oil prices and, therefore, the level of exploration, development and production activity, have experienced significant fluctuations. Worldwide economic, political and military events, including war, terrorist activity, events in the Middle East and initiatives by OPEC, have contributed, and are likely to continue to contribute, to price volatility. Additionally, warmer than normal winters in North America and other weather patterns may adversely impact the short-term demand for natural gas and, therefore, demand for our products and services. Natural gas prices experienced a significant decline during 2012 and remained low throughout 2013 and 2014, which resulted in a decline in the United States drilling rig count. Further, the price of oil declined significantly during the second half of 2014, and currently remains low. This reduction in natural gas and oil prices has depressed the level of natural gas and oil exploration, development, production and well completions activity and resulting demand for our products. This decline has had an adverse impact on our results of operations and could have a material adverse effect on our financial condition if natural gas and oil prices and well completion activity do not improve.
Our business and financial performance could suffer if the levels of hydraulic fracturing decrease or cease as a result of the development of new processes, increased regulation or a decrease in horizontal drilling activity.
Substantially all of our products are proppants used in the completion and re-completion of natural gas and oil wells through the process of hydraulic fracturing. In addition, demand for our proppants is substantially higher in the case of horizontally drilled wells, which allow for multiple hydraulic fractures within the same well bore but are more expensive to develop than vertically drilled wells. A reduction in horizontal drilling or the development of new processes for the completion of natural gas and oil wells leading to a reduction in, or discontinuation of the use of, hydraulic fracturing could cause a decline in demand for our products. Additionally, increased regulation or environmental restrictions on hydraulic fracturing or the materials used in this process could negatively affect our business by increasing the costs of compliance or resulting in operational delays, which could cause operators to abandon the process due to commercial impracticability. Moreover, future federal, state local or foreign laws or regulations could otherwise limit or ban hydraulic fracturing. Several states in which our customers operate have adopted, or are considering adopting, regulations that have imposed, or could impose, more stringent permitting, transparency, disposal and well construction requirements on hydraulic fracturing operations. Some states, such as New York, have banned the process of hydraulic fracturing altogether. Similar efforts have been proposed in other states. Any of these events could have a material adverse effect on our results of operations and financial condition.
We face distribution and logistical challenges in our business
As oil and natural gas prices fluctuate, our customers may shift their focus back and forth between different resource plays, some of which can be located in geographic areas that do not have well-developed transportation and distribution infrastructure systems. Transportation and logistical operating expenses continue to comprise a significant portion of our total delivered cost of sales. Therefore, serving our clients in these less-developed areas
11
presents distribution and other operational challenges that affect our sales and negatively impact our operating costs. Disruptions in transportation services, including shortages of rail cars or a lack of rail transportation services or developed infrastructure, could affect our ability to timely and cost effectively deliver to our customers and could provide a competitive advantage to competitors located in closer proximity to customers. Additionally, increases in the price of diesel fuel could negatively impact operating costs if we are unable to pass those increased costs along to our customers. Failure to find long-term solutions to these logistical challenges could adversely affect our ability to respond quickly to the needs of our customers or result in additional increased costs, and thus could negatively impact our results of operations and financial condition.
We operate in an increasingly competitive market.
The proppant market is highly competitive and no one supplier is dominant. We compete with other domestic and international suppliers of ceramic proppant, as well as with suppliers of sand for use as proppant, in the hydraulic fracturing of natural gas and oil wells. The expiration of key patents owned by the Company has resulted in additional competition in the market for ceramic proppant. Specifically, Chinese manufacturers now import ceramic proppant of varying quality into North America, which has led to an oversupply of product in the marketplace. While we believe our ceramic proppant can be differentiated from low quality imports, the oversupply in the marketplace had resulted in pricing and margin pressures. In 2014 and 2013, ceramic proppant imports from China decreased somewhat when compared to early 2012, but these imports were still present in the market. The entry of additional competitors into the market to supply ceramic proppant or a surge in the level of ceramic proppant imports into North America could have a material adverse effect on our results of operations and financial condition.
We may be adversely affected by decreased demand for our proppant or the development by our competitors of effective alternative proppants.
Ceramic proppant is a premium product capable of withstanding higher pressure and providing more highly conductive fractures than mined sand, which is the most commonly used proppant type. During the second half of 2014, we saw some E&P operators that have traditionally used ceramic proppant experiment with the use of mined sand in its place. Although we believe that the use of ceramic proppant or resin-coated sand generates higher production rates and more favorable production economics than mined sand, a significant shift in demand from ceramic proppant to resin-coated sand or mined sand could have a material adverse effect on our results of operations and financial condition. The development and use of effective alternative proppant could also cause a decline in demand for our products, and could have a material adverse effect on our results of operations and financial condition.
We rely upon, and receive a significant percentage of our revenues from, a limited number of key customers and end users.
During 2014, our key customers included several of the largest participants in the worldwide petroleum pressure pumping industry. Two of these customers accounted collectively for approximately 52% of our 2014 revenues. However, the end users of our products are numerous operators of natural gas and oil wells that hire pressure pumping service companies to hydraulically fracture wells. During 2014, a majority of our ceramic proppant sales were directed to a concentrated number of end users. We generally supply our domestic pumping service customers with products on a just-in-time basis, with transactions governed by individual purchase orders. Continuing sales of product depend on our direct customers and the end user well operators being satisfied with product quality, pricing, availability and delivery performance. While we believe our relations with our customers and our end users are satisfactory, a material decline in the level of sales to any one of our major customers or loss of a key end user due to unsatisfactory product performance, pricing, delivery delays or any other reason could have a material adverse effect on our results of operations and financial condition.
12
The operations of our customers, and thus the results of our operations, are subject to a number of operational risks, interruptions and seasonal trends.
As hydraulic fracturing jobs have increased in size and intensity, common issues such as weather, equipment delays or changes in the location and types of oil and natural gas plays can result in increased variability in proppant sales volumes. Our business operations and those of our customers involve a high degree of operational risk. Natural disasters, adverse weather conditions, collisions and operator error could cause personal injury or loss of life, severe damage to and destruction of property, equipment and the environment, and suspension of operations. Our customers perform work that is subject to unexpected or arbitrary interruption or termination. The occurrence of any of these events could result in work stoppage, loss of revenue, casualty loss, increased costs and significant liability to third parties. We have not historically considered seasonality to be a significant risk, but with the increase in resource plays in the northern and eastern United States as well as our operations in Marshfield, Wisconsin, our results of operations are exposed to seasonal variations and inclement weather. Operations in certain regions involve more seasonal risk in the winter months, and work is hindered during other inclement weather events. This variability makes it more difficult to predict sales and can result in greater fluctuations to our quarterly financial results. These quarterly fluctuations could result in operating results that are below the expectations of public market analysts and investors, and therefore may adversely affect the market price for our common stock.
The ability of our customers to complete work, as well as our ability to mine sand from cold climate areas, could be affected during the winter months. Our revenue and profitability could decrease during these periods and in other severe weather conditions because work is either prevented or more costly to complete. If a substantial amount of production is interrupted, our cash flow and, in turn, our results of operations could be materially and adversely affected.
We will require a significant amount of cash to meet our needs, which depends on many factors beyond our control.
Our primary source of liquidity is cash on hand, cash flow from operations and borrowing capacity under our revolving credit facility, subject to certain limitations contained in the agreement for that facility. Based on our current and anticipated levels of operations and conditions in our markets, we believe that cash on hand, cash flow from operations, borrowing capacity under our credit facility and cash flow from other liquidity-generating transactions will enable us to meet our working capital, capital expenditure, debt service and other funding requirements for at least the next twelve months. However, our ability to fund our working capital, capital expenditures, debt service and other obligations and to comply with the financial covenants under our credit facility depends on our future operating performance and cash from operations and other liquidity-generating transactions, which are in turn subject to prevailing oil and gas prices, economic conditions and other factors, many of which are beyond our control. If our future operating performance does not meet our expectation or our plans materially change in an adverse manner or prove to be materially inaccurate, we may need additional financing. Adverse securities and credit market conditions could significantly affect the availability of equity or debt financing. Future financing transactions may further increase interest expense, which could in turn reduce our financial flexibility and our ability to fund other activities and make us more vulnerable to changes in operating performance or economic downturns generally. There can be no assurance that additional financing, if permitted under the terms of our credit facility, will be available on terms acceptable to us or at all. The inability to generate sufficient cash or obtain additional financing could have a material adverse effect on our financial condition and on our ability to meet our obligations or pursue strategic initiatives.
A significant portion of our ceramic proppant is manufactured at one of our plants. All of our mined sand is processed at another plant. Any adverse developments at those plants could have a material adverse effect on our financial condition and results of operations.
Our Toomsboro, Georgia plant currently represents approximately 42% of our total annual capacity at our existing ceramic proppant manufacturing facilities. Our Marshfield, Wisconsin plant represents 100% of our
13
annual mined sand processing capacity. Any adverse developments at these plants, including a material disruption in production, an inability to supply the plant with raw materials at a competitive cost, or adverse developments due to catastrophic events, could have a material adverse effect on our financial condition and results of operations.
We provide environmental warranties on certain of our containment and spill prevention products.
Falcon Technologies’ tank liners, secondary containments and related products and services are designed to contain or avoid spills of hydrocarbons and other materials. If a release of these materials occurs, it could be harmful to the environment. Although we attempt to negotiate appropriate limitations of liability in the applicable terms of sale, some customers have required expanded warranties, indemnifications or other terms that could hold Falcon Technologies responsible in the event of a spill or release under particular circumstances. If Falcon Technologies is held responsible for a spill or release of materials from one of its customer’s facilities, it could have a material adverse effect on our results of operations and financial condition.
We rely upon intellectual property to protect our proprietary rights. Failure to protect our intellectual property rights may affect our competitive position, and protecting our rights or defending against third-party allegations of infringement may be costly.
The Company uses a significant amount of trade secrets, or “know-how,” and other proprietary information and technology in the conduct of its business. In some cases, we rely on trade secrets, trademarks or contractual restrictions to protect intellectual property rights that are not patented. The steps we take to protect the non-patented intellectual property may not be sufficient to protect it and any loss or diminishment of such intellectual property rights could negatively impact our competitive advantage. Additionally, our competitors could independently develop the same or similar technologies that are only protected by trade secret and thus do not prevent third parties from competing with us. Furthermore, even protected intellectual property rights can be infringed upon by third parties. Monitoring unauthorized use of Company intellectual property can be difficult and expensive, and adequate remedies may not be available.
Although the Company does not believe that it is infringing upon the intellectual property rights of others by using such proprietary information and technology, it is possible that such a claim might be asserted against the Company in the future. In the event any third party makes a claim against us for infringement of patents or other intellectual property rights of a third party, such claims, with or without merit, could be time-consuming and result in costly litigation. In addition, the Company could experience loss or cancellation of customer orders, experience product shipment delays, or be subject to significant liabilities to third parties. If our products or services were found to infringe on a third party’s proprietary rights, the Company could be required to enter into royalty or licensing agreements to continue selling its products or services. Royalty or licensing agreements, if required, may not be available on acceptable terms, if at all, which could seriously harm our business. Involvement in any patent dispute or other intellectual property dispute or action to protect trade secrets and expertise could have a material adverse effect on the Company’s business.
Significant increases in fuel prices for any extended periods of time will increase our operating expenses.
The price and supply of natural gas are unpredictable, and can fluctuate significantly based on international, political and economic circumstances, as well as other events outside of our control, such as changes in supply and demand due to weather conditions, actions by OPEC and other oil and gas producers, regional production patterns and environmental concerns. Natural gas is a significant component of our direct manufacturing costs and price escalations will likely increase our operating expenses and can have a negative impact on income from operations and cash flows. We operate in a competitive marketplace and may not be able to pass through all of the increased costs that could result from an increase in the cost of natural gas.
14
Environmental compliance costs and liabilities could reduce our earnings and cash available for operations.
We are subject to increasingly stringent laws and regulations relating to environmental protection, including laws and regulations governing air emissions, water discharges and waste management. The technical requirements of complying with these environmental laws and regulations are becoming increasingly expensive and complex, and may affect the Company’s ability to expand its operations. Our ability to continue the expansion of our manufacturing capacity to meet market demand is contingent upon obtaining required environmental permits and compliance with their terms, which continue to be more restrictive and require longer lead times to obtain in anticipation of any efforts to expand and increase capacity. We incur, and expect to continue to incur, capital and operating costs to comply with environmental laws and regulations.
In addition, we use some hazardous substances and generate certain industrial wastes in our operations. Many of our current and former properties are or have been used for industrial purposes. Accordingly, we could become subject to potentially material liabilities relating to the investigation and cleanup of contaminated properties, and to claims alleging personal injury or property damage as the result of exposures to, or releases of, hazardous substances. These laws also may provide for “strict liability” for damages to natural resources or threats to public health and safety. Strict liability can render a party liable for environmental damage without regard to negligence or fault on the part of the party. Some environmental laws provide for joint and several strict liability for remediation of spills and releases of hazardous substances.
Stricter enforcement of existing laws and regulations, new laws and regulations, the discovery of previously unknown contamination or the imposition of new or increased requirements could restrict our expansion efforts, require us to incur costs, or become the basis of new or increased liabilities. Any of these events could reduce our earnings and our cash available for operations.
Our international operations subject us to risks inherent in doing business on an international level that could adversely impact our results of operations.
International revenues accounted for approximately 24%, 21% and 23% of our total revenues in 2014, 2013 and 2012, respectively. We may not succeed in overcoming the risks that relate to or arise from operating in international markets. Risks inherent in doing business on an international level include, among others, the following:
| • | economic and political instability (including as a result of the threat or occurrence of armed international conflict or terrorist attacks); |
| • | changes in regulatory requirements, tariffs, customs, duties and other trade barriers; |
| • | transportation delays and costs; |
| • | power supply shortages and shutdowns; |
| • | difficulties in staffing and managing foreign operations and other labor problems; |
| • | currency rate fluctuations, convertibility and repatriation; |
| • | taxation of our earnings and the earnings of our personnel; |
| • | potential expropriation of assets by foreign governments; and |
| • | other risks relating to the administration of or changes in, or new interpretations of, the laws, regulations and policies of the jurisdictions in which we conduct our business. |
In particular, we are subject to risks associated with our production facilities in Luoyang, China, and Kopeysk, Russia. For example, during 2014, we recognized an impairment in the value of our production facility in China. The legal systems in both China and Russia are still developing and are subject to change. Accordingly, our operations and orders for products in both countries could be adversely impacted by changes to or interpretation of each country’s law. Moreover, during 2014, some parts of our Russian operations were impacted
15
by the imposition of trade sanctions enacted by the U.S. government in response to the ongoing conflict in The Ukraine. Further, if manufacturing in either region is disrupted, our overall capacity could be significantly reduced and sales and/or profitability could be negatively impacted.
Undetected defects in our fracture simulation software could adversely affect our business.
Despite extensive testing, our software could contain defects, bugs or performance problems. If any of these problems are not detected, the Company could be required to incur extensive development costs or costs related to product recalls or replacements. The existence of any defects, errors or failures in our software products may subject us to liability for damages, delay the development or release of new products and adversely affect market acceptance or perception of our software products or related services, any one of which could materially and adversely affect the Company’s business, results of operations and financial condition.
The market price of our common stock will fluctuate, and could fluctuate significantly.
The market price of the Company’s common stock will fluctuate, and could fluctuate significantly, in response to various factors and events, including the following:
| • | the liquidity of the market for our common stock; |
| • | seasonal or quarterly sales fluctuations; |
| • | differences between our actual financial or operating results and those expected by investors and analysts; |
| • | changes in analysts’ recommendations or projections; |
| • | new statutes or regulations or changes in interpretations of existing statutes and regulations affecting our business; |
| • | changes in general economic or market conditions; and |
| • | broad market fluctuations. |
Our actual results could differ materially from results anticipated in forward-looking statements we make.
Some of the statements included or incorporated by reference in this Form 10-K are forward-looking statements. These forward-looking statements include statements relating to trends in the natural gas and oil industries, the demand for ceramic proppant and our performance in the “Management’s Discussion and Analysis of Financial Condition and Results of Operations” and “Business” sections of this Form 10-K. In addition, we have made and may continue to make forward-looking statements in other filings with the SEC, and in written material, press releases and oral statements issued by us or on our behalf. Forward-looking statements include statements regarding the intent, belief or current expectations of the Company or its officers. Our actual results could differ materially from those anticipated in these forward-looking statements. See “Business–Forward-Looking Information.”
| Item 1B. | Unresolved Staff Comments |
Not applicable.
| Item 2. | Properties |
The Company maintains its corporate headquarters in leased office space in Houston, Texas and also leases space for its technology center in Houston. The Company owns its manufacturing facilities, land and substantially all of the related production equipment in New Iberia, Louisiana, Eufaula, Alabama, and Kopeysk, Russia and leases its McIntyre, Toomsboro, and Millen, Georgia, facilities. The Company owns the buildings and
16
production equipment at its facility in Luoyang, China, and has been granted use of the land on which the facility is located through 2051 under the terms of a land use agreement with the People’s Republic of China.
The facilities in McIntyre and Toomsboro, Georgia, include real property, plant and equipment that are leased by the Company from the Development Authority of Wilkinson County. The original lease was executed in 1997 and was last amended in 2008. The term of the current lease, which covers both locations, terminates on November 1, 2017, subject to the Company’s ability to renew the lease through November 2022. Under the terms of the lease, the Company is responsible for all costs incurred in connection with the premises, including costs of construction of the plant and equipment. At the termination of the lease, title to all of the real property, plant and equipment is to be conveyed to the Company in exchange for nominal consideration. The Company has the right to purchase the property, plant and equipment at any time during the term of the lease for a nominal price.
In November 2012, the Company entered into a lease for the land and improvements associated with the construction of a plant in Millen, Georgia. The lease term continues until the tenth anniversary of the completion of the last phase of the facility. Similar to lease terms of the two other Georgia facilities, the Millen lease requires the Company to be responsible for all costs (including construction costs) incurred in connection with the premises. Moreover, title to the real property, plant and equipment of the facility is to be conveyed to the Company at the end of the lease term for nominal consideration, and may be purchased by the Company at any time for a nominal price. The Company completed construction and commenced operations of the first 250 million pound ceramic production line in Millen during 2014. In addition, the Company began the construction on a second 250 million pound production line in Millen. However, due to current market conditions, the construction and completion of this second line has been temporarily suspended.
The Marshfield, Wisconsin sand processing plant, which became operational during 2012, is located on land owned by the Company. The Company made a decision that it will not move forward with construction of a resin coating plant in Marshfield, Wisconsin for which the Company had previously developed engineering plans and procured certain equipment that had long-lead delivery times.
The Company owns or otherwise utilizes distribution facilities in multiple locations around the world. See “Item 1. Business – Distribution.”
The Company owns approximately 4,235 acres of land and leasehold interests near its plants in Georgia and Alabama. The land contains raw material for use in the production of the Company’s lightweight ceramic proppants. The Company also holds approximately 490 acres of land and leasehold interests in Wisconsin near its resin-coating facility under construction in Marshfield, Wisconsin.
Falcon Technologies owns its service facility located in Decatur, Texas, and leases other regional service facilities within the United States.
| Item 3. | Legal Proceedings |
From time to time, the Company is the subject of legal proceedings arising in the ordinary course of business. The Company does not believe that any of these proceedings will have a material adverse effect on its business or its results of operations.
| Item 4. | Mine Safety Disclosure |
Several of our U.S. manufacturing facilities process mined minerals, and therefore are viewed as mine operations subject to regulation by the federal Mine Safety and Health Administration under the Federal Mine Safety and Health Act of 1977. Information concerning mine safety violations or other regulatory matters required by section 1503(a) of the Dodd-Frank Wall Street Reform and Consumer Protection Act and the recently proposed Item 106 of Regulation S-K (17 CFR 229.106) is included in Exhibit 95 to this annual report.
17
PART II
| Item 5. | Market for Registrant’s Common Equity, Related Stockholder Matters and Issuer Purchases of Equity Securities |
Common Stock Market Prices, Dividends and Stock Repurchases
The Company’s common stock is traded on the New York Stock Exchange (ticker symbol CRR). The number of record and beneficial holders of the Company’s common stock as of February 1, 2015 was approximately 22,316.
The following table sets forth the high and low sales prices of the Company’s common stock on the New York Stock Exchange and dividends for the last two fiscal years:
| 2014 | 2013 | |||||||||||||||||||||||
| Sales Price | Cash Dividends Declared (1) |
Sales Price | Cash Dividends Declared (2) |
|||||||||||||||||||||
| Quarter Ended |
High | Low | High | Low | ||||||||||||||||||||
| March 31 |
$ | 137.99 | $ | 105.78 | $ | 0.60 | $ | 97.53 | $ | 75.03 | $ | 0.54 | ||||||||||||
| June 30 |
154.12 | 131.23 | — | 92.74 | 65.64 | — | ||||||||||||||||||
| September 30 |
150.22 | 59.23 | 0.66 | 104.95 | 65.63 | 0.60 | ||||||||||||||||||
| December 31 |
57.16 | 34.10 | — | 126.00 | 97.68 | — | ||||||||||||||||||
| (1) | Represents quarters during which dividends were declared. The payment months for cash dividends were February 2014 ($0.30), May 2014 ($0.30), August 2014 ($0.33) and November 2014 ($0.33). |
| (2) | Represents quarters during which dividends were declared. The payment months for cash dividends were February 2013 ($0.27), May 2013 ($0.27), August 2013 ($0.30) and November 2013 ($0.30). |
The Company currently expects to continue its policy of paying quarterly cash dividends, although there can be no assurance as to future dividends because they depend on future earnings, capital requirements and financial condition.
On August 28, 2008, the Company’s Board of Directors authorized the repurchase of up to two million shares of the Company’s common stock. Shares are effectively retired at the time of purchase. The Company completed the repurchase of all of the shares authorized by this plan by the end of the third quarter of 2014.
On January 28, 2015, the Company’s Board of Directors authorized the repurchase of up to an additional two million shares of the Company’s common stock. Shares are effectively retired at the time of purchase. As of February 17, 2015, the Company had not yet repurchased any shares under the plan.
The following table provides information about the Company’s repurchases of common stock during the quarter ended December 31, 2014, all of which represent shares surrendered to the Company for tax withholding obligations upon the vesting of restricted stock:
ISSUER PURCHASES OF EQUITY SECURITIES
| Period |
Total Number of Shares Purchased |
Average Price Paid per Share |
Total Number of Shares Purchased as Part of Publicly Announced Plan (1) |
Maximum Number of Shares that May Yet be Purchased Under the Plan (2) |
||||||||||||
| 10/01/14 to 10/31/14 |
1,445 | (3) | $ | 57.11 | — | 0 | ||||||||||
| 11/01/14 to 11/30/14 |
91 | (3) | $ | 49.70 | — | 0 | ||||||||||
| 12/01/14 to 12/31/14 |
— | $ | — | — | 0 | |||||||||||
| Total |
1,536 | (3) | — | |||||||||||||
18
| (1) | On August 28, 2008, the Company announced the authorization by its Board of Directors for the repurchase of up to two million shares of its Common Stock. |
| (2) | Represents the maximum number of shares that may be repurchased under the 2008 plan as of period end. As of February 17, 2015, a maximum of 2,000,000 shares may be repurchased under the 2015 plan. |
| (3) | Represents shares of stock withheld for the payment of withholding taxes upon the vesting of restricted stock. |
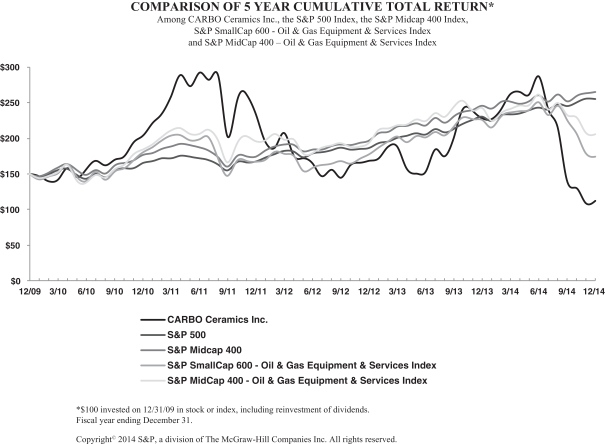
Stock Performance Graph
The graph below compares the cumulative shareholder return on the Company’s common stock with the cumulative returns of the the S&P 500 index, the S&P Midcap 400 index, the S&P SmallCap 600 – Oil & Gas Equipment & Services index, and the S&P MidCap 400 – Oil & Gas Equipment & Services index. As of February 10, 2015, the Company has moved from being listed on the S&P MidCap 400 – Oil & Gas Equipment & Services Index to the S&P SmallCap 600 – Oil & Gas Equipment & Services Index. The graph tracks the performance of a $100 investment in the Company’s common stock and in each of the indexes (with the reinvestment of all dividends) from December 31, 2009 to December 31, 2014.
19
| Item 6. | Selected Financial Data |
The following selected financial data are derived from the audited consolidated financial statements of the Company. The data should be read in conjunction with Management’s Discussion and Analysis of Financial Condition and Results of Operations and the consolidated financial statements and notes thereto included elsewhere in this Form 10-K.
| Years ended December 31, | ||||||||||||||||||||
| 2014 | 2013 | 2012 | 2011 | 2010 | ||||||||||||||||
| ($ in thousands, except per share data) | ||||||||||||||||||||
| Statement of Income Data: |
||||||||||||||||||||
| Revenues . |
$ | 648,325 | $ | 667,398 | $ | 645,536 | $ | 625,705 | $ | 473,082 | ||||||||||
| Cost of sales . |
467,045 | 474,403 | 422,031 | 363,990 | 298,411 | |||||||||||||||
|
|
|
|
|
|
|
|
|
|
|
|||||||||||
| Gross profit |
181,280 | 192,995 | 223,505 | 261,715 | 174,671 | |||||||||||||||
| Selling, general, & administrative expenses |
72,535 | 68,447 | 64,033 | 62,381 | 52,635 | |||||||||||||||
| Other operating expenses (1) |
15,890 | (43 | ) | 586 | 1,732 | 2,426 | ||||||||||||||
|
|
|
|
|
|
|
|
|
|
|
|||||||||||
| Operating profit |
92,855 | 124,591 | 158,886 | 197,602 | 119,610 | |||||||||||||||
| Other income (expense), net |
16 | 610 | (296 | ) | (152 | ) | (261 | ) | ||||||||||||
|
|
|
|
|
|
|
|
|
|
|
|||||||||||
| Income before income taxes |
92,871 | 125,201 | 158,590 | 197,450 | 119,349 | |||||||||||||||
| Income taxes |
37,283 | 40,315 | 52,657 | 67,314 | 40,633 | |||||||||||||||
|
|
|
|
|
|
|
|
|
|
|
|||||||||||
| Net income |
$ | 55,588 | $ | 84,886 | $ | 105,933 | $ | 130,136 | $ | 78,716 | ||||||||||
|
|
|
|
|
|
|
|
|
|
|
|||||||||||
| Earnings per share: |
||||||||||||||||||||
| Basic |
$ | 2.41 | $ | 3.67 | $ | 4.59 | $ | 5.62 | $ | 3.41 | ||||||||||
|
|
|
|
|
|
|
|
|
|
|
|||||||||||
| Diluted |
$ | 2.41 | $ | 3.67 | $ | 4.59 | $ | 5.62 | $ | 3.40 | ||||||||||
|
|
|
|
|
|
|
|
|
|
|
|||||||||||
| December 31, | ||||||||||||||||||||
| 2014 | 2013 | 2012 | 2011 | 2010 | ||||||||||||||||
| ($ in thousands, except per share data) | ||||||||||||||||||||
| Balance Sheet Data: |
||||||||||||||||||||
| Current assets |
$ | 337,611 | $ | 371,382 | $ | 349,917 | $ | 302,565 | $ | 237,655 | ||||||||||
| Current liabilities |
77,415 | 56,688 | 50,830 | 79,066 | 51,247 | |||||||||||||||
| Property, plant and equipment, net |
568,716 | 478,535 | 426,232 | 392,659 | 338,483 | |||||||||||||||
| Total assets |
934,226 | 878,951 | 808,878 | 740,865 | 599,571 | |||||||||||||||
| Total shareholders’ equity |
776,057 | 768,587 | 713,078 | 630,158 | 521,979 | |||||||||||||||
| Cash dividends per share |
$ | 1.26 | $ | 1.14 | $ | 1.02 | $ | 0.88 | $ | 0.76 | ||||||||||
| (1) | Other operating expenses include costs of start-up activities and gains/losses on disposal or impairment of assets. |
20
| Item 7. | Management’s Discussion and Analysis of Financial Condition and Results of Operations |
Executive Level Overview
CARBO Ceramics Inc. is an oilfield service technology company that generates revenue primarily through the sale of products and services to the oil and gas industry for production enhancement and environmental services.
Our production enhancement businesses promote increased E&P Operators’ production and EUR by providing industry leading technology to Design, Build, and Optimize the FracTM. Our environmental services business is intended to protect E&P Operators’ assets, minimizes environmental risk, and lowers operating costs (LOE).
The Company’s principal business consists of manufacturing and selling proppant products for use primarily in the hydraulic fracturing of oil and natural gas wells. These proppant products include ceramic, resin-coated sand and raw sand. The Company, through its wholly-owned subsidiary StrataGen, Inc., also provides the industry’s most widely used hydraulic fracture simulation software under the brand FracPro®, as well as hydraulic fracture design and consulting services under the brand StrataGen. Falcon Technologies, a wholly-owned subsidiary of the Company, uses proprietary technology to provide products that are designed to enable its clients to extend the life of their storage assets, reduce the potential for hydrocarbon spills and provide containment of stored materials.
The Company’s products and services help oil and gas producers increase production and recovery rates from their wells, thereby lowering overall finding and development (“F&D”) costs. As a result, the Company’s business is dependent to a large extent on the level of drilling and hydraulic fracturing activity in the oil and gas industry worldwide. Although the Company’s ceramic proppants are more expensive than alternative non-ceramic proppants, the Company has been able to demonstrate the cost-effectiveness of its products to numerous operators of oil and gas wells through increased technical marketing activity. The Company believes its future prospects benefit from both an increase in drilling and hydraulic fracturing activity worldwide and the desire of industry participants to improve production results and lower their overall development costs.
The Company believes international sales will continue to represent an important role in its business. International revenues represented 24%, 21% and 23% of total revenues in 2014, 2013 and 2012, respectively.
Management believes the addition of new manufacturing capacity is critical to the Company’s ability to continue its long-term growth in sales volume and revenue for ceramic proppant and resin-coated ceramic proppant. The Company completed construction and commenced operations on the first 250 million pound line in Millen, Georgia during 2014. The Company also began construction on a second 250 million pound line in Millen during 2014. However, due to current market conditions, the construction and completion of this second line has been temporarily suspended. Once the second line at the Millen, Georgia facility is completed, the Company’s ceramic manufacturing capacity will total 2.25 billion pounds per year. Although the Company has operated near or at full capacity at times during the previous ten years, the addition of significant new capacity, as well as the addition of resin-coating capacity, could adversely impact operating profit margins if the timing of this new capacity does not match increases in demand for the Company’s products. In addition, the ability to construct new capacity will be contingent upon the receipt of all needed environmental emission permits. See “Item 1 – Business” and “Item 1A – Risk Factors”.
Operating profit margin for the Company’s ceramic proppant business is principally impacted by sales volume, product mix, sales price, distribution costs, manufacturing costs, including natural gas, and the Company’s production levels as a percentage of its capacity. The level of selling, general and administrative spending, as well as other operating expenses, can also impact operating profit margins. In 2013 and 2014, operating profit margin was also impacted by spending to bring the Company’s new KRYPTOSPHERETM proppant technology to a commercial state. And, in 2014, the Company recognized asset impairment charges related to certain long-lived assets.
21
Although most direct manufacturing expenses have been relatively stable or predictable over time, the Company has experienced volatility in the cost of natural gas, which is used in production by the Company’s domestic manufacturing facilities. The cost of natural gas has been a significant component of total monthly domestic direct production expense. In recent years, the price of natural gas has been low compared to historical prices, as well as fairly stable from period to period. However, in an effort to mitigate volatility in the cost of natural gas purchases and reduce exposure to short term spikes in the price of this commodity, the Company contracts in advance for portions of its future natural gas requirements. Despite the efforts to reduce exposure to changes in natural gas prices, it is possible that, given the significant portion of manufacturing costs represented by this item, gross margins as a percentage of sales may decline and changes in net income may not directly correlate to changes in revenue.
As a result of the decline in North American activity in natural gas basins experienced in 2012, the oil and natural gas industry experienced an increased amount of activity in infrastructure-limited, liquids-rich basins, which introduced supply chain challenges to the industry. These challenges resulted in higher supply chain costs for the Company. As a result, the Company has invested in strategic projects to enhance its distribution network in order to meet the present and future demands of its clients. The Company believes these investments should help address the quarterly fluctuations in industry activity and the increased amount of proppant being used per well. These enhancements are important as the tight supply of available trucks in certain areas can create additional challenges with transporting proppants to the well site throughout the industry.
In 2012, the Company expanded its resin coating operations and also began processing raw sand for use in resin coating operations. In 2013, the Company began selling raw frac sand. Resin coated sand and raw frac sand products sell at much lower prices and with lower gross profit margins than the Company’s ceramic proppant. While gross profit is generally not meaningfully impacted by the sale of these products, given the current sales volumes, the Company’s overall gross profit margin as a percent of revenues can be affected as can the overall average selling price of all proppants sold.
During the second half of 2013, the Company introduced KRYPTOSPHERETM HD, a new ultra-high conductivity, ultra-high strength proppant. Product testing and qualifications with the Company’s clients is ongoing, and the first KRYPTOSPHERE HD sale was made during the fourth quarter of 2014. The next phase of KRYPTOSPHERETM product development will be to apply this technology to the Company’s existing manufacturing footprint.
As the Company has expanded its operations in both domestic and international markets, there has been an increase in activities and expenses related to marketing, research and development, and finance and administration. As a result, selling, general and administrative expenses have increased in recent years. However, the Company intends to reduce its cost base to better match anticipated activity in 2015, including a reduction in SG&A costs from 2014 levels.
General Business Conditions
The Company’s proppant business is impacted by the number of natural gas and oil wells drilled in North America, and the need to hydraulically fracture these wells. In markets outside North America, sales of the Company’s products are also influenced by the overall level of drilling and hydraulic fracturing activity. Furthermore, because the decision to use ceramic proppant is based on comparing the higher initial costs to the future value derived from increased production and recovery rates, the Company’s business is influenced by the current and expected prices of natural gas and oil.
During 2012, the Company experienced lower pricing for its proppant products due to market conditions resulting from a decline in North American activity in the natural gas industry caused by a drop in natural gas prices and an over-supply of imported ceramic proppant. The lingering effects of the conditions driving these pricing pressures have continued into 2014.
22
Late in 2014, a severe decline in oil prices led some customers to reduce drilling activities and capital spending. These low oil prices are expected to continue for the foreseeable future and will likely negatively impact both pricing and demand for ceramic proppants. Entering 2015, the Company has significantly lowered production output levels in order to match this lower level of demand.
Furthermore, conditions in the North American oil and natural gas market also negatively impacted the proppant market inside China. Proppant manufacturers in China experienced excess production capacity as a result of market conditions in North America. As a result, during the fourth quarter of 2014, the Company evaluated its China operation, concluded that its long-term assets inside China were not fully recoverable, and recorded an impairment charge of $10.2 million. The Company also reduced the value of certain of its finished goods and raw materials in China down to lower market prices. The Company expects to idle its plant in China during the first quarter of 2015.
Critical Accounting Policies
The Company’s Consolidated Financial Statements are prepared in accordance with accounting principles generally accepted in the U.S., which require the Company to make estimates and assumptions (see Note 1 to the Consolidated Financial Statements). The Company believes that, of its significant accounting policies, the following may involve a higher degree of judgment and complexity.
Revenue is recognized when title passes to the customer (generally upon delivery of products) or at the time services are performed. The Company generates a significant portion of its revenues and corresponding accounts receivable from sales to the petroleum pressure pumping industry. In addition, the Company generates a significant portion of its revenues and corresponding accounts receivable from sales to two major customers, both of which are in the petroleum pressure pumping industry. As of December 31, 2014, approximately 40% of the balance in trade accounts receivable was attributable to those two customers. The Company records an allowance for doubtful accounts based on its assessment of collectability risk and periodically evaluates the allowance based on a review of trade accounts receivable. Trade accounts receivable are periodically reviewed for collectability based on customers’ past credit history and current financial condition, and the allowance is adjusted, if necessary. If a prolonged economic downturn in the petroleum pressure pumping industry were to occur or, for some other reason, any of the Company’s primary customers were to experience significant adverse conditions, the Company’s estimates of the recoverability of accounts receivable could be reduced by a material amount and the allowance for doubtful accounts could be increased by a material amount. At December 31, 2014, the allowance for doubtful accounts totaled $1.8 million.
The Company values inventory using the weighted average cost method. Assessing the ultimate realization of inventories requires judgments about future demand and market conditions. The Company regularly reviews inventories to determine if the carrying value of the inventory exceeds market value and the Company records an adjustment to reduce the carrying value to market value, as necessary. Future changes in demand and market conditions could cause the Company to be exposed to additional obsolescence or slow moving inventory. If actual market conditions are less favorable than those projected by management, lower of cost or market adjustments may be required.
Income taxes are provided for in accordance with ASC Topic 740, “Income Taxes”. This standard takes into account the differences between financial statement treatment and tax treatment of certain transactions. Deferred tax assets and liabilities are recognized for the future tax consequences attributable to differences between the financial statement carrying amounts of existing assets and liabilities and their respective tax bases. Deferred tax assets and liabilities are measured using enacted tax rates expected to apply to taxable income in the years in which those temporary differences are expected to be recovered or settled. The effect of a change in tax rates is recognized as income or expense in the period that includes the enactment date. This calculation requires the Company to make certain estimates about its future operations. Changes in state, federal and foreign tax laws, as well as changes in the Company’s financial condition, could affect these estimates.
23
Long-lived assets, which include net property, plant and equipment, goodwill, intangibles and other long-term assets, comprise a significant amount of the Company’s total assets. The Company makes judgments and estimates in conjunction with the carrying values of these assets, including amounts to be capitalized, depreciation and amortization methods and useful lives. Additionally, the carrying values of these assets are periodically reviewed for impairment or whenever events or changes in circumstances indicate that the carrying amounts may not be recoverable. An impairment loss is recorded in the period in which it is determined that the carrying amount is not recoverable. This requires the Company to make long-term forecasts of its future revenues and costs related to the assets subject to review. These forecasts require assumptions about demand for the Company’s products and services, future market conditions and technological developments. Significant and unanticipated changes to these assumptions could require a provision for impairment in a future period.
Results of Operations
Net Income
| ($ in thousands) |
2014 | Percent Change |
2013 | Percent Change |
2012 | |||||||||||||||
| Net Income |
$ | 55,588 | (35 | )% | $ | 84,886 | (20 | )% | $ | 105,933 | ||||||||||
For the year ended December 31, 2014, the Company reported net income of $55.6 million, a decrease of 35% compared to the $84.9 million reported in the previous year. Operations in 2014 continued to be impacted by the shift in drilling activity away from natural gas basins due to the severe decline in natural gas prices in late 2011. In late 2014, the industry experienced a severe decline in oil prices, which has caused drilling activity to be further reduced. In addition, operations were impacted by a growing number of E&P operators experimenting with the use of raw frac sand and delays in some well completions during the third and fourth quarters of 2014. While the Company achieved record sales volume of nearly 2.9 billion pounds, net income in 2014 decreased primarily as a result of lower ceramic proppant sales volumes, a $15.1 million impairment of long-lived assets, $5.4 million lower of cost or market adjustments to reduce China finished goods and raw materials carrying values to their lower market prices and higher SG&A expenses. Income tax expense in 2014 decreased primarily due to lower pretax income but was negatively impacted by valuation allowances recorded against certain deferred tax assets.
For the year ended December 31, 2013, the Company reported net income of $84.9 million, a decrease of 20% compared to the $105.9 million reported in the previous year. Operations in 2013 continued to be impacted by the shift in drilling activity away from natural gas basins due to the severe decline in natural gas prices in late 2011. While the Company achieved record sales volume of nearly 2.1 billion pounds, net income in 2013 decreased primarily as a result of a decrease in the average proppant selling price, spending to bring the Company’s new KRYPTOSPHERETM proppant technology to a commercial state and higher selling, general and administrative costs. Income tax expense in 2013 decreased primarily due to lower pretax income.
Individual components of financial results are discussed below.
Revenues
| ($ in thousands) |
2014 | Percent Change |
2013 | Percent Change |
2012 | |||||||||||||||
| Consolidated revenues |
$ | 648,325 | (3 | )% | $ | 667,398 | 3 | % | $ | 645,536 | ||||||||||
Revenues of $648.3 million for the year ended December 31, 2014 decreased 3% compared to $667.4 million in 2013. Revenues decreased primarily due to a 6% decrease in ceramic proppant sales volume, a 33% decrease in resin-coated sand sales volumes, and a decrease in Falcon revenues. These decreases were partially offset by an increase in Northern White Sand sales volumes.
Revenues of $667.4 million for the year ended December 31, 2013 increased 3% compared to $645.5 million in 2012. Revenues increased primarily due to a 20% increase in proppant sales volume, partially offset by
24
a 13% decrease in the average proppant selling price in response to market conditions during mid-2012 and higher volumes of sand-based products, which have a lower average selling price than ceramic proppants.
Worldwide proppant sales volumes were as follows.
| Proppant Sales Volumes | For the years ended December 31, | |||||||||||
| (in million pounds) |
2014 | 2013 | 2012 | |||||||||
| Ceramic |
1,618 | 1,718 | 1,649 | |||||||||
| Resin Coated Sand |
162 | 241 | 57 | |||||||||
| Northern White Sand |
1,131 | 101 | 6 | |||||||||
|
|
|
|
|
|
|
|||||||
| Total |
2,911 | 2,060 | 1,712 | |||||||||
|
|
|
|
|
|
|
|||||||
North American (defined as Canada and the U.S.) proppant sales volume increased 46% in 2014 compared to 2013 on higher sales of Northern White Sand. North American ceramic proppant sales volume decreased 10% in 2014 compared to 2013, partly as a result of some customers experimenting with more sand proppant and delays in some well completions during the third and fourth quarters of 2014, partly due to falling oil prices. International (excluding Canada) proppant sales volume increased 6% in 2014 compared to 2013 primarily due to increases in Mexico, partially offset by a decrease in China.
North American (defined as Canada and the U.S.) sales volume increased 29% in 2013 compared to 2012 due to continued success of the Company’s products in oily, liquids-rich basins and despite a decrease in the North America rig count. International (excluding Canada) sales volume decreased 17% in 2013 compared to 2012 primarily due to decreases in China, Mexico, and Africa, partially offset by an increase in Europe.
Average selling prices per pound for proppants sold during 2014 were as follows: Ceramic $0.33; Resin Coated Sand $0.22; and Northern White Sand $0.03. Primarily due to the change in product mix, the average selling price per pound of all proppant was $0.21 during 2014 compared to $0.30 during 2013 and $0.34 in 2012. In addition to product mix, average selling prices can be impacted by sales prices, geographic areas of sale, customer requirements and delivery methods.
Gross Profit
| ($ in thousands) |
2014 | Percent Change |
2013 | Percent Change |
2012 | |||||||||||||||
| Consolidated gross profit |
$ | 181,280 | (6 | )% | $ | 192,995 | (14 | )% | $ | 223,505 | ||||||||||
| As a % of revenues |
28 | % | 29 | % | 35 | % | ||||||||||||||
The Company’s cost of sales related to proppant manufacturing consists of manufacturing costs, packaging and transportation expenses associated with the delivery of the Company’s products to its customers and handling costs related to maintaining finished goods inventory and operating the Company’s remote stocking facilities. Variable manufacturing costs include raw materials, labor, utilities and repair and maintenance supplies. Fixed manufacturing costs include depreciation, property taxes on production facilities, insurance and factory overhead.
Gross profit for the year ended December 31, 2014 was $181.3 million, or 28% of revenues, compared to $193.0 million, or 29% of revenues, for 2013. The decrease in gross profit was primarily the result of lower ceramic proppant sales volumes and a decrease in Falcon gross profit, partially offset by a favorable change in ceramic sales mix to higher margin lightweight ceramic proppants and improved margins on sand proppants. In addition, due to increasing competition in the China proppant market, the Company recorded $5.4 million lower of cost or market adjustments in 2014 to reduce finished goods and raw materials carrying values to their lower market prices.
Gross profit for the year ended December 31, 2013 was $193.0 million, or 29% of revenues, compared to $223.5 million, or 35% of revenues, for 2012. The decrease in gross profit was primarily the result of a decrease
25
in average selling price and spending to bring the Company’s new proppant technology to a commercial state, partially offset by higher proppant sales volumes. The gross profit margin as a percentage of revenues also declined due to the change in the product sales mix resulting from volume gains of the Company’s lower-priced and lower-margin sand-based products. The increase in sales volumes for Northern White Sand did not materially impact gross profit.
Selling, General & Administrative (SG&A) and Other Operating Expenses
| ($ in thousands) |
2014 | Percent Change |
2013 | Percent Change |
2012 | |||||||||||||||
| Consolidated SG&A and other |
$ | 88,425 | 29 | % | $ | 68,404 | 6 | % | $ | 64,619 | ||||||||||
| As a % of revenues |
14 | % | 10 | % | 10 | % | ||||||||||||||
Operating expenses consisted of $72.5 million of SG&A expenses and $15.9 million of other operating expenses for the year ended December 31, 2014 compared to $68.4 million of SG&A expenses and $43.0 thousand of other operating income for 2013. The increase in SG&A expenses primarily resulted from higher research and development spending, higher compensation costs, and increased marketing spending. Other operating expenses in 2014 consisted primarily of $15.1 million of impairment charges associated with certain long-lived assets at the Company’s manufacturing facility in China, as a result of deteriorating market conditions inside China, and its resin coating business, as a result of the Company’s decision that it will not move forward with construction of a resin coating plant in Marshfield, Wisconsin for which the Company had previously developed engineering plans and procured certain equipment that had long-lead delivery times. The resin coating assets were classified as available for sale. Other operating expenses also included $0.8 million of start-up costs related to the start-up of the new manufacturing facility in Millen, Georgia. Other operating expenses in 2013 consisted of asset disposals. As a percentage of revenues, SG&A and other operating expenses for 2014 increased to 14% in 2014 compared to 10% in 2013, primarily due to the impairment of assets.
Operating expenses consisted of $68.4 million of SG&A expenses and $43.0 thousand of other operating income for the year ended December 31, 2013 compared to $64.0 million of SG&A expenses and $0.6 million of other operating expenses for 2012. The increase in SG&A expenses primarily resulted from higher marketing and research and development spending. Other operating expenses in 2013 decreased $0.5 million compared to 2012 due primarily to a loss on disposal of assets in 2012 related to the wind down of the geotechnical monitoring business. As a percentage of revenues, SG&A and other operating expenses for 2013 remained consistent to 2012.
Income Tax Expense
| ($ in thousands) |
2014 | Percent Change |
2013 | Percent Change |
2012 | |||||||||||||||
| Income Tax Expense |
$ | 37,283 | (8 | )% | $ | 40,315 | (23 | )% | $ | 52,657 | ||||||||||
| Effective Income Tax Rate |
40.1 | % | 32.2 | % | 33.2 | % | ||||||||||||||
Consolidated income tax expense was $37.3 million, or 40.1% of pretax income, for the year ended December 31, 2014 compared to $40.3 million, or 32.2% of pretax income for 2012. The $3.0 million decrease is primarily due to lower pre-tax income partially offset by a higher effective tax rate. The higher effective tax rate is primarily associated with the Company recording a valuation allowance on foreign deferred tax assets for which recoverability was not certain.
Consolidated income tax expense was $40.3 million, or 32.2% of pretax income, for the year ended December 31, 2013 compared to $52.7 million, or 33.2% of pretax income for 2012. The $12.3 million decrease is due to lower pre-tax income and a lower effective tax rate primarily associated with additional R&D tax credits and the final preparation and filing of the Company’s prior year income tax returns.
26
Outlook
Given the cyclical nature of the industry, the Company believes that market conditions will continue to fluctuate, driven by several factors, including oil and natural gas commodity prices and quarterly seasonality trends. The 2014 ceramic proppant market was impacted by two main factors. First, a number of exploration and production (E&P) operators experimented with increased use of raw frac sand in place of ceramic proppant. Second, with an oversupplied ceramic proppant market, cheaper Chinese products of inferior quality remained a market force. These events drove both domestic and international competitors to reduce prices. As a result of these market conditions, our ceramic proppant sales volumes and revenues declined from the previous year. These conditions are expected to continue during 2015.
Industry activity late in 2014 was also influenced by the significantly depressed commodity price for oil. Entering 2015, E&P budget cuts have been significant. The duration and associated impact of a lower commodity price environment is difficult to determine. Managing through this environment will continue to be challenging.
Historically, depressed commodity prices such as those found in today’s environment drive a focused effort to reduce cost, often at the sacrifice of production. While that driver may be out of the Company’s control, the Company will continue to work closely with its clients to deliver technologies that increase net present value of their wells, and achieve the goal of reducing costs while optimizing production results. To that end, the Company has presented production-neutral frac designs to a number of clients. These frac designs substitute large amounts of sand volumes with smaller ceramic proppant volumes. Total oil and gas production from both completions are modeled to be the same, yet overall total completion costs are lower in the case of the ceramic proppant well. The Company believes this is an advantage for the E&P operator as it addresses their immediate concern of reducing costs while making the best wells possible.
The duration of this cycle is unknown today, and rig activity is declining rapidly. This introduces a lack of visibility into the Company’s operations. The Company has seen a shift in E&P behavior resulting in lower demand for ceramic proppant. As a result, the company expects to see continued pricing pressure for ceramic proppant.
The Company currently anticipates that its capital expenditures in 2015 will be reduced to less than half of 2014 capital expenditures and will primarily focus on the retrofit of one of its plants with the new KRYPTOSPHERE proppant technology. As part of its capital expenditure reduction plan, the Company has deferred the completion of the second ceramic proppant manufacturing line at its Millen, Georgia facility.
The Company is reducing its cost base to better match anticipated activity in 2015.
The amount of activity in infrastructure-limited, liquids-rich basins introduced supply chain challenges to the industry and resulted in higher distribution costs during 2012 and the first part of 2013. The Company has continued addressing distribution costs with a number of initiatives. One initiative is rationalizing the Company’s rail fleet to reduce reliance on the fleet as a form of storage. Other initiatives include increasing storage capacity at new and existing stocking locations and reducing transportation costs.
Commercialization of KRYPTOSPHERETM HD, the Company’s new ultra-high conductivity, ultra-high strength proppant technology, is progressing well. During the fourth quarter of 2014, KRYPTOSPHERE HD was successfully pumped in its first deep-water Gulf of Mexico well. The technology was employed in a completion by a multinational E&P company. The next phase in the Company’s KRYPTOSPHERETM product development will be to apply this technology to the Company’s existing manufacturing footprint. The retrofit of an existing plant with this technology is underway. Once the retrofit is complete, KRYPTOSPHERETM will expand the Company’s technology position in the industry and further assist in increasing the production and EUR of its clients’ oil and natural gas wells.
27
During 2014, sales for new products across the Company’s proppant-delivered technology platforms grew. For example, in the United States and Canada, SCALEGUARD was pumped in numerous wells for multiple operators. This scale-inhibiting technology, which is released into the fracture only on contact with water, is on track to meet or exceed projected treatment life thereby reducing or eliminating expensive remedial maintenance programs.
Liquidity and Capital Resources
At December 31, 2014, the Company had cash and cash equivalents of $24.3 million compared to cash and cash equivalents of $94.3 million at December 31, 2013. During 2014, the Company generated $105.8 million of cash from operating activities, $25.0 million from bank borrowings, and retained $0.4 million from excess tax benefits relating to stock based compensation. Uses of cash included $161.5 million for capital expenditures, $29.1 million for the payment of cash dividends, $7.0 million for repurchases of the Company’s common stock, and $3.5 million for the effect of exchange rate changes on cash. Major capital spending in 2014 included engineering, procurement and construction activities related to the first two production lines at the new manufacturing facility in Millen, Georgia, retrofitting an existing plant with the new KRYPTOSPHERE proppant technology, expansion of the Company’s distribution infrastructure, as well as upgrades and improvements at existing manufacturing facilities.
Subject to its financial condition, the amount of funds generated from operations and the level of capital expenditures, the Company’s current intention is to continue to pay quarterly dividends to holders of its common stock. On January 20, 2015, the Company’s Board of Directors approved the payment of a quarterly cash dividend of $0.33 per share to shareholders of the Company’s common stock on February 2, 2015. The dividend was paid on February 16, 2015. The Company estimates its total capital expenditures in 2015 will be between $30.0 million and $50.0 million, which primarily include costs associated with retrofitting an existing plant with the new KRYPTOSPHERE proppant technology. Due to current market conditions, the completion of the second line at the manufacturing facility in the Millen, Georgia area has been temporarily suspended.
The Company maintains an unsecured line of credit with a bank. On October 31, 2014, this line of credit was increased from $50.0 million to $100.0 million, and the expiration date of the facility was extended to October 31, 2019. As of December 31, 2014, the Company’s outstanding debt under the credit agreement was $25.0 million. As of February 26, 2015, the Company’s outstanding debt under the agreement was $35.0 million. The Company anticipates that cash on hand, cash provided by operating activities and funds provided by its line of credit will be sufficient to meet planned operating expenses, tax obligations, capital expenditures and other cash needs for the next 12 months. While the Company plans to make draws under its credit facility during 2015 for liquidity needs, the use of this line of credit is subject to compliance with the financial covenants in the underlying credit agreement, which depends on our future operating performance and cash flow. These factors are in turn subject to prevailing oil and gas prices, economic conditions and other factors, many of which are beyond our control. The Company also believes that it could acquire additional debt or equity financing, if needed.
Off-Balance Sheet Arrangements
The Company had no off-balance sheet arrangements as of December 31, 2014.
28
Contractual Obligations
The following table summarizes the Company’s contractual obligations as of December 31, 2014:
| Payments due in period | ||||||||||||||||||||
| ($ in thousands) | Total | Less than 1 year |
1 - 3 years |
3 - 5 years |
More than 5 years |
|||||||||||||||
| Long-term debt obligations |
$ | — | $ | — | $ | — | $ | — | $ | — | ||||||||||
| Capital lease obligations |
— | — | — | — | — | |||||||||||||||
| Operating lease obligations: |
||||||||||||||||||||
| – Primarily railroad equipment (net of subleases) |
140,565 | 17,682 | 39,080 | 29,937 | 53,866 | |||||||||||||||
| Purchase obligations: |
||||||||||||||||||||
| – Natural gas contracts |
68,657 | 25,119 | 33,615 | 9,923 | — | |||||||||||||||
| – Raw materials contracts |
— | — | — | — | — | |||||||||||||||
| Other long-term obligations |
— | — | — | — | — | |||||||||||||||
|
|
|
|
|
|
|
|
|
|
|
|||||||||||
| Total contractual obligations |
$ | 209,222 | $ | 42,801 | $ | 72,695 | $ | 39,860 | $ | 53,866 | ||||||||||
|
|
|
|
|
|
|
|
|
|
|
|||||||||||
See Note 4 and Note 13 to the Notes to the Consolidated Financial Statements.
Operating lease obligations relate primarily to railroad equipment leases and include leases of other property, plant and equipment.
The Company uses natural gas to power its domestic manufacturing plants. From time to time, the Company enters into contracts to purchase a portion of the anticipated natural gas requirements at specified prices. As of December 31, 2014, the last such contract was due to expire in December 2018.
The Company has entered into contracts to supply raw materials, primarily kaolin, bauxite and hydro sized sand, to each of its manufacturing plants. Each of the contracts is described in Note 13 to the Notes to the Consolidated Financial Statements. Three outstanding contracts do not require the Company to purchase minimum annual quantities, but do require the purchase of minimum annual percentages, ranging from 50% to 80% of the respective plants’ requirements for the specified raw materials. One outstanding contract, which required the Company to purchase a minimum annual quantity of material, has no further minimum requirements.
| Item 7A. | Quantitative and Qualitative Disclosures about Market Risk |
The Company’s major market risk exposure is to foreign currency fluctuations that could impact its investments in China and Russia. As of December 31, 2014, the Company’s net investment that is subject to foreign currency fluctuations totaled $45.8 million, and the Company has recorded a cumulative foreign currency translation loss of $23.0 million. This cumulative translation loss is included in Accumulated Other Comprehensive Loss. From time to time, the Company may enter into forward foreign exchange contracts to hedge the impact of foreign currency fluctuations. There were no such foreign exchange contracts outstanding at December 31, 2014. During 2014, the value of the Russian Ruble significantly declined relative to the U.S. dollar for which the financial impact on the Company’s net assets in Russia is included in Other Comprehensive Income and the cumulative foreign currency translation loss noted above. No income tax benefits have been recorded on these losses as a result of the uncertainty about recoverability of the related deferred income tax benefits.
The Company has a $100.0 million revolving credit agreement with a bank. Under the terms of the agreement, the Company has the option of choosing either the bank’s fluctuating Base Rate or LIBOR Fixed
Rate, plus an Applicable Margin, all as defined in the credit agreement. The Company’s outstanding debt under the credit agreement was $25.0 million at December 31, 2014. The Company does not believe that it has any material exposure to market risk associated with interest rates.
29
The Company is subject to the risk of market price fluctuations of certain commodities, such as natural gas, and utilizes forward purchase contracts to manage or reduce market risks relating to these costs. The Company does not enter into these transactions for speculative or trading purposes. The Company expects to take delivery of the underlying natural gas and, as such, does not currently believe the market risk exposure on these instruments to be material. As of December 31, 2014, $68.7 million of natural gas forward contracts were outstanding for delivery of gas through 2018.
| Item 8. | Financial Statements and Supplementary Data |
The information required by this Item is contained in pages F-3 through F-23 of this Report.
| Item 9. | Changes in and Disagreements with Accountants on Accounting and Financial Disclosure |
Not applicable.
| Item 9A. | Controls and Procedures |
| (a) | Evaluation of Disclosure Controls and Procedures |
Disclosure controls and procedures are designed to ensure that information required to be disclosed in the reports filed or submitted under the Securities Exchange Act of 1934 (the “Exchange Act”) is recorded, processed, summarized and reported, within the time periods specified in the SEC’s rules and forms. Disclosure controls and procedures include, without limitation, controls and procedures designed to ensure that information required to be disclosed in the reports filed under the Exchange Act is accumulated and communicated to management, including the Chief Executive Officer and Chief Financial Officer, as appropriate to allow timely decisions regarding required disclosure.
As of December 31, 2014, management carried out an evaluation, under the supervision and with the participation of the Chief Executive Officer and Chief Financial Officer, of the effectiveness of the design and operation of the Company’s disclosure controls and procedures. There are inherent limitations to the effectiveness of any system of disclosure controls and procedures. Accordingly, even effective disclosure controls and procedures can only provide reasonable assurances of achieving their control objectives. Based upon and as of the date of that evaluation, the Chief Executive Officer and Chief Financial Officer have concluded that the Company’s disclosure controls and procedures were effective to ensure that information required to be disclosed by the Company in the reports it files or submits under the Exchange Act is recorded, processed, summarized and reported, within the time periods specified in the SEC’s rules and forms, and to ensure that information required to be disclosed by the Company in the reports that it files or submits under the Exchange Act is accumulated and communicated to the Company’s management, including its Chief Executive Officer and Chief Financial Officer, as appropriate to allow timely decisions regarding required disclosure.
(b) Management’s Report on Internal Control Over Financial Reporting
For Management’s Report on Internal Control Over Financial Reporting, see page F-1 of this Report.
(c) Report of Independent Registered Public Accounting Firm
For the Report of Independent Registered Public Accounting Firm on the Company’s internal control over financial reporting, see page F-2 of this Report.
(d) Changes in Internal Control over Financial Reporting
There were no changes in the Company’s internal control over financial reporting during the quarter ended December 31, 2014, that materially affected, or are reasonably likely to materially affect, those controls.
| Item 9B. | Other Information |
Not applicable.
30
PART III
Certain information required by Part III is omitted from this Report. The Company will file a definitive proxy statement pursuant to Regulation 14A (the “Proxy Statement”) not later than 120 days after the end of the fiscal year covered by this Report and certain information included therein is incorporated herein by reference. Only those sections of the Proxy Statement that specifically address the items set forth herein are incorporated by reference. Such incorporation does not include the Compensation Committee Report included in the Proxy Statement.
| Item 10. | Directors, Executive Officers and Corporate Governance |
Information concerning executive officers under Item 401 of Regulation S-K is set forth in Part I of this Form 10-K. The other information required by this Item is incorporated by reference to the portions of the Company’s Proxy Statement entitled “Security Ownership of Certain Beneficial Owners and Management,” “Election of Directors,” “Board of Directors, Committees of the Board of Directors and Meeting Attendance,” “Code of Business Conduct and Ethics,” “Section 16(a) Beneficial Ownership Reporting Compliance” and “Report of the Audit Committee.”
| Item 11. | Executive Compensation |
The information required by this Item is incorporated by reference to the portions of the Company’s Proxy Statement entitled “Compensation of Executive Officers,” “Director Compensation” and “Potential Termination and Change in Control Payments.”
| Item 12. | Security Ownership of Certain Beneficial Owners and Management and Related Stockholder Matters |
The information required by this Item is incorporated by reference from the Company’s Proxy Statement under the captions “Securities Ownership of Certain Beneficial Owners and Management” and “Equity Compensation Plan Information.”
| Item 13. | Certain Relationships and Related Transactions, and Director Independence |
The information required by this Item is incorporated by reference to the portion of the Company’s Proxy Statement entitled “Election of Directors.”
| Item 14. | Principal Accounting Fees and Services |
The information required by this Item is incorporated by reference to the portion of the Company’s Proxy Statement entitled “Ratification of Appointment of the Company’s Independent Registered Public Accounting Firm.”
31
PART IV
| Item 15. | Exhibits, Financial Statement Schedules |
| (a) | Exhibits, Financial Statements and Financial Statement Schedules: |
| 1. | Consolidated Financial Statements |
The Consolidated Financial Statements of CARBO Ceramics Inc. listed below are contained in pages F-3 through F-23 of this Report:
| Consolidated Statements of Income for each of the three years ended December 31, 2014, 2013 and 2012 |
| 2. | Consolidated Financial Statement Schedules |
All schedules have been omitted since they are either not required or not applicable.
| 3. | Exhibits |
The exhibits listed on the accompanying Exhibit Index are filed as part of, or incorporated by reference into, this Report.
32
Pursuant to the requirements of Section 13 or 15(d) of the Securities Exchange Act of 1934, the Registrant has duly caused this Report to be signed on its behalf by the undersigned, thereunto duly authorized.
CARBO Ceramics Inc.
| By: | /s/ Gary A Kolstad | |
| Gary A. Kolstad | ||
| President and Chief Executive Officer | ||
| By: | /s/ Ernesto Bautista III | |
| Ernesto Bautista III | ||
| Vice President and Chief Financial Officer | ||
Dated: February 26, 2015
33
POWER OF ATTORNEY
KNOW ALL PERSONS BY THESE PRESENTS, that each person whose signature appears below constitutes and appoints Gary A. Kolstad and Ernesto Bautista III, jointly and severally, his attorneys-in-fact, each with the power of substitution, for him in any and all capacities, to sign any amendments to this Report on Form 10-K, and to file the same, with exhibits thereto and other documents in connection therewith, with the Securities and Exchange Commission, hereby ratifying and confirming all that each of said attorneys-in-fact, or his substitute or substitutes, may do or cause to be done by virtue hereof.
Pursuant to the requirements of the Securities Exchange Act of 1934, this Report has been signed below by the following persons on behalf of the Registrant and in the capacities and on the dates indicated.
| Signature |
Title |
Date | ||
| /s/ William C. Morris William C. Morris |
Chairman of the Board |
February 26, 2015 | ||
| /s/ Gary A. Kolstad Gary A. Kolstad |
President, Chief Executive Officer and Director (Principal Executive Officer) |
February 26, 2015 | ||
| /s/ Ernesto Bautista III Ernesto Bautista III |
Vice President and Financial and Accounting Officer) |
February 26, 2015 | ||
| /s/ Sigmund L. Cornelius Sigmund L. Cornelius |
Director |
February 26, 2015 | ||
| /s/ Chad C. Deaton Chad C. Deaton |
Director |
February 26, 2015 | ||
| /s/ James B. Jennings James B. Jennings |
Director |
February 26, 2015 | ||
| /s/ H.E. Lentz, Jr. H.E. Lentz, Jr. |
Director |
February 26, 2015 | ||
| /s/ Randy L. Limbacher Randy L. Limbacher |
Director |
February 26, 2015 | ||
| /s/ Robert S. Rubin Robert S. Rubin |
Director |
February 26, 2015 | ||
34
MANAGEMENT’S REPORT ON INTERNAL CONTROL OVER FINANCIAL REPORTING
Management is responsible for establishing and maintaining adequate internal control over financial reporting, as defined in Rules 13a-15(f) and 15d-15(f) under the Securities Exchange Act of 1934. The Company’s internal control over financial reporting is designed to provide reasonable assurance regarding the reliability of financial reporting and the preparation of financial statements for external reporting purposes in accordance with generally accepted accounting principles.
Because of its inherent limitations, internal control over financial reporting may not prevent or detect misstatements. Also, projections of any evaluation of effectiveness to future periods are subject to the risk that controls may become inadequate because of changes in conditions, or that the degree of compliance with the policies or procedures may deteriorate.
Management, including our Chief Executive Officer and our Chief Financial Officer, assessed the effectiveness of the Company’s internal control over financial reporting as of December 31, 2014. In making this assessment, it used the criteria set forth by the Committee of Sponsoring Organizations of the Treadway Commission (COSO) in Internal Control – Integrated Framework (1992). Based on its assessment and those criteria, management has concluded that the Company maintained effective internal control over financial reporting as of December 31, 2014.
The Company’s independent registered public accounting firm, Ernst & Young LLP, has issued an attestation report on the Company’s internal control over financial reporting. That report is included herein.
F-1
REPORT OF INDEPENDENT REGISTERED PUBLIC ACCOUNTING FIRM
The Board of Directors and Shareholders
CARBO Ceramics Inc.
We have audited CARBO Ceramics Inc.’s internal control over financial reporting as of December 31, 2014, based on criteria established in Internal Control – Integrated Framework issued by the Committee of Sponsoring Organizations of the Treadway Commission (1992 framework) (the COSO criteria). CARBO Ceramics Inc.’s management is responsible for maintaining effective internal control over financial reporting and for its assessment of the effectiveness of internal control over financial reporting included in the accompanying Management’s Report on Internal Control Over Financial Reporting. Our responsibility is to express an opinion on the Company’s internal control over financial reporting based on our audit.
We conducted our audit in accordance with the standards of the Public Company Accounting Oversight Board (United States). Those standards require that we plan and perform the audit to obtain reasonable assurance about whether effective internal control over financial reporting was maintained in all material respects. Our audit included obtaining an understanding of internal control over financial reporting, assessing the risk that a material weakness exists, testing and evaluating the design and operating effectiveness of internal control based on the assessed risk, and performing such other procedures as we considered necessary in the circumstances. We believe that our audit provides a reasonable basis for our opinion.
A company’s internal control over financial reporting is a process designed to provide reasonable assurance regarding the reliability of financial reporting and the preparation of financial statements for external purposes in accordance with generally accepted accounting principles. A company’s internal control over financial reporting includes those policies and procedures that (1) pertain to the maintenance of records that, in reasonable detail, accurately and fairly reflect the transactions and dispositions of the assets of the company; (2) provide reasonable assurance that transactions are recorded as necessary to permit preparation of financial statements in accordance with generally accepted accounting principles, and that receipts and expenditures of the company are being made only in accordance with authorizations of management and directors of the company; and (3) provide reasonable assurance regarding prevention or timely detection of unauthorized acquisition, use, or disposition of the company’s assets that could have a material effect on the financial statements.
Because of its inherent limitations, internal control over financial reporting may not prevent or detect misstatements. Also, projections of any evaluation of effectiveness to future periods are subject to the risk that controls may become inadequate because of changes in conditions, or that the degree of compliance with the policies or procedures may deteriorate.
In our opinion, CARBO Ceramics Inc. maintained, in all material respects, effective internal control over financial reporting as of December 31, 2014, based on the COSO criteria.
We also have audited, in accordance with the standards of the Public Company Accounting Oversight Board (United States), the consolidated balance sheets of CARBO Ceramics Inc. as of December 31, 2014 and 2013, and the related consolidated statements of income, comprehensive income, shareholders’ equity, and cash flows for each of the three years in the period ended December 31, 2014, and our report dated February 26, 2015 expressed an unqualified opinion thereon.
/s/ Ernst & Young LLP
New Orleans, Louisiana
February 26, 2015
F-2
REPORT OF INDEPENDENT REGISTERED PUBLIC ACCOUNTING FIRM
The Board of Directors and Shareholders
CARBO Ceramics Inc.
We have audited the accompanying consolidated balance sheets of CARBO Ceramics Inc. as of December 31, 2014 and 2013, and the related consolidated statements of income, comprehensive income, shareholders’ equity, and cash flows for each of the three years in the period ended December 31, 2014. These financial statements are the responsibility of the Company’s management. Our responsibility is to express an opinion on these financial statements based on our audits.
We conducted our audits in accordance with the standards of the Public Company Accounting Oversight Board (United States). Those standards require that we plan and perform the audit to obtain reasonable assurance about whether the financial statements are free of material misstatement. An audit includes examining, on a test basis, evidence supporting the amounts and disclosures in the financial statements. An audit also includes assessing the accounting principles used and significant estimates made by management, as well as evaluating the overall financial statement presentation. We believe that our audits provide a reasonable basis for our opinion.
In our opinion, the financial statements referred to above present fairly, in all material respects, the consolidated financial position of CARBO Ceramics Inc. at December 31, 2014 and 2013, and the consolidated results of its operations and its cash flows for each of the three years in the period ended December 31, 2014, in conformity with U.S. generally accepted accounting principles.
We also have audited, in accordance with the standards of the Public Company Accounting Oversight Board (United States), CARBO Ceramics Inc.’s internal control over financial reporting as of December 31, 2014, based on criteria established in Internal Control – Integrated Framework issued by the Committee of Sponsoring Organizations of the Treadway Commission (1992 framework), and our report dated February 26, 2015 expressed an unqualified opinion thereon.
/s/ Ernst & Young LLP
New Orleans, Louisiana
February 26, 2015
F-3
($ in thousands, except per share data)
| December 31, | ||||||||
| 2014 | 2013 | |||||||
| ASSETS | ||||||||
| Current assets: |
||||||||
| Cash and cash equivalents |
$ | 24,298 | $ | 94,250 | ||||
| Trade accounts and other receivables, net |
132,573 | 125,179 | ||||||
| Inventories: |
||||||||
| Finished goods |
106,941 | 87,218 | ||||||
| Raw materials and supplies |
37,502 | 47,042 | ||||||
|
|
|
|
|
|||||
| Total inventories |
144,443 | 134,260 | ||||||
| Prepaid expenses and other current assets |
5,241 | 5,442 | ||||||
| Prepaid income taxes |
19,708 | 1,888 | ||||||
| Deferred income taxes |
11,348 | 10,363 | ||||||
|
|
|
|
|
|||||
| Total current assets |
337,611 | 371,382 | ||||||
| Property, plant and equipment: |
||||||||
| Land and land improvements |
40,921 | 31,163 | ||||||
| Land-use and mineral rights |
19,877 | 12,751 | ||||||
| Buildings |
74,911 | 72,702 | ||||||
| Machinery and equipment |
627,517 | 535,529 | ||||||
| Construction in progress |
109,378 | 109,735 | ||||||
|
|
|
|
|
|||||
| Total |
872,604 | 761,880 | ||||||
| Less accumulated depreciation and amortization |
303,888 | 283,345 | ||||||
|
|
|
|
|
|||||
| Net property, plant and equipment |
568,716 | 478,535 | ||||||
| Goodwill |
12,164 | 12,164 | ||||||
| Intangible and other assets, net |
15,735 | 16,870 | ||||||
|
|
|
|
|
|||||
| Total assets |
$ | 934,226 | $ | 878,951 | ||||
|
|
|
|
|
|||||
| LIABILITIES AND SHAREHOLDERS’ EQUITY | ||||||||
| Current liabilities: |
||||||||
| Bank borrowings |
$ | 25,000 | $ | — | ||||
| Accounts payable |
22,922 | 24,570 | ||||||
| Accrued payroll and benefits |
12,466 | 13,650 | ||||||
| Accrued freight |
5,925 | 6,873 | ||||||
| Accrued utilities |
3,714 | 3,577 | ||||||
| Other accrued expenses |
7,388 | 8,018 | ||||||
|
|
|
|
|
|||||
| Total current liabilities |
77,415 | 56,688 | ||||||
| Deferred income taxes |
80,754 | 53,676 | ||||||
| Shareholders’ equity: |
||||||||
| Preferred stock, par value $0.01 per share, 5,000 shares authorized, none outstanding |
— | — | ||||||
| Common stock, par value $0.01 per share, 80,000,000 shares authorized; 23,092,674 and 23,080,632 shares issued and outstanding at December 31, 2014 and 2013, respectively |
231 | 231 | ||||||
| Additional paid-in capital |
59,297 | 56,782 | ||||||
| Retained earnings |
739,498 | 714,835 | ||||||
| Accumulated other comprehensive loss |
(22,969 | ) | (3,261 | ) | ||||
|
|
|
|
|
|||||
| Total shareholders’ equity |
776,057 | 768,587 | ||||||
|
|
|
|
|
|||||
| Total liabilities and shareholders’ equity |
$ | 934,226 | $ | 878,951 | ||||
|
|
|
|
|
|||||
See accompanying notes to consolidated financial statements.
F-4
CONSOLIDATED STATEMENTS OF INCOME
($ in thousands, except per share data)
| Years ended December 31, | ||||||||||||
| 2014 | 2013 | 2012 | ||||||||||
| Revenues |
$ | 648,325 | $ | 667,398 | $ | 645,536 | ||||||
| Cost of sales |
467,045 | 474,403 | 422,031 | |||||||||
|
|
|
|
|
|
|
|||||||
| Gross profit |
181,280 | 192,995 | 223,505 | |||||||||
| Selling, general and administrative expenses |
72,535 | 68,447 | 64,033 | |||||||||
| Start-up costs |
811 | — | 68 | |||||||||
| Loss (gain) on disposal or impairment of assets |
15,079 | (43 | ) | 518 | ||||||||
|
|
|
|
|
|
|
|||||||
| Operating profit |
92,855 | 124,591 | 158,886 | |||||||||
| Other income (expense): |
||||||||||||
| Interest income, net |
597 | 777 | 64 | |||||||||
| Foreign currency exchange loss, net |
(303 | ) | (17 | ) | (76 | ) | ||||||
| Other, net |
(278 | ) | (150 | ) | (284 | ) | ||||||
|
|
|
|
|
|
|
|||||||
| 16 | 610 | (296 | ) | |||||||||
|
|
|
|
|
|
|
|||||||
| Income before income taxes |
92,871 | 125,201 | 158,590 | |||||||||
| Income taxes |
37,283 | 40,315 | 52,657 | |||||||||
|
|
|
|
|
|
|
|||||||
| Net income |
$ | 55,588 | $ | 84,886 | $ | 105,933 | ||||||
|
|
|
|
|
|
|
|||||||
| Earnings per share: |
||||||||||||
| Basic |
$ | 2.41 | $ | 3.67 | $ | 4.59 | ||||||
|
|
|
|
|
|
|
|||||||
| Diluted |
$ | 2.41 | $ | 3.67 | $ | 4.59 | ||||||
|
|
|
|
|
|
|
|||||||
See accompanying notes to consolidated financial statements.
F-5
CONSOLIDATED STATEMENTS OF COMPREHENSIVE INCOME
($ in thousands)
| Years ended December 31, | ||||||||||||
| 2014 | 2013 | 2012 | ||||||||||
| Net income |
$ | 55,588 | $ | 84,886 | $ | 105,933 | ||||||
| Other comprehensive (loss) income: |
||||||||||||
| Foreign currency translation adjustment |
(17,952 | ) | (2,031 | ) | 2,960 | |||||||
| Deferred income tax (expense) benefit |
(1,756 | ) | 710 | (1,035 | ) | |||||||
|
|
|
|
|
|
|
|||||||
| Other comprehensive (loss) income, net of tax |
(19,708 | ) | (1,321 | ) | 1,925 | |||||||
|
|
|
|
|
|
|
|||||||
| Comprehensive income |
$ | 35,880 | $ | 83,565 | $ | 107,858 | ||||||
|
|
|
|
|
|
|
|||||||
See accompanying notes to consolidated financial statements.
F-6
CONSOLIDATED STATEMENTS OF SHAREHOLDERS’ EQUITY
($ in thousands, except per share data)
| Common Stock |
Additional Paid-In Capital |
Retained Earnings |
Accumulated Other Comprehensive Income (Loss) |
Total | ||||||||||||||||
| Balances at January 1, 2012 |
231 | 56,539 | 577,253 | (3,865 | ) | 630,158 | ||||||||||||||
| Net income |
— | — | 105,933 | — | 105,933 | |||||||||||||||
| Foreign currency translation adjustment, net of tax expense of $1,035 |
— | — | — | 1,925 | 1,925 | |||||||||||||||
|
|
|
|||||||||||||||||||
| Comprehensive income |
107,858 | |||||||||||||||||||
| Exercise of stock options |
— | 54 | — | — | 54 | |||||||||||||||
| Tax benefit from stock based compensation |
— | 1,388 | — | — | 1,388 | |||||||||||||||
| Stock granted under restricted stock plan, net |
1 | 206 | — | — | 207 | |||||||||||||||
| Stock based compensation |
— | 4,903 | — | — | 4,903 | |||||||||||||||
| Shares repurchased and retired |
(1 | ) | (5,726 | ) | — | — | (5,727 | ) | ||||||||||||
| Shares surrendered by employees to pay taxes |
— | — | (2,200 | ) | — | (2,200 | ) | |||||||||||||
| Cash dividends ($1.02 per share) |
— | — | (23,563 | ) | — | (23,563 | ) | |||||||||||||
|
|
|
|
|
|
|
|
|
|
|
|||||||||||
| Balances at December 31, 2012 |
231 | 57,364 | 657,423 | (1,940 | ) | 713,078 | ||||||||||||||
| Net income |
— | — | 84,886 | — | 84,886 | |||||||||||||||
| Foreign currency translation adjustment, net of tax benefit of ($710) |
— | — | — | (1,321 | ) | (1,321 | ) | |||||||||||||
|
|
|
|||||||||||||||||||
| Comprehensive income |
83,565 | |||||||||||||||||||
| Tax expense from stock based compensation |
— | (205 | ) | — | — | (205 | ) | |||||||||||||
| Stock granted under restricted stock plan, net |
1 | 209 | — | — | 210 | |||||||||||||||
| Stock based compensation |
— | 5,247 | — | — | 5,247 | |||||||||||||||
| Shares repurchased and retired |
(1 | ) | (5,833 | ) | — | — | (5,834 | ) | ||||||||||||
| Shares surrendered by employees to pay taxes |
— | — | (1,124 | ) | — | (1,124 | ) | |||||||||||||
| Cash dividends ($1.14 per share) |
— | — | (26,350 | ) | — | (26,350 | ) | |||||||||||||
|
|
|
|
|
|
|
|
|
|
|
|||||||||||
| Balances at December 31, 2013 |
231 | 56,782 | 714,835 | (3,261 | ) | 768,587 | ||||||||||||||
| Net income |
— | — | 55,588 | — | 55,588 | |||||||||||||||
| Foreign currency translation adjustment, net of tax expense of $1,756 |
— | — | — | (19,708 | ) | (19,708 | ) | |||||||||||||
|
|
|
|||||||||||||||||||
| Comprehensive income |
35,880 | |||||||||||||||||||
| Tax benefit from stock based compensation |
— | 303 | — | — | 303 | |||||||||||||||
| Stock granted under restricted stock plan, net |
1 | 699 | — | — | 700 | |||||||||||||||
| Stock based compensation |
— | 6,688 | — | — | 6,688 | |||||||||||||||
| Shares repurchased and retired |
(1 | ) | (5,175 | ) | — | — | (5,176 | ) | ||||||||||||
| Shares surrendered by employees to pay taxes |
— | — | (1,804 | ) | — | (1,804 | ) | |||||||||||||
| Cash dividends ($1.26 per share) |
— | — | (29,121 | ) | — | (29,121 | ) | |||||||||||||
|
|
|
|
|
|
|
|
|
|
|
|||||||||||
| Balances at December 31, 2014 |
$ | 231 | $ | 59,297 | $ | 739,498 | $ | (22,969 | ) | $ | 776,057 | |||||||||
|
|
|
|
|
|
|
|
|
|
|
|||||||||||
See accompanying notes to consolidated financial statements.
F-7
CONSOLIDATED STATEMENTS OF CASH FLOWS
($ in thousands)
| Years ended December 31, | ||||||||||||
| 2014 | 2013 | 2012 | ||||||||||
| Operating activities |
||||||||||||
| Net income |
$ | 55,588 | $ | 84,886 | $ | 105,933 | ||||||
| Adjustments to reconcile net income to net cash provided by operating activities: |
||||||||||||
| Depreciation and amortization |
50,860 | 47,472 | 44,893 | |||||||||
| Provision for doubtful accounts |
546 | 354 | 19 | |||||||||
| Deferred income taxes |
24,389 | 10,121 | 11,212 | |||||||||
| Excess tax benefits from stock based compensation |
(372 | ) | (134 | ) | (1,384 | ) | ||||||
| Lower of cost or market inventory adjustment |
5,363 | — | — | |||||||||
| Loss (gain) on disposal or impairment of assets |
15,079 | (43 | ) | 518 | ||||||||
| Foreign currency transaction loss, net |
303 | 17 | 76 | |||||||||
| Stock compensation expense |
7,529 | 5,837 | 5,335 | |||||||||
| Changes in operating assets and liabilities: |
||||||||||||
| Trade accounts and other receivables |
(9,511 | ) | (22,024 | ) | 8,945 | |||||||
| Inventories |
(25,624 | ) | 6,068 | (7,589 | ) | |||||||
| Prepaid expenses and other current assets |
(112 | ) | (1,136 | ) | (150 | ) | ||||||
| Long-term prepaid expenses |
(122 | ) | 2,969 | 12,005 | ||||||||
| Accounts payable |
2,079 | 4,330 | (18,201 | ) | ||||||||
| Accrued expenses |
(2,487 | ) | 1,677 | (10,628 | ) | |||||||
| Accrued income taxes, net |
(17,726 | ) | (2,823 | ) | 5,397 | |||||||
|
|
|
|
|
|
|
|||||||
| Net cash provided by operating activities |
105,782 | 137,571 | 156,381 | |||||||||
| Investing activities |
||||||||||||
| Capital expenditures |
(161,469 | ) | (99,936 | ) | (77,189 | ) | ||||||
|
|
|
|
|
|
|
|||||||
| Net cash used in investing activities |
(161,469 | ) | (99,936 | ) | (77,189 | ) | ||||||
| Financing activities |
||||||||||||
| Proceeds from bank borrowings |
25,000 | — | 10,000 | |||||||||
| Repayments on bank borrowings |
— | — | (10,000 | ) | ||||||||
| Net proceeds from stock based compensation |
— | — | 54 | |||||||||
| Dividends paid |
(29,121 | ) | (26,350 | ) | (23,563 | ) | ||||||
| Purchase of common stock |
(6,979 | ) | (6,958 | ) | (7,927 | ) | ||||||
| Excess tax benefits from stock based compensation |
372 | 134 | 1,384 | |||||||||
|
|
|
|
|
|
|
|||||||
| Net cash used in financing activities |
(10,728 | ) | (33,174 | ) | (30,052 | ) | ||||||
| Effect of exchange rate changes on cash |
(3,537 | ) | (846 | ) | 225 | |||||||
|
|
|
|
|
|
|
|||||||
| Net (decrease) increase in cash and cash equivalents |
(69,952 | ) | 3,615 | 49,365 | ||||||||
| Cash and cash equivalents at beginning of year |
94,250 | 90,635 | 41,270 | |||||||||
|
|
|
|
|
|
|
|||||||
| Cash and cash equivalents at end of year |
$ | 24,298 | $ | 94,250 | $ | 90,635 | ||||||
|
|
|
|
|
|
|
|||||||
| Supplemental cash flow information |
||||||||||||
| Interest paid |
$ | 135 | $ | 10 | $ | 78 | ||||||
|
|
|
|
|
|
|
|||||||
| Income taxes paid |
$ | 30,619 | $ | 33,015 | $ | 36,036 | ||||||
|
|
|
|
|
|
|
|||||||
See accompanying notes to consolidated financial statements.
F-8
NOTES TO CONSOLIDATED FINANCIAL STATEMENTS
($ in thousands, except per share data)
| 1. | Significant Accounting Policies |
Description of Business
CARBO Ceramics Inc. (the “Company”) was formed in 1987 and is a manufacturer of ceramic proppants and also produces resin-coated ceramic and resin-coated sand proppants. The Company has seven production plants in: New Iberia, Louisiana; Eufaula, Alabama; McIntyre, Georgia; Toomsboro, Georgia; Millen, Georgia; Luoyang, China; and Kopeysk, Russia; and a sand processing facility in Marshfield, Wisconsin. The Company predominantly markets its proppant products through pumping service companies that perform hydraulic fracturing for oil and gas companies. Finished goods inventories are stored at the plant sites and various domestic and international remote distribution facilities. The Company also provides the industry’s most widely used hydraulic fracture simulation software FracPro®, as well as hydraulic fracture design and consulting services. In addition, the Company provides a broad range of technologies for spill prevention, containment and countermeasures. The Company wound-down its geotechnical monitoring business in late 2012.
Principles of Consolidation
The consolidated financial statements include the accounts of CARBO Ceramics Inc. and its operating subsidiaries. All significant intercompany transactions have been eliminated.
Concentration of Credit Risk, Accounts Receivable and Other Receivables
The Company performs periodic credit evaluations of its customers’ financial condition and generally does not require collateral. Receivables are generally due within 30 days. The majority of the Company’s receivables are from customers in the petroleum pressure pumping industry. The Company establishes an allowance for doubtful accounts based on its assessment of collectability risk and periodically evaluates the balance in the allowance based on a review of trade accounts receivable. Trade accounts receivable are periodically reviewed for collectability based on customers’ past credit history and current financial condition, and the allowance is adjusted if necessary. Credit losses historically have been insignificant. The allowance for doubtful accounts at December 31, 2014 and 2013 was $1,842 and $2,083, respectively. Other receivables were $1,084 and $2,781 as of December 31, 2014 and 2013, respectively, of which related mainly to miscellaneous receivables in the United States and China.
Cash Equivalents
The Company considers all highly liquid investments with a maturity of three months or less when purchased to be cash equivalents. The carrying amounts reported in the balance sheet for cash equivalents approximate fair value.
Inventories
Inventories are stated at the lower of cost (weighted average) or market. Finished goods inventories include costs of materials, plant labor and overhead incurred in the production of the Company’s products and costs to transfer finished goods to distribution centers.
Due to increasing competition in the China proppant market, the Company evaluated the carrying values of its inventories in China and concluded that current market prices were below carrying costs. Consequently, the Company recognized $5,363 lower of cost or market adjustments in 2014 in cost of sales to adjust finished goods and raw materials carrying values to the lower market prices.
F-9
CARBO CERAMICS INC.
NOTES TO CONSOLIDATED FINANCIAL STATEMENTS—(Continued)
($ in thousands, except per share data)
Property, Plant and Equipment
Property, plant and equipment are stated at cost. Repair and maintenance costs are expensed as incurred. Depreciation is computed on the straight-line method for financial reporting purposes using the following estimated useful lives:
| Buildings and improvements |
15 to 30 years | |||
| Machinery and equipment |
3 to 30 years | |||
| Land-use rights |
30 years |
The Company holds approximately 4,235 acres of land and leasehold interests containing kaolin reserves near its plants in Georgia and Alabama. The Company also holds approximately 490 acres of land and leasehold interests near its resin-coating facility currently under construction in Marshfield, Wisconsin containing sand reserves for use as raw material in the production of its resin-coated sand products. The capitalized costs of land and mineral rights as well as costs incurred to develop such property are amortized using the units-of-production method based on estimated total tons of these reserves.
Impairment of Long-Lived Assets and Intangible Assets
Long-lived assets to be held and used and intangible assets that are subject to amortization are reviewed for impairment whenever events or circumstances indicate their carrying amounts might not be recoverable. Recoverability is assessed by comparing the undiscounted expected future cash flows from the assets with their carrying amount. If the carrying amount exceeds the sum of the undiscounted future cash flows an impairment loss is recorded. The impairment loss is measured by comparing the fair value of the assets with their carrying amounts. Intangible assets that are not subject to amortization are tested for impairment at least annually by comparing their fair value with the carrying amount and recording an impairment loss for any excess of carrying amount over fair value. Fair values are generally determined based on discounted expected future cash flows or appraised values, as appropriate.
During 2014, the Company recorded losses totaling $15,079 on disposal or impairment of certain long-lived assets as market conditions changed with regard to demand for certain products offered by the Company. The Company evaluated its operations and reviewed the carrying values of related long-lived assets and concluded that certain assets had been impacted by the change in market conditions. As a result of deteriorating market conditions in China during the fourth quarter of 2014, the Company recorded an impairment charge of its long-lived assets in China. In addition, the Company made a decision that it will not move forward with construction of a resin coating plant in Marshfield, Wisconsin for which the Company had previously developed engineering plans and procured certain equipment that had long-lead delivery times. The related resin coating assets were classified as held for sale, and the Company recorded an impairment of those assets. As such, the Company recognized impairment charges totaling $15,120 to adjust the carrying values to the fair values less cost to sell, totaling $2,138, at December 31, 2014. During 2013, the Company recognized a gain of $43, and in 2012, the Company recognized a loss of $518 on disposal or impairment of various assets. The gain in 2013 consisted primarily of equipment disposals. The loss in 2012 consisted primarily of the wind down of the geotechnical monitoring business.
U.S. GAAP establishes a fair value hierarchy that has three levels based on the reliability of the inputs used to determine the fair value. These levels include: Level 1, defined as inputs such as unadjusted quoted prices in active markets for identical assets or liabilities; Level 2, defined as inputs other than quoted prices in active markets that are either directly or indirectly observable; and Level 3, defined as unobservable inputs for use when
F-10
CARBO CERAMICS INC.
NOTES TO CONSOLIDATED FINANCIAL STATEMENTS—(Continued)
($ in thousands, except per share data)
little or no market data exists, therefore requiring an entity to develop its own assumptions. The carrying value of related long-lived assets were adjusted to fair value less cost to sell based on estimates for similar used equipment, which are Level 3 inputs.
Capitalized Software
The Company capitalizes certain software costs, after technological feasibility has been established, which are amortized utilizing the straight-line method over the economic lives of the related products, generally not to exceed five years.
Goodwill
Goodwill represents the excess of the cost of companies acquired over the fair value of their net assets at the date of acquisition. Goodwill relating to each of the Company’s reporting units is tested for impairment annually as well as when an event, or change in circumstances, indicates an impairment is more likely than not to have occurred. The latest impairment review indicated goodwill was not impaired.
Revenue Recognition
Revenue from proppant sales is recognized when title passes to the customer, generally upon delivery. Revenue from consulting and geotechnical services is recognized at the time service is performed. Revenue from the sale of fracture simulation software is recognized when title passes to the customer at time of shipment. Revenue from the sale of spill prevention services is recognized at the time service is performed. Revenue from the sale of containment goods is recognized at the time goods are delivered.
Shipping and Handling Costs
Shipping and handling costs are classified as cost of sales. Shipping costs consist of transportation costs to deliver products to customers. Handling costs include labor and overhead to maintain finished goods inventory and operate distribution facilities.
Cost of Start-Up Activities
Start-up activities, including organization costs, are expensed as incurred. Start-up costs for 2014 related to the start-up of the new manufacturing facility in Millen, Georgia. There were no start-up costs during 2013. Start-up costs for 2012 primarily related to the start-up of the second resin-coating line at the Company’s New Iberia, Louisiana facility.
Use of Estimates
The preparation of financial statements in conformity with accounting principles generally accepted in the United States requires management to make estimates and assumptions that affect the amounts reported in the financial statements and accompanying notes. Actual results could differ from those estimates.
Research and Development Costs
Research and development costs are charged to operations when incurred and are included in Selling, General and Administrative expenses. The amounts incurred in 2014, 2013 and 2012 were $10,855, $8,416 and $6,916, respectively.
F-11
CARBO CERAMICS INC.
NOTES TO CONSOLIDATED FINANCIAL STATEMENTS—(Continued)
($ in thousands, except per share data)
Foreign Subsidiaries
Financial statements of the Company’s foreign subsidiaries are translated using current exchange rates for assets and liabilities; average exchange rates for the period for revenues, expenses, gains and losses; and historical exchange rates for equity accounts. Resulting translation adjustments are included in, and the only component of, Accumulated Other Comprehensive Loss as a separate component of shareholders’ equity.
New Accounting Pronouncements
In January 2015, the FASB issued ASU No. 2015-01, “Income Statement – Extraordinary and Unusual Items (Subtopic 225-20): Simplifying Income Statement Presentation by Eliminating the Concept of Extraordinary Items,” (“ASU 2015-01”) which eliminates the concept of extraordinary items from U.S. GAAP. ASU 2015-01 will be effective for the interim and annual periods beginning after December 15, 2015 with early adoption permitted. The adoption of ASU 2015-01 is not expected to have a material impact on the Company’s consolidated financial position, results of operations, cash flows, or related footnote disclosures.
In August 2014, the FASB issued ASU No. 2014-15, “Presentation of Financial Statements – Going Concern (Subtopic 205-40): Disclosure of Uncertainties about an Entity’s Ability to Continue as a Going Concern,” (“ASU 2014-15”) which provides guidance in U.S. GAAP about management’s responsibility to evaluate whether there is substantial doubt about an entity’s ability to continue as a going concern and to provide related footnote disclosures. ASU 2014-15 will be effective for the interim and annual periods beginning after December 15, 2016 with early adoption permitted. The adoption of ASU 2014-15 is not expected to have a material impact on the Company’s consolidated financial position, results of operations, cash flows, or related footnote disclosures.
In June 2014, the FASB issued ASU No. 2014-12, “Compensation – Stock Compensation (Topic 718): Accounting for Share-Based Payments When the Terms of an Award Provide That a Performance Target Could Be Achieved after the Requisite Service Period (a consensus of the FASB Emerging Issues Task Force),” (“ASU 2014-12”) which amends current guidance for stock compensation tied to performance targets. The amendments require that a performance target that affects vesting and that could be achieved after the requisite service period be treated as a performance condition and apply existing guidance in Topic 718 as it relates to awards with performance conditions that affect vesting to account for such awards. ASU 2014-12 will be effective for interim and annual periods beginning after December 15, 2015 with early adoption permitted. The adoption of ASU 2014-12 is not expected to have a material impact on the Company’s consolidated financial position, results of operations or cash flows.
In May 2014, the FASB issued ASU No. 2014-09, “Revenue from Contracts with Customers (Topic 606),” (“ASU 2014-09”) which amends current revenue guidance. The core principle of the guidance is that an entity should recognize revenue to depict the transfer of promised goods or services to customers in an amount that reflects the consideration to which the entity expects to be entitled in exchange for those goods or services. ASU 2014-09 will be effective for the interim and annual periods beginning after December 15, 2016 with no early adoption permitted. The Company is currently evaluating the potential impact, if any, of adopting this new guidance on the consolidated financial statements and related disclosures.
In April 2014, the FASB issued ASU No. 2014-08, “Presentation of Financial Statements (Topic 205) and Property, Plant, and Equipment (Topic 360): Reporting Discontinued Operations and Disclosures of Disposals of Components of an Entity,” (“ASU 2014-08”) which amends the reporting requirements of discontinued operations. The main provisions of the guidance require that a disposal of a component of an entity is required to
F-12
CARBO CERAMICS INC.
NOTES TO CONSOLIDATED FINANCIAL STATEMENTS—(Continued)
($ in thousands, except per share data)
be reported in discontinued operations if the disposal represents a strategic shift that has or will have a major effect on an entity’s operations and financial results. ASU 2014-08 will be effective for the interim and annual periods beginning after December 15, 2014 with early adoption permitted. The Company is currently evaluating the potential impact, if any, of adopting this new guidance on the consolidated financial statements and related disclosures.
| 2. | Intangible and Other Assets |
Following is a summary of intangible assets as of December 31:
| Weighted Average Life |
2014 | 2013 | ||||||||||||||||
| Gross Amount |
Accumulated Amortization |
Gross Amount |
Accumulated Amortization |
|||||||||||||||
| Intangibles: |
||||||||||||||||||
| Patents and licenses, software and hardware designs |
6 years | $ | 4,222 | $ | 2,171 | $ | 3,620 | $ | 1,461 | |||||||||
| Developed technology |
10 years | 2,782 | 1,461 | 2,782 | 1,182 | |||||||||||||
| Customer relationships and non-compete |
9 years | 2,838 | 1,753 | 2,838 | 1,428 | |||||||||||||
| Trademark |
Indefinite | 833 | — | 833 | — | |||||||||||||
|
|
|
|
|
|
|
|
|
|||||||||||
| $ | 10,675 | $ | 5,385 | $ | 10,073 | $ | 4,071 | |||||||||||
|
|
|
|
|
|
|
|
|
|||||||||||
Amortization expense for 2014, 2013 and 2012 was $1,313, $1,173 and $1,224, respectively. Estimated amortization expense for each of the ensuing years through December 31, 2019 is $1,238, $700, $638, $565 and $279, respectively.
Following is a summary of other assets as of December 31:
| 2014 | 2013 | |||||||
| Other assets: |
||||||||
| Bauxite raw materials: |
||||||||
| Inventories |
$ | 9,404 | $ | 9,949 | ||||
| Prepayments |
— | 474 | ||||||
| Other assets |
1,041 | 445 | ||||||
|
|
|
|
|
|||||
| $ | 10,445 | $ | 10,868 | |||||
|
|
|
|
|
|||||
Bauxite raw materials are used in the production of heavyweight ceramic products. As of December 31, 2014 and 2013, the Company has classified as long-term assets those bauxite raw materials inventories that are not expected to be consumed in production during the upcoming twelve month period.
| 3. | Bank Borrowings |
The Company has an unsecured revolving credit agreement with a bank. On March 5, 2012, the Company entered into a first amendment to this credit agreement to (i) extend its maturity date from January 29, 2013 to July 29, 2013, (ii) increase the size from $10,000 to $25,000, and (iii) make other administrative changes to certain covenants and provisions. On July 25, 2013, the Company entered into a second amendment to this credit agreement to (i) extend its maturity date to July 25, 2018, (ii) increase the size of the revolving credit facility to
F-13
CARBO CERAMICS INC.
NOTES TO CONSOLIDATED FINANCIAL STATEMENTS—(Continued)
($ in thousands, except per share data)
$50,000, and (iii) make other administrative changes to certain covenants and provisions. On October 31, 2014 the Company entered into a third amendment to this credit agreement that (i) extended the maturity date of the credit agreement from July 25, 2018 to October 31, 2019 and (ii) increased the size of the revolving credit facility from $50,000 to $100,000.
The Company has the option of choosing either the bank’s fluctuating Base Rate or LIBOR Fixed Rate, plus an Applicable Margin, all as defined in the credit agreement. The terms of the credit agreement provide for certain affirmative and negative covenants and require the Company to maintain certain financial ratios. Commitment fees are payable quarterly at an annual rate between 0.375% and 0.50% of the unused line of credit. Commitment fees for 2014, 2013 and 2012 were $207, $154 and $107, respectively.
As of December 31, 2014, the Company’s outstanding debt under the credit agreement was $25,000 and the weighted average interest rate was 2.625% based on LIBOR-based rate borrowings. The company did not have any outstanding debt under the credit agreement as of December 31, 2013.
| 4. | Leases |
The Company leases certain property, plant and equipment under operating leases, primarily consisting of railroad equipment leases. Net minimum future rental payments due under non-cancelable operating leases with remaining terms in excess of one year as of December 31, 2014 are as follows:
| 2015 |
$ | 17,682 | ||
| 2016 |
20,369 | |||
| 2017 |
18,711 | |||
| 2018 |
16,370 | |||
| 2019 |
13,567 | |||
| Thereafter |
53,866 | |||
|
|
|
|||
| Total |
$ | 140,565 | ||
|
|
|
Leases of railroad equipment generally provide for renewal options at their fair rental value at the time of renewal. In the normal course of business, operating leases for railroad equipment are generally renewed or replaced by other leases. For the years ended December 31, 2015 and 2016, minimum future rental payments in the table above are presented net of sublease income related to subleases of railroad equipment of $4,007 and $2,242, respectively. Rent expense for all operating leases was $24,116 in 2014, $22,542 in 2013 and $21,452 in 2012. For the years ended December 31, 2014 and 2013, rent expense is stated net of sublease income of $1,816 and $208, respectively.
F-14
CARBO CERAMICS INC.
NOTES TO CONSOLIDATED FINANCIAL STATEMENTS—(Continued)
($ in thousands, except per share data)
| 5. | Income Taxes |
Deferred income taxes reflect the net tax effects of temporary differences between the carrying amounts of assets and liabilities for financial reporting purposes and the amounts used for income tax purposes. Significant components of the Company’s deferred tax assets and liabilities as of December 31 are as follows:
| 2014 | 2013 | |||||||
| Deferred tax assets: |
||||||||
| Employee benefits |
$ | 1,440 | $ | 1,757 | ||||
| Inventories |
6,966 | 5,923 | ||||||
| Goodwill |
874 | 1,358 | ||||||
| Other |
2,942 | 4,438 | ||||||
| Foreign losses |
4,300 | — | ||||||
| Foreign tax assets valuation allowance |
(4,300 | ) | — | |||||
|
|
|
|
|
|||||
| Total deferred tax assets |
12,222 | 13,476 | ||||||
|
|
|
|
|
|||||
| Deferred tax liabilities: |
||||||||
| Depreciation |
81,628 | 54,973 | ||||||
| Foreign earnings |
— | 1,816 | ||||||
|
|
|
|
|
|||||
| Total deferred tax liabilities |
81,628 | 56,789 | ||||||
|
|
|
|
|
|||||
| Net deferred tax liabilities |
$ | 69,406 | $ | 43,313 | ||||
|
|
|
|
|
|||||
Foreign earnings in the table above are presented net of foreign tax credits of $0 and $5,019 as of December 31, 2014 and 2013, respectively, which are expected to be utilized upon repatriation of the foreign earnings. Benefits from foreign tax credits were not recognized in 2014 due to the uncertainty of the Company being able to realize the foreign tax assets associated with foreign investments.
Significant components of the provision for income taxes for the years ended December 31 are as follows:
| 2014 | 2013 | 2012 | ||||||||||
| Current: |
||||||||||||
| Federal |
$ | 11,310 | $ | 27,188 | $ | 37,596 | ||||||
| State |
500 | 2,164 | 2,268 | |||||||||
| Foreign |
1,084 | 842 | 1,581 | |||||||||
|
|
|
|
|
|
|
|||||||
| Total current |
12,894 | 30,194 | 41,445 | |||||||||
| Deferred |
24,389 | 10,121 | 11,212 | |||||||||
|
|
|
|
|
|
|
|||||||
| $ | 37,283 | $ | 40,315 | $ | 52,657 | |||||||
|
|
|
|
|
|
|
|||||||
F-15
CARBO CERAMICS INC.
NOTES TO CONSOLIDATED FINANCIAL STATEMENTS—(Continued)
($ in thousands, except per share data)
The reconciliation of income taxes computed at the U.S. statutory tax rate to the Company’s income tax expense for the years ended December 31 is as follows:
| 2014 | 2013 | 2012 | ||||||||||||||||||||||
| Amount | Percent | Amount | Percent | Amount | Percent | |||||||||||||||||||
| U.S. statutory rate |
$ | 32,505 | 35.0 | % | $ | 43,820 | 35.0 | % | $ | 55,507 | 35.0 | % | ||||||||||||
| State income taxes, net of federal tax benefit |
1,882 | 2.0 | 2,097 | 1.7 | 2,199 | 1.4 | ||||||||||||||||||
| Mining depletion |
(3,035 | ) | (3.3 | ) | (2,751 | ) | (2.2 | ) | (2,606 | ) | (1.6 | ) | ||||||||||||
| Foreign tax assets valuation allowance |
4,300 | 4.6 | — | — | — | — | ||||||||||||||||||
| Non-recognized benefit on foreign investments |
2,980 | 3.2 | — | — | — | — | ||||||||||||||||||
| Section 199 Manufacturing Benefit and other |
(1,349 | ) | (1.4 | ) | (2,851 | ) | (2.3 | ) | (2,443 | ) | (1.6 | ) | ||||||||||||
|
|
|
|
|
|
|
|
|
|
|
|
|
|||||||||||||
| $ | 37,283 | 40.1 | % | $ | 40,315 | 32.2 | % | $ | 52,657 | 33.2 | % | |||||||||||||
|
|
|
|
|
|
|
|
|
|
|
|
|
|||||||||||||
Provision has been made for deferred U.S. income taxes on all foreign earnings based on the Company’s intent to repatriate foreign earnings. The Company did not recognize benefits on foreign investments of $2,980 and recorded a $4,300 valuation allowance during the fourth quarter of 2014 due to the uncertainty of the Company being able to realize the foreign tax assets in light of current market conditions in China.
The Company elected to claim bonus tax depreciation totaling $61,781 on assets placed in service in the United States during 2014. This election reduced current taxable income, which reduced current income tax expense, increased deferred income tax expense, and reduced the Section 199 Manufacturing Benefit. The Company did not claim bonus depreciation on assets placed in service during 2013 or 2012.
The Company had a recorded reserve of $153 associated with uncertain tax positions as of December 31, 2014 and there were no significant changes to the recorded reserve during 2014. If these uncertain tax positions are recognized, substantially all of this amount would impact the effective tax rate. Related accrued interest and penalties are recorded in income tax expense and are not material.
The Company files its tax returns as prescribed by the tax laws of the jurisdictions in which it operates, the most significant of which are U.S. federal and certain state jurisdictions. The 2011 and subsequent tax years are still subject to examination. Various U.S. state jurisdiction tax years remain open to examination as well though the Company believes assessments, if any, would be immaterial to its consolidated financial statements.
| 6. | Shareholders’ Equity |
Common Stock
Holders of Common Stock are entitled to one vote per share on all matters to be voted on by shareholders and do not have cumulative voting rights. Subject to preferences of any Preferred Stock, the holders of Common Stock are entitled to receive ratably such dividends, if any, as may be declared from time to time by the Board of Directors out of funds legally available for that purpose. In the event of liquidation, dissolution or winding up of the Company, holders of Common Stock are entitled to share ratably in all assets remaining after payment of liabilities, subject to prior distribution rights of any Preferred Stock then outstanding. The Common Stock has no preemptive or conversion rights or other subscription rights. There are no redemption or sinking fund provisions applicable to the Common Stock. All outstanding shares of Common Stock are fully paid and non-assessable.
On January 20, 2015, the Board of Directors declared a cash dividend of $0.33 per share. The dividend was paid on February 16, 2015 to shareholders of record on February 2, 2015.
F-16
CARBO CERAMICS INC.
NOTES TO CONSOLIDATED FINANCIAL STATEMENTS—(Continued)
($ in thousands, except per share data)
Preferred Stock
The Company’s charter authorizes 5,000 shares of Preferred Stock. The Board of Directors has the authority to issue Preferred Stock in one or more series and to fix the rights, preferences, privileges and restrictions thereof, including dividend rights, conversion rights, voting rights, terms of redemption, redemption prices, liquidation preferences and the number of shares constituting any series or the designation of such series, without further vote or action by the Company’s shareholders. In connection with adoption of a shareholder rights plan on February 13, 2002, the Company created the Series A Preferred Stock and authorized 2,000 shares of the Series A Preferred Stock. This shareholder rights plan expired in February 2012.
Common Stock Repurchase Program
On August 28, 2008, the Company’s Board of Directors authorized the repurchase of up to two million shares of the Company’s Common Stock. Shares are effectively retired at the time of purchase. During the years ended December 31, 2014, 2013 and 2012, the Company repurchased and retired 47,424, 75,000 and 60,000 shares respectively, at an aggregate price of $5,175, $5,833 and $5,727, respectively. As of December 31, 2014, the Company has repurchased and retired 2,000,000 shares at an aggregate price of $89,309.
| 7. | Stock Based Compensation |
On May 20, 2014, the shareholders approved the 2014 CARBO Ceramics Inc. Omnibus Incentive Plan (the “2014 Omnibus Incentive Plan”). The 2014 Omnibus Incentive Plan replaces the expired 2009 Omnibus Incentive Plan. Under the 2014 Omnibus Incentive Plan, the Company may grant cash-based awards, stock options (both non-qualified and incentive) and other equity-based awards (including stock appreciation rights, phantom stock, restricted stock, restricted stock units, performance shares, deferred share units or share-denominated performance units) to employees and non-employee directors. The amount paid under the 2014 Omnibus Incentive Plan to any single participant in any calendar year with respect to any cash-based award shall not exceed $5,000. Awards may be granted with respect to a number of shares of the Company’s Common Stock that in the aggregate does not exceed 750,000 shares prior to the fifth anniversary of its effective date, plus (i) the number of shares that are forfeited, cancelled or returned, and (ii) the number of shares that are withheld from the participants to satisfy an option exercise price or minimum statutory tax withholding obligations. No more than 50,000 shares may be granted to any single participant in any calendar year. Equity-based awards may be subject to performance-based and/or service-based conditions. With respect to stock options and stock appreciation rights granted, the exercise price shall not be less than the market value of the underlying Common Stock on the date of grant. The maximum term of an option is ten years. Restricted stock awards granted generally vest (i.e., transfer and forfeiture restrictions on these shares are lifted) proportionately on each of the first three anniversaries of the grant date, but subject to certain limitations, awards may specify other vesting periods. As of December 31, 2014, 742,534 shares were available for issuance under the 2014 Omnibus Incentive Plan. Although the Company’s 2009 Omnibus Incentive Plan has expired, unvested shares granted under that plan remain outstanding in accordance with its terms.
As of December 31, 2012, all compensation cost related to stock options granted under the expired stock option plan has been recognized. During 2012, a total of 2,425 options, with a weighted-average exercise price of $22.35 per share, were exercised. There were no options outstanding at December 31, 2012 and thereafter. The total intrinsic value of options exercised during the years ended December 31, 2014, 2013 and 2012 was none, none, and $118, respectively.
F-17
CARBO CERAMICS INC.
NOTES TO CONSOLIDATED FINANCIAL STATEMENTS—(Continued)
($ in thousands, except per share data)
A summary of restricted stock activity and related information for the year ended December 31, 2014 is presented below:
| Shares | Weighted- Average Grant-Date Fair Value |
|||||||
| Nonvested at January 1, 2014 |
136,195 | $ | 90.50 | |||||
| Granted |
76,085 | $ | 111.99 | |||||
| Vested |
(59,533 | ) | $ | 94.70 | ||||
| Forfeited |
(5,258 | ) | $ | 100.95 | ||||
|
|
|
|||||||
| Nonvested at December 31, 2014 |
147,489 | $ | 99.51 | |||||
|
|
|
|||||||
As of December 31, 2014, there was $7,499 of total unrecognized compensation cost, net of estimated forfeitures, related to restricted shares granted under the Omnibus Incentive Plans. That cost is expected to be recognized over a weighted-average period of 1.6 years. The weighted-average grant date fair value of restricted stock granted during the years ended December 31, 2014, 2013 and 2012 was $111.99, $82.18 and $105.22, respectively. The total fair value of shares vested during the years ended December 31, 2014, 2013 and 2012 was $5,638, $4,995 and $4,696, respectively.
The Company also made phantom stock awards to key international employees pursuant to the expired 2009 Omnibus Incentive Plan prior to its expiration. The units subject to an award vest and cease to be forfeitable in equal annual installments over a three-year period. Participants awarded units of phantom stock are entitled to a lump sum cash payment equal to the fair market value of a share of Common Stock on the vesting date. In no event will Common Stock of the Company be issued with regard to outstanding phantom stock awards. As of December 31, 2014, there were 18,180 units of phantom stock granted under the expired 2009 Omnibus Incentive Plan, of which 9,397 have vested and 1,570 have been forfeited, with a total value of $289, a portion of which is accrued as a liability within Accrued Payroll and Benefits.
| 8. | Earnings Per Share |
ASC Topic 260, “Earnings Per Share”, provides that unvested share-based payment awards that contain non-forfeitable rights to dividends or dividend equivalents (whether paid or unpaid) are participating securities and shall be included in the computation of earnings per share pursuant to the two-class method. The Company’s outstanding non-vested restricted stock awards are participating securities. Accordingly, earnings per common share are computed using the two-class method.
F-18
CARBO CERAMICS INC.
NOTES TO CONSOLIDATED FINANCIAL STATEMENTS—(Continued)
($ in thousands, except per share data)
The following table sets forth the computation of basic and diluted earnings per share under the two-class method:
| 2014 | 2013 | 2012 | ||||||||||
| Numerator for basic and diluted earnings per share: |
||||||||||||
| Net income |
$ | 55,588 | $ | 84,886 | $ | 105,933 | ||||||
| Effect of reallocating undistributed earnings of participating securities |
(376 | ) | (530 | ) | (553 | ) | ||||||
|
|
|
|
|
|
|
|||||||
| Net income available under the two-class method |
$ | 55,212 | $ | 84,356 | $ | 105,380 | ||||||
|
|
|
|
|
|
|
|||||||
| Denominator: |
||||||||||||
| Denominator for basic earnings per share—weighted-average shares |
22,946,395 | 22,957,013 | 22,968,696 | |||||||||
| Effect of dilutive potential common shares |
— | — | 625 | |||||||||
|
|
|
|
|
|
|
|||||||
| Denominator for diluted earnings per share—adjusted weighted—average shares |
22,946,395 | 22,957,013 | 22,969,321 | |||||||||
|
|
|
|
|
|
|
|||||||
| Basic earnings per share |
$ | 2.41 | $ | 3.67 | $ | 4.59 | ||||||
|
|
|
|
|
|
|
|||||||
| Diluted earnings per share |
$ | 2.41 | $ | 3.67 | $ | 4.59 | ||||||
|
|
|
|
|
|
|
|||||||
| 9. | Quarterly Operating Results – (Unaudited) |
Quarterly results for the years ended December 31, 2014 and 2013 were as follows:
| Three Months Ended | ||||||||||||||||
| March 31 | June 30 | September 30 | December 31 | |||||||||||||
| 2014 |
||||||||||||||||
| Revenues |
$ | 148,564 | $ | 176,561 | $ | 155,402 | $ | 167,798 | ||||||||
| Gross profit |
44,364 | 53,648 | 42,150 | 41,118 | ||||||||||||
| Net income |
18,427 | 23,017 | 13,744 | 399 | ||||||||||||
| Earnings per share: |
||||||||||||||||
| Basic |
$ | 0.80 | $ | 1.00 | $ | 0.60 | $ | 0.02 | ||||||||
| Diluted |
$ | 0.80 | $ | 1.00 | $ | 0.60 | $ | 0.02 | ||||||||
| 2013 |
||||||||||||||||
| Revenues |
$ | 147,657 | $ | 153,744 | $ | 201,477 | $ | 164,520 | ||||||||
| Gross profit |
42,384 | 39,333 | 62,759 | 48,519 | ||||||||||||
| Net income |
17,577 | 16,307 | 30,148 | 20,854 | ||||||||||||
| Earnings per share: |
||||||||||||||||
| Basic |
$ | 0.76 | $ | 0.71 | $ | 1.31 | $ | 0.90 | ||||||||
| Diluted |
$ | 0.76 | $ | 0.71 | $ | 1.31 | $ | 0.90 | ||||||||
Quarterly data may not sum to full year data reported in the Consolidated Financial Statements due to rounding.
F-19
CARBO CERAMICS INC.
NOTES TO CONSOLIDATED FINANCIAL STATEMENTS—(Continued)
($ in thousands, except per share data)
| 10. | Sales to Customers |
The following schedule presents customers from whom the Company derived 10% or more of total revenues for the years ended December 31:
| Major Customers | ||||||||
| A | B | |||||||
| 2014 |
22.4 | % | 29.9 | % | ||||
| 2013 |
13.1 | % | 34.7 | % | ||||
| 2012 |
13.7 | % | 35.2 | % | ||||
| 11. | Geographic Information |
Long-lived assets, consisting of net property, plant and equipment and other long-term assets, as of December 31 in the United States and other countries are as follows:
| 2014 | 2013 | 2012 | ||||||||||
| Long-lived assets: |
||||||||||||
| United States |
$ | 561,109 | $ | 454,031 | $ | 403,534 | ||||||
| International (primarily China and Russia) |
18,052 | 35,372 | 36,535 | |||||||||
|
|
|
|
|
|
|
|||||||
| Total |
$ | 579,161 | $ | 489,403 | $ | 440,069 | ||||||
|
|
|
|
|
|
|
|||||||
During 2014, the Company recorded an impairment of most of the long-lived assets in China. Consequently, the above international assets in 2014 are primarily associated with Russia.
Revenues outside the United States accounted for 24%, 21% and 23% of the Company’s revenues for 2014, 2013 and 2012, respectively. Revenues for the years ended December 31 in the United States, Canada and other countries are as follows:
| 2014 | 2013 | 2012 | ||||||||||
| Revenues: |
||||||||||||
| United States |
$ | 491,004 | $ | 529,603 | $ | 500,106 | ||||||
| Canada |
73,092 | 43,329 | 30,929 | |||||||||
| Other international |
84,229 | 94,466 | 114,501 | |||||||||
|
|
|
|
|
|
|
|||||||
| Total |
$ | 648,325 | $ | 667,398 | $ | 645,536 | ||||||
|
|
|
|
|
|
|
|||||||
| 12. | Benefit Plans |
The Company has defined contribution savings and profit sharing plans pursuant to Section 401(k) of the Internal Revenue Code. Benefit costs recognized as expense under these plans consisted of the following for the years ended December 31:
| 2014 | 2013 | 2012 | ||||||||||
| Contributions: |
||||||||||||
| Profit sharing |
$ | 2,337 | $ | 2,126 | $ | 2,132 | ||||||
| Savings |
1,849 | 1,609 | 1,241 | |||||||||
|
|
|
|
|
|
|
|||||||
| $ | 4,186 | $ | 3,735 | $ | 3,373 | |||||||
|
|
|
|
|
|
|
|||||||
F-20
CARBO CERAMICS INC.
NOTES TO CONSOLIDATED FINANCIAL STATEMENTS—(Continued)
($ in thousands, except per share data)
All contributions to the plans are 100% participant directed. Participants are allowed to invest up to 20% of contributions in the Company’s Common Stock.
| 13. | Commitments |
In January 2011, the Company entered into an agreement with one of the Company’s existing suppliers to purchase from the supplier at least 70 percent of the annual kaolin requirements for the Eufaula plant at specified contract prices. The term of the agreement was three years, with options to extend for an additional six years. In May 2012, the agreement was amended to require the Company to purchase from the supplier at least 50 percent of the annual kaolin requirements for the Eufaula, Alabama plant at specified contract prices for the remainder of 2012 and the ensuing five calendar years. The agreement has options to extend the term for an additional three years. For the years ended December 31, 2014, 2013 and 2012, the Company purchased from the supplier $2,263, $3,788 and $3,012, respectively, of kaolin under the agreement.
In January 2003, the Company entered into a mining agreement with a contractor to provide kaolin for the Company’s McIntyre plant at specified contract prices, from lands owned or leased by either the Company or the contractor. The term of the agreement, which commenced on January 1, 2003, and remains in effect until such time as all Company-owned minerals have been depleted, requires the Company to accept delivery from the contractor of at least 80 percent of the McIntyre plant’s annual kaolin requirements. In 2006, the Company’s plant in Toomsboro, Georgia commenced operations and became part of this agreement. For the years ended December 31, 2014, 2013 and 2012, the Company purchased $14,823, $13,091 and $12,919, respectively, of kaolin under the agreement.
In July 2011, the Company entered into a new agreement with a supplier to provide hydro sized sand for the Company’s Marshfield, Wisconsin plant at a specified contract price. The term of the agreement was five years commencing on July 30, 2011 and required the Company to purchase a minimum of 40,000 tons and 100,000 tons of hydro sized sand during 2011 and 2012, respectively. Effective January 30, 2012, the agreement was amended and requires the Company to purchase a minimum of 150,000 tons of hydro sized sand annually during 2012 and 2013 and a minimum of 350,000 tons of hydro sized sand in 2014, all at a stated contract price. For the years ended December 31, 2014, 2013 and 2012, the Company purchased $6,922, $3,546 and $2,538, respectively, of sand under this agreement.
In May 2012, the Company entered into a new supply agreement to provide kaolin for the Company’s manufacturing plant in Millen, Georgia at specified contract prices, from lands owned or leased by either the Company or the contractor. The term of the agreement, which commenced in July 2014, has an initial term of five years with options to extend for an additional five years and requires the Company to accept delivery from the contractor of at least 50 percent of the Millen plant’s annual kaolin requirements. For the year ended December 31, 2014, the Company purchased $1,465 of kaolin under this agreement.
The Company has entered into a lease agreement dated November 1, 2008 with the Development Authority of Wilkinson County (the “Wilkinson County Development Authority”) and a lease agreement dated November 1, 2012 with the Development Authority of Jenkins County (the “Jenkins County Development Authority” and together with the Wilkinson County Development Authority, the “Development Authorities”) each in the State of Georgia. Pursuant to the 2008 agreement, the Wilkinson County Development Authority holds the title to the real and personal property of the Company’s McIntyre and Toomsboro manufacturing facilities and leases the facilities to the Company for an annual rental fee of $50 per year through the year 2022. Pursuant to the 2012 agreement, the Jenkins County Development Authority holds title to the real estate and
F-21
CARBO CERAMICS INC.
NOTES TO CONSOLIDATED FINANCIAL STATEMENTS—(Continued)
($ in thousands, except per share data)
personal property of the Company’s Millen, Georgia manufacturing facility, a portion of which is currently under construction, and leases the facility to the Company until the tenth anniversary of completion of the final phase of the facility. At any time prior to the scheduled termination of either lease, the Company has the option to terminate the lease and purchase the property for a nominal fee plus the payment of any rent payable through the balance of the lease term. Furthermore, the Company has security interests in the titles held by the Development Authorities. The Company has also entered into a Memorandum of Understanding (the “MOU”) with the Development Authorities and other local agencies, under which the Company receives tax incentives in exchange for its commitment to invest in the county and increase employment. The MOU with the Jenkins County Development Authority also requires the Company to pay an administrative payment of $50 per year during the term of the Millen lease. The Company is required to achieve certain employment levels in order to retain its tax incentives. In the event the Company does not meet the agreed-upon employment targets or the MOU is otherwise terminated, the Company would be subjected to additional property taxes annually. The properties subject to these lease agreements are included in Property, Plant and Equipment (net book value of $367,053 at December 31, 2014) in the accompanying consolidated financial statements.
The Company uses natural gas to power its domestic manufacturing plants. From time to time the Company enters into contracts to purchase a portion of the anticipated natural gas requirements at specified prices. As of December 31, 2014, the Company had natural gas contracts totaling $25,119, $20,142, $13,473 and $9,923 for years ended 2015, 2016, 2017 and 2018, respectively.
| 14. | Employment Agreements |
The Company has an employment agreement through December 31, 2015 with its President and Chief Executive Officer. The agreement provides for an annual base salary and incentive bonus. If the President and Chief Executive Officer is terminated early without cause, the Company will be obligated to pay two years base salary and a prorated incentive bonus. Under the agreement, the timing of the payment of severance obligations to the President in the event of the termination of his employment under certain circumstances has been conformed so that a portion of such obligations will be payable in a lump sum, with the remainder of the obligations to be paid over an 18 month period. The agreement also contains a two-year non-competition covenant that would become effective upon termination for any reason. The employment agreement extends automatically for successive one-year periods without prior written notice.
| 15. | Foreign Currencies |
As of December 31, 2014, the Company’s net investment that is subject to foreign currency fluctuations totaled $45,829, and the Company has recorded a cumulative foreign currency translation loss of $22,969. This cumulative translation loss is included in and is the only component of Accumulated Other Comprehensive Loss. There were no amounts reclassified to net income during the year ended December 31, 2014. During 2014, the value of the Russian Ruble significantly declined relative to the U.S. dollar for which the financial impact on the Company’s net assets in Russia is included in Other Comprehensive Income and the cumulative foreign currency translation loss noted above. No income tax benefits have been recorded on these losses as a result of the uncertainty about recoverability of the related deferred income tax benefits.
| 16. | Legal Proceedings and Regulatory Matters |
The Company is subject to legal proceedings, claims and litigation arising in the ordinary course of business. While the outcome of these matters is currently not determinable, management does not expect that the ultimate costs to resolve these matters will have a material adverse effect on the Company’s consolidated financial position, results of operations, or cash flows.
F-22
CARBO CERAMICS INC.
NOTES TO CONSOLIDATED FINANCIAL STATEMENTS—(Continued)
($ in thousands, except per share data)
| 17. | Subsequent Events |
In January 2015, the Company awarded 204,395 shares of restricted stock to certain employees. The fair value of the stock award on the date of grant totaled $6,906, which will be recognized as expense, net of estimated forfeitures, on a straight-line basis over the three-year vesting period.
In January 2015, the Company awarded 5,020 units of phantom shares to certain key international employees. The fair value of the stock award on the date of grant totaled $169.
In January 2015, the Company’s Board of Directors authorized the repurchase of up to two million shares of the Company’s Common Stock. As of February 17, 2015, the Company had not yet repurchased any shares under this plan.
Subsequent to December 31, 2014, the Company drew down $10,000 on its existing revolving credit facility to support various commitments. As of February 26, 2015, the balance outstanding on the Company’s revolving credit facility was $35,000.
Given current business conditions, the Company expects to idle its plant in China during the first quarter of 2015.
F-23
Exhibit Index
| 3.1 | Restated Certificate of Incorporation of CARBO Ceramics Inc. (incorporated by reference to Exhibit 3.1 of the Registrant’s Form 10-Q filed for the period ending June 30, 2012) | |
| 3.2 | Second Amended and Restated By-Laws of CARBO Ceramics Inc. (incorporated by reference to Exhibit 3.1 of the Registrant’s Form 8-K Current Report filed March 20, 2009) | |
| 4.1 | Form of Common Stock Certificate of CARBO Ceramics Inc. (incorporated by reference to Exhibit 4.1 of the Registrant’s Form S-1 Registration Statement No. 333-1884 filed July 19, 1996) | |
| 4.2 | Certificate of Designations of Series A Preferred Stock (incorporated by reference to Exhibit 2 of the Registrant’s Form 8-A12B Registration Statement No. 001-15903 filed February 26, 2002) | |
| 10.1 | Mining Agreement dated as of January 1, 2003 between CARBO Ceramics Inc. and Arcilla Mining & Land Co. (incorporated by reference to Exhibit 10.8 of the Registrant’s Form 10-K Annual Report for the year ended December 31, 2002) | |
| 10.2 | Addendum to Mining Agreement dated as of November 10, 2009 between CARBO Ceramics Inc. and Arcilla Mining & Land Co. (incorporated by reference to Exhibit 10.3 of the Registrant’s Form 10-K Annual Report for the year ended December 31, 2010) | |
| *10.3 | Second Amended and Restated Employment Agreement dated effective as of January 1, 2012, by and between CARBO Ceramics Inc. and Gary A. Kolstad (incorporated by reference to Exhibit 10.8 of the Registrant’s Form 10-K filed for the period ending December 31, 2011) | |
| *10.4 | Third Amended and Restated Employment Agreement dated effective as of December 16, 2014, by and between CARBO Ceramics Inc. and Gary A. Kolstad | |
| 10.5 | Proppant Supply Agreement dated as of August 28, 2008 between CARBO Ceramics Inc. and Halliburton Energy Services, Inc. (incorporated by reference to Exhibit 10.3 of the Registrant’s Form 10-Q Quarterly Report for the quarter ended September 30, 2008) | |
| 10.6 | Amendment No. 1 to Proppant Supply Agreement dated as of February 28, 2011 between CARBO Ceramics Inc. and Halliburton Energy Services, Inc. (incorporated by reference to Exhibit 10.1 of the Registrant’s Form 10-Q Quarterly Report for the quarter ended March 31, 2011) | |
| 10.7 | Side Letter to Proppant Supply Agreement dated as of August 26, 2011 between CARBO Ceramics Inc. and Halliburton Energy Services, Inc. (incorporated by reference to Exhibit 10.1 of the Registrant’s Form 10-Q Quarterly Report for the quarter ended September 30, 2011) | |
| 10.8 | Amendment No. 3 to Proppant Supply Agreement dated as of March 24, 2014 by and between CARBO Ceramics Inc. and Halliburton Energy Services, Inc. (incorporated by reference to Exhibit 10.1 of the Registrant’s Form 10-Q Quarterly Report for the quarter ended March 31, 2014) | |
| 10.9 | Lease Agreement dated as of November 1, 2008 between the Development Authority of Wilkinson County and CARBO Ceramics Inc. (incorporated by reference to Exhibit 10.1 of the Registrant’s Form 8-K Current Report filed December 30, 2008) | |
| 10.10 | Option Agreement dated as of November 1, 2008 between the Development Authority of Wilkinson County and CARBO Ceramics Inc. (incorporated by reference to Exhibit 10.2 of the Registrant’s Form 8-K Current Report filed December 30, 2008) | |
| 10.11 | Lease Agreement dated as of November 1, 2012 between the Development Authority of Jenkins County and CARBO Ceramics Inc. (incorporated by reference to Exhibit 10.9 of the Registrant’s Form 10-K Annual Report for the year ended December 31, 2012) | |
| *10.12 | CARBO Ceramics Inc. Omnibus Incentive Plan (incorporated by reference to Exhibit 10.1 of the Registrant’s Form 8-K Current Report filed May 21, 2009) | |
| *10.13 | 2014 CARBO Ceramics Inc. Omnibus Incentive Plan (incorporated by reference to Appendix A of the Registrant’s Definitive Proxy Statement on Schedule 14A filed April 2, 2014) | |
| *10.14 | Form of Officer Restricted Stock Award Agreement for Omnibus Incentive Plan (incorporated by reference to Exhibit 10.20 of the Registrant’s Form 10-K Annual Report for the year ended December 31, 2010) | |
| *10.15 | Form of Amended and Restated Officer Restricted Stock Award Agreement for Omnibus Incentive Plan (incorporated by reference to Exhibit 10.12 of the Registrant’s Form 10-K Annual Report for the year ended December 31, 2013) | |
| *10.16 | Form of Non-Employee Director Restricted Stock Award Agreement for Omnibus Incentive Plan (incorporated by reference to Exhibit 10.21 of the Registrant’s Form 10-K Annual Report for the year ended December 31, 2010) | |
| *10.17 | Form of Amended and Restated Non-Employee Director Restricted Stock Award Agreement for Omnibus Incentive Plan (incorporated by reference to Exhibit 10.14 of the Registrant’s Form 10-K Annual Report for the year ended December 31, 2013) | |
| *10.18 | Description of Annual Non-Employee Director Stock Grants (incorporated by reference to Exhibit 10.1 of the Registrant’s Form 10-Q Quarterly Report for the quarter ended June 30, 2010) | |
| *10.19 | Description of Modification to Annual Non-Employee Director Stock Grants (incorporated by reference to Exhibit 10.2 of the Registrant’s Form 10-Q Quarterly Report for the quarter ended March 31, 2011) | |
| *10.20 | Description of Modification to the Annual Non-Employee Director Stock Grants (incorporated by reference to Exhibit 10.2 of the Registrant’s Form 10-Q Quarterly Report for the quarter ended March 31, 2012) | |
| *10.21 | Description of Modification to Annual Non-Employee Director Stock Grants (incorporated by reference to Exhibit 10.1 of the Registrant’s Form 10-Q Quarterly Report for the quarter ended March 31, 2013) | |
| *10.22 | Description of Modification to Annual Non-Employee Director Stock Grants (incorporated by reference to Exhibit 10.2 of the Registrant’s Form 10-Q Quarterly Report for the quarter ended March 31, 2014) | |
| *10.23 | CARBO Ceramics Inc. Omnibus Incentive Plan Annual Incentive Arrangement (incorporated by reference to Exhibit 10.1 of the Registrant’s Form 8-K Current Report filed January 21, 2010) | |
| *10.24 | CARBO Ceramics Inc. 2014 Omnibus Incentive Plan Annual Incentive Arrangement | |
| 10.25 | Office Lease dated as of January 20, 2009 between I-10 EC Corridor #2 Limited Partnership and CARBO Ceramics Inc. (incorporated by reference to Exhibit 10.27 of the Registrant’s Form 10-K Annual Report for the year ended December 31, 2009) | |
| 10.26 | First Amendment to Lease dated as of January 15, 2010 between I-10 EC Corridor #2 Limited Partnership and CARBO Ceramics Inc. (incorporated by reference to Exhibit 10.28 of the Registrant’s Form 10-K Annual Report for the year ended December 31, 2009) | |
| 10.27 | Credit Agreement, dated as of January 29, 2010, among CARBO Ceramics Inc., as borrower, Wells Fargo Bank, National Association, as administrative agent, issuing lender and swing line lender, and the lenders named therein (incorporated by reference to Exhibit 10.1 of the Registrant’s Form 8-K Current Report filed February 4, 2010) | |
| 10.28 | Amendment No. 1, dated as of March 5, 2012, among CARBO Ceramics Inc., as borrower, Wells Fargo Bank, National Association, as administrative agent, issuing lender and swing line lender, and the lenders named therein (incorporated by reference to Exhibit 10.1 of the Registrant’s Form 8-K Current Report filed March 6, 2012) | |
| 10.29 | Amendment No. 2 to Credit Agreement, dated as of July 25, 2013, among CARBO Ceramics Inc., as borrower, Wells Fargo Bank, National Association, as administrative agent, issuing lender and swing line lender, and the lenders named therein (incorporated by reference to Exhibit 10.1 of the Registrant’s Form 10-Q Quarterly Report for the quarter ended June 30, 2013) | |
| 10.30 | Amendment No. 3 to Credit Agreement, dated as of October 31, 2014, among CARBO Ceramics Inc., as borrower, Wells Fargo Bank, National Association, as administrative agent, issuing lender and swing line lender, and the lenders named therein (incorporated by reference to Exhibit 10.1 of the Registrant’s Form 10-Q Quarterly Report for the quarter ended September 30, 2014) | |
| *10.31 | Form of Change in Control Severance Agreement (incorporated by reference to Exhibit 10.1 of the Registrant’s Form 10-Q Quarterly Report for the quarter ended March 31, 2012). | |
| 21 | Subsidiaries | |
| 23 | Consent of Independent Registered Public Accounting Firm | |
| 31.1 | Rule 13a-14(a)/15d-14(a) Certification by Gary A. Kolstad | |
| 31.2 | Rule 13a-14(a)/15d-14(a) Certification by Ernesto Bautista III | |
| 32 | Certification pursuant to 18 U.S.C. Section 1350, as adopted pursuant to Section 906 of the Sarbanes-Oxley Act of 2002 | |
| 95 | Mine Safety Disclosure | |
| 101 | The following financial information from the Company’s Annual Report on Form 10-K for the year ended December 31, 2014, formatted in XBRL: (i) Consolidated Balance Sheets; (ii) Consolidated Statements of Income; (iii) Consolidated Statements of Shareholders’ Equity; (iv) Consolidated Statements of Cash Flows; and (v) Notes to the Consolidated Financial Statements. | |
| * | Management contract or compensatory plan or arrangement filed as an exhibit pursuant to Item 15(b) of the requirements for an Annual Report on Form 10-K. |