Attached files
| file | filename |
|---|---|
| 8-K - RAIT FINANCIAL TRUST--FORM 8-K - RAIT Financial Trust | d439109d8k.htm |
 1
R
A
I
T
RAIT Financial Trust
Investor Presentation
Third Quarter 2012
Exhibit 99.1 |
 2
R
A
I
T
Forward Looking Statements &
Non-GAAP Financial Measures
This
document
and
the
related
presentation
may
contain
forward-looking
statements
within
the
meaning
of
the
Private
Securities
Litigation
Reform
Act
of
1995.
These
forward-looking
statements
include,
but
are
not
limited
to,
statements
about
RAIT
Financial
Trust’s
(“RAIT”)
plans,
objectives,
expectations
and
intentions
with
respect
to
future
operations,
products,
dividends,
cash
from
investments
and
services
and
other
statements
that
are
not
historical
facts.
Forward-
looking
statements
are
sometimes
identified
by
the
words
“may”,
“will”,
“should”,
“potential”,
“predict”,
“continue”,
“project”,
“guide”,
or
other
similar
words
or
expressions.
These
forward-looking
statements
are
based
upon
the
current
beliefs
and
expectations
of
RAIT's
management
and
are
inherently
subject
to
significant
business,
economic
and
competitive
uncertainties
and
contingencies,
many
of
which
are
difficult
to
predict
and
generally
not
within
RAIT’s
control.
In
addition,
these
forward-looking
statements
are
subject
to
assumptions
with
respect
to
future
business
strategies
and
decisions
that
are
subject
to
change.
RAIT
does
not
guarantee
that
the
assumptions
underlying
such
forward
looking
statements
are
free
from
errors.
Actual
results
may
differ
materially
from
the
anticipated
results
discussed
in
these
forward-looking
statements.
The following factors, among others, could cause actual results to differ materially from the
anticipated results or other expectations expressed in the forward-looking
statements: the risk factors and other disclosure contained in filings by RAIT with the
Securities and Exchange Commission (“SEC”), including, without limitation, RAIT’s most recent
annual and quarterly reports filed with SEC. RAIT’s SEC filings are available on
RAIT’s website at www.raitft.com. You
are
cautioned
not
to
place
undue
reliance
on
these
forward-looking
statements,
which
speak
only
as
of
the
date
of
this
presentation.
All
subsequent
written
and
oral
forward-looking
statements
attributable
to
RAIT
or
any
person
acting
on
its
behalf
are
expressly
qualified
in
their
entirety
by
the
cautionary
statements
contained
or
referred
to
in
this
document
and
the
related
presentation.
Except
to
the
extent
required
by
applicable
law
or
regulation,
RAIT
undertakes
no
obligation
to
update
these
forward-looking
statements
to
reflect
events
or
circumstances
after
the
date
of
this
presentation
or
to
reflect
the
occurrence
of
unanticipated
events.
This document and the related presentation may contain non-U.S. generally accepted
accounting principles (“GAAP”) financial measures. A reconciliation of
these non-GAAP financial measures to the most directly comparable GAAP financial
measure is included in this document and/or RAIT’s most recent annual and quarterly reports.
This presentation is for informational purposes only and does not constitute an offer to sell
or a solicitation of an offer to buy any securities of RAIT or Independence Realty
Trust, Inc. |
 3
R
A
I
T
About RAIT
RAIT Financial Trust (“RAIT”) (NYSE: RAS), is a multi-strategy commercial real
estate company organized as an internally-managed REIT
Scalable commercial real estate platform with over 350 employees
$3.6 billion of assets under management
Seasoned executive team with strong real estate experience
Increased quarterly common dividend to $0.09 for the third quarter 2012 –
a 50% increase from the fourth quarter 2011
No corporate, unsecured, recourse debt maturities until October 2015
As of September 30, 2012 |
 4
R
A
I
T
Multi-Strategy Business Approach
Commercial real estate lender
“One Source”
financing option to middle market
Comprehensive lending platform -
originate, underwrite, close & service CMBS
and transitional CRE loans
$1.0 billion loan portfolio
Commercial real estate owner
Maximize value of the portfolio over time through increased occupancy and
rental rates
$997 million portfolio (58 properties): 60% multi-family, 26% office, 9% retail
and 5% other
Adds stability to the asset mix
Asset and property manager
S&P & Morningstar rated primary and special loan servicer
Full service property management capabilities
Asset Manager –
earning management fees
Non-traded REIT sponsor: Scalable non-traded REIT platform
As of September 30, 2012 |
 5
R
A
I
T
Commercial Real Estate Lender
The lending opportunity
Over
$1.5
trillion
of
CRE
debt
is
expected
to
mature
through
2019
(1)
Limited competition for small balance CMBS loans and short term transitional loans
Increasing
CMBS
activity:
market
expects
to
end
2012
with
around
$46
billion
of
issuance,
approximately
a
43%
increase
over
the
$32.7
billion
issued
in
2011
(2)
Equity gap drives bridge and mezzanine lending opportunities
RAIT’s goal
Capitalize on lending opportunity utilizing existing, scalable platform and internal
expertise to originate and underwrite bridge, mezzanine and CMBS
loans of $5
million to $30 million on multi-family, office, retail and light industrial
properties Active credit and risk management
(1)
Morgan Stanley, Bloomberg LP, Foresight Analytics, Trepp and Intex
(2)
Commercial Mortgage Alert and CRE Finance Council |
 6
R
A
I
T
Commercial Real Estate Lender: CMBS
CMBS loans
Funding
Barclays $150 million
Citibank $100 million
Originated
$51
million
and
securitized
$42
million
of
CMBS
loans
from
January
1,
20
12 through
September
30,
2012
CMBS pipeline at approximately $530 million at September 30, 2012
CMBS loans: warehouse providers |
 7
R
A
I
T
Commercial Real Estate Lender: Bridge &
Mezzanine Lending
Bridge & mezzanine lending
$234 million in transitional loan originations from January 1, 2012 through September
30, 2012
Bridge and mezzanine pipeline at approximately $134 million at September 30, 2012
General terms
–
transitional properties
Bridge loans –
floating rate, fees, approximately 6.5% -
7% coupons
Mezzanine loans -
floating rate, fees, approximately 12%+ coupons
Origination and exit fees
Funding
Senior participations: regional bank participation program
Sourcing: warehouse and credit facilities |
 8
R
A
I
T
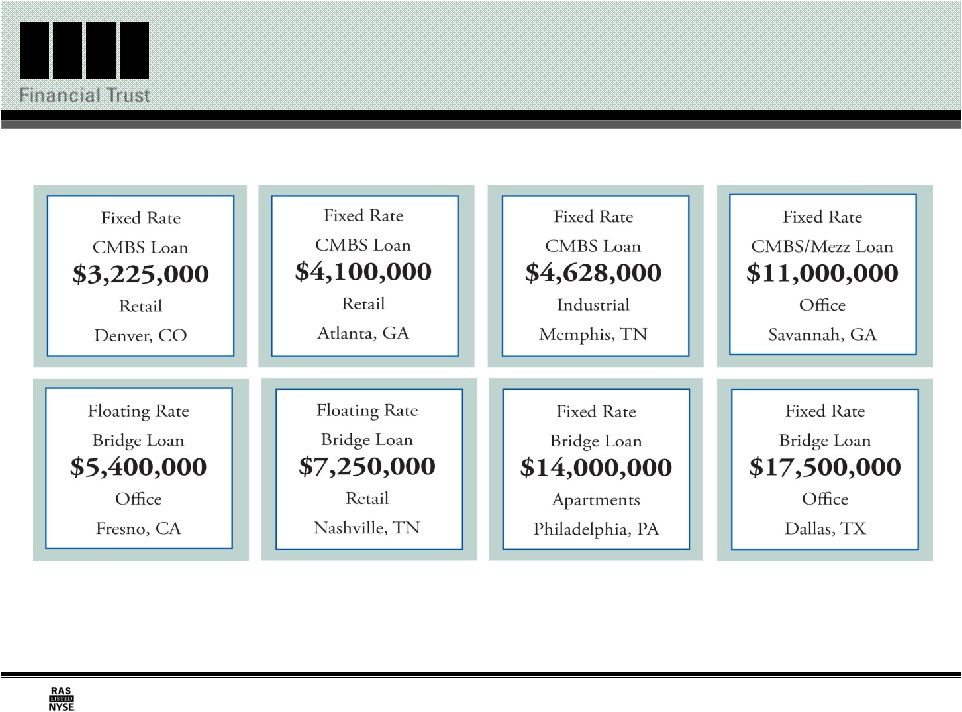
Commercial Real Estate Loan Examples |
 9
R
A
I
T
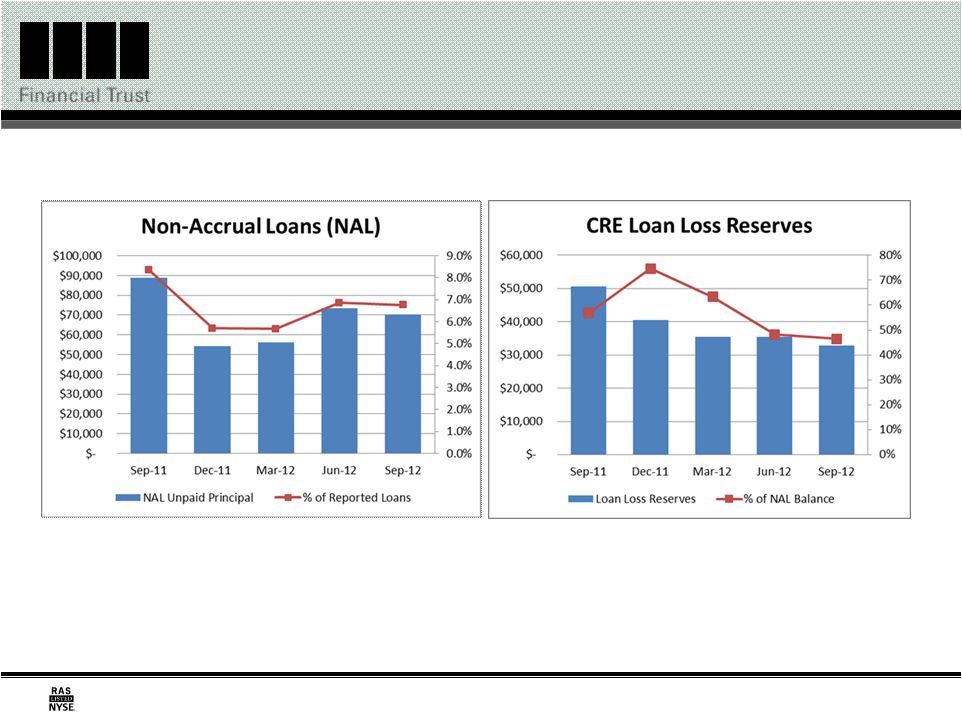
Risk Management: Commercial Real Estate
Loan Performance
As of September 30, 2012 ($ in 000s) |
 10
R
A
I
T
Commercial Real Estate Owner
Directly owned real estate portfolio
Strategy to maximize value over time through increasing occupancy and higher
rental rates
$997 million of CRE properties at September 30, 2012
Assets acquired below replacement cost
Portfolio is internally managed by seasoned property management professionals
Opportunistically acquire properties |
 11
R
A
I
T
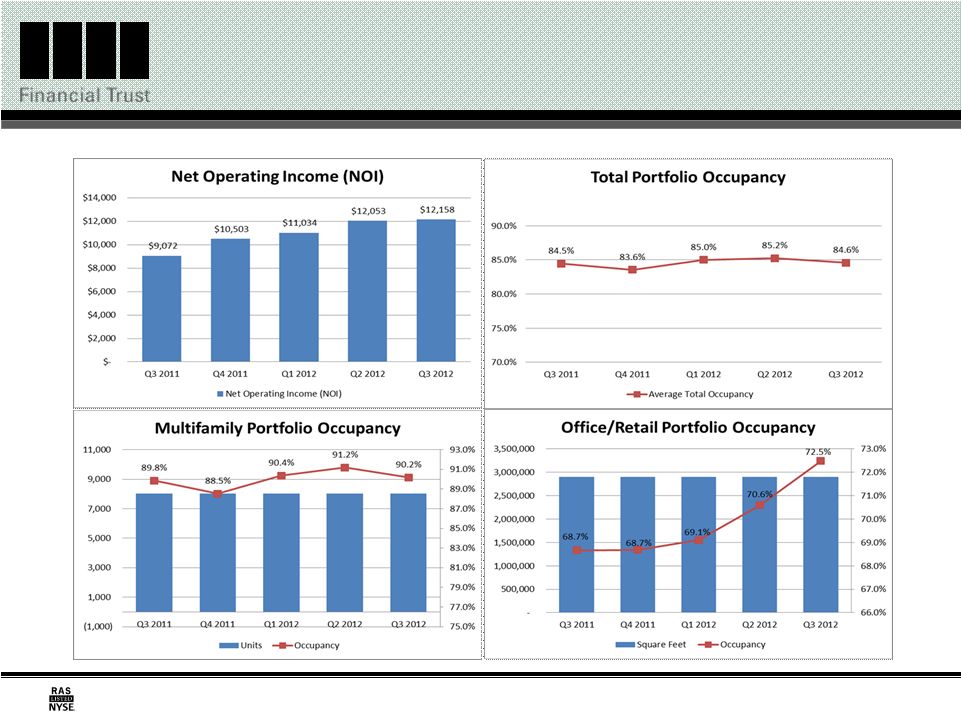
Owned Commercial Real Estate Performance
As of September 30, 2012 ($ in 000s) |
 12
R
A
I
T
Fee Income: Asset and Property Manager
Asset management
Management fees
Manage approximately $1.8 billion of commercial real estate loans and $1.6
billion of U.S. real estate debt securities
S&P & Morningstar rated primary and special CRE loan servicer
Property management
Property management fees
Jupiter Communities -
Multi-family focused
50 properties -
11,038 units
CRP Commercial Services -
Office focused
2.7 million square feet
Scalable non-traded REIT platform
Independence Realty Trust, Inc. -
multi-family equity REIT
As of September 30, 2012 |
 13
R
A
I
T
2012 Opportunities for Growth & Stability
Focus on growth & stability through a multi-strategy approach:
Utilizing RAIT’s core real estate platform and management expertise to generate
appropriate risk-adjusted returns by originating, underwriting and managing
commercial real estate loans
Focus on CMBS and transitional loans (bridge and mezzanine loans)
Continue to actively manage credit risk
Effectively manage RAIT’s portfolio of owned real estate to deliver increasing
rental and occupancy rates while managing operating costs
Leveraging RAIT’s capabilities through non-traded REIT platform to grow fee
income and assets under management |
 14
R
A
I
T
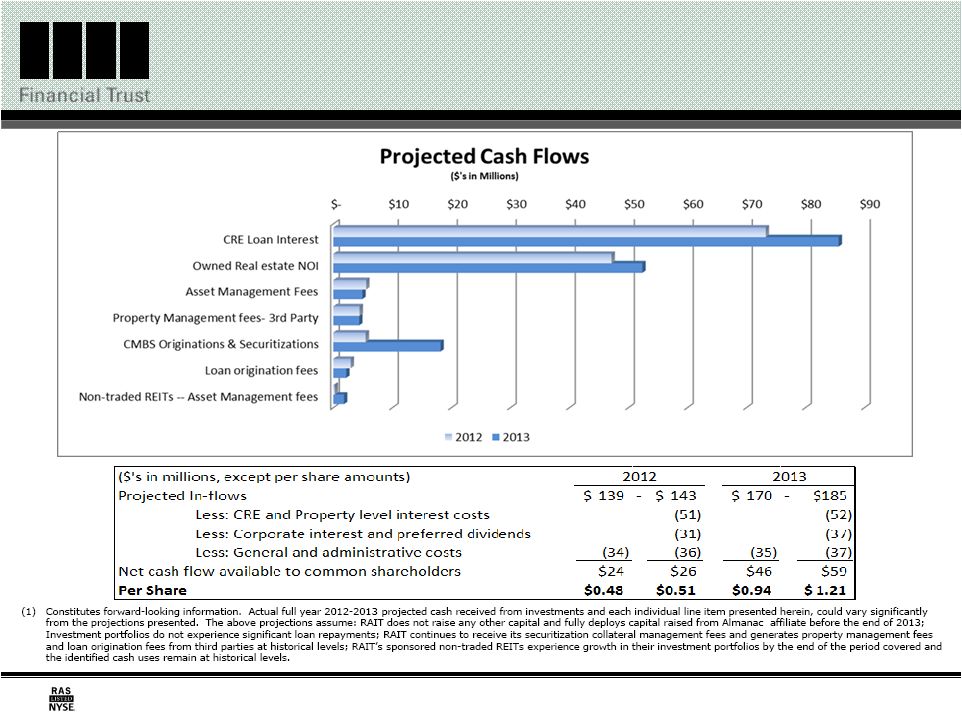
2012-2013 Projected Cash Received from
Investments
(1) |
 15
R
A
I
T
RAIT Highlights
Multi-strategy business approach for growth and stability
Integrated platform with synergistic business lines
Pipeline of investment opportunities
Improving cash flow and capital access
Stable and growing dividends |
 16
R
A
I
T
Appendix |
 17
R
A
I
T
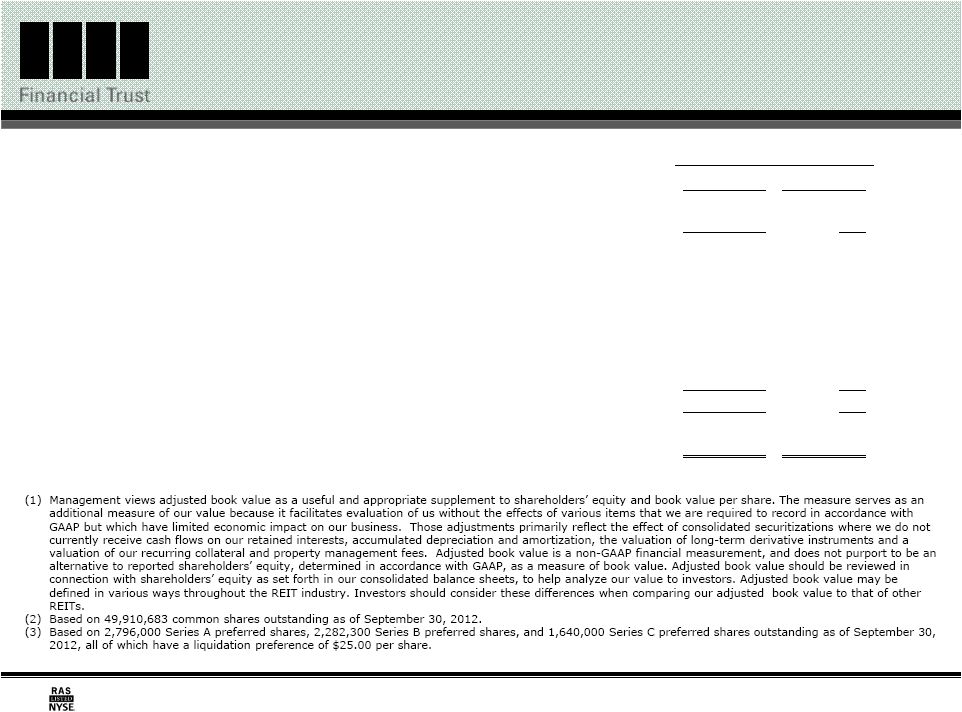
Adjusted Book Value
(1)
Amount
Per Share (2)
Total shareholders' equity, as
reported………………………………………………………………………………..
829,852
$
16.63
$
Liquidation value of preferred stock
(3)……………………………………………………………………………….
(167,958)
(3.37)
RAIT book
value…………………………………………………………………………………………………………………….
661,894
13.26
Adjustments:
Taberna securitizations net
effect…………………………………………………………………………………..
(533,942)
(10.70)
CRE CDO derivative
liabilities…………………………………………………………………………………………..
75,812
1.52
Accumulated depreciation and
amortization…………………………………………………………………..
107,658
2.16
Valuation of recurring collateral and property management
fees………………...………………..
20,590
0.41
Total
adjustments…………………………………………………………………………………………………………………..
(329,882)
(6.61)
Adjusted book
value…………………………………………………………………………………………………….
332,012
$
6.65
$
As of September 30, 2012 |
 18
R
A
I
T
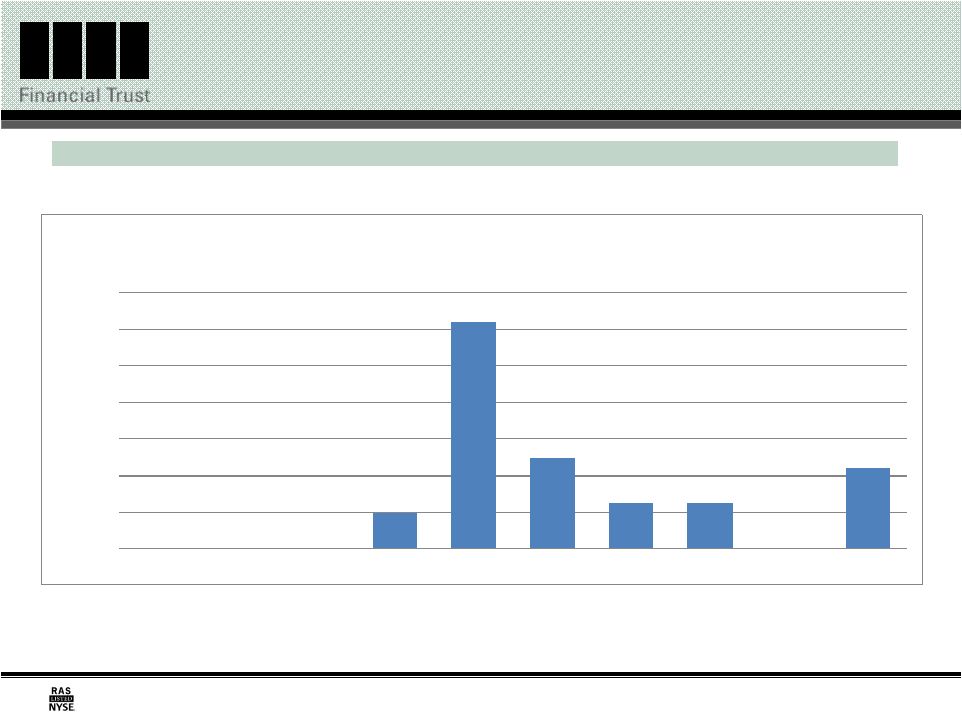
Recourse Debt Summary
No unsecured, recourse debt maturities until October 2015
(1)
Assumes full exercise of holders’
7.0% convertible senior notes redemption right in April 2016.
(2)
Includes senior secured notes issued by us with an aggregate principal amount equal to
$100,000 with a weighted average coupon of 7.0%, which are eliminated in consolidation
As of September 30, 2012 ($ in 000s)
$-
$-
$-
$19,381
$123,564
$50,000
$25,000
$25,000
$-
$43,771
$-
$20,000
$40,000
$60,000
$80,000
$100,000
$120,000
$140,000
2012
2013
2014
2015
2016 (1)
2017 (2)
2018 (2)
2019 (2)
2020
Thereafter
Recourse Debt Maturities and Redemption Dates
(in 000s) |
 19
R
A
I
T
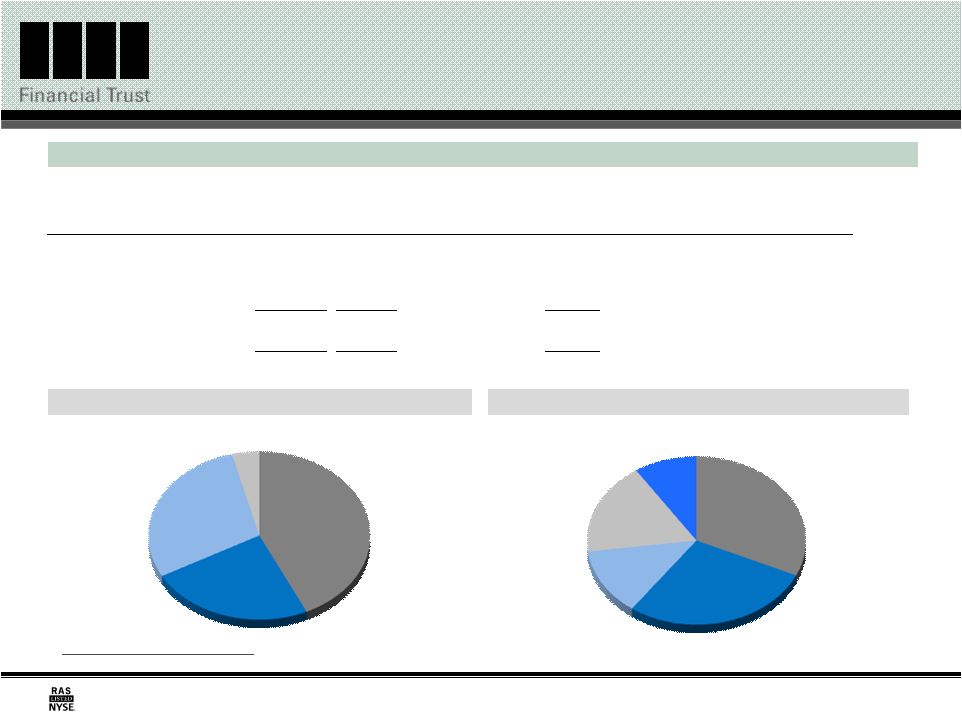
CRE Loan Portfolio Statistics
By Property Type
(1)
(1) Based on book value at 9/30/2012.
By Geographic Region
(1)
Improved credit performance of the loan portfolio
As of September 30, 2012 unless otherwise Indicated ($ in 000s)
Office
43%
Multi-family
24%
Retail
29%
Other
4%
Central
32%
Mid Atlantic
28%
Southeast
13%
West
18%
Northeast
9%
Book Value
Weighted-
Average
Coupon
Range of Maturities
Number
of Loans
Key Statistics
Q3
2012
Q3
2011
Commercial Real Estate (CRE) Loans
Non
-accrual loans
$70,419
$91,833
Commercial mortgages
$672,854
6.7%
Nov.
2012
to Oct. 2022
47
%
change
(23%)
Mezzanine loans
272,856
9.3%
Nov.
2012
to Nov. 2038
86
Reserve for losses
32,738
50,609
Preferred equity interests
63,701
9.7%
Mar. 2014
to Aug. 2025
15
%
change
(35%)
Total CRE Loans
$1,009,411
7.5%
148
Provision for losses
500
500
Other loans
38,651
4.9%
Nov.
2012
to Oct. 2016
2 |
  20
R
A
I
T
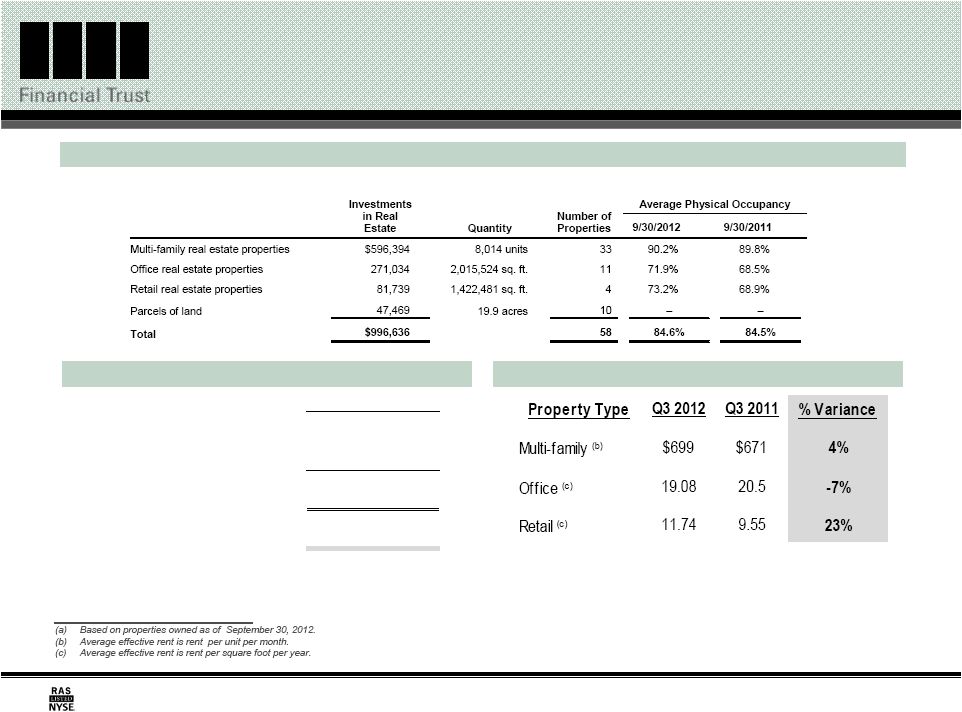
Directly Owned Commercial Real Estate
Portfolio Statistics
Net Real Estate Operating Income
Average Effective Rent
(a)
Improved Occupancy and Net Operating Income
Q3 2012
Q3 2011
Rental income
$26,412
$23,635
Real estate operating expenses
14,254
14,563
Net Real Estate Operating Income
$12,158
$9,072
Average Occupancy
84.6%
84.5%
As of September 30, 2012 unless otherwise Indicated ($ in 000s)
|