Attached files
| file | filename |
|---|---|
| 8-K - FORM 8-K - RAIT Financial Trust | d401268d8k.htm |
 1
R
A
I
T
RAIT Financial Trust
Investor Presentation
Second Quarter 2012
Exhibit 99.1 |
 2
R
A
I
T
Forward Looking Statements &
Non-GAAP Financial Measures
This document and the related presentation may contain forward-looking statements within
the meaning of the Private Securities Litigation Reform Act of 1995. These
forward-looking statements include, but are not limited to, statements about RAIT
Financial Trust’s (“RAIT”) plans, objectives, expectations and intentions with respect to future operations,
products, dividends, cash from investments and services and other statements that are not
historical facts. Forward- looking statements are sometimes identified by the words
“may”, “will”, “should”, “potential”, “predict”, “continue”,
“project”, “guide”, or other similar words or expressions. These
forward-looking statements are based upon the current beliefs and expectations of
RAIT's management and are inherently subject to significant business, economic and
competitive uncertainties and contingencies, many of which are difficult to predict and
generally not within RAIT’s control. In addition, these forward-looking
statements are subject to assumptions with respect to future business strategies and
decisions that are subject to change. RAIT does not guarantee that the assumptions underlying such
forward looking statements are free from errors. Actual results may differ materially from the
anticipated results discussed in these forward-looking statements. The
following factors, among others, could cause actual results to differ materially from the anticipated results or other
expectations expressed in the forward-looking statements: the risk factors discussed and
identified in filings by RAIT with the Securities and Exchange Commission
(“SEC”), including, without limitation, RAIT’s most recent annual and
quarterly reports filed with SEC. You are
cautioned not to place undue reliance on these forward-looking statements, which speak only as of the date of
this presentation. All subsequent written and oral forward-looking statements attributable
to RAIT or any person acting on its behalf are expressly qualified in their entirety by
the cautionary statements contained or referred to in this document and the related
presentation. Except to the extent required by applicable law or regulation, RAIT undertakes
no obligation to update these forward-looking statements to reflect events or
circumstances after the date of this presentation or to reflect the occurrence of
unanticipated events. This document and the related presentation may contain non-U.S. generally accepted
accounting principles (“GAAP”) financial measures. A reconciliation of
these non-GAAP financial measures to the most directly comparable GAAP financial
measure is included in this document and/or RAIT’s most recent annual and quarterly reports.
RAIT’s SEC filings are available on RAIT’s website at www.raitft.com. |
 3
R
A
I
T
About RAIT
RAIT Financial Trust (“RAIT”) (NYSE: RAS), is a diversified full service
commercial real estate company organized as an internally-managed REIT with
$3.6 billion of assets under management
Scalable commercial real estate platform with over 350 employees
Seasoned commercial real estate Lender
Origination platform for bridge, mezzanine and CMBS Loans
Owner –
commercial real estate properties (primarily multi-family properties)
Sophisticated asset management
Captive property management for multi-family and office properties
Non-traded REIT sponsor
Increased quarterly common dividend 33% in the first quarter to $0.08 per
common share
No unsecured, recourse debt maturities until October 2015 |
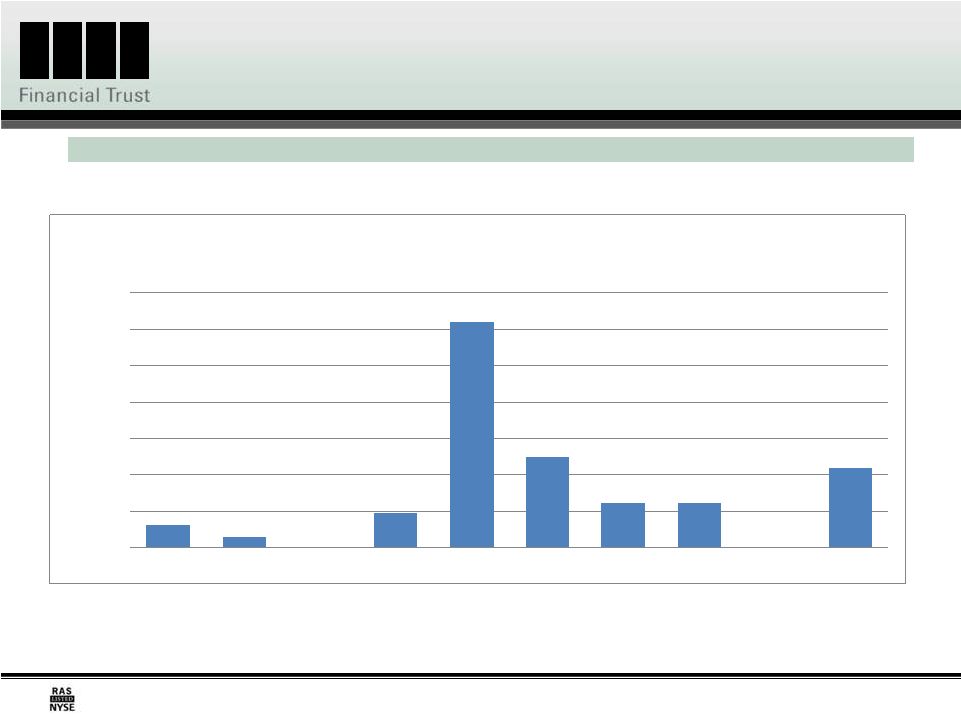 Recourse Debt
Summary As of June 30, 2012 ($ in 000s)
4
R
A
I
T
(1)
Assumes full exercise of holders’ 7.0% convertible senior notes redemption right in April
2016.
(2)
Includes senior secured notes issued by us with an aggregate principal amount equal to $100,000 with a
weighted average coupon of 7.0%, which are eliminated in consolidation $12,633
$6,187
$-
$19,381
$124,033
$50,000
$25,000
$25,000
$-
$43,771
$-
$20,000
$40,000
$60,000
$80,000
$100,000
$120,000
$140,000
2012
2013
2014
2015
2016 (1)
2017 (2)
2018 (2)
2019 (2)
2020
Thereafter
Recourse Debt Maturities and Redemption Dates
(in 000s)
No unsecured, recourse debt maturities until October 2015
|
 5
R
A
I
T
Synergistic Business Lines
Commercial real estate lending
$1.1 billion in loans
Originate, underwrite, close CMBS and transitional CRE loans
Directly owned commercial real estate
$994 million portfolio: $595 million multi-family, $271 million office, $81 million
retail and $47 million land
Asset and property management
Scalable non-traded REIT platform
Full service property management capabilities
CDOs –
earning management fees |
 6
R
A
I
T
Commercial Real Estate Lending
Commercial real estate lending
$1.1 billion of CRE loans at June 30, 2012
Capitalize
on
existing,
scalable
platform
and
internal
expertise
to
originate
bridge,
mezzanine and CMBS loans of $5 million to $30 million on multi-family, office, retail
and light industrial properties
Growing pipelines
Spread expansion opportunities
Fee income opportunities –
originating, managing and servicing |
 7
R
A
I
T
Commercial Real Estate Lending: CMBS
CMBS
loans:
warehouse
providers
Barclays
$150
million
Citibank
$100
million
CMBS
pipeline
at
approximately
$450
million
at
June
30,
2012
$231
million
of
availability
at
June
30,
2012
Originated
$37
million
of
CMBS
loans
through
June
30,
2012
Securitized
$25
million
of
CMBS
loans
through
July
15,
2012
Expect
to
fund
and
securitize
CMBS
loans
quarterly |
 8
R
A
I
T
Commercial Real Estate Lending: Bridge &
Mezzanine Lending
Bridge & mezzanine lending
$233 million in transitional loan originations through June 30, 2012
General
terms
–
transitional
properties
Bridge
loans
–
floating
rate,
fees,
approximately
7%
coupons
Mezzanine loans -
floating rate, fees, approximately 12%+ coupons
Funding
Senior participations: Developing bank participation program
$44 million in un-restricted cash available at June 30, 2012
|
 R
A
I
T
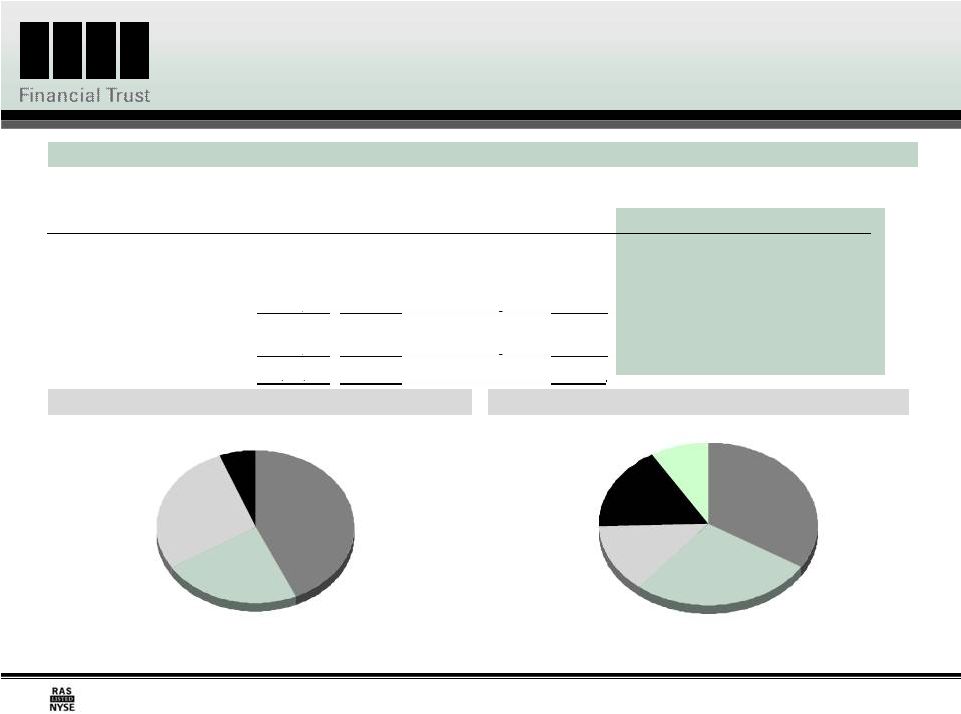
CRE Loan Portfolio Statistics
By Property Type
(1)
(1) Based on book value at 6/30/2012.
By Geographic Region
(1)
Improved credit performance of the loan portfolio
As of June 30, 2012 unless otherwise Indicated ($ in 000s)
Mid Atlantic
27%
Southeast
14%
Northeast
9%
Central
33%
West
17%
Multi-family
23%
Retail
28%
Other
6%
Office
43%
9
Book Value
Weighted-
Average
Coupon
Range of Maturities
Number
of Loans
Key Statistics
Q2
2012
Q2
2011
Commercial Real Estate (CRE) Loans
Non-accrual loans
$73,592
$94,117
Commercial mortgages
$692,406
6.3%
Aug.
2012
to Jul. 2022
49
% change
(22%)
Mezzanine loans
280,651
9.5%
Aug.
2012
to Nov. 2038
87
Reserve for losses
35,426
49,906
Preferred equity interests
65,669
9.6%
Mar. 2014
to Aug. 2025
23
% change
(29%)
Total CRE Loans
$1,038,726
7.3%
159
Provision for losses
500
950
Other loans
53,684
4.5%
Aug.
2012
to Oct. 2016
3
% change
(47%)
Total investments in loans
$1,092,410
7.2%
162 |
 10
R
A
I
T
Directly Owned Commercial Real Estate
Directly owned real estate portfolio
$994 million of CRE properties at June 30, 2012
Strategy to maximize value over time through increasing occupancy and higher
rental rates
Increasing rental income from June 30, 2011 through June 30, 2012
Increasing average effective rent, average occupancy and net operating income
from June 30, 2011 to June 30, 2012
Assets acquired below borrower’s cost upon loan conversions
Portfolio is internally managed by seasoned property management professionals
|
  11
R
A
I
T
Directly Owned Commercial Real Estate
Portfolio Statistics
Net Real Estate Operating Income
Average Effective Rent
(a)
Improved Occupancy and Net Operating Income
As of June 30, 2012 unless otherwise Indicated ($ in 000s)
Investments
in Real
Estate
Quantity
Number of
Properties
Average Physical Occupancy
6/30/2012
6/30/2011
Multi-family real estate properties
$594,928
8,014 units
33
91.2%
88.6%
Office real estate properties
270,724
2,015,524 sq. ft.
11
71.0%
68.8%
Retail real estate properties
81,454
1,422,298 sq. ft.
4
70.0%
62.0%
Parcels of land
47,059
19.9 acres
10
–
–
Total
$994,165
58
85.2%
83.1%
Q2 2012
Q2 2011
Rental income
$25,540
$22,138
Real estate operating expenses
(13,487)
(13,791)
Net Real Estate Operating Income
$12,053
$8,347
Number of owned properties
58
48
Average Occupancy
85.2%
83.1%
Property Type
Q2 2012
Q2 2011
% Variance
Multi-family
(b)
$695
$673
3%
Office
(c)
19.07
18.39
4%
Retail
(c)
12.44
6.69
(d)
86%
(d)
(a)
Based on properties owned as of June 30, 2012.
(b)
Average effective rent is rent per unit per month.
(c)
Average effective rent is rent per square foot per year.
(d)
Retail rental rate of $6.69 per square foot for Q2 2011 was lower than contractual rates due to certain
one-time leasing adjustments. Without these one-time items, the Q2 2011 retail rental
rate would have been approximately $8.53 per square foot. This translates into a 46% increase in
rental rates on our retail portfolio from Q2 2011 through Q2 2012
|
 12
R
A
I
T
Scalable non-traded REIT platform
Independence Realty Trust, Inc. (“IRT”) & Independence Mortgage Trust, Inc.
(“IMT”)
Raise capital through retail Broker/Dealer & financial advisor networks
IRT
–
multi-family equity REIT
RAIT
equity
investment
of
$51
million
pari
passu
with
returns
to
IRT
equity
investors
RAIT contributed seven properties to IRT with an aggregate purchase price of $133.3
million Monthly dividend –
6% current run rate based on $10 initial offering price
Target maximum equity raise: $1.1 billion
IMT
–
structured finance REIT: formed in October 2011 and is currently in
registration with the SEC
We expect IMT to acquire and manage a portfolio of commercial real estate loans, CMBS and
other commercial real estate-related securities
Target maximum equity raise: $1.7 billion
Any disclosure relating to IRT or IMT is neither an offer nor a solicitation to purchase
securities issued by IRT and IMT Fee Income: Asset and Property Management
|
 13
R
A
I
T
Fee Income: Asset and Property Management
Asset management
Management fees
CDOs
$1.9 billion of commercial real estate loans
$1.7 billion of U.S. real estate debt securities
S & P and Morningstar rated loan servicer and special servicer
Property management
Property management fees
Jupiter Communities
Multi-family focused
47 properties and 10,290 units
CRP Commercial Services
Office focused
3 million square feet
As of June 30, 2012 |
 14
R
A
I
T
2012 Opportunities for Growth
Focus on growth through:
Utilizing RAIT’s core commercial real estate platform to generate appropriate
risk-adjusted returns by originating, underwriting and managing commercial real
estate loans
Focus on CMBS and transitional loans (bridge and mezzanine loans)
Continuing to effectively manage RAIT’s portfolio of owned real estate to deliver
increasing rental and occupancy rates while managing operating costs
Leveraging RAIT’s capabilities through non-traded REIT platform to grow fee
income and assets under management
Opportunistically investing in discounted RAIT liabilities including CDO debt and
convertible debt |
 15
R
A
I
T
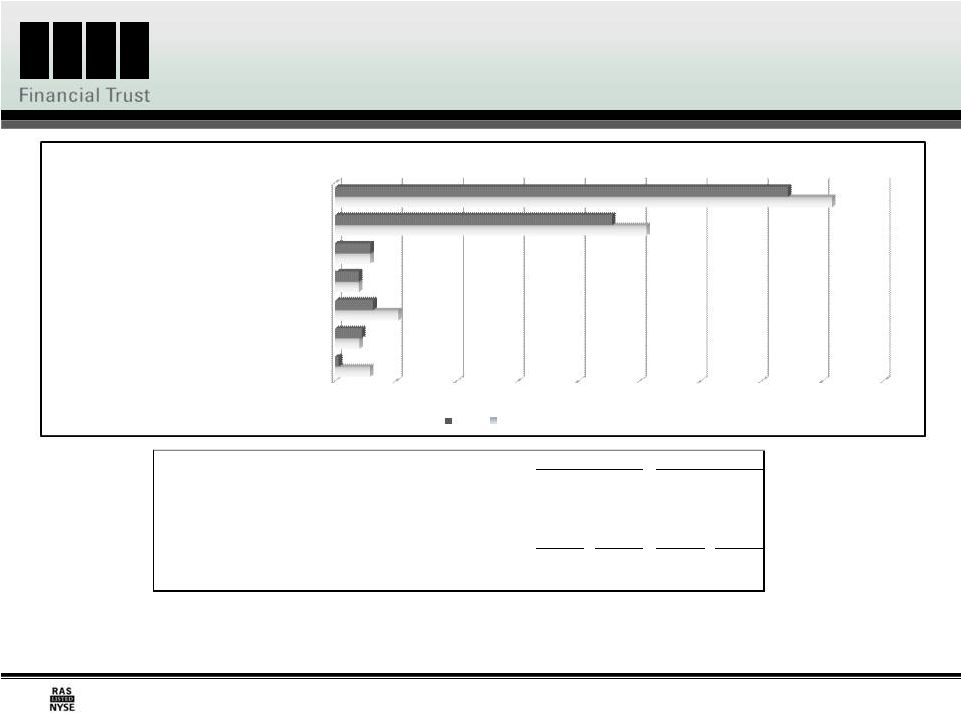
2012-2013 Projected Cash Received from
Investments
(1)
(1)
Constitutes forward-looking information. Actual full year 2012-2013 projected
cash received from investments and each individual line item presented herein, could vary significantly
from the projections presented. The above projections assume: Investment portfolios
remain static with June 30, 2012 balances and generate cash at historical levels; RAIT does not
raise additional capital; RAIT continues to receive its securitization collateral management
fees and generates property management fees and loan origination fees from third parties at
historical levels; RAIT’s sponsored non-traded REITs experience significant growth in
their investment portfolios by the end of the period covered and the identified cash uses remain at
historical levels.
($'s in millions, except per share amounts)
Projected cash received from investments
(1)
140
$
-
150
$
157
$
-
$169
Less: CDO and property level interest costs
(51)
(50)
Less: Corporate interest and preferred dividends
(33)
(33)
Less: General and administrative costs
(32)
-
(35)
(32)
-
(35)
Projected net cash received from investments
(1)
$24
-
$31
$41
-
$51
Per Share
0.48
$
-
0.63
$
0.84
$
-
1.05
$
2012
2013
$-
$10
$20
$30
$40
$50
$60
$70
$80
$90
CRE loan interest received
Owned real estate cash received
CDO management fees received
CMBS loan sales
Loan origination fees received
($'s in Millions)
2012
2013
Non-traded REITs -- asset management fees
Property management fees - 3rd party
|
 16
R
A
I
T
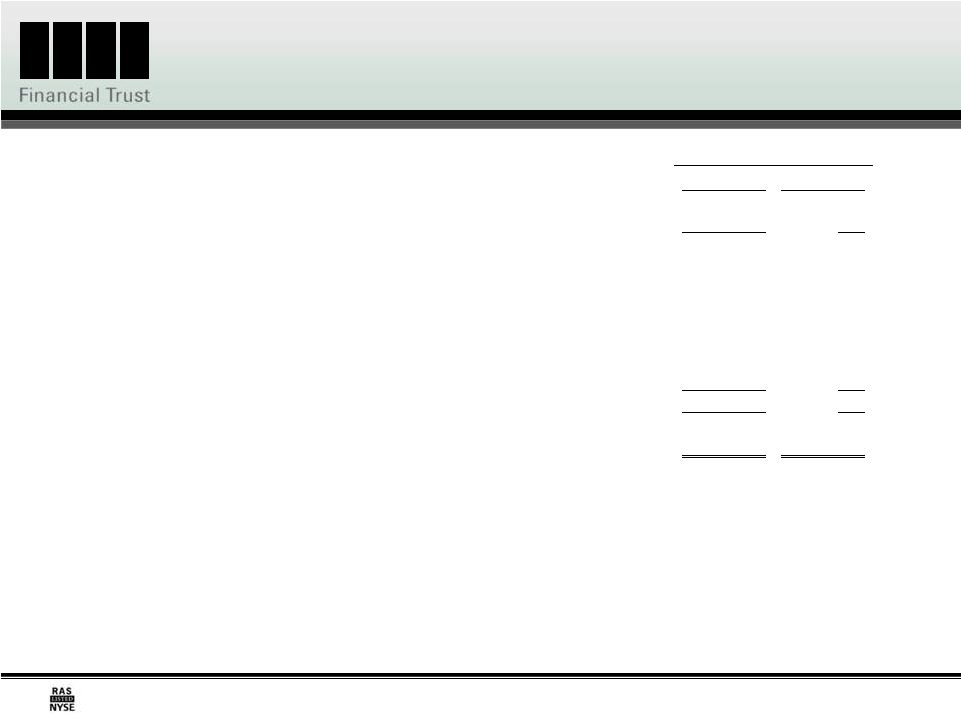
Adjusted Book Value
(1)
Amount
Per Share (2)
Total shareholders' equity, as
reported………………………………………………………………………………..
841,612
$
16.87
$
Liquidation value of preferred stock
(3)……………………………………………………………………………….
(167,025)
(3.35)
RAIT book
value…………………………………………………………………………………………………………………….
674,587
13.52
Adjustments:
Taberna securitizations net
effect…………………………………………………………………………………..
(547,257)
(10.97)
CRE CDO derivative
liabilities…………………………………………………………………………………………..
79,816
1.60
Accumulated depreciation and
amortization…………………………………………………………………..
99,333
1.99
Valuation of recurring collateral and property management
fees………………...………………..
20,970
0.42
Total
adjustments…………………………………………………………………………………………………………………..
(347,138)
(6.96)
Adjusted book
value…………………………………………………………………………………………………….
327,449
$
6.56
$
As of June 30, 2012
(1)
Management views adjusted book value as a useful and appropriate supplement to
shareholders’ equity and book value per share. The measure serves as an
additional measure of our value because it facilitates evaluation of us without the effects of various items that we are required to
record in accordance with GAAP but which have limited economic impact on our business.
Those adjustments primarily reflect the effect of consolidated securitizations where
we do not currently receive cash flows on our retained interests, accumulated depreciation and amortization,
the valuation of long-term derivative instruments and a valuation of our recurring
collateral and property management fees. Adjusted book value is a non-GAAP
financial measurement, and does not purport to be an alternative to reported shareholders’ equity, determined in accordance with
GAAP, as a measure of book value. Adjusted book value should be reviewed in connection with
shareholders’ equity as set forth in our consolidated balance sheets, to help
analyze our value to investors. Adjusted book value may be defined in various ways throughout the REIT
industry. Investors should consider these differences when comparing our adjusted book
value to that of other REITs.
(2)
Based on 49,905,866 common shares outstanding as of June 30, 2012.
(3)
Based on 2,787,931 Series A preferred shares, 2,271,620 Series B preferred shares, and
1,621,430 Series C preferred shares outstanding as of June 30, 2012, all of which have
a liquidation preference of $25.00 per share. |
 17
R
A
I
T
RAIT Highlights
Experienced management team
Integrated platform with synergistic business lines
Pipeline of investment opportunities
Improving cash flow
Provided common dividend guidance of at least $0.08 per quarter for 2012
|