Attached files
| file | filename |
|---|---|
| 8-K - FORM 8-K - RAIT Financial Trust | d258574d8k.htm |
 1
RAIT Financial Trust
Third Quarter 2011
Exhibit 99.1 |
 2
Forward Looking Statements &
Non-GAAP Financial Measures
This document and the related presentation may contain forward-looking statements within
the meaning of the Private Securities Litigation Reform Act of 1995. These
forward-looking statements include, but are not limited to, statements about RAIT
Financial Trust’s (“RAIT”) plans, objectives, expectations and intentions with respect
to future operations, products and services and other statements that are not historical
facts. These forward- looking statements are based upon the current beliefs and
expectations of RAIT's management and are inherently subject to significant business,
economic and competitive uncertainties and contingencies, many of which are difficult
to predict and generally not within RAIT’s control. In addition, these forward-looking
statements are subject to assumptions with respect to future business strategies and decisions
that are subject to change. Actual results may differ materially from the anticipated
results discussed in these forward-looking statements. The
following factors, among others, could cause actual results to differ materially from the anticipated results
or other expectations expressed in the forward-looking statements: the risk factors
discussed and identified in filings by RAIT with the Securities and Exchange Commission
(“SEC”), including, without limitation, RAIT’s most recent annual and
quarterly reports filed with SEC.
You are cautioned not to place undue reliance on these forward-looking statements, which
speak only as of the date of this presentation. All subsequent written and oral
forward-looking statements attributable to RAIT or any person acting on its behalf
are expressly qualified in their entirety by the cautionary statements contained or
referred to in this document and the related presentation. Except to the extent required by applicable law or
regulation, RAIT undertakes no obligation to update these forward-looking statements to
reflect events or circumstances after the date of this presentation or to reflect the
occurrence of unanticipated events.
The related presentation may contain non-U.S. generally accepted accounting principles
(“GAAP”) financial measures. A reconciliation of these non-GAAP
financial measures to the most directly comparable GAAP financial measure is included
in the Appendix to this document and RAIT’s most recent annual and quarterly
reports.
RAIT’s SEC filings are available on RAIT’s website at www.raitft.com. |
 3
About RAIT
RAIT,
(NYSE:
RAS),
is
a
diversified
full
service
commercial
real
estate
company organized as an internally-managed REIT
$3.6 billion of real estate assets under management
Philadelphia
headquarters
with
offices
in
New
York
City,
Chicago
and
Minneapolis
Scalable commercial real estate platform with over 400 employees
Seasoned commercial real estate Lender
Origination platform for bridge, mezzanine and CMBS Loans
Owner –
commercial real estate properties
Sophisticated asset management
Captive property management for multi-family and office properties
Non-traded REIT sponsor
Experienced management team that has invested through multiple cycles
|
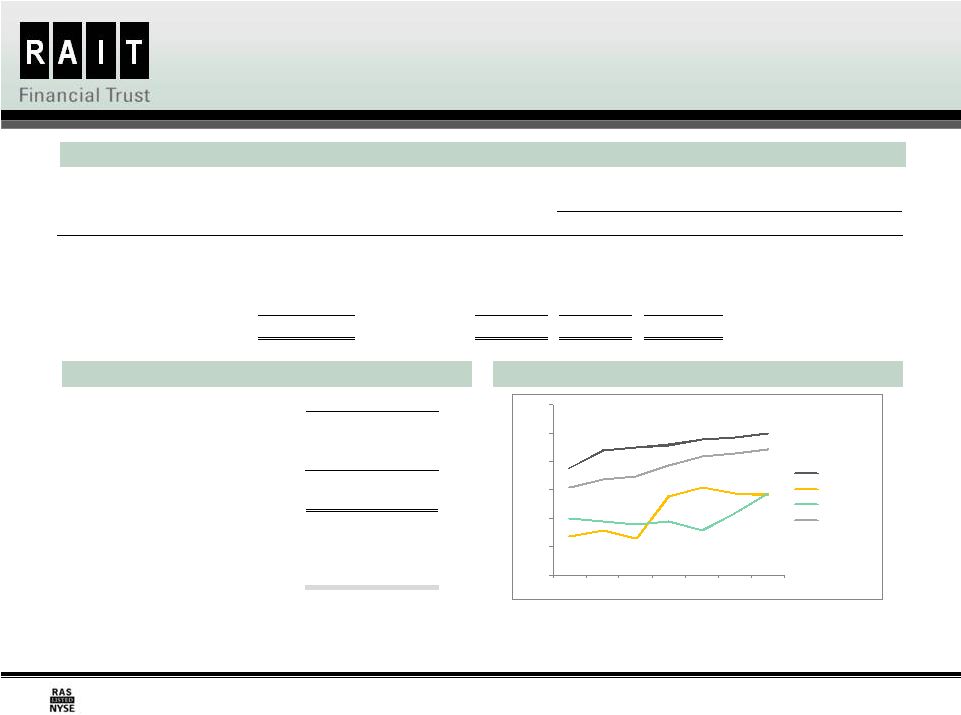
 4
Recent Performance
Positioned
for
Growth
Improving
Cash Flow
Improved
Asset
Performance
Reduced debt to equity ratio to 2.3x at 9/30/11 from a peak of 7.4x
at 6/30/09
At 9/30/11, $4.6 million in recourse debt obligations that are
redeemable or maturing prior to October 2015
Recourse debt reductions through 10/29/11 expected to reduce
related interest expense
At 9/30/11, CRE securitizations remain fully cash-flowing and
performance test coverage ratios have improved
Increasing loan repayments, in prior quarters, creates opportunities
to increase spreads on new loans
Expiring interest rate hedges expected to reduce related interest
expense
Loans on non-accrual decreased to $91.8 million at 9/30/11 from
$143.2 million at 9/30/10
Increasing occupancy and rental rates across all property types at
9/30/11 from 9/30/10
Increased net operating income from owned real estate from
9/30/10 to 9/30/11
Reduced
Leverage &
Operating
Costs |
 5
Synergistic Business Lines
Commercial Real Estate Lending
Directly Owned Commercial Real Estate
Scalable Non-Traded REIT Platform
Asset and Property Management |
 6
Commercial Real Estate Lending
Commercial Real Estate Lending
$1.1 billion of CRE loans at September 30, 2011
Capitalize
on
existing,
scalable
platform
and
internal
expertise
to
originate
bridge,
mezzanine
and
CMBS
loans
of
$5
million
to
$30
million
on
multi-family,
office, retail and light industrial properties
Growing pipeline
Spread expansion opportunities
Fee
income
opportunities
–
originating,
managing
and
servicing
Capital
sources
–
repayments,
warehouse
facilities
&
other
sources
Citibank $100 million facility for CMBS eligible collateral
$77.9 million in loan repayments during quarter ended September 30, 2011
$90.7 million in capacity for reinvestment in RAIT’s CRE securitizations at
October 28, 2011 |
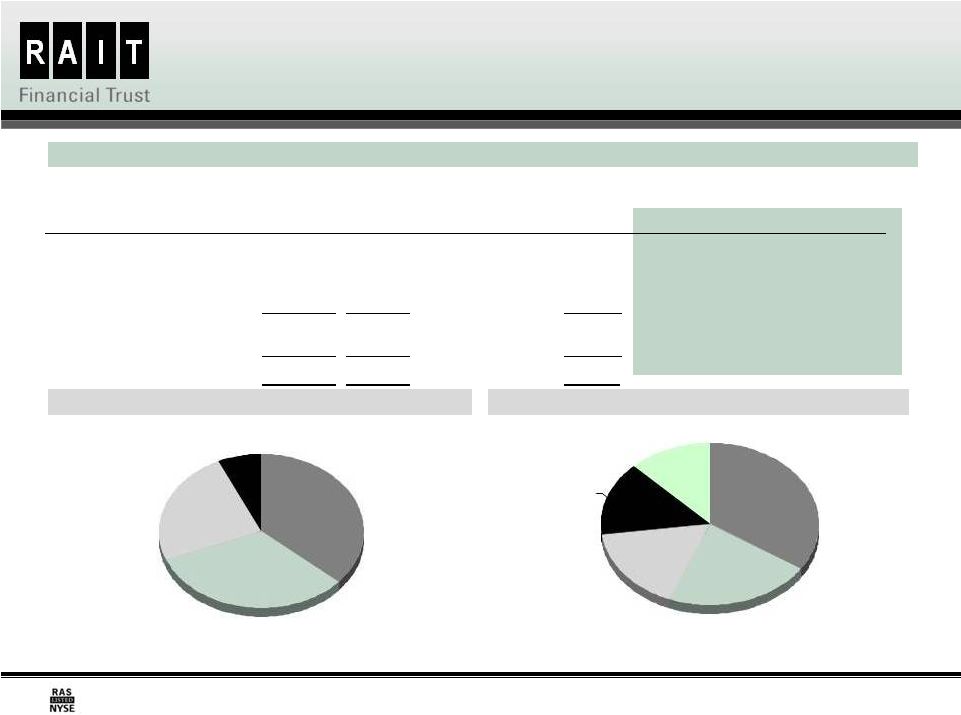 7
CRE Loan Portfolio Statistics
By Property Type
(1)
(1) Based on book value at 9/30/2011.
By Geographic Region
(1)
Improved credit performance of the loan portfolio
As of September 30, 2011 unless otherwise Indicated ($ in 000s)
Multi-family
33%
Retail
24%
Other
7%
Office
36%
Mid Atlantic
22%
Southeast
17%
Northeast
12%
Central
34%
West
15%
Book Value
Weighted-
Average
Coupon
Range of Maturities
Number
of Loans
Key Statistics
Q3
2011
Q3
2010
Commercial Real Estate (CRE) Loans
Non-accrual loans
$91,833
$143,212
Commercial mortgages
$654,497
6.7%
Nov.
2011 to May 2021
39
% change
(36%)
Mezzanine loans
339,843
8.9%
Nov.
2011 to Nov. 2038
93
Reserve for losses
50,609
73,029
Preferred equity interests
60,070
10.5%
Nov. 2011 to Aug. 2025
21
% change
(31%)
Total CRE Loans
$1,054,410
7.6%
153
Provision for losses
500
10,813
Other loans
54,226
6.4%
Nov.
2011 to Oct. 2016
4
% change
(95%)
Total investments in loans
$1,108,636
7.6%
157 |
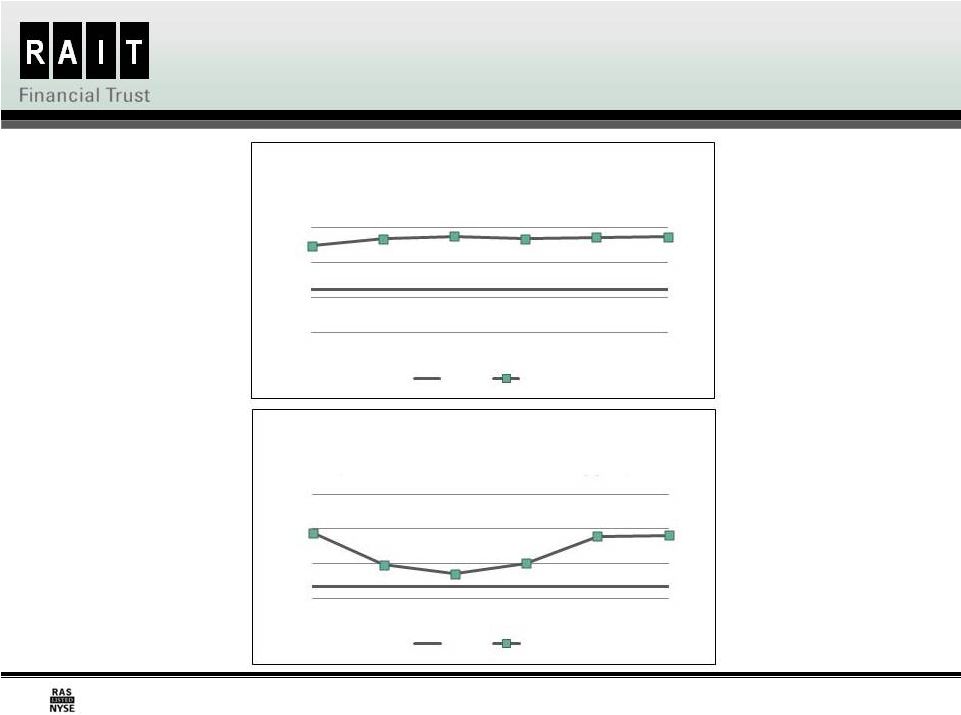 8
CRE Portfolio Securitization Performance
110.0%
115.0%
120.0%
125.0%
Inception
9/30/2010
12/31/2010
3/31/2011
6/30/2011
10/28/2011
RAIT CRE CDO I Performance
(Overcollateralization Trigger)
Trigger
Actual
110.0%
115.0%
120.0%
125.0%
Inception
9/30/2010
12/31/2010
3/31/2011
6/30/2011
10/28/2011
RAIT CRE CDO II Performance
(Overcollateralization Trigger)
Trigger
Actual |
 9
Directly Owned Commercial Real Estate
Directly Owned Real Estate Portfolio
$850 million of CRE properties at September 30, 2011
Strategy to maximize value over time through increasing occupancy and higher
rental rates
Assets acquired below borrower’s cost upon loan conversions
Asset value creation opportunity
Increasing rental income from September 30, 2010 through September 30,
2011
Jupiter Communities –
internal multi-family property manager
CRP Commercial Services –
internal office property manager |
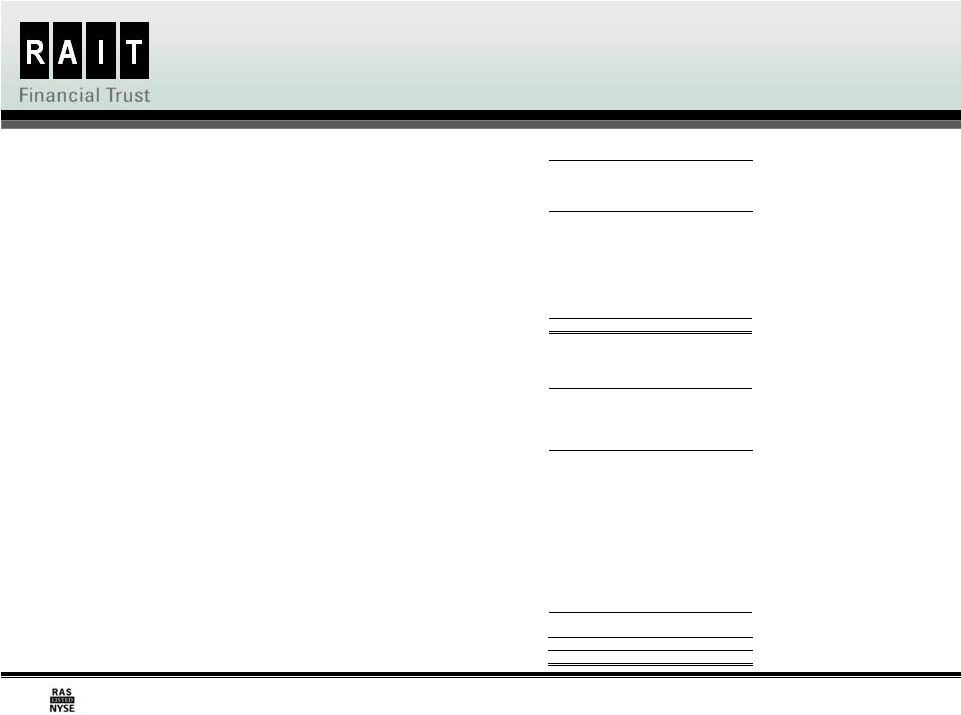
  10
Directly Owned Commercial Real Estate
Portfolio Statistics
Net Real Estate Operating Income
Occupancy Rates by Property Type
(a) Based on operating performance for the three-month period ended
September 30, 2011 and September 30, 2010. (b) Average effective rent is
rent per unit per month. (c) Average effective rent is rent per
square foot per year. Improved Occupancy and Net Operating Income
As of September 30, 2011 unless otherwise Indicated ($ in 000s)
Q3 2011
Q4 2010
Rental income
$23,635
$20,170
Real estate operating expenses
(14,563)
(13,404)
Net Real Estate Operating Income
$9,072
$6,766
Number of owned properties
48
47
Average Occupancy
84.5%
79.2%
Investments
in Real
Estate
Quantity
Number of
Properties
Average Physical Occupancy
Average Effective Rent
(a)
9/30/2011
12/31/2010
Q3 2011
Q3
2010
Multi-family real estate properties
(b)
$555,916
8,014
units
33
89.8%
85.5%
$671
$646
Office real estate properties
(c)
224,981
1,786,860
sq. ft.
10
68.5%
67.8%
20.50
19.54
Retail real estate properties
(c)
46,127
1,114,250
sq. ft.
2
68.9%
58.8%
9.55
7.75
Parcels of land
22,208
7.3 acres
3
–
–
–
–
Total
$849,232
48
84.5%
79.2%
78%
84%
85%
86%
88%
89%
90%
54%
56%
53%
68%
71%
69%
69%
60%
59%
58%
59%
56%
62%
69%
71%
74%
75%
79%
82%
83%
85%
40%
50%
60%
70%
80%
90%
100%
Q12010
Q32010
Q12011
Q32011
Multi-family
Office
Retail
Total |
 11
Non-Traded REIT Platform
Scalable Non-Traded REIT Platform
Independence Realty Trust, Inc. (“IRT”)
RAIT’s subsidiaries serve as dealer manager, external manager & advisor
Target asset class: multi-family
RAIT equity investment of $40 million paripassu with returns to IRT equity
investors »
RAIT contributed six properties to IRT
Fee stream to RAIT
»
.75 bps on average invested assets (excludes fee on initial portfolio for two
years) »
Up to 3% dealer manager fee
»
1%
3
party
financing
coordination
fee
»
4% of revenue property management fee (Jupiter Communities)
»
Expense reimbursement
»
Back-end promote structure
Monthly dividend –
6% current run rate based on $10 initial offering price
Target maximum equity raise: $1.1 billion
Raise capital through retail Broker/Dealer & financial advisor networks
Recently signed first selling agreement
Any disclosure relating to IRT is neither an offer nor a solicitation to purchase securities
issued by IRT rd |
 12
Asset and Property Management
Asset Management
Management fees
CDOs
$1.9 billion of commercial real estate loans
$1.7 billion of U.S. real estate debt securities
Non-traded
REIT
–
IRT
targeting
over
$1.5
billion
of
assets
upon
full
ramp
up
S & P rated loan servicer and special servicer
Property Management
Property management fees
Jupiter Communities
Multi-family focused
49 properties and 11,500 units
CRP Commercial Services
Office focused
2 million square feet
As of September 30, 2011 |
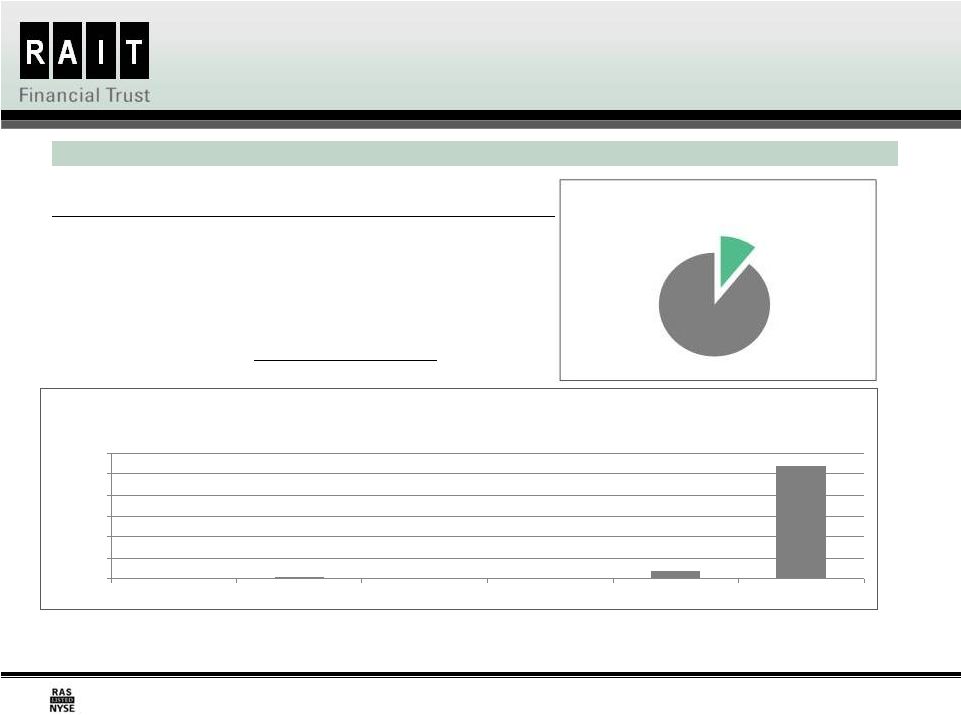 13
Recourse Debt Summary
Only $4.6 million of Redeemable Recourse Indebtedness and No Debt
Maturities Prior to October 2015 Description
Unpaid Principal
Balance
Weighted-
Average
Interest Rate
Contractual Maturity
Recourse Indebtedness:
7.0% convertible senior notes (1)
115,000
$
7.0%
Apr. 2031
6.75% senior secured note (2)
25,000
6.8%
Apr. 2017
6.85% senior secured note (2)
25,000
6.9%
Oct. 2017
7.15% senior secured note (2)
25,000
7.2%
Oct. 2018
7.25% senior secured note (2)
25,000
7.3%
Apr. 2019
Junior subordinated notes
38,052
5.2%
Oct. 2015 to Mar. 2035
Junior subordinated notes
25,100
7.7%
Apr. 2037
Secured credit facility
10,554
3.0%
Dec. 2016
6.875% convertible senior notes (3)
4,582
6.9%
Apr. 2031
Toal recourse indebtedness
293,288
$
6.7%
$-
$4,582
$-
$-
$19,381
$269,325
$-
$50,000
$100,000
$150,000
$200,000
$250,000
$300,000
2011
2012 (4)
2013
2014
2015
Thereafter (5)
Recourse Debt Maturities and Redemption Dates
(in 000's)
Debt Breakdown
Recourse
10%
Non-
recourse
90%
As of October 28, 2011 ($ in 000s)
(1) Our 7.0% convertible senior notes are redeemable, at par at the option of the holder, in April
2016, April 2021, and April 2026. (2) Eliminated in consolidation
(3) Our 6.875% convertible senior notes are redeemable, at par at the option of the holder, in April
2012, April 2017, and April 2022. (4) Assumes full exercise of holders’ 6.875% convertible senior notes redemption right in April
2012. (5) Assumes full exercise of holders’ 7.0% convertible senior notes redemption right in April
2016. |
 14
Resourceful and Disciplined Investment
Approach
RAIT kept its core commercial real estate platform in place throughout the recession
and was opportunistic in managing its assets and liabilities
Focused on originating, underwriting and managing commercial real estate
investments directly utilizing RAIT’s internal capabilities
Opportunistically invested in discounted RAIT liabilities including CDO debt and
convertible debt
Generated new investments from restructuring investments in our $3.6 billion of
assets under management
Maintained
adequate
liquidity
with
only
$4.6
million
in
recourse
debt
obligations
at
October 28, 2011 that are redeemable or maturing prior to October 2015
Funding capacity in RAIT CRE securitizations
New $100 million CMBS facility to fund CMBS eligible loans and in discussion
with other capital providers
Leverage RAIT’s capabilities through creation of non-traded REIT platform
Reinstated quarterly common dividend in second quarter 2011 |
 15
Experienced Management Team
Officer
Position
Years of
Experience
Comments
Scott F. Schaeffer
Chairman of the Board, CEO
and President
26
Chairman of the Board since December 2010
CEO of RAIT since February 2009
President since September 2000
Jack E. Salmon
CFO and Treasurer
35
CFO and Treasurer of RAIT since December 2006
President of Independence Realty Trust since January 2011
Joined RAIT in 2006
Raphael Licht
COO and Secretary
18
COO of RAIT since February 2009
Chief Legal Officer and Chief Administrative Officer from
December 2006 to February 2009
Joined RAIT in 2006
Ken Frappier
Executive Vice President –
Portfolio and Risk
Management
37
Executive Vice President of RAIT since February 2008
Chief Credit Officer of RAIT from December 2006 to February
2008
Senior Vice President of Portfolio and Risk Management of RAIT
from April 2002 to December 2006
Jim Sebra
Senior Vice President
and CAO
14
SVP and CAO since May 2007
Joined RAIT in 2006
Andres Viroslav
Vice President, Director of
Corporate Communications
16
Vice President of RAIT since 2002
Joined RAIT in September 2001 |
 16
RAIT Highlights
Experienced management team
Integrated platform with synergistic business lines
Pipeline of new investment opportunities
Access to new sources of capital
Adequate liquidity with no near term debt maturities
Reinstated quarterly common dividend in second quarter 2011 |
 17
Appendix |
 18
Key Statistics
(1)
Excludes our 6.875% convertible senior notes that have a final maturity in April 2027 but are
redeemable in full in April 2012. Includes any principal amortization on recourse debt
that is required prior to the stated maturity.
(2)
On January
10, 2011, RAIT declared a 2010 annual cash dividend on its common shares of $0.09 per common
share, split adjusted. The dividends were paid on January 31, 2011 to holders
of record on January
21, 2011.
(Dollars in thousands, except share and per share amounts)
(1)
(2)
(2)
(2)
September
31, 2011
June 30,
2011
March 31,
2011
December
31, 2011
September
31, 2011
Financial Statistics:
Assets under management
$3,633,133
$3,763,184
$3,822,534
$3,837,526
$3,901,342
Total revenue
$60,089
$58,863
$58,279
$59,057
$58,899
Recourse debt maturing in one year
$1,833
$19,745
$20,040
$41,489
$7,919
Earnings per share – diluted
$(0.55)
$(0.53)
$0.16
$0.86
$0.49
Funds from Operations (“FFO”) per share
$(0.36)
$(0.34)
$0.33
$1.05
$0.82
Adjusted Funds from Operations
$0.23
$0.22
$0.19
$0.15
$(0.09)
(“AFFO”) per share
Common dividend declared
$0.06
$0.06
$0.09
-
-
Debt to equity ratio
2.3x
2.2x
2.1x
2.3x
2.6x
Commercial Real Estate (“CRE”) Loan
Portfolio:
CRE loans-- unpaid principal
$1,064,946
$1,122,898
$1,149,169
$1,173,141
$1,216,875
Non-accrual loans -- unpaid principal
$91,833
$94,117
$121,054
$122,306
$143,212
Non-accrual loans as a % of reported
8.6%
8.4%
10.5%
10.4%
11.8%
loans
Reserve for losses
$50,609
$49,906
$58,809
$61,731
$73,029
Reserves as a % of non-accrual loans
55.1%
53.0%
48.6%
50.5%
51.0%
Provision for losses
$500
$950
$1,950
$2,500
$10,813
CRE Property Portfolio:
Reported investments in real estate
$849,232
$851,916
$859,983
$839,192
$818,184
Number of properties owned
48
48
48
47
47
Multifamily units owned
8,014
8,014
8,311
8,311
8,231
Office square feet owned
1,786,860
1,786,908
1,786,908
1,632,978
1,634,997
Retail square feet owned
1,114,250
1,116,171
1,116,063
1,116,112
1,069,588
Average occupancy data:
Multifamily
89.8%
88.6%
88.0%
85.5%
84.6%
Office
68.5%
68.8%
70.7%
67.8%
52.5%
Retail
68.9%
62.0%
56.3%
58.8%
57.7%
Total
84.5%
83.1%
82.4%
79.2%
74.8%
|
 19
Balance Sheet
(Dollars in thousands, except share and per share amounts)
As of
September 30,
2011
As of
December 31,
2010
Assets
Investments in mortgages and loans, at amortized cost:
Commercial mortgages, mezzanine loans, other loans and preferred
equity interests
Allowance for losses
(56,126)
Total investments in mortgages and loans
1,051,303
1,149,419
Investments in real estate
849,232
839,192
Investments in securities and security-related receivables, at fair value
719,546
705,451
Cash and cash equivalents
29,693
27,230
Restricted cash
179,019
Accrued interest receivable
37,138
Other assets
43,851
32,840
Deferred financing costs, net of accumulated amortization of $11,010
and 22,791
19,954
respectively
2,769
3,189
Total assets
3,048,172
Liabilities and Equity
Indebtedness:
Recourse indebtedness
247,564
Non-recourse indebtedness
1,545,686
Total indebtedness
1,793,250
1,838,177
Accrued interest payable
25,495
Accounts payable and accrued expenses
24,843
Derivative liabilities
184,878
91,499
Total liabilities
Equity:
Shareholders’
equity:
Preferred shares, $0.01 par value per share, 25,000,000 shares authorized;
7.75% Series A cumulative redeemable preferred shares, liquidation
preference $25.00 per share, 2,760,000 shares issued and outstanding
28
28
8.375% Series B cumulative redeemable preferred shares, liquidation
preference $25.00 per share, 2,258,300 shares issued and outstanding
23
23
8.875% Series C cumulative redeemable preferred shares, liquidation
preference $25.00 per share, 1,600,000 shares issued and outstanding
16
16
Common shares, $0.03 par value per share, 200,000,000 shares authorized,
1,205
1,060
Additional paid in capital
1,730,373
1,691,681
Accumulated other comprehensive income (loss)
Retained earnings (deficit)
Total shareholders’
equity
915,022
918,096
3,839
434
Total equity
918,861
918,530
Total liabilities and equity
3,048,172
2,993,432
$9,943, respectively
40,077,148 and 35,300,190 issued and outstanding
Noncontrolling interests
41,110
293,357
1,544,820
$
$
$
$
$
$
$
$
287,877
194,224
1,107,429
(69,691)
1,219,110
2,993,432
19,925
25,089
6,833
(127,602)
(126,081)
(690,542)
2,129,311
2,074,902
(647,110)
Intangible assets, net of accumulated amortization of $2,197 and $1,777, Deferred taxes, borrowers’ escrows and other
liabilities |
 20
Consolidated Statements of Operations
(Dollars in thousands, except share and per share amounts)
For the Three-Month
Periods Ended
September 30
For the Nine-Month
Periods Ended
September 30
2011
2010
2011
2010
Revenue:
Interest income
$
33,549
$ 37,252
$
101,590
$
117,755
Rental income
23,635
18,443
67,063
52,203
Fee and other income
2,905
3,204
8,578
15,555
Total revenue
60,089
58,899
177,231
185,513
Expenses:
Interest expense
22,689
24,038
68,384
74,170
Real estate operating expense
14,563
13,951
40,971
37,872
Compensation expense
6,898
6,766
19,179
21,704
General and administrative expense
4,042
4,331
13,441
14,588
Provision for loan losses
500
10,813
3,400
35,807
Depreciation and amortization
7,300
7,380
21,668
20,576
Total expenses
55,992
67,279
167,043
204,717
Operating income
4,097
(8,380)
10,188
(19,204)
Interest and other income (expense)
145
42
295
401
Gains (losses) on sale of assets
1,455
-
3,434
11,616
Gains (losses) on extinguishment of debt
11,371
14,278
14,540
51,290
Change in fair value of financial instruments
(34,997)
14,237
(55,113)
35,120
Income (loss) before taxes and discontinued operations
(17,929)
20,177
(26,656)
79,223
Income tax benefit (provision)
158
627
468
484
Income (loss) from continuing operations
(17,771)
20,804
(26,188)
79,707
Income (loss) from discontinued operations
(50)
(2,556)
747
(1,630)
Net income (loss)
(17,821)
18,248
(25,441)
78,077
(Income) loss allocated to preferred shares
(3,407)
(3,406)
(10,235)
(10,227)
(Income) loss allocated to noncontrolling interests
59
210
176
803
Net income (loss) allocable to common shares
$
(21,169)
$ 15,052
$ (35,500)
$
68,653
Earnings (loss) per share—Basic:
Continuing operations
$
(0.55)
$
0.58
$ (0.96)
$ 2.57
Discontinued operations
0.00
(0.08)
0.02
(0.06)
Total earnings (loss) per share—Basic
$
(0.55)
$
0.50
$ (0.94)
$
2.51
Weighted-average shares outstanding—Basic
38,771,022
30,330,259
37,822,750
27,384,451
Earnings (loss) per share—Diluted:
Continuing operations
$
(0.55)
$
0.57
$ (0.96)
$ 2.53
Discontinued operations
0.00
(0.08)
0.02
(0.06)
Total earnings (loss) per share—Diluted
$
(0.55)
$ 0.49
$
(0.94)
$
2.47
Weighted-average shares outstanding—Diluted
38,771,022
30,887,145
37,822,750
27,800,648
|
 21
Adjusted Funds From Operations
(Dollars in thousands, except share and per share amounts)
(1) We believe that funds from operations, or FFO, and adjusted funds from operations, or AFFO, each of
which are non-GAAP measures, are additional appropriate measures of the operating
performance of a REIT and us in particular. We compute FFO in accordance with the standards established
by the National Association of Real Estate Investment Trusts, or NAREIT, as net income or loss
allocated to common shares (computed in accordance with GAAP), excluding real estate-related depreciation and amortization expense, gains or losses on sales of real estate and the cumulative
effect of changes in accounting principles. AFFO is a computation made by analysts and investors
to measure a real estate company's cash flow generated by operations. We calculate AFFO by
adding to or subtracting from FFO: change in fair value of financial instruments; gains or losses on
debt extinguishment; capital expenditures, net of any direct financing associated with those capital
expenditures; straight-line rental effects; amortization of various deferred items and intangible
assets; and share-based compensation. Our calculation of AFFO differs from the methodology used for
calculating AFFO by certain other REITs and, accordingly, our AFFO may not be comparable to AFFO
reported by other REITs. Our management utilizes FFO and AFFO as measures of our operating
performance, and believes they are also useful to investors, because they facilitate an understanding
of our operating performance after adjustment for certain non-cash items, such as real estate
depreciation, share-based compensation and various other items required by GAAP that may not
necessarily be indicative of current operating performance and that may not accurately compare our
operating performance between periods. Furthermore, although FFO, AFFO and other supplemental
performance measures are defined in various ways throughout the REIT industry, we also believe
that FFO and AFFO may provide us and our investors with an additional useful measure to compare our
financial performance to certain other REITs. Neither FFO nor AFFO is equivalent to net
income or cash generated from operating activities determined in accordance with U.S. GAAP.
Furthermore, FFO and AFFO do not represent amounts available for management's discretionary use
because of needed capital replacement or expansion, debt service obligations or other commitments or
uncertainties. Neither FFO nor AFFO should be considered as an alternative to net income as an
indicator of our operating performance or as an alternative to cash flow from operating activities as a
measure of our liquidity. References to “we”, “us”, and “our” refer to RAIT Financial Trust and its
subsidiaries.
For the Three-
Month Periods
Ended September 30
For the Nine-
Month Periods
Ended September 30
2011
2010
2011
2010
$ (21,169)
$
15,052
$ (35,500)
$ 68,653
7,024
7,702
20,817
21,151
50
2,911
218
2,645
$ (14,095)
$ 25,665
$ (14,465)
$
92,449
$ (0.36)
$ 0.83
(0.38)
$
3.33
38,771,022
30,887,145
37,822,750
27,800,648
$ (14,095)
$
25,665
$ (14,465)
$ 92,449
34,997
(14,237)
55,113
(35,120)
(11,371)
(14,278)
(14,540)
(51,290)
(671)
(568)
(1,446)
(1,136)
(1,096)
75
(2,783)
40
1,046
371
2,482
(475)
79
583
396
2,877
$
8,889
$
(2,389)
$ 24,757
$
7,345
$ 0.
23
$ (0.08)
$
065
$
0.26
38,771,022
30,887,145
37,822,750
27,800,648
Funds From Operations (“FFO”):
Net income (loss) allocable to common shares ....................................
Adjustments:
Depreciation expense .................................................................
(Gains) Losses on sale of real estate
..........................................
Funds from operations
..........................................................................
Funds from Operations per share .........................................................
Weighted-average shares - diluted
Adjusted Funds From Operations (“AFFO”):
Funds from Operations .........................................................................
Adjustments:
Change in fair value of financial instruments ...............................
(Gains) Losses on debt extinguishment ......................................
Capital expenditures, net of direct financing ................................
Straight-line rental adjustments ...................................................
Amortization of deferred items and intangible assets ..................
Share-based compensation .........................................................
Adjusted Funds from Operations ..........................................................
Adjusted Funds from Operations per share ..........................................
Weighted-average shares - diluted
$ |
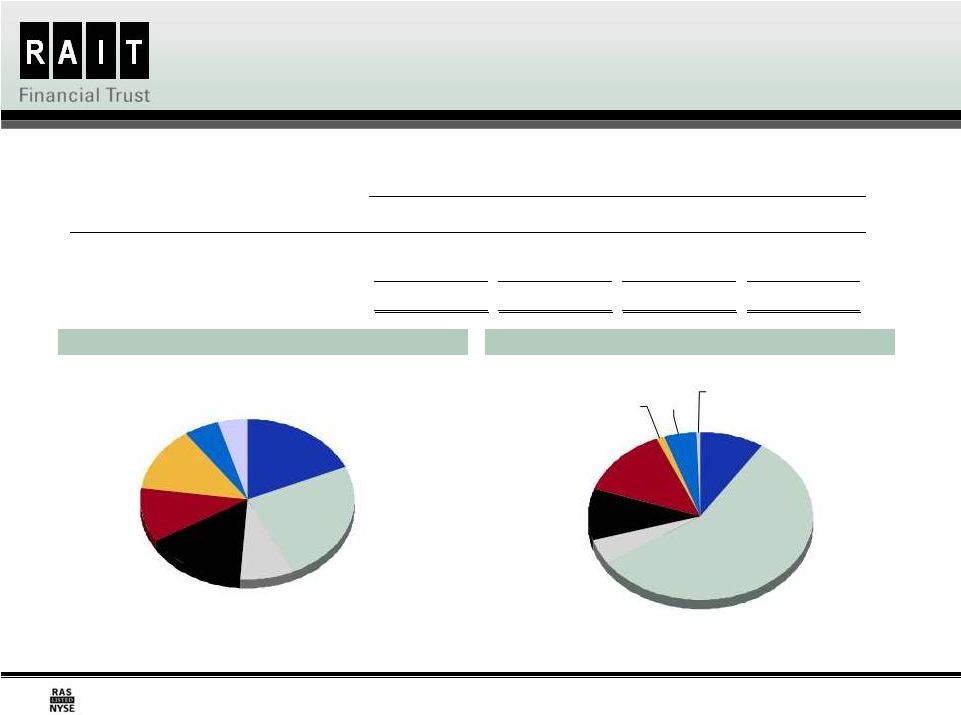 22
Investment in Debt Securities
TruPS and Subordinated Debentures by Industry Sector
(1)
(1) Based on estimated fair value.
(2) S&P Ratings as of September 31, 2011.
Other Securities by Ratings Distribution
(1)(2)
($ in 000s)
Office
25%
Residential
Mortgage
8%
Specialty
Finance
15%
Retail
13%
Hospitality
5%
Homebuilders
11%
Storage
5%
Commercial
Mortgage
18%
BBB
56%
BB
5%
B
10%
AAA
5%
D
1%
CCC
13%
AA
1%
A
9%
As of September 30, 2011
Investment Description
Estimated Fair
Value
Amortized Cost
Weighted-Average
Coupon
Weighted Average
Years to Maturity
TruPS and Subordinated Debentures
$564,769
$748,575
4.9%
21.1
Other securities
154,777
303,073
5.1%
27.3
Total
$719,546
$1,051,648
5.0%
22.9 |