Attached files
UNITED STATES
SECURITIES AND EXCHANGE COMMISSION
Washington DC 20549
FORM 10-K
(Mark One)
| þ | ANNUAL REPORT PURSUANT TO SECTION 13 OR 15(d) OF THE SECURITIES EXCHANGE ACT OF 1934 |
For the fiscal year ended May 31, 2011
OR
| ¨ | TRANSITION REPORT PURSUANT TO SECTION 13 OR 15(d) OF THE SECURITIES EXCHANGE ACT OF 1934 |
For the transition period from to
Commission File Number: 000-09061
ELECTRO RENT CORPORATION
(Exact Name of Registrant as Specified in Its Charter)
| CALIFORNIA | 95-2412961 | |
| (State or Other Jurisdiction | (I.R.S. Employer | |
| of Incorporation or Organization) | Identification No.) |
6060 Sepulveda Boulevard
Van Nuys, California 91411-2512
(Address of Principal Executive Offices and Zip Code)
(818) 786-2525
(Registrant’s telephone number, including area code)
Securities registered pursuant to Section 12(b) of the Act:
| Title of Each Class | Name of Each Exchange on Which Registered | |
| Common Stock without par value | The NASDAQ Stock Market LLC |
Securities registered pursuant to Section 12(g) of the Act: None
Indicate by check mark if the registrant is a well-known seasoned issuer, as defined in Rule 405 of the Securities Act.
Yes ¨ No þ
Indicate by check mark if the registrant is not required to file reports pursuant to Section 13 or Section 15(d) of the Act. Yes ¨ No þ
Indicate by check mark whether the registrant (1) has filed all reports required to be filed by Section 13 or 15(d) of the Securities Exchange Act of 1934 during the preceding 12 months (or for such shorter period that the registrant was required to file such reports), and (2) has been subject to such filing requirements for the past 90 days. Yes þ No ¨
Indicate by check mark whether the registrant has submitted electronically and posted on its corporate Web site, if any, every Interactive Data File required to be submitted and posted pursuant to Rule 405 of Regulation S-T (§ 232.405 of this chapter) during the preceding 12 months (or for such shorter period that the registrant was required to submit and post such files). Yes ¨ No ¨
Indicate by check mark if disclosure of delinquent filers pursuant to Item 405 of Regulation S-K (§229.405 of this chapter) is not contained herein, and will not be contained, to the best of registrant’s knowledge, in definitive proxy or information statements incorporated by reference in Part III of this Form 10-K or any amendment to this Form 10-K. ¨
Indicate by check mark whether the registrant is a large accelerated filer, an accelerated filer, a non-accelerated filer, or a smaller reporting company. See the definitions of “large accelerated filer,” “accelerated filer” and “smaller reporting company” in Rule 12b-2 of the Exchange Act. (Check one)
| Large Accelerated Filer ¨ | Accelerated Filer þ | Non-Accelerated Filer ¨ | Smaller Reporting Company ¨ | |||
| (Do not check if a smaller reporting company) | ||||||
Indicate by check mark whether the registrant is a shell company (as defined in Rule 12b-2 of the Act). Yes ¨ No þ
The aggregate market value of the registrant’s stock held by non-affiliates of the registrant as of November 30, 2010, was $290,782,316.
Number of shares of shares of the registrant’s common stock outstanding as of August 5, 2011: 23,980,581.
DOCUMENTS INCORPORATED BY REFERENCE
The information contained in the Proxy Statement for the Annual Shareholders Meeting of Shareholders to be held on October 13, 2011 that is required by Part III of this Form 10-K is incorporated herein by reference.
EXPLANATORY NOTE
Unless otherwise noted, (1) the terms “we”, “us” and “our” refer to Electro Rent Corporation and its subsidiaries, and (2) the terms “Common Stock” and “shareholder(s)” refer to our common stock and the holders of that stock, respectively.
SPECIAL NOTE ABOUT FORWARD-LOOKING STATEMENTS
This Report contains forward-looking statements within the meaning of Section 27A of the Securities Act of 1933, as amended, and Section 21E of the Securities Exchange Act of 1934, as amended. You can find many (but not all) of these statements by looking for words such as “approximates,” “believes,” “expects,” “anticipates,” “estimates,” “intends,” “plans,” “would,” “may” or other similar expressions in this Report. We claim the protection of the safe harbor contained in the Private Securities Litigation Reform Act of 1995. We caution investors that any forward-looking statements presented in this Report, or that we may make orally or in writing from time to time, are based on the beliefs of, assumptions made by, and information currently available to, us. Such statements are based on assumptions, and the actual outcome will be affected by known and unknown risks, trends, uncertainties and factors that are beyond our control or ability to predict. Although we believe that our assumptions are reasonable, they are not guarantees of future performance and some will inevitably prove to be incorrect. As a result, our actual future results can be expected to differ from our expectations, and those differences may be material. Accordingly, investors should use caution in relying on past forward-looking statements, which are based on known results and trends at the time they are made, to anticipate future results or trends.
Some of the risks and uncertainties that may cause our actual results, performance or achievements to differ materially from those expressed or implied by forward-looking statements include the following: common stock price fluctuations, fluctuations in operating results (including as a result of changing economic conditions), risks associated with technology changes, risks associated with customer solvency, competition, risks associated with international operations, risks associated with our manufacturers and suppliers, dependence on key personnel, control by management and others, risks associated with possible acquisitions and new business ventures and anti-takeover provisions. For further discussion of these and other factors, see Item 1A. “Risk Factors”; Item 7. “Management’s Discussion and Analysis of Financial Condition and Results of Operations”; and Item 7A. “Quantitative and Qualitative Disclosure About Interest Rates and Currency Rates,” in this Report, and our other filings with the Securities and Exchange Commission.
This Report and all subsequent written and oral forward-looking statements attributable to us or any person acting on our behalf are expressly qualified in their entirety by the cautionary statements contained or referred to in this section. We do not undertake any obligation to release publicly any revisions to our forward-looking statements to reflect events or circumstances after the date of this Report.
2
PART I
Item 1. Business.
We are one of the largest global organizations devoted to the rental, lease and sale of new and used electronic test and measurement (“T&M”) equipment. We purchase that equipment from leading manufacturers such as Agilent Technologies, Inc. (“Agilent”) and Tektronix primarily for use by our customers in the aerospace, defense, telecommunications, electronics, industrial and semiconductor industries. Although it represented only approximately 8% of our revenues in fiscal 2011, we believe our data products (“DP”) division is one of the largest rental companies in the United States for personal computers and servers from manufacturers including Dell, HP/Compaq, IBM and Toshiba. We have also recently expanded our efforts in the rental, lease and sale of industrial equipment such as electrical test equipment and inspection equipment.
The Electro Rent Approach. For the most part, customers who purchase or lease equipment from us place orders through our inside sales force, which has access to our proprietary computer system that is updated in real time for equipment availability and pricing. In the case of rentals and some leases, we generally use a pool of equipment we have previously purchased for that purpose or we may add equipment to that pool to fill a lease or rental order if the addition makes economic sense. Our equipment fulfillment team typically can arrange delivery of equipment from our pool to our customers within one or two days of a request. Most of our equipment is technically complex and must be calibrated and serviced when returned to us. We do most of that calibration in house, using a team of experienced technicians and our state of the art calibration laboratory.
Although our customers respond to equipment pricing and availabilities in making their decisions to choose to work with us, we believe that our success also depends on other factors:
| • | Customer Responsiveness. Our customer service, responsiveness and expert technical staff provide us a key competitive advantage. Our resale agreement with Agilent, for the United States and Canada, has enabled us to substantially expand the number and technical expertise of our T&M sales force, which at approximately 90 persons is the largest among our principal competitors. We believe our management team is the most experienced and stable in the industry, averaging 26 years at Electro Rent. In 2008 and 2009, Forbes magazine named us as one of their “100 Most Trustworthy Companies” out of the more than 8,000 publicly traded companies for what Forbes termed “transparent and conservative accounting practices and solid corporate governance and management.” |
| • | Global Platform. Although our customers represent a cross-section of the economy, much of our business is conducted with large companies in the aerospace and defense, semiconductor, electronics and telecommunications industries. As the largest T&M rental, leasing and sales company in North America, and one of the only rental companies in the world with a global platform and key locations in the US, Canada, China and Europe, our size and reach appeals to our multinational customers and assists us in maximizing our equipment utilization and inventory management across different geographic markets. |
| • | Multichannel Offerings. In the last two years, we have expanded our business to offer customers a single source for their equipment acquisitions, whether they want to rent, lease or buy new or used equipment. We believe that we offer the greatest breadth of acquisition options in the industry, allowing our customers to match the appropriate option to their usage and capital needs, budget and other factors, such as accounting rules and regulatory requirements. In addition, spreading costs over multiple channels allows us to maintain the largest sales force among our principal competitors, which in turn broadens and deepens our customer contacts and provides them more technical strength and assistance. |
3
| • | Deep Vendor Relationships. We have worked to develop and maintain strong relationships with the major manufacturers of equipment, who are our principal suppliers. We build these relationships not only through our rental and leasing activities, which make us one of the largest customers of these manufacturers, but also through partnerships with our vendors to sell their products. By maintaining close relationships with multiple vendors, we can help our customers select the right equipment for their needs, better fill customer orders for equipment with long lead-times, and understand product development trends which tend to shape the nature of the demands of our rental and leasing customers and the prices for our used equipment. |
| • | Dynamic Inventory Management Systems. To maximize our overall profit from the rental, leasing, and sales of equipment, we manage our equipment pool on an on-going basis by controlling the timing, pricing and mix of our purchases and sales. We acquire new and used equipment to meet current technological standards and current and anticipated customer demand, and we sell our used equipment when we believe that is the most lucrative option. We employ a complex equipment management strategy and our proprietary PERFECT™ software to adjust our inventory and pricing on a dynamic basis in order to maximize equipment availability, utilization and profitability. We manage each specific equipment class based on a separate assessment of that equipment’s historical and projected life cycle and numerous other factors, including the U.S. and global economy, interest rates and new product launches. |
Our Strategic Growth Initiatives. We believe that our resources and financial infrastructure remain capable of handling a significantly greater volume of business activity without a proportionate increase in expenses. Based on this belief, we have been seeking ways to increase revenues to leverage that infrastructure through internal growth and external acquisitions. These strategies include:
| • | Sales and Distribution Channel Initiative. Beginning in fiscal 2007, we have been expanding our business by adding new equipment sales channels to our rental, leasing and used equipment sales offerings. In addition to adding revenue and expanding our sales organization, we can capture related rental and lease opportunities and provide customers with a full range of equipment acquisition options. Our resale agreement with Agilent, commencing in fiscal 2010, gives us the exclusive right to sell Agilent’s more complex T&M equipment to small and medium size customers (who previously purchased directly from Agilent) in the United States and Canada. |
| • | Equipment Pool Expansion Initiatives. Despite the global economic downturn, we have used our strong balance sheet to make significant equipment purchases to meet T&M rental demand, support areas of potential growth and keep our equipment pool technologically up-to-date. In response to increasing customer demand, we increased our purchases of equipment during fiscal 2011 by 15% compared to fiscal 2010, which included $22.9 million of equipment acquired from Telogy, LLC (“Telogy”) in March 2010. As a result, we have been able to expand and upgrade our equipment base with equipment that is limited in supply but growing in demand, enhancing our ability to meet the needs of a wide range of customers, as well as expand our equipment pool offerings in some related areas such as telecom and industrial products. |
| • | Vendor Leasing Initiative. In fiscal 2009, we began an initiative to develop a substantial worldwide T&M leasing program by partnering with Agilent, Ixia, JDSU and other major manufacturers. These relationships have expanded our leasing program and enhanced our ability to meet the needs of our customers by offering competitive finance and operating leases. |
Our Markets and Competition. We believe the North American general purpose test equipment rental market generates in excess of $300 million of annual rental and lease revenue, and is characterized by intense competition from several large competitors. Although no single competitor holds a dominant market share in North America, our primary competitors in the T&M rental area include McGrath Rent Corp., Continental Resources, Test Equity, and Microlease plc. We compete for rental business with Microlease plc and Livingston Group Ltd. in Europe, and Orix Corporation and a number of local operators in Asia. These entities also compete with us in leasing T&M equipment, as do banks, vendors and other financing sources. In addition, in selling our equipment, we may also compete with sales of
4
new equipment by our suppliers, including Agilent and Tektronix, and their other distributors. Our competitors engage in aggressive pricing for both rentals and sales, as well as offer customers extended warranties that exceed the underlying manufacturers’ warranties and other services. In order to maintain or increase our market share, we may choose to lower our prices, resulting in lower revenues and decreased profitability.
The market for the lease and rental of computers and servers is highly fragmented, although our principal competitors include SmartSource Computer & Audio Visual Rentals, Source One Rentals, Rentex and CRE Rentals. The computer rental market has been characterized by intense competition that has led to industry consolidation. We acquired two competitors during the last fifteen years and SmartSource, our largest competitor, has expanded primarily due to its nineteen acquisitions. While we have focused on the rental of large quantities of computers to unique customers, SmartSource concentrates more on audio visual and trade show technology rentals and is thus not a direct competitor.
Our Backlog. As of May 31, 2011, we had an order backlog of $17.0 million, compared to $9.7 million as of May 31, 2010, the result of sales in connection with our resale agreement with Agilent. There was no such backlog in fiscal 2009. We expect that a majority of the backlog will be delivered to customers within six months of our fiscal year end.
Backlog represents the cumulative balance, at a given point in time, of recorded customer sales orders that have not yet been shipped or recognized as sales. Backlog is increased when an order is received, and backlog is decreased when we recognize sales. Although backlog consists of firm orders for which goods and services are yet to be provided, customers can, and sometimes do, terminate or modify these orders. Backlog, on any particular date, while indicative of short-term revenue performance, is not necessarily a reliable indicator of medium or long-term revenue performance.
International Operations. We have sales and leasing activity in foreign countries, which in the aggregate accounted for approximately 12.6% of our revenues in 2011, 14.6% in 2010 and 14.8% in 2009. Selected financial information regarding our international operations is presented below:
| Year ended May 31, (in thousands) |
2011 | 2010 | 2009 | |||||||||
|
|
||||||||||||
| Revenues: 1 |
||||||||||||
| U.S. |
$ | 199,861 | $ | 124,618 | $ | 111,184 | ||||||
| Other 2 |
28,868 | 21,249 | 19,297 | |||||||||
|
|
||||||||||||
| Total |
$ | 228,729 | $ | 145,867 | $ | 130,481 | ||||||
|
|
||||||||||||
| As of May 31, (in thousands) |
2011 | 2010 | 2009 | |||||||||
|
|
||||||||||||
| Net Long Lived Assets: 3 |
||||||||||||
| U.S. |
$ | 180,591 | $ | 166,533 | $ | 151,204 | ||||||
| Other 2 |
33,491 | 25,206 | 24,672 | |||||||||
|
|
||||||||||||
| Total |
$ | 214,082 | $ | 191,739 | $ | 175,876 | ||||||
|
|
||||||||||||
| 1 | Revenues by country are based on the location of shipping destination, whether the order originates in the U.S. parent or a foreign subsidiary. |
| 2 | Other consists of other foreign countries that each individually accounts for less that 10% of the total revenues or assets. |
| 3 | Net long-lived assets include rental and lease equipment, other property, goodwill and intangibles, net of accumulated depreciation and amortization. |
For risks relating to our international operations, see “Item 1A. Risk Factors – Risks Associated with International Operations.”
5
Other Information about Us. The following table shows, for each of the last three fiscal years, revenues from rentals and leases and sales of equipment and other revenues for our T&M and DP operating segments:
| Years ended May 31, (in thousands) |
T&M | DP | Total | |||||||||
|
|
||||||||||||
| 2011 |
||||||||||||
| Rentals and leases |
$ | 101,273 | $ | 16,789 | $ | 118,062 | ||||||
| Sales of equipment and other revenues |
108,450 | 2,217 | 110,667 | |||||||||
|
|
||||||||||||
| $ | 209,723 | $ | 19,006 | $ | 228,729 | |||||||
|
|
||||||||||||
| 2010 |
||||||||||||
| Rentals and leases |
$ | 77,874 | $ | 16,327 | $ | 94,201 | ||||||
| Sales of equipment and other revenues |
49,282 | 2,384 | 51,666 | |||||||||
|
|
||||||||||||
| $ | 127,156 | $ | 18,711 | $ | 145,867 | |||||||
|
|
||||||||||||
| 2009 |
||||||||||||
| Rentals and leases |
$ | 77,430 | $ | 20,965 | $ | 98,395 | ||||||
| Sales of equipment and other revenues |
29,054 | 3,032 | 32,086 | |||||||||
|
|
||||||||||||
| $ | 106,484 | $ | 23,997 | $ | 130,481 | |||||||
|
|
||||||||||||
The majority of our rental equipment inventory is located at our Van Nuys, California warehouse and is serviced by an ISO9001:2000 and AS9100 Revision B registered and compliant laboratory. We also service our customers through sales offices and calibration and service centers in the United States, Canada, China and Europe, which are linked by a proprietary on-line computer system. These centers also function as depots for the sale of used equipment.
For additional financial information about our segments, see Note 15 to our consolidated financial statements included in this Form 10-K.
Our business is non-seasonal, except for the third quarter months of December, January and February, when rental activity declines due to extended holiday closings by a number of customers. In addition, because February is a short month, rental billing is reduced.
No single customer accounted for more than 10% of our total revenues during fiscal 2011, 2010 or 2009. We do not derive any significant portion of our revenues from direct United States Government contracts.
We have no material patents, trademarks, licenses, franchises or concessions.
At May 31, 2011, we employed approximately 371 individuals. None of these employees is a member of a labor union. We believe that our employee relations are satisfactory.
Electro Rent Corporation was incorporated in California in 1965 and became a publicly held corporation in 1980.
Obtaining Additional Information. Our Internet address is www.electrorent.com. Copies of our annual report on Form 10-K, quarterly reports on Form 10-Q, current reports on Form 8-K and amendments to those reports filed or furnished pursuant to Section 13(a) or 15(d) of the Securities Exchange Act of 1934 are available free of charge on our website via links to the Securities and Exchange Commission’s website as soon as reasonably practicable after we electronically file those materials with the Securities and Exchange Commission. We provide paper copies of these reports to shareholders upon written request to Shareholder Relations, Electro Rent Corporation, 6060 Sepulveda Boulevard, Van Nuys, California 91411-2512.
Item 1A. Risk Factors.
Please carefully consider the following discussion of various risks and uncertainties. We believe these risk factors are the most relevant to our business and could cause our results to differ materially from the
6
forward-looking statements made by us. The following risk factors are not the only risk factors that we face. Additional risks that we do not consider material, or of which we are not currently aware, may also have an adverse impact on us. Our business, financial condition and results of operations could be seriously harmed if any of these risks or uncertainties actually occur or materialize. In that event, the market price for our common stock could decline, and our shareholders may lose all or part of their investment.
COMMON STOCK PRICE FLUCTUATIONS
Our Common Stock price has fluctuated significantly and may continue to do so in the future.
General Factors. We believe some of the reasons for past fluctuations in the price of our stock have included:
| • | announcements of developments related to our business; |
| • | announcements concerning new products or enhancements in the equipment that we rent, or developments in our relationships with our customers; |
| • | variations in our revenues, gross margins, earnings or other financial results from investors’ expectations; and |
| • | fluctuations in results of our operations and general conditions in the economy, our market, and the markets served by our customers. |
In addition, prices in the stock market have been volatile in recent years. In many cases, the fluctuations have been unrelated to the operating performance of the affected companies. As a result, the price of our Common Stock could fluctuate in the future without regard to our operating performance.
Future Sales of our Common Stock. Sales of our Common Stock by our officers, directors and employees could adversely and unpredictably affect the price of our shares. Additionally, the price could be affected even by the potential for sales by these persons. In addition to the 23,980,581 shares outstanding as of August 5, 2011, as of such date, we are authorized to issue up to 303,501 shares of Common Stock upon exercise of stock options and conversion of our stock units previously granted under our equity incentive plan.
We cannot predict the effect that any future sales of our Common Stock, or the potential for those sales, will have on our share price.
FLUCTUATIONS IN OPERATING RESULTS
Historically, our operating results have fluctuated, and we expect that fluctuations could continue in the future. The fluctuations in our past results have resulted from many factors, some of which are beyond our control. In the future, these or other factors could have a material adverse impact on our operating results and cause our stock price to decrease.
Timing of Equipment Purchases and Sales and Equipment Pool Management. The profitability of our business depends in part on controlling the timing, pricing and mix of purchases and sales of equipment and on managing our equipment pool. We seek to acquire new and used equipment at attractive prices, from which we feel we can make a profit as a result of a combination of renting and/or selling that equipment. We base expenditures for equipment purchases, sales and marketing and other items on our expectations of future customer demand. In order to maximize overall profit from the rental, leasing, and sales of equipment, we manage our equipment pool on an on-going basis by analyzing our product strategy for each specific equipment class in light of that equipment’s historical and projected lifecycle. In doing so, we compare our estimate of potential profit from rental with the potential profit from the product’s immediate sale and replacement with new or other equipment.
7
Our overall equipment management is complex and our equipment strategy can change during the equipment’s lifetime based upon numerous factors, including the U.S. and global economy, interest rates and new product launches. Our strategic equipment decisions are based on the following fundamentals:
| • | our acquisition cost; |
| • | our estimates of current and future market demand for rentals; |
| • | our estimates of current and future supply of equipment; |
| • | the book value of the equipment after depreciation and other impairment; |
| • | our estimates of the effect of interest rates on rental and leasing fees as well as capital financing; and |
| • | our estimates of the potential current and future sale prices of equipment. |
However, historical trends are not necessarily indicative of future trends. If our assumptions prove to be wrong, not only may our revenues fall short of our expectations, but we may not be able to adjust our inventory quickly enough to compensate for lower demand for one or more products in our inventory. In addition, as demand for a product falls, we may have difficulty in selling any of our excess equipment at a favorable price or at all. Both of these factors can compound the impact of any revenue shortfall and further affect our operating results and the price of our stock.
Risks Associated with Changing Economic Conditions. The U.S. economy and international markets that we serve have been impacted by a severe recession, which has resulted in more stringent credit requirements and reduced access to capital, and which may deepen and continue for the foreseeable future. Our customers historically have reduced their expenditures for electronic equipment during economic downturns. Accordingly, when the domestic and/or international economy weakens, demand for our services declines. A large part of our equipment pool is rented or leased to customers in the aerospace, defense, electronics and telecommunications industries. Continued slowdowns in the U.S. and global economy, or one or more of these specific industries, may result in lower demand and price pressure and could have a material adverse effect on our operating results and stock price. In fact, in fiscal 2002 and fiscal 2003, the U.S. economy experienced a downturn and the core industries we serve were negatively impacted. As a result, we experienced a decline in revenues, and we recorded a loss on impairment of goodwill and intangibles. Beginning in fiscal 2009, the recession in the U.S. and global economy resulted in reduced revenues and a decline in our operating results for fiscal 2009 and 2010. Although we experienced growth in revenues and operating profit in fiscal 2011, there can be no assurances that this trend will continue.
Seasonal and Quarterly Fluctuations. Regardless of the overall economic outlook domestically and globally, December, January and February typically reflect lower rental activity. In addition, because February is a short month, revenue billing in that month is reduced. We cannot predict whether these seasonal factors or their effects will change in the future. The seasonal spending patterns of our customers are affected by factors such as:
| • | weather, holiday and vacation considerations; and |
| • | budgetary considerations. |
Additionally, our operating results are subject to quarterly fluctuations resulting from a variety of factors, including remarketing activities, product announcements by manufacturers, economic conditions and
8
variations in the financial mix of new rentals and leases. The financial mix of new rentals and leases is a result of a combination of factors such as:
| • | changes in customer demands and/or requirements; |
| • | new product announcements; |
| • | price changes; |
| • | changes in delivery dates; |
| • | changes in maintenance policies and the pricing policies of equipment manufacturers; and |
| • | price competition from other rental, leasing and finance companies. |
Other Factors. Other factors that may affect our operating results include:
| • | competitive forces within our current and anticipated future markets; |
| • | changes in interest rates; |
| • | our ability to attract customers and meet their expectations; |
| • | currency fluctuations and other risks of international operations; |
| • | general economic conditions; and |
| • | differences in the timing of our spending on acquiring equipment, renting or leasing that equipment and receiving revenues from our customers. |
All or any of these and similar factors could result in our operating results differing substantially from the expectations of public market analysts and investors, which would likely have a material adverse impact on our stock price.
RISKS ASSOCIATED WITH TECHNOLOGY CHANGES
If we do not adequately anticipate or respond to changes in technology, it could have a material adverse effect on our operating results and stock price.
Technological Advancements. We must anticipate and keep pace with the introduction of new hardware, software and networking technologies and acquire equipment that will be marketable to our current and prospective customers. The equipment we rent can be the subject of rapid technological developments, evolving customer demands and frequent new product announcements and enhancements. If we fail to adequately anticipate or adapt to new technological developments or to recognize changing market conditions, our operating results and stock price could be materially and adversely affected.
Expenses Resulting from Technological Advancements. As a result of technology developments, we may have to make substantial and unanticipated expenditures to acquire new equipment or invest in further staff education on operating and servicing the equipment we deliver to our customers. Further, we may not adequately anticipate or respond successfully to technological changes for many reasons, including misjudging the impact of technological changes as well as financial, technological or other constraints. If we do not adequately anticipate or respond to changes in technological advancements or
9
customer preferences, it would likely have a material adverse impact on our operating results and stock price.
Introduction of New Products and Services. The markets in which we operate are characterized by rapidly changing technology, evolving industry standards and declining prices of certain products. Our operating results will depend to a significant extent on our ability to continue to introduce new services and to control and/or reduce costs on existing services. Whether we succeed in our new offerings depends on several factors such as:
| • | proper identification of customer needs; |
| • | our costs; |
| • | timely completion and introduction of products and services as compared to our competitors; |
| • | our ability to differentiate our equipment and services from our competitors; and |
| • | market acceptance of our business. |
RISKS ASSOCIATED WITH CUSTOMER SOLVENCY
If we do not collect on contracts with customers, it could have a material adverse effect on our operating results and stock price.
One of the reasons some of our customers find it more attractive to rent or lease electronic equipment than owning that equipment is the need to deploy their capital elsewhere. This can be particularly true in industries with high growth rates such as the telecommunications industry. However, some of our customers have liquidity issues, which have been compounded by the current economic recession, and ultimately cannot fulfill the terms of their agreements with us. If we are not able to manage credit risk issues, or if a large number of customers should have financial difficulties at the same time, our credit losses would increase above historical levels. If this should occur, our results of operations and stock price may be materially and adversely affected.
COMPETITION
If we do not effectively compete in our market, our operating results and stock price will be materially and adversely affected.
Our industry is characterized by intense competition from several large competitors, some of which have access to greater financial and other resources than we do. Although no single competitor holds a dominant market share, we face competition from both established entities and new entries in the market. Our primary competitors in the North American T&M rental area include McGrath Rent Corp., Continental Resources, Test Equity and Microlease plc. We compete for rental business with Microlease plc and Livingston Group Ltd. in Europe and Orix Corporation in Asia. These entities also compete with us in leasing T&M equipment, as do banks, vendors and other financing sources. In addition, in selling our equipment, we may also compete with sales of new equipment by our suppliers, including Agilent and Tektronix, and their other distributors.
The market for the lease and rental of computers and servers is highly fragmented, although our principal competitors include SmartSource Computer & Audio Visual Rentals, Source One Rentals, Rentex and CRE Rentals. The computer rental market has been characterized by intense competition that has lead to industry consolidation. We acquired two competitors during the last sixteen years and SmartSource, our largest competitor, has expanded primarily due to its nineteen acquisitions.
10
Our competitors engage in aggressive pricing for both rentals and sales, as well as offer customers extended warranties in excess of the underlying manufacturers’ warranties and other services. In order to maintain or increase our market share, we may choose to lower our prices, resulting in lower revenues and decreased profitability.
RISKS ASSOCIATED WITH INTERNATIONAL OPERATIONS
If we do not adequately anticipate and respond to the risks inherent in international operations, it could have a material adverse effect on our operating results and stock price.
Currency Risks. We generated approximately 12.6% of our revenues from international operations during the past fiscal year. Our contracts to supply equipment outside of the U.S. are generally priced in local currency. However, our consolidated financial statements are prepared in U.S. dollars. Consequently, changes in exchange rates can unpredictably and adversely affect our consolidated operating results, and could result in exchange losses. Although we use foreign currency forward contracts to mitigate the risks associated with fluctuations in exchange rates, we may not be able to eliminate or reduce the effects of currency fluctuations. Thus, exchange rate fluctuations could have a material adverse impact on our operating results and stock price.
Other Risks Associated with International Operations. Additionally, our financial results may be adversely affected by other international risks, such as:
| • | international political and economic conditions; |
| • | changes in government regulation in various countries; |
| • | trade barriers; |
| • | difficulty in staffing our foreign sales and service centers, and in training and retaining foreign employees; |
| • | issues relating to the repatriation of any profits; |
| • | adverse tax consequences; and |
| • | costs associated with expansion into new territories. |
We expect to continue our international operations and that the revenues we derive from these activities will continue to be a meaningful portion of our total revenues. If we do not anticipate and respond to the risks associated with international operations, it could have a material adverse effect on our operating results and stock price.
RISKS ASSOCIATED WITH OUR MANUFACTURERS AND SUPPLIERS
If we are not able to obtain equipment at favorable rates, it could have a material adverse effect on our operating results and stock price.
About 90% of our equipment portfolio at acquisition cost consists of general purpose T&M instruments purchased from leading manufacturers such as Agilent and Tektronix. The remainder of our equipment pool consists of personal computers and workstations, which include personal computers from Compaq, Dell, IBM, Apple, and Toshiba and workstations primarily from Sun Microsystems and Hewlett Packard. We depend on these manufacturers and suppliers to contract for our equipment. If, in the future, we are not able to purchase necessary equipment from one or more of these suppliers on favorable terms, we may not be able to meet our customers’ demands in a timely manner or for a price that generates a profit. If this should occur, we can make no assurance that we will be able to secure necessary equipment from
11
an alternative source on acceptable terms and our business and stock price may be materially and adversely affected.
DEPENDENCE ON KEY PERSONNEL
If we are unable to recruit and retain qualified personnel, it could have a material adverse effect on our operating results and stock price.
Our success depends in large part on the continued services of our executive officers, our senior managers and other key personnel, including, among others, our Chief Executive Officer, Daniel Greenberg, our President, Steven Markheim, and our Chief Financial Officer, Craig Jones. The loss of these people, especially without advance notice, could materially and adversely impact our results of operations. It is also very important that we attract and retain highly skilled personnel to accommodate growth and to replace personnel who leave. Competition for qualified personnel can be intense, especially in technology industries, and there are a limited number of people with the requisite knowledge and experience to market, sell and service our equipment. Under these conditions, we could be unable to recruit, train, and retain employees. If we cannot attract and retain qualified personnel, it could have a material adverse impact on our operating results and stock price.
CONTROL BY MANAGEMENT AND OTHERS
Senior management has significant influence over our policies and affairs and may be in a position to determine the outcome of corporate actions.
As of August 5, 2011, our executive officers and directors collectively own approximately 21.4% of our Common Stock.
As of that date, (i) Mr. Daniel Greenberg, our Chairman and Chief Executive Officer, beneficially owns approximately 20.1% of our outstanding shares of Common Stock, and (ii) one other shareholder controls 16.1% of our outstanding shares of Common Stock. Consequently, these shareholders may have significant influence over our policies and affairs and may be in a position to determine the outcome of corporate actions requiring shareholder approval. These may include, for example, the election of directors, the adoption of amendments to our corporate documents and the approval of mergers and sales of our assets.
RISKS ASSOCIATED WITH POSSIBLE ACQUISITIONS AND NEW BUSINESS VENTURES
If we cannot successfully implement any recent or future acquisitions or new business ventures, it could have a material adverse effect on our operating results and stock price.
On occasion, we evaluate business opportunities that appear to fit within our overall business strategy. In fiscal 2006, we acquired Rush Computer Rentals, Inc., a private company based in Wallingford, Connecticut that rents and sells a wide range of DP equipment. In fiscal 2010, we acquired certain assets and select post-closing liabilities of Telogy, a private company headquartered in Union City, California, and a leading provider of electronic T&M equipment. In fiscal 2010, we entered into a resale agreement with Agilent to sell new T&M equipment in the U.S. and Canada, resulting in the hiring of additional sales and support staff. We could decide to pursue one or more other opportunities by acquisition or internal development. Acquisitions and new business ventures, both domestic and foreign, involve many risks, including:
| • | the difficulty of integrating acquired operations and personnel with our existing operations; |
| • | the difficulty of developing and marketing new products and services; |
12
| • | the diversion of our management’s attention as a result of evaluating, negotiating and integrating acquisitions or new business ventures; |
| • | our exposure to unforeseen liabilities of acquired companies; and |
| • | the loss of key employees of an acquired operation. |
In addition, an acquisition or new business venture could adversely impact cash flows and/or operating results, and dilute shareholder interests, for many reasons, including:
| • | charges to our income to reflect the impairment of acquired intangible assets, including goodwill; |
| • | interest costs and debt service requirements for any debt incurred in connection with an acquisition or new business venture; and |
| • | any issuance of securities in connection with an acquisition or new business venture that dilutes or lessens the rights of our current shareholders. |
Additionally, we have implemented various new business ventures in the past, and not all of such ventures have been successful. The risks associated with acquisitions and new business ventures could have a material adverse impact on our operating results and stock price.
RISKS ASSOCIATED WITH FLUCTUATING INTEREST RATES
Interest rate fluctuations could have a material adverse effect on our operating results and stock price.
Our leasing yields tend to correlate with market interest rates. When interest rates are higher, our leasing terms incorporate a higher financing charge. However, in times of relatively lower interest rates our financing charges also decrease, and some of our customers choose to purchase new equipment, rather than leasing equipment at all. Lower leasing yields are reflected in lower rental and lease revenues.
ANTI-TAKEOVER PROVISIONS
The anti-takeover provisions contained in our Articles of Incorporation and Bylaws and in California law could materially and adversely impact the value of our Common Stock.
Certain provisions of our Articles of Incorporation, our Bylaws and California law could, together or separately, discourage, delay or prevent a third party from acquiring us, even if doing so might benefit our shareholders. This may adversely impact the interests of our shareholders with respect to a potential acquisition and may also affect the price investors would receive for their shares of Common Stock. Some examples of these provisions in our Articles of Incorporation and Bylaws are:
| • | the right of our board of directors to issue preferred stock with rights and privileges that are senior to the Common Stock, without prior shareholder approval; and |
| • | certain limitations of the rights of shareholders to call a special meeting of shareholders. |
Item 1B. Unresolved Staff Comments.
None.
13
Item 2. Properties.
We own a building that houses our corporate headquarters and Los Angeles sales office located at 6060 Sepulveda Boulevard, Van Nuys, California. The building contains approximately 84,500 square feet of office space. Approximately 40,500 square feet are currently leased to others. These tenant arrangements provide for all of the leased property to be available for our future needs.
We own a building at 15385 Oxnard Street, Van Nuys, California, which contains approximately 68,200 square feet. We use all of this space, except for 1,000 square feet that are currently being leased to others. This building houses our California warehouse and equipment calibration center.
We own a facility in Wood Dale, Illinois, containing approximately 30,750 square feet. This facility houses our Illinois warehouse and service center.
As of May 31, 2011, we had sales offices in the metropolitan areas of Atlanta and Los Angeles. We also have service centers in Chicago, Dallas, Los Angeles, New York/Newark, San Francisco, Charlotte, Orlando, Toronto and Washington/Baltimore. We have foreign sales offices and warehouses in Mechelen, Belgium, and in Beijing and Tianjin, China.
Our facilities aggregate approximately 269,000 square feet as of May 31, 2011. Except for the corporate headquarters, the Wood Dale, Illinois facilities and the Oxnard Street building, each of which we own, all of our facilities are rented pursuant to leases for up to seven years for aggregate annual rentals of approximately $1.1 million in fiscal 2011. We do not consider any rented facility essential to our operations. We consider our facilities to be in good condition, well maintained and adequate for our needs.
Item 3. Legal Proceedings.
From time to time, we may be involved in litigation relating to claims arising out of our operations in the normal course of business, including claims of alleged infringement, misuse or misappropriation of intellectual property rights of third parties. As of the date of this report, we are not a party to any litigation which we believe would have a material adverse effect on our business operations or financial condition.
Item 4. (Removed and Reserved).
None.
PART II
Item 5. Market for the Registrant’s Common Equity, Related Stockholder Matters and Issuer Purchases of Equity Securities.
Market for Common Stock; Holders.
Our common stock is quoted on the NASDAQ stock market under the symbol ELRC. There were approximately 332 shareholders of record at August 5, 2011. The following table sets forth, for the period shown, the high and low sale prices of our Common Stock as reported by NASDAQ.
| Fiscal Year 2011 | Fiscal Year 2010 | |||||||||||||||
| High | Low | High | Low | |||||||||||||
| First Quarter |
$ | 14.36 | $ | 11.09 | $ | 10.61 | $ | 8.76 | ||||||||
| Second Quarter |
15.68 | 11.99 | 11.95 | 9.90 | ||||||||||||
| Third Quarter |
17.19 | 14.56 | 12.26 | 10.22 | ||||||||||||
| Fourth Quarter |
17.80 | 13.76 | 15.50 | 11.62 | ||||||||||||
14
Sales of Unregistered Securities.
We did not make any unregistered sales of our securities during the quarter ended May 31, 2011.
Securities Authorized for Issuance Under Equity Compensation Plans.
The following table provides information as of May 31, 2011 with respect to shares of our Common Stock that may be issued under our existing stock incentive plans, all of which were approved by our shareholders:
EQUITY COMPENSATION PLAN INFORMATION
| Number of shares of common stock to be issued upon exercise of outstanding options, warrants and rights (a) |
Weighted-average exercise price of outstanding options, warrants and rights (b) |
Number of shares of common stock remaining available for future issuance under equity compensation plans (excluding shares reflected in column (a)) (c) | ||
| 36,000 |
$17.69 | 669,099 |
Stock Repurchases.
We have from time to time repurchased shares of our common stock under an authorization from our Board of Directors. Shares repurchased by us are retired and returned to the status of authorized but unissued stock.
We did not repurchase any shares in fiscal 2011. During fiscal 2010 and 2009, we repurchased 44,114 and 2,138,057 shares of our common stock, respectively. We may choose to make additional open market or other purchases of our common stock in the future, but we have no commitment to do so.
Dividends.
Since July 2007, we have been paying quarterly dividends in each January, April, July and October. The total amount of cash dividends we paid in fiscal 2011, 2010 and 2009 is discussed under “Item 7. Management’s Discussion and Analysis and Results of Operations-Liquidity and Capital Resources.” We expect to continue paying a quarterly dividend in future quarters, although the amount and timing of dividends, if any, will be made by our Board of Directors in each quarter, subject to compliance with applicable law.
15
Performance Graph.
This graph compares our total shareholder return with (1) the NASDAQ (US) Index, (2) the Russell 2000 Index, and (3) the composite prices of the companies listed by Value Line, Inc. in its Industrial Services Industry Group. Our Common Stock is listed in both the Russell 2000 Index and the Industrial Services Industry Group. The comparison is over a five year period, beginning May 31, 2006 and ending May 31, 2011. The total shareholder return assumes $100 invested at the beginning of the period in our Common Stock and in each index. It also assumes reinvestment of all dividends.
Cumulative Five Year Total Return
Value of $100 Invested on May 31, 2006
Fiscal Years Ended May 31
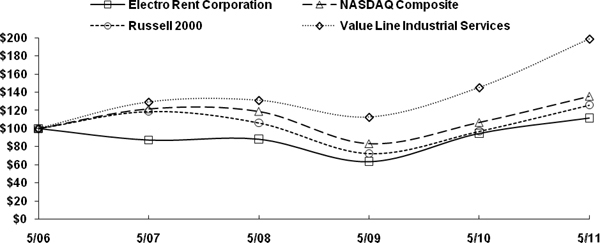
| 2006 | 2007 | 2008 | 2009 | 2010 | 2011 | |||||||||||||||||||
| Electro Rent Corporation |
100 | 87 | 88 | 64 | 95 | 111 | ||||||||||||||||||
| NASDAQ Composite |
100 | 122 | 119 | 84 | 107 | 135 | ||||||||||||||||||
| Russell 2000 |
100 | 119 | 106 | 73 | 97 | 126 | ||||||||||||||||||
| Value Line Industrial Services |
100 | 129 | 131 | 113 | 145 | 199 | ||||||||||||||||||
16
Item 6. Selected Financial Data.
(in thousands, except per share amounts)
The following selected consolidated financial data should be read in conjunction with our audited consolidated financial statements and the accompanying notes included in Item 8. Financial Statements and Supplementary Data below and other financial and statistical information included in this Form 10-K.
| Fiscal year ended May 31, | ||||||||||||||||||||
| 2011 | 2010 (1) | 2009 | 2008 | 2007 | ||||||||||||||||
|
|
||||||||||||||||||||
| Operations data: |
||||||||||||||||||||
| Revenues |
$ | 228,729 | $ | 145,867 | $ | 130,481 | $ | 144,536 | $ | 126,859 | ||||||||||
|
|
||||||||||||||||||||
| Costs of revenues and depreciation |
134,571 | 81,666 | 68,630 | 69,901 | 55,848 | |||||||||||||||
| Selling, general and administrative expenses |
57,423 | 46,447 | 44,456 | 43,940 | 42,000 | |||||||||||||||
| Bargain purchase gain (2) |
(202 | ) | (679 | ) | — | — | — | |||||||||||||
| Interest and other, net |
(352 | ) | (1,599 | ) | (1,507 | ) | (3,292 | ) | (5,440 | ) | ||||||||||
|
|
||||||||||||||||||||
| Income before income taxes |
37,289 | 20,032 | 18,902 | 33,987 | 34,451 | |||||||||||||||
| Income tax provision |
13,533 | 8,435 | 7,150 | 12,883 | 13,402 | |||||||||||||||
|
|
||||||||||||||||||||
| Net income |
$ | 23,756 | $ | 11,597 | $ | 11,752 | $ | 21,104 | $ | 21,049 | ||||||||||
|
|
||||||||||||||||||||
| Earnings per share: |
||||||||||||||||||||
| Basic |
$ | 0.99 | $ | 0.48 | $ | 0.47 | $ | 0.81 | $ | 0.82 | ||||||||||
| Diluted |
$ | 0.99 | $ | 0.48 | $ | 0.47 | $ | 0.81 | $ | 0.81 | ||||||||||
| Shares used in per share calculation: |
||||||||||||||||||||
| Basic |
23,974 | 23,932 | 24,899 | 25,910 | 25,716 | |||||||||||||||
| Diluted |
24,072 | 24,004 | 24,980 | 26,079 | 26,053 | |||||||||||||||
| Balance sheet data (at end of year): |
||||||||||||||||||||
| Total assets |
$ | 305,927 | $ | 276,068 | $ | 271,334 | $ | 293,082 | $ | 284,819 | ||||||||||
| Shareholders’ equity |
$ | 240,375 | $ | 229,962 | $ | 228,753 | $ | 256,108 | $ | 243,479 | ||||||||||
| Shareholders’ equity per common share |
$ | 10.02 | $ | 9.60 | $ | 9.55 | $ | 9.87 | $ | 9.43 | ||||||||||
| Cash dividends declared per common share |
$ | 0.60 | $ | 0.45 | $ | 0.75 | $ | 0.35 | $ | 0.10 | ||||||||||
| (1) | Includes the operating results and balance sheet information of the assets acquired from Telogy from March 31, 2010, the closing date of the acquisition (see Note 4 to the consolidated financial statements included in this Form 10-K). |
| (2) | The estimated fair value of the net assets acquired from Telogy exceeded the acquisition cost, resulting in a bargain purchase gain with respect to this transaction. |
Item 7. Management’s Discussion and Analysis of Financial Condition and Results of Operations.
(in thousands, except per share amounts)
The following discussion of our financial condition and results of operations should be read in conjunction with the consolidated financial statements and the notes thereto and the other financial and statistical information appearing elsewhere in this Form 10-K.
Overview
We are one of the largest global organizations devoted to the rental, lease and sale of new and used electronic T&M equipment. We purchase that equipment from leading manufacturers such as Agilent and Tektronix primarily for use by our customers in the aerospace, defense, telecommunications, electronics, industrial and semiconductor industries. Although it represents only approximately 8%, 13% and 18% of our revenues in fiscal 2011, 2010 and 2009, respectively, we believe our DP division is one of the largest
17
rental businesses in the United States for personal computers and servers from manufacturers including Dell, HP/Compaq, IBM and Toshiba.
We have also recently expanded our efforts in the rental, lease and sale of industrial equipment such as electrical test equipment and inspection equipment. Our resale agreement with Agilent gives us the exclusive right to sell Agilent’s more complex T&M equipment to small and medium size customers (who previously purchased directly from Agilent) in the United States and Canada. We began selling T&M equipment under the resale agreement during our third quarter of fiscal 2010. We have added approximately 58 people to our sales and support staff to serve these customers, and this agreement is material to our operations.
On March 31, 2010, we completed the acquisition of certain assets (including accounts receivable and rental equipment but excluding certain designated assets) and select liabilities of Telogy, LLC (“Telogy”), for $24.7 million in cash, subject to post-closing adjustments. The purchase price was reduced by $0.3 million in fiscal 2011 reflecting the final determination of assets acquired and other components of the purchase price in accordance with specific provisions of the asset purchase agreement with Telogy. Telogy, headquartered in Union City, California, was a leading provider of electronic T&M equipment in North America. We accounted for the acquisition under Accounting Standards Codification (“ASC”) 805, Business Combinations. (See Note 4 to the consolidated financial statements included in this Form 10-K.)
Our financial results for fiscal 2010 were impacted by competitive pressure on rental rates due in large part to the recession in the U.S. and our major international markets. However, our utilization rates improved due to an increase in demand and equipment on rent. During fiscal 2011, we have seen a modest improvement in our T&M and DP rental rates and a significant increase in our equipment on rent, while maintaining a high utilization rate, in particular in our North American and European operations. As a result of these improvements, our recent acquisition of Telogy, and sales of T&M equipment in connection with our Agilent resale agreement, we have experienced substantial growth in revenues and operating profit for fiscal 2011. Despite this growth, our customers and competitors continue to be affected by the recent recession in the U.S. and global economy, resulting in more stringent credit requirements and reduced access to capital. We must continue to be focused on remaining profitable in the current conditions, as well as being prepared for the possibility that recessionary trends may continue in future periods.
In fiscal 2011, 86% of our rental and lease revenues was derived from T&M equipment, compared to 83% for fiscal 2010. We have experienced growth in both our T&M and DP rental revenues, due to increased rental activity and a modest increase in our T&M and DP rental rates. Our T&M rental revenues for fiscal 2011 and the fourth quarter of fiscal 2010 include the rental revenues acquired from Telogy.
For fiscal 2011, rental revenues were 90% of our rental and lease revenues, compared to 86% for the fiscal 2010. The increase is the result of an increase in our T&M and DP rental activity, including the rental revenues associated with assets acquired from Telogy, while our lease revenues declined due to a decrease in demand for DP leases.
To maximize our overall profit from the rental, leasing, and sales of equipment, we manage our equipment pool on an on-going basis by controlling the timing, pricing and mix of our purchases and sales of equipment. We acquire new and used equipment to meet current technological standards and current and anticipated customer demand, and we sell our used equipment where we believe that is the most lucrative option. We employ a complex equipment management strategy and our proprietary PERFECT™ software to adjust our inventory and pricing on a dynamic basis in order to maximize equipment availability, utilization and profitability. We manage each specific equipment class based on a separate assessment of that equipment’s historical and projected life cycle and numerous other factors, including the U.S. and global economy, interest rates and new product launches. If we do not accurately predict market trends, or if demand for the equipment we supply declines, we can be left with inventory that we are unable to rent or sell for a profit. We assess the carrying value of the equipment pool on a quarterly basis or more frequently when factors indicating potential impairment are present.
18
Profitability and key business trends
Comparing fiscal 2011 to fiscal 2010, our revenues increased by 56.8% from $145.9 million to $228.7 million, our operating profit increased 100.4% from $18.4 million to $36.9 million and our net income increased by 104.8% from $11.6 million to $23.8 million.
Our rental and lease revenues increased 25.3% from $94.2 million to $118.0 million. The increase in our rental and lease revenues reflects increased rental activity and T&M and DP rental rates in our North American and European operations, which are attributable to improved market conditions and the T&M rental revenues acquired from Telogy.
In addition, our T&M sales activity increased 120.1% from $49.3 million to $108.5 million. The increase in our T&M sales activity is due to new equipment sales in connection with our Agilent resale agreement, and an increase in our used equipment sales attributable to improved demand and pricing. The increase in T&M sales more than offset declines in revenues from finance leases and distribution sales.
Some of our key profitability measurements are presented below:
| Fiscal 2011 | Fiscal 2010 | Fiscal 2009 | ||||||||||
|
|
||||||||||||
| Net income per diluted common share (EPS) |
$ | 0.99 | $ | 0.48 | $ | 0.47 | ||||||
| Net income as a percentage of average assets |
8.2 | % | 4.2 | % | 4.2 | % | ||||||
| Net income as a percentage of average equity |
10.3 | % | 5.2 | % | 4.9 | % | ||||||
|
|
||||||||||||
The increase in our operating profit is due primarily to a significant increase in rental revenues and sales of new equipment for fiscal 2011. The increase was partially offset by an increase in depreciation expense of $5.3 million, or 12.5%, as we have invested in additional rental equipment to support our growth, and an increase in selling, general and administrative expenses of $11.0 million, or 23.6%, primarily related to our hiring of sales and support staff in connection with our Agilent resale agreement.
The amount of our equipment on rent, based on acquisition cost, increased 7.5% to $214.5 million at May 31, 2011 from $199.5 million at May 31, 2010. Acquisition cost of equipment on lease decreased 2.8% to $27.8 million at May 31, 2011 from $28.6 million at May 31, 2010.
The average amount of our equipment on rent, based on average acquisition cost, increased 28.8% to $212.1 million for fiscal 2011 from $164.7 million for fiscal 2010. The average acquisition cost of equipment on lease increased 2.4% to $28.7 million for fiscal 2011 from $28.0 million for fiscal 2010.
Average rental rates for our T&M and DP segments increased by 2.4% for fiscal 2011 from fiscal 2010, while average lease rates declined by 9.4% for the same period. Average utilization for our T&M equipment pool, based on average acquisition cost of equipment on rent and lease compared to the total average equipment pool, was 70.0% for fiscal 2011 compared to 65.1% for fiscal 2010. Over the same period, the average utilization of our DP equipment pool decreased to 41.9% from 43.7%.
RESULTS OF OPERATIONS
Fiscal 2011 Compared with Fiscal 2010
Total Revenues: Total revenues for fiscal 2011 and 2010 were $228.7 million and $145.9 million, respectively. The 56.8% increase in total revenues was due to a 25.3% increase in rental and lease revenues and a 114.2% increase in sales of equipment and other revenues.
Rental and lease revenues for fiscal 2011 were $118.1 million, compared to $94.2 million for the same period of the prior fiscal year. This increase reflects an increase in our T&M and DP rental activity and rental rates in our North American and European operations, due to improved market conditions, the
19
acquisition of Telogy in the fourth quarter of fiscal 2010, and an increase in T&M leasing activity that was partially offset by a continued decline in DP leasing demand.
Sales of equipment and other revenues increased to $110.7 million for fiscal 2011 from $51.7 million in fiscal 2010. The increase is due to the full year effect of sales of new T&M equipment through our Agilent resale agreement and an increase in our sales of used equipment in our T&M business, due in part to a large sale to a customer, partially offset by a decline in finance lease activity and distribution sales. Our unfilled orders for T&M equipment relating to our resale agreement were $17.0 million at May 31, 2011, compared to $9.7 million at May 31, 2010. We terminated our distribution agreement with Agilent (which was replaced with the resale agreement) on January 31, 2010.
Depreciation of Rental and Lease Equipment: Depreciation of rental and lease equipment increased in fiscal 2011 to $47.9 million, or 40.6% of rental and lease revenues, from $42.6 million, or 45.2% of rental and lease revenues, in fiscal 2010. The increased depreciation expense in fiscal 2011 was due to a higher average rental and lease equipment pool, while the decreased ratio, as a percentage of rental and lease revenues, was due to higher average utilization for fiscal 2011.
Costs of Revenues Other Than Depreciation: Costs of revenues other than depreciation increased 121.8% to $86.6 million in fiscal 2011 from $39.1 million in fiscal 2010. Costs of revenues other than depreciation primarily includes the cost of equipment sales, which increased as a percentage of equipment sales to 77.0% in fiscal 2011 from 73.2% for fiscal 2010. This increase is due to an increase in sales of new T&M equipment through our Agilent resale agreement, which generally carry a lower margin than used equipment sales. Our sales margin is expected to continue to decline as a result of anticipated growth in connection with our resale agreement. Our sales margin is also impacted by competition, the global recession, and customer requirements and funding.
Selling, General and Administrative Expenses: Selling, general and administrative expenses increased 23.6% to $57.4 million in fiscal 2011 compared to $46.4 million in fiscal 2010. Our selling, general and administrative expenses increased primarily due to additional sales and support staff in connection with our Agilent resale agreement. As a percentage of total revenues, selling, general and administrative expenses decreased to 25.1% in fiscal 2011 from 31.8% in fiscal 2010, due to the increase in total revenues.
Operating Profit: As a result of significant growth in both our rental and lease revenues and our sales of equipment and other revenues, due to improved market conditions, the acquisition of Telogy in the fourth quarter of fiscal 2010, and sales of new T&M equipment in connection with our Agilent resale agreement, operating profit increased 100.4% to $36.9 million, or 16.1% of total revenues, in fiscal 2011, compared to an operating profit of $18.4 million, or 12.6% of total revenues, in fiscal 2010.
Interest Income, Net: Interest income, net, was $0.4 million in fiscal 2011, compared to $1.6 million in fiscal 2010, due to a lower cash balance, lower interest rates on our money market funds, and the redemption of our auction rate securities (“ARS”) (which carried a higher interest rate) in our first fiscal quarter of fiscal 2011.
Income Tax Provision: Our effective tax rate was 36.3% for fiscal 2011, compared to 42.1% for fiscal 2010. The decrease is due primarily to the derecognition of $1.4 million of interest and penalties resulting from the effective settlement of our uncertain tax positions in fiscal 2011. (See Note 7 to our consolidated financial statements included in this Form 10-K.)
Fiscal 2010 Compared with Fiscal 2009
Total Revenues: Total revenues for fiscal 2010 and 2009 were $145.9 million and $130.5 million, respectively. The 11.8% increase in total revenues was due to a 61.0% increase in sales of equipment and other revenues, partially offset by a decrease in rental and lease revenues of 4.3%.
Rental and lease revenues in fiscal 2010 were $94.2 million, compared to $98.4 million in fiscal 2009. This decrease reflected a decline in our DP lease revenues, primarily due to lower demand for leases,
20
and a decrease in DP rental revenues, while our T&M rental and lease revenues remained essentially unchanged from fiscal 2009. Rental rates decreased for both our DP and T&M businesses, reflecting increased competitive pressures and the global recession. This decrease was partially offset by an increase in our T&M rental and lease activity, due in part to the Telogy acquisition.
Sales of equipment and other revenues increased to $51.7 million for fiscal 2010 from $32.1 million in fiscal 2009. The increase was primarily due to an increase in used equipment sales in our T&M business, increased finance lease activity, resulting from a large sale to a customer and continued development of our vendor leasing program that provides customers with flexible financing alternatives, and sales of T&M equipment through our new Agilent resale agreement. Our unfilled orders for T&M equipment relating to our resale agreement were $9.7 million at May 31, 2010. Distribution sales in fiscal 2010 declined as a result of the termination of our Agilent distribution agreement on January 31, 2010.
Depreciation of Rental and Lease Equipment: Depreciation of rental and lease equipment decreased in fiscal 2010 to $42.6 million, or 45.2% of rental and lease revenues, from $46.1 million, or 46.8% of rental and lease revenues, in fiscal 2009. The decreased depreciation expense in fiscal 2010 was due to a sale of excess T&M equipment, while the decreased depreciation ratio, as a percentage of rental and lease revenues, reflected the lower equipment level during most of the year and higher utilization.
Costs of Revenues Other Than Depreciation: Costs of revenues other than depreciation increased 73.0% to $39.1 million in fiscal 2010 from $22.6 million in fiscal 2009. Costs of revenues other than depreciation primarily includes the cost of equipment sales, which increased as a percentage of equipment sales to 73.2% in fiscal 2010 from 67.3% in fiscal 2009. This increase reflected a decline in our used equipment sales margin, resulting from competitive pressures and the global recession, and an increase in our lower margin finance leases. In addition, fiscal 2010 includes sales of T&M equipment through the Agilent resale agreement, which generally carry a lower margin. Our sales margin is also impacted by competition, the global recession, and customer requirements and funding.
Selling, General and Administrative Expenses: Selling, general and administrative expenses increased 4.5% to $46.4 million in fiscal 2010 compared to $44.5 million in fiscal 2009. Our selling, general and administrative expenses increased primarily due to additional sales and support staff in connection with our new Agilent resale agreement, and $0.2 million in transition costs related to the Telogy acquisition, partially offset by several cost cutting measures that we introduced at the beginning of fiscal 2010 to control or reduce our selling, general and administrative expenses in response to the recession in the U.S. and our major international markets. As a percentage of total revenues, selling, general and administrative expenses decreased to 31.8% in fiscal 2010 from 34.1% in fiscal 2009, due to an increase in total revenues.
Operating Profit: As a result of significant growth in our sales of equipment and other revenues and a gain on bargain purchase of $0.7 million as a result of the Telogy acquisition, operating profit increased 6.0% to $18.4 million, or 12.6% of total revenues, in fiscal 2010, compared to an operating profit of $17.4 million, or 13.3% of total revenues, in fiscal 2009.
Interest Income, Net: Interest income, net, was $1.6 million in fiscal 2010, compared to $1.5 million in fiscal 2009. Interest income, net, includes $0.7 million of unrealized losses on our put option to UBS AG (“UBS”) which were offset by a related $0.7 million of unrealized gains on our investments, trading.
Income Tax Provision: Our effective tax rate was 42.1% for fiscal 2010, compared to 37.8% for fiscal 2009. The increase was due primarily to changes in tax estimates, a valuation allowance on tax benefits for certain foreign subsidiary losses and a reduction of the benefit from tax-advantaged investments.
Liquidity and Capital Resources
Capital Expenditures. During the last three fiscal years, our primary capital requirements have been purchases of rental and lease equipment. We generally purchase equipment throughout the year to replace equipment that has been sold and to maintain adequate levels of rental equipment to meet existing and expected customer demands. To meet T&M rental demand, support areas of potential
21
growth for both T&M and DP equipment and to keep our equipment pool technologically up-to-date, we made payments for purchases of $91.5 million of rental and lease equipment during fiscal 2011, $79.8 million in fiscal 2010, and $52.0 million in fiscal 2009. In response to increasing customer demand beginning in the second half of fiscal 2010 and continuing throughout fiscal 2011, purchases of equipment in fiscal 2011 were 14.7% higher than fiscal 2010. Capital expenditures for fiscal 2010 include $22.9 million of rental and lease equipment acquired from Telogy.
Share Repurchases and Dividends. We periodically repurchase shares of our common stock under an authorization from our board of directors. Shares we repurchase are retired and returned to the status of authorized but unissued stock. During fiscal 2010 and 2009, we repurchased 44 and 2,138 shares of our common stock, respectively, for $0.4 million and $22.8 million, respectively, at an average price per share of $8.94 and $10.67, respectively. There were no shares repurchased in fiscal 2011. We may make repurchases of our common stock in the future through open market transactions or otherwise, but we have no commitments to do so.
For fiscal 2011, 2010 and 2009, we paid aggregate dividends of $14.4 million, $14.4 million and $15.0 million, respectively. We expect to continue paying a quarterly dividend in future quarters, although the amount and timing of dividends, if any, will be made at the discretion of our board of directors in each quarter, subject to compliance with applicable law.
Dividend and Repurchase Summary
| Fiscal Year Ended May 31, | ||||||||||||||||
| (in thousands, except per share information) | Three Year Totals |
2011 | 2010 | 2009 | ||||||||||||
|
|
||||||||||||||||
| Cash dividends paid |
$ | 43,839 | $ | 14,449 | $ | 14,360 | $ | 15,030 | ||||||||
| Shares repurchased |
2,182 | — | 44 | 2,138 | ||||||||||||
| Average price per share repurchased |
$ | 10.64 | $ | — | $ | 8.94 | $ | 10.67 | ||||||||
| Aggregate purchase price |
$ | 23,208 | $ | — | $ | 395 | $ | 22,813 | ||||||||
| Total cash returned to shareholders |
$ | 67,047 | $ | 14,449 | $ | 14,755 | $ | 37,843 | ||||||||
|
|
||||||||||||||||
Cash and Cash Equivalents and Investments. Despite the $67.0 million in cash we have returned to our shareholders over the past three fiscal years, and the $24.7 million we paid in connection with the Telogy acquisition in fiscal 2010, we continue to maintain $41.4 million in cash and cash equivalents. We expect that the level of our cash and cash equivalents and investments may decrease as we pay dividends in future quarters, or if we decide to buy back additional shares of our common stock, increase equipment purchases in response to demand, finance another acquisition, or pursue other opportunities. We primarily invest our cash balance in money market funds, and corporate and government bond funds.
At May 31, 2010, we held $14.3 million, at cost, in ARS, which we classified as investments, trading.
On November 6, 2008, we accepted an offer from UBS providing us with rights related to our ARS (the “Rights”). The Rights permitted us to require UBS to purchase our ARS at par value, defined as the price equal to the liquidation preference of the ARS plus accrued but unpaid dividends or interest, at any time between June 30, 2010 and July 2, 2012. During the first quarter of fiscal 2011, UBS purchased our remaining ARS of $14.3 million at par value.
During the second quarter of fiscal 2010, we sold our investments available-for-sale, which consisted of corporate and government bond funds, for $28.8 million, including a realized gain of $0.8 million, included in interest income, net, in our consolidated statements of operations.
Cash Flows and Credit Facilities. We have three principal sources of liquidity: cash flows provided by our operating activities, proceeds from the sale of equipment from our portfolio, and external funds that historically have been provided by bank borrowings.
22
During fiscal 2011, 2010, and 2009 net cash provided by operating activities was $68.8 million, $34.2 million and $59.0 million, respectively. The increase in operating cash flow for fiscal 2011 compared to fiscal 2010 was due primarily to:
| • | an increase in net income to $23.8 million for fiscal 2011 from $11.6 million for fiscal 2010; and |
| • | an increase in our deferred tax liability of $23.5 million, due to the effective settlement of $4.5 million in unrecognized tax positions during fiscal 2011, and the enactment of bonus depreciation, which significantly increased our tax depreciation expense for fiscal 2011 and retroactively for our fiscal year ended May 31, 2010, resulting in deferral of payment of our current year tax expense of $13.5 million, and a refund of prior year taxes paid of $6.7 million. |
This increase was partially offset by an increase in other assets of $8.9 million for fiscal 2011 due to an increase in our demonstration pool inventory of $3.1 million and recording of an income tax receivable of $3.1 million.
The decrease in operating cash flow for fiscal 2010 compared to fiscal 2009 was due primarily to:
| • | a $7.5 million increase in accounts receivable for fiscal 2010, primarily due to higher revenues in fiscal 2010; |
| • | a decrease in our deferred tax liability of $2.8 million for fiscal 2010, resulting from an increase in used equipment sales in fiscal 2010; |
| • | an increase in other assets of $4.3 million for fiscal 2010, due to a large finance lease transaction in the second quarter of fiscal 2010; |
| • | an increase in accrued expenses of $2.5 million in fiscal 2010 due to an increase in current taxes payable as a result of the change in deferred taxes noted above; |
| • | a dividend accrual of $3.6 million in fiscal 2009 that was paid in fiscal 2010; and |
| • | an increase in deferred revenue of $1.1 million in fiscal 2010, resulting from an increase in revenues in our fourth fiscal quarter of 2010, due in part to the Telogy acquisition. |
The decrease also includes a decline in net income to $11.6 million for fiscal 2010 from $11.8 million in fiscal 2009.
During fiscal 2011, 2010, and 2009 net cash used in investing activities was $45.7 million, $9.5 million and $50.8 million, respectively. The increase in cash used in investing activities for fiscal 2011 was primarily due to increased purchases of rental and lease equipment of $91.5 million, compared to $56.9 million and $52.0 million for fiscal 2010 and 2009, respectively. For fiscal 2011, there were no purchases of investments or redemptions of investments, available-for-sale, compared to redemptions of investments, available-for-sale, of $28.7 million for fiscal 2010, and purchases of investments of $27.9 million in fiscal 2009. Redemptions of investments, trading, were $14.3 million, $7.3 million and $2.0 million for fiscal 2011, 2010 and 2009, respectively. Proceeds from sale of rental and lease equipment decreased to $32.9 million for fiscal 2011 compared to $36.7 million for fiscal 2010 and $27.3 million for fiscal 2009. Fiscal 2010 includes cash paid for the acquisition of Telogy of $24.7 million.
Net cash flows used in financing activities were $14.2 million in fiscal 2011 and 2010, respectively, and $36.5 million in fiscal 2009. These funds used were primarily composed of payments for dividends of $14.4 million for fiscal 2011 and 2010, respectively, and $15.0 million fiscal 2009. There were no payments for the repurchase of common stock for fiscal 2011, compared to $0.4 million in fiscal 2010 and $22.8 million in fiscal 2009.
23
As the following table illustrates, aggregate cash flows from operating activities and proceeds from the sale of equipment have been more than sufficient to fund our operations during the last three fiscal years.
| (in thousands) | Three Years May 31, 2011 |
2011 | 2010 | 2009 | ||||||||||||
|
|
||||||||||||||||
| Cash flows from operating activities1 |
$ | 161,901 | $ | 68,751 | $ | 34,173 | $ | 58,977 | ||||||||
| Proceeds from sale of equipment |
96,920 | 32,917 | 36,661 | 27,342 | ||||||||||||
|
|
||||||||||||||||
| Total |
258,821 | 101,668 | 70,834 | 86,319 | ||||||||||||
| Payments for equipment purchases |
(200,385 | ) | (91,538 | ) | (56,891 | ) | (51,956 | ) | ||||||||
| Equipment purchased from Telogy |
(22,923 | ) | — | (22,923 | ) | — | ||||||||||
| Net increase in equipment portfolio at acquisition cost |
53,137 | 35,765 | 13,457 | 3,915 | ||||||||||||
|
|
||||||||||||||||
| ¹ | For the components of cash flows from operating activities see the consolidated statements of cash flows. |
As indicated by the table, cash flows from operating activities and proceeds from sale of equipment provided 116% of the funds required for equipment purchased during the past three fiscal years.
We have a $10.0 million revolving line of credit with an institutional lender, subject to certain restrictions, to meet equipment acquisition needs as well as working capital and general corporate requirements. We had no bank borrowings outstanding or off balance sheet financing arrangements during the last three fiscal years.
We believe that cash and cash equivalents, cash flows from operating activities, proceeds from the sale of equipment and our borrowing capacity will be sufficient to fund our operations for at least the next twelve months.
Inflation. Inflation generally has favorably influenced our results of operations by enhancing the sale prices of our used equipment. However, lower inflation rates and the continued availability of newer, less expensive equipment with similar or better specifications over a period of several years could result in lower relative sale prices for used electronic equipment, which could reduce margins and earnings. Prices of new and used electronic test equipment have not consistently followed the overall inflation rate, while prices of new and used personal computers and servers have consistently declined. Because we are unable to predict the advances in technology and the rate of inflation for the next several years, it is not possible to estimate the impact of these factors on our margins and earnings.
CONTRACTUAL OBLIGATIONS
We lease certain facilities under various operating leases. Most of the lease agreements provide us with the option of renewing the lease at the end of the initial lease term, at the fair rental value, for periods of up to five years. In most cases, we expect that facility leases will be renewed or replaced by other leases in the normal course of business.
The table below presents the amount of payments due under our contractual obligations. The table reflects expected payments due as of May 31, 2011 and does not reflect changes that could arise after that time.
24
| Payments due by period | ||||||||||||||||||||
| Contractual Obligations (in thousands) | Total | Less than 1 year |
1-3 years |
3-5 years |
More than 5 years |
|||||||||||||||
|
|
||||||||||||||||||||
| Facility lease payments, not including property taxes and insurance |
$ | 1,618 | $797 | $ | 525 | $ | 296 | $ | — | |||||||||||
|
|
||||||||||||||||||||
| Total |
$ | 1,618 | $797 | $ | 525 | $ | 296 | $ | — | |||||||||||
|
|
||||||||||||||||||||
CRITICAL ACCOUNTING POLICIES AND ESTIMATES
The preparation of consolidated financial statements in conformity with accounting principles generally accepted in the United States of America (“generally accepted accounting principles”) requires us to make estimates and assumptions that affect the reported amounts of assets and liabilities and the disclosure of contingent assets and liabilities at the date of the financial statements and the reported amounts of revenues and expenses during the reporting period. On a regular basis, we review these estimates, including those related to asset lives and depreciation methods, impairment of long-lived assets (including rental and lease equipment), impairment of goodwill and definite lived intangible assets, investments, allowance for doubtful accounts and income taxes. These estimates are based on our historical experience and on various other assumptions we believe to be reasonable under the circumstances. Actual results may differ from these estimates under different assumptions or conditions.
We believe the following critical accounting policies affect the more significant judgments and estimates used in the preparation of our financial statements:
Asset Lives and Depreciation Methods: Our primary business involves the purchase and subsequent rental and lease of long-lived electronic equipment. We have chosen asset lives that we believe correspond to the economic lives of the related assets. We have chosen depreciation methods that we believe generally match our benefit from the assets with the associated costs. These judgments have been made based on our expertise in each equipment type that we carry. If the asset life and depreciation method chosen do not reduce the book value of the asset to at least our potential future cash flows from the asset, we would be required to record an impairment loss. Depreciation methods and useful lives are periodically reviewed and revised as deemed appropriate.
Investments in Debt Securities: Our investment portfolio may at any time contain direct obligations of the United States government, securities issued by agencies of the United States government, money market or cash management funds, corporate and government bond funds, and ARS. ASC 820, Fair Value Measurements, establishes three levels of inputs that may be used to measure fair value (see Note 3 to our consolidated financial statements included in this Form 10-K). Each level of input has different levels of subjectivity and difficulty in determining fair value.
Level 1 – Observable inputs, such as quoted prices in active markets for identical assets or liabilities. Determining fair value for Level 1 investments generally does not require significant management judgment.
Level 2 – Inputs, other than the quoted prices in active markets, that are observable either directly or through corroboration with observable market data.
Level 3 – Unobservable inputs, for which there is little or no market data for the assets or liabilities, such as internally-developed valuation models. The determination of fair value for Level 3 investments requires the most management judgment and subjectivity.
All of the securities classified as Level 3 investments have been ARS. Although none were held at May 31, 2011, during fiscal 2010, we sold $7.3 million of our ARS at par value. During the first quarter of fiscal 2011 we sold all of our remaining ARS to UBS at par value, for $14.3 million in cash. Our ARS were long-term debt instruments backed by student loans, a substantial portion of which was guaranteed by the United States government. Prior to their sale, we valued the ARS from quotes received from our
25
broker, UBS, which were derived from UBS’s internally developed model. In determining a discount factor for each ARS, the model weighted various factors, including assessments of credit quality, duration, insurance wraps, portfolio composition, discount rates, overall capital market liquidity and comparable securities, if any.
Impairment of Long-Lived Assets: On a quarterly basis, we review the carrying value of our rental and lease equipment to determine if the carrying value of the assets may not be recoverable due to current and forecasted economic conditions. This requires us to make estimates related to future cash flows from the assets and to determine whether any deterioration is other than temporary. If these estimates or the related assumptions change in the future, we may be required to record additional impairment charges.
Allowance for Doubtful Accounts: We maintain an allowance for doubtful accounts for estimated losses resulting from the inability of customers to pay our invoices. The estimated losses are based on historical collection experience in conjunction with an evaluation of the status of the existing accounts. If the financial condition of our customers were to deteriorate, then additional allowances could be required that would reduce income. Conversely, if the financial condition of our customers were to improve or if legal remedies to collect past due amounts were more successful than expected, then the allowance for doubtful accounts might need to be reduced and income would be increased.
Goodwill Impairment: Goodwill is the excess of the acquisition cost of a business over the fair value of the identifiable net assets acquired. We recognized goodwill of $3.1 million on the acquisition of Rush Computer Rentals in January 2006. Impairment testing for goodwill is performed annually, on May 31, or more frequently if indications of potential impairment exist under the provisions of ASC 350, Intangibles—Goodwill and Other (“ASC 350”). The impairment test for goodwill uses a two-step approach, which is performed at the reporting unit level. We have separate operating segments (reporting units) for T&M and DP equipment, although these two segments are aggregated into a single reportable segment in accordance with ASC 280, Segment Reporting. Step one of the impairment test compares the fair value of the reporting unit using a market approach to its carrying value. If the carrying value exceeds the fair value, there is a potential impairment and step two must be performed. Step two compares the carrying value of the reporting unit’s goodwill to its implied fair value (i.e., fair value of reporting unit less the fair value of the unit’s assets and liabilities, including identifiable intangible assets). If the implied fair value of goodwill is less than the carrying amount of goodwill, impairment is recognized.
Definite-lived Intangible Assets: Definite-lived intangible assets consist of customer lists and covenants not-to-compete. The assets are amortized over their useful lives and reviewed for impairment whenever events or changes in circumstances indicate that the carrying amount of the asset may not be recoverable in accordance with ASC 350. If any indications of impairment are present, then we test for recoverability by comparing the carrying amount of the asset to the net undiscounted cash flows expected to be generated from the asset. If the net undiscounted cash flows indicate the asset is not recoverable, we determine the fair value of the asset and record any impairment. We reevaluate the useful life determinations for these intangible assets each reporting period to determine whether events and circumstances warrant a revision in their remaining useful lives.
Income Taxes: We are required to estimate income taxes in each of the jurisdictions in which we operate. Significant judgment is required in determining the provision for income taxes and deferred tax assets and liabilities. This process involves us estimating actual current tax exposure and assessing temporary differences resulting from differing treatment of items, such as depreciation and amortization, for tax and accounting purposes. These differences result in deferred tax assets and liabilities, which are included within our consolidated balance sheet. We then assess the likelihood that our deferred tax assets will be recovered. To the extent management believes that recovery is not likely, we establish a valuation allowance. We determined that a valuation allowance was required in fiscal 2011, 2010 and 2009 of $0.6 million, $0.5 million and $0.3 million, respectively, for our deferred tax asset related to certain foreign net operating loss carry forwards and other related timing differences.
Effective January 1, 2007, the Financial Accounting Standards Board issued new accounting guidance regarding uncertain income tax positions. This guidance found under ASC 740, Income Taxes, provides that the tax effects of a position be recognized only if it is “more-likely-than-not” to be sustained based
26
solely on its technical merits as of the reporting date. The more-likely-than-not threshold represents a positive assertion by us that our company is entitled to the economic benefits of a tax position. If a tax position is not considered more-likely-than-not to be sustained based solely on its technical merits, no benefits of the position are to be recognized. Moreover, the more-likely-than-not threshold must continue to be met in each reporting period to support continued recognition of a benefit. At adoption, companies must adjust their financial statements to reflect only those tax positions that are more-likely-than-not to be sustained as of the adoption date. Any necessary adjustment would be recorded directly to retained earnings in the period of adoption and reported as a change in accounting principle. Pursuant to our adoption of this guidance on June 1, 2007, we recorded a net decrease of $0.4 million to retained earnings. During the second quarter of fiscal 2011 we effectively settled our remaining uncertain tax positions, and derecognized $4,515 of previously recognized uncertain tax positions, and the related deferred tax asset, and $1,396 for interest and penalties previously recognized. (See Note 7 to our consolidated financial statements included in this form 10-K.)
OFF BALANCE SHEET TRANSACTIONS
As of May 31, 2011 we did not have any “off-balance-sheet arrangements,” as defined in Item 303(a)(4)(ii) of Regulation S-K.
Item 7A. Quantitative and Qualitative Disclosures About Market Risk.
We could be exposed to market risks related to changes in interest rates and foreign currency exchange rates.
Interest Rate and Market Risk.
While we have the ability to draw on our revolving credit line, we have not had any borrowings under that credit facility for several years.
The primary objective of our investment activities is to preserve principal while at the same time maximizing the income we receive from our investments without significantly increasing risk. To achieve this objective, we maintain our portfolio of cash equivalents and investments in a variety of high quality securities, including direct obligations of the United States government, securities issued by agencies of the United States government, AAA-rated money market or cash management funds, corporate and government bond funds and ARS. A hypothetical increase in interest rates by 10% would not have a material impact on our financial condition or results of operations.
At May 31, 2010, our only investments held for trading purposes were ARS with a par value of $14.3 million, all of which were subsequently purchased by UBS at par during fiscal 2011 pursuant to an agreement with UBS entered into on November 6, 2008.
Changes in foreign currencies.
We have wholly owned Chinese and European subsidiaries. In addition, we have revenues, cash and cash equivalents and accounts receivable in other foreign currencies, primarily the Canadian dollar. Our international operations subject us to foreign currency risks (i.e., the possibility that the financial results could be better or worse than planned because of changes in foreign currency exchange rates). During fiscal 2010 we began using forward contracts to hedge our economic exposure with respect to assets, liabilities and firm commitments denominated in foreign currencies. Although there can be no assurances, given the extent of our international operations and our hedging, we do not expect a 10% change in foreign currency rates to have a material impact on our consolidated balance sheet.
Item 8. Financial Statements and Supplementary Data.
See Consolidated Financial Statements beginning on page F-1 of this Form 10-K.
27
Supplemental Financial Information regarding quarterly results is contained in Note 16 — Quarterly Information (unaudited), in the Notes to our Consolidated Financial Statements on page F-26 of this Form 10-K.
Item 9. Changes in and Disagreements With Accountants on Accounting and Financial Disclosure.
Not Applicable.
Item 9A. Controls and Procedures.
As of May 31, 2011, the end of the period covered by this Annual Report on Form 10-K, we have, with the participation of our Chief Executive Officer and our Chief Financial Officer, evaluated the effectiveness of our disclosure controls and procedures, as such terms are defined in Rule 13a-15(e) and Rule 15d-15(e) under the Securities and Exchange Act of 1934 as amended (the “Exchange Act”). Based on that evaluation, our Chief Executive Officer and Chief Financial Officer concluded that our disclosure controls and procedures as of the end of the period covered by this report were effective.
Management’s Report on Internal Control over Financial Reporting
Our management is responsible for establishing and maintaining adequate internal control over financial reporting (as defined in Rule 13a-15(f) of the Securities Exchange Act of 1934). Our management assessed the effectiveness of our internal control over financial reporting as of May 31, 2011. In making this assessment, our management used the criteria set forth in Internal Control Integrated Framework by the Committee of Sponsoring Organizations of the Treadway Commission (“COSO”). Our management has concluded that, as of May 31, 2011, our internal control over financial reporting is effective based on these criteria.
Deloitte & Touche LLP, an independent registered public accounting firm, who audited our consolidated financial statements included in this Form 10-K has issued an attestation report on our internal control over financial reporting, which is included below.
Changes in Internal Control over Financial Reporting
There was no change in our internal control over financial reporting (as defined in Rule 13a-15(f) of the Exchange Act) that occurred during our fourth fiscal quarter that has materially affected, or is reasonably likely to materially affect, our internal control over financial reporting.
Inherent Limitations on Effectiveness of Controls
Our management, including our Chief Executive Officer and Chief Financial Officer, does not expect that our disclosure controls and procedures or our internal controls will prevent all error and all fraud. A control system, no matter how well conceived and operated, can provide only reasonable, not absolute, assurance that the objectives of the control system are met. Further, the design of a control system must reflect the fact that there are resource constraints, and the benefits of controls must be considered relative to their costs. Because of the inherent limitations in all control systems, no evaluation of controls can provide absolute assurance that all control issues and instances of fraud, if any, within our company have been detected.
28
REPORT OF INDEPENDENT REGISTERED PUBLIC ACCOUNTING FIRM
To the Board of Directors and Shareholders of
Electro Rent Corporation
Van Nuys, California
We have audited the internal control over financial reporting of Electro Rent Corporation and subsidiaries (the “Company”) as of May 31, 2011, based on criteria established in Internal Control – Integrated Framework issued by the Committee of Sponsoring Organizations of the Treadway Commission. The Company’s management is responsible for maintaining effective internal control over financial reporting and for its assessment of the effectiveness of internal control over financial reporting, included in the accompanying “Management’s Report on Internal Control Over Financial Reporting.” Our responsibility is to express an opinion on the Company’s internal control over financial reporting based on our audit.
We conducted our audit in accordance with the standards of the Public Company Accounting Oversight Board (United States). Those standards require that we plan and perform the audit to obtain reasonable assurance about whether effective internal control over financial reporting was maintained in all material respects. Our audit included obtaining an understanding of internal control over financial reporting, assessing the risk that a material weakness exists, testing and evaluating the design and operating effectiveness of internal control based on the assessed risk, and performing such other procedures as we considered necessary in the circumstances. We believe that our audit provides a reasonable basis for our opinion.
A company’s internal control over financial reporting is a process designed by, or under the supervision of, the company’s principal executive and principal financial officers, or persons performing similar functions, and effected by the company’s board of directors, management, and other personnel to provide reasonable assurance regarding the reliability of financial reporting and the preparation of financial statements for external purposes in accordance with generally accepted accounting principles. A company’s internal control over financial reporting includes those policies and procedures that (1) pertain to the maintenance of records that, in reasonable detail, accurately and fairly reflect the transactions and dispositions of the assets of the company; (2) provide reasonable assurance that transactions are recorded as necessary to permit preparation of financial statements in accordance with generally accepted accounting principles, and that receipts and expenditures of the company are being made only in accordance with authorizations of management and directors of the company; and (3) provide reasonable assurance regarding prevention or timely detection of unauthorized acquisition, use, or disposition of the company’s assets that could have a material effect on the financial statements.
Because of inherent limitations of internal control over financial reporting, including the possibility of collusion or improper management override of controls, material misstatements due to error or fraud may not be prevented or detected on a timely basis. Also, projections of any evaluation of the effectiveness of the internal control over financial reporting to future periods are subject to the risk that the controls may become inadequate because of changes in conditions, or that the degree of compliance with the policies or procedures may deteriorate.
In our opinion, the Company maintained, in all material respects, effective internal control over financial reporting as of May 31, 2011, based on the criteria established in Internal Control – Integrated Framework issued by the Committee of Sponsoring Organizations of the Treadway Commission.
We have also audited, in accordance with the standards of the Public Company Accounting Oversight Board (United States) the consolidated financial statements as of and for the year ended May 31, 2011 of the Company and our report dated August 8, 2011 expressed an unqualified opinion on those financial statements.
/s/ DELOITTE & TOUCHE LLP
Los Angeles, California
August 8, 2011
29
Item 9B. Other Information.
Not Applicable.
PART III
Item 10. Directors, Executive Officers and Corporate Governance.
The information required by this Item is incorporated by reference to our definitive Proxy Statement with respect to our Annual Meeting of Shareholders, which will be filed with the Securities and Exchange Commission not later than September 28, 2011.
Item 11. Executive Compensation.
The information required by this Item is incorporated by reference to our definitive Proxy Statement with respect to our Annual Meeting of Shareholders, which will be filed with the Securities and Exchange Commission not later than September 28, 2011.
Item 12. Security Ownership of Certain Beneficial Owners and Management and Related Stockholder Matters.
The information required by this Item is incorporated by reference to our definitive Proxy Statement with respect to our Annual Meeting of Shareholders, which will be filed with the Securities and Exchange Commission not later than September 28, 2011.
Item 13. Certain Relationships and Related Transactions, and Director Independence.
The information required by this Item is incorporated by reference to our definitive Proxy Statement with respect to our Annual Meeting of Shareholders, which will be filed with the Securities and Exchange Commission not later than September 28, 2011.
Item 14. Principal Accountant Fees and Services.
The information required by this Item is incorporated by reference to our definitive Proxy Statement with respect to our Annual Meeting of Shareholders, which will be filed with the Securities and Exchange Commission not later than September 28, 2011.
PART IV
Item 15. Exhibits and Financial Statement Schedules.
| (a) | Financial Statements. |
| 1. |
Index to Financial Statements: | Page | ||||
| See Consolidated Financial Statements included as part of this Form 10-K. Pursuant to Rule 7-05 of Regulation S-X, the schedules have been omitted as the information to be set forth therein is included in the notes of the audited consolidated financial statements. | F-1 | |||||
All other schedules have been omitted since the required information is not present or is not present in amounts sufficient to require submission of a schedule, or because the information required is included in the financial statements or related notes.
30
| (b) | Exhibits. |
| Exhibit |
Description of Document |
Incorporation by Reference | ||
| 3.1 |
Restated Articles of Incorporation, filed October 3, 1984 | Incorporated by reference from Registrant’s Annual Report on Form 10-K for the fiscal year ended May 31, 2009. | ||
| 3.2 |
Certificate of Amendment of Restated Articles of Incorporation, filed October 24, 1988 | Incorporated by reference from Registrant’s Annual Report on Form 10-K for the fiscal year ended May 31, 2009. | ||
| 3.3 |
Certificate of Amendment of Restated Articles of Incorporation, filed October 15, 1997 | Incorporated by reference from Registrant’s Annual Report on Form 10-K for the fiscal year ended May 31, 1998. | ||
| 3.4 |
Bylaws of Registrant, adopted February 6, 1979 | Incorporated by reference from Registrant’s Annual Report on Form 10-K for the fiscal year ended May 31, 2009. | ||
| 3.5 |
Amendment of Bylaws of Registrant, adopted October 6, 1994 | Incorporated by reference from Registrant’s Annual Report on Form 10-K for the fiscal year ended May 31, 1995. | ||
| 3.6 |
Amendment of Bylaws of Registrant, adopted November 15, 1996 | Incorporated by reference from Registrant’s Annual Report on Form 10-K for the fiscal year ended May 31, 1997. | ||
| 3.7 |
Amendment of Bylaws of Registrant, adopted July 11, 2002 | Incorporated by reference from Registrant’s Annual Report on Form 10-K for the fiscal year ended May 31, 2009. | ||
| 4.1 |
Form of Common Stock Certificate | Incorporated by reference from Registrant’s Annual Report on Form 10-K for the fiscal year ended May 31, 2009. | ||
| 10.1* |
Electro Rent Corporation Supplemental Retirement Plan | Incorporated by reference from Registrant’s Annual Report on Form 10-K for the fiscal year ended May 31, 2009. | ||
| 10.2* |
Executive Employment Agreement (Amended and Restated as of July 15, 1992) between Registrant and Daniel Greenberg | Incorporated by reference from Registrant’s Annual Report on Form 10-K for the fiscal year ended May 31, 2009. | ||
| 10.3* |
Amendment No. 1 to Executive Employment Agreement (Amended and Restated as of July 15, 1992) between Registrant and Daniel Greenberg, dated October 12, 2001 | Incorporated by reference from Registrant’s Annual Report on Form 10-K for the fiscal year ended May 31, 2003. | ||
| 10.4* |
Employment Agreement between Registrant and Steven Markheim, dated as of October 31, 2005 | Incorporated by reference from Registrant’s Current Report on Form 8-K filed November 1, 2005. | ||
| 10.5* |
Employment Agreement between Registrant and Craig R. Jones, dated as of October 31, 2005 | Incorporated by reference from Registrant’s Current Report on Form 8-K filed November 1, 2005. | ||
| 10.6* |
1996 Stock Option Plan | Incorporated by reference from Registrant’s Annual Report on Form 10-K for the fiscal year ended May 31, 1996. | ||
| 10.7* |
Form of Stock Option Agreement (Incentive Stock Option) (1996 Plan) | Incorporated by reference from Registrant’s Annual Report on Form 10-K for the fiscal year ended May 31, 1996. | ||
| 10.8* |
Form of Stock Option Agreement (Nonstatutory Stock Option) (1996 Plan) | Incorporated by reference from Registrant’s Annual Report on Form 10-K for the fiscal year ended May 31, 1996. | ||
| 10.9* |
Amendment Number One to 1996 Stock Option Plan, adopted November 1, 1996 | Incorporated by reference from Registrant’s Registration Statement on Form S-8 filed December 5, 1996 (Registration No. 333-17295). |
31
| Exhibit |
Description of Document |
Incorporation by Reference | ||
| 10.10* |
Amendment No. 1 to 1996 Stock Option Plan, 1996 Director Option Plan, and 2002 Employee Stock Option Plan | Incorporated by reference from Registrant’s Proxy Statement on Form DEF 14A filed December 2, 2003. | ||
| 10.11* |
2005 Equity Incentive Plan | Incorporated by reference from Registrant’s Registration Statement on Form S-8 filed December 20, 2005 (File No. 333-130487). | ||
| 10.12* |
Form of 2005 Stock Option Agreement | Incorporated by reference from Registrant’s Registration Statement on Form S-8 filed December 20, 2005 (File No. 333-130487). | ||
| 10.13* |
Form of Stock Unit Award Agreement (Employee) | Incorporated by reference from Registrant’s Current Report on Form 8-K filed July 21, 2009. | ||
| 10.14* |
Form of Stock Unit Award Agreement (Director) | Incorporated by reference from Registrant’s Annual Report on Form 10-K for the fiscal year ended May 31, 2009. | ||
| 10.15* |
Form of Indemnification Agreement | Incorporated by reference from Registrant’s Annual Report on Form 10-K for the fiscal year ended May 31, 2009. | ||
| 10.16 |
Commercial Credit Agreement dated as of September 29, 2008 between Electro Rent Corporation (the “Company”) and Union Bank of California, N.A. | Incorporated by reference from Registrant’s Quarterly Report on Form 10-Q for the quarterly period ended February 28, 2010. | ||
| 10.17 |
First Amendment to Commercial Credit Agreement dated as of March 4, 2009 between the Company and Union Bank of California, N.A | Incorporated by reference from Registrant’s Quarterly Report on Form 10-Q for the quarterly period ended February 28, 2010. | ||
| 10.18 |
Second Amendment to Commercial Credit Agreement dated as of September 16, 2009 between the Company and Union Bank of California, N.A. | Incorporated by reference from Registrant’s Quarterly Report on Form 10-Q for the quarterly period ended February 28, 2010. | ||
| 10.19 |
Third Amendment to Commercial Credit Agreement dated as of September 22, 2010 between the Company and Union Bank of California, N.A. | Filed herewith. | ||
| 10.20 |
Asset Purchase Agreement between Registrant and Telogy, LLC dated as of March 16, 2010 | Incorporated by reference from Registrant’s Current Report on Form 8-K filed March 22, 2010. | ||
| 10.21 |
Agreement between the Company and UBS regarding Auction Rate Securities | Incorporated by reference from Registrant’s Quarterly Report on Form 10-Q for the quarterly period ended February 28, 2010. | ||
| 14 |
Code of Business Conduct and Ethics | Incorporated by reference from Registrant’s Annual Report on Form 10-K for the fiscal year ended May 31, 2009. |
32
| Exhibit |
Description of Document |
Incorporation by Reference | ||
| 21 |
Subsidiaries of the Registrant.
• Genstar Rental Electronics, Inc., a Canadian corporation
• ER International, Inc., a Delaware corporation
• Electro Rent Asia, Inc., a California corporation
• Electro Rent (Tianjin) Rental Co., Ltd., a Chinese wholly foreign-owned enterprise
• Electro Rent (Beijing) Technology Rental Co., Ltd., a Chinese wholly foreign-owned enterprise
• Electro Rent Europe NV, a Belgium corporation
• Electro Rent, LLC, a Delaware limited liability company
|
|||
| 23 |
Consent of Deloitte & Touche LLP, the Company’s independent registered public accounting firm | Filed herewith. | ||
| 31.1 |
Rule 13a-14(a)/15d-14(a) Certification of Chief Executive Officer | Filed herewith. | ||
| 31.2 |
Rule 13a-14(a)/15d-14(a) Certification of Chief Financial Officer | Filed herewith. | ||
| 32.1 |
Section 1350 Certification by Principal Executive Officer | Filed herewith. | ||
| 32.2 |
Section 1350 Certification by Chief Financial Officer | Filed herewith. |
| * | Management contract or compensatory plan or arrangement |
| (c) | Schedule of Financial Statements |
None.
33
SIGNATURES
Pursuant to the requirements of Sections 13 or 15(d) of the Securities Exchange Act of 1934, the registrant has duly caused this report to be signed on its behalf by the undersigned, thereunto duly authorized.
| Electro Rent Corporation | ||||||
| Dated: August 8, 2011 | By | /s/ Daniel Greenberg | ||||
| Daniel Greenberg | ||||||
| Chief Executive Officer and Director | ||||||
Pursuant to the requirements of the Securities Exchange Act of 1934, this report has been signed below by the following persons on behalf of the registrant and in the capacities and on the dates indicated.
| SIGNATURE | TITLE | DATE | ||
| /s/ Daniel Greenberg Daniel Greenberg |
Chairman of the Board and Chief Executive Officer (Principal Executive Officer) |
August 8, 2011 | ||
| /s/ Craig R. Jones Craig R. Jones |
Chief Financial Officer (Principal Financial and Accounting Officer) |
August 8, 2011 | ||
| /s/ Gerald D. Barrone Gerald D. Barrone |
Director | August 8, 2011 | ||
| /s/ Nancy Y. Bekavac Nancy Y. Bekavac |
Director | August 8, 2011 | ||
| /s/ Karen J. Curtin Karen J. Curtin |
Director | August 8, 2011 | ||
| /s/ Theodore E. Guth Theodore E. Guth |
Director | August 8, 2011 | ||
| /s/ Joseph J. Kearns Joseph J. Kearns |
Director | August 8, 2011 | ||
| /s/ James S. Pignatelli James S. Pignatelli |
Director | August 8, 2011 | ||
34
INDEX TO CONSOLIDATED FINANCIAL STATEMENTS
MAY 31, 2011
| Page Number | ||||||
| 1. |
Financial Statements |
|||||
| F-2 | ||||||
| Consolidated Statements of Operations for each of the three years in the period ended May 31, 2011 |
F-3 | |||||
| F-4 | ||||||
| F-5 | ||||||
| Consolidated Statements of Cash Flows for each of the three years in the period ended May 31, 2011 |
F-6 | |||||
| F-7 | ||||||
F-1
REPORT OF INDEPENDENT REGISTERED PUBLIC ACCOUNTING FIRM
To the Board of Directors and Shareholders of
Electro Rent Corporation
Van Nuys, California
We have audited the accompanying consolidated balance sheets of Electro Rent Corporation and subsidiaries (the “Company”) as of May 31, 2011 and 2010, and the related consolidated statements of operations, shareholders’ equity, and cash flows for each of the three years in the period ended May 31, 2011. These financial statements are the responsibility of the Company’s management. Our responsibility is to express an opinion on these financial statements based on our audits.
We conducted our audits in accordance with the standards of the Public Company Accounting Oversight Board (United States). Those standards require that we plan and perform the audit to obtain reasonable assurance about whether the financial statements are free of material misstatement. An audit includes examining, on a test basis, evidence supporting the amounts and disclosures in the financial statements. An audit also includes assessing the accounting principles used and significant estimates made by management, as well as evaluating the overall financial statement presentation. We believe that our audits provide a reasonable basis for our opinion.
In our opinion, such consolidated financial statements present fairly, in all material respects, the financial position of the Company at May 31, 2011 and 2010, and the results of its operations and its cash flows for each of the three years in the period ended May 31, 2011, in conformity with accounting principles generally accepted in the United States of America.
We have also audited, in accordance with the standards of the Public Company Accounting Oversight Board (United States), the Company’s internal control over financial reporting as of May 31, 2011, based on the criteria established in Internal Control – Integrated Framework issued by the Committee of Sponsoring Organizations of the Treadway Commission and our report dated August 8, 2011 expressed an unqualified opinion on the Company’s internal control over financial reporting.
/s/ DELOITTE & TOUCHE LLP
LOS ANGELES, CALIFORNIA
AUGUST 8, 2011
F-2
ELECTRO RENT 2011 ANNUAL REPORT
Consolidated Statements of Operations
| Year Ended May 31, (in thousands, except per share information) |
2011 | 2010 | 2009 | |||||||||
|
|
||||||||||||
| Revenues: |
||||||||||||
| Rentals and leases |
$ | 118,062 | $ | 94,201 | $ | 98,395 | ||||||
| Sales of equipment and other revenues |
110,667 | 51,666 | 32,086 | |||||||||
|
|
||||||||||||
| Total revenues |
228,729 | 145,867 | 130,481 | |||||||||
|
|
||||||||||||
| Operating expenses: |
||||||||||||
| Depreciation of rental and lease equipment |
47,922 | 42,605 | 46,056 | |||||||||
| Costs of revenues other than depreciation of rental and lease equipment |
86,649 | 39,061 | 22,574 | |||||||||
| Selling, general and administrative expenses |
57,423 | 46,447 | 44,456 | |||||||||
| Gain on bargain purchase, net of taxes |
(202 | ) | (679 | ) | — | |||||||
|
|
||||||||||||
| Total operating expenses |
191,792 | 127,434 | 113,086 | |||||||||
|
|
||||||||||||
| Operating profit |
36,937 | 18,433 | 17,395 | |||||||||
| Interest income, net |
352 | 1,599 | 1,507 | |||||||||
|
|
||||||||||||
| Income before income taxes |
37,289 | 20,032 | 18,902 | |||||||||
| Income tax provision |
13,533 | 8,435 | 7,150 | |||||||||
|
|
||||||||||||
| Net income |
$ | 23,756 | $ | 11,597 | $ | 11,752 | ||||||
|
|
||||||||||||
| Earnings per share: |
||||||||||||
| Basic |
$ | 0.99 | $ | 0.48 | $ | 0.47 | ||||||
| Diluted |
$ | 0.99 | $ | 0.48 | $ | 0.47 | ||||||
| Shares used in per share calculation: |
||||||||||||
| Basic |
23,974 | 23,932 | 24,899 | |||||||||
| Diluted |
24,072 | 24,004 | 24,980 | |||||||||
|
|
||||||||||||
The accompanying notes are an integral part of these consolidated financial statements.
F-3
ELECTRO RENT 2011 ANNUAL REPORT
| As of May 31, (in thousands, except share information) |
2011 | 2010 | ||||||
|
|
||||||||
| Assets |
||||||||
| Cash and cash equivalents |
$ | 41,441 | $ | 32,906 | ||||
| Investments, trading, at fair value (cost of $14,275) |
— | 13,323 | ||||||
| Put option |
— | 952 | ||||||
| Accounts receivable, net of allowance for doubtful accounts of $602 and $536 |
30,616 | 25,670 | ||||||
| Rental and lease equipment, net of accumulated depreciation of $191,160 and $177,380 |
195,632 | 173,647 | ||||||
| Other property, net of accumulated depreciation and amortization of $16,825 and $16,055 |
14,127 | 13,585 | ||||||
| Goodwill |
3,109 | 3,109 | ||||||
| Intangibles, net of amortization of $2,201 and $2,017 |
1,214 | 1,398 | ||||||
| Other |
19,788 | 11,478 | ||||||
|
|
||||||||
| $ | 305,927 | $ | 276,068 | |||||
|
|
||||||||
| Liabilities and Shareholders’ Equity |
||||||||
| Liabilities: |
||||||||
| Accounts payable |
$ | 8,237 | $ | 8,294 | ||||
| Accrued expenses |
10,437 | 14,240 | ||||||
| Deferred revenue |
5,874 | 6,022 | ||||||
| Deferred tax liability |
41,004 | 17,550 | ||||||
|
|
||||||||
| Total liabilities |
65,552 | 46,106 | ||||||
|
|
||||||||
| Commitments and contingencies (Note 13) |
||||||||
| Shareholders’ equity: |
||||||||
| Preferred stock, $1 par - shares authorized 1,000,000; none issued |
||||||||
| Common stock, no par - shares authorized 40,000,000; issued and outstanding 2011 - 23,980,581; 2010 - 23,960,694 |
34,742 | 33,555 | ||||||
| Retained earnings |
205,633 | 196,407 | ||||||
|
|
||||||||
| Total shareholders’ equity |
240,375 | 229,962 | ||||||
|
|
||||||||
| $ | 305,927 | $ | 276,068 | |||||
|
|
||||||||
The accompanying notes are an integral part of these consolidated financial statements.
F-4
ELECTRO RENT 2011 ANNUAL REPORT
Consolidated Statements of Shareholders’ Equity
| Accumulated | ||||||||||||||||||||
| Common Stock | Other | Total | ||||||||||||||||||
| Three years ended May 31, | Number | Comprehensive | Retained | Shareholders’ | ||||||||||||||||
| (in thousands) | of Shares | Amount | Income/(Loss) | Earnings | Equity | |||||||||||||||
|
|
||||||||||||||||||||
| Balance, May 31, 2008 |
25,945 | $ | 33,938 | $ | (619 | ) | $ | 222,789 | $256,108 | |||||||||||
| Exercise of stock options and issuance of restricted shares |
147 | 1,327 | — | — | 1,327 | |||||||||||||||
| Tax benefit for stock options exercised |
— | 49 | — | — | 49 | |||||||||||||||
| Non-cash stock compensation expense |
— | 158 | — | — | 158 | |||||||||||||||
| Repurchase of common stock |
(2,138 | ) | (2,876 | ) | — | (19,937 | ) | (22,813 | ) | |||||||||||
| Dividends declared |
— | — | — | (18,623 | ) | (18,623 | ) | |||||||||||||
| Comprehensive income: |
||||||||||||||||||||
| Realized loss on transfer of investments available-for-sale to investments, trading |
— | — | 619 | — | 619 | |||||||||||||||
| Unrealized gains on investments available-for-sale, net of $116 of tax expense |
— | — | 176 | — | 176 | |||||||||||||||
| Net income for the year ended May 31, 2009 |
— | — | — | 11,752 | 11,752 | |||||||||||||||
|
|
|
|||||||||||||||||||
| Total comprehensive income |
12,547 | |||||||||||||||||||
|
|
||||||||||||||||||||
| Balance, May 31, 2009 |
23,954 | 32,596 | 176 | 195,981 | 228,753 | |||||||||||||||
| Exercise of stock options and issuance of restricted shares |
51 | 454 | — | — | 454 | |||||||||||||||
| Tax deficit for stock options expired, net of tax benefit for stock options exercised |
— | (45 | ) | — | — | (45 | ) | |||||||||||||
| Non-cash stock compensation expense |
— | 610 | — | — | 610 | |||||||||||||||
| Repurchase of common stock |
(44 | ) | (60 | ) | — | (335 | ) | (395 | ) | |||||||||||
| Dividends declared |
— | — | — | (10,836 | ) | (10,836 | ) | |||||||||||||
| Comprehensive income: |
||||||||||||||||||||
| Realized loss on transfer of investments available-for-sale to investments, trading |
— | — | (176 | ) | — | (176 | ) | |||||||||||||
| Net income for the year ended May 31, 2010 |
— | — | — | 11,597 | 11,597 | |||||||||||||||
|
|
|
|||||||||||||||||||
| Total comprehensive income |
11,421 | |||||||||||||||||||
|
|
||||||||||||||||||||
| Balance, May 31, 2010 |
23,961 | 33,555 | — | 196,407 | 229,962 | |||||||||||||||
| Exercise of stock options and issuance of restricted shares |
20 | 197 | — | — | 197 | |||||||||||||||
| Tax benefit for stock options exercised |
— | 34 | — | — | 34 | |||||||||||||||
| Non-cash stock compensation expense |
— | 956 | — | — | 956 | |||||||||||||||
| Repurchase of common stock |
— | — | — | — | — | |||||||||||||||
| Dividends declared |
— | — | — | (14,530 | ) | (14,530 | ) | |||||||||||||
| Net income for the year ended May 31, 2011 |
— | — | — | 23,756 | 23,756 | |||||||||||||||
|
|
||||||||||||||||||||
| Balance, May 31, 2011 |
23,981 | $ | 34,742 | $ | — | $ | 205,633 | $240,375 | ||||||||||||
|
|
||||||||||||||||||||
The accompanying notes are an integral part of these consolidated financial statements.
F-5
ELECTRO RENT 2011 ANNUAL REPORT
Consolidated Statements of Cash Flows
| Year Ended May 31, (in thousands) |
2011 | 2010 | 2009 | |||||||||
|
|
||||||||||||
| Cash flows from operating activities: |
||||||||||||
| Net income |
$ | 23,756 | $ | 11,597 | $ | 11,752 | ||||||
| Adjustments to reconcile net income to net cash provided by operating activities: |
||||||||||||
| Depreciation and amortization |
49,127 | 43,759 | 47,226 | |||||||||
| Put option loss (gain) |
952 | 671 | (1,623 | ) | ||||||||
| Mark to market, trading |
(952 | ) | (671 | ) | 1,623 | |||||||
| Remeasurement (gain) loss |
43 | 93 | 445 | |||||||||
| Provision for losses on accounts receivable |
500 | 529 | 481 | |||||||||
| Realized gain on sale of investments available for sale |
0 | (841 | ) | — | ||||||||
| Gain on sale of rental and lease equipment |
(12,083 | ) | (10,768 | ) | (8,952 | ) | ||||||
| Gain on bargain purchase, net of taxes |
(202 | ) | (679 | ) | — | |||||||
| Stock compensation expense |
956 | 610 | 158 | |||||||||
| Excess tax benefit for share based compensation |
(37 | ) | (62 | ) | (49 | ) | ||||||
| Deferred tax liability |
23,454 | (2,802 | ) | 4,588 | ||||||||
| Change in operating assets and liabilities: |
||||||||||||
| Accounts receivable |
(4,819 | ) | (7,545 | ) | 6,170 | |||||||
| Other assets |
(8,950 | ) | (4,268 | ) | (1,779 | ) | ||||||
| Accounts payable |
1,184 | 939 | 508 | |||||||||
| Accrued expenses |
(3,974 | ) | 2,467 | (945 | ) | |||||||
| Deferred revenue |
(204 | ) | 1,144 | (626 | ) | |||||||
|
|
||||||||||||
| Net cash provided by operating activities |
68,751 | 34,173 | 58,977 | |||||||||
|
|
||||||||||||
| Cash flows from investing activities: |
||||||||||||
| Proceeds from sale of rental and lease equipment |
32,917 | 36,661 | 27,342 | |||||||||
| Cash paid for acquisition |
— | (24,653 | ) | — | ||||||||
| Proceeds from acquisition purchase price adjustment |
260 | — | — | |||||||||
| Purchase of rental and lease equipment |
(91,538 | ) | (56,891 | ) | (51,956 | ) | ||||||
| Purchases of investments |
— | — | (27,896 | ) | ||||||||
| Redemptions of investments, available-for-sale |
— | 28,737 | — | |||||||||
| Redemptions of investments, trading |
14,275 | 7,325 | 2,000 | |||||||||
| Purchase of other property |
(1,563 | ) | (682 | ) | (275 | ) | ||||||
|
|
||||||||||||
| Net cash used in investing activities |
(45,649 | ) | (9,503 | ) | (50,785 | ) | ||||||
|
|
||||||||||||
| Cash flows from financing activities: |
||||||||||||
| Proceeds from issuance of common stock |
197 | 454 | 1,327 | |||||||||
| Excess tax benefit for share based compensation |
37 | 62 | 49 | |||||||||
| Payments for repurchase of common stock |
— | (395 | ) | (22,813 | ) | |||||||
| Payment of dividends |
(14,449 | ) | (14,360 | ) | (15,030 | ) | ||||||
|
|
||||||||||||
| Net cash used in financing activities |
(14,215 | ) | (14,239 | ) | (36,467 | ) | ||||||
|
|
||||||||||||
| Net increase (decrease) in cash and cash equivalents |
8,887 | 10,431 | (28,275 | ) | ||||||||
| Effect of exchange rate changes on cash |
(352 | ) | 260 | (474 | ) | |||||||
| Cash and cash equivalents at beginning of year |
32,906 | 22,215 | 50,964 | |||||||||
|
|
||||||||||||
| Cash and cash equivalents at end of year |
$ | 41,441 | $ | 32,906 | $ | 22,215 | ||||||
|
|
||||||||||||
The accompanying notes are an integral part of these consolidated financial statements.
F-6
NOTES TO CONSOLIDATED FINANCIAL STATEMENTS
FOR THE YEARS ENDED MAY 31, 2011, 2010 AND 2009
(in thousands, except per share amounts)
Note 1: Summary of Significant Accounting Policies
Basis of Presentation: The consolidated financial statements include Electro Rent Corporation and its wholly owned subsidiaries (collectively “we”, “us”, or “our” hereafter). All intercompany balances and transactions have been eliminated in consolidation.
Business and Organization: We primarily engage in the short-term rental, lease, and sale of state-of-the-art electronic equipment. We maintain an equipment portfolio composed primarily of test and measurement equipment (“T&M”) and personal computer-related data products (“DP”) equipment purchased from leading manufacturers. Another aspect of our business is the sale of equipment after its utilization for rental or lease and the sale of a range of new T&M equipment through our resale agreement with Agilent Technologies, Inc. (“Agilent”), which we entered into effective December 1, 2009. Our resale agreement with Agilent gives us the exclusive right to sell Agilent’s more complex T&M equipment to small and medium size customers (who previously purchased directly from Agilent) in the United States and Canada. We began selling T&M equipment under the resale agreement during our third quarter of fiscal 2010. In connection with the execution of this agreement, we terminated our prior distribution agreement with Agilent, which was our largest distribution agreement and related to less complex T&M equipment.
We conduct our business activities in the United States, as well as through our wholly owned subsidiaries, Electro Rent, LLC, Electro Rent Europe, NV, Electro Rent (Beijing) Test and Measurement Equipment Rental Co., Ltd., and Electro Rent (Tianjin) Rental Co., Ltd. which conduct some or all of these business activities in Canada, Europe and China, respectively. Our wholly owned subsidiary, Genstar Rental Electronics, Inc. conducted some of these business activities in Canada through fiscal 2010, but is now inactive. Our wholly owned subsidiary, Electro Rent Asia, Inc., is the U.S. parent company of Electro Rent (Beijing) Test and Measurement Equipment Rental Co., Ltd. and Electro Rent (Tianjin) Rental Co., Ltd., and our wholly owned subsidiary, ER International, Inc., is the U.S. parent company of Electro Rent Europe, NV.
Use of Estimates: The preparation of financial statements in conformity with accounting principles generally accepted in the United States of America requires us to make estimates and assumptions that affect the reported amounts of assets and liabilities as well as the disclosures of contingent assets and liabilities as of the date of these financial statements and the reported amounts of revenues and expenses during the reporting period. On a regular basis, we review these estimates including those related to asset lives and depreciation methods, impairment of long-lived assets, including rental and lease equipment, goodwill and intangibles, investments, allowance for doubtful accounts, income taxes and contingencies and litigation. These estimates are based on our evaluation of current business and economic conditions, historical experience and on various other assumptions believed to be reasonable under the circumstances. Actual results may differ from these estimates under different assumptions or conditions. We believe, however, that our estimates, including those for the above-listed items, are reasonable.
Revenue Recognition: Rental and lease revenues are recognized in the month they are due on the accrual basis of accounting. Rentals and leases are primarily billed to customers in advance, and unearned billings are recorded as deferred revenue. Sales of new equipment through our resale agreement and used equipment from our rental and lease equipment pool are recognized in the period in which the respective equipment is shipped and risk of loss is passed to the customer. Other revenues, consisting primarily of billings to customers for delivery and repairs are recognized in the period in which the respective services are performed. In the case of equipment that is sold to customers that is already on rent or lease to the same party, revenue is recognized at the agreed-upon date when the rent or lease term ends. Negotiated lease early-termination charges are recognized upon receipt.
F-7
Rental and Lease Equipment and Other Property: Assets are generally stated at cost, less accumulated depreciation. Upon retirement or disposal of assets, the cost and the related accumulated depreciation are eliminated from the accounts and any gain or loss is recognized. We depreciate our buildings over 31.5 years, furniture and other equipment over three to ten years, and leasehold improvements over three to five years. Each is depreciated on a straight-line basis. Depreciation of rental and lease equipment and other property is computed using straight-line and accelerated methods over the estimated useful lives of the respective equipment. Generally, new rental and lease equipment is depreciated over three to ten years, and used equipment over two to nine years, depending on the type of equipment. Depreciation methods and useful lives are periodically reviewed and revised, as deemed appropriate. Normal maintenance and repairs are expensed as incurred. Rental and lease equipment at net book value comprised $192,484 of T&M equipment and $3,148 of DP equipment at May 31, 2011 and $168,400 of T&M equipment and $5,247 of DP equipment at May 31, 2010.
Income Taxes: We recognize a liability or asset for the deferred tax consequences of temporary differences between the tax basis of assets and liabilities and their reported amounts in the financial statements. These temporary differences will result in taxable or deductible amounts in future years when reported amounts of the assets or liabilities are recovered or settled. The deferred tax assets are periodically reviewed for recoverability.
We recognize the tax impact from an uncertain tax position only if it is more likely than not that the tax position will be sustained on examination by the taxing authorities, based on the technical merits of the position. The tax impact recognized in the financial statements from such a position is measured based on the largest benefit that has a greater than 50% likelihood of being realized upon ultimate resolution. We recognize interest, penalties and foreign currency gains and losses with respect to uncertain tax positions as components of our income tax provision. Accrued interest and penalties are included within accrued expenses in the consolidated balance sheet. Significant judgment is required in the identification of uncertain tax positions and in the estimation of penalties and interest on uncertain tax positions. During the second quarter of fiscal 2011 we effectively settled our remaining uncertain tax positions, and derecognized $4,515 of previously recognized uncertain tax positions, and the related deferred tax asset, and $1,396 for interest and penalties previously recognized. (See Note 7 for further discussion.)
Impairment of Assets: The carrying value of equipment held for rental and lease is assessed quarterly or when factors indicating impairment are present. We recognize impairment losses on equipment held for rental and lease when the expected future undiscounted cash flows are less than the asset’s carrying value, in which case the asset is written down to its estimated fair value. There were no such impairment charges during fiscal 2011, 2010 and 2009.
Goodwill and Other Intangible Assets: Goodwill, which represents the excess of purchase price over the fair value of net assets acquired, and other intangible assets, such as customer relationships, non-compete agreements and trade name as a result of our acquisition of Rush Computer Rentals, Inc. in January 2006, and the purchase of certain assets and select post-closing liabilities of Telogy, LLC in March 2010, are discussed further in Note 4. Goodwill is not amortized and is reviewed for impairment on an annual basis or on an interim basis if an event occurs or circumstances change that would reduce the fair value of a reporting unit below its carrying value. The intangible assets, with the exception of the trade name, are amortized over their estimated useful lives and are reviewed for impairment whenever events or changes in circumstances indicate that the carrying value may not be recoverable. Impairment of goodwill and identifiable intangible assets is permanently recognized by writing down the asset to the extent that the carrying value exceeds the estimated fair value. Goodwill and intangibles have not been impaired.
Cash and Cash Equivalents: We consider highly liquid investments with maturities of three months or less at the date of purchase to be cash equivalents. Cash equivalents consist primarily of AAA-rated money market funds in all periods presented.
Investments, Trading: Except for direct obligations of the United States government, securities issued by agencies of the United States government, and money market or cash management funds, we
F-8
diversify our investments by limiting our holdings with any individual issuer. Our investments, trading consisted of auction rate securities (“ARS”) at the end of fiscal 2010. Investments that are designated as trading securities are reported at fair value, with gains or losses resulting from changes in fair value recognized in earnings (see Note 2 for further discussion).
Allowance for Doubtful Accounts: We maintain an allowance for doubtful accounts for estimated losses resulting from the inability of customers to make rental and lease payments. The estimated losses are based on historical collection experience in conjunction with an evaluation of the current status of the existing accounts. If the financial condition of our customers were to deteriorate, then additional allowances could be required that would reduce income. Conversely, if the financial condition of our customers were to improve or if legal remedies to collect past due amounts were more successful than expected, then the allowance for doubtful accounts may need to be reduced and income would be increased.
A roll-forward of the allowance for doubtful accounts is as follows at May 31:
| 2011 | 2010 | 2009 | ||||||||||
|
|
||||||||||||
| Beginning of year |
$ | 536 | $ | 317 | $ | 359 | ||||||
| Provision for doubtful accounts |
500 | 529 | 481 | |||||||||
| Write-offs |
(434 | ) | (310 | ) | (523 | ) | ||||||
|
|
||||||||||||
| End of year |
$ | 602 | $ | 536 | $ | 317 | ||||||
|
|
||||||||||||
Other Assets: We include demonstration equipment used in connection with our resale activity of $3,894 and $1,341 as of May 31, 2011 and 2010, respectively, in other assets for a period up to two years. Demonstration equipment is recorded at the lower of cost or estimated market value until the units are sold or transferred to our rental and lease equipment pool. Demonstration equipment transferred to our rental and lease equipment pool is depreciated over its remaining estimated useful life.
Other assets consisted of the following at May 31:
| 2011 | 2010 | |||||||
|
|
||||||||
| Net investment in sales-type leases |
$ | 7,478 | $ | 6,519 | ||||
| Demonstration equipment |
3,894 | 1,341 | ||||||
| Supplemental executive retirement plan assets |
2,671 | 2,081 | ||||||
| Income taxes receivable |
3,066 | — | ||||||
| Prepaid expenses and other |
2,679 | 1,537 | ||||||
|
|
||||||||
| $ | 19,788 | $ | 11,478 | |||||
|
|
||||||||
Concentration of Credit Risk: Financial instruments that potentially expose us to concentration of credit risk consist primarily of cash equivalents, investments and trade accounts receivable. We invest excess cash primarily in money market funds of major financial institutions, corporate and government bond funds, and ARS. Excess cash of $32,868 and $27,802 as of May 31, 2011 and 2010, respectively, was invested in four large government money market funds. As of May 31, 2010, investments of $14,275, at cost, were in ARS (see Note 2 for further discussion). We believe that we are not exposed to any significant financial risk with respect to cash and cash equivalents. For trade accounts receivable, we sell primarily on 30-day terms, perform credit evaluation procedures on each customer’s individual transactions and require security deposits or personal guarantees from our customers when significant credit risks are identified. Typically, most customers are large, established firms.
We purchase rental and lease equipment from numerous vendors and resale equipment from Agilent. During fiscal 2011, 2010, and 2009, Agilent accounted for approximately 82%, 75% and 59%, respectively, of all new equipment purchases. No other vendor accounted for more than 10% of such purchases.
F-9
Foreign Currency: The U.S. dollar has been determined to be our functional currency. The assets and liabilities of our foreign subsidiaries are remeasured from their foreign currency to U.S. dollars at current or historic exchange rates, as appropriate. Revenues and expenses are remeasured from any foreign currencies to U.S. dollars using historic rates or an average monthly rate, as appropriate, for the month in which the transaction occurred. Remeasurement gains and losses are included in selling, general and administrative expenses or income taxes as appropriate. The assets, liabilities, revenues and expenses of our foreign subsidiaries are individually less than 10% of our respective consolidated amounts. The euro, Canadian dollar and Chinese yuan are our primary foreign currencies.
On occasion, we have entered into forward contracts to hedge against unfavorable fluctuations in our monetary assets and liabilities, primarily in our European and Canadian operations. These contracts are designed to minimize the effect of fluctuations in foreign currencies. Such derivative instruments, not designated as hedging instruments, are recorded at fair value as a current asset or liability, and any changes in fair value are recorded in our consolidated statements of operations.
Effective June 1, 2009, we adopted new accounting guidance intended to improve financial reporting disclosures about derivative instruments and hedging activities. The adoption of this guidance did not have a material effect on our financial condition, results of operations or cash flows. The fair value of our foreign exchange forward contracts recorded in other assets as of May 31, 2011 and 2010 is shown in the table below:
| Derivatives Not Designated as Hedging Instruments |
Consolidated Balance Sheet Location |
May 31, 2011 |
May 31, 2010 |
|||||||
|
|
|
|
|
|
|
|||||
| Foreign exchange forward contracts |
Other | $15 | $176 | |||||||
The table below provides data about the amount of fiscal 2011 and 2010 gains and (losses) recognized in income for derivative instruments not designated as hedging instruments:
| Derivatives Not Designated | Location of (Loss) Gain Recognized | Year ended May 31, | ||||||||
| as Hedging Instruments |
in Income on Derivatives |
2011 | 2010 | |||||||
| Foreign exchange forward contracts |
Selling, general and administrative expenses | $ | (592 | ) | $ | 390 | ||||
Net Income Per Common and Common Equivalent Share: Basic earnings per share (“EPS”) is computed as net income divided by the weighted average number of shares of common stock outstanding for the reported year, excluding the dilutive effects of stock options and other potentially dilutive securities. Diluted EPS is computed as net income divided by the weighted average number of shares outstanding of common stock and common stock equivalents for the reported year. Common stock equivalents result from the dilutive effects of restricted stock and stock options computed using the treasury stock method.
Cash Flow: Supplemental disclosures of cash paid (refunded) during the fiscal year for:
| Year ended May 31, | 2011 | 2010 | 2009 | |||||||||
|
|
||||||||||||
| Interest |
$ | 56 | $ | 21 | $ | 15 | ||||||
| Income taxes |
(2,048 | ) | 10,022 | 1,104 | ||||||||
|
|
||||||||||||
Supplemental Disclosure of Non-Cash Investing and Financing Activities: We had accounts payable and other accruals related to acquired equipment totaling $4,860, $6,167, and $2,098, at May 31, 2011, 2010, and 2009, respectively, which amounts were subsequently paid. During fiscal 2011, we transferred $520 of demonstration equipment, included in other assets, to rental and lease equipment. There were no similar activities in fiscal 2010 or 2009. During fiscal 2009, we (i) transferred $20,909 from
F-10
investments available-for-sale to investments, trading; (ii) increased shareholders’ equity by $176, net of tax expense of $116, as a result of unrealized gains on investments available-for-sale; and (iii) recorded $3,593 of dividends declared and not yet paid as accrued expenses and a reduction of retained earnings. There were no similar activities in fiscal 2011 or 2010.
Stock-Based Compensation: Share-based payments to employees, including grants of employee stock options, are recognized in the consolidated financial statements as compensation expense over the period that an employee provides service in exchange for the award based on its fair value. Compensation expense resulting from restricted stock and restricted stock units is measured at fair value on the date of grant and is recognized in selling, general and administrative expenses over the vesting period (see Note 13 for further discussion).
Fair Value Measurements: As of May 31, 2011 and 2010 we held certain assets and liabilities that are required to be measured at fair value on a recurring basis. These included cash equivalents, trading securities, put option and foreign currency derivatives. The fair value of the trading securities and put option were determined by the use of pricing models (see Note 3 for further discussion).
Recent Accounting Pronouncements: In October 2009, the Financial Accounting Standards Board (“FASB”) amended revenue recognition guidance for arrangements with multiple deliverables. The guidance eliminates the residual method of revenue recognition and allows the use of management’s best estimate of the selling price for individual elements of an arrangement when vendor specific objective evidence or third-party evidence is unavailable. This guidance will be effective in fiscal years beginning on or after June 15, 2010. We will be required to adopt this guidance beginning with our first quarter of fiscal 2012. We do not anticipate that the adoption of this guidance will have a material impact on our financial condition, results of operations or cash flows.
In July 2010, the FASB issued an update regarding disclosures about the credit quality of financing receivables and the allowance for credit losses. This update amends previous guidance and the main objective is to provide greater transparency about an entity’s allowance for credit losses and the credit quality of its financing receivables. Disclosures required under this update will discuss the nature of the credit risk inherent in the entity’s portfolio of financing receivables, how that risk is analyzed and assessed in arriving at the allowance for credit losses and the changes and reasons for those changes in the allowance for credit losses. The amendments that require disclosures as of the end of a reporting period are effective for public entities for interim and annual reporting periods ending on or after December 15, 2010. The amendments that require disclosures about activity that occurs during a reporting period are effective for interim and annual reporting periods beginning on or after December 15, 2010. We adopted this guidance beginning in our fourth quarter of fiscal 2011 and we have revised our disclosure accordingly.
In December 2010, the FASB issued an update to its existing guidance for goodwill and other intangible assets. This guidance modifies Step 1 of the goodwill impairment test for reporting units with zero or negative carrying amounts. For those reporting units, an entity is required to perform Step 2 of the goodwill impairment test if there are qualitative factors indicating that it is more likely than not that a goodwill impairment exists. The qualitative factors are consistent with the existing guidance which requires goodwill of a reporting unit to be tested for impairment between annual tests if an event occurs or circumstances change that would more likely than not reduce the fair value of a reporting unit below its carrying amount. This guidance is effective for fiscal years, and interim periods within those years, beginning after December 15, 2011. We will be required to adopt this guidance beginning with our fourth quarter of fiscal 2012. We do not anticipate that the adoption of this guidance will have a material impact on our financial condition, results of operations or cash flows.
In December 2010, the FASB issued an update to its existing guidance on business combinations. This guidance requires a public entity that presents comparative financial statements to present in its pro forma disclosure the revenue and earnings of the combined entity as though the business combinations that occurred during the current year had occurred as of the beginning of the prior annual reporting period. In addition, this guidance expands the supplemental pro forma disclosures to include a
F-11
description of the nature and amount of material, nonrecurring pro forma adjustments directly attributable to the business combination included in the reported pro forma revenue and earnings. This guidance is effective for the first annual reporting period beginning on or after December 15, 2010. We will be required to adopt this guidance beginning with our first quarter of fiscal 2012. We do not anticipate that the adoption of this guidance will have a material impact on our financial condition, results of operations or cash flows.
In May 2011, the FASB issued guidance to provide a consistent definition of fair value and ensure that the fair value measurement and disclosure requirements are similar between U.S. generally accepted accounting principles and international financial reporting standards. The guidance also changes certain fair value measurement principles and enhances the disclosure requirements particularly for Level 3 fair value measurements. This guidance is effective for reporting periods beginning on or after December 15, 2011, with early adoption prohibited. We will be required to adopt this guidance beginning with our fourth quarter of fiscal 2012. We do not anticipate that the adoption of this guidance will have a material impact on our financial condition, results of operations or cash flows.
In June 2011, the FASB issued guidance on presentation of comprehensive income. The new guidance eliminates the current option to report other comprehensive income and its components in the statement of changes in equity. Instead, an entity will be required to present either a continuous statement of net income and other comprehensive income or in two separate but consecutive statements. This guidance is effective for fiscal years, and interim periods within those years, beginning after December 15, 2011. Early adoption of the new guidance is permitted and full retrospective application is required. We will be required to adopt this guidance beginning with our first quarter of fiscal 2013. We do not anticipate that the adoption of this guidance will have a material impact on our financial condition, results of operations or cash flows.
Note 2: Investments
Investments, trading at May 31, 2010 consisted of ARS, and were carried at fair value. Except for direct obligations of the United States government, securities issued by agencies of the United States government, and money market or cash management funds, we diversify our investments by limiting our holdings with any individual issuer.
When made, our investments are intended to establish a high-quality portfolio that preserves principal, meets liquidity needs, avoids inappropriate concentrations and delivers an appropriate yield in relationship to our investment guidelines and market conditions.
At May 31, 2011 and 2010, we held $0 and $14,275, at cost, of ARS. During the first quarter of fiscal 2011 we sold all of our remaining ARS to UBS AG (“UBS”) at par plus accrued interest, for $14,275 in cash when we exercised our put right (the “Put Option”) under a November 2008 settlement agreement (“Agreement”) with UBS. Our ARS were long-term debt instruments backed by student loans, a substantial portion of which was guaranteed by the United States government. Prior to their sale, we valued the ARS from quotes received from our broker, UBS, which were derived from UBS’s internally developed model. In determining a discount factor for each ARS, the model weighted various factors, including assessments of credit quality, duration, insurance wraps, portfolio composition, discount rates, overall capital market liquidity and comparable securities, if any. In accordance with accounting guidance, which permits an entity to elect the fair value option for financial assets and liabilities, we elected to measure the Put Option at fair value in order to match the changes in the fair value of the ARS. The fair value of the trading securities and Put Option were determined by pricing models (see Note 3 for further discussion).
Note 3: Fair Value Measurements
We measure certain financial assets and liabilities at fair value on a recurring basis, including cash equivalents, trading securities, Put Option and foreign currency derivatives. The fair value of these
F-12
financial assets and liabilities was determined based on three levels of inputs, of which the first two are considered observable and the last unobservable, that may be used to measure fair value, as follows:
Level 1 – Observable inputs, such as quoted prices in active markets for identical assets or liabilities;
Level 2 – Inputs, other than the quoted prices in active markets, that are observable either directly or through corroboration with observable market data; and
Level 3 – Unobservable inputs, for which there is little or no market data for the assets or liabilities, such as internally-developed valuation models.
Assets and liabilities measured at fair value on a recurring basis are as follows:
| At May 31, 2011 | ||||||||||||||||
|
|
||||||||||||||||
| Quoted Prices in Active Markets for Identical Instruments (Level 1) |
Significant Other Observable Inputs (Level 2) |
Significant Unobservable Inputs (Level 3) |
Total Balance |
|||||||||||||
|
|
||||||||||||||||
| Assets |
||||||||||||||||
| Money market funds |
$32,868 | $ | — | $ — | $ | 32,868 | ||||||||||
| Supplemental executive retirement plan |
2,671 | — | — | 2,671 | ||||||||||||
| Foreign exchange forward contracts |
— | 15 | — | 15 | ||||||||||||
|
|
||||||||||||||||
| Total assets measured at fair value |
$35,539 | $ | 15 | $ — | $ | 35,554 | ||||||||||
|
|
||||||||||||||||
| Liabilities |
||||||||||||||||
| Supplemental executive retirement plan |
$ 2,671 | $ | — | $ — | $ | 2,671 | ||||||||||
|
|
||||||||||||||||
| Total liabilities measured at fair value |
$ 2,671 | $ | — | $ — | $ | 2,671 | ||||||||||
|
|
||||||||||||||||
| At May 31, 2010 | ||||||||||||||||
|
|
||||||||||||||||
| Quoted Prices in Active Identical Instruments (Level 1) |
Significant Other Observable Inputs (Level 2) |
Significant Unobservable Inputs (Level 3) |
Total Balance |
|||||||||||||
|
|
||||||||||||||||
| Assets |
||||||||||||||||
| Money market funds |
$27,802 | $ | — | $ — | $ | 27,802 | ||||||||||
| Auction rate securities |
— | — | 13,323 | 13,323 | ||||||||||||
| Put option |
— | — | 952 | 952 | ||||||||||||
| Supplemental executive retirement plan |
2,081 | — | — | 2,081 | ||||||||||||
| Foreign exchange forward contracts |
— | 176 | — | 176 | ||||||||||||
|
|
||||||||||||||||
| Total assets measured at fair value |
$29,883 | $ | 176 | $14,275 | $ | 44,334 | ||||||||||
|
|
||||||||||||||||
| Liabilities |
||||||||||||||||
| Supplemental executive retirement plan |
$ 2,081 | $ | — | $ — | $ | 2,081 | ||||||||||
|
|
||||||||||||||||
| Total liabilities measured at fair value |
$ 2,081 | $ | — | $ — | $ | 2,081 | ||||||||||
|
|
||||||||||||||||
The fair value measures for our money market funds and supplemental executive retirement plan asset and liability were derived from quoted market prices in active markets and are included in Level 1 inputs. Foreign currency forward contracts were valued based on observable market spot and forward rates as of
F-13
our reporting date and are included in Level 2 inputs. We valued our ARS from quotes received from UBS that were derived from UBS’s internally developed model. In determining a discount factor for each ARS, the model weighted various factors, including assessments of credit quality, duration, insurance wraps, portfolio composition, discount rates, overall capital market liquidity and comparable securities, if any. The Put Option was a free standing asset separate from the ARS, and represented our contractual right to require UBS to purchase our ARS at par value during the period from June 30, 2010 through July 2, 2012. In order to value the Put Option, we considered the intrinsic value, time value of money and our assessment of the credit worthiness of UBS. Our ARS and Put Option are included in Level 3 inputs.
The following table presents a reconciliation of all assets and liabilities measured at fair value on a recurring basis, excluding accrued interest components, using significant unobservable inputs (Level 3) for fiscal 2011 and 2010:
| May 31, | ||||||||||||||||
| 2011 | 2010 | |||||||||||||||
|
|
||||||||||||||||
| Put Option | Auction Rate Securities |
Put Option | Auction Rate Securities |
|||||||||||||
|
|
||||||||||||||||
| Fair value at beginning of period |
$ | 952 | $ | 13,323 | $ | 1,623 | $ | 19,977 | ||||||||
| Settlements (at par) |
— | (14,275 | ) | — | (7,325 | ) | ||||||||||
| Unrealized gains (losses) included in interest income, net |
(671 | ) | 671 | |||||||||||||
| Realized gains (losses) included in interest income, net |
(952 | ) | 952 | |||||||||||||
|
|
||||||||||||||||
| Fair value at end of period |
$ | — | $ | — | $ | 952 | $ | 13,323 | ||||||||
|
|
||||||||||||||||
We included in earnings an unrealized gain of $89 for fiscal 2010, attributable to the remaining ARS we held on that date, and an unrealized loss of $89, attributable to our Put Option on those securities. We sold all of our remaining ARS to UBS pursuant to the Put Option at par plus accrued interest and included in earnings a realized gain of $952 attributable to the sale and a realized loss of $952 attributable to the Put Option for fiscal 2011.
Note 4: Acquisition
On March 31, 2010, pursuant to an asset purchase agreement, we completed the purchase of certain assets and the assumption of specified post-closing liabilities of Telogy, LLC (“Telogy”), for cash consideration of $24,653. We acquired Telogy in order to facilitate growth in our T&M business. Telogy, headquartered in Union City, California, was a leading provider of electronic T&M equipment. Telogy had previously filed a voluntary petition for relief under Chapter 11 of the Bankruptcy Code in the United States Bankruptcy Court for the District of Delaware, and we were the winning bidder in a Bankruptcy Court auction of Telogy’s assets. The purchase price, which was subject to post closing adjustments, was allocated to the assets acquired and liabilities assumed based upon our estimate of their respective fair values. Because the estimated fair value of the net assets acquired exceeded the acquisition cost, we recorded a bargain purchase gain with respect to this transaction. The bargain purchase reflects the recurring losses incurred by Telogy and liquidity constraints due to the difficult global economy and the recent bankruptcy filing.
F-14
The following table provides estimated fair values of the assets acquired and liabilities assumed as of the date of acquisition.
| Total cash consideration |
$ | 24,653 | ||
|
|
|
|||
| Preliminary purchase price allocation: |
||||
| Accounts receivable |
2,723 | |||
| Rental and lease equipment |
22,922 | |||
| Customer relationships acquired |
940 | |||
| Other |
34 | |||
| Accrued expenses |
(189 | ) | ||
| Deferred tax liability |
(481 | ) | ||
| Deferred revenue |
(617 | ) | ||
|
|
|
|||
| Net assets acquired |
25,332 | |||
|
|
|
|||
| Bargain purchase gain, net of estimated taxes of $481 |
$ | (679 | ) | |
|
|
|
|||
During fiscal 2011 we increased the bargain purchase gain by $342 ($202, net of tax), consisting of (i) $260 representing the final determination of assets acquired and other components of the purchase price in accordance with specific provisions of the APA, and (ii) $82 resulting from a change in the fair value of certain assets and liabilities acquired from Telogy.
The bargain purchase gain is included as a separate component of operating expenses.
The fair value of assets acquired included gross accounts receivable of $3,153, of which an estimated $430 was not expected to be collected, resulting in a fair value of $2,723. Intangible assets consist of customer relationships and have a useful life of 8 years.
Acquisition-related transaction costs of $180 are accounted for as expenses in the periods in which the costs are incurred and are included in our selling, general and administrative expenses for fiscal 2010.
The purchase of Telogy was an asset purchase, and Telogy’s operations were integrated with ours immediately after the closing date. Revenues and income before income taxes of $1,740 and $425, respectively, from the acquired customers were included in our consolidated statements of operations for the fiscal year ended May 31, 2010.
The following pro forma results of operations for the fiscal years ended May 31, 2010 and 2009 assume the acquisition of Telogy occurred as of the beginning of those periods. The pro forma results have been prepared for comparative purposes only and do not purport to indicate the results of operations that would actually have occurred had the acquisition occurred on the dates indicated, nor are these results necessarily indicative of future consolidated results of operations. We have included the operating results of Telogy in our consolidated financial statements since March 31, 2010.
| Year ended May 31, | 2010 | 2009 | ||||||
|
|
||||||||
| Revenues |
$ | 161,518 | $ | 154,169 | ||||
| Net income |
$ | 9,453 | $ | 7,109 | ||||
| Earnings per share: |
||||||||
| Basic |
$ | 0.40 | $ | 0.29 | ||||
| Diluted |
$ | 0.39 | $ | 0.28 | ||||
Note 5: Goodwill and Other Intangible Assets
Goodwill represents the excess of the purchase price over the fair value of the net tangible and identifiable intangible assets acquired in a business combination. Intangible assets resulting from the acquisitions of entities accounted for using the purchase method of accounting are recorded at the
F-15
estimated fair value of the assets acquired. Identifiable intangible assets comprise purchased customer relationships, and trade names, and non-compete agreements.
Our goodwill and intangibles at May 31, 2011 were the result of the acquisitions of Telogy on March 31, 2010 and of Rush Computer Rentals on January 31, 2006.
The changes in carrying amount of goodwill and other intangible assets for fiscal 2011 and 2010 were as follows:
| Balance as of June 1, 2010 (net of amortization) |
Additions | Amortization | Balance as of May 31, 2011 |
|||||||||||||
|
|
||||||||||||||||
| Goodwill |
$ | 3,109 | $ | — | $ | — | $ | 3,109 | ||||||||
| Trade name |
411 | — | — | 411 | ||||||||||||
| Non-compete agreements |
66 | — | (66 | ) | — | |||||||||||
| Customer relationships |
921 | — | (118 | ) | 803 | |||||||||||
|
|
||||||||||||||||
| $ | 4,507 | $ | $ | (184 | ) | $ | 4,323 | |||||||||
|
|
||||||||||||||||
| Balance as of June 1, 2009 (net of amortization) |
Additions | Amortization | Balance as of May 31, 2010 |
|||||||||||||
|
|
||||||||||||||||
| Goodwill |
$ | 3,109 | $ | — | $ | — | $ | 3,109 | ||||||||
| Trade name |
411 | — | — | 411 | ||||||||||||
| Non-compete agreements |
166 | — | (100 | ) | 66 | |||||||||||
| Customer relationships |
157 | 940 | (176 | ) | 921 | |||||||||||
|
|
||||||||||||||||
| $ | 3,843 | $ | 940 | $ | (276 | ) | $ | 4,507 | ||||||||
|
|
||||||||||||||||
Goodwill is not deductible for tax purposes.
There were no conditions that indicated any impairment of goodwill or identifiable intangible assets in fiscal 2011, 2010 and 2009. The annual impairment review date for goodwill is May 31.
Intangible assets with finite useful lives are amortized over their respective estimated useful lives. The following table provides a summary of our intangible assets:
| May 31, 2011 | ||||||||||||||||
|
|
||||||||||||||||
| Estimated Useful Life |
Gross Carrying Amount |
Accumulated Amortization |
Net Carrying Amount |
|||||||||||||
|
|
||||||||||||||||
| Trade name |
— | $ | 411 | $ | — | $ | 411 | |||||||||
| Non-compete agreements |
2-5 years | 1,050 | (1,050 | ) | — | |||||||||||
| Customer relationships |
3-8 years | 1,954 | (1,151 | ) | 803 | |||||||||||
|
|
||||||||||||||||
| $ | 3,415 | $ | (2,201 | ) | $ | 1,214 | ||||||||||
|
|
||||||||||||||||
F-16
| May 31, 2010 | ||||||||||||||||
|
|
||||||||||||||||
| Estimated Useful Life |
Gross Carrying Amount |
Accumulated Amortization |
Net Carrying Amount |
|||||||||||||
|
|
||||||||||||||||
| Trade name |
— | $ | 411 | $ | — | $ | 411 | |||||||||
| Non-compete agreements |
2-5 years | 1,050 | (984 | ) | 66 | |||||||||||
| Customer relationships |
3-8 years | 1,954 | (1,033 | ) | 921 | |||||||||||
|
|
||||||||||||||||
| $ | 3,415 | $ | (2,017 | ) | $ | 1,398 | ||||||||||
|
|
||||||||||||||||
Amortization expense was $184, $276, and $335 for fiscal 2011, 2010, and 2009, respectively.
Amortization expense for customer relationships and non-compete agreements is included in selling, general and administrative expenses. The following table provides estimated future amortization expense related to intangible assets:
| Year ending May 31, | Future Amortization |
|||
|
|
||||
| 2012 |
$ | 118 | ||
| 2013 |
118 | |||
| 2014 |
118 | |||
| 2015 |
118 | |||
| 2016 |
118 | |||
| Thereafter |
213 | |||
|
|
||||
| $ | 803 | |||
|
|
||||
Note 6: Borrowings
For many years, we have had a standby revolving line of credit for $10,000 with a bank. The line of credit is subject to annual renewals and is subject to certain restrictions. The interest rate on the line of credit is based on the prime rate or LIBOR plus 1.25%. We had no borrowings outstanding during fiscal 2011, 2010 or 2009. At May 31, 2011, we are in compliance with the financial covenants contained in the revolving line of credit agreement and expect to continue to be in compliance with them.
Note 7: Income Taxes
On June 1, 2007, we adopted new accounting guidance which establishes a single model to address the accounting for uncertain tax positions. Specifically, it prescribes a recognition threshold that a tax position is required to meet before being recognized in the financial statements and provides guidance on derecognition, measurement, classification, interest and penalties, accounting in interim periods, disclosure and transition issues.
We applied this guidance to all open tax positions as of June 1, 2007. The total amount of unrecognized tax benefits as of the date of its adoption was $4,260. As a result of the implementation of this guidance, we recognized a $3,894 increase in the liability for unrecognized tax benefits with a corresponding increase in deferred tax assets, and $366 as a reduction to retained earnings.
During the second quarter of fiscal 2011 we effectively settled our remaining uncertain tax positions. The derecognition of $4,515 of previously recognized uncertain tax positions, and the related deferred tax asset, had no impact on our effective tax rate. However, the derecognition of $1,396 for interest and penalties previously recognized reduced our tax provision by a corresponding amount for fiscal 2011. This derecognition reduced our effective tax rate from 40.0% to 36.3% for fiscal 2011.
We recognize interest and penalties accrued with respect to uncertain tax positions as components of our income tax provision. We had accrued approximately $349 for the payment of interest and penalties as
F-17
of May 31, 2007. Upon adoption on June 1, 2007, we increased our accrual for interest and penalties to $1,141. At May 31, 2011 and 2010, our accrual for interest and penalties was $0 and $2,389.
The reconciliation of our unrecognized tax benefits is as follows for the fiscal years ended May 31:
| 2011 | 2010 | 2009 | ||||||||||
|
|
||||||||||||
| Balance as of June 1 |
$ | 4,691 | $ | 3,943 | $ | 3,693 | ||||||
| Increase/(decrease) related to prior year tax positions |
(4,691 | ) | 748 | 250 | ||||||||
|
|
||||||||||||
| Balance as of May 31 |
$ | — | $ | 4,691 | $ | 3,943 | ||||||
|
|
||||||||||||
|
We are subject to taxation in the U.S., as well as various states and foreign jurisdictions. We have substantially settled all income tax matters for the United States federal jurisdiction for years through fiscal 2009. Major state jurisdictions have been examined through fiscal years 2004 and 2005, and foreign jurisdictions have not been examined for their respective maximum statutory periods.
There were no additional unrecognized tax benefits in fiscal 2011.
For financial reporting purposes, income before income taxes comprised the following as of May 31:
|
| |||||||||||
| 2011 | 2010 | 2009 | ||||||||||
|
|
||||||||||||
| Domestic |
$ | 36,817 | $ | 20,184 | $ | 19,182 | ||||||
| Foreign |
472 | (152 | ) | (280 | ) | |||||||
|
|
||||||||||||
| $ | 37,289 | $ | 20,032 | $ | 18,902 | |||||||
|
|
||||||||||||
| The provision for income taxes consisted of the following for the fiscal years ended May 31: | ||||||||||||
| 2011 | 2010 | 2009 | ||||||||||
|
|
||||||||||||
| Current |
||||||||||||
| Federal |
$ | (5,583 | ) | $ | 8,117 | $ | 751 | |||||
| State |
2,028 | 1,698 | 968 | |||||||||
| Foreign |
(521 | ) | 1,427 | 639 | ||||||||
| Deferred |
||||||||||||
| Federal |
17,083 | (2,476 | ) | 4,131 | ||||||||
| State |
540 | (330 | ) | 226 | ||||||||
| Foreign |
(14 | ) | (1 | ) | 435 | |||||||
|
|
||||||||||||
| $ | 13,533 | $ | 8,435 | $ | 7,150 | |||||||
|
|
||||||||||||
| The following reconciles the statutory federal income tax rate to the effective tax rate for the fiscal years ended May 31: | ||||||||||||
| 2011 | 2010 | 2009 | ||||||||||
|
|
||||||||||||
| Statutory federal rate |
35.0 | % | 35.0 | % | 35.0 | % | ||||||
| State taxes, net of federal benefit |
4.5 | 4.6 | 4.2 | |||||||||
| Changes in reserves due to changes in tax estimates |
— | 1.4 | (1.7 | ) | ||||||||
| Derecognition of uncertain tax positions |
(3.4 | ) | — | — | ||||||||
| Permanent differences resulting from tax advantaged investments |
— | — | (1.2 | ) | ||||||||
| Permanent differences resulting from valuation allowances |
0.3 | 1.1 | 1.4 | |||||||||
| Other |
(0.1 | ) | — | 0.1 | ||||||||
|
|
||||||||||||
| Effective tax rate |
36.3 | % | 42.1 | % | 37.8 | % | ||||||
|
|
||||||||||||
Our effective tax rate in fiscal 2011, 2010 and 2009 was 36.3%, 42.1% and 37.8%, respectively. The lower effective rate in fiscal 2011 was due to our effective settlement of our remaining uncertain tax positions and the resulting derecognition of $1,396 for interest and penalties previously recognized in our income tax provision. The lower effective rate for fiscal 2009 was due to a release of reserves as a result
F-18
of changes in estimated tax exposures, partially offset by a valuation allowance relating to certain deferred tax assets of our foreign operations. The change in estimated tax exposures reduced tax expense by $324 in fiscal 2009. Tax advantaged investments reduced expense by $2, $52 and $237 for fiscal 2011, 2010 and 2009, respectively.
The tax effects of temporary differences that gave rise to significant portions of the net deferred tax liabilities consisted of the following at May 31:
| 2011 | 2009 | |||||||
|
|
||||||||
| Deferred tax assets: |
||||||||
| Goodwill and intangible assets |
$ | 1,194 | $ | 2,099 | ||||
| Allowance for doubtful accounts |
238 | 213 | ||||||
| Deferred compensation and benefits |
1,734 | 1,482 | ||||||
| Tax credits |
— | 4,691 | ||||||
| Net operating losses |
1,364 | 398 | ||||||
| Other |
1,400 | 1,903 | ||||||
| Valuation allowance |
(593 | ) | (468 | ) | ||||
|
|
||||||||
| 5,337 | 10,318 | |||||||
| Deferred tax liabilities: |
||||||||
| Accumulated depreciation |
(45,800 | ) | (27,423 | ) | ||||
| Other |
(541 | ) | (445 | ) | ||||
|
|
||||||||
| Net deferred tax liabilities |
$ | (41,004 | ) | $ | (17,550 | ) | ||
|
|
||||||||
We determined that a valuation allowance was required in fiscal 2011 and 2010 of $593 and $468, respectively, for our deferred tax asset related to certain foreign net operating loss carry forwards and other related timing differences, which, if unused, will expire between fiscal 2014 and 2016. As of May 31, 2011, 2010 and 2009, U.S. income taxes had not been assessed on approximately $1,425, $853 and $1,093, respectively, of undistributed earnings of foreign subsidiaries because we consider these earnings to be invested indefinitely.
Our deferred tax assets include a federal net operating loss carryforward of $800, which, if unused, will expire in 2031.
Note 8: Sales-type Leases
We had certain customer leases providing bargain purchase options, which are accounted for as sales-type leases. Interest income is recognized over the life of the lease using the effective interest method.
The initial acceptance of customer finance arrangements is based on an in-depth review of each customer’s credit profile, including review of third party credit reports, customer financial statements and bank verifications. We monitor the credit quality of our sales-type lease portfolio based on payment activity that drives the finance lease receivable aging. This credit quality is assessed on a monthly basis. There were no balances due for sales-type receivables beyond 90 days as of May 31, 2011. Our historical losses on finance lease receivables are insignificant, and therefore we do not have a specific allowance for credit losses.
The minimum lease payments receivable and the net investment included in other assets were as follows at May 31:
| 2011 | 2010 | |||||||
|
|
||||||||
| Gross minimum lease payments receivable |
$ | 7,834 | $ | 6,874 | ||||
| Less – unearned interest |
(356 | ) | (355 | ) | ||||
|
|
||||||||
| Net investment in sales-type lease receivables |
$ | 7,478 | $ | 6,519 | ||||
|
|
||||||||
F-19
The following table provides estimated future minimum lease payments by year related to sales-type leases:
| Year ending May 31, | Future Amortization |
|||
|
|
||||
| 2012 |
$4,745 | |||
| 2013 |
2,539 | |||
| 2014 |
545 | |||
| 2015 |
5 | |||
|
|
||||
| $7,834 | ||||
|
|
||||
Note 9: Computation of Earnings Per Share
The following is a reconciliation of the denominator used in the computation of basic and diluted EPS for the fiscal years ended May 31:
| 2011 | 2010 | 2009 | ||||||||||
|
|
||||||||||||
| Denominator: |
||||||||||||
| Denominator for basic earnings per share – weighted average common shares outstanding |
23,974 | 23,932 | 24,899 | |||||||||
| Effect of dilutive options and restricted stock |
98 | 72 | 81 | |||||||||
|
|
||||||||||||
| Diluted shares used in per share calculation |
24,072 | 24,004 | 24,980 | |||||||||
|
|
||||||||||||
| Net income |
$ | 23,756 | $ | 11,597 | $ | 11,752 | ||||||
| Earnings per share: |
||||||||||||
| Basic |
$ | 0.99 | $ | 0.48 | $ | 0.47 | ||||||
| Diluted |
$ | 0.99 | $ | 0.48 | $ | 0.47 | ||||||
|
|
||||||||||||
Certain options to purchase our common stock were not included in the computation of diluted earnings per share because to do so would have been antidilutive. The quantity of such options is 36, 54 and 72 for fiscal 2011, 2010 and 2009, respectively.
Note 10: Rentals Under Noncancellable Operating Leases
We rent equipment on a short-term basis and lease equipment for periods greater than 12 months. Such leases provide the lessee with the option of renewing the agreement for periods of up to 12 months or purchasing the equipment at fair market value at the end of the initial or renewal term. Our cost of equipment under operating leases at May 31, 2011, with remaining noncancellable lease terms of more than one year, was $7,582, before accumulated depreciation of $3,120, and the net book value was $4,462.
The following sets forth a schedule of minimum future rentals to be received on noncancellable operating leases with remaining lease terms of more than one year as of May 31, 2011:
| 2012 |
$ | 2,632 | ||
| 2013 |
1,708 | |||
| 2014 |
536 | |||
| 2015 and thereafter |
109 | |||
|
|
||||
| $ | 4,985 | |||
|
|
||||
F-20
Note 11: Other Property
Other property, at cost, consisted of the following at May 31:
| 2011 | 2010 | |||||||
|
|
||||||||
| Land |
$ | 6,985 | $ | 6,985 | ||||
| Buildings |
14,917 | 14,451 | ||||||
| Furniture and other equipment |
8,831 | 8,067 | ||||||
| Leasehold improvements |
219 | 137 | ||||||
|
|
||||||||
| 30,952 | 29,640 | |||||||
| Less – accumulated depreciation and amortization |
(16,825 | ) | (16,055 | ) | ||||
|
|
||||||||
| $ | 14,127 | $ | 13,585 | |||||
|
|
||||||||
Depreciation expense was $1,020, $878, and $835 for fiscal 2011, 2010 and 2009, respectively. Depreciation expense is included in selling, general and administrative expenses.
Note 12: Commitments and Contingencies
We lease certain facilities under various operating leases. Most of the lease agreements provide us with the option of renewing our leases at the end of the initial lease term, at the fair rental value, for periods of up to five years. In most cases, we expect that in the normal course of business facility leases will be renewed or replaced by other leases.
Minimum payments over the next five years under these leases as of May 31, 2011, exclusive of property taxes and insurance, were as follows:
| 2012 |
$ | 797 | ||
| 2013 |
334 | |||
| 2014 |
191 | |||
| 2015 |
147 | |||
| 2016 |
149 | |||
|
|
||||
| $ | 1,618 | |||
|
|
||||
Rent expense was $1,057, $1,135, and $1,109 for fiscal 2011, 2010 and 2009, respectively. Rent expense is included in selling, general and administrative expenses.
We purchase substantial amounts of rental equipment from numerous vendors. As a result, we have occasionally been included as a member of the plaintiff class in class action lawsuits related to product warranties or price adjustments. Settlements of such claims can result in distributions of cash or product coupons that can be redeemed, sold or used to purchase new equipment. We recognize any benefits from such settlements when all contingencies have expired to the extent either cash has been received and/or realization of value from any coupon is assured.
We are subject to legal proceedings and business disputes involving ordinary and routine claims. The ultimate legal and financial liability with respect to such matters cannot be estimated with certainty and requires the use of estimates in recording liabilities for potential litigation settlements. Estimates for losses from litigation are made after consultation with outside counsel. If estimates of potential losses increase or the related facts and circumstances change in the future, we may be required to record either more or less litigation expense. We are not involved in any pending or threatened legal proceedings that we believe could reasonably be expected to have a material adverse effect on our financial condition, results of operations, or cash flows at May 31, 2011.
F-21
Note 13: Stock Option Plans and Equity Incentive Plan
Our 2005 Equity Incentive Plan (the “Equity Incentive Plan”) authorizes our Board of Directors to grant incentive and non-statutory stock options, stock appreciation rights, restricted stock awards, restricted stock units, performance unit awards and performance share awards covering a maximum of 1,000 shares of our common stock. The Equity Incentive Plan replaced our prior stock option plans, under which there are no outstanding options. Pursuant to the Equity Incentive Plan, we have granted incentive and non-statutory options to directors, officers and key employees at prices not less than 100% of the fair market value on the day of grant. In addition, we have granted restricted stock and restricted stock units to directors, officers and key employees. The Equity Incentive Plan provides for a variety of vesting dates with the majority of the outstanding grants vesting at a rate of one-third per year over a period of three years from the date of grant. All outstanding options expire in October 2011.
The following table summarizes certain information relative to options for common stock:
| Shares | Weighted Average Exercise Price |
Weighted Average Remaining Contractual Term (in years) |
Aggregate Intrinsic Value |
|||||||||||||
|
|
||||||||||||||||
| Outstanding at May 31, 2010 |
57 | $ | 15.46 | |||||||||||||
| Granted |
— | — | ||||||||||||||
| Exercised |
(17 | ) | 11.92 | |||||||||||||
| Forfeited/cancelled |
(4 | ) | 10.20 | |||||||||||||
|
|
||||||||||||||||
| Outstanding at May 31, 2011, all vested and exercisable |
36 | $ | 17.69 | 0.4 | $ | — | ||||||||||
|
|
||||||||||||||||
There were no stock options granted during fiscal 2011, 2010 and 2009. The total fair value of shares vested during fiscal 2011, 2010 and 2009 was $0, $54 and $99, respectively. The aggregate intrinsic value is calculated as the difference between the exercise price of the underlying awards and the quoted price of our common stock. The aggregate intrinsic value of options exercised during fiscal 2011, 2010 and 2009 was $13, $180 and $383, respectively. Shares of newly issued common stock will be issued upon exercise of stock options.
Restricted Stock
We have issued restricted shares of common stock to members of our board of directors pursuant to our Equity Incentive Plan. We granted 7 shares of restricted stock to Board members during fiscal 2009. There were no grants in fiscal 2011 and 2010. At May 31, 2011, there was no unrecognized share-based compensation cost related to restricted stock.
F-22
Restricted Stock Units
Restricted stock units represent the right to receive one share of our common stock provided that the vesting conditions are satisfied. The following table represents restricted stock unit activity for the fiscal year ended May 31, 2011:
| Restricted Stock |
Weighted – Average Grant Date Fair Value |
|||||||
|
|
|
|
|
|||||
| Nonvested at June 1, 2010 |
150 | $ | 10.14 | |||||
| Granted |
107 | 12.58 | ||||||
| Vested |
(51 | ) | 10.20 | |||||
| Forfeited/canceled |
(2 | ) | 13.73 | |||||
|
|
|
|
|
|||||
| Nonvested at May 31, 2011 |
204 | $ | 11.36 | |||||
|
|
|
|
|
|||||
| Expected to vest at May 31, 2011 |
204 | $ | 11.36 | |||||
|
|
|
|
|
|||||
We granted 107 and 166 restricted stock units during fiscal 2011 and 2010, respectively. No restricted stock units were granted during fiscal 2009. As of May 31, 2011, we have unrecognized share-based compensation cost of approximately $1,469 associated with restricted stock units. This cost is expected to be recognized over a weighted-average period of approximately 1.7 years.
The total fair value of shares that vested during fiscal 2011 was $523, which was calculated based on the closing price of our common stock on the Nasdaq Stock Market on the applicable date of vesting.
Accounting for Share Based Payments
Accounting guidance requires all share-based payments to employees, including grants of employee stock options, restricted stock and restricted stock units, to be recognized as compensation expense in the consolidated financial statements based on their fair values. Compensation expense is recognized over the period that an employee provides service in exchange for the award.
We use the Black-Scholes option pricing model to calculate the fair value of any option grant. Our computation of expected volatility is based on historical volatility. Our computation of expected term is determined based on historical experience of similar awards, giving consideration to the contractual terms of the stock-based awards, vesting schedules and expectations of future employee behavior. The expected term represents the period that our option awards are expected to be outstanding and was determined based on historical experience of similar awards. The risk-free interest rate is based on U.S. Treasury zero-coupon issues with a term equal to the expected term of the option at the date of grant. Forfeitures are estimated at the date of grant based on historical experience. We use the market price of our common stock on the date of grant to calculate the fair value of each grant of restricted stock and restricted stock units.
We recorded $956, $610 and $158 of stock-based compensation as part of selling, general and administrative expenses for fiscal 2011, 2010, and 2009, respectively.
We receive a tax deduction for certain stock option exercises during the period the options are exercised, generally for the excess of the fair value of our common stock at the date of exercise over the exercise price of the options. Excess tax benefits are realized tax benefits from tax deductions for exercised options in excess of the deferred tax asset attributable to stock compensation costs for such options. The total tax benefit realized from stock option exercises for fiscal 2011, 2010, and 2009 was $37, $62, and $49, respectively. Cash received from stock option exercises was $197, $454, and $1,327 for fiscal 2011, 2010, and 2009, respectively.
F-23
Note 14: Savings Plan, Employee Stock Ownership Plan and Retirement Plan
We maintain a Savings Plan (“401(k)”) and a frozen Employee Stock Ownership Plan (“ESOP”). Employees become eligible to participate in the 401(k) after 90 days of employment. We have the option to match contributions of participants at a rate we determine each year. For participants with three or more years of service, we also may elect to make additional discretionary matching contributions in excess of the rate elected for participants with less than three years of service.
The Board of Directors determines the amount to be contributed annually to the 401(k) in cash, provided that such contributions shall not exceed the amount deductible for federal income tax purposes. Cash contributions to the 401(k) of $483, $259 and $343 were made for fiscal 2011, 2010 and 2009, respectively.
The ESOP was established in 1975 and was frozen in 1994, at which time all participants became fully vested. Contributions to the ESOP were invested primarily in our common stock. The ESOP held 19,036 shares of our common stock and cash of $133 at May 31, 2011.
We have a Supplemental Executive Retirement Plan (“SERP”) that provides for automatic deferral of contributions in excess of the maximum amount permitted under the 401(k) plan for our executives who choose to participate. The SERP is a non-qualified deferred compensation program, and we have an unfunded contractual obligation under this plan. We have the option to match contributions of participants at a rate we determine each year. Cash contributions to the SERP were $14, $5 and $21 for fiscal 2011, 2010 and 2009, respectively. As of May 31, 2011 and 2010, we had $2,671 and $2,081, respectively, of obligations for this plan included in accrued expenses. We have investments in money market and stock funds, as directed by the participants, of $2,671 and $2,081 as of May 31, 2011 and 2010, respectively, included in other assets.
Note 15: Segment Reporting and Related Disclosures
Accounting guidance establishes reporting standards for an enterprise’s operating segments and related disclosures about its products, services, geographic areas and major customers. Operating segments are defined as components of an enterprise for which separate financial information is available that is regularly evaluated by the chief operating decision maker in deciding how to allocate resources and in assessing performance. In order to determine our operating segments, we considered the following: an operating segment is a component of an enterprise (i) that engages in business activities from which it may earn revenues and incur expenses, (ii) whose operating results are regularly reviewed by the enterprise’s chief operating decision maker to make decisions about resources to be allocated to the segment and assess its performance, and (iii) for which discrete financial information is available. In accordance with this guidance, we have identified two operating segments: the rental, lease and sale of T&M and of DP equipment.
Although we have separate operating segments for T&M and DP equipment, these two segments are aggregated into a single reportable segment because they have similar economic characteristics and qualitative factors. The T&M and DP segments have similar long-term average gross margins, and both rent, lease and sell electronic equipment to large corporations, purchase directly from major manufacturers, configure and calibrate the equipment, and ship directly to customers.
Our equipment pool, based on acquisition cost, comprised $347,138 of T&M equipment and $39,654 of DP equipment at May 31, 2011 and $310,292 of T&M equipment and $40,735 of DP equipment at May 31, 2010.
F-24
Revenues for these operating segments were as follows for the fiscal year ended May 31:
| T&M | DP | Total | ||||||||||
|
|
||||||||||||
| 2011 |
||||||||||||
| Rentals and leases |
$ | 101,273 | $ | 16,789 | $ | 118,062 | ||||||
| Sales of equipment and other revenues |
108,450 | 2,217 | 110,667 | |||||||||
|
|
||||||||||||
| $ | 209,723 | $ | 19,006 | $ | 228,729 | |||||||
|
|
||||||||||||
| 2010 |
||||||||||||
| Rentals and leases |
$ | 77,874 | $ | 16,327 | $ | 94,201 | ||||||
| Sales of equipment and other revenues |
49,282 | 2,384 | 51,666 | |||||||||
|
|
||||||||||||
| $ | 127,156 | $ | 18,711 | $ | 145,867 | |||||||
|
|
||||||||||||
| 2009 |
||||||||||||
| Rentals and leases |
$ | 77,430 | $ | 20,965 | $ | 98,395 | ||||||
| Sales of equipment and other revenues |
29,054 | 3,032 | 32,086 | |||||||||
|
|
||||||||||||
| $ | 106,484 | $ | 23,997 | $ | 130,481 | |||||||
|
|
||||||||||||
| No single customer accounted for more than 10% of total revenues during fiscal 2011, 2010 or 2009. | ||||||||||||
| Selected country information is presented below: | ||||||||||||
| Year ended May 31, | 2011 | 2010 | 2009 | |||||||||
|
|
||||||||||||
| Revenues: 1 |
||||||||||||
| U.S. |
$ | 199,861 | $ | 124,618 | $ | 111,184 | ||||||
| Other 2 |
28,868 | 21,249 | 19,297 | |||||||||
|
|
||||||||||||
| Total |
$ | 228,729 | $ | 145,867 | $ | 130,481 | ||||||
|
|
||||||||||||
| As of May 31, | 2011 | 2010 | 2009 | |||||||||
|
|
||||||||||||
| Net Long Lived Assets: 3 |
||||||||||||
| U.S. |
$ | 180,591 | $ | 166,533 | $ | 151,204 | ||||||
| Other 2 |
33,491 | 25,206 | 24,672 | |||||||||
|
|
||||||||||||
| Total |
$ | 214,082 | $ | 191,739 | $ | 175,876 | ||||||
|
|
||||||||||||
| 1 | Revenues by country are based on the location of shipping destination, whether the order originates in the U.S. parent or a foreign subsidiary. |
| 2 | Other consists of other foreign countries that each individually accounts for less that 10% of the total revenues or assets. |
| 3 | Net long-lived assets include rental and lease equipment, other property, goodwill and intangibles, net of accumulated depreciation and amortization. |
F-25
Note 16: Quarterly Information (Unaudited)
Summarized quarterly financial data for fiscal 2011 and 2010 was as follows:
| Total | Gross | Income Before |
Net | Earnings per share | ||||||||||||||||||||
| Revenues | Profit | Taxes | Income | Basic | Diluted | |||||||||||||||||||
|
|
||||||||||||||||||||||||
| Fiscal Year 2011 |
||||||||||||||||||||||||
| First Quarter |
$ | 50,825 | $ | 21,947 | $ | 8,650 | $ | 5,221 | $ | 0.22 | $ | 0.22 | ||||||||||||
| Second Quarter |
53,277 | 23,271 | 9,707 | 7,119 | 0.30 | 0.30 | ||||||||||||||||||
| Third Quarter |
59,450 | 22,557 | 8,336 | 5,077 | 0.21 | 0.21 | ||||||||||||||||||
| Fourth Quarter |
65,177 | 26,383 | 10,596 | 6,339 | 0.27 | 0.26 | ||||||||||||||||||
|
|
||||||||||||||||||||||||
| Annual totals |
$ | 228,729 | $ | 94,158 | $ | 37,289 | $ | 23,756 | $ | 0.99 | $ | 0.99 | ||||||||||||
|
|
||||||||||||||||||||||||
| Fiscal Year 2010 |
||||||||||||||||||||||||
| First Quarter |
$ | 32,201 | $ | 13,639 | $ | 3,639 | $ | 2,075 | $ | 0.09 | $ | 0.09 | ||||||||||||
| Second Quarter |
36,577 | 16,251 | 6,942 | 4,011 | 0.17 | 0.17 | ||||||||||||||||||
| Third Quarter |
33,034 | 15,456 | 4,064 | 2,151 | 0.09 | 0.09 | ||||||||||||||||||
| Fourth Quarter |
44,055 | 18,855 | 5,387 | 3,360 | 0.14 | 0.14 | ||||||||||||||||||
|
|
||||||||||||||||||||||||
| Annual totals |
$ | 145,867 | $ | 64,201 | $ | 20,032 | $ | 11,597 | $ | 0.48 | $ | 0.48 | ||||||||||||
|
|
||||||||||||||||||||||||
F-26