Attached files
| file | filename |
|---|---|
| EXCEL - IDEA: XBRL DOCUMENT - ELECTRO RENT CORP | Financial_Report.xls |
| EX-32.2 - EXHIBIT - ELECTRO RENT CORP | ex-322.htm |
| EX-32.1 - EXHIBIT - ELECTRO RENT CORP | ex-321.htm |
| EX-10.21 - EXHIBIT - ELECTRO RENT CORP | ex1022fye14.htm |
| EX-10.36 - EXHIBIT - ELECTRO RENT CORP | ex1036fye14.htm |
| EX-10.21 - EXHIBIT - ELECTRO RENT CORP | ex1021fye14.htm |
| EX-10.35 - EXHIBIT - ELECTRO RENT CORP | ex-1035fye14.htm |
| EX-23 - EXHIBIT - ELECTRO RENT CORP | ex-23.htm |
| EX-10.18 - EXHIBIT - ELECTRO RENT CORP | ex1018fye14.htm |
| EX-31.2 - EXHIBIT - ELECTRO RENT CORP | ex-312.htm |
| EX-31.1 - EXHIBIT - ELECTRO RENT CORP | ex-311.htm |
| EX-10.18 - EXHIBIT - ELECTRO RENT CORP | ex1019fye14.htm |
UNITED STATES
SECURITIES AND EXCHANGE COMMISSION
Washington DC 20549
FORM 10-K
(Mark One)
þ | ANNUAL REPORT PURSUANT TO SECTION 13 OR 15(d) OF THE SECURITIES EXCHANGE ACT OF 1934 |
For the fiscal year ended May 31, 2014
OR
¨ | TRANSITION REPORT PURSUANT TO SECTION 13 OR 15(d) OF THE SECURITIES EXCHANGE ACT OF 1934 |
For the transition period from to
Commission File Number: 000-09061
ELECTRO RENT CORPORATION
(Exact Name of Registrant as Specified in Its Charter)
CALIFORNIA | 95-2412961 | |
(State or Other Jurisdiction of Incorporation or Organization) | (I.R.S. Employer Identification No.) | |
6060 Sepulveda Boulevard
Van Nuys, California 91411-2512
(Address of Principal Executive Offices and Zip Code)
(818) 786-2525
(Registrant’s telephone number, including area code)
Securities registered pursuant to Section 12(b) of the Act:
Title of Each Class | Name of Each Exchange on Which Registered | |
Common Stock without par value | The NASDAQ Stock Market LLC | |
Securities registered pursuant to Section 12(g) of the Act: None
Indicate by check mark if the registrant is a well-known seasoned issuer, as defined in Rule 405 of the Securities Act. Yes ¨ No ý
Indicate by check mark if the registrant is not required to file reports pursuant to Section 13 or Section 15(d) of the Act. Yes ¨ No ý
Indicate by check mark whether the registrant (1) has filed all reports required to be filed by Section 13 or 15(d) of the Securities Exchange Act of 1934 during the preceding 12 months (or for such shorter period that the registrant was required to file such reports), and (2) has been subject to such filing requirements for the past 90 days. Yes ý No ¨
Indicate by check mark whether the registrant has submitted electronically and posted on its corporate Web site, if any, every Interactive Data File required to be submitted and posted pursuant to Rule 405 of Regulation S-T (§ 232.405 of this chapter) during the preceding 12 months (or for such shorter period that the registrant was required to submit and post such files). Yes ý No ¨
Indicate by check mark if disclosure of delinquent filers pursuant to Item 405 of Regulation S-K (§229.405 of this chapter) is not contained herein, and will not be contained, to the best of registrant’s knowledge, in definitive proxy or information statements incorporated by reference in Part III of this Form 10-K or any amendment to this Form 10-K. ý
Indicate by check mark whether the registrant is a large accelerated filer, an accelerated filer, a non-accelerated filer, or a smaller reporting company. See the definitions of “large accelerated filer,” “accelerated filer” and “smaller reporting company” in Rule 12b-2 of the Exchange Act. (Check one)
Large Accelerated Filer | ¨ | Accelerated Filer | ý | |||
Non-Accelerated Filer | ¨ | Smaller Reporting Company | ¨ | |||
Indicate by check mark whether the registrant is a shell company (as defined in Rule 12b-2 of the Act). Yes ¨ No ý
The aggregate market value of the registrant’s common stock held by non-affiliates, computed on the basis of the closing price as reported on the Nasdaq market as of November 30, 2013, was $408,047,552. Shares of common stock held by executive officers, directors and by persons who own 10% or more of the outstanding common stock of the registrant have been excluded for purposes of the foregoing calculation. This does not reflect a determination that such persons are affiliates for any other purpose.
Number of shares of the registrant’s common stock outstanding as of August 11, 2014: 24,008,489.
DOCUMENTS INCORPORATED BY REFERENCE
Part III of this Annual Report on Form 10-K incorporates by reference certain information contained in the Proxy Statement for the registrant's Annual Meeting of Shareholders, which will be filed with the Securities and Exchange Commission not later than September 28, 2014.
EXPLANATORY NOTE
Unless otherwise noted, (1) the terms “we”, “us” and “our” refer to Electro Rent Corporation and its subsidiaries, and (2) the terms “Common Stock” and “shareholder(s)” refer to our common stock and the holders of that stock, respectively.
SPECIAL NOTE ABOUT FORWARD-LOOKING STATEMENTS
This Annual Report on Form 10-K contains forward-looking statements within the meaning of Section 27A of the Securities Act of 1933, as amended, and Section 21E of the Securities Exchange Act of 1934, as amended. You can find many (but not all) of these statements by looking for words such as “approximates,” “believes,” “expects,” “anticipates,” “estimates,” “intends,” “plans,” “would,” “may” or other similar expressions in this Report. We claim the protection of the safe harbor contained in the Private Securities Litigation Reform Act of 1995. We caution investors that any forward-looking statements presented in this report, or that we may make orally or in writing from time to time, reflect our good faith estimations based on information currently available to us. Such statements are based on assumptions, and the actual outcome will be affected by known and unknown risks, trends, uncertainties and factors that are beyond our control or ability to predict. Although we believe that our assumptions are reasonable, they are not guarantees of future performance and some will inevitably prove to be incorrect. As a result, our actual future results can be expected to differ from our expectations, and those differences may be material.
Some of the risks and uncertainties that may cause our actual results, performance or achievements to differ materially from those expressed or implied by forward-looking statements include the following: Common Stock price fluctuations, fluctuations in operating results (including as a result of changing economic conditions), risks associated with technology changes, risks associated with customer solvency, competition, risks associated with international operations, risks associated with our manufacturers and suppliers, dependence on key personnel, control by management and others, risks associated with possible acquisitions and new business ventures and anti-takeover provisions. For further discussion of these and other factors, see Item 1A. “Risk Factors”; Item 7. “Management’s Discussion and Analysis of Financial Condition and Results of Operations”; and Item 7A. “Quantitative and Qualitative Disclosure about Interest Rates and Currency Rates,” in this report, and our other filings with the Securities and Exchange Commission.
This Annual Report on Form 10-K and all subsequent written and oral forward-looking statements attributable to us or any person acting on our behalf are expressly qualified in their entirety by the cautionary statements contained or referred to in this section. We do not undertake any obligation to release publicly any revisions to our forward-looking statements to reflect events or circumstances after the date of this report.
2
PART I
Item 1. Business.
We are one of the largest global organizations devoted to the rental, lease and sale of new and used electronic test and measurement (“T&M”) equipment. We purchase that equipment from leading manufacturers such as Keysight Technologies, Inc. (formerly Agilent Technologies, Inc., “Keysight”), Anritsu, Inc. ("Anritsu"), and Tektronix Inc. (“Tektronix”) primarily for use by our customers in the aerospace, defense, telecommunications, electronics, and semiconductor industries. Although it represented only approximately 8% of our revenues in fiscal 2014, we believe our Data Products ("DP") division is one of the largest rental companies in the United States for personal computers and servers from manufacturers including Dell, HP/Compaq, IBM, Toshiba and Apple.
The Electro Rent Approach. For the most part, customers who rent, purchase, or lease equipment from us place orders through our inside sales force, which has access to our proprietary computer system that we update in real time for equipment availability and pricing. In the case of rentals and some leases, we generally use a pool of equipment we have previously purchased for that purpose, or we may add equipment to that pool to fill a lease or rental order if the addition makes economic sense. Our equipment fulfillment team typically can arrange delivery of equipment from our pool to our customers within one or two days of a request. Most of our equipment is technically complex and must be tested and serviced when returned to us. We do most of that testing in house, using a team of experienced technicians and our state of the art calibration laboratory.
Although our customers respond to equipment pricing and availability in making their decisions to choose to work with us, we believe that our success also depends on other factors:
• | Customer Service. Our customer service, responsiveness and expert technical staff provide us with a key competitive advantage. Our resale channel for Keysight T&M equipment in the United States and Canada has enabled us to substantially expand the number and technical expertise of our T&M sales force, which at approximately 100 persons is the largest among our principal competitors. |
• | Trusted Brand. We believe our management team is the most experienced and stable in the industry, with our executive officers averaging 30 years at Electro Rent. In 2008, 2009 and 2014, Forbes magazine named us as one of the “100 Most Trustworthy Companies” out of more than 8,000 publicly traded companies for “transparent and conservative accounting practices and solid corporate governance and management.” We were also honored as a Frost & Sullivan 2012 Company of the Year. |
• | Global Platform. As the largest T&M rental, leasing and sales company in North America, and one of the only T&M rental companies in the world with a global platform and key locations in the US, Canada, China and Europe, our size and reach appeals to our multinational customers and assists us in maximizing our equipment utilization and equipment pool management across different geographic markets. |
• | Multichannel Offerings. In the last two years, we have expanded our business to offer customers a single source for their equipment acquisitions, whether they want to rent, lease or buy new or used equipment. We believe that we offer the greatest breadth of acquisition options in the industry, allowing our customers to match the appropriate option to their usage and capital needs, budget and other factors, such as accounting rules and regulatory requirements. In addition, spreading costs over multiple channels allows us to maintain the largest sales force among our principal competitors, which in turn broadens and deepens our customer contacts and provides them more technical strength and assistance. |
• | Proprietary Equipment Management Systems. To maximize our overall profit, we manage our equipment pool on an on-going basis by controlling the timing, pricing and mix of our purchases and sales of equipment. We acquire new and used equipment to meet current and anticipated customer demand and stay abreast of current technical standards. We sell our used equipment when we believe that is the most lucrative option. We employ a complex equipment management strategy and our proprietary PERFECT software to adjust our equipment pool and pricing in order to maximize equipment availability, utilization and profitability. |
Strategic Growth Initiatives. We believe that our resources and financial infrastructure remain capable of handling a significantly greater volume of business activity without a proportionate increase in expenses. Based on this belief, we have been seeking ways to increase revenues and leverage that infrastructure through internal growth and external acquisitions. Despite continuing weakness in the economic environment, we have used our strong balance sheet to make significant equipment purchases to meet the T&M rental demand and support areas of potential growth. We paid $58.7 million for rental and lease equipment purchases during fiscal 2014, compared to $64.1 million during fiscal 2013, a decline of 8.4%. Our equipment purchases have allowed us to expand and upgrade our equipment base, enhancing our ability to meet the needs
3
of a wide range of customers, as well as expand our equipment pool offerings in some related areas such as telecommunications and industrial products.
Competition. We face different competition based on industry sector and geography. For T&M equipment, the North American market generates in excess of $300 million of rental and lease revenue annually. The market is characterized by intense competition from several large competitors, and no single competitor holds a dominant market share in North America. Our primary competitors in this market include McGrath RentCorp, Continental Resources, Inc., Test Equity LLC, and Microlease plc. In Europe, we compete for T&M rental business with Microlease plc and Livingston Group Ltd. In Asia we compete with a number of local operators. These entities also compete with us in leasing T&M equipment, as do banks,vendors and other financing sources. In selling used equipment, we may also compete with sales of new equipment by our suppliers, including Keysight, Tektronix and Anritsu, and their other distributors. Our competitors engage in aggressive pricing for both rentals and sales. In order to maintain or increase our market share, we may choose to lower our prices, resulting in lower revenues and decreased profitability.
For our DP division, the market for the lease and rental of computers and servers is highly fragmented. Our principal competitors in this area include SmartSource Rentals (“SmartSource”), Source One Rentals, Rentex and CRE Rentals. The computer rental market has been characterized by intense competition that has led to industry consolidation. We have acquired two competitors during the last seventeen years and SmartSource, our largest competitor in this market, has expanded primarily due to its numerous acquisitions. While we have focused on the rental of large quantities of computers to unique customers, SmartSource concentrates more on audio visual and trade show technology rentals.
Our Backlog. At May 31, 2014, we had a sales order backlog for new T&M equipment of $10.7 million, compared to $7.6 million at May 31, 2013 and $8.4 million at May 31, 2012. The increase in backlog is primarily due to longer manufacturing lead times for certain equipment as well as an increase in demand from our customers.
Backlog represents the cumulative balance, at a given point in time, of recorded customer sales orders that have not yet been shipped or recognized as sales. Backlog increases when an order is received, and declines when we recognize sales. Although backlog consists of firm orders for which goods and services are yet to be provided, customers can, and sometimes do, terminate or modify these orders. Backlog, on any particular date, while indicative of short-term revenue performance, is not necessarily a reliable indicator of medium or long-term revenue performance.
International Operations. We conduct rental, leasing and sales activity in foreign countries, which in the aggregate accounted for approximately 15.5% of our revenues in 2014, 14.9% in 2013 and 13.8% in 2012. Selected financial information regarding our international operations is presented below:
Fiscal Year ended May 31, (in thousands) | 2014 | 2013 | 2012 | ||||||||
Revenues: 1 | |||||||||||
U.S. | $ | 203,806 | $ | 211,745 | $ | 214,354 | |||||
Other 2 | 37,331 | 36,986 | 34,200 | ||||||||
Total | $ | 241,137 | $ | 248,731 | $ | 248,554 | |||||
As of May 31, (in thousands) | 2014 | 2013 | 2012 | ||||||||
Net Long Lived Assets: 3 | |||||||||||
U.S. | $ | 188,343 | $ | 198,956 | $ | 207,449 | |||||
Other 2 | 46,667 | 49,726 | 49,595 | ||||||||
Total | $ | 235,010 | $ | 248,682 | $ | 257,044 | |||||
1 | Revenues by country are based on the shipping destination. |
2 | Other consists of countries other than the United States. No single country outside the United States accounted for 10% or more of the total revenues and net long-lived assets. |
3 | Net long-lived assets include rental and lease equipment and other property, net of accumulated depreciation and amortization. |
For risks relating to our international operations, see “Item 1A. Risk Factors – Risks Associated with International Operations.”
4
Other Information. The following table shows, for each of the last three fiscal years, revenues from rentals and leases and sales of equipment and other revenues for our T&M and DP operating segments:
Fiscal Year ended May 31, (in thousands) | T&M | DP | Total | ||||||||
2014 | |||||||||||
Rentals and leases | $ | 120,629 | $ | 16,788 | $ | 137,417 | |||||
Sales of equipment and other revenues | 101,898 | 1,822 | 103,720 | ||||||||
$ | 222,527 | $ | 18,610 | $ | 241,137 | ||||||
2013 | |||||||||||
Rentals and leases | $ | 120,846 | $ | 15,745 | $ | 136,591 | |||||
Sales of equipment and other revenues | 109,700 | 2,440 | 112,140 | ||||||||
$ | 230,546 | $ | 18,185 | $ | 248,731 | ||||||
2012 | |||||||||||
Rentals and leases | $ | 113,540 | $ | 16,197 | $ | 129,737 | |||||
Sales of equipment and other revenues | 116,417 | 2,400 | 118,817 | ||||||||
$ | 229,957 | $ | 18,597 | $ | 248,554 | ||||||
The majority of our rental equipment not out on rent is located at our Van Nuys, California warehouse and is serviced by an ISO9001:2008 (DEKRA certified) and ISO17025:2005 (A2LA accreditation). We also service our customers through sales offices and calibration and service centers in the United States, Canada, China and Belgium, which are linked by a proprietary on-line computer system. These centers also function as depots for the sale of used equipment.
For additional financial information about our segments, see Note 14 to our consolidated financial statements included in this Annual Report on Form 10-K.
No single customer accounted for more than 10% of our total revenues during fiscal 2014, 2013 or 2012. We do not derive any significant portion of our revenues from direct United States government contracts.
Other than the license included in our reseller agreement with Keysight, we have no material patents, trademarks, licenses, franchises or concessions.
At May 31, 2014, we employed approximately 420 individuals. Except in China, where we have 13 employees, none of these employees are members of a labor union. None of our employees are subject to collective bargaining agreements. We believe that our employee relations are satisfactory.
Electro Rent Corporation was incorporated in California in 1965 and became a publicly held corporation in 1980.
Obtaining Additional Information. Our Internet address is www.electrorent.com. Copies of our Annual Report on Form 10-K, Quarterly Reports on Form 10-Q, Current Reports on Form 8-K and amendments to those reports filed or furnished pursuant to Section 13(a) or 15(d) of the Securities Exchange Act of 1934 are available free of charge on our website via links to the Securities and Exchange Commission’s website as soon as reasonably practicable after we electronically file those materials with the Securities and Exchange Commission. We provide paper copies of these reports to shareholders upon written request to Shareholder Relations, Electro Rent Corporation, 6060 Sepulveda Boulevard, Van Nuys, California 91411-2512.
Item 1A. Risk Factors.
Please carefully consider the following discussion of various risks and uncertainties, as well as the other information in this report and in other reports and documents we file with the Securities and Exchange Commission, when evaluating our business and future prospects. We believe that the following risk factors are the most relevant to our business, but they are not the only risk factors that we face. Additional risks and uncertainties, not presently known to us, or that we currently see as immaterial, may also occur. Our business, financial condition and results of operations could be seriously harmed if any of these risks or uncertainties actually occur or materialize. In that event, the market price for our Common Stock could decline, and our shareholders may lose all or part of their investment.
5
COMMON STOCK PRICE FLUCTUATIONS
The price of our Common Stock has fluctuated significantly in the past and may continue to do so in the future.
General Factors. We believe some of the reasons for past fluctuations in the price of our Common Stock have included:
• | announcements of developments related to our business; |
• | announcements concerning new products or enhancements in the equipment that we rent, or developments in our relationships with our customers; |
• | variations in our revenues, gross margins, earnings or other financial results from investors’ expectations; and |
• | fluctuations in results of our operations and general conditions in the economy, our market, and the markets served by our customers. |
In addition, prices in the stock market in general have been volatile in recent years. In many cases, the fluctuations have been unrelated to the operating performance of the affected companies. As a result, the price of our Common Stock could fluctuate in the future without regard to our operating performance.
Future Sales of our Common Stock. Sales of our Common Stock by our officers, directors and employees could adversely and unpredictably affect the price of our shares. Additionally, the price could be affected by even the potential for sales by these persons. In addition to the 24,008,489 shares outstanding as of August 11, 2014, as of such date, up to 517,907 shares of Common Stock may be issued upon conversion of our vested and unvested stock units previously granted under our Equity Incentive Plan.
We cannot predict the effect that any future sales of our Common Stock, or the potential for those sales, will have on the share price for our Common Stock.
FLUCTUATIONS IN OPERATING RESULTS
Historically, our operating results have fluctuated from period to period, and we expect that fluctuations could continue in the future. The fluctuations in our past results have resulted from many factors, some of which are beyond our control. In the future, these or other factors could have a material impact on our operating results and the price of our Common Stock.
Timing of Equipment Purchases and Sales and Equipment Pool Management. The profitability of our business depends in part on controlling the timing, pricing and mix of purchases and sales of equipment and on managing our equipment pool. We seek to acquire new and used equipment at attractive prices, from which we feel we can make a profit as a result of a combination of renting, leasing and selling that equipment. We base expenditures for equipment purchases, sales and marketing and other items on our expectations of future customer demand. In order to maximize overall profit from the rental, leasing, and sales of equipment, we manage our equipment pool on an on-going basis by analyzing our product strategy for equipment in light of historical and projected lifecycles. In doing so, we compare our estimate of potential profit from rental with the potential profit from the product’s immediate sale and replacement with new or other equipment.
Our overall equipment management is complex and our equipment strategy can change during the equipment’s lifetime based upon numerous factors, including the U.S. and global economy, interest rates and new product launches. Our strategic equipment decisions are based on the following fundamentals:
• | our acquisition cost; |
• | our estimates of current and future market demand for rentals; |
• | our estimates of current and future supply of equipment; |
• | the book value of the equipment after depreciation and other impairment; |
• | our estimates of the effect of interest rates on rental and leasing fees as well as capital financing; and |
• | our estimates of the potential current and future sale prices of equipment. |
However, historical trends are not necessarily indicative of future trends. If our assumptions prove to be wrong, not only may our revenues fall short of our expectations, but we may not be able to adjust our equipment quickly enough to compensate for lower demand for one or more products in our equipment pool. In addition, as demand for a product falls, we may have
6
difficulty in selling any of our excess equipment at a favorable price or at all. Both of these factors can compound the impact of any revenue shortfall and further affect our operating results and the price of our Common Stock.
Global Economic Conditions. In recent years, our financial results have been impacted by competitive pressure on rental rates due in large part to the recession in the U.S. and our major international markets. Our customers historically have reduced their expenditures for T&M and DP equipment during economic downturns. Accordingly, when the domestic and/or international economy weakens, demand for our product offerings declines. A large part of our equipment pool is rented or leased to customers in the aerospace, defense, telecommunications, electronics, industrial and semiconductor industries. Continued weakness in the U.S. and global economy, or in one or more of these specific industries, may result in lower demand and increased pressure on prices and gross profit.
Economic uncertainty continues to impact our customers and competitors, resulting in more stringent credit requirements for our customers and reduced access to capital. We continue to focus on remaining profitable in the current conditions, as well as being prepared for the possibility that recessionary trends may return in future periods.
Seasonality. Regardless of the overall economic outlook domestically and globally, December, January and February typically reflect lower rental activity. In addition, because February is a short month, revenue billing in that month is reduced. The seasonal spending patterns of our customers are also affected by factors such as:
• | weather, holiday and vacation considerations; and |
• | fiscal budgetary cycles. |
Other Factors. Our quarterly operating results are subject to fluctuation based on a wide variety of factors. Other factors that may affect our operating results from one quarter to another include:
• | changes in customer demands and/or requirements; |
changes in pricing or maintenance policies of equipment manufacturers;
• | price competition from other rental, leasing and finance companies; |
• | the timing of new product announcements and launches; |
• | changes in interest rates; |
• | changes in product delivery dates; |
• | currency fluctuations and other risks of international operations; and |
• | changes and reductions to government spending that could negatively impact our customers in the aerospace and defense industry. |
All or any of these factors and similar factors could result in our operating results differing substantially from our expectations, as well as the expectations of public market analysts and investors, which would likely have a material adverse impact on our stock price.
RISKS ASSOCIATED WITH TECHNOLOGY CHANGES
We serve customers that operate in industries that are characterized by technological change, and accordingly must anticipate and respond to changes in technology in order to maintain competitiveness and successful operations.
Technological Advancements. We must anticipate and keep pace with the introduction of new hardware, software and networking technologies and acquire equipment that will be marketable to our current and prospective customers. The equipment that we acquire for our equipment pool can be subject to technological change, evolving customer demands and frequent new product announcements and enhancements. If we fail to adequately anticipate or adapt to new technological developments or to recognize changing market conditions, our operating results and stock price could be materially and adversely affected.
Expenses Resulting from Technological Advancements. As a result of technology developments, we may have to make substantial and unanticipated expenditures to acquire new equipment or invest in further staff education on operating and servicing the equipment we deliver to our customers. Further, we may not adequately anticipate or respond successfully to technological changes for many reasons, including misjudging the impact of technological changes as well as financial, technological or other constraints. If we do not adequately anticipate or respond to changes in technological advancements or customer preferences, it would likely have a material adverse impact on our operating results and stock price.
7
Introduction of New Products and Services. The markets in which we operate are characterized by changing technology, evolving industry standards and declining prices of certain products. Our operating results will depend to a significant extent on our ability to continue to introduce new services and to control and/or reduce costs on existing services. Whether we succeed in our new offerings depends on several factors such as:
• | proper identification of customer needs; |
• | appropriate control of costs; |
• | timely completion and introduction of products and services as compared to our competitors; |
• | our ability to differentiate our equipment and services from our competitors; and |
• | appropriate pricing and market acceptance of our solutions. |
RISKS ASSOCIATED WITH CUSTOMER SOLVENCY
Our customers may face liquidity issues, and if we make poor credit decisions or are unable to collect on contracts with customers, it could have a material adverse effect on our operating results and stock price.
One of the reasons some of our customers find it more attractive to rent or lease electronic equipment instead of owning that equipment is because renting or leasing enables them to deploy their capital elsewhere. This can be particularly true in industries with high growth rates such as the telecommunications industry. However, some of our customers have liquidity issues, which have been compounded by the recent slowness in the global economy, and ultimately may not be able to fulfill the terms of their agreements with us. If we are not able to manage credit risk issues, or if a large number of customers should have financial difficulties at the same time, our credit losses would increase above historical levels and may become material.
COMPETITION
If we do not compete effectively, we may lose market share and our revenues and profitability may decline.
The equipment rental, leasing and sales business is characterized by intense competition from several large competitors, some of which have access to greater financial and other resources than we do. We face competition from both established entities and new entries in the market. Our primary competitors in the North American T&M rental area include McGrath RentCorp, Continental Resources, Inc., Test Equity LLC and Microlease plc. Internationally, our largest competitors for rental business are Microlease plc and Livingston Group Ltd. in Europe. These entities also compete with us in leasing T&M equipment, as do banks, vendors and other financing sources. In addition, in equipment sale, we also compete with sales by our suppliers, including Keysight and Tektronix, and their other distributors. The market for the lease and rental of computers and servers is highly fragmented, and our principal competitors include SmartSource, Source One Rentals, Rentex and CRE Rentals.
Our competitors engage in aggressive pricing for both rentals and sales. In order to maintain or increase our market share, we may choose, or be compelled, to lower our prices, resulting in decreased revenues and profitability, which could materially and adversely affect our stock price.
RISKS ASSOCIATED WITH INTERNATIONAL OPERATIONS
Our international operations will continue to be a meaningful portion of our overall revenues and operations in the future. There are risks that are inherent to our international operations, and if we fail to manage them appropriately we may not meet our revenue expectations or may incur unanticipated expenses, either of which would adversely affect our operations.
Currency Risks. We generated 15.5% of our revenues from activity in foreign countries during the past fiscal year. Our contracts to supply equipment outside of the U.S. are generally priced in local currency. However, our consolidated financial statements are prepared in U.S. dollars. Consequently, changes in exchange rates can unpredictably and adversely affect our consolidated operating results, and could result in exchange losses. Although we use foreign currency forward contracts to mitigate the risks associated with fluctuations in exchange rates, we may not be able to eliminate or reduce the effects of currency fluctuations. Thus, exchange rate fluctuations could have a material adverse impact on our operating results and stock price.
Other Risks Associated with International Operations. Additionally, our financial results may be adversely affected by other international risks, such as:
• | international political and economic conditions; |
• | changes in government regulation in various countries; |
8
• | trade barriers; |
• | difficulty in staffing our foreign sales and service centers, and in training and retaining foreign employees; |
• | issues relating to the repatriation of any profits; |
• | adverse tax consequences; and |
• | costs associated with expansion into new territories. |
We expect to continue our international operations and that the revenues we derive from these activities will continue to be a meaningful portion of our total revenues. If we do not anticipate and respond to the risks associated with international operations, it could have a material adverse effect on our operating results and stock price.
RISKS ASSOCIATED WITH OUR MANUFACTURERS AND SUPPLIERS
Our business is dependent on our ability to purchase equipment for our equipment pool from third party manufacturers and suppliers at prices and on terms that allow us to meet our customers’ requirements. Any significant change in availability, pricing or terms for equipment from our manufacturers could have a substantial impact on our results of operations.
About 92% of our equipment portfolio at acquisition cost consists of general purpose T&M instruments purchased from leading manufacturers such as Keysight, Anritsu, and Tektronix. The remainder of our equipment pool consists of personal computers and workstations, which include personal computers from Dell, Apple, IBM and Toshiba and workstations primarily from HP/Compaq. We depend on these manufacturers and suppliers for our equipment. If, in the future, we are not able to purchase necessary equipment from one or more of these suppliers on favorable terms, we may not be able to meet our customers’ demands in a timely manner or for a price that generates a profit. Depending on the equipment required, or the customer’s specific requirements, there may not be suitable alternatives from other suppliers. Any inability to acquire equipment would adversely impact our revenues. Similarly, if we cannot increase our pricing commensurate with pricing changes from our customers our gross profit and income from operations will be adversely impacted.
If we are unable to renew our reseller agreement with Keysight when it expires on May 31, 2015 on acceptable terms, it could have a material adverse effect on our operating results and stock price.
Sales of new T&M equipment represent approximately 63.5% and 66.8% of our sales of equipment and other revenues for fiscal 2014 and 2013, respectively. Nearly all of our sales of new T&M equipment are in connection with our reseller agreement with Keysight, which expires on May 31, 2015. Keysight is a wholly-owned subsidiary of Agilent Technologies, Inc. (“Agilent”), with whom we originally entered into the reseller agreement. Agilent is currently in the process of spinning off Keysight into a separate publicly traded company, which Agilent has announced that it expects to complete by November 2014. We have renewed our reseller arrangement four times since we entered into the reseller agreement with Agilent in 2009. If we are unable to renew our reseller agreement with Keysight, or if the terms of any renewal are less favorable to us, our T&M equipment sales business may be materially and adversely affected.
Agilent's planned spin-off of Keysight (which manufactures T&M equipment) could impact our relationship with Keysight.
Agilent announced on September 19, 2013 that it plans to spin off its electronic measurement business (which manufactures the T&M equipment) into a separate company. Agilent is in the process of affecting the spin-off, and has assigned its rights to our reseller agreement to Keysight. Agilent has stated publicly that it expects to complete the spin-off by November, 2014. We do not know whether or how the spin-off will impact the renewal of our reseller agreement or other aspects of our relationship with Keysight. Sales of Keysight/Agilent T&M equipment constitutes a substantial portion of our overall revenues. Any material change in our relationship with Keysight, in Keysight’s sales strategy for T&M equipment, or our reseller agreement, may have a material and adverse effect on our business and operating prospects.
DEPENDENCE ON KEY PERSONNEL
If we are unable to recruit and retain qualified personnel, it could have a material adverse effect on our operating results and stock price.
Our success depends in large part on the continued services of our executive officers, our senior managers and other key personnel. Our executive officers, including our Chief Executive Officer, Daniel Greenberg, our President, Steven Markheim, and our Chief Financial Officer, Craig Jones, are each extremely experienced with a long history at the Company. The loss of any of these people could result in significant disruption to our operations. In addition, T&M equipment and solutions can be highly technical and complex, and typically require customizations to meet specific customer applications and needs. The
9
quality of our customer service and the knowledge of our personnel is a key competitive factor for our business. It is very important that we attract highly skilled personnel to accommodate growth and to replace personnel who leave. Competition for qualified personnel can be intense, especially in technology industries, and there are a limited number of people with the requisite knowledge and experience to market, sell and service our equipment. We must retain and recruit qualified personnel in order to maintain and grow our business.
CONTROL BY MANAGEMENT AND OTHERS
Senior management has significant influence over our policies and affairs and may be in a position to determine the outcome of corporate actions.
As of August 11, 2014, our executive officers and directors collectively owned approximately 21.2% of our Common Stock.
As of that date, (i) Mr. Daniel Greenberg, our Chairman and Chief Executive Officer, beneficially owned approximately 19.1% of our outstanding shares of Common Stock, and (ii) one other shareholder controlled 16.2% of our outstanding shares of Common Stock. As long as these shareholders own significant percentage of our Common Stock, they will be able to exert significant influence over our policies and affairs and may be in a position to determine the outcome of corporate actions requiring shareholder approval. These may include, for example, the election of directors, the adoption of amendments to our corporate documents and the approval of mergers and sales of our assets.
RISKS ASSOCIATED WITH POSSIBLE ACQUISITIONS AND NEW BUSINESS VENTURES
If we fail to accurately assess and successfully integrate any recent or future acquisitions or new business ventures, we may not achieve the anticipated benefits, which could result in lower revenues, unanticipated operating expenses, reduced profitability and dilution of our book value per share.
On occasion, we evaluate business opportunities that appear to fit within our overall business strategy. We have completed the following acquisitions and business ventures in recent years:
• | In fiscal 2012, we acquired certain assets and select post-closing liabilities of EMT, a private company based in Las Vegas, Nevada, and a provider of electronic T&M equipment. |
• | In fiscal 2010, we became a reseller of Agilent Technologies, Inc.’s (now Keysight Technologies, Inc.) new T&M equipment in the U.S. and Canada, resulting in the hiring of additional sales and support staff. |
We could decide to pursue one or more other opportunities by acquisition or internal development. Acquisitions and new business ventures, both domestic and foreign, involve many risks, including:
• | the difficulty of integrating acquired operations and personnel with our existing operations; |
• | the difficulty of developing and marketing new products and services; |
• | the diversion of our management’s attention as a result of evaluating, negotiating and integrating acquisitions or new business ventures; |
• | our exposure to unforeseen liabilities of acquired companies; and |
• | the loss of key employees of an acquired operation. |
In addition, an acquisition or new business venture could adversely impact cash flows and/or operating results, and dilute shareholder interests, for many reasons, including:
• | charges to our income to reflect the impairment of acquired intangible assets, including goodwill; |
• | interest costs and debt service requirements for any debt incurred in connection with an acquisition or new business venture; and |
• | any issuance of securities in connection with an acquisition or new business venture that dilutes or lessens the rights of our current shareholders. |
We have implemented various new business ventures in the past, and not all of such ventures have been successful. The risks associated with acquisitions and new business ventures could have a material adverse impact on our operating results and stock price.
10
RISKS ASSOCIATED WITH FLUCTUATING INTEREST RATES
Interest rate fluctuations could have a material adverse effect on our operating results and stock price.
Our leasing yields tend to correlate with market interest rates. When interest rates are higher, our leasing terms incorporate a higher financing charge. However, in times of relatively lower interest rates our financing charges also decrease, and some of our customers choose to purchase new equipment, rather than leasing equipment at all. Lower leasing yields result in lower rental and lease revenues, which could have a material adverse impact on our operating results and stock price.
RISKS ASSOCIATED WITH CHANGES IN GOVERNMENT SPENDING
We have customers in the aerospace and defense industry that derive a significant amount of revenue from the U.S. government. If the U.S. government were to substantially curtail spending for the aerospace and defense industry, it would have a significant negative effect on our revenues and profitability.
The U.S. federal government has implemented significant changes and reductions to government spending and programs. In addition, uncertainty resulting from previously announced defense spending reductions and the potential future additional reductions have impacted, and are likely to continue to impact, the manner in which our customers in the aerospace and defense industry make procurement decisions, resulting in reduced demand by such customers in our rental services and resale business. A shift in government priorities to government programs in which our customers do not participate and/or reductions in funding for or the termination of government programs in which our customers do participate, unless offset by other programs and opportunities, could have a material adverse effect on the demand of our services and products and, as a consequence, our revenues, operating results and stock price.
ANTI-TAKEOVER PROVISIONS
The anti-takeover provisions contained in our Articles of Incorporation and Bylaws and in California law could materially and adversely impact the value of our Common Stock.
Certain provisions of our Articles of Incorporation, our Bylaws and California law could, together or separately, discourage, delay or prevent a third party from acquiring us, even if doing so might benefit our shareholders. This may adversely impact the interests of our shareholders with respect to a potential acquisition and may also affect the price investors would receive for their shares of Common Stock. Some examples of these provisions in our Articles of Incorporation and Bylaws are:
• | the right of our board of directors to issue preferred stock with rights and privileges that are senior to the Common Stock, without prior shareholder approval; and |
• | certain limitations of the rights of shareholders to call a special meeting of shareholders. |
Item 1B: Unresolved Staff Comments.
None.
Item 2. Properties.
We own a building that houses our corporate headquarters and Los Angeles sales office located at 6060 Sepulveda Boulevard, Van Nuys, California. The building contains approximately 84,500 square feet of office space. Approximately 16,000 square feet are currently leased to others. These tenant arrangements provide for all of the leased property to be available for our future needs.
We own a building at 15385 Oxnard Street, Van Nuys, California, which contains approximately 68,200 square feet. We use all of this space, except for 1,000 square feet that are currently being leased to others. This building houses our California warehouse and equipment calibration center.
We own a facility in Wood Dale, Illinois, containing approximately 30,750 square feet. This facility houses our Illinois warehouse and service center.
As of May 31, 2014, we had sales offices in the metropolitan areas of Atlanta and Los Angeles. We also have service centers in Chicago, Dallas, Los Angeles, New York/Newark, San Francisco, Charlotte, Orlando, Toronto, Seattle and Washington/Baltimore. We have foreign sales offices and warehouses in Mechelen, Belgium, and Beijing, China.
Our facilities aggregate approximately 271,000 square feet as of May 31, 2014. Except for the corporate headquarters, the Wood Dale, Illinois facilities and the Oxnard Street building, each of which we own, all of our facilities are rented pursuant to leases for up to seven years for aggregate annual rentals of approximately $1.2 million in fiscal 2014. Most of our leases provide us with the option of renewing our leases at the end of the initial lease term, at the then-existing fair rental value, for periods of up to five years. We do not consider any rented facility essential to our operations. We consider our facilities to be in good condition, well maintained and adequate for our needs.
Item 3. Legal Proceedings.
We are subject to legal proceedings and business disputes involving ordinary routine legal matters and claims incidental to our business. The ultimate legal and financial liability with respect to such matters generally cannot be estimated with certainty and requires the use of estimates in recording liabilities for potential litigation settlements or awards against us. Estimates for losses
11
from litigation are made after consultation with outside counsel. If estimates of potential losses increase or the related facts and circumstances change in the future, we may be required to record either more or less litigation expense. At May 31, 2014 we are not involved in any pending or threatened legal proceedings that we believe could reasonably be expected to have a material adverse effect on our financial condition, results of operations or cash flows.
Item 4. Mine Safety Disclosures.
Not applicable.
PART II
Item 5. Market for the Registrant’s Common Equity, Related Stockholder Matters and Issuer Purchases of Equity Securities.
Market for Common Stock; Holders.
Our Common Stock is quoted on the NASDAQ stock market under the symbol ELRC. There were 307 shareholders of record at August 11, 2014. The following table sets forth, for the periods shown, the high and low sale prices of our Common Stock as reported by NASDAQ.
Fiscal Year 2014 | Fiscal Year 2013 | ||||||||||||||
High | Low | High | Low | ||||||||||||
First Quarter | $ | 19.41 | $ | 16.31 | $ | 18.10 | $ | 13.61 | |||||||
Second Quarter | 21.58 | 17.00 | 18.23 | 13.56 | |||||||||||
Third Quarter | 21.25 | 15.68 | 16.39 | 13.93 | |||||||||||
Fourth Quarter | 19.29 | 14.76 | 18.73 | 15.91 | |||||||||||
Sales of Unregistered Securities.
We did not make any unregistered sales of our securities in fiscal 2014.
Securities Authorized for Issuance Under Equity Compensation Plans.
The following table provides information as of May 31, 2014 with respect to shares of our Common Stock that may be issued under our existing stock incentive plans, all of which were approved by our shareholders:
EQUITY COMPENSATION PLAN INFORMATION
Number of shares of Common Stock to be issued upon exercise of outstanding options, warrants and rights (a) | Weighted-average exercise price of outstanding options, warrants and rights (b) | Number of shares of Common Stock remaining available for future issuance under equity compensation plans (excluding shares reflected in column (a)) (c) | ||
0 | 0 | 498,130 | ||
Stock Repurchases.
We have from time to time repurchased shares of our Common Stock under an authorization from our Board of Directors. Shares repurchased by us are retired and returned to the status of authorized but unissued stock. We did not repurchase any shares during fiscal 2014, 2013 or 2012. We may choose to make additional open market or other purchases of our Common Stock in the future, but we have no commitment to do so.
Dividends.
Since July 2007, we have been paying quarterly dividends each January, April, July and October. For fiscal 2014, we paid total dividends of $0.80 per common share (representing a quarterly dividend of $0.20 per common share), compared to a total of $1.80 per common share in fiscal 2013 (which included a special dividend of $1.00 per common share) and a total of $0.80 per common share in fiscal 2012 amounting to an aggregate of $19.7 million, $43.8 million and $19.4 million for fiscal 2014, 2013 and 2012, respectively. We expect to continue paying a quarterly dividend in future quarters, although the amount and timing of dividends, if any, will be determined by our Board of Directors in each quarter, subject to compliance with applicable law.
12
Performance Graph.
The graph below compares our total shareholder return with (1) the NASDAQ Composite Index, (2) the Russell 2000 Index, and (3) the composite prices of the companies listed by Value Line, Inc. in its Industrial Services Industry Group. Our Common Stock is listed in both the Russell 2000 Index and the Industrial Services Industry Group. The comparison is over a five year period, beginning May 31, 2009 and ending May 31, 2014. The total shareholder return assumes $100 invested at the beginning of the period in our Common Stock and in each index. It also assumes reinvestment of all dividends.
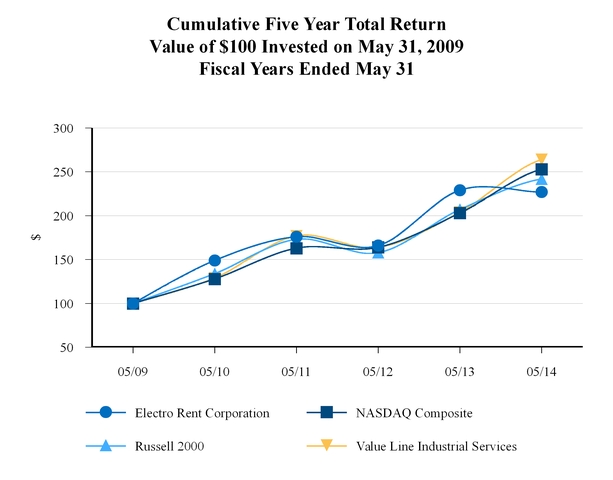
2009 | 2010 | 2011 | 2012 | 2013 | 2014 | ||||||||||||
Electro Rent Corporation | 100 | 149 | 176 | 166 | 229 | 227 | |||||||||||
NASDAQ Composite | 100 | 128 | 163 | 164 | 203 | 253 | |||||||||||
Russell 2000 | 100 | 134 | 173 | 158 | 207 | 242 | |||||||||||
Value Line Industrial Services | 100 | 129 | 177 | 164 | 204 | 264 | |||||||||||
Item 6. Selected Financial Data.
(in thousands, except per share amounts)
The following selected consolidated financial data should be read in conjunction with our audited consolidated financial statements and the accompanying notes included in “Item 8. Financial Statements and Supplementary Data” below and other financial and statistical information included in this Annual Report on Form 10-K.
13
Fiscal year ended May 31, | |||||||||||||||||||
2014 | 2013 | 2012 (1) | 2011 | 2010 (2) | |||||||||||||||
Operations data: | |||||||||||||||||||
Revenues | $ | 241,137 | $ | 248,731 | $ | 248,554 | $ | 228,729 | $ | 145,867 | |||||||||
Costs of revenues and depreciation | 150,078 | 155,477 | 159,218 | 144,582 | 90,319 | ||||||||||||||
Selling, general and administrative expenses | 58,920 | 56,543 | 53,250 | 47,412 | 37,794 | ||||||||||||||
Operating profit | 32,139 | 36,711 | 36,086 | 36,735 | 17,754 | ||||||||||||||
Bargain purchase gain, net (3) | — | — | 3,435 | 202 | 679 | ||||||||||||||
Interest and other, net | 387 | 402 | 484 | 352 | 1,599 | ||||||||||||||
Income before income taxes | 32,526 | 37,113 | 40,005 | 37,289 | 20,032 | ||||||||||||||
Income tax provision | 12,118 | 14,359 | 14,233 | 13,533 | 8,435 | ||||||||||||||
Net income | $ | 20,408 | $ | 22,754 | $ | 25,772 | $ | 23,756 | $ | 11,597 | |||||||||
Earnings per share: | |||||||||||||||||||
Basic | $ | 0.84 | $ | 0.94 | $ | 1.07 | $ | 0.99 | $ | 0.48 | |||||||||
Diluted | $ | 0.84 | $ | 0.94 | $ | 1.07 | $ | 0.99 | $ | 0.48 | |||||||||
Shares used in per share calculation: | |||||||||||||||||||
Basic | 24,325 | 24,226 | 23,983 | 23,974 | 23,932 | ||||||||||||||
Diluted | 24,357 | 24,269 | 24,152 | 24,072 | 24,004 | ||||||||||||||
Balance sheet data (at end of year): | |||||||||||||||||||
Total assets | $ | 302,058 | $ | 318,926 | $ | 329,831 | $ | 305,927 | $ | 276,068 | |||||||||
Bank borrowings | $ | — | $ | 10,000 | $ | — | $ | — | $ | — | |||||||||
Shareholders’ equity | $ | 230,958 | $ | 228,549 | $ | 248,131 | $ | 240,375 | $ | 229,962 | |||||||||
Shareholders’ equity per common share | $ | 9.62 | $ | 9.52 | $ | 10.34 | $ | 10.02 | $ | 9.60 | |||||||||
Cash dividends declared per common share | $ | 0.80 | $ | 1.80 | $ | 0.80 | $ | 0.60 | $ | 0.45 | |||||||||
(1) | Includes the post-acquisition operating results and year-end balance sheet information for the assets acquired from EMT on August 24, 2011. (See Note 3 to the consolidated financial statements included in this Annual Report on Form 10-K). |
(2) | Includes the post-acquisition operating results and year-end balance sheet information for the assets acquired from Telogy on March 31, 2010. |
(3) | The estimated fair value of the net assets acquired from EMT in fiscal 2012 and Telogy in fiscal 2010 (further adjusted in fiscal 2011) exceeded the acquisition cost, resulting in bargain purchase gains with respect to these transactions. |
Item 7. Management’s Discussion and Analysis of Financial Condition and Results of Operations.
The following discussion of our financial condition and results of operations should be read in conjunction with the consolidated financial statements and the notes thereto and the other financial and statistical information appearing elsewhere in this Annual Report on Form 10-K.
OVERVIEW
We are one of the largest global organizations devoted to the rental, lease and sale of new and used electronic T&M equipment. We purchase that equipment from leading manufacturers such as Keysight, Anritsu, and Tektronix primarily for use by our customers in the aerospace, defense, telecommunications, electronics, industrial and semiconductor industries.
In addition, although it represented only approximately 8%, 7% and 7% of our revenues in fiscal 2014, 2013 and 2012, respectively, we believe our DP division is one of the largest rental businesses in the United States for personal computers and servers from manufacturers including Dell, HP/Compaq, IBM, Toshiba and Apple.
In fiscal 2010, we became a reseller for Agilent, the largest T&M equipment manufacturer in North America. On May 29, 2014, we entered into a new agreement with Agilent, pursuant to which we were appointed as a reseller for certain new and premium used T&M products and services in the United States and Canada. This agreement replaced and superseded the previous agreement dated December 1, 2009, which expired according to its terms on May 31, 2014. Agilent has, effective August 1, 2014, assigned our reseller agreement to its wholly-owned subsidiary, Keysight, in connection with the planned spin-off by Agilent of Keysight into a separate publicly traded company, which Agilent has announced it expects to complete by November
14
2014. Our reseller agreement with Keysight provides us with the exclusive right to sell Keysight’s more complex T&M equipment to small and medium size customers (who previously purchased directly from Agilent/Keysight).
We do not currently have reseller agreements with any other manufacturers for equipment similar to that included in our Keysight reseller agreement. In addition, we sell used equipment from a variety of manufacturers that was previously in our rental and lease pool.
We have a focused sales strategy, using a direct sales force to meet our customers’ needs in our T&M equipment rental, lease and sales business. We have a large technical sales force that consists primarily of field engineers and applications engineers, each of whom specializes in all the products and services offered by our company. Our sales force is usually assigned to specific territories, and identifies potential customers through coordinated efforts with our marketing organization. Our marketing organization is staffed by professionals with many years of industry-related experience. As our customers have a wide range of requirements for equipment, our sales force is able to leverage our extensive knowledge of the test and measurement equipment environment to determine the right product to rent, lease or sell to the customer to meet the customer’s specific needs.
Our sales force also specializes in configuring new Keysight equipment to sell to our customers that is tailored to the customer’s need. These configurations typically start with a base model, which is frequently upgraded through an extensive list of options in order to perform the customer’s specific test or measurement. Once the configuration is determined, it serves as the basis for our orders to Keysight, who builds the product accordingly. We order equipment from Keysight once the customer has placed an order with us. Equipment is typically shipped directly to the customer by Keysight at our request. Occasionally, equipment is shipped to our warehouse prior to delivery to the customer. Inventory held for sale is immaterial and is therefore included in other assets in our consolidated balance sheets. Each order and sales invoice is subject to our standard sales terms and conditions, which include provisions covering equipment delivery delays and warranty services.
On August 24, 2011, we completed the acquisition of certain assets (including accounts receivable and rental equipment but excluding certain designated assets) and the assumption of specified post-closing liabilities of EMT, for $10.7 million in cash, of which $0.5 million was deposited into an escrow account for any post-closing adjustments. The purchase price was reduced by $0.3 million reflecting the final determination of the post-closing adjustment of the purchase price in accordance with the asset purchase agreement with EMT. (See Note 3 to the consolidated financial statements included in this Annual Report on Form 10-K).
In recent years, our financial results have been impacted by competitive pressure on rental rates due in large part to the recession and subsequent weakness in the U.S. economy and our major international markets. During fiscal 2013, our revenues were flat compared to fiscal 2012 as growth in our rental and leasing business and increased sales of used equipment, in part due to a large buyout of used equipment by a customer in the third fiscal quarter of 2013, was offset by a decline in sales of new equipment. Our operating profit increased modestly for fiscal 2013 as compared to fiscal 2012, as growth in our higher margin rental and lease revenues and used equipment sales offset declines in our sales of new equipment, which typically have lower operating margins. During fiscal 2014, our revenues declined slightly and our operating profit declined moderately as compared to fiscal 2013, primarily due to a decline in our new equipment sales revenue, partially offset by growth in our higher margin rental and lease revenues. Our new equipment sales continue to be affected by delays in our customers’ procurement decisions, resulting in decreased demand, particularly in the aerospace and defense sector due to uncertainty regarding U.S. government defense spending. We have also seen a softening in the telecommunications and semiconductor manufacturing sectors. We experienced an increase in our selling, general and administrative expenses as a result of our infrastructure investment which began in fiscal 2011 and continued throughout fiscal 2012, 2013 and 2014 in support of our continued investment in our oversees operations, the strengthening of our IT and financial infrastructure and the expansion of our sales and marketing organization in support of future opportunities.
Economic uncertainty continues to impact certain industries that we serve. We will continue to focus on remaining profitable in the current conditions, as well as being prepared for the possibility that recessionary trends may return in future periods.
To maximize our overall profit from the rental, leasing, and sales of equipment, we manage our equipment pool on an on-going basis by controlling the timing, pricing and mix of our purchases and sales of equipment. We acquire new and used equipment to meet current technological standards and current and anticipated customer demand, and we sell our used equipment where we believe that is the most lucrative option. We employ a complex equipment management strategy and our proprietary PERFECT software to adjust our equipment pool and pricing on a dynamic basis in order to maximize equipment availability, utilization and profitability. If we do not accurately predict market trends, or if demand for the equipment we supply declines, we can be left with equipment that we are unable to rent or sell for a profit. We assess the carrying value of the equipment pool on an annual basis or more frequently when factors indicating potential impairment are present.
15
We have revenues, expenses, assets and liabilities in foreign currencies, primarily the euro, the Canadian dollar and the Chinese yuan, due to our foreign operations. We enter into forward contracts to hedge against unfavorable currency fluctuations in our monetary assets and liabilities in our European and Canadian operations. Our exposure to fluctuations in the Chinese yuan is not significant. These contracts are designed to minimize the effect of fluctuations in foreign currencies. As a result of these forward contracts, as well as the relative stability of these foreign currencies, the impact on our operating results from foreign currency fluctuations has been insignificant. See “Item 7A-Quantitative and Qualitative Disclosures about Market Risk-Changes in Foreign Currencies” for additional information about our exposure to foreign currency exchange risk.
Profitability and Key Business Trends
Comparing fiscal 2014 to fiscal 2013, our revenues decreased by 3.1% from $248.7 million to $241.1 million, our operating profit decreased 12.5% from $36.7 million to $32.1 million and our net income decreased by 10.3% from $22.8 million to $20.4 million.
Our rental and lease revenues increased by 0.6%, from $136.6 million for fiscal 2013 to $137.4 million for fiscal 2014. For fiscal 2014 and 2013, 88% of our rental and lease revenues were derived from T&M equipment. Our T&M rental revenues decreased $0.1 million due to a decrease in demand of $2.2 million offset by an increase in rental rates of $2.1 million. Our T&M lease revenues decreased $0.1 million due to a decrease in lease rates of $0.4 million offset by an increase in demand of $0.3 million. Rental and lease revenues in our DP segment increased $0.6 million and $0.4 million, respectively, due to an increase in rental and lease rates.
Our sales of equipment and other revenues decreased 7.5%, from $112.1 million for fiscal 2013 to $103.7 million for fiscal 2014. This decrease was primarily due to a decline in new equipment sales, which continue to be affected by delays in our customers’ procurement decisions, resulting in decreased demand, particularly in the aerospace and defense sector due to uncertainty regarding U.S. government defense spending. We have also seen a softening in the telecommunications and semiconductor manufacturing sectors.
For fiscal 2014, our operating profit decreased 12.5% compared to fiscal 2013. Our rental and lease business contributed an additional $0.1 million in operating profit resulting from a) a $0.8 million, or 0.6%, increase in rental and lease revenues, b) an offsetting increase in depreciation expense of $0.2 million, or 0.4%, due to a higher average rental equipment pool, and c) an offsetting increase in our costs of rentals and leases, excluding depreciation, of $0.5 million, or 2.8%. Sales of equipment and other revenues decreased $8.4 million, or 7.5%, resulting in a decline of $2.3 million in operating profit. Although our higher margin used equipment sales contributed an additional $1.7 million in revenue, this was offset by a $9.1 million decline in revenue from sales of our lower margin new equipment. The remaining decrease in sales of equipment and other revenues is attributable to a $1.0 million decrease in other revenue. Our selling, general and administrative expenses increased by 4.2% from $56.5 million in fiscal 2013 to $58.9 million in fiscal 2014, primarily due to our continued investment in our oversees operations, the strengthening of our IT and financial infrastructure and the expansion of our sales and marketing organization in support of future opportunities. Our net income for fiscal 2012 included a bargain purchase gain, net of deferred taxes, of $3.4 million as a result of our acquisition of EMT.
Some of our key profitability measurements are presented below:
Fiscal 2014 | Fiscal 2013 | Fiscal 2012 | |||||||||
Net income per diluted common share (EPS) | $ | 0.84 | $ | 0.94 | $ | 1.07 | |||||
Net income as a percentage of average assets | 6.5 | % | 7.0 | % | 8.1 | % | |||||
Net income as a percentage of average equity | 8.8 | % | 9.6 | % | 10.7 | % | |||||
Our average acquisition cost of equipment for rent and lease in our equipment pool is presented below:
Average acquisition cost of equipment (in millions) | Fiscal 2014 vs. Fiscal 2013 | Fiscal 2013 vs. Fiscal 2012 | |||||||||||||||||||
2014 | 2013 | Change | 2013 | 2012 | Change | ||||||||||||||||
On rent | $ | 238.6 | $ | 245.5 | (2.8 | )% | $ | 245.5 | $ | 234.1 | 4.9 | % | |||||||||
On lease | $ | 37.2 | $ | 35.0 | 6.3 | % | $ | 35.0 | $ | 31.7 | 10.4 | % | |||||||||
The decrease in our average equipment on rent is due to a decline in demand in our T&M North American operations, in particular in the aerospace and defense sector, partially offset by increased demand in our T&M foreign operations. Our average equipment on lease increased due to higher demand in North American operations.
16
Average rental rates increased by 2.8% in fiscal 2014 as compared to fiscal 2013 and 2.7% as compared to fiscal 2012. Our average lease rates decreased by 0.8% in fiscal 2014 as compared to fiscal 2013, and 3.4% as compared to fiscal 2012. The increase in rental rates is the result of growth in industries where we realize higher rental rates.
Average utilization for our T&M equipment pool, calculated based on average acquisition cost of equipment on rent and lease compared to the average total equipment pool, decreased to 64.9% for fiscal 2014, compared to 66.9% for fiscal 2013 and 67.7% for fiscal 2012. The average utilization of our DP equipment pool, based on the same method of calculation, was 35.7% for fiscal 2014, compared to 35.6% for fiscal 2013 and 38.1% for fiscal 2012. Our utilization rate fluctuates frequently, and is impacted by new equipment purchases in support of existing and potential business, and sales of used equipment.
As of May 31, 2014, we had a sales order backlog for new T&M equipment of $10.7 million, compared to $7.6 million as of May 31, 2013 and $8.4 million as of May 31, 2012. The increase in backlog is primarily due to longer manufacturing lead times on certain products as well as an increase in demand.
RESULTS OF OPERATIONS
Fiscal 2014 Compared with Fiscal 2013
Total Revenues: Total revenues for fiscal 2014 and 2013 were $241.1 million and $248.7 million, respectively. The 3.1% decrease in total revenues was due to a 7.5% decrease in sales of equipment and other revenues offset by a 0.6% increase in rental and lease revenues.
Rental and lease revenues for fiscal 2014 were $137.4 million, compared to $136.6 million for the prior fiscal year. This increase is due to an increase in rental rates in our T&M and DP segments, due to our growth in industries where we realize higher rental rates, and increased demand in our Chinese and European operations. This increase was offset, in part, by a decrease in demand in our North American operations due to softening in the aerospace and defense and semiconductor industries. Our lease revenues increased primarily due to higher demand for T&M equipment, while our DP lease revenues increased slightly.
Sales of equipment and other revenues decreased to $103.7 million for fiscal 2014 from $112.1 million in the prior year. Sales of used equipment, including finance leases, increased to $32.8 million for fiscal 2014, compared to $31.0 million for fiscal 2013 while sales of new equipment decreased to $65.8 million for fiscal 2014 compared to $74.9 million for fiscal 2013. Our new equipment sales continue to be affected by delays in our customers’ procurement decisions, resulting in decreased demand, particularly in the aerospace and defense sector due to uncertainty regarding U.S. government defense spending. We have also seen a softening in the telecommunications and semiconductor manufacturing sectors.
Operating expenses
Depreciation of Rental and Lease Equipment: Depreciation of rental and lease equipment remained relatively consistent at $57.0 million, or 41.5% of rental and lease revenues in fiscal 2014 compared to $56.8 million, or 41.6% of rental and lease revenues in fiscal 2013. The depreciation ratio stayed consistent due to increases in our rental rates of our DP equipment offset by decreases in our lease and utilization rates of our T&M equipment.
Costs of Rentals and Leases, Excluding Depreciation: Costs of rentals and leases, excluding depreciation, which primarily includes labor related costs of our operations personnel, supplies, repairs, and insurance and warehousing costs associated with our rental and lease equipment, increased to $18.3 million for fiscal 2014 compared to $17.8 million for fiscal 2013, primarily due to higher labor related costs to support growth in our rental and lease business. This expense is not expected to significantly fluctuate from period to period, as only moderate changes are required from time to time to handle changes in rental and lease activity.
Costs of Sales of Equipment and Other Revenues: Costs of sales of equipment and other revenues, which primarily include the costs of equipment sales, decreased to $74.8 million for fiscal 2014 from $80.9 million in fiscal 2013. Costs of sales of equipment and other revenues as a percentage of sales of equipment and other revenues remained flat at 72.1% in fiscal 2014 and fiscal 2013. Our sales margin percentage is expected to fluctuate depending on the mix of used and new equipment sales. Our sales margin is also impacted by competition, economic uncertainty, changes in U.S. governmental policies, and customer requirements and funding.
Selling, General and Administrative Expenses: Selling, general and administrative expenses increased 4.2% to $58.9 million in fiscal 2014 compared to $56.5 million in fiscal 2013. As a percentage of total revenues, selling, general and administrative expenses increased modestly to 24.4% in fiscal 2014 from 22.7% in fiscal 2013. The increase in selling, general, and administrative reflects our continued investment in our oversees operations, the strengthening of our IT and financial infrastructure and the expansion of our sales and marketing organization in support of future opportunities.
17
Income Tax Provision: Our effective tax rate was 37.3% for fiscal 2014, compared to 38.7% for fiscal 2013. The decrease for fiscal 2014 is due to more income being apportioned to states with lower tax rates resulting in a lower effective state rate as well as the recognition of certain Belgian tax credits which had no impact in fiscal 2013.
Fiscal 2013 Compared with Fiscal 2012
Total Revenues: Total revenues for fiscal 2013 and 2012 were $248.7 million and $248.6 million, respectively. The 0.1% increase in total revenues was due to a 5.3% increase in rental and lease revenues offset by a 5.6% decrease in sales of equipment and other revenues.
Rental and lease revenues for fiscal 2013 were $136.6 million, compared to $129.7 million for the prior fiscal year. This increase was due to an increase in T&M rental and lease demand, in particular in our North American operations, due in part to the acquisition of EMT, and the integration of our resale organization and T&M sales force, which began in the first quarter of fiscal 2012, providing additional rental opportunities to an expanding customer base, and higher demand from our customers in lieu of new equipment purchases. This increase was partially offset by a decline in rental and lease revenues in our DP business, due to a decrease in demand.
Sales of equipment and other revenues decreased to $112.1 million for fiscal 2013 from $118.8 million in the prior year. Sales of used equipment, including finance leases, increased to $31.0 million for fiscal 2013, compared to $24.9 million for fiscal 2012, in part due to a large buyout by a customer in the third quarter of fiscal 2013, while sales of new equipment decreased to $75.0 million for fiscal 2013 compared to $88.4 million for fiscal 2012, as our customers that traditionally purchase new equipment delayed procurement decisions due to changes in the U.S. national budgetary policy and uncertainty in the global economy.
Operating expenses
Depreciation of Rental and Lease Equipment: Depreciation of rental and lease equipment increased in fiscal 2013 to $56.8 million, or 41.6% of rental and lease revenues, from $53.7 million, or 41.4% of rental and lease revenues, in fiscal 2012. The increased depreciation expense in fiscal 2013 was due to a higher average rental and lease equipment pool. The depreciation ratio, as a percentage of rental and lease revenues, marginally increased due to a moderate decline in utilization rates while rental rates were flat.
Costs of Rentals and Leases, Excluding Depreciation: Costs of rentals and leases, excluding depreciation, which primarily include labor related costs of our operations personnel, supplies, repairs, and insurance and warehousing costs associated with our rental and lease equipment, increased to $17.8 million for fiscal 2013 compared to $17.3 million for fiscal 2012, primarily due to higher labor related costs to support growth in our rental and lease business. This expense is not expected to significantly fluctuate from period to period, as only moderate changes are required from time to time to handle changes in rental and lease activity.
Costs of Sales of Equipment and Other Revenues: Costs of sales of equipment and other revenues, which primarily include the costs of equipment sales, decreased to $80.9 million for fiscal 2013 from $88.2 million in fiscal 2012. Costs of sales of equipment and other revenues decreased as a percentage of sales of equipment and other revenues to 76.3% in fiscal 2013 from 77.8% in fiscal 2012. This decrease is due to a decline in sales of new T&M equipment, which generally carry a lower margin than used equipment sales, while higher margin used equipment sales increased. Our sales margin percentage is expected to fluctuate depending on the mix of used and new equipment sales. Our sales margin is also impacted by competition, economic uncertainty, changes in U.S. governmental policies, and customer requirements and funding.
Selling, General and Administrative Expenses: Selling, general and administrative expenses increased 6.2% to $56.5 million in fiscal 2013 compared to $53.3 million in fiscal 2012. As a percentage of total revenues, selling, general and administrative expenses increased modestly to 22.7% in fiscal 2013 from 21.4% in fiscal 2012. Our selling, general and administrative expenses increased primarily due to the broadening and strengthening of our sales and sales support organizations, as well as our administrative infrastructure, necessary to support our sales and rental demand and to better focus on future growth opportunities.
Gain on Bargain Purchase: We recorded a gain on bargain purchase, net of deferred taxes, of $3.4 million during fiscal 2012 related to our acquisition of EMT. The gain on bargain purchase, net of deferred taxes, resulted from the excess of the net fair value of the assets acquired and liabilities assumed in the EMT acquisition, over the respective purchase price. We believe that we were able to negotiate a bargain purchase price as a result of our access to the liquidity necessary to complete the transaction, and the recurring losses and bankruptcy filing of EMT.
Income Tax Provision: Our effective tax rate was 38.7% for fiscal 2013, compared to 35.6% for fiscal 2012. The increase for fiscal 2013 is due to a bargain purchase gain, net of deferred taxes, of $3.4 million for fiscal 2012, related to our purchase of
18
EMT on August 24, 2011. Bargain purchase gains are recorded net of deferred taxes and are treated as permanent differences, resulting in a lower effective tax rate in the period recorded.
Liquidity and Capital Resources
We have three principal sources of liquidity: cash flows provided by our operating activities, proceeds from the sale of equipment from our portfolio, and external funds that historically have been provided by bank borrowings. We believe that cash and cash equivalents, cash flows from operating activities, proceeds from the sale of equipment and our borrowing capacity will be sufficient to fund our operations for at least the next twelve months.
Cash and Cash Equivalents. The balance of our cash and cash equivalents was $5.9 million at May 31, 2014, a decrease of $4.5 million from May 31, 2013, in part because we chose to borrow less, with bank borrowings declining to $0 as of May 31, 2014 from $10.0 million as of May 31, 2013. Outside of our normal operations and equipment purchases, we use our cash to pay dividends to shareholders and to take advantage of strategic acquisitions and new customer opportunities.
We expect that the level of our cash needs may increase if we increase equipment purchases in response to demand, finance an acquisition, or pursue other opportunities. We do not intend to repatriate the funds from our foreign operations as we consider these earnings to be invested indefinitely.
Given our growth record achieved since fiscal 2000, and our available line of credit under which we have $25.0 million remaining that we may borrow as of May 31, 2014, we believe that we have ample access to borrowing capacity and that our cash flows from operations and ability to borrow will allow us to continue funding our current and future growth. We may, however, seek to expand our borrowing capacity in order to ensure sufficient resources to quickly respond to strategic growth opportunities.
Cash Flows. During fiscal 2014, 2013, and 2012 net cash provided by operating activities was $49.2 million, $68.9 million and $69.9 million, respectively. Operating cash flow for fiscal 2014 decreased as compared to fiscal 2013 primarily due to income taxes paid of $23.8 million in fiscal 2014 as compared to $15.6 million in fiscal 2013, a decline in net income and a decrease in working capital. Operating cash flow for fiscal 2013 was comparable to fiscal 2012 as an improvement in our working capital and an increase in income, after giving effect to non-cash items, was offset by tax payments of $15.6 million for fiscal 2013, compared to a tax refund, net of taxes paid, of $0.5 million for fiscal 2012.
During fiscal 2014, 2013 and 2012, net cash used in investing activities was $23.8 million, $34.1 million and $82.9 million, respectively. The decline in cash used in investing activities for fiscal 2014 was due, in part, to a decrease in payments for purchases of rental and lease equipment to $58.7 million from $64.1 million and $96.7 million for fiscal 2013 and 2012, respectively. Payments for purchase of other property also decreased to $0.4 million in fiscal 2014 from $1.1 million in fiscal 2013 and $0.9 million in fiscal 2012. Proceeds from sale of rental and lease equipment were $35.2 million for fiscal 2014 compared to $31.1 million for fiscal 2013 and $25.0 million for fiscal 2012. Fiscal 2012 includes cash paid for the acquisition of EMT of $10.3 million.
During fiscal 2014, 2013 and 2012, net cash flows used in financing activities were $29.5 million, $33.6 million and $19.3 million, respectively. These funds used were primarily composed of borrowings and payments under the bank's line of credit of $56.0 million and $66.0 million in fiscal 2014, $63.5 million and $53.5 million in fiscal 2013 and $3.3 million and $3.3 million in fiscal 2012, respectively. We also paid dividends of $19.7 million for fiscal 2014, $43.8 million for fiscal 2013 and $19.4 million for fiscal 2012.
As the following table illustrates, aggregate cash flows from operating activities and proceeds from the sale of equipment have provided 127% of the funds required for equipment purchased for the three years ended May 31, 2014, excluding equipment purchased in connection with acquisitions.
(in thousands) | Fiscal Three Years Ended May 31, 2014 | 2014 | 2013 | 2012 | |||||||||||
Cash flows from operating activities1 | $ | 187,991 | $ | 49,186 | $ | 68,930 | $ | 69,875 | |||||||
Proceeds from sale of equipment | 91,385 | 35,224 | 31,119 | 25,042 | |||||||||||
Total | 279,376 | 84,410 | 100,049 | 94,917 | |||||||||||
Payments for equipment purchases | (219,475 | ) | (58,678 | ) | (64,088 | ) | (96,709 | ) | |||||||
Net increase/(decrease) in equipment portfolio at acquisition cost | 72,247 | (214 | ) | 11,972 | 60,489 | ||||||||||
1 For the components of cash flows from operating activities see the consolidated statements of cash flows.
19
Credit Facilities. We have a $25.0 million revolving bank line of credit, subject to certain restrictions, to meet equipment acquisition needs as well as working capital and general corporate requirements. We borrowed $56.0 million and repaid $66.0 million on our line of credit during fiscal 2014. As of May 31, 2014, we had no borrowings outstanding under the revolving bank line of credit. There are no other bank borrowings outstanding or off balance sheet financing arrangements at May 31, 2014. We are in compliance with all loan covenants at May 31, 2014.
Capital Expenditures. Our primary capital requirements have been purchases of rental and lease equipment. We generally purchase equipment throughout the year to replace equipment that has been sold and to maintain adequate levels of rental equipment to meet existing and expected customer demands. To meet T&M rental demand, support areas of potential growth for both T&M and DP equipment and to keep our equipment pool technologically up-to-date, we made payments for purchases of $58.7 million of rental and lease equipment during fiscal 2014, $64.1 million in fiscal 2013 and $96.7 million in fiscal 2012, excluding $15.8 million, at fair value, of rental and lease equipment acquired in connection with our acquisition of EMT in fiscal 2012. The decrease in equipment purchases of 8.6% from fiscal 2013 to fiscal 2014 is due to equipment purchases returning to historical levels after the unusually high payment level of fiscal 2012 which reflected recovery from the preceding economic downturn.
Dividends. For fiscal 2014, we paid dividends of $0.80 per common share, compared to $1.80 per common share in fiscal 2013 (including a special dividend of $1.00 per common share) and $0.80 per common share in fiscal 2012 amounting to an aggregate of $19.7 million, $43.8 million and $19.4 million for fiscal 2014, 2013 and 2012, respectively. We expect to continue paying a quarterly dividend in future quarters, although the amount and timing of dividends, if any, will be made at the discretion of our board of directors in each quarter, subject to compliance with applicable law.
Inflation. Inflation generally has favorably influenced our results of operations by enhancing the sale prices of our used equipment. However, lower inflation rates and the continued availability of newer, less expensive equipment with similar or better specifications over a period of several years could result in lower relative sale prices for used electronic equipment, which could reduce margins and earnings. Prices of new and used electronic test equipment have not consistently followed the overall inflation rate, while prices of new and used personal computers and servers have consistently declined. Because we are unable to predict the advances in technology and the rate of inflation for the next several years, it is not possible to estimate the impact of these factors on our margins and earnings.
CONTRACTUAL OBLIGATIONS
At May 31, 2014, our material contractual obligations consisted of operating leases for facilities. We lease certain facilities under various operating leases. Most of the lease agreements provide us with the option of renewing the lease at the end of the initial lease term, at the fair rental value, for periods of up to five years. In most cases, we expect that facility leases will be renewed or replaced by other leases in the normal course of business.
The table below presents the expected amount of payments due under our contractual obligations, as of May 31, 2014, but does not reflect changes that could arise after that time:
Payments due by period | |||||||||||||||||||
Contractual Obligations (in thousands) | Total | Less than 1 year | 2-3 years | 3-5 years | More than 5 years | ||||||||||||||
Facility lease payments, not including property taxes and insurance | 1,469 | 773 | 634 | 62 | — | ||||||||||||||
Total | $ | 1,469 | $ | 773 | $ | 634 | $ | 62 | $ | — | |||||||||
CRITICAL ACCOUNTING POLICIES AND ESTIMATES
The preparation of consolidated financial statements in conformity with accounting principles generally accepted in the United States of America (“generally accepted accounting principles”) requires us to make estimates and assumptions that affect the reported amounts of assets and liabilities and the disclosure of contingent assets and liabilities at the date of the financial statements, as well as the reported amounts of revenues and expenses during the reporting period. On a regular basis, we review these estimates, including those related to asset lives and depreciation methods, impairment of long-lived assets (including rental and lease equipment and definite lived intangibles), impairment of goodwill and income taxes. These estimates are based on our historical experience and on various other assumptions we believe to be reasonable under the circumstances. Actual results may differ from these estimates under different assumptions or conditions.
We believe the following accounting policies involve the more significant judgments and estimates used in the preparation of our financial statements:
Asset Lives and Depreciation Methods: Our primary business involves the purchase and subsequent rental and lease of long-lived electronic equipment. We have chosen asset lives that we believe correspond to the economic lives of the related assets. We have chosen depreciation methods that we believe generally match our benefit from the assets with the associated costs.
20
These judgments have been made based on our expertise in each equipment type that we carry. If the asset life and depreciation method chosen do not reduce the book value of the asset to at least our potential future cash flows from the asset, we would be required to record an impairment loss. Depreciation methods and useful lives are periodically reviewed and revised as deemed appropriate.
Impairment of Long-Lived Assets: The carrying value of equipment held for rental and lease is assessed quarterly or when circumstances indicate that the carrying amount of equipment may not be recoverable. Recoverability of equipment to be rented and leased is measured by a comparison of the carrying amount to the undiscounted future cash flows expected to be generated by the asset. If the current carrying value exceeds the estimated undiscounted cash flows, an impairment loss is recorded equal to the difference between the asset’s current carrying value and its fair value as described in FASB ASC Topic No. 820, Fair Value Measurements and Disclosures. Based upon such periodic assessments, no impairments occurred during fiscal 2014, 2013 and 2012.
Goodwill Impairment: We recognized goodwill of $3.1 million on the acquisition of Rush Computer Rentals in January 2006. Goodwill, which represents the excess of purchase price over the fair value of net assets acquired is discussed further in Note 4 to our consolidated financial statements included in this Form 10-K. Pursuant to FASB ASC Topic No. 350, Intangibles – Goodwill and Other (“ASC 350”), goodwill is not amortized but tested annually for impairment, or on an interim basis if an event occurs or circumstances change that would reduce the fair value of a reporting unit below its carrying value. In connection with the annual impairment test for goodwill, we have the option to perform a qualitative assessment to determine whether it is more likely than not that the fair value of the reporting unit is less than its carrying amount. If we determine that it was more likely than not that the fair value of the reporting unit is less than its carrying amount, then we perform the impairment test. The impairment test involves a two-step process. The first step involves comparing the fair values of the applicable reporting units with their aggregate carrying values, including goodwill. We generally determine the fair value of our reporting units using the market approach methodology of valuation. If the carrying value of a reporting unit exceeds the reporting unit’s fair value, we perform the second step of the test to determine the amount of impairment loss. The second step involves measuring the impairment by comparing the implied fair values of the affected reporting unit’s goodwill with the carrying amount of that goodwill. We completed the required impairment review at the end of fiscal 2014, 2013 and 2012 and concluded that there were no impairments.
Revenue Recognition—Principal Agent Considerations: In accordance with accounting guidance, we are acting as the principal with respect to sales of new equipment through our resale agreement, based on several factors, including: (1) We act as the primary obligor by working directly with our customers to define their needs, providing them with options to satisfy such needs, contracting directly with the customer, and, to the extent required, providing customers with instruction on the use of the product and additional technical support once the product is received by the customer. The product manufacturer is not a party to our customer sales agreements, nor is it referenced in the agreements, and therefore has no obligation to our customers with the exception of the manufacturer’s standard warranty on the product. (2) We bear back-end risk of inventory loss with respect to any product return from the customer as the original manufacturer is not required to accept returns of equipment from us. We also bear front-end risk of inventory loss in those cases where we acquire products for resale into our inventory prior to shipment to customers. (3) We have full discretion in setting pricing terms with our customers and to negotiate all such terms ourselves. (4) We assume all credit risk. Accordingly, sales of new equipment through our resale channel are recorded in Sales of Equipment and Other Revenues and the related equipment costs are recorded in Costs of Sales of Equipment and Other Revenues in our consolidated statements of operations.
Income Taxes: We are required to estimate income taxes in each of the jurisdictions in which we operate. Significant judgment is required in determining the provision for income taxes and deferred tax assets and liabilities. This process involves us estimating actual current tax exposure and assessing temporary differences resulting from differing treatment of items, such as depreciation and amortization, for tax and accounting purposes. These differences result in deferred tax assets and liabilities, which are included within our consolidated balance sheet. We then assess the likelihood that our deferred tax assets will be recovered. To the extent management believes that recovery is not likely, we establish a valuation allowance. We determined that a valuation allowance was required in fiscal 2014, 2013 and 2012 of $0.3 million, $1.1 million and $0.9 million, respectively, for our deferred tax asset related to certain foreign net operating loss carry forwards and other related timing differences.
The guidance for uncertain income tax positions provides that the tax effects of a position be recognized only if it is “more-likely-than-not” to be sustained based solely on its technical merits as of the reporting date. The more-likely-than-not threshold represents a positive assertion by us that our company is entitled to the economic benefits of a tax position. If a tax position is not considered more-likely-than-not to be sustained based solely on its technical merits, no benefits of the position are to be recognized. There were no uncertain tax positions in fiscal 2014, 2013 and 2012.
OFF BALANCE SHEET TRANSACTIONS
As of May 31, 2014 we did not have any “off-balance-sheet arrangements,” as defined in Item 303(a)(4)(ii) of Regulation S-K.
Item 7A. Quantitative and Qualitative Disclosures about Market Risk.
We could be exposed to market risks related to changes in interest rates and foreign currency exchange rates.
Interest Rate and Market Risk.
We are exposed to fluctuations in interest rates on our commercial credit agreement with J.P. Morgan Chase Bank, National Association ("JPM") which matures on November 19, 2016. Borrowings under the Credit Agreement bear interest at a rate equal to, at our election, the applicable rate for a “Eurodollar Loan” or a “CB Floating Rate Loan.” Eurodollar Loan advances accrue interest at a per annum interest rate equal to (i) the quotient (rounded upwards to the next 1/16th of 1%) of (a) the applicable LIBO Rate, divided by (b) one minus the maximum aggregate reserve requirement (expressed as a decimal) imposed under Federal Reserve Board Regulation D (the “Adjusted LIBO Rate”), plus (ii) 0.75%. CB Floating Rate Loan advances accrue interest at a per annum interest rate equal to (i) the higher of (a) JPM’s Prime Rate or (b) the Adjusted LIBO Rate for a one month interest period plus 2.5%, minus (ii) 2.0%. In addition, we pay a commitment fee of 0.10% of the unused amount if the average borrowing under the Credit Agreement is less than or equal to $8.0 million on a quarterly basis.
Our borrowings under our commercial credit agreement at May 31, 2014 and 2013 were $0 and $10.0 million, respectively. As our borrowings outstanding have not been significant, and the interest rate is low, a hypothetical increase in interest rates by 10% would not have a material impact on our financial condition or results of operations.
Changes in Foreign Currencies.
We have wholly owned Chinese and European subsidiaries. In addition, we have revenues, cash and cash equivalents and accounts receivable in other foreign currencies, primarily the Canadian dollar. Our international operations subject us to foreign currency risks (i.e., the possibility that the financial results could be better or worse than planned because of changes in foreign currency exchange rates). During fiscal 2010 we began using forward contracts to hedge our economic exposure with respect to assets and liabilities denominated in foreign currencies. Given the extent of our international operations and our hedging, we would not expect a 10% change in foreign currency rates to have a material impact on our financial condition or results of operations.
Item 8. Financial Statements and Supplementary Data.
See Consolidated Financial Statements beginning on page F-1 of this Annual Report on Form 10-K.
Supplemental Financial Information regarding quarterly results is contained in Note 15—Quarterly Information (unaudited), in the Notes to our Consolidated Financial Statements of this Annual Report on Form 10-K.
Item 9. Changes in and Disagreements with Accountants on Accounting and Financial Disclosure.
Not applicable.
21
Item 9A. Controls and Procedures.
Disclosure Controls and Procedures.
As of May 31, 2014, the end of the period covered by this Annual Report on Form 10-K, we have, with the participation of our Chief Executive Officer and our Chief Financial Officer, evaluated the effectiveness of our disclosure controls and procedures. Based on that evaluation, our Chief Executive Officer and Chief Financial Officer concluded that our disclosure controls and procedures as of the end of the period covered by this Report were effective at the reasonable assurance level.
Management’s Report on Internal Control over Financial Reporting.
Our management is responsible for establishing and maintaining adequate internal control over financial reporting. Internal control over financial reporting is a process designed to provide reasonable assurance regarding the reliability of financial reporting and the preparation of financial statements for external purposes in accordance with generally accepted accounting principles. Our internal control over financial reporting includes policies and procedures that (1) pertain to the maintenance of records that, in reasonable detail, accurately and fairly reflect the transactions and dispositions of our assets; (2) provide reasonable assurance that transactions are recorded as necessary to permit preparation of financial statements in accordance with generally accepted accounting principles, and that our receipts and expenditures are being made only in accordance with authorizations of our management and directors; and (3) provide reasonable assurance regarding prevention or timely detection of unauthorized acquisition, use, or disposition of our assets that could have a material effect on the financial statements.
Our management assessed the effectiveness of our internal control over financial reporting as of May 31, 2014. In making this assessment, our management used the criteria set forth in Internal Control Integrated Framework (1992) issued by the Committee of Sponsoring Organizations of the Treadway Commission (“COSO”). Our management has concluded that, as of May 31, 2014, our internal control over financial reporting was effective based on these criteria.
Deloitte & Touche LLP, an independent registered public accounting firm, who audited our consolidated financial statements included in this Form 10-K has issued an attestation report on our internal control over financial reporting, which is included below.
Changes in Internal Control over Financial Reporting.
There was no change in our internal control over financial reporting (as defined in Rule 13a-15(f) of the Exchange Act) that occurred during our fourth fiscal quarter that has materially affected, or is reasonably likely to materially affect, our internal control over financial reporting.
Inherent Limitations on Effectiveness of Controls.
Our management, including our Chief Executive Officer and Chief Financial Officer, does not expect that our disclosure controls and procedures or our internal controls will prevent all errors and all fraud. A control system, no matter how well conceived and operated, can provide only reasonable, not absolute, assurance that the objectives of the control system are met. Further, the design of a control system must reflect the fact that there are resource constraints, and the benefits of controls must be considered relative to their costs. Because of the inherent limitations in all control systems, no evaluation of controls can provide absolute assurance that all control issues and instances of fraud, if any, within our company have been or will be detected.
22
REPORT OF INDEPENDENT REGISTERED PUBLIC ACCOUNTING FIRM
To the Board of Directors and Shareholders of
Electro Rent Corporation
Van Nuys, California
We have audited the internal control over financial reporting of Electro Rent Corporation and subsidiaries (the "Company") as of May 31, 2014, based on criteria established in Internal Control - Integrated Framework (1992) issued by the Committee of Sponsoring Organizations of the Treadway Commission. The Company's management is responsible for maintaining effective internal control over financial reporting and for its assessment of the effectiveness of internal control over financial reporting, included in the accompanying “Management’s Report on Internal Control Over Financial Reporting.” Our responsibility is to express an opinion on the Company's internal control over financial reporting based on our audit.
We conducted our audit in accordance with the standards of the Public Company Accounting Oversight Board (United States). Those standards require that we plan and perform the audit to obtain reasonable assurance about whether effective internal control over financial reporting was maintained in all material respects. Our audit included obtaining an understanding of internal control over financial reporting, assessing the risk that a material weakness exists, testing and evaluating the design and operating effectiveness of internal control based on the assessed risk, and performing such other procedures as we considered necessary in the circumstances. We believe that our audit provides a reasonable basis for our opinion.
A company's internal control over financial reporting is a process designed by, or under the supervision of, the company's principal executive and principal financial officers, or persons performing similar functions, and effected by the company's board of directors, management, and other personnel to provide reasonable assurance regarding the reliability of financial reporting and the preparation of financial statements for external purposes in accordance with generally accepted accounting principles. A company's internal control over financial reporting includes those policies and procedures that (1) pertain to the maintenance of records that, in reasonable detail, accurately and fairly reflect the transactions and dispositions of the assets of the company; (2) provide reasonable assurance that transactions are recorded as necessary to permit preparation of financial statements in accordance with generally accepted accounting principles, and that receipts and expenditures of the company are being made only in accordance with authorizations of management and directors of the company; and (3) provide reasonable assurance regarding prevention or timely detection of unauthorized acquisition, use, or disposition of the company's assets that could have a material effect on the financial statements.
Because of the inherent limitations of internal control over financial reporting, including the possibility of collusion or improper management override of controls, material misstatements due to error or fraud may not be prevented or detected on a timely basis. Also, projections of any evaluation of the effectiveness of the internal control over financial reporting to future periods are subject to the risk that the controls may become inadequate because of changes in conditions, or that the degree of compliance with the policies or procedures may deteriorate.
In our opinion, the Company maintained, in all material respects, effective internal control over financial reporting as of May 31, 2014, based on the criteria established in Internal Control - Integrated Framework (1992) issued by the Committee of Sponsoring Organizations of the Treadway Commission.
We have also audited, in accordance with the standards of the Public Company Accounting Oversight Board (United States), the consolidated financial statements as of and for the year ended May 31, 2014 of the Company and our report dated August 11, 2014 expressed an unqualified opinion on those financial statements.
/s/ DELOITTE & TOUCHE LLP
Los Angeles, California
August 11, 2014
23
Item 9B. Other Information.
Not applicable.
PART III
Item 10. Directors, Executive Officers and Corporate Governance.
The information required by this Item is incorporated by reference to our definitive Proxy Statement with respect to our Annual Meeting of Shareholders, which will be filed with the Securities and Exchange Commission not later than September 28, 2014.
Item 11. Executive Compensation.
The information required by this Item is incorporated by reference to our definitive Proxy Statement with respect to our Annual Meeting of Shareholders, which will be filed with the Securities and Exchange Commission not later than September 28, 2014.
Item 12. Security Ownership of Certain Beneficial Owners and Management and Related Stockholder Matters.
The information required by this Item is incorporated by reference to our definitive Proxy Statement with respect to our Annual Meeting of Shareholders, which will be filed with the Securities and Exchange Commission not later than September 28, 2014.
Item 13. Certain Relationships and Related Transactions, and Director Independence.
The information required by this Item is incorporated by reference to our definitive Proxy Statement with respect to our Annual Meeting of Shareholders, which will be filed with the Securities and Exchange Commission not later than September 28, 2014.
Item 14. Principal Accountant Fees and Services.
The information required by this Item is incorporated by reference to our definitive Proxy Statement with respect to our Annual Meeting of Shareholders, which will be filed with the Securities and Exchange Commission not later than September 28, 2014.
PART IV
Item 15. Exhibits and Financial Statement Schedules.
The following statements are filed as part of this Annual Report on Form 10-K:
1. Financial Statements.
A listing of the Consolidated Financial Statements, related notes and Report of Independent Registered Public Accounting is set forth on page F-1 in this Annual Report on Form 10-K.
2. Financial Statement Schedules.
All schedules have been omitted since the required information is not present or is not present in amounts sufficient to require submission of a schedule, or because the information required is included in the financial statements or related notes.
3. Index to Exhibits.
Exhibit No. | Description of Document | Incorporation by Reference | ||
3.1 | Restated Articles of Incorporation, filed October 3, 1984 | Incorporated by reference from Registrant’s Annual Report on Form 10-K for the fiscal year ended May 31, 2009. | ||
3.2 | Certificate of Amendment of Restated Articles of Incorporation, filed October 24, 1988 | Incorporated by reference from Registrant’s Annual Report on Form 10-K for the fiscal year ended May 31, 2009. | ||
3.3 | Certificate of Amendment of Restated Articles of Incorporation, filed October 15, 1997 | Incorporated by reference from Registrant’s Annual Report on Form 10-K for the fiscal year ended May 31, 1998. | ||
3.4 | Amended and Restated By-laws of Registrant, adopted July 10, 2014 | Incorporated by reference from Registrant’s Current Report on Form 8-K filed July 16, 2014. | ||
24
Exhibit No. | Description of Document | Incorporation by Reference | ||
4.1 | Form of Common Stock Certificate | Incorporated by reference from Registrant’s Annual Report on Form 10-K for the fiscal year ended May 31, 2009. | ||
10.1* | Electro Rent Corporation Supplemental Executive Retirement Plan | Incorporated by reference from Registrant’s Annual Report on Form 10-K for the fiscal year ended May 31, 2009. | ||
10.2* | Executive Employment Agreement (Amended and Restated as of July 15, 1992) between Registrant and Daniel Greenberg | Incorporated by reference from Registrant’s Annual Report on Form 10-K for the fiscal year ended May 31, 2009. | ||
10.3* | Amendment No. 1 to Executive Employment Agreement (Amended and Restated as of July 15, 1992) between Registrant and Daniel Greenberg, dated October 12, 2001 | Incorporated by reference from Registrant’s Annual Report on Form 10-K for the fiscal year ended May 31, 2003. | ||
10.4* | Amendment No. 2 to the Executive Employment Agreement between Electro Rent Corporation and Daniel Greenberg dated August 13, 2012 | Incorporated by reference from Registrant’s Quarterly Report on Form 10-Q for the quarterly period ended August 31, 2012. | ||
10.5* | Employment Agreement between Registrant and Steven Markheim, dated as of October 31, 2005 | Incorporated by reference from Registrant’s Current Report on Form 8-K filed November 1, 2005. | ||
10.6* | Amendment No. 1 to the Executive Employment Agreement between Electro Rent Corporation and Steven Markheim dated August 13, 2012 | Incorporated by reference from Registrant’s Quarterly Report on Form 10-Q for the quarterly period ended August 31, 2012. | ||
10.7* | Employment Agreement between Registrant and Craig R. Jones, dated as of October 31, 2005 | Incorporated by reference from Registrant’s Current Report on Form 8-K filed November 1, 2005. | ||
10.8* | Amendment No. 1 to the Executive Employment Agreement between Electro Rent Corporation and Craig Jones dated August 13, 2012 | Incorporated by reference from Registrant’s Quarterly Report on Form 10-Q for the quarterly period ended August 31, 2012. | ||
10.9* | 1996 Stock Option Plan | Incorporated by reference from Registrant’s Annual Report on Form 10-K for the fiscal year ended May 31, 1996. | ||
10.10* | Form of Stock Option Agreement (Incentive Stock Option) (1996 Plan) | Incorporated by reference from Registrant’s Annual Report on Form 10-K for the fiscal year ended May 31, 1996. | ||
10.11* | Form of Stock Option Agreement (Nonstatutory Stock Option) (1996 Plan) | Incorporated by reference from Registrant’s Annual Report on Form 10-K for the fiscal year ended May 31, 1996. | ||
10.12* | Amendment Number One to 1996 Stock Option Plan, adopted November 1, 1996 | Incorporated by reference from Registrant’s Registration Statement on Form S-8 filed December 5, 1996 (Registration No. 333-17295). | ||
10.13* | Amendment No. 1 to 1996 Stock Option Plan, 1996 Director Option Plan, and 2002 Employee Stock Option Plan | Incorporated by reference from Registrant’s Proxy Statement on Form DEF 14A filed December 2, 2003. | ||
10.14* | 2005 Equity Incentive Plan | Incorporated by reference from Registrant’s Registration Statement on Form S-8 filed December 20, 2005 (File No. 333-130487). | ||
10.15* | Amendment No. 1 to 2005 Equity Incentive Plan | Incorporated by reference from Registrant’s Quarterly Report on Form 10-Q for the quarterly period ended August 31, 2012. | ||
25
Exhibit No. | Description of Document | Incorporation by Reference | ||
10.16* | Form of Stock Option Agreement (2005 Plan) | Incorporated by reference from Registrant’s Registration Statement on Form S-8 filed December 20, 2005 (File No. 333-130487). | ||
10.17* | Form of Stock Unit Award Agreement (Employee) (2005 Plan) | Incorporated by reference from Registrant’s Current Report on Form 8-K filed July 21, 2009. | ||
10.18* | Form of Stock Unit Award Agreement (Employee) (2005 Plan) (new form of agreement adopted October 11, 2014) | Filed herewith. | ||
10.19* | Amendment No. 1 to Form of Stock Unit Award Agreement (Employee) (2005 Plan) | Filed herewith. | ||
10.20* | Form of Stock Unit Award Agreement (Director) (2005 Plan) | Incorporated by reference from Registrant’s Annual Report on Form 10-K for the fiscal year ended May 31, 2009. | ||
10.21* | Form of Stock Unit Award Agreement (Director) (2005 Plan) (new form of agreement adopted October 11, 2014) | Filed herewith. | ||
10.22* | Amendment No. 1 to Form of Stock Unit Award Agreement (Director) (2005 Plan) | Filed herewith. | ||
10.23* | Form of Stock Option Agreement (2005 Plan) | Incorporated by reference from Registrant’s Registration Statement on Form S-8 filed December 20, 2005 (File No. 333-130487). | ||
10.24* | Form of Stock Unit Award Agreement (Employee) (2005 Plan) | Incorporated by reference from Registrant’s Current Report on Form 8-K filed July 21, 2009. | ||
10.25* | Form of Stock Unit Award Agreement (Director) (2005 Plan) | Incorporated by reference from Registrant’s Annual Report on Form 10-K for the fiscal year ended May 31, 2009. | ||
10.26* | Form of Indemnification Agreement | Incorporated by reference from Registrant’s Annual Report on Form 10-K for the fiscal year ended May 31, 2009. | ||
10.27 | Commercial Credit Agreement dated as of September 29, 2008 between Electro Rent Corporation (the “Company”) and Union Bank of California, N.A. | Incorporated by reference from Registrant’s Quarterly Report on Form 10-Q for the quarterly period ended February 28, 2010. | ||
10.28 | First Amendment to Commercial Credit Agreement dated as of March 4, 2009 between the Company and Union Bank of California, N.A | Incorporated by reference from Registrant’s Quarterly Report on Form 10-Q for the quarterly period ended February 28, 2010. | ||
10.29 | Second Amendment to Commercial Credit Agreement dated as of September 16, 2009 between the Company and Union Bank of California, N.A. | Incorporated by reference from Registrant’s Quarterly Report on Form 10-Q for the quarterly period ended February 28, 2010. | ||
10.30 | Third Amendment to Commercial Credit Agreement dated as of September 22, 2010 between the Company and Union Bank of California, N.A. | Incorporated by reference from Registrant’s Annual Report on Form 10-K for the fiscal year ended May 31, 2011. | ||
10.31 | Asset Purchase Agreement between Registrant and Telogy, LLC dated as of March 16, 2010 | Incorporated by reference from Registrant’s Current Report on Form 8-K filed March 22, 2010. | ||
26
Exhibit No. | Description of Document | Incorporation by Reference | ||
10.32 | Agreement between the Company and UBS regarding Auction Rate Securities | Incorporated by reference from Registrant’s Quarterly Report on Form 10-Q for the quarterly period ended February 28, 2010. | ||
10.33 | Fourth amendment to Commercial Credit Agreement dated as of September 28, 2011 between the Company and Union Bank of California, N.A. | Incorporated by reference from Registrant’s Current Report on Form 8-K filed September 30, 2011. | ||
10.34 | Fifth amendment to Commercial Credit Agreement dated as of February 3, 2012 between the Company and Union Bank of California, N.A. | Incorporated by reference from Registrant’s Current Report on Form 8-K filed February 9, 2012. | ||
10.35 | Sixth Amendment to Commercial Credit Agreement between Electro Rent Corporation and Union Bank, N.A. | Incorporated by reference from the Registrant’s Current Report on Form 8-K filed on November 29, 2012. | ||
10.36 | Credit Agreement between Electro Rent Corporation (the “Company”) and J.P. Morgan Chase Bank, National Association, as administrative agent, J.P. Morgan Securities LLC, as sole bookrunner and sole lead arranger, and the lenders party thereto, dated as of November 19, 2013. | Incorporated by reference from the Registrant’s Current Report on Form 8-K filed on November 25, 2013. | ||
10.37# | EMG Authorized Technology Partner Program Agreement / Agreement No. ANT76 dated as of May 29, 2014 by and between Electro Rent Corporation and Keysight Technologies, Inc. | Filed herewith. | ||
10.38 | Amendment No. 1 to EMG Authorized Technology Partner Program Agreement / Agreement No. ANT76 dated as of May 29, 2014 | Filed herewith. | ||
14 | Code of Business Ethics and Conduct | Incorporated by reference from the Registrant’s Current Report on Form 8-K filed on July 16, 2014. | ||
21 | Subsidiaries of the Registrant. • ER International, Inc., a Delaware corporation • Electro Rent Asia, Inc., a California corporation • Electro Rent (Beijing) Technology Rental Co., Ltd., a Chinese wholly foreign-owned enterprise • Electro Rent Europe NV, a Belgium corporation • Electro Rent, LLC, a Delaware limited liability company | |||
23 | Consent of Deloitte & Touche LLP, the Company’s independent registered public accounting firm | Filed herewith. | ||
31.1 | Rule 13a-14(a)/15d-14(a) Certification of Principal Executive Officer | Filed herewith. | ||
31.2 | Rule 13a-14(a)/15d-14(a) Certification of Principal Financial Officer | Filed herewith. | ||
32.1** | Section 1350 Certification by Principal Executive Officer | Filed herewith. | ||
27
Exhibit No. | Description of Document | Incorporation by Reference | ||
32.2** | Section 1350 Certification by Principal Financial Officer | Filed herewith. | ||
101.INS*** | XBRL Instance Document. | |||
101.SCH*** | XBRL Taxonomy Extension Schema Document. | |||
101.CAL*** | XBRL Taxonomy Extension Calculation Linkbase Document. | |||
101.DEF*** | XBRL Taxonomy Extension Definition Linkbase Document. | |||
101.LAB*** | XBRL Taxonomy Label Linkbase Document. | |||
101.PRE*** | XBRL Taxonomy Extension Presentation Linkbase Document. | |||
# | The Company has requested confidential treatment for portions of this agreement. Accordingly, certain portions of this agreement have been omitted in the version filed with this report and such confidential portions have been filed with the Securities and Exchange Commission. |
* | Management contract or compensatory plan or arrangement. |
** | This certification is being furnished solely to accompany this report pursuant to 18 U.S.C. 1350, and is not being filed for purposes of Section 18 of the Securities Exchange Act of 1934 and is not to be incorporated by reference into any filing of the registrant, whether made before or after the date hereof, regardless of any general incorporation language in such filing. |
*** | Pursuant to Rule 406T of Regulation S-T, the Interactive Data Files on Exhibit 101 hereto are deemed not filed or part of a registration statement or prospectus for purposes of Sections 11 or 12 of the Securities Act of 1933, are deemed not filed for purposes of Section 18 of the Securities Exchange Act of 1934, as amended, and otherwise are not subject to liability under those sections. |
28
SIGNATURES
Pursuant to the requirements of Sections 13 or 15(d) of the Securities Exchange Act of 1934, the registrant has duly caused this report to be signed on its behalf by the undersigned, thereunto duly authorized.
Electro Rent Corporation | |||||||
Dated: | August 11, 2014 | By | /s/ Daniel Greenberg | ||||
Daniel Greenberg | |||||||
Chief Executive Officer and Director | |||||||
Pursuant to the requirements of the Securities Exchange Act of 1934, this report has been signed below by the following persons on behalf of the registrant and in the capacities and on the dates indicated.
SIGNATURE | TITLE | DATE | ||
/s/ Daniel Greenberg | Chairman of the Board and Chief Executive Officer | August 11, 2014 | ||
Daniel Greenberg | (Principal Executive Officer) | |||
/s/ Craig R. Jones | Chief Financial Officer | August 11, 2014 | ||
Craig R. Jones | (Principal Financial and Accounting Officer) | |||
/s/ Nancy Y. Bekavac | Director | August 11, 2014 | ||
Nancy Y. Bekavac | ||||
/s/ Karen J. Curtin | Director | August 11, 2014 | ||
Karen J. Curtin | ||||
/s/ Theodore E. Guth | Director | August 11, 2014 | ||
Theodore E. Guth | ||||
/s/ Joseph J. Kearns | Director | August 11, 2014 | ||
Joseph J. Kearns | ||||
/s/ James S. Pignatelli | Director | August 11, 2014 | ||
James S. Pignatelli | ||||
29
INDEX TO CONSOLIDATED FINANCIAL STATEMENTS
May 31, 2014
Page Number | ||||
1. | Financial Statements | |||
F- 1
REPORT OF INDEPENDENT REGISTERED PUBLIC ACCOUNTING FIRM
To the Board of Directors and Shareholders of
Electro Rent Corporation
Van Nuys, California
We have audited the accompanying consolidated balance sheets of Electro Rent Corporation and subsidiaries (the “Company”) as of May 31, 2014 and 2013, and the related consolidated statements of operations, shareholders' equity, and cash flows for each of the three years in the period ended May 31, 2014. These financial statements are the responsibility of the Company's management. Our responsibility is to express an opinion on these financial statements based on our audits.
We conducted our audits in accordance with the standards of the Public Company Accounting Oversight Board (United States). Those standards require that we plan and perform the audit to obtain reasonable assurance about whether the financial statements are free of material misstatement. An audit includes examining, on a test basis, evidence supporting the amounts and disclosures in the financial statements. An audit also includes assessing the accounting principles used and significant estimates made by management, as well as evaluating the overall financial statement presentation. We believe that our audits provide a reasonable basis for our opinion.
In our opinion, such consolidated financial statements present fairly, in all material respects, the financial position of the Company at May 31, 2014 and 2013, and the results of its operations and its cash flows for each of the three years in the period ended May 31, 2014, in conformity with accounting principles generally accepted in the United States of America.
We have also audited, in accordance with the standards of the Public Company Accounting Oversight Board (United States), the Company's internal control over financial reporting as of May 31, 2014, based on the criteria established in Internal Control - Integrated Framework (1992) issued by the Committee of Sponsoring Organizations of the Treadway Commission and our report dated August 11, 2014 expressed an unqualified opinion on the Company's internal control over financial reporting.
/s/ DELOITTE & TOUCHE LLP
Los Angeles, California
August 11, 2014
F- 2
ELECTRO RENT 2014 ANNUAL REPORT
Consolidated Statements of Operations
Year Ended May 31, (in thousands, except per share information) | 2014 | 2013 | 2012 | ||||||||
Revenues: | |||||||||||
Rentals and leases | $ | 137,417 | $ | 136,591 | $ | 129,737 | |||||
Sales of equipment and other revenues | 103,720 | 112,140 | 118,817 | ||||||||
Total revenues | 241,137 | 248,731 | 248,554 | ||||||||
Operating expenses: | |||||||||||
Depreciation of rental and lease equipment | 57,034 | 56,795 | 53,651 | ||||||||
Costs of rentals and leases, excluding depreciation | 18,292 | 17,788 | 17,320 | ||||||||
Costs of sales of equipment and other revenues | 74,752 | 80,894 | 88,247 | ||||||||
Selling, general and administrative expenses | 58,920 | 56,543 | 53,250 | ||||||||
Total operating expenses | 208,998 | 212,020 | 212,468 | ||||||||
Operating profit | 32,139 | 36,711 | 36,086 | ||||||||
Gain on bargain purchase, net of deferred taxes | — | — | 3,435 | ||||||||
Interest income, net | 387 | 402 | 484 | ||||||||
Income before income taxes | 32,526 | 37,113 | 40,005 | ||||||||
Income tax provision | 12,118 | 14,359 | 14,233 | ||||||||
Net income | $ | 20,408 | $ | 22,754 | $ | 25,772 | |||||
Earnings per share: | |||||||||||
Basic | $ | 0.84 | $ | 0.94 | $ | 1.07 | |||||
Diluted | $ | 0.84 | $ | 0.94 | $ | 1.07 | |||||
Shares used in per share calculation: | |||||||||||
Basic | 24,325 | 24,226 | 23,983 | ||||||||
Diluted | 24,357 | 24,269 | 24,152 | ||||||||
Cash dividend declared per share | $ | 0.80 | $ | 1.80 | $ | 0.80 | |||||
The accompanying notes are an integral part of these consolidated financial statements.
F- 3
ELECTRO RENT 2014 ANNUAL REPORT
Consolidated Balance Sheets
As of May 31, (in thousands, except share information) | 2014 | 2013 | |||||
Assets | |||||||
Cash and cash equivalents | $ | 5,946 | $ | 10,402 | |||
Accounts receivable, net of allowance for doubtful accounts of $555 and $457 | 34,970 | 34,350 | |||||
Rental and lease equipment, net of accumulated depreciation of $237,151 and $224,397 | 221,888 | 234,856 | |||||
Other property, net of accumulated depreciation and amortization of $18,983 and $18,873 | 13,122 | 13,826 | |||||
Goodwill | 3,109 | 3,109 | |||||
Intangibles, net of amortization of $1,632 and $1,468 | 873 | 1,037 | |||||
Other assets | 22,150 | 21,346 | |||||
$ | 302,058 | $ | 318,926 | ||||
Liabilities and Shareholders’ Equity | |||||||
Liabilities: | |||||||
Bank borrowings | $ | — | $ | 10,000 | |||
Accounts payable | 7,279 | 7,479 | |||||
Accrued expenses | 14,472 | 15,866 | |||||
Deferred revenue | 7,537 | 7,292 | |||||
Deferred tax liability | 41,812 | 49,740 | |||||
Total liabilities | 71,100 | 90,377 | |||||
Commitments and contingencies (Note 11) | |||||||
Shareholders’ equity: | |||||||
Preferred stock, $1 par—shares authorized 1,000,000; none issued | |||||||
Common stock, no par—shares authorized 40,000,000; issued and outstanding 2014—24,007,709; 2013—23,995,626 | 39,252 | 37,724 | |||||
Retained earnings | 191,706 | 190,825 | |||||
Total shareholders’ equity | 230,958 | 228,549 | |||||
$ | 302,058 | $ | 318,926 | ||||
The accompanying notes are an integral part of these consolidated financial statements.
F- 4
ELECTRO RENT 2014 ANNUAL REPORT
Consolidated Statements of Shareholders’ Equity
Common Stock | Total | |||||||||||||
Three years ended May 31, (in thousands) | Number of Shares | Amount | Retained Earnings | Shareholders’ Equity | ||||||||||
Balance, June 1, 2011 | 23,981 | $ | 34,742 | $ | 205,633 | $ | 240,375 | |||||||
Issuance of restricted stock | 7 | — | — | — | ||||||||||
Excess tax benefit for share based compensation, net of tax deficit | — | 46 | — | 46 | ||||||||||
Non-cash stock compensation expense | — | 1,438 | — | 1,438 | ||||||||||
Dividends declared | — | — | (19,453 | ) | (19,453 | ) | ||||||||
Net settlement of shares | — | (47 | ) | — | (47 | ) | ||||||||
Net income for the year ended May 31, 2012 | — | — | 25,772 | 25,772 | ||||||||||
Balance, May 31, 2012 | 23,988 | 36,179 | 211,952 | 248,131 | ||||||||||
Issuance of restricted shares | 8 | — | — | — | ||||||||||
Excess tax benefit for share based compensation | — | 251 | — | 251 | ||||||||||
Non-cash stock compensation expense | — | 1,330 | — | 1,330 | ||||||||||
Dividends declared | — | — | (43,881 | ) | (43,881 | ) | ||||||||
Net settlement of shares | — | (36 | ) | — | (36 | ) | ||||||||
Net income for the year ended May 31, 2013 | — | — | 22,754 | 22,754 | ||||||||||
Balance, May 31, 2013 | 23,996 | 37,724 | 190,825 | 228,549 | ||||||||||
Issuance of restricted shares | 12 | — | — | — | ||||||||||
Excess tax benefit for share based compensation | — | 183 | — | 183 | ||||||||||
Non-cash stock compensation expense | — | 1,356 | — | 1,356 | ||||||||||
Dividends declared | — | — | (19,527 | ) | (19,527 | ) | ||||||||
Net settlement of shares | — | (11 | ) | — | (11 | ) | ||||||||
Net income for the year ended May 31, 2014 | — | — | 20,408 | 20,408 | ||||||||||
Balance, May 31, 2014 | 24,008 | $ | 39,252 | $ | 191,706 | $ | 230,958 | |||||||
The accompanying notes are an integral part of these consolidated financial statements.
F- 5
ELECTRO RENT 2014 ANNUAL REPORT
Consolidated Statements of Cash Flows
Year Ended May 31, (in thousands) | 2014 | 2013 | 2012 | ||||||||
Cash flows from operating activities: | |||||||||||
Net income | $ | 20,408 | $ | 22,754 | $ | 25,772 | |||||
Adjustments to reconcile net income to net cash provided by operating activities: | |||||||||||
Depreciation and amortization | 58,286 | 58,109 | 54,960 | ||||||||
Remeasurement (gain)/loss on foreign currency | 152 | (2 | ) | 267 | |||||||
Provision for losses on accounts receivable | 860 | 445 | 233 | ||||||||
Gain on sale of rental and lease equipment | (14,195 | ) | (13,189 | ) | (10,954 | ) | |||||
Gain on bargain purchase, net of deferred taxes | — | — | (3,435 | ) | |||||||
Stock compensation expense | 1,356 | 1,330 | 1,438 | ||||||||
Excess tax benefit for share based compensation | (183 | ) | (251 | ) | (102 | ) | |||||
Deferred income taxes | (7,928 | ) | (4,631 | ) | 11,120 | ||||||
Change in operating assets and liabilities: | |||||||||||
Accounts receivable | (2,366 | ) | 1,322 | (5,594 | ) | ||||||
Other assets | (6,568 | ) | (931 | ) | (5,839 | ) | |||||
Accounts payable | 260 | (467 | ) | (120 | ) | ||||||
Accrued expenses | (1,125 | ) | 4,068 | 1,516 | |||||||
Deferred revenue | 229 | 373 | 613 | ||||||||
Net cash provided by operating activities | 49,186 | 68,930 | 69,875 | ||||||||
Cash flows from investing activities: | |||||||||||
Proceeds from sales of rental and lease equipment | 35,224 | 31,119 | 25,042 | ||||||||
Cash paid for acquisition | — | — | (10,327 | ) | |||||||
Payments for purchase of rental and lease equipment | (58,678 | ) | (64,088 | ) | (96,709 | ) | |||||
Payments for purchase of other property | (384 | ) | (1,105 | ) | (900 | ) | |||||
Net cash used in investing activities | (23,838 | ) | (34,074 | ) | (82,894 | ) | |||||
Cash flows from financing activities: | |||||||||||
Borrowing under bank line of credit | 56,018 | 63,500 | 3,250 | ||||||||
Payment under bank line of credit | (66,018 | ) | (53,500 | ) | (3,250 | ) | |||||
Minimum tax withholdings on share based compensation | (11 | ) | (36 | ) | (47 | ) | |||||
Excess tax benefit for share based compensation | 183 | 251 | 102 | ||||||||
Payment of dividends | (19,657 | ) | (43,765 | ) | (19,378 | ) | |||||
Net cash used in financing activities | (29,485 | ) | (33,550 | ) | (19,323 | ) | |||||
Net (decrease) increase in cash and cash equivalents | (4,137 | ) | 1,306 | (32,342 | ) | ||||||
Effect of exchange rate changes on cash | (319 | ) | (194 | ) | 191 | ||||||
Cash and cash equivalents at beginning of year | 10,402 | 9,290 | 41,441 | ||||||||
Cash and cash equivalents at end of year | $ | 5,946 | $ | 10,402 | $ | 9,290 | |||||
Interest paid, during the period | $ | 106 | $ | 180 | $ | 21 | |||||
Net income taxes paid (refunds received), during the period | $ | 23,778 | $ | 15,579 | $ | (543 | ) | ||||
Dividends accrued during the period, not yet paid | $ | 211 | $ | 340 | $ | 224 | |||||
Rental equipment acquisitions, not yet paid | $ | 4,479 | $ | 4,965 | $ | 5,418 | |||||
Used equipment sales, not yet collected | $ | 9,050 | $ | 11,419 | $ | 10,021 | |||||
Transfers of demonstration equipment to rental and lease equipment | $ | 4,535 | $ | 2,937 | $ | 2,207 | |||||
The accompanying notes are an integral part of these consolidated financial statements.
F- 6
NOTES TO CONSOLIDATED FINANCIAL STATEMENTS
FOR THE YEARS ENDED MAY 31, 2014, 2013 AND 2012
(in thousands, except per share amounts)
Note 1: Summary of Significant Accounting Policies
Basis of Presentation: The consolidated financial statements include Electro Rent Corporation and its wholly owned subsidiaries (collectively “we”, “us”, or “our” hereafter). All intercompany balances and transactions have been eliminated in consolidation.
Business and Organization: We primarily engage in the short-term rental, lease, and sale of state-of-the-art electronic equipment. We maintain an equipment portfolio composed primarily of test and measurement equipment (“T&M”) and personal computer-related data products (“DP”) equipment purchased from leading manufacturers. Another aspect of our business is the sale of equipment after its utilization for rent/lease and the sale of new T&M equipment for Keysight Technologies, Inc. (formerly Agilent Technologies, Inc.) ("Keysight") as well as other smaller vendors. Under our agreement with Keysight, we have the exclusive right to sell Keysight’s more complex T&M equipment to small and medium size customers (who previously purchased directly from Keysight) in the United States and Canada. Keysight is a wholly-owned subsidiary of Agilent Technologies, Inc. (“Agilent”), with whom we originally entered into the reseller agreement. Agilent is currently in the process of spinning off Keysight into a separate publicly traded company, which Agilent has announced that it expects to complete by November 2014. We have renewed our reseller arrangement four times since we entered into the agreement with Agilent in 2009, and our current agreement is due to expire in May 31, 2015.
We conduct our business activities in the United States, as well as through our wholly owned subsidiaries, Electro Rent, LLC, Electro Rent Europe, NV, and Electro Rent (Beijing) Test and Measurement Equipment Rental Co., Ltd. which conduct some or all of these business activities in Canada, Belgium and China, respectively. Our wholly owned subsidiary, Electro Rent Asia, Inc., is the U.S. parent company of Electro Rent (Beijing) Test and Measurement Equipment Rental Co., Ltd., and our wholly owned subsidiary, ER International, Inc., is the U.S. parent company of Electro Rent Europe, NV.
Use of Estimates: The preparation of financial statements in conformity with accounting principles generally accepted in the United States of America requires us to make estimates and assumptions that affect the reported amounts of assets and liabilities as well as the disclosures of contingent assets and liabilities as of the date of these financial statements and the reported amounts of revenues and expenses during the reporting period. On a regular basis, we review these estimates including those related to asset lives and depreciation methods, impairment of long-lived assets, including rental and lease equipment, goodwill and intangibles, investments, allowance for doubtful accounts, income taxes, contingencies and litigation. These estimates are based on our evaluation of current business and economic conditions, historical experience and on various other assumptions believed to be reasonable under the circumstances. Actual results may differ from these estimates under different assumptions or conditions. We believe, however, that our estimates, including those for the above-listed items, are reasonable.
Revenue Recognition: We generate revenues primarily through the rental and leasing of T&M and DP equipment and through the sale of new and used equipment. Rental revenues comprise short term agreements that can be daily, weekly or monthly. Rental revenues are recognized in the month they are due on the accrual basis of accounting. Our operating lease agreements have varying terms, typically one to three years. Upon lease termination, customers have the option to renew the lease term, purchase the equipment at fair market value, or continue to rent on a month-to-month basis. Our operating leases do not provide for contingent rentals. Revenues related to operating leases are recognized on a straight-line basis over the term of the lease. Negotiated lease early-termination charges are recognized upon receipt. Rentals and leases are primarily billed to customers in advance, and unearned billings are recorded as deferred revenue.
We enter into finance leases as lessor for some of our equipment. Our finance lease agreements contain bargain purchase options and are accounted for as sale-type leases. Revenues from finance leases, which are recorded at the present value of the aggregate future lease payments, less unearned interest, are included in sales of equipment and other revenues in our consolidated statements of operations. Unearned interest is recognized over the life of the finance lease term using the effective interest method. Our finance lease terms vary, and are typically one to three years. The net investment in finance leases, which represents the receivables due from lessees, net of unearned interest, is included in other assets in our consolidated balance sheets. Historically, we have not required security deposits based on our assessed credit risk within our customer bases.
Initial direct costs for operating and finance leases are insignificant.
Sales of new equipment through our resale channel are recognized in the period in which the equipment is delivered and risk of loss passes to the customer, while sales of used equipment from our rental and lease equipment pool are recognized in the period in which the equipment is shipped and risk of loss passes to the customer. In the case of equipment sold to customers
F- 7
that is already on rent or lease to the same party, revenue is recognized at the agreed-upon date when the rent or lease term ends and risk of loss passes to the customer.
In accordance with accounting guidance, we are acting as the principal with respect to sales of new equipment through our Keysight resale agreement, based on several factors, including: (1) We act as the primary obligor by working directly with our customers to define their needs, providing them with options to satisfy such needs, contracting directly with the customer, and, to the extent required, providing customers with instruction on the use of the product and additional technical support once the product is received by the customer. The product manufacturer is not a party to our customer sales agreements, nor is it referenced in the agreements, and therefore has no obligation to our customers with the exception of the manufacturer’s standard warranty on the product. (2) We bear back-end risk of inventory loss with respect to any product return from the customer as the original manufacturer is not required to accept returns of equipment from us. We also bear front-end risk of inventory loss in those cases where we acquire products for resale into our inventory prior to shipment to customers. (3) We have full discretion in setting pricing terms with our customers and to negotiate all such terms ourselves. (4) We assume all credit risk. Accordingly, sales of new equipment through our resale channel are recorded in sales of equipment and other revenues and the related equipment costs are recorded in costs of sales of equipment and other revenues in our consolidated statements of operations.
Other revenues, consisting primarily of billings to customers for delivery and repairs, are recognized in the period in which the respective services are performed.
Operating Expenses: Costs of rentals and leases, excluding depreciation, primarily include labor related costs of our operations personnel, supplies, repairs, insurance and warehousing costs associated with our rental and lease equipment, relating to our rental and lease revenues.
Costs of sales of equipment and other revenues primarily include the cost of new equipment and the carrying value of used equipment sold.
Selling, general and administrative expenses include sales and advertising costs, payroll and related benefit costs, insurance expenses, property taxes on our property and rental and lease equipment, legal and professional fees, and administrative overhead. Advertising costs are expensed as incurred. Total advertising expenses were $982, $982 and $962 for fiscal 2014, 2013 and 2012, respectively. Selling, general and administrative expenses also include shipping and handling costs of $3,977, $3,951 and $4,184 for fiscal 2014, 2013 and 2012, respectively.
Rental and Lease Equipment and Other Property: Assets are generally stated at cost, less accumulated depreciation. Upon retirement or disposal of assets, the cost and the related accumulated depreciation are eliminated from the accounts and any gain or loss is recognized. We depreciate our buildings over 31.5 years, furniture and other equipment over three to ten years, and leasehold improvements over the shorter of the lease period, typically three to five years, or useful life. Each is depreciated on a straight-line basis. Depreciation of rental and lease equipment assets is provided over the estimated useful lives of the respective assets. We depreciated $427,005 and $428,957 of equipment, at acquisition cost, at May 31, 2014 and 2013, respectively, using straight-line methods ranging from two to ten years, and $32,034 and $30,296 of equipment, at acquisition cost, at May 31, 2014 and 2013, respectively, using accelerated methods ranging from two to four years. We generally use straight-line methods for our T&M equipment, which we believe maintains its value consistently throughout the equipment’s useful life, and accelerated methods primarily for our DP equipment, which tend to depreciate faster due to frequent technological advancements. Depreciation methods and useful lives are periodically reviewed and revised, as deemed appropriate, including revisions to reflect shorter useful lives to more closely match depreciation expense with rental revenue for rental arrangements where the customer can acquire title through payment of all required rentals. Normal maintenance and repairs are expensed as incurred. Rental and lease equipment at net book value comprised $217,288 of T&M equipment and $4,601 of DP equipment at May 31, 2014, and $230,074 of T&M equipment and $4,782 of DP equipment at May 31, 2013.
Income Taxes: We recognize a liability or asset for the deferred tax consequences of temporary differences between the tax basis of assets and liabilities and their reported amounts in the financial statements. These temporary differences will result in taxable or deductible amounts in future years when reported amounts of the assets or liabilities are recovered or settled. Deferred tax assets are periodically reviewed for recoverability.
We recognize the tax impact from an uncertain tax position only if it is more likely than not that the tax position will be sustained on examination by the taxing authorities, based on the technical merits of the position. The tax impact recognized in the financial statements from such a position is measured based on the largest benefit that has a greater than 50% likelihood of being realized upon ultimate resolution. We recognize interest, penalties and foreign currency gains and losses with respect to uncertain tax positions as components of our income tax provision. Accrued interest and penalties are included within accrued expenses in the consolidated balance sheet. Significant judgment is required in the identification of uncertain tax positions and in the estimation of penalties and interest on uncertain tax positions. (See Note 6 for further discussion.)
F- 8
Impairment of Long-Lived Assets: The carrying value of equipment held for rental and lease is assessed quarterly or when circumstances indicate that the carrying amount of equipment may not be recoverable. Recoverability of equipment to be rented and leased is measured by a comparison of the carrying amount to the undiscounted future cash flows expected to be generated by the asset. If the current carrying value exceeds the estimated undiscounted cash flows, an impairment loss is recorded equal to the difference between the asset’s current carrying value and its fair value as described in FASB ASC Topic No. 820, Fair Value Measurements and Disclosures. Based upon such periodic assessments, no impairments occurred during fiscal 2014, 2013 and 2012.
Goodwill: Goodwill, which represents the excess of purchase price over the fair value of net assets acquired is discussed further in Note 4. Pursuant to FASB ASC Topic No. 350, Intangibles – Goodwill and Other (“ASC 350”), goodwill is not amortized but tested annually for impairment, or on an interim basis if an event occurs or circumstances change that would reduce the fair value of a reporting unit below its carrying value. In connection with the annual impairment test for goodwill, we have the option to perform a qualitative assessment to determine whether it is more likely than not that the fair value of the reporting unit is less than its carrying amount. If we determine that it was more likely than not that the fair value of the reporting unit is less than its carrying amount, then we perform the impairment test. The impairment test involves a two-step process. The first step involves comparing the fair values of the applicable reporting units with their aggregate carrying values, including goodwill. We generally determine the fair value of our reporting units using the market approach methodology of valuation. If the carrying value of a reporting unit exceeds the reporting unit’s fair value, we perform the second step of the test to determine the amount of impairment loss. The second step involves measuring the impairment by comparing the implied fair values of the affected reporting unit’s goodwill with its carrying value. We completed the required impairment review at the end of fiscal 2014, 2013 and 2012 and concluded that there were no impairments.
Cash and Cash Equivalents: We consider highly liquid investments with maturities of three months or less at the date of purchase to be cash equivalents. Cash equivalents consist primarily of AAA-rated money market funds in all periods presented.
Allowance for Doubtful Accounts: We maintain an allowance for doubtful accounts for estimated losses resulting from the inability of customers to make rental and lease payments. The estimated losses are based on historical collection experience in conjunction with an evaluation of the current status of the existing accounts. If the financial condition of our customers were to deteriorate, then additional allowances could be required that would reduce income. Conversely, if the financial condition of our customers were to improve or if legal remedies to collect past due amounts were more successful than expected, then the allowance for doubtful accounts may need to be reduced and income would be increased.
A roll forward of the allowance for doubtful accounts is as follows at May 31:
2014 | 2013 | 2012 | |||||||||
Beginning of year | $ | 457 | $ | 522 | $ | 602 | |||||
Provision for doubtful accounts | 860 | 445 | 233 | ||||||||
Write-offs | (762 | ) | (510 | ) | (313 | ) | |||||
End of year | $ | 555 | $ | 457 | $ | 522 | |||||
Other Assets: We include demonstration equipment used in connection with our resale activity, totaling $6,659 and $6,057 as of May 31, 2014 and 2013, respectively, in other assets for a period up to two years. Demonstration equipment is recorded at the lower of cost or estimated market value until the units are sold or transferred to our rental and lease equipment pool. Demonstration equipment transferred to our rental and lease equipment pool is depreciated over its remaining estimated useful life.
Other assets consisted of the following at May 31:
2014 | 2013 | ||||||
Net investment in sales-type leases | $ | 7,264 | $ | 9,437 | |||
Demonstration equipment | 6,659 | 6,057 | |||||
Supplemental executive retirement plan assets | 3,418 | 2,947 | |||||
Income taxes receivable | 1,831 | — | |||||
Prepaid expenses and other | 2,978 | 2,905 | |||||
$ | 22,150 | $ | 21,346 | ||||
Concentration of Credit Risk: Financial instruments that potentially expose us to concentration of credit risk primarily consist of trade accounts receivable. We sell our trade accounts receivable primarily on 30-day terms, perform credit evaluation
F- 9
procedures on each customer’s individual transactions and require security deposits or personal guarantees from our customers when significant credit risks are identified. Typically, most customers are large, established firms.
We purchase rental and lease equipment from numerous vendors and resale equipment from Keysight (formerly Agilent Technologies, Inc.). During fiscal 2014, 2013 and 2012, Keysight accounted for approximately 66%, 74% and 75%, respectively, of all new equipment purchases, including rental equipment and equipment purchased for resale. No other vendor accounted for more than 10% of such purchases.
Foreign Currency: The U.S. dollar has been determined to be the functional currency of all foreign subsidiaries. The assets and liabilities of our foreign subsidiaries are remeasured from their local currency to U.S. dollars at current or historic exchange rates, as appropriate. Revenues and expenses are remeasured from any foreign currencies to U.S. dollars using historic or average monthly exchange rates, as appropriate, for the month in which the transaction occurred. Remeasurement gains and losses are included in selling, general and administrative expenses or income taxes, as appropriate. The assets, liabilities, revenues and expenses of our foreign subsidiaries are individually less than 10% of our respective consolidated amounts. The euro, Canadian dollar and Chinese yuan are our primary foreign currencies. Remeasurement gains and losses have not been significant.
We enter into forward contracts to hedge against unfavorable currency fluctuations in our monetary assets and liabilities in our European and Canadian operations. These contracts are designed to minimize the effect of fluctuations in foreign currencies. To qualify for hedge accounting, contracts must reduce the foreign currency exchange rate and interest rate risk otherwise inherent in the amount and duration of the hedged exposures and comply with established risk management policies. Our derivative instruments are not designated as hedging instruments and, therefore, are recorded at fair value as a current asset or liability, and any changes in fair value are recorded in our consolidated statements of operations. We do not use derivative financial instruments for speculative trading purposes.
The fair value of our foreign exchange forward contracts in the consolidated balance sheets is shown in the table below:
Derivatives Not Designated as Hedging Instruments | Consolidated Balance Sheet Location | May 31, 2014 | May 31, 2013 | ||||||
Foreign exchange forward contracts | Other assets | $ | 9 | $ | 114 | ||||
The table below provides data about the amount of fiscal 2014 and 2013 losses recognized in income for derivative instruments not designated as hedging instruments:
Derivatives Not Designated as Hedging Instruments | Location of Loss Recognized in Income on Derivatives | Year ended May 31, | |||||||
2014 | 2013 | ||||||||
Foreign exchange forward contracts | Selling, general and administrative expenses | $ | 269 | $ | 306 | ||||
Net Income Per Common and Common Equivalent Share: Basic earnings per share (“EPS”) is computed as net income divided by the weighted average number of shares of common stock outstanding and shares issuable for vested restricted stock units for the reported year, excluding the dilutive effects of restricted stock, stock options and other potentially dilutive securities. Diluted EPS is computed as net income divided by the weighted average number of shares outstanding of common stock and common stock equivalents for the reported year. The dilutive effects of restricted stock and stock options are computed using the treasury stock method.
Stock-Based Compensation: Share-based payments to employees, including grants of employee stock options, are recognized in the consolidated financial statements as compensation expense over the period that an employee provides service in exchange for the award based on its fair value on the date of grant. Compensation expense resulting from restricted stock and restricted stock units is measured at fair value on the date of grant and is recognized in selling, general and administrative expenses over the vesting period (see Note 12 for further discussion).
Recent Accounting Pronouncements: In June 2011, the Financial Accounting Standards Board (“FASB”) issued guidance on presentation of comprehensive income. This guidance eliminated the current option to report other comprehensive income and its components in the statement of changes in equity. Instead, an entity is required to present components of comprehensive income in either (1) a continuous statement of net income or (2) two separate but consecutive statements. This guidance was effective for fiscal years, and interim periods within those years, beginning after December 15, 2011. We adopted this guidance effective June 1, 2013 with no material impact on our financial position, results of operations or cash flows.
F- 10
In July 2012, the FASB issued guidance to simplify how an entity tests indefinite-lived intangible assets other than goodwill for impairment and permit an entity to first assess qualitative factors to determine whether it is more likely than not that the fair value of the indefinite-lived intangible asset is less than its carrying amount as a basis for determining whether it is necessary to perform a quantitative impairment test. This guidance was effective for annual and interim impairment tests performed for fiscal years beginning after December 15, 2011. The guidance for the qualitative process became effective for our first quarter of fiscal 2013, and had no material impact on our consolidated financial position, results of operations or cash flows.
In February 2013, the FASB issued guidance on reporting the effect of significant reclassifications out of accumulated other comprehensive income. If the amount being reclassified is required under generally accepted accounting principles ("GAAP") to be reclassified in its entirety to net income, an entity is required to report the effect of these reclassifications on the respective line items in net income. For other amounts that are not required under GAAP to be reclassified in their entirety to net income in the same reporting period, an entity is required to cross-reference other disclosures required under GAAP that provide additional detail about those amounts. The guidance is effective prospectively for reporting periods beginning after December 15, 2013. The new guidance affects disclosures only, and did not impact our consolidated financial position, results of operations or cash flows.
In July 2013, the Financial Accounting Standards Board issued guidance which requires entities to present an unrecognized tax benefit, or a portion of an unrecognized tax benefit, as a reduction to a deferred tax asset for a net operating loss carryforward, a similar tax loss, or a tax credit carryforward when settlement in this manner is available under the tax law. The guidance is effective for fiscal years, and interim periods within those years, beginning after December 15, 2013. The new guidance is not expected to have a material impact our consolidated statements of operations, balance sheets, or statements of cash flows.
In May 2014, the FASB and the International Accounting Standards Board ("IASB") issued guidance to establish a new, more robust framework for the recognition of revenue related to the transfer of goods and services to customers. This guidance is effective for reporting periods beginning after December 15, 2016, including interim reporting periods within that reporting period. The impact this guidance will have on the consolidated financial statements cannot be determined at this time.
Other Comprehensive Income: Comprehensive income is equivalent to net income for all periods presented.
F- 11
Note 2: Fair Value Measurements
We measure certain financial assets and liabilities at fair value on a recurring basis, including cash equivalents, supplemental executive retirement plan assets and liabilities, and foreign currency derivatives. The fair value of financial assets and liabilities can be determined based on three levels of inputs, of which the first two are considered observable and the last unobservable, that may be used to measure fair value, as follows:
Level 1 – Observable inputs, such as quoted prices in active markets for identical assets or liabilities;
Level 2 – Inputs, other than the quoted prices in active markets, that are observable either directly or through corroboration with observable market data; and
Level 3 – Unobservable inputs, for which there is little or no market data for the assets or liabilities, such as internally-developed valuation models.
Our assets and liabilities measured at fair value on a recurring basis were determined as follows:
May 31, 2014 | |||||||||||||||
Quoted Prices in Active Markets for Identical Instruments (Level 1) | Significant Other Observable Inputs (Level 2) | Significant Unobservable Inputs (Level 3) | Total Balance | ||||||||||||
Assets | |||||||||||||||
Money market funds | $ | — | $ | — | $ | — | $ | — | |||||||
Supplemental executive retirement plan | |||||||||||||||
Money market fund | 323 | — | — | 323 | |||||||||||
Mutual funds | 3,095 | — | — | 3,095 | |||||||||||
Foreign exchange forward contracts | — | 9 | — | 9 | |||||||||||
Total assets measured at fair value | $ | 3,418 | $ | 9 | $ | — | $ | 3,427 | |||||||
May 31, 2013 | |||||||||||||||
Quoted Prices in Active Markets for Identical Instruments (Level 1) | Significant Other Observable Inputs (Level 2) | Significant Unobservable Inputs (Level 3) | Total Balance | ||||||||||||
Assets | |||||||||||||||
Money market funds | $ | 14 | $ | — | $ | — | $ | 14 | |||||||
Supplemental executive retirement plan | |||||||||||||||
Money market fund | 113 | — | — | 113 | |||||||||||
Mutual funds | 2,834 | — | — | 2,834 | |||||||||||
Foreign exchange forward contracts | — | 114 | — | 114 | |||||||||||
Total assets measured at fair value | $ | 2,961 | $ | 114 | $ | — | $ | 3,075 | |||||||
The fair value measures for our money market funds and supplemental executive retirement plan asset (see Note 13 for further discussion of our supplemental executive retirement plan asset) were derived from quoted market prices in active markets and are included in Level 1 inputs. Foreign currency forward contracts were valued based on observable market spot and forward rates as of our reporting date and are included in Level 2 inputs.
F- 12
Note 3: Acquisitions
Equipment Management Technology, Inc.
On August 24, 2011, pursuant to an Asset Purchase Agreement (“APA”), we completed the purchase of certain assets and the assumption of specified post-closing liabilities of Equipment Management Technology, Inc., a Nevada Corporation (“EMT”), for cash consideration of $10,673. EMT, headquartered in Las Vegas, Nevada, was a provider of electronic T&M equipment. We acquired EMT in order to facilitate growth in our T&M business. EMT had previously filed a voluntary petition for relief under Chapter 11 of the Bankruptcy Code in the United States Bankruptcy Court for the District of Nevada. The sale was approved by the Bankruptcy Court on August 11, 2011, and the related sale order was issued on August 12, 2011. At closing, $500 was deposited into an escrow account for any post-closing adjustments that reduce the purchase price. We have accounted for the acquisition of EMT as a business combination in accordance with accounting guidance.
At August 31, 2011, we completed our estimates of the fair value of rental and lease equipment and deferred revenue. Due to the timing of the acquisition, we completed our evaluation of intangible assets and accounts receivable in our second quarter ended November 30, 2011. We acquired gross accounts receivable of $972, of which an estimated $430 was not expected to be collected, resulting in a fair value of $542. Under accounting guidance, a bargain purchase gain results if the fair value of the purchase consideration is less than the net fair value of the assets acquired and liabilities assumed. We recorded a bargain purchase gain of $3,194, net of deferred taxes, related to our acquisition of EMT at August 31, 2011. We believe that we were able to negotiate a bargain purchase price as a result of our access to the liquidity necessary to complete the transaction and EMT’s recurring losses and recent bankruptcy filing.
The following table provides the estimated fair values of the assets acquired and liabilities assumed as of the date of acquisition.
Total cash consideration | $ | 10,673 | |
Purchase price allocation: | |||
Accounts receivable | 542 | ||
Rental and lease equipment | 15,896 | ||
Deferred tax liability | (2,092 | ) | |
Deferred revenue | (479 | ) | |
Net assets acquired | 13,867 | ||
Bargain purchase gain, net of deferred taxes of $2,092 | $ | (3,194 | ) |
The bargain purchase gain is classified separately in our consolidated statements of operations.
Acquisition-related transaction costs of $55 were accounted for as expenses in the periods in which the costs were incurred and are included in our selling, general and administrative expenses for fiscal 2012.
The acquisition of EMT was an asset purchase, and EMT’s operations were integrated with ours immediately after the acquisition date. Revenues and income before income taxes from the acquired assets included in our consolidated statements of operations were $5,232 and $2,862, respectively, for fiscal 2012.
During fiscal 2012, we increased the bargain purchase gain by a total of $396 ($241, net of deferred tax), consisting of (i) $140, representing the estimated fair value of customer relationships acquired, (ii) $273, of post-closing adjustments, which were disbursed from the escrow funds in accordance with the APA, offset by (iii) $17, representing the final determination of assets acquired and other components of the purchase price.
Supplemental pro forma information reflecting the acquisition of EMT as if it occurred on June 1, 2011 is not practicable because we are not able to obtain reliable historical financial information for 2011 and 2012, primarily due to a deterioration of the organization and controls leading up to and following EMT’s February 2011 bankruptcy filing.
Note 4: Goodwill and Other Intangible Assets
Goodwill represents the excess of the purchase price over the fair value of the net tangible and identifiable intangible assets acquired in a business combination. Intangible assets resulting from the acquisitions of entities accounted for using the acquisition method of accounting are recorded at the estimated fair value of the assets acquired. Identifiable intangible assets consist of purchased customer relationships and trade names.
Our goodwill and intangibles at May 31, 2014 are the result of our acquisition of EMT on August 24, 2011, Telogy on March 31, 2010, and Rush Computer Rentals, Inc. on January 31, 2006.
F- 13
The changes in carrying amount of goodwill and other intangible assets for fiscal 2014 and 2013 were as follows:
Balance as of June 1, 2013 (net of amortization) | Additions | Amortization | Balance as of May 31, 2014 | ||||||||||||
Goodwill | $ | 3,109 | $ | — | $ | — | $ | 3,109 | |||||||
Trade name | 411 | — | — | 411 | |||||||||||
Customer relationships | 626 | — | (164 | ) | 462 | ||||||||||
$ | 4,146 | $ | — | $ | (164 | ) | $ | 3,982 | |||||||
Balance as of June 1, 2012 (net of amortization) | Additions | Amortization | Balance as of May 31, 2013 | ||||||||||||
Goodwill | $ | 3,109 | $ | — | $ | — | $ | 3,109 | |||||||
Trade name | 411 | — | — | 411 | |||||||||||
Customer relationships | 790 | — | (164 | ) | 626 | ||||||||||
$ | 4,310 | $ | — | $ | (164 | ) | $ | 4,146 | |||||||
Goodwill is not deductible for tax purposes.
We evaluate the recoverability of goodwill and indefinite-lived intangible assets annually as of May 31, and whenever events or changes in circumstances indicate to us that the carrying amount may not be recoverable. There were no conditions that indicated any impairment of goodwill or identifiable intangible assets as of May 31, 2014, 2013 and 2012.
Intangible assets with finite useful lives are amortized over their respective estimated useful lives. The following table provides a summary of our intangible assets:
May 31, 2014 | ||||||||||||||
Estimated Useful Life | Gross Carrying Amount | Accumulated Amortization | Net Carrying Amount | |||||||||||
Trade name | — | $ | 411 | $ | — | $ | 411 | |||||||
Customer relationships | 3-8 years | 2,094 | (1,632 | ) | 462 | |||||||||
$ | 2,505 | $ | (1,632 | ) | $ | 873 | ||||||||
May 31, 2013 | ||||||||||||||
Estimated Useful Life | Gross Carrying Amount | Accumulated Amortization | Net Carrying Amount | |||||||||||
Trade name | — | $ | 411 | $ | — | $ | 411 | |||||||
Customer relationships | 3-8 years | 2,094 | (1,468 | ) | 626 | |||||||||
$ | 2,505 | $ | (1,468 | ) | $ | 1,037 | ||||||||
Amortization expense was $164, $164 and $153 for fiscal 2014, 2013 and 2012, respectively.
Amortization expense for customer relationships is included in selling, general and administrative expenses. The following table provides estimated future amortization expense related to intangible assets:
Year ending May 31, | Future Amortization | ||
2015 | $ | 129 | |
2016 | 118 | ||
2017 | 118 | ||
2018 | 97 | ||
2019 | — | ||
$ | 462 | ||
F- 14
Note 5: Borrowings
On November 19, 2013, we entered into a credit agreement (the “Credit Agreement”) with J.P. Morgan Chase Bank, National Association (“JPM”), as administrative agent, J.P. Morgan Securities LLC, as sole bookrunner and sole lead arranger, and a syndicate of lenders. The Credit Agreement provides for a $25,000 revolving credit facility, including swingline loans and letters of credit, and has a term of three years. We have an option to increase the commitments under the Credit Agreement by up to an additional $25,000, subject to certain approvals and conditions as set forth in the Credit Agreement. Borrowings under the Credit Agreement bear interest at a rate equal to, at our election, the applicable rate for a “Eurodollar Loan” or a “CB Floating Rate Loan.” Eurodollar Loan advances accrue interest at a per annum interest rate equal to (i) the quotient (rounded upwards to the next 1/16th of 1%) of (a) the applicable LIBO Rate, divided by (b) one minus the maximum aggregate reserve requirement (expressed as a decimal) imposed under Federal Reserve Board Regulation D (the “Adjusted LIBO Rate”), plus (ii) 0.75%. CB Floating Rate Loan advances accrue interest at a per annum interest rate equal to (i) the higher of (a) JPM’s Prime Rate or (b) the Adjusted LIBO Rate for a one month interest period plus 2.5%, minus (ii) 2.0%. In addition, we pay a commitment fee of 0.10% of the unused amount if the average borrowing under the Credit Agreement is less than or equal to $8,000 on a quarterly basis.
The Credit Agreement contains customary affirmative and negative covenants (which are in some cases subject to certain exceptions), including, but not limited to, restrictions on the ability to incur additional indebtedness, create liens, make certain investments, make restricted payments, enter into or undertake certain liquidations, mergers, consolidations or acquisitions and dispose of assets or subsidiaries. In addition, the Credit Agreement requires us to maintain minimum earnings and tangible net worth. We were in compliance with all financial covenants at May 31, 2014.
On November 19, 2013, in connection with entering into the Credit Agreement, we terminated our prior credit facility and repaid all outstanding loans thereunder without penalty. The prior credit agreement provided for a revolving credit facility of $50,000.
At May 31, 2014, we had no borrowings outstanding under the Credit Agreement. We had $10,000 borrowings outstanding at May 31, 2013. The weighted average interest rate under the line of credit was approximately 2.35% at May 31, 2013.
Note 6: Income Taxes
We recognize a liability or an asset for the deferred tax consequences of temporary differences between the tax basis of assets and liabilities and their reported amounts in the financial statements. These temporary differences will result in taxable or deductible amounts in future years when reported amounts of the assets or liabilities are recovered or settled. The deferred tax assets are periodically reviewed for recoverability.
Accounting guidance for accounting for uncertain tax positions prescribes a recognition threshold required to be met before being recognized in the financial statements and provides guidance on derecognition, measurement, classification, interest and penalties, accounting in interim periods, disclosure and transition issues. There were no uncertain tax positions in fiscal 2014, 2013 and 2012.
We recognize interest and penalties accrued with respect to uncertain tax positions as components of our income tax provision. At May 31, 2014 and 2013, we did not have any accrual for interest and penalties.
We are subject to taxation in the U.S., as well as various states and foreign jurisdictions. We have substantially settled all income tax matters for the United States federal jurisdiction for years through fiscal 2011. Major state jurisdictions have been examined through fiscal 2004 and 2005, and foreign jurisdictions have not been examined for their respective maximum statutory periods.
For financial reporting purposes, income before income taxes comprised the following as of May 31:
2014 | 2013 | 2012 | |||||||||
Domestic | $ | 30,907 | $ | 37,162 | $ | 40,364 | |||||
Foreign | 1,619 | (49 | ) | (359 | ) | ||||||
$ | 32,526 | $ | 37,113 | $ | 40,005 | ||||||
F- 15
The provision for income taxes consisted of the following for the fiscal years ended May 31:
2014 | 2013 | 2012 | |||||||||
Current | |||||||||||
Federal | $ | 18,007 | $ | 17,007 | $ | 1,057 | |||||
State | 1,720 | 1,417 | 1,523 | ||||||||
Foreign | 319 | 573 | 538 | ||||||||
Deferred | |||||||||||
Federal | (7,553 | ) | (4,401 | ) | 10,541 | ||||||
State | (500 | ) | 257 | 559 | |||||||
Foreign | 125 | (494 | ) | 15 | |||||||
$ | 12,118 | $ | 14,359 | $ | 14,233 | ||||||
The following reconciles the statutory federal income tax rate to the effective tax rate for the fiscal years ended May 31:
2014 | 2013 | 2012 | ||||||
Statutory federal rate | 35.0 | % | 35.0 | % | 35.0 | % | ||
State taxes, net of federal benefit | 2.5 | 3.0 | 3.4 | |||||
Bargain purchase gain | — | — | (3.0 | ) | ||||
Foreign tax credit/refund | (0.6 | ) | — | (0.4 | ) | |||
Permanent differences resulting from valuation allowances | 0.3 | 0.7 | 0.7 | |||||
Other | 0.1 | — | (0.1 | ) | ||||
Effective tax rate | 37.3 | % | 38.7 | % | 35.6 | % | ||
The lower effective rate for fiscal 2014 as compared to fiscal 2013 is due to more income being apportioned to states with lower tax rates resulting in a lower effective state rate and Belgian tax credits. The lower effective rate in fiscal 2012 as compared to fiscal 2013 was due to the bargain purchase gain on EMT and state tax credits offset by an increase in the foreign valuation allowance.
The tax effects of temporary differences that gave rise to significant portions of the net deferred tax liabilities consisted of the following at May 31:
2014 | 2013 | ||||||
Deferred tax assets: | |||||||
Allowance for doubtful accounts | $ | 198 | $ | 105 | |||
Deferred compensation and benefits | 4,547 | 3,545 | |||||
Net operating losses | 254 | 1,110 | |||||
Valuation allowance | (254 | ) | (1,110 | ) | |||
Other | 1,791 | 908 | |||||
6,536 | 4,558 | ||||||
Deferred tax liabilities: | |||||||
Accumulated depreciation | (46,169 | ) | (51,948 | ) | |||
Deferred taxes on bargain purchase | (2,027 | ) | (2,207 | ) | |||
Intangible asset | (152 | ) | (143 | ) | |||
Net deferred tax liabilities | $ | (41,812 | ) | $ | (49,740 | ) | |
We determined that a valuation allowance was required in fiscal 2014, 2013 and 2012 of $254, $1,110 and $871, respectively, for our deferred tax asset related to certain foreign net operating loss carry forwards, which, if unused, will expire between fiscal 2014 and 2017. The change in the valuation allowance for fiscal 2014, 2013 and 2012 was not significant. As of May 31, 2014, 2013 and 2012, U.S. income taxes had not been assessed on approximately $6,303, $1,833 and $1,599, respectively, of undistributed earnings of foreign subsidiaries because we consider these earnings to be invested indefinitely.
F- 16
Note 7: Sales-type Leases
We have certain customer leases providing bargain purchase options, which are accounted for as sales-type leases. Interest income is recognized over the life of the lease using the effective interest method.
The initial acceptance of customer finance arrangements is based on an in-depth review of each customer’s credit profile, including review of third party credit reports, customer financial statements and bank verifications. We monitor the credit quality of our sales-type lease portfolio based on payment activity and the related finance lease receivable aging. This credit quality is assessed on a monthly basis. Our historical losses on finance lease receivables are insignificant, and therefore we do not have a specific allowance for credit losses.
The minimum lease payments receivable and the net investment included in other assets were as follows at May 31:
2014 | 2013 | ||||||
Gross minimum lease payments receivable | $ | 7,543 | $ | 9,862 | |||
Less—unearned interest | (279 | ) | (425 | ) | |||
Net investment in sales-type lease receivables | $ | 7,264 | $ | 9,437 | |||
The following table provides estimated future minimum lease payments by year related to sales-type leases:
Year ending May 31, | Future Amortization | ||
2015 | $ | 5,699 | |
2016 | 1,547 | ||
2017 | 297 | ||
2018 | — | ||
2019 | — | ||
$ | 7,543 | ||
Note 8: Computation of Earnings per Share
The following is a reconciliation of the denominator used in the computation of basic and diluted EPS for the fiscal years ended May 31:
2014 | 2013 | 2012 | |||||||||
Denominator: | |||||||||||
Denominator for basic earnings per share—weighted average common shares outstanding (including shares issuable for vested restricted stock units) | 24,325 | 24,226 | 23,983 | ||||||||
Effect of unvested restricted stock units | 32 | 43 | 169 | ||||||||
Diluted shares used in per share calculation | 24,357 | 24,269 | 24,152 | ||||||||
Net income | $ | 20,408 | $ | 22,754 | $ | 25,772 | |||||
Earnings per share: | |||||||||||
Basic | $ | 0.84 | $ | 0.94 | $ | 1.07 | |||||
Diluted | $ | 0.84 | $ | 0.94 | $ | 1.07 | |||||
Note 9: Rentals under Noncancellable Operating Leases
We rent equipment on a short-term basis and lease equipment for periods of typically one to three years. Such leases provide the lessee with the option to renew the lease term, purchase the equipment at fair market value, or continue to rent on a month-to-month basis. Our operating leases do not provide for contingent rentals.
Our cost of equipment under operating leases at May 31, 2014 and May 31, 2013, with remaining noncancellable lease terms of more than one year, was $9,353 and $15,215, before accumulated depreciation of $3,409 and $4,242, and the net book value was $5,943 and $10,973, respectively.
F- 17
The following sets forth a schedule of minimum future rentals to be received on noncancellable operating leases with remaining lease terms of more than one year as of May 31, 2014:
2015 | $ | 2,827 | |
2016 | 1,390 | ||
2017 | 231 | ||
2018 | — | ||
2019 | — | ||
$ | 4,448 | ||
Note 10: Other Property
Other property, at cost, consisted of the following at May 31:
2014 | 2013 | ||||||
Land | $ | 6,985 | $ | 6,985 | |||
Buildings | 15,784 | 15,774 | |||||
Furniture and other equipment | 9,118 | 9,730 | |||||
Leasehold improvements | 218 | 210 | |||||
32,105 | 32,699 | ||||||
Less—accumulated depreciation and amortization | (18,983 | ) | (18,873 | ) | |||
$ | 13,122 | $ | 13,826 | ||||
Depreciation expense was $1,089, $1,149 and $1,157 for fiscal 2014, 2013 and 2012, respectively. Depreciation expense is included in selling, general and administrative expenses.
Note 11: Commitments and Contingencies
We lease certain facilities under various operating leases. Most of the lease agreements provide us with the option of renewing our leases at the end of the initial lease term, at fair market rates, for periods of up to five years. In most cases, we expect that in the normal course of business, facility leases will be renewed or replaced by other leases.
Minimum payments over the next five years under these leases as of May 31, 2014, exclusive of property taxes and insurance, are as follows:
2015 | $ | 773 | |
2016 | 484 | ||
2017 | 150 | ||
2018 | 62 | ||
2019 | — | ||
$ | 1,469 | ||
Rent expense was $1,169, $1,125 and $1,007 for fiscal 2014, 2013 and 2012, respectively.
We are subject to legal proceedings and business disputes involving ordinary routine legal matters and claims incidental to our business. The ultimate legal and financial liability with respect to such matters generally cannot be estimated with certainty and requires the use of estimates in recording liabilities for potential litigation settlements or awards against us. Estimates for losses from litigation are made after consultation with outside counsel. If estimates of potential losses increase or the related facts and circumstances change in the future, we may be required to record either more or less litigation expense. We are not involved in any pending or threatened legal proceedings that we believe could reasonably be expected to have a material adverse effect on our financial condition, results of operations or cash flows.
F- 18
Note 12: Stock Option Plans and Equity Incentive Plan
Our 2005 Equity Incentive Plan (the “Equity Incentive Plan”) authorizes our Board of Directors to grant incentive and non-statutory stock option grants, stock appreciation rights, restricted stock awards, restricted stock units, performance unit awards and performance share awards covering a maximum of 1,000 shares of our common stock. The Equity Incentive Plan replaced our prior stock option plans, under which there are no outstanding options. Pursuant to the Equity Incentive Plan, we granted incentive and non-statutory options to directors, officers and key employees at prices not less than 100% of the fair market value on the day of grant. All outstanding options expired in October 2011. In addition, we have granted restricted stock and restricted stock units to directors, officers and key employees. The Equity Incentive Plan provides for a variety of vesting dates. Our typical vesting period is three years.
Restricted Stock Units
Restricted stock units represent the right to receive one share of our common stock provided that the vesting conditions are satisfied. The following table represents restricted stock unit activity for fiscal 2014:
Restricted Stock Units | Weighted Average Grant Date Fair Value | |||||
Nonvested at June 1, 2013 | 154 | $ | 16.13 | |||
Granted | 65 | 18.20 | ||||
Vested | (96 | ) | 15.71 | |||
Forfeited/canceled | (1 | ) | 15.65 | |||
Nonvested at May 31, 2014 | 122 | $ | 17.57 | |||
We granted 65, 73 and 101 restricted stock units during fiscal 2014, 2013 and 2012, respectively. As of May 31, 2014, we have unrecognized share-based compensation cost of approximately $1,134 associated with restricted stock units. This cost is expected to be recognized over a weighted-average period of approximately 1.7 years. We had 329, 246 and 145 of vested restricted stock units as of May 31, 2014, 2013 and 2012, respectively, which received dividends upon vesting and are convertible to common shares five years after grant date.
The total fair value of shares that vested during fiscal 2014, 2013 and 2012 was $1,414, $1,439 and $523, respectively, which was calculated based on the closing price of our common stock on the Nasdaq Stock Market on the applicable date of vesting.
Accounting for Share Based Payments
Accounting guidance requires all share-based payments to employees, including grants of employee stock options, restricted stock and restricted stock units, to be recognized as compensation expense in the consolidated financial statements based on their fair values. Compensation expense is recognized over the period that an employee provides service in exchange for the award, approximately three years.
Forfeitures are estimated at the date of grant based on historical experience. We use the market price of our common stock on the date of grant to calculate the fair value of each grant of restricted stock and restricted stock units.
We recorded $1,356, $1,330 and $1,438 of stock-based compensation as part of selling, general and administrative expenses for fiscal 2014, 2013 and 2012, respectively.
We receive a tax deduction for certain stock option exercises during the period the options are exercised, generally for the excess of the fair value of our common stock at the date of exercise over the exercise price of the options, and dividends paid on vested restricted stock units. Excess tax benefits are realized tax benefits from tax deductions for exercised options in excess of the deferred tax asset attributable to stock compensation costs for such options. The total tax benefit realized from stock option exercises, shares issued and dividend payments for vested restricted stock units for fiscal 2014, 2013 and 2012 was $183, $251 and $102, respectively. There were no stock option exercises in fiscal 2014, 2013 and 2012.
Note 13: Savings Plan, Employee Stock Ownership Plan and Retirement Plan
We maintain a Savings Plan (“401(k)”) and a frozen Employee Stock Ownership Plan (“ESOP”). Employees become eligible to participate in the 401(k) after 90 days of employment. We have the option to match contributions of participants at a rate we determine each year. For participants with three or more years of service, we also may elect to make additional discretionary matching contributions in excess of the rate elected for participants with less than three years of service.
F- 19
The Board of Directors determines the amount to be contributed annually to the 401(k) in cash, provided that such contributions shall not exceed the amount deductible for federal income tax purposes. Cash contributions to the 401(k) of $784, $749 and $428 were made for fiscal 2014, 2013 and 2012, respectively.
The ESOP was established in 1975 and was frozen in 1994, at which time all participants became fully vested. Contributions to the ESOP were invested primarily in our common stock. The ESOP was terminated in fiscal 2013.
We have a Supplemental Executive Retirement Plan (“SERP”) that provides for automatic deferral of contributions in excess of the maximum amount permitted under the 401(k) for our executives who choose to participate. The SERP is a non-qualified deferred compensation program, and we have an unfunded contractual obligation under this plan. We have the option to match contributions of participants at a rate we determine each year. Cash contributions to the SERP were $25, $29 and $30 for fiscal 2014, 2013 and 2012, respectively. As of May 31, 2014 and 2013, we had $3,418 and $2,947, respectively, of obligations for this plan included in accrued expenses. We have investments in money market and stock and bond funds, as directed by the participants, of $3,418 and $2,947 as of May 31, 2014 and 2013, respectively, included in other assets.
Note 14: Segment Reporting and Related Disclosures
Accounting guidance establishes reporting standards for an enterprise’s operating segments and related disclosures about its products, services, geographic areas and major customers. Operating segments are defined as components of an enterprise for which separate financial information is available that is regularly evaluated by the chief operating decision maker in deciding how to allocate resources and in assessing performance. In order to determine our operating segments, we considered the following: an operating segment is a component of an enterprise (i) that engages in business activities from which it may earn revenues and incur expenses, (ii) whose operating results are regularly reviewed by the enterprise’s chief operating decision maker to make decisions about resources to be allocated to the segment and assess its performance, and (iii) for which discrete financial information is available. In accordance with this guidance, we have identified two operating segments: our T&M and of DP business.
Although we have separate operating segments for T&M and DP equipment, these two segments are aggregated into a single reportable segment because they have similar economic characteristics and qualitative factors. The T&M and DP segments have similar long-term average gross margins, and both rent, lease and sell electronic equipment to large corporations, purchase directly from major manufacturers, configure and calibrate the equipment, and ship directly to customers.
Our equipment pool, based on acquisition cost, comprised $421,128 of T&M equipment and $37,911 of DP equipment at May 31, 2014, and $423,306 of T&M equipment and $35,947 of DP equipment at May 31, 2013. Revenues for these operating segments were as follows for the fiscal year ended May 31:
T&M | DP | Total | |||||||||
2014 | |||||||||||
Rentals and leases | $ | 120,629 | $ | 16,788 | $ | 137,417 | |||||
Sales of equipment and other revenues | 101,898 | 1,822 | 103,720 | ||||||||
$ | 222,527 | $ | 18,610 | $ | 241,137 | ||||||
2013 | |||||||||||
Rentals and leases | $ | 120,846 | $ | 15,745 | $ | 136,591 | |||||
Sales of equipment and other revenues | 109,700 | 2,440 | 112,140 | ||||||||
$ | 230,546 | $ | 18,185 | $ | 248,731 | ||||||
2012 | |||||||||||
Rentals and leases | $ | 113,540 | $ | 16,197 | $ | 129,737 | |||||
Sales of equipment and other revenues | 116,417 | 2,400 | 118,817 | ||||||||
$ | 229,957 | $ | 18,597 | $ | 248,554 | ||||||
F- 20
No single customer accounted for more than 10% of total revenues during fiscal 2014, 2013 or 2012. Selected country information is presented below:
Year ended May 31, | 2014 | 2013 | 2012 | ||||||||
Revenues: 1 | |||||||||||
U.S. | $ | 203,806 | $ | 211,745 | $ | 214,354 | |||||
Other 2 | 37,331 | 36,986 | 34,200 | ||||||||
Total | $ | 241,137 | $ | 248,731 | $ | 248,554 | |||||
As of May 31, | 2014 | 2013 | 2012 | ||||||||
Net Long Lived Assets: 3 | |||||||||||
U.S. | $ | 188,343 | $ | 198,956 | 207,449 | ||||||
Other 2 | 46,667 | 49,726 | 49,595 | ||||||||
Total | $ | 235,010 | $ | 248,682 | $ | 257,044 | |||||
1 | Revenues by country are based on the shipping destination. |
2 | Other consists of countries other than the U.S. Each foreign country individually accounts for less that 10% of the total revenues and long-lived assets. |
3 | Net long-lived assets include rental and lease equipment and other property, net of accumulated depreciation and amortization. |
Note 15: Quarterly Information (Unaudited)
Summarized quarterly financial data for fiscal 2014 and 2013 was as follows:
Total Revenues | Gross Profit 1 | Income Before Taxes | Net Income | Earnings per share | |||||||||||||||||||
Basic | Diluted | ||||||||||||||||||||||
Fiscal Year 2014 | |||||||||||||||||||||||
First Quarter | $ | 60,168 | $ | 23,465 | $ | 8,868 | $ | 5,697 | $ | 0.23 | $ | 0.23 | |||||||||||
Second Quarter | 57,876 | 23,138 | 8,999 | 5,581 | 0.23 | 0.23 | |||||||||||||||||
Third Quarter | 62,016 | 21,579 | 7,291 | 4,537 | 0.19 | 0.19 | |||||||||||||||||
Fourth Quarter | 61,077 | 22,877 | 7,368 | 4,593 | 0.19 | 0.19 | |||||||||||||||||
Annual totals | $ | 241,137 | $ | 91,059 | $ | 32,526 | $ | 20,408 | $ | 0.84 | $ | 0.84 | |||||||||||
Fiscal Year 2013 | |||||||||||||||||||||||
First Quarter | $ | 58,501 | $ | 22,022 | $ | 8,391 | $ | 5,086 | $ | 0.21 | $ | 0.21 | |||||||||||
Second Quarter | 65,192 | 24,388 | 10,457 | 6,239 | 0.26 | 0.26 | |||||||||||||||||
Third Quarter | 64,672 | 22,160 | 8,437 | 5,037 | 0.21 | 0.21 | |||||||||||||||||
Fourth Quarter | 60,366 | 24,684 | 9,828 | 6,392 | 0.26 | 0.26 | |||||||||||||||||
Annual totals | $ | 248,731 | $ | 93,254 | $ | 37,113 | $ | 22,754 | $ | 0.94 | $ | 0.94 | |||||||||||
1 | Gross profit is calculated as total revenues less depreciation of rental and lease equipment, costs of rentals and leases and costs of sales of equipment and other revenues. |
Note 16: Subsequent Events
On June 5, 2014 our Board of Directors declared a quarterly cash dividend of $0.20 per common share. The dividend was paid on July 10, 2014 to shareholders of record as of June 20, 2014.
F- 21