Attached files
| file | filename |
|---|---|
| EX-32.1 - EXHIBIT 32.1 - ELECTRO RENT CORP | ex-32153116.htm |
| EX-32.2 - EXHIBIT 32.2 - ELECTRO RENT CORP | ex-32253116.htm |
| EX-31.2 - EXHIBIT 31.2 - ELECTRO RENT CORP | ex-31253116.htm |
| EX-31.1 - EXHIBIT 31.1 - ELECTRO RENT CORP | ex-31153116.htm |
| EX-23 - EXHIBIT 23 - ELECTRO RENT CORP | ex-2353116.htm |
| EX-10.11 - EXHIBIT 10.11 - ELECTRO RENT CORP | ex-101153116.htm |
UNITED STATES
SECURITIES AND EXCHANGE COMMISSION
Washington DC 20549
FORM 10-K
(Mark One)
☑ | ANNUAL REPORT PURSUANT TO SECTION 13 OR 15(d) OF THE SECURITIES EXCHANGE ACT OF 1934 |
For the fiscal year ended May 31, 2016
or
☐ | TRANSITION REPORT PURSUANT TO SECTION 13 OR 15(d) OF THE SECURITIES EXCHANGE ACT OF 1934 |
For the transition period from to
Commission File Number: 000-09061
ELECTRO RENT CORPORATION
(Exact Name of Registrant as Specified in Its Charter)
CALIFORNIA | 95-2412961 | |
(State or Other Jurisdiction of Incorporation or Organization) | (I.R.S. Employer Identification No.) | |
6060 Sepulveda Boulevard
Van Nuys, California 91411-2512
(Address of Principal Executive Offices and Zip Code)
(818) 786-2525
(Registrant’s telephone number, including area code)
Securities registered pursuant to Section 12(b) of the Act:
Title of Each Class | Name of Each Exchange on Which Registered | |
Common Stock without par value | The NASDAQ Stock Market LLC | |
Securities registered pursuant to Section 12(g) of the Act: None
Indicate by check mark if the registrant is a well-known seasoned issuer, as defined in Rule 405 of the Securities Act. Yes ☐ No ☒
Indicate by check mark if the registrant is not required to file reports pursuant to Section 13 or Section 15(d) of the Act. Yes ☐ No ☒
Indicate by check mark whether the registrant (1) has filed all reports required to be filed by Section 13 or 15(d) of the Securities Exchange Act of 1934 during the preceding 12 months (or for such shorter period that the registrant was required to file such reports), and (2) has been subject to such filing requirements for the past 90 days. Yes ☒ No ☐
Indicate by check mark whether the registrant has submitted electronically and posted on its corporate Web site, if any, every Interactive Data File required to be submitted and posted pursuant to Rule 405 of Regulation S-T (§ 232.405 of this chapter) during the preceding 12 months (or for such shorter period that the registrant was required to submit and post such files). Yes ☒ No ☐
Indicate by check mark if disclosure of delinquent filers pursuant to Item 405 of Regulation S-K (§229.405 of this chapter) is not contained herein, and will not be contained, to the best of registrant’s knowledge, in definitive proxy or information statements incorporated by reference in Part III of this Form 10-K or any amendment to this Form 10-K. ☒
Indicate by check mark whether the registrant is a large accelerated filer, an accelerated filer, a non-accelerated filer, or a smaller reporting company. See the definitions of “large accelerated filer,” “accelerated filer” and “smaller reporting company” in Rule 12b-2 of the Exchange Act.
Large Accelerated Filer | ☐ | Accelerated Filer | ☒ | |||
Non-Accelerated Filer | ☐ | (Do not check if a smaller reporting company) | Smaller Reporting Company | ☐ | ||
Indicate by check mark whether the registrant is a shell company (as defined in Rule 12b-2 of the Act). Yes ☐ No ☒
The aggregate market value of the registrant’s common stock held by non-affiliates, computed on the basis of the closing price as reported on the Nasdaq market as of November 30, 2015, was $159,711,978. Shares of common stock held by executive officers, directors and by persons who own 10% or more of the outstanding common stock of the registrant have been excluded for purposes of the foregoing calculation. This does not reflect a determination that such persons are affiliates for any other purpose.
Number of shares of the registrant’s common stock outstanding as of August 8, 2016: 24,200,660.
EXPLANATORY NOTE
Unless otherwise noted, (1) the terms “we”, “us” and “our” refer to Electro Rent Corporation and its subsidiaries, and (2) the terms “Common Stock” and “shareholder(s)” refer to our common stock and the holders of that stock, respectively.
On June 23, 2016, we entered into an Amended and Restated Agreement and Plan of Merger (the “Restated Merger Agreement”) with Elecor Intermediate Holding II Corporation, a Delaware corporation (“Parent”), and Elecor Merger Corporation, a California corporation and a wholly owned subsidiary of Parent (“Merger Sub”), pursuant to which, subject to the satisfaction or waiver of the conditions set forth therein, Merger Sub will be merged with and into us, and we will survive the merger as a wholly-owned subsidiary of Parent (the “Merger”). Parent and Merger Sub are affiliates of Platinum Equity, a Beverly Hills-based private equity firm (“Platinum Equity”).
Our board of directors, in accordance with and upon the unanimous recommendation of a special committee of independent directors, has approved the Merger Agreement and the transactions contemplated thereby, including the Merger. The Merger was approved by our shareholders at a special meeting held on August 5, 2016. We expect the Merger and the transactions contemplated thereby to close by the end of August 2016.
If the Merger closes, each outstanding share of our Common Stock (other than shares held by any person who properly asserts dissenters’ rights under California law) will be converted into the right to receive an amount in cash equal to $15.50 per share (the “Merger Consideration”). Our existing shareholders will no longer have an equity ownership in our company and will no longer participate in our future earnings or growth. After the closing of the Merger, our Common Stock will no longer be listed on the NASDAQ Global Select Market and will be deregistered under the Securities Exchange Act of 1934, as amended and we will no longer file periodic reports with the SEC.
SPECIAL NOTE ABOUT FORWARD-LOOKING STATEMENTS
This Annual Report on Form 10-K contains forward-looking statements within the meaning of Section 27A of the Securities Act of 1933, as amended, and Section 21E of the Securities Exchange Act of 1934, as amended. You can find many (but not all) of these statements by looking for words such as “approximates,” “believes,” “expects,” “anticipates,” “estimates,” “intends,” “plans,” “would,” “may” or other similar expressions in this report. We claim the protection of the safe harbor contained in the Private Securities Litigation Reform Act of 1995. We caution investors that any forward-looking statements presented in this report, or that we may make orally or in writing from time to time, reflect our good faith estimations based on information currently available to us. Such statements are based on assumptions, and the actual outcome will be affected by known and unknown risks, trends, uncertainties and factors that are beyond our control or ability to predict. Although we believe that our assumptions are reasonable, they are not guarantees of future performance and some will inevitably prove to be incorrect. As a result, our actual future results can be expected to differ from our expectations, and those differences may be material.
Some of the risks and uncertainties that may cause our actual results, performance or achievements to differ materially from those expressed or implied by forward-looking statements include the following: statements concerning our expectation that the Merger will close, Common Stock price fluctuations, fluctuations in operating results (including as a result of changing economic conditions), risks associated with technology changes, risks associated with customer solvency, competition, risks associated with international operations, risks associated with our manufacturers and suppliers, dependence on key personnel, control by management and others, risks associated with possible acquisitions and new business ventures and anti-takeover provisions. For further discussion of these and other factors that may impact our future operations, see Item 1A. “Risk Factors”; Item 7. “Management’s Discussion and Analysis of Financial Condition and Results of Operations”; and Item 7A. “Quantitative and Qualitative Disclosure about Interest Rates and Currency Rates,” in this report, and our other filings with the Securities and Exchange Commission.
This Annual Report on Form 10-K and all subsequent written and oral forward-looking statements attributable to us or any person acting on our behalf are expressly qualified in their entirety by the cautionary statements contained or referred to in this section. We do not undertake any obligation to update our forward-looking statements to reflect events or circumstances after the date of this report, except as required by law.
2
PART I
Item 1. Business.
We are a global organization devoted to the rental, lease and sale of new and used electronic test and measurement (“T&M”) equipment. We purchase T&M equipment from leading manufacturers such as Keysight Technologies, Inc. (formerly Agilent Technologies, Inc., “Keysight”), Anritsu, Inc. ("Anritsu"), Rohde & Schwarz Gmbh & Co. KG ("Rohde & Schwarz") and Tektronix Inc ("Tektronix"). Our customers rent, lease and buy our T&M equipment, and use that equipment primarily in the aerospace and defense, telecommunications, electronics, industrial and semiconductor markets.
In addition, we purchase personal computers from manufacturers including Dell, HP, IBM, Toshiba and Apple for our Data Products ("DP") division.
The Electro Rent Approach. For the most part, customers who rent, purchase, or lease equipment from us place orders through our inside sales force, which has access to our proprietary computer system that we update in real time for equipment availability and pricing. In the case of rentals and some leases, we use a pool of equipment we have previously purchased for that purpose, or we may add equipment to that pool to fill a lease or rental order if the addition makes economic sense. Our equipment fulfillment team typically can arrange delivery of equipment from our pool to our customers within one or two days of a request. Most of our equipment is technically complex and must be tested and serviced when returned to us. We do most of that testing in house, using a team of experienced technicians and our state of the art calibration laboratory.
Although our customers respond to equipment pricing and availability in making their decisions to choose to work with us, we believe that our success also depends on other factors:
• | Customer Service. Our customer service responsiveness and expert technical staff provide us with a key competitive advantage. Our resale channel for T&M equipment in the United States and Canada has enabled us to substantially expand the number and technical expertise of our T&M sales force which, at approximately 100 persons worldwide, is already the largest among our principal competitors. |
• | Trusted Brand. We believe our management team is the most experienced and stable in the industry, with our executive officers averaging 30 years at Electro Rent. In 2008, 2009 and 2014, Forbes magazine named us as one of the “100 Most Trustworthy Companies” out of more than 8,000 publicly traded companies for “transparent and conservative accounting practices and solid corporate governance and management.” We were also honored as a Frost & Sullivan 2012 Company of the Year. |
• | Global Platform. We have locations in North America, Asia and Europe. Our size and reach may appeal to multinational customers and assists us in maximizing our equipment utilization and equipment pool management across different geographic markets. The majority of our rental equipment not out on rent is located at our Van Nuys, California warehouse and service center that is compliant with ISO9001:2008 (DEKRA certification), ISO17025:2005 (A2LA accreditation) and ANSI/NCSLI Z540.3-2006 (A2LA accreditation). We also service our customers through sales offices and calibration and service centers in the United States, Canada, China and Belgium, which are linked by a proprietary computer system. These centers also function as depots for the sale of used equipment. |
• | Multichannel Offerings. Our business offers customers a single source for their equipment needs, whether they want to rent, lease or buy new or used equipment. We believe that we offer the greatest breadth of acquisition options in the industry, allowing our customers to match the appropriate option to their usage and capital needs, budget and other factors, such as accounting rules and regulatory requirements. In addition, spreading costs over multiple channels allows us to maintain the largest sales force among our principal competitors, which in turn broadens and deepens our customer contacts and provides them more technical strength and assistance. |
• | Equipment Management. To maximize our overall profit, we manage our equipment pool on an on-going basis by controlling the timing, pricing and mix of our purchases and sales of equipment. We acquire new and used equipment to meet current and anticipated customer demand and stay abreast of current technical standards. We sell our used equipment when we believe that is the most lucrative option. We employ a complex equipment management strategy and our proprietary PERFECT software to adjust our equipment pool and pricing in order to maximize equipment availability, utilization and profitability. Our PERFECT software is designed to provide real time pricing and availability on our global equipment pool, ensure rapid order fulfillment and improve overall customer service. |
Our Sales Strategy. We have a focused sales strategy, using a direct sales force to meet our customers’ needs in our T&M equipment rental, lease and sales business. We have an experienced, highly technical sales force that specializes in all the products and services offered by our company. Our sales force identifies potential customers through coordinated efforts with our marketing organization, which is staffed by professionals with many years of industry-related experience. As our customers
3
have a wide range of requirements for equipment, our sales force is able to leverage our extensive knowledge of the T&M and DP equipment environment to determine the right product to rent, lease or sell to the customer to meet the customer’s specific needs.
We sell new T&M equipment and sales of new T&M equipment represented approximately 33.7%, 66.8% and 63.5% of our sales of equipment and other revenues for fiscal 2016, 2015 and 2014, respectively. Substantially all of our new equipment sales for the years ended May 31, 2015 and 2014 were generated through our reseller agreement with Keysight where we were an authorized reseller of certain Keysight T&M products and services to small and medium size customers in the United States and Canada. Our reseller agreement with Keysight expired on May 31, 2015. The expiration of the Keysight reseller agreement materially affected our revenues and net profits and will continue to do so in the future. Please see the risk factor in PART I-Section 1A, below, for further discussion about the risks related to the expiration of the Keysight reseller agreement.
In fiscal 2016, we entered into agreements with other manufacturers of equipment, which we could not represent while we operated under the Keysight reseller agreement, including Anritsu, Rohde & Schwarz and ART-Fi SAS.
Competition. We face different competition based on industry sector and geography. For T&M equipment, the North American market generates in excess of $300 million of rental and lease revenue annually. The market is characterized by intense competition from several competitors, and no single competitor holds a dominant market share in North America. Globally, our primary competitors in this market include McGrath RentCorp, Continental Resources, Inc., Test Equity LLC, and Microlease plc. These entities also compete with us in leasing T&M equipment, as do banks, vendors and other financing sources. In selling used equipment, we may also compete with sales of new equipment by our suppliers, including Keysight, Rohde & Schwarz, Tektronix and Anritsu, and their other distributors.
For our DP division, the market for the lease and rental of computers is highly fragmented. Our principal competitors in this area include SmartSource Rentals ("SmartSource"), Rentex Inc. ("Rentex"), Rentfusion Corporation ("Rentfusion") and Vernon Computer Source. The computer rental market has been characterized by intense competition that has led to industry consolidation in recent years. SmartSource, our largest competitor in this market, has expanded primarily due to its numerous acquisitions. While we have focused on the rental of large quantities of computers to unique customers, SmartSource concentrates more on audio visual and trade show technology rentals.
Competition in our industry is concentrated on price. Our competitors engage in aggressive pricing for both rentals and sales. In order to maintain or increase our market share, we may choose to lower our prices, resulting in lower revenues and decreased profitability. In addition to price, we compete on the breadth of our product offerings, extensive sales channels, experienced customer and technical support and proprietary equipment management systems as outlined under “The Electro Rent Approach” above.
Our Backlog. At May 31, 2016, we had a sales order backlog for new T&M equipment of $1.3 million, compared to $12.4 million at May 31, 2015 and $10.7 million at May 31, 2014. The decrease in backlog is primarily due to the expiration of the Keysight agreement on May 31, 2015. The majority of the backlog is expected to be delivered to customers within the next six months.
Backlog represents the cumulative balance, at a given point in time, of recorded customer sales orders that have not yet been shipped or recognized as sales. Backlog increases when an order is received, and declines when we recognize sales. Although backlog consists of firm orders for which goods and services are yet to be provided, customers can, and sometimes do, terminate or modify these orders. Backlog, on any particular date, while indicative of short-term revenue performance, is not necessarily a reliable indicator of medium or long-term revenue performance.
International Operations. We conduct rental, leasing and sales activity in foreign countries, which in the aggregate accounted for approximately 19.3% of our revenues in 2016, 15.9% in 2015 and 15.5% in 2014. Selected financial information regarding our international operations is presented below:
Fiscal Year ended May 31, (in thousands) | 2016 | 2015 | 2014 | ||||||||
Revenues: 1 | |||||||||||
U.S. | $ | 141,535 | $ | 200,323 | $ | 203,806 | |||||
Other 2 | 33,798 | 38,006 | 37,331 | ||||||||
Total | $ | 175,333 | $ | 238,329 | $ | 241,137 | |||||
4
As of May 31, (in thousands) | 2016 | 2015 | 2014 | ||||||||
Net Long Lived Assets: 3 | |||||||||||
U.S. | $ | 168,331 | $ | 197,514 | $ | 188,343 | |||||
Other 2 | 43,583 | 47,277 | 46,667 | ||||||||
Total | $ | 211,914 | $ | 244,791 | $ | 235,010 | |||||
1 | Revenues by country are based on the shipping destination. |
2 | Other consists of countries other than the U.S. Each foreign country individually accounts for less than 10% of the total consolidated revenues and net long-lived assets. |
3 | Net long-lived assets include rental and lease equipment and other property, net of accumulated depreciation and amortization. |
For risks relating to our international operations, see “Item 1A. Risk Factors – Risks Associated with International Operations.”
Segment Information. The following table shows, for each of the last three fiscal years, revenues from rentals and leases and sales of equipment and other revenues for our T&M and DP operating segments:
Fiscal Year ended May 31, (in thousands) | T&M | DP | Total | ||||||||
2016 | |||||||||||
Rentals and leases | $ | 105,850 | $ | 17,935 | $ | 123,785 | |||||
Sales of equipment and other revenues | 49,518 | 2,030 | 51,548 | ||||||||
Segment and consolidated total | $ | 155,368 | $ | 19,965 | $ | 175,333 | |||||
2015 | |||||||||||
Rentals and leases | $ | 111,327 | $ | 17,928 | $ | 129,255 | |||||
Sales of equipment and other revenues | 107,270 | 1,804 | 109,074 | ||||||||
Segment and consolidated total | $ | 218,597 | $ | 19,732 | $ | 238,329 | |||||
2014 | |||||||||||
Rentals and leases | $ | 120,629 | $ | 16,788 | $ | 137,417 | |||||
Sales of equipment and other revenues | 101,898 | 1,822 | 103,720 | ||||||||
Segment and consolidated total | $ | 222,527 | $ | 18,610 | $ | 241,137 | |||||
Depreciation of rental and lease equipment for these operating segments was as follows for the fiscal year ended May 31:
2016 | 2015 | 2014 | |||||||||
T&M | $ | 51,669 | $ | 52,278 | $ | 52,652 | |||||
DP | 4,262 | 4,167 | 4,382 | ||||||||
Segment and consolidated total | $ | 55,931 | $ | 56,445 | $ | 57,034 | |||||
Amortization expense is not material and is included in SG&A expenses.
5
We consider the marginal contribution as our measure of segment profit or loss. The marginal contribution is calculated as operating revenue less operating costs and direct and allocated SG&A expenses. Marginal contribution for these operating segments was as follows for the fiscal year ended May 31:
2016 | 2015 | 2014 | |||||||||
T&M | $ | 38,527 | $ | 50,410 | $ | 58,924 | |||||
DP | 6,695 | 6,914 | 5,962 | ||||||||
Total marginal contribution of operating segments | 45,222 | 57,324 | 64,886 | ||||||||
Deduct: | |||||||||||
Unallocated SG&A expenses | 37,139 | 34,396 | 32,747 | ||||||||
Add: | |||||||||||
Interest income, net | (329 | ) | 332 | 387 | |||||||
Other income | 33 | 1,390 | — | ||||||||
Consolidated income before income taxes | $ | 7,787 | $ | 24,650 | $ | 32,526 | |||||
For additional financial information about our segments, see Note 13 to our consolidated financial statements included in this Annual Report on Form 10-K.
Seasonality. Regardless of the overall economic outlook domestically and globally, December, January and February typically reflect lower rental activity. In addition, because February is a short month, revenue in that month is reduced. The seasonal spending patterns of our customers are also affected by factors such as weather, holiday and vacation considerations, and fiscal budgetary cycles.
Other Information. During fiscal 2016, 2015 and 2014, Keysight equipment accounted for 56.0%, 70.7% and 65.6%, respectively, of our new equipment purchases. Anritsu equipment purchases during fiscal 2016 accounted for 12.3% of our new equipment purchases while Anritsu equipment purchases during fiscal 2015 and fiscal 2014 were below 10%. No other vendor accounted for more than 10% of such purchases.
No single customer accounted for more than 10% of our total revenues during fiscal 2016, 2015 or 2014.
We do not derive any significant portion of our revenues from direct United States government contracts.
We have no material patents, trademarks, licenses, franchises or concessions.
At May 31, 2016, we employed approximately 386 individuals. None of our employees are members of a labor union or are subject to collective bargaining agreements. We believe that our employee relations are satisfactory.
Electro Rent Corporation was incorporated in California in 1965 and became a publicly held corporation in 1980.
Additional Information. Our Internet address is www.electrorent.com. Copies of our Annual Report on Form 10-K, Quarterly Reports on Form 10-Q, Current Reports on Form 8-K and amendments to those reports filed or furnished pursuant to Section 13(a) or 15(d) of the Securities Exchange Act of 1934 are available free of charge on our website via links to the Securities and Exchange Commission’s website as soon as reasonably practicable after we electronically file those materials with the Securities and Exchange Commission. We provide paper copies of these reports to shareholders upon written request to Shareholder Relations, Electro Rent Corporation, 6060 Sepulveda Boulevard, Van Nuys, California 91411-2512.
Item 1A. Risk Factors.
Please carefully consider the following discussion of various risks and uncertainties, as well as the other information in this report and in other reports and documents that we file with the Securities and Exchange Commission, when evaluating our business and future prospects. We believe that the following risk factors are the most relevant to our business, but they are not the only risk factors that we face. Additional risks and uncertainties, not presently known to us, or that we currently see as immaterial, may also occur. Our business, financial condition and results of operations could be seriously harmed if any of these risks or uncertainties actually occur or materialize. In that event, the market price for our Common Stock could decline, and our shareholders may lose all or part of their investment.
6
MERGER AGREEMENT WITH PLATINUM EQUITY
We have entered into a merger agreement with affiliates of Platinum Equity. If the merger closes as planned, each share of our outstanding Common Stock (other than shares held by any person who property asserts dissenters’ rights under California law) will be entitled to receive a cash payment of $15.50 per share, and our existing shareholders will no longer have an equity interest in our company and will not participate in our future earnings or growth.
On June 23, 2016, we entered into an Amended and Restated Agreement and Plan of Merger (the “Restated Merger Agreement”) with Elecor Intermediate Holding II Corporation, a Delaware corporation (“Parent”), and Elecor Merger Corporation, a California corporation and a wholly owned subsidiary of Parent (“Merger Sub”), pursuant to which, subject to the satisfaction or waiver of the conditions set forth therein, Merger Sub will be merged with and into us, and we will survive the merger as a wholly-owned subsidiary of Parent (the “Merger”). Parent and Merger Sub are affiliates of Platinum Equity, a Beverly Hills-based private equity firm (“Platinum Equity”).
Our board of directors (“Board”), in accordance with and upon the unanimous recommendation of a special committee of independent directors, has approved the Merger Agreement and the transactions contemplated thereby, including the Merger. The Merger was approved by our shareholders at a special meeting held on August 5, 2016. We expect the Merger and the transactions contemplated thereby to close by the end of August 2016.
If the Merger closes, each outstanding share of our common stock (other than shares held by any person who properly asserts dissenters’ rights under California law) will be converted into the right to receive an amount in cash equal to $15.50 per share (the “Merger Consideration”). Our existing shareholders will no longer have an equity ownership in our company and will no longer participate in our long term profits or operations. After the closing of the Merger, ELRC common stock will no longer be listed on the NASDAQ Global Select Market and will be deregistered under the Securities Exchange Act of 1934, as amended and we will no longer file periodic reports with the SEC.
COMMON STOCK PRICE FLUCTUATIONS
The price of our Common Stock has fluctuated significantly in the past and may continue to do so in the future.
General Factors. We believe some of the reasons for past fluctuations in the price of our Common Stock have included:
• | announcements of developments related to our business; |
• | announcements concerning new products or enhancements in the equipment that we rent, or developments in our relationships with our customers; |
• | announcements regarding the expiration of the Keysight reseller agreement and the establishment of new reseller or sales agent arrangements; |
• | variations in our revenues, gross margins, earnings or other financial results from investors’ expectations; and |
• | fluctuations in results of our operations and general conditions in the economy, our market, and the markets served by our customers. |
In addition, prices in the stock market in general have been volatile in recent years. In many cases, the fluctuations have been unrelated to the operating performance of the affected companies. As a result, the price of our Common Stock could fluctuate in the future without regard to our operating performance.
Future Sales of our Common Stock. Sales of our Common Stock by our officers, directors and employees could adversely and unpredictably affect the price of our shares. Additionally, the price could be affected by even the potential for sales by these persons. In addition to the 24,200,660 shares outstanding as of August 8, 2016, as of such date, up to 559,032 shares of Common Stock may be issued upon conversion of our vested and unvested restricted stock units previously granted under our Equity Incentive Plan.
We cannot predict the effect that any future sales of our Common Stock, or the potential for those sales, will have on the share price for our Common Stock.
FLUCTUATIONS IN OPERATING RESULTS
Historically, our operating results have fluctuated from period to period, and we expect that fluctuations could continue in the future. The fluctuations in our past results have resulted from many factors, some of which are beyond our control. In the future, these or other factors could have a material impact on our operating results and the price of our Common Stock.
7
Timing of Equipment Purchases and Sales and Equipment Pool Management. The profitability of our business depends in part on controlling the timing, pricing and mix of purchases and sales of equipment and on managing our equipment pool. We seek to acquire new and used equipment at attractive prices, from which we feel we can make a profit as a result of a combination of renting, leasing and selling that equipment. We base expenditures for equipment purchases, sales and marketing and other items on our expectations of future customer demand. In order to maximize overall profit from the rental, leasing, and sales of equipment, we manage our equipment pool on an on-going basis by analyzing our product strategy for equipment in light of historical and projected lifecycles. In doing so, we compare our estimate of potential profit from rental with the potential profit from the product’s immediate sale and replacement with new or other equipment.
Our overall equipment management is complex and our equipment strategy can change during the equipment’s lifetime based upon numerous factors, including the U.S. and global economy, interest rates and new product launches. Our strategic equipment decisions are based on the following fundamentals:
• | our acquisition cost; |
• | our estimates of current and future market demand for rentals; |
• | our estimates of current and future supply of equipment; |
• | the book value of the equipment after depreciation and other impairment; |
• | our estimates of the effect of interest rates on rental and leasing fees as well as capital financing; and |
• | our estimates of the potential current and future sale prices of equipment. |
However, historical trends are not necessarily indicative of future trends. If our assumptions prove to be wrong, not only may our revenues fall short of our expectations, but we may not be able to adjust our equipment quickly enough to compensate for lower demand for one or more products in our equipment pool. In addition, as demand for a product falls, we may have difficulty in selling any of our excess equipment at a favorable price or at all. Both of these factors can compound the impact of any revenue shortfall and further affect our operating results and the price of our Common Stock.
Economic Conditions. Demand for our rental products depends on continued business activity. In recent years, our financial results have been impacted by competitive pressure on rental rates. Our customers historically have reduced their expenditures for T&M and DP equipment during economic downturns. Accordingly, when the domestic and/or international economy weakens, demand for our products declines. A large part of our equipment pool is rented or leased to customers in the aerospace and defense, telecommunications, electronics, industrial and semiconductor markets. Uncertainty in U.S. or global economy, or in one or more of specific markets we serve, may result in lower demand and increased pressure on prices and gross profit.
While the U.S. economy has emerged from the recession, if the economy experiences another recession, reduced demand for our rental products could increase price competition and could have a material adverse effect on our revenue and profitability.
We continue to focus on remaining profitable in the current conditions, as well as being prepared for the possibility that recessionary trends may return in future periods.
Other Factors. Our quarterly operating results are subject to fluctuation based on a wide variety of factors. Other factors that may affect our operating results from one quarter to another include:
• | changes in customer demands and/or requirements; |
• | changes in pricing or maintenance policies of equipment manufacturers; |
• | price competition from other rental, leasing and finance companies; |
• | the timing of new product announcements and launches; |
• | mix of rental versus resale revenues; |
• | changes in interest rates; |
• | changes in product delivery dates; |
• | currency fluctuations and other risks of international operations; and |
• | changes and reductions to government spending that could negatively impact our customers in the aerospace and defense industry. |
8
All or any of these factors and similar factors could result in our operating results differing substantially from our expectations, as well as the expectations of public market analysts and investors, which would likely have a material adverse impact on our stock price.
RISKS ASSOCIATED WITH TECHNOLOGY CHANGES
We serve customers that operate in markets that are characterized by technological change, and accordingly must anticipate and respond to changes in technology in order to maintain competitiveness and successful operations.
Technological Advancements. We must anticipate and keep pace with the introduction of new hardware, software and networking technologies and acquire equipment that will be marketable to our current and prospective customers. The equipment that we acquire for our equipment pool can be subject to technological change, evolving customer demands and frequent new product announcements and enhancements. If we fail to adequately anticipate or adapt to new technological developments or to recognize changing market conditions, our operating results and stock price could be materially and adversely affected.
Expenses Resulting from Technological Advancements. As a result of technology developments, we may have to make substantial and unanticipated expenditures to acquire new equipment or invest in further staff education on operating and servicing the equipment we deliver to our customers. Further, we may not adequately anticipate or respond successfully to technological changes for many reasons, including misjudging the impact of technological changes as well as financial, technological or other constraints. If we do not adequately anticipate or respond to changes in technological advancements or customer preferences, it would likely have a material adverse impact on our operating results and stock price.
Introduction of New Products and Services. The markets in which we operate are characterized by changing technology, evolving industry standards and declining prices of certain products. Our operating results will depend to a significant extent on our ability to continue to introduce new products and services and to control and/or reduce costs. Whether we succeed in our new offerings depends on several factors such as:
• | proper identification of customer needs; |
• | appropriate control of costs; |
• | timely completion and introduction of products and services as compared to our competitors; |
• | our ability to differentiate our equipment and services from our competitors; and |
• | appropriate pricing and market acceptance of our solutions. |
RISKS ASSOCIATED WITH CUSTOMER SOLVENCY
Our customers may face liquidity issues and, if we make poor credit decisions or are unable to collect on contracts with customers, it could have a material adverse effect on our operating results and stock price.
One of the reasons some of our customers find it more attractive to rent or lease electronic equipment instead of owning that equipment is because renting or leasing enables them to deploy their capital elsewhere. However, some of our customers may have liquidity issues and ultimately may not be able to fulfill the terms of their agreements with us. If we are not able to manage credit risk issues, or if a large number of customers have financial difficulties at the same time, our credit losses would increase above historical levels and may become material.
COMPETITION
If we do not compete effectively, we may lose market share and our revenues and profitability may decline.
The equipment rental, leasing and sales business is characterized by intense competition from several large competitors, some of which have access to greater financial and other resources. We face competition from both established entities and new entries in the market. Our global competitors in T&M rental area include McGrath RentCorp, Continental Resources, Inc., Test Equity LLC and Microlease plc. These entities also compete with us in leasing T&M equipment, as do banks, vendors and other financing sources. In equipment sales, we also compete with sales by our suppliers, including Keysight, Anritsu, Rohde and Schwarz and Tektronix, and their distributors. The market for the lease and rental of computers is highly fragmented, and our principal competitors include SmartSource, Rentex, Rentfusion and Vernon Computer Source.
Our competitors engage in aggressive pricing for both rentals and sales. In order to maintain or increase our market share, we may choose, or be compelled, to lower our prices, resulting in decreased revenues and profitability, which could materially and adversely affect our stock price.
9
RISKS ASSOCIATED WITH INTERNATIONAL OPERATIONS
Our international operations will continue to be a meaningful portion of our overall revenues and operations in the future. There are risks that are inherent to our international operations and, if we fail to manage them appropriately, we may not meet our revenue expectations or may incur unanticipated expenses, either of which would adversely affect our operations.
Currency Risks. We generated 19.3% of our revenues from activity in foreign countries in fiscal 2016. Our contracts to supply equipment outside of the U.S. are generally priced in local currency. However, our consolidated financial statements are prepared in U.S. dollars. Consequently, changes in exchange rates can unpredictably and adversely affect our consolidated operating results, and could result in exchange losses. Although we use foreign currency forward contracts to mitigate the risks associated with fluctuations in exchange rates, we may not be able to reduce the impact of foreign currency fluctuations flowing through our operating results. Thus, exchange rate fluctuations could have a material adverse impact on our operating results and stock price.
Other Risks Associated with International Operations. Additionally, our financial results may be adversely affected by other international risks, such as:
• | international political and economic conditions; |
• | changes in government regulation in various countries; |
• | trade barriers; |
• | difficulty in staffing our foreign sales and service centers, and in training and retaining foreign employees; |
• | issues relating to the repatriation of any profits; |
• | adverse tax consequences; and |
• | costs associated with expansion into new territories. |
We expect that our international operations and the revenues we derive from these activities will continue to be a meaningful portion of our total revenues. If we do not anticipate and respond to the risks associated with international operations, it could have a material adverse effect on our operating results and stock price.
RISKS ASSOCIATED WITH OUR MANUFACTURERS AND SUPPLIERS
Our business is dependent on our ability to purchase equipment for our equipment pool from third party manufacturers and suppliers at prices and on terms that allow us to meet our customers’ requirements. Any significant change in availability, pricing or terms for equipment from our manufacturers could have a substantial impact on our results of operations.
About 93% of our equipment portfolio at acquisition cost consists of general purpose T&M instruments purchased from leading manufacturers such as Keysight, Rohde & Schwarz, Anritsu, and Tektronix. The remainder of our equipment pool consists of personal computers, workstations and tablets from Dell, Apple, IBM, Toshiba and HP. We depend on these manufacturers and suppliers for our equipment. If, in the future, we are not able to purchase necessary equipment from one or more of these suppliers on favorable terms, we may not be able to meet our customers’ demands in a timely manner or for a price that generates a profit. Depending on the equipment required, or the customer’s specific requirements, there may not be suitable alternatives from other suppliers. Any inability to acquire equipment would adversely impact our revenues. Similarly, if we cannot increase our pricing commensurate with pricing changes from our customers, our gross profit and income from operations will be adversely impacted.
The expiration of the Keysight reseller agreement on May 31, 2015 negatively impacted our revenue and net profits. There is no assurance that we will be able to replace the Keysight reseller arrangement with other reseller arrangements or that we will retain our key sales employees.
Sales of new Keysight equipment represented approximately 6.8%, 29.5% and 26.5% of our gross revenue in fiscal 2016, 2015 and 2014, respectively. On March 3, 2015, we announced that our reseller agreement with Keysight would not be renewed after its May 31, 2015 expiration date. The expiration of the Keysight reseller agreement has negatively impacted our revenue and net profits. In the first quarter of fiscal 2016, we entered into agreements with other manufacturers of equipment, including Anritsu, Rodhe & Schwarz and ART-Fi SAS, so that we can replace some of the revenue associated with our Keysight reseller agreement. There can be no assurance that we will replace all or a significant portion of the revenue from the Keysight reseller agreement with relationships with other manufacturers. There is also no assurance that we will be able to retain our key sales personnel, the loss of which may impact our ability to support agreements with other equipment manufacturers. If we are
10
unable to effectively manage the arrangements with other equipment manufacturers or retain our key sales employees, our operating results and stock price may be further materially and adversely affected.
DEPENDENCE ON KEY PERSONNEL
If we are unable to recruit and retain qualified personnel, it could have a material adverse effect on our operating results and stock price.
Our success depends in large part on the continued services of our executive officers, our senior managers and other key personnel. T&M equipment and solutions can be highly technical and complex, and typically require customizations to meet specific customer applications and needs. The quality of our customer service and the knowledge of our personnel is a key competitive factor for our business. It is very important that we attract highly skilled personnel to accommodate growth and to replace personnel who leave. Competition for qualified personnel can be intense, especially in technology industries, and there is a limited number of people with the requisite knowledge and experience to market, sell and service our equipment. We must retain and recruit qualified personnel in order to maintain and grow our business.
CONTROL BY MANAGEMENT AND OTHERS
Senior management has significant influence over our policies and affairs and may be in a position to determine the outcome of corporate actions.
As of August 8, 2016, our executive officers and directors collectively owned approximately 20.3% of our Common Stock.
As of that date, (i) Mr. Daniel Greenberg, our director, beneficially owned approximately 19.0% of our outstanding shares of Common Stock, and (ii) one other shareholder controlled 13.8% of our outstanding shares of Common Stock. As long as these shareholders own a significant percentage of our Common Stock, they will be able to exert significant influence over our policies and affairs and may be in a position to determine the outcome of corporate actions requiring shareholder approval. These may include, for example, the election of directors, the adoption of amendments to our corporate documents and the approval of mergers and sales of our assets.
RISKS ASSOCIATED WITH POSSIBLE ACQUISITIONS AND NEW BUSINESS VENTURES
If we fail to accurately assess and successfully integrate any recent or future acquisitions or new business ventures, we may not achieve the anticipated benefits, which could result in lower revenues, unanticipated operating expenses, reduced profitability and dilution of our book value per share.
We could decide to pursue one or more opportunities by acquisition or internal development. Acquisitions and new business ventures, both domestic and foreign, involve many risks, including:
• | the difficulty of integrating acquired operations and personnel with our existing operations; |
• | the difficulty of developing and marketing new products and services; |
• | the diversion of our management’s attention as a result of evaluating, negotiating and integrating acquisitions or new business ventures; |
• | our exposure to unforeseen liabilities of acquired companies; and |
• | the loss of key employees of an acquired operation. |
In addition, an acquisition or new business venture could adversely impact cash flows and/or operating results, and dilute shareholder interests, for many reasons, including:
• | charges to our income to reflect the impairment of acquired intangible assets, including goodwill; |
• | interest costs and debt service requirements for any debt incurred in connection with an acquisition or new business venture; and |
• | any issuance of securities in connection with an acquisition or new business venture that dilutes or lessens the rights of our current shareholders. |
We have implemented various new business ventures in the past, and not all of such ventures have been successful. The risks associated with acquisitions and new business ventures could have a material adverse impact on our operating results and stock price.
11
RISKS ASSOCIATED WITH FLUCTUATING INTEREST RATES
Interest rate fluctuations could have a material adverse effect on our operating results and stock price.
Our leasing yields tend to correlate with market interest rates. When interest rates are higher, our leasing terms incorporate a higher financing charge. However, in times of relatively lower interest rates our financing charges also decrease, and some of our customers choose to purchase new equipment, rather than to lease. Lower leasing yields result in lower rental and lease revenues, which could have a material adverse impact on our operating results and stock price.
RISKS ASSOCIATED WITH CHANGES IN GOVERNMENT SPENDING
We have customers in the aerospace and defense industry that derive a significant amount of revenue from the U.S. government. If the U.S. government were to substantially curtail spending for the aerospace and defense industry, it would have a significant negative effect on our revenues and profitability.
The U.S. federal government has implemented significant changes and reductions to government defense spending. In addition, uncertainty resulting from previously announced defense spending reductions and the potential future additional reductions have impacted, and are likely to continue to impact, the manner in which our customers in the aerospace and defense industry make procurement decisions, resulting in reduced demand by such customers in our rental services and resale business. A shift in government priorities to government programs in which our customers do not participate and/or reductions in funding for or the termination of government programs in which our customers do participate, unless offset by other programs and opportunities, could have a material adverse effect on the demand of our services and products and, as a consequence, our revenues, operating results and stock price.
RISKS ASSOCIATED WITH COMPLIANCE WITH RULES AND REGULATIONS
Failure to comply with internal control attestation requirements could lead to loss of public confidence in our financial statements and negatively impact our stock price.
As a public reporting company, we are required to comply with the Sarbanes-Oxley Act of 2002, including Section 404, and the related rules and regulations of the SEC. Compliance with Section 404 and other related requirements has increased our costs and will continue to require additional management resources. We may need to continue to implement additional finance and accounting procedures and controls to satisfy new reporting requirements. While our management concluded that our internal control over financial reporting as of May 31, 2016 was effective, there is no assurance that future assessments of the adequacy of our internal controls over financial reporting will be favorable. If we are unable to obtain future unqualified reports as to the effectiveness of our internal control over financial reporting, investors could lose confidence in the reliability of our internal control over financial reporting, which could adversely affect our stock price.
ANTI-TAKEOVER PROVISIONS
The anti-takeover provisions contained in our Articles of Incorporation and Bylaws and in California law could materially and adversely impact the value of our Common Stock.
Certain provisions of our Articles of Incorporation, our Bylaws and California law could, together or separately, discourage, delay or prevent a third party from acquiring us, even if doing so might benefit our shareholders. This may adversely impact the interests of our shareholders with respect to a potential acquisition and may also affect the price investors would receive for their shares of Common Stock. Some examples of these provisions in our Articles of Incorporation and Bylaws are:
• | the right of our board of directors to issue preferred stock with rights and privileges that are senior to the Common Stock, without prior shareholder approval; and |
• | certain limitations of the rights of shareholders to call a special meeting of shareholders. |
Item 1B: Unresolved Staff Comments.
None.
Item 2. Properties.
We own a building that houses our corporate headquarters and Los Angeles sales office located at 6060 Sepulveda Boulevard, Van Nuys, California. The building contains approximately 84,500 square feet of office space. Approximately 16,000 square feet are currently leased to others and approximately 25,000 square feet are available for lease. Current tenant arrangements provide for all of the leased property to be available for our future needs.
12
We own a building at 15385 Oxnard Street, Van Nuys, California, which contains approximately 68,200 square feet. We use all of this space, except for 1,000 square feet that are currently being leased to others. This building houses our California warehouse and equipment calibration center.
We own a facility in Wood Dale, Illinois, containing approximately 30,750 square feet. This facility houses our Illinois warehouse and service center.
As of May 31, 2016, we had sales offices and/or service centers in Los Angeles, Atlanta, Chicago, Dallas, Houston, New York/Newark, San Francisco, Charlotte, Orlando, Seattle and Washington/Baltimore. We have foreign sales offices and warehouses in Toronto, Canada; Mechelen, Belgium; London, United Kingdom; and Beijing and Shanghai, China.
Our facilities aggregate approximately 280,000 square feet as of May 31, 2016. Except for the corporate headquarters, the Wood Dale, Illinois facilities and the Oxnard Street building, each of which we own, all of our facilities are rented pursuant to leases for up to seven years for aggregate annual rentals of approximately $0.9 million in fiscal 2016. Most of our leases provide us with the option of renewing our leases at the end of the initial lease term, at the then-existing fair rental value, for periods of up to five years. We do not consider any rented facility essential to our operations. We consider our facilities to be in good condition, well maintained and adequate for our needs.
Item 3. Legal Proceedings.
We are subject to legal proceedings and business disputes involving ordinary routine legal matters and claims incidental to our business. The ultimate legal and financial liability with respect to such matters generally cannot be estimated with certainty and requires the use of estimates in recording liabilities for potential litigation settlements or awards against us. Estimates for losses from litigation are made after consultation with outside counsel. If estimates of potential losses increase or the related facts and circumstances change in the future, we may be required to record either more or less litigation expense. At May 31, 2016 we are not involved in any pending or threatened legal proceedings that we believe could reasonably be expected to have a material adverse effect on our financial condition, results of operations or cash flows, except as follows:
On June 8, 2016, following the announcement of the Merger, a shareholder class action lawsuit, entitled Chaklos, et al. v. Electro Rent Corp., et al., was filed in the Superior Court of the State of California, Los Angeles County, against ELRC, our directors, Phillip A. Greenberg, Platinum Equity, Parent and Merger Sub. The lawsuit asserts that defendants variously breached, or aided and abetted others in breaching, state law fiduciary duties in connection with their consideration and approval of the merger. The lawsuit seeks rescission of the merger agreement, an injunction barring consummation of the merger, imposition of a constructive trust of “benefits improperly received by defendants” as a result of any breaches of duty and costs and disbursements of the action.
On June 20, 2016, following the announcement of the merger, a shareholder class action lawsuit, entitled Wadsworth v. Electro Rent Corp., et al., was filed in the United States District Court for the Central District of California, against ELRC, its directors, Platinum Equity, Parent and Merger Sub. The lawsuit asserts that defendants variously breached, or aided and abetted others in breaching, state law fiduciary duties in connection with their consideration and approval of the merger. The lawsuit further asserts that the defendants violated securities law in connection with an assortment of alleged material omissions from the preliminary proxy statement. The lawsuit seeks rescission of the merger agreement, an injunction barring consummation of the merger, imposition of a constructive trust of “benefits improperly received by defendants” as a result of any breaches of duty and costs and disbursements of the action.
Item 4. Mine Safety Disclosures.
Not applicable.
PART II
Item 5. Market for the Registrant’s Common Equity, Related Stockholder Matters and Issuer Purchases of Equity Securities.
Market for Common Stock.
Our Common Stock is quoted on the NASDAQ stock market under the symbol ELRC. The following table sets forth, for the periods shown, the high and low sale prices of our Common Stock as reported by NASDAQ.
13
Fiscal Year 2016 | Fiscal Year 2015 | ||||||||||||||
High | Low | High | Low | ||||||||||||
First Quarter | $ | 11.71 | $ | 9.72 | $ | 17.37 | $ | 14.85 | |||||||
Second Quarter | 11.67 | 9.78 | 15.53 | 13.27 | |||||||||||
Third Quarter | 10.80 | 7.30 | 14.97 | 12.52 | |||||||||||
Fourth Quarter | 13.13 | 8.26 | 13.11 | 9.97 | |||||||||||
Holders.
There were 315 shareholders of record of our Common Stock at August 8, 2016.
Sales of Unregistered Securities.
We did not make any unregistered sales of our securities in fiscal 2016.
Securities Authorized for Issuance Under Equity Compensation Plans.
The following table provides information as of May 31, 2016 with respect to shares of our Common Stock that may be issued under our 2005 Equity Incentive Plan, as amended and restated, all of which were approved by our shareholders:
EQUITY COMPENSATION PLAN INFORMATION
Number of shares of Common Stock to be issued upon exercise of outstanding options, warrants and rights (a) | Weighted-average exercise price of outstanding options, warrants and rights (b) | Number of shares of Common Stock remaining available for future issuance under equity compensation plans (excluding shares reflected in column (a)) (c) | ||
— | — | 238,720 | ||
Stock Repurchases.
We have from time to time repurchased shares of our Common Stock under an authorization from our Board of Directors. Shares repurchased by us are retired and returned to the status of authorized but unissued stock. We did not repurchase any shares during fiscal 2016, 2015 or 2014. We may choose to make additional open market or other purchases of our Common Stock in the future, but we have no commitment to do so.
Dividends.
Since 2007, we have been paying quarterly dividends each January, April, July and October. We paid total dividends of $0.50 and $0.80 per common share for fiscal 2016 and 2015 amounting to an aggregate of $12.3 million and $19.7 million, respectively. In fiscal 2014, we paid dividends of $0.80 per common share amounting to an aggregate amount of $19.7 million. Payment of future dividends is at the discretion of our Board of Directors and depends on sales, profitability and other performance metrics of the Company, subject to compliance with applicable law.
14
Performance Graph.
The graph below compares our total shareholder return with (1) the NASDAQ Composite Index, (2) the Russell 2000 Index, and (3) the composite prices of the companies listed by Value Line, Inc. in its Industrial Services Industry Group. Our Common Stock is listed in both the Russell 2000 Index and the Industrial Services Industry Group. The comparison is over a five year period, beginning May 31, 2011 and ending May 31, 2016. The total shareholder return assumes $100 invested at the beginning of the period in our Common Stock and in each index. It also assumes reinvestment of all dividends.
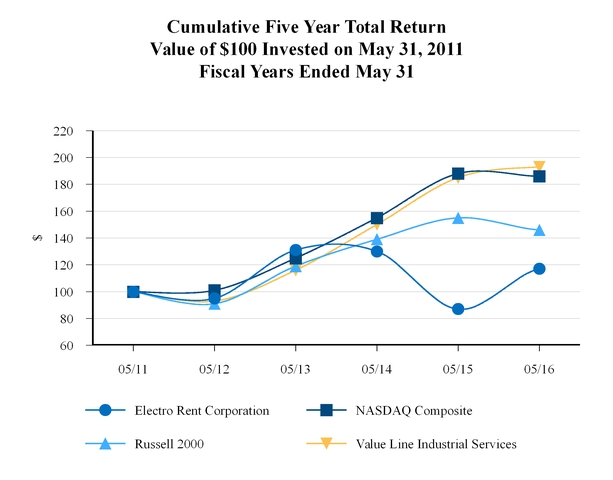
2011 | 2012 | 2013 | 2014 | 2015 | 2016 | ||||||||||||
Electro Rent Corporation | 100 | 95 | 131 | 130 | 87 | 117 | |||||||||||
NASDAQ Composite | 100 | 101 | 125 | 155 | 188 | 186 | |||||||||||
Russell 2000 | 100 | 91 | 119 | 139 | 155 | 146 | |||||||||||
Value Line Industrial Services | 100 | 93 | 116 | 150 | 185 | 193 | |||||||||||
Item 6. Selected Financial Data.
(in thousands, except per share amounts)
The following selected consolidated financial data should be read in conjunction with our audited consolidated financial statements and the accompanying notes included in “Item 8. Financial Statements and Supplementary Data” below and other financial and statistical information included in this Annual Report on Form 10-K.
15
Fiscal year ended May 31, | |||||||||||||||||||
2016 | 2015 | 2014 | 2013 | 2012 (1) | |||||||||||||||
Operations data: | |||||||||||||||||||
Revenues | $ | 175,333 | $ | 238,329 | $ | 241,137 | $ | 248,731 | $ | 248,554 | |||||||||
Costs of revenues and depreciation | 107,096 | 156,088 | 150,078 | 155,477 | 159,218 | ||||||||||||||
Selling, general and administrative expenses | 60,154 | 59,313 | 58,920 | 56,543 | 53,250 | ||||||||||||||
Operating profit | 8,083 | 22,928 | 32,139 | 36,711 | 36,086 | ||||||||||||||
Bargain purchase gain, net (2) | — | — | — | — | 3,435 | ||||||||||||||
Interest income/(expense), net | (329 | ) | 332 | 387 | 402 | 484 | |||||||||||||
Other income | 33 | 1,390 | — | — | — | ||||||||||||||
Income before income taxes | 7,787 | 24,650 | 32,526 | 37,113 | 40,005 | ||||||||||||||
Income tax provision | 3,003 | 9,218 | 12,118 | 14,359 | 14,233 | ||||||||||||||
Net income | $ | 4,784 | $ | 15,432 | $ | 20,408 | $ | 22,754 | $ | 25,772 | |||||||||
Earnings per share: | |||||||||||||||||||
Basic | $ | 0.20 | $ | 0.63 | $ | 0.84 | $ | 0.94 | $ | 1.07 | |||||||||
Diluted | $ | 0.20 | $ | 0.63 | $ | 0.84 | $ | 0.94 | $ | 1.07 | |||||||||
Shares used in per share calculation: | |||||||||||||||||||
Basic | 24,414 | 24,360 | 24,325 | 24,226 | 23,983 | ||||||||||||||
Diluted | 24,429 | 24,378 | 24,357 | 24,269 | 24,152 | ||||||||||||||
Balance sheet data (at end of year): | |||||||||||||||||||
Total assets | $ | 284,577 | $ | 300,314 | $ | 302,058 | $ | 318,926 | $ | 329,831 | |||||||||
Bank borrowings | $ | — | $ | 2,387 | $ | — | $ | 10,000 | $ | — | |||||||||
Shareholders’ equity | $ | 221,499 | $ | 227,978 | $ | 230,958 | $ | 228,549 | $ | 248,131 | |||||||||
Shareholders’ equity per common share | $ | 9.15 | $ | 9.46 | $ | 9.62 | $ | 9.52 | $ | 10.34 | |||||||||
Cash dividends declared per common share | $ | 0.50 | $ | 0.80 | $ | 0.80 | $ | 1.80 | $ | 0.80 | |||||||||
(1) | Includes the post-acquisition operating results and year-end balance sheet information for the assets acquired from Equipment Management Technology, Inc. ("EMT") on August 24, 2011. |
(2) | The estimated fair value of the net assets acquired from EMT in fiscal 2012 exceeded the acquisition cost, resulting in bargain purchase gains with respect to that transaction. |
Item 7. Management’s Discussion and Analysis of Financial Condition and Results of Operations.
The following discussion addresses our (a) financial condition as of May 31, 2016 and 2015, (b) the results of our operations for the fiscal years ended May 31, 2016, 2015 and 2014, and (c) cash flows for the fiscal years ended May 31, 2016, 2015 and 2014. This discussion should be read in conjunction with the consolidated financial statements and the notes thereto and the other financial and statistical information appearing elsewhere in this Annual Report on Form 10-K.
Statements in the following discussion and throughout this report that are not historical in nature are “forward-looking statements.” Please see “Special Note Regarding Forward Looking Statements” at the beginning of this report.
OVERVIEW
We are a large global organization devoted to the rental, lease and sale of new and used electronic test and measurement (“T&M”) equipment. We purchase T&M equipment from leading manufacturers such as Keysight Technologies, Inc. (formerly Agilent Technologies, Inc., “Keysight”), Anritsu, Inc., Rohde & Schwarz Gmbh & Co. KG and Tektronix Inc. Our customers rent, lease and buy our T&M equipment, and use that equipment primarily in the aerospace and defense, telecommunications, electronics, industrial and semiconductor markets.
In addition, although it represented only approximately 11.4% of our revenues in fiscal 2016, our Data Products ("DP") segment offers our customer an option to rent/lease personal computers from manufacturers including Dell, HP, IBM, Toshiba and Apple.
16
Our Businesses
Our businesses are as follows:
• | Rental and Lease Business. We rent and lease state-of-the-art electronic equipment. We maintain an equipment portfolio comprising T&M and DP equipment purchased from leading manufacturers, which we warehouse in various locations around the world to enable us to serve rental and lease customers. |
• | Used Equipment Sales. We sell used T&M and DP equipment that we previously held for rent and lease. Used equipment is sold at substantial discounts compared to new equipment, and provides an economic advantage for customers seeking ownership of used equipment. All of our used equipment has been maintained and serviced by our professional maintenance team, and our customers have confidence in the quality of the used equipment purchased from us. |
• | New Equipment Sales. We sell new T&M equipment. We were, through May 31, 2015, an authorized reseller of certain new Keysight (formerly Agilent) T&M products and services to small and medium size customers in the United States and Canada. Substantially all of our new equipment sales were through our Keysight reseller agreement. |
Our reseller agreement with Keysight expired on May 31, 2015. The expiration of the Keysight reseller agreement materially affected our revenues and net profits and is expected to do so in the future. Please see the risk factor in PART I-Section 1A, above, for further discussion about the risks related to the expiration of the Keysight reseller agreement. In fiscal 2016, we entered into agreements with other manufacturers of equipment, including Anritsu, Rohde & Schwarz and ART-Fi SAS.
Our Sales Strategy
We have a focused sales strategy, using a direct sales force to meet our customers’ needs in our T&M and DP equipment rental, lease and sales business. We have an experienced, highly technical sales force that specializes in all the products and services offered by our company. Our sales force identifies potential customers through coordinated efforts with our marketing organization, which is staffed by professionals with many years of industry-related experience. As our customers have a wide range of requirements for equipment, our sales force is able to leverage our extensive knowledge of the T&M and DP equipment to determine the right product to rent, lease or sell to the customer to meet the customer’s specific needs.
Our sales force also specializes in configuring new equipment to sell to our customers that is tailored to the customer’s need. These configurations typically start with a base model, which is frequently upgraded through an extensive list of options in order to perform the customer’s specific test or measurement. Once the configuration is determined, it serves as the basis for our orders to the manufacturer, who builds the product accordingly. We order equipment from the manufacturer once the customer had placed an order with us. Equipment is typically shipped directly to the customer by the manufacturer at our request. Occasionally, equipment is shipped to our warehouse prior to delivery to the customer. Inventory held for sale is immaterial and is therefore included in other assets in our consolidated balance sheets. Each order and sales invoice is subject to our standard sales terms and conditions, which include provisions covering equipment delivery delays and warranty services.
Our Equipment Management Strategy
To maximize our overall profitability from the rental, leasing, and sales of equipment, we manage our equipment pool on an on-going basis by controlling the timing, pricing and mix of our purchases and sales of equipment. We acquire new and used equipment for our rental pool to meet current technological standards and current and anticipated customer demand, and we sell our used equipment where we believe that is the most lucrative option. We employ a complex equipment management strategy utilizing our proprietary PERFECT software to adjust our equipment pool and pricing on a dynamic basis in order to maximize equipment availability, utilization and profitability. We manage each specific equipment class based on a separate assessment of that equipment’s historical and projected life cycle and numerous other factors, including the U.S. and global economy, interest rates and new product launches. If we do not accurately predict market trends, or if demand for the equipment we supply declines, we can be left with equipment that we are unable to rent or sell for a profit. We assess the carrying value of the equipment pool on an annual basis or more frequently when factors indicating potential impairment are present.
Foreign Operations and Hedging
Due to our foreign operations, we have revenue, expenses, assets and liabilities in foreign currencies, primarily the euro, Canadian dollar and Chinese yuan. We only enter into forward contracts to hedge against unfavorable currency fluctuations in our monetary assets and liabilities in our European and Canadian operations. Fluctuations in the Chinese yuan have not been significant. As a result of these forward contracts, we were able to reduce the impact of foreign currency fluctuations flowing through our operating results during fiscal 2016, 2015 and 2014. Please see "Item 7A-Quantitative and Qualitative Disclosures
17
about Market Risk-Changes in Foreign Currencies" for additional information about our exposure to foreign currency exchange risk.
Profitability and Key Business Trends
Following is a summary of certain financial metrics comparing fiscal 2016 to 2015 that our management deems important indicators of the performance of the Company:
• | our rental and lease revenues decreased by 4.2% to $123.8 million from $129.3 million primarily due to decreases in rental/lease rates as a result of a negative effect of a decline in foreign exchange rates and competition and, to a lesser degree, lower demand in certain industries we serve; |
• | our sales of equipment and other revenues decreased by 52.7% to $51.5 million from $109.1 million primarily due to a decrease in new equipment sales as a result of the expiration of the Keysight reseller agreement on May 31, 2015; |
• | our operating profit decreased 64.7% to $8.1 million from $22.9 million primarily due to the decrease in sales of new equipment revenues without a commensurate decrease in SG&A expenses; |
• | our net income decreased by 69% to $4.8 million from $15.4 million; |
• | our net income per diluted common share (EPS) decreased 68.3% to $0.20 from $0.63; |
• | our net income as a percentage of average assets declined to 1.6% from 5.1%; and |
• | our net income as a percentage of average equity declined to 2.1% from 6.7%. |
Following is a summary of certain financial metrics comparing fiscal 2015 to 2014 that our management deems important indicators of the performance of the Company:
• | our rental and lease revenues decreased by 5.9% to $129.3 million from $137.4 million primarily due to decreases in average T&M equipment on rent and lease and decreases in rates due to competition, changes in product mix and the negative effect of fluctuations in foreign exchange rates; |
• | our sales of equipment and other revenues increased by 5.2% to $109.1 million from $103.7 million primarily due to an increase in new equipment sales as a result of increased demand; |
• | our operating profit decreased 28.7% to $22.9 million from $32.1 million primarily due to the decrease in rental and lease revenues and changes in product mix; |
• | our net income decreased by 24.4% to $15.4 million from $20.4 million; |
• | our net income per diluted common share (EPS) decreased 25.0% to $0.63 from $0.84; |
• | our net income as a percentage of average assets declined to 5.1% from 6.5%; and |
• | our net income as a percentage of average equity declined to 6.7% from 8.8%. |
As of May 31, 2016, we had a sales order backlog for new T&M equipment of $1.3 million, compared to $12.4 million as of May 31, 2015 and $10.7 million as of May 31, 2014. The decrease in backlog is primarily due to the expiration of the Keysight agreement on May 31, 2015.
RESULTS OF OPERATIONS
Fiscal 2016 Compared with Fiscal 2015
Revenues
Total revenues for fiscal 2016 and 2015 were $175.3 million and $238.3 million, respectively. The 26.4% decrease in total revenues was due to a 4.2% decrease in rental and lease revenues and a 52.7% decrease in sales of equipment and other revenues.
18
Rental and Lease Revenues
Rental and lease revenues for fiscal 2016 were $123.8 million, compared to $129.3 million for fiscal 2015 as follows:
Fiscal Year | |||||||
2016 | 2015 | ||||||
T&M rental and lease revenue | $ | 105,850 | $ | 111,327 | |||
DP rental and lease revenue | 17,935 | 17,928 | |||||
$ | 123,785 | $ | 129,255 | ||||
Our T&M rental and lease revenues decreased by $5.5 million due to a decrease in rental and lease rates and the effect of decreases in foreign exchange rates. The decrease in rental and lease rates was primarily driven by competition and a change in product mix and included the effect of a decrease in foreign exchange rates of $2.1 million affecting our European and Canadian operations.
DP rental and lease revenues remained comparable to fiscal 2015.
Sales of Equipment and Other Revenues
Sales of equipment and other revenues decreased to $51.5 million in fiscal 2016 from $109.1 million in fiscal 2015 in as follows:
Fiscal Year | |||||||
2016 | 2015 | ||||||
Sales of new equipment | $ | 17,385 | $ | 72,846 | |||
Sales of used equipment and other revenues | 34,163 | 36,228 | |||||
$ | 51,548 | $ | 109,074 | ||||
The decrease in sales and other revenues in fiscal 2016 was primarily the result of a decrease in sales of new equipment. Sales of new equipment decreased by $55.5 million, or 76.1%, as a result of the expiration of the Keysight reseller agreement. Sales of used equipment and other revenue decreased by $2.1 million, as compared to prior period, which was impacted by a negative effect a $1.3 million non-recurring, out-of-the-period adjustment to other revenue in fiscal 2015. The expiration of the Keysight reseller agreement is expected to continue to materially affect our sales of new equipment.
Operating Expenses
Depreciation expense in fiscal 2016 decreased to $55.9 million from $56.4 million in fiscal 2015. However, the depreciation ratio, as a percentage of rental and lease revenues, increased to 45.2% in fiscal 2016 from 43.7% in fiscal 2015 as rental and lease revenues decreased.
Costs of rentals and leases, excluding depreciation, which primarily include labor related costs of our operations personnel, supplies, repairs, equipment subrentals, insurance and warehousing costs, decreased to $17.5 million in fiscal 2016 from $18.1 million in fiscal 2015. This expense generally remains consistent as our existing infrastructure is capable of handling moderate changes in rental and lease activity.
Costs of sales of equipment and other revenues, which primarily include the cost of equipment sales, decreased to $33.7 million in fiscal 2016 from $81.6 million in fiscal 2015, which is in line with the decrease in sales revenues. Costs of sales of equipment and other revenues, as a percentage of sales of equipment and other revenues, decreased to 65.4% in fiscal 2016 from 74.8% in fiscal 2015. This decrease was primarily due to a shift in sales mix favoring used T&M equipment sales, which generally result in higher margins than new equipment sales. Our sales margin percentage is expected to fluctuate depending on the mix of used and new equipment sales and is impacted by competition.
SG&A expenses increased to $60.2 million in fiscal 2016 compared to $59.3 million in fiscal 2015 primarily due to merger-related expenses and contractual obligations related to the retirement of Mr. Greenberg, our Chief Executive Officer, effective July 2016. As a percentage of total revenues, SG&A expenses increased to 34.3% in fiscal 2016 from 24.9% in fiscal 2015, due to a decrease in our revenues without a commensurate decrease in SG&A expenses.
Operating Profit
Our operating profit decreased 64.7%, or $14.8 million, from $22.9 million for fiscal 2015 to $8.1 million for fiscal 2016.
19
As compared to fiscal 2015, our rental and lease business contributed $4.4 million less to operating profit, resulting from a) a $5.5 million, or 4.2%, decrease in rental and lease revenues, b) a decrease in our costs of rentals and leases, excluding depreciation of $0.6 million and c) a $0.5 million decrease in depreciation expense.
As compared to fiscal 2015, operating profit from sales of equipment and other revenues decreased by $9.6 million as our sales of equipment and other revenues decreased by $57.5 million, or 52.7%, while the related costs decreased by $47.9 million, or 58.7%.
Our SG&A expenses increased $0.8 million, or 1.4%, to $60.2 million the fiscal 2016 from $59.3 million for fiscal 2015.
Average Acquisition Cost of Equipment
The following table sets forth the average acquisition cost of our equipment on rent and lease:
Fiscal Year | ||||||||||
Average acquisition cost of equipment on rent and lease (in millions) | 2016 | 2015 | Change | |||||||
T&M | $ | 257.7 | $ | 257.6 | — | % | ||||
DP | $ | 12.7 | $ | 13.0 | (2.3 | )% | ||||
Average T&M acquisition cost of equipment on rent and lease for fiscal 2016 remained comparable to fiscal 2015. Average DP acquisition cost of equipment on rent and lease decreased by 2.3% due to a slowdown in demand for DP products.
Average Rental and Lease Rates
Average T&M rental and lease rates decreased by 4.8% while the average DP rental and lease rates increased by 2.0% in fiscal 2016 as compared to the prior fiscal year. The decrease in T&M rates was due to the negative effect of exchange rates on our European and Canadian operations, a shift to markets where we generally experience lower rates and, to a lesser degree, competition in the marketplace. The increase in DP rates is the result of a change in product mix in fiscal 2016 as compared to fiscal 2015.
Average Utilization
Average utilization for our T&M equipment pool, calculated based on average acquisition cost of equipment on rent and lease compared to the average total equipment pool, decreased to 63.8% in fiscal 2016 from 64.3% in fiscal 2015. The average utilization of our DP equipment pool, based on the same method of calculation, increased to 40.2% in fiscal 2016 from 38.4% in fiscal 2015. Our utilization rate is impacted by rental and lease demand, new equipment purchases in support of existing and potential business, and sales of used equipment.
Other Income
In fiscal 2015, we recognized other income from a $1.4 million settlement received as one of the plaintiffs in a class action lawsuit involving the purchase of certain computer products.
Income Tax Provision
Our effective tax rate increased to 38.6% in fiscal 2016 from 37.4% in fiscal 2015 primarily due to higher losses in our China operations for which we receive no tax benefit and lower consolidated pretax income.
Fiscal 2015 Compared with Fiscal 2014
Revenues
Total revenues for fiscal 2015 and 2014 were $238.3 million and $241.1 million, respectively. The 1.2% decrease in total revenues was due to a 5.9% decrease in rental and lease revenues partially offset by a 5.2% increase in sales of equipment and other revenues.
20
Rental and Lease Revenues
Rental and lease revenues for fiscal 2015 were $129.3 million, compared to $137.4 million for fiscal 2014 as follows:
Fiscal Year | |||||||
2015 | 2014 | ||||||
T&M rental and lease revenue | $ | 111,327 | $ | 120,629 | |||
DP rental and lease revenue | 17,928 | 16,788 | |||||
$ | 129,255 | $ | 137,417 | ||||
Our T&M rental and lease revenues decreased by $9.3 million due to a decrease in demand of $3.4 million and a decrease in rates of $5.9 million primarily driven by competition, changes in product mix and currency fluctuations. We experienced reduced demand in several markets we serve, including telecommunications, semiconductor, and aerospace and defense, the latter having been impacted by sequestration and lower budgets, while demand increased in Europe and our China and industrial markets remained stable. The decrease in rates included the impact of a decrease in foreign exchange rates of $1.8 million affecting our European and Canadian revenues.
The decrease in T&M rental and lease revenues was partially offset by a $1.1 million increase in DP rental and lease revenues primarily due to an increase in demand while rates remained consistent to fiscal 2014.
Sales of Equipment and Other Revenues
Sales of equipment and other revenues increased from $103.7 million in fiscal 2014 to $109.1 million in fiscal 2015 as follows:
Fiscal Year | |||||||
2015 | 2014 | ||||||
Sales of new equipment | $ | 72,846 | $ | 65,813 | |||
Sales of used equipment and other revenues | 36,228 | 37,907 | |||||
$ | 109,074 | $ | 103,720 | ||||
The increase in sales of new equipment in fiscal 2015 was primarily a result of an increase in demand. The decrease in sales of used equipment and other revenues was primarily a result of a $1.3 million non-recurring, out-of-period adjustment which reduced other revenues.
On March 3, 2015, we announced that our reseller agreement with Keysight would not be renewed after its May 31, 2015 expiration date.
Operating Expenses
Depreciation expense in fiscal 2015 remained relatively consistent to fiscal 2014 at $56.4 million and $57.0 million, respectively. However, the depreciation ratio, as a percentage of rental and lease revenues, increased to 43.7% in fiscal 2015 from 41.5% in fiscal 2014 as T&M rental and lease revenues decreased.
Costs of rentals and leases, excluding depreciation, which primarily include labor related costs of our operations personnel, supplies, repairs, equipment subrentals, insurance and warehousing costs, remained relatively stable at $18.1 million in fiscal 2015 and $18.3 million in fiscal 2014. Generally, this expense remains consistent as our existing infrastructure is capable of handling moderate changes in rental and lease activity.
Costs of sales of equipment and other revenues, which primarily include the cost of equipment sales, increased to $81.6 million
in fiscal 2015 from $74.8 million in fiscal 2014, which is in line with the increase in sales revenues. Costs of sales of
equipment and other revenues, as a percentage of sales of equipment and other revenues, increased to 74.8% in fiscal 2015 from 72.1% in fiscal 2014. This increase was primarily due to a shift in sales mix favoring new T&M equipment sales, which generally result in lower margins than used equipment sales, and a decrease in other revenues as a result of the $1.3 million out-of-period adjustment. Our sales margin percentage is expected to fluctuate depending on the mix of used and new equipment sales and is impacted by competition.
SG&A expenses remained relatively consistent at $59.3 million and $58.9 million in fiscal 2015 and 2014, respectively. As a percentage of total revenues, SG&A expenses increased to 24.9% in fiscal 2015 from 24.4% in fiscal 2014, due to a decrease in our revenues without a commensurate decrease in SG&A expenses.
21
Operating Profit
Our operating profit decreased 28.7%, or $9.2 million, from $32.1 million for fiscal 2014 to $22.9 million for fiscal 2015.
As compared to fiscal 2014, our rental and lease business contributed $7.4 million less to operating profit, resulting from a) an $8.2 million, or 5.9%, decrease in rental and lease revenues, b) a decrease in our costs of rentals and leases, excluding depreciation of $0.2 million and c) a $0.6 million decrease in depreciation expense.
As compared to the prior fiscal year, operating profit from sales of equipment and other revenues decreased by $1.4 million as our sales of equipment and other revenues increased by $5.4 million, or 5.2%, while the related costs increased by $6.8 million, or 9.1%. The greater increase in costs as compared to the increase in revenues is primarily due to the $1.3 million out-of-period adjustment which reduced other revenue without a corresponding reduction of costs. Changes in product mix also had a negative impact on the operating profit as new equipment sales, which generally result in lower margins, increased while our higher margin used equipment sales remained stable.
Our SG&A expenses increased $0.4 million, or 0.7%, from $58.9 million for fiscal 2014 to $59.3 million the fiscal 2015.
Average Acquisition Cost of Equipment
The following table sets forth the average acquisition cost of our equipment on rent and lease:
Fiscal Year | ||||||||||
Average acquisition cost of equipment on rent and lease (in millions) | 2015 | 2014 | Change | |||||||
T&M | $ | 257.6 | $ | 264.1 | (2.5 | )% | ||||
DP | $ | 13.0 | $ | 11.7 | 11.1 | % | ||||
Average T&M acquisition cost of equipment on rent and lease for fiscal 2015 decreased as compared to fiscal 2014 due to a decline in demand in our T&M North American operations, partially offset by an increase in demand in our European operations. Average DP acquisition cost of equipment on rent and lease increased due to increased demand for DP products.
Average Rental and Lease Rates
Average T&M rental and lease rates decreased by 4.9% while the average DP rental and lease rates decreased by 1.6% in fiscal 2015 as compared to the prior fiscal year. The decrease in T&M rates was due to competition in the marketplace, the negative effect of exchange rates on our European and Canadian operations and changes in product mix. The decrease in DP rates is the result of increased price competition in the marketplace.
Average Utilization
Average utilization for our T&M equipment pool, calculated based on average acquisition cost of equipment on rent and lease compared to the average total equipment pool, decreased from 64.9% for fiscal 2014 to 64.3% for fiscal 2015. The average utilization of our DP equipment pool, based on the same method of calculation, increased from 35.7% to 38.4% for fiscal 2014 and 2015, respectively. Our utilization rate is impacted by rental and lease demand, new equipment purchases in support of existing and potential business, and sales of used equipment.
Other Income
In fiscal 2015, we recognized other income from a $1.4 million settlement received as one of the plaintiffs in a class action lawsuit involving the purchase of certain computer products.
Income Tax Provision
Our effective tax rate remained consistent to the prior fiscal year at 37.4% in fiscal 2015 and 37.3% in fiscal 2014.
Liquidity and Capital Resources
We have three principal sources of liquidity: cash flows provided by our operating activities, proceeds from the sale of equipment, and external funds that historically have been provided by bank borrowings. We believe that cash, cash flows from operating activities, proceeds from the sale of equipment and our borrowing capacity will be sufficient to fund our operations for at least the next twelve months.
Cash. The balance of our cash was $30.1 million at May 31, 2016, an increase of $26.0 million from May 31, 2015, primarily due to a decrease in payments for purchases of rental and lease equipment of $26.9 million and a decrease in dividend
22
payments by $7.3 million partially offset by a decrease in net income of $10.6 million. Outside of our normal operations and equipment purchases, we use our cash to pay dividends to shareholders.
We consider the undistributed earnings of our foreign subsidiaries as of May 31, 2016, to be indefinitely reinvested. As of May 31, 2016, the amount of cash associated with indefinitely reinvested foreign earnings was approximately $5,702. We have not, nor do we anticipate the need to, repatriate funds to the United States to satisfy domestic liquidity needs arising in the ordinary course of business, including liquidity needs associated with our domestic debt service requirements.
Cash Flows. During fiscal 2016, 2015 and 2014 net cash provided by operating activities was $52.4 million, $52.6 million and $49.2 million, respectively. Operating cash flows for fiscal 2016 remained comparable to fiscal 2015 primarily due to a decline in net income that was offset by changes in working capital, primarily a reduction in accounts receivable, as a result of a decrease in revenue. Operating cash flows for fiscal 2015 increased as compared to fiscal 2014 primarily due to a decrease in income taxes paid of $8.1 million in fiscal 2015 as compared to $23.8 million in fiscal 2014 partially offset by a decline in net income. The decrease in income taxes paid in fiscal 2015 as compared to fiscal 2014 reflects a combination of factors, specifically entering fiscal 2015 with an overpayment, Congress' extension of bonus depreciation and our lower earnings in fiscal 2015.
During fiscal 2016, 2015 and 2014, net cash used in investing activities was $11.4 million, $37.7 million and $23.8 million, respectively. The decrease in net cash used in investing activities in fiscal 2016 as compared to fiscal 2015 was primarily due to a decrease in payments for purchases of rental and lease equipment to $44.1 million from $71.0 million in fiscal 2016 and 2015, respectively. The increase in net cash used in investing activities in fiscal 2015 as compared to fiscal 2014 was primarily due to an increase in payments for purchases of rental and lease equipment to $71.0 million from $58.7 million in fiscal 2015 and 2014, respectively. Proceeds from sale of rental and lease equipment were $33.1 million in fiscal 2016 compared to $34.3 million in fiscal 2015 and $35.2 million in fiscal 2014.
During fiscal 2016, 2015 and 2014, net cash flows used in financing activities were $14.9 million, $17.4 million and $29.5 million, respectively. Net cash used in financing activities decreased during fiscal 2016 primarily due to decrease in payments of dividends to $12.3 million during fiscal 2016 from $19.7 million during fiscal 2015. Net cash used in financing activities during fiscal 2015 decreased as compared to fiscal 2014 primarily due to changes in line of credit activity.
As the following table illustrates, aggregate cash flows from operating activities and proceeds from the sale of used equipment have provided 148% of the funds required for equipment purchases for the three years ended May 31, 2016.
(in thousands) | Fiscal Three Years Ended May 31, 2016 | 2016 | 2015 | 2014 | |||||||||||
Cash flows from operating activities1 | $ | 154,160 | $ | 52,355 | $ | 52,619 | $ | 49,186 | |||||||
Proceeds from sale of used equipment | 102,551 | 33,066 | 34,261 | 35,224 | |||||||||||
Total cash flows | 256,711 | 85,421 | 86,880 | 84,410 | |||||||||||
Payments for equipment purchases | (173,703 | ) | (44,071 | ) | (70,954 | ) | (58,678 | ) | |||||||
Total cash flows as percentage of payments for equipment purchases | 148 | % | 194 | % | 122 | % | 144 | % | |||||||
1 For the components of cash flows from operating activities see the consolidated statements of cash flows.
Sales of new T&M equipment represented approximately 33.7%, 66.8% and 63.5% of our sales of equipment and other revenues for fiscal 2016, 2015 and 2014, respectively. Before May 31, 2015, nearly all of our sales of new T&M equipment were in connection with our reseller agreement with Keysight. Our reseller agreement with Keysight that expired on May 31, 2015. We entered into reseller agreements and sales agent agreements with other T&M equipment manufacturers, but cannot provide any assurances that our new agreements will replace all or a substantial portion of the new equipment sales revenue that we generated under the Keysight Agreement. The expiration of the Keysight reseller agreement has negatively impacted our revenue and net profits.
Credit Facilities. We have a $25.0 million revolving bank line of credit, subject to certain restrictions, to meet equipment acquisition needs as well as working capital and general corporate requirements. We borrowed $11.2 million and repaid $13.6 million on our line of credit during fiscal 2016. As of May 31, 2016, we had no borrowings outstanding under the revolving bank line of credit. As of May 31, 2015, we had $2.4 million borrowings outstanding. At May 31, 2016, 2015 and 2014, there were no other bank borrowings outstanding or off balance sheet financing arrangements. We are in compliance with all loan covenants.
23
Capital Expenditures. Our primary capital requirements have been purchases of rental and lease equipment. We generally purchase equipment throughout the year to replace equipment that has been sold and to maintain adequate levels of equipment to meet existing and expected customer demands. To meet T&M rental demand, support areas of potential growth for both T&M and DP equipment and to keep our equipment pool technologically up-to-date, we made payments for purchases of $44.1 million of rental and lease equipment during fiscal 2016, $71.0 million in fiscal 2015 and $58.7 million in fiscal 2014. The decrease in equipment purchases of 37.9% from fiscal 2015 to fiscal 2016 was due to our efforts to optimize our equipment pool as we deemed our equipment levels sufficient to satisfy the current demand. The increase in equipment purchases of 20.9% from fiscal 2014 to fiscal 2015 was due to our efforts to meet expanding customer requirements.
Dividends. For fiscal 2016 and 2015, we paid dividends of $0.50 and $0.80 per common share amounting to an aggregate of $12.3 million and $19.7 million, respectively. In fiscal 2014, we paid dividends of $0.80 per common share amounting to an aggregate amount of $19.7 million. Payment of future dividends is at the discretion of our Board of Directors and depends on sales, profitability and other performance metrics of the company, subject to compliance with applicable laws.
Inflation. Inflation generally has favorably influenced our results of operations by enhancing the sale prices of our used equipment. However, lower inflation rates and the continued availability of newer, less expensive equipment with similar or better specifications over a period of several years could result in lower relative sale prices for used electronic equipment, which could reduce margins and earnings. Prices of new and used electronic test equipment have not consistently followed the overall inflation rate, while prices of new and used personal computers have consistently declined. Because we are unable to predict the advances in technology and the rate of inflation for the next several years, it is not possible to estimate the impact of these factors on our margins and earnings.
CONTRACTUAL OBLIGATIONS
At May 31, 2016, our material contractual obligations consisted of operating leases for facilities and severance related to the retirement of Mr. Greenberg, our Chief Executive Officer. We lease certain facilities under various operating leases. Most of the lease agreements provide us with the option of renewing the lease at the end of the initial lease term, at the fair rental value, for periods of up to five years. In most cases, we expect that facility leases will be renewed or replaced by other leases in the normal course of business. Mr. Greenberg retired from this position as our Chief Executive Officer effective July 11, 2016.
We did not have an outstanding balances under our Credit agreement at May 31, 2016.
The table below presents the expected amount of payments due under our contractual obligations, as of May 31, 2016, but does not reflect changes that could arise after that time:
Payments due by period | |||||||||||||||||||
Contractual Obligations (in thousands) | Total | 1 year | 2-3 years | 3-5 years | More than 5 years | ||||||||||||||
Facility lease payments, not including property taxes and insurance | $ | 1,524 | $ | 706 | $ | 707 | $ | 111 | $ | — | |||||||||
Severance payments | 2,476 | 2,454 | 22 | — | — | ||||||||||||||
Total | $ | 4,000 | $ | 3,160 | $ | 729 | $ | 111 | $ | — | |||||||||
CRITICAL ACCOUNTING POLICIES AND ESTIMATES
The preparation of consolidated financial statements in conformity with accounting principles generally accepted in the United States of America (“generally accepted accounting principles”) requires us to make estimates and assumptions that affect the reported amounts of assets and liabilities and the disclosure of contingent assets and liabilities at the date of the financial statements, as well as the reported amounts of revenues and expenses during the reporting period. On a regular basis, we review these estimates, including those related to asset lives and depreciation methods, impairment of long-lived assets (including rental and lease equipment and definite lived intangibles), impairment of goodwill and income taxes. These estimates are based on our historical experience and on various other assumptions we believe to be reasonable under the circumstances. Actual results may differ from these estimates under different assumptions or conditions.
We believe the following accounting policies involve the more significant judgments and estimates used in the preparation of our financial statements:
Asset Lives and Depreciation Methods: Our primary business involves the purchase and subsequent rental and lease of long-lived electronic equipment. We have chosen asset lives that we believe correspond to the economic lives of the related assets. We have chosen depreciation methods that we believe generally match our benefit from the assets with the associated costs.
24
These judgments have been made based on our expertise in each equipment type that we carry. If the asset life and depreciation method chosen do not reduce the book value of the asset to at least our potential future cash flows from the asset, we would be required to record an impairment loss. Depreciation methods and useful lives are periodically reviewed and revised as deemed appropriate.
Impairment of Long-Lived Assets: The carrying value of equipment held for rental and lease is assessed when circumstances indicate that the carrying amount of equipment may not be recoverable. Recoverability of equipment to be rented and leased is measured by a comparison of the carrying amount to the undiscounted future cash flows expected to be generated by the asset. If the current carrying value exceeds the estimated undiscounted cash flows, an impairment loss is recorded equal to the difference between the asset’s current carrying value and its fair value as described in FASB ASC Topics No. 360, Impairment and Disposal of Long-Lived Assets and No. 820, Fair Value Measurements and Disclosures. Based upon such periodic assessments, costs of rentals and leases included impairment charges of $443 related to our T&M rental and lease equipment during the year ended May 31, 2016. No impairments occurred during fiscal 2015 and 2014.
Goodwill Impairment: Goodwill represents the excess of purchase price over the fair value of net assets acquired. Pursuant to FASB ASC Topic No. 350, Intangibles – Goodwill and Other, goodwill is not amortized but tested annually for impairment, or on an interim basis if an event occurs or circumstances change that would reduce the fair value of a reporting unit below its carrying value. In connection with the annual impairment test for goodwill, we have elected the option to perform a qualitative assessment to determine whether it is more likely than not that the fair value of the reporting unit is less than its carrying amount. If we determine that it was more likely than not that the fair value of the reporting unit is less than its carrying amount, then we perform the impairment test. The impairment test involves a two-step process. The first step involves comparing the fair values of the applicable reporting units with their aggregate carrying values, including goodwill. We generally determine the fair value of our reporting units using the market approach methodology of valuation. If the carrying value of a reporting unit exceeds the reporting unit’s fair value, we perform the second step of the test to determine the amount of impairment loss. The second step involves measuring the impairment by comparing the implied fair values of the affected reporting unit’s goodwill with the carrying amount of that goodwill. We completed the required impairment review at the end of fiscal 2016, 2015 and 2014 and concluded that there were no impairments.
Revenue Recognition—Principal Agent Considerations: In accordance with accounting guidance, through May 31, 2015, we were acting as the principal with respect to sales of new equipment through our resale agreement with Keysight, based on several factors, including: (1) We acted as the primary obligor by working directly with our customers to define their needs, providing them with options to satisfy such needs, contracting directly with the customer, and, to the extent required, providing customers with instruction on the use of the product and additional technical support once the product was received by the customer. The product manufacturer was not a party to our customer sales agreements, nor was it referenced in the agreements, and therefore had no obligation to our customers with the exception of the manufacturer’s standard warranty on the product. (2) We bore back-end risk of inventory loss with respect to any product return from the customer as the original manufacturer was not required to accept returns of equipment from us. We also bore front-end risk of inventory loss in those cases where we acquired products for resale into our inventory prior to shipment to customers. (3) We had full discretion in setting pricing terms with our customers and to negotiate all such terms ourselves. (4) We assumed all credit risk.
In situations where we act as principal, the gross sales of new equipment are recorded in sales of equipment and other revenues, while the related equipment costs, including the purchase price from the original equipment manufacturer, are recorded in costs of sales of equipment and other revenues in our consolidated statements of operations.
In situations where we act as an agent for the original equipment manufacturer, we recognize revenue only on the commissions that we receive, which are recorded in other revenue within the sales of equipment and other revenues in our consolidated statement of operations.
Income Taxes: We are required to estimate income taxes in each of the jurisdictions in which we operate. Significant judgment is required in determining the provision for income taxes and deferred tax assets and liabilities. This process involves us estimating actual current tax exposure and assessing temporary differences resulting from differing treatment of items, such as depreciation and amortization, for tax and accounting purposes. These differences result in deferred tax assets and liabilities, which are included within our consolidated balance sheet. We then assess the likelihood that our deferred tax assets will be recovered. To the extent management believes that recovery is not likely, we establish a valuation allowance. We determined that a valuation allowance was required in fiscal 2016, 2015 and 2014 of $0.7 million, $0.4 million and $0.3 million, respectively, for our deferred tax asset related to certain foreign net operating loss carry forwards and other related timing differences.
The guidance for uncertain income tax positions provides that the tax effects of a position be recognized only if it is “more-likely-than-not” to be sustained based solely on its technical merits as of the reporting date. The more-likely-than-not threshold represents a positive assertion by us that our company is entitled to the economic benefits of a tax position. If a tax position is
25
not considered more-likely-than-not to be sustained based solely on its technical merits, no benefits of the position are to be recognized. There were no uncertain tax positions in fiscal 2016, 2015 and 2014.
OFF BALANCE SHEET TRANSACTIONS
As of May 31, 2016 we did not have any “off-balance-sheet arrangements,” as defined in Item 303(a)(4)(ii) of Regulation S-K.
Item 7A. Quantitative and Qualitative Disclosures About Market Risk.
We could be exposed to market risks related to changes in interest rates and foreign currency exchange rates.
Interest Rate and Market Risk.
We are exposed to fluctuations in interest rates on our commercial credit agreement with J.P. Morgan Chase Bank, National Association ("JPM") which matures on November 19, 2016. Borrowings under the Credit Agreement bear interest at a rate equal to, at our election, the applicable rate for a “Eurodollar Loan” or a “CB Floating Rate Loan.” Eurodollar Loan advances accrue interest at a per annum interest rate equal to (i) the quotient (rounded upwards to the next 1/16th of 1%) of (a) the applicable LIBO Rate, divided by (b) one minus the maximum aggregate reserve requirement (expressed as a decimal) imposed under Federal Reserve Board Regulation D (the “Adjusted LIBO Rate”), plus (ii) 0.75%. CB Floating Rate Loan advances accrue interest at a per annum interest rate equal to (i) the higher of (a) JPM’s Prime Rate or (b) the Adjusted LIBO Rate for a one month interest period plus 2.5%, minus (ii) 2.0%. In addition, we pay a commitment fee of 0.10% of the unused amount if the average borrowing under the Credit Agreement is less than or equal to $8.0 million on a quarterly basis.
Our borrowings under our commercial credit agreement at May 31, 2016 and 2015 were $0.0 million and $2.4 million, respectively. As our borrowings outstanding have not been significant, and the interest rate is low, a hypothetical increase in interest rates by 10% would not have a material impact on our financial condition or results of operations.
Changes in Foreign Currencies.
We have wholly owned Chinese and European subsidiaries. In addition, we have revenues, cash and accounts receivable in other foreign currencies, primarily the Canadian dollar. Our international operations subject us to foreign currency risks (i.e., the possibility that the financial results could be better or worse than planned because of changes in foreign currency exchange rates). During fiscal 2010 we began using forward contracts to hedge our economic exposure with respect to assets and liabilities denominated in foreign currencies. Given the extent of our international operations and our hedging, we would not expect a 1.0% change in foreign currency rates to have a material impact on our financial condition or results of operations. Our net remeasurement gains and losses for fiscal 2016, 2015 and 2014 were not significant. See Note 1 to the consolidated financial statements for additional information about our hedging activities.
Item 8. Financial Statements and Supplementary Data.
See Consolidated Financial Statements beginning on page F-1 of this Annual Report on Form 10-K.
Supplemental Financial Information regarding quarterly results is contained in Note 14—Quarterly Information (Unaudited), in the Notes to our Consolidated Financial Statements of this Annual Report on Form 10-K.
Item 9. Changes in and Disagreements with Accountants on Accounting and Financial Disclosure.
Not applicable.
26
Item 9A. Controls and Procedures.
Disclosure Controls and Procedures.
Our disclosure controls and procedures are designed to provide reasonable assurances that material information related to our company is recorded, processed, summarized and reported within the time periods specified in the SEC rules and forms, and that such information is accumulated and communicated to our management, including our Chief Executive Officer and Chief Financial Officer, as appropriate, to allow timely decisions regarding required disclosure.
As of May 31, 2016, the end of the period covered by this Annual Report on Form 10-K, we have, with the participation of our Chief Executive Officer and our Chief Financial Officer, evaluated the effectiveness of our disclosure controls and procedures. Based on that evaluation, our Chief Executive Officer and Chief Financial Officer concluded that our disclosure controls and procedures as of the end of the period covered by this Report were effective at the reasonable assurance level.
Management’s Report on Internal Control over Financial Reporting.
Our management is responsible for establishing and maintaining adequate internal control over financial reporting. Internal control over financial reporting is a process designed to provide reasonable assurance regarding the reliability of financial reporting and the preparation of financial statements for external purposes in accordance with generally accepted accounting principles. Our internal control over financial reporting includes policies and procedures that (1) pertain to the maintenance of records that, in reasonable detail, accurately and fairly reflect the transactions and dispositions of our assets; (2) provide reasonable assurance that transactions are recorded as necessary to permit preparation of financial statements in accordance with generally accepted accounting principles, and that our receipts and expenditures are being made only in accordance with authorizations of our management and directors; and (3) provide reasonable assurance regarding prevention or timely detection of unauthorized acquisition, use, or disposition of our assets that could have a material effect on the financial statements.
Our management assessed the effectiveness of our internal control over financial reporting as of May 31, 2016. In making this assessment, our management used the criteria set forth in Internal Control Integrated Framework (2013) issued by the Committee of Sponsoring Organizations of the Treadway Commission (“COSO”). Our management has concluded that, as of May 31, 2016, our internal control over financial reporting was effective based on these criteria.
Deloitte & Touche LLP, an independent registered public accounting firm, who audited our consolidated financial statements included in this Form 10-K has issued an attestation report on our internal control over financial reporting, which is included below.
Changes in Internal Control over Financial Reporting.
There was no change in our internal control over financial reporting (as defined in Rule 13a-15(f) of the Exchange Act) that occurred during our fourth fiscal quarter that has materially affected, or is reasonably likely to materially affect, our internal control over financial reporting.
Inherent Limitations on Effectiveness of Controls.
Our management, including our Chief Executive Officer and Chief Financial Officer, does not expect that our disclosure controls and procedures or our internal controls will prevent all errors and all fraud. A control system, no matter how well conceived and operated, can provide only reasonable, not absolute, assurance that the objectives of the control system are met. Further, the design of a control system must reflect the fact that there are resource constraints, and the benefits of controls must be considered relative to their costs. Because of the inherent limitations in all control systems, no evaluation of controls can provide absolute assurance that all control issues and instances of fraud, if any, within our company have been or will be detected.
27
REPORT OF INDEPENDENT REGISTERED PUBLIC ACCOUNTING FIRM
To the Board of Directors and Shareholders of
Electro Rent Corporation
Van Nuys, California
We have audited the internal control over financial reporting of Electro Rent Corporation and subsidiaries (the "Company") as of May 31, 2016, based on criteria established in Internal Control - Integrated Framework (2013) issued by the Committee of Sponsoring Organizations of the Treadway Commission. The Company's management is responsible for maintaining effective internal control over financial reporting and for its assessment of the effectiveness of internal control over financial reporting, included in the accompanying “Management’s Report on Internal Control Over Financial Reporting.” Our responsibility is to express an opinion on the Company's internal control over financial reporting based on our audit.
We conducted our audit in accordance with the standards of the Public Company Accounting Oversight Board (United States). Those standards require that we plan and perform the audit to obtain reasonable assurance about whether effective internal control over financial reporting was maintained in all material respects. Our audit included obtaining an understanding of internal control over financial reporting, assessing the risk that a material weakness exists, testing and evaluating the design and operating effectiveness of internal control based on the assessed risk, and performing such other procedures as we considered necessary in the circumstances. We believe that our audit provides a reasonable basis for our opinion.
A company's internal control over financial reporting is a process designed by, or under the supervision of, the company's principal executive and principal financial officers, or persons performing similar functions, and effected by the company's board of directors, management, and other personnel to provide reasonable assurance regarding the reliability of financial reporting and the preparation of financial statements for external purposes in accordance with generally accepted accounting principles. A company's internal control over financial reporting includes those policies and procedures that (1) pertain to the maintenance of records that, in reasonable detail, accurately and fairly reflect the transactions and dispositions of the assets of the company; (2) provide reasonable assurance that transactions are recorded as necessary to permit preparation of financial statements in accordance with generally accepted accounting principles, and that receipts and expenditures of the company are being made only in accordance with authorizations of management and directors of the company; and (3) provide reasonable assurance regarding prevention or timely detection of unauthorized acquisition, use, or disposition of the company's assets that could have a material effect on the financial statements.
Because of the inherent limitations of internal control over financial reporting, including the possibility of collusion or improper management override of controls, material misstatements due to error or fraud may not be prevented or detected on a timely basis. Also, projections of any evaluation of the effectiveness of the internal control over financial reporting to future periods are subject to the risk that the controls may become inadequate because of changes in conditions, or that the degree of compliance with the policies or procedures may deteriorate.
In our opinion, the Company maintained, in all material respects, effective internal control over financial reporting as of May 31, 2016, based on the criteria established in Internal Control - Integrated Framework (2013) issued by the Committee of Sponsoring Organizations of the Treadway Commission.
We have also audited, in accordance with the standards of the Public Company Accounting Oversight Board (United States), the consolidated financial statements as of and for the year ended May 31, 2016 of the Company and our report dated August 9, 2016 expressed an unqualified opinion on those financial statements.
/s/ DELOITTE & TOUCHE LLP
Los Angeles, California
August 9, 2016
28
Item 9B. Other Information.
Not applicable.
PART III
Item 10. Directors, Executive Officers and Corporate Governance.
DIRECTORS
Name | Age | |
Nancy Y. Bekavac | 69 | |
Karen J. Curtin | 61 | |
Daniel Greenberg | 75 | |
Joseph J. Kearns | 74 | |
James S. Pignatelli | 72 | |
Theodore E. Guth | 61 | |
Nancy Y. Bekavac has served on our Board since 1992. From 1990 until her retirement in 2007, she served as president of Scripps College. From 1988 to 1990, Ms. Bekavac was Counselor to the President of Dartmouth College. From 1985 to 1988, she worked with the Thomas J. Watson Foundation. From 1974 to 1988, she was a lawyer at the law firm of Munger, Tolles & Olson after clerking with the United States Court of Appeals for the District of Columbia from 1973 to 1974. Ms. Bekavac serves on the board of the Seaver Foundation and First Marblehead Corporation. Ms. Bekavac is a graduate of Swarthmore College and holds a J.D. from Yale Law School. Ms. Bekavac was nominated as a result of her extensive senior leadership skills and legal expertise.
Karen J. Curtin has served on our Board since 2004, and was appointed as our Lead Director in April 2009. On May 10, 2016, our Board of Directors appointed Karen Curtin to succeed Mr. Greenberg as our Chairman of the Board. She assumed her new role on July 11, 2016. Since 2010, Ms. Curtin has been a private investor. She was a Venture Partner in Paradigm Capital Ltd. from 2005 to 2010. From 2004 until 2005, Ms. Curtin was a Principal in Dulcinea Ventures, a startup venture capital fund. From 1998 to 2002, Ms. Curtin was Executive Vice President for Bank of America. Prior to that time she was manager of Bank of America’s Leasing and Transportation Divisions and of predecessor Continental Bank’s Leasing Division. Ms. Curtin holds a B.A. from Newcomb College of Tulane University and an M.A. from Columbia University School of International Affairs. Ms. Curtin was nominated as a result of her financial and business management expertise as well as her experience related to our industry.
Daniel Greenberg has served on our Board since 1976 and has been Chairman of our Board and Chief Executive Officer since 1979. Mr. Greenberg resigned from his positions as Chief Executive Officer and Chairman of the Board, effective as of July 11, 2016. Prior to Electro Rent, he was President and Chief Executive Officer of Telecor, Inc., our former parent company. Prior to joining Telecor, he was a staff attorney with the State of California Department of Water Resources. Mr. Greenberg serves on the board of trustees of Reed College. Mr. Greenberg holds a B.A. from Reed College and a J.D. from the University of Chicago Law School. Mr. Greenberg was nominated as a result of his 35 years as our Chief Executive Officer and Chairman of the Board. Mr. Greenberg brings extensive industry experience and leadership to our board.
Joseph J. Kearns has served on our Board since 1988. Since January 1998, Mr. Kearns has served as President of Kearns & Associates LLC, which specializes in investment consulting for high net worth clients and family foundations. Mr. Kearns is also a part time lecturer on investment management at the Anderson School of Business at UCLA. He served as Vice-President and Chief Financial Officer/Chief Investment Officer of the J. Paul Getty Trust from May 1982 to January 1999. Before joining the Trust, he worked for nearly 20 years for Pacific Telephone, where he served as Financial Manager-Pension Funds and various other financial, accounting and data systems positions. He is a director of the Morgan Stanley Funds and the Ford Family Foundation and is a trustee of Mount Saint Mary’s College. Mr. Kearns holds a B.A. in mathematics from California State University, Sacramento and an M.A. in statistics from Stanford University. He also completed the Williams College Program for Executives. Mr. Kearns was nominated as a result of his extensive finance experience, including his role as a chief financial officer and his many other financial management positions, as well as his related experience serving as the Audit Committee Chairman of the Morgan Stanley Funds since 1997. He also brings strategic insight through his many years of strategic investing, and our Board has unanimously determined that he qualifies as an “audit committee financial expert” under SEC rules and regulations.
James S. Pignatelli has served on our Board since 2002. Since July 1998 until his retirement in January 2009, Mr. Pignatelli
29
was Chairman of the Board, Chief Executive Officer and President of Unisource Energy Corporation, an electric utility holding company, and Chairman of the Board, Chief Executive Officer and President of Tucson Electric Power Company, its principal subsidiary. Previously he served those companies as Senior Vice President and Chief Operating Officer. Mr. Pignatelli serves on the Board of Directors of Altos Hornos de Mexico and Blue Cross-Blue Shield of Arizona. Mr. Pignatelli holds a B.A. in accounting from Claremont Men’s College and a J.D. from the University of San Diego. Mr. Pignatelli was nominated as a result of his experience leading a publicly traded corporation as well as his service on public company boards.
Theodore E. Guth has served on our Board since January 2011. Mr. Guth served as Chief Financial Officer of Douglas Emmett, Inc. (NYSE: DEI), a real estate investment trust (from 2012 to 2015). Previously, Mr. Guth was a partner and held various management positions at the law firms of Manatt, Phelps & Phillips LLP (from 2007 to 2010), Guth/Christopher LLP (from 1997 to 2007) and Irell & Manella LLP. He also served as President of Dabney/Resnick, Inc. (now Imperial Capital), an investment banking and brokerage firm specializing in distressed debt and special situations, and as a full-time professor at the UCLA School of Law. Mr. Guth earned a B.S. from the University of Notre Dame in 1975 and a J.D. from the Yale School of Law in 1978. Mr. Guth was nominated as a result of his intimate familiarity with all aspects of our business, knowledge he has gained serving as our lead counsel in the areas of mergers and acquisitions and securities law from 2001 to 2011.
EXECUTIVE OFFICERS
The table below sets forth the name, age and office or offices of each of our executive officers. No executive officer is related by blood, marriage or adoption to any other officer, director or nominee for director.
Named Executive Officer | Age | Office or Offices | |||
Daniel Greenberg 1 | 75 | Chairman of the Board and Chief Executive Officer | |||
Steven Markheim 1 | 63 | President and Chief Executive Officer | |||
Craig Jones 2 | 70 | Vice President and Chief Financial Officer | |||
Allen Sciarillo 2 | 51 | Vice President and Chief Financial Officer | |||
Herb F. Ostenberg | 66 | Senior Vice President, North American Sales | |||
1 On May 10, 2016, Daniel Greenberg notified the Company of his decision to resign from his positions as Chief Executive Officer and Chairman of the Board, effective as of July 11, 2016. Our Board of Directors appointed Steven Markheim to succeed Mr. Greenberg as Chief Executive Officer. Mr. Markheim assumed the responsibilities of Chief Executive Officer effective on July 11, 2016.
2 On May 10, 2016, Allen Sciarillo was appointed Chief Financial Officer, effective immediately. Mr. Sciarillo has been our Acting Chief Financial Officer since the predecessor Chief Financial Officer, Craig Jones, retired effective August 31, 2015.
Throughout this annual report, the above individuals, all of whom are included in the Summary Compensation Table below, are referred to as our “named executive officers.”
Steven Markheim joined us as a Financial Analyst in 1980 and has been our President and Chief Operating Officer since 2007. In May 2016, Mr. Markheim was appointed to succeed Mr. Greenberg as our Chief Executive Officer effective as of July 11, 2016. Prior to joining us, he was Accounting Manager for Panasonic West, a wholly-owned subsidiary of Matsushita of America, from 1978 to 1980. Mr. Markheim was an auditor with Wolf & Co. from 1975 to 1977. Mr. Markheim holds a B.S. in Accounting from California State University, Northridge.
Allen Sciarillo joined us in 2006 as our Controller. He then served as our VP Finance beginning on February 12, 2015 and Acting Chief Financial Officer beginning on September 1, 2015. In May 2016, Mr. Sciarillo was appointed as our Chief Financial Officer. Prior to joining Electro Rent Corporation, Mr. Sciarillo served as Chief Financial Officer of Dial Thru International Corporation, InterPacket Networks and RSL COM USA. Mr. Sciarillo began his career in public accounting with Deloitte & Touche. Mr. Sciarillo earned his B.S. in Accounting from California State University, Northridge and is a Certified Public Accountant.
Herb F. Ostenberg joined us in 2009 as the National Sales Director of our Authorized Technology Partner Channel and has been our Senior Vice President, North American Sales, since 2011. Prior to joining us, Mr. Ostenberg held several senior sales management positions, including Vice President and General Manager, at Agilent Technologies Inc. from 1999 to 2009, and held various sales, marketing and general management positions at Hewlett Packard from 1980 to 1999. Mr. Ostenberg holds a B.S. in Electrical Engineering from Montana State University.
30
BOARD, COMMITTEES AND CORPORATE GOVERNANCE
Our Board held a total of ten meetings during fiscal 2016 and acted two times by written consent. All of our directors are expected to attend each meeting of our Board and the committees on which they serve and are encouraged to attend annual shareholder meetings, to the extent reasonably possible. All directors attended more than 75% of the aggregate of the meetings of our Board and committees on which they served in fiscal 2016 held during the period in which they served as directors. All of the directors attended our 2015 annual meeting of shareholders. Our Board has designated an Audit Committee, Nominating Committee and Compensation Committee. The charter of each of these committees is posted on our corporate website at http://www.electrorent.com/er/financials/governance.aspx.
Audit Committee
Audit Committee Duties. Our Audit Committee’s primary function is to review the financial information to be provided to our shareholders and others, the financial reporting process, the system of internal controls, the independent auditors’ independence, the audit process and our process for monitoring compliance with laws and regulations. Under our Audit Committee charter, our Audit Committee is solely responsible for:
• | Selecting, retaining and overseeing our independent auditors and approving their fees and engagement terms; |
• | Resolving any disagreement between our independent auditors and our management; and |
• | Pre-approving all audit and non-audit services performed by our independent auditors, subject to a de minimis exception. |
Audit Committee Membership. The members of our Audit Committee are Joseph J. Kearns, Chairman, James S. Pignatelli and Karen J. Curtin. Our Board has affirmatively determined that each member of our Audit Committee is an independent director under the listing standards for NASDAQ and under SEC rules and regulations. Our Board has determined that the Chair of our Audit Committee, Mr. Kearns, is an “audit committee financial expert” under the rules of the SEC, and that each of the other members of our Audit Committee is financially literate.
Audit Committee Meetings in Fiscal 2016. Our Audit Committee met seven times during fiscal 2016.
Nominating and Corporate Governance Committee
Nominating Committee Duties. Our Nominating Committee is responsible for overseeing and, as appropriate, making recommendations to the Board regarding membership and constitution of our Board and its role in overseeing our affairs. Our Nominating Committee manages the process for evaluating the performance of our Board and for nominating candidates (including current Board members) at the time for election by the shareholders after considering the appropriate skills and characteristics required on our Board, the current makeup of our Board, the results of the evaluations, and the wishes of existing Board members to be re-nominated. As appropriate, our Nominating Committee reviews director compensation levels and practices, and recommends, from time to time, changes in such compensation levels and practices to our Board. Our Nominating Committee also:
• | reviews the definition of independent director; |
• | investigates potential conflicts of interest and related party transactions; |
• | recommends committee assignments; and |
• | reviews our Code of Business Conduct and Ethics, corporate governance guidelines and committee charters. |
Nomination Process. On at least an annual basis, our Nominating Committee reviews with our Board whether it believes our Board would benefit from adding a new member(s), and if so, the appropriate skills and characteristics required for the new member(s). If our Board determines that a new member would be beneficial, our Nominating Committee solicits and receives recommendations for candidates and manages the process for evaluating candidates. All potential candidates, regardless of their source (including nominees by shareholders), are reviewed under the same process. Our Nominating Committee (or its chairperson) screens the available information about the potential candidates. Based on the results of the initial screening, interviews with viable candidates are scheduled with Nominating Committee members, other members of our Board and senior members of management. Upon completion of these interviews and other due diligence, our Nominating Committee may recommend to our Board the election or nomination of a candidate.
31
Candidates for independent Board members have typically been found through recommendations from directors or others associated with us. Our Nominating Committee will consider nominations for directors from shareholders. Such nominations should be sent to our Secretary and include the name and qualifications of the nominee. All such recommendations will be brought to the attention of our Nominating Committee. Our current directors were selected and recommended by our Nominating Committee and approved by our Board.
Our Nominating Committee has no predefined minimum criteria for selecting Board nominees although it believes that all Board nominees must demonstrate an ability to make meaningful contributions to the oversight of our business and affairs and also must have a reputation for honesty and ethical conduct in their personal and professional activities. The Nominating Committee also believes that all directors should share qualities such as independence; relevant, non-competitive experience; and strong communication and analytical skills. In any given search, our Nominating Committee may also define particular characteristics for candidates to balance the overall skills and characteristics of our Board and our perceived needs. Our Nominating Committee believes that it is necessary for at least one independent Board member to possess financial expertise. However, during any search, our Nominating Committee reserves the right to modify its stated search criteria for exceptional candidates. Our Nominating Committee does not have a formal policy with respect to diversity; however, our Board and our Nominating Committee believe that it is important that we have Board members whose diversity of skills, experience and background are complementary to those of our other Board members. In considering candidates for our Board, the Nominating Committee considers the entirety of each candidate’s credentials. We believe that all of the nominees for election to our Board meet the minimum requirements and general considerations outlined above.
Nominating Committee Membership. All of the Board members, except Messrs. Greenberg serve as members of our Nominating Committee. The Chair of our Nominating Committee is Ms. Bekavac. Our Board has determined that each member of our Nominating Committee is an independent director under the listing standards of NASDAQ.
Nominating Committee Meetings in Fiscal 2016. Our Nominating Committee met five times during fiscal 2016.
Compensation Committee
Compensation Committee Duties. The Compensation Committee is generally responsible for overseeing and, as appropriate, determining the annual salaries and other compensation of our executive officers and our general employee compensation and other policies, providing assistance and recommendations with respect to our compensation policies and practices, and assisting with the administration of our compensation plans. Among other things, the Compensation Committee will specifically:
• | review and approve the corporate goals and objectives for our Chief Executive Officer and set our Chief Executive Officer’s compensation; |
• | review and approve the evaluation process and compensation structure for our other executive officers and approve their compensation; |
• | review the performance of our executive officers, including our Chief Executive Officer; |
• | review and approve employment, severance or termination agreements with our executive officers; |
• | oversee our policies relating to compensation of our employees; and |
• | as appropriate, approve grants of equity incentives, including stock options and restricted stock units, to our employees, and make recommendations to our Board with respect to incentive compensation plans and equity-based plans and administer those plans that include our officers. |
The Compensation Committee charter does not provide for the delegation of the Compensation Committee’s duties to any other person.
Compensation Committee Membership. All of our Board members, except Mr. Greenberg, serve as members of the Compensation Committee. The Chair of the Compensation Committee is Mr. Pignatelli. Our Board has determined that each member of the Compensation Committee is an independent director under the listing standards of NASDAQ and under SEC rules and regulations.
Compensation Committee Meetings in Fiscal 2016. The Compensation Committee met three times during fiscal 2016.
32
Board Leadership Structure and Role in Risk Oversight
Prior to June 2016, our Board did not separate the role of Chairman of the Board from the role of our Chief Executive Officer. Daniel Greenberg resigned from his positions as Chief Executive Officer and Chairman of the Board, effective as of July 11, 2016. Karen J. Curtin, effective Mr. Greenberg's resignation, took over the role of the Chairman of the Board. Ms. Curtin is also an independent director (under NASDAQ listing standards) and served as our our lead director since April 2009 through July 2016. Our Board believes that the lead director structure allowed us to combine Mr. Greenberg's extensive experience with accountability and effective oversight.
Each committee of our Board is responsible for evaluating certain risks and overseeing the management of such risks. The Compensation Committee is responsible for overseeing the management of risks relating to our executive compensation plans and arrangements. Our Audit Committee oversees the process by which our senior management and the relevant departments assess and manage our exposure to, and management of, financial risks as well as potential conflicts of interest. Our Nominating Committee manages risks associated with the independence of our Board. Our entire Board is regularly informed about these risks, oversees the management of these risks and regularly reviews information regarding our operations and finances as well as our strategic direction.
Mandatory Retirement Policy
The Board has adopted a standard retirement age of 75 for the non-employee members of the Board. It is the general policy of the Board that it will not appoint to the Board or nominate for election to the Board any candidate who has attained an age of 75 or older on the date of such appointment or nomination.
Indemnification Agreements
We have entered into Indemnification Agreements with each of our directors and officers. These Agreements require us to indemnify our officers and directors to the fullest extent permitted under California law against expenses and, in certain cases, judgments, settlements or other payments incurred by the officer or director in suits brought by us, derivative actions brought by shareholders and suits brought by other third parties related to the officer’s or director’s service to us.
Communications to the Board
Shareholders may contact any of our directors by writing to them c/o Electro Rent Corporation, attention: Meryl D. Evans, Secretary, 6060 Sepulveda Boulevard, Van Nuys, California 91411-2512. Shareholders and employees who wish to contact our Board or any member of our Audit Committee to report questionable accounting or auditing matters may do so anonymously by using the address above and designating the communication as “confidential.” Alternatively, concerns may be reported to the following e-mail address: “auditcom@electrorent.com.” This e-mail address is a special e-mailbox to report concerns to the appropriate persons for proper handling. Communications raising safety, security or privacy concerns, or matters that are otherwise improper, will be addressed in an appropriate manner.
Code of Ethics
We have adopted a Code of Business Conduct and Ethics that applies to our principal executive officer and principal financial officer (“Code of Ethics”). The Code of Ethics is designed to promote honest and ethical conduct, full, fair, accurate and timely public disclosure, compliance with all applicable laws, and prompt internal reporting of violations of the Code of Ethics to a person identified therein. Shareholders may obtain a copy of our Code of Ethics without charge. Requests should be addressed to our principal office, attention: Meryl D. Evans, Secretary. Our Code of Ethics can be found on our website at http://www.electrorent.com/er/financials/governance.aspx. We intend to post any waivers from any provision of our Code of Ethics that apply to our principal executive officer or principal financial officer by posting that information on our corporate website, at www.electrorent.com.
33
Equity Ownership Guidelines
We believe that equity ownership by our executive officers and directors can help align their interests with our shareholders’ interests. In April 2009, we adopted equity ownership guidelines for our executive officers and directors. While these guidelines are informal (there are no penalties for failure to meet the ownership levels), we will report ownership status to the Compensation Committee on an annual basis. Failure to meet the ownership levels, or show sustained progress towards meeting them, may result in payment to the executive officers and directors of future annual or long-term incentive compensation in the form of equity. Executive officers and directors are expected to reach target equity ownership levels equal to the lesser of a multiple of their annual base salary or retainer at the previous year end or a fixed share amount, as follows:
Title | Share Equivalents | Multiple of Base Salary/Retainer | ||
Chief Executive Officer | 120,000 | 4x | ||
Other executive officers | 50,000 | 3x | ||
Directors | 12,500 | 3x | ||
These requirements may be met through ownership of Common Stock (including restricted Common Stock) or restricted stock units, whether held individually, jointly with or separately by or in trust for an immediate family member. Each executive officer and director is expected to reach his target ownership level within five years from the date he became subject to that ownership level, based on the fair market value of the equity at each year end.
SECTION 16(a) BENEFICIAL OWNERSHIP REPORTING COMPLIANCE
Section 16(a) of the Securities Exchange Act of 1934 requires our directors and executive officers, as well as persons who own more than 10 percent of our Common Stock, to file with the SEC initial reports of beneficial ownership and reports of changes in beneficial ownership of our Common Stock. Directors, executive officers and greater-than-10-percent shareholders are required by the SEC regulations to furnish us with copies of all Section 16(a) forms they file.
Based solely on a review of copies of such reports filed with the SEC and submitted to us and on written representations by certain of our directors and executive officers, we believe that all of our directors and executive officers filed all such required reports on a timely basis during the past fiscal year.
Item 11. Executive Compensation.
EXECUTIVE COMPENSATION
Compensation Discussion and Analysis
Overview of Compensation Program
The Compensation Committee is responsible for oversight of our compensation and employee benefit plans and practices, including our executive compensation, incentive-compensation and equity-based plans. The Compensation Committee also establishes our policies with respect to compensation of executive officers, including our named executive officers, and reviews our executive compensation disclosures as required by the SEC to be included in our annual proxy statement or annual report on Form 10-K filed with the SEC. For fiscal 2016, our named executive officers consisted of Mr. Greenberg, who served as our chief executive officer; Mr. Markheim, who served as our president and chief operating officer; Mr. Jones, who served as our vice president and chief financial officer until his retirement on August 31, 2015; Mr. Sciarillo, our vice president and chief financial officer; and Mr. Ostenberg, our senior vice president of North American sales.
Compensation Philosophy and Objectives
In designing compensation programs, we believe that the total compensation of our named executive officers and other key employees should reflect the value created for shareholders while supporting our strategic goals. In doing so, the compensation programs reflect the following principles:
• | Compensation should be meaningfully related to the value created for our shareholders. |
• | Compensation programs should support our short-term and long-term strategic goals and objectives. |
• | Compensation programs should reflect and promote our values. |
34
One of our core values in setting compensation has been the promotion of team effort by our executive officers.
Compensation Consultant Review. In determining fiscal 2014 compensation, the Compensation Committee retained Frederic W. Cook & Co, Inc., an independent national compensation consulting firm (“FWC”), in April 2013 to conduct an independent review of our compensation structure, including our process for determining and awarding base salary, annual incentives, long-term incentives, and total direct compensation, including the annualized grant value of long term incentives and FWC prepared a report on its findings. FWC reported directly to the Compensation Committee, although it also conducted discussions with our executive officers. FWC also conducted an equity analysis including award types, mix and various measures of overall value and costs and compared shares usage and dilution and compared our compensation with the compensation of an 18-company peer group for purposes of competitive compensation and performance comparisons (our “Benchmark Group”).
FWC has not provided any services for us other than the services that it provided to the Compensation Committee and the Nominating and Corporate Governance Committee. After considering, among other things, the other factors described elsewhere in this annual report with respect to FWC’s work for the Compensation Committee and the Nominating and Corporate Governance Committee and (i) the absence of any business or personal relationship between FWC and any member of the Compensation Committee or the Nominating and Corporate Governance Committee or any of our executive officers, (ii) the amount of fees received by FWC from us, as a percentage of FWC’s total revenue, (iii) any of our stock owned by FWC (iv) FWC’s Independence Policy that is reviewed annually by its board of directors, (v) FWC’s policy of proactively notifying the Compensation Committee and the Nominating and Corporate Governance Committee chairs of any potential or perceived conflicts of interest, (vi) FWC’s policies and procedures that are designed to prevent conflicts of interest; (iv) any business or personal relationship of FWC with a member of the Compensation Committee or the Nominating and Corporate Governance Committee, and (vii) any business or personal relationship of FWC with our executive officers, the Compensation Committee has concluded that FWC is independent and that its work does not raise any conflict of interest.
In consultation with FWC, our Compensation Committee altered in 2013 our Benchmark Group to include the following 18 publicly traded United States based technology/capital equity leasing companies and similarly sized technology hardware companies, the median market capitalization of which was then consistent with our market capitalization:
Agilysys, Inc. | Measurement Specialties, Inc. | |
Aircastle Ltd | Mobile Mini Inc. | |
CAI International Inc. | PC Connection, Inc. | |
Extreme Networks, Inc. | PCM, Inc. | |
Globecomm Systems, Inc. | Richardson Electronics, Ltd. | |
GSI Group Inc. | ScanSource, Inc. | |
H&E Equipment Services, Inc. | Symmetricom, Inc. | |
Maxwell Technologies Inc. | TAL International Group, Inc. | |
McGrath RentCorp | Willis Lease Finance Corporation | |
The FWC report reflected that our target annual cash opportunity is at or below the 25th percentile for the named executive officers compared to most positions, except for our Chief Operating Officer, and that our individual annual equity awards in fiscal year 2013 and over the previous years were below the 25th percentile as compared to our Benchmark Group. As discussed in more detail below, our Compensation Committee determined that the level of our compensation was generally appropriate for our compensation philosophy and objectives. We did not make material changes to our compensation structure for the fiscal years following the FWC report.
The Role of Shareholder Say-on-Pay Votes. We provide our shareholders with the opportunity to cast an annual advisory vote on executive compensation (a “say-on-pay proposal”). At our annual meeting of shareholders held in October 2015, more than 90% of the votes cast on the say-on-pay proposal at that meeting were voted in favor of the proposal. The Compensation Committee believes this affirms shareholders’ support of our approach to executive compensation. Accordingly, the Compensation Committee did not change its approach in fiscal 2015 and fiscal 2016 and carried forward the compensation structure developed for fiscal 2014 as described below. The Compensation Committee will continue to consider the outcome of our say-on-pay votes when making future compensation decisions for our named executive officers.
Executive Compensation Components
The compensation for our named executive officers generally consists of the following components: base salary, annual incentive bonuses, restricted stock units and other long-term equity incentives and other benefits.
Base Salary. We pay our named executive officers a salary to provide a minimum compensation level and to reflect the perceived
35
current value of each executive officer relative to his peers. The Compensation Committee reviews the salary of each of our named executive officers at least once each year. The analysis generally begins with an average increase for all employees, which generally reflects our performance, any changes in the cost of living and any perceived increases in competitive salaries. The Compensation Committee may then adjust this average percentage to reflect individual circumstances, including such factors as performance, individual salary history, increased job responsibility and changes in compensation paid by competitors. The Compensation Committee may also adjust salaries at other times during the year under certain circumstances such as promotions.
The Compensation Committee established the salaries for our named executive officers for fiscal 2016 and 2017 as follows:
Named Executive Officer | Fiscal 2015 Base Salary | Fiscal 2016 Base Salary | Percentage Change from Fiscal 2015 | Fiscal 2017 Base Salary | Percentage Change from Fiscal 2016 | |||||
Daniel Greenberg | $509,028 | $407,222 | (20.0)% | $— | (100.0)% | |||||
Steven Markheim | $348,282 | $348,282 | —% | $400,000 | 14.8% | |||||
Craig R. Jones | $251,835 | $251,835 | —% | $— | (100.0)% | |||||
Allen Sciarillo | $225,000 | $225,000 | —% | $260,000 | 15.6% | |||||
Herb F. Ostenberg | $223,946 | $223,946 | —% | $223,946 | —% | |||||
For fiscal 2016, based on a low forecasted inflation rate, disappointing fiscal 2015 earnings and the recommendation of management, the Compensation Committee did not increase the base salaries for any of our named executive officers. In fact, at Mr. Greenberg’s request, his salary was reduced by 20% in view of the challenging environment faced by the Company. For fiscal 2017, the salaries for Mr. Markheim and Mr. Sciarillo were increased as a result of their promotions effective July 11, 2016. Mr. Greenberg retired effective July 11, 2016 and Mr. Jones retired effective August 31, 2015.
Overall, based largely on information from the FWC report, the Compensation Committee believed that the named executive officers’ salaries for fiscal 2016 and fiscal 2017 were below the median of comparable positions in our Benchmark Group, with the exception of Mr. Markheim, whose salary was slightly above the median. Our Compensation Committee’s view is that Mr. Markheim's responsibilities were likely greater than the average Chief Operating Officer (as supported by his appointment to Chief Executive Officer and, effective July 2016, justifying the higher base salary.
Annual Incentive Bonuses. After the end of each fiscal year, generally we set aside approximately 3% of our annual earnings before taxes to create an incentive bonus pool for our officers, although the Compensation Committee retains the discretion to adjust the size of the pool to take into account factors including (without limitation) changes in the number of officers participating and the impact on net earnings of acquisitions or other unusual events during our fiscal year. We believe that calculating the amount of this bonus pool based on our earnings before taxes aligns the interests of our officers with our financial results, and hence, to the interest of our shareholders.
At the beginning of each fiscal year, the Compensation Committee assigns to each officer a “Target Percentage” of the incentive bonus pool based largely on position, seniority and compensation. The Compensation Committee retains the right to adjust the Target Percentages as a result of hires, promotions and terminations of officers and similar factors. Each officer is also assigned performance goals for the fiscal year, which are approved by the Compensation Committee. The Compensation Committee retains the right to adjust individual goals in its discretion to take into account factors such as changes in market conditions, acquisitions or other unusual events during the fiscal year.
Following the end of our fiscal year, the Compensation Committee:
• | May adjust the Target Percentage where appropriate to reflect changes in responsibilities and similar issues; |
• | Evaluates the performance of each officer against the performance goals for that officer and other factors in its discretion. For Messrs. Greenberg, Markheim and Sciarillo, their principal performance goals for fiscal 2016 were based on the Company’s planned revenue and earnings before taxes. In fiscal 2016, the Company’s revenue was approximately 14% below plan and the Company’s earnings before taxes were approximately 58% below plan; |
• | Based on that evaluation, assigns each officer a “Participation Percentage” that is generally not less than 85% of his or her Target Percentage nor more than 115% of his or her Target Percentage; and |
• | Each participating officer’s actual Annual Incentive Bonus is then determined by multiplying his or her Participation Percentage times his or her Target Percentage, and then multiplying that percentage by the aggregate bonus pool. The Compensation Committee retains the power to adjust the calculated Annual Incentive Bonus for any participating officer in its discretion. |
36
Because of the impact of the Participation Percentages, the aggregate actual Annual Incentive Bonuses awarded may be more or less than the 3% nominal bonus pool. For fiscal 2016, the Compensation Committee awarded aggregate Annual Incentive Bonuses to the participating officers (a total of 10 persons in fiscal 2016), including our named executive officers, equal to $399,400, or 5.1% of our fiscal 2016 earnings before taxes of 7.8 million. As a result of lower earnings and this smaller percentage, the Annual Incentive Bonuses for fiscal 2016 were 35.4% less than the aggregate Annual Incentive Bonuses for fiscal 2015.
The potential adjustment to the Target Percentage means that a portion of an officer’s bonus depends on individual performance, but in keeping with our traditional emphasis on the officers working together as a team, the majority of each bonus is determined by our overall success (as measured by our earnings before taxes).
The Target Percentages and the Participation Percentages of our named executive officers approved by the Compensation Committee for fiscal 2016 were as follows:
Named Executive Officer | Fiscal 2016 Target Percentage | Fiscal 2016 Participation Percentage | Fiscal 2016 Target Bonus 1 | Fiscal 2016 Actual Bonus | ||||||
Daniel Greenberg | 22.8% | 19.3% | $90,000 | $77,000 | ||||||
Steven Markheim | 25.0% | 24.9% | $99,000 | $99,400 | ||||||
Allen Sciarillo | 6.8% | 14.3% | $27,000 | $57,200 | ||||||
Herb F. Ostenberg | 8.2% | 7.0% | $32,000 | $27,800 | ||||||
1 | The “Target” amount for each named executive officer was calculated by multiplying (i) the total of the incentive bonus pool, at 3% of our actual fiscal 2016 earnings before taxes (adjusted for acquisition related charges and Mr. Greenberg's severance), by (ii) that named executive officer’s fiscal 2016 Target Percentage assigned at the beginning of the fiscal year (rounded to the nearest thousand). |
For fiscal 2016, the Compensation Committee made the following determinations concerning the Participation Percentages of each of our named executive officers:
• | Mr. Greenberg received a Participation Percentage of 85%, based on the Company’s disappointing financial performance compared to its planned revenue and earnings before taxes. As a result of this Participation Percentage and the overall decline in the aggregate bonus pool, Mr. Greenberg’s Annual Incentive Bonus for fiscal 2016 declined by 36.4% from his Annual Incentive Bonus for fiscal 2015. |
• | Mr. Markheim received a Participation Percentage of 100%, based on the Company’s disappointing financial performance compared to its planned revenue and earnings before taxes, offset by his increased responsibilities with respect to his succession as Chief Executive Officer of the Company. As a result of this Participation Percentage and the overall decline in the aggregate bonus pool, Mr. Markheim’s Annual Incentive Bonus for fiscal 2016 declined by 31.0% from his Annual Incentive Bonus for fiscal 2015. |
• | Mr. Sciarillo received a Participation Percentage of 117% based on Mr. Sciarillo’s increased responsibilities first as Acting Chief Financial Officer and then later as Chief Financial Officer. As a result, Mr. Sciarillo’s Annual Incentive Bonus for fiscal 2016 increased by 14.4% from his Annual Incentive Bonus for fiscal 2015. |
• | Mr. Ostenberg received a Participation Percentage of 86%, based on his achievement of 85% of quantitative performance goals related to North America test and measurement equipment lease and rental revenues, while he did not achieve his qualitative goals. As a result of this Participation Percentage and the overall decline in the aggregate bonus pool, Mr. Ostenberg’s Annual Incentive Bonus for fiscal 2016 declined by 55.9% from his Annual Incentive Bonus for fiscal 2015. |
37
The Compensation Committee determined to use the same methodology for Annual Incentive Bonuses with respect to fiscal 2017 as it utilized in fiscal 2016. The Compensation Committee has assigned the following Target Percentages for our named executive officers for fiscal 2017:
Named Executive Officer | Fiscal 2017 Target Percentage | Fiscal 2016 Target Percentage | |||
Daniel Greenberg | —% | 22.8% | |||
Steven Markheim | 34.7% | 25.0% | |||
Allen Sciarillo | 25.0% | 6.8% | |||
Herb F. Ostenberg | 8.1% | 8.2% | |||
• | In light of Mr. Greenberg’s announced retirement, the Compensation Committee did not set a Target Percentage for Mr. Greenberg for fiscal 2017. |
• | The Target Percentage for Mr. Markheim for fiscal 2017 was increased compared to fiscal 2016 as a result of his promotion to Chief Executive Officer effective July 11, 2016. |
• | The Target Percentage for Mr. Sciarillo for fiscal 2017 was increased compared to fiscal 2016 as a result of his promotion to Chief Executive Officer effective July 11, 2016. |
• | The Target Percentage for Mr. Ostenberg for fiscal 2017 remained comparable to fiscal 2016. |
Restricted Stock Units, or Long-Term Equity Incentives. Historically, we have granted equity participation to each of our named executive officers (other than Mr. Greenberg, who requested that he not participate given his large stock ownership position) to provide incentives for them to guide the business toward our long-term goal of increasing shareholder value, to maintain competitive levels of total compensation and to reward attainment of corporate goals over a multi-year period.
In recent years, we have made equity grants to our named executive officers in the form of restricted stock units (or "RSUs"). RSUs vest in three equal annual installments, subject to acceleration on any change of control. Any RSUs not vested at the time the grantee ceases to be an employee (other than in connection with a change of control, death or disability) will be forfeited. When vested, each RSU entitles the holder to be issued one share of Common Stock on the earliest of: (i) the first January 1st after the fifth anniversary of the grant; (ii) a change of control; or (iii) the grantee ceasing to be an employee for any reason, including death or disability. In addition, an amount equal to any dividend (less any applicable withholding) paid on the underlying Common Stock will be paid at the same time on all vested RSUs, and a make-up payment for any dividends paid between the date of grant and the date of vesting will be paid on the first date any RSUs become vested. We typically do not make major adjustments in RSUs based on performance in any year, which is the function of the annual incentive compensation.
In July 2015 and 2016, the Compensation Committee approved grants of restricted stock units for executive officers as follows:
Named Executive Officer | July 2015 RSU Grants (Units) | Grant Date Value | July 2016 RSU Grants (Units) | Grant Date Value | ||||||||||
Steven Markheim | 22,686 | $ | 250,000 | — | $ | — | ||||||||
Craig R. Jones | — | $ | — | — | $ | — | ||||||||
Allen Sciarillo 1 | 13,000 | $ | 150,000 | — | $ | — | ||||||||
Herb F. Ostenberg | 6,352 | $ | 70,000 | — | $ | — | ||||||||
1 In October 2015, the Compensation Committee determined to grant approximately $150,000 to Mr. Sciarillo in light of Mr. Jones' retirement effective August 2015. Mr. Sciarillo became the Acting Chief Financial Officer effective Mr. Jones' retirement.
Our Compensation Committee did not grant any RSUs in July 2016 because of the pendency of the Merger Agreement with Platinum Equities and the expectation that the Merger would be completed in August 2016.
In July 2015, the Compensation Committee determined to grant approximately an additional $78,000 to Mr. Markheim’s RSU grant, bringing the total grant date value to $250,000. This reflected an appreciation for Mr. Markheim’s increased role in the Company’s finance function as well as with the Company’s success in reconfiguring its new equipment channel. The Compensation Committee determined to use RSUs rather than awarding additional Annual Incentive Bonus because it believed that the vesting of the RSUs could serve as an incentive for Mr. Markheim to stay at the Company for the long term. The grant date value of the RSUs awarded to Mr. Ostenberg in July 2015 declined by $10,000 from his award in July 2014, again reflecting lower revenues
38
from the sales organization reporting to him. The Compensation Committee did not make any equity grants to Mr. Jones in July 2015 because he had informed the Company that he would be resigning his employment in August 2015.
In July 2015, the Compensation Committee determined to grant approximately an additional $78,000 to Mr. Markheim’s RSU grant, bringing the total grant date value to $250,000
Overall, based largely on the FWC report, the Compensation Committee believed that the named executive officers’ equity grants in each year were slightly below the median of comparable positions in our Benchmark Group, which the Compensation Committee believed was appropriate given the lower risk inherent in restricted stock units rather than the options used by many companies in our Benchmark Group.
Other Benefits. We provide our named executive officers with perquisites and other personal benefits that we believe are reasonable and consistent with our overall compensation program to better enable us to attract and retain superior employees for key positions. In addition to vacation, medical and health benefits comparable to those provided to our employees generally, each of our named executive officers receives (i) reimbursement of tax, financial, and other services fees up to$15,000 per year for Mr. Greenberg, $7,500 per year for Mr. Markheim, $5,000 per year for Mr. Sciarillo and $2,500 for Mr. Ostenberg and (ii) personal use of a company-owned vehicle. These benefits remain unchanged from fiscal year 2014. Messrs. Greenberg and Markheim also received reimbursement for dues at a country club where each was a member. We also sponsor a retirement savings plan under Section 401(k) of the Internal Revenue Code of 1986, as amended from time to time (the “Code”), that covers all of our eligible employees that allows eligible employees to defer, within prescribed limits, up to 15% of their compensation on a pre-tax basis through contributions to the plan. In addition, we have a Supplemental Executive Retirement Plan that provides for automatic deferral of contributions in excess of the maximum amount permitted under the 401(k) plan for our executives who choose to participate. In addition, for Mr. Greenberg and his spouse, we have agreed to maintain lifetime medical coverage consistent with the standard coverage then available to him, regardless of any termination of employment relationship. Each executive is also entitled to receive an individual life insurance policy, the premiums for which are paid by the Company while the executive is employed by the Company. The policy amount is determined based on each executive's position and responsibilities. We believe these perquisites, while not representing a significant portion of our named executive officers’ total compensation, reflect our intent to create overall market comparable compensation packages.
Tax and Accounting Implications
Section 162(m) of the Code generally disallows a tax deduction to public corporations for compensation paid to executive officers in excess of $1,000,000 during any fiscal year. It is the current policy of the Compensation Committee to preserve, to the extent reasonably possible, our ability to obtain a corporate tax deduction for compensation paid to executive officers to the extent consistent with our best interests. However, the Compensation Committee believes that its primary responsibility is to provide a compensation program that will attract, retain and reward the executive talent necessary for our success. Consequently, the Compensation Committee recognizes that the loss of a tax deduction may be necessary in some circumstances.
We account for stock-based payments in accordance with the requirements of Financial Accounting Standards Board Accounting Standards Codification Topic 718, Compensation-Stock Compensation (“ASC 718”).
Change of Control Payments
As described below under “Principal Compensation Agreements and Plans-Employment Agreements,” as a result of a change of control that occurred in 2000, Mr. Greenberg is entitled to severance when his employment is terminated for any reason other than cause, but will not receive any additional severance as a result of future changes of control. In addition, we are obligated under employment contracts with Messrs. Markheim and Sciarillo to make severance payments to them in the event they terminate their employment for good reason, or they are terminated by us other than for cause, within 18 months following a "material change", which generally includes a change of control and is described in more detail below under "Principal Compensation Agreements and Plans - Employment Agreements." We believe that agreeing to these payments was necessary to retain these officers. We do not have any contractual obligations to make any severance payments to Mr. Ostenberg in the event his employment is involuntarily terminated by us.
Role of Executive Officers in Compensation Decisions
Under its charter, the Compensation Committee makes all compensation decisions with respect to the Chief Executive Officer and our other named executive officers and all other elected officers. In doing so, the Compensation Committee is expected to consult with our Chief Executive Officer and other officers as appropriate. In general, our Chief Executive Officer makes recommendations concerning the compensation of persons other than himself, but generally does not make any recommendation as to himself.
39
Compensation Committee Interlocks and Insider Participation
No member of the Compensation Committee is or was one of our officers or employees, or is related to any other member of the Compensation Committee, or any member of our Board, or any other of our executive officers, by blood, marriage or adoption or had any other relationship requiring disclosure under SEC rules.
Principal Compensation Agreements and Plans
Employment Agreements
Mr. Greenberg, who served as our Chief Executive Officer in fiscal 2016 prior to his July 11, 2016 retirement, was employed pursuant to a written employment agreement initially entered into on December 15, 1986 and amended and restated in July 1992 and later amended and supplemented in October 2001 and further clarified in July 2012. The material terms of Mr. Greenberg’s employment agreement are summarized below:
• | Term. Mr. Greenberg’s employment agreement continues for a rolling three year term such that each month that passes results in the employment term being extended by one month. Upon notice by either party, Mr. Greenberg’s employment term shall no longer be extended by one month increments and shall expire at the end of the three year employment term then in effect. |
• | Base Salary. Mr. Greenberg’s annual base salary shall not be less than $300,000. The Board or the Compensation Committee may increase the salary payable to Mr. Greenberg during the term of the employment agreement. Mr. Greenberg’s salary was also subject to annual increase or decrease in accordance with the Consumer Price Index for the Los Angeles-Long Beach-Anaheim Metropolitan Area. Mr. Greenberg’s base salary for fiscal 2016 was $407,222. |
• | Bonuses. Mr. Greenberg was entitled to receive a bonus and incentive compensation each year in addition to his base salary. In determining the amount of such bonus and incentive compensation, Mr. Greenberg’s employment agreement provides that consideration shall be given to all pertinent factors including, but not limited to, historic policies and practices, business revenues, business profits, the quality of Mr. Greenberg’s performance and the value of his contributions, and the prevailing compensation levels for comparable executive officers in businesses of size, complexity and character similar to us. |
• | Benefits. Mr. Greenberg was entitled to employee benefits comparable to those provided to our senior executives. In October 2001, we further amended Mr. Greenberg’s employment agreement to require that we maintain medical coverage, consistent with the standard of coverage then available to him, for Mr. Greenberg and his spouse for as long as they each shall live, regardless of any termination of the employment relationship. |
• | Severance. For purposes of Mr. Greenberg’s employment, a “change in control,” as defined in his agreement, occurred in 2000. Accordingly, following Mr. Greenberg's resignation, we are obligated (i) to pay an amount equal to three times his highest “annual base amount” (which includes Mr. Greenberg’s base salary, bonus, incentive compensation and deferred compensation) during the term of his employment, payable in one lump sum on the 60th day after Mr. Greenberg’s termination of employment (provided that any portion of the lump sum payment that constitutes an excess parachute payment as defined in Code Section 280G shall not be paid), (ii) to continue each employee health plan and welfare benefit plan and other fringe benefits for a period of 36 months following the date of termination (with medical coverage continuing for his and his spouse’s lifetime) and (iii) to pay Mr. Greenberg’s vested account balance under the Electro Rent Employee Stock Ownership and Savings Plan, as well as an amount equal to the retirement contributions that would have been made on his behalf during the three years following termination. However, the cash payments to Mr. Greenberg are subject to reduction in order to avoid being characterized as excess parachute payments within the meaning of Section 280G of the Code and Mr. Greenberg shall receive a gross up to compensate for any excise taxes payable on any payments made to Mr. Greenberg under this agreement as a result of Section 4999 of the Code. |
Mr. Markheim, Mr. Jones and Mr. Sciarillo. On October 31, 2005, we entered into employment agreements with Steven Markheim, who served as our President and Chief Operating Officer (Chief Executive Officer effective July 11, 2016), and Craig R. Jones, our Vice President and Chief Financial Officer (though August 31, 2015), which agreements were each clarified in August 2012. On February 1, 2015, we entered into employment agreement with Allen Sciarillo, our Vice President and Chief Financial Officer (effective July 11, 2016). The terms of the employment agreements are substantially the same and are summarized below:
• | At Will Employment. Mr. Markheim, Mr. Jones and Mr. Sciarillo are “at will” employees, and may be terminated by us at any time for any reason or resign at any time for any reason. |
• | Salary and Bonus. Mr. Markheim, Mr. Jones and Mr. Sciarillo are paid a base salary and a discretionary bonus each year in an amount to be determined in accordance with our practices for our senior executive officers. Mr. Markheim’s base salary for fiscal 2016 and 2017 is $348,282 and $400,000, respectively. Mr. Jones’s base salary for fiscal 2016 was |
40
$251,835. Mr. Sciarillo's base salary for fiscal 2016 and 2017 is $225,000 and $260,000, respectively.
• | Employee Benefits. Mr. Markheim, Mr. Jones and Mr. Sciarillo receive employment benefits generally available to our senior executive officers. |
• | Severance. Messrs. Markheim, Jones and Sciarillo employment agreements provide for severance if, within 18 months after a “material change,” either Mr. Markheim, Mr. Jones or Mr. Sciarillo is terminated by us other than for cause or terminates his employment relationship for good reason (which generally includes diminution in work responsibilities, forced relocation or material reduction in compensation). In such event, Mr. Markheim, Mr. Jones or Mr. Sciarillo, respectively, shall be entitled to (i) a severance payment equal to two times his base salary as in effect on the date of termination, (ii) immediate vesting of all then-outstanding unvested equity compensation awards previously granted to him, (iii) a pro rata share of the bonus pool for the year of termination based on the percentage of the year worked prior to termination and his share of the prior year’s bonus pool and (iv) reimbursement for any COBRA payments made by him for the 12 months following the termination date. If, at any time other than within 18 months following a “material change,” either Mr. Markheim, Mr. Jones or Mr. Sciarillo is terminated by us other than for cause or if either of them terminates his employment relationship with us for good reason, then he shall be entitled to (i) a severance payment equal to one times his base salary, (ii) a pro rata share of the bonus pool for the year of termination equal to his share of the prior year’s bonus pool multiplied by the percentage of the year worked prior to termination and (iii) reimbursement for any COBRA payments made by him for the 12 months following the termination date. The severance payments described in clause (i) of each of the two preceding sentences shall be payable as one lump sum on the 60th day after the termination date of Mr. Markheim or Mr. Jones, respectively. Severance payments to Messrs. Markheim, Jones and Sciarillo will be reduced to avoid being characterized as a parachute payment within the meaning of Section 280G of the Code and to thereby avoid the imposition of excise taxes pursuant to Section 4999 of the Code. Messrs. Markheim, Jones and Sciarillo will be required to sign a release of claims on or within 45 days after his respective termination of employment, to not revoke the release and to remain in full compliance with the terms of the release as a condition of receiving any severance payment. |
• | Material change. A “material change” is defined in the employment agreements to have occurred (i) upon a merger, consolidation or sale of substantially all of our assets other than in a transaction in which the holders of our Common Stock immediately prior to the merger, consolidation or asset sale have at least 75% ownership of the voting capital stock of the surviving corporation, (ii) upon any person becoming the beneficial owner of 25% or more of our Common Stock (excluding persons and affiliates of persons who have been 5% holders of our Common Stock for at least one year), or (iii) if during any period of two consecutive years, individuals who at the beginning of such period constitute the entire Board cease for any reason (except death) to constitute a majority thereof unless the election, or the nomination for election by our shareholders, of each new director was approved by a vote of the directors then still in office who were directors at the beginning of such period. As discussed below, the proposed Merger with Platinum Equity, which is expected to close in August 2016 would constitute a “material change” under the employment agreements. |
• | Good Reason. A “good reason” event is defined in the employment agreements as the occurrence of any of the following: (i) a material breach by us of this agreement, (ii) we require Messrs. Markheim, Jones or Sciarillo, respectively, to relocate his principal place of work more than 20 miles from the location at which he performed his duties prior to the relocation, (iii) we fail to provide Messrs. Markheim, Jones or Sciarillo, respectively, with compensation and benefits in the aggregate on terms not materially less favorable in the aggregate than those enjoyed by the executive under this agreement prior to the “material change”, or the subsequent material reduction of his compensation and benefits in effect at the time of the “material change” unless such compensation and benefits are substantially equally reduced for our executive officers as a group and there is less than a 10% reduction in compensation or benefits, or (iv) we assign duties to Messrs. Markheim, Jones or Sciarillo, respectively, materially and adversely inconsistent with his positions prior to the “material change”, provided however that a lateral transfer within our company or to an affiliate will not constitute a “good reason.” Termination by Messrs. Markheim, Jones or Sciarillo for “good reason” also requires that Messrs. Markheim, Jones and Sciarillo provide written notice to us describing the existence of the “good reason” event within 90 days of the date of the initial existence of the event. Upon our receipt of such timely written notice, we then have 30 days during which we may cure or remedy the event. Messrs. Markheim’s, Jones’ or Sciarillo's resignation for “good reason” can only be effective if we have not cured or remedied the “good reason” event during the 30 day period and if Messrs. Markheim, Jones or Sciarillo, respectively, actually resigns his employment for “good reason” within 60 days after the expiration of the 30 day cure/remedy period. |
As noted above, Craig Jones, our former Chief Financial Officer, voluntarily submitted his resignation to our Board of Directors with a termination date of August 31, 2015. In recognition of Mr. Jones’ service to our company, our Board of Directors determined that, notwithstanding Mr. Jones’ voluntary resignation, the Company will, pursuant to a Separation Agreement and Release, pay Mr. Jones certain separation benefits in exchange for a release of claims from Mr. Jones. The separation benefits include: a payment
41
in the amount of Mr. Jones’ annual base salary of $251,835, which was paid in one lump sum on the 60th day after Mr. Jones’ resignation is effective; a share of the fiscal 2016 bonus pool payable in a lump sum when we pay our other bonuses, which share will be $5,393 calculated as (a) the total amount of the year’s executive bonus pool, times (b) the percentage of last year’s total executive bonus pool that Mr. Jones received, times (c) the percentage of fiscal 2016 that elapsed as of Mr. Jones’ termination on August 31, 2015; and reimbursement for COBRA coverage for COBRA payments made by Mr. Jones during the 12 month period after the termination of Mr. Jones’ employment. In addition, the Company entered into a consulting agreement with Mr. Jones pursuant to which Mr. Jones will assist in the transition of his duties and responsibilities, in exchange for which the Company will pay Mr. Jones $200 per hour for his services, not to exceed $1,600 in any single calendar day.
We have not entered into an employment agreement or a severance or change in control agreement with Mr. Ostenberg.
Payments upon Termination
All Terminations. Regardless of the manner in which any of our employees (including any of our named executive officers) are terminated, each employee is entitled to receive certain amounts due during such employee’s term of employment. Such amounts include:
• | Any unpaid base salary from the date of the last payroll to the date of termination; |
• | Reimbursement for any properly incurred unreimbursed business expenses; and |
• | Any existing rights to indemnification for prior acts through the date of termination. |
The information below sets forth the amount of compensation we would be required to pay to each of our named executive officers in the event of termination of such executive’s employment, under what we believe to be reasonable assumptions, assuming a hypothetical termination or change of control as of May 31, 2016. These amounts are in addition to the amounts summarized under “All Terminations” above. For Mr. Greenberg, the information below is a present value of his estimated severance payments, including an actuarial analysis of medical insurance premiums and cost of other benefits (including retirement contributions) using the AFR rate of 2.68%.
The actual amounts to be paid out can only be determined at the time of such executive’s separation and may differ materially from the amounts set forth in the table below. The amounts set forth in the table below do not reflect the withholding of applicable state and federal taxes and further assume that no reduction is necessary to avoid having parachute payments under Code Section 280G.
On June 23, 2016, we entered into the Restated Merger Agreement with affiliates of Platinum Equities. We expect the Merger and the transactions contemplated thereby to close by the end of August 2016. If the Merger closes, we will experience a change in control. Pursuant to the Restated Merger Agreement, each outstanding share of our Common Stock (other than shares held by any person who properly asserts dissenters’ rights under California law) will be converted into the right to receive an amount in cash equal to $15.50 per share. Our existing shareholders will no longer have an equity ownership in our company and will no longer participate in our future earnings or growth. After the closing of the Merger, affiliates of Platinum Equity will own all of our Common Stock.
42
Involuntary Termination4 | ||||||||||||||||||
Named Executive Officer | Voluntary Termination 1 | Not for Cause | Change of Control | Death or Permanent Disability | ||||||||||||||
Daniel Greenberg | ||||||||||||||||||
Base salary | $ | 1,221,666 | $ | 1,221,666 | $ | 1,221,666 | $ | 1,221,666 | ||||||||||
Non-equity incentive plan compensation | 231,000 | 231,000 | 231,000 | 231,000 | ||||||||||||||
Employee health and other fringe benefits | 477,246 | 477,246 | 477,246 | 477,246 | ||||||||||||||
Accumulated vacation pay 3 | 4,699 | 4,699 | 4,699 | 4,699 | ||||||||||||||
Total | $ | 1,934,611 | $ | 1,934,611 | $ | 1,934,611 | $ | 1,934,611 | ||||||||||
Steven Markheim | ||||||||||||||||||
Base salary | $ | 348,282 | $ | 348,282 | $ | 696,564 | $ | — | ||||||||||
Non-equity incentive plan compensation | 99,000 | 99,000 | 99,000 | 99,000 | ||||||||||||||
Employee health benefits | 16,434 | 16,434 | 16,434 | — | ||||||||||||||
Unvested and accelerated awards under equity incentive plans 2 | — | — | 454,418 | 454,418 | ||||||||||||||
Accumulated vacation pay 3 | 96,352 | 96,352 | 96,352 | 96,352 | ||||||||||||||
Total | $ | 560,068 | $ | 560,068 | $ | 1,362,768 | $ | 649,770 | ||||||||||
Allen Sciarillo | ||||||||||||||||||
Base salary | $ | 260,000 | $ | 260,000 | $ | 520,000 | $ | — | ||||||||||
Non-equity incentive plan compensation | 57,200 | 57,200 | 57,200 | 57,200 | ||||||||||||||
Employee health benefits | 7,800 | 7,800 | 7,800 | — | ||||||||||||||
Unvested and accelerated awards under equity incentive plans 2 | — | — | 282,940 | 282,940 | ||||||||||||||
Accumulated vacation pay 3 | 89,116 | 89,116 | 89,116 | 89,116 | ||||||||||||||
Total | $ | 414,116 | $ | 414,116 | $ | 957,056 | $ | 429,256 | ||||||||||
Herb F. Ostenberg | ||||||||||||||||||
Base salary | $ | — | $ | — | $ | — | $ | — | ||||||||||
Non-equity incentive plan compensation | 27,800 | 27,800 | 27,800 | 27,800 | ||||||||||||||
Employee health benefits | — | — | — | — | ||||||||||||||
Unvested and accelerated awards under equity incentive plans 2 | — | — | 157,458 | 157,458 | ||||||||||||||
Accumulated vacation pay 3 | 18,074 | 18,074 | 18,074 | 18,074 | ||||||||||||||
Total | $ | 45,874 | $ | 45,874 | $ | 203,332 | $ | 203,332 | ||||||||||
As described above, Craig Jones, our former Chief Financial Officer, voluntarily retired August 31, 2015. As such, he is not included in the table above.
1 | In the case of Messrs. Markheim and Sciarillo, only if they have good reason and the voluntary termination does not follow a "material change" as described above under "Principal Compensation Agreements and Plans - Employment Agreements." |
2 | Reflects the value of unvested restricted stock units as of May 31, 2016 valued using the closing NASDAQ Stock Market price of $13.10 per share. Includes the following dividend equivalent amounts that had accrued on unvested restricted stock units and which would be paid out to the executive if and when the underlying stock units’ vesting is accelerated upon a change of control, death or disability: Steven Markheim - $22,354; Allen Sciarillo - $7,172; Herb F. Ostenberg - $9,166. Does not include the amounts for restricted stock units which were vested as of May 31, 2016 for each executive which would be issued in the following amounts upon a hypothetical termination occurring on May 31, 2016: 37,825 restricted stock units for Steven Markheim valued at $495,508; 2,373 restricted stock units for Allen Sciarillo valued at $31,086; and 16,263 restricted stock units for Herb F. Ostenberg valued at $213,045. |
3 | Represents accrued standard paid vacation amounts as of May 31, 2016. |
43
4 | For Mr. Greenberg, an “involuntary termination” includes his resignation for any reason as described above under “Principal Compensation Agreements and Plans-Employment Agreements.” In the case of Messrs. Markheim and Sciarillo, only if the termination follows within 18 months of a "material change" and is terminated by us without cause or by Messrs. Markheim or Jones for "good reason", as described above under "Principal Compensation Agreements and Plans - Employment Agreements." |
2005 Equity Incentive Plan
We are currently authorized to issue options (incentive stock options and/or non-qualified stock options), stock appreciation rights, restricted stock awards, restricted stock units, performance unit awards and performance share awards to our officers, employees, directors and consultants under our 2005 Equity Incentive Plan. The 2005 Equity Incentive Plan was adopted by our Board and effective as of August 22, 2005 and was approved by our shareholders in October 2005 and was clarified by our Board as of April 12, 2012. In July 2015, the Board approved an amendment and restatement of the 2005 Equity Incentive Plan.
At May 31, 2016, our 2005 Equity Incentive Plan had 559,032 vested and unvested restricted stock unit awards outstanding and 238,720 shares remained available for future grants. During fiscal 2015 and 2016, 127,024 and 86,724 vested restricted stock units were settled into common stock, respectively.
Our 2005 Equity Incentive Plan is administered by the Compensation Committee. Each equity grant is evidenced by written agreement in a form approved by the Compensation Committee. No equity grant granted under our 2005 Equity Incentive Plan is transferable by the optionee other than by will or by the laws of descent and distribution, and each option is exercisable, during the lifetime of the optionee, only by the optionee.
The exercise price of a stock option under our 2005 Equity Incentive Plan must be at least equal to 100% of the fair market value of the Common Stock on the date of grant (110% of the fair market value in the case of incentive stock options granted to employees who hold more than 10 percent of the voting power of our Common Stock on the date of grant). The term of a stock option under our 2005 Equity Incentive Plan may not exceed 10 years (5 years in the case of an incentive stock option granted to a 10 percent holder). The Compensation Committee has the discretion to determine the vesting schedule and the period required for full exercisability of stock options. Upon exercise of any option granted under our 2005 Equity Incentive Plan, the exercise price may be paid in cash, and/or such other form of payment as may be permitted under the applicable option agreement, including, without limitation, previously owned shares of Common Stock.
Our 2005 Equity Incentive Plan permits the grant of shares of Common Stock (including restricted stock units) subject to conditions imposed by the Compensation Committee, including, without limitation, restrictions based upon time, the achievement of specific performance goals, and/or restrictions under applicable federal or state securities laws. The Compensation Committee may accelerate the time at which any restrictions lapse, and/or remove any restrictions.
Other Employee Benefit Plans
We maintain a 401(k) Savings Plan, which is intended to qualify under Section 401(k) of the Code. Under Section 401(k) of the Code, contributions by employees or by us to the 401(k) plan, and income earned on plan contributions, are not taxable to employees until withdrawn from the 401(k) plan, and our contributions will be deductible by us when made. All of our employees who have attained 18 years of age become eligible to participate in the 401(k) plan after three months of employment. We have the option to match contributions of participants at a rate determined by our management each year. For participants with three or more years of service, we also may elect to make additional discretionary matching contributions in excess of the rate elected for participants with less than three years of service.
We also maintain a Supplemental Executive Retirement Plan (“SERP”). Contributions in excess of the maximum permitted under the 401(k) plan are automatically deferred under the SERP for executives. The SERP is a non-qualified deferred compensation program. We are obligated under the SERP to make matching contributions that would otherwise be due under our 401(k) Savings Plan which cannot be provided under the 401(k) Savings Plan due to Code Section 415 or applicable anti-discrimination requirements. The benefits under the SERP are paid to the plan participants at the time of termination of employment in a cash lump sum or, if the accumulated benefits under the SERP exceed $40,000, in up to ten annual installments depending on the amount of the benefits. The SERP is an unfunded, unsecured employee benefits plan. However, we are authorized under the SERP to transfer money or other property to one or more trust funds to fund the payment of SERP benefits. We do not maintain a pension plan that requires disclosure.
44
Summary Compensation Table
The following table sets forth the base salary and other compensation paid or earned by our named executive officers:
Named Executive Officer | Year | Salary | Stock Awards 1 | Non-equity Incentive Plan Compensation 2 | All Other Compensation 3 | Total | |||||||||||||||||
Daniel Greenberg | 2016 | $ | 407,222 | $ | — | $ | 77,000 | $ | 102,333 | $ | 586,555 | ||||||||||||
Chairman of the Board | 2015 | $ | 509,028 | $ | — | $ | 121,000 | $ | 88,134 | $ | 718,162 | ||||||||||||
and Chief Executive Officer | 2014 | $ | 499,047 | $ | — | $ | 273,000 | $ | 86,273 | $ | 858,320 | ||||||||||||
Steven Markheim | 2016 | $ | 348,282 | $ | — | $ | 99,400 | $ | 35,696 | $ | 483,378 | ||||||||||||
President and Chief | 2015 | $ | 348,282 | $ | 172,100 | $ | 144,000 | $ | 44,646 | $ | 709,028 | ||||||||||||
Operating Officer | 2014 | $ | 341,453 | $ | 172,100 | $ | 240,000 | $ | 48,811 | $ | 802,364 | ||||||||||||
Craig R. Jones 4 | 2016 | $ | 251,835 | $ | — | $ | 5,393 | $ | 17,047 | $ | 274,275 | ||||||||||||
Vice President and | 2015 | $ | 251,835 | $ | 110,700 | $ | 40,000 | $ | 32,853 | $ | 435,388 | ||||||||||||
Chief Financial Officer | 2014 | $ | 246,897 | $ | 110,700 | $ | 126,000 | $ | 40,680 | $ | 524,277 | ||||||||||||
Allen Sciarillo | 2016 | $ | 225,000 | $ | — | $ | 57,200 | $ | 20,942 | $ | 303,142 | ||||||||||||
Vice President and | 2015 | $ | 187,500 | $ | 75,000 | $ | 50,000 | $ | 6,908 | $ | 319,408 | ||||||||||||
Chief Financial Officer | 2014 | $ | 170,000 | $ | 30,000 | $ | — | $ | — | $ | 200,000 | ||||||||||||
Herb F. Ostenberg | 2016 | $ | 223,946 | $ | — | $ | 26,700 | $ | 21,452 | $ | 272,098 | ||||||||||||
Senior Vice President, North | 2015 | $ | 223,946 | $ | 80,000 | $ | 63,000 | $ | 17,760 | $ | 384,706 | ||||||||||||
American Sales | 2014 | $ | 219,555 | $ | 90,000 | $ | 75,000 | $ | 21,439 | $ | 405,994 | ||||||||||||
1 | Represents the aggregate grant date fair value of restricted stock units recognized in accordance with ASC 718. Assumptions used in the calculation of this amount are included in Note 11 to our audited financial statements for fiscal 2016. See “Executive Compensation-Compensation Discussion and Analysis-Executive Compensation Components” above, the "Grants of Plan-Based Awards" below, and the "Outstanding Equity Awards at Fiscal Year-End" table for more details regarding the terms of the restricted stock units. |
2 | Consists of amounts paid under our annual incentive compensation program. See “Executive Compensation-Compensation Discussion and Analysis-Executive Compensation Components-Annual Incentive Bonuses” above and "Grants of Plan-Based Awards" table below. |
45
3 | The components of the column entitled “All Other Compensation” for fiscal 2016 are set forth in the following table: |
Each named executive officer is responsible for paying income tax on such amounts.
Named Executive Officer | 401(k) Savings Plan | Supplemental Executive Retirement Plan | Life Insurance Premiums | Professional Services (a) | Personal Use of Company Owned Vehicle | Other (b) | Total | ||||||||||||||||||||||
Daniel Greenberg | $ | 6,496 | $ | 7,253 | $ | 34,597 | $ | 15,000 | $ | 24,247 | $ | 14,740 | $ | 102,333 | |||||||||||||||
Steven Markheim | $ | 5,782 | $ | 4,898 | $ | 12,895 | $ | 2,750 | $ | 5,231 | $ | 4,140 | $ | 35,696 | |||||||||||||||
Craig R. Jones | $ | 3,961 | $ | — | $ | 6,161 | $ | 5,000 | $ | 1,925 | $ | — | $ | 17,047 | |||||||||||||||
Allen Sciarillo | $ | 6,624 | $ | — | $ | 276 | $ | — | $ | 14,042 | $ | — | $ | 20,942 | |||||||||||||||
Herb F. Ostenberg | $ | 6,260 | $ | 960 | $ | 5,305 | $ | 4,500 | $ | 4,427 | $ | — | $ | 21,452 | |||||||||||||||
(a) | Professional services include legal, accounting, financial planning, investment counseling and other services. |
(b) | Other includes reimbursement to Mr. Greenberg and Mr. Markheim for dues at clubs where each is a member. |
4 | Mr. Jones voluntarily resigned his employment effective August 31, 2015. |
Grants of Plan-Based Awards
The following table sets forth the grants of plan-based awards during fiscal 2016 to our named executive officers:
Named Executive Officer | Grant Date | Estimated Future Payouts under Non-Equity Incentive Plan Awards 1 | All Other Stock Awards: Number of Shares of Stock or Units | Grant Date Fair Value of Stock and Option Awards 2 | ||||||||||
Minimum | Target | Maximum | ||||||||||||
Daniel Greenberg | — | $76,500 | $90,000 | $103,500 | — | — | ||||||||
— | — | — | — | — | — | |||||||||
Steven Markheim | — | $84,150 | $99,000 | $113,850 | — | — | ||||||||
7/16/2015 | — | — | — | 22,686 | $250,000 | |||||||||
Craig R. Jones | — | $— | $— | $— | — | — | ||||||||
7/16/2015 | — | — | — | — | — | |||||||||
Allen Sciarillo | — | $22,950 | $27,000 | $31,050 | — | — | ||||||||
7/16/2015 | — | — | — | 6,806 | $75,000 | |||||||||
10/15/2015 | — | — | — | 13,000 | $150,000 | |||||||||
Herb F. Ostenberg | — | $27,200 | $32,000 | $36,800 | — | — | ||||||||
7/16/15 | — | — | — | 6,352 | 70,000 | |||||||||
1 | Represents amounts expected to be received under our annual incentive compensation program. The “Target” amount for each named executive officer was calculated by multiplying (i) the total of the incentive bonus pool, estimated at 3% of our actual fiscal 2016 earnings before taxes (adjusted for acquisition related charges and Mr. Greenberg's severance), by (ii) that named executive officer’s fiscal 2016 Target Percentage assigned at the beginning of the fiscal year. We then calculated the “Threshold” amount as 85% of that “Target” (based on the expected minimum Participation Percentage) and the “Maximum” as 115% of that “Target” (based on the expected maximum Participation Percentage), although because the Compensation Committee retained discretion to adjust the size of the pool, the Target Percentage and the Participation Percentage, the actual bonuses paid could be less than or more than the values in the table above. For additional discussion, see “Executive Compensation-Compensation Discussion and Analysis-Executive Compensation Components-Annual Incentive Bonuses.” For actual amounts paid for fiscal 2016, see “Summary Compensation Table-Non-equity Incentive Plan Compensation.” |
46
2 | Represents the aggregate grant date fair value of restricted stock units recognized in accordance with ASC 718. Assumptions used in the calculation of this amount are included in Note 11 to our audited financial statements for fiscal 2016 included in our Annual Report on Form 10-K. The closing price of our Common Stock on July 16, 2015 was $11.02 per share. These awards vest evenly in annual increments over three years, with full vesting on July 16, 2018. See “Executive Compensation-Compensation Discussion and Analysis-Executive Compensation Components” for a description of the terms of the restricted stock units. |
Outstanding Equity Awards at Fiscal Year-End
The named executive officers did not hold any outstanding stock options or other equity compensation awards except for restricted stock units at the end of fiscal 2016. The following table presents all unvested restricted stock units held by the named executive officers at the end of fiscal 2016:
Stock Awards | ||||||||
Named Executive Officer | Number of Shares or Units of Stock That Have Not Vested | Market Value of Shares or Units of Stock That Have Not Vested 1 | ||||||
Daniel Greenberg | — | — | ||||||
Steven Markheim | 32,982 | 2 | 432,064 | |||||
Craig R. Jones | — | — | ||||||
Allen Sciarillo | 21,051 | 3 | 275,768 | |||||
Herb F. Ostenberg | 11,320 | 4 | 148,292 | |||||
1 | The market values of the unvested restricted stock units are presented based on the closing price of our Common Stock on May 31, 2016 of $13.10 per share. See “Executive Compensation-Compensation Discussion and Analysis-Executive Compensation Components” for a description of the terms of the restricted stock units. |
2 | Consists of the following restricted stock unit awards: (a) 9,456 restricted stock units granted on July 11, 2013, vesting one-third on July 11, 2014, 2015 and 2016; and (b) 10,716 restricted stock units granted July 10, 2014, vesting one-third on July 10, 2015, 2016 and 2017; and (c) 22,686 restricted stock units granted July 16, 2015, vesting one-third on July 16, 2016, 2017 and 2018. |
3 | Consists of the following restricted stock unit awards: (a) 1,868 restricted stock units granted on July 10, 2014, vesting one-third on July 10, 2014, 2015 and 2016; and (b) 6,806 restricted stock units granted July 16, 2015, vesting one-third on July 16, 2016, 2017 and 2018; and (c) 13,000 restricted stock units granted October 15, 2015, vesting one-third on October 15, 2016, 2017 and 2018. |
4 | Consists of the following restricted stock unit awards: (a) 4,945 restricted stock units granted on July 11, 2013, vesting one-third on July 11, 2014, 2015 and 2016; and (b) 4,981 restricted stock units granted July 10, 2014, vesting one-third on July 10, 2015, 2016 and 2017; and (c) 6,352 restricted stock units granted July 16, 2015, vesting one-third on July 16, 2016, 2017 and 2018. |
Restricted Stock Units Vested and Settled into Shares
The following table sets forth the restricted stock units that vested during fiscal 2016.
Named Executive Officer | Stock Awards | |||||||
Number of Shares Vesting 1 | Value Realized on Vesting 2 | |||||||
Daniel Greenberg | — | $ | — | |||||
Steven Markheim | 11,045 | $ | 119,617 | |||||
Craig R. Jones | 6,478 | $ | 70,157 | |||||
Allen Sciarillo | 1,206 | $ | 13,061 | |||||
Herb F. Ostenberg | 5,176 | $ | 56,056 | |||||
1 | Shares for the vested restricted stock units will be issued to the named executive officer on the earliest of: (i) the first |
47
January 1st after the fifth anniversary of the grant of the restricted stock units; (ii) a change of control; or (iii) the named executive officer ceasing to be an employee for any reason, including death or disability. The shares in this column will be distributed to the named executive officers as follows unless a change of control occurs or the named executive officer ceases to be an employee prior to such dates, in which case all of the shares yet to be issued will be distributed to the named executive officer upon such earlier occurrence:
Named Executive Officer | January 1, 2018 | January 1, 2019 | January 1, 2020 | Total | |||||||
Steven Markheim | 4,321 | 3,152 | 3,572 | 11,045 | |||||||
Craig R. Jones | 2,153 | 2,027 | 2,298 | 6,478 | |||||||
Allen Sciarillo | 583 | — | 623 | 1,206 | |||||||
Herb F. Ostenberg | 1,867 | 1,648 | 1,661 | 5,176 | |||||||
2 Value realized was computed by using the closing prices of our Common Stock on vesting dates.
Non-Qualified Deferred Compensation
The following table provides details for the named executive officers regarding their non-qualified deferred compensation accounts as of May 31, 2016. Registrant contribution amounts reflect contributions to the SERP that could not be made under our qualified 401(k) plan due to Internal Revenue Service rules and deferred compensation on vested restricted stock units pursuant to our 2005 Equity Incentive Plan. Aggregated balances for the contributions to the SERP include deferred salary and annual incentive bonuses earned in prior years but deferred by the officers. Additional discussion of our non-qualified deferred compensation programs is presented below the table.
Named Executive Officer | Executive Contributions in Last FY 1 | Registrant Contributions in Last FY 2 | Aggregate Earnings / (Losses) in Last FY 3 | Aggregate Withdrawals/ Distributions 4 | Aggregate Balance at Last FYE 5 | |||||||||||||||
Daniel Greenberg | ||||||||||||||||||||
SERP | $ | 43,519 | $ | 7,253 | $ | (285,654 | ) | $ | — | $ | 2,322,436 | |||||||||
Steven Markheim | ||||||||||||||||||||
SERP | $ | 9,795 | $ | 4,898 | $ | 12,188 | $ | — | $ | 555,191 | ||||||||||
Vested Stock Units | $ | — | $ | 144,690 | $ | 75,787 | $ | (220,800 | ) | $ | 495,508 | |||||||||
Craig R. Jones | ||||||||||||||||||||
SERP | $ | — | $ | — | $ | — | $ | (170,033 | ) | $ | — | |||||||||
Vested Stock Units | $ | — | $ | 69,055 | $ | — | $ | (302,637 | ) | $ | — | |||||||||
Allen Sciarillo | ||||||||||||||||||||
SERP | $ | — | $ | — | $ | — | $ | — | $ | — | ||||||||||
Vested Stock Units | $ | — | $ | 15,799 | $ | 9,300 | $ | (18,400 | ) | $ | 31,086 | |||||||||
Herb F. Ostenberg | ||||||||||||||||||||
SERP | $ | 5,762 | $ | 960 | $ | 74 | $ | — | $ | 36,337 | ||||||||||
Vested Stock Units | $ | — | $ | 67,806 | $ | 31,376 | $ | (73,600 | ) | $ | 213,045 | |||||||||
1 | Represents cash contributions to the SERP through salary deferrals. The amounts are also included in the “Salary” column totals for fiscal 2016 reported in the “Summary Compensation Table.” |
2 | For SERP contributions, represents matching contributions for each named executive officer due to limitations imposed by the Internal Revenue Service on our matching contributions to the 401(k) plan. The amounts are also included in the “All Other Compensation” column totals for fiscal 2016 reported above in the “Summary Compensation Table.” |
For vested stock units, represents restricted stock units (valued using the fiscal 2016 year-end closing NASDAQ Stock Market price of $13.10 per share, except for Mr. Jones) which vested in fiscal 2016 but for which the issuance of shares of Common Stock has been deferred as described above in footnote 1 to the “Option Exercises and Stock Vested” table. For Mr. Jones, we used the NASDAQ Stock Market price of $10.66 per share on his date of retirement of August 31, 2015. None of these amounts are included for fiscal 2016 reported above in the “Summary Compensation Table.”
3 | Each participant in the SERP directs the investment of his account balance in the same manner as participants in our 401(k) plan, and his account receives the benefits of any resulting gains or income and is charged with any resulting losses. The |
48
“earnings” listed in the table above represent the net impact of the changes in the participant’s account during the fiscal year, excluding the effect of contributions and withdrawals. Accordingly, we do not treat any of the earnings as being above-market or preferential. Therefore, none of the amounts are included for fiscal 2016 reported above in the “Summary Compensation Table.”
For vested stock units, reflects the change in value of the shares underlying the outstanding restricted stock units that had vested prior to fiscal 2016 and reflects the difference between the fiscal 2016 and fiscal 2015 year-end closing NASDAQ Stock Market prices which were $13.10 and $10.27 per share, respectively. At fiscal 2015 year-end Mr. Markheim, held 50,780 vested stock units, Mr. Sciarillo held 2,583 vested stock units and Mr. Ostenberg held 19,087 vested stock units. None of the amounts are included for fiscal 2016 reported above in the “Summary Compensation Table.” At fiscal 2016 year-end Mr. Markheim held 37,825 vested stock units, Mr. Sciarillo held 2,373 vested stock units and Mr. Ostenberg held 16,263 vested stock units. The number and value of restricted stock units that were settled into shares of common stock during fiscal 2016 were excluded from the calculation.
Mr. Jones retired effective August 31, 2016. At that time, Mr. Jones held 28,390 shares of vested restricted stock units which we valued using NASDAQ Stock Market price of $10.66 per share on his date of retirement.
4. | Reflects the value of the 24,000, 2,000 and 8,000 vested restricted stock units held by Mr. Markheim, Mr. Sciarillo and Mr. Ostenberg, respectively, that were settled into common stock on January 4, 2016. The value was calculated using the closing NASDAQ Stock Market price of $9.20 per share on December 31, 2015. |
5. | For vested stock units, reflects the aggregate value of the shares underlying the vested stock units as of May 31, 2016 based on the closing NASDAQ Stock Market price of $13.10 per share as of such date: Mr. Markheim - 37,825 shares, Mr. Sciarillo - 2,373 shares and Mr. Ostenberg - 16,263 shares. The following grant date values for these stock units were previously reported in the “Stock Awards” column of the Summary Compensation Table in previous years: For Mr. Markheim, $646,499; for Mr. Ostenberg, $278,680. Mr. Jones retired effective August 31, 2015 and Mr. Sciarillo became an executive officer upon Mr. Jones' retirement. |
For the SERP: For Mr. Greenberg, $1,308,544 of the aggregate balance was reported in the Summary Compensation Table in previous years. For Mr. Markheim, $303,176 of the aggregate balance was reported in the Summary Compensation Table in previous years. For Mr. Jones, $130,348 of the aggregate balance was reported in the Summary Compensation Table in previous years. For Mr. Ostenberg, $141,082 of the aggregate balance was reported in the Summary Compensation Table in previous years. Mr. Sciarillo does not participate in SERP.
Deferral of compensation is permitted up to 15% of salary and bonus. All of the named executive officers’ deferrals and any company matches are added to a recordkeeping account. The account is credited with earnings or losses, depending upon actual performance of the mutual-fund-type investment options the participant has chosen. These are the same investment options available to non-executive 401(k) plan participants.
Payment of a participant’s account balance is deferred until a date designated by the participant upon making the deferral election. The deferral amounts are paid either in one lump sum or in annual installments for up to 10 years. Upon a participant’s death, any remaining balance in the participant’s account is paid to the participant’s designated beneficiary. See also “Executive Compensation-Other Employee Benefit Plans.”
49
COMPENSATION COMMITTEE REPORT
The information contained in this Compensation Committee Report shall not be deemed incorporated by reference in any filing under the Securities Act of 1933, as amended, or the Securities Exchange Act of 1934, as amended, whether made before or after the date hereof and irrespective of any general incorporation language in any such filing (except to the extent that we specifically incorporate this information by reference), and shall not otherwise be deemed “soliciting material” or “filed” with the SEC or subject to Regulation 14A or 14C, or to the liabilities of Section 18 of the Securities Exchange Act of 1934 (except to the extent that we specifically incorporate this information by reference).
The Compensation Committee has reviewed and discussed the Compensation Discussion and Analysis required by Item 402(b) of Regulation S-K with management and, based on such review and discussions, the Compensation Committee recommended to our Board that the Compensation Discussion and Analysis be included in this annual report.
COMPENSATION COMMITTEE | |
James S. Pignatelli, Chairperson | |
Karen J. Curtin | |
Nancy Y. Bekavac | |
Theodore E. Guth | |
Joseph J. Kearns | |
50
DIRECTOR COMPENSATION
Our Nominating Committee reviews director compensation levels and practices and recommends to our Board from time to time changes in compensation levels and practices. Directors who are employees, such as Mr. Greenberg, receive no additional compensation for their services as directors.
Non-employee directors receive the following compensation, payable quarterly in cash, with the exception of amounts paid in connection with meeting attendance, which are paid at the end of the quarter during which the meeting was held:
• | Annual retainer of $50,000; |
• | Annual grants of restricted stock units to each continuing non-employee director valued at $50,0001; |
• | An additional retainer of $5,000 for the Compensation Committee chairperson and $4,000 for our Nominating Committee chairperson; |
• | An additional $15,000 annual retainer for the Audit Committee chairperson; |
• | An additional $15,000 one-time retainer for the Strategic Alternatives Committee chairperson; |
• | An additional $10,000 annual retainer for the lead director. |
1 | The restricted stock units are granted each year in October, on the date of our annual shareholders’ meeting, and vest in four equal quarterly installments (25% upon grant) with full vesting on July 1 of the following year (subject to acceleration on any change of control, death or disability) but are otherwise the same as those issued to our officers. The shares of Common Stock underlying the units are issued with respect to the vested units on the earliest of (i) the first January 1 after the fifth anniversary of the grant, (ii) a change of control, or (iii) the grantee ceasing to be a director for any reason. |
Director Compensation
The table below summarizes the compensation paid by us to our non-employee directors for fiscal 2016:
Name | Fees Earned or Paid in Cash | Stock Awards 1 & 2 | Total | |||||||||
Nancy Y. Bekavac | $ | 54,000 | $ | 50,000 | $ | 104,000 | ||||||
Karen J. Curtin | $ | 60,000 | $ | 50,000 | $ | 110,000 | ||||||
Joseph J. Kearns | $ | 65,000 | $ | 50,000 | $ | 115,000 | ||||||
James S. Pignatelli | $ | 50,000 | $ | 50,000 | $ | 100,000 | ||||||
Theodore E. Guth | $ | 55,000 | $ | 50,000 | $ | 105,000 | ||||||
1 | Represents the aggregate grant date fair value of restricted stock units recognized in accordance with ASC 718. The assumptions used in the calculation of this amount are included in Note 11 to our audited financial statements the year ended May 31, 2016. |
2 | Each director was granted 4,329 restricted stock units in fiscal 2016 on October 15, 2015 in connection with their annual director compensation. The closing price of our Common Stock on October 15, 2015 was $11.55. The restricted stock units vested 25% upon grant, and another 25% vested on each of January 1, April 1 and July 1, 2016. As of May 31, 2016, 1,082 restricted stock units remained unvested for each non-employee director. |
51
Item 12. Security Ownership of Certain Beneficial Owners and Management and Related Stockholder Matters.
SECURITY OWNERSHIP OF CERTAIN BENEFICIAL OWNERS AND MANAGEMENT
The following table presents information concerning the beneficial ownership of the shares of ELRC’s common stock as of August 1, 2016 by:
• | each person ELRC knows to be the beneficial owner of 5% or more of the outstanding shares of ELRC’s common stock; |
• | each of ELRC’s named executive officers; |
• | each of ELRC’s directors; and |
• | all of ELRC’s current executive officers and directors as a group. |
Beneficial ownership is determined under the rules of the Securities and Exchange Commission and generally includes voting or investment power over securities. Except in cases where community property laws apply or as indicated in the footnotes to this table, ELRC believes that each shareholder identified in the table possesses sole voting and investment power over all shares of common stock shown as beneficially owned by the shareholder. The address for each of ELRC’s directors and named executive officers is c/o Electro Rent Corporation, 6060 Sepulveda Boulevard, Van Nuys, CA 91411.
The percentage of beneficial ownership is based on 24,197,843 shares of common stock outstanding on August 1, 2016.
Name and Address of Owner 1 | Number of Shares of Common Stock Beneficially Owned 2 | Percentage of Common Stock Beneficially Owned 2 | ||||
5% Shareholders | ||||||
T. Rowe Price and Associates, Inc. 3 | 3,337,400 | 13.8 | % | |||
Dimensional Fund Advisors LP 4 | 1,847,042 | 7.6 | % | |||
Phillip Greenberg 5 | 1,735,573 | 7.2 | % | |||
Current Directors and Named Executive Officers | ||||||
Nancy Y. Bekavac | 46,070 | * | ||||
Karen J. Curtin | 40,040 | * | ||||
Daniel Greenberg 6 | 4,600,434 | 19.0 | % | |||
Theodore E. Guth | 18,748 | * | ||||
Joseph J. Kearns | 30,072 | * | ||||
Steven Markheim | 259,101 | 1.1 | % | |||
Herb F. Ostenberg | 29,689 | * | ||||
James S. Pignatelli | 36,700 | * | ||||
Allen Sciarillo | 6,389 | * | ||||
Total current directors and executive officers as a group | 5,067,243 | 20.1 | % | |||
* Indicates less than 1% | ||||||
1 | The address of each shareholder is 6060 Sepulveda Boulevard, Van Nuys, California 91411-2512 unless otherwise set forth in the table or in the footnote. |
2 | For purposes of this table, a person or group of persons is deemed to have “beneficial ownership” of any shares that such person or group has the right to acquire within 60 days after August 1, 2016. These shares are deemed outstanding for purposes of computing the percentage of outstanding shares held by each person or group on that date, but are not deemed outstanding for computing the percentage ownership of any other person. The number of shares in this table includes restricted stock units that are currently vested or that will become vested within 60 days after August 1, 2016: Mr. Markheim, 52,111; Mr. Sciarillo, 5,264; Mr. Ostenberg, 21,689; 15,182 for each of Ms. Bekavac, Ms. Curtin, Mr. Kearns, Mr. Pignatelli and 16,248 for Mr. Guth. |
3 | Based on information filed in their joint Schedule 13G/A on February 11, 2016, on behalf of each of T. Rowe Price Associates, Inc., a Maryland corporation, and an investment adviser registered under the Investment Advisers Act of 1940, and T. Rowe Price Small-Cap Value Fund, Inc., a Maryland corporation, T. Rowe Price Associates, Inc. has sole voting |
52
power with respect to 891,570 shares and sole dispositive power with respect to 3,337,400 shares. T. Rowe Price Small-Cap Value Fund, Inc. has sole voting power with respect to 1,905,120 shares, but does not have sole or shared dispositive power with respect to any shares. The address of T. Rowe Price Associates, Inc. and T. Rowe Price Small-Cap Value Fund, Inc. is 100 E. Pratt Street, Baltimore, Maryland 21202.
4 | Based on information contained in its Schedule 13G/A filed on February 9, 2016, Dimensional Fund Advisors LP, an investment adviser registered under the Investment Advisers Act of 1940, has sole voting power with respect to 1,790,030 shares and sole dispositive power with respect to 1,847,042 shares. The address of Dimensional Fund Advisors LP is Building One, 6300 Bee Cave Road, Austin, Texas 78746. |
5 | In his Schedule 13G/A filed on January 25, 2010, Phillip A. Greenberg reported sole voting and dispositive power with respect to 2,335,573 shares. Mr. Greenberg transferred 600,000 shares to a charity subsequent to May 27, 2016; however, the charity agreed to an agreement obligating it to vote in favor of the merger with respect to the 600,000 shares. |
6 | The number of shares reflected in the table includes 1,001,672 shares held by the Greenberg Foundation, which Daniel Greenberg has the right to vote, but as to which he disclaims beneficial ownership. |
Changes in Control
On June 23, 2016, we entered into the Restated Merger Agreement with affiliates of Platinum Equities. We expect the Merger and the transactions contemplated thereby to close by the end of August 2016. If the Merger closes, we will experience a change in control. Pursuant to the Restated Merger Agreement, each outstanding share of our Common Stock (other than shares held by any person who properly asserts dissenters’ rights under California law) will be converted into the right to receive an amount in cash equal to $15.50 per share. Our existing shareholders will no longer have an equity ownership in our company and will no longer participate in our future earnings or growth. After the closing of the Merger, affiliates of Platinum Equity will own all of our Common Stock.
Securities Authorized for Issuance Under Equity Compensation Plans.
The following table provides information as of May 31, 2016 with respect to shares of our Common Stock that may be issued under our 2005 Equity Incentive Plan, as amended and restated, all of which were approved by our shareholders:
EQUITY COMPENSATION PLAN INFORMATION
Number of shares of Common Stock to be issued upon exercise of outstanding options, warrants and rights (a) | Weighted-average exercise price of outstanding options, warrants and rights (b) | Number of shares of Common Stock remaining available for future issuance under equity compensation plans (excluding shares reflected in column (a)) (c) | ||
— | $— | 238,720 | ||
53
Item 13. Certain Relationships and Related Transactions, and Director Independence.
TRANSACTIONS WITH RELATED PERSONS
Mr. Daniel Greenberg, our Chief Executive Officer in fiscal 2016, personally rents a total of 975 square feet of space in our buildings located at 6060 Sepulveda Boulevard, Van Nuys, California 91411-2512 and 15387 Oxnard Street, Van Nuys, CA 91411-2506, at a rate of $438 per month.
Policies and Procedures for Review, Approval or Ratification of Transactions with Related Persons
In August 2008, our Board adopted a Related Party Transaction Policy which prescribes policies and procedures for review and approval of a “related party transaction.” The term “related party transaction” is defined as any transaction, arrangement or relationship or any series of similar transactions, arrangements or relationships (including any indebtedness or guarantee of indebtedness) in which:
• | the aggregate amount involved will or may be expected to exceed $120,000 in any fiscal year; |
• | we are a participant; and |
• | any related party has or will have a direct or indirect interest (other than solely as a result of being a director or a less than 10 percent beneficial owner of another entity). |
A “related party” is any person who, since the beginning of the last fiscal year for which we filed a Form 10-K and proxy statement (even if that person does not presently serve in that role), is or was:
• | an executive officer, director or nominee for election as a director; |
• | a beneficial owner of more than five percent of any class of our voting securities; |
• | an immediate family member of any of the persons named above, which means any child, stepchild, parent, stepparent, spouse, sibling, mother-in-law, father-in-law, son-in-law, daughter-in-law, brother-in-law, or sister-in-law of the director, executive officer, nominee or more than five percent beneficial owner, and any person (other than a tenant or employee) sharing the household of such director, executive officer, nominee or more than five percent beneficial owner; and |
• | a firm, corporation or other entity in which any of the persons named above is employed or is a general partner or principal or in a similar position. |
The Board has delegated to the Nominating Committee the responsibility of reviewing and approving related party transactions. The Nominating Committee either approves or disapproves of the entry into a related party transaction after reviewing the material facts of that related party transaction and taking into account such factors as the Nominating Committee deems appropriate. Approval of each related party transaction is given in advance, unless that is not practical, in which case ratification must be promptly sought from the Nominating Committee. Related party transactions that are ongoing are subject to ongoing review by the Nominating Committee to determine whether it is in our best interest and our shareholders’ best interest to continue, modify or terminate the related party transaction. No director may participate in the approval of a related party transaction with respect to which he or she is a related party.
Corporate Giving Program
The Board established a charitable giving program beginning in fiscal 2005. In fiscal 2016, we donated $98,975 under this program. Mr. Daniel Greenberg, our Chief Executive Officer in fiscal 2016, who administered the program with the oversight of our Nominating Committee, serves on the board of trustees of a private university and a public charity to which we made donations.
54
Item 14. Principal Accountant Fees and Services.
Independent Auditors’ Fees and Services
The following table presents fees for professional services rendered by D&T for fiscal 2016 and 2015:
Fiscal 2016 | Fiscal 2015 | |||||||
Audit fees 1 | $ | 866,273 | $ | 1,244,917 | ||||
Audit-related fees 2 | — | — | ||||||
Tax fees 3 | 23,700 | 22,575 | ||||||
All other fees | — | — | ||||||
Total | $ | 889,973 | $ | 1,267,492 | ||||
1 | Consists of fees for professional services rendered for the audit of our annual financial statements and review of our annual report on Form 10-K and for reviews of the financial statements included in our quarterly reports on Form 10-Q for the first three quarters of fiscal 2016 and 2015. |
2 | Consists of fees for assurance services that are reasonably related to performance of audit or review of our financial statements. |
3 | Consists of professional services rendered by D&T for tax compliance, tax advice and tax planning, which are aggregate fees billed by D&T for tax services rendered to us, other than those described above under “Audit Fees.” |
Approval by Audit Committee
Prior to engaging our independent auditors to audit the financial statements of the company, our Audit Committee approves such engagement based on its judgment of the independence and effectiveness of our independent auditors. Our Audit Committee pre-approves all non-audit services performed by our independent auditors. In pre-approving non-audit services, our Audit Committee considers whether the provision of non-audit services, if any, by our independent auditors is compatible with maintaining our independent auditors’ independence. In fiscal 2016 and 2015, our Audit Committee pre-approved all non-audit services provided by our independent auditors. Our Audit Committee will not approve any of the prohibited services listed on Appendix A to its charter, and, in making a business judgment about particular non-audit services, our Audit Committee will consider the guidelines contained in Appendix A to its charter. Our Audit Committee considered and determined that the provision of non-audit services by D&T was compatible with maintaining the independent auditors’ independence.
55
AUDIT COMMITTEE REPORT
The information contained in this Audit Committee Report shall not be deemed incorporated by reference in any filing under the Securities Act of 1933 or the Securities Exchange Act of 1934, whether made before or after the date hereof and irrespective of any general incorporation language in any such filing (except to the extent that we specifically incorporate this information by reference), and shall not otherwise be deemed “soliciting material” or “filed” with the SEC or subject to Regulation 14A or 14C, or to the liabilities of Section 18 of the Securities Exchange Act of 1934 (except to the extent that we specifically incorporate this information by reference).
Although the Audit Committee oversees our financial reporting process on behalf of our Board consistent with the Audit Committee’s written charter, management has the primary responsibility for preparation of our consolidated financial statements in accordance with generally accepted accounting principles and the reporting process, including disclosure controls and procedures and the system of internal control over financial reporting. Our independent registered public accounting firm is responsible for auditing the annual financial statements prepared by management.
The Audit Committee has reviewed and discussed with management and our independent registered public accounting firm, Deloitte & Touche LLP (“D&T”) our fiscal 2016 audited financial statements and management’s assessment of the effectiveness of our internal control over financial reporting as of May 31, 2016. Prior to the commencement of the audit, the Audit Committee discussed with our management and D&T the overall scope and plans for the audit. Subsequent to the audit and each of the quarterly reviews, the Audit Committee discussed with D&T, with and without management present, the results of their examinations or reviews, including a discussion of the quality, not just the acceptability, of the accounting principles, the reasonableness of specific judgments and the clarity of disclosures in the consolidated financial statements.
In addition, the Audit Committee discussed with D&T the matters required to be discussed by Statement on Auditing Standards No. 61, “Communication with Audit Committees” as amended by Statement on Auditing Standards No. 90, “Audit Committee Communications.” The Audit Committee has also received written representation from D&T required by applicable requirements of the Public Company Accounting Oversight Board regarding the independent accountant’s communications with the audit committee concerning independence. The Audit Committee discussed with D&T its independence from us and our management and considered the compatibility of non-audit services with the independent auditors’ independence.
Based upon the reviews and discussions referred to in the foregoing paragraphs, the Audit Committee recommended to our Board that the audited financial statements be included in our Annual Report on Form 10-K for fiscal 2016 filed with the Securities and Exchange Commission.
AUDIT COMMITTEE
Joseph J. Kearns, Chairman
Karen J. Curtin
James S. Pignatelli
56
PART IV
Item 15. Exhibits, Financial Statement Schedules.
The following statements are filed as part of this Annual Report on Form 10-K:
1. Financial Statements.
A listing of the Consolidated Financial Statements, related notes and Report of Independent Registered Public Accounting is set forth on page F-1 in this Annual Report on Form 10-K.
2. Financial Statement Schedules.
All schedules have been omitted since the required information is not present or is not present in amounts sufficient to require submission of a schedule, or because the information required is included in the financial statements or related notes.
3. Index to Exhibits.
Exhibit No. | Description of Document | Incorporation by Reference | ||
2.1 | Agreement and Plan of Merger dated May 27, 2016 among Elecor Intermediate Holding II Corporation, Elecor Merger Corporation and the Company | Incorporated by reference from the Registrant's Current Report on Form 8-K filed May 31, 2016. | ||
2.2 | Amended and Restated Agreement and Plan of Merger dated June 23, 2016 among Elecor Intermediate Holding II Corporation, Elecor Merger Corporation and the Company | Incorporated by reference from the Registrant's Current Report on Form 8-K filed June 23, 2016. | ||
3.1 | Restated Articles of Incorporation, filed October 3, 1984 | Incorporated by reference from Registrant’s Annual Report on Form 10-K for the fiscal year ended May 31, 2009. | ||
3.2 | Certificate of Amendment of Restated Articles of Incorporation, filed October 24, 1988 | Incorporated by reference from Registrant’s Annual Report on Form 10-K for the fiscal year ended May 31, 2009. | ||
3.3 | Certificate of Amendment of Restated Articles of Incorporation, filed October 15, 1997 | Incorporated by reference from Registrant’s Annual Report on Form 10-K for the fiscal year ended May 31, 1998. | ||
3.4 | Amended and Restated By-laws of Registrant, adopted July 10, 2014 | Incorporated by reference from Registrant’s Current Report on Form 8-K filed July 16, 2014. | ||
4.1 | Form of Common Stock Certificate | Incorporated by reference from Registrant’s Annual Report on Form 10-K for the fiscal year ended May 31, 2009. | ||
10.1* | Electro Rent Corporation Supplemental Executive Retirement Plan | Incorporated by reference from Registrant’s Annual Report on Form 10-K for the fiscal year ended May 31, 2009. | ||
10.2* | Executive Employment Agreement (Amended and Restated as of July 15, 1992) between Registrant and Daniel Greenberg | Incorporated by reference from Registrant’s Annual Report on Form 10-K for the fiscal year ended May 31, 2009. | ||
10.3* | Amendment No. 1 to Executive Employment Agreement (Amended and Restated as of July 15, 1992) between Registrant and Daniel Greenberg, dated October 12, 2001 | Incorporated by reference from Registrant’s Annual Report on Form 10-K for the fiscal year ended May 31, 2003. | ||
10.4* | Amendment No. 2 to the Executive Employment Agreement between Electro Rent Corporation and Daniel Greenberg dated August 13, 2012 | Incorporated by reference from Registrant’s Quarterly Report on Form 10-Q for the quarterly period ended August 31, 2012. | ||
57
Exhibit No. | Description of Document | Incorporation by Reference | ||
10.5* | Employment Agreement between Registrant and Steven Markheim, dated as of October 31, 2005 | Incorporated by reference from Registrant’s Current Report on Form 8-K filed November 1, 2005. | ||
10.6* | Amendment No. 1 to the Executive Employment Agreement between Electro Rent Corporation and Steven Markheim dated August 13, 2012 | Incorporated by reference from Registrant’s Quarterly Report on Form 10-Q for the quarterly period ended August 31, 2012. | ||
10.7* | Employment Agreement between Registrant and Craig R. Jones, dated as of October 31, 2005 | Incorporated by reference from Registrant’s Current Report on Form 8-K filed November 1, 2005. | ||
10.8* | Amendment No. 1 to the Executive Employment Agreement between Electro Rent Corporation and Craig Jones dated August 13, 2012 | Incorporated by reference from Registrant’s Quarterly Report on Form 10-Q for the quarterly period ended August 31, 2012. | ||
10.9* | Separation Agreement and Release, dated August 31, 2015, by and between Electro Rent Corporation and Craig Jones. | Incorporated by reference from the Registrant's Current Report on Form 8-K filed December 3, 2015. | ||
10.10* | Consulting Agreement, dated August 31, 2015, by and between Electro Rent Corporation and Craig Jones. | Incorporated by reference from the Registrant's Current Report on Form 8-K filed December 3, 2015. | ||
10.11* | Retention Agreement, dated February 1, 2015, by and between Electro Rent Corporation and Allen Sciarillo | Filed herewith. | ||
10.12* | 2005 Equity Incentive Plan | Incorporated by reference from Registrant’s Registration Statement on Form S-8 filed December 20, 2005 (File No. 333-130487). | ||
10.13* | Amendment No. 1 to 2005 Equity Incentive Plan | Incorporated by reference from Registrant’s Quarterly Report on Form 10-Q for the quarterly period ended August 31, 2012. | ||
10.14* | Form of Stock Option Agreement (2005 Plan) | Incorporated by reference from Registrant’s Registration Statement on Form S-8 filed December 20, 2005 (File No. 333-130487). | ||
10.15* | Form of Stock Unit Award Agreement (Employee) (2005 Plan) | Incorporated by reference from Registrant’s Current Report on Form 8-K filed July 21, 2009. | ||
10.16* | Form of Stock Unit Award Agreement (Employee) (2005 Plan) (new form of agreement adopted October 11, 2014) | Incorporated by reference from Registrant’s Annual Report on Form 10-K for the fiscal year ended May 31, 2014. | ||
10.17* | Amendment No. 1 to Form of Stock Unit Award Agreement (Employee) (2005 Plan) | Incorporated by reference from Registrant’s Annual Report on Form 10-K for the fiscal year ended May 31, 2014. | ||
10.18* | Form of Stock Unit Award Agreement (Director) (2005 Plan) | Incorporated by reference from Registrant’s Annual Report on Form 10-K for the fiscal year ended May 31, 2009. | ||
10.19* | Form of Stock Unit Award Agreement (Director) (2005 Plan) (new form of agreement adopted October 11, 2014) | Incorporated by reference from Registrant’s Annual Report on Form 10-K for the fiscal year ended May 31, 2014. | ||
10.20* | Amendment No. 1 to Form of Stock Unit Award Agreement (Director) (2005 Plan) | Incorporated by reference from Registrant’s Annual Report on Form 10-K for the fiscal year ended May 31, 2014. | ||
58
Exhibit No. | Description of Document | Incorporation by Reference | ||
10.21* | Form of Indemnification Agreement | Incorporated by reference from Registrant’s Annual Report on Form 10-K for the fiscal year ended May 31, 2009. | ||
10.22 | Credit Agreement between Electro Rent Corporation (the “Company”) and J.P. Morgan Chase Bank, National Association, as administrative agent, J.P. Morgan Securities LLC, as sole bookrunner and sole lead arranger, and the lenders party thereto, dated as of November 19, 2013. | Incorporated by reference from the Registrant’s Current Report on Form 8-K filed on November 25, 2013. | ||
10.23 | Amendment Number One dated as of November 27, 2015 to Credit Agreement by and among Electro Rent Corporation, JPMorgan Chase Bank, National Association, as administrative agent, J.P. Morgan Securities LLC, as sole bookrunner and sole lead arranger, and the lenders party thereto, dated as of November 19, 2013. | Incorporated by reference from the Registrant's Current Report on Form 8-K filed December 12, 2015. | ||
10.24# | EMG Authorized Technology Partner Program Agreement / Agreement No. ANT76 dated as of May 29, 2014 by and between Electro Rent Corporation and Keysight Technologies, Inc. | Incorporated by reference from Registrant’s Annual Report on Form 10-K for the fiscal year ended May 31, 2014. | ||
10.25 | Amendment No. 1 to EMG Authorized Technology Partner Program Agreement / Agreement No. ANT76 dated as of May 29, 2014 | Incorporated by reference from Registrant’s Annual Report on Form 10-K for the fiscal year ended May 31, 2014. | ||
10.26# | Amendment No. 2 to EMG Authorized Technology Partner Program Agreement / Agreement No. ANT76 dated as of August 18, 2014 | Incorporated by reference from Registrant’s Quarterly Report on Form 10-Q for the quarterly period ended August 31, 2014. | ||
10.27# | Amendment No. 3 to EMG Authorized Technology Partner Program Agreement / Agreement No. ANT76 dated as of September 17, 2014 | Incorporated by reference from Registrant’s Quarterly Report on Form 10-Q for the quarterly period ended August 31, 2014. | ||
10.28# | Amendment No. 4 to EMG Authorized Technology Partner Program Agreement / Agreement No. ANT76 effective as of January 10, 2015 | Incorporated by reference from Registrant’s Quarterly Report on Form 10-Q for the quarterly period ended November 30, 2014. | ||
10.29# | Amendment No. 5 to EMG Authorized Technology Partner Program Agreement / Agreement No. ANT76 effective as of November 1, 2014 | Incorporated by reference from Registrant’s Quarterly Report on Form 10-Q for the quarterly period ended November 30, 2014. | ||
10.30# | Amendment No. 6 to EMG Authorized Technology Partner Program Agreement / Agreement No. ANT76 effective as of November 1, 2014 | Incorporated by reference from Registrant’s Quarterly Report on Form 10-Q for the quarterly period ended November 30, 2014. | ||
10.31# | Amendment No. 7 to EMG Authorized Technology Partner Program Agreement / Agreement No. ANT76 effective as of November 1, 2014 | Incorporated by reference from Registrant’s Quarterly Report on Form 10-Q for the quarterly period ended February 28, 2015. | ||
10.32# | Amendment No. 8 to EMG Authorized Technology Partner Program Agreement / Agreement No. ANT76 effective as of March 30, 2015 | Incorporated by reference from Registrant’s Quarterly Report on Form 10-Q for the quarterly period ended February 28, 2015. | ||
10.33# | Amendment No. 9 to EMG Authorized Technology Partner Program Agreement / Agreement No. ANT76 effective as of April 10, 2015 | Filed herewith. | ||
59
Exhibit No. | Description of Document | Incorporation by Reference | ||
10.34# | Amendment No. 10 to EMG Authorized Technology Partner Program Agreement / Agreement No. ANT76 effective as of June 2, 2015 | Filed herewith. | ||
14 | Code of Business Ethics and Conduct | Incorporated by reference from the Registrant’s Current Report on Form 8-K filed on July 16, 2014. | ||
21 | Subsidiaries of the Registrant. • ER International, Inc., a Delaware corporation • Electro Rent Asia, Inc., a California corporation • Electro Rent (Beijing) Test and Measurement Equipment Rental Co., Ltd., a Chinese wholly foreign-owned enterprise • Electro Rent Europe NV, a Belgium corporation • Electro Rent, LLC, a Delaware limited liability company | Filed herewith. | ||
23 | Consent of Deloitte & Touche LLP, the Company’s independent registered public accounting firm | Filed herewith. | ||
31.1 | Rule 13a-14(a)/15d-14(a) Certification of Principal Executive Officer | Filed herewith. | ||
31.2 | Rule 13a-14(a)/15d-14(a) Certification of Principal Financial Officer | Filed herewith. | ||
32.1** | Section 1350 Certification by Principal Executive Officer | Filed herewith. | ||
32.2** | Section 1350 Certification by Principal Financial Officer | Filed herewith. | ||
101.INS*** | XBRL Instance Document. | |||
101.SCH*** | XBRL Taxonomy Extension Schema Document. | |||
101.CAL*** | XBRL Taxonomy Extension Calculation Linkbase Document. | |||
101.DEF*** | XBRL Taxonomy Extension Definition Linkbase Document. | |||
101.LAB*** | XBRL Taxonomy Label Linkbase Document. | |||
101.PRE*** | XBRL Taxonomy Extension Presentation Linkbase Document. | |||
60
# | The Company has requested confidential treatment for portions of this agreement. Accordingly, certain portions of this agreement have been omitted in the version filed with this report and such confidential portions have been filed with the Securities and Exchange Commission. |
* | Management contract or compensatory plan or arrangement. |
** | This certification is being furnished solely to accompany this report pursuant to 18 U.S.C. 1350, and is not being filed for purposes of Section 18 of the Securities Exchange Act of 1934 and is not to be incorporated by reference into any filing of the registrant, whether made before or after the date hereof, regardless of any general incorporation language in such filing. |
*** | Pursuant to Rule 406T of Regulation S-T, the Interactive Data Files on Exhibit 101 hereto are deemed not filed or part of a registration statement or prospectus for purposes of Sections 11 or 12 of the Securities Act of 1933, are deemed not filed for purposes of Section 18 of the Securities Exchange Act of 1934, as amended, and otherwise are not subject to liability under those sections. |
61
SIGNATURES
Pursuant to the requirements of Sections 13 or 15(d) of the Securities Exchange Act of 1934, the registrant has duly caused this report to be signed on its behalf by the undersigned, thereunto duly authorized.
Electro Rent Corporation | |||||||
Dated: | August 9, 2016 | By | /s/ Steve Markheim | ||||
Steve Markheim | |||||||
President and Chief Executive Officer | |||||||
Pursuant to the requirements of the Securities Exchange Act of 1934, this report has been signed below by the following persons on behalf of the registrant and in the capacities and on the dates indicated.
SIGNATURE | TITLE | DATE | ||
/s/ Allen Sciarillo | Vice President and Chief Financial Officer | August 9, 2016 | ||
Allen Sciarillo | (Principal Financial and Accounting Officer) | |||
/s/ Nancy Y. Bekavac | Director | August 9, 2016 | ||
Nancy Y. Bekavac | ||||
/s/ Karen J. Curtin | Chairman of the Board | August 9, 2016 | ||
Karen J. Curtin | ||||
/s/ Daniel Greenberg | Director | August 9, 2016 | ||
Daniel Greenberg | ||||
/s/ Theodore E. Guth | Director | August 9, 2016 | ||
Theodore E. Guth | ||||
/s/ Joseph J. Kearns | Director | August 9, 2016 | ||
Joseph J. Kearns | ||||
/s/ James S. Pignatelli | Director | August 9, 2016 | ||
James S. Pignatelli | ||||
62
INDEX TO CONSOLIDATED FINANCIAL STATEMENTS
May 31, 2016
Page Number | ||||
1. | Financial Statements | |||
F- 1
REPORT OF INDEPENDENT REGISTERED PUBLIC ACCOUNTING FIRM
To the Board of Directors and Shareholders of
Electro Rent Corporation
Van Nuys, California
We have audited the accompanying consolidated balance sheets of Electro Rent Corporation and subsidiaries (the “Company”) as of May 31, 2016 and 2015, and the related consolidated statements of operations, shareholders' equity, and cash flows for each of the three years in the period ended May 31, 2016. These financial statements are the responsibility of the Company's management. Our responsibility is to express an opinion on these financial statements based on our audits.
We conducted our audits in accordance with the standards of the Public Company Accounting Oversight Board (United States). Those standards require that we plan and perform the audit to obtain reasonable assurance about whether the financial statements are free of material misstatement. An audit includes examining, on a test basis, evidence supporting the amounts and disclosures in the financial statements. An audit also includes assessing the accounting principles used and significant estimates made by management, as well as evaluating the overall financial statement presentation. We believe that our audits provide a reasonable basis for our opinion.
In our opinion, such consolidated financial statements present fairly, in all material respects, the financial position of the Company at May 31, 2016 and 2015, and the results of its operations and its cash flows for each of the three years in the period ended May 31, 2016, in conformity with accounting principles generally accepted in the United States of America.
We have also audited, in accordance with the standards of the Public Company Accounting Oversight Board (United States), the Company's internal control over financial reporting as of May 31, 2016, based on the criteria established in Internal Control - Integrated Framework (2013) issued by the Committee of Sponsoring Organizations of the Treadway Commission and our report dated August 9, 2016 expressed an unqualified opinion on the Company's internal control over financial reporting.
/s/ DELOITTE & TOUCHE LLP
Los Angeles, California
August 9, 2016
F- 2
ELECTRO RENT 2016 ANNUAL REPORT
Consolidated Statements of Operations
Year Ended May 31, (in thousands, except per share information) | 2016 | 2015 | 2014 | ||||||||
Revenues: | |||||||||||
Rentals and leases | $ | 123,785 | $ | 129,255 | $ | 137,417 | |||||
Sales of equipment and other revenues | 51,548 | 109,074 | 103,720 | ||||||||
Total revenues | 175,333 | 238,329 | 241,137 | ||||||||
Operating expenses: | |||||||||||
Depreciation of rental and lease equipment | 55,931 | 56,445 | 57,034 | ||||||||
Costs of rentals and leases, excluding depreciation | 17,466 | 18,086 | 18,292 | ||||||||
Costs of sales of equipment and other revenues | 33,699 | 81,557 | 74,752 | ||||||||
Selling, general and administrative expenses | 60,154 | 59,313 | 58,920 | ||||||||
Total operating expenses | 167,250 | 215,401 | 208,998 | ||||||||
Operating profit | 8,083 | 22,928 | 32,139 | ||||||||
Interest income/(expense), net | (329 | ) | 332 | 387 | |||||||
Other income | 33 | 1,390 | — | ||||||||
Income before income taxes | 7,787 | 24,650 | 32,526 | ||||||||
Income tax provision | 3,003 | 9,218 | 12,118 | ||||||||
Net income | $ | 4,784 | $ | 15,432 | $ | 20,408 | |||||
Earnings per share: | |||||||||||
Basic | $ | 0.20 | $ | 0.63 | $ | 0.84 | |||||
Diluted | $ | 0.20 | $ | 0.63 | $ | 0.84 | |||||
Shares used in per share calculation: | |||||||||||
Basic | 24,414 | 24,360 | 24,325 | ||||||||
Diluted | 24,429 | 24,378 | 24,357 | ||||||||
Cash dividend declared per share | $ | 0.50 | $ | 0.80 | $ | 0.80 | |||||
The accompanying notes are an integral part of these consolidated financial statements.
F- 3
ELECTRO RENT 2016 ANNUAL REPORT
Consolidated Balance Sheets
As of May 31, (in thousands, except share information) | 2016 | 2015 | |||||
Assets | |||||||
Cash | $ | 30,065 | $ | 4,064 | |||
Accounts receivable, net of allowance for doubtful accounts of $464 and $604 | 22,266 | 33,863 | |||||
Rental and lease equipment, net of accumulated depreciation of $235,387 and $241,116 | 199,525 | 231,671 | |||||
Other property, net of accumulated depreciation and amortization of $17,653 and $16,749 | 12,389 | 13,120 | |||||
Goodwill | 3,109 | 3,109 | |||||
Intangibles, net of amortization of $1,879 and $1,761 | 626 | 744 | |||||
Other assets | 16,597 | 13,743 | |||||
$ | 284,577 | $ | 300,314 | ||||
Liabilities and Shareholders’ Equity | |||||||
Liabilities: | |||||||
Bank borrowings | $ | — | $ | 2,387 | |||
Accounts payable | 5,195 | 8,234 | |||||
Accrued expenses | 16,954 | 18,487 | |||||
Deferred revenue | 5,153 | 5,576 | |||||
Deferred tax liability | 35,776 | 37,652 | |||||
Total liabilities | 63,078 | 72,336 | |||||
Commitments and contingencies (Note 10) | |||||||
Shareholders’ equity: | |||||||
Preferred stock, $1 par—shares authorized 1,000,000; none issued | — | — | |||||
Common stock, no par—shares authorized 40,000,000; issued and outstanding 2016—24,196,634; 2015—24,108,176 | 41,483 | 40,440 | |||||
Retained earnings | 180,016 | 187,538 | |||||
Total shareholders’ equity | 221,499 | 227,978 | |||||
$ | 284,577 | $ | 300,314 | ||||
The accompanying notes are an integral part of these consolidated financial statements.
F- 4
ELECTRO RENT 2016 ANNUAL REPORT
Consolidated Statements of Shareholders’ Equity
Common Stock | Total | |||||||||||||
Three years ended May 31, (in thousands) | Number of Shares | Amount | Retained Earnings | Shareholders’ Equity | ||||||||||
Balance, June 1, 2013 | 23,996 | $ | 37,724 | $ | 190,825 | $ | 228,549 | |||||||
Issuance of shares under equity plan, net of shares withheld for employee taxes | 12 | — | — | — | ||||||||||
Excess tax benefit for share-based compensation | — | 183 | — | 183 | ||||||||||
Non-cash stock compensation expense | — | 1,356 | — | 1,356 | ||||||||||
Dividends declared | — | — | (19,527 | ) | (19,527 | ) | ||||||||
Minimum tax withholdings on share-based compensation | — | (11 | ) | — | (11 | ) | ||||||||
Net income for the year ended May 31, 2014 | — | — | 20,408 | 20,408 | ||||||||||
Balance, May 31, 2014 | 24,008 | 39,252 | 191,706 | 230,958 | ||||||||||
Issuance of shares under equity plan, net of shares withheld for employee taxes | 100 | — | — | — | ||||||||||
Excess tax benefit for share-based compensation | — | 358 | — | 358 | ||||||||||
Non-cash stock compensation expense | — | 1,292 | — | 1,292 | ||||||||||
Dividends declared | — | — | (19,600 | ) | (19,600 | ) | ||||||||
Minimum tax withholdings on share-based compensation | — | (462 | ) | — | (462 | ) | ||||||||
Net income for the year ended May 31, 2015 | — | — | 15,432 | 15,432 | ||||||||||
Balance, May 31, 2015 | 24,108 | 40,440 | 187,538 | 227,978 | ||||||||||
Issuance of shares under equity plan, net of shares withheld for employee taxes | 88 | — | — | — | ||||||||||
Excess tax shortfall for share-based compensation | — | (30 | ) | — | (30 | ) | ||||||||
Non-cash stock compensation expense | — | 1,371 | — | 1,371 | ||||||||||
Dividends declared | — | — | (12,306 | ) | (12,306 | ) | ||||||||
Minimum tax withholdings on share-based compensation | — | (298 | ) | — | (298 | ) | ||||||||
Net income for the year ended May 31, 2016 | — | — | 4,784 | 4,784 | ||||||||||
Balance, May 31, 2016 | 24,196 | $ | 41,483 | $ | 180,016 | $ | 221,499 | |||||||
The accompanying notes are an integral part of these consolidated financial statements.
F- 5
ELECTRO RENT 2016 ANNUAL REPORT
Consolidated Statements of Cash Flows
Year Ended May 31, (in thousands) | 2016 | 2015 | 2014 | ||||||||
Cash flows from operating activities: | |||||||||||
Net income | $ | 4,784 | $ | 15,432 | $ | 20,408 | |||||
Adjustments to reconcile net income to net cash provided by operating activities: | |||||||||||
Depreciation and amortization | 57,164 | 57,562 | 58,286 | ||||||||
Rental and lease equipment impairment | 443 | — | — | ||||||||
Remeasurement loss on foreign currency | 343 | 5 | 152 | ||||||||
Provision for losses on accounts receivable | 679 | 591 | 860 | ||||||||
Gain on sale of rental and lease equipment | (11,973 | ) | (13,622 | ) | (14,195 | ) | |||||
Stock compensation expense | 1,372 | 1,292 | 1,356 | ||||||||
Excess tax benefit for share-based compensation | (100 | ) | (358 | ) | (183 | ) | |||||
Deferred income taxes | (1,876 | ) | (4,160 | ) | (7,928 | ) | |||||
Change in operating assets and liabilities: | |||||||||||
Accounts receivable | 9,137 | (503 | ) | (2,366 | ) | ||||||
Other assets | (4,250 | ) | (7,532 | ) | (6,568 | ) | |||||
Accounts payable | (1,463 | ) | 1,195 | 260 | |||||||
Accrued expenses | (1,491 | ) | 4,586 | (1,125 | ) | ||||||
Deferred revenue | (414 | ) | (1,869 | ) | 229 | ||||||
Net cash provided by operating activities | 52,355 | 52,619 | 49,186 | ||||||||
Cash flows from investing activities: | |||||||||||
Proceeds from sales of rental and lease equipment | 33,066 | 34,261 | 35,224 | ||||||||
Payments for purchase of rental and lease equipment | (44,071 | ) | (70,954 | ) | (58,678 | ) | |||||
Payments for purchase of other property | (384 | ) | (986 | ) | (384 | ) | |||||
Net cash used in investing activities | (11,389 | ) | (37,679 | ) | (23,838 | ) | |||||
Cash flows from financing activities: | |||||||||||
Borrowings under bank lines of credit | 11,211 | 45,702 | 56,018 | ||||||||
Payments under bank lines of credit | (13,598 | ) | (43,315 | ) | (66,018 | ) | |||||
Minimum tax withholdings on share-based compensation | (298 | ) | (462 | ) | (11 | ) | |||||
Excess tax benefit for share-based compensation | 100 | 358 | 183 | ||||||||
Payment of dividends | (12,328 | ) | (19,656 | ) | (19,657 | ) | |||||
Net cash used in financing activities | (14,913 | ) | (17,373 | ) | (29,485 | ) | |||||
Effect of exchange rate changes on cash | (52 | ) | 551 | (319 | ) | ||||||
Net increase (decrease) in cash and cash equivalents | 26,001 | (1,882 | ) | (4,456 | ) | ||||||
Cash and cash equivalents at beginning of year | 4,064 | 5,946 | 10,402 | ||||||||
Cash and cash equivalents at end of year | $ | 30,065 | $ | 4,064 | $ | 5,946 | |||||
Interest paid, during the period | $ | 69 | $ | 31 | $ | 106 | |||||
Income taxes paid, during the period | $ | 7,883 | $ | 8,063 | $ | 23,778 | |||||
Dividends accrued during the period, not yet paid | $ | 133 | $ | 155 | $ | 211 | |||||
Rental equipment acquisitions, not yet paid | $ | 2,854 | $ | 4,430 | $ | 4,479 | |||||
Used equipment sales in accounts receivable and other assets, not yet collected | $ | 4,961 | $ | 7,426 | $ | 9,050 | |||||
Transfers from other assets to rental and lease equipment | $ | 466 | $ | 14,338 | $ | 4,535 | |||||
The accompanying notes are an integral part of these consolidated financial statements.
F- 6
NOTES TO CONSOLIDATED FINANCIAL STATEMENTS
FOR THE YEARS ENDED MAY 31, 2016, 2015 AND 2014
(in thousands, except per share amounts)
Note 1: Summary of Significant Accounting Policies
Basis of Presentation: The consolidated financial statements include Electro Rent Corporation and its wholly owned subsidiaries, Electro Rent, LLC, ER International, Inc., Electro Rent Europe NV, Electro Rent Asia, Inc. and Electro Rent (Beijing) Test and Measurement Equipment Rental Co., Ltd. (collectively “we”, “us”, or “our” hereafter). All intercompany balances and transactions have been eliminated in consolidation.
Business and Organization: We are a global organization devoted to the rental, lease and sale of new and used electronic test and measurement (“T&M”) equipment. We purchase T&M equipment from leading manufacturers such as Keysight Technologies, Inc. (formerly Agilent Technologies, Inc., “Keysight”), Anritsu, Inc. ("Anritsu"), Rohde & Schwarz Gmbh & Co. KG ("Rohde & Schwarz") and Tektronix Inc. Our customers rent, lease and buy our T&M equipment, and use that equipment primarily in the aerospace and defense, telecommunications, electronics, industrial and semiconductor markets.
In addition, we purchase personal computers from manufacturers including Dell, HP, IBM, Toshiba and Apple for our Data Products ("DP") division.
Our reseller agreement with Keysight was not renewed after its May 31, 2015 expiration date. The expiration of the Keysight reseller agreement materially affected our revenues and net profits.
Use of Estimates: The preparation of financial statements in conformity with accounting principles generally accepted in the United States of America requires us to make estimates and assumptions that affect the reported amounts of assets and liabilities as well as the disclosures of contingent assets and liabilities as of the date of these financial statements and the reported amounts of revenues and expenses during the reporting period. On a regular basis, we review these estimates including those related to asset lives and depreciation methods, impairment of long-lived assets, including rental and lease equipment, goodwill and intangibles, allowance for doubtful accounts, income taxes, contingencies and litigation. These estimates are based on our evaluation of current business and economic conditions, historical experience and on various other assumptions believed to be reasonable under the circumstances. Actual results may differ from these estimates under different assumptions or conditions. We believe, however, that our estimates, including those for the above-listed items, are reasonable.
Revenue Recognition: We generate revenues primarily through the rental and leasing of T&M and DP equipment and through the sale of new and used equipment. Rental revenues comprise short term agreements that can be daily, weekly or monthly. Rental revenues are recognized in the month they are due on the accrual basis of accounting. Our operating lease agreements have varying terms, typically one to three years. Upon lease termination, customers have the option to renew the lease term, purchase the equipment at fair market value, or continue to rent on a month-to-month basis. Our operating leases do not provide for contingent rentals. Revenues related to operating leases are recognized on a straight-line basis over the term of the lease. Negotiated lease early-termination charges are recognized upon receipt. Rentals and leases are primarily billed to customers in advance, and unearned billings are recorded as deferred revenue.
We enter into finance leases as lessor for some of our equipment. Our finance lease agreements contain bargain purchase options and are accounted for as sale-type leases. Revenues from finance leases, which are recorded at the present value of the aggregate future lease payments, net of unearned interest, are included in sales of equipment and other revenues in our consolidated statements of operations. Unearned interest is recognized over the life of the finance lease term using the effective interest method. Our finance lease terms vary, and are typically one to three years. The net investment in finance leases, which represents the receivables due from lessees, net of unearned interest, is included in other assets in our consolidated balance sheets. Historically, we have not required security deposits based on our assessed credit risk within our customer bases.
Initial direct costs for operating and finance leases are insignificant.
Sales of new equipment through our resale channel are recognized in the period in which the equipment is delivered and risk of loss passes to the customer, while sales of used equipment from our rental and lease equipment pool are recognized in the period in which the equipment is shipped and risk of loss passes to the customer. In the case of equipment sold to customers that is already on rent or lease to the same party, revenue is recognized at the agreed-upon date when the rent or lease term ends and risk of loss passes to the customer.
The amount of revenue recognized for sales of new equipment depends on whether we sell as principal or as agent for the original equipment manufacturer. Prior to May 31, 2015, our sales of new equipment were derived primarily from the reseller agreement with Keysight Technologies, Inc. In fiscal 2016, we entered into reseller agreements with other T&M equipment
F- 7
manufacturers, including Anritsu and Rohde & Schwarz. Under the terms of these agreements we act as the principal with respect to sales of new equipment, based on several factors, including:
(1) We act as the primary obligor by working directly with our customers to define their needs, providing them with options to satisfy such needs, contracting directly with the customer, and, to the extent required, providing customers with instruction on the use of the product and additional technical support once the product is received by the customer. The original equipment manufacturer is not a party to our customer sales agreements, nor is it referenced in the agreements, and therefore has no obligation to our customers with the exception of the manufacturer’s standard warranty on the product;
(2) We bear back-end risk of inventory loss with respect to any product return from the customer as the original equipment manufacturer is not required to accept returns of equipment from us. Under the reseller agreement with Keysight, we also bore front-end risk of inventory loss in those cases where we acquired products for resale into our equipment pool prior to shipment to customers;
(3) We have full discretion in setting pricing terms with our customers and negotiate all such terms ourselves; and
(4) We assume all credit risk.
In situations where we act as principal, the gross sales of new equipment are recorded in sales of equipment and other revenues, while the related equipment costs, including the purchase price from the original equipment manufacturer, are recorded in costs of sales of equipment and other revenues in our consolidated statements of operations.
In situations where we act as an agent for the original equipment manufacturer, we recognize revenue only on the commissions that we receive, which are recorded in other revenue within the sales of equipment and other revenues in our consolidated statement of operations.
Other revenues, consisting primarily of billings to customers for delivery and repairs, are recognized in the period in which the respective services are performed.
Operating Expenses: Costs of rentals and leases, excluding depreciation, primarily include labor related costs of our operations personnel, supplies, repairs, insurance and warehousing costs associated with our rental and lease equipment, relating to our rental and lease revenues.
Costs of sales of equipment and other revenues primarily include the cost of new equipment and the carrying value of used equipment sold.
Selling, general and administrative expenses include sales and advertising costs, payroll and related benefit costs, insurance expenses, property taxes on our property and rental and lease equipment, legal and professional fees, and administrative overhead. Advertising costs are expensed as incurred. Total advertising expenses were $1,133, $982 and $982 for fiscal 2016, 2015 and 2014, respectively. Selling, general and administrative expenses also include shipping and handling costs of $3,634, $3,953 and $3,977 for fiscal 2016, 2015 and 2014, respectively.
Rental and Lease Equipment and Other Property: Assets are generally stated at cost, less accumulated depreciation. Upon retirement or disposal of assets, the cost and the related accumulated depreciation are eliminated from the accounts and any gain or loss is recognized. We depreciate our buildings over 31.5 years, building improvements over useful life, furniture and other equipment over three to ten years, and leasehold improvements over the shorter of the lease term, typically three to five years, or useful life. Each is depreciated on a straight-line basis. Depreciation of rental and lease equipment is provided over the estimated useful lives of the respective assets. We depreciated $407,807 and $440,495 of equipment, at acquisition cost, at May 31, 2016 and 2015, respectively, using straight-line methods ranging from two to ten years, and $27,106 and $32,292 of equipment, at acquisition cost, at May 31, 2016 and 2015, respectively, using accelerated methods ranging from two to four years. We generally use straight-line methods for our T&M equipment, which we believe maintains its value consistently throughout the equipment’s useful life, and accelerated methods primarily for our DP equipment, which tends to depreciate faster due to frequent technological advancements. Depreciation methods and useful lives are periodically reviewed and revised, as deemed appropriate, including revisions to reflect shorter useful lives to more closely match depreciation expense with rental revenue for rental arrangements where the customer can acquire title through payment of all required rentals. Normal maintenance and repairs are expensed as incurred. Depreciation expense for rental and lease equipment was $55,931, $56,445 and $57,034 for fiscal 2016, 2015 and 2014, respectively. Rental and lease equipment at net book value was comprised of $194,618 of T&M equipment and $4,908 of DP equipment at May 31, 2016, and $225,222 of T&M equipment and $6,449 of DP equipment at May 31, 2015.
Income Taxes: We recognize a liability or asset for the deferred tax consequences of temporary differences between the tax basis of assets and liabilities and their reported amounts in the financial statements. These temporary differences will result in
F- 8
taxable or deductible amounts in future years when reported amounts of the assets or liabilities are recovered or settled. Deferred tax assets are periodically reviewed for recoverability.
We recognize the tax impact from an uncertain tax position only if it is more likely than not that the tax position will be sustained on examination by the taxing authorities, based on the technical merits of the position. The tax impact recognized in the financial statements from such a position is measured based on the largest benefit that has a greater than 50% likelihood of being realized upon ultimate resolution. We recognize interest, penalties and foreign currency gains and losses with respect to uncertain tax positions as components of our income tax provision. Accrued interest and penalties are included within accrued expenses in the consolidated balance sheet. Significant judgment is required in the identification of uncertain tax positions and in the estimation of penalties and interest on uncertain tax positions (see Note 5 for further discussion.)
Impairment of Long-Lived Assets: The carrying value of equipment held for rental and lease is assessed when circumstances indicate that the carrying amount of equipment may not be recoverable. Recoverability of equipment to be rented and leased is measured by a comparison of the carrying amount to the undiscounted future cash flows expected to be generated by the asset. If the current carrying value exceeds the estimated undiscounted cash flows, an impairment loss is recorded equal to the difference between the asset’s current carrying value and its fair value as described in FASB ASC Topics No. 360, Impairment and Disposal of Long-Lived Assets and No. 820, Fair Value Measurements and Disclosures. We determine the fair value based upon the projected net cash flows from model's rental and sale considering current market conditions. Based upon such periodic assessments, costs of rentals and leases included impairment charges of $443 related to our T&M rental and lease equipment during the year ended May 31, 2016. No impairments occurred during fiscal 2015 and 2014.
Goodwill: Goodwill, which represents the excess of purchase price over the fair value of net assets acquired is discussed further in Note 3. Pursuant to FASB ASC Topic No. 350, Intangibles – Goodwill and Other, goodwill is not amortized but tested annually for impairment, or on an interim basis if an event occurs or circumstances change that would reduce the fair value of a reporting unit below its carrying value. In connection with the annual impairment test for goodwill, we have elected the option to perform a qualitative assessment to determine whether it is more likely than not that the fair value of the reporting unit is less than its carrying amount. If we determine that it was more likely than not that the fair value of the reporting unit is less than its carrying amount, then we perform the impairment test. The impairment test involves a two-step process. The first step involves comparing the fair values of the applicable reporting units with their aggregate carrying values, including goodwill. We generally determine the fair value of our reporting units using the market approach methodology of valuation. If the carrying value of a reporting unit exceeds the reporting unit’s fair value, we perform the second step of the test to determine the amount of impairment loss. The second step involves measuring the impairment by comparing the implied fair value of the affected reporting unit’s goodwill with its carrying value. We completed the required impairment review at the end of fiscal 2016, 2015 and 2014 and concluded that there were no impairments.
Cash and Cash Equivalents: We consider highly liquid investments with maturities of three months or less at the date of purchase to be cash equivalents. We held no cash equivalents at May 31, 2016 and 2015 except for the money market funds that are part of our supplemental executive retirement plan (SERP) assets included in other assets.
Allowance for Doubtful Accounts: We maintain an allowance for doubtful accounts for estimated losses resulting from the inability of customers to make rental and lease payments. The estimated losses are based on historical collection experience in conjunction with an evaluation of the current status of the existing accounts. If the financial condition of our customers were to deteriorate, then additional allowances could be required that would reduce income. Conversely, if the financial condition of our customers were to improve or if legal remedies to collect past due amounts were more successful than expected, then the allowance for doubtful accounts may need to be reduced and income would be increased.
A roll forward of the allowance for doubtful accounts is as follows at May 31:
2016 | 2015 | 2014 | |||||||||
Beginning of year | $ | 604 | $ | 555 | $ | 457 | |||||
Provision for doubtful accounts | 679 | 591 | 860 | ||||||||
Write-offs | (819 | ) | (542 | ) | (762 | ) | |||||
End of year | $ | 464 | $ | 604 | $ | 555 | |||||
Other Assets: We include demonstration equipment used in connection with our resale activity, totaling $4,851 and $81 as of May 31, 2016 and 2015, respectively, in other assets for a period up to two years. Demonstration equipment is recorded at the lower of cost or estimated market value until the units are transferred to our rental and lease equipment pool. Once transferred to our rental and lease equipment pool, the equipment is depreciated over its remaining estimated useful life.
F- 9
Other assets consisted of the following at May 31:
2016 | 2015 | ||||||
Net investment in sales-type leases | $ | 3,581 | $ | 5,876 | |||
Supplemental executive retirement plan assets | 3,089 | 3,521 | |||||
Demonstration equipment | 4,851 | 81 | |||||
Income taxes receivable | 1,342 | — | |||||
Prepaid and other assets | 3,734 | 4,265 | |||||
$ | 16,597 | $ | 13,743 | ||||
Concentration of Credit Risk: Financial instruments that potentially expose us to concentration of credit risk primarily consist of trade accounts receivable. To mitigate the risk, we sell primarily on 30-day terms, perform credit evaluation procedures on each customer’s individual transactions and require security deposits or personal guarantees from our customers when significant credit risks are identified. Typically, most customers are large, established firms.
We purchase rental and lease equipment from numerous vendors. During fiscal 2016, 2015 and 2014, Keysight accounted for approximately 56.0%, 70.7% and 65.6%, respectively, of all new equipment purchases, including rental equipment and equipment purchased for resale. Anritsu equipment purchases during fiscal 2016 accounted for 12.3% of our new equipment purchases while Anritsu equipment purchases during fiscal 2015 and fiscal 2014 were below 10.0%. No other vendor accounted for more than 10.0% of such purchases.
Foreign Currency: The U.S. dollar has been determined to be the functional currency of all foreign subsidiaries. The assets and liabilities of our foreign subsidiaries are remeasured from their local currency to U.S. dollars at current or historic exchange rates, as appropriate. Revenues and expenses are remeasured from foreign currencies to U.S. dollars using historic or average monthly exchange rates, as appropriate, for the month in which the transaction occurred. Remeasurement gains and losses are included in selling, general and administrative expenses or income taxes, as appropriate. The assets, liabilities, revenues and expenses of our foreign subsidiaries are individually less than 10.0% of our respective consolidated amounts. The euro, British pound sterling, Canadian dollar and Chinese yuan are our primary foreign currencies. Net remeasurement gains and losses have not been significant.
We enter into forward contracts to hedge against unfavorable currency fluctuations in our monetary assets and liabilities in our European and Canadian operations. These contracts are designed to minimize the effect of fluctuations in foreign currencies. To qualify for hedge accounting, contracts must reduce the foreign currency exchange rate and interest rate risk otherwise inherent in the amount and duration of the hedged exposures and comply with established risk management policies. Our derivative instruments are not designated as hedging instruments and, therefore, are recorded at fair value as an asset or liability, and any changes in fair value are recorded in our consolidated statements of operations. We do not use derivative financial instruments for speculative trading purposes.
The fair value of our foreign exchange forward contracts in the consolidated balance sheets is shown in the table below:
Derivatives Not Designated as Hedging Instruments | Consolidated Balance Sheet Location | May 31, 2016 | May 31, 2015 | |||||||
Foreign exchange forward contracts | Accrued Expenses | $ | (6 | ) | $ | (16 | ) | |||
The table below provides data about the amount of fiscal 2016, 2015 and 2014 gains and losses recognized in income for derivative instruments not designated as hedging instruments:
Derivatives Not Designated as Hedging Instruments | Location of Gain/(Loss) Recognized in Income on Derivatives Not Designated as Hedging Instruments | Year ended May 31, | ||||||||||||
2016 | 2015 | 2014 | ||||||||||||
Foreign exchange forward contracts | Selling, general and administrative expenses | $ | 38 | $ | 1,210 | $ | (269 | ) | ||||||
Net Income Per Common and Common Equivalent Share: Basic earnings per share (“EPS”) is computed as net income divided by the weighted average number of shares of common stock outstanding and shares issuable for vested restricted stock units for the reported year, excluding the dilutive effects of any potentially anti-dilutive securities. Diluted EPS is computed as net income divided by the weighted average number of shares outstanding of common stock and common stock equivalents for the reported year. The dilutive effect of restricted stock units is computed using the treasury stock method.
F- 10
Share-Based Compensation: Share-based payments to employees are recognized in the consolidated financial statements as compensation expense over the period that an employee provides service in exchange for the award based on its fair value on the date of grant. Compensation expense resulting from restricted stock units is measured at fair value on the date of grant and is recognized in selling, general and administrative expenses over the vesting period (see Note 11 for further discussion).
Recent Accounting Pronouncements: In March 2016, the FASB issued ASU No. 2016-09, Compensation – Stock Compensation (Topic 718). Under the new guidance, all excess tax benefits and tax deficiencies will be recognized in the income statement as they occur. This will replace the current guidance, which requires tax benefits that exceed compensation cost (windfalls) to be recognized in equity. It will also eliminate the need to maintain a “windfall pool,” and will remove the requirement to delay recognizing a windfall until it reduces current taxes payable. The new guidance will also change the cash flow presentation of excess tax benefits, classifying them as operating inflows, consistent with other cash flows related to income taxes. The amendments in this guidance are effective for fiscal years beginning after December 15, 2016 and interim periods within those fiscal years. The Company is evaluating the impact of this new guidance on its consolidated financial statements.
In February 2016, the FASB issued guidance that will require lessees to put most leases on their balance sheets but recognize expenses in the income statement. For lessors, the standard will be similar to the current model but will be updated to align with certain changes to the lessee model. Lessors will continue to classify leases as operating, direct financing or sales-type leases. The standard is effective for fiscal years beginning after December 15, 2018, and interim periods within those fiscal years. Early adoption is permitted. The impact this guidance will have on the consolidated financial statements cannot be determined at this time.
In May 2014, the FASB and the International Accounting Standards Board ("IASB") issued guidance to establish a new, more robust framework for the recognition of revenue related to the transfer of goods and services to customers. This guidance is effective for reporting periods beginning after December 15, 2017, including interim reporting periods within that reporting period. The impact this guidance will have on the consolidated financial statements cannot be determined at this time.
Other Comprehensive Income: Comprehensive income is equivalent to net income for all periods presented.
Other Income: In fiscal 2015, we recognized other income from a $1,390 settlement received as one of the plaintiffs in a class action lawsuit involving the purchase of certain computer products.
Out-of-period Adjustment: In fiscal 2015, we identified $1,344 of previously recognized revenue which the Company was not entitled to recognize. We determined this adjustment to be immaterial to our current and previously filed financial statements. We have recorded this out-of-period adjustment as a reduction to sales of equipment and other revenues and an increase to accrued expenses.
Note 2: Fair Value Measurements
We measure certain financial assets and liabilities at fair value on a recurring basis, including supplemental executive retirement plan ("SERP") assets and liabilities, and foreign currency derivatives. The fair value of financial assets and liabilities can be determined based on three levels of inputs, of which the first two are considered observable and the last unobservable, that may be used to measure fair value, as follows:
Level 1 – Observable inputs, such as quoted prices in active markets for identical assets or liabilities;
Level 2 – Inputs, other than the quoted prices in active markets, that are observable either directly or through corroboration with observable market data; and
Level 3 – Unobservable inputs, for which there is little or no market data for the assets or liabilities, such as internally-developed valuation models.
F- 11
Our assets and liabilities measured at fair value on a recurring basis were determined as follows:
May 31, 2016 | |||||||||||||||
Quoted Prices in Active Markets for Identical Instruments (Level 1) | Significant Other Observable Inputs (Level 2) | Significant Unobservable Inputs (Level 3) | Total Balance | ||||||||||||
Assets | |||||||||||||||
SERP: | |||||||||||||||
Money market fund | $ | 182 | $ | — | $ | — | $ | 182 | |||||||
Mutual funds | 2,907 | — | — | 2,907 | |||||||||||
Total assets measured at fair value | $ | 3,089 | $ | — | $ | — | $ | 3,089 | |||||||
Liabilities | |||||||||||||||
SERP | $ | 3,089 | $ | — | $ | — | $ | 3,089 | |||||||
Foreign exchange forward contracts | — | 6 | — | 6 | |||||||||||
Total liabilities measured at fair value | $ | 3,089 | $ | 6 | $ | — | $ | 3,095 | |||||||
May 31, 2015 | |||||||||||||||
Quoted Prices in Active Markets for Identical Instruments (Level 1) | Significant Other Observable Inputs (Level 2) | Significant Unobservable Inputs (Level 3) | Total Balance | ||||||||||||
Assets | |||||||||||||||
SERP: | |||||||||||||||
Money market fund | $ | 166 | $ | — | $ | — | $ | 166 | |||||||
Mutual funds | 3,355 | — | — | 3,355 | |||||||||||
Total assets measured at fair value | $ | 3,521 | $ | — | $ | — | $ | 3,521 | |||||||
Liabilities | |||||||||||||||
SERP | $ | 3,521 | $ | — | $ | — | $ | 3,521 | |||||||
Foreign exchange forward contracts | — | 16 | — | 16 | |||||||||||
Total liabilities measured at fair value | $ | 3,521 | $ | 16 | $ | — | $ | 3,537 | |||||||
The fair value measures for our SERP money market funds and mutual funds, which we classify as trading securities, were derived from quoted market prices in active markets and are included in Level 1 inputs (see Note 12 for further discussion of our SERP assets and liabilities). Foreign currency forward contracts were valued based on observable market spot and forward rates as of our reporting date and are included in Level 2 inputs.
Note 3: Goodwill and Other Intangible Assets
Goodwill represents the excess of the purchase price over the fair value of the net tangible and identifiable intangible assets acquired in a business combination. Intangible assets resulting from the acquisitions of entities accounted for using the acquisition method of accounting are recorded at the estimated fair value of the assets acquired. Identifiable intangible assets consist of purchased customer relationships and trade names.
Our goodwill and intangibles at May 31, 2016 are the result of our acquisition of Equipment Management Technology, Inc. ("EMT") on August 24, 2011, Telogy LLC on March 31, 2010, and Rush Computer Rentals, Inc. on January 31, 2006.
F- 12
The changes in carrying amount of goodwill and other intangible assets for fiscal 2016 and 2015 were as follows:
Balance as of June 1, 2015 (net of amortization) | Additions | Amortization | Balance as of May 31, 2016 | ||||||||||||
Goodwill | $ | 3,109 | $ | — | $ | — | $ | 3,109 | |||||||
Trade name | 411 | — | — | 411 | |||||||||||
Customer relationships | 333 | — | (118 | ) | 215 | ||||||||||
$ | 3,853 | $ | — | $ | (118 | ) | $ | 3,735 | |||||||
Balance as of June 1, 2014 (net of amortization) | Additions | Amortization | Balance as of May 31, 2015 | ||||||||||||
Goodwill | $ | 3,109 | $ | — | $ | — | $ | 3,109 | |||||||
Trade name | 411 | — | — | 411 | |||||||||||
Customer relationships | 462 | — | (129 | ) | 333 | ||||||||||
$ | 3,982 | $ | — | $ | (129 | ) | $ | 3,853 | |||||||
Goodwill is not deductible for tax purposes.
We evaluate the recoverability of goodwill and indefinite-lived intangible assets annually as of May 31, and whenever events or changes in circumstances indicate to us that the carrying amount may not be recoverable. We completed the required impairment review at the end of fiscal 2016, 2015 and 2014 and concluded that there were no impairments.
Intangible assets with finite useful lives are amortized over their respective estimated useful lives. The following tables provide a summary of our intangible assets:
May 31, 2016 | ||||||||||||||
Estimated Useful Life | Gross Carrying Amount | Accumulated Amortization | Net Carrying Amount | |||||||||||
Trade name | — | $ | 411 | $ | — | $ | 411 | |||||||
Customer relationships | 3-8 years | 2,094 | (1,879 | ) | 215 | |||||||||
$ | 2,505 | $ | (1,879 | ) | $ | 626 | ||||||||
May 31, 2015 | ||||||||||||||
Estimated Useful Life | Gross Carrying Amount | Accumulated Amortization | Net Carrying Amount | |||||||||||
Trade name | — | $ | 411 | $ | — | $ | 411 | |||||||
Customer relationships | 3-8 years | 2,094 | (1,761 | ) | 333 | |||||||||
$ | 2,505 | $ | (1,761 | ) | $ | 744 | ||||||||
Amortization expense was $118, $129 and $164 for fiscal 2016, 2015 and 2014, respectively.
Amortization expense for customer relationships is included in selling, general and administrative expenses. The following table provides estimated future amortization expense related to intangible assets:
Year ending May 31, | Future Amortization | ||
2017 | $ | 118 | |
2018 | 97 | ||
2019 | — | ||
2020 | — | ||
2021 | — | ||
$ | 215 | ||
F- 13
Note 4: Borrowings
On November 19, 2013, we entered into a credit agreement (the “Credit Agreement”) with J.P. Morgan Chase Bank, National Association (“JPM”), as administrative agent, J.P. Morgan Securities LLC, as sole bookrunner and sole lead arranger, and a syndicate of lenders. The Credit Agreement provides for a $25,000 revolving credit facility, including swingline loans and letters of credit. The Credit Agreement expires on November 30, 2017.
We have an option to increase the commitments under the Credit Agreement by up to an additional $25,000, upon our request and subject to the lenders electing to increase their commitments or by means of the addition of new lenders. Borrowings under the Credit Agreement bear interest at a rate equal to, at our election, the applicable rate for a “Eurodollar Loan” or a “CB Floating Rate Loan.” Eurodollar Loan advances accrue interest at a per annum interest rate equal to (i) the quotient (rounded upwards to the next 1/16th of 1%) of (a) the applicable LIBO Rate, divided by (b) one minus the maximum aggregate reserve requirement (expressed as a decimal) imposed under Federal Reserve Board Regulation D (the “Adjusted LIBO Rate”), plus (ii) 0.75%. CB Floating Rate Loan advances accrue interest at a per annum interest rate equal to (i) the higher of (a) JPM’s Prime Rate or (b) the Adjusted LIBO Rate for a one month interest period plus 2.5%, minus (ii) 2.0%. In addition, we pay a commitment fee of 0.10% of the unused amount if the average borrowing under the Credit Agreement is less than or equal to $8,000 on a quarterly basis.
The Credit Agreement contains customary affirmative and negative covenants (which are in some cases subject to certain exceptions), including, but not limited to, restrictions on the ability to incur additional indebtedness, create liens, make certain investments, make restricted payments, enter into or undertake certain liquidations, mergers, consolidations or acquisitions and dispose of assets or subsidiaries. In addition, the Credit Agreement requires us to maintain minimum earnings and tangible net worth. We were in compliance with all financial covenants at May 31, 2016.
At May 31, 2016, we had no borrowings outstanding under the Credit Agreement. We had $2,387 borrowings outstanding at May 31, 2015. The weighted average interest rate under the line of credit was approximately 1.25% at May 31, 2015.
Note 5: Income Taxes
We recognize a liability or an asset for the deferred tax consequences of temporary differences between the tax basis of assets and liabilities and their reported amounts in the financial statements. These temporary differences will result in taxable or deductible amounts in future years when reported amounts of the assets or liabilities are recovered or settled. The deferred tax assets are periodically reviewed for recoverability.
There were no uncertain tax positions in fiscal 2016, 2015 and 2014.
At May 31, 2016 and 2015, we did not have any accrual for interest and penalties.
We are subject to taxation in the U.S., as well as various states and foreign jurisdictions. We have substantially settled all income tax matters for the United States federal jurisdiction for years through fiscal 2011. Major state jurisdictions have been examined through fiscal 2004 and 2005, and foreign jurisdictions have not been examined for their respective initial statutory periods of approximately 3 years.
For financial reporting purposes, income before income taxes comprised the following as of May 31:
2016 | 2015 | 2014 | |||||||||
Domestic | $ | 8,991 | $ | 24,203 | $ | 30,907 | |||||
Foreign | (1,204 | ) | 447 | 1,619 | |||||||
$ | 7,787 | $ | 24,650 | $ | 32,526 | ||||||
F- 14
The income tax provision consisted of the following for the fiscal years ended May 31:
2016 | 2015 | 2014 | |||||||||
Current | |||||||||||
Federal | $ | 4,228 | $ | 11,636 | $ | 18,007 | |||||
State | 556 | 1,355 | 1,720 | ||||||||
Foreign | 95 | 387 | 319 | ||||||||
Deferred | |||||||||||
Federal | (1,285 | ) | (3,626 | ) | (7,553 | ) | |||||
State | (277 | ) | (248 | ) | (500 | ) | |||||
Foreign | (314 | ) | (286 | ) | 125 | ||||||
$ | 3,003 | $ | 9,218 | $ | 12,118 | ||||||
The following reconciles the statutory federal income tax rate to the effective tax rate for the fiscal years ended May 31:
2016 | 2015 | 2014 | ||||||
Statutory federal rate | 35.0 | % | 35.0 | % | 35.0 | % | ||
State taxes, net of federal benefit | 2.3 | 2.9 | 2.5 | |||||
Foreign tax credit/refund | (3.0 | ) | (0.8 | ) | (0.6 | ) | ||
Permanent differences resulting from valuation allowances | 3.6 | 0.6 | 0.3 | |||||
Other | 0.7 | (0.3 | ) | 0.1 | ||||
Effective tax rate | 38.6 | % | 37.4 | % | 37.3 | % | ||
The higher tax rate in fiscal 2016 is primarily due to higher losses in our China operations for which we receive no tax benefit and lower consolidated pretax income. Our effective tax rate remained consistent between fiscal 2015 and fiscal 2014.
The tax effects of temporary differences that gave rise to significant portions of the net deferred tax liabilities consisted of the following at May 31:
2016 | 2015 | ||||||
Deferred tax assets: | |||||||
Allowance for doubtful accounts | $ | 130 | $ | 113 | |||
Deferred compensation and benefits | 5,193 | 4,588 | |||||
Net operating losses | 681 | 398 | |||||
Valuation allowance | (681 | ) | (398 | ) | |||
Other | 1,640 | 1,890 | |||||
6,963 | 6,591 | ||||||
Deferred tax liabilities: | |||||||
Accumulated depreciation | (41,392 | ) | (42,505 | ) | |||
Deferred taxes on bargain purchase | (1,189 | ) | (1,583 | ) | |||
Intangible asset | (158 | ) | (155 | ) | |||
Net deferred tax liabilities | $ | (35,776 | ) | $ | (37,652 | ) | |
We determined that a valuation allowance was required in fiscal 2016, 2015 and 2014 of $681, $398 and $254, respectively, for our deferred tax assets related to certain foreign net operating loss carry forwards, which, if unused, will expire between fiscal 2017 and 2021. The change in the valuation allowance for fiscal 2016 as compared to fiscal 2015 was due to higher loss in China and lower consolidated pretax income. The change in the valuation allowance for fiscal 2015 and 2014 was not significant. As of May 31, 2016, 2015 and 2014, U.S. income taxes had not been assessed on approximately $7,322, $7,574 and $6,303, respectively, of undistributed earnings of foreign subsidiaries because we consider these earnings to be invested indefinitely.
We consider the undistributed earnings of our foreign subsidiaries as of May 31, 2016, to be indefinitely reinvested and, accordingly, no U.S. income taxes have been provided thereon. As of May 31, 2016, the amount of cash associated with indefinitely reinvested foreign earnings was approximately $5,702. We have not, nor do we anticipate the need to, repatriate
F- 15
funds to the United States to satisfy domestic liquidity needs arising in the ordinary course of business, including liquidity needs associated with our domestic debt service requirements.
Note 6: Sales-Type Leases
We have certain customer leases providing bargain purchase options, which are accounted for as sales-type leases. Interest income is recognized over the life of the lease using the effective interest method.
The initial acceptance of customer finance arrangements is based on a review of each customer’s credit profile, which may include the review of third party credit reports, customer financial statements and/or bank verifications. We monitor the credit quality of our sales-type lease portfolio based on payment activity and the related finance lease receivable aging. This credit quality is assessed on a monthly basis. Our historical losses on finance lease receivables are insignificant, and therefore we do not have a specific allowance for credit losses.
The minimum lease payments receivable and the net investment included in other assets were as follows at May 31:
2016 | 2015 | ||||||
Gross minimum lease payments receivable | $ | 3,701 | $ | 6,109 | |||
Less—unearned interest | (120 | ) | (233 | ) | |||
Net investment in sales-type lease receivables | $ | 3,581 | $ | 5,876 | |||
The following table provides estimated future minimum lease payments by year related to sales-type leases:
Year ending May 31, | Future Amortization | ||
2017 | $ | 2,949 | |
2018 | 679 | ||
2019 | 73 | ||
2020 | — | ||
2021 | — | ||
$ | 3,701 | ||
Note 7: Computation of Earnings per Share
The following is a reconciliation of the denominator used in the computation of basic and diluted EPS for the fiscal years ended May 31:
2016 | 2015 | 2014 | |||||||||
Denominator: | |||||||||||
Denominator for basic earnings per share—weighted average common shares outstanding (including shares issuable for vested restricted stock units) | 24,414 | 24,360 | 24,325 | ||||||||
Effect of unvested restricted stock units | 15 | 18 | 32 | ||||||||
Diluted shares used in per share calculation | 24,429 | 24,378 | 24,357 | ||||||||
Net income | $ | 4,784 | $ | 15,432 | $ | 20,408 | |||||
Earnings per share: | |||||||||||
Basic | $ | 0.20 | $ | 0.63 | $ | 0.84 | |||||
Diluted | $ | 0.20 | $ | 0.63 | $ | 0.84 | |||||
We did not include 47, 5, and 3 shares in the calculation of diluted earnings per share for the years ended May 31, 2016, 2015 and 2014, respectively, as to do so would have been antidilutive.
Note 8: Rentals under Noncancellable Operating Leases
Our operating lease agreements have varying terms, typically one to three years. Upon lease termination, the lessee has the option to renew the lease term, purchase the equipment at fair market value, or continue to rent on a month-to-month basis. Our operating leases do not provide for contingent rentals.
F- 16
Our cost of equipment under operating leases at May 31, 2016 and May 31, 2015, with remaining noncancellable lease terms of more than one year, was $15,104 and $12,512, before accumulated depreciation of $4,201 and $3,335, and the net book value was $10,904 and $9,177, respectively.
The following sets forth a schedule of future minimum rental payments to be received on noncancellable operating leases with remaining lease terms of more than one year as of May 31, 2016:
Year ending May 31, | Future Minimum Rental Payments | ||
2017 | $ | 4,639 | |
2018 | 2,802 | ||
2019 | 531 | ||
2020 | — | ||
2021 | — | ||
$ | 7,972 | ||
Note 9: Other Property
Other property, at cost, consisted of the following at May 31:
2016 | 2015 | ||||||
Land | $ | 6,985 | $ | 6,985 | |||
Buildings | 15,906 | 15,895 | |||||
Furniture and other equipment | 6,907 | 6,733 | |||||
Leasehold improvements | 244 | 256 | |||||
30,042 | 29,869 | ||||||
Less—accumulated depreciation and amortization | (17,653 | ) | (16,749 | ) | |||
$ | 12,389 | $ | 13,120 | ||||
Depreciation expense for other property was $1,113, $987 and $1,089 for fiscal 2016, 2015 and 2014, respectively. Depreciation expense is included in selling, general and administrative expenses.
Note 10: Commitments and Contingencies
We lease certain facilities under various operating leases. Most of the lease agreements provide us with the option of renewing our leases at the end of the initial lease term, at fair market rates, for periods of up to five years. In most cases, we expect that in the normal course of business, facility leases will be renewed or replaced by other leases.
Minimum payments over the next five years under these leases as of May 31, 2016, exclusive of property taxes and insurance, are as follows:
Year ending May 31, | Minimum Payments | ||
2017 | $ | 706 | |
2018 | 449 | ||
2019 | 258 | ||
2020 | 111 | ||
2021 | — | ||
$ | 1,524 | ||
Rent expense was $907, $1,197 and $1,169 for fiscal 2016, 2015 and 2014, respectively.
We are subject to legal proceedings and business disputes involving ordinary routine legal matters and claims incidental to our business. The ultimate legal and financial liability with respect to such matters generally cannot be estimated with certainty and requires the use of estimates in recording liabilities for potential litigation settlements or awards against us. Estimates for losses from litigation are made after consultation with outside counsel. If estimates of potential losses increase or the related facts and circumstances change in the future, we may be required to record either more or less litigation expense. We are not involved in
F- 17
any pending or threatened legal proceedings that we believe could reasonably be expected to have a material adverse effect on our financial condition, results of operations or cash flows.
Agreement with Keysight Technologies, Inc.
In fiscal 2010, we became a reseller of Agilent's new T&M equipment in the U.S. and Canada. In 2014, Agilent spun off Keysight Technologies, Inc., its wholly-owned subsidiary that manufactures T&M equipment, into a separate publicly traded company. Sales of new T&M equipment represented approximately 33.7%, 66.8% and 63.5% of our sales of equipment and other revenues for fiscal 2016, 2015 and 2014, respectively. Prior to fiscal 2016, nearly all of our sales of new T&M equipment were in connection with our reseller agreement with Keysight which expired May 31, 2015.
Note 11: Equity Incentive Plan
Our 2005 Equity Incentive Plan (the “Equity Incentive Plan”), as amended and restated, authorizes our Board of Directors to grant incentive and non-statutory stock option grants, stock appreciation rights, restricted stock awards, restricted stock units, performance unit awards and performance share awards covering a maximum of 1,000 shares of our common stock. Pursuant to the Equity Incentive Plan, we have granted restricted stock units to directors, officers and key employees.
Restricted Stock Units
Each vested restricted stock unit entitles the holder to be issued one share of common stock. The vested restricted stock units settle into common stock on the earliest of (i) the first January 1st after the fifth anniversary of the grant, (ii) a change of control, or (iii) termination of the holder’s employment or membership on our Board of Directors. Restricted stock units vest according to a vesting schedule determined by the Compensation Committee of our Board of Directors, generally over a one to three year period.
The following table represents restricted stock unit activity for fiscal 2016:
Restricted Stock Units | Weighted Average Grant Date Fair Value | |||||
Nonvested at June 1, 2015 | 129 | $ | 16.75 | |||
Granted | 182 | 11.24 | ||||
Vested | (81 | ) | 15.78 | |||
Forfeited/canceled | (9 | ) | 15.40 | |||
Nonvested at May 31, 2016 | 221 | $ | 12.62 | |||
We granted 182, 87 and 65 restricted stock units during fiscal 2016, 2015 and 2014, respectively. As of May 31, 2016, we have unrecognized share-based compensation cost of approximately $1,730 associated with restricted stock units. This cost is expected to be recognized over a weighted-average period of approximately 1.9 years. We had 231, 274 and 329 of vested restricted stock units as of May 31, 2016, 2015 and 2014, respectively, which received dividends upon vesting and are convertible to common shares five years after grant date.
The total fair value of shares that vested during fiscal 2016, 2015 and 2014 was $1,067, $807 and $1,414, respectively, which was calculated based on the closing price of our common stock on the Nasdaq Stock Market on the applicable date of vesting.
Accounting for Share-Based Payments
Accounting guidance requires all share-based payments to employees, including grants of restricted stock units, to be recognized as compensation expense in the consolidated financial statements based on their fair values. Compensation expense is recognized over the period that an employee provides service in exchange for the award, which is approximately three years.
Forfeitures are estimated at the date of grant based on historical experience. We use the market price of our common stock on the date of grant to calculate the fair value of each grant of restricted stock units.
We recorded $1,372, $1,292 and $1,356 of share-based compensation as part of selling, general and administrative expenses for fiscal 2016, 2015 and 2014, respectively.
We receive a tax deduction for certain restricted stock units on the date the related shares are issued, generally for (1) the fair value of our common stock at the date of issuance and (2) for dividends paid on vested restricted stock units where the underlying shares have not been issued. Excess tax benefits are realized when restricted stock units are issued and the tax deductions (fair value at issuance) are greater than the compensation expense for financial reporting purposes (fair value at the
F- 18
date of grant). Shortfalls are realized when the fair value at issuance is less than the fair value at grant. The total excess tax shortfall realized for fiscal 2016 was $30. The total excess tax benefit realized for fiscal 2015 and 2014 was $358 and $183, respectively.
Note 12: Savings Plan, Employee Stock Ownership Plan and Retirement Plan
We maintain a Savings Plan (“401(k)”). Employees become eligible to participate in the 401(k) after 90 days of employment. We have the option to match contributions of participants at a rate we determine each year. For participants with three or more years of service, we also may elect to make additional discretionary matching contributions in excess of the rate elected for participants with less than three years of service.
The Board of Directors determines the amount to be contributed annually to the 401(k) in cash, provided that such contributions shall not exceed the amount deductible for federal income tax purposes. Cash contributions to the 401(k) of $554, $848 and $784 were made for fiscal 2016, 2015 and 2014, respectively.
We have a Supplemental Executive Retirement Plan (“SERP”) that provides for automatic deferral of contributions in excess of the maximum amount permitted under the 401(k) for our executives who choose to participate. The SERP is a non-qualified deferred compensation program, and we have an unfunded contractual obligation under this plan. We have the option to match contributions of participants at a rate we determine each year. Cash contributions to the SERP were $14, $22 and $25 for fiscal 2016, 2015 and 2014, respectively. As of May 31, 2016 and 2015, we had $3,089 and $3,521, respectively, of obligations for this plan included in accrued expenses. We have investments in money market and mutual funds, as directed by the participants, of $3,089 and $3,521 as of May 31, 2016 and 2015, respectively, included in other assets.
Note 13: Segment Reporting and Related Disclosures
Accounting guidance establishes reporting standards for an enterprise’s operating segments and related disclosures about its products, services, geographic areas and major customers. Operating segments are defined as components of an enterprise for which separate financial information is available that is regularly evaluated by the chief operating decision maker in deciding how to allocate resources and in assessing performance. In order to determine our operating segments, we considered the following: an operating segment is a component of an enterprise (i) that engages in business activities from which it may earn revenues and incur expenses, (ii) whose operating results are regularly reviewed by the enterprise’s chief operating decision maker to make decisions about resources to be allocated to the segment and assess its performance, and (iii) for which discrete financial information is available. In accordance with this guidance, we have identified two operating segments: our T&M and DP businesses.
In the past, we concluded that although we had separate operating segments for T&M and DP equipment, these two segments could be aggregated into a single reportable segment because they had similar economic characteristics and qualitative factors. However, as a result of a change in economic characteristics in fiscal 2015 in our T&M segment, primarily attributable to the expiration of the Keysight agreement and greater competition in the marketplace, we determined that we no longer expected similar economic characteristics and qualitative factors to continue in the future. As such, management concluded that the operating segments should no longer be aggregated. Following the change in the composition of our reportable operating segments at the end of fiscal 2015, we restated the segment information for fiscal 2014.
Our equipment pool, based on acquisition cost, comprised $403,154 of T&M equipment and $31,759 of DP equipment at May 31, 2016, and $434,963 of T&M equipment and $37,824 of DP equipment at May 31, 2015. Additional segment asset information is not available.
F- 19
Revenues for these operating segments were as follows for the fiscal year ended May 31:
T&M | DP | Total | |||||||||
2016 | |||||||||||
Rentals and leases | $ | 105,850 | $ | 17,935 | $ | 123,785 | |||||
Sales of equipment and other revenues | 49,518 | 2,030 | 51,548 | ||||||||
Segment and consolidated total | $ | 155,368 | $ | 19,965 | $ | 175,333 | |||||
2015 | |||||||||||
Rentals and leases | $ | 111,327 | $ | 17,928 | $ | 129,255 | |||||
Sales of equipment and other revenues | 107,270 | 1,804 | 109,074 | ||||||||
Segment and consolidated total | $ | 218,597 | $ | 19,732 | $ | 238,329 | |||||
2014 | |||||||||||
Rentals and leases | $ | 120,629 | $ | 16,788 | $ | 137,417 | |||||
Sales of equipment and other revenues | 101,898 | 1,822 | 103,720 | ||||||||
Segment and consolidated total | $ | 222,527 | $ | 18,610 | $ | 241,137 | |||||
Depreciation of rental and lease equipment for these operating segments was as follows for the fiscal year ended May 31:
2016 | 2015 | 2014 | |||||||||
T&M | $ | 51,669 | $ | 52,278 | $ | 52,652 | |||||
DP | 4,262 | 4,167 | 4,382 | ||||||||
Segment and consolidated total | $ | 55,931 | $ | 56,445 | $ | 57,034 | |||||
Amortization expense is not material and is included in SG&A expenses.
We consider the marginal contribution as our measure of segment profit or loss. The marginal contribution is calculated as operating revenue less operating costs and direct and allocated SG&A expenses. Marginal contribution for these operating segments was as follows for the fiscal year ended May 31:
2016 | 2015 | 2014 | |||||||||
T&M | $ | 38,527 | $ | 50,410 | $ | 58,924 | |||||
DP | 6,695 | 6,914 | 5,962 | ||||||||
Total marginal contribution of operating segments | 45,222 | 57,324 | 64,886 | ||||||||
Deduct: | |||||||||||
Unallocated SG&A expenses | 37,139 | 34,396 | 32,747 | ||||||||
Add: | |||||||||||
Interest income, net | (329 | ) | 332 | 387 | |||||||
Other income | 33 | 1,390 | — | ||||||||
Consolidated income before income taxes | $ | 7,787 | $ | 24,650 | $ | 32,526 | |||||
No single customer accounted for more than 10% of total revenues during fiscal 2016, 2015 or 2014. We conduct rental, leasing and sales activity in foreign countries. Selected country information is presented below:
Year ended May 31, | 2016 | 2015 | 2014 | ||||||||
Revenues: 1 | |||||||||||
U.S. | $ | 141,535 | $ | 200,323 | $ | 203,806 | |||||
Other 2 | 33,798 | 38,006 | 37,331 | ||||||||
Total | $ | 175,333 | $ | 238,329 | $ | 241,137 | |||||
F- 20
As of May 31, | 2016 | 2015 | 2014 | ||||||||
Net Long Lived Assets: 3 | |||||||||||
U.S. | $ | 168,331 | $ | 197,514 | $ | 188,343 | |||||
Other 2 | 43,583 | 47,277 | 46,667 | ||||||||
Total | $ | 211,914 | $ | 244,791 | $ | 235,010 | |||||
1 | Revenues by country are based on the shipping destination. |
2 | Other consists of countries other than the U.S. Each foreign country individually accounts for less than 10% of the total consolidated revenues and net long-lived assets. |
3 | Net long-lived assets include rental and lease equipment and other property, net of accumulated depreciation and amortization. |
Note 14: Quarterly Information (Unaudited)
Summarized quarterly financial data for fiscal 2016 and 2015 was as follows:
Total Revenues | Gross Profit 1 | Income Before Taxes | Net Income | Earnings per share | |||||||||||||||||||
Basic | Diluted | ||||||||||||||||||||||
Fiscal Year 2016 | |||||||||||||||||||||||
First Quarter | $ | 53,343 | $ | 18,964 | $ | 3,951 | $ | 2,470 | $ | 0.10 | $ | 0.10 | |||||||||||
Second Quarter | 43,310 | 17,881 | 3,541 | 2,190 | 0.09 | 0.09 | |||||||||||||||||
Third Quarter | 39,498 | 15,172 | 1,492 | 1,009 | 0.04 | 0.04 | |||||||||||||||||
Fourth Quarter | 39,182 | 16,220 | (1,197 | ) | (885 | ) | (0.04 | ) | (0.04 | ) | |||||||||||||
Annual totals | $ | 175,333 | $ | 68,237 | $ | 7,787 | $ | 4,784 | $ | 0.20 | $ | 0.20 | |||||||||||
Fiscal Year 2015 | |||||||||||||||||||||||
First Quarter | $ | 61,871 | $ | 22,480 | $ | 7,562 | $ | 4,771 | $ | 0.20 | $ | 0.20 | |||||||||||
Second Quarter | 59,703 | 20,825 | 7,696 | 4,795 | 0.20 | 0.20 | |||||||||||||||||
Third Quarter | 56,342 | 18,356 | 3,746 | 2,425 | 0.10 | 0.10 | |||||||||||||||||
Fourth Quarter | 60,413 | 20,580 | 5,646 | 3,441 | 0.14 | 0.14 | |||||||||||||||||
Annual totals | $ | 238,329 | $ | 82,241 | $ | 24,650 | $ | 15,432 | $ | 0.63 | $ | 0.63 | |||||||||||
1 | Gross profit is calculated as total revenues less depreciation of rental and lease equipment, costs of rentals and leases and costs of sales of equipment and other revenues. |
Note 15: Subsequent Events
On June 23, 2016, we entered into an Amended and Restated Agreement and Plan of Merger (the “Restated Merger Agreement”) with Elecor Intermediate Holding II Corporation, a Delaware corporation (“Parent”), and Elecor Merger Corporation, a California corporation and a wholly owned subsidiary of Parent (“Merger Sub”), pursuant to which, subject to the satisfaction or waiver of the conditions set forth therein, Merger Sub will be merged with and into us, with us surviving the merger as a wholly-owned subsidiary of Parent (the “Merger”). Parent and Merger Sub are affiliates of Platinum Equity, a Beverly Hills-based private equity firm (“Platinum Equity”). Pursuant to the Restated Merger Agreement, at the effective time of the Merger, and as a result of the Merger:
• | each outstanding share of our common stock (other than shares held by any person who properly asserts dissenters’ rights under California law) will be converted into the right to receive an amount in cash equal to $15.50 per share (the “Merger Consideration”); and |
• | each restricted stock unit (whether vested or unvested) that is outstanding at the effective time of the Merger will vest in full and will convert into the right to receive an amount in cash equal to the per share Merger Consideration. |
Our board, in accordance with and upon the unanimous recommendation of a special committee of independent directors, has approved the Merger Agreement and the transactions contemplated thereby, including the Merger. The Merger was approved by our shareholders at a special meeting held on August 5, 2016. We expect the Merger and the transactions contemplated thereby to close by the end of August 2016.
F- 21
As a result of the Merger, we will become a wholly-owned subsidiary of Parent and our shares of common stock will no longer be publicly traded. Following closing of the Merger, we will make appropriate filings to cause our common stock to be delisted from the NASDAQ Global Select Market and to be deregistered under the Securities Exchange Act of 1934, as amended.
On June 8, 2016, following the announcement of the Merger, a shareholder class action lawsuit, entitled Chaklos, et al. v. Electro Rent Corp., et al., was filed in the Superior Court of the State of California, Los Angeles County, against us, our directors, Phillip A. Greenberg, Platinum Equity, Parent and Merger Sub. The lawsuit asserts that defendants variously breached, or aided and abetted others in breaching, state law fiduciary duties in connection with their consideration and approval of the Merger. The lawsuit seeks rescission of the Merger Agreement, an injunction barring consummation of the Merger, imposition of a constructive trust of “benefits improperly received by defendants” as a result of any breaches of duty and costs and disbursements of the action.
On June 20, 2016, following the announcement of the Merger, a shareholder class action lawsuit, entitled Wadsworth v. Electro Rent Corp., et al., was filed in the United States District Court for the Central District of California, against us, our directors, Platinum Equity, Parent and Merger Sub. The lawsuit asserts that defendants variously breached, or aided and abetted others in breaching, state law fiduciary duties in connection with their consideration and approval of the Merger. The lawsuit further asserts that the defendants violated securities law in connection with an assortment of alleged material omissions from the preliminary proxy statement. The lawsuit seeks rescission of the Merger Agreement, an injunction barring consummation of the Merger, imposition of a constructive trust of “benefits improperly received by defendants” as a result of any breaches of duty and costs and disbursements of the action.
F- 22