Attached files
| file | filename |
|---|---|
| 8-K - FORM 8-K - RAIT Financial Trust | d8k.htm |
 RAIT
Financial Trust NAREIT REITWeek 2011
June 8, 2011
Exhibit 99.1
1 |
 Forward Looking
Statements & Non-GAAP Financial Measures
This document and the related presentation may contain forward-looking statements within
the meaning of the Private Securities Litigation Reform Act of 1995. These
forward-looking statements include, but are not limited to, statements about RAIT Financial Trust’s (“RAIT”) plans, objectives, expectations and
intentions with respect to future operations, products and services and other statements that
are not historical facts. These forward-looking statements are based upon the
current beliefs and expectations of RAIT's management and are inherently subject to significant business, economic and competitive
uncertainties and contingencies, many of which are difficult to predict and generally not
within RAIT’s control. In addition, these forward-looking statements are
subject to assumptions with respect to future business strategies and decisions that are
subject to change. Actual results may differ materially from the anticipated results
discussed in these forward-looking statements. The following factors, among others, could cause actual results to differ materially from the
anticipated results or other expectations expressed in the forward- looking
statements: the risk factors discussed and identified in filings by RAIT with the Securities and Exchange Commission (“SEC”), including, without
limitation, RAIT’s most recent annual and quarterly reports filed with SEC.
You are cautioned not to place undue reliance on these forward-looking statements, which
speak only as of the date of this presentation. All subsequent written and oral
forward-looking statements attributable to RAIT or any person acting on its behalf are expressly qualified in their entirety by the cautionary statements
contained or referred to in this document and the related presentation. Except to the extent
required by applicable law or regulation, RAIT undertakes no obligation to update these
forward-looking statements to reflect events or circumstances after the date of this presentation or to reflect the occurrence of
unanticipated events.
The related presentation may contain non-U.S. generally accepted accounting principles
(“GAAP”) financial measures. A reconciliation of these non-GAAP
financial measures to the most directly comparable GAAP financial measure is included in
RAIT’s most recent annual and quarterly reports.
RAIT’s SEC filings are available on RAIT’s website at www.raitft.com. 2 |
 About RAIT
Diversified full service commercial real estate company with $3.8 billion
assets under management
Lender -
Commercial Real Estate Loans
Multi-family, office, retail
Origination platform for bridge, mezzanine and CMBS Loans
Long-dated, match funded liabilities
Owner –
Commercial real estate properties
Primarily multi-family & office
Captive property management
Operate as a REIT
IPO –
1998 : approximately 400 employees nationwide
Experienced management team that has invested through multiple cycles
Quarterly common dividend of $0.06 per share, split-adjusted,
representing an approximate 4% dividend yield
1:3 reverse-split effective June 30, 2011
3 |
 Experienced
Management Team Officer
Position
Years of
Experience
Comments
Scott F. Schaeffer
Chairman of the Board, CEO
and President
26
Chairman of the Board since December 2010
CEO of RAIT since February 2009
President since September 2000
Jack E. Salmon
CFO and Treasurer
34
CFO and Treasurer of RAIT since December 2006
Joined RAIT in 2006
Raphael Licht
COO and Secretary
18
COO of RAIT since February 2009
Chief Legal Officer and Chief Administrative Officer from
December 2006 to February 2009
Joined RAIT in 2006
Ken Frappier
Executive Vice President –
Portfolio and Risk
Management
37
Executive Vice President of RAIT since February 2008
Chief Credit Officer of RAIT from December 2006 to February
2008
Senior Vice President of Portfolio and Risk Management of RAIT
from April 2002 to December 2006
Jim Sebra
Senior Vice President
and CAO
14
SVP and CAO since May 2007
Joined RAIT in 2006
Andres Viroslav
Vice President, Director of
Corporate Communications
16
Vice President of RAIT since 2002
Joined RAIT in September 2001
4 |
 Diversified
Platform Assets Under
Management
$0.9 billion of
CRE properties
Manage $1.8B
of U.S. real
estate debt
S&P Rated
Loan Servicer
and Special
Servicer
Midland Enterprise
System
Cash
Management
/
Treasury
Functions
(SOX
Environment)
Broker Dealer
& Advisory
Services
CMBS
Origination and
Securitization
Advise Institutional
Investors on RE
Assets:
Origination, valuation,
management,
servicing,
acquisition, disposition
& reporting
$1.1B
of
CRE
loans
Asset &
Property
Management
Jupiter
Communities, LLC
CRP Commercial
Services
Investor Reporting
Leasing Capabilities
Monthly Credit
Analysis
Property-Level
Accounting
Non-Traded
REIT Sponsor
& Advisor
Independence
Realty Trust, Inc.
Captive Dealer
Manager
Generate fee
income
5 |
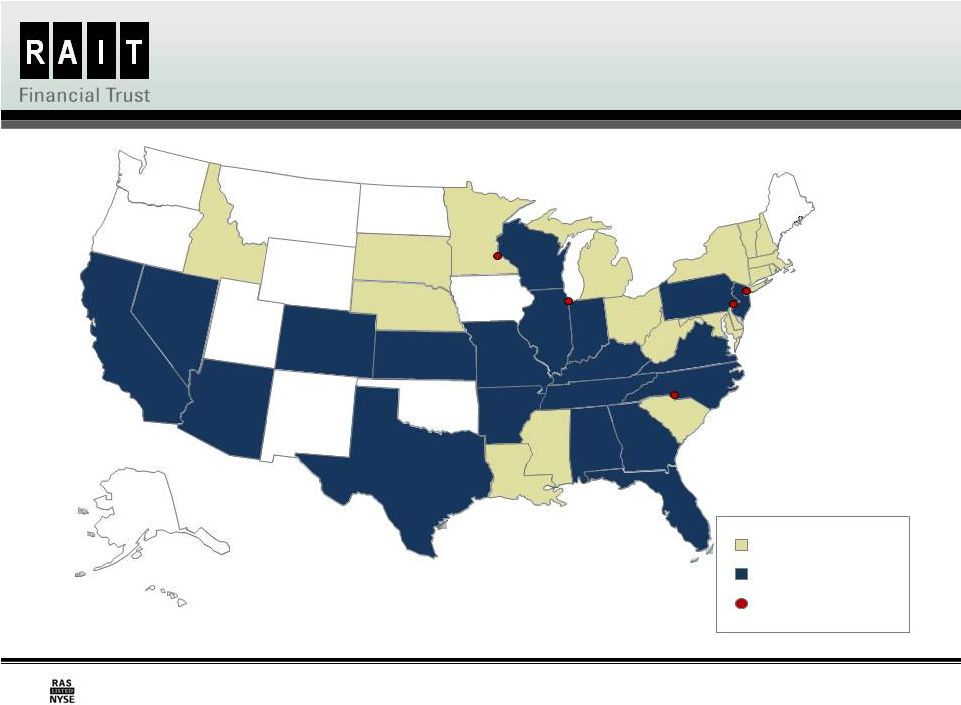 Where We Are:
National Reach 6
LEGEND
RAIT
CRE
Loans
RAIT
Commercial Services
Offices
AK
CA
OR
WA
MT
ID
NV
AZ
UT
WY
ND
SD
NE
KS
OK
NM
TX
CO
MN
IA
MO
AR
LA
IL
IN
WI
MI
PA
OH
NJ
DE
KY
TN
MS
AL
GA
FL
NC
SC
VA
WV
MD
RI
NY
ME
MA
VT
NH
CT
CRE
Loans owned
and/or managed by Jupiter
Communities and/or CRP |
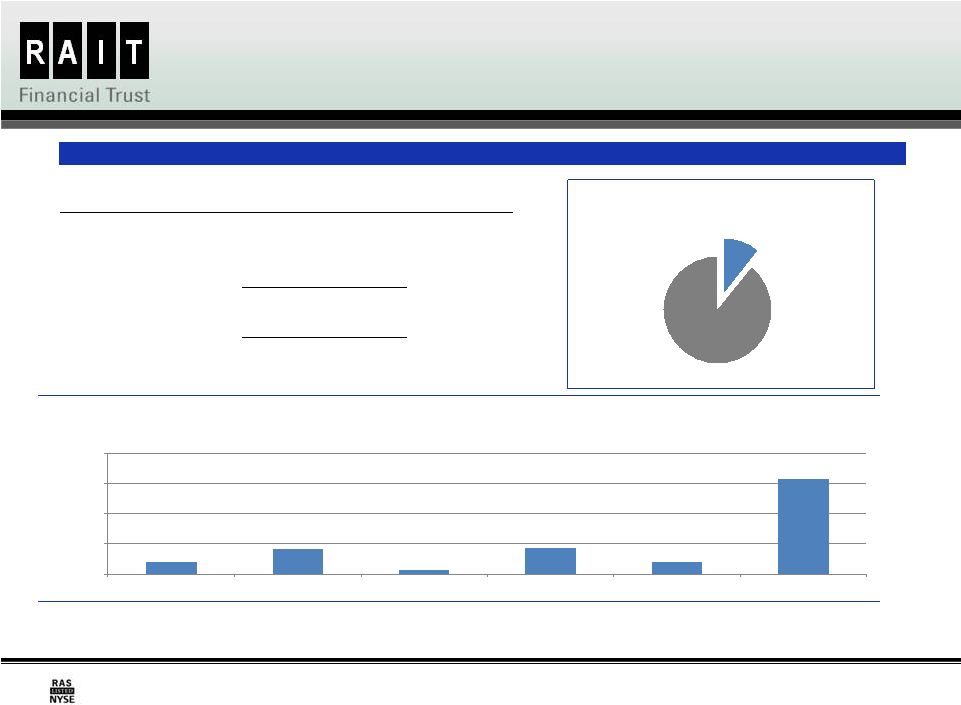 Recourse Debt
Summary – 6/3/2011
RAIT’s recourse indebtedness represents a manageable 10% of total
indebtedness $20,040
$40,913
$7,245
$43,000
$19,381
$158,771
$-
$50,000
$100,000
$150,000
$200,000
2011
2012 (3)
2013
2014
2015
Thereafter
Recourse Debt Maturities
(in 000's)
Recourse
10%
Non-
recourse
90%
Debt Breakdown
Description
Unpaid Principal
Balance
Weighted-
Average
Interst Rate
Contractual Maturity
Recourse Indebtedness:
7.0% convertible senior notes (1)
115,000
$
7.0%
Apr. 2031
6.875% convertible senior notes (2)
40,913
6.9%
Apr. 2027
Secured credit facilities
20,040
4.5%
Dec. 2011
Senior secured notes
43,000
12.5%
Apr. 2014
First mortgage on real estate owned
7,245
5.0%
Sept. 2013
Toal senior recourse indebtedness
226,198
$
7.7%
TRUPS
38,052
5.2%
Oct. 2015 to Mar. 2035
TRUPS
25,100
7.7%
Apr. 2037
Total junior recourse indebtedness
63,152
$
6.2%
($ in 000s)
7
(1) Our 7.0% convertible senior notes are redeemable, at par at the option of the holder, in April 2016,
April 2021, and April 2026. (2) Our 6.875% convertible senior notes are redeemable, at par at the option of the holder, in April
2012, April 2017, and April 2022. (3) Assumes full exercise of our 6.875% convertible senior notes redemption right in April 2012.
|
 Recent
Performance Positioned
for
Growth
Improving
Cash Flow
Improved
Asset
Performance
8
Reduced
Leverage &
Operating
Costs
Reduced debt to equity ratio to 2.1x from a peak of
7.4x in June 2009
Reduced recourse debt by $105 million in 2010 &
$45.9 million in 2011
Debt reduction has resulted in significant cash savings
CRE securitizations remain fully cash-flowing and
performance test coverage ratios continue to improve
Declared regular quarterly common dividend of $0.06
per share, split-adjusted, effective in July 2011
Increasing occupancy and rental rates in all property
types
Increased 2010 net operating income from owned real
estate year-over-year |
 9
2011 Strategic Initiatives:
CRE Lending
Commercial Real Estate Lending
Capitalize
on
existing,
scalable
platform
and
internal
expertise
to
originate Bridge and CMBS loans of $5 million to $30 million on stable
multi-family, office, retail and light industrial properties
Growing pipeline; repayment flows increasing
Lending capacity within CRE securitizations
Spread expansion opportunities
Fee
income
opportunities
–
originating,
securitizing,
managing
Sourcing
capital
for
future
growth
–
lines
of
credit,
JV,
warehouse,
debt
&
other sources |
 10
2011 Strategic Initiatives:
Direct Real Estate
Directly Owned Real Estate Portfolio
Maximize value over time through increasing occupancy and higher
rental rates
Assets acquired below borrower’s cost
Asset value creation opportunity
Increasing rental income
Invested approximately $20.8 million in capital expenditures to reposition
the portfolio
Jupiter
Communities
–
internal
multi-family
property
manager
CRP
Commercial
Services
–
internal
office
property
manager |
 11
2011 Strategic Initiatives:
Non-Traded REITs
New Non-Traded REIT Platform Leverages RAIT’s Real Estate
Expertise
Independence
Realty
Trust,
Inc.
(“IRT”)
-
Non-Traded
REIT
Acquisition
-
acquired on January 20, 2011
RAIT will serve as external manager & advisor
Target asset class: multi-family
Fee stream
»
.75 bps on average invested assets
»
1% 3
rd
party financing coordination fee
»
4% of revenue property management fee (Jupiter Communities)
»
Expense reimbursement
»
Back-end promote structure
RAIT equity investment pari passu with returns to IRT equity investors
Target maximum equity raise: $1 billion
Expect registration statement to be effective in Q2 2011
Raise capital through retail Broker/Dealer & financial advisor networks
65% maximum aggregate leverage
Any disclosure relating to IRT is neither an offer nor a solicitation to purchase
securities issued by IRT |
 12
Experienced
Management Team
Diversified Real Estate
Platform
Creating Shareholder
Value is Key to our
Success
Access to Capital for
Growth
Cash Distributions
Growth & Income
Focus
Cornerstones for Success–Why Invest ? |
 13
Appendix |
 14
Key Statistics –
3/31/2011
March 31,
2011
December
31, 2010
September
30, 2010
June 30,
2010
March 31,
2010
Financial Statistics:
Assets under management
$3,822,534
$3,837,526
$3,901,342
$4,014,556
$9,911,824
Debt to equity ratio
2.1x
2.3x
2.6x
2.7x
2.8x
Total revenue
$58,279
$59,057
$58,899
$60,370
$66,244
Recourse debt maturing in one year
$20,040
$41,489
$7,919
$9,919
$10,905
Earnings per share – diluted
$0.05
$0.29
$0.16
$0.27
$0.41
Commercial Real Estate (“CRE”) Loan
Portfolio:
CRE loans-- unpaid principal
$1,149,169
$1,173,141
$1,216,875
$1,288,466
$1,305,816
Non-accrual loans -- unpaid principal
$121,054
$122,306
$143,212
$131,377
$132,978
Non-accrual loans as a % of reported
loans
10.5%
10.4%
11.8%
10.2%
10.2%
Reserve for losses
$58,809
$61,731
$73,029
$70,699
$68,850
Reserves as a % of non-accrual loans
48.6%
50.5%
51.0%
53.8%
51.8%
Provision for losses
$1,950
$2,500
$10,813
$7,644
$17,350
CRE Property Portfolio:
Reported investments in real estate
$867,726
$841,488
$823,881
$803,548
$795,952
Number of properties owned
48
47
47
47
46
Multifamily units owned
8,311
8,311
8,231
7,893
7,893
Office square feet owned
1,786,908
1,632,978
1,634,997
1,732,626
1,550,401
Retail square feet owned
1,116,063
1,116,112
1,069,588
1,069,588
1,069,652
Average occupancy data:
Multifamily
88.0%
85.5%
84.6%
83.5%
78.0%
Office
70.7%
67.8%
52.5%
55.5%
54.2%
Retail
56.3%
58.8%
57.7%
58.7%
60.1%
Total
82.4%
79.2%
74.8%
74.4%
70.8%
(Not split-adjusted; dollars in thousands, except share and per share
amounts) |
 15
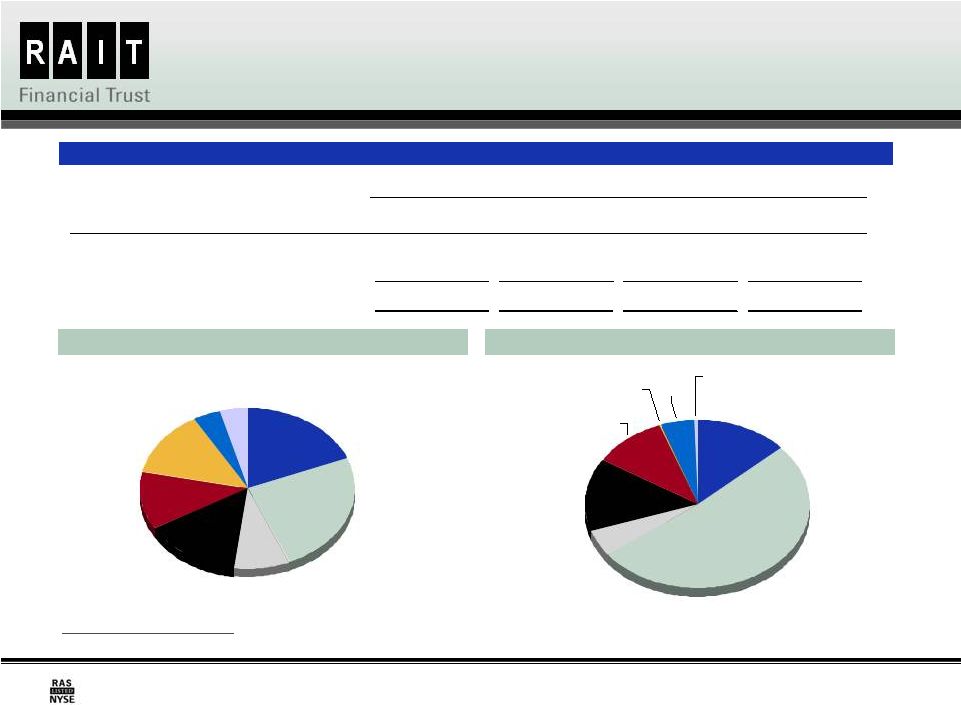
Commercial Real Estate Portfolio:
Loan Portfolio Statistics –
3/31/2011
By Property Type
(1)
(1) Based on book value.
By Geographic Region
(1)
Book Value
Weighted-
Average
Coupon
Range of Maturities
Number
of Loans
Key Statistics
Q1 2011
Q4 2010
Commercial Real Estate (CRE) Loans
Non-accrual loans
$121,054
$122,306
Commercial mortgages
$688,527
6.7%
May 2011 to Dec. 2020
42
% change
(1%)
Mezzanine loans
352,809
9.2%
May 2011 to Nov. 2038
103
Reserve for losses
58,809
61,731
Preferred equity interests
89,616
10.1%
Nov. 2011 to Aug. 2025
23
% change
(5%)
Total CRE Loans
$1,130,952
7.8%
168
Provision for losses
1,950
2,500
Other loans
61,321
6.7%
May 2011 to Oct. 2016
5
% change
(22%)
Total investments in loans
$1,192,273
7.7%
173
($ in 000s)
Improved credit performance of the loan portfolio
Mid Atlantic
21%
Southeast
16%
Northeast
14%
West
15%
Central
34%
Retail
25%
Office
33%
Other
7%
Multi-family
35% |
  16
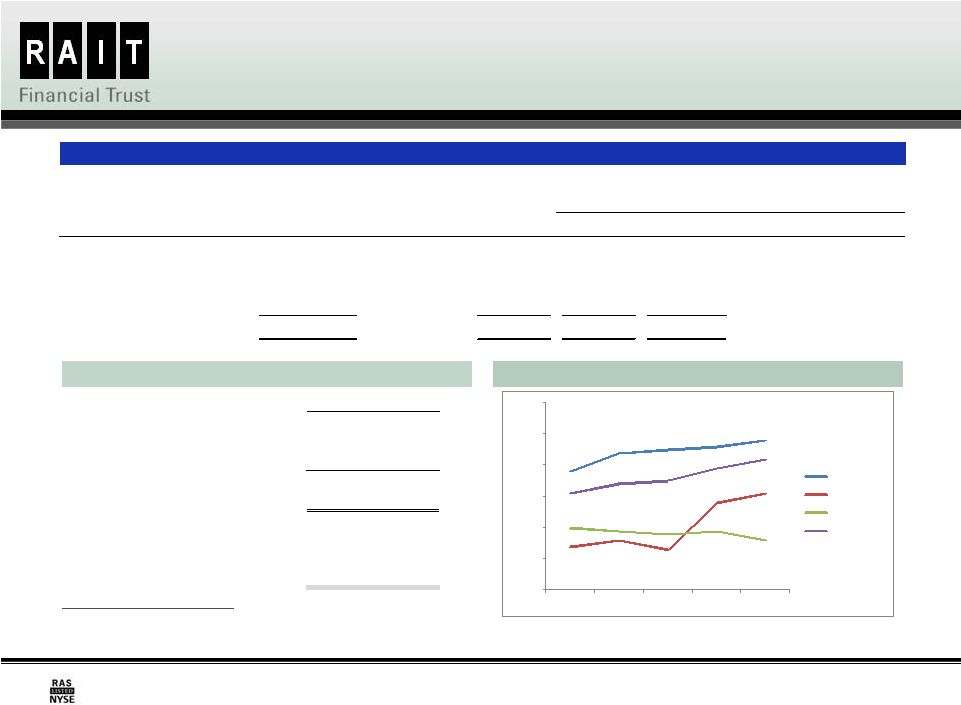
Commercial Real Estate Portfolio:
Owned Real Estate Statistics –
3/31/2011
Net Real Estate Operating Income
Occupancy Rates by Property Type
Average Physical Occupancy
Investments
in Real
Estate
Quantity
Number of
Properties
3/31/211
12/31/2010
Q1 2011
Q4 2010
Multi-family real estate properties
$570,849
8,311 units
33
88%
86%
$673
$681
Office real estate properties
226,800
1,786,908 sq. ft.
10
71%
68%
17.88
18.00
Retail real estate properties
47,869
1,116,063 sq. ft.
2
56%
59%
9.71
9.40
Parcels of land
22,208
7.3 acres
3
–
–
–
–
Total
$867,726
48
82%
79%
($ in 000s)
(1) Investments in real estate include $48.9 million of assets held for sale
as of March 31, 2011. (2) Based on operating performance for the
respective quarters. (3) Average effective rent is rent per unit per
month. (4) Average effective rent is rent per square foot per
year. Improved occupancy and net operating income
Q1 2011
Q4 2010
Rental income
$21,290
$20,170
Real estate operating expenses
(12,617)
(13,404)
Net Real Estate Operating Income
$8,673
$6,766
Number of owned properties
48
47
Occupancy
82%
79%
78%
84%
85%
86%
88%
54%
56%
53%
68%
71%
60%
59%
58%
59%
56%
71%
74%
75%
79%
82%
40%
50%
60%
70%
80%
90%
100%
Q12010
Q22010
Q32010
Q42010
Q12011
Multi-family
Office
Retail
Total
(1)(3)
(4)
(4)
(2)
Average Effective Rent
(1) |
 17
Balance Sheet –
3/31/2011
(Not split-adjusted; dollars in thousands, except share and per share
amounts) As of
March 31,
2011
As of
December 31,
2010
Assets
Investments in mortgages and loans, at amortized cost:
Commercial
mortgages,
mezzanine
loans,
other
loans
and
preferred
equity
interests
$ 1,190,576
$
1,219,110
Allowance for losses
(66,769)
(69,691)
Total investments in mortgages and loans
1,123,807
1,149,419
Investments in real estate
867,726
841,488
Investments in securities and security-related receivables, at fair value
718,937
705,451
Cash and cash equivalents
39,463
27,230
Restricted cash
179,308
176,723
Accrued interest receivable
Other assets
Deferred financing costs, net of accumulated amortization of $10,559 and
$9,943, respectively
Intangible assets, net of accumulated amortization of $1,917 and
$1,777, respectively
Total assets
Liabilities and Equity
Indebtedness:
Recourse indebtedness
Non-recourse indebtedness
Total indebtedness
Accrued interest payable
Accounts payable and accrued expenses
Derivative liabilities
Deferred
taxes,
borrowers’
escrows
and
other
liabilities
Total liabilities
Equity:
Shareholders’
equity:
Preferred shares, $0.01 par value per share, 25,000,000 shares authorized;
7.75% Series A cumulative redeemable preferred shares, liquidation preference
$25.00 per share, 2,760,000 shares issued and outstanding
8.375% Series B cumulative redeemable preferred shares, liquidation preference
$25.00 per share, 2,258,300 shares issued and outstanding
8.875% Series C cumulative redeemable preferred shares, liquidation preference
$25.00 per share, 1,600,000 shares issued and outstanding
Common shares, $0.01 par value per share, 200,000,000 shares authorized,
114,083,141 and 105,900,570 issued and outstanding
Additional paid in capital
Accumulated other comprehensive income (loss)
Retained earnings (deficit)
Total
shareholders’
equity
Noncontrolling interests
Total equity
Total liabilities and equity
$ 3,029,363
2,993,432
$
37,764
37,138
6,346
32,840
22,963
19,954
3,049
3,189
$ 3,029,363
$
2,993,432
$ 277, 891
$
293,357
1,552,726
1,544,820
1,830,617
1,838,177
20,444
19,925
25,495
25,089
164,127
184,878
20,852
6,833
2,061,535
2,074,902
28
23
16
1,141
1,060
1,721,730
1,691,681
(114,514)
(127,602)
(644,562)
(647,110)
963,862
918,096
3,966
434
967,828
918,530
28
23
16 |
 18
Consolidated Statements of Operations
(Not split-adjusted; dollars in thousands, except share and per share
amounts) For the Three-Month
Periods Ended
March 31
20
11
2010
Revenue:
Interest income
$ 33,558
$ 41,330
Rental income
21,290
16,075
Fee and other income
3,431
8,839
Total revenue
58,279
66,244
Expenses:
Interest expense
23,367
25,470
Real estate operating expense
12,617
10,522
Compensation expense
6,544
8,052
General and administrative expense
4,968
4,890
Provision for loan losses
1,950
17,350
Depreciation and amortization
7,119
6,223
Total expenses
56,565
72,467
Operating income
1,714
(6,223)
Interest and other income (expense)
83
82
Gains (losses) on sale of assets
1,415
3,924
Gains (losses) on extinguishment of debt
(537)
19,810
Change in fair value of financial instruments
5,611
16,437
Income (loss) before taxes and discontinued operations
8,286
34,030
Income tax benefit (provision)
54
(47)
Income (loss) from continuing operations
8,340
Income (loss) from discontinued operations
791
470
Net income (losss)
9,131
34,453
(Income) loss allocated to preferred shares
(3,414)
(3,406)
(Income)
loss
allocated
to
noncontrolling
interests
50
235
Net income (loss) allocable to common shares
$
$ 31,282
Earnings (loss) per share—Basic:
Continuing operations
$ 0.04
$ 0.41
Discontinued operations
0.01
0.01
Total earnings (loss) per share—Basic
$ 0.05
$ 0.42
Weighted-average shares outstanding—Basic
74,952,313
Earnings (loss) per share—Diluted:
Continuing operations
$ 0.04
$ 0.40
Discontinued operations
0.01
0.01
Total earnings (loss) per share—Diluted
$ 0.05
$ 0.41
Weighted-average shares outstanding—Diluted
110,904,359
75,512,999
5,767
109,856,729
33,983 |
 19
Adjusted Funds From Operations
(Not split-adjusted; dollars in thousands, except share and per share
amounts) For the Three-Months Periods
Ended March 31
2011
2010
Funds From Operations (“FFO”) (1):
Net income (loss) allocable to common
shares.................................. $ 5,767
$
31,282
Adjustments:
Depreciation
expense...............................................................
6,570
6,003
(Gains) Losses on sale of real
estate........................................ (266)
Funds from
operations........................................................................
$ 12,337
$ 37,019
Funds from Operations per
share.......................................................
$ 0.11
$ 0.49
Weighted-average
shares -
diluted
110,904,359
75,512,999
Adjusted Funds From Operations (“AFFO”) (1):
Funds from
Operations........................................................................
$ 12,337
$
37,019
Adjustments:
Change in fair value of financial instruments..............................
(5,611)
(16,437)
(Gains) Losses on debt extinguishment......................................
537
(19,810)
Capital expenditures, net of direct
financing................................ (362)
(158)
Straight-line rental
adjustments.................................................. (919)
(26)
Amortization of deferred items and intangible assets..................
673
(1)
Share-based
compensation.........................................................
259
1,671
Adjusted Funds from
Operations..........................................................
$ 6,914
$ 2,258
Adjusted Funds from Operations per
share...........................................
$ 0.06
$ 0.03
Weighted-average
shares
-
diluted
110,904,359
75,512,999
-
(1) We believe that funds from operations, or FFO, and adjusted funds from operations, or AFFO,
each of which are non-GAAP measures, are additional appropriate measures of the operating performance of a REIT and us in particular. We compute FFO in accordance with the standards
established by the National Association of Real Estate Investment Trusts, or NAREIT, as net income or
loss allocated to common shares (computed in accordance with GAAP), excluding real estate-related depreciation and amortization expense, gains or losses on sales of real estate and the
cumulative effect of changes in accounting principles. AFFO is a computation made by analysts and
investors to measure a real estate company's cash flow generated by operations. We calculate AFFO by adding to or subtracting from FFO: change in fair value of financial instruments; gains
or losses on debt extinguishment; capital expenditures, net of any direct financing associated with
those capital expenditures; straight-line rental effects; amortization of various deferred items and intangible assets; and share-based compensation. Our calculation of AFFO differs from the
methodology used for calculating AFFO by certain other REITs and, accordingly, our AFFO may not be
comparable to AFFO reported by other REITs. Our management utilizes FFO and AFFO as measures of our operating performance, and believes they are also useful to investors, because
they facilitate an understanding of our operating performance after adjustment for certain non-cash
items, such as real estate depreciation, share-based compensation and various other items required by GAAP that may not necessarily be indicative of current operating performance and that
may not accurately compare our operating performance between periods. Furthermore, although FFO, AFFO
and other supplemental performance measures are defined in various ways throughout the REIT industry, we also believe that FFO and AFFO may provide us and our investors with
an additional useful measure to compare our financial performance to certain other REITs.
Neither FFO nor AFFO is equivalent to net income or cash generated from operating activities determined in accordance with U.S. GAAP. Furthermore, FFO and AFFO do not represent amounts
available for management's discretionary use because of needed capital replacement or expansion, debt
service obligations or other commitments or uncertainties. Neither FFO nor AFFO should be considered as an alternative to net income as an indicator of our operating performance or as
an alternative to cash flow from operating activities as a measure of our liquidity.
References to “we”, “us”, and “our” refer to RAIT Financial Trust and its subsidiaries.
|
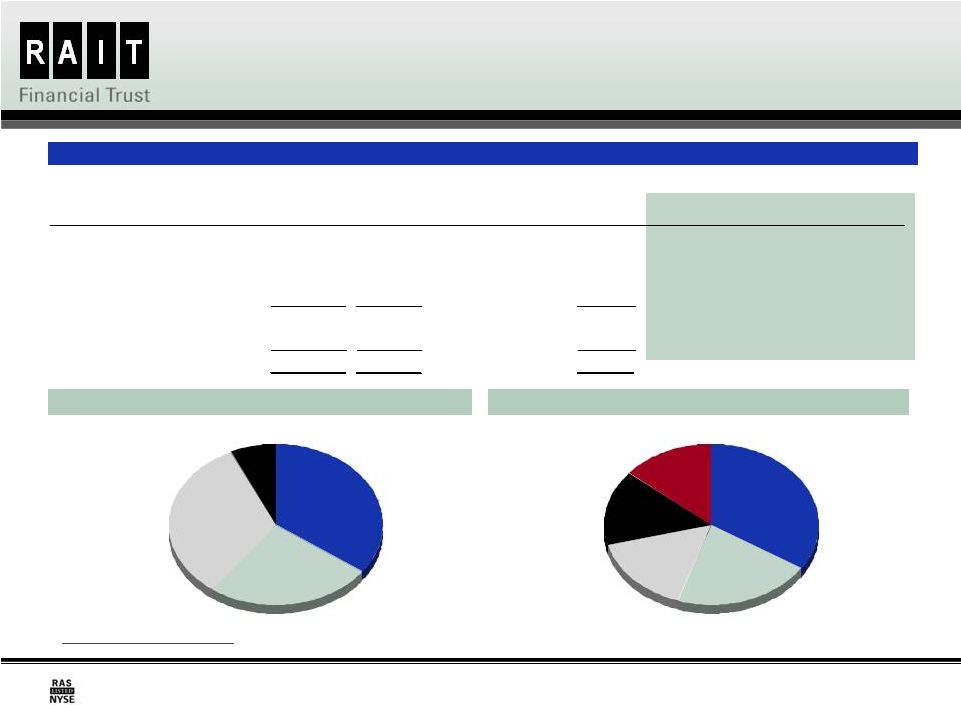
 20
Investment in Debt Securities Issued by Real
Estate Companies –
3/31/2011
TruPS and Subordinated Debentures by Industry Sector
(1)
(1) Based on estimated fair value.
(2) S&P Ratings as of March 31, 2011.
Other Securities by Ratings Distribution
(1)(2)
As of March 31, 2011
Investment Description
Estimated Fair
Value
Amortized Cost
Weighted-Average
Coupon
Weighted Average
Years to Maturity
TruPS and Subordinated Debentures
$546,081
$801,700
5.2%
21.9
Other securities
172,856
312,560
4.9%
27.3
Total
$718,937
$1,114,260
5.2%
23.4
($ in 000s)
RAIT earns senior management fees from the legacy Taberna portfolio
Office
25%
Residential
Mortgage
8%
Specialty
Finance
15%
Retail
13%
Hospitality
4%
Homebuilders
12%
Storage
4%
Commercial
Mortgage
19%
BBB
51%
BB
5%
B
14%
AAA
5%
D
0%
CCC
11%
AA
1%
A
13% |