Attached files
Exhibit 99.1
| CANADA | SUPERIOR COURT | |
| PROVINCE OF QUÉBEC DISTRICT OF MONTRÉAL
No.: 500-11-036133-094 |
Commercial Division Sitting as a court designated pursuant to the Companies’ Creditors Arrangement Act, R.S.C., c. C-36, as amended
| |
| IN THE MATTER OF THE PLAN OF COMPROMISE OR ARRANGEMENT OF: | ||
| ABITIBIBOWATER INC., a legal person incorporated under the laws of the State of Delaware, having its principal executive offices at 1155 Metcalfe Street, in the City and District of Montréal, Province of Quebec, H3B 5H2; | ||
| And | ||
| ABITIBI-CONSOLIDATED INC., a legal person incorporated under the laws of Canada, having its principal executive offices at 1155 Metcalfe Street, in the City and District of Montréal, Province of Quebec, H3B 5H2; | ||
| And | ||
| BOWATER CANADIAN HOLDINGS INC., a legal person incorporated under the laws of the Province of Nova Scotia, having its principal executive offices at 1155 Metcalfe Street, in the City and District of Montréal, Province of Quebec, H3B 5H2; | ||
| And | ||
| the other Petitioners listed on Appendices “A”, “B” and “C”; | ||
| Petitioners | ||
| And | ||
| ERNST & YOUNG INC., a legal person under the laws of Canada, having a place of business at 800 René-Lévesque Blvd. West, Suite 1900, in the City and District of Montréal, Province of Quebec, H3B 1X9; | ||
| Monitor | ||
SIXTY-THIRD REPORT OF THE MONITOR
OCTOBER 1, 2010
INTRODUCTION
| 1. | On April 17, 2009, Abitibi-Consolidated Inc. (“ACI”) and its subsidiaries listed in Appendix “A” hereto (collectively with ACI, the “ACI Petitioners”) and Bowater Canadian Holdings Incorporated (“BCHI”), its subsidiaries and affiliates listed in Appendix “B” hereto (collectively with BCHI, the “Bowater Petitioners”) (the ACI Petitioners and the Bowater Petitioners are collectively referred to herein as the “Petitioners”) filed for and obtained protection from their creditors under the Companies’ Creditors Arrangement Act (the “CCAA” and the “CCAA Proceedings”) pursuant to an Order of this Honourable Court, as amended on May 6, 2009 (the “Initial Order”). Pursuant to an Order of this Honourable Court dated November 10, 2009, Abitibi-Consolidated (U.K.) Inc., a subsidiary of ACI, was added to the list of the ACI Petitioners. |
| 2. | Pursuant to the Initial Order, Ernst & Young Inc. (“EYI”) was appointed as monitor of the Petitioners (the “Monitor”) under the CCAA and a stay of proceedings in favour of the Petitioners was granted until May 14, 2009 (the “Stay Period”). The Stay Period has been subsequently extended to the date of implementation of the plan of reorganization and compromise (the “Plan”) filed by the Petitioners pursuant to further Orders of this Honourable Court. |
| 3. | On April 16, 2009, AbitibiBowater Inc. (“ABH”), Bowater Inc. (“BI”), and certain of their direct and indirect U.S. and Canadian subsidiaries, including BCHI and Bowater Canadian Forest Products Inc. (“BCFPI”) (collectively referred to herein as “U.S. Debtors”), filed voluntary petitions (collectively, the “Chapter 11 Proceedings”) for relief under Chapter 11 of the U.S. Bankruptcy Code, 11 U.S.C. §§ 101 et seq. (the “U.S. Bankruptcy Code”) in the United States Bankruptcy Court for the District of Delaware (the “U.S. Bankruptcy Court”). |
| 4. | BCHI, Bowater Canada Finance Corporation, Bowater Canadian Limited, AbitibiBowater Canada Inc., BCFPI, Bowater LaHave Corporation and Bowater Maritimes Inc. have commenced both CCAA Proceedings and Chapter 11 Proceedings |
- 2 -
| and are referred to herein collectively as the “Cross-Border Petitioners” and are also included in the definition of “Petitioners”. |
| 5. | The Petitioners are all subsidiaries of ABH (ABH, collectively with its subsidiaries, are referred to as the “ABH Group”). |
| 6. | On April 17, 2009, ABH and the petitioners listed on Appendix “C” hereto (collectively with ABH, the “18.6 Petitioners”) obtained Orders under Section 18.6 of the CCAA in respect of voluntary proceedings initiated under Chapter 11 of the U.S. Bankruptcy Code and EYI was appointed as the information officer in respect of the 18.6 Petitioners. |
| 7. | On April 16, 2009, ACI and ACCC filed petitions for recognition under Chapter 15 of the U.S. Bankruptcy Code. On April 21, 2009, the U.S. Bankruptcy Court granted the recognition orders under Chapter 15 of the U.S. Bankruptcy Code. |
| 8. | On April 22, 2009, the Court amended the Initial Order to extend the stay of proceedings to the partnerships (the “Partnerships”) listed in Appendix “D” hereto. |
BACKGROUND
| 9. | ABH is one of the world’s largest publicly traded pulp and paper manufacturers. It produces a wide range of newsprint and commercial printing papers, market pulp and wood products. The ABH Group owns interests in or operates pulp and paper facilities, wood products facilities and recycling facilities located in Canada, the United States and South Korea. The Petitioners’ United Kingdom subsidiary, Bridgewater Paper Company Ltd. (“Bridgewater”), filed for administration, pursuant to the United Kingdom’s Insolvency Act of 1986, on February 2, 2010. The U.K. Administrator announced on May 19, 2010 that it had sold the property formerly owned by Bridgewater. |
| 10. | Incorporated in Delaware and headquartered in Montreal, Quebec, ABH functions as a holding company and its business is conducted principally through four direct subsidiaries: BI, Bowater Newsprint South LLC (“Newsprint South”) (BI, Newsprint South and their respective subsidiaries are collectively referred to as the “BI Group”), ACI (ACI and its subsidiaries are collectively referred to as the “ACI Group”) and |
- 3 -
| AbitibiBowater US Holding LLC (“ABUSH”) (ABUSH and its respective subsidiaries are collectively referred to as the “DCorp Group”). |
| 11. | ACI is a direct and indirect wholly-owned subsidiary of ABH. |
| 12. | ABH wholly owns BI which in turn, wholly owns BCHI which, in turn, indirectly owns BCFPI which carries on the main Canadian operations of BI. |
| 13. | ACCC, a wholly-owned subsidiary of ACI, and BCFPI hold the majority of ABH’s Canadian assets and operations. |
PURPOSE
| 14. | This is the sixty-third report of the Monitor (the “Sixty-Third Report”) in these CCAA Proceedings, the purpose of which is to report to this Honourable Court with respect to the following: |
| (i) | the Petitioners’ five-week cash flow results for the period from August 2, 2010 to September 5, 2010 (the “Reporting Period”), in accordance with the first stay extension order of this Honourable Court dated May 14, 2009 (the “First Stay Extension Order”), and to provide details with respect to the following: |
| (a) | an update in respect of the market condition overview provided in the fifty-third report of the Monitor dated August 26, 2010 (the “Fifty-Third Report”); |
| (b) | the receipts and disbursements of the ACI Group and BCFPI for the Reporting Period with a discussion of the variances from the respective forecasts (the “ACI Forecast” and the “BCFPI Forecast”) as set forth in the Fifty-Third Report; |
| (c) | the current liquidity and revised cash flow forecasts of the ACI Group and BCFPI for the 13-week period ending December 5, 2010; and |
- 4 -
| (d) | an update with respect to certain key performance indicators (“KPIs”) tracked by the Petitioners. |
TERMS OF REFERENCE
| 15. | In preparing this Sixty-Third Report, the Monitor has been provided with and, in making comments herein, has relied upon unaudited financial information, the ABH Group’s books and records, financial information and projections prepared by the ABH Group and discussions with management of the ABH Group (the “Management”). The Monitor has not audited, reviewed or otherwise attempted to verify the accuracy or completeness of such information and, accordingly, the Monitor expresses no opinion or other form of assurance in respect of such information contained in this Sixty-Third Report. Some of the information referred to in this Sixty-Third Report consists of forecasts and projections. An examination or review of the financial forecast and projections, as outlined in the Canadian Institute of Chartered Accountants Handbook, has not been performed. Future-oriented financial information referred to in this Sixty-Third Report was prepared by the ABH Group based on Management’s estimates and assumptions. Readers are cautioned that, since these projections are based upon assumptions about future events and conditions the actual results will vary from the projections, even if the assumptions materialize, and the variations could be significant. |
| 16. | Capitalized terms not defined in this Sixty-Third Report are as defined in the previous reports of the Monitor and the Initial Order. All references to dollars are in U.S. currency and are translated at a rate of CDN$1.00=US$0.98 unless otherwise noted. |
| 17. | Copies of all of the Monitor’s Reports, in both English and French, including a copy of this Sixty-Third Report, and all motion records and Orders in the CCAA Proceedings will be available on the Monitor’s website at www.ey.com/ca/abitibibowater. The Monitor has also established a bilingual toll-free telephone number that is referenced on the Monitor’s website so that parties may contact the Monitor if they have questions with respect to the CCAA Proceedings. |
- 5 -
| 18. | Copies of all of the U.S. Bankruptcy Court’s orders are posted on the website for Epiq Bankruptcy Solutions LCC (“Epiq”) at http://chapter11.epiqsystems.com/abitibibowater. The Monitor has included a link to Epiq’s website on the Monitor’s website. |
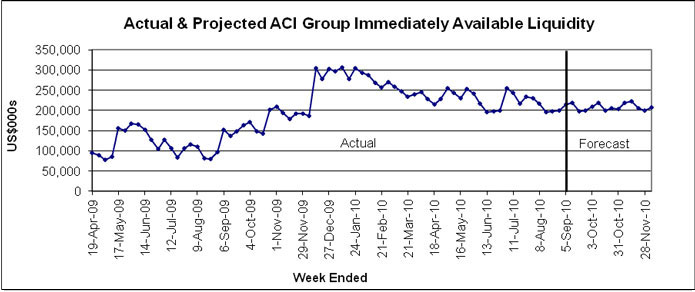
CURRENT MARKET CONDITIONS IN THE FOREST PRODUCTS INDUSTRY
| 19. | Pursuant to the First Stay Extension Order, the Monitor has provided this Honourable Court with regular reports on the Petitioners’ cash flows for each reporting period following the date of the First Stay Extension Order. These reports have included details with respect to the market conditions in the forest products industry. |
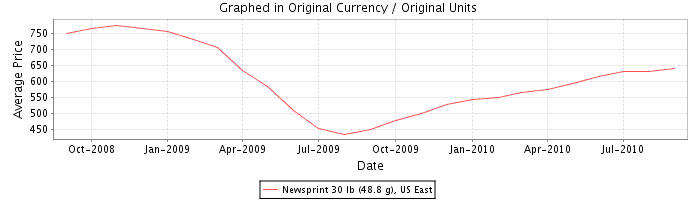
| 20. | According to a report on RISI.com (a leading forest products industry source) on September 17, 2010 (the “September 17th RISI Report”), the price of newsprint has continued to increase over the past year, with reported prices at $640 per tonne in September, 2010 compared to $450 per tonne in September, 2009. This is illustrated in the RISI.com graph below: |
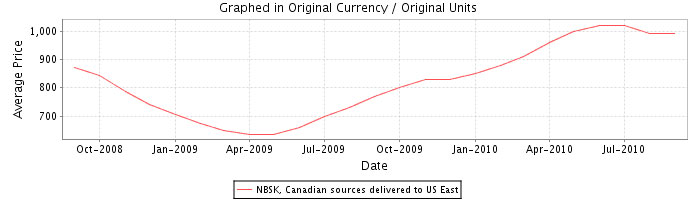
| 21. | According to a September 10, 2010 report on RISI.com (the “September 10th RISI Report”) North American pulp prices have remained stable over the past month with reported prices of $990 per tonne in September, 2010. The September 10th RISI Report notes that the price of northern softwood bleached kraft pulp (“NSBK”) remains higher than the price at September, 2009 of $770 per tonne. This is illustrated in the RISI.com graph below: |
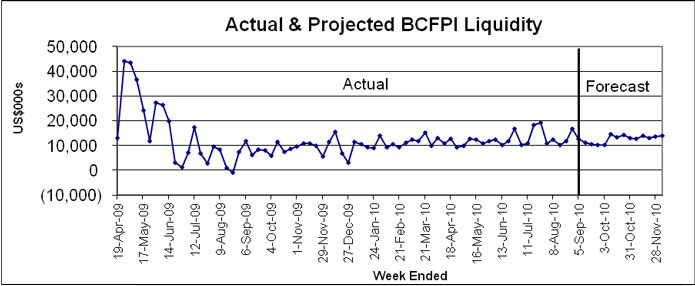
- 6 -
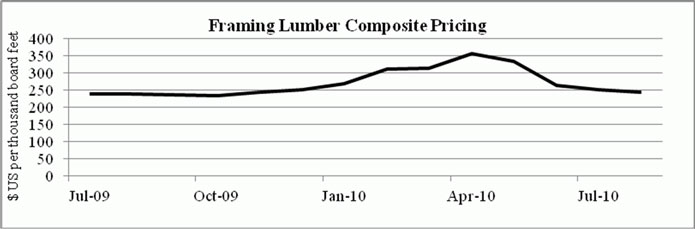
| 22. | According to RandomLengths.com (a leading wood products industry source) framing lumber composite prices continued to decline in August, 2010 with prices at $245 per thousand board feet, compared to $252 per thousand board feet in July, 2010. The price in the current market is still higher than the prior year price of $239 per thousand board feet in August, 2009. This is illustrated in the chart below: |
| 23. | As reported in the September 17th RISI Report, Terrace Bay Pulp Inc. (“Terrace Bay”), an NBSK pulp mill located in northwest Ontario, is scheduled to restart its operations on October 4, 2010 after emerging from CCAA protection on September 15, 2010. Terrace Bay entered into creditor protection pursuant to the CCAA on March 11, 2009. |
| 24. | Also as reported on RISI.com, Black Diamond White Birch Investment, an asset acquisition vehicle formed by Black Diamond Capital Management, Credit Suisse Loan Funding, and Caspian Capital Advisors, presented the winning bid for the insolvent newsprint company White Birch Paper (“White Birch”). Approval of the stalking horse bid of $150 million is subject to a court hearing scheduled for September 30, 2010. White Birch entered into creditor protection pursuant to the CCAA on February 24, 2010. |
- 7 -
RECEIPTS AND DISBURSEMENTS FROM AUGUST 2, 2010 TO SEPTEMBER 5, 2010 FOR THE ACI GROUP AND BCFPI
The ACI Group
| 25. | The table below summarizes the ACI Group’s (including DCorp) actual receipts and disbursements for the Reporting Period, which is detailed in Appendix “E” of this Sixty-Third Report, with a comparison to the ACI Forecast amounts provided in the Fifty-Third Report: |
The ACI Group
| US$000 | |||||||||||||||
| Actual | Forecast | Variance | |||||||||||||
| Opening Cash |
$ | 151,871 | $ | 151,871 | $ | — | — | ||||||||
| Receipts |
239,976 | 244,354 | (4,378 | ) | (2 | )% | |||||||||
| Disbursements |
|||||||||||||||
| Net Trade Disbursements |
(155,250 | ) | (147,981 | ) | (7,269 | ) | (5 | )% | |||||||
| Intercompany |
1,827 | — | 1,827 | N/A | |||||||||||
| Other |
(98,032 | ) | (93,827 | ) | (4,205 | ) | (4 | )% | |||||||
| (251,455 | ) | (241,808 | ) | (9,647 | ) | (4 | )% | ||||||||
| Financing |
|||||||||||||||
| Securitization Inflows / (Outflows) |
(1,370 | ) | (1,319 | ) | (51 | ) | (4 | )% | |||||||
| Adequate Protection by DCorp to ACCC Term Lenders |
(3,392 | ) | (3,287 | ) | (105 | ) | (3 | )% | |||||||
| Financing Fees |
(1,627 | ) | — | (1,627 | ) | N/A | |||||||||
| Restructuring & Other Items |
(10,134 | ) | (5,750 | ) | (4,384 | ) | (76 | )% | |||||||
| Foreign Exchange Translation |
2,209 | — | 2,209 | N/A | |||||||||||
| (14,314 | ) | (10,356 | ) | (3,958 | ) | (38 | )% | ||||||||
| Net Cash Flow |
(25,793 | ) | (7,810 | ) | (17,983 | ) | (230 | )% | |||||||
| Ending Cash |
$ | 126,078 | $ | 144,061 | $ | (17,983 | ) | (12 | )% | ||||||
| Immediately Available Liquidity |
$ | 214,890 | $ | 221,523 | $ | (6,633 | ) | (3 | )% | ||||||
| Total Available Liquidity |
$ | 323,446 | $ | 319,843 | $ | 3,603 | 1 | % | |||||||
| 26. | As detailed in the twenty-ninth report of the Monitor dated December 16, 2009 (the “Twenty-Ninth Report”), the sale of the ACCC MPCo Interest closed on December 9, 2009 for gross proceeds of CDN$615 million (the “Proceeds”). Certain of the Proceeds were paid to the Monitor for distribution as follows: |
| (i) | CDN$200.0 million to the holders of the 13.75% notes (the “Senior Secured Notes”) due in 2011 (the “Senior Secured Noteholders”); and |
| (ii) | CDN$130.0 million to the ACI Group pursuant to the ULC DIP Facility. |
- 8 -
| 27. | The Monitor continues to hold the following amounts related to the sale of the ACCC MPCo Interest pursuant to an order of this Honourable Court dated November 16, 2009: |
| (i) | CDN$50.0 million that is available as liquidity to the ACI Group subject to providing notice to certain creditors (the “ULC DIP Facility Available Upon Notice”); |
| (ii) | CDN$50.0 million that is available to the ACI Group subject to Court approval for the use of such funds (the “ULC DIP Facility Available Upon Court Approval”); and |
| (iii) | Approximately CDN$52.3 million that is not available to the ACI Group (the “Restricted ULC Reserve Deposit”). |
| 28. | The Monitor will continue to hold the ULC DIP Facility Available Upon Court Approval and the Restricted ULC Reserve Deposit until they are released or distributed in accordance with the Plan or until further order of this Honourable Court. |
| 29. | Pursuant to an order issued by the U.S. Bankruptcy Court, funds related to the sale of certain DCorp recycling assets, approximately $11.8 million, (the “Recycling Proceeds”) and funds related to the sale of DCorp’s West Tacoma mill, approximately $4.1 million, (the “West Tacoma Proceeds”) are only available to the ACI Group on ten days notice to the agent for the ACCC Term Lenders. The Recycling Proceeds and West Tacoma Proceeds are held in a designated bank account and are separate from the ACI Group’s general operating funds. |
| 30. | On April 12, 2010 the Monitor received approximately $2.8 million related to the sale of ACCC’s St. Raymond sawmill (the “St. Raymond Proceeds”). The St. Raymond Proceeds are being held by the Monitor until further order of this Honourable Court. |
| 31. | On May 5, 2010 the Monitor received approximately $1.7 million related to the sale of ACCC’s Shawinigan, Quebec mill (the “Belgo Proceeds”). The Belgo Proceeds are being held by the Monitor until further order of this Honourable Court. |
- 9 -
| 32. | On June 4, 2010 the Monitor received approximately $27.7 million related to the sale of ACCC’s Mackenzie, British Columbia mill (the “Mackenzie Proceeds”), which are also being held by the Monitor until further order of this Honourable Court. |
| 33. | As shown in the table above, the ACI Group’s total receipts for the Reporting Period, net of joint venture remittances, were approximately $4.4 million lower than projected in the ACI Forecast. Disbursements were approximately $9.6 million higher than projected in the ACI Forecast and Financing net cash outflows were approximately $4.0 million higher than projected in the ACI Forecast. Overall, the ending cash balance was approximately $18.0 million lower than the ACI Forecast and Immediately Available Liquidity was approximately $6.6 million lower than the ACI Forecast. |
| 34. | “Immediately Available Liquidity” in the table above includes cash on hand plus liquidity available pursuant to the ULC DIP Facility Available Upon Notice and amounts available through the ACI Group’s June, 2010 securitization program. “Total Available Liquidity” includes Immediately Available Liquidity plus the ULC DIP Facility Available Upon Court Approval, the Recycling Proceeds, the St. Raymond Proceeds, proceeds related to the sale of equipment at DCorp’s Alabama River facility (the “Alabama River Equipment Proceeds”), the Belgo Proceeds, the West Tacoma Proceeds, the Mackenzie Proceeds and proceeds related to the sale of DCorp’s Lufkin mill (the “Lufkin Proceeds”). |
Receipts
| 35. | A breakdown of the receipts for the Reporting Period is outlined in the table below: |
| $US 000 | ||||||||||||||||||
| Receipts |
Para. | Actual | Forecast | Variance | Variance % | |||||||||||||
| A/R Collections |
36 | (i) | $ | 205,536 | $ | 220,844 | $ | (15,308 | ) | (7 | )% | |||||||
| Intercompany A/R Settlement |
36 | (i) | 18,527 | — | 18,527 | N/A | ||||||||||||
| Joint Venture Remittances, Net |
36 | (i) | (23,157 | ) | (23,548 | ) | 391 | 2 | % | |||||||||
| Collections on Behalf of Joint Ventures |
36 | (ii) | 2,303 | 24,071 | (21,768 | ) | (90 | )% | ||||||||||
| Net A/R Collections |
203,209 | 221,367 | (18,158 | ) | (8 | )% | ||||||||||||
| Other Inflows |
36 | (iii) | 36,767 | 22,987 | 13,780 | 60 | % | |||||||||||
| Total Receipts |
$ | 239,976 | $ | 244,354 | $ | (4,378 | ) | (2 | )% | |||||||||
- 10 -
| 36. | The variance analysis has been compiled based on discussions with Management and the following represents the more significant reasons for the variances: |
| (i) | A/R Collections, inclusive of receipts related to Intercompany A/R Settlements, net Joint Venture Remittances, and Collections on Behalf of Joint Ventures, were approximately $203.2 million during the Reporting Period compared to a forecast amount of approximately $221.4 million. The negative variance of approximately $18.2 million is a result of timing of collections from the ACI Group’s customers. |
Intercompany A/R Settlements represent payments to the ACI Group from an affiliated ABH Group entity for ACI Group accounts receivable that were collected by the affiliated entity, such as BI or BCFPI.
| (ii) | Collections on Behalf of Joint Ventures represents amounts collected by the ACI Group for accounts receivable that belong to a joint venture partner. Such amounts will be paid to the joint venture partner on a monthly basis or in accordance with the joint venture agreement. The collections on behalf of joint ventures were approximately $2.3 million during the Reporting Period as compared to a forecast amount of approximately $24.1 million, resulting in a negative variance of approximately $21.8 million. |
This variance is due to the fact that certain amounts collected on behalf of joint ventures are also included in the “A/R Collections” line and have not yet been specifically allocated to “Collections on Behalf of Joint Ventures” as these amounts are allocated on a monthly basis.
During the Reporting Period, disbursements related to Joint Venture Remittances totalled approximately $23.2 million resulting in a positive variance of approximately $0.4 million.
| (iii) | Other Inflows, which include sales of woodchips to third parties, sales tax refunds and other miscellaneous receipts, totalled approximately $36.8 million during the Reporting Period. The ACI Forecast included projected receipts of approximately $23.0 million, resulting in a positive variance of approximately $13.8 million. |
- 11 -
This difference is primarily due to approximately $8.0 million of collections for the sale of wood chips at St. Felicien and approximately $5.8 million of collections for pulp sales at Fort Frances.
Disbursements
| 37. | A breakdown of the disbursements related to Net Trade Disbursements for the Reporting Period is outlined below: |
| $US 000 | |||||||||||||||||
| Para. | Actual | Forecast | Variance | Variance % | |||||||||||||
| Trade Payables |
38(i) | $ | (159,089 | ) | $ | (143,771 | ) | $ | (15,318 | ) | (11 | )% | |||||
| Intercompany A/P Settlement - Receipts |
38(ii) | 6,610 | — | 6,610 | N/A | ||||||||||||
| Intercompany A/P Settlements - Disbursements |
38(iii) | (2,771 | ) | — | (2,771 | ) | N/A | ||||||||||
| Capital Expenditures |
38(iv) | — | (4,210 | ) | 4,210 | 100 | % | ||||||||||
| Net Trade Disbursements |
$ | (155,250 | ) | $ | (147,981 | ) | (7,269 | ) | (5 | )% | |||||||
| 38. | The variance analysis with respect to the disbursements for the more significant variances has been prepared based on discussions with Management and the following represents a summary of the reasons for the variances: |
| (i) | Disbursements related to Trade Payables were approximately $159.1 million during the Reporting Period, which is approximately $15.3 million greater than the ACI Forecast. This negative variance can partially be explained by the fact that Capital Expenditures have been included in the actual amount for Trade Payables disbursements until such time as the ACI Group identifies and allocates the disbursements which are capital in nature. Also, during the Reporting Period the ACI Group’s raw material (roundwood) inventory increased by approximately $6.0 million; |
| (ii) | The ACI Group regularly disburses amounts on behalf of other affiliated entities. Identifiable settlements of these amounts are detailed on the Intercompany A/P Settlements – Receipts line and totalled approximately $6.6 million during the Reporting Period; |
| (iii) | Other affiliated entities may make disbursements on behalf of the ACI Group. When the ACI Group settles these amounts they are detailed on the Intercompany |
- 12 -
| A/P Settlements – Disbursements line and totalled approximately $2.8 million during the Reporting Period; and |
| (iv) | As noted above, Capital Expenditures are not tracked on a weekly basis. The disbursements related to capital expenditures have been included in the Trade Payables disbursement line. Management has advised the Monitor that Capital Expenditures during August, 2010 totalled approximately $2.5 million. |
| 39. | The net cash flows related to intercompany collections are detailed in the chart below: |
| $US 000 | ||||||||||||||||
| Para. | Actual | Forecast | Variance | Variance % | ||||||||||||
| A/R Collections - Affiliates |
39 | (i) | $ | 23,943 | $ | — | $ | 23,943 | N/A | |||||||
| Intercompany A/R Settlements |
39 | (i) | (22,116 | ) | — | (22,116 | ) | N/A | ||||||||
| $ | 1,827 | $ | — | $ | 1,827 | N/A | ||||||||||
| (i) | A/R Collections – Affiliates totalled approximately $23.9 million during the Reporting Period. As part of its normal Cash Management System, the ACI Group regularly collects accounts receivable on behalf of other ABH Group entities. As it is not possible to forecast which customers will incorrectly pay the ACI Group on behalf of the other entities, collections on behalf of affiliates are not forecast by the Petitioners. The accounts receivable collected on behalf of affiliates are paid on a regular basis by the ACI Group to the appropriate ABH Group entity, which payments are reflected in the Intercompany A/R Settlements line of the “Intercompany” section of the cash flow statement. An amount of approximately $22.1 million was paid to affiliates during the Reporting Period by the ACI Group to reimburse affiliates for collections made on their behalf by the ACI Group. |
| 40. | Disbursements related to “Other” items are summarized in the chart below: |
- 13 -
| $US 000 | ||||||||||||||||||
| Para. | Actual | Forecast | Variance | Variance % | ||||||||||||||
| Marine Freight Payments |
40 | (i) | $ | (9,113 | ) | $ | (8,925 | ) | $ | (188 | ) | (2 | )% | |||||
| Utility Payments |
40 | (ii) | (39,819 | ) | (38,540 | ) | (1,279 | ) | (3 | )% | ||||||||
| Payroll & Benefits |
40 | (iii) | (49,100 | ) | (46,362 | ) | (2,738 | ) | (6 | )% | ||||||||
| $ | (98,032 | ) | $ | (93,827 | ) | $ | (4,205 | ) | (4 | )% | ||||||||
| (i) | Marine Freight Payments totalled approximately $9.1 million during the Reporting Period and were consistent with the ACI Forecast. |
| (ii) | Utility Payments totalled approximately $39.8 million during the Reporting Period resulting in a negative variance of approximately $1.3 million when compared to the ACI Forecast. The variance is due to a major utility service provider requiring an additional payment in the month for increased electricity consumption. |
| (iii) | Total payments for Payroll & Benefits were approximately $49.1 million during the Reporting Period compared to an amount of approximately $46.4 million in the ACI Forecast. The variance of approximately $2.7 million is primarily due to higher than forecast employee benefit and pension payments. |
Financing
| 41. | Details regarding the ACI Group’s financing activities are summarized in the following table: |
| $US 000 | ||||||||||||||||||
| Financing |
Para. | Actual | Forecast | Variance | Variance % | |||||||||||||
| Securitization Inflows / (Outflows) |
42 | (i) | $ | (1,370 | ) | $ | (1,319 | ) | $ | (51 | ) | (4 | )% | |||||
| Adequate Protection by DCorp to ACCC Term Lenders |
42 | (ii) | (3,392 | ) | (3,287 | ) | (105 | ) | (3 | )% | ||||||||
| Financing Fees |
42 | (iii) | (1,627 | ) | — | (1,627 | ) | N/A | ||||||||||
| Restructuring & Other Items |
42 | (iv) | (10,134 | ) | (5,750 | ) | (4,384 | ) | (76 | )% | ||||||||
| Foreign Exchange Translation |
42 | (v) | 2,209 | — | 2,209 | N/A | ||||||||||||
| $ | (14,314 | ) | $ | (10,356 | ) | $ | (3,958 | ) | (38 | )% | ||||||||
| 42. | The variance analysis with respect to the ACI Group’s financing activities has been compiled based on discussions with Management and the following represents a summary of the reasons for the variances: |
- 14 -
| (i) | Securitization Inflows / (Outflows) were an outflow of approximately $1.4 million and were consistent with the ACI Forecast. |
| (ii) | Adequate Protection by DCorp to ACCC Term Lenders disbursements were approximately $3.4 million and were consistent with the ACI Forecast. |
| (iii) | Financing Fees were approximately $1.6 million and represent a disbursement by the ACI Group to cash collateralize a letter of credit issued to the Ministry of the Environment. The letter of credit is held by the Ministry of the Environment as security against any future clean up costs at the ACI Group’s Thorold, Ontario facility. |
| (iv) | Payments for Restructuring & Other Items totalled approximately $10.1 million compared to a forecast amount of approximately $5.8 million. The variance is a result of the timing of the receipt of invoices for professional services rendered. |
| (v) | Amounts on the Foreign Exchange Translation line represent the difference between the actual exchange rate between Canadian and U.S. dollars at the time of conversion as compared to the forecast rate of CDN$1.00=US$0.98. During the Reporting Period the value of the Canadian dollar fluctuated between US$0.9397 and US$0.9844. |
BCFPI
| 42. | The following table summarizes the receipts and disbursements of BCFPI for the Reporting Period, which is detailed in Appendix “F” of this Sixty-Third Report: |
- 15 -
BCFPI
| US$000 | |||||||||||||||
| Actual | Forecast | Variance | |||||||||||||
| Receipts |
$ | 65,520 | $ | 51,550 | $ | 13,970 | 27 | % | |||||||
| Disbursements |
|||||||||||||||
| Net Trade Disbursements |
(30,149 | ) | (30,118 | ) | (31 | ) | (0 | )% | |||||||
| Intercompany |
(10,382 | ) | — | (10,382 | ) | N/A | |||||||||
| Other |
(21,025 | ) | (16,089 | ) | (4,936 | ) | (31 | )% | |||||||
| (61,556 | ) | (46,207 | ) | (15,349 | ) | (33 | )% | ||||||||
| Financing |
|||||||||||||||
| Interest |
(1,714 | ) | (1,722 | ) | 8 | 0 | % | ||||||||
| Restructuring Costs |
(1,253 | ) | (1,595 | ) | 342 | 21 | % | ||||||||
| Foreign Exchange Translation |
809 | — | 809 | N/A | |||||||||||
| (2,158 | ) | (3,317 | ) | 1,159 | 35 | % | |||||||||
| Net Cash Flows |
1,806 | 2,026 | (220 | ) | (11 | )% | |||||||||
| Opening Cash |
10,811 | 10,811 | — | — | |||||||||||
| Ending Cash |
$ | 12,617 | $ | 12,837 | $ | (220 | ) | (2 | )% | ||||||
| 43. | As detailed in the table above, BCFPI’s total receipts for the Reporting Period were approximately $14.0 million higher than the BCFPI Forecast. Disbursements were approximately $15.3 million higher than the BCFPI Forecast and Financing cash outflows were approximately $1.2 million lower than the BCFPI Forecast. BCFPI had cash on hand of approximately $12.6 million as at September 5, 2010. Overall, the ending cash balance was approximately $0.2 million lower than the BCFPI Forecast. |
Receipts
| 43. | A breakdown of the BCFPI receipts is summarized in the table below: |
| Receipts | Para. | US$000 | Variance % | ||||||||||||||
| Actual | Forecast | Variance | |||||||||||||||
| A/R Collections |
44 | (i) | $ | 13,446 | $ | 54,834 | $ | (41,388 | ) | (75 | )% | ||||||
| Intercompany A/R Settlements |
44 | (i) | 45,517 | — | 45,517 | N/A | |||||||||||
| Total A/R Collections |
44 | (i) | 58,963 | 54,834 | 4,129 | 8 | % | ||||||||||
| Advances from/(to) Bowater Inc. |
44 | (ii) | 2,000 | (7,000 | ) | 9,000 | 129 | % | |||||||||
| Other Inflows |
44 | (iii) | 4,557 | 3,716 | 841 | 23 | % | ||||||||||
| Total Receipts |
$ | 65,520 | $ | 51,550 | $ | 13,970 | 27 | % | |||||||||
- 16 -
| 44. | The variance analysis with respect to receipts has been compiled based on discussions with Management and the following represents a summary of the reasons for the significant variances: |
| (i) | Total A/R Collections were approximately $59.0 million resulting in a positive variance of approximately $4.1 million. This variance is primarily due to the timing of collections from BCFPI’s customers. |
Pursuant to BCFPI’s normal practice and the Cash Management System, sales which are made to customers domiciled in the United States are made through an affiliate, Bowater America Inc. (“BAI”). BAI, which is a subsidiary of BI, collects the accounts receivable from third party customers and then remits these funds through an Intercompany A/R Settlement to BCFPI. BCFPI continues to reconcile its intercompany trade receivables on a regular basis.
| (ii) | On a net basis, Advances from/to Bowater Inc. totalled an advance of $2.0 million during the Reporting Period. Repayments of $7.0 million had been included in the BCFPI Forecast. The variance is primarily due to BCFPI requiring an advance from BI to fund higher than forecast inventory and production in its woodland operations. |
| (iii) | Amounts received related to Other Inflows were approximately $4.6 million during the Reporting Period. Receipts related to Other Inflows were forecast to be approximately $3.7 million, resulting in a positive variance of approximately $0.8 million. This variance was primarily due to higher than forecast collections with respect to local sales at the BCFPI sawmills. |
Disbursements
| 45. | Details regarding BCFPI’s disbursements related to Net Trade Disbursements are summarized in the following table: |
- 17 -
| Para. | US$000 | Variance % | ||||||||||||||||
| Actual | Forecast | Variance | ||||||||||||||||
| Trade Payables |
46 | (i) | $ | (39,570 | ) | $ | (31,018 | ) | $ | (8,552 | ) | (28 | )% | |||||
| Intercompany A/P Settlements - Receipts |
46 | (ii) | 13,004 | 3,170 | 9,834 | 310 | % | |||||||||||
| Intercompany A/P Settlements - Disbursements |
46 | (iii) | (3,583 | ) | — | (3,583 | ) | N/A | ||||||||||
| Capital Expenditures |
46 | (iv) | — | (2,270 | ) | 2,270 | 100 | % | ||||||||||
| Net Trade Disbursements |
$ | (30,149 | ) | $ | (30,118 | ) | $ | (31 | ) | (0 | )% | |||||||
| 46. | The variance analysis with respect to BCFPI’s disbursements has been compiled based on discussions with Management and the following represents a summary of the reasons provided for these variances: |
| (i) | Disbursements related to Trade Payables were approximately $8.6 million higher than projected during the Reporting Period. This negative variance is primarily the result of disbursements related to BCFPI’s sawmills being approximately $9.2 million higher than forecast due to an increase in raw materials inventory, as well as higher than forecast production volumes. Also, Capital Expenditures have been included in the actual amount for Trade Payables disbursements until such time as BCFPI identifies and allocates the disbursements which are capital in nature. |
| (ii) | Intercompany A/P Settlements – Receipts represents BCFPI being reimbursed for disbursements made on behalf of related entities. During the Reporting Period, BCFPI received approximately $13.0 million for disbursements it had made on behalf of the Bowater Mersey Paper Company (“Bowater Mersey”) during July and August, 2010. |
| (iii) | Intercompany A/P Settlements – Disbursements represents BCFPI reimbursing related entities for payments made on its behalf. During the Reporting Period, such payments totalled approximately $3.6 million. |
| (iv) | Capital Expenditures are not tracked on a weekly basis. Accordingly, disbursements for this line item have been included in Trade Payables. |
- 18 -
| Management has advised the Monitor that Capital Expenditures during August, 2010 totalled approximately $2.1 million. |
| 47. | Actual receipts and disbursements related to intercompany transactions are summarized in the table below: |
| Para. | US$000 | Variance % | |||||||||||||||
| Actual | Forecast | Variance | |||||||||||||||
| A/R Collections - Affiliates |
47 | (i) | $ | (1,723 | ) | $ | — | $ | (1,723 | ) | N/A | ||||||
| Intercompany A/R Settlements |
47 | (ii) | (16,818 | ) | — | (16,818 | ) | N/A | |||||||||
| Payments on Behalf of Affiliates |
47 | (iii) | (30,149 | ) | (22,778 | ) | (31 | ) | N/A | ||||||||
| $ | (48,690 | ) | $ | (22,778 | ) | $ | (18,572 | ) | N/A | ||||||||
| (i) | Receipts related to A/R Collections – Affiliates totalled approximately $8.2 million during the Reporting Period. Such amounts are regularly collected by BCFPI as part of the operation of the Cash Management System. |
| (ii) | Payments for Intercompany A/R Settlements totalled approximately $1.7 million during the Reporting Period. Intercompany A/R Settlements represent payments made by BCFPI to reimburse related entities for accounts receivable incorrectly paid to BCFPI by ABH-affiliated customers. |
| (iii) | Payments on Behalf of Affiliates were approximately $16.8 million during the Reporting Period. These payments primarily represent disbursements made by BCFPI on behalf of Bowater Mersey. Due to the integrated nature of the operations of the Petitioners and the Cash Management System, such payments occur on a regular basis. |
| 48. | Disbursements for “Other” items are as follows and are summarized in the table below: |
| Para. | US$000 | Variance % | ||||||||||||||||
| Actual | Forecast | Variance | ||||||||||||||||
| Freight |
48 | (i) | $ | (6,891 | ) | $ | (5,388 | ) | $ | (1,503 | ) | (28 | )% | |||||
| Payroll and Benefits |
48 | (ii) | (14,134 | ) | $ | (10,701 | ) | (3,433 | ) | (32 | )% | |||||||
| $ | (21,025 | ) | $ | (16,089 | ) | $ | (4,936 | ) | (31 | )% | ||||||||
- 19 -
| (i) | Disbursements for Freight were approximately $6.9 million and exceeded the amount in the BCFPI Forecast by $1.5 million. The variance is primarily as a result of a higher proportion of international shipments during the Reporting Period, thereby increasing freight costs. |
| (ii) | During the Reporting Period, payments in respect of Payroll and Benefits totalled approximately $14.1 million. The BCFPI Forecast projected disbursements in the amount of approximately $10.7 million. The variance is a result of the timing of the payment of payroll deductions, the timing of payments related to the employee pension plan and payroll disbursements related to higher than forecast woodland activity. |
Financing
| 49. | Details regarding financing are summarized in the following table: |
| Financing |
Para. | US$000 | Variance % | |||||||||||||
| Actual | Forecast | Variance | ||||||||||||||
| Interest |
50 | (1,714 | ) | (1,722 | ) | 8 | 0 | % | ||||||||
| Restructuring Costs |
51 | (1,253 | ) | (1,595 | ) | 342 | 21 | % | ||||||||
| Foreign Exchange Translation |
52 | 809 | — | 809 | N/A | |||||||||||
| Cash Flow from Financing/Restructuring |
$ | (2,158 | ) | $ | (3,317 | ) | $ | 1,159 | 35 | % | ||||||
| 50. | Disbursements related to Interest were $1.7 million and were consistent with the BCFPI Forecast. |
| 51. | Disbursements related to Restructuring Costs were approximately $0.3 million lower than the BCFPI Forecast. The variance is a result of the timing of the receipt of invoices for professional services rendered. |
| 52. | Amounts on the Foreign Exchange Translation line represent the difference between the actual exchange rate at the time of conversion between Canadian and U.S. dollars as compared to the forecast rate of CDN$1.00=US$0.98. During the Reporting Period the value of the Canadian dollar fluctuated between US$0.9397 and US$0.9844. |
- 20 -
CURRENT LIQUIDITY POSITION AND THE 13-WEEK CASH FLOW FORECASTS
| 53. | Attached as Appendices “G” and “H”, respectively, are the updated 13-week cash flow forecasts of the ACI Group (including DCorp) and BCFPI through December 5, 2010. |
| 54. | As at September 5, 2010, the ACI Group had cash on hand of approximately $126.1 million, Immediately Available Liquidity of approximately $214.9 million and Total Available Liquidity of approximately $323.4 million. |
| 55. | The ACI Group’s actual liquidity to September 5, 2010 and forecast Immediately Available Liquidity for the 13 weeks ending December 5, 2010 is set forth in Appendix “G” and is summarized in the graph below. Forecast liquidity in the chart below assumes the exchange rate between Canadian and U.S. dollars is converted at a rate of CDN$1.00=US$0.98. Actual liquidity has been translated at a rate of either CDN$1.00=US$0.80, CDN$1.00=US$0.90, or CDN$1.00=US$0.98, depending on the period, as the rate employed by the Petitioners to convert Canadian funds to U.S. funds has been adjusted several times since the beginning of these CCAA Proceedings. |
| 56. | The ACI Group’s Immediately Available Liquidity at December 5, 2010, which is the end of the 13-week period in the forecast in Appendix “G”, is projected to be approximately $207.3 million. Amounts in Appendix “G” do not contemplate certain cash flows which may occur as a result of the ACI Group’s targeted emergence from CCAA Proceedings in October, 2010. |
- 21 -
| 57. | The projected Immediately Available Liquidity in the graph above excludes certain items including the ULC DIP Facility Available Upon Court Approval ($49 million), the West Tacoma Proceeds (approximately $4.1 million), the Belgo Proceeds (approximately $1.7 million), the St. Raymond Proceeds (approximately $2.8 million), the Alabama River Equipment Proceeds (approximately $1.3 million), the Mackenzie Proceeds (approximately $27.7 million), the Lufkin Proceeds (approximately $10.2 million) and the Recycling Proceeds (approximately $11.8 million). Thus, the ACI Group’s Total Available Liquidity at December 5, 2010 is projected to be approximately $315.9 million. |
| 58. | Actual results since the date of the issuance of the Initial Order and BCFPI’s forecast liquidity for the 13 weeks ended December 5, 2010, which includes the projected intercompany repayment to BI in the amount of $9.0 million, is set forth in Appendix “H” and is summarized in the graph below. Forecast liquidity in the chart below assumes the exchange rate between Canadian and U.S. dollars is converted at a rate of CDN$1.00=US$0.98. Actual liquidity has been translated at a rate of either CDN$1.00=US$0.80, CDN$1.00=US$0.90, or CDN$1.00=$US$0.98, depending on the period, as the rate employed by the Petitioners to convert Canadian funds to U.S. funds has been adjusted several times since the beginning of these CCAA Proceedings. |
| 59. | On August 26, 2009 and September 1, 2009, this Honourable Court and the U.S. Bankruptcy Court, respectively, approved certain agreements between the ACI Group, BCFPI and Smurfit-Stone Container Canada Inc. (“Smurfit”) relating to the sale of |
- 22 -
| certain timberlands by Smurfit, which will result in BCFPI receiving net proceeds in the amount of approximately CDN$28.7 million (the “Smurfit Timberland Proceeds”). The Smurfit Timberland Proceeds were paid to the Monitor’s trust account in the week ended October 25, 2009 and are to be held in trust by the Monitor pending further order of this Honourable Court. For purposes of the forecast, the proceeds are reflected as being held in trust by the Monitor and are not used for operating purposes due to the uncertainty regarding the timing of the release of these funds. |
| 60. | BCFPI’s liquidity as at December 5, 2010 which is the end of the 13-week period in the forecast in Appendix “H” is projected to be approximately $13.9 million, not including the Smurfit Timberland Proceeds. Amounts in Appendix “H” do not contemplate certain cash flows which may occur as a result of BCFPI’s targeted emergence from CCAA proceedings in October, 2010. |
| 61. | Management has informed the Monitor that BCFPI’s forecast cash requirements will be supported by BI through intercompany advances, as necessary. |
KEY PERFORMANCE INDICATORS
| 62. | As first reported in the seventh report of the Monitor dated June 15, 2009, the Petitioners track certain key performance indicators in the course of managing their business. Appendices “I” and “J” contain certain key performance indicators which have been updated through August 31, 2010, the most current data available as at the date of this Sixty-Third Report. |
- 23 -
All of which is respectfully submitted.
ERNST & YOUNG INC.
in its capacity as the Court-Appointed Monitor
of the Petitioners
Per:
Alex Morrison, CA, CIRP
Senior Vice President
Todd Ambachtsheer, CA, CIRP
Vice President
Andre Greenwood, CA
Manager
- 24 -
APPENDIX “A”
ABITIBI PETITIONERS
| 1. | Abitibi-Consolidated Company of Canada |
| 2. | Abitibi-Consolidated Inc. |
| 3. | 3224112 Nova Scotia Limited |
| 4. | Marketing Donohue Inc. |
| 5. | Abitibi-Consolidated Canadian Office Products Holding Inc. |
| 6. | 3834328 Canada Inc. |
| 7. | 6169678 Canada Inc. |
| 8. | 4042140 Canada Inc. |
| 9. | Donohue Recycling Inc. |
| 10. | 1508756 Ontario Inc. |
| 11. | 3217925 Nova Scotia Company |
| 12. | La Tuque Forest Products Inc. |
| 13. | Abitibi-Consolidated Nova Scotia Incorporated |
| 14. | Saguenay Forest Products Inc. |
| 15. | Terra Nova Explorations Ltd. |
| 16. | The Jonquière Pulp Company |
| 17. | The International Bridge and Terminal Company |
| 18. | Scramble Mining Ltd. |
| 19. | 9150-3383 Québec Inc. |
| 20. | Abitibi-Consolidated (U.K.) Inc. |
- 25 -
APPENDIX “B”
BOWATER PETITIONERS
| 1. | Bowater Canada Finance Corporation |
| 2. | Bowater Canadian Limited |
| 3. | Bowater Canadian Holdings. Inc. |
| 4. | 3231378 Nova Scotia Company |
| 5. | AbitibiBowater Canada Inc. |
| 6. | Bowater Canada Treasury Corporation |
| 7. | Bowater Canadian Forest Products Inc. |
| 8. | Bowater Shelburne Corporation |
| 9. | Bowater LaHave Corporation |
| 10. | St-Maurice River Drive Company Limited |
| 11. | Bowater Treated Wood Inc. |
| 12. | Canexel Hardboard Inc. |
| 13. | 9068-9050 Québec Inc. |
| 14. | Alliance Forest Products Inc. (2001) |
| 15. | Bowater Belledune Sawmill Inc. |
| 16. | Bowater Maritimes Inc. |
| 17. | Bowater Mitis Inc. |
| 18. | Bowater Guérette Inc. |
| 19. | Bowater Couturier Inc. |
- 26 -
APPENDIX “C”
18.6 PETITIONERS
| 1. | AbitibiBowater US Holding 1 Corp. |
| 2. | AbitibiBowater Inc. |
| 3. | Bowater Ventures Inc. |
| 4. | Bowater Incorporated |
| 5. | Bowater Nuway Inc. |
| 6. | Bowater Nuway Mid-States Inc. |
| 7. | Catawba Property Holdings LLC |
| 8. | Bowater Finance Company Inc. |
| 9. | Bowater South American Holdings Incorporated |
| 10. | Bowater America Inc. |
| 11. | Lake Superior Forest Products Inc. |
| 12. | Bowater Newsprint South LLC |
| 13. | Bowater Newsprint South Operations LLC |
| 14. | Bowater Finance II, LLC |
| 15. | Bowater Alabama LLC |
| 16. | Coosa Pines Golf Club Holdings, LLC |
- 27 -
APPENDIX “D”
PARTNERSHIPS
| 1. | Bowater Canada Finance Limited Partnership |
| 2. | Bowater Pulp and Paper Canada Holdings Limited Partnership |
| 3. | Abitibi-Consolidated Finance LP |
- 28 -
APPENDIX “E”
ACI GROUP ACTUAL RECEIPTS AND DISBURSEMENTS
- 29 -
Abitibi-Consolidated Inc. and its Subsidiaries (the “ACI Group”)
Actual to Forecast Comparison
5 Weeks Ended September 5, 2010
US$000
| Actual | ||||||||||||||||||
| Week Ended | 8-Aug-10 | 15-Aug-10 | 22-Aug-10 | 29-Aug-10 | 5-Sep-10 | Total | ||||||||||||
| Opening Cash |
151,871 | 140,613 | 121,341 | 116,997 | 115,885 | 151,871 | ||||||||||||
| Receipts |
||||||||||||||||||
| A/R Collections |
33,400 | 36,952 | 34,302 | 45,669 | 55,213 | 205,536 | ||||||||||||
| Intercompany A/R Settlement |
4,996 | 4,493 | — | 8,747 | 291 | 18,527 | ||||||||||||
| Joint Venture Remittances, Net |
— | (21,309 | ) | — | (1,848 | ) | — | (23,157 | ) | |||||||||
| Collections on Behalf of Joint Ventures |
(14 | ) | 107 | 1,964 | 37 | 209 | 2,303 | |||||||||||
| Net A/R Collections |
38,382 | 20,243 | 36,266 | 52,605 | 55,713 | 203,209 | ||||||||||||
| Other Inflows |
8,910 | 13,882 | 3,337 | 5,626 | 5,012 | 36,767 | ||||||||||||
| Total Receipts |
47,292 | 34,125 | 39,603 | 58,231 | 60,725 | 239,976 | ||||||||||||
| Disbursements |
||||||||||||||||||
| Trade Payables |
(36,768 | ) | (28,730 | ) | (28,156 | ) | (32,254 | ) | (33,181 | ) | (159,089 | ) | ||||||
| Intercompany A/P Settlement - Receipts |
— | 2,563 | 89 | 1,508 | 2,450 | 6,610 | ||||||||||||
| Intercompany A/P Settlements - Disbursements |
— | (2,771 | ) | — | — | — | (2,771 | ) | ||||||||||
| Capital Expenditures |
— | — | — | — | — | — | ||||||||||||
| Net A/P Variance |
(36,768 | ) | (28,938 | ) | (28,067 | ) | (30,746 | ) | (30,731 | ) | (155,250 | ) | ||||||
| A/R Collections - Affiliates |
5,565 | 5,314 | 4,495 | 3,493 | 5,076 | 23,943 | ||||||||||||
| Intercompany A/R Settlements |
(3,988 | ) | (8,119 | ) | (521 | ) | (9,436 | ) | (52 | ) | (22,116 | ) | ||||||
| 1,577 | (2,805 | ) | 3,974 | (5,943 | ) | 5,024 | 1,827 | |||||||||||
| Marine Freight Payments |
(2,515 | ) | (901 | ) | (666 | ) | (2,908 | ) | (2,123 | ) | (9,113 | ) | ||||||
| Utility Payments |
(9,550 | ) | (8,567 | ) | (7,812 | ) | (5,266 | ) | (8,624 | ) | (39,819 | ) | ||||||
| Payroll & Benefits |
(8,292 | ) | (9,895 | ) | (7,167 | ) | (13,515 | ) | (10,231 | ) | (49,100 | ) | ||||||
| Net Other Disbursements |
(20,357 | ) | (19,363 | ) | (15,645 | ) | (21,689 | ) | (20,978 | ) | (98,032 | ) | ||||||
| Total Disbursements |
(55,548 | ) | (51,106 | ) | (39,738 | ) | (58,378 | ) | (46,685 | ) | (251,455 | ) | ||||||
| Financing |
||||||||||||||||||
| Securitization Inflows / (Outflows) |
(687 | ) | — | — | — | (683 | ) | (1,370 | ) | |||||||||
| Adequate Protection by DCorp to ACCC Term Lenders |
— | — | — | — | (3,392 | ) | (3,392 | ) | ||||||||||
| Financing Fees |
— | — | (1,627 | ) | — | — | (1,627 | ) | ||||||||||
| Restructuring & Other Items |
(2,281 | ) | (2,119 | ) | (2,978 | ) | (2,150 | ) | (606 | ) | (10,134 | ) | ||||||
| Foreign Exchange Translation |
(34 | ) | (172 | ) | 396 | 1,185 | 834 | 2,209 | ||||||||||
| (3,002 | ) | (2,291 | ) | (4,209 | ) | (965 | ) | (3,847 | ) | (14,314 | ) | |||||||
| Cash Flow From Operations |
(11,258 | ) | (19,272 | ) | (4,344 | ) | (1,112 | ) | 10,193 | (25,793 | ) | |||||||
| Opening Cash Balance |
151,871 | 140,613 | 121,341 | 116,997 | 115,885 | 151,871 | ||||||||||||
| Cash Flow From Operations |
(11,258 | ) | (19,272 | ) | (4,344 | ) | (1,112 | ) | 10,193 | (25,793 | ) | |||||||
| Ending Cash Balance |
140,613 | 121,341 | 116,997 | 115,885 | 126,078 | 126,078 | ||||||||||||
Note: The above totals are subject to rounding adjustments
- 30 -
Abitibi-Consolidated Inc. and its Subsidiaries (the “ACI Group”)
Actual to Forecast Comparison
5 Weeks Ended September 5, 2010
US$000
| Forecast | ||||||||||||||||||
| Week Ended | 8-Aug-10 | 15-Aug-10 | 22-Aug-10 | 29-Aug-10 | 5-Sep-10 | Total | ||||||||||||
| Opening Cash |
151,871 | 147,617 | 126,447 | 127,888 | 141,746 | 151,871 | ||||||||||||
| Receipts |
||||||||||||||||||
| A/R Collections |
35,922 | 38,613 | 43,067 | 58,687 | 44,555 | 220,844 | ||||||||||||
| Intercompany A/R Settlement |
— | — | — | — | — | — | ||||||||||||
| Joint Venture Remittances, Net |
— | (20,353 | ) | — | (3,195 | ) | — | (23,548 | ) | |||||||||
| Collections on Behalf of Joint Ventures |
4,777 | 4,777 | 4,777 | 4,777 | 4,963 | 24,071 | ||||||||||||
| Net A/R Collections |
40,699 | 23,037 | 47,844 | 60,269 | 49,518 | 221,367 | ||||||||||||
| Other Inflows |
2,822 | 6,620 | 2,822 | 5,899 | 4,824 | 22,987 | ||||||||||||
| Total Receipts |
43,521 | 29,657 | 50,666 | 66,168 | 54,342 | 244,354 | ||||||||||||
| Disbursements |
||||||||||||||||||
| Trade Payables |
(28,463 | ) | (30,463 | ) | (28,463 | ) | (27,463 | ) | (28,919 | ) | (143,771 | ) | ||||||
| Intercompany A/P Settlement - Receipts |
— | — | — | — | — | — | ||||||||||||
| Intercompany A/P Settlements - Disbursements |
— | — | — | — | — | — | ||||||||||||
| Capital Expenditures |
(838 | ) | (838 | ) | (838 | ) | (838 | ) | (858 | ) | (4,210 | ) | ||||||
| Net A/P Variance |
(29,301 | ) | (31,301 | ) | (29,301 | ) | (28,301 | ) | (29,777 | ) | (147,981 | ) | ||||||
| A/R Collections - Affiliates |
— | — | — | — | — | — | ||||||||||||
| Intercompany A/R Settlements |
— | — | — | — | — | — | ||||||||||||
| — | — | — | — | — | — | |||||||||||||
| Marine Freight Payments |
(1,425 | ) | (1,425 | ) | (1,425 | ) | (3,225 | ) | (1,425 | ) | (8,925 | ) | ||||||
| Utility Payments |
(9,182 | ) | (6,500 | ) | (10,315 | ) | (6,500 | ) | (6,043 | ) | (38,540 | ) | ||||||
| Payroll & Benefits |
(6,084 | ) | (10,501 | ) | (7,084 | ) | (13,184 | ) | (9,509 | ) | (46,362 | ) | ||||||
| Net Other Disbursements |
(16,691 | ) | (18,426 | ) | (18,824 | ) | (22,909 | ) | (16,977 | ) | (93,827 | ) | ||||||
| Total Disbursements |
(45,992 | ) | (49,727 | ) | (48,125 | ) | (51,210 | ) | (46,754 | ) | (241,808 | ) | ||||||
| Financing |
||||||||||||||||||
| Securitization Inflows / (Outflows) |
(683 | ) | — | — | — | (636 | ) | (1,319 | ) | |||||||||
| Adequate Protection by DCorp to ACCC Term Lenders |
— | — | — | — | (3,287 | ) | (3,287 | ) | ||||||||||
| Financing Fees |
— | — | — | — | — | — | ||||||||||||
| Restructuring & Other Items |
(1,100 | ) | (1,100 | ) | (1,100 | ) | (1,100 | ) | (1,350 | ) | (5,750 | ) | ||||||
| Foreign Exchange Translation |
— | — | — | — | — | — | ||||||||||||
| (1,783 | ) | (1,100 | ) | (1,100 | ) | (1,100 | ) | (5,273 | ) | (10,356 | ) | |||||||
| Cash Flow From Operations |
(4,254 | ) | (21,170 | ) | 1,441 | 13,858 | 2,315 | (7,810 | ) | |||||||||
| Opening Cash Balance |
151,871 | 147,617 | 126,447 | 127,888 | 141,746 | 151,871 | ||||||||||||
| Cash Flow From Operations |
(4,254 | ) | (21,170 | ) | 1,441 | 13,858 | 2,315 | (7,810 | ) | |||||||||
| Ending Cash Balance |
147,617 | 126,447 | 127,888 | 141,746 | 144,061 | 144,061 | ||||||||||||
Note: The above totals are subject to rounding adjustments
- 31 -
Abitibi-Consolidated Inc. and its Subsidiaries (the “ACI Group”)
Actual to Forecast Comparison
5 Weeks Ended September 5, 2010
US$000
| Variance | ||||||||||||||||||
| Week Ended | 8-Aug-10 | 15-Aug-10 | 22-Aug-10 | 29-Aug-10 | 5-Sep-10 | Total | ||||||||||||
| Opening Cash |
— | (7,004 | ) | (5,106 | ) | (10,891 | ) | (25,861 | ) | — | ||||||||
| Receipts | ||||||||||||||||||
| A/R Collections |
(2,522 | ) | (1,661 | ) | (8,765 | ) | (13,018 | ) | 10,658 | (15,308 | ) | |||||||
| Intercompany A/R Settlement |
4,996 | 4,493 | — | 8,747 | 291 | 18,527 | ||||||||||||
| Joint Venture Remittances, Net |
— | (956 | ) | — | 1,347 | — | 391 | |||||||||||
| Collections on Behalf of Joint Ventures |
(4,791 | ) | (4,670 | ) | (2,813 | ) | (4,740 | ) | (4,754 | ) | (21,768 | ) | ||||||
| Net A/R Collections |
(2,317 | ) | (2,794 | ) | (11,578 | ) | (7,664 | ) | 6,195 | (18,158 | ) | |||||||
| Other Inflows |
6,088 | 7,262 | 515 | (273 | ) | 188 | 13,780 | |||||||||||
| Total Receipts |
3,771 | 4,468 | (11,063 | ) | (7,937 | ) | 6,383 | (4,378 | ) | |||||||||
| Disbursements | ||||||||||||||||||
| Trade Payables |
(8,305 | ) | 1,733 | 307 | (4,791 | ) | (4,262 | ) | (15,318 | ) | ||||||||
| Intercompany A/P Settlement - Receipts |
— | 2,563 | 89 | 1,508 | 2,450 | 6,610 | ||||||||||||
| Intercompany A/P Settlements - Disbursements |
— | (2,771 | ) | — | — | — | (2,771 | ) | ||||||||||
| Capital Expenditures |
838 | 838 | 838 | 838 | 858 | 4,210 | ||||||||||||
| Net A/P Variance |
(7,467 | ) | 2,363 | 1,234 | (2,445 | ) | (954 | ) | (7,269 | ) | ||||||||
| A/R Collections - Affiliates |
5,565 | 5,314 | 4,495 | 3,493 | 5,076 | 23,943 | ||||||||||||
| Intercompany A/R Settlements |
(3,988 | ) | (8,119 | ) | (521 | ) | (9,436 | ) | (52 | ) | (22,116 | ) | ||||||
| 1,577 | (2,805 | ) | 3,974 | (5,943 | ) | 5,024 | 1,827 | |||||||||||
| Marine Freight Payments |
(1,090 | ) | 524 | 759 | 317 | (698 | ) | (188 | ) | |||||||||
| Utility Payments |
(368 | ) | (2,067 | ) | 2,503 | 1,234 | (2,581 | ) | (1,279 | ) | ||||||||
| Payroll & Benefits |
(2,208 | ) | 606 | (83 | ) | (331 | ) | (722 | ) | (2,738 | ) | |||||||
| Net Other Disbursements |
(3,666 | ) | (937 | ) | 3,179 | 1,220 | (4,001 | ) | (4,205 | ) | ||||||||
| Total Disbursements |
(9,556 | ) | (1,379 | ) | 8,387 | (7,168 | ) | 69 | (9,647 | ) | ||||||||
| Financing | ||||||||||||||||||
| Securitization Inflows / (Outflows) |
(4 | ) | — | — | — | (47 | ) | (51 | ) | |||||||||
| Adequate Protection by DCorp to ACCC Term Lenders |
— | — | — | — | (105 | ) | (105 | ) | ||||||||||
| Financing Fees |
— | — | (1,627 | ) | — | — | (1,627 | ) | ||||||||||
| Restructuring & Other Items |
(1,181 | ) | (1,019 | ) | (1,878 | ) | (1,050 | ) | 744 | (4,384 | ) | |||||||
| Foreign Exchange Translation |
(34 | ) | (172 | ) | 396 | 1,185 | 834 | 2,209 | ||||||||||
| (1,219 | ) | (1,191 | ) | (3,109 | ) | 135 | 1,426 | (3,958 | ) | |||||||||
| Cash Flow From Operations |
(7,004 | ) | 1,898 | (5,785 | ) | (14,970 | ) | 7,878 | (17,983 | ) | ||||||||
| Opening Cash Balance |
— | (7,004 | ) | (5,106 | ) | (10,891 | ) | (25,861 | ) | — | ||||||||
| Cash Flow From Operations |
(7,004 | ) | 1,898 | (5,785 | ) | (14,970 | ) | 7,878 | (17,983 | ) | ||||||||
| Ending Cash Balance |
(7,004 | ) | (5,106 | ) | (10,891 | ) | (25,861 | ) | (17,983 | ) | (17,983 | ) | ||||||
Note: The above totals are subject to rounding adjustments
- 32 -
APPENDIX “F”
BCFPI ACTUAL RECEIPTS AND DISBURSEMENTS
- 33 -
Bowater Canadian Forest Products Inc. (“BCFPI”)
Actual to Forecast Comparison
5 Weeks Ended September 5, 2010
US$000
| Actual | ||||||||||||||||||
| Week Ended | 8-Aug-10 | 15-Aug-10 | 22-Aug-10 | 29-Aug-10 | 5-Sep-10 | Total | ||||||||||||
| Opening Cash |
10,811 | 12,478 | 10,330 | 11,922 | 16,735 | 10,811 | ||||||||||||
| Receipts |
||||||||||||||||||
| A/R Collections |
2,849 | 2,510 | 2,288 | 1,769 | 4,030 | 13,446 | ||||||||||||
| Intercompany A/R Settlements |
9,332 | 8,420 | 12,809 | 5,795 | 9,161 | 45,517 | ||||||||||||
| Total A/R Collections |
12,181 | 10,930 | 15,097 | 7,564 | 13,191 | 58,963 | ||||||||||||
| Advances from Bowater Inc. |
(2,000 | ) | — | 5,000 | 3,000 | (4,000 | ) | 2,000 | ||||||||||
| Other Inflows |
825 | 1,792 | 466 | 416 | 1,058 | 4,557 | ||||||||||||
| Total Receipts |
11,006 | 12,722 | 20,563 | 10,980 | 10,249 | 65,520 | ||||||||||||
| Disbursements |
||||||||||||||||||
| Trade Payables |
(5,025 | ) | (11,841 | ) | (6,569 | ) | (10,189 | ) | (5,946 | ) | (39,570 | ) | ||||||
| Intercompany A/P Settlements - Receipts |
— | 5,941 | — | 7,063 | — | 13,004 | ||||||||||||
| Intercompany A/P Settlements - Disbursements |
— | (2,473 | ) | (23 | ) | (23 | ) | (1,064 | ) | (3,583 | ) | |||||||
| Capital Expenditures |
— | — | — | — | — | — | ||||||||||||
| Net A/P |
(5,025 | ) | (8,373 | ) | (6,592 | ) | (3,149 | ) | (7,010 | ) | (30,149 | ) | ||||||
| A/R Collections - Affiliates |
2,999 | 723 | 701 | 1,150 | 2,586 | 8,159 | ||||||||||||
| Intercompany A/R Settlements |
(100 | ) | (1,444 | ) | — | (64 | ) | (115 | ) | (1,723 | ) | |||||||
| Payments on Behalf of Affiliates |
(2,124 | ) | (2,246 | ) | (8,591 | ) | (772 | ) | (3,085 | ) | (16,818 | ) | ||||||
| 775 | (2,967 | ) | (7,890 | ) | 314 | (614 | ) | (10,382 | ) | |||||||||
| Freight |
(1,518 | ) | (1,388 | ) | (1,290 | ) | (1,093 | ) | (1,602 | ) | (6,891 | ) | ||||||
| Payroll and Benefits |
(2,548 | ) | (2,163 | ) | (2,748 | ) | (2,188 | ) | (4,487 | ) | (14,134 | ) | ||||||
| Total Disbursements |
(8,316 | ) | (14,891 | ) | (18,520 | ) | (6,116 | ) | (13,713 | ) | (61,556 | ) | ||||||
| Cash Flow From Operations |
2,690 | (2,169 | ) | 2,043 | 4,864 | (3,464 | ) | 3,964 | ||||||||||
| Financing |
||||||||||||||||||
| Interest |
(814 | ) | — | — | (72 | ) | (828 | ) | (1,714 | ) | ||||||||
| Restructuring Costs |
(216 | ) | (91 | ) | (585 | ) | (234 | ) | (127 | ) | (1,253 | ) | ||||||
| Foreign Exchange Translation |
7 | 112 | 134 | 255 | 301 | 809 | ||||||||||||
| Cash Flow from Financing/Restructuring |
(1,023 | ) | 21 | (451 | ) | (51 | ) | (654 | ) | (2,158 | ) | |||||||
| Net Cash Flows |
1,667 | (2,148 | ) | 1,592 | 4,813 | (4,118 | ) | 1,806 | ||||||||||
| Opening Cash Balance |
10,811 | 12,478 | 10,330 | 11,922 | 16,735 | 10,811 | ||||||||||||
| Cash Flow From Operations |
1,667 | (2,148 | ) | 1,592 | 4,813 | (4,118 | ) | 1,806 | ||||||||||
| Ending Cash Balance |
12,478 | 10,330 | 11,922 | 16,735 | 12,617 | 12,617 | ||||||||||||
Note: The above totals are subject to rounding adjustments
- 34 -
Bowater Canadian Forest Products Inc. (“BCFPI”)
Actual to Forecast Comparison
5 Weeks Ended September 5, 2010
US$000
| Forecast | ||||||||||||||||||
| Week Ended | 8-Aug-10 | 15-Aug-10 | 22-Aug-10 | 29-Aug-10 | 5-Sep-10 | Total | ||||||||||||
| Opening Cash |
10,811 | 10,719 | 10,441 | 9,678 | 16,798 | 10,811 | ||||||||||||
| Receipts |
||||||||||||||||||
| A/R Collections |
10,211 | 8,948 | 9,728 | 16,141 | 9,806 | 54,834 | ||||||||||||
| Intercompany A/R Settlements |
— | — | — | — | — | — | ||||||||||||
| Total A/R Collections |
10,211 | 8,948 | 9,728 | 16,141 | 9,806 | 54,834 | ||||||||||||
| Advances from Bowater Inc. |
(2,000 | ) | (3,000 | ) | (1,000 | ) | (1,000 | ) | — | (7,000 | ) | |||||||
| Other Inflows |
2,316 | 350 | 350 | 350 | 350 | 3,716 | ||||||||||||
| Total Receipts |
10,527 | 6,298 | 9,078 | 15,491 | 10,156 | 51,550 | ||||||||||||
| Disbursements |
||||||||||||||||||
| Trade Payables |
(6,035 | ) | (6,035 | ) | (6,035 | ) | (6,035 | ) | (6,878 | ) | (31,018 | ) | ||||||
| Intercompany A/P Settlements - Receipts |
— | 3,170 | — | — | — | 3,170 | ||||||||||||
| Intercompany A/P Settlements - Disbursements |
— | — | — | — | — | — | ||||||||||||
| Capital Expenditures |
(452 | ) | (452 | ) | (452 | ) | (452 | ) | (462 | ) | (2,270 | ) | ||||||
| Net A/P |
(6,487 | ) | (3,317 | ) | (6,487 | ) | (6,487 | ) | (7,340 | ) | (30,118 | ) | ||||||
| A/R Collections - Affiliates |
— | — | — | — | — | — | ||||||||||||
| Intercompany A/R Settlements |
— | — | — | — | — | — | ||||||||||||
| Payments on Behalf of Affiliates |
— | — | — | — | — | — | ||||||||||||
| — | — | — | — | — | — | |||||||||||||
| Freight |
(1,073 | ) | (1,073 | ) | (1,073 | ) | (1,073 | ) | (1,096 | ) | (5,388 | ) | ||||||
| Payroll and Benefits |
(1,909 | ) | (1,867 | ) | (1,902 | ) | (492 | ) | (4,531 | ) | (10,701 | ) | ||||||
| Total Disbursements |
(9,469 | ) | (6,257 | ) | (9,462 | ) | (8,052 | ) | (12,967 | ) | (46,207 | ) | ||||||
| Cash Flow From Operations |
1,058 | 41 | (384 | ) | 7,439 | (2,811 | ) | 5,343 | ||||||||||
| Financing |
||||||||||||||||||
| Interest |
(831 | ) | — | (60 | ) | — | (831 | ) | (1,722 | ) | ||||||||
| Restructuring Costs |
(319 | ) | (319 | ) | (319 | ) | (319 | ) | (319 | ) | (1,595 | ) | ||||||
| Foreign Exchange Translation |
— | — | — | — | — | — | ||||||||||||
| Cash Flow from Financing/Restructuring |
(1,150 | ) | (319 | ) | (379 | ) | (319 | ) | (1,150 | ) | (3,317 | ) | ||||||
| Net Cash Flows |
(92 | ) | (278 | ) | (763 | ) | 7,120 | (3,961 | ) | 2,026 | ||||||||
| Opening Cash Balance |
10,811 | 10,719 | 10,441 | 9,678 | 16,798 | 10,811 | ||||||||||||
| Cash Flow From Operations |
(92 | ) | (278 | ) | (763 | ) | 7,120 | (3,961 | ) | 2,026 | ||||||||
| Ending Cash Balance |
10,719 | 10,441 | 9,678 | 16,798 | 12,837 | 12,837 | ||||||||||||
Note: The above totals are subject to rounding adjustments
- 35 -
Bowater Canadian Forest Products Inc. (“BCFPI”)
Actual to Forecast Comparison
5 Weeks Ended September 5, 2010
US$000
| Variance | ||||||||||||||||||
| Week Ended | 8-Aug-10 | 15-Aug-10 | 22-Aug-10 | 29-Aug-10 | 5-Sep-10 | Total | ||||||||||||
| Opening Cash |
— | 1,759 | (111 | ) | 2,244 | (63 | ) | — | ||||||||||
| Receipts |
||||||||||||||||||
| A/R Collections |
(7,362 | ) | (6,438 | ) | (7,440 | ) | (14,372 | ) | (5,776 | ) | (41,388 | ) | ||||||
| Intercompany A/R Settlements |
9,332 | 8,420 | 12,809 | 5,795 | 9,161 | 45,517 | ||||||||||||
| Total A/R Collections |
1,970 | 1,982 | 5,369 | (8,577 | ) | 3,385 | 4,129 | |||||||||||
| Advances from Bowater Inc. |
— | 3,000 | 6,000 | 4,000 | (4,000 | ) | 9,000 | |||||||||||
| Other Inflows |
(1,491 | ) | 1,442 | 116 | 66 | 708 | 841 | |||||||||||
| Total Receipts |
479 | 6,424 | 11,485 | (4,511 | ) | 93 | 13,970 | |||||||||||
| Disbursements |
||||||||||||||||||
| Trade Payables |
1,010 | (5,806 | ) | (534 | ) | (4,154 | ) | 932 | (8,552 | ) | ||||||||
| Intercompany A/P Settlements - Receipts |
— | 2,771 | — | 7,063 | — | 9,834 | ||||||||||||
| Intercompany A/P Settlements - Disbursements |
— | (2,473 | ) | (23 | ) | (23 | ) | (1,064 | ) | (3,583 | ) | |||||||
| Capital Expenditures |
452 | 452 | 452 | 452 | 462 | 2,270 | ||||||||||||
| Net A/P |
1,462 | (5,056 | ) | (105 | ) | 3,338 | 330 | (31 | ) | |||||||||
| A/R Collections - Affiliates |
2,999 | 723 | 701 | 1,150 | 2,586 | 8,159 | ||||||||||||
| Intercompany A/R Settlements |
(100 | ) | (1,444 | ) | — | (64 | ) | (115 | ) | (1,723 | ) | |||||||
| Payments on Behalf of Affiliates |
(2,124 | ) | (2,246 | ) | (8,591 | ) | (772 | ) | (3,085 | ) | (16,818 | ) | ||||||
| 775 | (2,967 | ) | (7,890 | ) | 314 | (614 | ) | (10,382 | ) | |||||||||
| Freight |
(445 | ) | (315 | ) | (217 | ) | (20 | ) | (506 | ) | (1,503 | ) | ||||||
| Payroll and Benefits |
(639 | ) | (296 | ) | (846 | ) | (1,696 | ) | 44 | (3,433 | ) | |||||||
| Total Disbursements |
1,153 | (8,634 | ) | (9,058 | ) | 1,936 | (746 | ) | (15,349 | ) | ||||||||
| Cash Flow From Operations |
1,632 | (2,210 | ) | 2,427 | (2,575 | ) | (653 | ) | (1,379 | ) | ||||||||
| Financing |
||||||||||||||||||
| Interest |
17 | — | 60 | (72 | ) | 3 | 8 | |||||||||||
| Restructuring Costs |
103 | 228 | (266 | ) | 85 | 192 | 342 | |||||||||||
| Foreign Exchange Translation |
7 | 112 | 134 | 255 | 301 | 809 | ||||||||||||
| Cash Flow from Financing/Restructuring |
127 | 340 | (72 | ) | 268 | 496 | 1,159 | |||||||||||
| Net Cash Flows |
1,759 | (1,870 | ) | 2,355 | (2,307 | ) | (157 | ) | (220 | ) | ||||||||
| Opening Cash Balance |
— | 1,759 | (111 | ) | 2,244 | (63 | ) | — | ||||||||||
| Cash Flow From Operations |
1,759 | (1,870 | ) | 2,355 | (2,307 | ) | (157 | ) | (220 | ) | ||||||||
| Ending Cash Balance |
1,759 | (111 | ) | 2,244 | (63 | ) | (220 | ) | (220 | ) | ||||||||
Note: The above totals are subject to rounding adjustments
- 36 -
APPENDIX “G”
ACI GROUP CASH FLOW FORECAST
- 37 -
Abitibi Consolidated Inc. and its subsidiaries (the “ACI Group”)
Weekly Cash Flow Forecast
13 Weeks Ending December 5, 2010
US$000
| Week ended | Notes | 12-Sep-10 | 19-Sep-10 | 26-Sep-10 | 3-Oct-10 | 10-Oct-10 | 17-Oct-10 | 24-Oct-10 | 31-Oct-10 | 7-Nov-10 | 14-Nov-10 | 21-Nov-10 | 28-Nov-10 | 5-Dec-10 | Total | |||||||||||||||||||||||||||||
| Opening Cash |
1 | 126,078 | 124,731 | 102,186 | 94,326 | 101,953 | 118,934 | 101,890 | 107,390 | 107,504 | 120,600 | 123,292 | 105,173 | 105,458 | 126,078 | |||||||||||||||||||||||||||||
| Receipts | ||||||||||||||||||||||||||||||||||||||||||||
| Total A/R Collections |
3 | 39,735 | 35,623 | 41,699 | 52,802 | 40,246 | 43,125 | 45,122 | 50,429 | 43,281 | 42,944 | 41,065 | 43,276 | 53,830 | 573,177 | |||||||||||||||||||||||||||||
| Collections on Behalf of Joint Ventures |
4 | 5,037 | 5,037 | 5,037 | 4,821 | 4,532 | 4,532 | 4,532 | 4,532 | 5,157 | 5,157 | 5,157 | 5,157 | 4,937 | 63,625 | |||||||||||||||||||||||||||||
| Other Inflows |
5 | 2,826 | 6,620 | 6,688 | 4,822 | 15,558 | 2,750 | 2,818 | 8,767 | 8,229 | 2,827 | 2,750 | 2,750 | 4,824 | 72,229 | |||||||||||||||||||||||||||||
| Total Receipts |
47,598 | 47,281 | 53,425 | 62,445 | 60,336 | 50,407 | 52,471 | 63,727 | 56,666 | 50,928 | 48,972 | 51,183 | 63,591 | 709,031 | ||||||||||||||||||||||||||||||
| Disbursements | ||||||||||||||||||||||||||||||||||||||||||||
| Trade Payables |
6 | (29,901 | ) | (31,901 | ) | (30,901 | ) | (29,545 | ) | (28,070 | ) | (28,070 | ) | (28,070 | ) | (28,070 | ) | (27,424 | ) | (27,424 | ) | (27,424 | ) | (27,424 | ) | (28,864 | ) | (373,091 | ) | |||||||||||||||
| Capital Expenditures |
7 | (866 | ) | (866 | ) | (866 | ) | (850 | ) | (829 | ) | (829 | ) | (829 | ) | (829 | ) | (834 | ) | (834 | ) | (834 | ) | (834 | ) | (807 | ) | (10,904 | ) | |||||||||||||||
| Marine Freight Payments |
8 | (1,425 | ) | (1,425 | ) | (3,225 | ) | (1,425 | ) | (1,425 | ) | (1,425 | ) | (1,425 | ) | (3,225 | ) | (1,425 | ) | (1,425 | ) | (1,425 | ) | (3,225 | ) | (1,425 | ) | (23,925 | ) | |||||||||||||||
| Utility Payments |
9 | (6,794 | ) | (6,794 | ) | (10,494 | ) | (7,480 | ) | (6,794 | ) | (6,794 | ) | (10,410 | ) | (6,794 | ) | (6,794 | ) | (6,794 | ) | (10,633 | ) | (6,794 | ) | (6,337 | ) | (99,706 | ) | |||||||||||||||
| Payroll & Benefits |
10 | (8,858 | ) | (6,658 | ) | (11,508 | ) | (10,326 | ) | (5,137 | ) | (10,712 | ) | (5,137 | ) | (16,860 | ) | (5,333 | ) | (10,659 | ) | (5,683 | ) | (8,333 | ) | (13,952 | ) | (119,156 | ) | |||||||||||||||
| Joint Venture Remittances, Net |
11 | — | (21,081 | ) | (3,191 | ) | — | — | (18,520 | ) | — | (3,198 | ) | — | — | (19,992 | ) | (3,189 | ) | — | (69,171 | ) | ||||||||||||||||||||||
| Restructuring & Other Items |
12 | (1,100 | ) | (1,100 | ) | (1,100 | ) | (1,350 | ) | (1,100 | ) | (1,100 | ) | (1,100 | ) | (1,350 | ) | (1,100 | ) | (1,100 | ) | (1,100 | ) | (1,100 | ) | (1,350 | ) | (15,050 | ) | |||||||||||||||
| Total Disbursements |
(48,945 | ) | (69,825 | ) | (61,285 | ) | (50,976 | ) | (43,355 | ) | (67,450 | ) | (46,971 | ) | (60,326 | ) | (42,910 | ) | (48,237 | ) | (67,090 | ) | (50,899 | ) | (52,734 | ) | (711,004 | ) | ||||||||||||||||
| Financing | ||||||||||||||||||||||||||||||||||||||||||||
| Repayment / Interest Under Securitization Program |
13 | — | — | — | (661 | ) | — | — | — | — | (661 | ) | — | — | — | (661 | ) | (1,983 | ) | |||||||||||||||||||||||||
| Adequate Protection and Fees by DCorp to ACCC Term Lenders |
14 | — | — | — | (3,181 | ) | — | — | — | (3,287 | ) | — | — | — | — | (3,181 | ) | (9,648 | ) | |||||||||||||||||||||||||
| Total Financing |
— | — | — | (3,842 | ) | — | — | — | (3,287 | ) | (661 | ) | — | — | — | (3,842 | ) | (11,632 | ) | |||||||||||||||||||||||||
| Total Change in Cash |
(1,347 | ) | (22,544 | ) | (7,860 | ) | 7,627 | 16,980 | (17,043 | ) | 5,500 | 114 | 13,096 | 2,692 | (18,119 | ) | 285 | 7,015 | (13,605 | ) | ||||||||||||||||||||||||
| Ending Cash Balance |
124,731 | 102,186 | 94,326 | 101,953 | 118,934 | 101,890 | 107,390 | 107,504 | 120,600 | 123,292 | 105,173 | 105,458 | 112,473 | 112,473 | ||||||||||||||||||||||||||||||
| Ending Cash Balance |
124,731 | 102,186 | 94,326 | 101,953 | 118,934 | 101,890 | 107,390 | 107,504 | 120,600 | 123,292 | 105,173 | 105,458 | 112,473 | 112,473 | ||||||||||||||||||||||||||||||
| ULC DIP Facility Available Upon Notice |
15 | 49,000 | 49,000 | 49,000 | 49,000 | 49,000 | 49,000 | 49,000 | 49,000 | 49,000 | 49,000 | 49,000 | 49,000 | 49,000 | 49,000 | |||||||||||||||||||||||||||||
| Availability Under Securitization Program |
13 | 45,885 | 46,033 | 57,040 | 58,764 | 50,591 | 48,761 | 50,270 | 47,907 | 49,896 | 50,290 | 50,889 | 45,477 | 45,875 | 45,875 | |||||||||||||||||||||||||||||
| Immediately Available Liquidity |
219,616 | 197,219 | 200,367 | 209,717 | 218,524 | 199,652 | 206,661 | 204,411 | 219,496 | 222,581 | 205,062 | 199,934 | 207,348 | 207,348 | ||||||||||||||||||||||||||||||
| ULC DIP Facility Available Upon Court Approval |
15 | 49,000 | 49,000 | 49,000 | 49,000 | 49,000 | 49,000 | 49,000 | 49,000 | 49,000 | 49,000 | 49,000 | 49,000 | 49,000 | 49,000 | |||||||||||||||||||||||||||||
| West Tacoma Proceeds Held in Trust |
16 | 4,051 | 4,051 | 4,051 | 4,051 | 4,051 | 4,051 | 4,051 | 4,051 | 4,051 | 4,051 | 4,051 | 4,051 | 4,051 | 4,051 | |||||||||||||||||||||||||||||
| Belgo Proceeds Held in Trust |
16 | 1,734 | 1,734 | 1,734 | 1,734 | 1,734 | 1,734 | 1,734 | 1,734 | 1,734 | 1,734 | 1,734 | 1,734 | 1,734 | 1,734 | |||||||||||||||||||||||||||||
| Lufkin Proceeds Held in Trust |
16 | 10,236 | 10,236 | 10,236 | 10,236 | 10,236 | 10,236 | 10,236 | 10,236 | 10,236 | 10,236 | 10,236 | 10,236 | 10,236 | 10,236 | |||||||||||||||||||||||||||||
| Recycling Proceeds Held in Trust |
16 | 11,765 | 11,765 | 11,765 | 11,765 | 11,765 | 11,765 | 11,765 | 11,765 | 11,765 | 11,765 | 11,765 | 11,765 | 11,765 | 11,765 | |||||||||||||||||||||||||||||
| Mackenzie Proceeds Held in Trust |
16 | 27,710 | 27,710 | 27,710 | 27,710 | 27,710 | 27,710 | 27,710 | 27,710 | 27,710 | 27,710 | 27,710 | 27,710 | 27,710 | 27,710 | |||||||||||||||||||||||||||||
| St. Raymond Proceeds Held in Trust |
16 | 2,810 | 2,810 | 2,810 | 2,810 | 2,810 | 2,810 | 2,810 | 2,810 | 2,810 | 2,810 | 2,810 | 2,810 | 2,810 | 2,810 | |||||||||||||||||||||||||||||
| Alabama River Equipment Proceeds Held in Trust |
16 | 1,250 | 1,250 | 1,250 | 1,250 | 1,250 | 1,250 | 1,250 | 1,250 | 1,250 | 1,250 | 1,250 | 1,250 | 1,250 | 1,250 | |||||||||||||||||||||||||||||
| Total Available Liquidity |
15, 16 |
328,172 | 305,775 | 308,922 | 318,272 | 327,080 | 308,207 | 315,216 | 312,966 | 328,051 | 331,137 | 313,618 | 308,490 | 315,904 | 315,904 | |||||||||||||||||||||||||||||
| Securitization Schedule |
17 | |||||||||||||||||||||||||||||||||||||||||||
| Availability Based on Receivable Pool Balance |
165,591 | 165,738 | 176,746 | 178,469 | 170,296 | 168,467 | 169,976 | 167,612 | 169,602 | 169,995 | 170,595 | 165,182 | 165,581 | 165,581 | ||||||||||||||||||||||||||||||
| Amount Drawn Under Facility |
119,706 | 119,706 | 119,706 | 119,706 | 119,706 | 119,706 | 119,706 | 119,706 | 119,706 | 119,706 | 119,706 | 119,706 | 119,706 | 119,706 | ||||||||||||||||||||||||||||||
| Available Liquidity Before Interest, Fees and Repayments |
45,885 | 46,033 | 57,040 | 58,764 | 50,591 | 48,761 | 50,270 | 47,907 | 49,896 | 50,290 | 50,889 | 45,477 | 45,875 | 45,875 | ||||||||||||||||||||||||||||||
| Interest and Repayments |
18 | — | — | — | (661 | ) | — | — | — | — | (661 | ) | — | — | — | (661 | ) | (1,983 | ) | |||||||||||||||||||||||||
| Restricted ULC Reserve Deposit |
19 | 51,254 | 51,254 | 51,254 | 51,254 | 51,254 | 51,254 | 51,254 | 51,254 | 51,254 | 51,254 | 51,254 | 51,254 | 51,254 | 51,254 | |||||||||||||||||||||||||||||
The above forecast uses an exchange rate of CDN$1.00=US$0.98.
Note: The above totals are subject to rounding adjustments in the underlying balances.
The information and analysis in this document have not been audited or reviewed and, accordingly, no assurances are provided thereon. In addition, because forecasts are dependent upon numerous assumptions regarding future events, actual results will be different than forecast, and such differences may be material.
- 38 -
Abitibi Consolidated Inc. and its subsidiaries (the “ACI Group”)
Notes to Weekly Cash Flow Forecast
13 Weeks Ending December 5, 2010
US$000
| 1. | Opening Cash in the forecast includes cash on hand. |
| 2. | The cash flow forecast includes mills owned by the ACI Group and its subsidiaries and includes the operations of the DCorp Group. This weekly cash flow forecast may differ from the ACI Monthly Forecast as the underlying assumptions are updated weekly and will vary with the ongoing operations of the ACI Group, whereas the ACI Monthly Forecast is based on longer-term assumptions used to forecast future monthly cash flow. |
| 3. | Total A/R Collections represent amounts estimated to be collected from the ACI Group’s customers. The timing of collections is based on the ACI Group’s collection terms with its customers and the latest sales forecast. |
| 4. | Collections on Behalf of Joint Ventures represent amounts estimated to be collected by the ACI Group on behalf of its joint venture partners. The ACI Group has agreements with its joint venture partners whereby the ACI Group collects the joint venture partners’ accounts receivable (for a fee) and remits these funds to the joint venture in accordance with their agreement. |
| 5. | Other Inflows represent miscellaneous receipts including, but not limited to, such items as tax refunds, insurance proceeds or collection/management fees received from joint ventures, as estimated by the ACI Group. |
| 6. | Trade Payables represent amounts estimated to be paid to suppliers for the purchase of the ACI Group’s raw materials, repairs and maintenance and other goods and services related to production. Also included are disbursements related to selling, general and administration expenses. |
| 7. | Capital Expenditures represent amounts estimated to be paid pursuant to the ACI Group’s most recent capital expenditure budget. |
| 8. | Marine Freight Payments represent amounts estimated to be paid to the ACI Group’s outbound marine freight suppliers. |
| 9. | Utility Payments represent amounts estimated to be payable to the ACI Group’s utility suppliers. |
| 10. | Payroll and Benefits represent estimated amounts for salaries, wages, benefits and current service pension costs. |
| 11. | Joint Venture Remittances, Net represent the estimated payment of accounts receivable funds collected by the ACI Group on behalf of the respective joint venture, net of any collection/management fees. |
| 12. | Restructuring and Other Items represent amounts estimated by the ACI Group for restructuring costs and other miscellaneous payments. |
| 13. | Under the June 2010 Securitization Program, the ACI Group will not draw on the available capital unless such a draw is required for liquidity purposes. However, borrowing availability under the June 2010 Securitization Program is still immediately available as liquidity. The Repayment/Interest Under the Securitization Program represents the estimated repayment (including interest) of funds. Availability Under the Securitization Program represents the amount of immediately available liquidity under the ACI Group’s June 2010 Securitization Program. |
| 14. | Adequate Protection and fees by DCorp to ACCC Term Lenders represents an estimate of payments pursuant to the adequate protection order issued by the U.S. Bankruptcy Court. |
| 15. | Immediately Available Liquidity is calculated as cash on hand, amounts available under the June 2010 Securitization Program and the portion of the ULC DIP Facility that is available upon notice ($49 million). Total Available Liquidity includes an additional $49 million of the ULC Reserve, which availability is subject to Court approval, as well as the Mackenzie Proceeds Held in Trust, Lufkin Proceeds Held in Trust, Recycling Proceeds Held in Trust, West Tacoma Proceeds Held in Trust, St. Raymond Proceeds Held in Trust, Belgo Proceeds Held in Trust and Alabama River Equipment Proceeds Held in Trust, available upon 10 days’ notice to the agent for the ACCC Term Lenders. |
| 16. | The net proceeds from the sale of the Mackenzie mill ($27.7 million), recycling assets ($11.8 million), St. Raymond mill ($2.8 million), Lufkin mill ($10.2 million), West Tacoma mill ($4.1 million), Belgo mill ($1.7 million) and Alabama River equipment ($1.3 million) will be held in trust or a designated account and are only available upon 10 days’ notice to the agent for the ACCC Term Lenders. |
| 17. | The Securitization Summary represents the ACI Group’s estimated calculation of amounts owing or available under the June 2010 Securitization Program based on the eligible accounts receivable (net of any fees, interest or allowances). |
| 18. | The Interest and Repayments represent interest related to the June 2010 Securitization Program, as well as repayments of funds. |
| 19. | Based on the current foreign exchange rate used in the forecast of CDN$1.00=USD$0.98, of the $276.7 million ($254.1 million at $0.90 USD FX) paid to the ULC Reserve, the Company drew $127.4 million ($117 million at $0.90 USD FX) as of the date of closing of the MPCo sale and has $49 million ($45 million at $0.90 USD FX) immediately available for liquidity purposes, with an additional $49 million ($45 million at $0.90 USD FX) availability subject to Court approval. The remaining $51.3 million ($47.1 million at 0.$90 USD FX) of the ULC Reserve will be held in cash, but will not be made available to the Company. |
| 20. | This forecast does not reflect certain cash flows which may occur as a result of ACI Group’s targeted October 2010 emergence from CCAA proceedings. |
- 39 -
APPENDIX “H”
BCFPI CASH FLOW FORECAST
- 40 -
Bowater Canadian Forest Products Inc.
Chapter 11/CCAA Cash Flow
13 Week Period Ending December 5, 2010
US$000s
| Week Ended | 12-Sep-10 | 19-Sep-10 | 26-Sep-10 | 3-Oct-10 | 10-Oct-10 | 17-Oct-10 | 24-Oct-10 | 31-Oct-10 | 7-Nov-10 | 14-Nov-10 | 21-Nov-10 | 28-Nov-10 | 5-Dec-10 | Total | ||||||||||||||||||||||||||||||
| Receipts |
Notes | |||||||||||||||||||||||||||||||||||||||||||
| Trade Receipts |
1, 2 | 4,919 | 10,682 | 9,224 | 15,467 | 10,351 | 10,214 | 9,473 | 12,415 | 8,800 | 9,700 | 9,376 | 10,910 | 11,830 | 133,362 | |||||||||||||||||||||||||||||
| Intercompany A/P Settlements |
3 | — | — | 3,000 | — | — | — | — | — | — | — | — | — | — | 3,000 | |||||||||||||||||||||||||||||
| Advances/(Repayments) from/to Bowater Inc. |
4 | 3,000 | (2,000 | ) | (3,000 | ) | (1,000 | ) | (6,000 | ) | — | — | — | — | — | — | — | — | (9,000 | ) | ||||||||||||||||||||||||
| Other Receipts |
5 | 350 | 2,868 | 350 | 350 | 8,652 | 350 | 350 | 350 | 350 | 2,129 | 350 | 350 | 350 | 17,148 | |||||||||||||||||||||||||||||
| Total Receipts |
8,269 | 11,550 | 9,574 | 14,817 | 13,002 | 10,564 | 9,823 | 12,765 | 9,150 | 11,829 | 9,726 | 11,260 | 12,180 | 144,510 | ||||||||||||||||||||||||||||||
| Disbursements |
||||||||||||||||||||||||||||||||||||||||||||
| Trade Payables |
6 | (7,215 | ) | (7,215 | ) | (7,215 | ) | (6,843 | ) | (6,347 | ) | (6,347 | ) | (6,347 | ) | (6,347 | ) | (6,764 | ) | (6,764 | ) | (6,764 | ) | (6,764 | ) | (6,202 | ) | (87,135 | ) | |||||||||||||||
| Freight |
7 | (1,105 | ) | (1,105 | ) | (1,105 | ) | (1,090 | ) | (1,069 | ) | (1,069 | ) | (1,069 | ) | (1,069 | ) | (1,148 | ) | (1,148 | ) | (1,148 | ) | (1,148 | ) | (1,072 | ) | (14,344 | ) | |||||||||||||||
| Payroll and Benefits |
8 | (520 | ) | (3,305 | ) | (529 | ) | (5,403 | ) | (515 | ) | (3,505 | ) | (506 | ) | (5,242 | ) | (513 | ) | (1,958 | ) | (1,908 | ) | (1,940 | ) | (3,079 | ) | (28,925 | ) | |||||||||||||||
| Capital Expenditures |
9 | (467 | ) | (467 | ) | (467 | ) | (460 | ) | (452 | ) | (452 | ) | (452 | ) | (452 | ) | (467 | ) | (467 | ) | (467 | ) | (467 | ) | (456 | ) | (5,989 | ) | |||||||||||||||
| Total Disbursements |
(9,306 | ) | (12,092 | ) | (9,315 | ) | (13,796 | ) | (8,383 | ) | (11,373 | ) | (8,374 | ) | (13,109 | ) | (8,892 | ) | (10,337 | ) | (10,287 | ) | (10,319 | ) | (10,809 | ) | (136,394 | ) | ||||||||||||||||
| Net Cash Flow From Operations |
(1,037 | ) | (542 | ) | 259 | 1,021 | 4,619 | (809 | ) | 1,449 | (344 | ) | 258 | 1,492 | (561 | ) | 941 | 1,371 | 8,116 | |||||||||||||||||||||||||
| Financing and Restructuring |
||||||||||||||||||||||||||||||||||||||||||||
| Interest Payments and Fees |
10 | — | — | (78 | ) | (806 | ) | — | — | (76 | ) | (827 | ) | — | — | — | (78 | ) | (806 | ) | (2,672 | ) | ||||||||||||||||||||||
| Restructuring Costs |
11 | (319 | ) | (319 | ) | (319 | ) | (319 | ) | (319 | ) | (319 | ) | (319 | ) | (319 | ) | (319 | ) | (319 | ) | (319 | ) | (319 | ) | (319 | ) | (4,141 | ) | |||||||||||||||
| Cash Flow From Financing/Restructuring |
(319 | ) | (319 | ) | (397 | ) | (1,125 | ) | (319 | ) | (319 | ) | (394 | ) | (1,146 | ) | (319 | ) | (319 | ) | (319 | ) | (397 | ) | (1,125 | ) | (6,812 | ) | ||||||||||||||||
| Net Cash Flow |
(1,356 | ) | (861 | ) | (138 | ) | (104 | ) | 4,301 | (1,127 | ) | 1,055 | (1,490 | ) | (60 | ) | 1,173 | (880 | ) | 544 | 246 | 1,304 | ||||||||||||||||||||||
| Opening Bank Balance |
12,617 | 11,261 | 10,401 | 10,262 | 10,158 | 14,459 | 13,332 | 14,387 | 12,897 | 12,837 | 14,010 | 13,130 | 13,675 | 12,617 | ||||||||||||||||||||||||||||||
| Cash Flow |
(1,356 | ) | (861 | ) | (138 | ) | (104 | ) | 4,301 | (1,127 | ) | 1,055 | (1,490 | ) | (60 | ) | 1,173 | (880 | ) | 544 | 246 | 1,304 | ||||||||||||||||||||||
| Closing Bank Balance |
2 | 11,261 | 10,401 | 10,262 | 10,158 | 14,459 | 13,332 | 14,387 | 12,897 | 12,837 | 14,010 | 13,130 | 13,675 | 13,921 | 13,921 | |||||||||||||||||||||||||||||
| Settlement Proceeds Held in Trust by Monitor |
12 | 28,167 | 28,167 | 28,167 | 28,167 | 28,167 | 28,167 | 28,167 | 28,167 | 28,167 | 28,167 | 28,167 | 28,167 | 28,167 | 28,167 | |||||||||||||||||||||||||||||
| Closing Bank Balance Including Settlement Proceeds |
39,429 | 38,568 | 38,430 | 38,326 | 42,627 | 41,499 | 42,554 | 41,065 | 41,004 | 42,177 | 41,297 | 41,842 | 42,088 | 42,088 | ||||||||||||||||||||||||||||||
| Intercompany A/R Balance |
13 | |||||||||||||||||||||||||||||||||||||||||||
| Ending Balance |
21,036 | 25,158 | 29,219 | 30,188 | 31,446 | 32,036 | 32,855 | 32,788 | 33,867 | 34,671 | 35,559 | 35,877 | 35,443 | 35,443 | ||||||||||||||||||||||||||||||
| Cumulative Advances from Bowater Inc. |
||||||||||||||||||||||||||||||||||||||||||||
| Opening Advance Balance |
9,000 | 12,000 | 10,000 | 7,000 | 6,000 | — | — | — | — | — | — | — | — | 9,000 | ||||||||||||||||||||||||||||||
| Advance / (Repayment) |
4 | 3,000 | (2,000 | ) | (3,000 | ) | (1,000 | ) | (6,000 | ) | — | — | — | — | — | — | — | — | (9,000 | ) | ||||||||||||||||||||||||
| Closing Advance Balance |
12,000 | 10,000 | 7,000 | 6,000 | — | — | — | — | — | — | — | — | — | — | ||||||||||||||||||||||||||||||
The above forecast uses an exchange rate of CDN$1.00=US$0.98
Amounts in the above table are subject to rounding adjustments from the underlying balances
The information and analysis in this document have not been audited or reviewed and, accordingly, no assurances are provided thereon. In addition, because forecasts are dependent upon numerous assumptions regarding future events, actual results will be different than forecast, and such difference may be material.
- 41 -
Bowater Canadian Forest Products Inc. (“BCFPI”)
Notes to CCAA Cash Flow
13 Week Period Ending December 5, 2010
US$000s
| 1. | Trade Receipts are based on BCFPI’s estimate of collection terms and BCFPI’s latest sales forecast. |
| 2. | The cash flows included in the forecast include only those BCFPI mills in Canada. No funding or dividends from foreign subsidiaries are included in the forecast. |
| 3. | Intercompany A/P Settlements represents the reimbursement of funds disbursed on behalf of Bowater Mersey Paper Company Limited. |
| 4. | Advances/(Repayments) from Bowater Inc. represents amounts received pursuant to the BI/BCFPI DIP Facility to maintain sufficient liquidity. |
| 5. | Other Receipts include the sale of woodchips, sundry mill level deposits, sales tax refunds and road tax refunds. |
| 6. | Trade Payables represent payments for raw materials, repairs and maintenance, utilities, insurance and other cost. |
| 7. | Freight represents disbursements in respect of costs to deliver product to customers. |
| 8. | Payroll and Benefits represent amounts paid to employees for salaries and wages (including the related withholdings), pension payments and other benefits due under employee benefit programs. The forecast assumes that only those pension payments in respect of current service costs will be paid. |
| 9. | Capital Expenditures are costs scheduled to be made in accordance with agreements with BCFPI’s various capital equipment suppliers and reflect requirements pursuant to BCFPI’s most recent capital expenditure budget. |
| 10. | Interest Payments and Fees represents interest costs and renewal fees for the company’s senior secured revolving facility, the existing secured term loan and the BI/BCFPI DIP Facility. Interest on Advances from Bowater Inc. are accrued at the 1 month LIBOR rate plus 2%. |
| 11. | Restructuring Costs represent costs related to the restructuring including transaction fees related to the DIP facility. |
| 12. | Settlement Proceeds Held in Trust represent funds received by BCFPI pursuant to an agreement it had with Smurfit-Stone Container Canada Inc. The amount held in trust by the Monitor does not form part of the Closing Bank Balance. |
| 13. | The Intercompany A/R Balance represents pre-filing and post-filing sales to paper customers in the United States by BCFPI through Bowater America Inc. This amount is assumed not to be stayed and is collected by BCFPI from Bowater America Inc. in the normal course. This balance represents trade A/R only and does not represent any amounts funded from BI to BCFPI pursuant to the BI/BCFPI DIP Facility. |
| 14. | This forecast does not reflect certain cash flows which may occur as a result of BCFPI’s targeted October 2010 emergence from CCAA and Chapter 11 proceedings. |
- 42 -
APPPENDIX “I”
ACI GROUP KEY PERFORMANCE INDICATORS
- 43 -
ACI Group
KPI Analysis
Newsprint, Specialty Paper & Pulp
| 2009 | 2010 | |||||||||||||||||
| Sales tonnage (MT) | December | January | February | March | April | May | June | July | August | |||||||||
| Newsprint |
142,165 | 121,084 | 91,235 | 142,627 | 94,276 | 130,197 | 147,520 | 102,497 | 129,554 | |||||||||
| Specialty Paper |
91,047 | 89,914 | 86,604 | 96,506 | 99,449 | 102,473 | 91,516 | 88,577 | 96,759 | |||||||||
| Pulp |
5,513 | 4,270 | 4,187 | 6,949 | 6,087 | 1,885 | 5,215 | 7,861 | 4,939 | |||||||||
| 238,725 | 215,267 | 182,026 | 246,082 | 199,812 | 234,555 | 244,251 | 198,934 | 231,253 | ||||||||||
| Net sales (US$000) |
139,663 | 130,193 | 112,015 | 145,064 | 132,237 | 158,981 | 164,137 | 141,183 | 163,864 | |||||||||
| Net selling price per tonne (US$) |
585 | 605 | 615 | 589 | 662 | 678 | 672 | 710 | 709 | |||||||||
| Mill Uptime (%) |
80 | 77 | 79 | 79 | 83 | 81 | 81 | 86 | 81 | |||||||||
| Lumber |
||||||||||||||||||
| Sales (mbf) |
68 | 64 | 76 | 102 | 86 | 67 | 72 | 63 | 66 | |||||||||
| Net sales (US$000) |
18,907 | 19,048 | 22,947 | 32,866 | 29,302 | 23,376 | 23,364 | 19,137 | 20,565 | |||||||||
| Sales per mbf (US$) |
280 | 296 | 303 | 322 | 342 | 350 | 324 | 305 | 312 | |||||||||
- 44 -
APPENDIX “J”
BCFPI KEY PERFORMANCE INDICATORS
- 45 -
Bowater Canadian Forest Products Inc.
KPI Analysis
Newsprint, Specialty Paper & Pulp
| 2009 | 2010 | |||||||||||||||||
| Sales tonnage (MT) | December | January | February | March | April | May | June | July | August | |||||||||
| Newsprint |
20,217 | 16,002 | 28,217 | 41,719 | 34,099 | 25,715 | 17,374 | 18,277 | 17,840 | |||||||||
| Specialty Paper |
4,986 | 5,348 | 3,470 | 7,541 | 4,726 | 80 | 472 | 1,043 | 37 | |||||||||
| Pulp |
32,379 | 23,094 | 35,612 | 30,892 | 25,977 | 20,890 | 23,111 | 22,128 | 25,535 | |||||||||
| 57,582 | 44,444 | 67,299 | 80,152 | 64,802 | 46,685 | 40,957 | 41,448 | 43,412 | ||||||||||
| Net sales (US$000) |
34,018 | 26,416 | 39,998 | 46,027 | 40,826 | 31,416 | 30,422 | 31,789 | 32,515 | |||||||||
| Net selling price per tonne (US$) |
591 | 594 | 594 | 574 | 630 | 673 | 743 | 767 | 749 | |||||||||
| Mill Uptime (%) |
80 | 77 | 82 | 83 | 79 | 82 | 74 | 82 | 82 | |||||||||
| Lumber |
||||||||||||||||||
| Sales (mbf) |
32 | 33 | 47 | 56 | 52 | 46 | 50 | 47 | 46 | |||||||||
| Net sales (US$000) |
8,337 | 8,472 | 13,257 | 16,333 | 15,733 | 14,233 | 14,345 | 12,143 | 11,804 | |||||||||
| Sales per mbf (US$) |
257 | 259 | 282 | 290 | 302 | 309 | 285 | 261 | 256 | |||||||||
- 46 -