Attached files
| file | filename |
|---|---|
| EXCEL - IDEA: XBRL DOCUMENT - Resolute Forest Products Inc. | Financial_Report.xls |
| EX-32.1 - EXHIBIT - Resolute Forest Products Inc. | rfp-2014630xex321.htm |
| EX-32.2 - EXHIBIT - Resolute Forest Products Inc. | rfp-2014630xex322.htm |
| EX-31.1 - EXHIBIT - Resolute Forest Products Inc. | rfp-2014630xex311.htm |
| EX-31.2 - EXHIBIT - Resolute Forest Products Inc. | rfp-2014630xex312.htm |
UNITED STATES SECURITIES AND EXCHANGE COMMISSION
WASHINGTON, D.C. 20549
FORM 10-Q
(Mark One)
þ | QUARTERLY REPORT PURSUANT TO SECTION 13 OR 15(d) OF THE SECURITIES EXCHANGE ACT OF 1934 | |
FOR THE QUARTERLY PERIOD ENDED JUNE 30, 2014
¨ | TRANSITION REPORT PURSUANT TO SECTION 13 OR 15(d) OF THE SECURITIES EXCHANGE ACT OF 1934 | |
FOR THE TRANSITION PERIOD FROM TO
COMMISSION FILE NUMBER: 001-33776
RESOLUTE FOREST PRODUCTS INC.
(Exact name of registrant as specified in its charter)
Delaware | 98-0526415 |
(State or other jurisdiction of incorporation or organization) | (I.R.S. employer identification number) |
111 Duke Street, Suite 5000; Montréal, Québec; Canada H3C 2M1 |
(Address of principal executive offices) (Zip Code) |
(514) 875-2515 |
(Registrant’s telephone number, including area code) |
(Former name, former address and former fiscal year, if changed since last report) |
Indicate by check mark whether the registrant: (1) has filed all reports required to be filed by Section 13 or 15(d) of the Securities Exchange Act of 1934 during the preceding 12 months (or for such shorter period that the registrant was required to file such reports), and (2) has been subject to such filing requirements for the past 90 days. Yes þ No ¨
Indicate by check mark whether the registrant has submitted electronically and posted on its corporate Website, if any, every Interactive Data File required to be submitted and posted pursuant to Rule 405 of Regulation S-T (§232.405 of this chapter) during the preceding 12 months (or for such shorter period that the registrant was required to submit and post such files).
Yes þ No ¨
Indicate by check mark whether the registrant is a large accelerated filer, an accelerated filer, a non-accelerated filer or a smaller reporting company. See the definitions of “large accelerated filer,” “accelerated filer,” and “smaller reporting company” in Rule 12b-2 of the Exchange Act.
Large accelerated filer þ | Accelerated filer ¨ | Non-accelerated filer ¨ | Smaller reporting company ¨ | |||
(Do not check if a smaller reporting company) | ||||||
Indicate by check mark whether the registrant is a shell company (as defined in Rule 12b-2 of the Exchange Act).
Yes ¨ No þ
Indicate by check mark whether the registrant has filed all documents and reports required to be filed by Sections 12, 13 or 15(d) of the Securities Exchange Act of 1934 subsequent to the distribution of securities under a plan confirmed by a court.
Yes þ No ¨
As of July 31, 2014, there were 94,590,405 shares of Resolute Forest Products Inc. common stock, $0.001 par value, outstanding.
RESOLUTE FOREST PRODUCTS INC.
TABLE OF CONTENTS
Page Number | |
PART I FINANCIAL INFORMATION | |
Item 1. Financial Statements: | |
PART II OTHER INFORMATION | |
RESOLUTE FOREST PRODUCTS INC.
CONSOLIDATED STATEMENTS OF OPERATIONS
(Unaudited, in millions, except per share amounts)
Three Months Ended June 30, | Six Months Ended June 30, | ||||||||||||||||
2014 | 2013 | 2014 | 2013 | ||||||||||||||
Sales | $ | 1,091 | $ | 1,107 | $ | 2,107 | $ | 2,181 | |||||||||
Costs and expenses: | |||||||||||||||||
Cost of sales, excluding depreciation, amortization and distribution costs | 812 | 859 | 1,633 | 1,715 | |||||||||||||
Depreciation and amortization | 62 | 61 | 124 | 121 | |||||||||||||
Distribution costs | 134 | 130 | 254 | 253 | |||||||||||||
Selling, general and administrative expenses | 41 | 44 | 77 | 88 | |||||||||||||
Closure costs, impairment and other related charges | 52 | 12 | 62 | 52 | |||||||||||||
Net gain on disposition of assets | (2 | ) | (2 | ) | (2 | ) | (2 | ) | |||||||||
Operating (loss) income | (8 | ) | 3 | (41 | ) | (46 | ) | ||||||||||
Interest expense | (11 | ) | (13 | ) | (23 | ) | (27 | ) | |||||||||
Other income (expense), net | 20 | (65 | ) | 7 | (47 | ) | |||||||||||
Income (loss) before income taxes | 1 | (75 | ) | (57 | ) | (120 | ) | ||||||||||
Income tax (provision) benefit | (1 | ) | 31 | 7 | 71 | ||||||||||||
Net loss including noncontrolling interests | — | (44 | ) | (50 | ) | (49 | ) | ||||||||||
Net (income) loss attributable to noncontrolling interests | (2 | ) | 1 | (2 | ) | 1 | |||||||||||
Net loss attributable to Resolute Forest Products Inc. | $ | (2 | ) | $ | (43 | ) | $ | (52 | ) | $ | (48 | ) | |||||
Net loss per share attributable to Resolute Forest Products Inc. common shareholders: | |||||||||||||||||
Basic | $ | (0.02 | ) | $ | (0.45 | ) | $ | (0.55 | ) | $ | (0.51 | ) | |||||
Diluted | (0.02 | ) | (0.45 | ) | (0.55 | ) | (0.51 | ) | |||||||||
Weighted-average number of Resolute Forest Products Inc. common shares outstanding: | |||||||||||||||||
Basic | 94.6 | 94.8 | 94.6 | 94.8 | |||||||||||||
Diluted | 94.6 | 94.8 | 94.6 | 94.8 | |||||||||||||
See accompanying notes to unaudited interim consolidated financial statements.
1
RESOLUTE FOREST PRODUCTS INC.
CONSOLIDATED STATEMENTS OF COMPREHENSIVE INCOME (LOSS)
(Unaudited, in millions)
Three Months Ended June 30, | Six Months Ended June 30, | ||||||||||||||||
2014 | 2013 | 2014 | 2013 | ||||||||||||||
Net loss including noncontrolling interests | $ | — | $ | (44 | ) | $ | (50 | ) | $ | (49 | ) | ||||||
Other comprehensive income (loss): | |||||||||||||||||
Change in unamortized prior service credits, net of tax of $17 and $34 for the three and six months ended June 30, 2014, respectively, and $5 for both the three and six months ended June 30, 2013 | 28 | (13 | ) | 52 | (14 | ) | |||||||||||
Change in unamortized actuarial losses, net of tax of $2 and $3 for the three and six months ended June 30, 2014, respectively, and $11 and $13 for the three and six months ended June 30, 2013, respectively | (2 | ) | 20 | (1 | ) | 24 | |||||||||||
Foreign currency translation | 1 | (3 | ) | — | (5 | ) | |||||||||||
Other comprehensive income, net of tax | 27 | 4 | 51 | 5 | |||||||||||||
Comprehensive income (loss) including noncontrolling interests | 27 | (40 | ) | 1 | (44 | ) | |||||||||||
Comprehensive (income) loss attributable to noncontrolling interests | (2 | ) | 1 | (2 | ) | 1 | |||||||||||
Comprehensive income (loss) attributable to Resolute Forest Products Inc. | $ | 25 | $ | (39 | ) | $ | (1 | ) | $ | (43 | ) | ||||||
See accompanying notes to unaudited interim consolidated financial statements.
2
RESOLUTE FOREST PRODUCTS INC.
CONSOLIDATED BALANCE SHEETS
(Unaudited, in millions, except per share amount)
June 30, 2014 | December 31, 2013 | |||||||
Assets | ||||||||
Current assets: | ||||||||
Cash and cash equivalents | $ | 263 | $ | 322 | ||||
Accounts receivable, net: | ||||||||
Trade | 521 | 536 | ||||||
Other | 89 | 98 | ||||||
Inventories, net | 579 | 529 | ||||||
Deferred income tax assets | 32 | 32 | ||||||
Other current assets | 62 | 45 | ||||||
Total current assets | 1,546 | 1,562 | ||||||
Fixed assets, net | 2,184 | 2,289 | ||||||
Amortizable intangible assets, net | 64 | 66 | ||||||
Deferred income tax assets | 1,237 | 1,266 | ||||||
Other assets | 216 | 202 | ||||||
Total assets | $ | 5,247 | $ | 5,385 | ||||
Liabilities and equity | ||||||||
Current liabilities: | ||||||||
Accounts payable and accrued liabilities | $ | 556 | $ | 533 | ||||
Current portion of long-term debt | 1 | 2 | ||||||
Deferred income tax liabilities | 32 | 32 | ||||||
Total current liabilities | 589 | 567 | ||||||
Long-term debt, net of current portion | 597 | 597 | ||||||
Pension and other postretirement benefit obligations | 1,146 | 1,294 | ||||||
Deferred income tax liabilities | 25 | 26 | ||||||
Other long-term liabilities | 48 | 62 | ||||||
Total liabilities | 2,405 | 2,546 | ||||||
Commitments and contingencies | ||||||||
Equity: | ||||||||
Resolute Forest Products Inc. shareholders’ equity: | ||||||||
Common stock, $0.001 par value. 117.1 shares issued and 94.6 shares outstanding as of June 30, 2014; 117.0 shares issued and 94.5 shares outstanding as of December 31, 2013 | — | — | ||||||
Additional paid-in capital | 3,753 | 3,751 | ||||||
Deficit | (644 | ) | (592 | ) | ||||
Accumulated other comprehensive loss | (220 | ) | (271 | ) | ||||
Treasury stock at cost, 22.5 shares as of June 30, 2014 and December 31, 2013 | (61 | ) | (61 | ) | ||||
Total Resolute Forest Products Inc. shareholders’ equity | 2,828 | 2,827 | ||||||
Noncontrolling interests | 14 | 12 | ||||||
Total equity | 2,842 | 2,839 | ||||||
Total liabilities and equity | $ | 5,247 | $ | 5,385 | ||||
See accompanying notes to unaudited interim consolidated financial statements.
3
RESOLUTE FOREST PRODUCTS INC.
CONSOLIDATED STATEMENTS OF CHANGES IN EQUITY
(Unaudited, in millions)
Six Months Ended June 30, 2014 | ||||||||||||||||||||||||||||
Resolute Forest Products Inc. Shareholders’ Equity | ||||||||||||||||||||||||||||
Common Stock | Additional Paid-In Capital | Deficit | Accumulated Other Comprehensive Loss | Treasury Stock | Non- controlling Interests | Total Equity | ||||||||||||||||||||||
Balance as of December 31, 2013 | $ | — | $ | 3,751 | $ | (592 | ) | $ | (271 | ) | $ | (61 | ) | $ | 12 | $ | 2,839 | |||||||||||
Share-based compensation costs for equity-classified awards | — | 2 | — | — | — | — | 2 | |||||||||||||||||||||
Net (loss) income | — | — | (52 | ) | — | — | 2 | (50 | ) | |||||||||||||||||||
Other comprehensive income, net of tax | — | — | — | 51 | — | — | 51 | |||||||||||||||||||||
Balance as of June 30, 2014 | $ | — | $ | 3,753 | $ | (644 | ) | $ | (220 | ) | $ | (61 | ) | $ | 14 | $ | 2,842 | |||||||||||
Six Months Ended June 30, 2013 | ||||||||||||||||||||||||||||
Resolute Forest Products Inc. Shareholders’ Equity | ||||||||||||||||||||||||||||
Common Stock | Additional Paid-In Capital | Retained Earnings (Deficit) | Accumulated Other Comprehensive Loss | Treasury Stock | Non- controlling Interests | Total Equity | ||||||||||||||||||||||
Balance as of December 31, 2012 | $ | — | $ | 3,730 | $ | 47 | $ | (614 | ) | $ | (61 | ) | $ | 23 | $ | 3,125 | ||||||||||||
Share-based compensation costs for equity-classified awards | — | 4 | — | — | — | — | 4 | |||||||||||||||||||||
Net loss | — | — | (48 | ) | — | — | (1 | ) | (49 | ) | ||||||||||||||||||
Contribution of capital from noncontrolling interest (net of tax of $3) | — | — | — | — | — | 5 | 5 | |||||||||||||||||||||
Acquisition of noncontrolling interest (Note 3) | — | 14 | — | — | — | (14 | ) | — | ||||||||||||||||||||
Other comprehensive income, net of tax | — | — | — | 5 | — | — | 5 | |||||||||||||||||||||
Balance as of June 30, 2013 | $ | — | $ | 3,748 | $ | (1 | ) | $ | (609 | ) | $ | (61 | ) | $ | 13 | $ | 3,090 | |||||||||||
See accompanying notes to unaudited interim consolidated financial statements.
4
RESOLUTE FOREST PRODUCTS INC.
CONSOLIDATED STATEMENTS OF CASH FLOWS
(Unaudited, in millions)
Six Months Ended June 30, | ||||||||
2014 | 2013 | |||||||
Cash flows from operating activities: | ||||||||
Net loss including noncontrolling interests | $ | (50 | ) | $ | (49 | ) | ||
Adjustments to reconcile net loss including noncontrolling interests to net cash provided by operating activities: | ||||||||
Share-based compensation | 2 | 4 | ||||||
Depreciation and amortization | 124 | 121 | ||||||
Closure costs, impairment and other related charges | 54 | 46 | ||||||
Inventory write-downs related to closures | 4 | 5 | ||||||
Deferred income taxes | (8 | ) | (71 | ) | ||||
Net pension contributions and other postretirement benefit payments | (74 | ) | (35 | ) | ||||
Net gain on disposition of assets | (2 | ) | (2 | ) | ||||
Loss on translation of foreign currency denominated deferred income taxes | 6 | 80 | ||||||
Gain on translation of foreign currency denominated pension and other postretirement benefit obligations | (6 | ) | (78 | ) | ||||
Gain on forgiveness of note payable | — | (12 | ) | |||||
Net loss on extinguishment of debt | — | 59 | ||||||
Net planned major maintenance payments | (6 | ) | (7 | ) | ||||
Dividends received from equity method investees in excess of income | — | 3 | ||||||
Changes in working capital: | ||||||||
Accounts receivable | 36 | (5 | ) | |||||
Inventories | (55 | ) | 14 | |||||
Other current assets | (9 | ) | (2 | ) | ||||
Accounts payable and accrued liabilities | 5 | (16 | ) | |||||
Other, net | 1 | (7 | ) | |||||
Net cash provided by operating activities | 22 | 48 | ||||||
Cash flows from investing activities: | ||||||||
Cash invested in fixed assets | (82 | ) | (86 | ) | ||||
Disposition of assets | 2 | 3 | ||||||
Proceeds from insurance settlements | — | 4 | ||||||
Decrease in restricted cash | 1 | 3 | ||||||
(Increase) decrease in deposit requirements for letters of credit, net | (1 | ) | 1 | |||||
Net cash used in investing activities | (80 | ) | (75 | ) | ||||
Cash flows from financing activities: | ||||||||
Issuance of long-term debt | — | 594 | ||||||
Premium paid on extinguishment of debt | — | (84 | ) | |||||
Payments of debt | (1 | ) | (497 | ) | ||||
Payments of financing and credit facility fees | (1 | ) | (9 | ) | ||||
Contribution of capital from noncontrolling interest | — | 8 | ||||||
Net cash (used in) provided by financing activities | (2 | ) | 12 | |||||
Effect of exchange rate changes on cash and cash equivalents | 1 | — | ||||||
Net decrease in cash and cash equivalents | (59 | ) | (15 | ) | ||||
Cash and cash equivalents: | ||||||||
Beginning of period | 322 | 263 | ||||||
End of period | $ | 263 | $ | 248 | ||||
See accompanying notes to unaudited interim consolidated financial statements.
5
RESOLUTE FOREST PRODUCTS INC.
Notes to Unaudited Interim Consolidated Financial Statements
Note 1. Organization and Basis of Presentation
Nature of operations
Resolute Forest Products Inc. (with its subsidiaries and affiliates, either individually or collectively, unless otherwise indicated, referred to as “Resolute Forest Products,” “we,” “our,” “us,” “Parent” or the “Company”) is incorporated in Delaware. We are a global leader in the forest products industry, with a diverse range of products, including newsprint, specialty papers, market pulp and wood products, which are marketed in close to 90 countries. We own or operate nearly 40 pulp and paper mills and wood products facilities in the United States, Canada and South Korea, and power generation assets in Canada.
Financial statements
Our interim consolidated financial statements are unaudited and have been prepared in accordance with the requirements of the United States Securities and Exchange Commission (the “SEC”) for interim reporting. Under those rules, certain footnotes and other financial information that are normally required by United States generally accepted accounting principles (“U.S. GAAP”) may be condensed or omitted. In our opinion, all adjustments (consisting of normal recurring adjustments) necessary for the fair statement of the unaudited interim consolidated financial statements have been made. All amounts are expressed in U.S. dollars, unless otherwise indicated. The results for the interim period ended June 30, 2014 are not necessarily indicative of the results to be expected for the full year. These unaudited interim consolidated financial statements should be read in conjunction with our Annual Report on Form 10-K for the year ended December 31, 2013, filed with the SEC on March 3, 2014 (the “2013 Annual Report”). Certain prior period amounts in our footnotes have been reclassified to conform to the 2014 presentation.
New accounting pronouncements
In May 2014, the Financial Accounting Standards Board (“FASB”) issued Accounting Standards Update 2014-09, “Revenue from Contracts from Customers” (“ASU 2014-09”). ASU 2014-09 provides a framework that replaces existing revenue recognition guidance in U.S. GAAP. This standard is effective for fiscal years beginning after December 15, 2016 and early adoption is prohibited. We do not expect the adoption of this accounting guidance to impact our results of operations or financial position.
6
RESOLUTE FOREST PRODUCTS INC.
Notes to Unaudited Interim Consolidated Financial Statements
Note 2. Closure Costs, Impairment and Other Related Charges
Closure costs, impairment and other related charges for the three and six months ended June 30, 2014 were comprised of the following:
(Unaudited, in millions) | Impairment of Assets (1) | Accelerated Depreciation | Severance and Other Costs | Total | ||||||||||||
Permanent closures: | ||||||||||||||||
Paper machine in Catawba, South Carolina (2) | ||||||||||||||||
Second quarter | $ | — | $ | 45 | $ | — | $ | 45 | ||||||||
First six months | — | 45 | 1 | 46 | ||||||||||||
Kraft mill and paper machine in Fort Frances, Ontario (3) | ||||||||||||||||
Second quarter | — | — | 2 | 2 | ||||||||||||
First six months | — | — | 8 | 8 | ||||||||||||
Paper machine in Iroquois Falls, Ontario (4) | ||||||||||||||||
Second quarter | — | — | — | — | ||||||||||||
First six months | — | 3 | — | 3 | ||||||||||||
Other | ||||||||||||||||
Second quarter | 5 | — | — | 5 | ||||||||||||
First six months | 6 | — | (1 | ) | 5 | |||||||||||
Total | ||||||||||||||||
Second quarter | $ | 5 | $ | 45 | $ | 2 | $ | 52 | ||||||||
First six months | 6 | 48 | 8 | 62 | ||||||||||||
(1) | We recorded long-lived asset impairment charges of $4 million and $5 million for the three and six months ended June 30, 2014 related to our recycling assets to reduce the carrying value of the assets to fair value less costs to sell. |
(2) | On May 22, 2014, we announced the permanent closure of the previously idled paper machine in Catawba. |
(3) | On May 6, 2014, we announced the permanent closure of our previously idled pulp mill and paper machine in Fort Frances. We are exploring opportunities to continue to operate the biomass boiler and electricity-producing turbine. |
(4) | In April 2014, we permanently closed a paper machine in Iroquois Falls, following the announcement made on October 24, 2013. |
7
RESOLUTE FOREST PRODUCTS INC.
Notes to Unaudited Interim Consolidated Financial Statements
Closure costs, impairment and other related charges for the three and six months ended June 30, 2013 were comprised of the following:
(Unaudited, in millions) | Accelerated Depreciation | Pension Plan Settlement Gain | Severance and Other Costs | Total | ||||||||||||
Indefinite idlings: | ||||||||||||||||
Paper machine in Calhoun, Tennessee (1) | ||||||||||||||||
Second quarter | $ | 9 | $ | — | $ | 3 | $ | 12 | ||||||||
First six months | 44 | — | 5 | 49 | ||||||||||||
Kraft mill and paper machine in Fort Frances (2) | ||||||||||||||||
Second quarter | — | — | — | — | ||||||||||||
First six months | — | — | 4 | 4 | ||||||||||||
Other | ||||||||||||||||
Second quarter | — | — | — | — | ||||||||||||
First six months | — | (1 | ) | — | (1 | ) | ||||||||||
Total | ||||||||||||||||
Second quarter | $ | 9 | $ | — | $ | 3 | $ | 12 | ||||||||
First six months | 44 | (1 | ) | 9 | 52 | |||||||||||
(1) | Following our acquisition of the noncontrolling interest in Calhoun Newsprint Company (“CNC”), we indefinitely idled a paper machine at the Calhoun mill on March 12, 2013, resulting in accelerated depreciation charges to reduce the carrying value of the assets to reflect their revised estimated remaining useful lives. In 2014, we restarted the paper machine. For additional information regarding our acquisition of the noncontrolling interest in CNC, see Note 3, “Other Income (Expense), Net.” |
(2) | On May 6, 2014, we announced the permanent closure of our previously idled pulp mill and paper machine in Fort Frances. We are exploring opportunities to continue to operate the biomass boiler and electricity-producing turbine. |
Note 3. Other Income (Expense), Net
Other income (expense), net for the three and six months ended June 30, 2014 and 2013 was comprised of the following:
Three Months Ended June 30, | Six Months Ended June 30, | ||||||||||||||||
(Unaudited, in millions) | 2014 | 2013 | 2014 | 2013 | |||||||||||||
Foreign exchange gain (loss) | $ | 17 | $ | (7 | ) | $ | 3 | $ | (12 | ) | |||||||
Net loss on extinguishment of debt (Note 7) | — | (59 | ) | — | (59 | ) | |||||||||||
Gain on forgiveness of note payable (1) | — | — | — | 12 | |||||||||||||
Gain on liquidation settlement (2) | — | — | — | 9 | |||||||||||||
Miscellaneous income | 3 | 1 | 4 | 3 | |||||||||||||
$ | 20 | $ | (65 | ) | $ | 7 | $ | (47 | ) | ||||||||
(1) | On March 11, 2013, we acquired the noncontrolling interest in CNC, which was previously owned 51% by us and included in our consolidated financial statements on a fully consolidated basis. As a result, CNC became a wholly-owned subsidiary of ours. In connection with this transaction, we recognized a gain on the forgiveness of a $12 million note issued by CNC. The acquisition of the noncontrolling interest in CNC was accounted for as an equity transaction. |
(2) | On February 2, 2010, Bridgewater Paper Company Limited (“BPCL”), a subsidiary of ours, filed for administration in the United Kingdom pursuant to the United Kingdom Insolvency Act 1986, as amended. As a result, we became a creditor of BPCL and lost control over their operations. In connection with our claims, we received a liquidation settlement of $9 million in March 2013. |
8
RESOLUTE FOREST PRODUCTS INC.
Notes to Unaudited Interim Consolidated Financial Statements
Note 4. Accumulated Other Comprehensive Loss
The change in our accumulated other comprehensive loss by component (net of tax) for the six months ended June 30, 2014 was as follows:
(Unaudited, in millions) | Unamortized Prior Service Credits (1) | Unamortized Actuarial Losses (1) | Foreign Currency Translation | Total | ||||||||||||
Balance as of December 31, 2013 | $ | 18 | $ | (290 | ) | $ | 1 | $ | (271 | ) | ||||||
Other comprehensive income (loss) before reclassifications | 55 | (2 | ) | — | 53 | |||||||||||
Amounts reclassified from accumulated other comprehensive loss (2) | (3 | ) | 1 | — | (2 | ) | ||||||||||
Net current period other comprehensive income (loss) | 52 | (1 | ) | — | 51 | |||||||||||
Balance as of June 30, 2014 | $ | 70 | $ | (291 | ) | $ | 1 | $ | (220 | ) | ||||||
(1) | During the six months ended June 30, 2014, we modified our U.S. other postretirement benefit (“OPEB”) plan, whereby unionized post-65 participants will be provided comparable Medicare coverage via a Medicare exchange program available under the U.S. Affordable Care Act, effective January 1, 2015. As a result of this plan amendment, “Pension and other postretirement benefit obligations” and “Accumulated other comprehensive loss” in our Consolidated Balance Sheet as of June 30, 2014, were decreased by $84 million and $51 million (net of tax of $33 million), respectively, and consisted of $55 million (net of tax of $36 million) of unamortized prior service credits offset by $4 million (net of tax of $3 million) of unamortized actuarial losses. |
(2) | See the table below for details about these reclassifications. |
The reclassifications out of accumulated other comprehensive loss for the six months ended June 30, 2014 were comprised of the following:
(Unaudited, in millions) | Amounts Reclassified From Accumulated Other Comprehensive Loss | Affected Line in the Consolidated Statements of Operations | |||
Unamortized Prior Service Credits | |||||
Amortization of prior service credits | $ | (5 | ) | Cost of sales, excluding depreciation, amortization and distribution costs (1) | |
2 | Income tax (provision) benefit | ||||
$ | (3 | ) | Net of tax | ||
Unamortized Actuarial Losses | |||||
Amortization of actuarial losses | $ | 1 | Cost of sales, excluding depreciation, amortization and distribution costs (1) | ||
— | Income tax (provision) benefit | ||||
$ | 1 | Net of tax | |||
Total Reclassifications | $ | (2 | ) | Net of tax | |
(1) | These items are included in the computation of net periodic benefit cost related to our pension and OPEB plans summarized in Note 8, “Employee Benefit Plans.” |
9
RESOLUTE FOREST PRODUCTS INC.
Notes to Unaudited Interim Consolidated Financial Statements
Note 5. Net Loss Per Share
The weighted-average number of common shares outstanding used to calculate the basic and diluted net loss per share attributable to Resolute Forest Products Inc. common shareholders for the three and six months ended June 30, 2014 and 2013 was as follows:
Three Months Ended June 30, | Six Months Ended June 30, | ||||||||||||
(Unaudited, in millions) | 2014 | 2013 | 2014 | 2013 | |||||||||
Basic weighted-average number of common shares outstanding | 94.6 | 94.8 | 94.6 | 94.8 | |||||||||
Diluted weighted-average number of common shares outstanding | 94.6 | 94.8 | 94.6 | 94.8 | |||||||||
No adjustments to net loss attributable to Resolute Forest Products Inc. common shareholders were necessary to calculate basic and diluted net loss per share for all periods presented.
The weighted-average number of share options and equity-classified restricted stock units (“RSUs”) and deferred stock units (“DSUs”) outstanding for the three and six months ended June 30, 2014 and 2013 was as follows:
Three Months Ended June 30, | Six Months Ended June 30, | ||||||||||||
(Unaudited, in millions) | 2014 | 2013 | 2014 | 2013 | |||||||||
Share options | 1.8 | 1.5 | 1.8 | 1.5 | |||||||||
RSUs and DSUs | 1.0 | 0.8 | 1.0 | 0.8 | |||||||||
These share options and RSUs and DSUs were excluded from the calculation of diluted net loss per share as the impact would have been antidilutive for all periods presented.
Note 6. Inventories, Net
Inventories, net as of June 30, 2014 and December 31, 2013 were comprised of the following:
(Unaudited, in millions) | June 30, 2014 | December 31, 2013 | ||||||
Raw materials and work in process | $ | 130 | $ | 153 | ||||
Finished goods | 260 | 195 | ||||||
Mill stores and other supplies | 189 | 181 | ||||||
$ | 579 | $ | 529 | |||||
During the three months ended June 30, 2014, we recorded charges of $3 million for write-downs of mill stores and other supplies as a result of the permanent closure of our previously idled paper machine in Catawba. During the six months ended June 30, 2014, we also recorded charges for write-downs of mill stores and other supplies of $1 million primarily related to the permanent closure of a paper machine in Iroquois Falls. During the three months ended June 30, 2013, we recorded charges of $1 million for write-downs of mill stores and other supplies as a result of the indefinite idling of a paper machine in Fort Frances. During the six months ended June 30, 2013, we also recorded charges for write-downs of mill stores and other supplies of $4 million as a result of the indefinite idling of a paper machine in Calhoun. These charges were included in “Cost of sales, excluding depreciation, amortization and distribution costs” in our Consolidated Statements of Operations.
10
RESOLUTE FOREST PRODUCTS INC.
Notes to Unaudited Interim Consolidated Financial Statements
Note 7. Long-Term Debt
Overview
Long-term debt, including current portion, as of June 30, 2014 and December 31, 2013 was comprised of the following:
(Unaudited, in millions) | June 30, 2014 | December 31, 2013 | ||||||
5.875% senior notes due 2023: | ||||||||
Principal amount | $ | 600 | $ | 600 | ||||
Unamortized discount | (5 | ) | (5 | ) | ||||
Total senior notes due 2023 | 595 | 595 | ||||||
Other debt: | ||||||||
PSIF – Investissement Québec loan | 1 | 1 | ||||||
Capital lease obligation | 2 | 3 | ||||||
Total other debt | 3 | 4 | ||||||
Total debt | 598 | 599 | ||||||
Less: Current portion of long-term debt | (1 | ) | (2 | ) | ||||
Long-term debt, net of current portion | $ | 597 | $ | 597 | ||||
5.875% senior notes due 2023
We issued $600 million in aggregate principal amount of 5.875% senior notes (the “2023 Notes”) on May 8, 2013. Interest is payable semi-annually on May 15 and November 15 of each year, until their maturity date of May 15, 2023. The fair value of the 2023 Notes was $596 million and $554 million as of June 30, 2014 and December 31, 2013, respectively, and was determined by reference to over-the-counter prices (Level 1).
On May 8, 2013, we used the proceeds of the sale of the 2023 Notes to purchase $496 million aggregate principal amount of the 10.25% senior secured notes due 2018 (the “2018 Notes”), or 99% of the outstanding amount, which was then fully redeemed on October 8, 2013. Aggregate consideration for the purchase was $584 million, including accrued and unpaid interest of $4 million. Accordingly, we recorded a loss on extinguishment of debt of $59 million (net of $25 million write-down of unamortized premium) in “Other Income (Expense), Net” in our Consolidated Statements of Operations for the three and six months ended June 30, 2013.
On May 27, 2014, in accordance with the registration rights agreement of May 8, 2013, we completed an exchange offer whereby we: (i) exchanged the 2023 Notes for registered notes (which we refer to as the “exchange notes”), with substantially the same terms as the 2023 Notes; and (ii) exchanged the guarantees related to the 2023 Notes for registered guarantees relating to the exchange notes, with substantially the same terms as the original guarantees.
11
RESOLUTE FOREST PRODUCTS INC.
Notes to Unaudited Interim Consolidated Financial Statements
ABL Credit Facility
Our senior secured asset-based revolving credit facility (the “ABL Credit Facility”), as amended, matures October 28, 2016 and provides an aggregate lender commitment of up to $665 million at any time outstanding, subject to borrowing base limitations. As of June 30, 2014, we had no borrowings and $38 million of letters of credit outstanding under the ABL Credit Facility. As of June 30, 2014, we had $567 million of availability under the ABL Credit Facility, which was comprised of $329 million for the “U.S. Borrowers” (Resolute Forest Products Inc., Resolute FP US Inc. and AbiBow Recycling LLC) and $238 million for the Canadian borrower (Resolute FP Canada Inc.).
The ABL Credit Facility was amended as of February 25, 2014, to, among other things:
• | release the liens securing the ABL Credit Facility on that portion of the assets of the U.S. Borrowers and certain of our material U.S. subsidiaries that had secured the 2018 Notes on a first priority basis, primarily consisting of real property, equipment, intellectual property and the equity of our subsidiaries, with the ability to re-implement those liens with a second lien priority should we issue new secured debt that is to be secured by a second lien on our accounts receivable and inventory and other assets that continue to secure the ABL Credit Facility; |
• | reduce the excess availability thresholds that trigger a minimum consolidated fixed charge coverage ratio to the greater of: (i) $50 million and (ii) 10% of the lesser of (A) the total commitments and (B) the borrowing base then in effect; |
• | increase the uncommitted incremental loan facility to $200 million; |
• | increase our borrowing capacity by expanding our ability to create liens if the debt incurrence test is met and by increasing minimum baskets for unsecured and secured debt to $500 million each, subject to certain conditions; and |
• | increase the borrowing base by including 90% of eligible international accounts receivable and 100% of cash deposits, limited to $100 million and subject to certain conditions. |
PSIF – Investissement Québec
On February 23, 2007, Investissement Québec granted Fibrek Inc. (“Fibrek”) a Cdn$6 million interest-free loan through the Soutien à l’industrie forestière program (“PSIF”), payable in monthly installments over a maximum of four years, starting December 31, 2010. As of June 30, 2014, the fair value of the loan approximated its carrying value of $1 million. The fair value was determined by discounting the cash flows using a current interest rate (4.4%) for financial instruments with similar characteristics and maturities (Level 3).
Capital lease obligation
We have a capital lease obligation for a warehouse, which can be renewed for 20 years at our option. Minimum payments are determined by an escalatory price clause.
12
RESOLUTE FOREST PRODUCTS INC.
Notes to Unaudited Interim Consolidated Financial Statements
Note 8. Employee Benefit Plans
Pension and OPEB plans
The components of net periodic benefit cost relating to our pension and OPEB plans for the three and six months ended June 30, 2014 and 2013 were as follows:
Pension Plans:
Three Months Ended June 30, | Six Months Ended June 30, | ||||||||||||||||
(Unaudited, in millions) | 2014 | 2013 | 2014 | 2013 | |||||||||||||
Service cost | $ | 7 | $ | 8 | $ | 14 | $ | 16 | |||||||||
Interest cost | 69 | 70 | 138 | 140 | |||||||||||||
Expected return on plan assets | (76 | ) | (77 | ) | (151 | ) | (155 | ) | |||||||||
Amortization of actuarial losses | 2 | 6 | 3 | 12 | |||||||||||||
Amortization of prior service credits | (1 | ) | — | (1 | ) | (1 | ) | ||||||||||
Net periodic benefit cost before special events | 1 | 7 | 3 | 12 | |||||||||||||
Settlement | — | — | — | (1 | ) | ||||||||||||
$ | 1 | $ | 7 | $ | 3 | $ | 11 | ||||||||||
OPEB Plans:
Three Months Ended June 30, | Six Months Ended June 30, | ||||||||||||||||
(Unaudited, in millions) | 2014 | 2013 | 2014 | 2013 | |||||||||||||
Service cost | $ | — | $ | 1 | $ | 1 | $ | 2 | |||||||||
Interest cost | 3 | 4 | 6 | 8 | |||||||||||||
Amortization of actuarial gains | (1 | ) | — | (2 | ) | — | |||||||||||
Amortization of prior service credits | (2 | ) | — | (4 | ) | — | |||||||||||
$ | — | $ | 5 | $ | 1 | $ | 10 | ||||||||||
Defined contribution plans
The expense for our defined contribution plans totaled $5 million for both the three months ended June 30, 2014 and 2013, and $11 million for both the six months ended June 30, 2014 and 2013.
Canadian pension funding
The provinces of Québec and Ontario adopted, as of April 9, 2014 and April 15, 2014, respectively, the funding relief regulations contemplated in Note 14, “Pension and Other Postretirement Benefit Plans - Canadian pension funding,” to our consolidated financial statements for the year ended December 31, 2013 to implement the revised framework parameters concerning the funding of the aggregate solvency deficits in our material Canadian registered pension plans, which we refer to as the “affected plans”.
The principal amendments to the funding relief regulations include, among other things:
• | an increase in the annual basic contribution in respect of the solvency deficits in the affected plans from Cdn$50 million to Cdn$80 million for each year from 2013 through 2020; and |
• | the elimination of the conditional additional contribution feature based on a measure of free cash flow (as determined in accordance with the regulations), which would have applied as of 2013 below a certain solvency threshold. |
As originally adopted, the funding relief regulations provided that corrective measures would be required if the aggregate solvency ratio in the affected plans fell below a prescribed level under the targets specified by the regulations as of December 31 in any year through 2014. This requirement was definitively removed with the amendments to the regulations. But according
13
RESOLUTE FOREST PRODUCTS INC.
Notes to Unaudited Interim Consolidated Financial Statements
to the Ontario regulations, the corresponding 2011 and 2012 amounts in respect of Ontario plans (approximately $100 million) have been deferred to after the expiration of the funding relief regulations in 2020, and will then be payable over 5 years in equal monthly installments starting on December 31, 2021, but only up to the elimination of the then remaining deficit, if any.
In connection with the establishment of the original regulations, our principal Canadian operating subsidiary had undertaken to make an additional solvency deficit reduction contribution of Cdn$75 to its affected plans, payable over four years, for each metric ton of capacity reduced in Québec or Ontario, in the event of downtime of more than six consecutive months or nine cumulative months over a period of 18 months. As part of the amendments to the funding relief regulations, it was determined that no additional contribution would be made in respect of any capacity reduction in Québec before April 13, 2013. The application of this undertaking in respect of capacity reductions in Ontario has yet to be settled.
Note 9. Income Taxes
The income tax (provision) benefit attributable to income (loss) before income taxes differs from the amounts computed by applying the United States federal statutory income tax rate of 35% for the three and six months ended June 30, 2014 and 2013 as a result of the following:
Three Months Ended June 30, | Six Months Ended June 30, | ||||||||||||||||
(Unaudited, in millions) | 2014 | 2013 | 2014 | 2013 | |||||||||||||
Income (loss) before income taxes | $ | 1 | $ | (75 | ) | $ | (57 | ) | $ | (120 | ) | ||||||
Income tax (provision) benefit: | |||||||||||||||||
Expected income tax benefit | — | 26 | 20 | 42 | |||||||||||||
Changes resulting from: | |||||||||||||||||
Valuation allowance (1) | (12 | ) | (1 | ) | (20 | ) | 33 | ||||||||||
Foreign exchange | 4 | — | (2 | ) | (1 | ) | |||||||||||
State income taxes and foreign tax rate differences | 9 | 7 | 11 | 4 | |||||||||||||
Other, net | (2 | ) | (1 | ) | (2 | ) | (7 | ) | |||||||||
$ | (1 | ) | $ | 31 | $ | 7 | $ | 71 | |||||||||
(1) | During the three and six months ended June 30, 2014, we increased our valuation allowance by $12 million and $20 million, respectively, primarily related to our U.S operations, where we do not recognize deferred income tax assets. During the six months ended June 30, 2013, we reversed $33 million of valuation allowance, primarily related to available U.S. capital losses that will be utilized as a result of the 2013 acquisition of the noncontrolling interest in CNC. |
14
RESOLUTE FOREST PRODUCTS INC.
Notes to Unaudited Interim Consolidated Financial Statements
Note 10. Commitments and Contingencies
Legal matters
We become involved in various legal proceedings and other disputes in the normal course of business, including matters related to contracts, commercial disputes, taxes, environmental issues, employment and workers’ compensation claims, Aboriginal claims and other matters. Although the final outcome is subject to many variables and cannot be predicted with any degree of certainty, we regularly assess the status of the matters and establish provisions (including legal costs expected to be incurred) when we believe an adverse outcome is probable, and the amount can be reasonably estimated. We believe that the ultimate disposition of these matters outstanding or pending as of June 30, 2014, will not have a material adverse effect on our consolidated financial statements.
Effective July 31, 2012, we completed the second step transaction pursuant to which we acquired the remaining 25.4% of the outstanding Fibrek shares, following the approval of Fibrek’s shareholders on July 23, 2012, and the issuance of a final order of the Québec Superior Court in Canada approving the arrangement on July 27, 2012. Certain former shareholders of Fibrek exercised (or purported to exercise) rights of dissent in respect of the transaction, asking for a judicial determination of the fair value of their claim under the Canada Business Corporations Act. No consideration has to date been paid to the former Fibrek shareholders who exercised (or purported to exercise) rights of dissent. Any such consideration will only be paid out upon settlement or judicial determination of the fair value of their claims and will be paid entirely in cash. Accordingly, we cannot presently determine the amount that ultimately will be paid to former holders of Fibrek shares in connection with the proceedings, but we have accrued approximately Cdn$14 million ($13 million, based on the exchange rate in effect on June 30, 2014) for the eventual payment of those claims.
On June 12, 2012, we filed a motion for directives with the Québec Superior Court, the court with the jurisdiction in the creditor protection proceedings from which our predecessor entity and all but one of its affiliates emerged in 2010, seeking an order to prevent pension regulators in each of Québec, New Brunswick, and Newfoundland and Labrador from declaring partial wind-ups of pension plans relating to employees of former operations in New Brunswick and Newfoundland and Labrador, or a declaration that any claim for accelerated reimbursements of deficits arising from a partial wind-up is a barred claim under the creditor protection proceedings. These plans are subject to the funding relief regulations described in Note 14, “Pension and Other Postretirement Benefit Plans - Canadian pension funding,” to our consolidated financial statements for the year ended December 31, 2013 and we contend, among other things, that any such declaration, if issued, would be inconsistent with the court’s sanction order confirming the plan of reorganization and the terms of our emergence from the creditor protection proceedings. A partial wind-up would likely shorten the period in which any deficit within those plans, which could reach up to Cdn$150 million ($141 million based on the exchange rate in effect on June 30, 2014), would have to be funded if we do not obtain the relief sought. No hearing date has been set to date.
Environmental matters
We are subject to a variety of federal, state, provincial and local environmental laws and regulations in the jurisdictions in which we operate. We believe our operations are in material compliance with current applicable environmental laws and regulations. Environmental regulations promulgated in the future could require substantial additional expenditures for compliance and could have a material impact on us, in particular, and the industry in general. We may be a “potentially responsible party” with respect to four hazardous waste sites that are being addressed pursuant to the Comprehensive Environmental Response, Compensation and Liability Act of 1980 (“Superfund”) or the Resource Conservation and Recovery Act (“RCRA”) corrective action authority. We believe we will not be liable for any significant amounts at any of these sites.
We have recorded $9 million of environmental liabilities as of both June 30, 2014 and December 31, 2013, which represents management’s estimate based on an assessment of relevant factors and assumptions of the ultimate settlement amounts for environmental liabilities. The amount of these liabilities could be affected by changes in facts or assumptions not currently known to management. These liabilities are included in “Accounts payable and accrued liabilities” or “Other long-term liabilities” in our Consolidated Balance Sheets.
Other representations, warranties and indemnifications
In the normal course of our business, we make representations and warranties, and offer indemnities to counterparties in connection with commercial transactions such as asset sales and other commercial agreements. Indemnification obligations generally are related to contingencies that are not expected to occur at the time of the agreement. We cannot predict with any degree of certainty the potential maximum exposure in respect of these indemnification obligations, but we believe that it is unlikely that we will be required to make material payments thereunder. Accordingly, we have recognized no material liabilities in this respect in our consolidated financial statements.
15
RESOLUTE FOREST PRODUCTS INC.
Notes to Unaudited Interim Consolidated Financial Statements
Note 11. Segment Information
We manage our business based on the products we manufacture. Accordingly, our reportable segments correspond to our primary product lines: newsprint, specialty papers, market pulp and wood products.
None of the income or loss items following “Operating (loss) income” in our Consolidated Statements of Operations are allocated to our segments, since those items are reviewed separately by management. For the same reason, closure costs, impairment and other related charges, inventory write-downs related to closures, start-up costs, net gain on disposition of assets, transaction costs, as well as other discretionary charges or credits are not allocated to our segments. We allocate depreciation and amortization expense to our segments, although the related fixed assets and amortizable intangible assets are not allocated to segment assets. Additionally, all selling, general and administrative expenses, excluding severance costs and certain discretionary charges and credits, are allocated to our segments.
Information about certain segment data for the three and six months ended June 30, 2014 and 2013 was as follows:
(Unaudited, in millions) | Newsprint | Specialty Papers | Market Pulp (1) | Wood Products | Corporate and Other | Consolidated Total | ||||||||||||||||||
Sales | ||||||||||||||||||||||||
Second quarter 2014 | $ | 364 | $ | 325 | $ | 241 | $ | 161 | $ | — | $ | 1,091 | ||||||||||||
Second quarter 2013 | 364 | 338 | 263 | 142 | — | 1,107 | ||||||||||||||||||
First six months 2014 | 710 | 626 | 475 | 296 | — | 2,107 | ||||||||||||||||||
First six months 2013 | 720 | 678 | 503 | 280 | — | 2,181 | ||||||||||||||||||
Depreciation and amortization | ||||||||||||||||||||||||
Second quarter 2014 | $ | 17 | $ | 22 | $ | 13 | $ | 8 | $ | 2 | $ | 62 | ||||||||||||
Second quarter 2013 | 18 | 19 | 13 | 9 | 2 | 61 | ||||||||||||||||||
First six months 2014 | 35 | 44 | 26 | 16 | 3 | 124 | ||||||||||||||||||
First six months 2013 | 36 | 38 | 26 | 18 | 3 | 121 | ||||||||||||||||||
Operating income (loss) (2) | ||||||||||||||||||||||||
Second quarter 2014 | $ | 18 | $ | (3 | ) | $ | 24 | $ | 15 | $ | (62 | ) | $ | (8 | ) | |||||||||
Second quarter 2013 | 10 | 2 | 10 | 16 | (35 | ) | 3 | |||||||||||||||||
First six months 2014 | 3 | (27 | ) | 32 | 27 | (76 | ) | (41 | ) | |||||||||||||||
First six months 2013 | 8 | 10 | 5 | 32 | (101 | ) | (46 | ) | ||||||||||||||||
(1) | Market pulp sales excluded inter-segment sales of $7 million and $3 million for the three months ended June 30, 2014 and 2013, respectively, and $10 million and $8 million for the six months ended June 30, 2014 and 2013, respectively. |
(2) | Corporate and other operating loss for the three and six months ended June 30, 2014 and 2013 included the following significant items: |
Three Months Ended June 30, | Six Months Ended June 30, | ||||||||||||||||
(Unaudited, in millions) | 2014 | 2013 | 2014 | 2013 | |||||||||||||
Net gain on disposition of assets | $ | 2 | $ | 2 | $ | 2 | $ | 2 | |||||||||
Closure costs, impairment and other related charges | (52 | ) | (12 | ) | (62 | ) | (52 | ) | |||||||||
Inventory write-downs related to closures | (3 | ) | (1 | ) | (4 | ) | (5 | ) | |||||||||
Transaction costs | — | (2 | ) | — | (5 | ) | |||||||||||
Start-up costs | (1 | ) | (13 | ) | (1 | ) | (28 | ) | |||||||||
$ | (54 | ) | $ | (26 | ) | $ | (65 | ) | $ | (88 | ) | ||||||
16
RESOLUTE FOREST PRODUCTS INC.
Notes to Unaudited Interim Consolidated Financial Statements
Note 12. Condensed Consolidating Financial Information
The following information is presented in accordance with Rule 3-10 of Regulation S-X and the public information requirements of Rule 144 promulgated pursuant to the Securities Act of 1933 in connection with Resolute Forest Products Inc.’s 2023 Notes that are fully and unconditionally guaranteed, on a joint and several basis, by all of our 100% owned material U.S. subsidiaries (the “Guarantor Subsidiaries”). The 2023 Notes are not guaranteed by our foreign subsidiaries and our less than 100% owned U.S. subsidiaries (the “Non-guarantor Subsidiaries”).
The following condensed consolidating financial information sets forth the Statements of Operations and Comprehensive Income (Loss) for the three and six months ended June 30, 2014 and 2013, the Balance Sheets as of June 30, 2014 and December 31, 2013 and the Statements of Cash Flows for the six months ended June 30, 2014 and 2013 for the Parent, the Guarantor Subsidiaries on a combined basis, and the Non-guarantor Subsidiaries on a combined basis. The condensed consolidating financial information reflects the investments of the Parent in the Guarantor Subsidiaries and Non-guarantor Subsidiaries, as well as the investments of the Guarantor Subsidiaries in the Non-guarantor Subsidiaries, using the equity method of accounting. The principal consolidating adjustments are elimination entries to eliminate the investments in subsidiaries and intercompany balances and transactions.
CONDENSED CONSOLIDATING STATEMENT OF OPERATIONS AND COMPREHENSIVE INCOME (LOSS) | ||||||||||||||||||||
For the Three Months Ended June 30, 2014 | ||||||||||||||||||||
(Unaudited, in millions) | Parent | Guarantor Subsidiaries | Non-guarantor Subsidiaries | Consolidating Adjustments | Consolidated | |||||||||||||||
Sales | $ | — | $ | 892 | $ | 732 | $ | (533 | ) | $ | 1,091 | |||||||||
Costs and expenses: | ||||||||||||||||||||
Cost of sales, excluding depreciation, amortization and distribution costs | — | 830 | 507 | (525 | ) | 812 | ||||||||||||||
Depreciation and amortization | — | 23 | 39 | — | 62 | |||||||||||||||
Distribution costs | — | 42 | 93 | (1 | ) | 134 | ||||||||||||||
Selling, general and administrative expenses | 4 | 13 | 24 | — | 41 | |||||||||||||||
Closure costs, impairment and other related charges | — | 48 | 4 | — | 52 | |||||||||||||||
Net gain on disposition of assets | — | — | (2 | ) | — | (2 | ) | |||||||||||||
Operating (loss) income | (4 | ) | (64 | ) | 67 | (7 | ) | (8 | ) | |||||||||||
Interest expense | (18 | ) | (1 | ) | (1 | ) | 9 | (11 | ) | |||||||||||
Other income, net | 1 | 8 | 20 | (9 | ) | 20 | ||||||||||||||
Parent’s equity in income of subsidiaries | 19 | — | — | (19 | ) | — | ||||||||||||||
(Loss) income before income taxes | (2 | ) | (57 | ) | 86 | (26 | ) | 1 | ||||||||||||
Income tax benefit (provision) | — | 15 | (18 | ) | 2 | (1 | ) | |||||||||||||
Net (loss) income including noncontrolling interests | (2 | ) | (42 | ) | 68 | (24 | ) | — | ||||||||||||
Net income attributable to noncontrolling interests | — | — | (2 | ) | — | (2 | ) | |||||||||||||
Net (loss) income attributable to Resolute Forest Products Inc. | $ | (2 | ) | $ | (42 | ) | $ | 66 | $ | (24 | ) | $ | (2 | ) | ||||||
Comprehensive income (loss) attributable to Resolute Forest Products Inc. | $ | 25 | $ | (16 | ) | $ | 67 | $ | (51 | ) | $ | 25 | ||||||||
17
RESOLUTE FOREST PRODUCTS INC.
Notes to Unaudited Interim Consolidated Financial Statements
CONDENSED CONSOLIDATING STATEMENT OF OPERATIONS AND COMPREHENSIVE (LOSS) INCOME | ||||||||||||||||||||
For the Six Months Ended June 30, 2014 | ||||||||||||||||||||
(Unaudited, in millions) | Parent | Guarantor Subsidiaries | Non-guarantor Subsidiaries | Consolidating Adjustments | Consolidated | |||||||||||||||
Sales | $ | — | $ | 1,737 | $ | 1,433 | $ | (1,063 | ) | $ | 2,107 | |||||||||
Costs and expenses: | ||||||||||||||||||||
Cost of sales, excluding depreciation, amortization and distribution costs | — | 1,650 | 1,039 | (1,056 | ) | 1,633 | ||||||||||||||
Depreciation and amortization | — | 48 | 76 | — | 124 | |||||||||||||||
Distribution costs | — | 79 | 177 | (2 | ) | 254 | ||||||||||||||
Selling, general and administrative expenses | 8 | 22 | 47 | — | 77 | |||||||||||||||
Closure costs, impairment and other related charges | — | 50 | 12 | — | 62 | |||||||||||||||
Net gain on disposition of assets | — | — | (2 | ) | — | (2 | ) | |||||||||||||
Operating (loss) income | (8 | ) | (112 | ) | 84 | (5 | ) | (41 | ) | |||||||||||
Interest expense | (35 | ) | (2 | ) | (4 | ) | 18 | (23 | ) | |||||||||||
Other income, net | — | 19 | 6 | (18 | ) | 7 | ||||||||||||||
Parent’s equity in loss of subsidiaries | (9 | ) | — | — | 9 | — | ||||||||||||||
(Loss) income before income taxes | (52 | ) | (95 | ) | 86 | 4 | (57 | ) | ||||||||||||
Income tax benefit (provision) | — | 30 | (24 | ) | 1 | 7 | ||||||||||||||
Net (loss) income including noncontrolling interests | (52 | ) | (65 | ) | 62 | 5 | (50 | ) | ||||||||||||
Net income attributable to noncontrolling interests | — | — | (2 | ) | — | (2 | ) | |||||||||||||
Net (loss) income attributable to Resolute Forest Products Inc. | $ | (52 | ) | $ | (65 | ) | $ | 60 | $ | 5 | $ | (52 | ) | |||||||
Comprehensive (loss) income attributable to Resolute Forest Products Inc. | $ | (1 | ) | $ | (15 | ) | $ | 61 | $ | (46 | ) | $ | (1 | ) | ||||||
18
RESOLUTE FOREST PRODUCTS INC.
Notes to Unaudited Interim Consolidated Financial Statements
CONDENSED CONSOLIDATING STATEMENT OF OPERATIONS AND COMPREHENSIVE (LOSS) INCOME | ||||||||||||||||||||
For the Three Months Ended June 30, 2013 | ||||||||||||||||||||
(Unaudited, in millions) | Parent | Guarantor Subsidiaries | Non-guarantor Subsidiaries | Consolidating Adjustments | Consolidated | |||||||||||||||
Sales | $ | — | $ | 935 | $ | 732 | $ | (560 | ) | $ | 1,107 | |||||||||
Costs and expenses: | ||||||||||||||||||||
Cost of sales, excluding depreciation, amortization and distribution costs | — | 859 | 558 | (558 | ) | 859 | ||||||||||||||
Depreciation and amortization | — | 25 | 36 | — | 61 | |||||||||||||||
Distribution costs | — | 42 | 89 | (1 | ) | 130 | ||||||||||||||
Selling, general and administrative expenses | 5 | 15 | 24 | — | 44 | |||||||||||||||
Closure costs, impairment and other related charges | — | 12 | — | — | 12 | |||||||||||||||
Net gain on disposition of assets | — | — | (2 | ) | — | (2 | ) | |||||||||||||
Operating (loss) income | (5 | ) | (18 | ) | 27 | (1 | ) | 3 | ||||||||||||
Interest expense | (23 | ) | (1 | ) | (2 | ) | 13 | (13 | ) | |||||||||||
Other (expense) income, net | (59 | ) | 11 | (4 | ) | (13 | ) | (65 | ) | |||||||||||
Parent’s equity in income of subsidiaries | 11 | — | — | (11 | ) | — | ||||||||||||||
(Loss) income before income taxes | (76 | ) | (8 | ) | 21 | (12 | ) | (75 | ) | |||||||||||
Income tax benefit (provision) | 33 | 5 | (7 | ) | — | 31 | ||||||||||||||
Net (loss) income including noncontrolling interests | (43 | ) | (3 | ) | 14 | (12 | ) | (44 | ) | |||||||||||
Net loss attributable to noncontrolling interests | — | — | 1 | — | 1 | |||||||||||||||
Net (loss) income attributable to Resolute Forest Products Inc. | $ | (43 | ) | $ | (3 | ) | $ | 15 | $ | (12 | ) | $ | (43 | ) | ||||||
Comprehensive (loss) income attributable to Resolute Forest Products Inc. | $ | (39 | ) | $ | 14 | $ | 2 | $ | (16 | ) | $ | (39 | ) | |||||||
19
RESOLUTE FOREST PRODUCTS INC.
Notes to Unaudited Interim Consolidated Financial Statements
CONDENSED CONSOLIDATING STATEMENT OF OPERATIONS AND COMPREHENSIVE (LOSS) INCOME | ||||||||||||||||||||
For the Six Months Ended June 30, 2013 | ||||||||||||||||||||
(Unaudited, in millions) | Parent | Guarantor Subsidiaries | Non-guarantor Subsidiaries | Consolidating Adjustments | Consolidated | |||||||||||||||
Sales | $ | — | $ | 1,782 | $ | 1,420 | $ | (1,021 | ) | $ | 2,181 | |||||||||
Costs and expenses: | ||||||||||||||||||||
Cost of sales, excluding depreciation, amortization and distribution costs | — | 1,633 | 1,094 | (1,012 | ) | 1,715 | ||||||||||||||
Depreciation and amortization | — | 50 | 71 | — | 121 | |||||||||||||||
Distribution costs | — | 85 | 171 | (3 | ) | 253 | ||||||||||||||
Selling, general and administrative expenses | 10 | 27 | 51 | — | 88 | |||||||||||||||
Closure costs, impairment and other related charges | — | 49 | 3 | — | 52 | |||||||||||||||
Net gain on disposition of assets | — | — | (2 | ) | — | (2 | ) | |||||||||||||
Operating (loss) income | (10 | ) | (62 | ) | 32 | (6 | ) | (46 | ) | |||||||||||
Interest expense | (55 | ) | (1 | ) | (4 | ) | 33 | (27 | ) | |||||||||||
Other (expense) income, net | (59 | ) | 45 | — | (33 | ) | (47 | ) | ||||||||||||
Parent’s equity in income of subsidiaries | 32 | — | — | (32 | ) | — | ||||||||||||||
(Loss) income before income taxes | (92 | ) | (18 | ) | 28 | (38 | ) | (120 | ) | |||||||||||
Income tax benefit (provision) | 44 | 40 | (14 | ) | 1 | 71 | ||||||||||||||
Net (loss) income including noncontrolling interests | (48 | ) | 22 | 14 | (37 | ) | (49 | ) | ||||||||||||
Net loss attributable to noncontrolling interests | — | — | 1 | — | 1 | |||||||||||||||
Net (loss) income attributable to Resolute Forest Products Inc. | $ | (48 | ) | $ | 22 | $ | 15 | $ | (37 | ) | $ | (48 | ) | |||||||
Comprehensive (loss) income attributable to Resolute Forest Products Inc. | $ | (43 | ) | $ | 40 | $ | 2 | $ | (42 | ) | $ | (43 | ) | |||||||
20
RESOLUTE FOREST PRODUCTS INC.
Notes to Unaudited Interim Consolidated Financial Statements
CONDENSED CONSOLIDATING BALANCE SHEET | ||||||||||||||||||||
As of June 30, 2014 | ||||||||||||||||||||
(Unaudited, in millions) | Parent | Guarantor Subsidiaries | Non-guarantor Subsidiaries | Consolidating Adjustments | Consolidated | |||||||||||||||
Assets | ||||||||||||||||||||
Current assets: | ||||||||||||||||||||
Cash and cash equivalents | $ | — | $ | 55 | $ | 208 | $ | — | $ | 263 | ||||||||||
Accounts receivable, net | — | 437 | 173 | — | 610 | |||||||||||||||
Accounts receivable from affiliates | — | 367 | 161 | (528 | ) | — | ||||||||||||||
Inventories, net | — | 259 | 332 | (12 | ) | 579 | ||||||||||||||
Deferred income tax assets | — | — | 32 | — | 32 | |||||||||||||||
Note and interest receivable from parent | — | 282 | — | (282 | ) | — | ||||||||||||||
Notes receivable from affiliates | — | 354 | — | (354 | ) | — | ||||||||||||||
Note receivable from subsidiary | 8 | — | — | (8 | ) | — | ||||||||||||||
Other current assets | — | 32 | 30 | — | 62 | |||||||||||||||
Total current assets | 8 | 1,786 | 936 | (1,184 | ) | 1,546 | ||||||||||||||
Fixed assets, net | — | 777 | 1,407 | — | 2,184 | |||||||||||||||
Amortizable intangible assets, net | — | — | 64 | — | 64 | |||||||||||||||
Deferred income tax assets | — | 28 | 1,206 | 3 | 1,237 | |||||||||||||||
Note receivable from parent | — | 376 | — | (376 | ) | — | ||||||||||||||
Notes receivable from affiliates | — | 170 | — | (170 | ) | — | ||||||||||||||
Investments in consolidated subsidiaries and affiliates | 4,776 | 1,999 | — | (6,775 | ) | — | ||||||||||||||
Other assets | 8 | 114 | 94 | — | 216 | |||||||||||||||
Total assets | $ | 4,792 | $ | 5,250 | $ | 3,707 | $ | (8,502 | ) | $ | 5,247 | |||||||||
Liabilities and equity | ||||||||||||||||||||
Current liabilities: | ||||||||||||||||||||
Accounts payable and accrued liabilities | $ | 5 | $ | 204 | $ | 347 | $ | — | $ | 556 | ||||||||||
Current portion of long-term debt | — | — | 1 | — | 1 | |||||||||||||||
Accounts payable to affiliates | 370 | 158 | — | (528 | ) | — | ||||||||||||||
Deferred income tax liabilities | — | 32 | — | — | 32 | |||||||||||||||
Note and interest payable to subsidiary | 282 | — | — | (282 | ) | — | ||||||||||||||
Notes payable to affiliates | — | — | 354 | (354 | ) | — | ||||||||||||||
Note payable to parent | — | — | 8 | (8 | ) | — | ||||||||||||||
Total current liabilities | 657 | 394 | 710 | (1,172 | ) | 589 | ||||||||||||||
Long-term debt, net of current portion | 595 | 2 | — | — | 597 | |||||||||||||||
Long-term debt due to subsidiary | 376 | — | — | (376 | ) | — | ||||||||||||||
Long-term debt due to affiliate | — | — | 170 | (170 | ) | — | ||||||||||||||
Pension and other postretirement benefit obligations | — | 244 | 902 | — | 1,146 | |||||||||||||||
Deferred income tax liabilities | — | 1 | 24 | — | 25 | |||||||||||||||
Other long-term liabilities | 1 | 26 | 21 | — | 48 | |||||||||||||||
Total liabilities | 1,629 | 667 | 1,827 | (1,718 | ) | 2,405 | ||||||||||||||
Total equity | 3,163 | 4,583 | 1,880 | (6,784 | ) | 2,842 | ||||||||||||||
Total liabilities and equity | $ | 4,792 | $ | 5,250 | $ | 3,707 | $ | (8,502 | ) | $ | 5,247 | |||||||||
21
RESOLUTE FOREST PRODUCTS INC.
Notes to Unaudited Interim Consolidated Financial Statements
CONDENSED CONSOLIDATING BALANCE SHEET | ||||||||||||||||||||
As of December 31, 2013 | ||||||||||||||||||||
(Unaudited, in millions) | Parent | Guarantor Subsidiaries | Non-guarantor Subsidiaries | Consolidating Adjustments | Consolidated | |||||||||||||||
Assets | ||||||||||||||||||||
Current assets: | ||||||||||||||||||||
Cash and cash equivalents | $ | — | $ | 165 | $ | 157 | $ | — | $ | 322 | ||||||||||
Accounts receivable, net | — | 433 | 201 | — | 634 | |||||||||||||||
Accounts receivable from affiliates | — | 335 | 135 | (470 | ) | — | ||||||||||||||
Inventories, net | — | 211 | 326 | (8 | ) | 529 | ||||||||||||||
Deferred income tax assets | — | — | 32 | — | 32 | |||||||||||||||
Interest receivable from parent | — | 14 | — | (14 | ) | — | ||||||||||||||
Note receivable from affiliate | — | 350 | — | (350 | ) | — | ||||||||||||||
Note receivable from subsidiary | 13 | — | — | (13 | ) | — | ||||||||||||||
Other current assets | — | 18 | 27 | — | 45 | |||||||||||||||
Total current assets | 13 | 1,526 | 878 | (855 | ) | 1,562 | ||||||||||||||
Fixed assets, net | — | 847 | 1,442 | — | 2,289 | |||||||||||||||
Amortizable intangible assets, net | — | — | 66 | — | 66 | |||||||||||||||
Deferred income tax assets | — | 28 | 1,236 | 2 | 1,266 | |||||||||||||||
Notes receivable from parent | — | 627 | — | (627 | ) | — | ||||||||||||||
Notes receivable from affiliates | — | 170 | — | (170 | ) | — | ||||||||||||||
Investments in consolidated subsidiaries and affiliates | 4,734 | 2,085 | — | (6,819 | ) | — | ||||||||||||||
Other assets | 8 | 112 | 82 | — | 202 | |||||||||||||||
Total assets | $ | 4,755 | $ | 5,395 | $ | 3,704 | $ | (8,469 | ) | $ | 5,385 | |||||||||
Liabilities and equity | ||||||||||||||||||||
Current liabilities: | ||||||||||||||||||||
Accounts payable and accrued liabilities | $ | 5 | $ | 190 | $ | 338 | $ | — | $ | 533 | ||||||||||
Current portion of long-term debt | — | 1 | 1 | — | 2 | |||||||||||||||
Accounts payable to affiliates | 352 | 118 | — | (470 | ) | — | ||||||||||||||
Deferred income tax liabilities | — | 32 | — | — | 32 | |||||||||||||||
Interest payable to subsidiaries | 14 | — | — | (14 | ) | — | ||||||||||||||
Note payable to affiliate | — | — | 350 | (350 | ) | — | ||||||||||||||
Note payable to parent | — | — | 13 | (13 | ) | — | ||||||||||||||
Total current liabilities | 371 | 341 | 702 | (847 | ) | 567 | ||||||||||||||
Long-term debt, net of current portion | 595 | 2 | — | — | 597 | |||||||||||||||
Long-term debt due to subsidiaries | 627 | — | — | (627 | ) | — | ||||||||||||||
Long-term debt due to affiliate | — | — | 170 | (170 | ) | — | ||||||||||||||
Pension and other postretirement benefit obligations | — | 340 | 954 | — | 1,294 | |||||||||||||||
Deferred income tax liabilities | — | 1 | 25 | — | 26 | |||||||||||||||
Other long-term liabilities | — | 26 | 36 | — | 62 | |||||||||||||||
Total liabilities | 1,593 | 710 | 1,887 | (1,644 | ) | 2,546 | ||||||||||||||
Total equity | 3,162 | 4,685 | 1,817 | (6,825 | ) | 2,839 | ||||||||||||||
Total liabilities and equity | $ | 4,755 | $ | 5,395 | $ | 3,704 | $ | (8,469 | ) | $ | 5,385 | |||||||||
22
RESOLUTE FOREST PRODUCTS INC.
Notes to Unaudited Interim Consolidated Financial Statements
CONDENSED CONSOLIDATING STATEMENT OF CASH FLOWS | ||||||||||||||||||||
For the Six Months Ended June 30, 2014 | ||||||||||||||||||||
(Unaudited, in millions) | Parent | Guarantor Subsidiaries | Non-guarantor Subsidiaries | Consolidating Adjustments | Consolidated | |||||||||||||||
Net cash (used in) provided by operating activities | $ | — | $ | (70 | ) | $ | 92 | $ | — | $ | 22 | |||||||||
Cash flows from investing activities: | ||||||||||||||||||||
Cash invested in fixed assets | — | (38 | ) | (44 | ) | — | (82 | ) | ||||||||||||
Disposition of assets | — | — | 2 | — | 2 | |||||||||||||||
Decrease in restricted cash | — | — | 1 | — | 1 | |||||||||||||||
Increase in deposit requirements for letters of credit, net | — | — | (1 | ) | — | (1 | ) | |||||||||||||
Net cash used in investing activities | — | (38 | ) | (42 | ) | — | (80 | ) | ||||||||||||
Cash flows from financing activities: | ||||||||||||||||||||
Payments of debt | — | (1 | ) | — | — | (1 | ) | |||||||||||||
Payments of financing and credit facility fees | — | (1 | ) | — | — | (1 | ) | |||||||||||||
Net cash used in financing activities | — | (2 | ) | — | — | (2 | ) | |||||||||||||
Effect of exchange rate changes on cash and cash equivalents | — | — | 1 | — | 1 | |||||||||||||||
Net (decrease) increase in cash and cash equivalents | — | (110 | ) | 51 | — | (59 | ) | |||||||||||||
Cash and cash equivalents: | ||||||||||||||||||||
Beginning of period | — | 165 | 157 | — | 322 | |||||||||||||||
End of period | $ | — | $ | 55 | $ | 208 | $ | — | $ | 263 | ||||||||||
23
RESOLUTE FOREST PRODUCTS INC.
Notes to Unaudited Interim Consolidated Financial Statements
CONDENSED CONSOLIDATING STATEMENT OF CASH FLOWS | ||||||||||||||||||||
For the Six Months Ended June 30, 2013 | ||||||||||||||||||||
(Unaudited, in millions) | Parent | Guarantor Subsidiaries | Non-guarantor Subsidiaries | Consolidating Adjustments | Consolidated | |||||||||||||||
Net cash (used in) provided by operating activities | $ | — | $ | (7 | ) | $ | 55 | $ | — | $ | 48 | |||||||||
Cash flows from investing activities: | ||||||||||||||||||||
Cash invested in fixed assets | — | (29 | ) | (57 | ) | — | (86 | ) | ||||||||||||
Disposition of assets | — | — | 3 | — | 3 | |||||||||||||||
Proceeds from insurance settlements | — | — | 4 | — | 4 | |||||||||||||||
Decrease in restricted cash | — | — | 3 | — | 3 | |||||||||||||||
Decrease in deposit requirements for letters of credit, net | — | — | 1 | — | 1 | |||||||||||||||
Advances (to) from affiliates | (10 | ) | 10 | — | — | — | ||||||||||||||
Net cash used in investing activities | (10 | ) | (19 | ) | (46 | ) | — | (75 | ) | |||||||||||
Cash flows from financing activities: | ||||||||||||||||||||
Issuance of long-term debt | 594 | — | — | — | 594 | |||||||||||||||
Premium paid on extinguishment of debt | (84 | ) | — | — | — | (84 | ) | |||||||||||||
Payments of debt | (496 | ) | — | (1 | ) | — | (497 | ) | ||||||||||||
Payments of financing and credit facility fees | (9 | ) | — | — | — | (9 | ) | |||||||||||||
Contribution of capital from noncontrolling interest | — | 8 | — | — | 8 | |||||||||||||||
Net cash provided by (used in) financing activities | 5 | 8 | (1 | ) | — | 12 | ||||||||||||||
Net (decrease) increase in cash and cash equivalents | (5 | ) | (18 | ) | 8 | — | (15 | ) | ||||||||||||
Cash and cash equivalents: | ||||||||||||||||||||
Beginning of period | 5 | 171 | 87 | — | 263 | |||||||||||||||
End of period | $ | — | $ | 153 | $ | 95 | $ | — | $ | 248 | ||||||||||
24
ITEM 2. | MANAGEMENT’S DISCUSSION AND ANALYSIS OF FINANCIAL CONDITION AND RESULTS OF OPERATIONS |
The following management’s discussion and analysis is intended to help the reader understand Resolute Forest Products, our results of operations, cash flows and financial condition. The discussion is provided as a supplement to, and should be read in conjunction with, our consolidated financial statements and the accompanying notes contained in Item 1 – Financial Statements.
When we refer to “Resolute Forest Products,” “we,” “our,” “us” or the “Company,” we mean Resolute Forest Products Inc. with its subsidiaries and affiliates, either individually or collectively, unless otherwise indicated.
CAUTIONARY STATEMENTS REGARDING FORWARD-LOOKING INFORMATION AND USE OF THIRD-PARTY DATA
Statements in this quarterly report on Form 10-Q that are not reported financial results or other historical information of Resolute Forest Products are “forward-looking statements” within the meaning of the Private Securities Litigation Reform Act of 1995. They include, for example, statements relating to our: efforts to continue to reduce costs and increase revenues and profitability, including our cost-reduction initiatives; business and operating outlook; assessment of market conditions; prospects, growth strategies and the industry in which we operate; and strategies for achieving our goals generally. Forward-looking statements may be identified by the use of forward-looking terminology such as the words “should,” “would,” “could,” “will,” “may,” “expect,” “believe,” “anticipate,” “attempt,” “project” and other terms with similar meaning indicating possible future events or potential impact on our business or Resolute Forest Products’ shareholders.
The reader is cautioned not to place undue reliance on these forward-looking statements, which are not guarantees of future performance. These statements are based on management’s current assumptions, beliefs and expectations, all of which involve a number of business risks and uncertainties that could cause actual results to differ materially. The potential risks and uncertainties that could cause our actual future financial condition, results of operations and performance to differ materially from those expressed or implied in this quarterly report on Form 10-Q include, but are not limited to, the potential risks and uncertainties set forth under Part I, Item 1A, “Risk Factors,” of our annual report of Form 10-K for the year ended December 31, 2013, filed with the U.S. Securities and Exchange Commission, or the “SEC”, on March 3, 2014 (the “2013 annual report”).
All forward-looking statements in this quarterly report on Form 10-Q are expressly qualified by the cautionary statements contained or referred to in this section and in our other filings with the SEC and the Canadian securities regulatory authorities. We disclaim any obligation to publicly update or revise any forward-looking information, whether as a result of new information, future events or otherwise, except as required by law.
Market and industry data
The information on industry and general economic conditions in this quarterly report on Form 10-Q was derived from third-party sources and trade publications we believe to be widely accepted and accurate. We have not independently verified the information and cannot assure you of its accuracy.
OVERVIEW
Resolute Forest Products is a global leader in the forest products industry, with a diverse range of products, including newsprint, specialty papers, market pulp and wood products, which are marketed in close to 90 countries. We own or operate nearly 40 pulp and paper mills and wood products facilities in the U.S., Canada and South Korea, and power generation assets in Canada. By capacity, we are the number one producer of newsprint in the world, the largest producer of uncoated mechanical papers in North America and the largest Canadian producer of wood products east of the Rockies. We are also a significant North American producer of coated mechanical papers and market pulp.
We report our activities in four business segments: newsprint, specialty papers, market pulp and wood products.
We are guided by our vision and values, focusing on safety, profitability, accountability, sustainability and teamwork. These are the elements that we believe best define us:
• | Competitive cost structure - as a result of aggressive cost reductions and mill rationalizations, today we compete as a leading, lower-cost North American producer. Maintaining this competitive advantage is our key focus. By challenging ourselves to optimize assets - maximizing the utilization of our most cost-effective mills and streamlining production to adapt to changing market dynamics - we seek to remain an industry cost leader and to maximize shareholder value and earnings power. |
25
• | Synergistic and diversified asset base - our harvesting rights and extensive network of Canadian sawmills not only make us a significant lumber producer in eastern North America, but also give us the fiber management advantage of integration from the harvested log through the finished pulp or paper product at more than half of our facilities. In the U.S., we source primarily from the lower-cost southeastern fiber basket. The diversified and complimentary nature of our asset base also provides earnings from multiple products. |
• | Financial strength - we make disciplined capital management a priority; we believe in maintaining a flexible and conservative capital structure. |
Our Business
For information relating to our business, including our products, strategy, sustainable performance and development, and power generation assets, refer to our 2013 annual report.
Second Quarter Overview
Three months ended June 30, 2014 vs. June 30, 2013
Excluding special items, we generated operating income of $46 million, compared to $29 million in the year-ago period. Unadjusted for special items, the operating loss was $8 million in the second quarter, compared to operating income of $3 million in the year-ago period. The special items are described below.
Our net income in the quarter, excluding special items, was $19 million, or $0.20 per share, up from net income, excluding special items, of $18 million, or $0.19 per share, in the second quarter of 2013. Unadjusted for special items, our net loss in the quarter was $2 million, compared to $43 million in the year-ago period. Sales were $1.1 billion in the quarter, down $16 million from the second quarter of 2013.
Three Months Ended June 30, 2014 | Operating Income (Loss) | Net Income (Loss) | EPS | |||||||||
(unaudited, in millions, except per share amounts) | ||||||||||||
GAAP, as reported | $ | (8 | ) | $ | (2 | ) | $ | (0.02 | ) | |||
Adjustments for special items (1): | ||||||||||||
Foreign exchange translation gain | — | (17 | ) | (0.18 | ) | |||||||
Closure costs, impairment and other related charges | 52 | 52 | 0.55 | |||||||||
Inventory write-downs related to closures | 3 | 3 | 0.03 | |||||||||
Start-up costs | 1 | 1 | 0.01 | |||||||||
Net gain on disposition of assets | (2 | ) | (2 | ) | (0.02 | ) | ||||||
Other income, net | — | (3 | ) | (0.03 | ) | |||||||
Income tax effect of special items | — | (13 | ) | (0.14 | ) | |||||||
GAAP, as adjusted for special items | $ | 46 | $ | 19 | $ | 0.20 | ||||||
26
Three Months Ended June 30, 2013 | Operating Income (Loss) | Net Income (Loss) | EPS | |||||||||
(unaudited, in millions, except per share amounts) | ||||||||||||
GAAP, as reported | $ | 3 | $ | (43 | ) | $ | (0.45 | ) | ||||
Adjustments for special items (1): | ||||||||||||
Foreign exchange translation loss | — | 7 | 0.07 | |||||||||
Closure costs, impairment and other related charges | 12 | 12 | 0.13 | |||||||||
Inventory write-downs related to closures | 1 | 1 | 0.01 | |||||||||
Start-up costs | 13 | 13 | 0.14 | |||||||||
Net gain on disposition of assets | (2 | ) | (2 | ) | (0.02 | ) | ||||||
Net loss on extinguishment of debt | — | 59 | 0.62 | |||||||||
Transaction costs | 2 | 2 | 0.02 | |||||||||
Other income, net | — | (1 | ) | (0.01 | ) | |||||||
Income tax effect of special items | — | (30 | ) | (0.32 | ) | |||||||
GAAP, as adjusted for special items | $ | 29 | $ | 18 | $ | 0.19 | ||||||
(1) | Operating income (loss), net income (loss) and net income (loss) per share (or “EPS”), in each case as adjusted for special items, are not financial measures recognized under generally accepted accounting principles, or “GAAP”. We calculate operating income (loss), as adjusted for special items, as operating income (loss) from our consolidated statements of operations, adjusted for items such as closure costs, impairment and other related charges, inventory write-downs related to closures, start-up costs, gains and losses on disposition of assets, transaction costs, and other charges or credits that are excluded from our segment’s performance from GAAP operating income (loss). We calculate net income (loss), as adjusted for special items, as net income (loss) from our consolidated statements of operations, adjusted for the same special items applied to operating income (loss), plus the effects of foreign currency translation, net loss on extinguishment of debt and other income (expense). EPS, as adjusted for special items, is calculated as net income (loss), as adjusted for special items, per diluted share. We believe that using these measures is useful because they are consistent with the indicators management uses internally to measure the Company’s performance, and it allows the reader to more easily compare our ongoing operations and financial performance from period to period. |
Six months ended June 30, 2014 vs. June 30, 2013
Excluding special items, we generated operating income of $24 million, compared to $42 million in the year-ago period. Unadjusted for special items, the operating loss was $41 million for the first half of the year, compared to a loss of $46 million in the year-ago period. The special items are described below.
Our net loss in the first half of the year, excluding special items, was $7 million, or $0.07 per share, down from net income, excluding special items, of $46 million, or $0.49 per share, for the first six months of 2013. Unadjusted for special items, our net loss in the quarter was $52 million, compared to a loss of $48 million in the year-ago period. Sales were $2.1 billion, down $74 million from the same period last year.
27
Six Months Ended June 30, 2014 | Operating Income (Loss) | Net Income (Loss) | EPS | |||||||||
(unaudited, in millions, except per share amounts) | ||||||||||||
GAAP, as reported | $ | (41 | ) | $ | (52 | ) | $ | (0.55 | ) | |||
Adjustments for special items (1): | ||||||||||||
Foreign exchange translation gain | — | (3 | ) | (0.03 | ) | |||||||
Closure costs, impairment and other related charges | 62 | 62 | 0.66 | |||||||||
Inventory write-downs related to closures | 4 | 4 | 0.04 | |||||||||
Start-up costs | 1 | 1 | 0.01 | |||||||||
Net gain on disposition of assets | (2 | ) | (2 | ) | (0.02 | ) | ||||||
Other income, net | — | (4 | ) | (0.04 | ) | |||||||
Income tax effect of special items | — | (13 | ) | (0.14 | ) | |||||||
GAAP, as adjusted for special items | $ | 24 | $ | (7 | ) | $ | (0.07 | ) | ||||
Six Months Ended June 30, 2013 | Operating Income (Loss) | Net Income (Loss) | EPS | |||||||||
(unaudited, in millions, except per share amounts) | ||||||||||||
GAAP, as reported | $ | (46 | ) | $ | (48 | ) | $ | (0.51 | ) | |||
Adjustments for special items (1): | ||||||||||||
Foreign exchange translation loss | — | 12 | 0.13 | |||||||||
Closure costs, impairment and other related charges | 52 | 52 | 0.55 | |||||||||
Inventory write-downs related to closures | 5 | 5 | 0.05 | |||||||||
Start-up costs | 28 | 28 | 0.30 | |||||||||
Net gain on disposition of assets | (2 | ) | (2 | ) | (0.02 | ) | ||||||
Net loss on extinguishment of debt | — | 59 | 0.62 | |||||||||
Transaction costs | 5 | 5 | 0.05 | |||||||||
Other income, net | — | (24 | ) | (0.25 | ) | |||||||
Income tax effect of special items | — | (41 | ) | (0.43 | ) | |||||||
GAAP, as adjusted for special items | $ | 42 | $ | 46 | $ | 0.49 | ||||||
(1) | Operating income (loss), net income (loss) and EPS, in each case as adjusted for special items, are non-GAAP financial measures. For more information on the calculation and reason we include this measure, see note 1 under “Overview – Second Quarter Overview” above. |
28
RESULTS OF OPERATIONS
Consolidated Results
Selected Financial Information
Three Months Ended June 30, | Six Months Ended June 30, | ||||||||||||||||
(unaudited, in millions, except per share amounts) | 2014 | 2013 | 2014 | 2013 | |||||||||||||
Sales | $ | 1,091 | $ | 1,107 | $ | 2,107 | $ | 2,181 | |||||||||
Operating income (loss) per segment: | |||||||||||||||||
Newsprint | 18 | 10 | 3 | 8 | |||||||||||||
Specialty papers | (3 | ) | 2 | (27 | ) | 10 | |||||||||||
Market pulp | 24 | 10 | 32 | 5 | |||||||||||||
Wood products | 15 | 16 | 27 | 32 | |||||||||||||
Corporate / other | (62 | ) | (35 | ) | (76 | ) | (101 | ) | |||||||||
Total | (8 | ) | 3 | (41 | ) | (46 | ) | ||||||||||
Net loss | (2 | ) | (43 | ) | (52 | ) | (48 | ) | |||||||||
Net loss per common share: | |||||||||||||||||
Basic | $ | (0.02 | ) | $ | (0.45 | ) | $ | (0.55 | ) | $ | (0.51 | ) | |||||
Diluted | (0.02 | ) | (0.45 | ) | (0.55 | ) | (0.51 | ) | |||||||||
Adjusted EBITDA (1) | $ | 108 | $ | 90 | $ | 148 | $ | 163 | |||||||||
Adjusted EBITDA margin (1) | 9.9 | % | 8.1 | % | 7.0 | % | 7.5 | % | |||||||||
As of June 30, | As of December 31, | |||||||
(unaudited, in millions) | 2014 | 2013 | ||||||
Cash and cash equivalents | $ | 263 | $ | 322 | ||||
Total assets | 5,247 | 5,385 | ||||||
(1) | Earnings before interest expense, income taxes, and depreciation and amortization, or “EBITDA”, adjusted EBITDA and adjusted EBITDA margin are non-GAAP financial measures. EBITDA is calculated as net income (loss) including noncontrolling interests from the consolidated statements of operations, adjusted for interest expense, income taxes, and depreciation and amortization. Adjusted EBITDA means EBITDA, excluding special items, such as foreign exchange translation gains and losses, closure costs, impairment and other related charges, inventory write-downs related to closures, start-up costs, gains and losses on disposition of assets, net loss on extinguishment of debt, transaction costs and other charges or credits. Adjusted EBITDA margin is adjusted EBITDA expressed as a percentage of sales. We believe that using measures such as EBITDA, adjusted EBITDA and adjusted EBITDA margin is useful because they are consistent with the indicators management uses internally to measure the Company’s performance and it allows the reader to more easily compare our ongoing operations and financial performance from period to period. |
29
Three Months Ended June 30, | Six Months Ended June 30, | ||||||||||||||||
(Unaudited, in millions) | 2014 | 2013 | 2014 | 2013 | |||||||||||||
Net loss including noncontrolling interests | $ | — | $ | (44 | ) | $ | (50 | ) | $ | (49 | ) | ||||||
Interest expense | 11 | 13 | 23 | 27 | |||||||||||||
Income tax provision (benefit) | 1 | (31 | ) | (7 | ) | (71 | ) | ||||||||||
Depreciation and amortization | 62 | 61 | 124 | 121 | |||||||||||||
EBITDA | $ | 74 | $ | (1 | ) | $ | 90 | $ | 28 | ||||||||
Foreign exchange translation (gain) loss | (17 | ) | 7 | (3 | ) | 12 | |||||||||||
Closure costs, impairment and other related charges | 52 | 12 | 62 | 52 | |||||||||||||
Inventory write-downs related to closures | 3 | 1 | 4 | 5 | |||||||||||||
Start-up costs | 1 | 13 | 1 | 28 | |||||||||||||
Net gain on disposition of assets | (2 | ) | (2 | ) | (2 | ) | (2 | ) | |||||||||
Net loss on extinguishment of debt | — | 59 | — | 59 | |||||||||||||
Transaction costs | — | 2 | — | 5 | |||||||||||||
Other income, net | (3 | ) | (1 | ) | (4 | ) | (24 | ) | |||||||||
Adjusted EBITDA | $ | 108 | $ | 90 | $ | 148 | $ | 163 | |||||||||
Three months ended June 30, 2014 vs. June 30, 2013
Operating (loss) income variance analysis
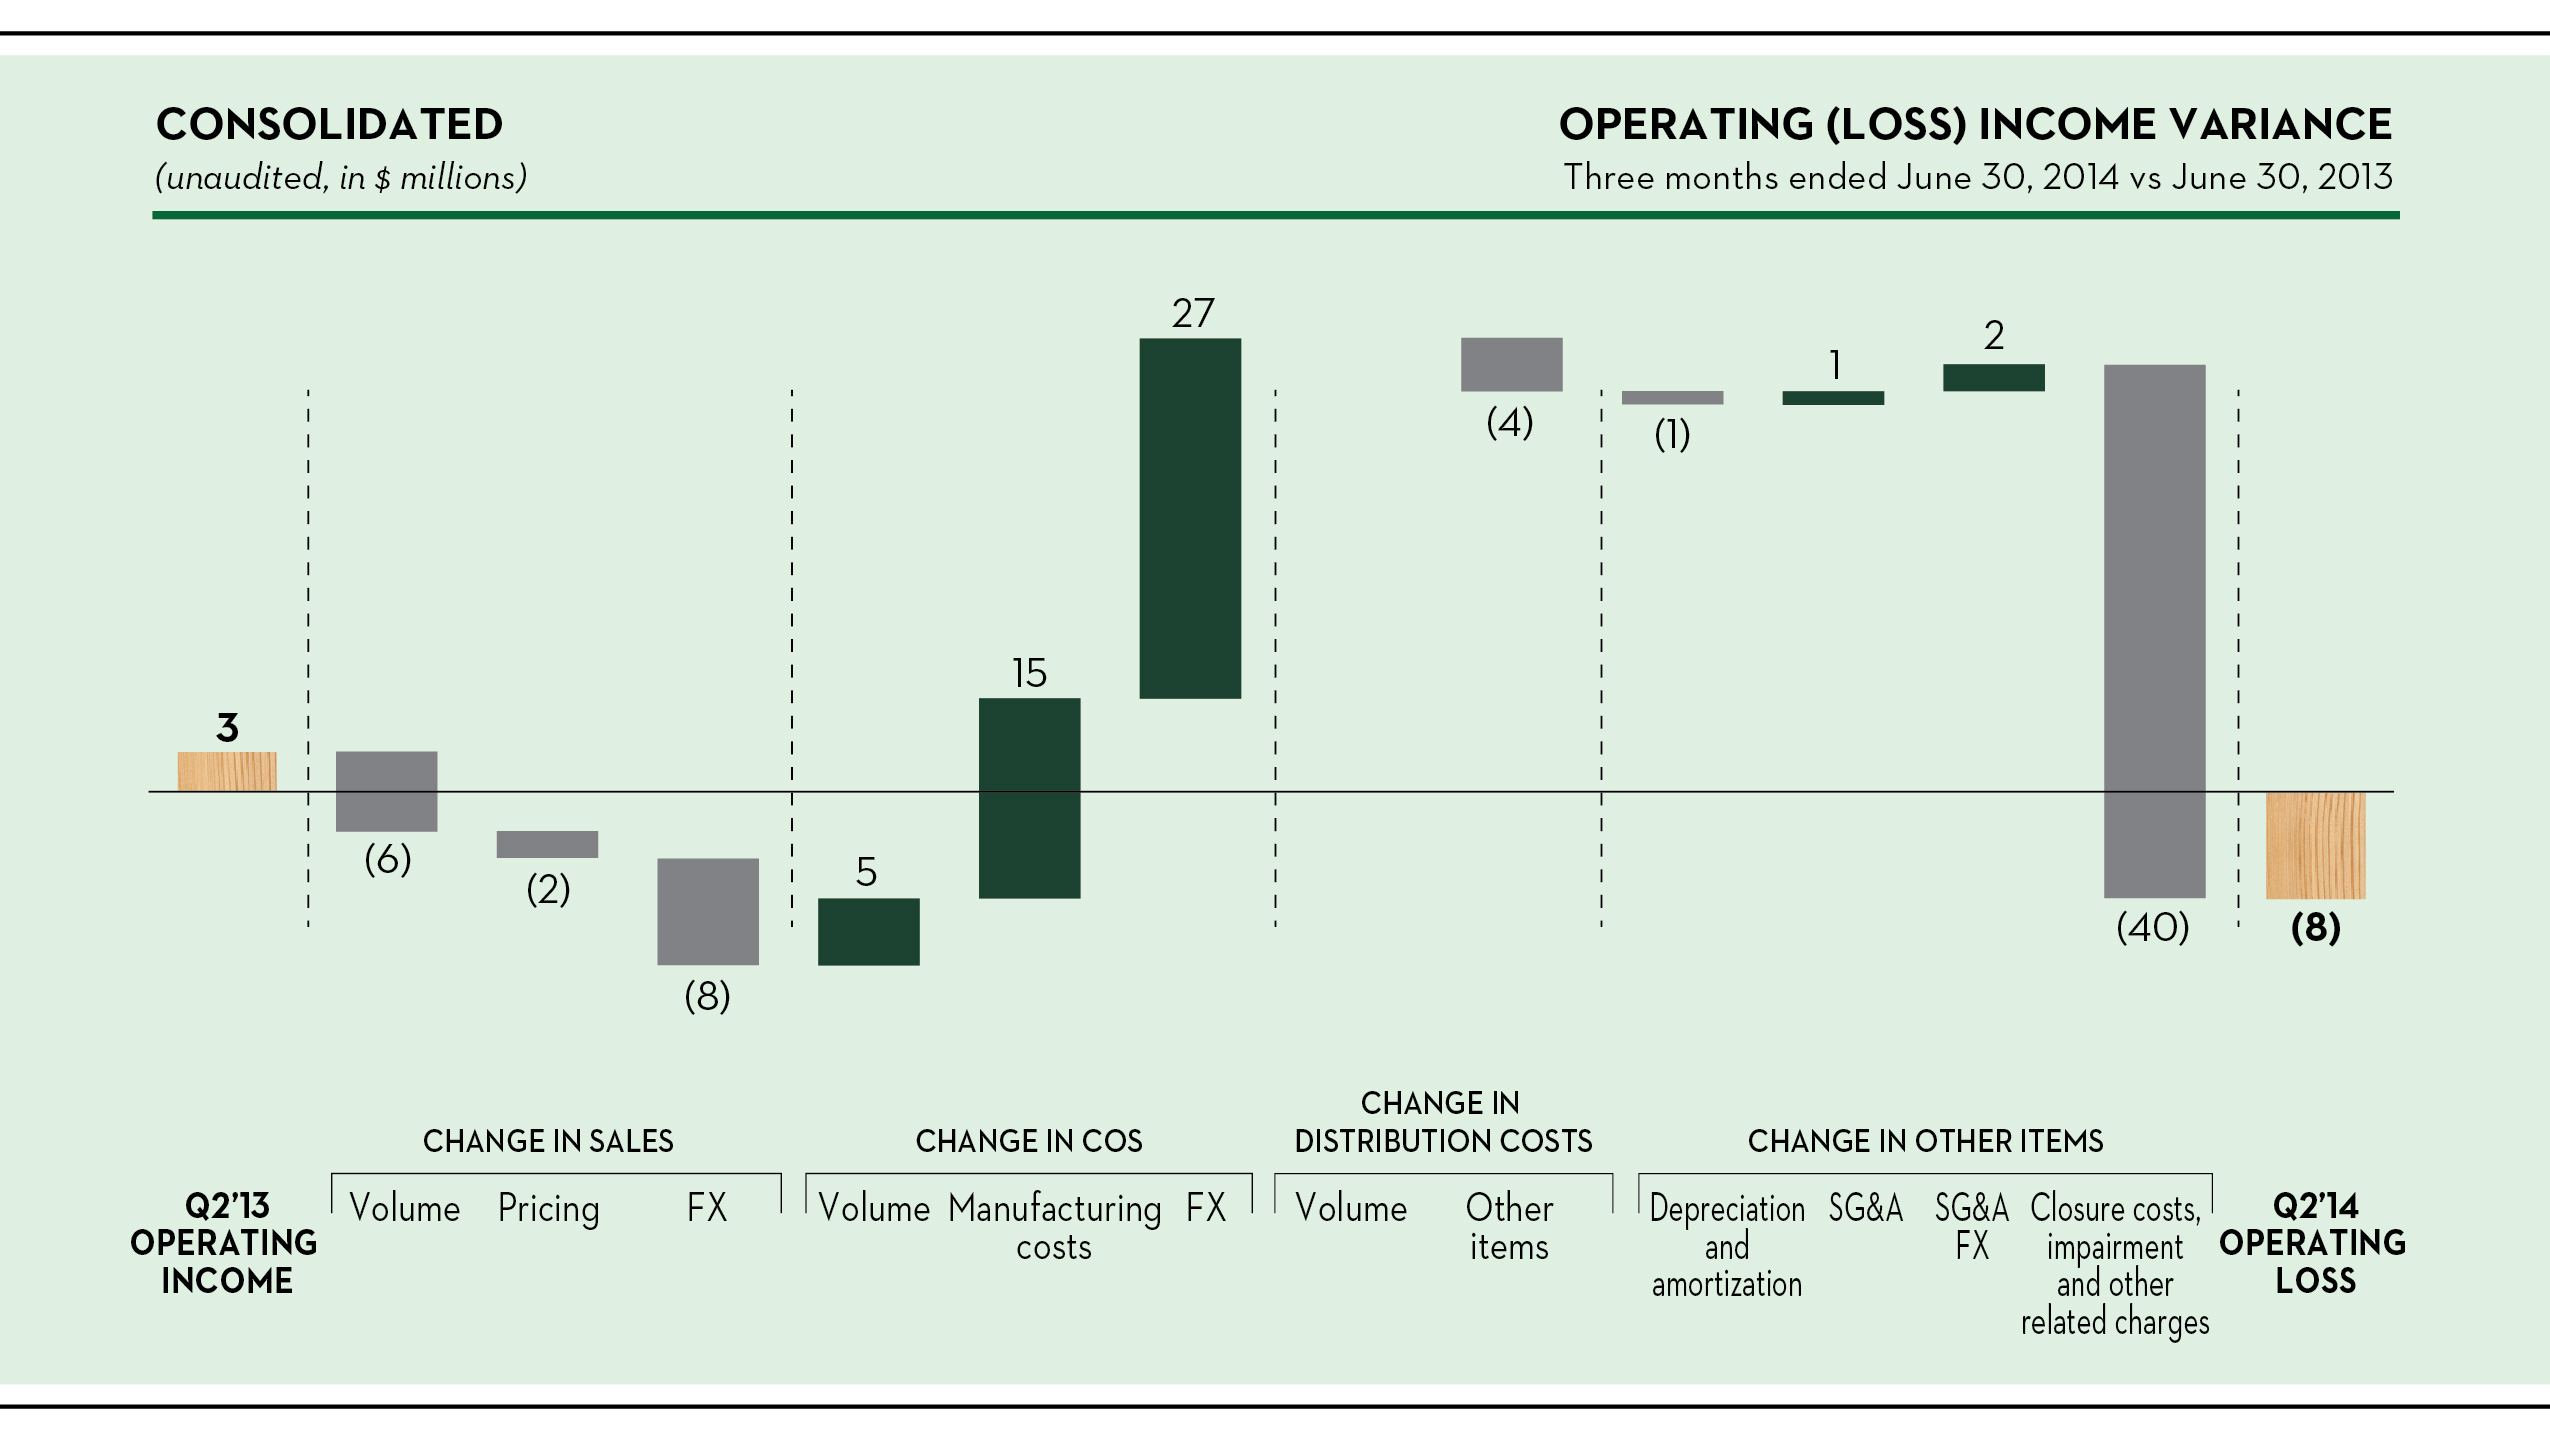
Sales
Our sales were $16 million, or 1%, lower than the year-ago period, at $1,091 million, mostly as a result of the unfavorable impact of the weaker Canadian dollar on sales denominated in that currency and a net decline in volume. That change in volume reflects a significant increase in wood products shipments, up by 22%, and a 3% increase in newsprint shipments, more than offset by a 15% drop in market pulp shipments and 2% in specialty papers. Overall pricing was slightly lower, as the $56 per metric ton increase in market pulp average transaction price was more than offset by declines in each of the other segments.
30
Cost of sales, excluding depreciation, amortization and distribution costs
Cost of sales, excluding depreciation, amortization and distribution costs, which we refer to as “COS”, improved by $47 million in the quarter, reflecting the weaker Canadian dollar - as a significant portion of our production capacity is based in Canada - and an improvement to manufacturing costs. Overall manufacturing costs improved as a result of:
• | lower start-up costs, the most significant of which were costs incurred in the second quarter of 2013 in connection with the restart of the Gatineau, Québec, mill ($13 million); |
• | lower pension and other postretirement benefit, or “OPEB”, expenses because of the lower unfunded pension liability and an amendment to one of our U.S. OPEB plans ($11 million); and |
• | better overall generation rates from the now fully operational cogeneration assets, which we use to make external sales of power, and the benefits of recent asset optimization initiatives ($5 million); |
offset in part by an increase in overall fiber costs and in maintenance and repair costs ($13 million).
Distribution costs
Distribution costs were higher, mostly in the specialty papers segment, as a result of increased freight and warehousing costs, some of which were carried over from the weather-affected first quarter, but also because of higher inventory levels.
Closure costs, impairment and other related charges
See the corresponding variance analysis under “- Segment Earnings - Corporate and Other” below.
Net loss variance analysis
Interest expense
Interest expense decreased by $2 million, to $11 million, reflecting the refinancing, in the second quarter of 2013, of the 10.25% senior secured notes due 2018 with our 5.875% senior unsecured notes due 2023.
Other income (expense), net
We recorded other income, net, of $20 million, mostly a gain on non-cash translation of Canadian dollar net monetary assets ($17 million). This compares to a $65 million expense in the same period in 2013, reflecting a loss on the non-cash translation of Canadian dollar net monetary assets ($7 million) and the tender premium paid to holders of 2018 notes, recorded as a loss on extinguishment of debt, net of the write-down of the associated unamortized premium ($59 million).
Income taxes
We recorded a $1 million income tax provision, on income before income taxes of $1 million, compared to an expected income tax benefit of nil based on the U.S. federal statutory income tax rate of 35%. This reflects the unfavorable effect of a net increase in valuation allowances, primarily related to our U.S. operations, where we no longer recognize deferred income tax assets, offset by state and foreign tax rate differences and foreign exchange related items.
We recorded a $31 million income tax benefit in the second quarter of 2013, on a loss before income taxes of $75 million, compared to an expected income tax benefit of $26 million. The difference reflects the impact of differences in state and foreign tax rates.
31
Six months ended June 30, 2014 vs. June 30, 2013
Operating loss variance analysis
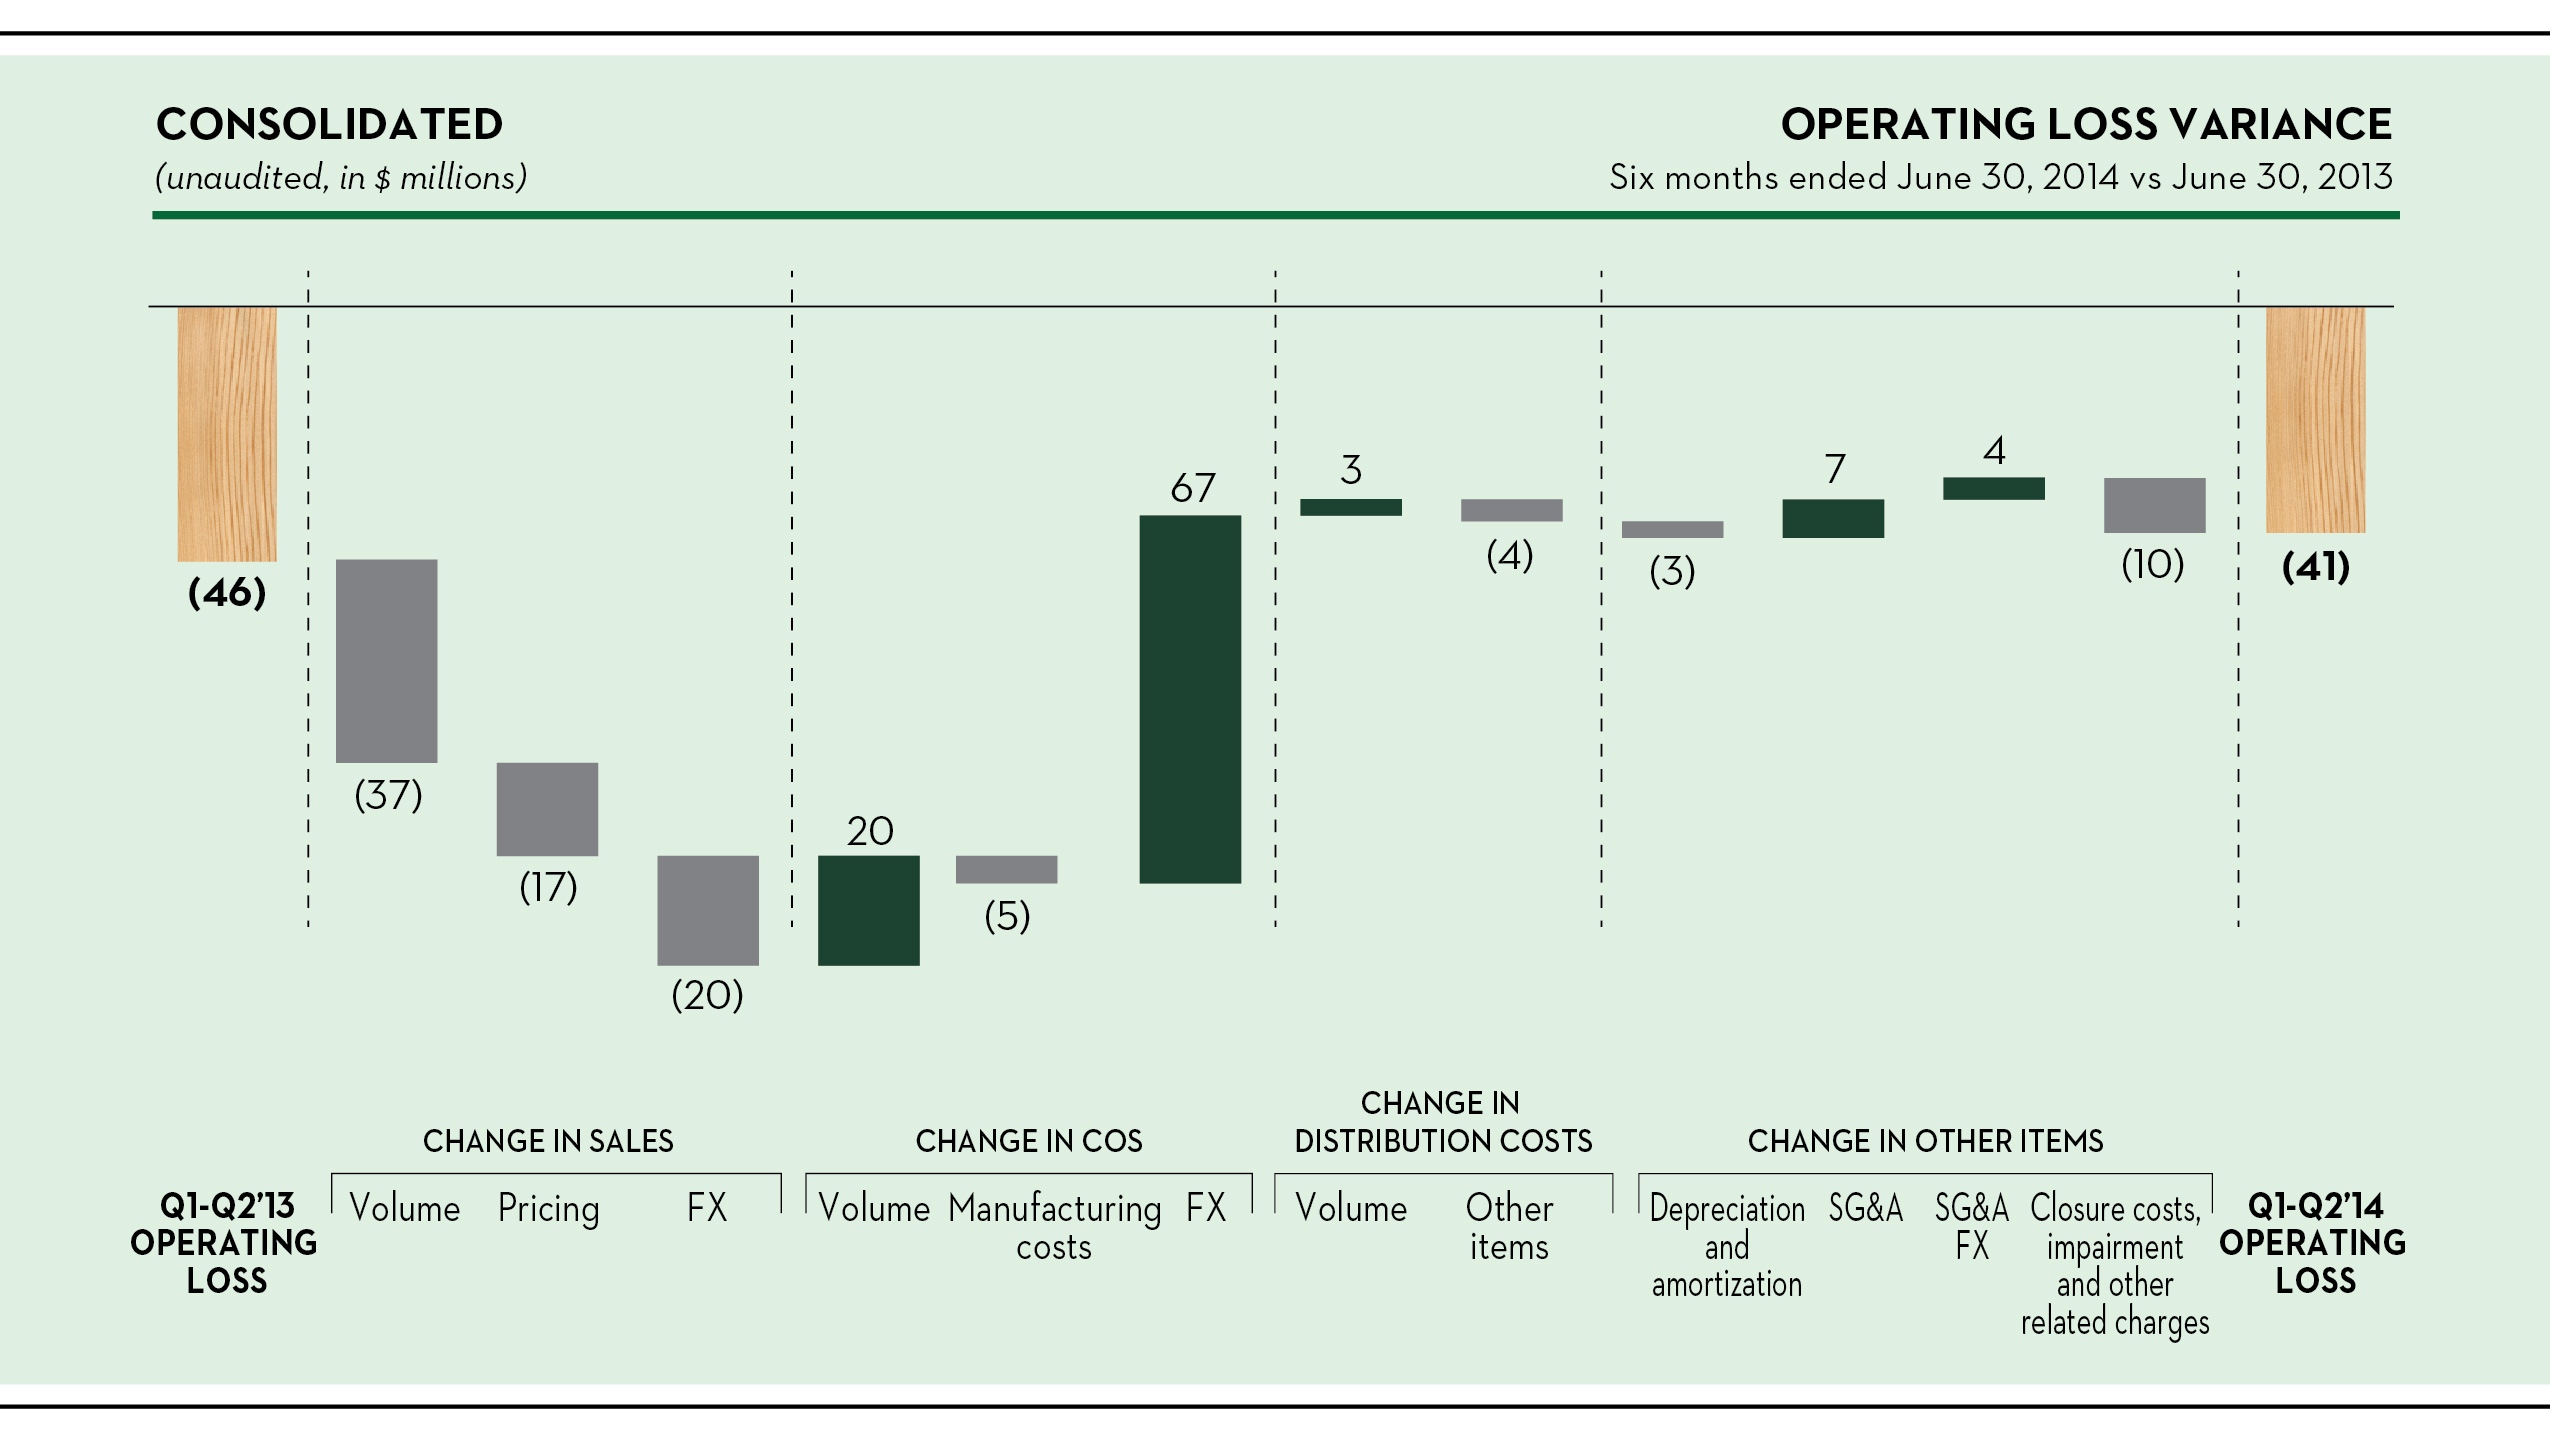
Sales
Sales were $74 million, or 3%, lower than in the year-ago period, at $2,107 million, including a $20 million unfavorable impact of the weaker Canadian dollar on sales denominated in that currency. Volume was higher in the newsprint and wood products segments, 3% and 13%, respectively, despite the first quarter effects of: the abnormal weather and operational disruptions in the newsprint segment; and of distribution constraints for lack of carrier availability in the wood products segment. But shipment volume fell 4% and 13% in specialty papers and market pulp, respectively, due largely to the first quarter effects of the abnormal weather and operational disruptions, and also greater internal consumption of hardwood kraft pulp and a conservative approach to pulp markets in the face of slowing demand in North America, particularly for softwood and recycled grades. Overall pricing was lower, as the $55 per metric ton increase in average transaction price in the market pulp segment was more than offset by drops in each of the other segments.
Cost of sales, excluding depreciation, amortization and distribution costs
COS improved by $82 million in the period. Excluding the favorable effects of the weaker Canadian dollar and the lower overall volume, manufacturing costs rose by $5 million, largely because of the effects of the first quarter, including the abnormally cold winter ($40 million) and operational disruptions ($7 million), but also because of higher stumpage fees and other costs associated with the comprehensive modification of the forest tenure system in the province of Québec ($12 million) and higher maintenance costs ($7 million). These items were only partially offset by:
• | lower start-up costs ($27 million), the most significant of which were costs incurred in 2013 in connection with the restart of the Gatineau mill; |
• | lower pension and OPEB expenses ($18 million); and |
• | the full period operation of the Thunder Bay, Ontario, cogeneration assets, and the absence of associated commissioning costs ($12 million). |
Distribution costs
After removing the effect of the lower volume, distribution costs rose in the period, mostly in the specialty papers segment, as a result of weather-related increases in transport and warehousing costs but also because of higher inventory levels.
32
Selling, general and administrative expenses
Selling, general and administrative expenses, or “SG&A”, were $11 million lower in the period, primarily because of the reduction of project costs and the weaker Canadian dollar.
Closure costs, impairment and other related charges
See the corresponding variance analysis under “- Segment Earnings - Corporate and Other” below.
Net loss variance analysis
Interest expense
Interest expense decreased by $4 million, to $23 million, reflecting the refinancing, in the second quarter of 2013, of the 10.25% senior secured notes due 2018 with our 5.875% senior unsecured notes due 2023.
Other income (expense), net
We recorded other income, net, of $7 million in 2014, the most significant portion of which was a gain on non-cash translation of Canadian dollar net monetary assets ($3 million).
The $47 million we recorded as other expense, net, in the same period of 2013 was the product of:
• | the tender premium paid to holders of 2018 notes in the refinancing, net of the write-down of the associated unamortized premium ($59 million); |
• | a loss on non-cash translation of Canadian dollar net monetary assets ($12 million); |
offset in part by:
• | the forgiveness of a note payable in connection with our acquisition of a former joint venture partner’s interest in Calhoun Newsprint Company (“CNC”) ($12 million); and |
• | a distribution from the liquidation of a former U.K. subsidiary ($9 million). |
Income taxes
We recorded an income tax benefit of $7 million on a loss before income taxes of $57 million, compared to an expected income tax benefit of $20 million based on the U.S. federal statutory income tax rate of 35%. This reflects the unfavorable effect of a net increase in valuation allowances, primarily related to our U.S. operations, where we no longer recognize deferred income tax assets, offset in part by state and foreign tax rate differences.
We recorded a $71 million income tax benefit in the first six months of 2013, on a loss before income taxes of $120 million, compared to an expected income tax benefit of $42 million based on the U.S. federal statutory income tax rate of 35%. The difference reflects the favorable effect of a $33 million reversal of valuation allowance, primarily related to available U.S. capital losses that are now expected to be used as a result of the 2013 acquisition of the noncontrolling interest in CNC, partly offset by the unfavorable effects related to various non-deductible items and other tax adjustments.
Segment Earnings
We manage our business based on the products we manufacture. Our reportable segments correspond to our principal product lines: newsprint, specialty papers, market pulp and wood products.
We do not allocate any of the income or loss items following “operating (loss) income” in our consolidated statements of operations to our segments because those items are reviewed separately by management. Similarly, we do not allocate to the segments: closure costs, impairment and other related charges; inventory write-downs related to closures; start-up costs; net gain on disposition of assets; transaction costs; as well as other discretionary charges or credits.
We allocate depreciation and amortization, and SG&A to the segments, with the exception of severance costs and certain other discretionary charges and credits, which we present under “corporate and other.”
33
NEWSPRINT
Highlights
Three Months Ended June 30, | Six Months Ended June 30, | ||||||||||||||||
(unaudited, in millions, except where otherwise stated) | 2014 | 2013 | 2014 | 2013 | |||||||||||||
Sales | $ | 364 | $ | 364 | $ | 710 | $ | 720 | |||||||||
Operating income (1) | 18 | 10 | 3 | 8 | |||||||||||||
EBITDA (2) | 35 | 28 | 38 | 44 | |||||||||||||
(in thousands of metric tons) | |||||||||||||||||
Shipments | 611 | 596 | 1,190 | 1,159 | |||||||||||||
Downtime | 38 | 22 | 68 | 77 | |||||||||||||
Inventory at end of period | 142 | 107 | 142 | 107 | |||||||||||||
(1) | Net income including noncontrolling interests is equal to operating income in this segment. |
(2) | EBITDA, a non-GAAP financial measure, is reconciled below. For more information on the calculation and reason we include this measure, see note 1 under “Results of Operations – Consolidated Results – Selected Financial Information” above. |
Three Months Ended June 30, | Six Months Ended June 30, | ||||||||||||||||
(unaudited, in millions) | 2014 | 2013 | 2014 | 2013 | |||||||||||||
Net income including noncontrolling interests | $ | 18 | $ | 10 | $ | 3 | $ | 8 | |||||||||
Depreciation and amortization | 17 | 18 | 35 | 36 | |||||||||||||
EBITDA | 35 | 28 | 38 | 44 | |||||||||||||
Industry trends
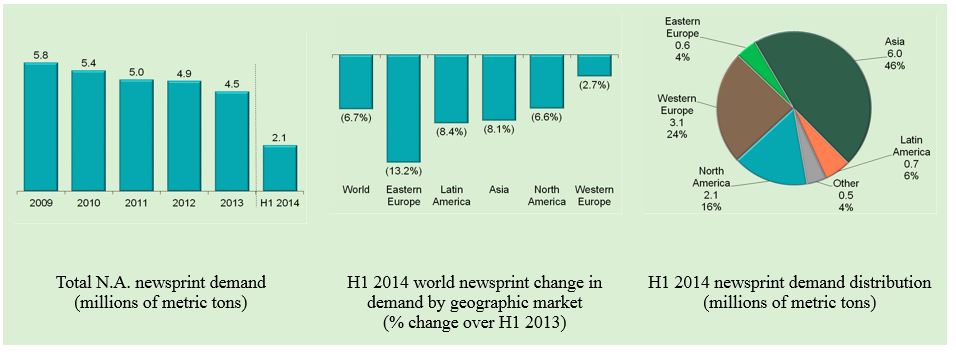
Source: Pulp & Paper Products Council (or “PPPC”)
Total North American newsprint demand was 7% lower through June. Though demand from newspaper publishers was down by 9%, demand continues to grow from other users, up 3%. Global demand was also down, by 7% through June, including an 8% decline in Asia, led by a significant drop in China, and an 8% decline in Latin America. Western Europe was down by 3%.
The North American industry’s shipment-to-capacity ratio was 92% for the first six months of the year, unchanged from the year-ago period. Western European capacity was at about 91%.
34
Three months ended June 30, 2014 vs. June 30, 2013
Operating income variance analysis
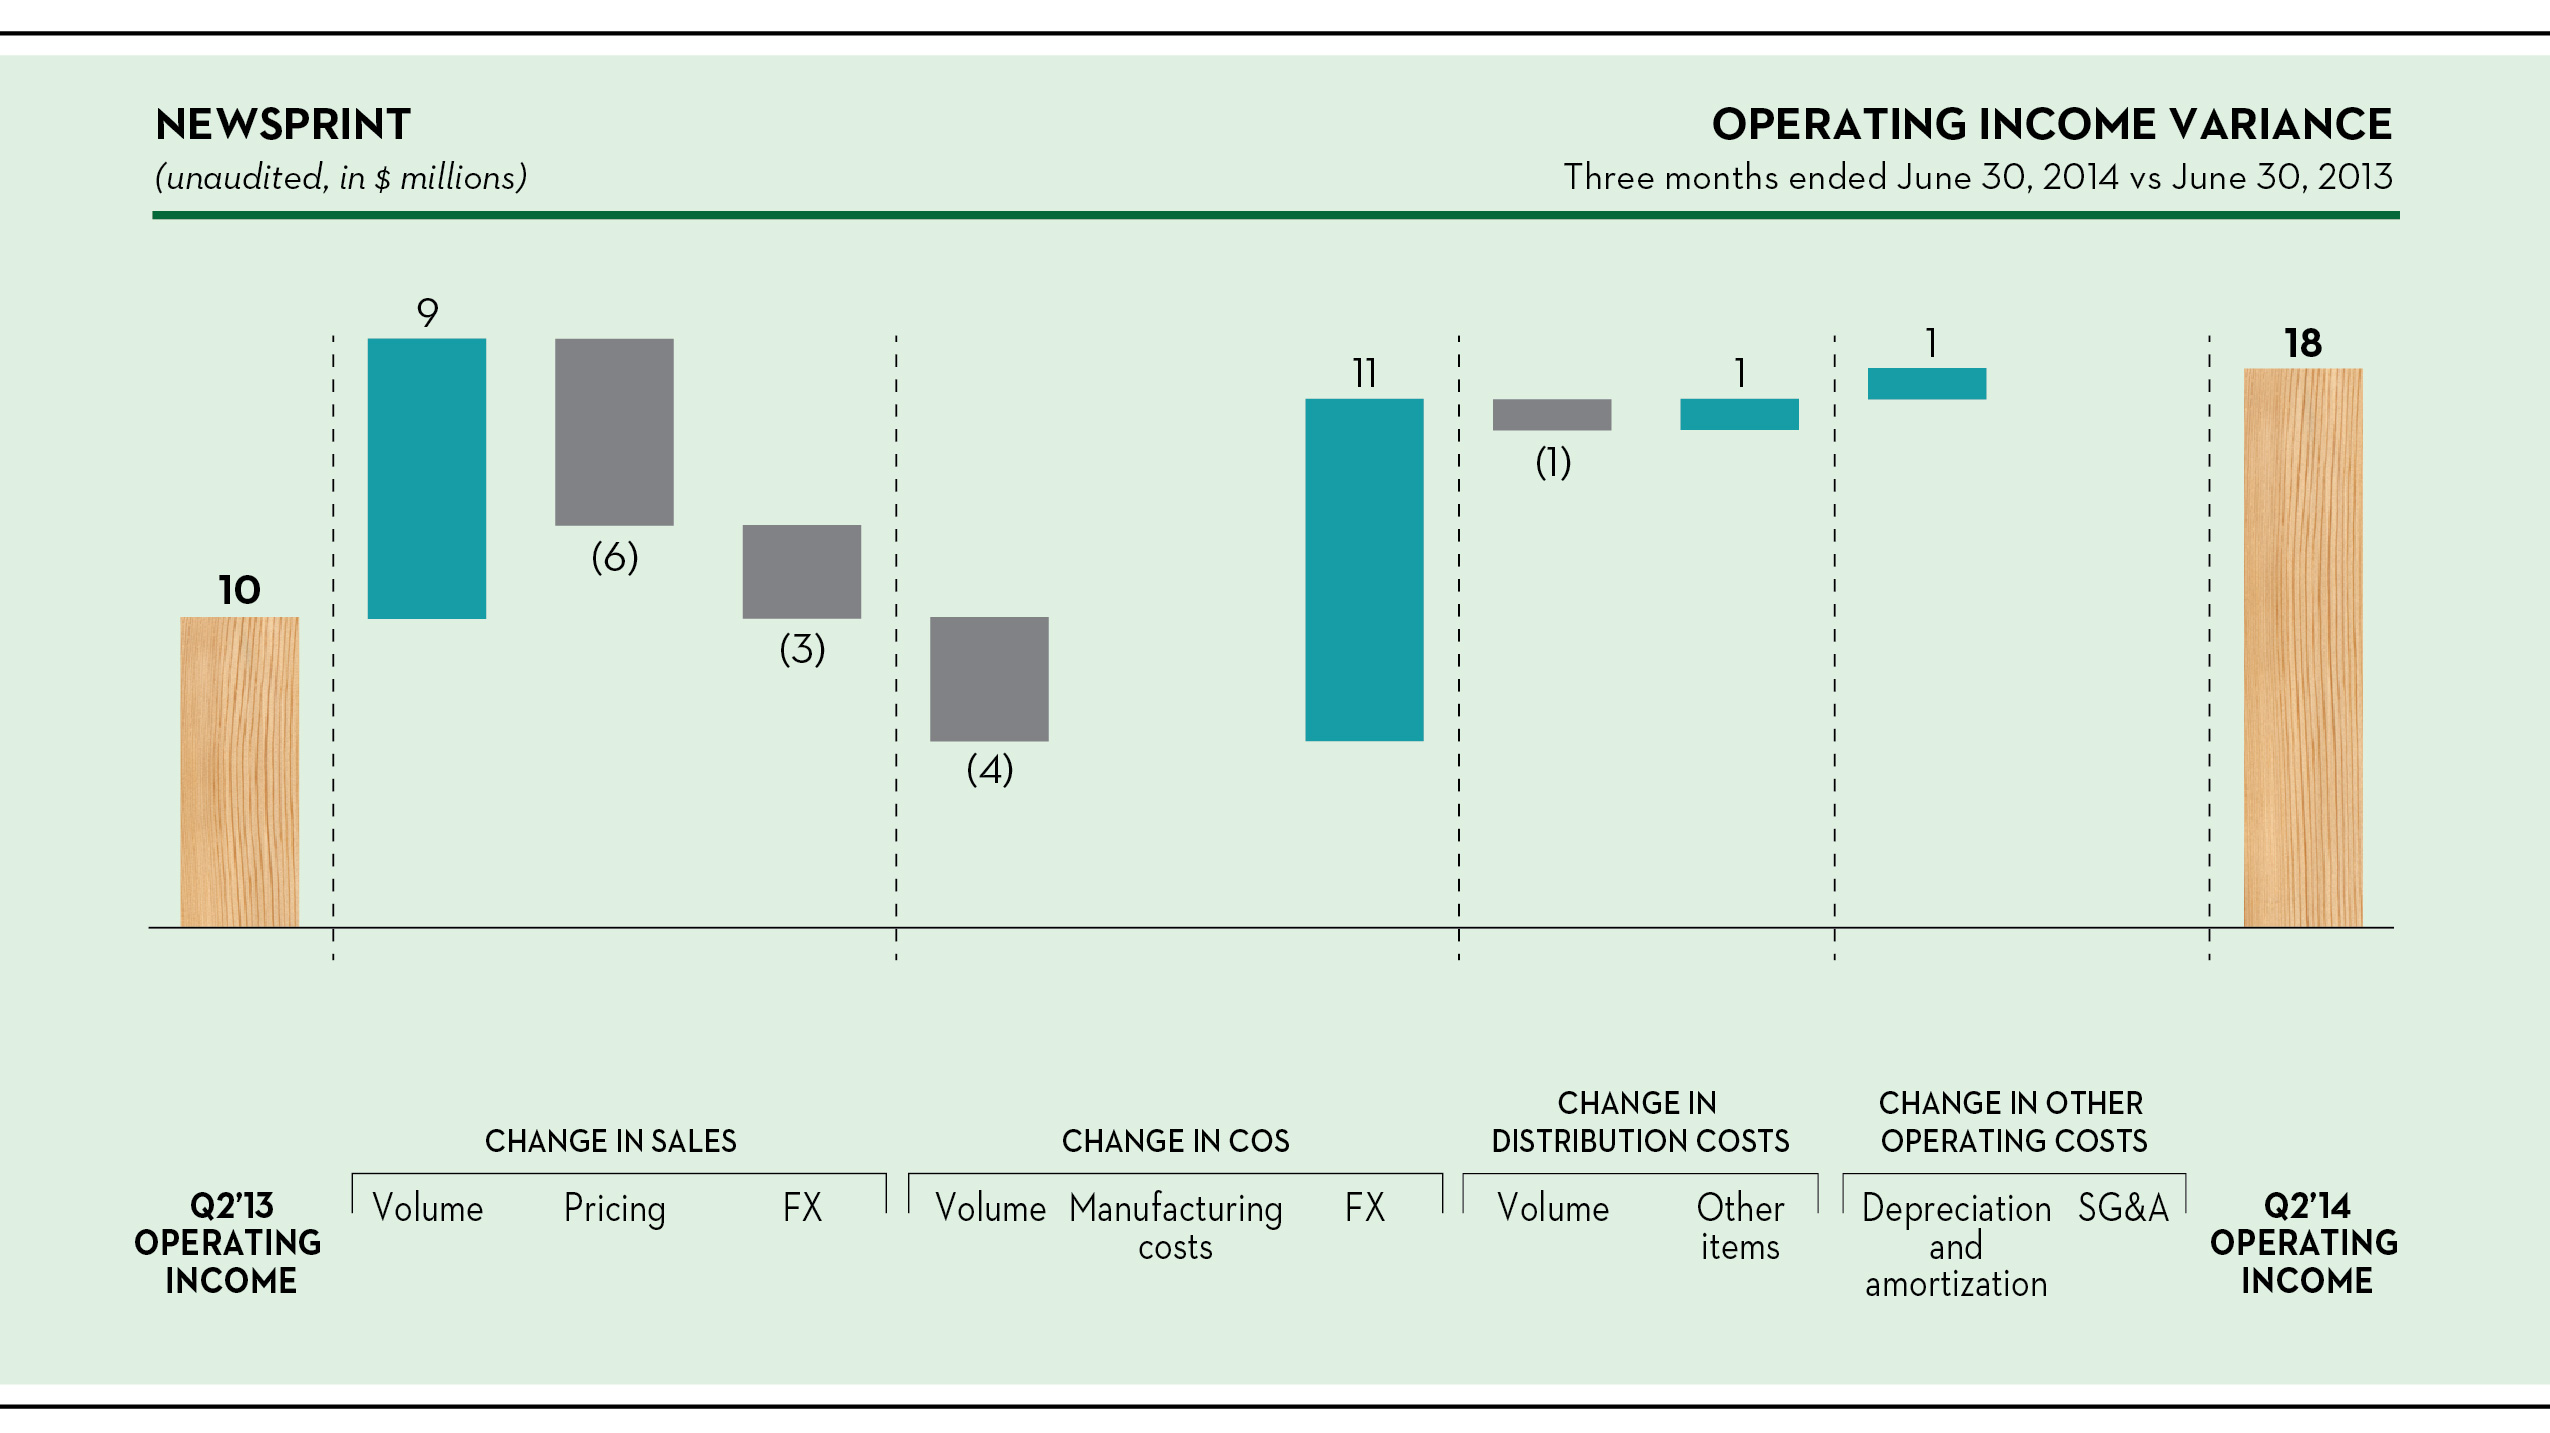
Sales
Sales of $364 million were unchanged, as the 15,000 metric tons increase in shipments, or 3%, was offset by the $15 per metric ton lower average transaction price, which includes the unfavorable effect of the weaker Canadian dollar on sales denominated in that currency. The increase in shipments reflects an improvement in our operating rate and higher shipments within North America to meet customer demand.
Our export volume represented 40% of total shipments, compared to 45% in the second quarter of 2013. We accumulated 20,000 metric tons more inventory than we did in the same quarter last year.
We took approximately 16,000 metric tons more downtime than we did in the same quarter of last year, mostly as a result of the fiber availability limitations at certain mills in Québec.
Cost of sales, excluding depreciation, amortization and distribution costs
Segment COS were $7 million lower, reflecting mostly the favorable effect of the weaker Canadian dollar, partially offset by the effect of higher shipments. Overall manufacturing costs were unchanged, but included better overall generation rates from the cogeneration assets ($4 million), lower chip prices ($2 million) and lower pension and OPEB expenses ($2 million), partially offset by an increase in maintenance costs and higher costs for recovered paper at the Mokpo, South Korea, mill.
35
Six months ended June 30, 2014 vs. June 30, 2013
Operating income variance analysis
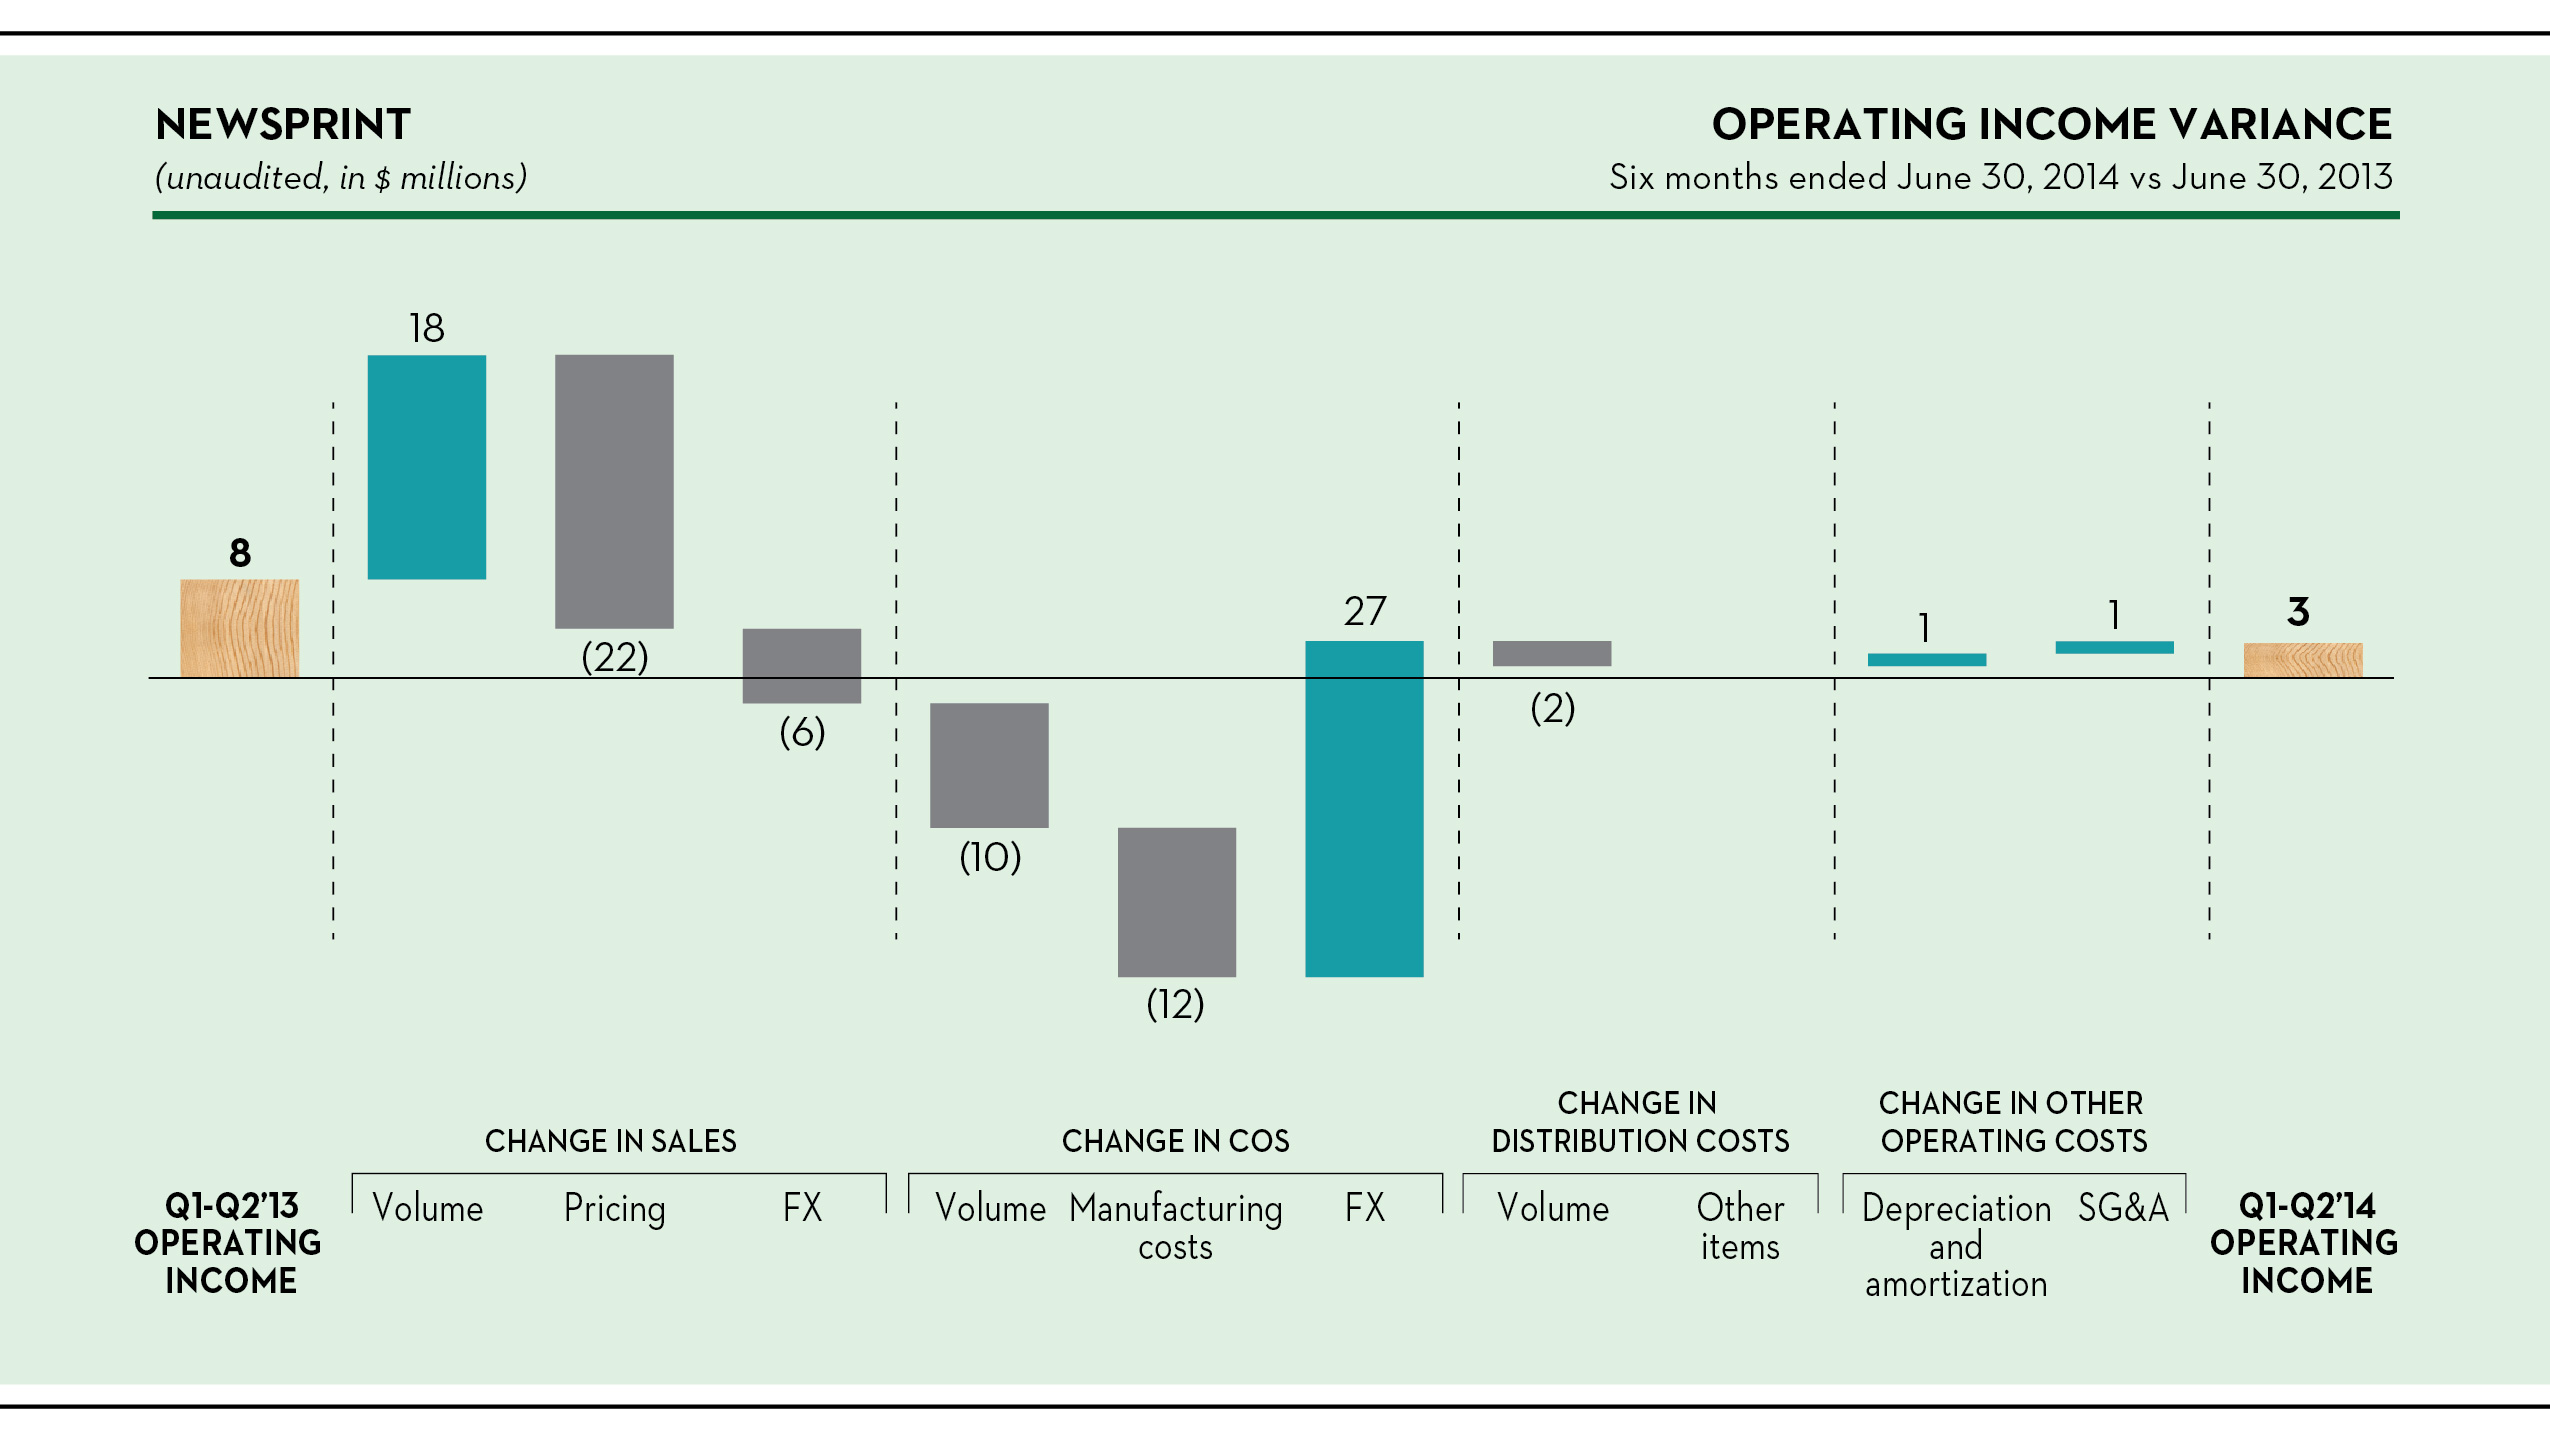
Sales
Sales slipped to $710 million, down $10 million, or 1%, as the $24 per metric ton drop in average transaction price, which includes the unfavorable effect of the weaker Canadian dollar on sales denominated in that currency, more than offset the 31,000 metric ton increase, or 3%, in shipments.
Despite weather-related production disruptions and a mechanical failure at the Augusta, Georgia, mill in the first quarter, the increase in shipments reflects an improvement in our operating rate and higher shipments within North America to meet customer demand. As a result, we have taken less production downtime and we operated intermittently a previously idled machine at the Calhoun, Tennessee, mill. Our export volume represented 41% of total shipments, compared to 45% in the same period of 2013. We did, however, accumulate 26,000 metric tons more inventory in the period than we did in the comparable period last year.
Cost of sales, excluding depreciation, amortization and distribution costs
Segment COS improved by $5 million, including a $27 million benefit from the weaker Canadian dollar. After removing the effect of higher shipment volume, manufacturing costs increased by $12 million in the period, including the unfavorable effect of the abnormally cold winter ($21 million), particularly the cost of electricity at the Ontario mills, and higher maintenance costs ($6 million), only partially offset by:
• | external sales of power from our cogeneration facilities at Thunder Bay ($10 million), which started operations as of the end of the first quarter of 2013; |
• | lower chip prices ($3 million); and |
• | lower pension and OPEB expenses ($2 million). |
36
SPECIALTY PAPERS
Highlights
Three Months Ended June 30, | Six Months Ended June 30, | ||||||||||||||||
(unaudited, in millions, except where otherwise stated) | 2014 | 2013 | 2014 | 2013 | |||||||||||||
Sales | $ | 325 | $ | 338 | $ | 626 | $ | 678 | |||||||||
Operating (loss) income (1) | (3 | ) | 2 | (27 | ) | 10 | |||||||||||
EBITDA (2) | 19 | 21 | 17 | 48 | |||||||||||||
(in thousands of short tons) | |||||||||||||||||
Shipments | 452 | 459 | 872 | 908 | |||||||||||||
Downtime | 13 | 50 | 100 | 95 | |||||||||||||
Inventory at end of period | 114 | 82 | 114 | 82 | |||||||||||||
(1) | Net (loss) income including noncontrolling interests is equal to operating (loss) income in this segment. |
(2) | EBITDA, a non-GAAP financial measure, is reconciled below. For more information on the calculation and reason we include this measure, see note 1 under “Results of Operations – Consolidated Results – Selected Financial Information” above. |
Three Months Ended June 30, | Six Months Ended June 30, | ||||||||||||||||
(unaudited, in millions) | 2014 | 2013 | 2014 | 2013 | |||||||||||||
Net (loss) income including noncontrolling interests | $ | (3 | ) | $ | 2 | $ | (27 | ) | $ | 10 | |||||||
Depreciation and amortization | 22 | 19 | 44 | 38 | |||||||||||||
EBITDA | 19 | 21 | 17 | 48 | |||||||||||||
Industry trends
Source: PPPC
North American demand for uncoated mechanical papers was unchanged through the first 6 months of the year, including a 3% increase in demand for supercalender grades, which represent approximately 25% of our specialty papers shipments, and no change in demand for standard grades. This, however, reflects a 5% increase in super-bright and high-bright grade shipments, offset by an increase in exports. There was a 20% drop in demand for lightweight grades, in which we have only a small presence. The industry shipment-to-capacity ratio was 91%, down 1% from the first half of 2013.
37
Source: PPPC
Demand for coated mechanical papers, however, was down by 7% through June, and the industry shipment-to-capacity ratio was at 88%, unchanged from the first quarter, but down by 4% from the same period last year.
Three months ended June 30, 2014 vs. June 30, 2013
Operating (loss) income variance analysis
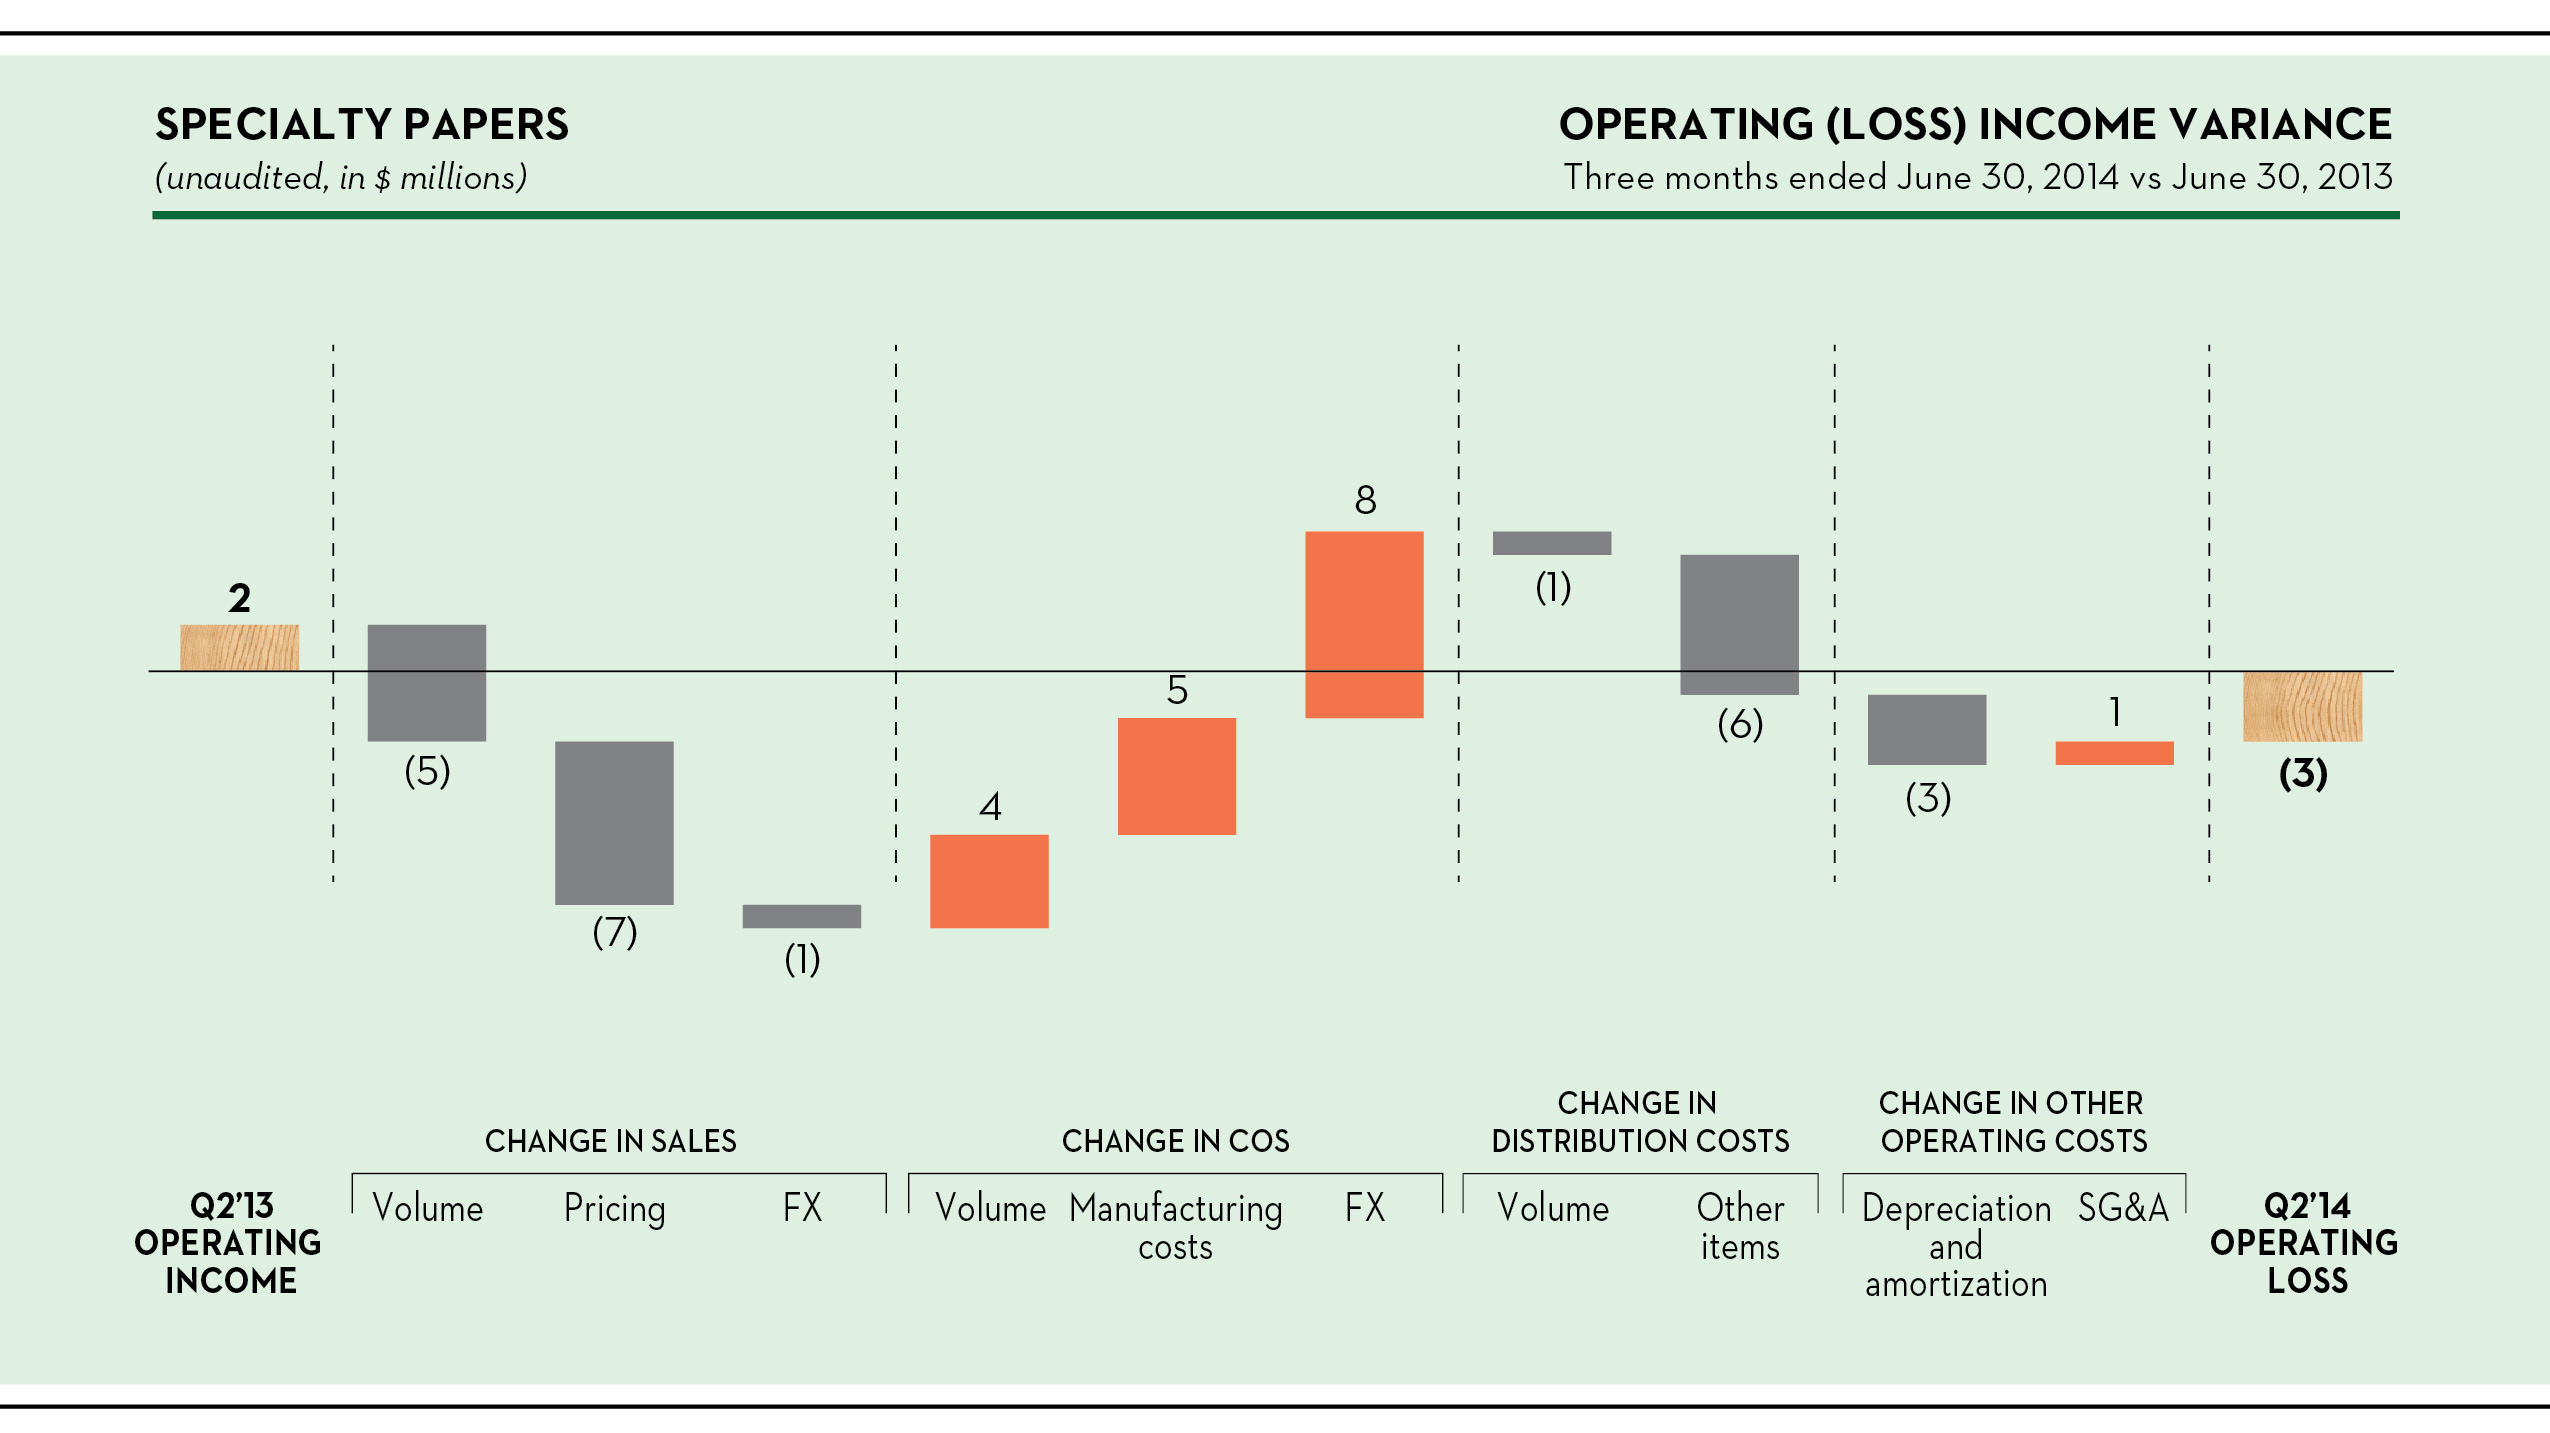
Sales
Specialty papers sales decreased by $13 million, or 4%, to $325 million, due to lower pricing and volume. Shipments were 7,000 short tons lower (6,400 metric tons) and the average transaction price was $18 per short ton lower, in both cases mostly reflecting lower demand and operating rates in coated mechanical grades.
We accumulated 15,000 short tons (13,600 metric tons) of finished goods inventory in the quarter, compared to a decrease of 11,000 short tons (10,000 metric tons) in the same period last year. Downtime in the second quarter of 2013 included 36,500 short tons (33,100 metric tons) of downtime on the idled machine at the Catawba, South Carolina, mill, which we permanently closed in the second quarter of 2014. The machine had been indeterminately idled since June of 2012. We cease to count downtime on a machine as of the quarter in which it is permanently closed.
38
Cost of sales, excluding depreciation, amortization and distribution costs
Segment COS decreased by $17 million, including the favorable effects of the weaker Canadian dollar and lower volume. Manufacturing costs fell by $5 million, which includes lower pension and OPEB expenses ($5 million), and asset optimization initiatives ($3 million), offset in part by higher maintenance costs ($3 million).
Distribution costs
Distribution costs rose in the period as a result of increased freight and warehousing costs, some of which were carried over from the weather-affected first quarter, but also because of higher inventory levels.
Six months ended June 30, 2014 vs. June 30, 2013
Operating (loss) income variance analysis
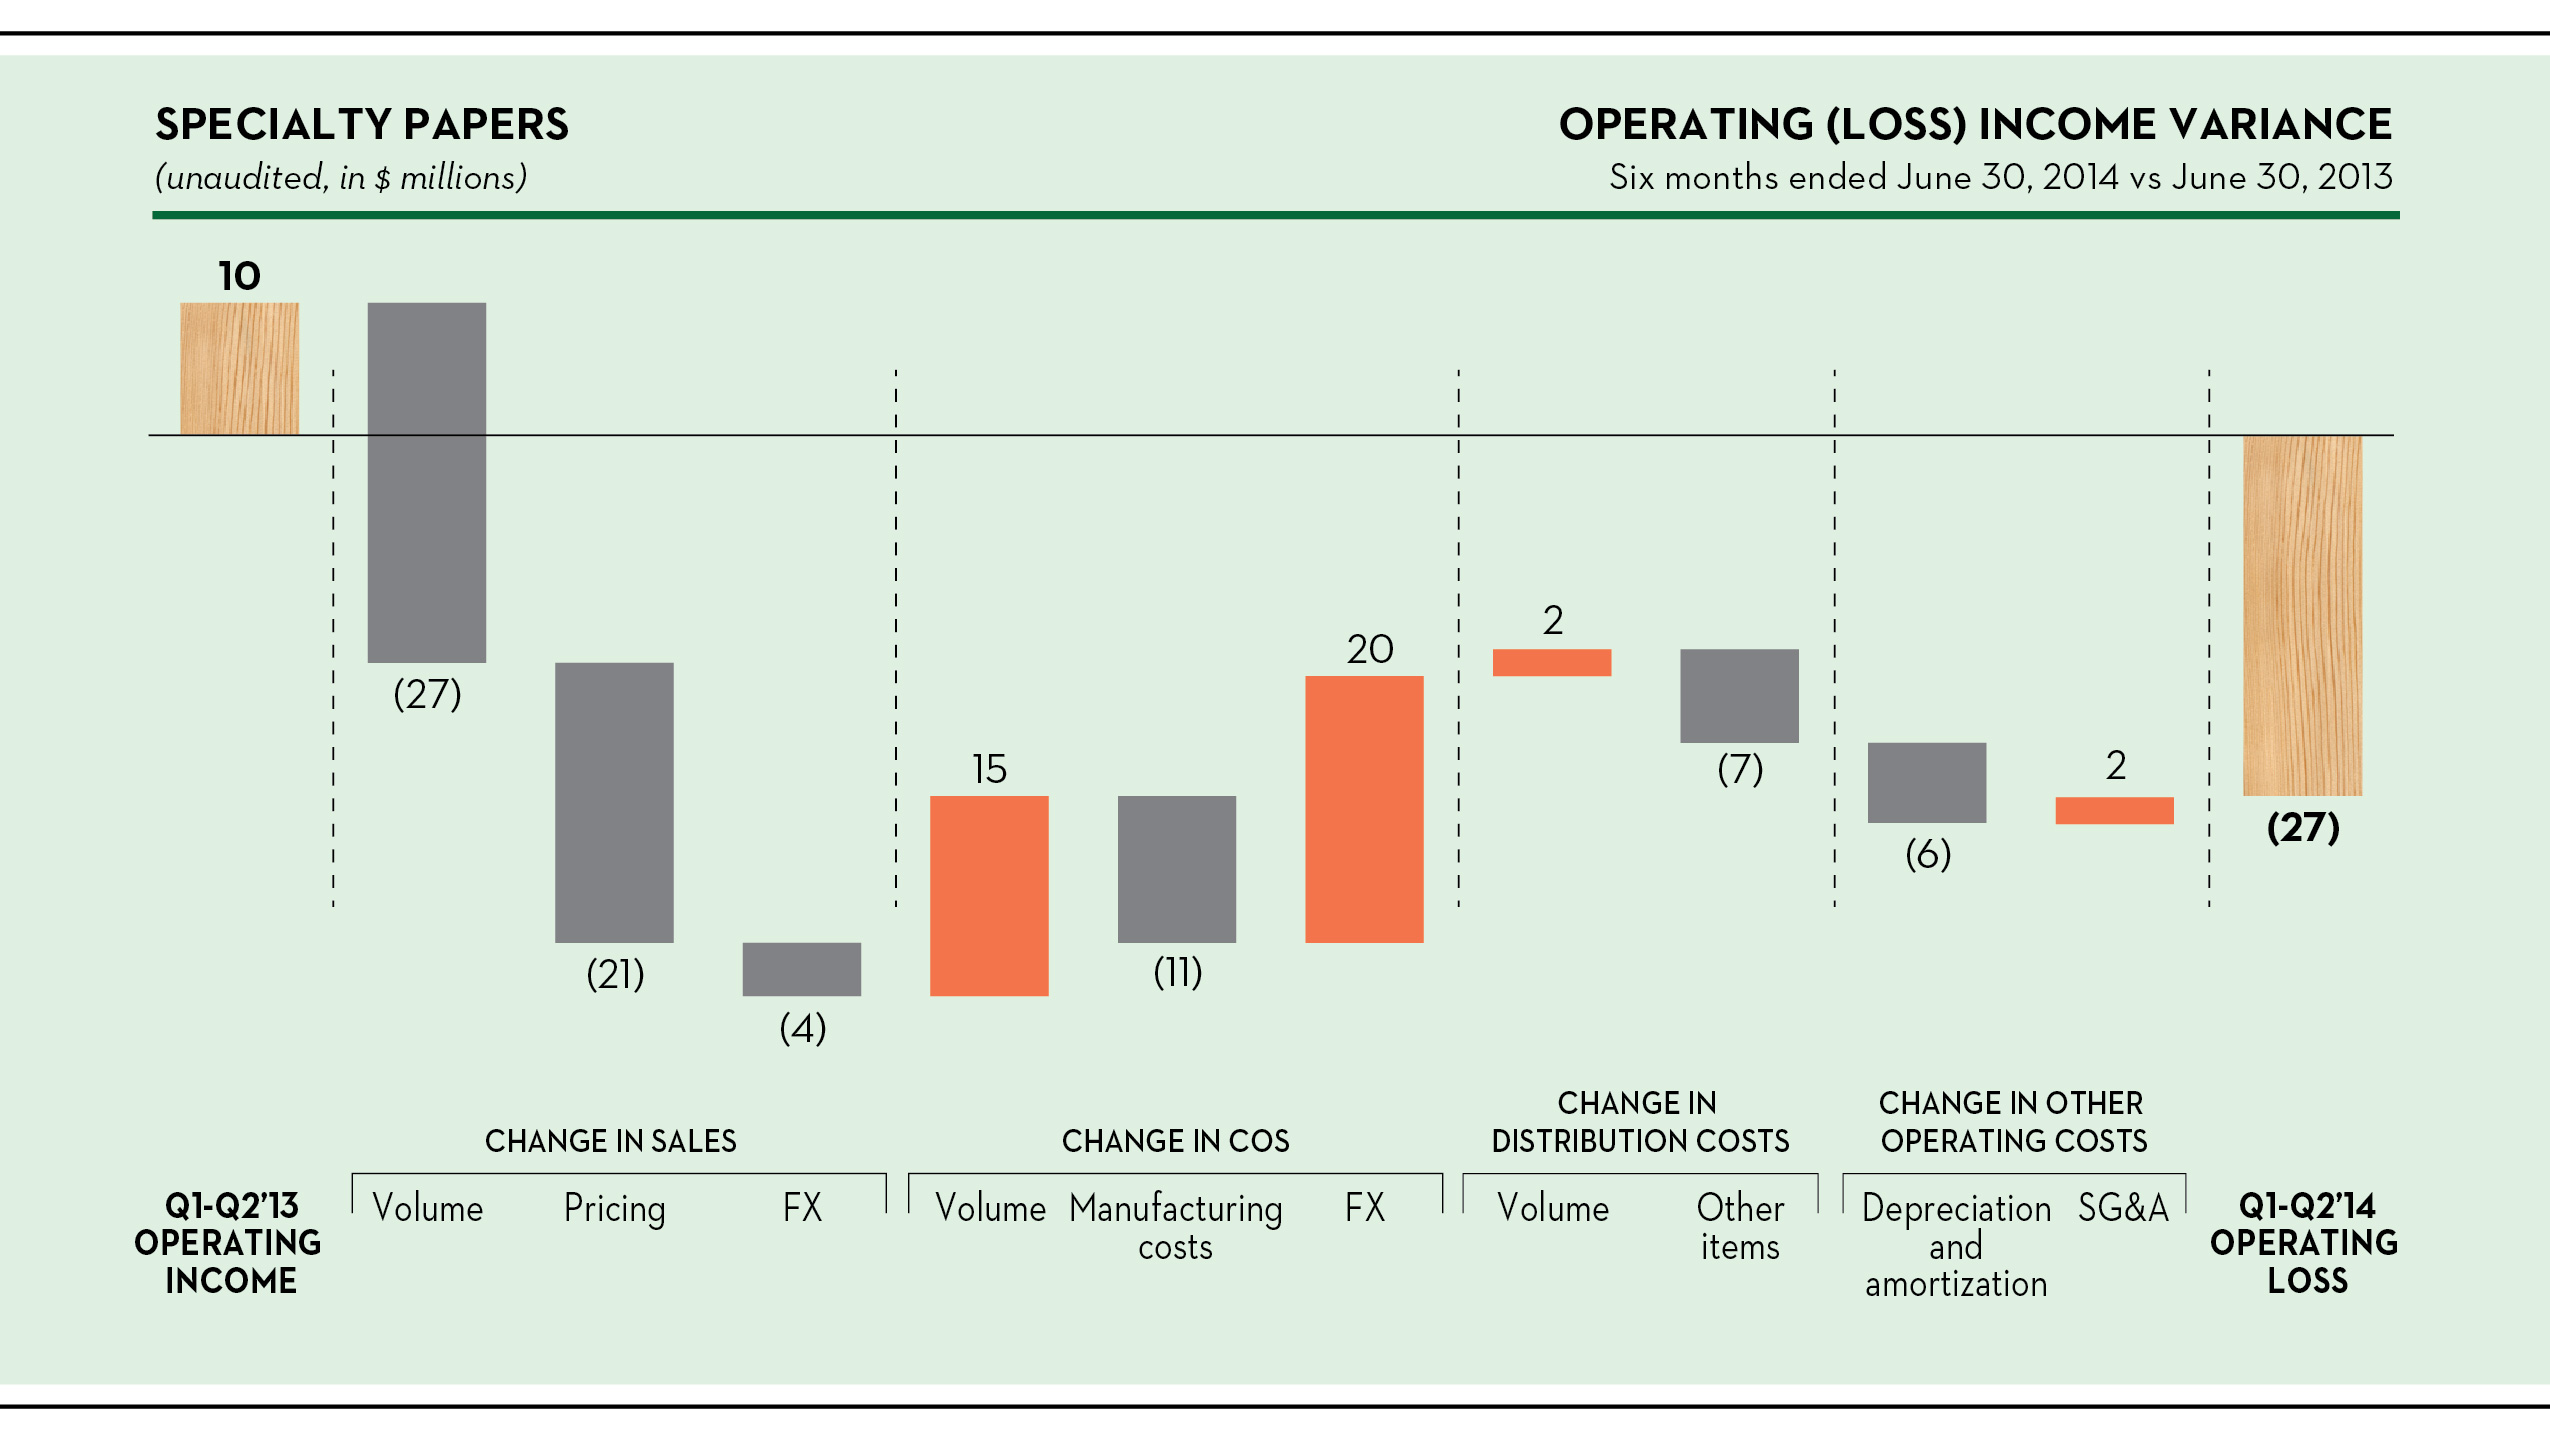
Sales
Specialty papers sales were down by $52 million, or 8%, to $626 million, as a result of a 36,000 short ton reduction in volume (32,700 metric tons) and a $30 per short ton decrease in the average transaction price, which includes the effect of the weaker Canadian dollar on sales denominated in that currency.
The lower volume stems mostly from issues in the first quarter, including weather-related production disruptions and mechanical failures in Catawba. The drop in average transaction price was most significant in coated mechanical papers, down by $61 per short ton, which has been under sustained pressure because of lower demand and operating rates in the last nine months. We accumulated 18,000 short tons (16,300 metric tons) more inventory during this six-month period, mostly in the second quarter of this year.
We recorded 56,000 short tons (50,800 metric tons) of downtime associated with the idled Catawba and Fort Frances, Ontario, machines in the first quarter, and none in the second quarter because of the closure announcements, compared to 73,000 short tons (66,200 metric tons) associated with the idled Catawba machine in the first six months of 2013. Most of the remaining increase in downtime represents additional maintenance downtime.
39
Cost of sales, excluding depreciation, amortization and distribution costs
COS improved by $24 million in the period. After removing the favorable effects of the weaker Canadian dollar and lower volume, manufacturing costs were $11 million higher, which reflects:
• | the abnormally cold winter ($11 million), including a significant increase in steam costs, particularly at our U.S. southeast mills; |
• | additional costs associated with the mechanical failures at Catawba in the first quarter ($3 million); and |
• | higher overall maintenance costs ($4 million); |
offset only in part by:
• | the lower pension and OPEB expenses ($9 million); and |
• | asset optimization initiatives ($2 million). |
Distribution costs
Distribution costs were higher as a result of weather-related increases in freight and warehousing costs, but also because of higher inventory levels.
Depreciation and amortization
The increase in depreciation and amortization reflects a change to the estimated useful life of a hydroelectric asset following an agreement we reached with the province of Québec on February 28, 2014, to renew the water rights associated with the Jim-Gray dam for a period of 10 years as of January 1, 2012, which are further renewable under certain conditions.
MARKET PULP
Highlights
Three Months Ended June 30, | Six Months Ended June 30, | ||||||||||||||||
(unaudited, in millions, except where otherwise stated) | 2014 | 2013 | 2014 | 2013 | |||||||||||||
Sales | $ | 241 | $ | 263 | $ | 475 | $ | 503 | |||||||||
Operating income (1) | 24 | 10 | 32 | 5 | |||||||||||||
EBITDA (2) | 37 | 23 | 58 | 31 | |||||||||||||
(in thousands of metric tons) | |||||||||||||||||
Shipments | 334 | 393 | 669 | 767 | |||||||||||||
Downtime | 22 | 11 | 36 | 30 | |||||||||||||
Inventory at end of period | 115 | 98 | 115 | 98 | |||||||||||||
(1) | Net income including noncontrolling interests is equal to operating income in this segment. |
(2) | EBITDA, a non-GAAP financial measure, is reconciled below. For more information on the calculation and reason we include this measure, see note 1 under “Results of Operations – Consolidated Results – Selected Financial Information” above. |
Three Months Ended June 30, | Six Months Ended June 30, | ||||||||||||||||
(unaudited, in millions) | 2014 | 2013 | 2014 | 2013 | |||||||||||||
Net income including noncontrolling interests | $ | 24 | $ | 10 | $ | 32 | $ | 5 | |||||||||
Depreciation and amortization | 13 | 13 | 26 | 26 | |||||||||||||
EBITDA | 37 | 23 | 58 | 31 | |||||||||||||
40
Industry trends
Source: PPPC
Global demand for market pulp grew by 1% through June, reflecting stronger demand from China, especially in the second quarter, despite a 2% drop in each of North America and Western Europe. Global demand for softwood pulp was flat, but up by 1% for hardwood grades. In North America, however, demand for softwood pulp was down by 6%, compared to a 3% increase in hardwood demand.
Three months ended June 30, 2014 vs. June 30, 2013
Operating income variance analysis
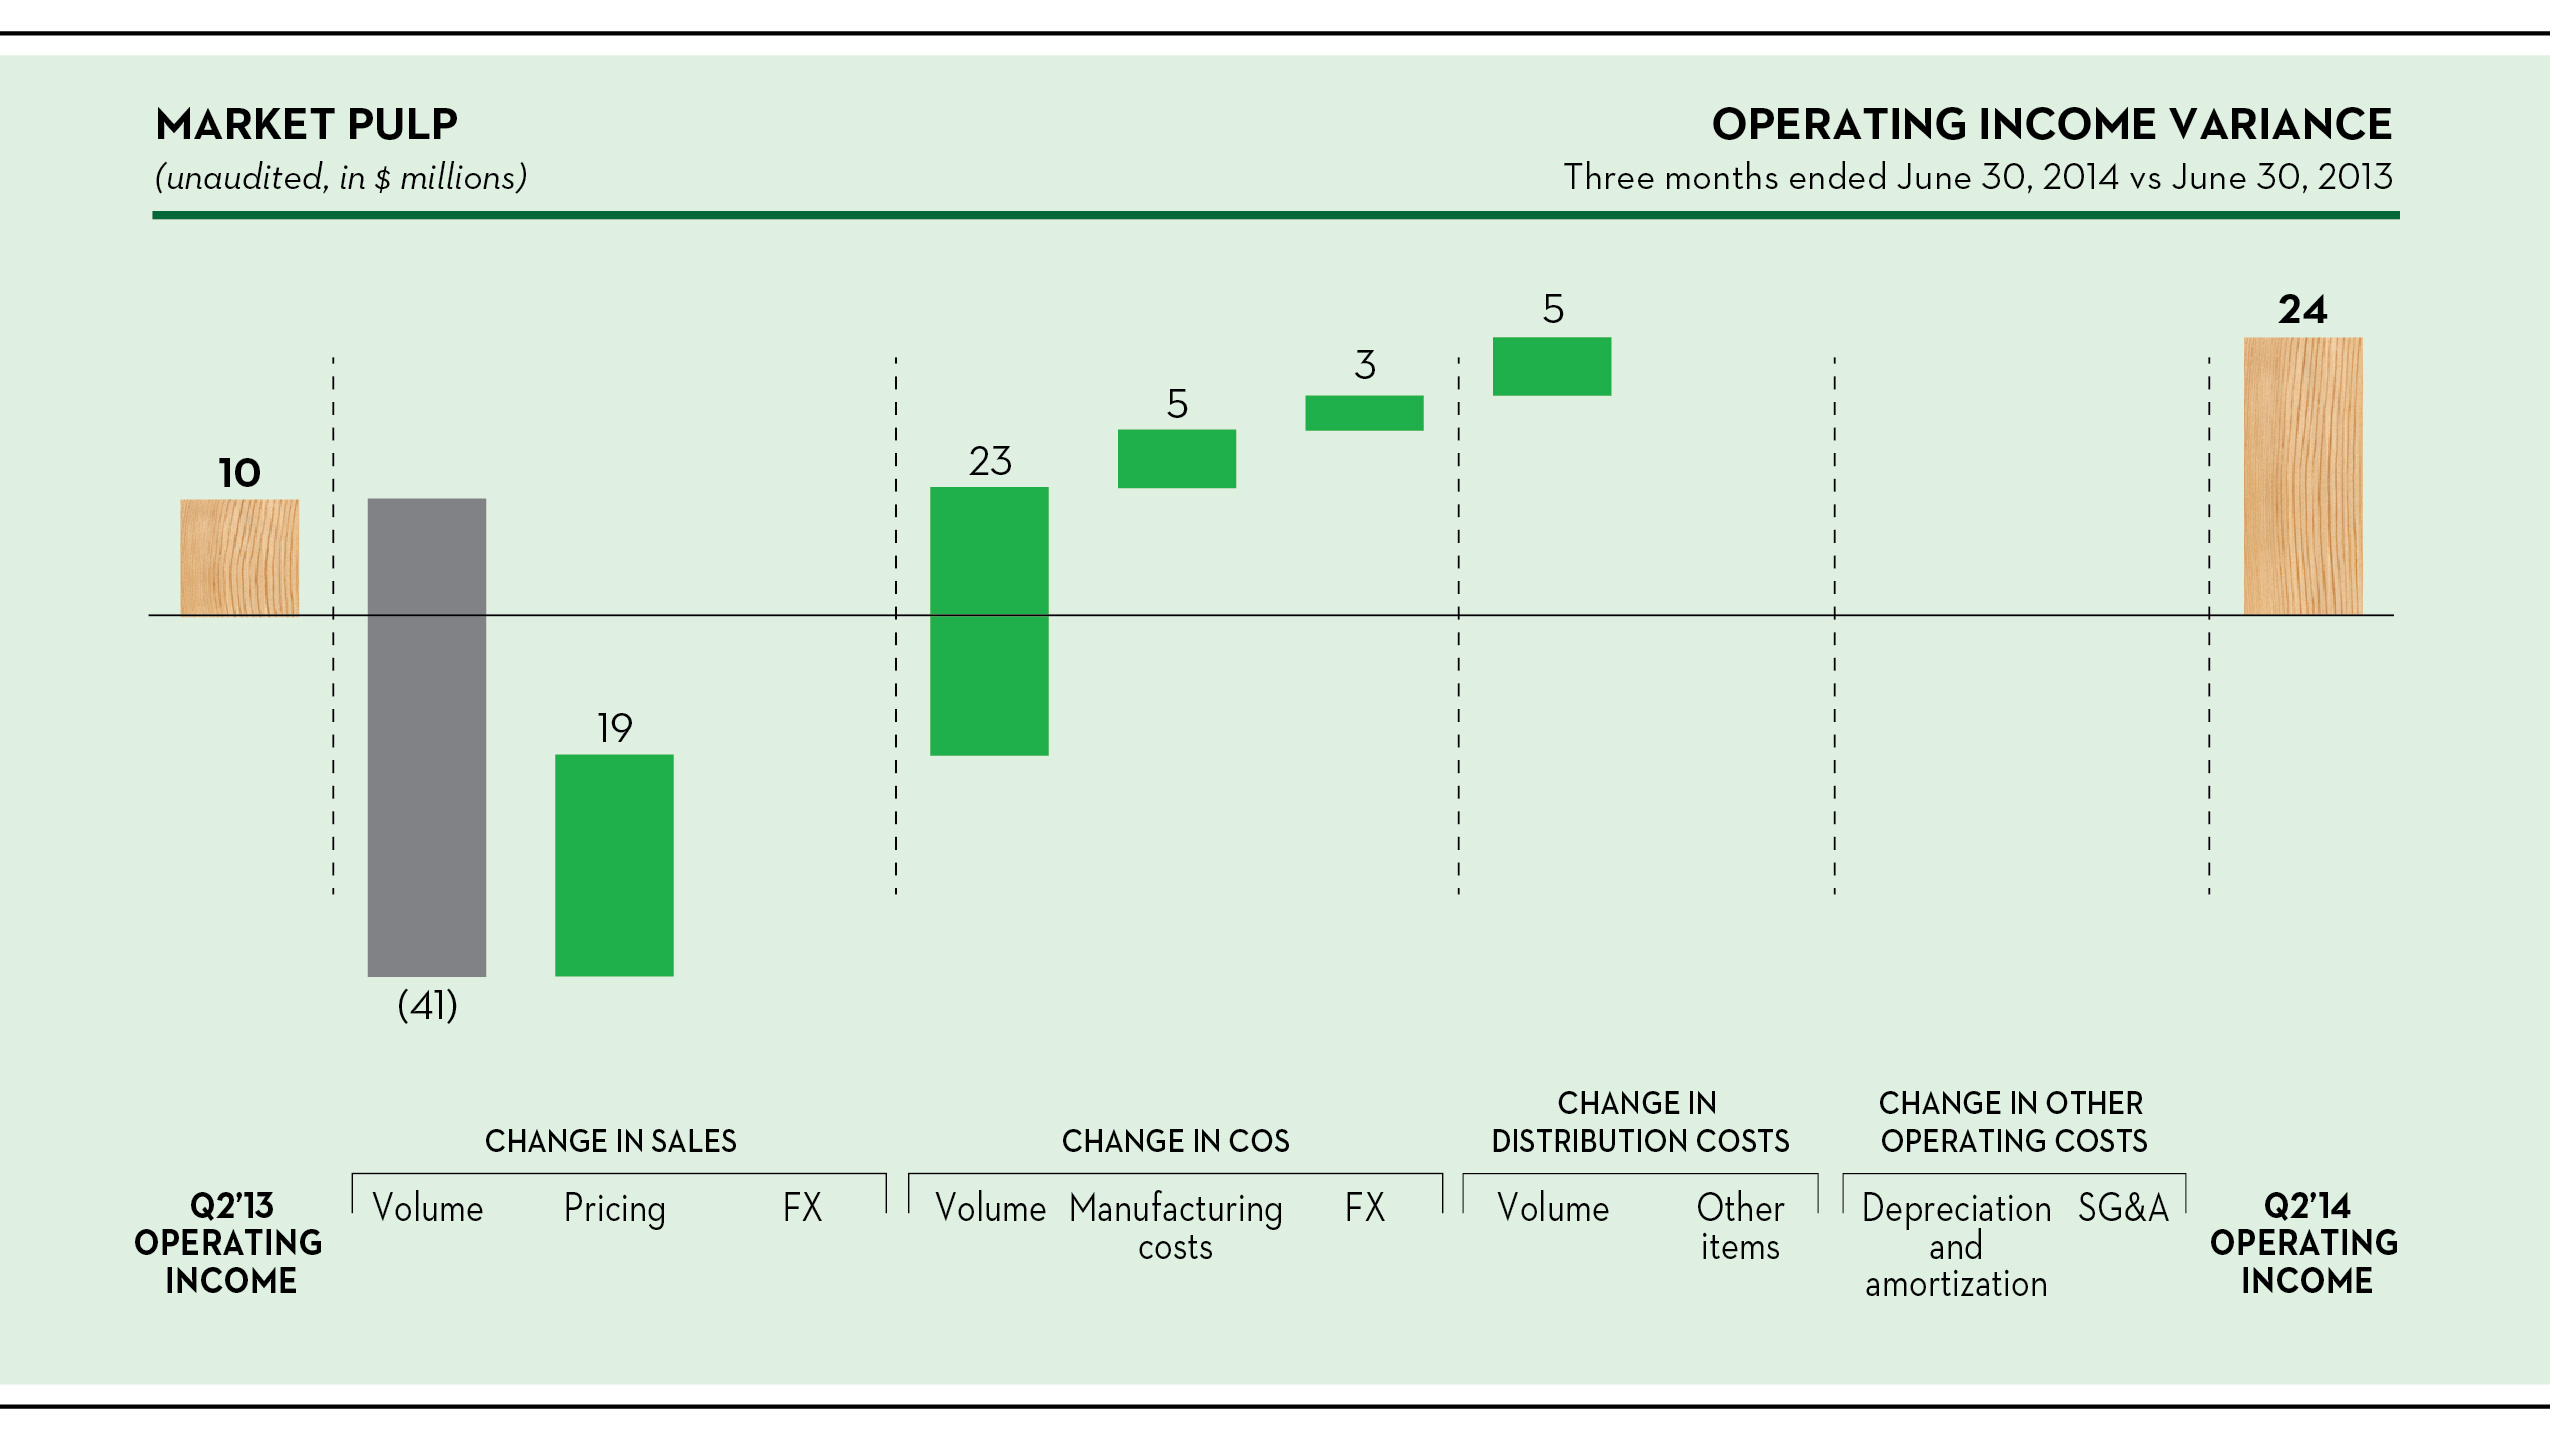
Sales
Sales were $241 million in market pulp, down $22 million, or 8%. The average transaction price improved by $56 per metric ton overall, rising significantly in all grades, but its effect was more than offset by the lower shipments, down by 59,000 metric tons, or 15%. The volume drop was in part due to greater internal consumption of hardwood kraft pulp (the equivalent of approximately 25,000 metric tons), and a more conservative approach to markets in light of slowing demand in North America, particularly for softwood and recycled grades. We also took approximately 5,000 metric tons of market downtime in recycled bleach kraft pulp. In all, we built 15,000 metric tons of finished goods inventory this quarter, or 15%, compared to a depletion of 15,000 metric tons, or 13% in the same period last year.
41
Cost of sales, excluding depreciation, amortization and distribution costs
Segment COS improved by $31 million, or $5 million after adjusting for the effect of lower volume and the weaker Canadian dollar, reflecting better fiber usage ($2 million) and the lower pension and OPEB expenses ($2 million).
Six months ended June 30, 2014 vs. June 30, 2013
Operating income variance analysis
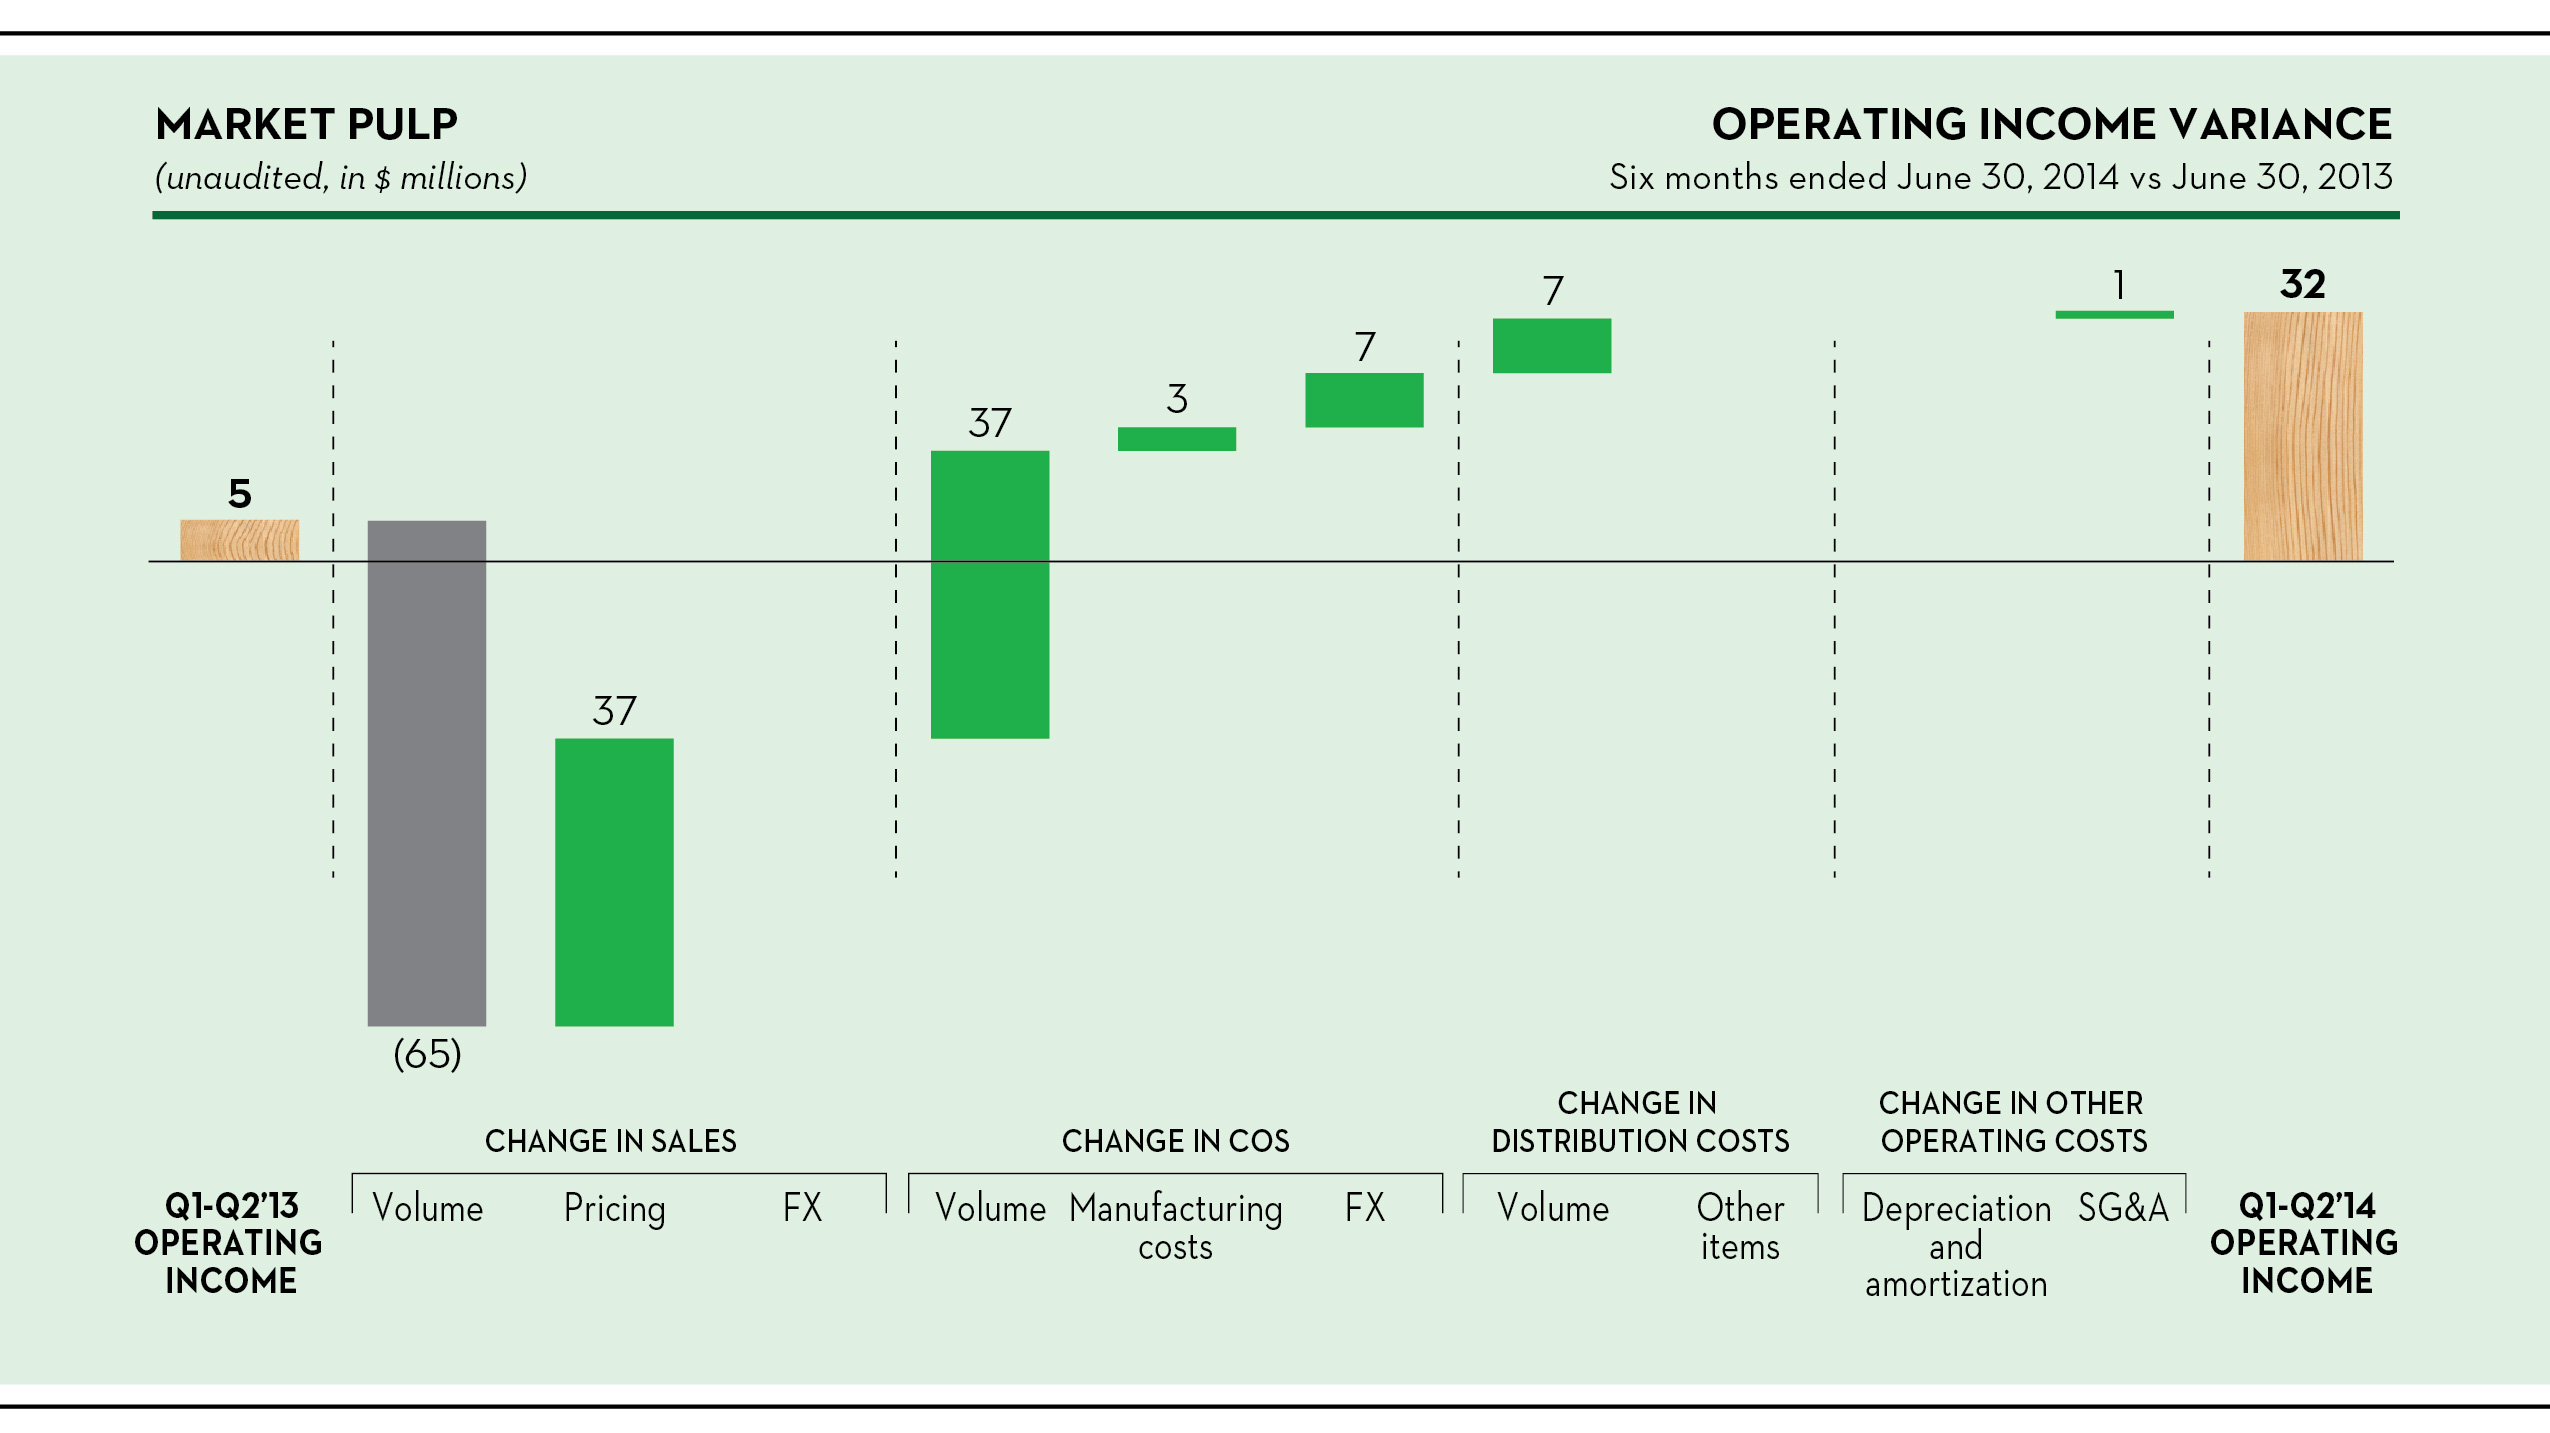
Sales
Sales were $28 million, or 6%, lower, to $475 million. While the average transaction price improved by $55 per metric ton, its effect was more than offset by the 98,000 metric tons drop in shipment volume. This 13% drop reflects the significant challenges of the first quarter, including weather-related production disruptions and mechanical failures at the Saint-Félicien, Québec, mill, as well as higher levels of internal consumption of hardwood kraft pulp (the equivalent of approximately 35,000 metric tons) and a more conservative approach to markets in light of slowing demand in North America, particularly for softwood and recycled grades.
We accumulated 34,000 metric tons of inventory in the period, compared to a decrease of 23,000 metric tons in the same period last year. This reflects the slowing demand and also a build-up of contingency inventory in the event of labor disruptions in light of negotiations for the renewal of Canadian labor agreements, which were successfully concluded in May.
Cost of sales, excluding depreciation, amortization and distribution costs
COS improved by $47 million. After removing the effect of the lower volume and weaker Canadian dollar, manufacturing costs improved by $3 million, which reflects the favorable effect of:
• | the lower pension and OPEB expenses ($4 million); |
• | lower maintenance costs as well as labor and steam efficiencies associated with the additional cogeneration capacity at the Thunder Bay mill ($5 million); and |
• | better fiber usage and lower chip costs ($4 million); |
42
offset in part by:
• | the abnormally cold winter ($8 million), including higher steam costs and wood prices in the U.S. southeast; and |
• | operational disruptions in the first quarter ($3 million), most of which occurred at the Saint-Félicien mill. |
WOOD PRODUCTS
Highlights
Three Months Ended June 30, | Six Months Ended June 30, | ||||||||||||||||
(unaudited, in millions, except where otherwise stated) | 2014 | 2013 | 2014 | 2013 | |||||||||||||
Sales | $ | 161 | $ | 142 | $ | 296 | $ | 280 | |||||||||
Operating income (1) | 15 | 16 | 27 | 32 | |||||||||||||
EBITDA (2) | 23 | 25 | 43 | 50 | |||||||||||||
(in millions of board feet) | |||||||||||||||||
Shipments | 420 | 345 | 773 | 683 | |||||||||||||
Downtime | 50 | 122 | 73 | 258 | |||||||||||||
Inventory at end of period | 154 | 149 | 154 | 149 | |||||||||||||
(1) | Net income including noncontrolling interests is equal to operating income in this segment. |
(2) | EBITDA, a non-GAAP financial measure, is reconciled below. For more information on the calculation and reason we include this measure, see note 1 under “Results of Operations – Consolidated Results– Selected Financial Information” above. |
Three Months Ended June 30, | Six Months Ended June 30, | ||||||||||||||||
(unaudited, in millions) | 2014 | 2013 | 2014 | 2013 | |||||||||||||
Net income including noncontrolling interests | $ | 15 | $ | 16 | $ | 27 | $ | 32 | |||||||||
Depreciation and amortization | 8 | 9 | 16 | 18 | |||||||||||||
EBITDA | 23 | 25 | 43 | 50 | |||||||||||||
Industry trends
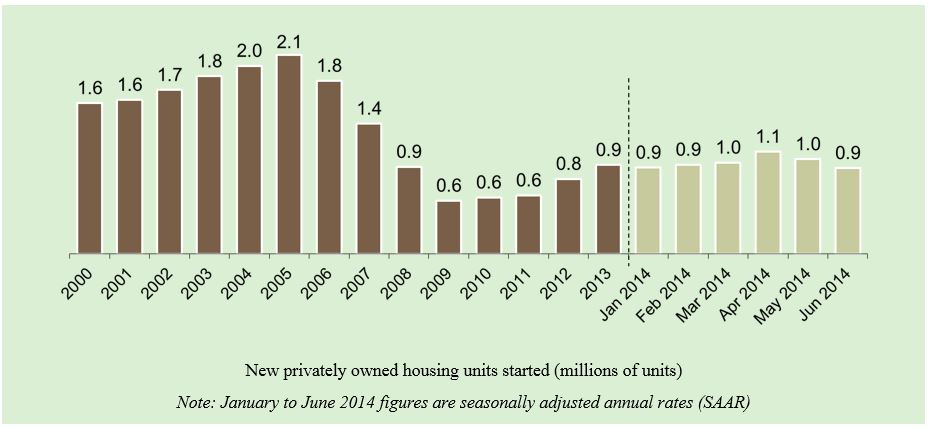
Source: U.S. Census Bureau
43
U.S. housing starts averaged about 980,000 on a seasonally-adjusted basis in the second quarter, or 13% better than the same quarter last year.
Three months ended June 30, 2014 vs. June 30, 2013
Operating income variance analysis
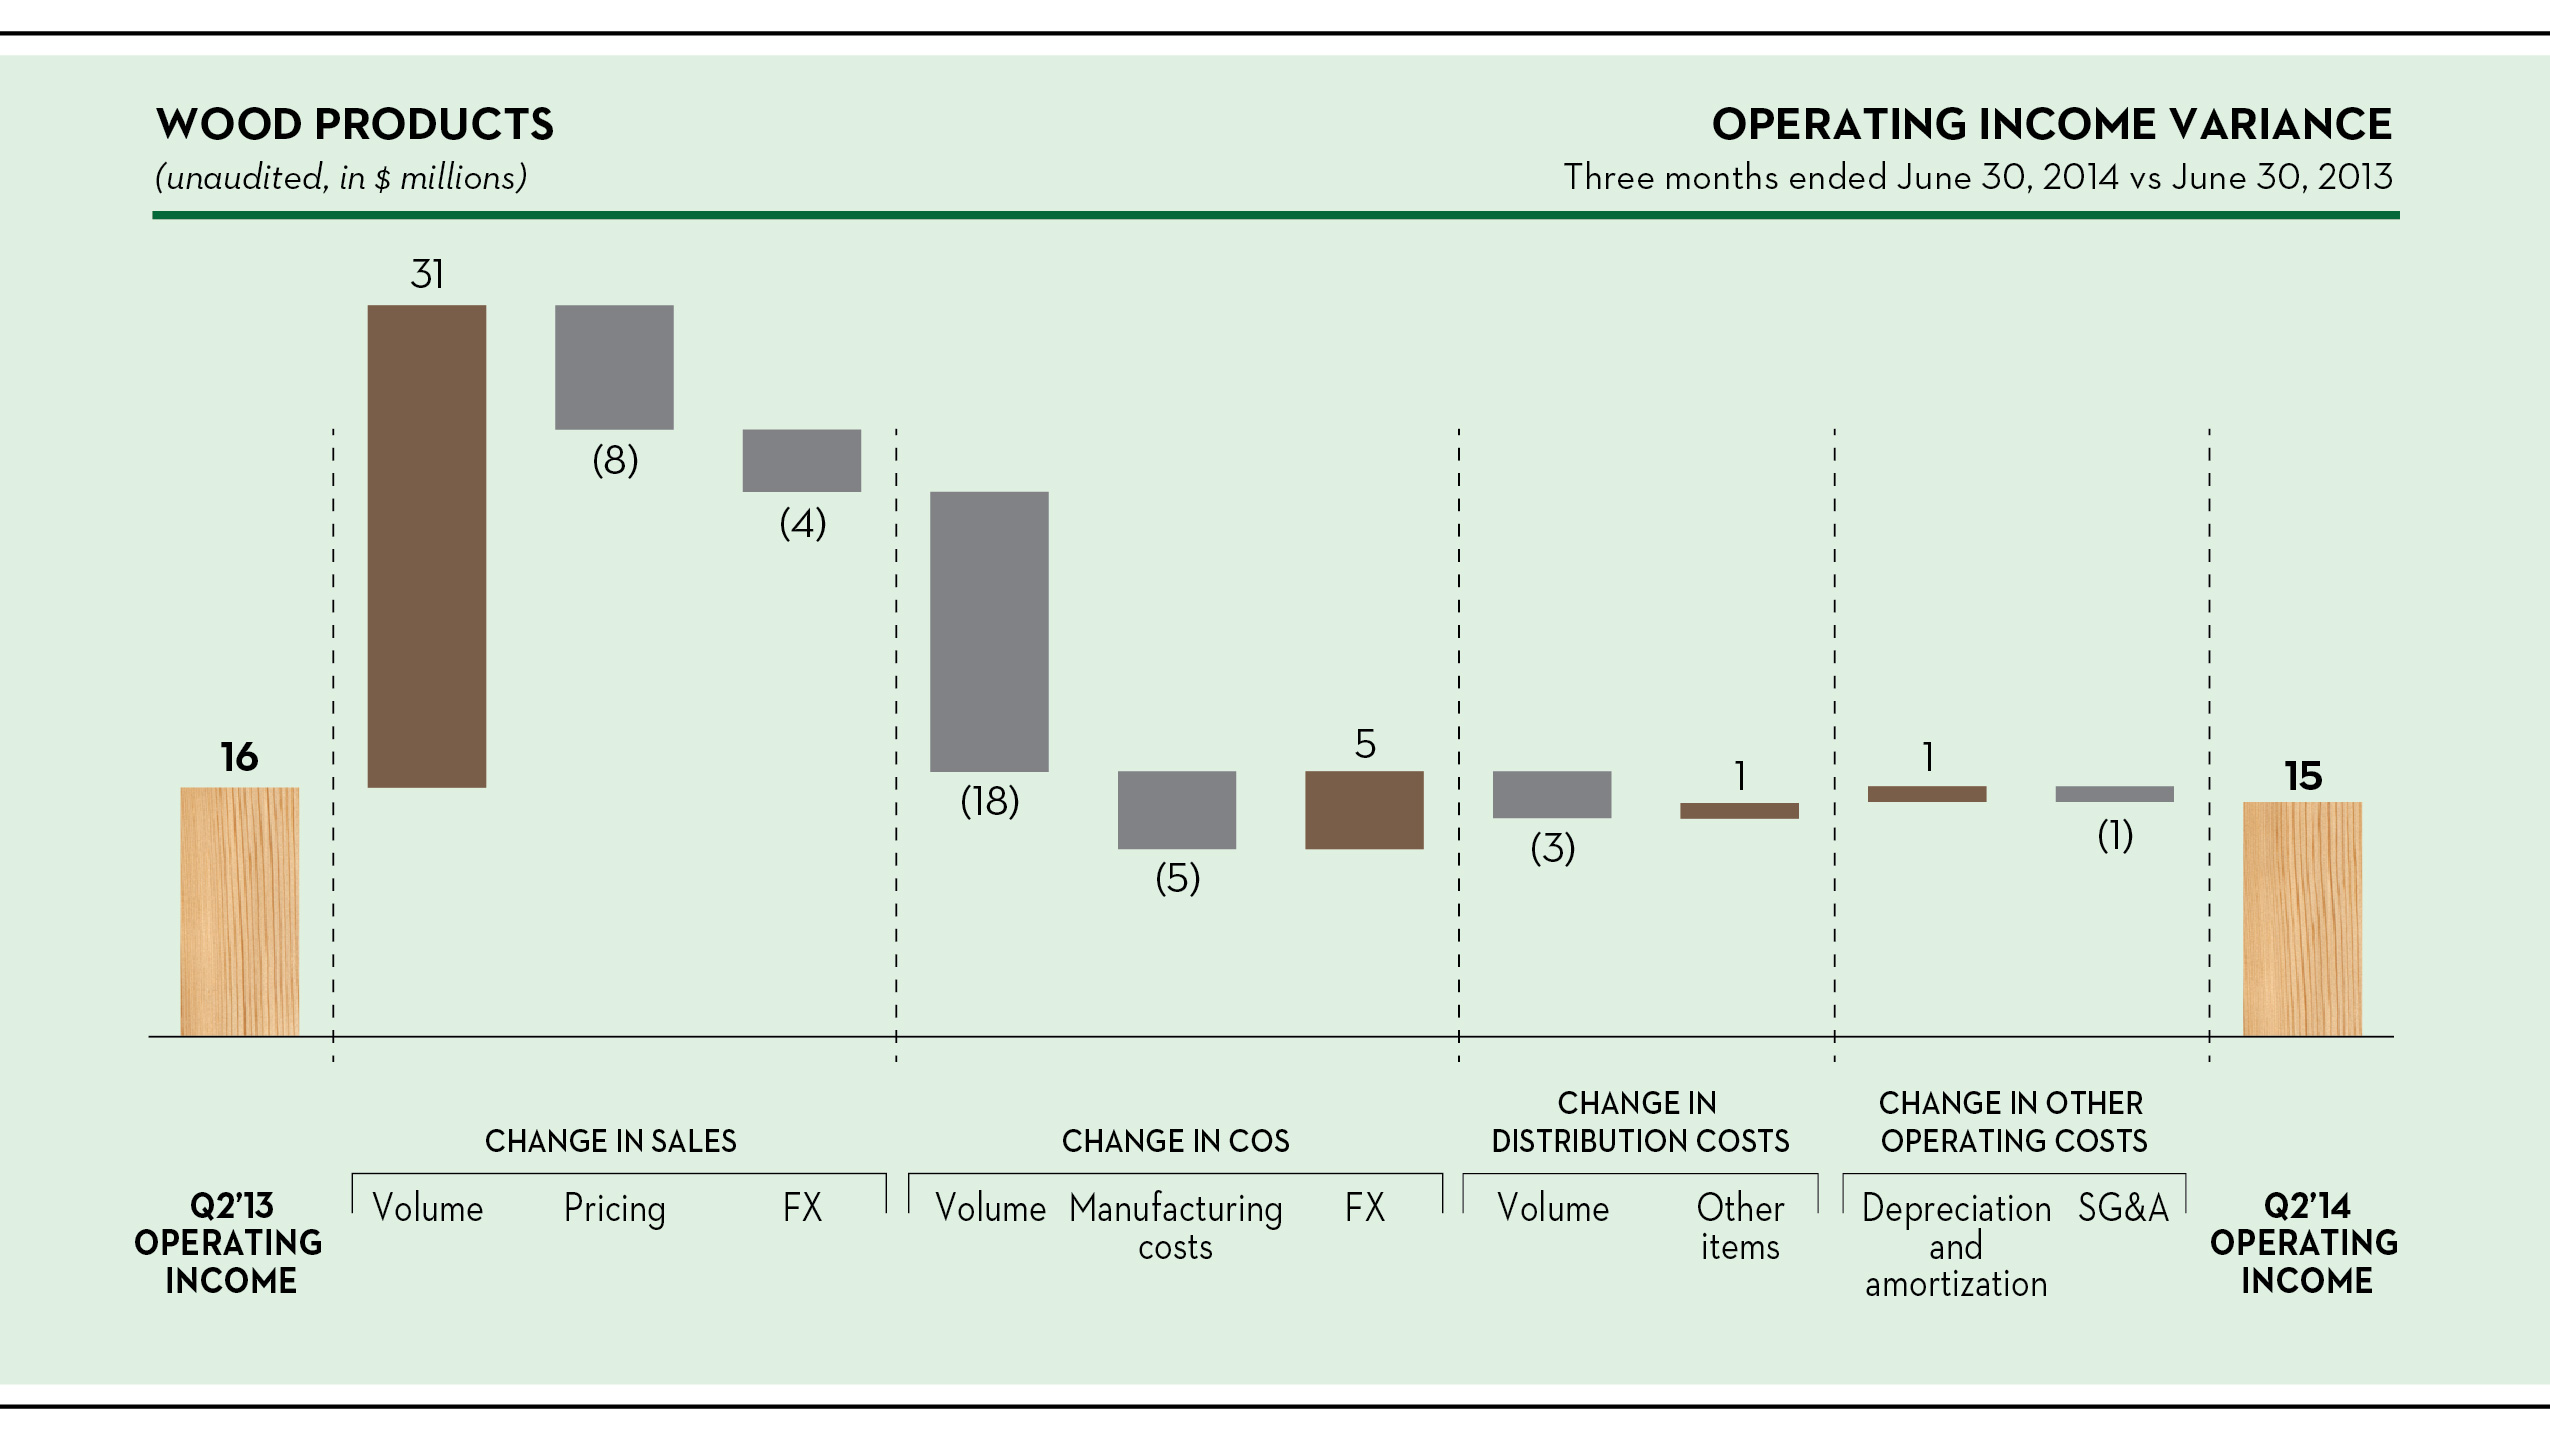
Sales
Wood products sales were $19 million higher, or 13%, at $161 million. The increase reflects a 75 million board feet increase in shipments, offset in part by a $28 per thousand board feet lower average transaction price, which includes the weaker Canadian dollar’s effect on sales denominated in that currency. The increase in shipments reflects an increase to production capacity, with the restart of our Maniwaki, Québec, sawmill, the refurbishment of the Comtois, Québec, sawmill and other capacity enhancement initiatives, as well as better market demand. We also drew down 22 million board feet of inventory in the quarter, compared to a build-up of 27 million board feet in the same period last year.
Cost of sales, excluding depreciation, amortization and distribution costs
The higher shipment volume and an increase in manufacturing costs pushed COS up by $18 million in the quarter, only partially offset by the favorable effect of the weaker Canadian dollar, as all of our production capacity is based in Canada. The change in manufacturing costs is due to higher log costs in the province of Québec ($4 million) due to the comprehensive modification of the forest tenure system in the province, and also lower internal wood chip selling prices (which in turn benefits the other segments).
44
Six months ended June 30, 2014 vs. June 30, 2013
Operating income variance analysis
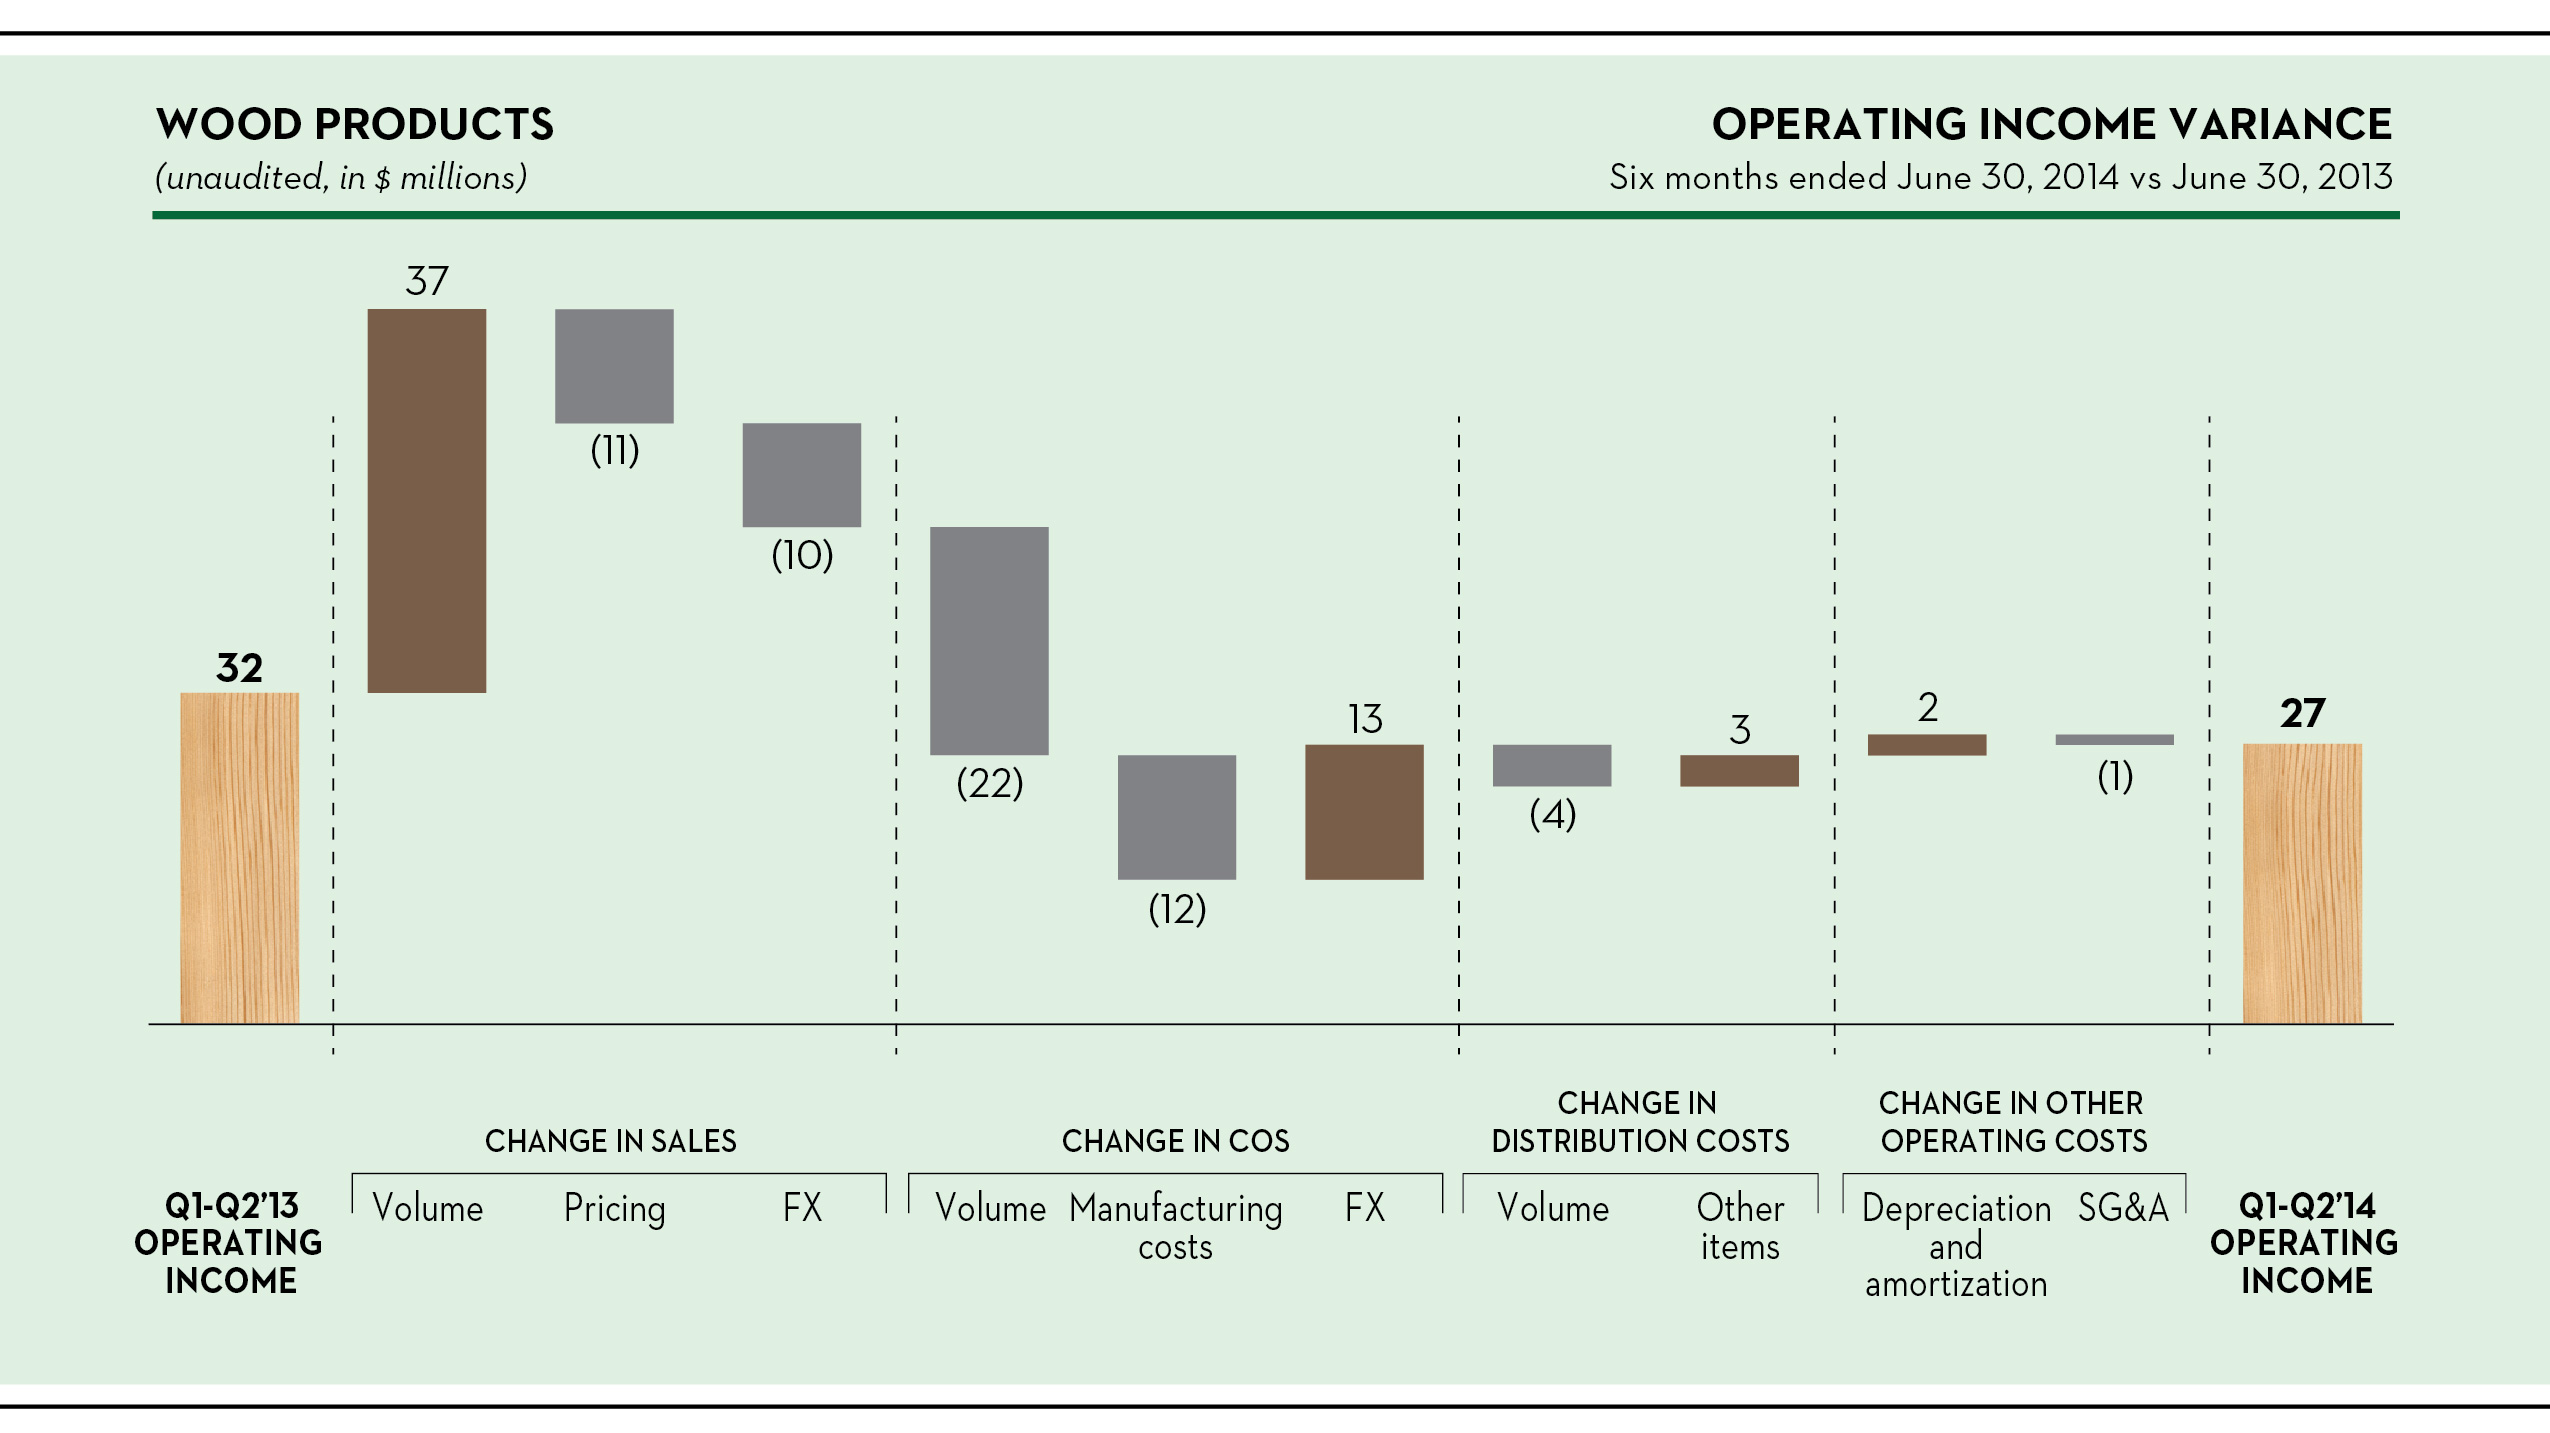
Sales
Sales were $16 million higher, or 6%, to $296 million, reflecting a 90 million board feet increase in shipments, offset in part by lower average transaction price, down by $27 per thousand board feet, which includes the weaker Canadian dollar’s effect on sales denominated in that currency. The increase in shipments reflects stronger market demand as well as an increase in our production capacity, including the restart of our Maniwaki sawmill and the refurbishment of the Comtois sawmill.
Cost of sales, excluding depreciation, amortization and distribution costs
After excluding the unfavorable effect of higher volume and the favorable effect of the weaker Canadian dollar, manufacturing costs increased by $12 million, almost entirely due to higher log costs in the province of Québec due to the comprehensive modification of the forest tenure system in the province, and also lower internal wood chip selling prices, offset in part by better fiber usage.
45
CORPORATE AND OTHER
Highlights
Three Months Ended June 30, | Six Months Ended June 30, | ||||||||||||||||
(unaudited, in millions) | 2014 | 2013 | 2014 | 2013 | |||||||||||||
Cost of sales, excluding depreciation, amortization and distribution costs | $ | (7 | ) | $ | (17 | ) | $ | (8 | ) | $ | (35 | ) | |||||
Depreciation and amortization | (2 | ) | (2 | ) | (3 | ) | (3 | ) | |||||||||
Selling, general and administrative expenses | (3 | ) | (6 | ) | (5 | ) | (13 | ) | |||||||||
Closure costs, impairment and other related charges | (52 | ) | (12 | ) | (62 | ) | (52 | ) | |||||||||
Net gain on disposition of assets | 2 | 2 | 2 | 2 | |||||||||||||
Operating loss | $ | (62 | ) | $ | (35 | ) | $ | (76 | ) | $ | (101 | ) | |||||
The table below shows the reconciliation of net loss including noncontrolling interests to EBITDA and adjusted EBITDA, which are non-GAAP financial measures. For more information on the calculation and reason we include these measures, see note 1 under “Results of Operations – Consolidated Results – Selected Financial Information” above.
Three Months Ended June 30, | Six Months Ended June 30, | ||||||||||||||||
(unaudited, in millions) | 2014 | 2013 | 2014 | 2013 | |||||||||||||
Net loss including noncontrolling interests | $ | (54 | ) | $ | (82 | ) | $ | (85 | ) | $ | (104 | ) | |||||
Interest expense | 11 | 13 | 23 | 27 | |||||||||||||
Income tax provision (benefit) | 1 | (31 | ) | (7 | ) | (71 | ) | ||||||||||
Depreciation and amortization | 2 | 2 | 3 | 3 | |||||||||||||
EBITDA | $ | (40 | ) | $ | (98 | ) | $ | (66 | ) | $ | (145 | ) | |||||
Foreign exchange translation (gain) loss | (17 | ) | 7 | (3 | ) | 12 | |||||||||||
Closure costs, impairment and other related charges | 52 | 12 | 62 | 52 | |||||||||||||
Inventory write-downs related to closures | 3 | 1 | 4 | 5 | |||||||||||||
Start-up costs | 1 | 13 | 1 | 28 | |||||||||||||
Net gain on disposition of assets | (2 | ) | (2 | ) | (2 | ) | (2 | ) | |||||||||
Net loss on extinguishment of debt | — | 59 | — | 59 | |||||||||||||
Transaction costs | — | 2 | — | 5 | |||||||||||||
Other income, net | (3 | ) | (1 | ) | (4 | ) | (24 | ) | |||||||||
Adjusted EBITDA | $ | (6 | ) | $ | (7 | ) | $ | (8 | ) | $ | (10 | ) | |||||
Three months ended June 30, 2014 vs. June 30, 2013
Cost of sales, excluding depreciation, amortization and distribution costs
We incurred COS of $7 million in the second quarter, including asset preservation costs at the Fort Frances mill ($3 million), which we permanently closed in the quarter, and a write-off of spare parts in connection with the permanent closure of the idled machine at Catawba ($3 million). This compares to COS of $17 million in the year-ago period, which included start-up costs at our Gatineau mill ($13 million).
Selling, general and administrative expenses
SG&A was $3 million lower in the quarter, primarily because of the reduction of project costs and the weaker Canadian dollar.
46
Closure costs, impairment and other related charges
We recorded closure costs, impairment and other related charges of $52 million in the quarter, compared to $12 million in the year-ago period. The current period includes $45 million of accelerated depreciation following our decision to permanently close the idled paper machine at Catawba, as well as long-lived asset impairment charges ($5 million).
Last year’s amount reflects the additional accelerated depreciation, severance and other costs associated with the idling of a newsprint machine at our Calhoun mill ($12 million).
Six months ended June 30, 2014 vs. June 30, 2013
Cost of sales, excluding depreciation, amortization and distribution costs
COS were $27 million lower in the period. The most significant change was start-up costs recorded in 2013 in connection with the restart of the Gatineau mill ($28 million), which began operation in June of 2013.
Selling, general and administrative expenses
SG&A was $8 million lower in this year’s period, primarily because of the reduction of project costs and the weaker Canadian dollar.
Closure costs, impairment and other related charges
We recorded closure costs, impairment and other related charges of $62 million, compared to $52 million in the year-ago period. The current period includes:
• | $45 million of accelerated depreciation following our decision in the second quarter to permanently close the idled paper machine at Catawba; |
• | $8 million of idling and cleaning costs in the first quarter, and severance charges in the second quarter at the Fort Frances mill; |
• | $6 million for long-lived asset impairment charges, mostly in the second quarter; and |
• | $3 million of accelerated depreciation in the first quarter for a paper machine closed at Iroquois Falls, Ontario. |
The amount in the same period last year mostly related to accelerated depreciation, severance and other costs associated with the idling of a newsprint machine at our Calhoun mill, recorded in both the first and second quarters ($49 million).
47
LIQUIDITY AND CAPITAL RESOURCES
Capital Resources
We rely on cash and cash equivalents, net cash provided by operations and our senior secured asset-based revolving credit facility, or “ABL credit facility”, to fund our operations, make pension contributions and finance our working capital and capital expenditures. As of June 30, 2014, we had cash and cash equivalents of $263 million and availability of $567 million under the ABL credit facility.
In our view, we have sufficient financial resources available to finance our business plan, meet working capital requirements and maintain an appropriate level of capital spending.
Amendments to ABL facility
The ABL credit facility was amended as of February 25, 2014, to, among other things:
• | release the second priority liens on the collateral of the covered borrowers and guarantors previously pledged to secure the 2018 notes, with an ability to re-implement that second lien should we issue new secured debt with a second lien on the ABL collateral; |
• | reduce the excess availability thresholds that trigger a minimum consolidated fixed charge coverage ratio; |
• | increase the uncommitted incremental loan facility; |
• | improve our borrowing capacity by providing more flexibility under the debt incurrence covenant, including significant expansion to baskets for unsecured and secured debt, subject to certain conditions; and |
• | increase certain advance rates for purposes of calculating the borrowing base. |
Flow of Funds
Summary of cash flows
Six Months Ended June 30, | ||||||||
(unaudited, in millions) | 2014 | 2013 | ||||||
Net cash provided by operating activities | $ | 22 | $ | 48 | ||||
Net cash used in investing activities | (80 | ) | (75 | ) | ||||
Net cash (used in) provided by financing activities | (2 | ) | 12 | |||||
Effect of exchange rate changes on cash and cash equivalents | 1 | — | ||||||
Net decrease in cash and cash equivalents | $ | (59 | ) | $ | (15 | ) | ||
Six months ended June 30, 2014 vs. June 30, 2013
Cash provided by operating activities
We generated $22 million of cash from operating activities in the first half of the year, compared to $48 million in the year-ago period. The change was affected by the lower sales, from lower volume and pricing, as well as higher costs related to the effect of the abnormally cold winter and higher pension plan contributions, partially offset by the absence of start-up costs.
Cash used in investing activities
Investing activities consisted of cash invested in fixed assets, which was largely consistent with the year-ago period.
Cash (used in) provided by financing activities
We used $2 million in financing activities in the first six months of 2014, compared to cash provided of $12 million in the same period last year. In 2013, we received proceeds of $594 million in connection with the issuance of the 2023 notes, which we used to repurchase $496 million of 2018 notes, or 99% of the amount then outstanding, and to pay $84 million as a tender offer premium. We also paid financing and credit facility fees of $9 million, and we received an $8 million contribution from our former joint venture partner in CNC in connection with our acquisition of their interest.
48
Employee Benefit Plans
Canadian pension funding
The provinces of Québec and Ontario adopted, as of April 9 and April 15, respectively, the regulations contemplated under “Management’s Discussion and Analysis of Financial Condition and Results of Operations ‑ Employee Benefit Plans ‑ Canadian Pension Funding” in the 2013 annual report. These regulations implement the revised framework of parameters concerning the funding of the aggregate solvency deficits in our material Canadian registered pension plans, which we refer to as the “affected plans”.
The principal amendments to the funding relief regulations include, among other things:
• | an increase in the annual basic contribution in respect of the solvency deficits in the affected plans from Cdn$50 million to Cdn$80 million for each year from 2013 through 2020; and |
• | the elimination of the additional contribution, starting in 2013, based on a measure of free cash flow (as determined in accordance with the regulations) when solvency is below a certain threshold. |
As originally adopted, the funding relief regulations provided that corrective measures would be required if the aggregate solvency ratio in the affected plans fell below a prescribed level under the targets specified by the regulations as of December 31 in any year through 2014. This requirement was definitively removed with the amendments to the Québec regulations. In Ontario, the corresponding amount has been deferred to after the expiration of the funding relief regulations in 2020, and will then be payable over five years in equal monthly installments starting on December 31, 2021, but only up to the elimination of the then remaining deficit, if any.
In connection with the establishment of the original regulations, our principal Canadian operating subsidiary had undertaken to make an additional solvency deficit reduction contribution of Cdn$75 to the affected plans, payable over four years, for each metric ton of capacity reduced in Québec or Ontario, in the event of downtime of more than six consecutive months or nine cumulative months over a period of 18 months. As part of the amendments to the funding relief regulations, it was determined that no additional contribution would be made in respect of any capacity reduction in Québec before April 13, 2013. The application of this undertaking in respect of capacity reductions in Ontario has yet to be settled.
49
ITEM 3. QUANTITATIVE AND QUALITATIVE DISCLOSURES ABOUT MARKET RISK
Information relating to quantitative and qualitative disclosures about market risk is disclosed in Part II, Item 7A, “Quantitative and Qualitative Disclosures About Market Risk,” in our 2013 Annual Report. There have been no material changes in our exposure to market risk as previously disclosed in our 2013 Annual Report.
ITEM 4. CONTROLS AND PROCEDURES
(a) Evaluation of Disclosure Controls and Procedures:
We have evaluated the effectiveness of the design and operation of our disclosure controls and procedures, as defined in Rules 13a–15(e) and 15d–15(e) of the Securities Exchange Act of 1934, as of June 30, 2014. Based on that evaluation, the President and Chief Executive Officer and the Senior Vice President and Chief Financial Officer concluded that our disclosure controls and procedures were effective as of such date in recording, processing, summarizing and timely reporting information required to be disclosed in our reports to the SEC.
(b) Changes in Internal Control over Financial Reporting:
In connection with the evaluation of internal control over financial reporting, there were no changes during the period covered by this report that have materially affected, or are reasonably likely to materially affect, our internal control over financial reporting.
PART II—OTHER INFORMATION
ITEM 1. LEGAL PROCEEDINGS
Information on our legal proceedings is presented under Part I, Item 3, “Legal Proceedings,” in our 2013 Annual Report. There have been no material changes to the legal proceedings described in the 2013 Annual Report.
ITEM 1A. RISK FACTORS
In addition to the other information set forth in this Form 10-Q, you should carefully consider the risk factors set forth under Part I, Item 1A, “Risk Factors” in our 2013 Annual Report, which could materially affect our business, financial condition or future results. The risks described in this report and in our 2013 Annual Report are not the only risks we are facing. Additional risks and uncertainties not currently known to us or that we currently deem to be immaterial may also materially affect our business, financial condition or future results. There have been no material changes to the risk factors previously disclosed in our 2013 Annual Report.
50
ITEM 6. EXHIBITS
Exhibit No. | Description | |
31.1* | Certification of President and Chief Executive Officer Pursuant to Section 302 of the Sarbanes-Oxley Act of 2002. | |
31.2* | Certification of Senior Vice President and Chief Financial Officer Pursuant to Section 302 of the Sarbanes-Oxley Act of 2002. | |
32.1* | Certification of President and Chief Executive Officer Pursuant to Section 906 of the Sarbanes-Oxley Act of 2002. | |
32.2* | Certification of Senior Vice President and Chief Financial Officer Pursuant to Section 906 of the Sarbanes-Oxley Act of 2002. | |
101.INS** | XBRL Instance Document. | |
101.SCH** | XBRL Taxonomy Extension Schema Document. | |
101.CAL** | XBRL Taxonomy Extension Calculation Linkbase Document. | |
101.LAB** | XBRL Taxonomy Extension Label Linkbase Document. | |
101.PRE** | XBRL Taxonomy Extension Presentation Linkbase Document. | |
101.DEF** | XBRL Taxonomy Extension Definition Linkbase Document. | |
* | Filed with this Form 10-Q. |
** | Interactive data files furnished with this Form 10-Q, which represent the following materials from this Form 10-Q formatted in XBRL (eXtensible Business Reporting Language): (i) the Consolidated Statements of Operations, (ii) the Consolidated Statements of Comprehensive Income (Loss), (iii) the Consolidated Balance Sheets, (iv) the Consolidated Statements of Changes in Equity, (v) the Consolidated Statements of Cash Flows and (vi) the Notes to Unaudited Interim Consolidated Financial Statements. |
51
SIGNATURES
Pursuant to the requirements of the Securities Exchange Act of 1934, the Registrant has duly caused this Report to be signed on its behalf by the undersigned thereunto duly authorized.
RESOLUTE FOREST PRODUCTS INC. | ||
By | /s/ Jo-Ann Longworth | |
Jo-Ann Longworth | ||
Senior Vice President and Chief Financial Officer | ||
By | /s/ Silvana Travaglini | |
Silvana Travaglini | ||
Vice President and Chief Accounting Officer | ||
Date: August 11, 2014
52
EXHIBIT INDEX
Exhibit No. | Description | |
31.1* | Certification of President and Chief Executive Officer Pursuant to Section 302 of the Sarbanes-Oxley Act of 2002. | |
31.2* | Certification of Senior Vice President and Chief Financial Officer Pursuant to Section 302 of the Sarbanes-Oxley Act of 2002. | |
32.1* | Certification of President and Chief Executive Officer Pursuant to Section 906 of the Sarbanes-Oxley Act of 2002. | |
32.2* | Certification of Senior Vice President and Chief Financial Officer Pursuant to Section 906 of the Sarbanes-Oxley Act of 2002. | |
101.INS** | XBRL Instance Document. | |
101.SCH** | XBRL Taxonomy Extension Schema Document. | |
101.CAL** | XBRL Taxonomy Extension Calculation Linkbase Document. | |
101.LAB** | XBRL Taxonomy Extension Label Linkbase Document. | |
101.PRE** | XBRL Taxonomy Extension Presentation Linkbase Document. | |
101.DEF** | XBRL Taxonomy Extension Definition Linkbase Document. | |
* | Filed with this Form 10-Q. |
** | Interactive data files furnished with this Form 10-Q, which represent the following materials from this Form 10-Q formatted in XBRL (eXtensible Business Reporting Language): (i) the Consolidated Statements of Operations, (ii) the Consolidated Statements of Comprehensive Income (Loss), (iii) the Consolidated Balance Sheets, (iv) the Consolidated Statements of Changes in Equity, (v) the Consolidated Statements of Cash Flows and (vi) the Notes to Unaudited Interim Consolidated Financial Statements. |
53