Attached files
| file | filename |
|---|---|
| EX-31.1 - EXHIBIT 31.1 - Resolute Forest Products Inc. | rfp-2015930xex311.htm |
| EX-32.2 - EXHIBIT 32.2 - Resolute Forest Products Inc. | rfp-2015930xex322.htm |
| EX-32.1 - EXHIBIT 32.1 - Resolute Forest Products Inc. | rfp-2015930xex321.htm |
| EX-31.2 - EXHIBIT 31.2 - Resolute Forest Products Inc. | rfp-2015930xex312.htm |
UNITED STATES SECURITIES AND EXCHANGE COMMISSION
WASHINGTON, D.C. 20549
FORM 10-Q
(Mark One)
þ | QUARTERLY REPORT PURSUANT TO SECTION 13 OR 15(d) OF THE SECURITIES EXCHANGE ACT OF 1934 | |
FOR THE QUARTERLY PERIOD ENDED SEPTEMBER 30, 2015
¨ | TRANSITION REPORT PURSUANT TO SECTION 13 OR 15(d) OF THE SECURITIES EXCHANGE ACT OF 1934 | |
FOR THE TRANSITION PERIOD FROM TO
COMMISSION FILE NUMBER: 001-33776
RESOLUTE FOREST PRODUCTS INC.
(Exact name of registrant as specified in its charter)
Delaware | 98-0526415 |
(State or other jurisdiction of incorporation or organization) | (I.R.S. employer identification number) |
111 Duke Street, Suite 5000; Montréal, Québec; Canada H3C 2M1 |
(Address of principal executive offices) (Zip Code) |
(514) 875-2515 |
(Registrant’s telephone number, including area code) |
(Former name, former address and former fiscal year, if changed since last report) |
Indicate by check mark whether the registrant: (1) has filed all reports required to be filed by Section 13 or 15(d) of the Securities Exchange Act of 1934 during the preceding 12 months (or for such shorter period that the registrant was required to file such reports), and (2) has been subject to such filing requirements for the past 90 days. Yes þ No ¨
Indicate by check mark whether the registrant has submitted electronically and posted on its corporate Website, if any, every Interactive Data File required to be submitted and posted pursuant to Rule 405 of Regulation S-T (§232.405 of this chapter) during the preceding 12 months (or for such shorter period that the registrant was required to submit and post such files).
Yes þ No ¨
Indicate by check mark whether the registrant is a large accelerated filer, an accelerated filer, a non-accelerated filer or a smaller reporting company. See the definitions of “large accelerated filer,” “accelerated filer,” and “smaller reporting company” in Rule 12b-2 of the Exchange Act.
Large accelerated filer þ | Accelerated filer ¨ | Non-accelerated filer ¨ | Smaller reporting company ¨ | |||
(Do not check if a smaller reporting company) | ||||||
Indicate by check mark whether the registrant is a shell company (as defined in Rule 12b-2 of the Exchange Act).
Yes ¨ No þ
Indicate by check mark whether the registrant has filed all documents and reports required to be filed by Sections 12, 13 or 15(d) of the Securities Exchange Act of 1934 subsequent to the distribution of securities under a plan confirmed by a court.
Yes þ No ¨
As of October 30, 2015, there were 89,306,132 shares of Resolute Forest Products Inc. common stock, $0.001 par value, outstanding.
RESOLUTE FOREST PRODUCTS INC.
TABLE OF CONTENTS
Page Number | ||
PART I. FINANCIAL INFORMATION | ||
Item 1. Financial Statements: | ||
PART II. OTHER INFORMATION | ||
PART I. | FINANCIAL INFORMATION |
ITEM 1. | FINANCIAL STATEMENTS |
RESOLUTE FOREST PRODUCTS INC.
CONSOLIDATED STATEMENTS OF OPERATIONS
(Unaudited, in millions, except per share amounts)
Three Months Ended September 30, | Nine Months Ended September 30, | ||||||||||||||||
2015 | 2014 | 2015 | 2014 | ||||||||||||||
Sales | $ | 905 | $ | 1,096 | $ | 2,751 | $ | 3,203 | |||||||||
Costs and expenses: | |||||||||||||||||
Cost of sales, excluding depreciation, amortization and distribution costs | 687 | 816 | 2,097 | 2,449 | |||||||||||||
Depreciation and amortization | 59 | 60 | 176 | 184 | |||||||||||||
Distribution costs | 117 | 134 | 348 | 388 | |||||||||||||
Selling, general and administrative expenses | 34 | 41 | 115 | 118 | |||||||||||||
Closure costs, impairment and other related charges | 2 | 85 | 8 | 147 | |||||||||||||
Net gain on disposition of assets | — | — | — | (2 | ) | ||||||||||||
Operating income (loss) | 6 | (40 | ) | 7 | (81 | ) | |||||||||||
Interest expense | (9 | ) | (12 | ) | (32 | ) | (35 | ) | |||||||||
Other (expense) income, net | (1 | ) | (65 | ) | 5 | (58 | ) | ||||||||||
Loss before income taxes | (4 | ) | (117 | ) | (20 | ) | (174 | ) | |||||||||
Income tax (provision) benefit | (2 | ) | 1 | (22 | ) | 8 | |||||||||||
Net loss including noncontrolling interests | (6 | ) | (116 | ) | (42 | ) | (166 | ) | |||||||||
Net income attributable to noncontrolling interests | — | — | (1 | ) | (2 | ) | |||||||||||
Net loss attributable to Resolute Forest Products Inc. | $ | (6 | ) | $ | (116 | ) | $ | (43 | ) | $ | (168 | ) | |||||
Net loss per share attributable to Resolute Forest Products Inc. common shareholders: | |||||||||||||||||
Basic | $ | (0.07 | ) | $ | (1.23 | ) | $ | (0.46 | ) | $ | (1.78 | ) | |||||
Diluted | (0.07 | ) | (1.23 | ) | (0.46 | ) | (1.78 | ) | |||||||||
Weighted-average number of Resolute Forest Products Inc. common shares outstanding: | |||||||||||||||||
Basic | 91.1 | 94.6 | 93.3 | 94.6 | |||||||||||||
Diluted | 91.1 | 94.6 | 93.3 | 94.6 | |||||||||||||
See accompanying notes to unaudited interim consolidated financial statements.
1
RESOLUTE FOREST PRODUCTS INC.
CONSOLIDATED STATEMENTS OF COMPREHENSIVE INCOME (LOSS)
(Unaudited, in millions)
Three Months Ended September 30, | Nine Months Ended September 30, | ||||||||||||||||
2015 | 2014 | 2015 | 2014 | ||||||||||||||
Net loss including noncontrolling interests | $ | (6 | ) | $ | (116 | ) | $ | (42 | ) | $ | (166 | ) | |||||
Other comprehensive income (loss): | |||||||||||||||||
Unamortized prior service credits: | |||||||||||||||||
Change in unamortized prior service credits | (4 | ) | (4 | ) | (12 | ) | 82 | ||||||||||
Income tax benefit (provision) | — | 1 | — | (33 | ) | ||||||||||||
Change in unamortized prior service credits, net of tax | (4 | ) | (3 | ) | (12 | ) | 49 | ||||||||||
Unamortized actuarial losses: | |||||||||||||||||
Change in unamortized actuarial losses | 20 | (42 | ) | 60 | (46 | ) | |||||||||||
Income tax (provision) benefit | (4 | ) | 11 | (13 | ) | 14 | |||||||||||
Change in unamortized actuarial losses, net of tax | 16 | (31 | ) | 47 | (32 | ) | |||||||||||
Foreign currency translation | (1 | ) | 1 | (3 | ) | 1 | |||||||||||
Other comprehensive income (loss), net of tax | 11 | (33 | ) | 32 | 18 | ||||||||||||
Comprehensive income (loss) including noncontrolling interests | 5 | (149 | ) | (10 | ) | (148 | ) | ||||||||||
Comprehensive income attributable to noncontrolling interests | — | — | (1 | ) | (2 | ) | |||||||||||
Comprehensive income (loss) attributable to Resolute Forest Products Inc. | $ | 5 | $ | (149 | ) | $ | (11 | ) | $ | (150 | ) | ||||||
See accompanying notes to unaudited interim consolidated financial statements.
2
RESOLUTE FOREST PRODUCTS INC.
CONSOLIDATED BALANCE SHEETS
(Unaudited, in millions, except per share amount)
September 30, 2015 | December 31, 2014 | |||||||
Assets | ||||||||
Current assets: | ||||||||
Cash and cash equivalents | $ | 235 | $ | 337 | ||||
Accounts receivable, net: | ||||||||
Trade | 420 | 449 | ||||||
Other | 93 | 90 | ||||||
Inventories, net | 535 | 542 | ||||||
Deferred income tax assets | 22 | 70 | ||||||
Other current assets | 63 | 46 | ||||||
Total current assets | 1,368 | 1,534 | ||||||
Fixed assets, net | 1,932 | 1,985 | ||||||
Amortizable intangible assets, net | 60 | 62 | ||||||
Deferred income tax assets | 1,028 | 1,219 | ||||||
Other assets | 160 | 121 | ||||||
Total assets | $ | 4,548 | $ | 4,921 | ||||
Liabilities and equity | ||||||||
Current liabilities: | ||||||||
Accounts payable and accrued liabilities | $ | 467 | $ | 518 | ||||
Current portion of long-term debt | 1 | 1 | ||||||
Total current liabilities | 468 | 519 | ||||||
Long-term debt, net of current portion | 596 | 596 | ||||||
Pension and other postretirement benefit obligations | 1,356 | 1,616 | ||||||
Deferred income tax liabilities | 3 | 3 | ||||||
Other liabilities | 67 | 70 | ||||||
Total liabilities | 2,490 | 2,804 | ||||||
Commitments and contingencies | ||||||||
Equity: | ||||||||
Resolute Forest Products Inc. shareholders’ equity: | ||||||||
Common stock, $0.001 par value. 117.3 shares issued and 89.3 shares outstanding as of September 30, 2015; 117.3 shares issued and 94.8 shares outstanding as of December 31, 2014 | — | — | ||||||
Additional paid-in capital | 3,764 | 3,754 | ||||||
Deficit | (912 | ) | (869 | ) | ||||
Accumulated other comprehensive loss | (686 | ) | (718 | ) | ||||
Treasury stock at cost, 28.0 shares and 22.5 shares as of September 30, 2015 and December 31, 2014, respectively | (120 | ) | (61 | ) | ||||
Total Resolute Forest Products Inc. shareholders’ equity | 2,046 | 2,106 | ||||||
Noncontrolling interests | 12 | 11 | ||||||
Total equity | 2,058 | 2,117 | ||||||
Total liabilities and equity | $ | 4,548 | $ | 4,921 | ||||
See accompanying notes to unaudited interim consolidated financial statements.
3
RESOLUTE FOREST PRODUCTS INC.
CONSOLIDATED STATEMENTS OF CHANGES IN EQUITY
(Unaudited, in millions)
Nine Months Ended September 30, 2015 | ||||||||||||||||||||||||||||
Resolute Forest Products Inc. Shareholders’ Equity | ||||||||||||||||||||||||||||
Common Stock | Additional Paid-In Capital | Deficit | Accumulated Other Comprehensive Loss | Treasury Stock | Non-controlling Interests | Total Equity | ||||||||||||||||||||||
Balance as of December 31, 2014 | $ | — | $ | 3,754 | $ | (869 | ) | $ | (718 | ) | $ | (61 | ) | $ | 11 | $ | 2,117 | |||||||||||
Share-based compensation costs for equity-classified awards | — | 10 | — | — | — | — | 10 | |||||||||||||||||||||
Net (loss) income | — | — | (43 | ) | — | — | 1 | (42 | ) | |||||||||||||||||||
Purchases of treasury stock (5.5 shares) (Note 11) | — | — | — | — | (59 | ) | — | (59 | ) | |||||||||||||||||||
Other comprehensive income, net of tax | — | — | — | 32 | — | — | 32 | |||||||||||||||||||||
Balance as of September 30, 2015 | $ | — | $ | 3,764 | $ | (912 | ) | $ | (686 | ) | $ | (120 | ) | $ | 12 | $ | 2,058 | |||||||||||
Nine Months Ended September 30, 2014 | ||||||||||||||||||||||||||||
Resolute Forest Products Inc. Shareholders’ Equity | ||||||||||||||||||||||||||||
Common Stock | Additional Paid-In Capital | Deficit | Accumulated Other Comprehensive Loss | Treasury Stock | Non- controlling Interests | Total Equity | ||||||||||||||||||||||
Balance as of December 31, 2013 | $ | — | $ | 3,751 | $ | (592 | ) | $ | (271 | ) | $ | (61 | ) | $ | 12 | $ | 2,839 | |||||||||||
Share-based compensation costs for equity-classified awards | — | 3 | — | — | — | — | 3 | |||||||||||||||||||||
Net (loss) income | — | — | (168 | ) | — | — | 2 | (166 | ) | |||||||||||||||||||
Stock options exercised and stock unit awards vested (0.1 shares), net of shares forfeited for employee withholding taxes | — | — | — | — | — | — | — | |||||||||||||||||||||
Other comprehensive income, net of tax | — | — | — | 18 | — | — | 18 | |||||||||||||||||||||
Balance as of September 30, 2014 | $ | — | $ | 3,754 | $ | (760 | ) | $ | (253 | ) | $ | (61 | ) | $ | 14 | $ | 2,694 | |||||||||||
See accompanying notes to unaudited interim consolidated financial statements.
4
RESOLUTE FOREST PRODUCTS INC.
CONSOLIDATED STATEMENTS OF CASH FLOWS
(Unaudited, in millions)
Nine Months Ended September 30, | ||||||||
2015 | 2014 | |||||||
Cash flows from operating activities: | ||||||||
Net loss including noncontrolling interests | $ | (42 | ) | $ | (166 | ) | ||
Adjustments to reconcile net loss including noncontrolling interests to net cash provided by operating activities: | ||||||||
Share-based compensation | 10 | 3 | ||||||
Depreciation and amortization | 176 | 184 | ||||||
Closure costs, impairment and other related charges | 2 | 139 | ||||||
Inventory write-downs related to closures | 1 | 10 | ||||||
Deferred income taxes | 26 | (9 | ) | |||||
Net pension contributions and other postretirement benefit payments | (66 | ) | (128 | ) | ||||
Net gain on disposition of assets | — | (2 | ) | |||||
Loss on translation of foreign currency denominated deferred income taxes | 160 | 63 | ||||||
Gain on translation of foreign currency denominated pension and other postretirement benefit obligations | (148 | ) | (51 | ) | ||||
Net planned major maintenance payments | (12 | ) | (1 | ) | ||||
Write-down of equity method investment | — | 50 | ||||||
Dividends received from equity method investees in excess of income | — | 2 | ||||||
Changes in working capital: | ||||||||
Accounts receivable | 24 | 35 | ||||||
Inventories | 4 | (44 | ) | |||||
Other current assets | (7 | ) | (10 | ) | ||||
Accounts payable and accrued liabilities | (45 | ) | — | |||||
Other, net | 7 | 5 | ||||||
Net cash provided by operating activities | 90 | 80 | ||||||
Cash flows from investing activities: | ||||||||
Cash invested in fixed assets | (123 | ) | (142 | ) | ||||
Disposition of assets | — | 6 | ||||||
Decrease in restricted cash | — | 1 | ||||||
(Increase) decrease in deposit requirements for letters of credit, net | (5 | ) | 2 | |||||
Net cash used in investing activities | (128 | ) | (133 | ) | ||||
Cash flows from financing activities: | ||||||||
Payments of debt | — | (1 | ) | |||||
Payments of financing and credit facility fees | (3 | ) | (1 | ) | ||||
Purchases of treasury stock | (59 | ) | — | |||||
Net cash used in financing activities | (62 | ) | (2 | ) | ||||
Effect of exchange rate changes on cash and cash equivalents | (2 | ) | (2 | ) | ||||
Net decrease in cash and cash equivalents | (102 | ) | (57 | ) | ||||
Cash and cash equivalents: | ||||||||
Beginning of period | 337 | 322 | ||||||
End of period | $ | 235 | $ | 265 | ||||
See accompanying notes to unaudited interim consolidated financial statements.
5
RESOLUTE FOREST PRODUCTS INC.
Notes to Unaudited Interim Consolidated Financial Statements
Note 1. Organization and Basis of Presentation
Nature of operations
Resolute Forest Products Inc. (with its subsidiaries and affiliates, either individually or collectively, unless otherwise indicated, referred to as “Resolute Forest Products,” “we,” “our,” “us,” “Parent” or the “Company”) is incorporated in Delaware. We are a global leader in the forest products industry, with a diverse range of products, including newsprint, specialty papers, market pulp and wood products, which are marketed in close to 80 countries. We own or operate some 40 pulp and paper mills and wood products facilities in the United States, Canada and South Korea, and power generation assets in Canada.
Financial statements
Our interim consolidated financial statements are unaudited and have been prepared in accordance with the requirements of the United States Securities and Exchange Commission (the “SEC”) for interim reporting. Under those rules, certain footnotes and other financial information that are normally required by United States generally accepted accounting principles may be condensed or omitted. In our opinion, all adjustments (consisting of normal recurring adjustments) necessary for the fair statement of the unaudited interim consolidated financial statements have been made. All amounts are expressed in U.S. dollars, unless otherwise indicated. The results for the interim period ended September 30, 2015, are not necessarily indicative of the results to be expected for the full year. These unaudited interim consolidated financial statements should be read in conjunction with our Annual Report on Form 10-K for the year ended December 31, 2014, filed with the SEC on March 2, 2015.
New accounting pronouncements
In February 2015, the Financial Accounting Standards Board (“FASB”) issued Accounting Standards Update (“ASU”) 2015-02, “Amendments to the Consolidation Analysis,” which affects the variable interest entity and voting entity consolidation models for all companies. This update is effective for financial statements issued for fiscal years beginning after December 15, 2015. The adoption of this accounting guidance will not materially impact our financial position.
In April 2015, the FASB issued ASU 2015-03, “Simplifying the Presentation of Debt Issuance Costs,” which requires debt issuance costs to be presented in the balance sheet as a direct deduction from the carrying value of the associated debt liability, consistent with the presentation of a debt discount. This update is effective for financial statements issued for fiscal years beginning after December 15, 2015. The adoption of this accounting guidance will not materially impact our financial position.
In April 2015, the FASB issued ASU 2015-05, “Customer’s Accounting for Fees Paid in a Cloud Computing Arrangement,” which provides guidance to customers about whether a cloud computing arrangement includes a software license. If a cloud computing arrangement includes a software license, then the customer should account for the software license element of the arrangement consistent with the acquisition of other software licenses. If a cloud computing arrangement does not include a software license, the customer should account for the arrangement as a service contract. This update is effective for financial statements issued for fiscal years beginning after December 15, 2015, with early adoption permitted as of the beginning of an interim or annual reporting period. The adoption of this accounting guidance will not materially impact our financial position.
In May 2015, the FASB issued ASU 2015-07, “Disclosures for Investments in Certain Entities That Calculate Net Asset Value per Share (or Its Equivalent),” which eliminates the requirement to categorize investments in the fair value hierarchy if the fair value is measured at net asset value per share, or its equivalent, using the practical expedient in FASB Accounting Standards Codification 820, “Fair Value Measurements and Disclosures.” This update is effective for financial statements issued for fiscal years beginning after December 15, 2015. The adoption of this accounting guidance will modify the fair value hierarchy presentation of our pension plan assets in our consolidated financial statements.
In July 2015, the FASB approved a one-year deferral of ASU 2014-09, “Revenue from Contracts with Customers,” deferring the effective date to fiscal years beginning after December 15, 2017. Early adoption is permitted for financial statements issued for fiscal years beginning after December 15, 2016.
In July 2015, the FASB issued ASU 2015-11, “Simplifying the Measurement of Inventory,” which requires that inventory within the scope of this update, including inventory stated at average cost, be measured at the lower of cost and net realizable value. This update is effective for financial statements issued for fiscal years beginning after December 15, 2016, with early adoption permitted as of the beginning of an interim or annual reporting period. The adoption of this accounting guidance will not materially impact our financial position.
6
RESOLUTE FOREST PRODUCTS INC.
Notes to Unaudited Interim Consolidated Financial Statements
Note 2. Closure Costs, Impairment and Other Related Charges
Closure costs, impairment and other related charges for the three and nine months ended September 30, 2015, were comprised of the following:
(Unaudited, in millions) | Impairment of Assets | Accelerated Depreciation | Severance and Other Costs | Total | ||||||||||||
Permanent closures: | ||||||||||||||||
Paper mill in Iroquois Falls, Ontario | ||||||||||||||||
Third quarter | $ | 1 | $ | 1 | $ | (1 | ) | $ | 1 | |||||||
First nine months | 1 | 1 | 4 | 6 | ||||||||||||
Paper machine in Clermont, Québec | ||||||||||||||||
Third quarter | — | — | — | — | ||||||||||||
First nine months | — | 2 | — | 2 | ||||||||||||
Other | ||||||||||||||||
Third quarter | — | — | 1 | 1 | ||||||||||||
First nine months | — | — | — | — | ||||||||||||
Total | ||||||||||||||||
Third quarter | $ | 1 | $ | 1 | $ | — | $ | 2 | ||||||||
First nine months | 1 | 3 | 4 | 8 | ||||||||||||
Closure costs, impairment and other related charges for the three and nine months ended September 30, 2014, were comprised of the following:
(Unaudited, in millions) | Impairment of Assets | Accelerated Depreciation | Severance and Other Costs | Total | ||||||||||||
Permanent closures: | ||||||||||||||||
Laurentide, Québec paper mill | ||||||||||||||||
Third quarter | $ | — | $ | 65 | $ | 16 | $ | 81 | ||||||||
First nine months | — | 65 | 16 | 81 | ||||||||||||
Paper machine in Catawba, South Carolina | ||||||||||||||||
Third quarter | — | — | — | — | ||||||||||||
First nine months | — | 45 | 1 | 46 | ||||||||||||
Pulp and paper mill in Fort Frances, Ontario | ||||||||||||||||
Third quarter | — | — | — | — | ||||||||||||
First nine months | — | — | 8 | 8 | ||||||||||||
Paper machine in Iroquois Falls | ||||||||||||||||
Third quarter | — | — | — | — | ||||||||||||
First nine months | — | 3 | — | 3 | ||||||||||||
Other | ||||||||||||||||
Third quarter | 3 | — | 1 | 4 | ||||||||||||
First nine months | 9 | — | — | 9 | ||||||||||||
Total | ||||||||||||||||
Third quarter | $ | 3 | $ | 65 | $ | 17 | $ | 85 | ||||||||
First nine months | 9 | 113 | 25 | 147 | ||||||||||||
7
RESOLUTE FOREST PRODUCTS INC.
Notes to Unaudited Interim Consolidated Financial Statements
Note 3. Other (Expense) Income, Net
Other (expense) income, net for the three and nine months ended September 30, 2015 and 2014, was comprised of the following:
Three Months Ended September 30, | Nine Months Ended September 30, | ||||||||||||||||
(Unaudited, in millions) | 2015 | 2014 | 2015 | 2014 | |||||||||||||
Foreign exchange loss | $ | (5 | ) | $ | (17 | ) | $ | (2 | ) | $ | (14 | ) | |||||
Write-down of equity method investment (1) | — | (50 | ) | — | (50 | ) | |||||||||||
Miscellaneous income | 4 | 2 | 7 | 6 | |||||||||||||
$ | (1 | ) | $ | (65 | ) | $ | 5 | $ | (58 | ) | |||||||
(1) | As a result of the continued deterioration of actual and projected cash flows in Ponderay Newsprint Company, a partnership in which we have a 40% interest, we recorded an other-than-temporary write-down of $50 million during the three months ended September 30, 2014. The carrying value of the investment was reduced to fair value, which was determined using the discounted cash flow method. |
8
RESOLUTE FOREST PRODUCTS INC.
Notes to Unaudited Interim Consolidated Financial Statements
Note 4. Accumulated Other Comprehensive Loss
The change in our accumulated other comprehensive loss by component (net of tax) for the nine months ended September 30, 2015, was as follows:
(Unaudited, in millions) | Unamortized Prior Service Credits | Unamortized Actuarial Losses | Foreign Currency Translation | Total | ||||||||||||
Balance as of December 31, 2014 | $ | 94 | $ | (812 | ) | $ | — | $ | (718 | ) | ||||||
Other comprehensive loss before reclassifications | — | — | (3 | ) | (3 | ) | ||||||||||
Amounts reclassified from accumulated other comprehensive loss (1) | (12 | ) | 47 | — | 35 | |||||||||||
Net current period other comprehensive (loss) income | (12 | ) | 47 | (3 | ) | 32 | ||||||||||
Balance as of September 30, 2015 | $ | 82 | $ | (765 | ) | $ | (3 | ) | $ | (686 | ) | |||||
(1) | See the table below for details about these reclassifications. |
The reclassifications out of accumulated other comprehensive loss for the nine months ended September 30, 2015, were comprised of the following:
(Unaudited, in millions) | Amounts Reclassified From Accumulated Other Comprehensive Loss | Affected Line in the Consolidated Statements of Operations | |||
Unamortized Prior Service Credits | |||||
Amortization of prior service credits | $ | (12 | ) | Cost of sales, excluding depreciation, amortization and distribution costs (1) | |
— | Income tax (provision) benefit | ||||
$ | (12 | ) | Net of tax | ||
Unamortized Actuarial Losses | |||||
Amortization of actuarial losses | $ | 60 | Cost of sales, excluding depreciation, amortization and distribution costs (1) | ||
(13 | ) | Income tax (provision) benefit | |||
$ | 47 | Net of tax | |||
Total Reclassifications | $ | 35 | Net of tax | ||
(1) | These items are included in the computation of net periodic benefit cost related to our pension and other postretirement benefit (“OPEB”) plans summarized in Note 8, “Employee Benefit Plans.” |
Note 5. Net Loss Per Share
The weighted-average number of stock options and equity-classified restricted stock units, deferred stock units and performance stock units (collectively, “stock unit awards”) outstanding for the three and nine months ended September 30, 2015 and 2014, was as follows:
Three Months Ended September 30, | Nine Months Ended September 30, | ||||||||||||
(Unaudited, in millions) | 2015 | 2014 | 2015 | 2014 | |||||||||
Stock options | 1.5 | 1.8 | 1.6 | 1.8 | |||||||||
Stock unit awards | 1.2 | 1.0 | 1.2 | 1.0 | |||||||||
These stock options and stock unit awards were excluded from the calculation of diluted net loss per share as the impact would have been antidilutive for all periods presented.
9
RESOLUTE FOREST PRODUCTS INC.
Notes to Unaudited Interim Consolidated Financial Statements
Note 6. Inventories, Net
Inventories, net as of September 30, 2015 and December 31, 2014, were comprised of the following:
(Unaudited, in millions) | September 30, 2015 | December 31, 2014 | ||||||
Raw materials and work in process | $ | 147 | $ | 160 | ||||
Finished goods | 185 | 192 | ||||||
Mill stores and other supplies | 203 | 190 | ||||||
$ | 535 | $ | 542 | |||||
Note 7. Long-Term Debt
Overview
Long-term debt, including current portion, as of September 30, 2015 and December 31, 2014, was comprised of the following:
(Unaudited, in millions) | September 30, 2015 | December 31, 2014 | ||||||
5.875% senior notes due 2023: | ||||||||
Principal amount | $ | 600 | $ | 600 | ||||
Unamortized discount | (5 | ) | (5 | ) | ||||
Total senior notes due 2023 | 595 | 595 | ||||||
Capital lease obligation | 2 | 2 | ||||||
Total debt | 597 | 597 | ||||||
Less: Current portion of long-term debt | (1 | ) | (1 | ) | ||||
Long-term debt, net of current portion | $ | 596 | $ | 596 | ||||
5.875% senior notes due 2023
We issued $600 million in aggregate principal amount of 5.875% senior notes due 2023 (the “2023 Notes”) on May 8, 2013. Interest on the notes is payable semi-annually on May 15 and November 15, until their maturity date of May 15, 2023. The fair value of the 2023 Notes was $459 million and $571 million as of September 30, 2015 and December 31, 2014, respectively, and was determined by reference to over-the-counter prices (Level 1).
ABL Credit Facility
On May 22, 2015, we entered into a new five-year credit agreement for a senior secured asset-based revolving credit facility (the “ABL Credit Facility”), with an aggregate lender commitment of up to $600 million at any time outstanding, subject to borrowing base availability based on specified advance rates, eligibility criteria and customary reserves. This facility replaces our previous $665 million senior secured asset-based revolving credit facility, originally dated as of December 9, 2010. The ABL Credit Facility will mature on May 22, 2020.
The aggregate lender commitment under the facility includes a $60 million swingline sub-facility and a $200 million letter of credit sub-facility, and we may convert up to $50 million of the commitments under the facility to a first-in last-out facility (“FILO Facility”), subject to the consent of each converting lender. The ABL Credit Facility also provides for an uncommitted ability to increase the revolving credit facility by up to $500 million, subject to certain terms and conditions set forth in the agreement.
Revolving loan (and letter of credit) availability under the credit agreement is subject to a borrowing base, which at any time is equal to the sum of (i) 85% of eligible accounts receivable (or 90% with respect to certain insured or letter of credit backed accounts or with accounts owed by investment grade obligors), plus (ii) the lesser of (A) 70% of the lesser of the cost or market value of eligible inventory or (B) 85% of the net orderly liquidation value of eligible inventory, plus (iii) 100% of the value of eligible cash and 95% of the value of permitted investments held in deposit accounts controlled solely by the administrative and collateral agent (the “agent”). The FILO Facility will be subject to a borrowing base, which at any time will be equal to (i) 5% of the eligible accounts receivable, plus (ii) 10% of the appraised net orderly value of the eligible inventory (subject to
10
RESOLUTE FOREST PRODUCTS INC.
Notes to Unaudited Interim Consolidated Financial Statements
reduction to 5% over the term of the facility). Each borrowing base described above is subject to customary reserves and eligibility criteria, in the exercise of the agent’s reasonable discretion.
The obligations under the credit agreement are guaranteed by certain material subsidiaries of the Company and are secured by first priority liens on and security interests in accounts receivable, inventory and related assets.
Borrowings under the credit agreement bear interest at a rate equal to the base rate, the London Interbank Offered Rate (“LIBOR”), or the Canadian banker’s acceptance (“BA”) rate, in each case plus an applicable margin. The applicable margin is between 0.00% and 0.75% with respect to base rate borrowings and between 1.00% and 1.75% with respect to LIBOR and Canadian BA borrowings, in each case based on availability under the credit facility and a leverage ratio.
Loans outstanding under the FILO Facility bear interest at a rate that is 1.25% per annum higher than the interest rate payable on revolving loans not made under the FILO Facility.
In addition to paying interest on outstanding principal under the credit agreement, we are required to pay fees of up to 0.30% in respect of unutilized commitments, as well as a fee in respect of outstanding letters of credit (equal to the applicable margin in respect of LIBOR and Canadian BA borrowings plus a fronting fee of 0.125% and certain administrative fees).
The Company is able to voluntarily repay outstanding loans and reduce unused commitments, in each case, in whole or in part, at any time without premium or penalty. However, no loans under the FILO Facility can be repaid unless all other loans under the credit agreement are repaid first. We are required to repay outstanding loans that exceed the maximum availability then in effect.
The credit agreement contains customary covenants for asset-based credit agreements of this type, including, among other things: (i) requirements to deliver financial statements, other reports and notices; (ii) restrictions on the existence or incurrence and repayment of indebtedness by the Company and its subsidiaries; (iii) restrictions on the existence or incurrence of liens by the Company and its subsidiaries; (iv) restrictions on the Company and certain of its subsidiaries making certain restricted payments; (v) restrictions on the Company and certain of its subsidiaries making certain investments; (vi) restrictions on certain mergers, consolidations and asset dispositions; (vii) restrictions on transactions with affiliates; (viii) restrictions on amendments or modifications to the Canadian pension and benefit plans; (ix) restrictions on modifications to material indebtedness; and (x) a springing requirement for the Company to maintain a minimum consolidated fixed charge coverage ratio, as determined under the credit agreement, of 1.0:1.0, anytime availability under the facility falls below the greater of $50 million or 10% of the maximum available borrowing amount for two consecutive business days. Subject to customary grace periods and notice requirements, the credit agreement also contains certain customary events of default.
As of September 30, 2015, we had $448 million of availability under the ABL Credit Facility, which was undrawn except for $34 million of ordinary course letters of credit.
Capital lease obligation
We have a capital lease obligation for a warehouse, which can be renewed for 20 years at our option. Minimum payments are determined by an escalatory price clause.
11
RESOLUTE FOREST PRODUCTS INC.
Notes to Unaudited Interim Consolidated Financial Statements
Note 8. Employee Benefit Plans
Pension and OPEB plans
The components of net periodic benefit cost relating to our pension and OPEB plans for the three and nine months ended September 30, 2015 and 2014, were as follows:
Pension Plans:
Three Months Ended September 30, | Nine Months Ended September 30, | ||||||||||||||||
(Unaudited, in millions) | 2015 | 2014 | 2015 | 2014 | |||||||||||||
Service cost | $ | 5 | $ | 6 | $ | 17 | $ | 20 | |||||||||
Interest cost | 56 | 69 | 172 | 207 | |||||||||||||
Expected return on plan assets | (64 | ) | (76 | ) | (198 | ) | (227 | ) | |||||||||
Amortization of actuarial losses | 21 | 3 | 63 | 6 | |||||||||||||
Amortization of prior service credits | — | — | (1 | ) | (1 | ) | |||||||||||
$ | 18 | $ | 2 | $ | 53 | $ | 5 | ||||||||||
OPEB Plans:
Three Months Ended September 30, | Nine Months Ended September 30, | ||||||||||||||||
(Unaudited, in millions) | 2015 | 2014 | 2015 | 2014 | |||||||||||||
Service cost | $ | 1 | $ | — | $ | 1 | $ | 1 | |||||||||
Interest cost | 1 | 3 | 5 | 9 | |||||||||||||
Amortization of actuarial gains | (1 | ) | (1 | ) | (3 | ) | (3 | ) | |||||||||
Amortization of prior service credits | (4 | ) | (4 | ) | (11 | ) | (8 | ) | |||||||||
$ | (3 | ) | $ | (2 | ) | $ | (8 | ) | $ | (1 | ) | ||||||
Defined contribution plans
Our expense for the defined contribution plans totaled $5 million and $6 million for the three months ended September 30, 2015 and 2014, respectively, and $15 million and $17 million for the nine months ended September 30, 2015 and 2014, respectively.
12
RESOLUTE FOREST PRODUCTS INC.
Notes to Unaudited Interim Consolidated Financial Statements
Note 9. Income Taxes
The income tax (provision) benefit attributable to loss before income taxes differs from the amounts computed by applying the United States federal statutory income tax rate of 35% for the three and nine months ended September 30, 2015 and 2014, as a result of the following:
Three Months Ended September 30, | Nine Months Ended September 30, | ||||||||||||||||
(Unaudited, in millions) | 2015 | 2014 | 2015 | 2014 | |||||||||||||
Loss before income taxes | $ | (4 | ) | $ | (117 | ) | $ | (20 | ) | $ | (174 | ) | |||||
Income tax (provision) benefit: | |||||||||||||||||
Expected income tax benefit | 1 | 41 | 7 | 61 | |||||||||||||
Changes resulting from: | |||||||||||||||||
Valuation allowance (1) | (16 | ) | (23 | ) | (43 | ) | (43 | ) | |||||||||
Foreign exchange | (8 | ) | (7 | ) | (15 | ) | (9 | ) | |||||||||
State income taxes and foreign tax rate differences | 4 | (5 | ) | 9 | 6 | ||||||||||||
Effect of change in tax rates (2) | 18 | 2 | 18 | 2 | |||||||||||||
Other, net | (1 | ) | (7 | ) | 2 | (9 | ) | ||||||||||
$ | (2 | ) | $ | 1 | $ | (22 | ) | $ | 8 | ||||||||
(1) | We recorded a net increase in our valuation allowance of $16 million and $23 million for the three months ended September 30, 2015 and 2014, respectively, and $43 million for both the nine months ended September 30, 2015 and 2014, primarily related to our U.S. operations where we recognize a full valuation allowance against our net deferred income tax assets. |
(2) | During the three months ended September 30, 2015, we recorded an income tax benefit of $18 million as a result of a change in tax rates on deferred income taxes, primarily due to an intercompany asset transfer in connection with an operating company realignment. |
Deferred tax charge
As a result of a gain on an intercompany asset transfer in connection with an operating company realignment, a $38 million income tax provision was deferred and recorded in “Other assets” in our Consolidated Balance Sheet as of September 30, 2015. This deferred tax charge will be amortized, as the underlying assets are consumed or sold to an unrelated party, in “Income tax provision” in our Consolidated Statements of Operations.
Note 10. Commitments and Contingencies
Legal matters
We become involved in various legal proceedings and other disputes in the normal course of business, including matters related to contracts, commercial disputes, taxes, environmental issues, activists’ damages, employment and workers’ compensation claims, Aboriginal claims and other matters. Although the final outcome is subject to many variables and cannot be predicted with any degree of certainty, we regularly assess the status of the matters and establish provisions (including legal costs expected to be incurred) when we believe an adverse outcome is probable, and the amount can be reasonably estimated. Except as described below and for claims that cannot be assessed due to their preliminary nature, we believe that the ultimate disposition of these matters outstanding or pending as of September 30, 2015, will not have a material adverse effect on our consolidated financial statements.
On February 26, 2015, a countervailing duty petition was filed with the U.S. Department of Commerce (“Commerce”) and the U.S. International Trade Commission (“USITC”) by certain U.S. supercalendered (“SC”) paper producers requesting the U.S. government to impose countervailing duties on Canadian-origin SC paper exported to the U.S. market. One of our subsidiaries was identified in the petition as being a Canadian exporting producer of SC paper to the U.S. and was selected as a mandatory respondent to be individually investigated by Commerce. On August 3, 2015, Commerce assigned a preliminary subsidy rate of 2.04% to our SC paper produced at our Canadian mills. On October 15, 2015, Commerce issued a final determination and increased the subsidy rate applicable to our Canadian-produced SC paper to 17.87%. Since October 20, 2015, we have been required to make cash deposits at the 17.87% subsidy rate for estimated and projected countervailing duties on SC papers we import to the U.S. from our Canadian mills. If the USITC rules that exports from Canada to the U.S. have caused or threatened
13
RESOLUTE FOREST PRODUCTS INC.
Notes to Unaudited Interim Consolidated Financial Statements
to cause material injury to the U.S. SC paper industry, we will be required to continue making cash deposits at the 17.87% subsidy rate until Commerce sets a countervailing duty rate in an administrative review, which may not be finalized until December of 2017, or possibly later. Based on our current operating parameters, the cash deposits could be as high as $25 million per year. To the extent the countervailing duty rate set by Commerce is lower than 17.87%, we will recover excess deposits, plus interest. If the countervailing duty rate set by Commerce is at or above 17.87%, the deposits and any deficiency will be converted into actual countervailing duties. We are not presently able to determine the ultimate resolution of this matter, but we believe it is not probable that we will be assessed with significant countervailing duties. Accordingly, no contingent loss was recorded in respect of this petition in our Consolidated Statement of Operations for the nine months ended September 30, 2015.
Effective July 31, 2012, we completed the final step of the transaction pursuant to which we acquired the remaining 25.4% of the outstanding Fibrek Inc. (“Fibrek”) shares, following the approval of Fibrek’s shareholders on July 23, 2012, and the issuance of a final order of the Québec Superior Court in Canada approving the arrangement on July 27, 2012. Certain former shareholders of Fibrek exercised (or purported to exercise) rights of dissent in respect of the transaction, asking for a judicial determination of the fair value of their claim under the Canada Business Corporations Act. No consideration has to date been paid to the former Fibrek shareholders who exercised (or purported to exercise) rights of dissent. Any such consideration will only be paid out upon settlement or judicial determination of the fair value of their claims and will be paid entirely in cash. Accordingly, we cannot presently determine the amount that ultimately will be paid to former holders of Fibrek shares in connection with the proceedings, but we have accrued approximately Cdn $14 million ($11 million, based on the exchange rate in effect on September 30, 2015) for the eventual payment of those claims.
On June 12, 2012, we filed a motion for directives with the Québec Superior Court in Canada, the court with jurisdiction in the creditor protection proceedings under the Companies’ Creditors Arrangement Act (Canada), from which our predecessor entity and all but one of its affiliates emerged in 2010, seeking an order to prevent pension regulators in each of Québec, New Brunswick, and Newfoundland and Labrador from declaring partial wind-ups of pension plans relating to employees of former operations in New Brunswick, and Newfoundland and Labrador, or a declaration that any claim for accelerated reimbursements of deficits arising from a partial wind-up is a barred claim under the creditor protection proceedings. These plans are subject to the funding relief regulations described in Note 14, “Pension and Other Postretirement Benefit Plans - Canadian pension funding,” to our consolidated financial statements for the year ended December 31, 2014 and we contend, among other things, that any such declaration, if issued, would be inconsistent with the Québec Superior Court in Canada’s sanction order confirming the plan of reorganization and the terms of our emergence from the creditor protection proceedings. A partial wind-up would likely shorten the period in which any deficit within those plans, which could reach up to Cdn $150 million ($113 million, based on the exchange rate in effect on September 30, 2015), would have to be funded if we do not obtain the relief sought. No hearing date has been set to date.
Environmental matters
We are subject to a variety of federal, state, provincial and local environmental laws and regulations in the jurisdictions in which we operate. We believe our operations are in material compliance with current applicable environmental laws and regulations. Environmental regulations promulgated in the future could require substantial additional expenditures for compliance and could have a material impact on us, in particular, and the industry in general.
We may be a “potentially responsible party” with respect to four hazardous waste sites that are being addressed pursuant to the Comprehensive Environmental Response, Compensation and Liability Act of 1980 (commonly known as Superfund) or the Resource Conservation and Recovery Act corrective action authority. We believe we will not be liable for any significant amounts at any of these sites.
We have recorded $13 million and $18 million of environmental liabilities as of September 30, 2015 and December 31, 2014, respectively, primarily related to environmental remediation related to closed sites. The amount of these liabilities represents management’s estimate of the ultimate settlement based on an assessment of relevant factors and assumptions and could be affected by changes in facts or assumptions not currently known to management for which the outcome cannot be reasonably estimated at this time. These liabilities are included in “Accounts payable and accrued liabilities” or “Other liabilities” in our Consolidated Balance Sheets.
We have also recorded $24 million and $22 million of asset retirement obligations as of September 30, 2015 and December 31, 2014, respectively, primarily consisting of liabilities associated with landfills, sludge basins and the dismantling of retired assets. These liabilities are included in “Accounts payable and accrued liabilities” or “Other liabilities” in our Consolidated Balance Sheets.
14
RESOLUTE FOREST PRODUCTS INC.
Notes to Unaudited Interim Consolidated Financial Statements
Other matters
On October 30, 2014, we received a notice from the Ministry of Natural Resources and Forestry of Ontario (the “MNRF”) directing us to repay a conditional incentive of Cdn $23 million ($17 million, based on the exchange rate in effect on September 30, 2015) offered in 2007 toward the construction of an electricity-producing turbine, should we fail to restart our Fort Frances pulp and paper mill or otherwise implement an alternative remedy that is acceptable to the MNRF. Several extensions to implement an alternative remedy have been granted to us by the MNRF, with the latest remedy date being November 30, 2015. We announced the permanent closure of the mill in the second quarter of 2014 and have been exploring a number of opportunities for the mill. We are not presently able to determine the outcome of this process, but we currently believe that we could reach an acceptable outcome for the MNRF within the time limit prescribed. Accordingly, we have recorded no contingent liability in respect of this notice in our Consolidated Balance Sheet as of September 30, 2015.
Note 11. Share Capital
On May 28, 2015, our board of directors authorized a $50 million increase to our existing $100 million share repurchase program, which was originally launched in May of 2012. As of December 31, 2014, we had repurchased 5.6 million shares, at a cost of $67 million. During the three and nine months ended September 30, 2015, we repurchased 2.3 million and 5.5 million shares, respectively, at a cost of $22 million and $59 million, respectively. There remains $24 million under the program.
15
RESOLUTE FOREST PRODUCTS INC.
Notes to Unaudited Interim Consolidated Financial Statements
Note 12. Segment Information
We manage our business based on the products we manufacture. Accordingly, our reportable segments correspond to our principal product lines: newsprint, specialty papers, market pulp and wood products.
None of the income or loss items following “Operating income (loss)” in our Consolidated Statements of Operations are allocated to our segments, since those items are reviewed separately by management. For the same reason, closure costs, impairment and other related charges, inventory write-downs related to closures, start-up costs, net gain on disposition of assets, certain components of pension and OPEB costs and credits as well as other discretionary charges or credits are not allocated to our segments. We allocate depreciation and amortization expense to our segments, although the related fixed assets and amortizable intangible assets are not allocated to segment assets. Additionally, all selling, general and administrative expenses, excluding certain discretionary charges and credits, are allocated to our segments.
In 2015, we changed our presentation of segment operating income to reallocate certain components of pension and OPEB costs, which consist of interest cost, expected return on plan assets and amortization of actuarial losses and gains, from the reportable segments to “corporate and other” in the segment presentation of operating income. Current service costs and amortization of prior service credits will continue to be allocated to the reportable segments. This approach is consistent with the indicators management uses internally to evaluate performance, including those used by the chief operating decision maker. Prior period amounts have been reclassified to conform to the 2015 presentation.
Information about certain segment data for the three and nine months ended September 30, 2015 and 2014, was as follows:
(Unaudited, in millions) | Newsprint | Specialty Papers | Market Pulp (1) | Wood Products | Segment Total | Corporate and Other | Total | |||||||||||||||||||||
Sales | ||||||||||||||||||||||||||||
Third quarter 2015 | $ | 258 | $ | 286 | $ | 230 | $ | 131 | $ | 905 | $ | — | $ | 905 | ||||||||||||||
Third quarter 2014 | 346 | 329 | 255 | 166 | 1,096 | — | 1,096 | |||||||||||||||||||||
First nine months 2015 | 838 | 830 | 679 | 404 | 2,751 | — | 2,751 | |||||||||||||||||||||
First nine months 2014 | 1,056 | 955 | 730 | 462 | 3,203 | — | 3,203 | |||||||||||||||||||||
Depreciation and amortization | ||||||||||||||||||||||||||||
Third quarter 2015 | $ | 16 | $ | 18 | $ | 14 | $ | 9 | $ | 57 | $ | 2 | $ | 59 | ||||||||||||||
Third quarter 2014 | 17 | 20 | 13 | 8 | 58 | 2 | 60 | |||||||||||||||||||||
First nine months 2015 | 48 | 54 | 40 | 26 | 168 | 8 | 176 | |||||||||||||||||||||
First nine months 2014 | 52 | 64 | 39 | 24 | 179 | 5 | 184 | |||||||||||||||||||||
Operating (loss) income | ||||||||||||||||||||||||||||
Third quarter 2015 | $ | (10 | ) | $ | 9 | $ | 22 | $ | 9 | $ | 30 | $ | (24 | ) | $ | 6 | ||||||||||||
Third quarter 2014 | 5 | 6 | 20 | 24 | 55 | (95 | ) | (40 | ) | |||||||||||||||||||
First nine months 2015 | (10 | ) | 31 | 59 | 10 | 90 | (83 | ) | 7 | |||||||||||||||||||
First nine months 2014 | 6 | (23 | ) | 51 | 51 | 85 | (166 | ) | (81 | ) | ||||||||||||||||||
(1) | Market pulp sales excluded inter-segment sales of $5 million for both the three months ended September 30, 2015 and 2014, and $13 million and $15 million for the nine months ended September 30, 2015 and 2014, respectively. |
16
RESOLUTE FOREST PRODUCTS INC.
Notes to Unaudited Interim Consolidated Financial Statements
Note 13. Condensed Consolidating Financial Information
The following information is presented in accordance with Rule 3-10 of Regulation S-X and the public information requirements of Rule 144 promulgated pursuant to the Securities Act of 1933 in connection with Resolute Forest Products Inc.’s 2023 Notes that are fully and unconditionally guaranteed, on a joint and several basis, by all of our 100% owned material U.S. subsidiaries (the “Guarantor Subsidiaries”). The 2023 Notes are not guaranteed by our foreign subsidiaries and our less than 100% owned U.S. subsidiaries (the “Non-guarantor Subsidiaries”).
The following condensed consolidating financial information sets forth the Statements of Operations and Comprehensive Income (Loss) for the three and nine months ended September 30, 2015 and 2014, the Balance Sheets as of September 30, 2015 and December 31, 2014, and the Statements of Cash Flows for the nine months ended September 30, 2015 and 2014 for the Parent, the Guarantor Subsidiaries on a combined basis, and the Non-guarantor Subsidiaries on a combined basis. The condensed consolidating financial information reflects the investments of the Parent in the Guarantor Subsidiaries and Non-guarantor Subsidiaries, as well as the investments of the Guarantor Subsidiaries in the Non-guarantor Subsidiaries, using the equity method of accounting. The principal consolidating adjustments are elimination entries to eliminate the investments in subsidiaries and intercompany balances and transactions.
CONDENSED CONSOLIDATING STATEMENT OF OPERATIONS AND COMPREHENSIVE INCOME (LOSS) | ||||||||||||||||||||
For the Three Months Ended September 30, 2015 | ||||||||||||||||||||
(Unaudited, in millions) | Parent | Guarantor Subsidiaries | Non-guarantor Subsidiaries | Consolidating Adjustments | Consolidated | |||||||||||||||
Sales | $ | — | $ | 748 | $ | 544 | $ | (387 | ) | $ | 905 | |||||||||
Costs and expenses: | ||||||||||||||||||||
Cost of sales, excluding depreciation, amortization and distribution costs | — | 696 | 381 | (390 | ) | 687 | ||||||||||||||
Depreciation and amortization | — | 23 | 36 | — | 59 | |||||||||||||||
Distribution costs | — | 43 | 74 | — | 117 | |||||||||||||||
Selling, general and administrative expenses | 3 | 12 | 19 | — | 34 | |||||||||||||||
Closure costs, impairment and other related charges | — | — | 2 | — | 2 | |||||||||||||||
Operating (loss) income | (3 | ) | (26 | ) | 32 | 3 | 6 | |||||||||||||
Interest expense | (19 | ) | — | (3 | ) | 13 | (9 | ) | ||||||||||||
Other (expense) income, net | (1 | ) | 11 | 2 | (13 | ) | (1 | ) | ||||||||||||
Equity in income of subsidiaries | 17 | 6 | — | (23 | ) | — | ||||||||||||||
(Loss) income before income taxes | (6 | ) | (9 | ) | 31 | (20 | ) | (4 | ) | |||||||||||
Income tax provision | — | — | (1 | ) | (1 | ) | (2 | ) | ||||||||||||
Net (loss) income including noncontrolling interests | (6 | ) | (9 | ) | 30 | (21 | ) | (6 | ) | |||||||||||
Net income attributable to noncontrolling interests | — | — | — | — | — | |||||||||||||||
Net (loss) income attributable to Resolute Forest Products Inc. | $ | (6 | ) | $ | (9 | ) | $ | 30 | $ | (21 | ) | $ | (6 | ) | ||||||
Comprehensive income (loss) attributable to Resolute Forest Products Inc. | $ | 5 | $ | (9 | ) | $ | 41 | $ | (32 | ) | $ | 5 | ||||||||
17
RESOLUTE FOREST PRODUCTS INC.
Notes to Unaudited Interim Consolidated Financial Statements
CONDENSED CONSOLIDATING STATEMENT OF OPERATIONS AND COMPREHENSIVE (LOSS) INCOME | ||||||||||||||||||||
For the Nine Months Ended September 30, 2015 | ||||||||||||||||||||
(Unaudited, in millions) | Parent | Guarantor Subsidiaries | Non-guarantor Subsidiaries | Consolidating Adjustments | Consolidated | |||||||||||||||
Sales | $ | — | $ | 2,246 | $ | 1,684 | $ | (1,179 | ) | $ | 2,751 | |||||||||
Costs and expenses: | ||||||||||||||||||||
Cost of sales, excluding depreciation, amortization and distribution costs | — | 2,076 | 1,202 | (1,181 | ) | 2,097 | ||||||||||||||
Depreciation and amortization | — | 69 | 107 | — | 176 | |||||||||||||||
Distribution costs | — | 125 | 223 | — | 348 | |||||||||||||||
Selling, general and administrative expenses | 9 | 38 | 68 | — | 115 | |||||||||||||||
Closure costs, impairment and other related charges | — | — | 8 | — | 8 | |||||||||||||||
Operating (loss) income | (9 | ) | (62 | ) | 76 | 2 | 7 | |||||||||||||
Interest expense | (55 | ) | (2 | ) | (7 | ) | 32 | (32 | ) | |||||||||||
Other (expense) income, net | (2 | ) | 32 | 7 | (32 | ) | 5 | |||||||||||||
Equity in income of subsidiaries | 23 | 6 | — | (29 | ) | — | ||||||||||||||
(Loss) income before income taxes | (43 | ) | (26 | ) | 76 | (27 | ) | (20 | ) | |||||||||||
Income tax benefit (provision) | — | 4 | (25 | ) | (1 | ) | (22 | ) | ||||||||||||
Net (loss) income including noncontrolling interests | (43 | ) | (22 | ) | 51 | (28 | ) | (42 | ) | |||||||||||
Net income attributable to noncontrolling interests | — | — | (1 | ) | — | (1 | ) | |||||||||||||
Net (loss) income attributable to Resolute Forest Products Inc. | $ | (43 | ) | $ | (22 | ) | $ | 50 | $ | (28 | ) | $ | (43 | ) | ||||||
Comprehensive (loss) income attributable to Resolute Forest Products Inc. | $ | (11 | ) | $ | (22 | ) | $ | 82 | $ | (60 | ) | $ | (11 | ) | ||||||
18
RESOLUTE FOREST PRODUCTS INC.
Notes to Unaudited Interim Consolidated Financial Statements
CONDENSED CONSOLIDATING STATEMENT OF OPERATIONS AND COMPREHENSIVE LOSS | ||||||||||||||||||||
For the Three Months Ended September 30, 2014 | ||||||||||||||||||||
(Unaudited, in millions) | Parent | Guarantor Subsidiaries | Non-guarantor Subsidiaries | Consolidating Adjustments | Consolidated | |||||||||||||||
Sales | $ | — | $ | 887 | $ | 707 | $ | (498 | ) | $ | 1,096 | |||||||||
Costs and expenses: | ||||||||||||||||||||
Cost of sales, excluding depreciation, amortization and distribution costs | — | 800 | 518 | (502 | ) | 816 | ||||||||||||||
Depreciation and amortization | — | 23 | 37 | — | 60 | |||||||||||||||
Distribution costs | — | 44 | 90 | — | 134 | |||||||||||||||
Selling, general and administrative expenses | 5 | 12 | 24 | — | 41 | |||||||||||||||
Closure costs, impairment and other related charges | — | 1 | 84 | — | 85 | |||||||||||||||
Operating (loss) income | (5 | ) | 7 | (46 | ) | 4 | (40 | ) | ||||||||||||
Interest expense | (18 | ) | (1 | ) | (2 | ) | 9 | (12 | ) | |||||||||||
Other expense, net | (1 | ) | (39 | ) | (16 | ) | (9 | ) | (65 | ) | ||||||||||
Equity in loss of subsidiaries | (92 | ) | — | — | 92 | — | ||||||||||||||
Loss before income taxes | (116 | ) | (33 | ) | (64 | ) | 96 | (117 | ) | |||||||||||
Income tax (provision) benefit | — | (2 | ) | 4 | (1 | ) | 1 | |||||||||||||
Net loss including noncontrolling interests | (116 | ) | (35 | ) | (60 | ) | 95 | (116 | ) | |||||||||||
Net income attributable to noncontrolling interests | — | — | — | — | — | |||||||||||||||
Net loss attributable to Resolute Forest Products Inc. | $ | (116 | ) | $ | (35 | ) | $ | (60 | ) | $ | 95 | $ | (116 | ) | ||||||
Comprehensive loss attributable to Resolute Forest Products Inc. | $ | (149 | ) | $ | (39 | ) | $ | (89 | ) | $ | 128 | $ | (149 | ) | ||||||
19
RESOLUTE FOREST PRODUCTS INC.
Notes to Unaudited Interim Consolidated Financial Statements
CONDENSED CONSOLIDATING STATEMENT OF OPERATIONS AND COMPREHENSIVE LOSS | ||||||||||||||||||||
For the Nine Months Ended September 30, 2014 | ||||||||||||||||||||
(Unaudited, in millions) | Parent | Guarantor Subsidiaries | Non-guarantor Subsidiaries | Consolidating Adjustments | Consolidated | |||||||||||||||
Sales | $ | — | $ | 2,624 | $ | 2,140 | $ | (1,561 | ) | $ | 3,203 | |||||||||
Costs and expenses: | ||||||||||||||||||||
Cost of sales, excluding depreciation, amortization and distribution costs | — | 2,450 | 1,557 | (1,558 | ) | 2,449 | ||||||||||||||
Depreciation and amortization | — | 71 | 113 | — | 184 | |||||||||||||||
Distribution costs | — | 123 | 267 | (2 | ) | 388 | ||||||||||||||
Selling, general and administrative expenses | 13 | 34 | 71 | — | 118 | |||||||||||||||
Closure costs, impairment and other related charges | — | 51 | 96 | — | 147 | |||||||||||||||
Net gain on disposition of assets | — | — | (2 | ) | — | (2 | ) | |||||||||||||
Operating (loss) income | (13 | ) | (105 | ) | 38 | (1 | ) | (81 | ) | |||||||||||
Interest expense | (53 | ) | (3 | ) | (6 | ) | 27 | (35 | ) | |||||||||||
Other expense, net | (1 | ) | (20 | ) | (10 | ) | (27 | ) | (58 | ) | ||||||||||
Equity in loss of subsidiaries | (101 | ) | — | — | 101 | — | ||||||||||||||
(Loss) income before income taxes | (168 | ) | (128 | ) | 22 | 100 | (174 | ) | ||||||||||||
Income tax benefit (provision) | — | 28 | (20 | ) | — | 8 | ||||||||||||||
Net (loss) income including noncontrolling interests | (168 | ) | (100 | ) | 2 | 100 | (166 | ) | ||||||||||||
Net income attributable to noncontrolling interests | — | — | (2 | ) | — | (2 | ) | |||||||||||||
Net loss attributable to Resolute Forest Products Inc. | $ | (168 | ) | $ | (100 | ) | $ | — | $ | 100 | $ | (168 | ) | |||||||
Comprehensive loss attributable to Resolute Forest Products Inc. | $ | (150 | ) | $ | (54 | ) | $ | (28 | ) | $ | 82 | $ | (150 | ) | ||||||
20
RESOLUTE FOREST PRODUCTS INC.
Notes to Unaudited Interim Consolidated Financial Statements
CONDENSED CONSOLIDATING BALANCE SHEET | ||||||||||||||||||||
As of September 30, 2015 | ||||||||||||||||||||
(Unaudited, in millions) | Parent | Guarantor Subsidiaries | Non-guarantor Subsidiaries | Consolidating Adjustments | Consolidated | |||||||||||||||
Assets | ||||||||||||||||||||
Current assets: | ||||||||||||||||||||
Cash and cash equivalents | $ | — | $ | 18 | $ | 217 | $ | — | $ | 235 | ||||||||||
Accounts receivable, net | — | 357 | 156 | — | 513 | |||||||||||||||
Accounts receivable from affiliates | 5 | 410 | 226 | (641 | ) | — | ||||||||||||||
Inventories, net | — | 250 | 292 | (7 | ) | 535 | ||||||||||||||
Deferred income tax assets | — | — | 22 | — | 22 | |||||||||||||||
Advance and interest receivable from parent | — | 72 | — | (72 | ) | — | ||||||||||||||
Note and interest receivable from affiliates | — | 42 | — | (42 | ) | — | ||||||||||||||
Other current assets | — | 26 | 37 | — | 63 | |||||||||||||||
Total current assets | 5 | 1,175 | 950 | (762 | ) | 1,368 | ||||||||||||||
Fixed assets, net | — | 740 | 1,192 | — | 1,932 | |||||||||||||||
Amortizable intangible assets, net | — | — | 60 | — | 60 | |||||||||||||||
Deferred income tax assets | — | — | 1,027 | 1 | 1,028 | |||||||||||||||
Notes receivable from parent | — | 690 | — | (690 | ) | — | ||||||||||||||
Note receivable from affiliate | — | 270 | — | (270 | ) | — | ||||||||||||||
Investments in consolidated subsidiaries and affiliates | 4,151 | 2,030 | — | (6,181 | ) | — | ||||||||||||||
Other assets | 7 | 49 | 104 | — | 160 | |||||||||||||||
Total assets | $ | 4,163 | $ | 4,954 | $ | 3,333 | $ | (7,902 | ) | $ | 4,548 | |||||||||
Liabilities and equity | ||||||||||||||||||||
Current liabilities: | ||||||||||||||||||||
Accounts payable and accrued liabilities | $ | 14 | $ | 185 | $ | 268 | $ | — | $ | 467 | ||||||||||
Current portion of long-term debt | — | 1 | — | — | 1 | |||||||||||||||
Accounts payable to affiliates | 410 | 226 | 5 | (641 | ) | — | ||||||||||||||
Advance and interest payable to subsidiaries | 72 | — | — | (72 | ) | — | ||||||||||||||
Note and interest payable to affiliate | — | — | 42 | (42 | ) | — | ||||||||||||||
Total current liabilities | 496 | 412 | 315 | (755 | ) | 468 | ||||||||||||||
Long-term debt, net of current portion | 595 | 1 | — | — | 596 | |||||||||||||||
Notes payable to subsidiaries | 690 | — | — | (690 | ) | — | ||||||||||||||
Note payable to affiliate | — | — | 270 | (270 | ) | — | ||||||||||||||
Pension and other postretirement benefit obligations | — | 394 | 962 | — | 1,356 | |||||||||||||||
Deferred income tax liabilities | — | — | 3 | — | 3 | |||||||||||||||
Other liabilities | 1 | 29 | 37 | — | 67 | |||||||||||||||
Total liabilities | 1,782 | 836 | 1,587 | (1,715 | ) | 2,490 | ||||||||||||||
Total equity | 2,381 | 4,118 | 1,746 | (6,187 | ) | 2,058 | ||||||||||||||
Total liabilities and equity | $ | 4,163 | $ | 4,954 | $ | 3,333 | $ | (7,902 | ) | $ | 4,548 | |||||||||
21
RESOLUTE FOREST PRODUCTS INC.
Notes to Unaudited Interim Consolidated Financial Statements
CONDENSED CONSOLIDATING BALANCE SHEET | ||||||||||||||||||||
As of December 31, 2014 | ||||||||||||||||||||
(Unaudited, in millions) | Parent | Guarantor Subsidiaries | Non-guarantor Subsidiaries | Consolidating Adjustments | Consolidated | |||||||||||||||
Assets | ||||||||||||||||||||
Current assets: | ||||||||||||||||||||
Cash and cash equivalents | $ | — | $ | 257 | $ | 80 | $ | — | $ | 337 | ||||||||||
Accounts receivable, net | — | 383 | 156 | — | 539 | |||||||||||||||
Accounts receivable from affiliates | — | 384 | 95 | (479 | ) | — | ||||||||||||||
Inventories, net | — | 251 | 300 | (9 | ) | 542 | ||||||||||||||
Deferred income tax assets | — | — | 70 | — | 70 | |||||||||||||||
Note and interest receivable from parent | — | 287 | — | (287 | ) | — | ||||||||||||||
Notes receivable from affiliates | — | 318 | — | (318 | ) | — | ||||||||||||||
Other current assets | — | 20 | 26 | — | 46 | |||||||||||||||
Total current assets | — | 1,900 | 727 | (1,093 | ) | 1,534 | ||||||||||||||
Fixed assets, net | — | 742 | 1,243 | — | 1,985 | |||||||||||||||
Amortizable intangible assets, net | — | — | 62 | — | 62 | |||||||||||||||
Deferred income tax assets | — | — | 1,217 | 2 | 1,219 | |||||||||||||||
Note receivable from parent | — | 388 | — | (388 | ) | — | ||||||||||||||
Investments in consolidated subsidiaries and affiliates | 4,096 | 2,020 | — | (6,116 | ) | — | ||||||||||||||
Other assets | 7 | 49 | 65 | — | 121 | |||||||||||||||
Total assets | $ | 4,103 | $ | 5,099 | $ | 3,314 | $ | (7,595 | ) | $ | 4,921 | |||||||||
Liabilities and equity | ||||||||||||||||||||
Current liabilities: | ||||||||||||||||||||
Accounts payable and accrued liabilities | $ | 5 | $ | 193 | $ | 320 | $ | — | $ | 518 | ||||||||||
Current portion of long-term debt | — | 1 | — | — | 1 | |||||||||||||||
Accounts payable to affiliates | 386 | 93 | — | (479 | ) | — | ||||||||||||||
Note and interest payable to subsidiary | 287 | — | — | (287 | ) | — | ||||||||||||||
Notes payable to affiliate | — | — | 318 | (318 | ) | — | ||||||||||||||
Total current liabilities | 678 | 287 | 638 | (1,084 | ) | 519 | ||||||||||||||
Long-term debt, net of current portion | 595 | 1 | — | — | 596 | |||||||||||||||
Note payable to subsidiary | 388 | — | — | (388 | ) | — | ||||||||||||||
Pension and other postretirement benefit obligations | — | 414 | 1,202 | — | 1,616 | |||||||||||||||
Deferred income tax liabilities | — | — | 3 | — | 3 | |||||||||||||||
Other liabilities | 1 | 29 | 40 | — | 70 | |||||||||||||||
Total liabilities | 1,662 | 731 | 1,883 | (1,472 | ) | 2,804 | ||||||||||||||
Total equity | 2,441 | 4,368 | 1,431 | (6,123 | ) | 2,117 | ||||||||||||||
Total liabilities and equity | $ | 4,103 | $ | 5,099 | $ | 3,314 | $ | (7,595 | ) | $ | 4,921 | |||||||||
22
RESOLUTE FOREST PRODUCTS INC.
Notes to Unaudited Interim Consolidated Financial Statements
CONDENSED CONSOLIDATING STATEMENT OF CASH FLOWS | ||||||||||||||||||||
For the Nine Months Ended September 30, 2015 | ||||||||||||||||||||
(Unaudited, in millions) | Parent | Guarantor Subsidiaries | Non-guarantor Subsidiaries | Consolidating Adjustments | Consolidated | |||||||||||||||
Net cash provided by (used in) operating activities | $ | — | $ | 106 | $ | (16 | ) | $ | — | $ | 90 | |||||||||
Cash flows from investing activities: | ||||||||||||||||||||
Cash invested in fixed assets | — | (62 | ) | (61 | ) | — | (123 | ) | ||||||||||||
Increase in deposit requirements for letters of credit, net | — | — | (5 | ) | — | (5 | ) | |||||||||||||
Investment in common stock of subsidiary | — | (225 | ) | — | 225 | — | ||||||||||||||
Advance to parent | — | (59 | ) | — | 59 | — | ||||||||||||||
Decrease of notes receivable from affiliates | — | 3 | — | (3 | ) | — | ||||||||||||||
Net cash used in investing activities | — | (343 | ) | (66 | ) | 281 | (128 | ) | ||||||||||||
Cash flows from financing activities: | ||||||||||||||||||||
Payments of financing and credit facility fees | — | (2 | ) | (1 | ) | — | (3 | ) | ||||||||||||
Purchases of treasury stock | (59 | ) | — | — | — | (59 | ) | |||||||||||||
Issuance of common stock | — | — | 225 | (225 | ) | — | ||||||||||||||
Advance from subsidiary | 59 | — | — | (59 | ) | — | ||||||||||||||
Decrease of notes payable to affiliate | — | — | (3 | ) | 3 | — | ||||||||||||||
Net cash (used in) provided by financing activities | — | (2 | ) | 221 | (281 | ) | (62 | ) | ||||||||||||
Effect of exchange rate changes on cash and cash equivalents | — | — | (2 | ) | — | (2 | ) | |||||||||||||
Net (decrease) increase in cash and cash equivalents | — | (239 | ) | 137 | — | (102 | ) | |||||||||||||
Cash and cash equivalents: | ||||||||||||||||||||
Beginning of period | — | 257 | 80 | — | 337 | |||||||||||||||
End of period | $ | — | $ | 18 | $ | 217 | $ | — | $ | 235 | ||||||||||
23
RESOLUTE FOREST PRODUCTS INC.
Notes to Unaudited Interim Consolidated Financial Statements
CONDENSED CONSOLIDATING STATEMENT OF CASH FLOWS | ||||||||||||||||||||
For the Nine Months Ended September 30, 2014 | ||||||||||||||||||||
(Unaudited, in millions) | Parent | Guarantor Subsidiaries | Non-guarantor Subsidiaries | Consolidating Adjustments | Consolidated | |||||||||||||||
Net cash (used in) provided by operating activities | $ | — | $ | (56 | ) | $ | 136 | $ | — | $ | 80 | |||||||||
Cash flows from investing activities: | ||||||||||||||||||||
Cash invested in fixed assets | — | (61 | ) | (81 | ) | — | (142 | ) | ||||||||||||
Disposition of assets | — | 4 | 2 | — | 6 | |||||||||||||||
Decrease in restricted cash | — | — | 1 | — | 1 | |||||||||||||||
Decrease in deposit requirements for letters of credit, net | — | — | 2 | — | 2 | |||||||||||||||
Net cash used in investing activities | — | (57 | ) | (76 | ) | — | (133 | ) | ||||||||||||
Cash flows from financing activities: | ||||||||||||||||||||
Payments of debt | — | (1 | ) | — | — | (1 | ) | |||||||||||||
Payments of financing and credit facility fees | — | (1 | ) | — | — | (1 | ) | |||||||||||||
Net cash used in financing activities | — | (2 | ) | — | — | (2 | ) | |||||||||||||
Effect of exchange rate changes on cash and cash equivalents | — | — | (2 | ) | — | (2 | ) | |||||||||||||
Net (decrease) increase in cash and cash equivalents | — | (115 | ) | 58 | — | (57 | ) | |||||||||||||
Cash and cash equivalents: | ||||||||||||||||||||
Beginning of period | — | 165 | 157 | — | 322 | |||||||||||||||
End of period | $ | — | $ | 50 | $ | 215 | $ | — | $ | 265 | ||||||||||
24
ITEM 2. | MANAGEMENT’S DISCUSSION AND ANALYSIS OF FINANCIAL CONDITION AND RESULTS OF OPERATIONS |
The following management’s discussion and analysis is intended to help the reader understand Resolute Forest Products, our results of operations, cash flows and financial condition. The discussion is provided as a supplement to, and should be read in conjunction with, our consolidated financial statements and the accompanying notes contained in Item 1 – Financial Statements.
When we refer to “Resolute Forest Products,” “we,” “our,” “us” or the “Company,” we mean Resolute Forest Products Inc. with its subsidiaries and affiliates, either individually or collectively, unless otherwise indicated.
CAUTIONARY STATEMENTS REGARDING FORWARD-LOOKING INFORMATION AND USE OF THIRD-PARTY DATA
Statements in this quarterly report on Form 10-Q that are not reported financial results or other historical information of Resolute Forest Products are “forward-looking statements” within the meaning of the Private Securities Litigation Reform Act of 1995. They include, for example, statements relating to our: efforts to continue to reduce costs and increase revenues and profitability, including our cost-reduction initiatives; business and operating outlook; future pension funding obligations; assessment of market conditions; prospects, growth strategies and the industry in which we operate; and strategies for achieving our goals generally. Forward-looking statements may be identified by the use of forward-looking terminology such as the words “should,” “would,” “could,” “will,” “may,” “expect,” “believe,” “anticipate,” “attempt,” “project” and other terms with similar meaning indicating possible future events or potential impact on our business or Resolute Forest Products’ shareholders.
The reader is cautioned not to place undue reliance on these forward-looking statements, which are not guarantees of future performance. These statements are based on management’s current assumptions, beliefs and expectations, all of which involve a number of business risks and uncertainties that could cause actual results to differ materially. The potential risks and uncertainties that could cause our actual future financial condition, results of operations and performance to differ materially from those expressed or implied in this quarterly report on Form 10-Q include, but are not limited to, developments in alternative media, which are expected to adversely affect the demand for some of our key products, and the effectiveness of our responses to these developments; the impact of any additional closure costs and long-lived asset impairment or accelerated depreciation charges; the impact of currency fluctuations on our competitive position, selling prices and manufacturing costs; the impact of global economic conditions; intense competition in the forest products industry and our ability to compete effectively; negative publicity, even if unjustified, which could have a negative impact on our brand and the marketability of our products; the highly cyclical nature of the forest products industry, which could impact the prices of and demand for our products, which could result in small or negative profit margins, lower sales volumes and curtailment or closure of operations; the impact of contributions to our Canadian pension plans, which could be at levels significantly higher than expected; the impact of the terms of our outstanding indebtedness, which could restrict our current and future operations, particularly our ability to respond to changes and take certain actions; our ability to maintain adequate capital resources to provide for all of our capital requirements, which are substantial; any inability to successfully implement our strategies to increase our earnings power; the impact of changes in laws or regulations, including environmental regulations and liabilities and the impact of future regulation of our Canadian softwood lumber exports to the United States; the imposition of countervailing duties, or cash deposit requirements in respect of estimated countervailing duties, which could require us to set aside a substantial amount of cash for sales of products subject to duties or cash deposit requirements and impact the competitive position of the affected operations; any difficulties in obtaining wood fiber at favorable prices, or at all; the impact of changes in the cost of purchased energy and other raw materials, which could lead to higher manufacturing costs and reduce our margins; the impact of changes in political or economic conditions in Canada, the United States or other countries in which our products are manufactured or sold; physical and financial risks associated with climate change; the impact of any labor disputes; extreme weather conditions or natural or man-made disasters, which could disrupt our supply chain and delivery of our products; cyber security risks; the impact of acquisitions, divestitures or other strategic transactions we may pursue; and the potential risks and uncertainties set forth under (i) Part I, Item 1A, “Risk Factors,” of our annual report on Form 10-K for the year ended December 31, 2014, filed with the U.S. Securities and Exchange Commission, or the “SEC”, on March 2, 2015 (the “2014 Annual Report”), and (ii) Part II, Item 1A, “Risk Factors,” in this quarterly report on Form 10-Q.
All forward-looking statements in this quarterly report on Form 10-Q are expressly qualified by the cautionary statements contained or referred to in this section and in our other filings with the SEC and the Canadian securities regulatory authorities. We disclaim any obligation to publicly update or revise any forward-looking information, whether as a result of new information, future events or otherwise, except as required by law.
25
Market and industry data
The information on industry and general economic conditions in this quarterly report on Form 10-Q was derived from third-party sources and trade publications we believe to be widely accepted and accurate. We have not independently verified the information and cannot assure you of its accuracy.
OVERVIEW
Resolute Forest Products is a global leader in the forest products industry, with a diverse range of products, including newsprint, specialty papers, market pulp and wood products, which are marketed in close to 80 countries. We own or operate some 40 pulp and paper mills and wood products facilities in the U.S., Canada and South Korea, and power generation assets in Canada. We’re the biggest Canadian producer of wood products east of the Rockies and one of the most significant pulp producers in North America. By capacity, we are the number one producer of newsprint in the world and the largest producer of uncoated mechanical papers in North America.
We report our activities in four business segments: newsprint, specialty papers, market pulp and wood products.
We are guided by our vision and values, focusing on safety, profitability, accountability, sustainability and teamwork. These are the elements that we believe best define us:
• | Competitive cost structure - as a result of aggressive cost reductions and mill rationalizations, today we compete as a leading, lower-cost North American producer. Maintaining this competitive advantage is our key focus. We are committed to maximizing shareholder value and earnings power by: stressing our guiding principles of operational excellence in everything we do; pushing to optimize our asset base in order to maximize the utilization of our most cost-effective mills; and streamlining production to adapt to changing market dynamics. |
• | Synergistic and diversified asset base - we apply our principles of operational excellence to our synergistic and diversified asset base, one that has evolved with time as we execute our profitable retreat from paper toward more sustainable long-term businesses. Put simply, our optimized paper segments generate significant cash flow, which we use to grow our business for the long-term, including: the tissue manufacturing and converting facility scheduled for ramp-up in 2017; the three pulp mills we acquired in 2012; the capacity enhancement initiatives in wood products; and the continuous pulp digester project at the Calhoun, Tennessee, pulp and paper facility. This synergistic and complementary asset base also offers the fiber management advantage of integration and earnings diversification. |
• | Financial strength - we make disciplined capital management a priority; we believe in maintaining a flexible and conservative capital structure. Our financial strength gives us the ability to consider a range of suitable opportunities, and the patience to make sure the valuation is right. |
Our Business
For information relating to our business, including our products, strategy, sustainable performance and development, and power generation assets, refer to our 2014 Annual Report.
Third Quarter Overview
In 2015, we changed our presentation of segment operating income to reallocate the net financing and remeasurement components of pension and other postretirement benefit, or “OPEB”, costs from the reportable segments to “corporate and other” in the segment presentation of operating income. We refer to these components, which consist of interest cost, expected return on plan assets and amortization of actuarial losses and gains, as “non-operating pension and OPEB costs or credits.” Current service costs and amortization of prior service credits will continue to be allocated to the reportable segments.
We now also treat non-operating pension and OPEB costs as a special item to be adjusted for purposes of establishing our non-GAAP performance measures, as further described below. We believe that reallocating the non-operating pension and OPEB costs to “corporate and other” and removing them from non-GAAP performance measures better reflects our ongoing operating results and improves their comparability between periods, and will therefore be more useful to investors. This approach is consistent with the indicators management uses internally to evaluate performance, including those used by the chief operating decision maker, and also consistent with a number of industry peers.
Prior period amounts have been reclassified to conform to the 2015 presentation.
26
Three months ended September 30, 2015 vs. September 30, 2014
Excluding special items, we generated operating income of $23 million in the quarter, compared to $50 million in the third quarter of 2014. Unadjusted for special items, operating income was $6 million, compared to an operating loss of $40 million in the year-ago period. Special items are described below.
Our net income in the quarter, excluding special items, was $14 million, or $0.15 per share, down from net income, excluding special items, of $15 million, or $0.16 per share, in the year-ago period. Unadjusted for special items, our net loss in the quarter was $6 million, or $0.07 per share, compared to $116 million, or $1.23 per share, in the year-ago period.
Three Months Ended September 30, 2015 | Operating Income (Loss) | Net Income (Loss) | EPS | |||||||||
(unaudited, in millions, except per share amounts) | ||||||||||||
GAAP, as reported | $ | 6 | $ | (6 | ) | $ | (0.07 | ) | ||||
Adjustments for special items (1): | ||||||||||||
Foreign exchange translation loss | — | 5 | 0.06 | |||||||||
Closure costs, impairment and other related charges | 2 | 2 | 0.02 | |||||||||
Start-up costs | 2 | 2 | 0.02 | |||||||||
Non-operating pension and OPEB costs | 13 | 13 | 0.14 | |||||||||
Other income, net | — | (4 | ) | (0.04 | ) | |||||||
Income tax effect of special items | — | 2 | 0.02 | |||||||||
GAAP, as adjusted for special items | $ | 23 | $ | 14 | $ | 0.15 | ||||||
Three Months Ended September 30, 2014 | Operating Income (Loss) | Net Income (Loss) | EPS | |||||||||
(unaudited, in millions, except per share amounts) | ||||||||||||
GAAP, as reported | $ | (40 | ) | $ | (116 | ) | $ | (1.23 | ) | |||
Adjustments for special items (1): | ||||||||||||
Foreign exchange translation loss | — | 17 | 0.18 | |||||||||
Closure costs, impairment and other related charges | 85 | 85 | 0.90 | |||||||||
Inventory write-downs related to closures | 6 | 6 | 0.06 | |||||||||
Start-up costs | 1 | 1 | 0.01 | |||||||||
Non-operating pension and OPEB credits | (2 | ) | (2 | ) | (0.02 | ) | ||||||
Write-down of equity method investment | — | 50 | 0.53 | |||||||||
Other income, net | — | (2 | ) | (0.02 | ) | |||||||
Income tax effect of special items | — | (24 | ) | (0.25 | ) | |||||||
GAAP, as adjusted for special items | $ | 50 | $ | 15 | $ | 0.16 | ||||||
(1) | Operating income (loss), net income (loss) and net income (loss) per share (or “EPS”), in each case as adjusted for special items, are not financial measures recognized under generally accepted accounting principles, or “GAAP.” We calculate operating income (loss), as adjusted for special items, as operating income (loss) from our consolidated statements of operations, adjusted for items such as closure costs, impairment and other related charges, inventory write-downs related to closures, start-up costs, gains and losses on disposition of assets, non-operating pension and OPEB costs and credits, and other charges or credits that are excluded from our segment’s performance from GAAP operating income (loss). We calculate net income (loss), as adjusted for special items, as net income (loss) from our consolidated statements of operations, adjusted for the same special items applied to operating income (loss), in addition to foreign exchange translation gains and losses, write-down of equity method investment, other income (expense), net and the income tax effect of the special items. EPS, as adjusted for special items, is calculated as net income (loss), as adjusted for special items, per diluted share. We believe that using these non-GAAP measures is useful because they are consistent with the indicators management uses internally to measure the Company’s performance, and it allows the reader to more easily compare our ongoing operations and financial performance from period to period. Operating income (loss), net income (loss) and EPS, in each case as adjusted for special items, are internal measures, and therefore may not be comparable to those of other companies. These non-GAAP measures should not be viewed as substitutes to financial measures determined under GAAP. |
27
Nine months ended September 30, 2015 vs. September 30, 2014
Excluding special items, we generated operating income of $59 million in the first nine months of the year, compared to $68 million in the year-ago period. Unadjusted for special items, operating income was $7 million, compared to an operating loss of $81 million in the year-ago period. Special items are described below.
Net income, excluding special items, in the first nine months was $2 million, or $0.02 per share, down from net income, excluding special items, of $4 million, or $0.04 per share, for the first nine months of 2014. Unadjusted for special items, our net loss in the period was $43 million, or $0.46 per share, compared to $168 million, or $1.78 per share, in the year-ago period.
Nine Months Ended September 30, 2015 | Operating Income (Loss) | Net Income (Loss) | EPS | |||||||||
(unaudited, in millions, except per share amounts) | ||||||||||||
GAAP, as reported | $ | 7 | $ | (43 | ) | $ | (0.46 | ) | ||||
Adjustments for special items (1): | ||||||||||||
Foreign exchange translation loss | — | 2 | 0.02 | |||||||||
Closure costs, impairment and other related charges | 8 | 8 | 0.09 | |||||||||
Inventory write-downs related to closures | 1 | 1 | 0.01 | |||||||||
Start-up costs | 4 | 4 | 0.04 | |||||||||
Non-operating pension and OPEB costs | 39 | 39 | 0.42 | |||||||||
Other income, net | — | (7 | ) | (0.08 | ) | |||||||
Income tax effect of special items | — | (2 | ) | (0.02 | ) | |||||||
GAAP, as adjusted for special items | $ | 59 | $ | 2 | $ | 0.02 | ||||||
Nine Months Ended September 30, 2014 | Operating Income (Loss) | Net Income (Loss) | EPS | |||||||||
(unaudited, in millions, except per share amounts) | ||||||||||||
GAAP, as reported | $ | (81 | ) | $ | (168 | ) | $ | (1.78 | ) | |||
Adjustments for special items (1): | ||||||||||||
Foreign exchange translation loss | — | 14 | 0.15 | |||||||||
Closure costs, impairment and other related charges | 147 | 147 | 1.55 | |||||||||
Inventory write-downs related to closures | 10 | 10 | 0.11 | |||||||||
Start-up costs | 2 | 2 | 0.02 | |||||||||
Net gain on disposition of assets | (2 | ) | (2 | ) | (0.02 | ) | ||||||
Non-operating pension and OPEB credits | (8 | ) | (8 | ) | (0.09 | ) | ||||||
Write-down of equity method investment | — | 50 | 0.53 | |||||||||
Other income, net | — | (6 | ) | (0.06 | ) | |||||||
Income tax effect of special items | — | (35 | ) | (0.37 | ) | |||||||
GAAP, as adjusted for special items | $ | 68 | $ | 4 | $ | 0.04 | ||||||
(1) | Operating income (loss), net income (loss) and EPS, in each case as adjusted for special items, are non-GAAP financial measures. For more information on the calculation and reasons we include these measures, see note 1 under “Overview – Third Quarter Overview” above. |
28
RESULTS OF OPERATIONS
Consolidated Results
Selected Financial Information
Three Months Ended September 30, | Nine Months Ended September 30, | ||||||||||||||||
(unaudited, in millions, except per share amounts and percentages) | 2015 | 2014 | 2015 | 2014 | |||||||||||||
Sales | $ | 905 | $ | 1,096 | $ | 2,751 | $ | 3,203 | |||||||||
Operating (loss) income per segment: | |||||||||||||||||
Newsprint | (10 | ) | 5 | (10 | ) | 6 | |||||||||||
Specialty papers | 9 | 6 | 31 | (23 | ) | ||||||||||||
Market pulp | 22 | 20 | 59 | 51 | |||||||||||||
Wood products | 9 | 24 | 10 | 51 | |||||||||||||
Segment total | 30 | 55 | 90 | 85 | |||||||||||||
Corporate and other | (24 | ) | (95 | ) | (83 | ) | (166 | ) | |||||||||
Operating income (loss) | 6 | (40 | ) | 7 | (81 | ) | |||||||||||
Net loss | (6 | ) | (116 | ) | (43 | ) | (168 | ) | |||||||||
Net loss per common share: | |||||||||||||||||
Basic | $ | (0.07 | ) | $ | (1.23 | ) | $ | (0.46 | ) | $ | (1.78 | ) | |||||
Diluted | (0.07 | ) | (1.23 | ) | (0.46 | ) | (1.78 | ) | |||||||||
Adjusted EBITDA (1) | $ | 82 | $ | 110 | $ | 235 | $ | 252 | |||||||||
Adjusted EBITDA margin (1) | 9.1 | % | 10.0 | % | 8.5 | % | 7.9 | % | |||||||||
As of September 30, | As of December 31, | |||||||
(unaudited, in millions) | 2015 | 2014 | ||||||
Cash and cash equivalents | $ | 235 | $ | 337 | ||||
Total assets | 4,548 | 4,921 | ||||||
(1) | Earnings before interest expense, income taxes, and depreciation and amortization, or “EBITDA”, adjusted EBITDA and adjusted EBITDA margin are not financial measures recognized under GAAP. EBITDA is calculated as net income (loss) including noncontrolling interests from the consolidated statements of operations, adjusted for interest expense, income taxes, and depreciation and amortization. Adjusted EBITDA means EBITDA, excluding special items, such as foreign exchange translation gains and losses, closure costs, impairment and other related charges, inventory write-downs related to closures, start-up costs, gains and losses on disposition of assets, non-operating pension and OPEB costs and credits, write-down of equity method investment, and other charges or credits. Adjusted EBITDA margin is adjusted EBITDA expressed as a percentage of sales. We believe that using non-GAAP measures such as EBITDA, adjusted EBITDA and adjusted EBITDA margin is useful because they are consistent with the indicators management uses internally to measure the Company’s performance and it allows the reader to more easily compare our ongoing operations and financial performance from period to period. EBITDA, adjusted EBITDA and adjusted EBITDA margin are internal measures, and therefore may not be comparable to those of other companies. These non-GAAP measures should not be viewed as substitutes to financial measures determined under GAAP. |
29
Three Months Ended September 30, | Nine Months Ended September 30, | ||||||||||||||||
(unaudited, in millions) | 2015 | 2014 | 2015 | 2014 | |||||||||||||
Net loss including noncontrolling interests | $ | (6 | ) | $ | (116 | ) | $ | (42 | ) | $ | (166 | ) | |||||
Interest expense | 9 | 12 | 32 | 35 | |||||||||||||
Income tax provision (benefit) | 2 | (1 | ) | 22 | (8 | ) | |||||||||||
Depreciation and amortization | 59 | 60 | 176 | 184 | |||||||||||||
EBITDA | $ | 64 | $ | (45 | ) | $ | 188 | $ | 45 | ||||||||
Foreign exchange translation loss | 5 | 17 | 2 | 14 | |||||||||||||
Closure costs, impairment and other related charges | 2 | 85 | 8 | 147 | |||||||||||||
Inventory write-downs related to closures | — | 6 | 1 | 10 | |||||||||||||
Start-up costs | 2 | 1 | 4 | 2 | |||||||||||||
Net gain on disposition of assets | — | — | — | (2 | ) | ||||||||||||
Write-down of equity method investment | — | 50 | — | 50 | |||||||||||||
Non-operating pension and OPEB costs (credits) | 13 | (2 | ) | 39 | (8 | ) | |||||||||||
Other income, net | (4 | ) | (2 | ) | (7 | ) | (6 | ) | |||||||||
Adjusted EBITDA | $ | 82 | $ | 110 | $ | 235 | $ | 252 | |||||||||
Three months ended September 30, 2015 vs. September 30, 2014
Operating income (loss) variance analysis
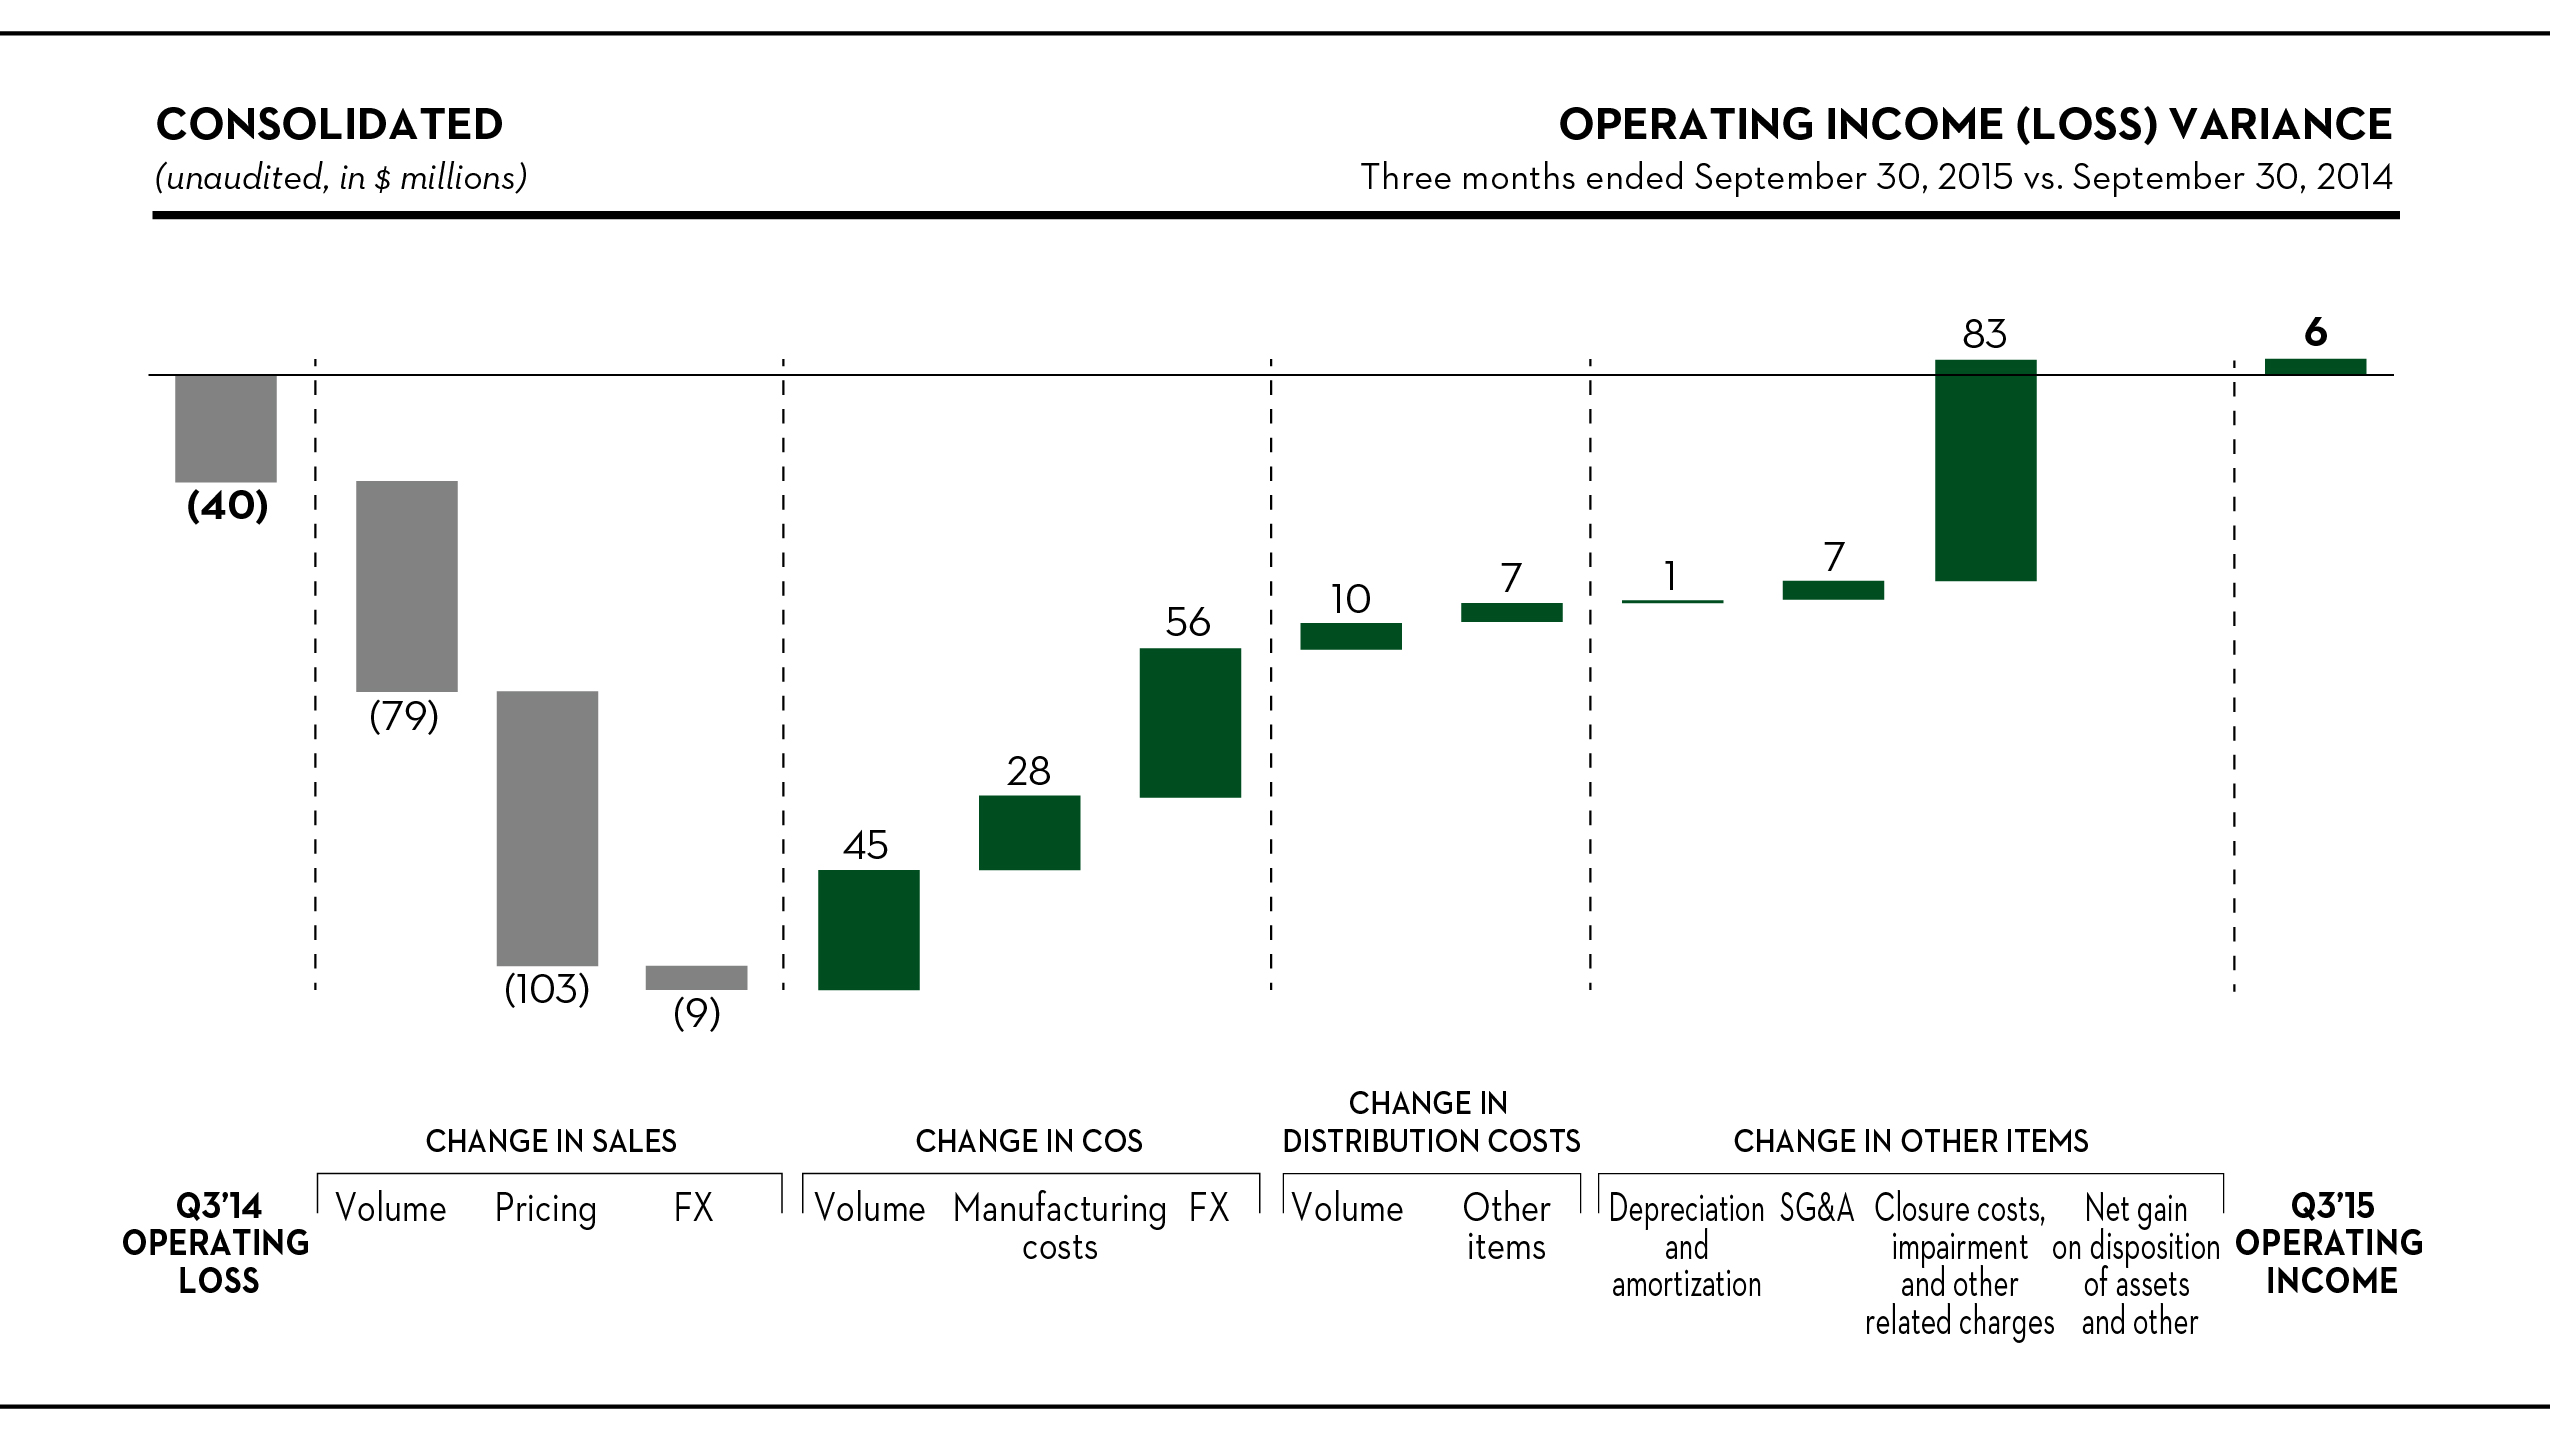
Sales
Our sales were $191 million, or 17%, lower than the year-ago period, to $905 million. Overall, pricing had an unfavorable impact of $103 million, reflecting lower average transaction prices across all segments: 20% for wood products; 16% for newsprint; 9% for market pulp; and 3% for specialty papers. Shipments of newsprint and specialty papers were also lower as a result of our 2014 capacity rationalization initiatives to, among other things, adapt to changing market dynamics.
30
Cost of sales, excluding depreciation, amortization and distribution costs
Cost of sales, excluding depreciation, amortization and distribution costs, which we refer to as “COS”, improved by $129 million in the quarter. After removing the effects of the weaker Canadian dollar - as a significant portion of our production capacity is based in Canada - and the lower overall volume, costs improved by $28 million. Excluding an increase relating to our defined benefit pension and OPEB plans, costs were $42 million lower as a result of:
• | the effect of asset optimization initiatives, including closure-related write-down of mill stores and other supplies incurred in the year-ago period ($16 million); |
• | lower commodity prices and higher mill efficiencies ($11 million); |
• | a favorable property tax adjustment and the recognition of additional tax credits in connection with infrastructure investments ($10 million); and |
• | higher contributions from cogeneration facilities ($5 million); |
partially offset by the recognition of an energy saving incentive in the U.S. Southeast in 2014 ($6 million).
The higher defined benefit pension and OPEB plans costs ($14 million) related mainly to the amortization of actuarial losses incurred in 2014. These losses reflect the substantial drop in discount rates and longer life expectancy assumptions in both the U.S. and Canada, which caused the net pension and OPEB liability to increase by $330 million in 2014.
Distribution costs
After removing the effects of lower volume and the weaker Canadian dollar, distribution costs were $4 million lower in the period, primarily due to lower fuel surcharges offset in part by higher freight rates.
Selling, general and administrative expenses
Selling, general and administrative expenses, or “SG&A”, were $7 million lower in the period, primarily because of the favorable effect of the weaker Canadian dollar ($5 million), a group insurance refund and expense timing ($4 million), offset in part by higher project costs ($3 million).
Closure costs, impairment and other related charges
See the corresponding variance analysis under “- Segment Earnings - Corporate and Other” below.
Net loss variance analysis
Other expense, net
We recorded other expense, net, of $1 million in the quarter, compared to $65 million in the year-ago period. This reflects mostly a non-cash foreign exchange loss of $5 million on the translation of Canadian dollar net monetary balances in the current period, compared to a non-cash foreign exchange loss of $17 million and a $50 million write-down of our investment in Ponderay Newsprint Company, an unconsolidated partnership in which we have a 40% interest, in the year-ago period.
Income taxes
We recorded a $2 million income tax provision this quarter, on a loss before income taxes of $4 million, compared to an expected income tax benefit of $1 million based on the U.S. federal statutory income tax rate of 35%. The difference reflects a net increase in valuation allowances, primarily related to our U.S. operations where we recognize a full valuation allowance against our net deferred income tax assets and foreign exchange related items, offset by a change in tax rates on deferred income taxes due to an intercompany asset transfer in connection with an operating company realignment and state and foreign tax rate differences.
We recorded a $1 million income tax benefit in the third quarter of 2014, on a loss before income taxes of $117 million, compared to an expected income tax benefit of $41 million based on the U.S. federal statutory income tax rate of 35%. The difference reflects a net increase in valuation allowances, primarily related to our U.S. operations where we recognize a full valuation allowance against our net deferred income tax assets, foreign exchange related items and state and foreign tax rate differences.
31
Most of our Canadian subsidiaries, including our principal Canadian operating subsidiary, use the U.S. dollar as functional currency but determine taxable income in Canadian dollars. This can cause frequent and substantial variations to our effective tax rate when compared to the weighted-average of both domestic and foreign statutory tax rates. This is because we compute the foreign exchange component of the income tax provision of our Canadian subsidiaries on a different basis than in our consolidated financial statements. Due to the unpredictability of foreign exchange rates, we are unable to estimate the impact of future changes in exchange rates on our effective tax rate.
Nine months ended September 30, 2015 vs. September 30, 2014
Operating income (loss) variance analysis
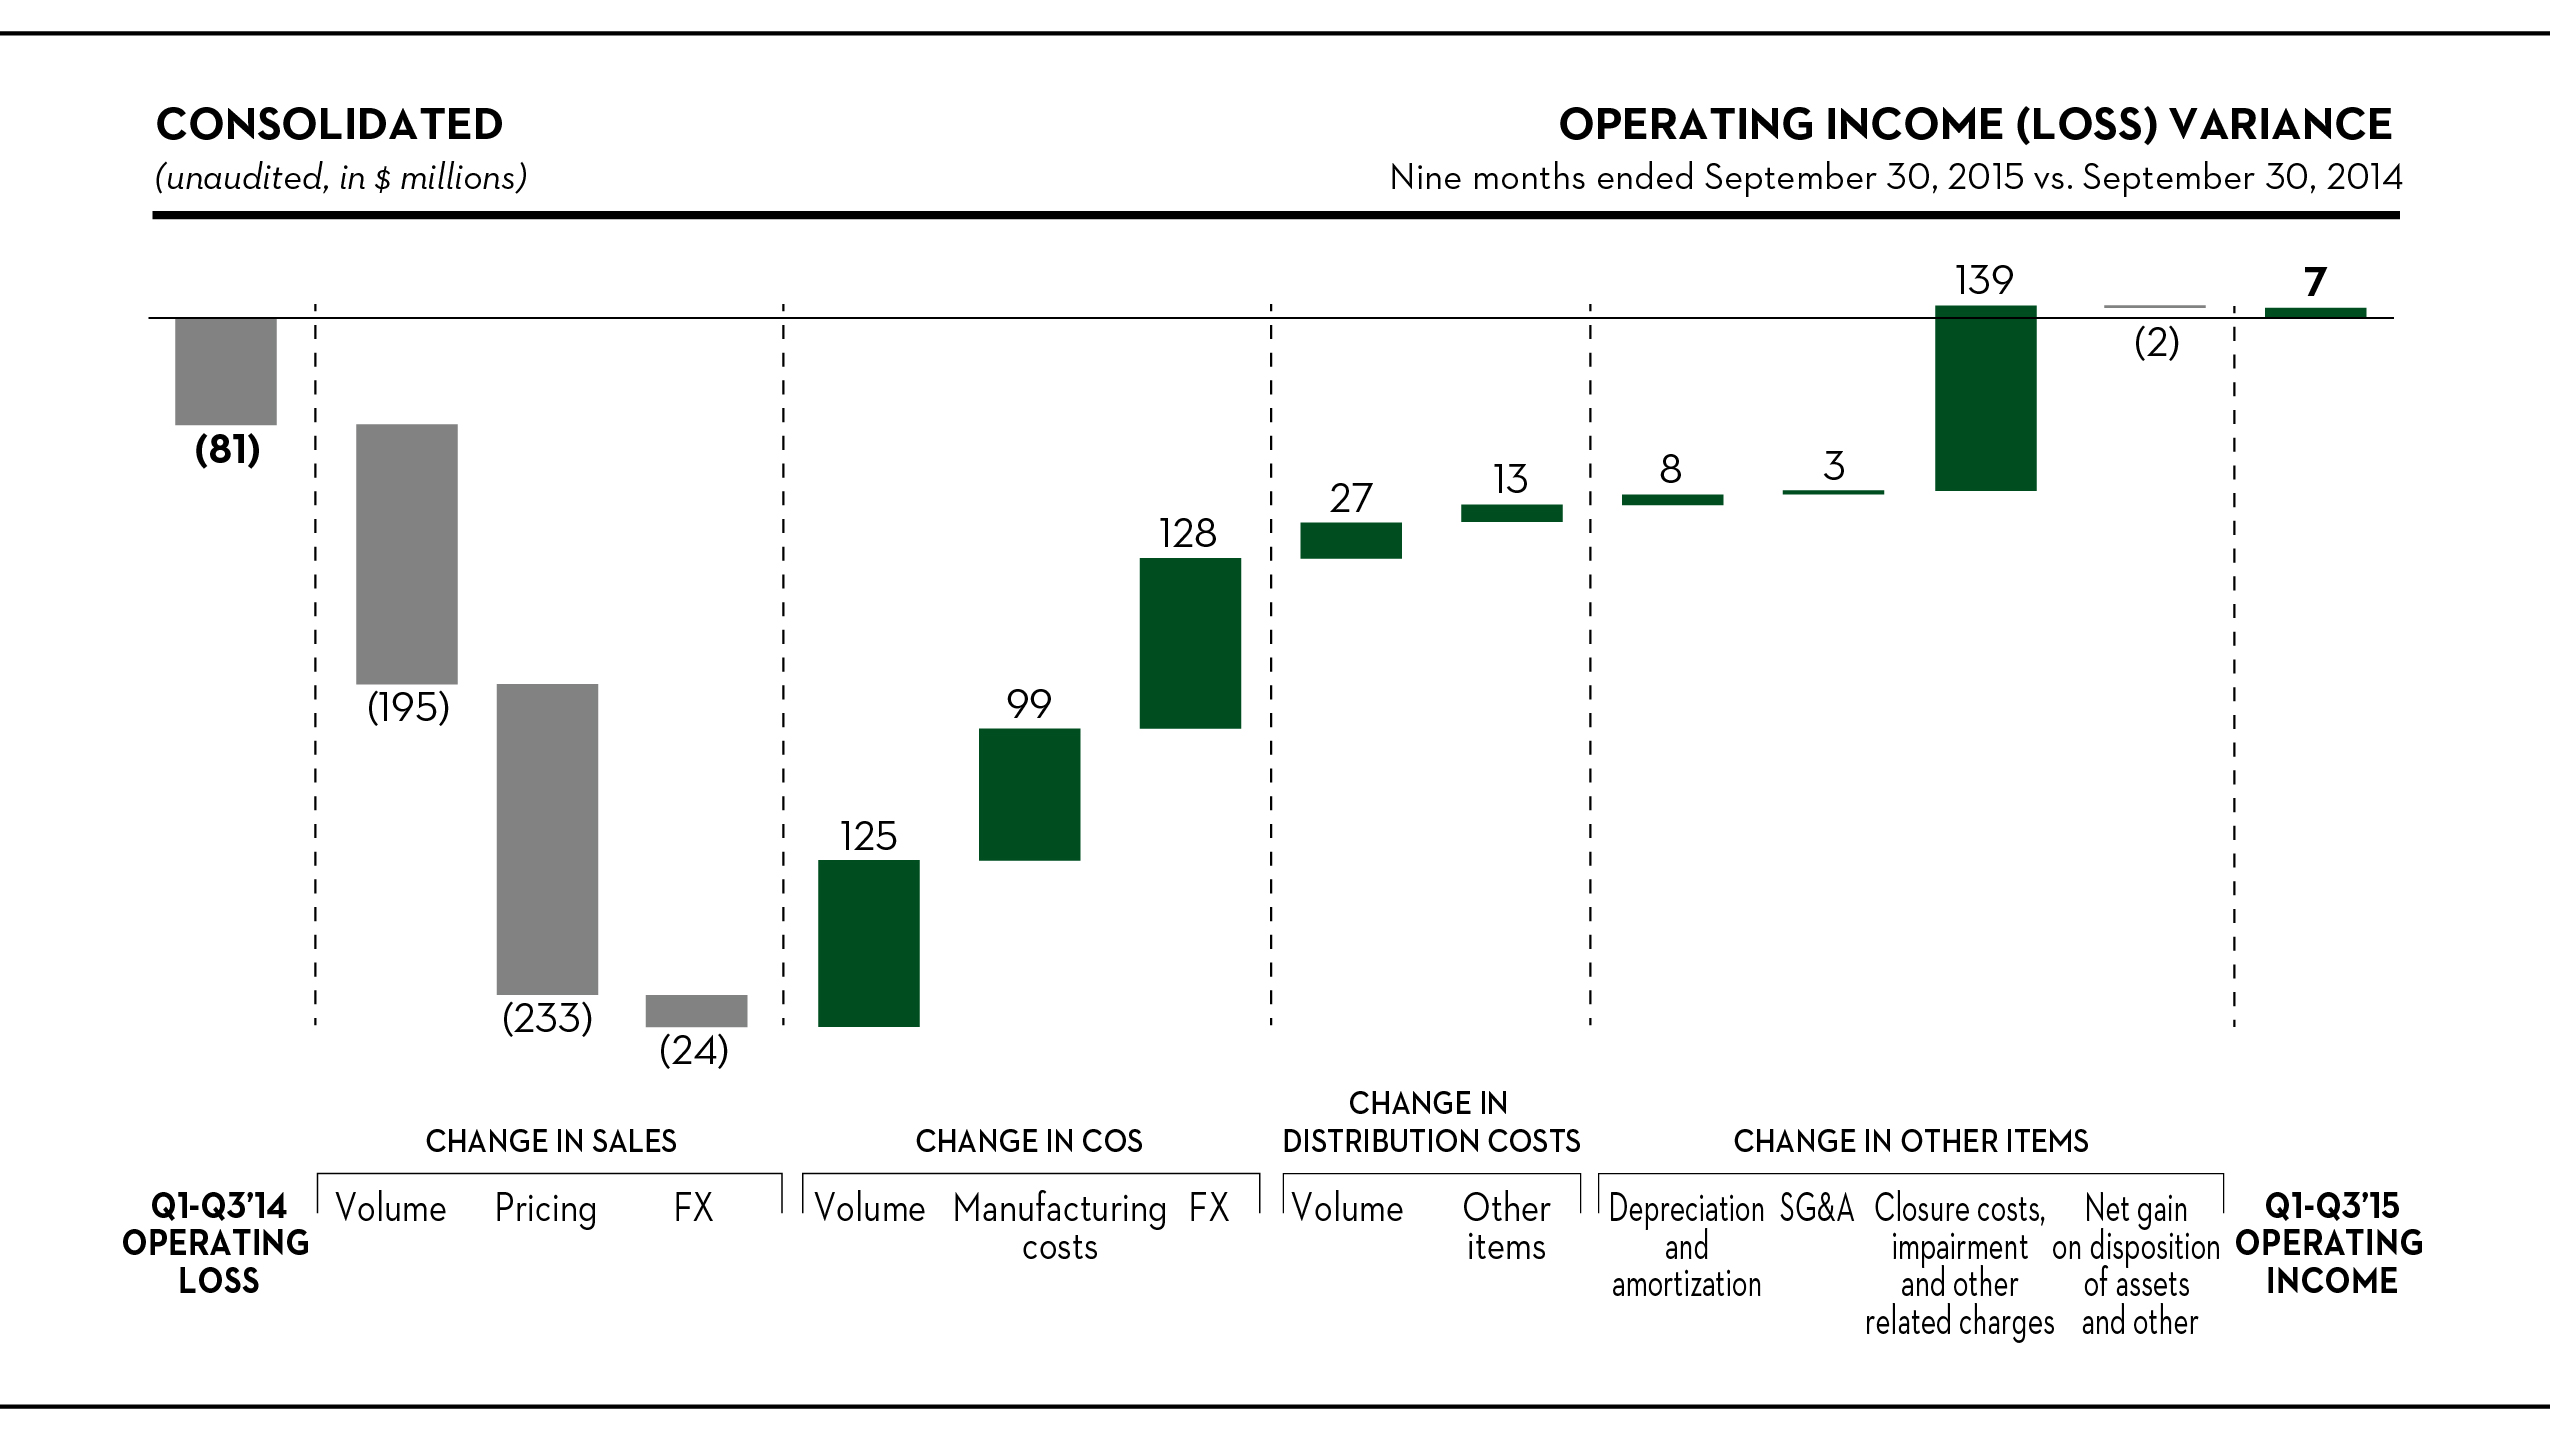
Sales
Sales were $452 million, or 14%, lower than in the year-ago period, to $2,751 million. Despite a 3% increase in shipments of wood products, sales volume decreased by $195 million because of lower shipments of specialty papers and newsprint, down by 12% and 10%, respectively, reflecting the effect of the capacity rationalization initiatives we announced in the fourth quarter of 2014. Overall, pricing had an unfavorable impact of $257 million, including the effect of currency of $24 million, reflecting a 15% drop in the average transaction price for wood products, 12% for newsprint and 7% for market pulp.
Cost of sales, excluding depreciation, amortization and distribution costs
COS were $352 million lower in the period. After removing the effects of the weaker Canadian dollar and the lower overall volume, costs improved by $99 million, reflecting primarily:
• | the effect of asset optimization initiatives, including closure-related write-down of mill stores and other supplies incurred last year ($41 million); |
• | the abnormally cold winter of 2014 ($40 million); |
• | lower maintenance costs and fewer operational disruptions ($22 million); |
• | lower commodity prices and higher mill efficiencies ($19 million); |
• | favorable property tax adjustments and the recognition of additional tax credits in connection with infrastructure investments ($12 million); |
• | lower steam costs ($10 million), mainly due to lower natural gas prices; and |
32
• | higher contributions from cogeneration facilities ($6 million); |
partially offset by:
• | higher defined benefit pension and OPEB plans costs ($40 million) relating to the amortization of 2014 actuarial losses; |
• | an increase in fiber usage ($9 million), partly due to product mix; |
• | higher power costs ($6 million), mostly due to higher power prices in Ontario; and |
• | the recognition of an energy saving incentive in the U.S. Southeast in 2014 ($6 million). |
Distribution costs
After removing the effects of lower volume and the weaker Canadian dollar, distribution costs were $6 million lower in the period, primarily due to the weather-related increases in freight and warehousing costs in the first quarter of 2014. The favorable effect of lower fuel surcharges was almost all offset by the impact of an increase in average length of haul and higher freight rates.
Depreciation and amortization
Depreciation and amortization was $8 million lower in the period, mainly as a result of 2014 capacity closures, partially offset by the amortization of costs associated with the implementation of our integrated business management software.
Selling, general and administrative expenses
SG&A was $3 million lower in the period, reflecting the favorable effect of the weaker Canadian dollar and expense timing ($16 million), offset by higher project costs ($9 million) and a change in the forfeiture rate assumptions for our equity-based awards ($3 million).
Closure costs, impairment and other related charges
See the corresponding variance analysis under “- Segment Earnings - Corporate and Other” below.
Net loss variance analysis
Other income (expense), net
We recorded other income, net, of $5 million in 2015, compared to other expense, net, of $58 million in the year-ago period. This reflects mostly a non-cash foreign exchange loss of $2 million on the translation of Canadian dollar net monetary balances in the current period, compared to a non-cash foreign exchange loss of $14 million and a $50 million write-down of our investment in Ponderay Newsprint Company, an unconsolidated partnership in which we have a 40% interest, in the year-ago period.
Income taxes
We recorded an income tax provision of $22 million in 2015, on a loss before income taxes of $20 million, compared to an expected income tax benefit of $7 million based on the U.S. federal statutory income tax rate of 35%. In 2014, we recorded an income tax benefit of $8 million, on a loss before income taxes of $174 million, compared to an expected income tax benefit of $61 million based on the U.S. federal statutory income tax rate of 35%. The difference in both periods reflects a net increase in valuation allowances, primarily related to our U.S. operations where we recognize a full valuation allowance against our net deferred income tax assets, and foreign exchange related items, offset by state and foreign tax rate differences. The difference in 2015 also reflects a change in tax rates on deferred income taxes, primarily due to an intercompany asset transfer in connection with an operating company realignment.
Segment Earnings
We manage our business based on the products we manufacture. Our reportable segments correspond to our principal product lines: newsprint, specialty papers, market pulp and wood products.
We do not allocate any of the income or loss items following “operating income (loss)” in our consolidated statements of operations to our segments because those items are reviewed separately by management. Similarly, we do not allocate to the
33
segments: closure costs, impairment and other related charges; inventory write-downs related to closures; start-up costs; net gain on disposition of assets; non-operating pension and OPEB costs and credits; as well as other discretionary charges or credits.
We allocate depreciation and amortization, and SG&A to the segments, with the exception of certain other discretionary charges and credits, which we present under “corporate and other.”
In 2015, we changed our presentation of segment operating income to reallocate non-operating pension and OPEB costs from the reportable segments to “corporate and other” in the segment presentation of operating income. For more information see “Overview – Third Quarter Overview” above.
34
NEWSPRINT
Highlights
Three Months Ended September 30, | Nine Months Ended September 30, | ||||||||||||||||
(unaudited, in millions, except where otherwise stated) | 2015 | 2014 | 2015 | 2014 | |||||||||||||
Sales | $ | 258 | $ | 346 | $ | 838 | $ | 1,056 | |||||||||
Operating (loss) income (1) | (10 | ) | 5 | (10 | ) | 6 | |||||||||||
EBITDA (2) | 6 | 22 | 38 | 58 | |||||||||||||
(in thousands of metric tons) | |||||||||||||||||
Shipments | 517 | 584 | 1,599 | 1,774 | |||||||||||||
Downtime | 34 | 83 | 68 | 151 | |||||||||||||
As of September 30, | ||||||||
(unaudited, in thousands of metric tons) | 2015 | 2014 | ||||||
Finished goods inventory | 101 | 123 | ||||||
(1) | Net (loss) income including noncontrolling interests is equal to operating (loss) income in this segment. |
(2) | EBITDA, a non-GAAP financial measure, is reconciled below. For more information on the calculation and reasons we include this measure, see note 1 under “Results of Operations – Consolidated Results – Selected Financial Information” above. |
Three Months Ended September 30, | Nine Months Ended September 30, | ||||||||||||||||
(unaudited, in millions) | 2015 | 2014 | 2015 | 2014 | |||||||||||||
Net (loss) income including noncontrolling interests | $ | (10 | ) | $ | 5 | $ | (10 | ) | $ | 6 | |||||||
Depreciation and amortization | 16 | 17 | 48 | 52 | |||||||||||||
EBITDA | 6 | 22 | 38 | 58 | |||||||||||||
Industry trends
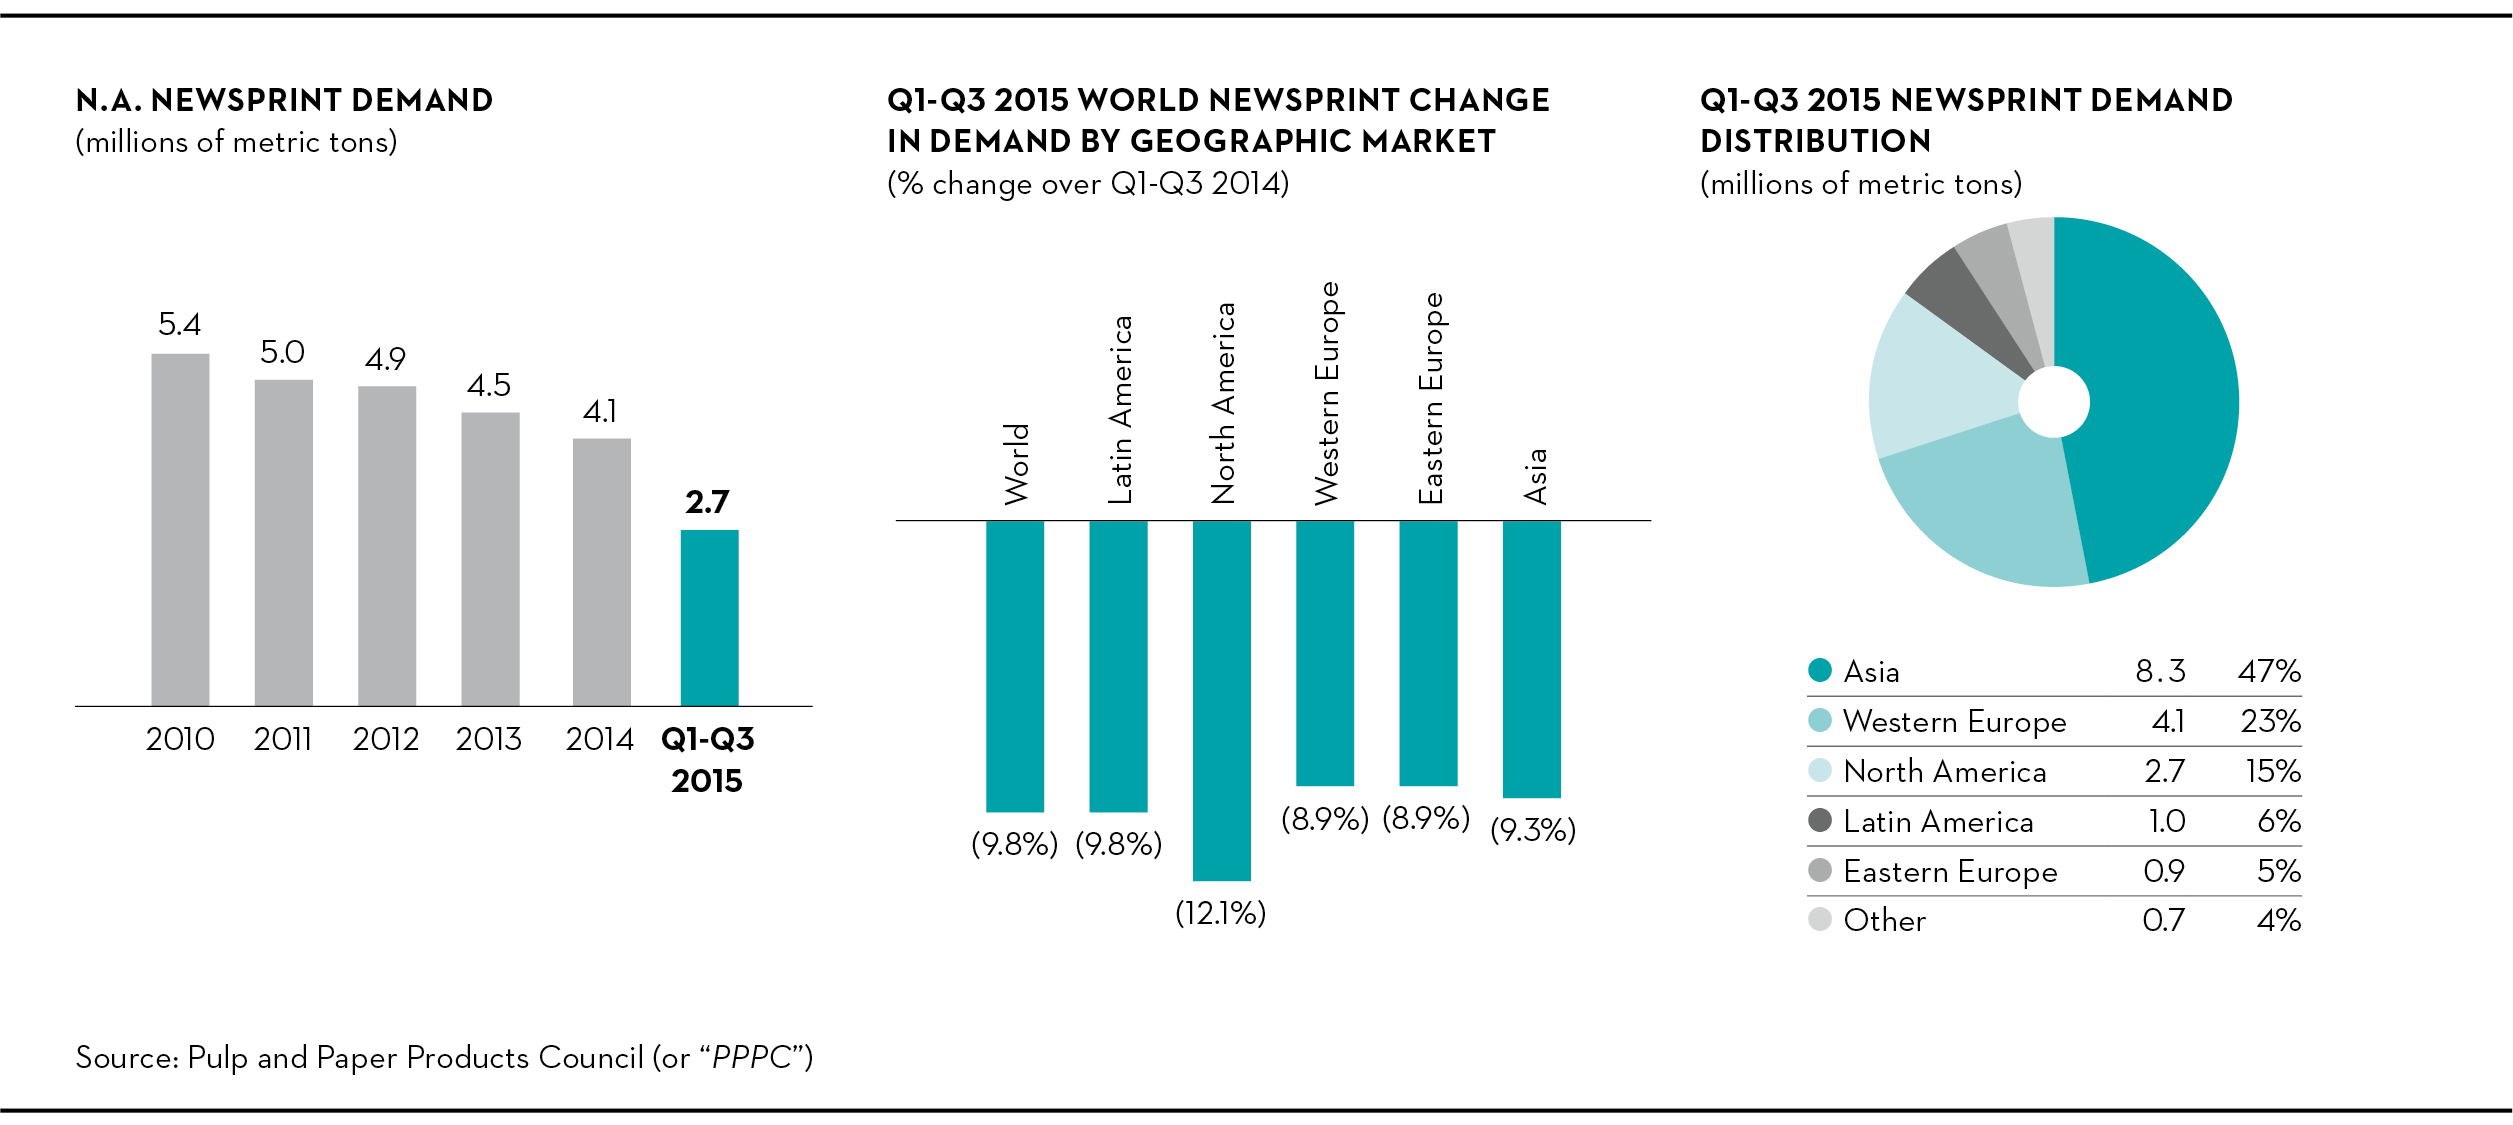
North American demand for newsprint dropped by 12% through September. Production was down by 15% in the same period, contributing to operating rates of 91% in North America. Global demand was down by 10% through three quarters, with drops in all major regions, including Asia (9%), Western Europe (9%), and Latin America (10%). Total exports from North America
35
were down by 16%, including a drop of 17% to Latin America and 19% to Asia. World operating rates excluding North America and Western Europe were 83% through September.
Three months ended September 30, 2015 vs. September 30, 2014
Operating (loss) income variance analysis
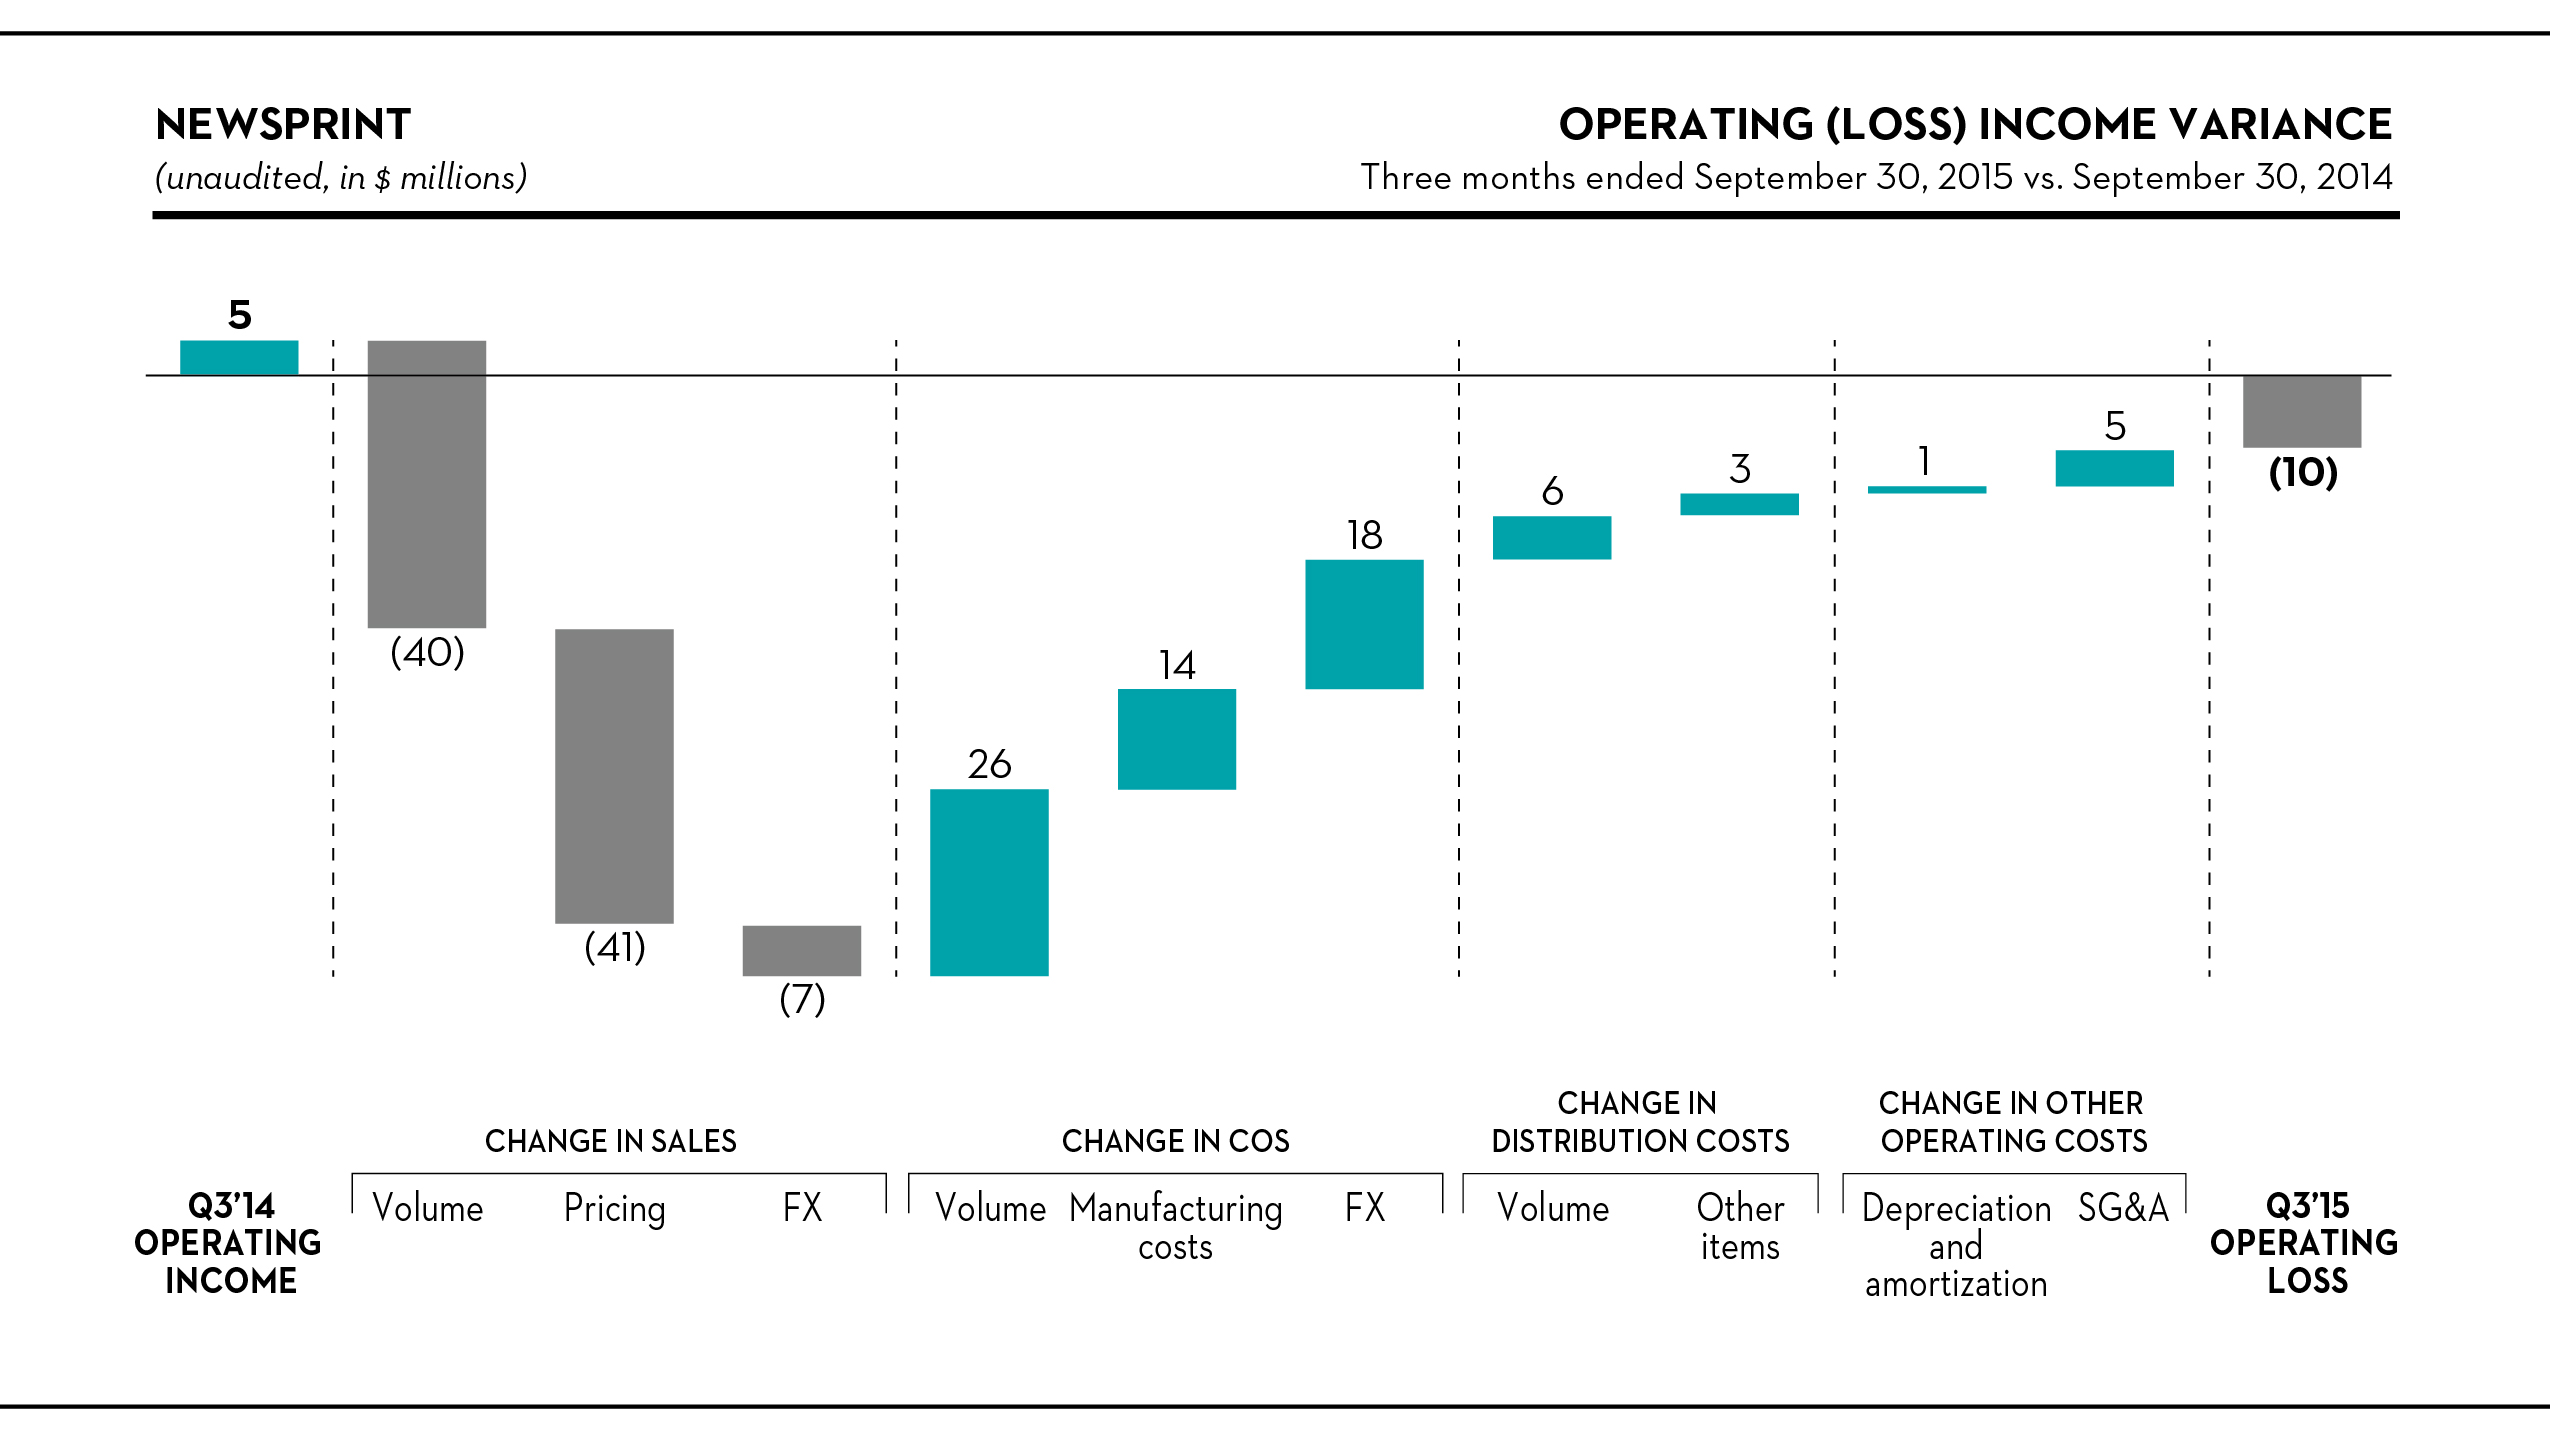
Sales
Newsprint sales dropped by $88 million, or 25%, to $258 million in the third quarter of 2015. This reflects a 67,000 metric ton decrease in shipments and a $93 per metric ton drop in average transaction price, which includes the unfavorable effect of the weaker Canadian dollar on sales denominated in that currency. The drop in shipments largely follows lower production volumes as a result of the 465,000 metric tons of closures we announced in December of 2014 at three newsprint machines in Canada due to the ongoing challenges for North American producers in the global newsprint business, who face an accelerating pace of North American and global decline and the effect of very low operating rates outside North America and Western Europe. Capacity closures are part of our efforts to optimize the asset base, maximizing the utilization of our most cost-effective mills and streamlining production to adapt to changing market dynamics.
Compared to the third quarter of 2014, our international shipments are down by 16%, and domestic shipments are down by 8%. Accordingly, our domestic shipments represented 60% of total newsprint shipments in the quarter. Finished goods inventory rose by 4% in the quarter.
We recorded 34,000 metric tons of downtime in the quarter, compared to 83,000 metric tons in the year-ago period. That period included 21,000 metric tons of downtime associated with our mill in Iroquois Falls, Ontario, which has since been permanently closed.
Cost of sales, excluding depreciation, amortization and distribution costs
COS were $58 million lower in the period, reflecting the effect of lower volume ($26 million), the weaker Canadian dollar ($18 million) and a $14 million improvement in manufacturing costs, due to:
• | the effect of asset optimization initiatives, including the closure of our Iroquois Falls mill ($6 million); |
• | higher contribution from cogeneration facilities ($5 million); |
• | lower natural gas prices and recycled paper costs ($4 million); and |
• | a favorable property tax adjustment ($2 million); |
36
partially offset by the recognition of an energy saving incentive in the U.S. Southeast in 2014 ($6 million).
Distribution costs
After removing the effects of lower volume and the weaker Canadian dollar, distribution costs were $2 million lower in the period.
Selling, general and administrative expenses
SG&A was $5 million lower in the period, mostly because of the effect of the weaker Canadian dollar and the timing of expenses.
Nine months ended September 30, 2015 vs. September 30, 2014
Operating (loss) income variance analysis
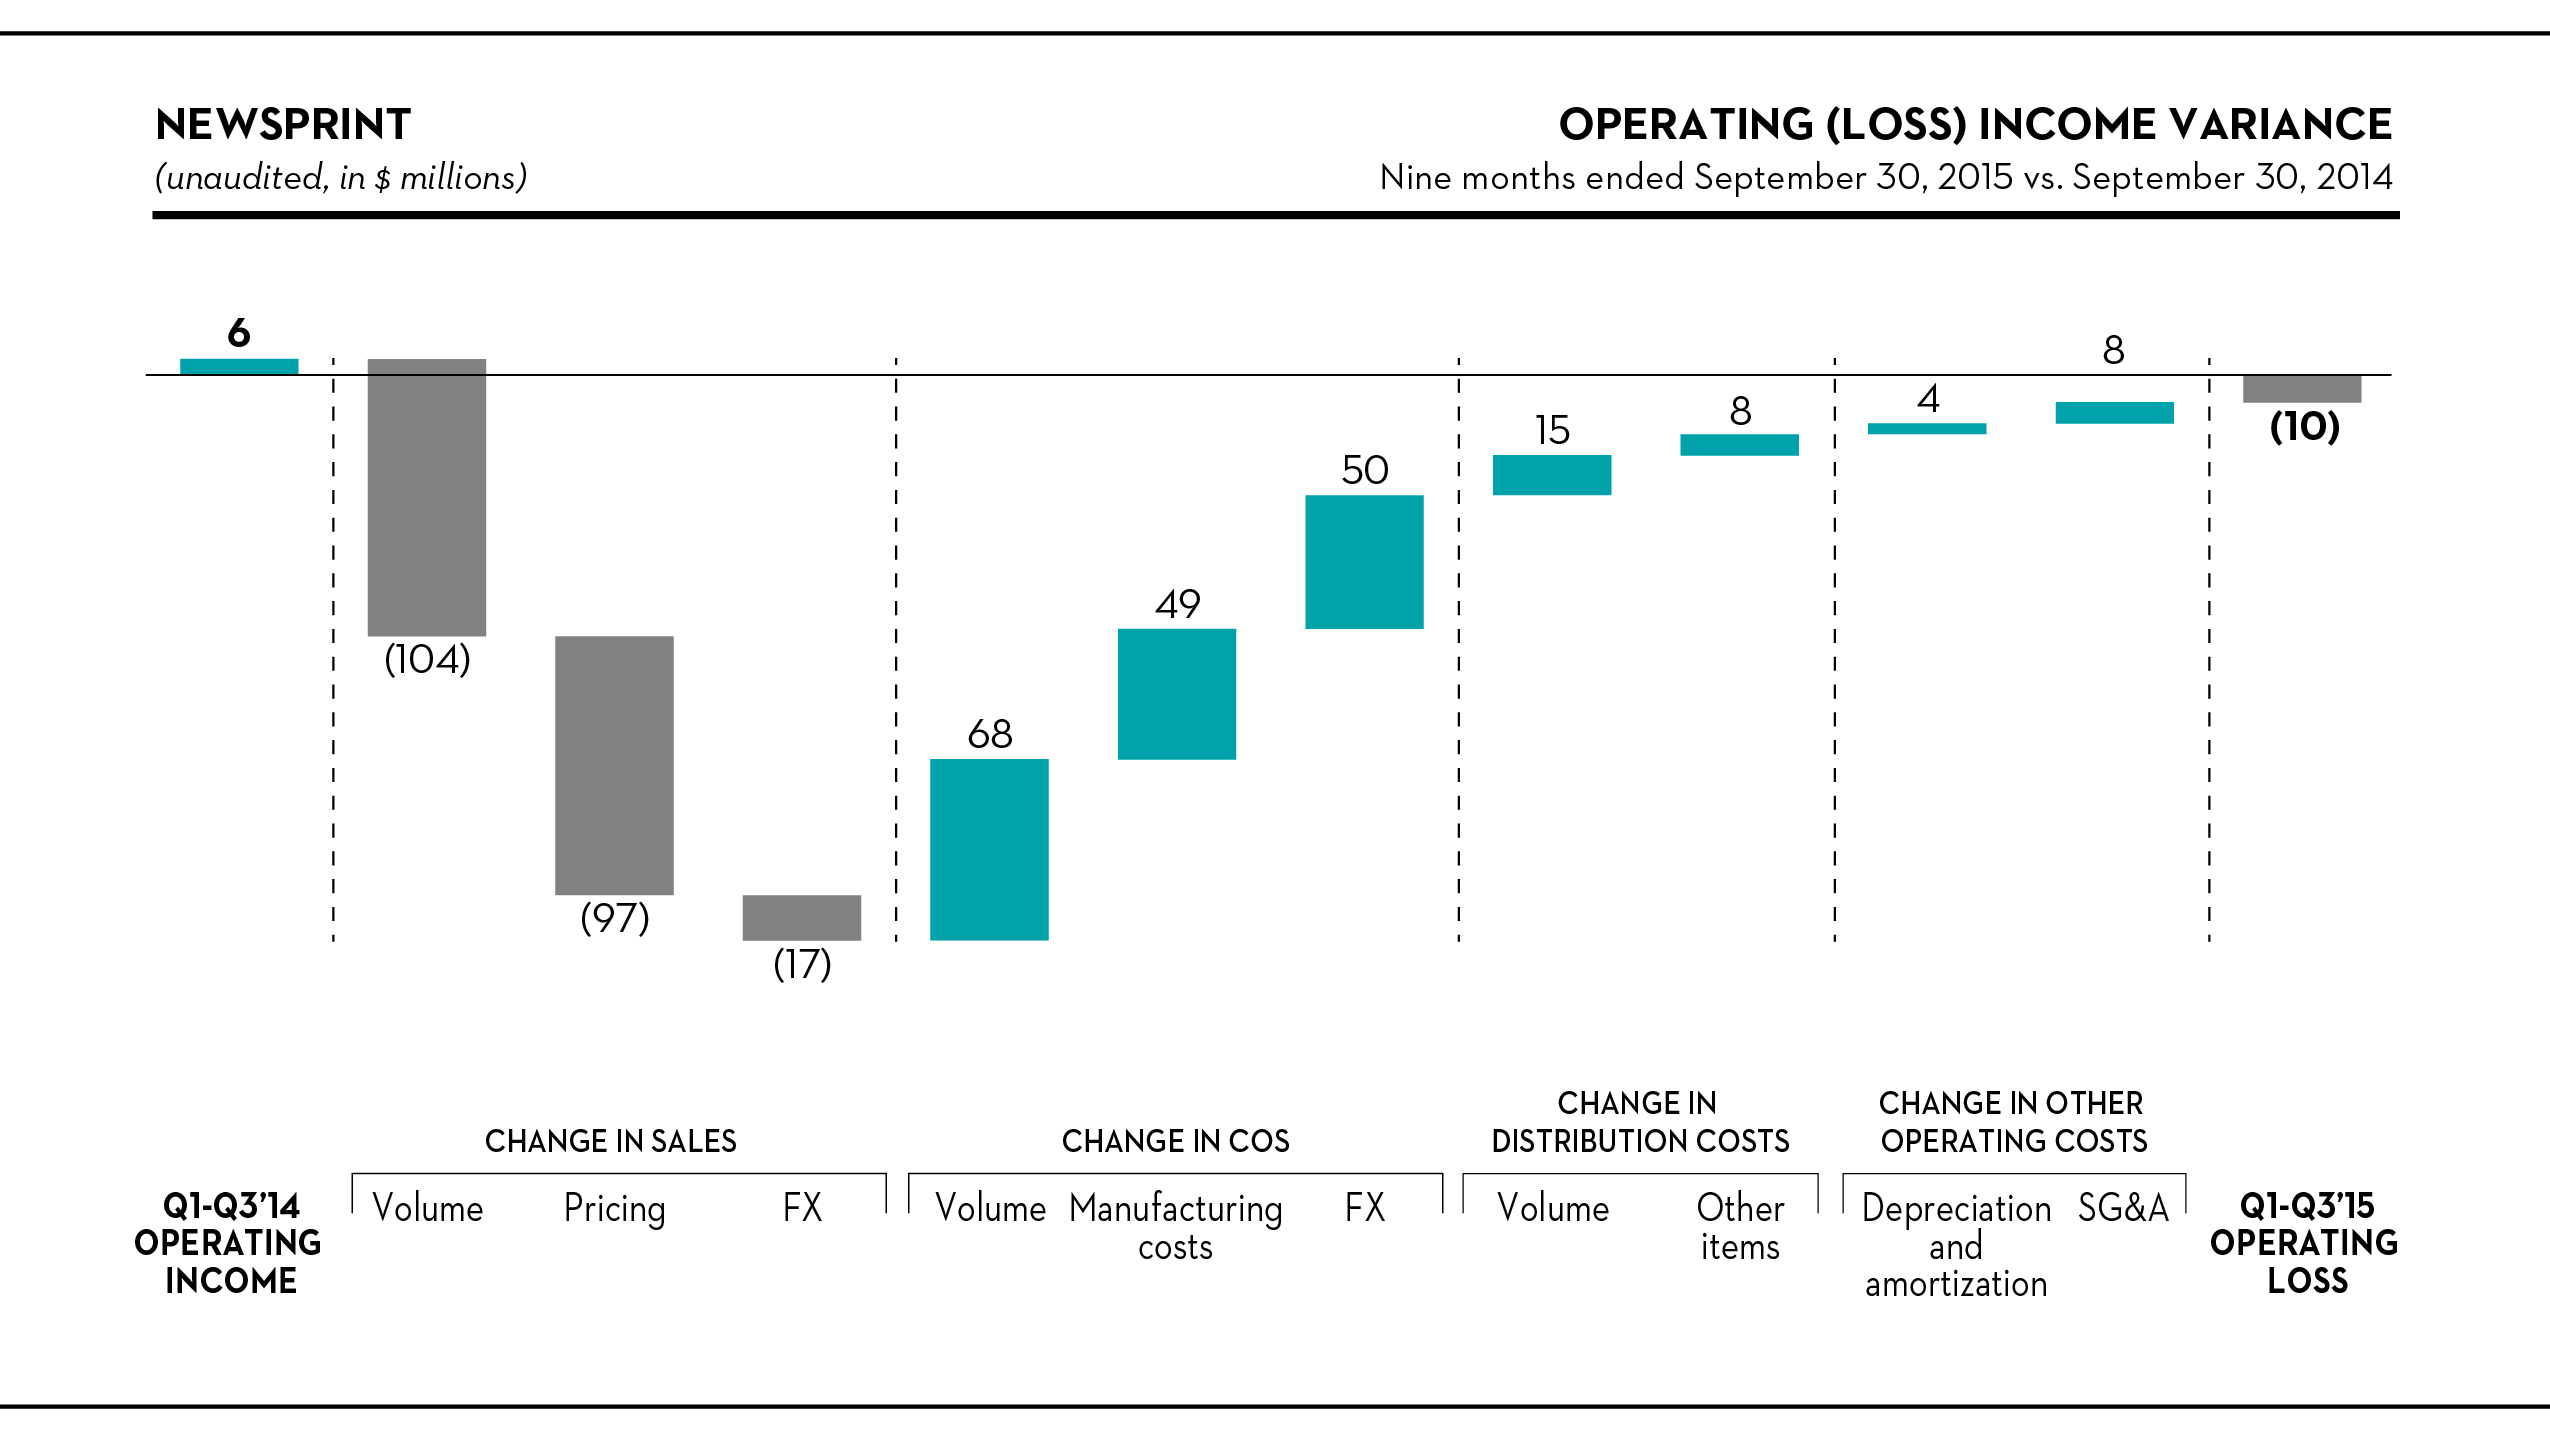
Sales
Newsprint sales dropped by $218 million, or 21%, to $838 million in the first nine months of the year, reflecting a 175,000 metric ton decrease in shipments, in line with lower production volume following our recent capacity closures, and a $71 per metric ton drop in average transaction price, which includes the unfavorable effect of the weaker Canadian dollar on sales denominated in that currency.
Compared to 2014, our international shipments fell by 13% and our domestic shipments were down by 8%. Accordingly, our domestic shipments represented 60% of total newsprint shipments in the period.
We recorded 68,000 metric tons of downtime in 2015, compared to 151,000 metric tons in the comparable period. The 2014 period included 24,000 metric tons of downtime associated with our mill in Iroquois Falls and downtime associated with the fiber availability limitations at certain mills in Québec.
37
Cost of sales, excluding depreciation, amortization and distribution costs
COS were $167 million lower in the period, reflecting the effect of lower volume ($68 million), the weaker Canadian dollar ($50 million) and a $49 million improvement in manufacturing costs, due to:
• | the abnormally cold winter of 2014 ($21 million), particularly the cost of electricity at the Ontario mills; |
• | the effect of asset optimization initiatives, including the closure of our Iroquois Falls mill ($17 million); |
• | lower commodity prices ($10 million); |
• | favorable property tax adjustments ($4 million); |
• | lower maintenance costs ($4 million); and |
• | higher contribution from cogeneration facilities ($3 million); |
offset in part by:
• | higher power prices ($8 million), mainly in Ontario; and |
• | the recognition of an energy saving incentive in the U.S. Southeast in 2014 ($6 million). |
Distribution costs
After removing the effects of lower volume and the weaker Canadian dollar, distribution costs were $5 million lower in the period, primarily due to the weather-related increases in freight and warehousing costs in the first quarter of 2014. Lower fuel surcharges in 2015 were offset in part by higher freight rates.
Selling, general and administrative expenses
SG&A was $8 million lower in the period primarily due to the effect of the weaker Canadian dollar and the timing of expenses.
38
SPECIALTY PAPERS
Highlights
Three Months Ended September 30, | Nine Months Ended September 30, | ||||||||||||||||
(unaudited, in millions, except where otherwise stated) | 2015 | 2014 | 2015 | 2014 | |||||||||||||
Sales | $ | 286 | $ | 329 | $ | 830 | $ | 955 | |||||||||
Operating income (loss) (1) | 9 | 6 | 31 | (23 | ) | ||||||||||||
EBITDA (2) | 27 | 26 | 85 | 41 | |||||||||||||
(in thousands of short tons) | |||||||||||||||||
Shipments | 411 | 463 | 1,181 | 1,335 | |||||||||||||
Downtime | 18 | 13 | 43 | 113 | |||||||||||||
As of September 30, | ||||||||
(unaudited, in thousands of short tons) | 2015 | 2014 | ||||||
Finished goods inventory | 102 | 122 | ||||||
(1) | Net income (loss) including noncontrolling interests is equal to operating income (loss) in this segment. |
(2) | EBITDA, a non-GAAP financial measure, is reconciled below. For more information on the calculation and reasons we include this measure, see note 1 under “Results of Operations – Consolidated Results – Selected Financial Information” above. |
Three Months Ended September 30, | Nine Months Ended September 30, | ||||||||||||||||
(unaudited, in millions) | 2015 | 2014 | 2015 | 2014 | |||||||||||||
Net income (loss) including noncontrolling interests | $ | 9 | $ | 6 | $ | 31 | $ | (23 | ) | ||||||||
Depreciation and amortization | 18 | 20 | 54 | 64 | |||||||||||||
EBITDA | 27 | 26 | 85 | 41 | |||||||||||||
Industry trends
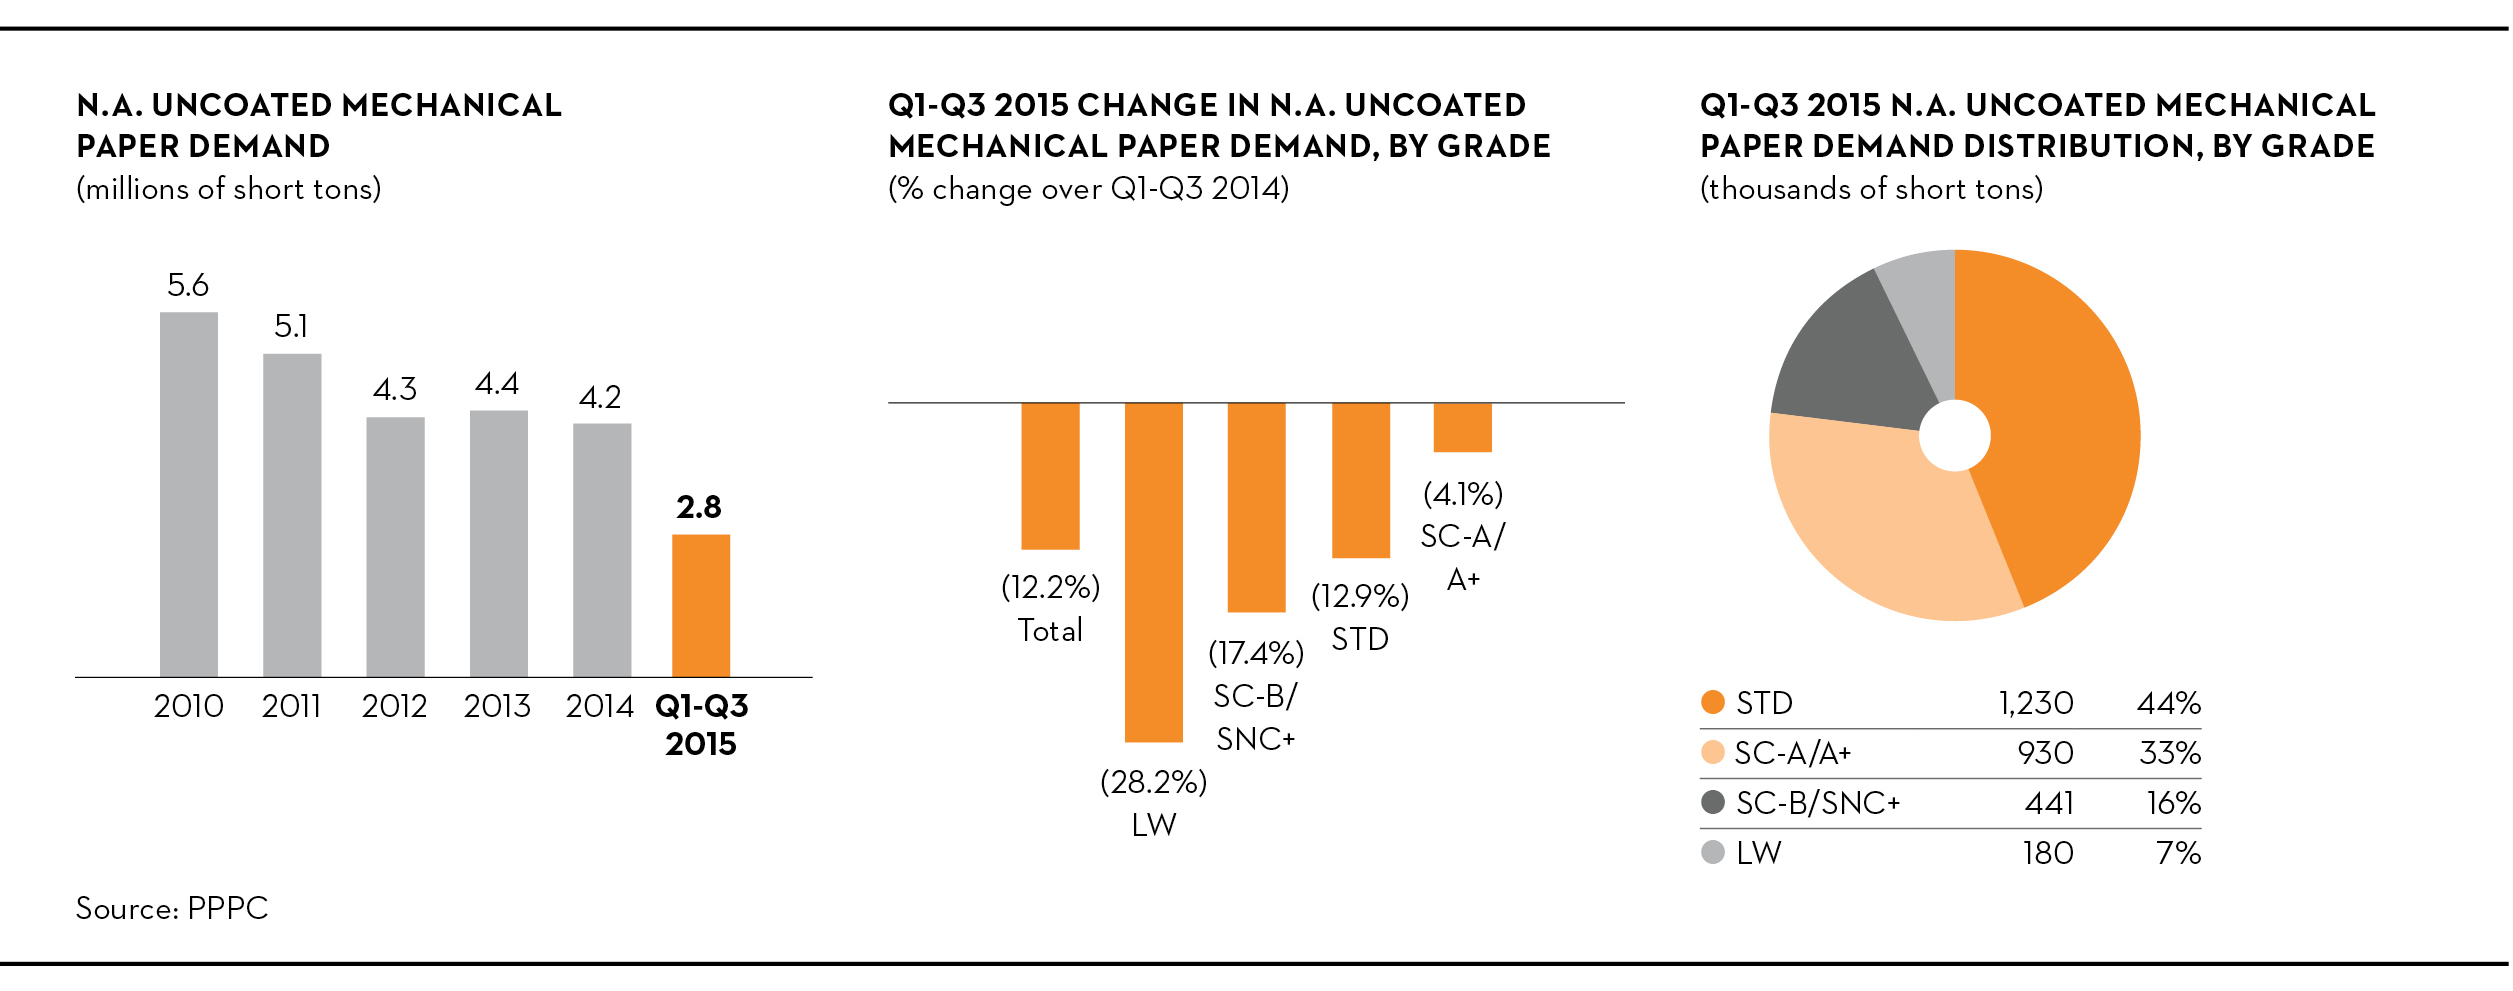
Year-to-date demand for uncoated mechanical papers was down by 12% in North America, with supercalendered, or “SC”, grades down by 9% and standard grades, which include our super-brights and high-brights, down by 13%. Overall production was down by a corresponding 14%, leading to operating rates of 90%.
39
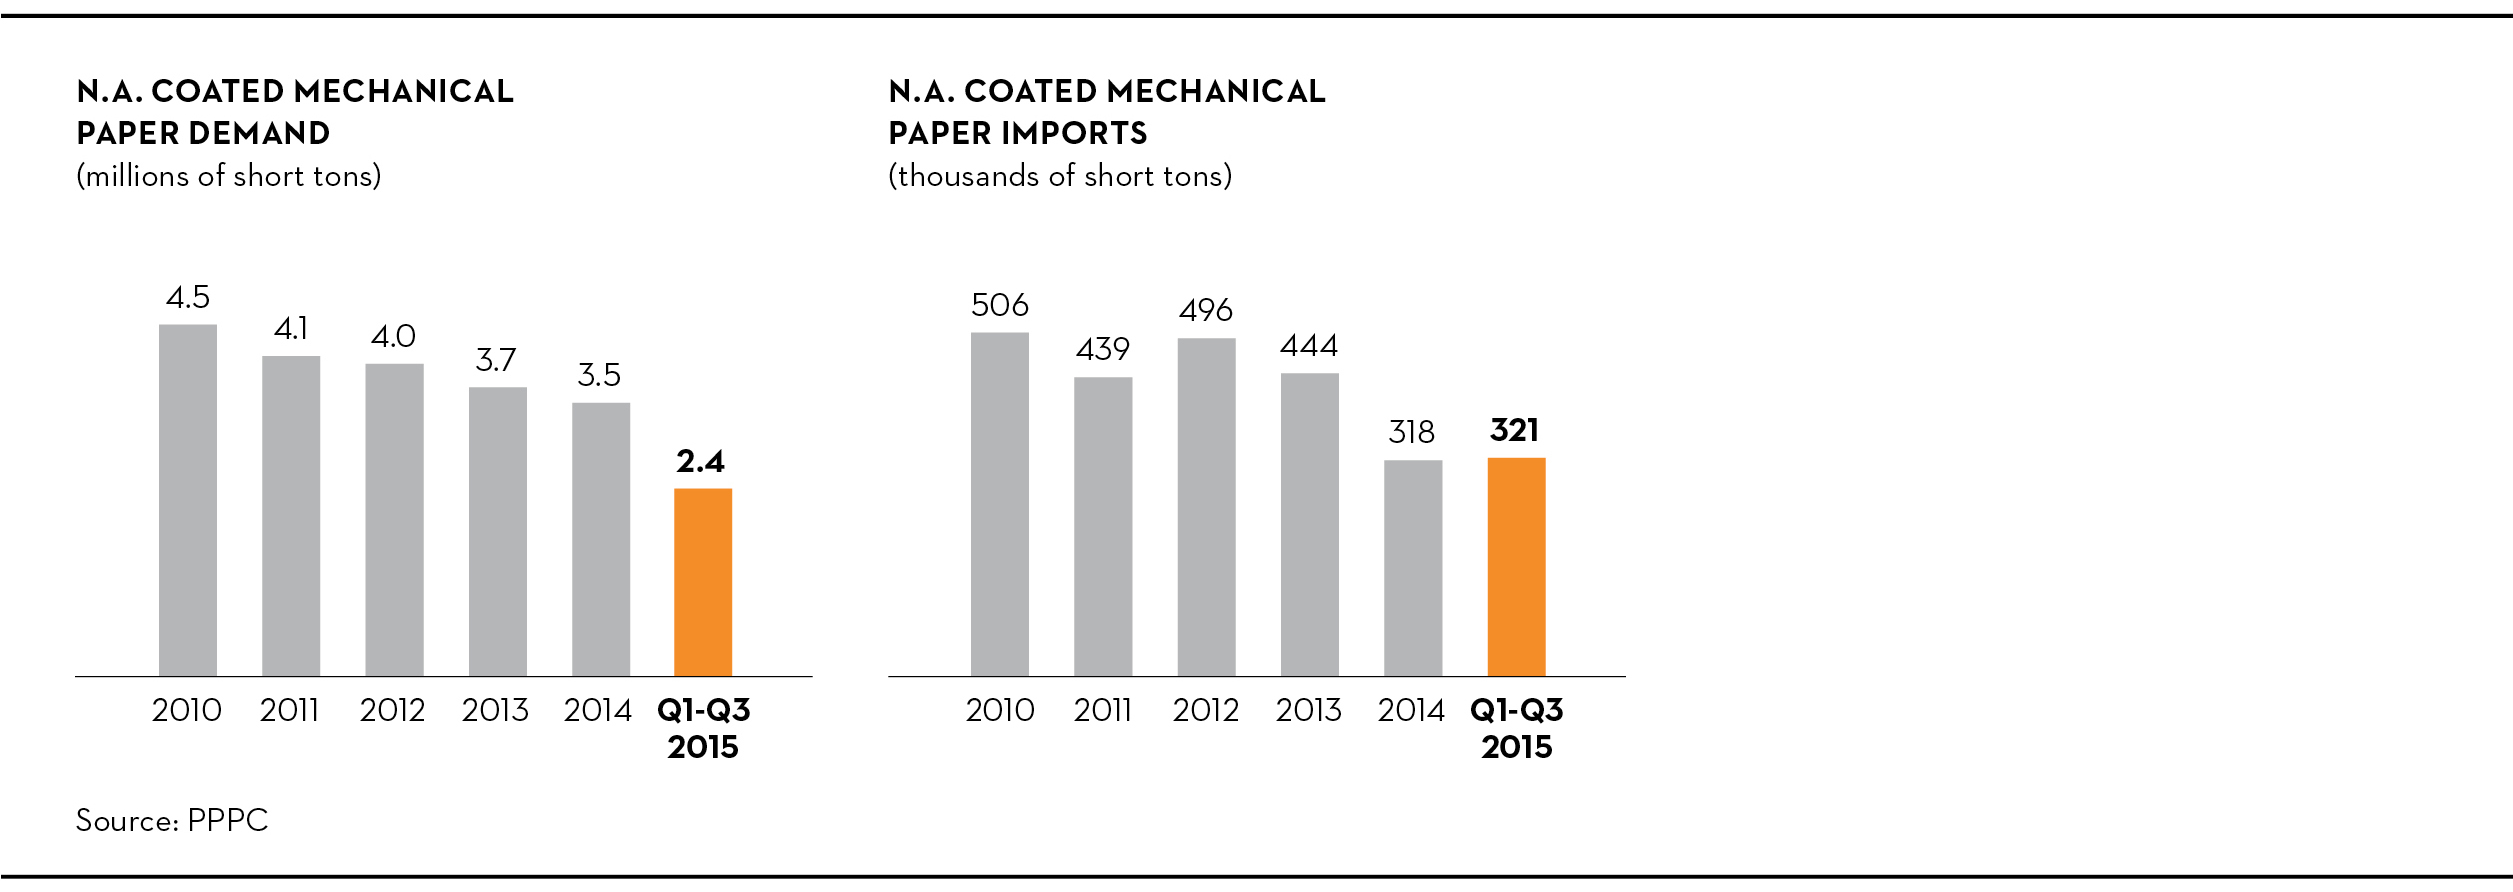
Demand for coated mechanical grades was down by 7% through September, but the shipment-to-capacity ratio was 93% as a result of a 9% reduction in capacity.
Three months ended September 30, 2015 vs. September 30, 2014
Operating income variance analysis
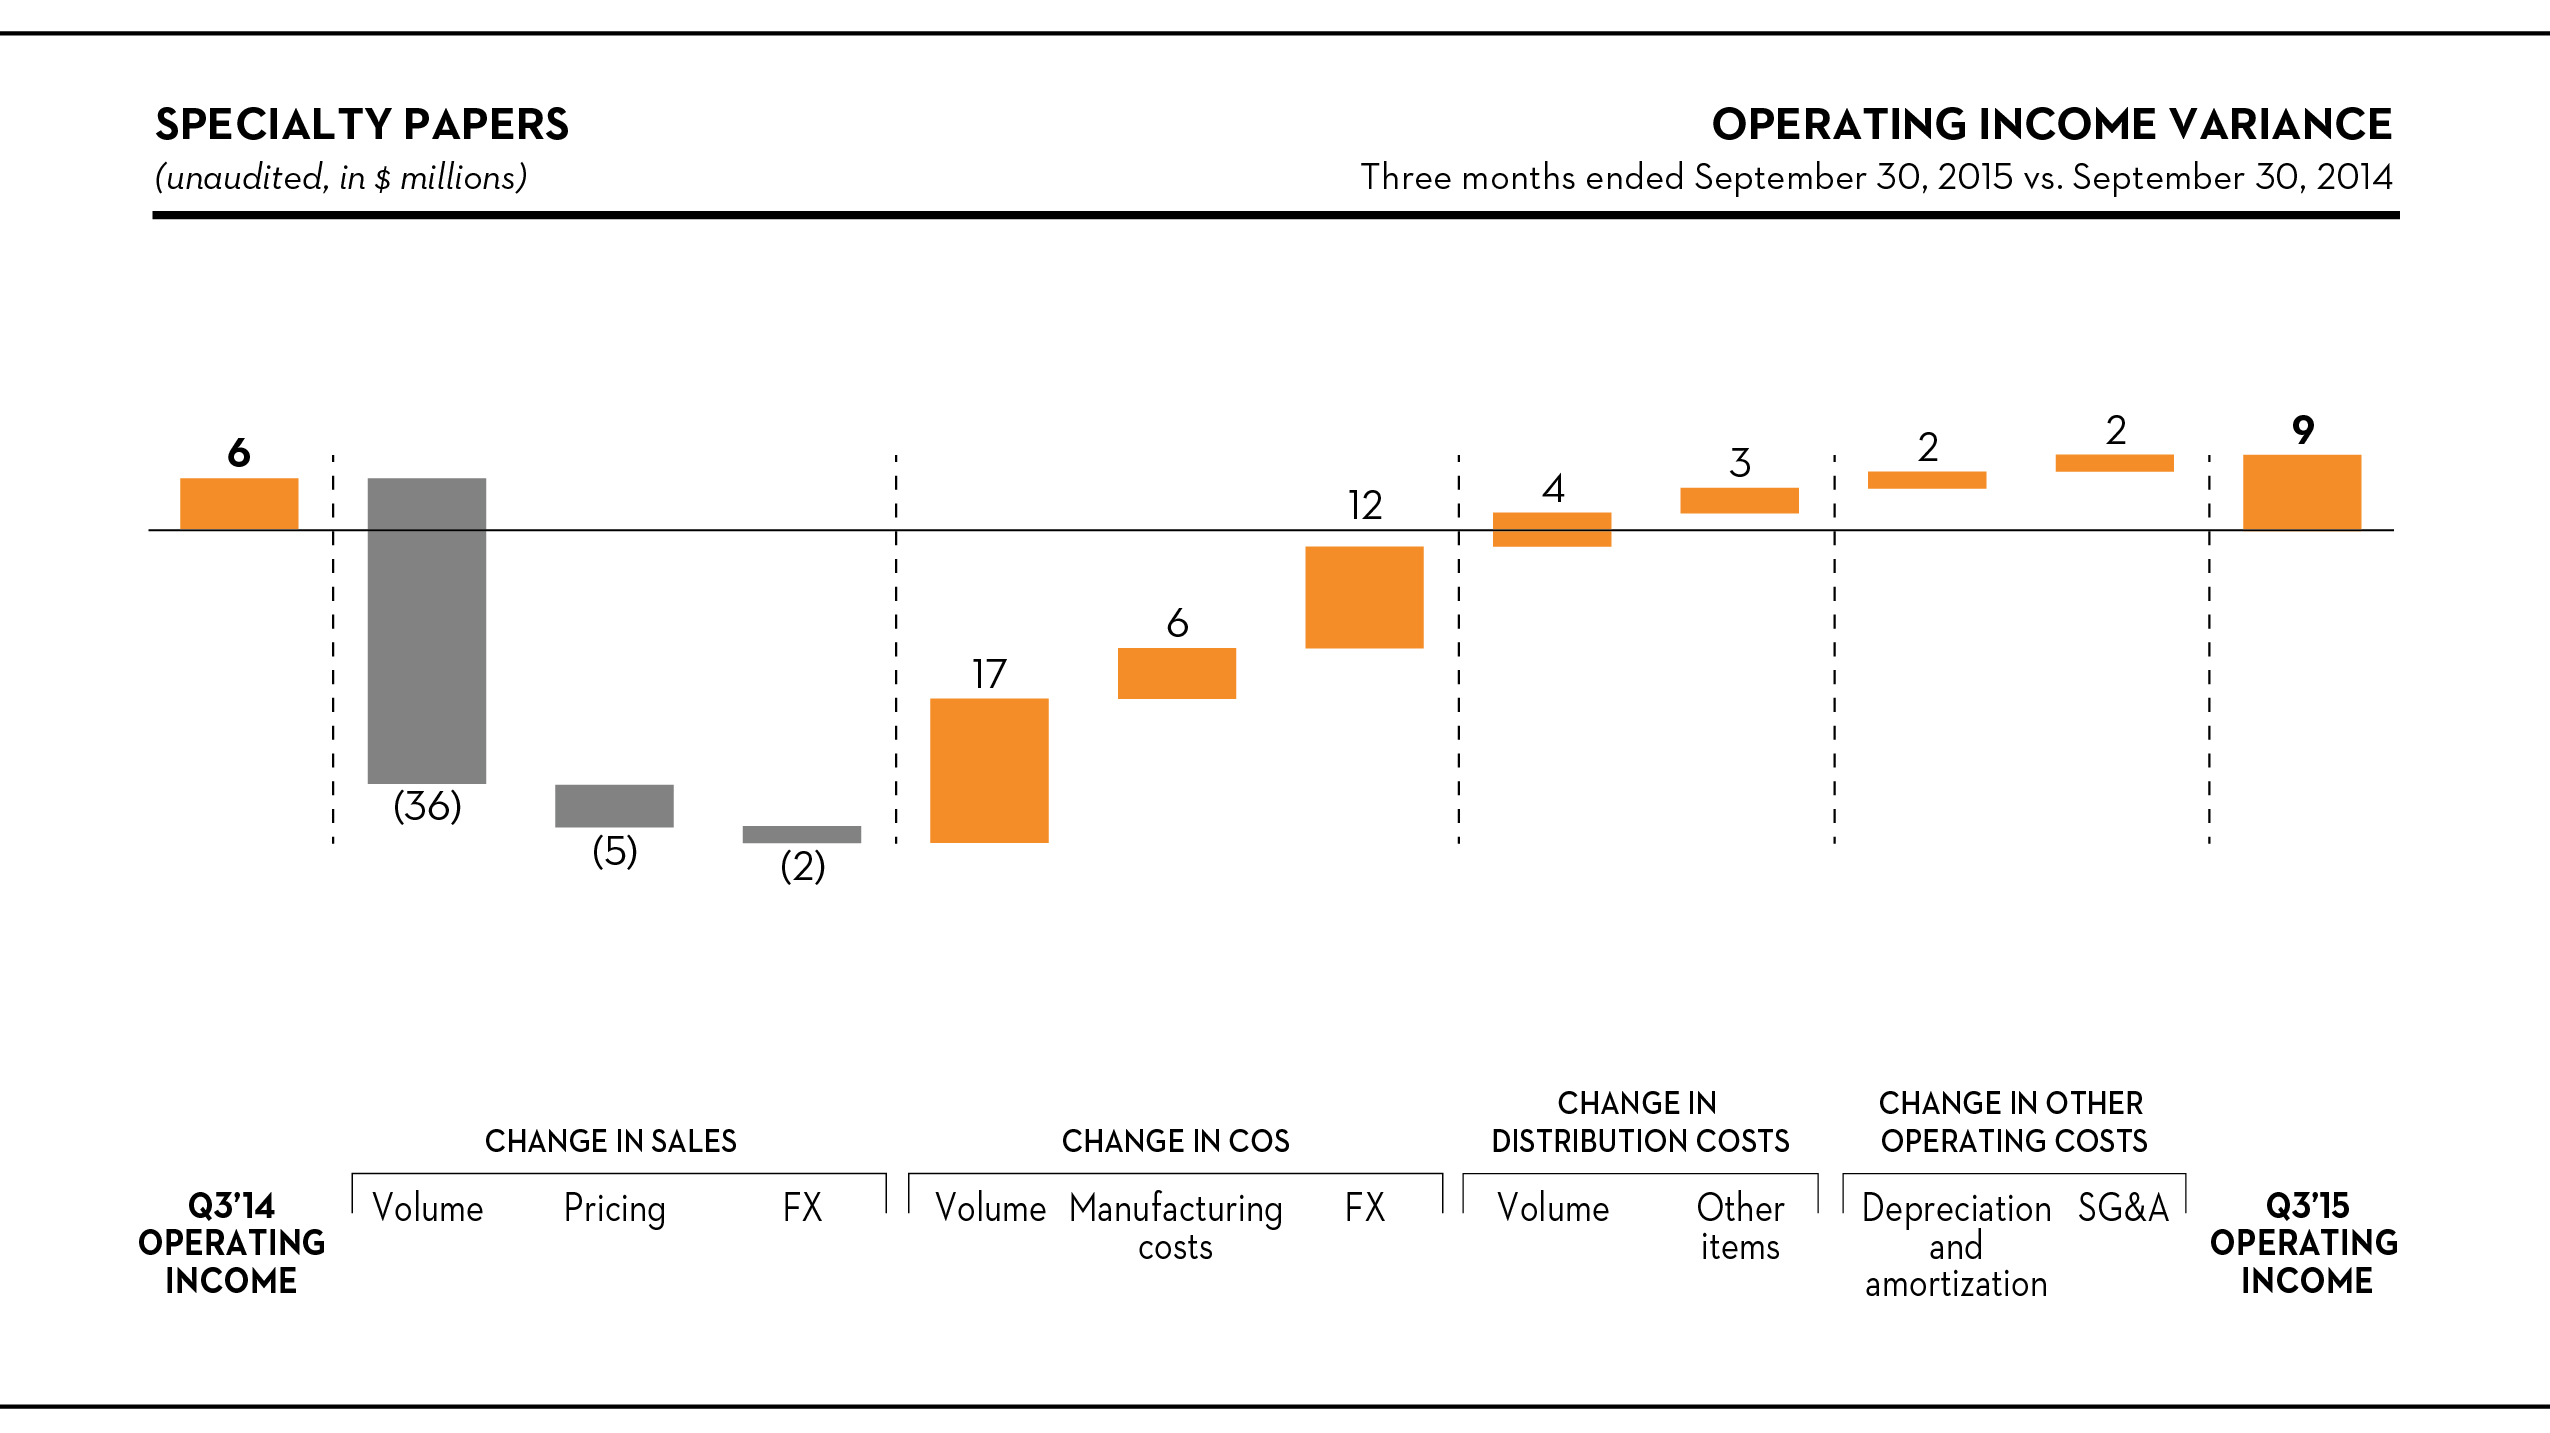
Sales
Specialty paper sales decreased by $43 million, or 13%, to $286 million in the third quarter, mostly because of a 52,000 short ton (47,200 metric tons) reduction in shipments following the closure of our Laurentide, Québec, mill in the fourth quarter of 2014.
Cost of sales, excluding depreciation, amortization and distribution costs
COS improved by $35 million in the quarter. After removing the effects of the weaker Canadian dollar and lower volume, our manufacturing costs fell by $6 million, mostly reflecting the effect of asset optimization initiatives ($4 million) with the closure of our Laurentide mill in 2014.
40
Distribution costs
After removing the effects of lower volume and the weaker Canadian dollar, distribution costs were $2 million lower in the period.
Nine months ended September 30, 2015 vs. September 30, 2014
Operating income (loss) variance analysis
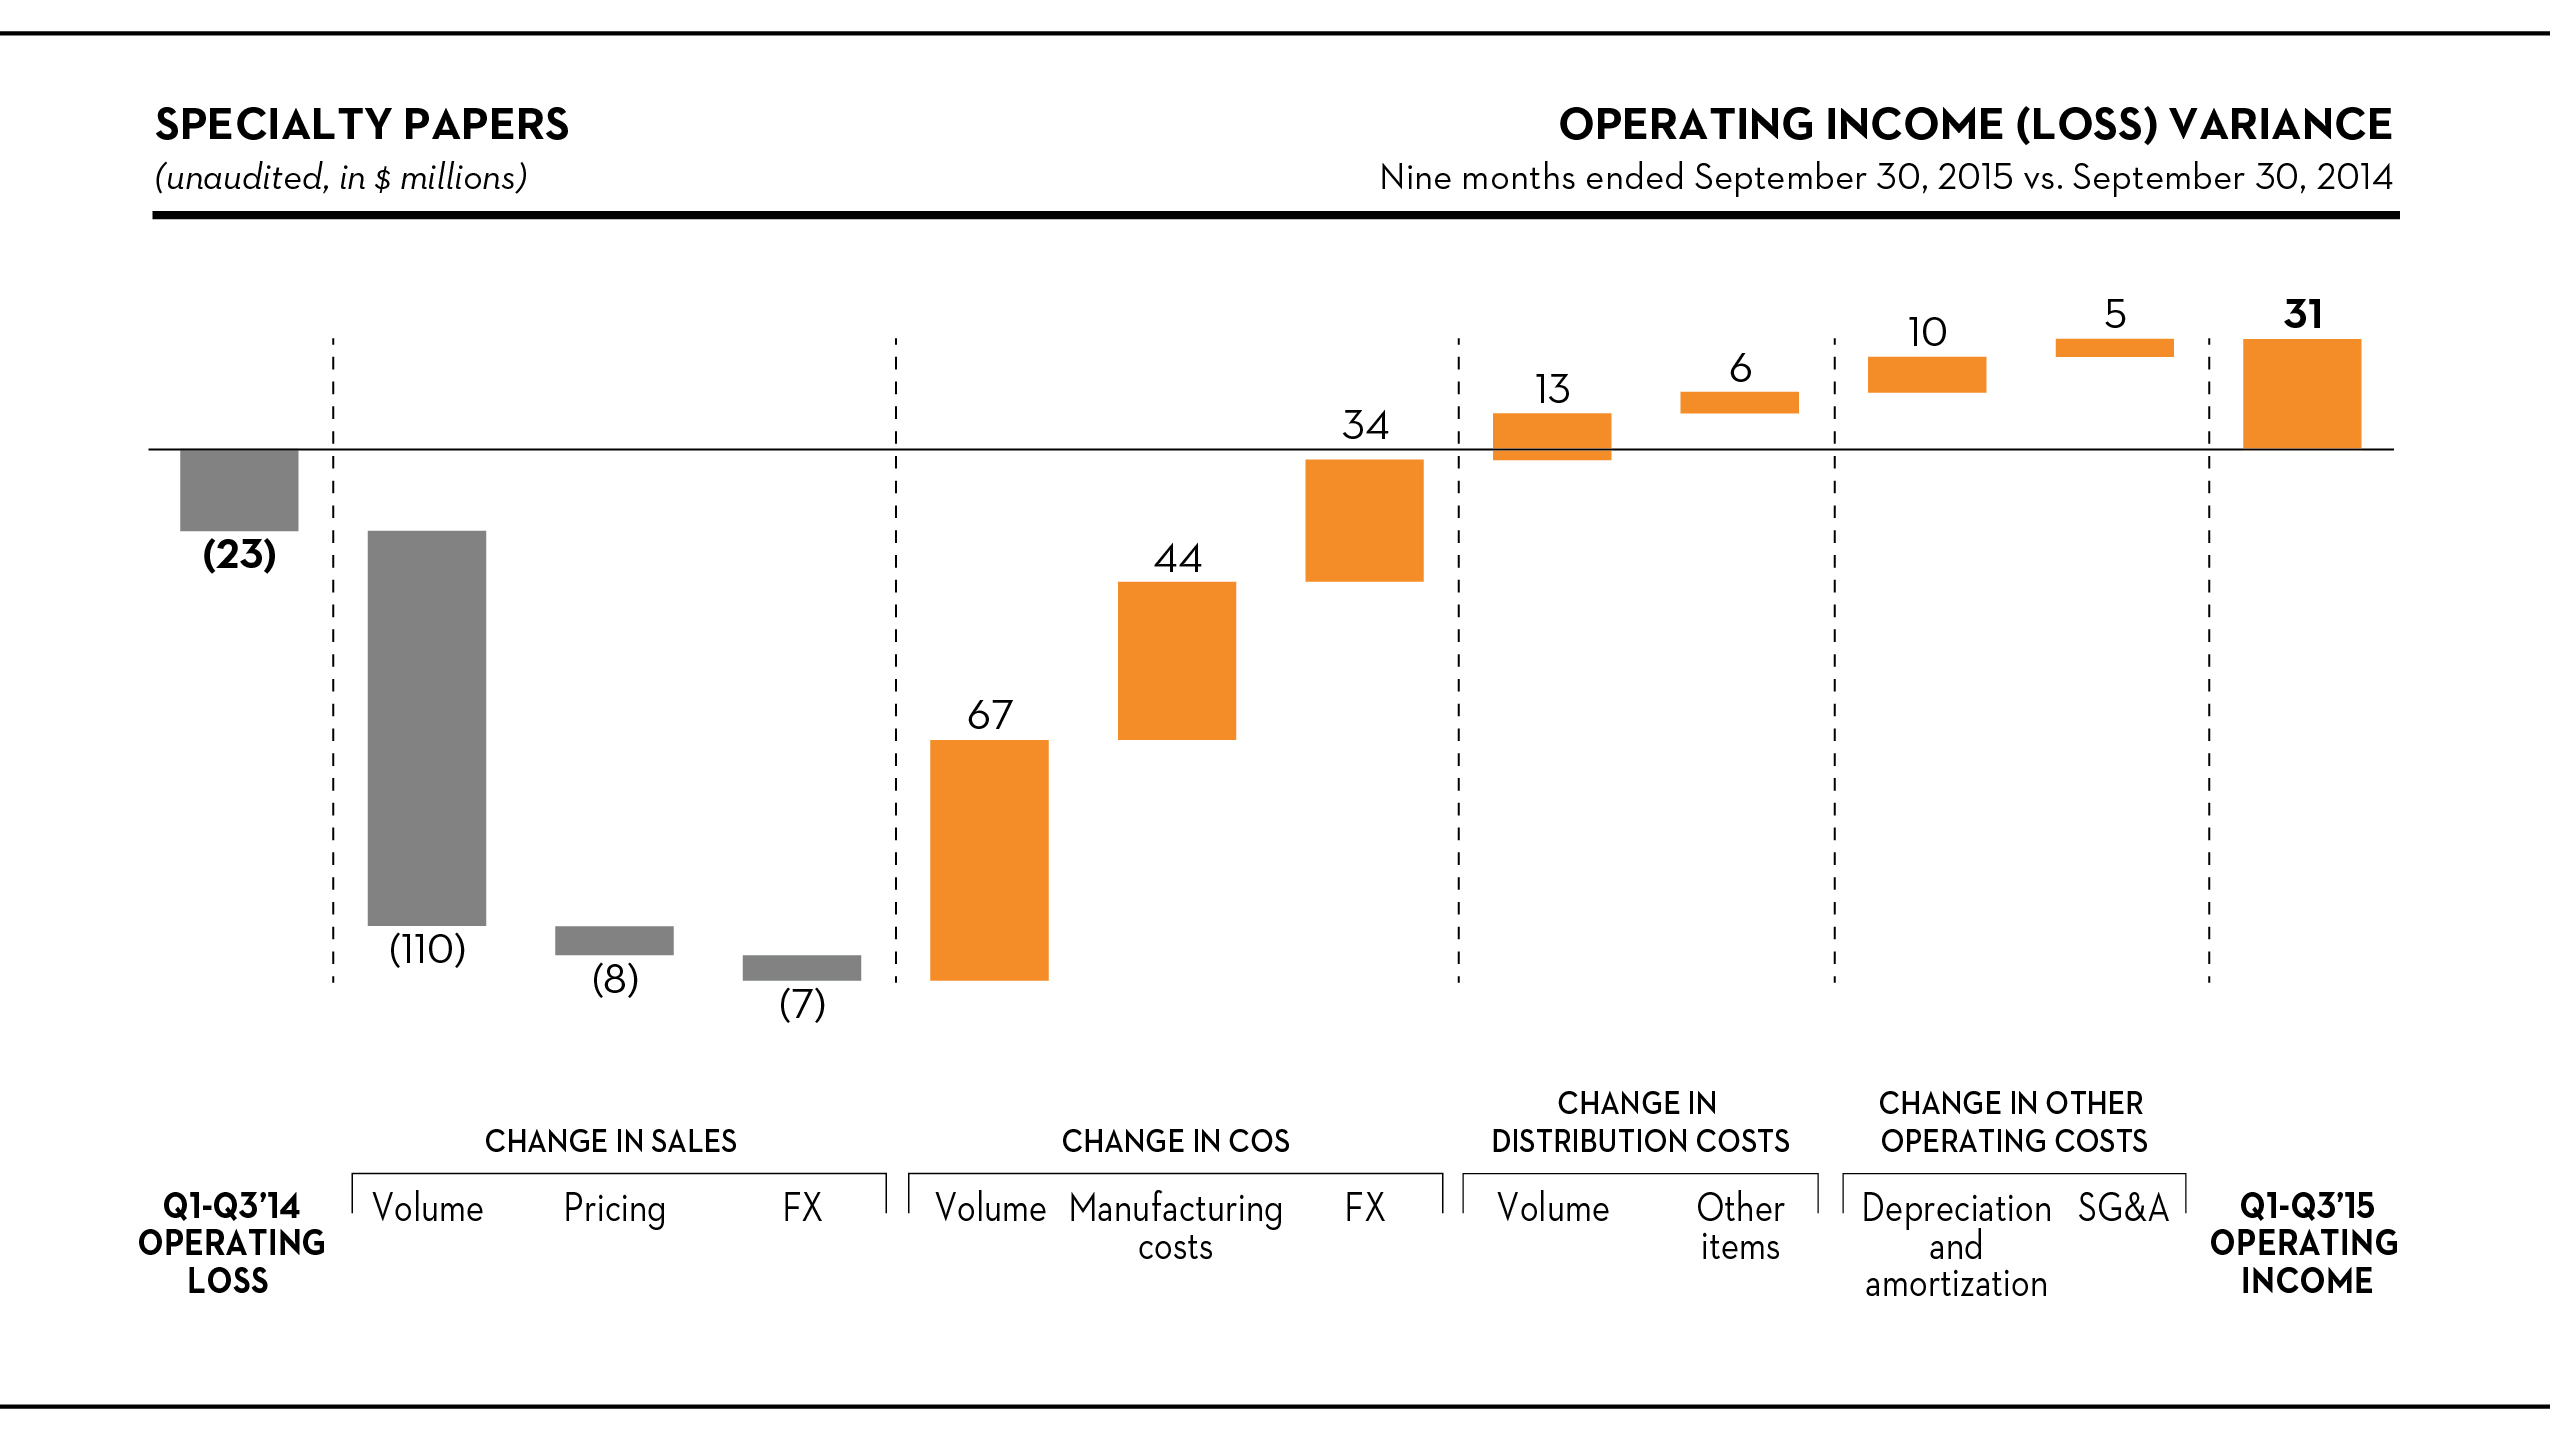
Sales
Specialty paper sales decreased by $125 million, or 13%, to $830 million in the first nine months of the year, mostly as a result of a 154,000 short ton (139,700 metric tons) drop in shipments with the closure of our Laurentide mill in the fourth quarter of 2014.
We recorded 43,000 short tons (39,000 metric tons) of downtime in 2015, compared to 113,000 short tons (102,500 metric tons) in the comparable period. That period included 56,000 short tons (50,800 metric tons) of downtime associated with the idled paper machines at Catawba, South Carolina, and Fort Frances, Ontario, both of which have since been permanently closed and are no longer recorded as downtime.
Cost of sales, excluding depreciation, amortization and distribution costs
COS improved by $145 million in the period. After removing the effects of the weaker Canadian dollar and lower volume, our manufacturing costs fell by $44 million, reflecting:
• | the effect of asset optimization initiatives ($15 million), including the closure of our Laurentide and Fort Frances mills in 2014; |
• | the abnormally cold winter of 2014 ($11 million), which included a significant increase in steam costs, particularly at our U.S. Southeast mills; |
• | better chemical and steam costs as a result of lower prices and higher mill efficiencies ($10 million); and |
• | lower maintenance costs and fewer operational disruptions ($8 million); |
offset in part by higher fiber usage, in part due to product mix ($7 million).
41
Distribution costs
After removing the effects of lower volume and the weaker Canadian dollar, distribution costs were $4 million lower in the period, primarily due to the weather-related increases in freight and warehousing costs in the first quarter of 2014. The favorable effect of lower fuel surcharges was almost all offset by the impact of an increase in average length of haul and higher freight rates.
Depreciation and amortization
The lower depreciation and amortization reflects the closure of a machine at our Catawba mill and the permanent closure of the Laurentide mill.
Selling, general and administrative expenses
SG&A was $5 million lower in the period, mostly due to the effect of the weaker Canadian dollar and the timing of expenses.
42
MARKET PULP
Highlights
Three Months Ended September 30, | Nine Months Ended September 30, | ||||||||||||||||
(unaudited, in millions, except where otherwise stated) | 2015 | 2014 | 2015 | 2014 | |||||||||||||
Sales | $ | 230 | $ | 255 | $ | 679 | $ | 730 | |||||||||
Operating income (1) | 22 | 20 | 59 | 51 | |||||||||||||
EBITDA (2) | 36 | 33 | 99 | 90 | |||||||||||||
(in thousands of metric tons) | |||||||||||||||||
Shipments | 360 | 363 | 1,039 | 1,032 | |||||||||||||
Downtime | 25 | 27 | 90 | 63 | |||||||||||||
As of September 30, | ||||||||
(unaudited, in thousands of metric tons) | 2015 | 2014 | ||||||
Finished goods inventory | 77 | 94 | ||||||
(1) | Net income including noncontrolling interests is equal to operating income in this segment. |
(2) | EBITDA, a non-GAAP financial measure, is reconciled below. For more information on the calculation and reasons we include this measure, see note 1 under “Results of Operations – Consolidated Results – Selected Financial Information” above. |
Three Months Ended September 30, | Nine Months Ended September 30, | ||||||||||||||||
(unaudited, in millions) | 2015 | 2014 | 2015 | 2014 | |||||||||||||
Net income including noncontrolling interests | $ | 22 | $ | 20 | $ | 59 | $ | 51 | |||||||||
Depreciation and amortization | 14 | 13 | 40 | 39 | |||||||||||||
EBITDA | 36 | 33 | 99 | 90 | |||||||||||||
Industry trends
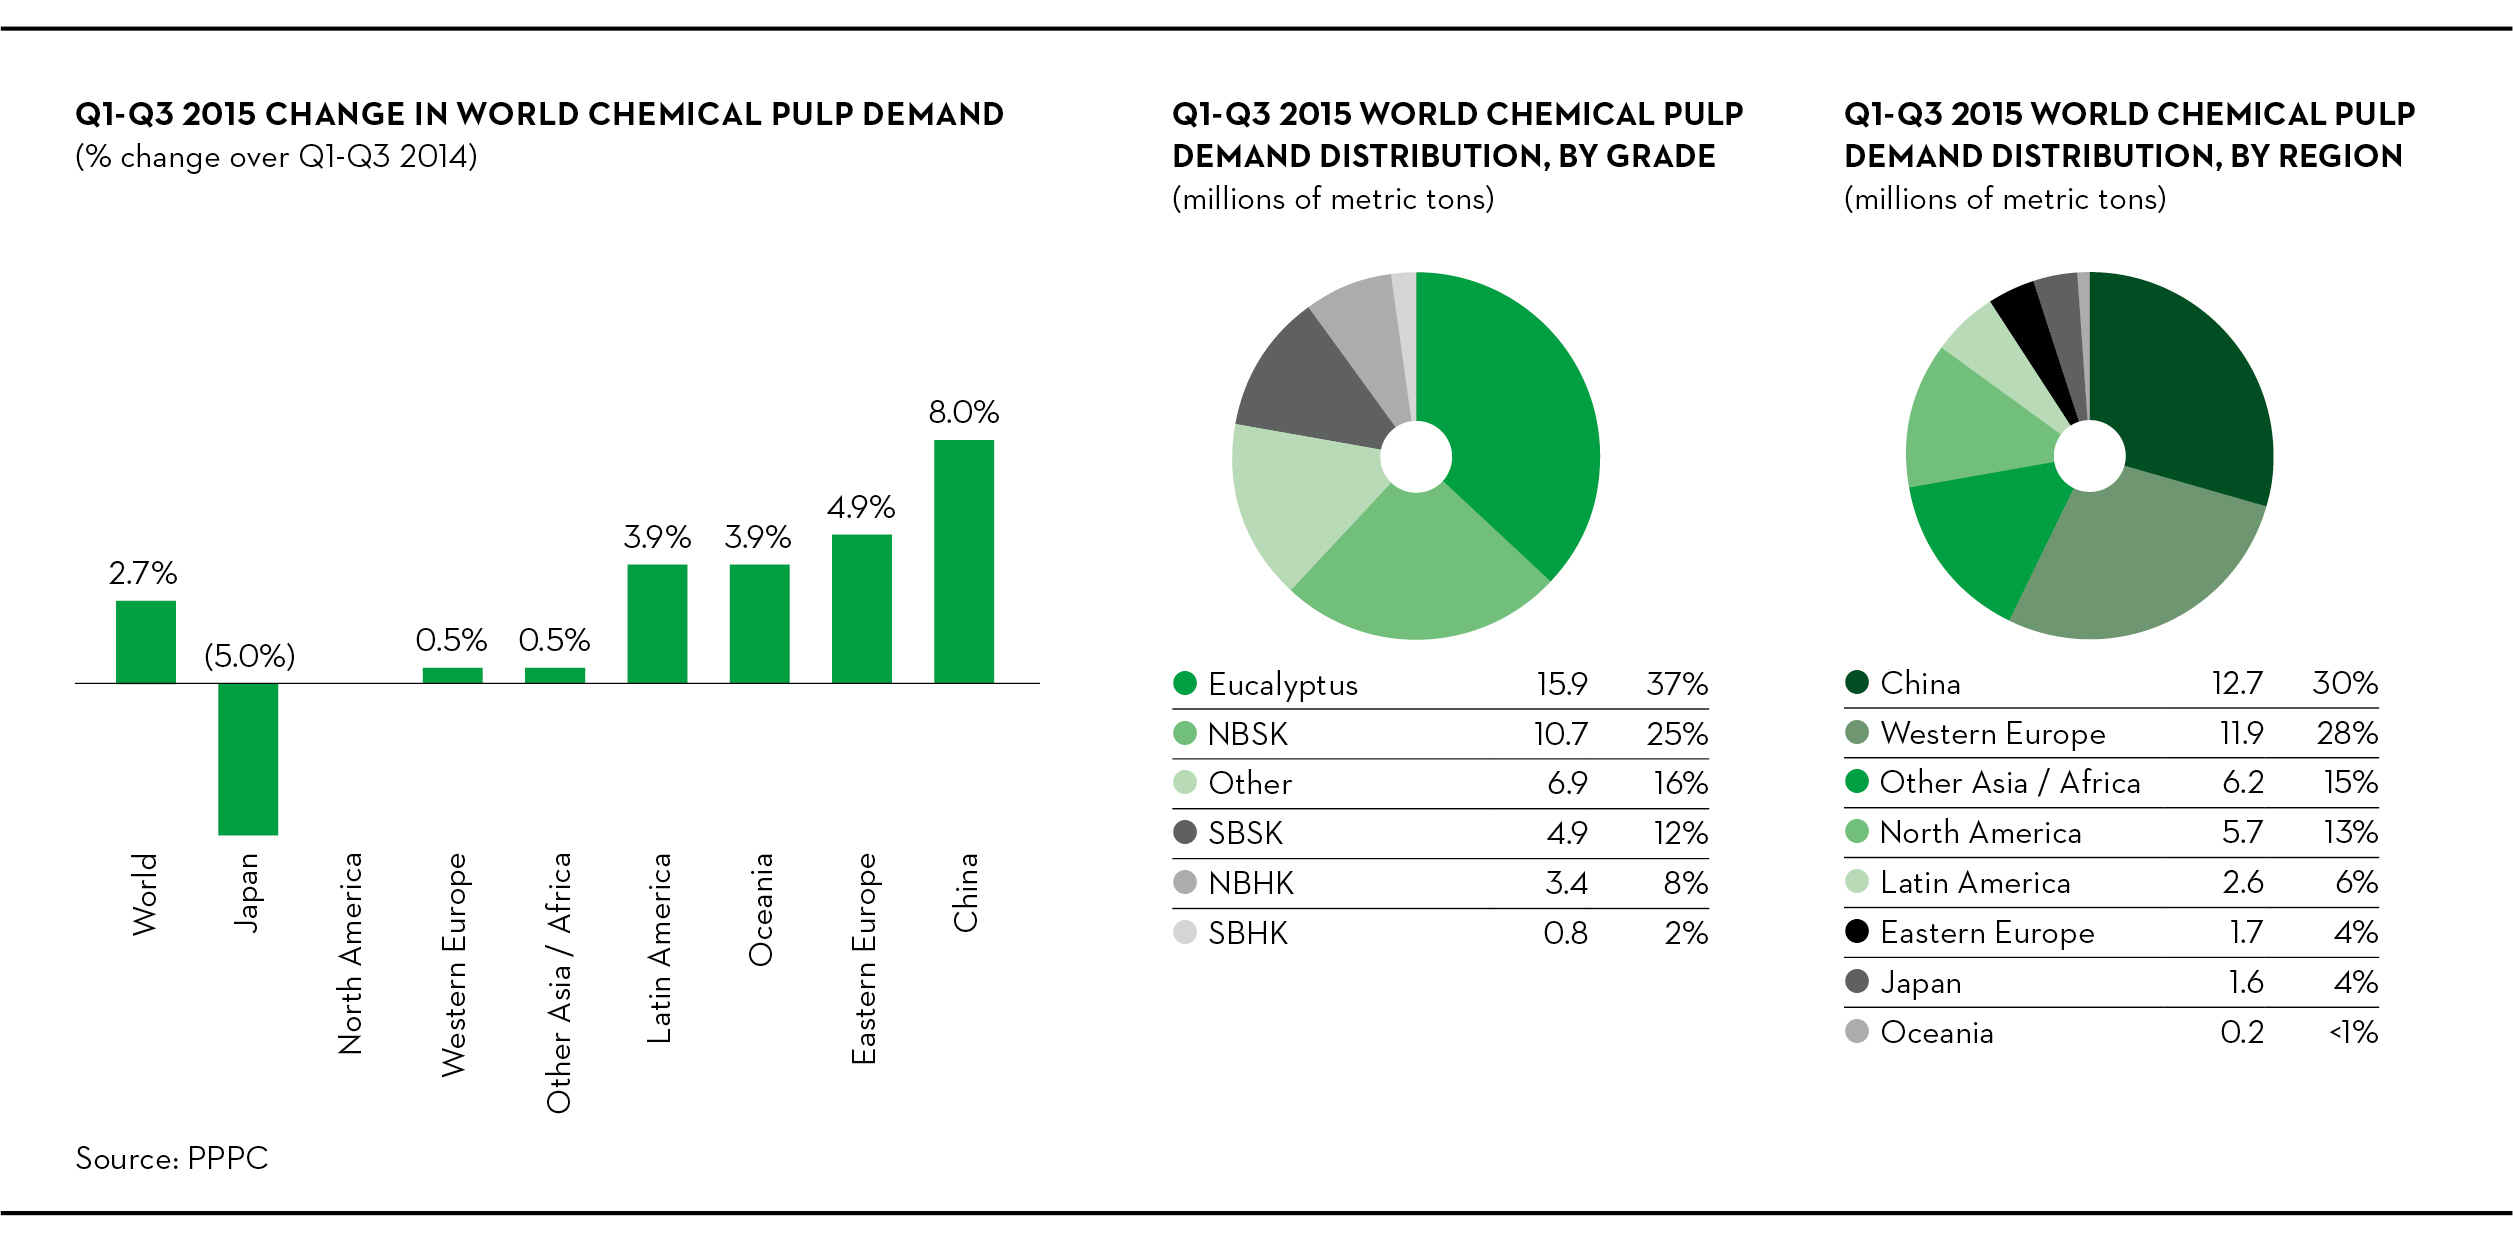
Through September, world demand for chemical pulp grew by 3% compared to the same period of 2014, including an increase of 8% in China and 4% in Latin America. World capacity grew by approximately 2% in the same period, mostly reflecting the
43
significant expansions of Latin American hardwood capacity. Year-to-date demand for softwood was up by 1%, which reflects a 7% increase in shipments to China, offset by a 3% decrease of shipments to Western Europe. In the same period, demand for hardwood pulp was up by 4%, with shipments higher by 9% to China and 3% to Western Europe, but down by 4% to North America.
Three months ended September 30, 2015 vs. September 30, 2014
Operating income variance analysis
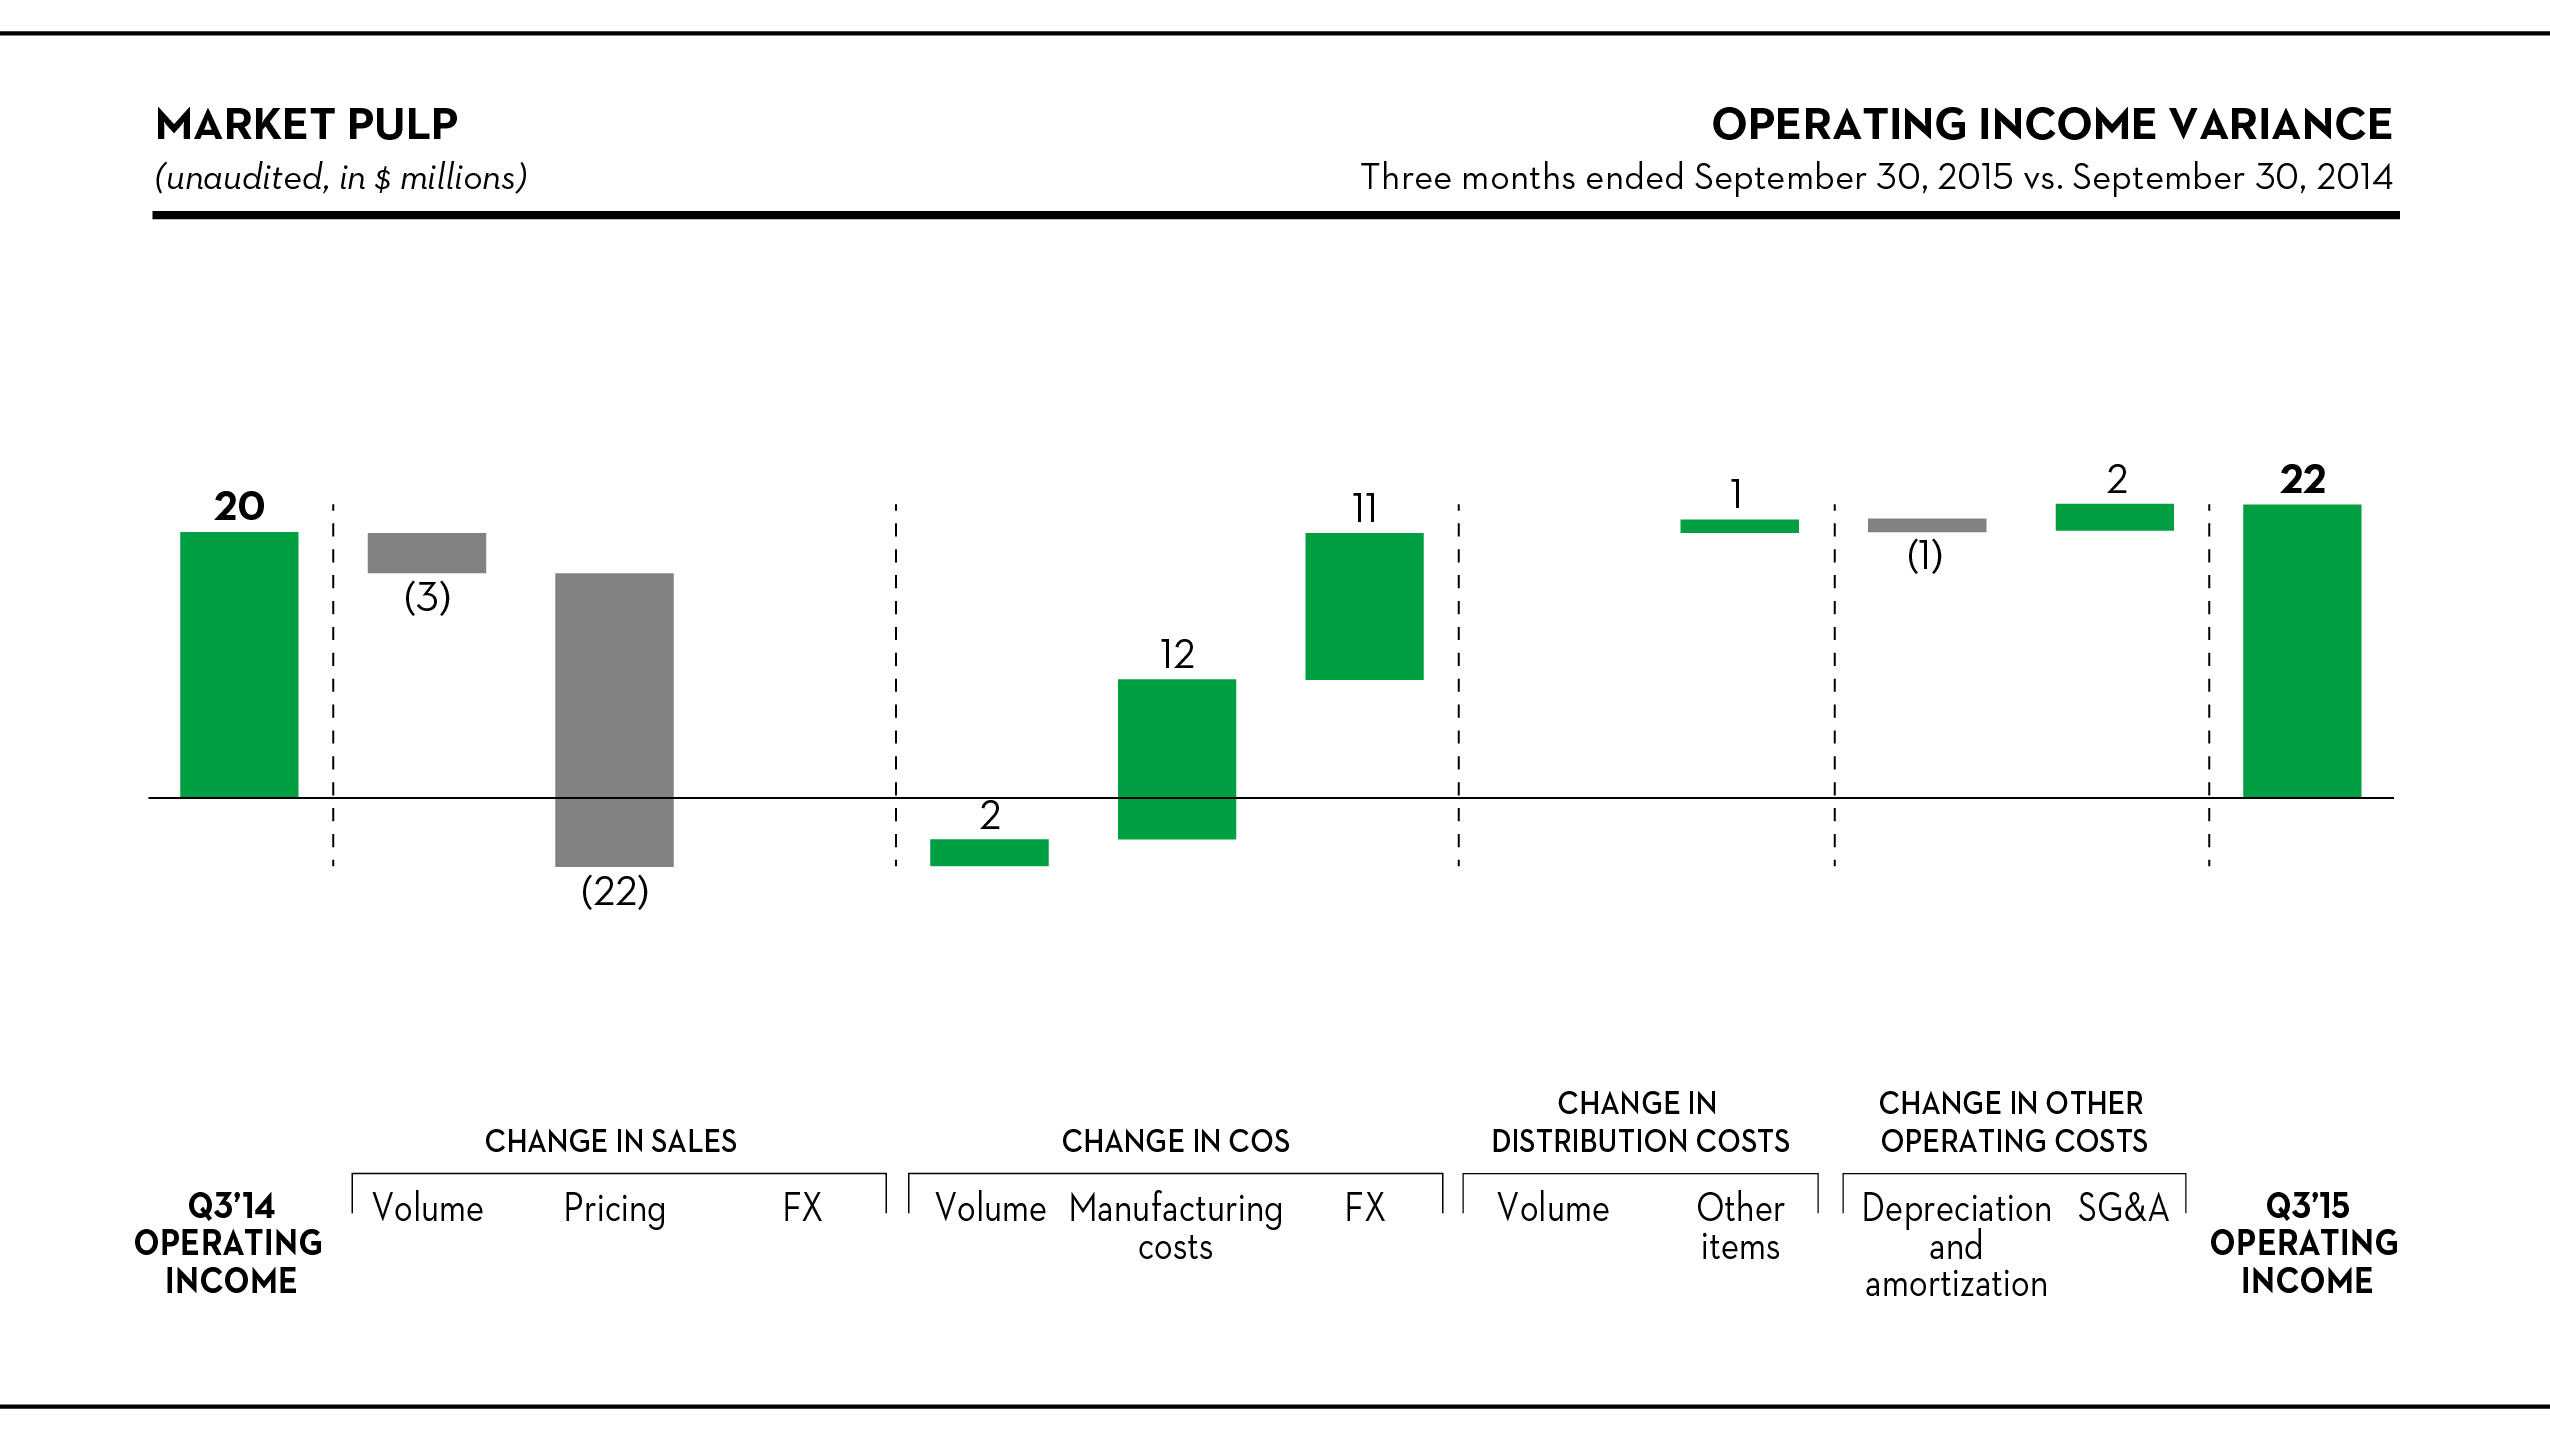
Sales
Sales were $25 million lower, or 10%, to $230 million in the quarter. Shipments were essentially unchanged, down 3,000 metric tons, but the average transaction price fell by $62 per metric ton. The lower prices affected all the subgrades, but it was most pronounced in softwood and fluff pulp.
Cost of sales, excluding depreciation, amortization and distribution costs
COS improved by $25 million in the quarter. When adjusting for the effects of lower volume and the weaker Canadian dollar, manufacturing costs improved by $12 million as a result of:
• | lower commodity prices and higher mill efficiencies ($7 million); and |
• | a favorable property tax adjustment ($4 million). |
44
Nine months ended September 30, 2015 vs. September 30, 2014
Operating income variance analysis
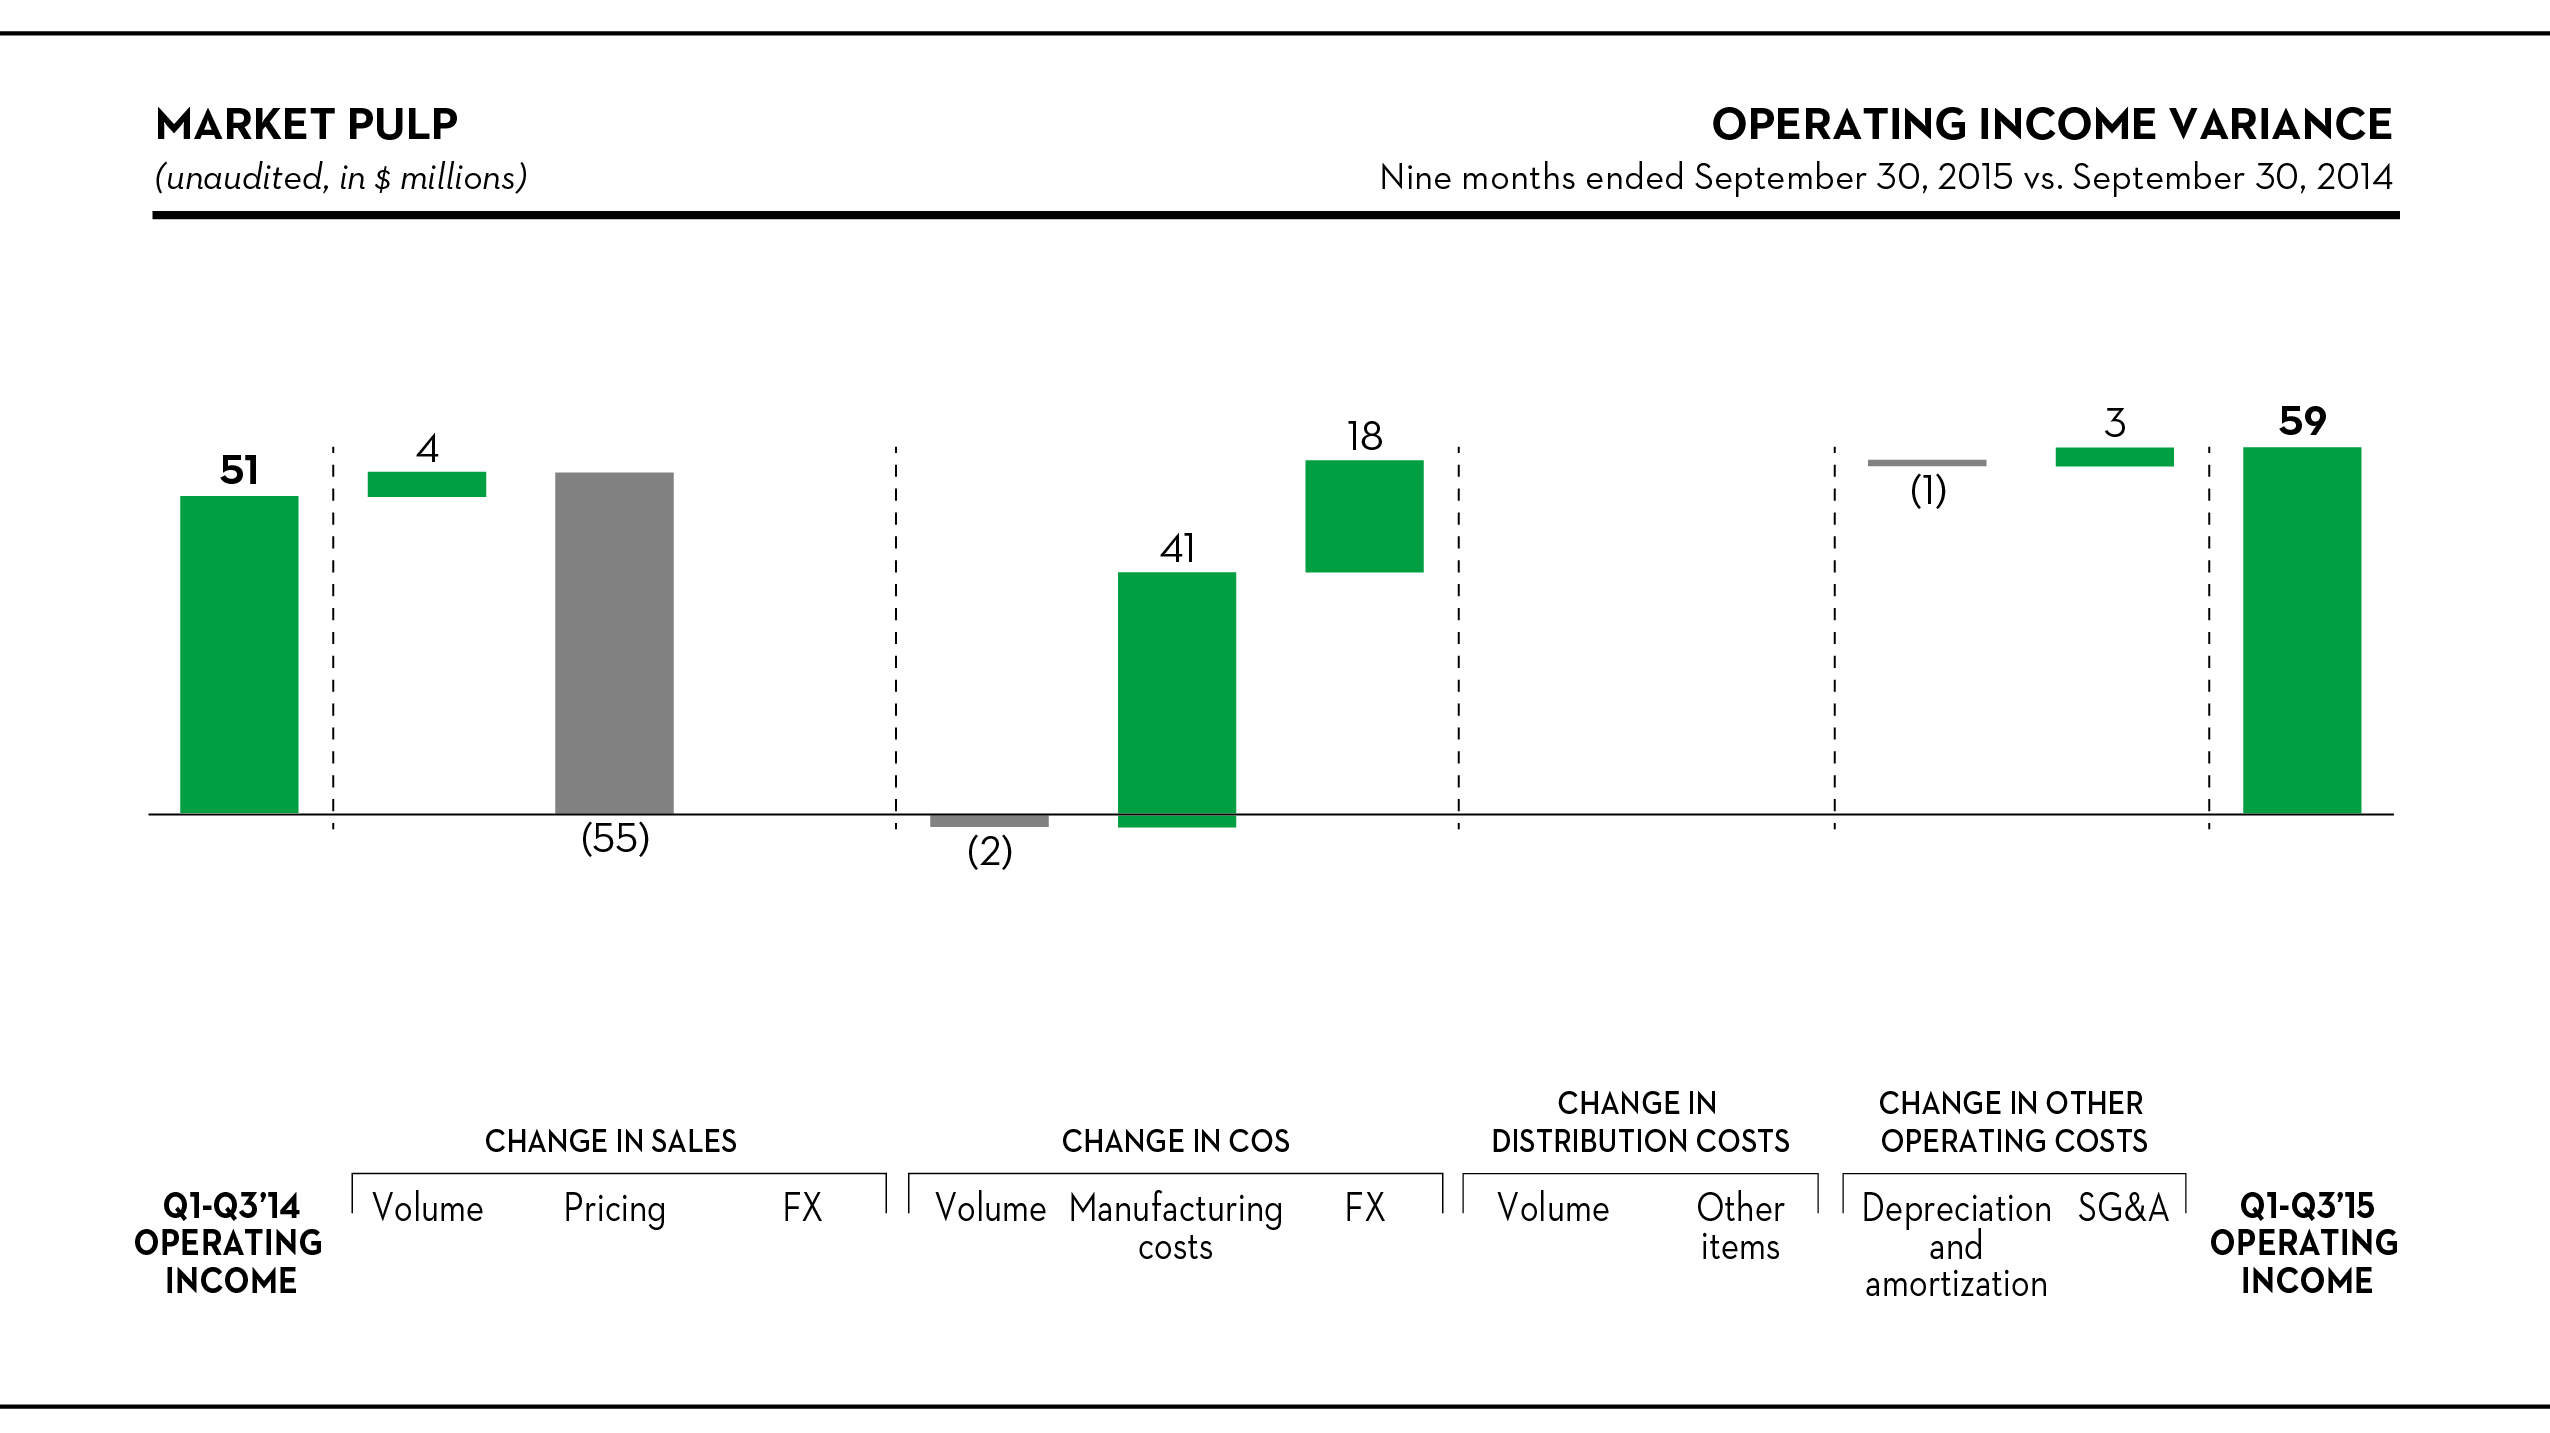
Sales
Sales were $51 million lower, or 7%, to $679 million in the first nine months of the year. Shipments were 7,000 metric tons higher, but the average market price dropped by $53 per metric ton as a result of lower transaction prices across all grades, but mostly softwood.
We recorded 27,000 metric tons of additional downtime in the period compared to the year-ago period as a result of a production slowback at our recycled bleached kraft mills and the timing of the annual maintenance in Saint-Félicien, Québec.
Cost of sales, excluding depreciation, amortization and distribution costs
COS improved by $57 million in the period. Manufacturing costs improved by $41 million after adjusting for the effect of higher volume and the favorable effect of the weaker Canadian dollar, reflecting:
• | lower commodity prices and higher mill efficiencies ($15 million); |
• | lower maintenance costs and fewer operational disruptions ($9 million); |
• | the abnormally cold winter of 2014, including higher steam costs and wood prices in the year-ago period ($8 million); |
• | a favorable property tax adjustment ($4 million); and |
• | higher contribution from the cogeneration facility at Saint-Félicien ($3 million). |
45
WOOD PRODUCTS
Highlights
Three Months Ended September 30, | Nine Months Ended September 30, | ||||||||||||||||
(unaudited, in millions, except where otherwise stated) | 2015 | 2014 | 2015 | 2014 | |||||||||||||
Sales | $ | 131 | $ | 166 | $ | 404 | $ | 462 | |||||||||
Operating income (1) | 9 | 24 | 10 | 51 | |||||||||||||
EBITDA (2) | 18 | 32 | 36 | 75 | |||||||||||||
(in millions of board feet) | |||||||||||||||||
Shipments (3) | 421 | 422 | 1,232 | 1,195 | |||||||||||||
Downtime | 47 | 46 | 124 | 119 | |||||||||||||
As of September 30, | ||||||||
(unaudited, in millions of board feet) | 2015 | 2014 | ||||||
Finished goods inventory (3) | 135 | 124 | ||||||
(1) | Net income including noncontrolling interests is equal to operating income in this segment. |
(2) | EBITDA, a non-GAAP financial measure, is reconciled below. For more information on the calculation and reasons we include this measure, see note 1 under “Results of Operations – Consolidated Results – Selected Financial Information” above. |
(3) | Includes wood pellets measured by mass, converted to board feet using a density-based conversion ratio. |
Three Months Ended September 30, | Nine Months Ended September 30, | ||||||||||||||||
(unaudited, in millions) | 2015 | 2014 | 2015 | 2014 | |||||||||||||
Net income including noncontrolling interests | $ | 9 | $ | 24 | $ | 10 | $ | 51 | |||||||||
Depreciation and amortization | 9 | 8 | 26 | 24 | |||||||||||||
EBITDA | 18 | 32 | 36 | 75 | |||||||||||||
Industry trends
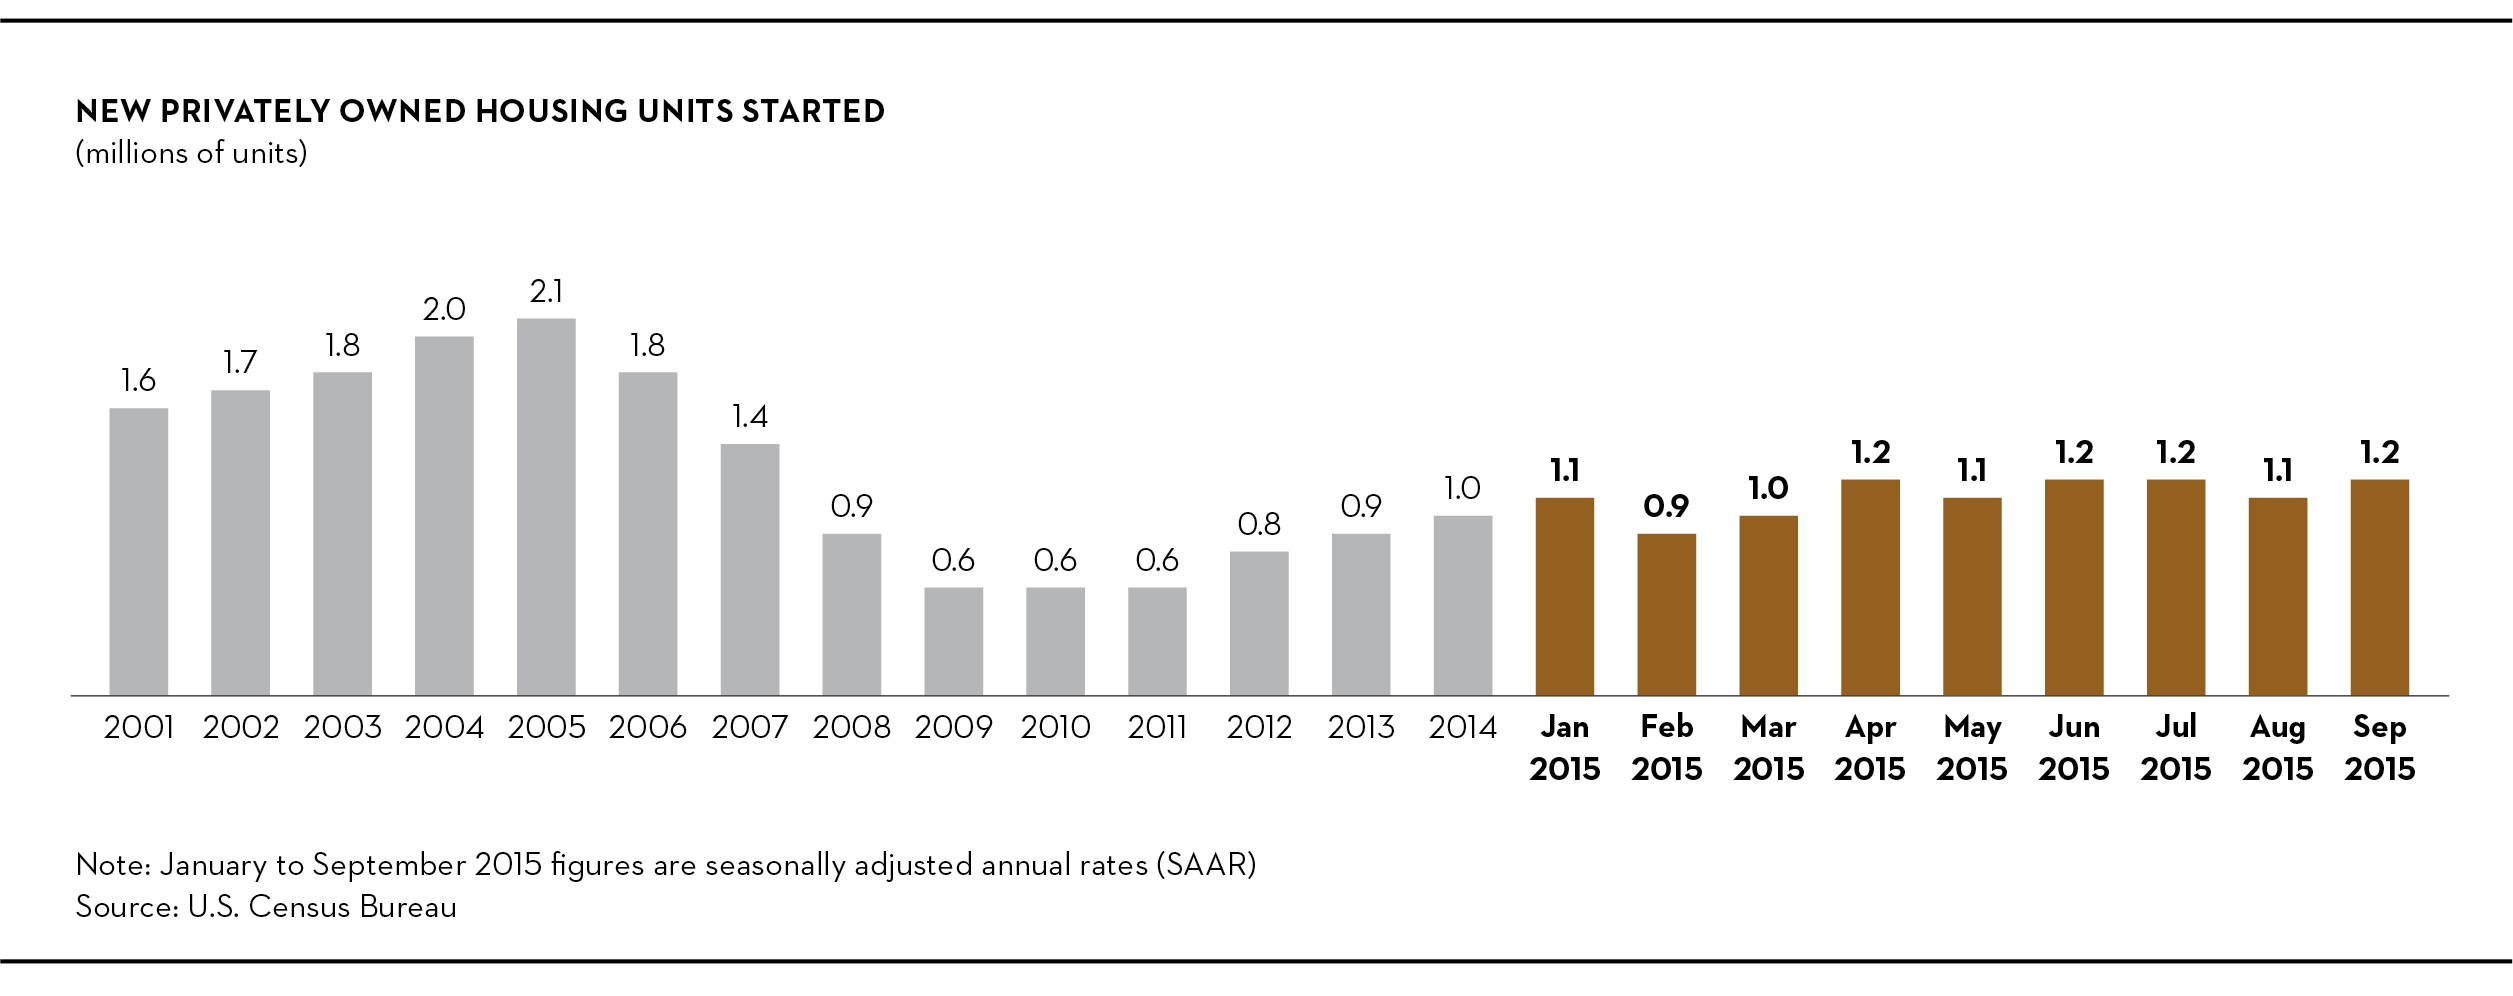
Average U.S. housing starts were 1.2 million on a seasonally-adjusted basis in the third quarter, up by 13% from the same period last year. But North American exports of lumber to China were down by 15% through August.
46
Three months ended September 30, 2015 vs. September 30, 2014
Operating income variance analysis
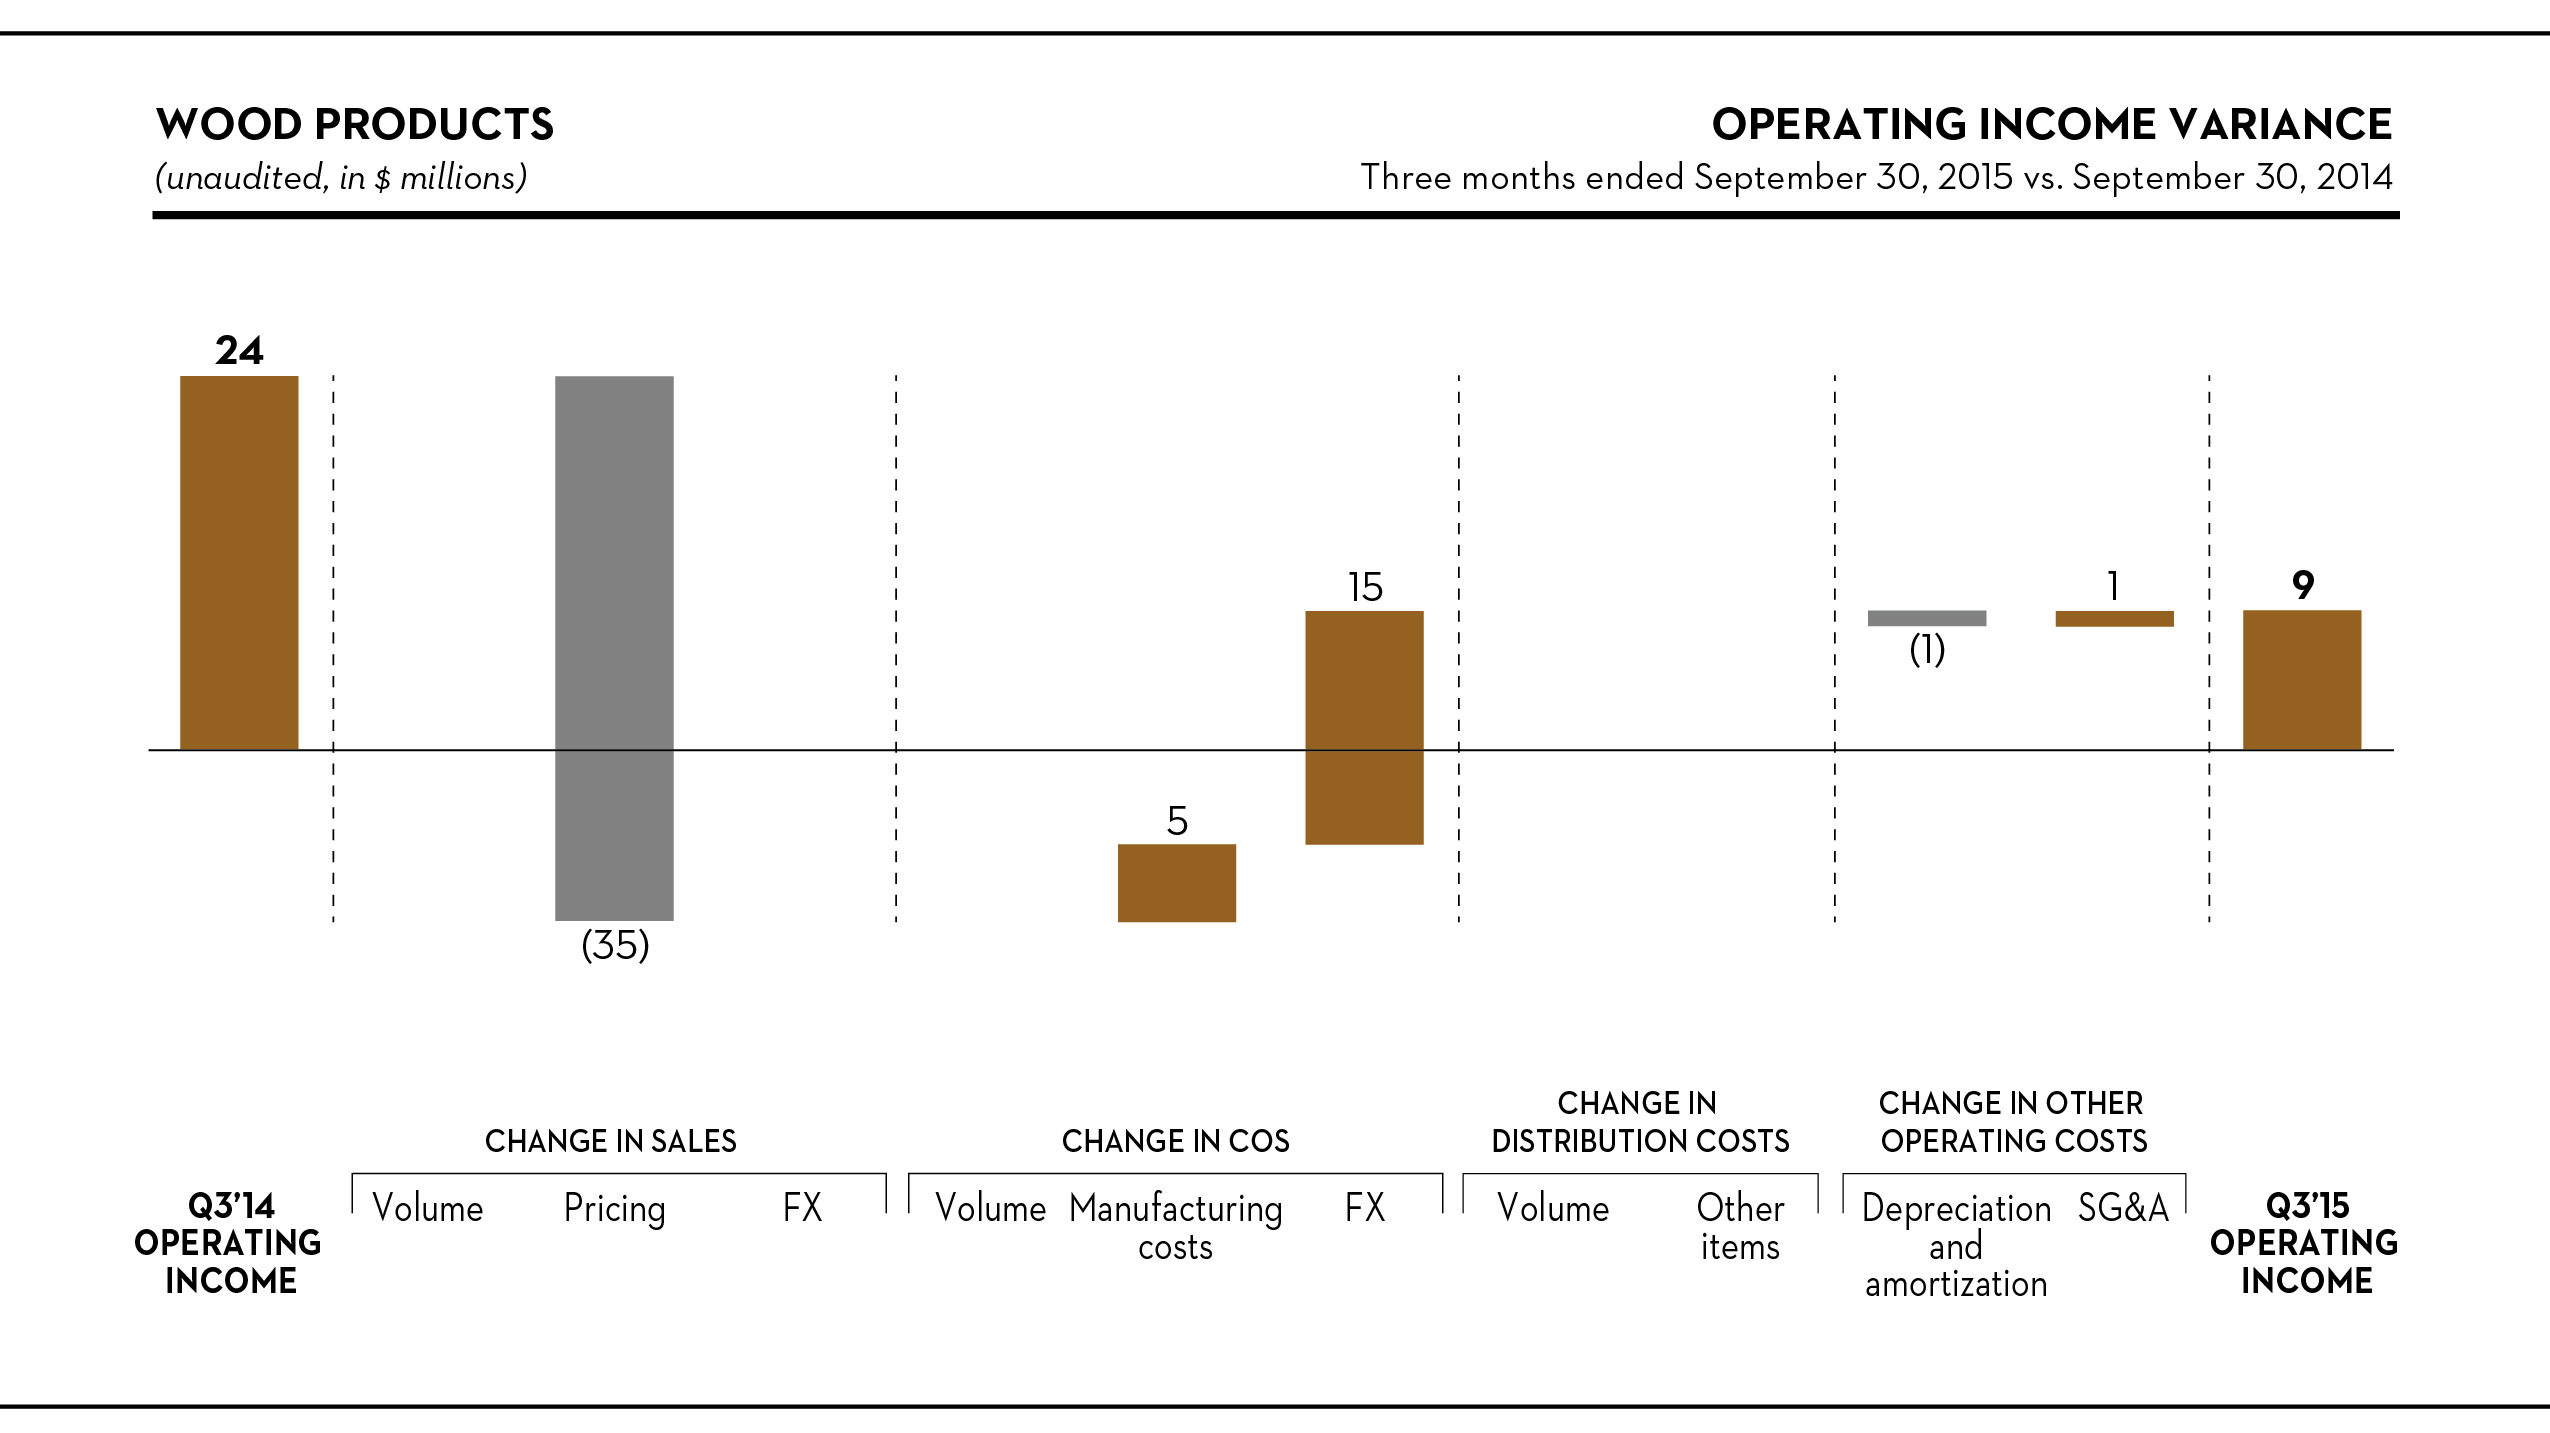
Sales
Sales were $35 million lower, or 21%, to $131 million as a result of an $80 per thousand board feet drop in average transaction price, or 20%.
Cost of sales, excluding depreciation, amortization and distribution costs
After adjusting for the favorable effect of the weaker Canadian dollar, manufacturing costs improved by $5 million, mostly due to the recognition of additional tax credits in connection with infrastructure investments.
47
Nine months ended September 30, 2015 vs. September 30, 2014
Operating income variance analysis
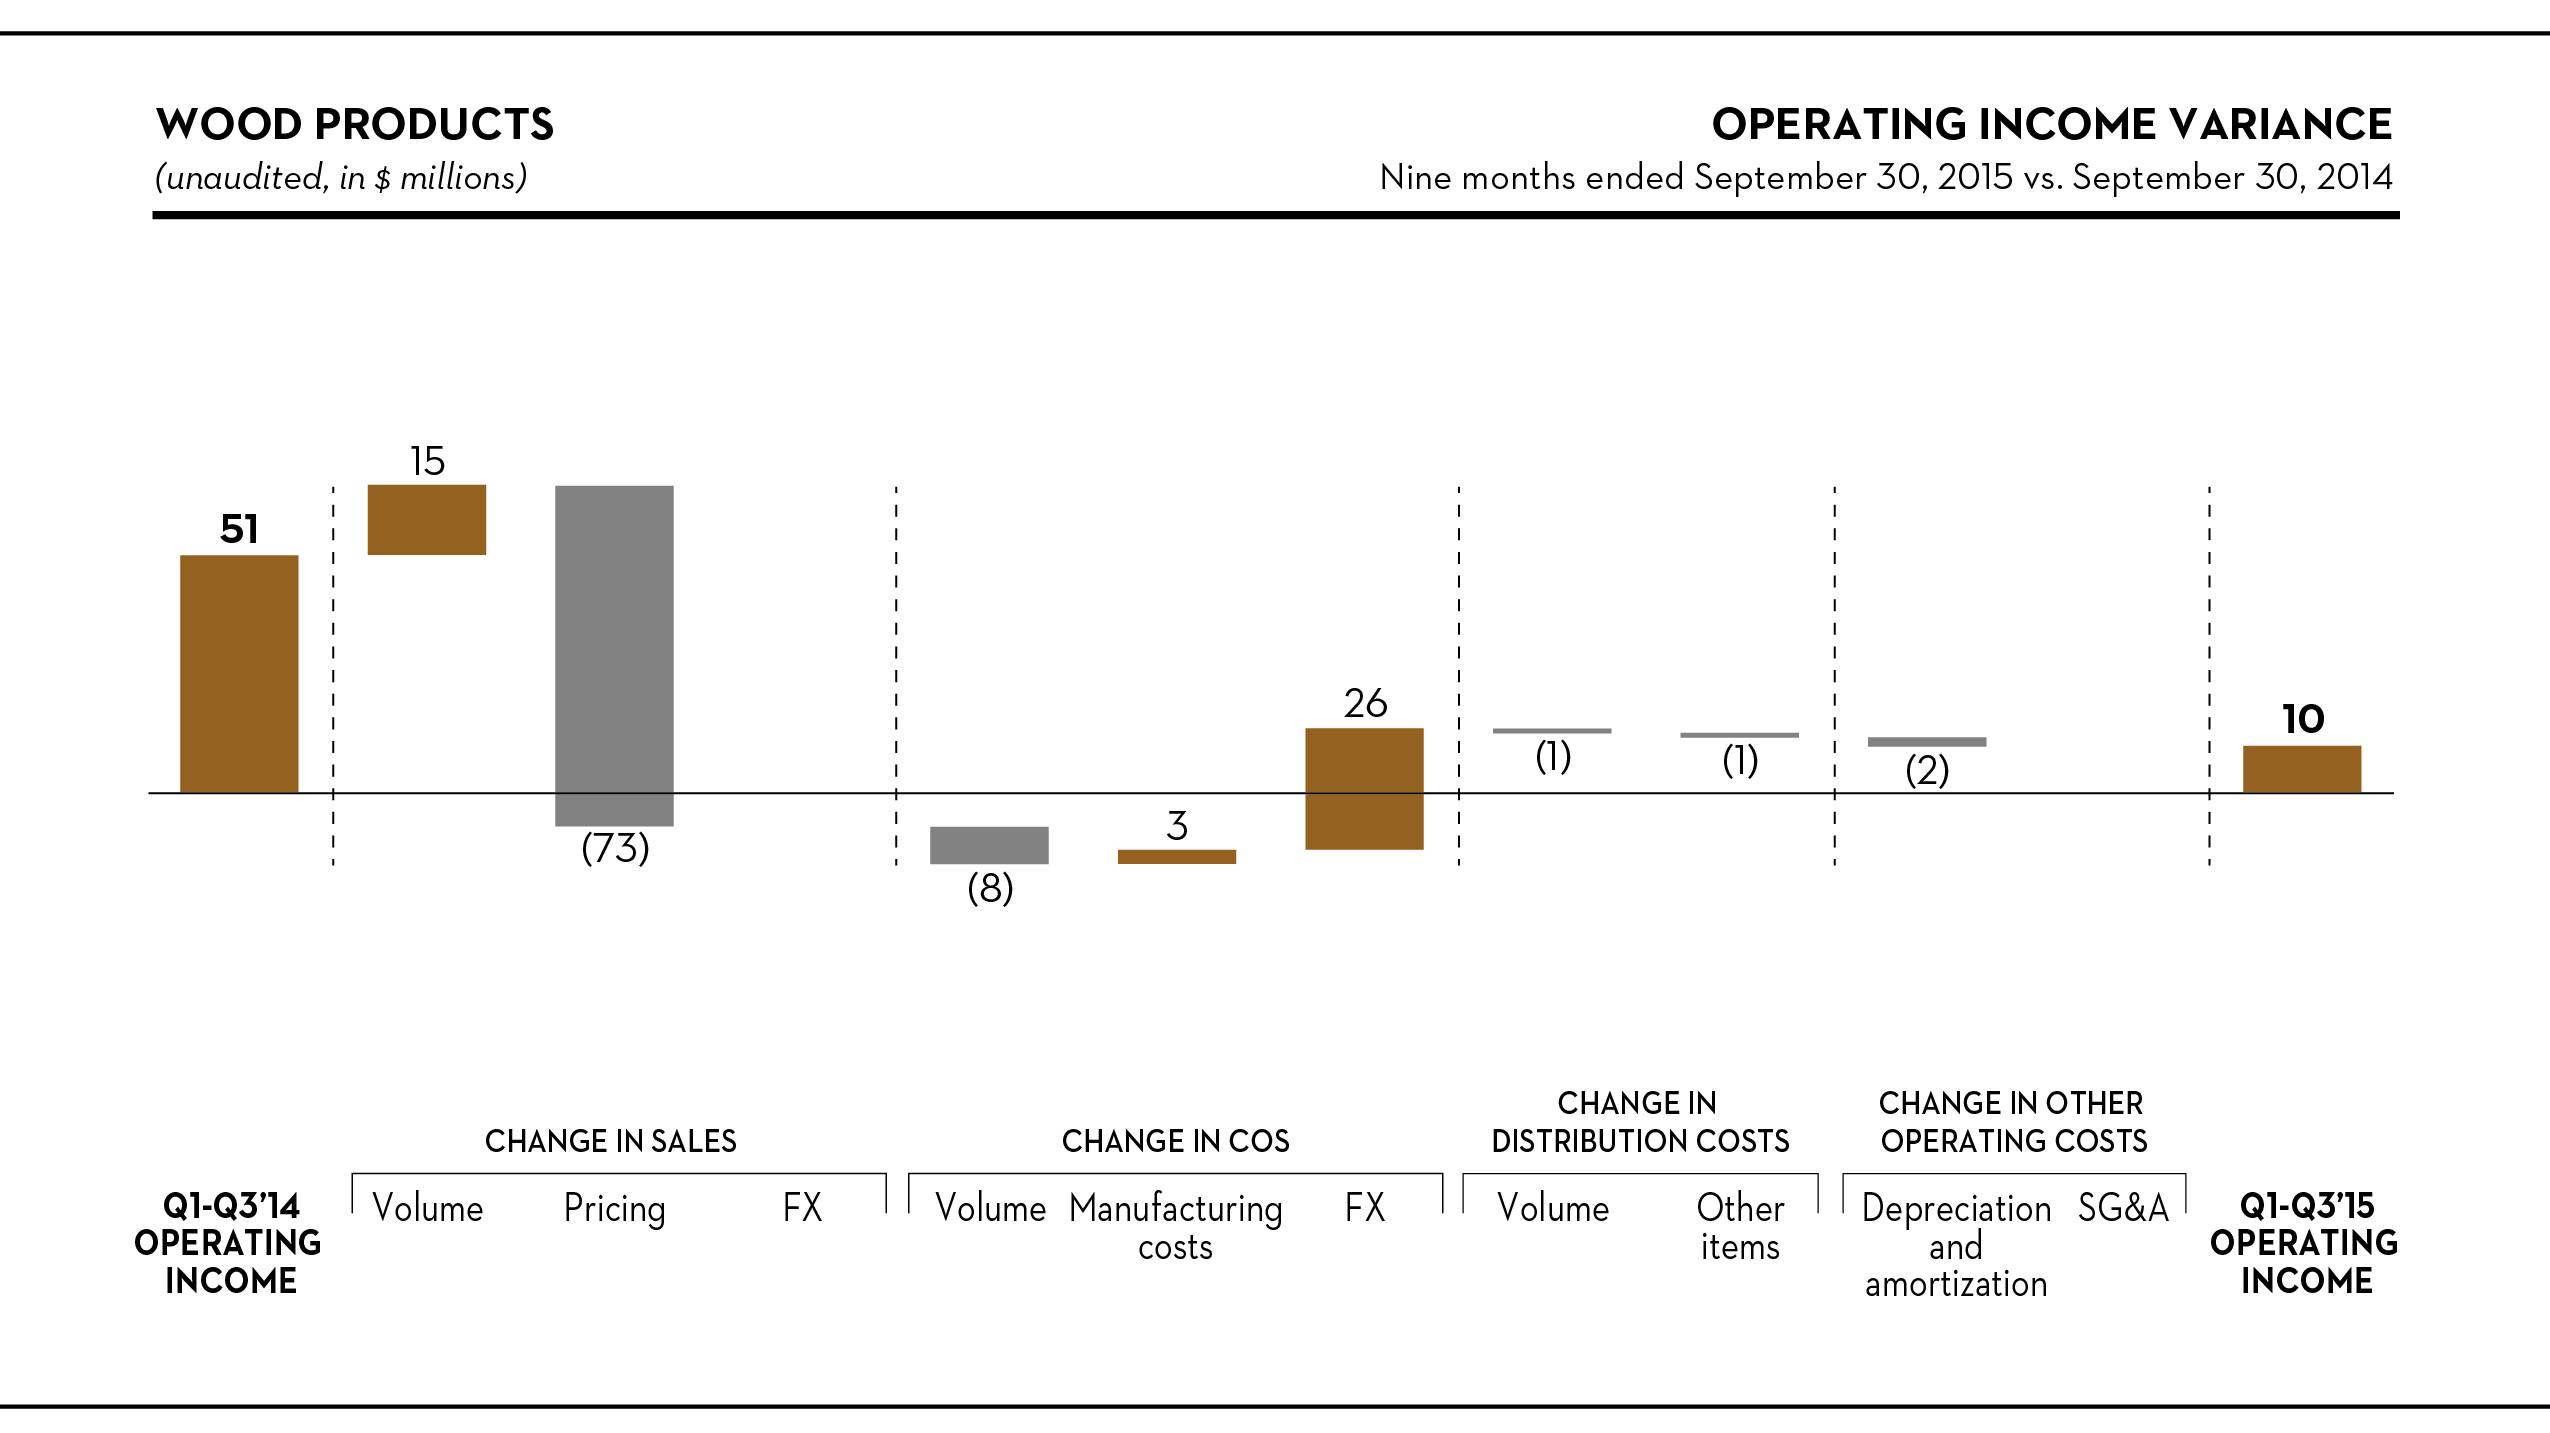
Sales
Sales were $58 million lower, or 13%, to $404 million in the first three quarters of the year, reflecting a $59 per thousand board feet drop in average transaction price, or 15%. Shipments, however, increased by 37 million board feet following our capacity enhancement initiatives, including better productivity at our Comtois, Québec, sawmill, the start-up of our Thunder Bay, Ontario, wood pellet facility and also volume from our new Atikokan and Ignace sawmills in Ontario.
Cost of sales, excluding depreciation, amortization and distribution costs
After adjusting for the effect of higher volume and the favorable effect of the weaker Canadian dollar, manufacturing costs improved by $3 million, mainly because of the recognition of tax credits in connection with infrastructure investments, partly offset by unfavorable fiber costs, including higher stumpage fees in the province of Québec, net of lower fuel prices.
48
CORPORATE AND OTHER
Highlights
Three Months Ended September 30, | Nine Months Ended September 30, | ||||||||||||||||
(unaudited, in millions) | 2015 | 2014 | 2015 | 2014 | |||||||||||||
Cost of sales, excluding depreciation, amortization and distribution costs | $ | (15 | ) | $ | (6 | ) | $ | (47 | ) | $ | (9 | ) | |||||
Depreciation and amortization | (2 | ) | (2 | ) | (8 | ) | (5 | ) | |||||||||
Selling, general and administrative expenses | (5 | ) | (2 | ) | (20 | ) | (7 | ) | |||||||||
Closure costs, impairment and other related charges | (2 | ) | (85 | ) | (8 | ) | (147 | ) | |||||||||
Net gain on disposition of assets | — | — | — | 2 | |||||||||||||
Operating loss | $ | (24 | ) | $ | (95 | ) | $ | (83 | ) | $ | (166 | ) | |||||
Interest expense | (9 | ) | (12 | ) | (32 | ) | (35 | ) | |||||||||
Other (expense) income, net | (1 | ) | (65 | ) | 5 | (58 | ) | ||||||||||
Income tax (provision) benefit | (2 | ) | 1 | (22 | ) | 8 | |||||||||||
Net loss including noncontrolling interests | $ | (36 | ) | $ | (171 | ) | $ | (132 | ) | $ | (251 | ) | |||||
The table below shows the reconciliation of net loss including noncontrolling interests to EBITDA and adjusted EBITDA, which are non-GAAP financial measures. For more information on the calculation and reasons we include these measures, see note 1 under “Results of Operations – Consolidated Results – Selected Financial Information” above.
Three Months Ended September 30, | Nine Months Ended September 30, | ||||||||||||||||
(unaudited, in millions) | 2015 | 2014 | 2015 | 2014 | |||||||||||||
Net loss including noncontrolling interests | $ | (36 | ) | $ | (171 | ) | $ | (132 | ) | $ | (251 | ) | |||||
Interest expense | 9 | 12 | 32 | 35 | |||||||||||||
Income tax provision (benefit) | 2 | (1 | ) | 22 | (8 | ) | |||||||||||
Depreciation and amortization | 2 | 2 | 8 | 5 | |||||||||||||
EBITDA | $ | (23 | ) | $ | (158 | ) | $ | (70 | ) | $ | (219 | ) | |||||
Foreign exchange translation loss | 5 | 17 | 2 | 14 | |||||||||||||
Closure costs, impairment and other related charges | 2 | 85 | 8 | 147 | |||||||||||||
Inventory write-downs related to closures | — | 6 | 1 | 10 | |||||||||||||
Start-up costs | 2 | 1 | 4 | 2 | |||||||||||||
Net gain on disposition of assets | — | — | — | (2 | ) | ||||||||||||
Write-down of equity method investment | — | 50 | — | 50 | |||||||||||||
Non-operating pension and OPEB costs (credits) | 13 | (2 | ) | 39 | (8 | ) | |||||||||||
Other income, net | (4 | ) | (2 | ) | (7 | ) | (6 | ) | |||||||||
Adjusted EBITDA | $ | (5 | ) | $ | (3 | ) | $ | (23 | ) | $ | (12 | ) | |||||
Three months ended September 30, 2015 vs. September 30, 2014
Cost of sales, excluding depreciation, amortization and distribution costs
We incurred COS of $15 million in the third quarter, almost all of which is due to non-operating pension and OPEB costs ($13 million). In the same period last year, we incurred COS of $6 million, most of which was due to the write-down of mills stores in connection with the permanent closure of our Laurentide mill ($5 million). The higher defined benefit pension and OPEB plans costs related mainly to the amortization of actuarial losses incurred in 2014, which reflect the substantial drop in discount rates and longer life expectancy assumptions in both the U.S. and Canada, which caused the net pension and OPEB liability to increase by $330 million in 2014.
49
Selling, general and administrative expenses
The SG&A allocated to “corporate and other” was $3 million higher in the quarter because of higher project costs, offset in part by a group insurance refund.
Closure costs, impairment and other related charges
We recorded $2 million of closure costs, impairment and other related charges in the quarter, compared to $85 million in the year-ago period. Last year’s amount included $65 million of accelerated depreciation, $11 million for severance and other termination benefits, and $5 million for other closure costs, including environmental remediation obligations, in connection with the permanent closure of our Laurentide mill.
Nine months ended September 30, 2015 vs. September 30, 2014
Cost of sales, excluding depreciation, amortization and distribution costs
COS were $47 million in the period compared to $9 million in the year-ago period. The current period includes:
• | non-operating pension and OPEB costs ($39 million); |
• | asset preservations costs for the permanently closed Fort Frances, Laurentide and Iroquois Falls mills ($6 million); and |
• | start-up costs with the construction of our Atikokan sawmill ($4 million). |
In the same period of 2014, we incurred COS of $9 million, which included:
• | write-off of mill stores ($10 million) in connection with the permanent closure of the idled machine at Catawba and the permanent closure of the Laurentide mill; and |
• | asset preservation costs ($8 million) mainly related to the permanently closed Fort Frances mill; |
mostly offset by non-operating pension and OPEB credits ($8 million).
Depreciation and amortization
Depreciation and amortization was $3 million higher in the period, mainly because of the amortization of costs associated with the implementation of our integrated business management software.
Selling, general and administrative expenses
The SG&A allocated to “corporate and other” was $13 million greater in this year’s period, primarily because of higher project costs and a change in the forfeiture rate assumptions for our equity-based awards.
Closure costs, impairment and other related charges
In 2015, we recorded closure costs, impairment and other related charges of $8 million, mainly for impairment of assets, accelerated depreciation and idling and cleaning costs at our permanently closed Iroquois Falls mill.
In the same period last year, we recorded closure costs, impairment and other related charges of $147 million, which included:
• | $65 million of accelerated depreciation, $11 million for severance and other termination benefits, and $5 million for other closure costs, including environmental remediation obligations, in connection with the permanent closure of the Laurentide mill; |
• | $45 million of accelerated depreciation following the permanent closure of the idled paper machine at Catawba; |
• | $8 million of idling and cleaning costs, and severance charges at the Fort Frances mill; |
• | $6 million for long-lived asset impairment charges in connection with our recycling assets; and |
• | $3 million of accelerated depreciation for a paper machine closed at Iroquois Falls. |
50
LIQUIDITY AND CAPITAL RESOURCES
Capital Resources
We rely on cash and cash equivalents, net cash provided by operations and our asset-based revolving credit facility to fund our operations, make pension contributions, and finance our working capital, capital expenditures and share repurchases. As of September 30, 2015, we had cash and cash equivalents of $235 million and availability of $448 million under our asset-based revolving credit facility.
In our view, we have sufficient financial resources available to finance our business plan, meet working capital requirements and maintain an appropriate level of capital spending.
On October 15, the U.S. Department of Commerce, or “Commerce”, issued a final determination in connection with its investigation of Canadian-origin SC paper exported to the U.S. market, in which it assigned a subsidy rate of 17.87% to our Canadian-produced SC paper. Since October 20, we have been required to make cash deposits at the 17.87% subsidy rate for estimated and projected countervailing duties on SC papers we import to the U.S. from our Canadian mills. If the U.S. International Trade Commission, or the “USITC”, rules that exports from Canada to the U.S. have caused or threatened to cause material injury to the U.S. SC paper industry, we will be required to continue making cash deposits at the 17.87% subsidy rate until Commerce sets a countervailing duty rate in an administrative review, which may not be finalized until December of 2017, or possibly later. Based on our current operating parameters, the cash deposits could be as high as $25 million per year, which could significantly and adversely impact the competitive position of our Canadian SC paper operations. To the extent the countervailing duty rate set by Commerce is lower than 17.87%, we will recover excess deposits, plus interest. If the countervailing duty rate set by Commerce is at or above 17.87%, the deposits and any deficiency will be converted into actual countervailing duties.
New ABL credit facility
On May 22, 2015, we entered into a new five-year credit agreement for a senior secured asset-based revolving credit facility, or “ABL credit facility,” with an aggregate lender commitment of up to $600 million at any time outstanding, subject to borrowing base availability based on specified advance rates, eligibility criteria and customary reserves. This facility replaces our previous $665 million senior secured asset-based revolving credit facility, originally dated as of December 9, 2010. The ABL credit facility will mature on May 22, 2020. The facility was undrawn as of September 30, 2015, except for $34 million of ordinary course letters of credit.
Flow of Funds
Summary of cash flows
Nine Months Ended September 30, | ||||||||
(unaudited, in millions) | 2015 | 2014 | ||||||
Net cash provided by operating activities | $ | 90 | $ | 80 | ||||
Net cash used in investing activities | (128 | ) | (133 | ) | ||||
Net cash used in financing activities | (62 | ) | (2 | ) | ||||
Effect of exchange rate changes on cash and cash equivalents | (2 | ) | (2 | ) | ||||
Net decrease in cash and cash equivalents | $ | (102 | ) | $ | (57 | ) | ||
Nine months ended September 30, 2015 vs. September 30, 2014
Cash provided by operating activities
We generated $90 million of cash from operating activities in the first nine months of the year, compared to $80 million in the year-ago period. The increase is mainly due to the favorable effect of the weaker Canadian dollar on overall pension contributions, offset in part by lower sales and higher planned maintenance expenditures.
Cash used in investing activities
Investing activities, down $5 million against the year-ago period, consisted mostly of cash invested in fixed assets, which reflects investments in strategic projects such as: the construction of our new sawmill in Atikokan; the upgrade to the Calhoun
51
pulp mill to install a continuous digester and other wood chip processing equipment; the tissue manufacturing and converting facility; and the implementation of our integrated business management software.
Cash used in financing activities
We used $62 million in financing activities in the first nine months of the year, almost all of which related to share repurchases.
Share Repurchase Program
On May 28, 2015, our board of directors authorized a $50 million increase to our existing $100 million share repurchase program, which was originally launched in May of 2012. As of December 31, 2014, we had repurchased 5.6 million shares, at a cost of $67 million. During the three and nine months ended September 30, 2015, we repurchased 2.3 million and 5.5 million shares, respectively, at a cost of $22 million and $59 million, respectively. There remains $24 million under the program.
52
ITEM 3. | QUANTITATIVE AND QUALITATIVE DISCLOSURES ABOUT MARKET RISK |
Information relating to quantitative and qualitative disclosures about market risk is disclosed in Part II, Item 7A, “Quantitative and Qualitative Disclosures About Market Risk,” in our 2014 Annual Report. Except as otherwise provided hereafter, there have been no material changes in our exposure to market risk as previously disclosed in our 2014 Annual Report. Based on revised assumptions and operating projections for 2015, if the Canadian dollar strengthens by one cent against the U.S. dollar, we expect that it will decrease our annual operating income by approximately $16 million, and vice versa.
ITEM 4. | CONTROLS AND PROCEDURES |
(a) Evaluation of Disclosure Controls and Procedures:
We have evaluated the effectiveness of the design and operation of our disclosure controls and procedures, as defined in Rules 13a–15(e) and 15d–15(e) of the Securities Exchange Act of 1934, as of September 30, 2015. Based on that evaluation, the President and Chief Executive Officer and the Senior Vice President and Chief Financial Officer concluded that our disclosure controls and procedures were effective as of such date in recording, processing, summarizing and timely reporting information required to be disclosed in our reports to the SEC.
(b) Changes in Internal Control over Financial Reporting:
In connection with the evaluation of internal control over financial reporting, there were no changes during the period covered by this report that have materially affected, or are reasonably likely to materially affect, our internal control over financial reporting.
PART II. | OTHER INFORMATION |
ITEM 1. | LEGAL PROCEEDINGS |
Information on our legal proceedings is presented under Part I, Item 3, “Legal Proceedings,” in our 2014 Annual Report. Except as otherwise provided hereafter, there have been no material changes to the legal proceedings described in the 2014 Annual Report.
On February 26, 2015, a countervailing duty petition was filed with Commerce and the USITC by certain U.S. SC paper producers requesting the U.S. government to impose countervailing duties on Canadian-origin SC paper exported to the U.S. market. One of our subsidiaries was identified in the petition as being a Canadian exporting producer of SC paper to the U.S. and was selected as a mandatory respondent to be individually investigated by Commerce. On August 3, 2015, Commerce assigned a preliminary subsidy rate of 2.04% to our SC paper produced at our Canadian mills. On October 15, 2015, Commerce issued a final determination and increased the subsidy rate applicable to our Canadian-produced SC paper to 17.87%. Since October 20, 2015, we have been required to make cash deposits at the 17.87% subsidy rate for estimated and projected countervailing duties on SC papers we import to the U.S. from our Canadian mills. If the USITC rules that exports from Canada to the U.S. have caused or threatened to cause material injury to the U.S. SC paper industry, we will be required to continue making cash deposits at the 17.87% subsidy rate until Commerce sets a countervailing duty rate in an administrative review, which may not be finalized until December of 2017, or possibly later. Based on our current operating parameters, the cash deposits could be as high as $25 million per year. To the extent the countervailing duty rate set by Commerce is lower than 17.87%, we will recover excess deposits, plus interest. If the countervailing duty rate set by Commerce is at or above 17.87%, the deposits and any deficiency will be converted into actual countervailing duties. We are not presently able to determine the ultimate resolution of this matter, but we believe it is not probable that we will be assessed with significant countervailing duties. Accordingly, no contingent loss was recorded in respect of this petition in our Consolidated Statement of Operations for the nine months ended September 30, 2015.
53
ITEM 1A. | RISK FACTORS |
In addition to the other information set forth in this Form 10-Q, you should carefully consider the risk factors set forth under Part I, Item 1A, “Risk Factors” in our 2014 Annual Report, which could materially affect our business, financial condition or future results. The risks described in this report and in our 2014 Annual Report are not the only risks we face. Additional risks and uncertainties not currently known to us or that we currently deem to be immaterial may also materially affect our business, financial condition or future results. Except as otherwise provided hereafter, there have been no material changes to the risk factors previously disclosed in our 2014 Annual Report.
We may be subject to countervailing duty trade remedies on international sales of our products, which could adversely affect our operations and cash flows.
Under international agreements and the domestic trade laws of many countries, trade remedies are available to domestic industries where imports are considered to be “subsidized” and such imports cause material injury, or an imminent threat of material injury, to a domestic industry. Although there are differences in how the trade remedies are assessed, such laws typically have common features established in accordance with World Trade Organization standards. In the U.S., where injurious subsidization is found, the trade remedy is typically a countervailing duty order. In principle, a duty equal to the amount of subsidization is imposed on the importer of the product, however, authorities have imposed assumed or estimated rates on products that may not be based on subsidies actually received by the producer. Such duty orders do not prevent the importation of product, but rather require the importer of the product to pay to the government a countervailing duty or a deposit on estimated countervailing duties.
One of our Canadian subsidiaries is a respondent in a Commerce and USITC investigation of whether SC paper exports from Canada receive countervailable subsidies that injure, or threaten to injure, U.S. producers. The investigation was commenced in response to a countervailing duty petition filed with Commerce and the USITC on February 26, 2015, by certain U.S. SC paper producers. On August 3, 2015, Commerce assigned a preliminary subsidy rate of 2.04% to our SC paper produced at our Canadian mills. On October 15, 2015, Commerce issued a final determination and increased the subsidy rate applicable to our Canadian-produced SC paper to 17.87%. 17.10% of that rate is based on a rate set in a 1992 administrative review concerning imports of pure and alloy magnesium. Commerce used that rate from the 1992 review by applying “adverse facts available” to our Canadian subsidiary based on its determination that it discovered unreported government assistance during the course of the investigation, and on its application of an interpretive rule, that was published and went into effect on August 6, 2015, to the investigation conducted prior to August 2015. Since October 20, 2015, we have been required to make cash deposits at the 17.87% subsidy rate for estimated and projected countervailing duties on SC papers we import to the U.S. from our Canadian mills. If the USITC rules that exports from Canada to the U.S. have caused or threatened to cause material injury to the U.S. SC paper industry, we will be required to continue making cash deposits at the 17.87% subsidy rate until Commerce sets a countervailing duty rate in an administrative review, which may not be finalized until December of 2017, or possibly later. Based on our current operating parameters, the cash deposits could be as high as $25 million per year.
The countervailing duty rate set in any administrative review will be based on Commerce’s determination of countervailable subsidies received during the 12 months preceding the beginning of the administrative review, and will not be based on the 17.87% subsidy rate announced by Commerce in October 2015. We expect such a review to commence in December of 2016, and we may be subject to annual administrative reviews until December 2020, or possibly later. We believe that SC paper produced at our Canadian mills will ultimately not be subject to any significant countervailing duty; however, we cannot provide any assurance regarding the countervailing duty rate that may be determined by Commerce. In addition, if in the administrative review Commerce sets rates based on an examination of other Canadian SC paper producers, rather than based on an examination of our Canadian subsidiary, the final duty rate set for our Canadian produced SC paper may not reflect an amount of countervailable subsidies received by us, but rather an average of the rates of Canadian producers that are individually examined in the administrative review. We believe we will be individually examined, but we cannot provide any assurances. To the extent the countervailing duty rate set by Commerce is lower than 17.87%, we will recover excess deposits, plus interest. If the countervailing duty rate set by Commerce is at or above 17.87%, the deposits and any deficiency will be converted into actual countervailing duties. In either case, once a countervailing duty rate is set, we will be required to continue paying countervailing duties at that rate, or a rate determined in a subsequent administrative review, on our imports of SC paper from our Canadian mills to the U.S. until we are determined not to be receiving countervailable subsidies. Even if the countervailing duty rate is determined to be less than 17.87%, the requirement that we make cash deposits at that 17.87% rate until the countervailing duty rate is determined could require us to set aside a substantial amount of cash, and could significantly and adversely impact the competitive position of our Canadian SC paper operations.
54
ITEM 2. | UNREGISTERED SALES OF EQUITY SECURITIES AND USE OF PROCEEDS |
The following table sets forth information about our stock repurchases for the three months ended September 30, 2015:
Period | Total Number of Shares Purchased | Average Price Paid per Share | Total Number of Shares Purchased as Part of Publicly Announced Plans or Programs | Approximate Dollar Value of Shares That May Yet Be Purchased Under the Plans or Programs (1) | ||||||||||||
July 1 to July 31 | 300,000 | $ | 11.52 | 300,000 | $ | 42,683,730 | ||||||||||
August 1 to August 31 | — | — | — | 42,683,730 | ||||||||||||
September 1 to September 30 | 2,000,000 | 9.35 | 2,000,000 | 23,983,730 | ||||||||||||
Total | 2,300,000 | $ | 9.63 | 2,300,000 | $ | 23,983,730 | ||||||||||
(1) | On May 28, 2015, our board of directors authorized a $50 million increase to our existing $100 million share repurchase program, which was originally launched in May of 2012. |
55
ITEM 6. | EXHIBITS |
Exhibit No. | Description | |
31.1* | Certification of President and Chief Executive Officer Pursuant to Section 302 of the Sarbanes-Oxley Act of 2002. | |
31.2* | Certification of Senior Vice President and Chief Financial Officer Pursuant to Section 302 of the Sarbanes-Oxley Act of 2002. | |
32.1* | Certification of President and Chief Executive Officer Pursuant to Section 906 of the Sarbanes-Oxley Act of 2002. | |
32.2* | Certification of Senior Vice President and Chief Financial Officer Pursuant to Section 906 of the Sarbanes-Oxley Act of 2002. | |
101.INS** | XBRL Instance Document. | |
101.SCH** | XBRL Taxonomy Extension Schema Document. | |
101.CAL** | XBRL Taxonomy Extension Calculation Linkbase Document. | |
101.LAB** | XBRL Taxonomy Extension Label Linkbase Document. | |
101.PRE** | XBRL Taxonomy Extension Presentation Linkbase Document. | |
101.DEF** | XBRL Taxonomy Extension Definition Linkbase Document. | |
* | Filed with this Form 10-Q. |
** | Interactive data files furnished with this Form 10-Q, which represent the following materials from this Form 10-Q formatted in XBRL (eXtensible Business Reporting Language): (i) the Consolidated Statements of Operations, (ii) the Consolidated Statements of Comprehensive Income (Loss), (iii) the Consolidated Balance Sheets, (iv) the Consolidated Statements of Changes in Equity, (v) the Consolidated Statements of Cash Flows and (vi) the Notes to Unaudited Interim Consolidated Financial Statements. |
56
SIGNATURES
Pursuant to the requirements of the Securities Exchange Act of 1934, the Registrant has duly caused this Report to be signed on its behalf by the undersigned thereunto duly authorized.
RESOLUTE FOREST PRODUCTS INC. | ||
By | /s/ Jo-Ann Longworth | |
Jo-Ann Longworth | ||
Senior Vice President and Chief Financial Officer | ||
By | /s/ Silvana Travaglini | |
Silvana Travaglini | ||
Vice President and Chief Accounting Officer | ||
Date: November 9, 2015
57
EXHIBIT INDEX
Exhibit No. | Description | |
31.1* | Certification of President and Chief Executive Officer Pursuant to Section 302 of the Sarbanes-Oxley Act of 2002. | |
31.2* | Certification of Senior Vice President and Chief Financial Officer Pursuant to Section 302 of the Sarbanes-Oxley Act of 2002. | |
32.1* | Certification of President and Chief Executive Officer Pursuant to Section 906 of the Sarbanes-Oxley Act of 2002. | |
32.2* | Certification of Senior Vice President and Chief Financial Officer Pursuant to Section 906 of the Sarbanes-Oxley Act of 2002. | |
101.INS** | XBRL Instance Document. | |
101.SCH** | XBRL Taxonomy Extension Schema Document. | |
101.CAL** | XBRL Taxonomy Extension Calculation Linkbase Document. | |
101.LAB** | XBRL Taxonomy Extension Label Linkbase Document. | |
101.PRE** | XBRL Taxonomy Extension Presentation Linkbase Document. | |
101.DEF** | XBRL Taxonomy Extension Definition Linkbase Document. | |
* | Filed with this Form 10-Q. |
** | Interactive data files furnished with this Form 10-Q, which represent the following materials from this Form 10-Q formatted in XBRL (eXtensible Business Reporting Language): (i) the Consolidated Statements of Operations, (ii) the Consolidated Statements of Comprehensive Income (Loss), (iii) the Consolidated Balance Sheets, (iv) the Consolidated Statements of Changes in Equity, (v) the Consolidated Statements of Cash Flows and (vi) the Notes to Unaudited Interim Consolidated Financial Statements. |
58