UNITED STATES
SECURITIES AND EXCHANGE COMMISSION
Washington, D.C. 20549
FORM 10-K
| |
|
|
|
þ
|
|
ANNUAL REPORT PURSUANT TO SECTION 13 OR 15(d) OF THE
SECURITIES EXCHANGE ACT OF 1934
|
|
|
|
For the fiscal year ended February 27,
2010
|
|
OR
|
|
o
|
|
TRANSITION REPORT PURSUANT TO SECTION 13 OR 15(d) OF THE
SECURITIES EXCHANGE ACT OF 1934
|
|
|
|
For the transition period
from to
|
Commission file
number: 1-5418
SUPERVALU
INC.
(Exact name of registrant as
specified in its charter)
| |
|
|
|
DELAWARE
|
|
41-0617000
|
|
(State or other jurisdiction of incorporation or
organization)
|
|
(I.R.S. Employer Identification No.)
|
| |
|
|
11840 VALLEY VIEW ROAD
EDEN PRAIRIE, MINNESOTA
|
|
55344
|
|
(Address of principal executive offices)
|
|
(Zip Code)
|
Registrant’s telephone
number, including area code:
(952) 828-4000
Securities registered pursuant
to Section 12(b) of the Act:
| |
|
|
|
Title of each class
|
|
Name of the exchange on which registered
|
|
Common Stock, par value $1.00 per share
|
|
New York Stock Exchange
|
|
Preferred Share Purchase Rights
|
|
New York Stock Exchange
|
Securities registered pursuant
to Section 12(g) of the Act:
None
Indicate by check mark if the registrant is a well-known
seasoned issuer, as defined in Rule 405 of the Securities
Act. Yes þ No o
Indicate by check mark if the registrant is not required to file
reports pursuant to Section 13 or Section 15(d) of the
Act. Yes o No þ
Indicate by check mark whether the registrant (1) has filed
all reports required to be filed by Section 13 or 15(d) of
the Securities Exchange Act of 1934 during the preceding
12 months (or for such shorter period that the registrant
was required to file such reports), and (2) has been
subject to such filing requirements for the past
90 days. Yes þ No o
Indicate by check mark whether the registrant has submitted
electronically and posted on its corporate Web site, if any,
every Interactive Data File required to be submitted and posted
pursuant to Rule 405 of
Regulation S-T
(§ 232.405 of this chapter) during the preceding
12 months (or for such shorter period that the registrant
was required to submit and post such
files). Yes þ No o
Indicate by check mark if disclosure of delinquent filers
pursuant to Item 405 of
Regulation S-K
(§ 229.405 of this chapter) is not contained herein,
and will not be contained, to the best of registrant’s
knowledge, in definitive proxy or information statements
incorporated by reference in Part III of this
Form 10-K
or any amendment to this
Form 10-K. o
Indicate by check mark whether the registrant is a large
accelerated filer, an accelerated filer, a non-accelerated
filer, or a smaller reporting company. See definitions of
“large accelerated filer,” “accelerated
filer” and “smaller reporting company” in
Rule 12b-2
of the Exchange Act.
Large accelerated
filer þ Accelerated
filer o Non-accelerated
filer o Smaller
reporting
company o
Indicate by check mark if the registrant is a shell company (as
defined in
Rule 12b-2
of the Exchange
Act). Yes o No þ
The aggregate market value of the voting and non-voting stock
held by non-affiliates of the registrant as of
September 11, 2009 was approximately $3,390,462,161 (based
upon the closing price of registrant’s Common Stock on the
New York Stock Exchange).
As of April 16, 2010, there were 212,225,397 shares of the
registrant’s common stock outstanding.
DOCUMENTS INCORPORATED BY
REFERENCE
Portions of registrant’s definitive Proxy Statement filed
for the registrant’s 2010 Annual Meeting of Stockholders
are incorporated by reference into Part III, as
specifically set forth in Part III.
SUPERVALU
INC.
Annual
Report on
Form 10-K
TABLE OF
CONTENTS
CAUTIONARY
STATEMENTS FOR PURPOSES OF THE SAFE HARBOR PROVISIONS OF THE
SECURITIES LITIGATION REFORM ACT
Any statements contained in this Annual Report on
Form 10-K
regarding the outlook for the Company’s businesses and
their respective markets, such as projections of future
performance, guidance, statements of the Company’s plans
and objectives, forecasts of market trends and other matters,
are forward-looking statements based on the Company’s
assumptions and beliefs. Such statements may be identified by
such words or phrases as “will likely result,”
“are expected to,” “will continue,”
“outlook,” “will benefit,” “is
anticipated,” “estimate,” “project,”
“management believes” or similar expressions. These
forward-looking statements are subject to certain risks and
uncertainties that could cause actual results to differ
materially from those discussed in such statements and no
assurance can be given that the results in any forward-looking
statement will be achieved. For these statements, SUPERVALU INC.
claims the protection of the safe harbor for forward-looking
statements contained in the Private Securities Litigation Reform
Act of 1995. Any forward-looking statement speaks only as of the
date on which it is made, and we disclaim any obligation to
subsequently revise any forward-looking statement to reflect
events or circumstances after such date or to reflect the
occurrence of anticipated or unanticipated events.
Certain factors could cause the Company’s future results to
differ materially from those expressed or implied in any
forward-looking statements contained in this Annual Report on
Form 10-K.
These factors include the factors discussed in Part I,
Item 1A of this Annual Report on
Form 10-K
under the heading “Risk Factors,” the factors
discussed below and any other cautionary statements, written or
oral, which may be made or referred to in connection with any
such forward-looking statements. Since it is not possible to
foresee all such factors, these factors should not be considered
as complete or exhaustive.
Economic
Conditions
|
|
|
| |
•
|
Continued weakness in the economy or further adverse changes in
economic conditions that affect consumer spending or buying
habits
|
| |
| |
•
|
Increases in unemployment, healthcare costs, energy costs and
commodity prices, which could impact consumer spending or buying
habits and the cost of doing business
|
| |
| |
•
|
Changes in interest rates
|
| |
| |
•
|
Food and drug inflation or deflation
|
| |
| |
•
|
The outcome of negotiations with partners, governments,
suppliers, unions or customers
|
Execution
of Initiatives
|
|
|
| |
•
|
The Company’s ability to execute customer-focused
initiatives designed to support its vision of becoming
“America’s Neighborhood Grocer”
|
| |
| |
•
|
The effectiveness of cost reduction strategies
|
| |
| |
•
|
The adequacy of our capital resources to fund new store growth
and remodeling activities that achieve appropriate returns on
capital investment
|
Competitive
Practices
|
|
|
| |
•
|
The Company’s ability to attract and retain customers
|
| |
| |
•
|
The Company’s ability to hire, train or retain employees
|
| |
| |
•
|
Competition from other food or drug retail chains, supercenters,
non-traditional competitors and emerging alternative formats in
the Company’s markets
|
2
|
|
|
| |
•
|
Declines in the Company’s Supply chain services sales due
to increased wholesaler competition or increased customer
self-distribution
|
| |
| |
•
|
Changes in demographics or consumer preferences that affect
consumer spending habits
|
| |
| |
•
|
The impact of consolidation in the Retail food and Supply chain
services industries
|
| |
| |
•
|
The success of the Company’s promotional and sales programs
and the Company’s ability to respond to the promotional and
pricing practices of competitors
|
Food
Safety
|
|
|
| |
•
|
Events that give rise to actual or potential food contamination,
drug contamination or food-borne illness or any adverse
publicity relating to these types of concern, whether or not
valid
|
Liquidity
|
|
|
| |
•
|
The Company’s substantial indebtedness and its potential
effect on the operation of the Company’s business
|
| |
| |
•
|
The availability of favorable credit and trade terms
|
Labor
Relations
|
|
|
| |
•
|
Potential work disruptions resulting from labor disputes
|
| |
| |
•
|
Ability to negotiate labor contracts with acceptable terms
|
Employee
Benefit Costs
|
|
|
| |
•
|
Increased operating costs resulting from rising employee benefit
costs or pension funding obligations
|
Regulatory
Matters
|
|
|
| |
•
|
The ability to timely obtain permits, comply with government
regulations or make capital expenditures required to maintain
compliance with government regulations
|
| |
| |
•
|
Changes in applicable laws and regulations that impose
additional requirements or restrictions on the operation of the
Company’s businesses
|
Self-Insurance
|
|
|
| |
•
|
Variability in actuarial projections regarding workers’
compensation and general and automobile liability
|
| |
| |
•
|
Potential increase in the number or severity of claims for which
we are self-insured
|
Legal
and Administrative Proceedings
|
|
|
| |
•
|
Unfavorable outcomes in litigation, governmental or
administrative proceedings or other disputes
|
| |
| |
•
|
Adverse publicity related to such unfavorable outcomes
|
Information
Technology
|
|
|
| |
•
|
Difficulties in developing, maintaining or upgrading information
technology systems
|
3
|
|
|
| |
•
|
Business disruptions or losses resulting from data theft,
information espionage, or other criminal activity directed at
the Company’s computer or communications systems
|
Severe
Weather, Natural Disasters and Adverse Climate
Changes
|
|
|
| |
•
|
Property damage or business disruption resulting from severe
weather conditions and natural disasters that affect the
Company, and the Company’s customers or suppliers
|
| |
| |
•
|
Unseasonably adverse climate conditions that impact the
availability or cost of certain products in the grocery supply
chain
|
Accounting
Matters
|
|
|
| |
•
|
Changes in accounting standards that impact the Company’s
financial statements
|
Goodwill
and Intangible Asset Impairment Charges
|
|
|
| |
•
|
Unfavorable changes in economic, industry or market conditions,
business operations, competition or the Company’s stock
price and market capitalization
|
4
PART I
General
SUPERVALU INC. (“SUPERVALU” or the
“Company”), a Delaware corporation, was organized in
1925 as the successor to two wholesale grocery firms established
in the 1870’s. The Company’s principal executive
offices are located at 11840 Valley View Road, Eden Prairie,
Minnesota 55344 (Telephone:
952-828-4000).
All references to the “Company” or
“SUPERVALU” relate to SUPERVALU INC. and its
majority-owned subsidiaries.
SUPERVALU is one of the largest companies in the United States
grocery channel. SUPERVALU conducts its retail operations under
the Acme, Albertsons, Bristol Farms, Cub Foods, Farm Fresh,
Hornbacher’s, Jewel-Osco, Lucky,
Save-A-Lot,
Shaw’s, Shop ’n Save, Shoppers Food &
Pharmacy and Star Market banners as well as in-store pharmacies
under the Osco and Sav-on banners. Additionally, the Company
provides supply chain services, primarily wholesale
distribution, across the United States retail grocery channel.
On June 2, 2006, the Company acquired New Albertson’s,
Inc. (“New Albertsons”) consisting of the core
supermarket businesses (the “Acquired Operations”)
formerly owned by Albertson’s, Inc.
(“Albertsons”) operating approximately 1,125 stores
under the banners of Acme, Albertsons, Bristol Farms,
Jewel-Osco, Shaw’s, Star Market, the related in-store
pharmacies under the Osco and Sav-on banners, 10 distribution
centers and certain regional and corporate offices (the
“Acquisition”). As part of the Acquisition, the
Company acquired the Acme, Albertsons, Bristol Farms, Jewel,
Osco, Sav-on and Shaw’s trademarks and tradenames (the
“Acquired Trademarks”). The Acquisition greatly
increased the size of the Company.
SUPERVALU is focused on long-term retail growth through targeted
new store development and remodel activities. During fiscal
2010, the Company added 40 new stores through new store
development and closed or sold 112 stores, including planned
disposals. The Company leverages its distribution operations by
providing wholesale distribution and logistics and service
solutions to its independent retail customers through its Supply
chain services segment.
The Company makes available free of charge at its internet
website (www.supervalu.com) its annual reports on
Form 10-K,
quarterly reports on
Form 10-Q,
current reports on
Form 8-K
and any amendments to these reports filed or furnished pursuant
to Section 13(a) or 15(d) of the Securities Exchange Act of
1934, as amended (the “Exchange Act”) as soon as
reasonably practicable after such material is electronically
filed with or furnished to the Securities and Exchange
Commission (the “SEC”). Information on the
Company’s website is not deemed to be incorporated by
reference into this Annual Report on
Form 10-K.
The Company will also provide its SEC filings free of charge
upon written request to Investor Relations, SUPERVALU INC.,
P.O. Box 990, Minneapolis, MN 55440.
All dollar and share amounts in this Annual Report on
Form 10-K
are in millions, except per share data and where otherwise noted.
Financial
Information About Reportable Segments
The Company’s business is classified by management into two
reportable segments: Retail food and Supply chain services.
These reportable segments are two distinct businesses, one
retail and one wholesale, each with a different customer base,
marketing strategy and management structure. The Retail food
reportable segment is an aggregation of the Company’s
retail operating segments, which are organized based on format
(traditional retail food stores and
hard-discount
food stores). The Retail food reportable segment derives
revenues from the sale of groceries at retail locations operated
by the Company (both the Company’s own stores and stores
licensed by the Company). The Supply chain services reportable
segment derives revenues from wholesale distribution to
independently-owned retail food stores, mass merchants and other
customers (collectively referred to as “independent retail
customers”) and logistics support services. Substantially
all of the Company’s operations are domestic. Refer to the
Consolidated Segment Financial Information set forth in
Part II, Item 8
5
of this Annual Report on
Form 10-K
for financial information concerning the Company’s
operations by reportable segment.
Retail
Food
The Company conducts its Retail food operations through a total
of 2,349 traditional and hard-discount retail food stores,
including 855 licensed
Save-A-Lot
stores, located throughout the United States. The Company’s
Retail food operations are supplied by 23 dedicated distribution
centers and nine distribution centers that are part of the
Supply chain services segment providing wholesale distribution
to both the Company’s own stores and stores of independent
retail customers.
The Company operates 1,161 traditional retail food stores under
the Acme, Albertsons, Bristol Farms, Cub Foods, Farm Fresh,
Hornbacher’s, Jewel-Osco, Lucky, Shaw’s, Shop ’n
Save, Shoppers Food & Pharmacy and Star Market banners
ranging in size from approximately 40,000 to 60,000 square
feet. The Company’s traditional retail food stores provide
an extensive grocery offering and, depending on size, a variety
of additional products including, general merchandise, health
and beauty care, pharmacy and fuel.
The Company owns 333 hard-discount food stores operating under
the
Save-A-Lot
banner and licenses an additional 855
Save-A-Lot
stores to independent operators.
Save-A-Lot
holds the number one market position, based on revenues, in the
hard-discount grocery-retailing sector.
Save-A-Lot
food stores typically are approximately 15,000 square feet
in size, and stock primarily custom-branded high-volume food
items generally in a single size for each product sold.
Supply
Chain Services
The Company’s Supply chain services business primarily
provides wholesale distribution of products to independent
retailers and is the largest public company food wholesaler in
the nation. The Company’s Supply chain services network
spans 49 states and serves as primary grocery supplier to
approximately 1,940 stores of independent retail customers, in
addition to the Company’s own stores, as well as serving as
secondary grocery supplier to approximately 550 stores of
independent retail customers. The Company’s wholesale
distribution customers include single and multiple grocery store
independent operators, regional and national chains, mass
merchants and the military.
The Company has established a network of strategically located
distribution centers utilizing a multi-tiered logistics system.
The network includes facilities that carry slow turn or fast
turn groceries, perishables, general merchandise and health and
beauty care products. The network is comprised of 21
distribution facilities, nine of which supply the Company’s
own stores in addition to stores of independent retail
customers. Deliveries to retail stores are made from the
Company’s distribution centers by Company-owned trucks,
third-party independent trucking companies or customer-owned
trucks. In addition, the Company provides certain facilitative
services between its independent retailers and vendors related
to products that are delivered directly by suppliers to retail
stores under programs established by the Company. These services
include sourcing, invoicing and payment services.
The Company also offers third-party logistics solutions through
its subsidiary, Total Logistics, Inc. and its Advantage
Logistics operations. These operations provide customers with a
suite of logistics services, including warehouse management,
transportation, procurement, contract manufacturing and
logistics engineering and management services.
Products
The Company offers a wide variety of nationally advertised brand
name and private-label products, primarily including grocery
(both perishable and nonperishable), general merchandise and
health and beauty care, pharmacy and fuel, which are sold
through the Company’s own and licensed retail food stores
to shoppers and through its Supply chain services business to
independent retail customers. The Company believes that it has
6
adequate and alternative sources of supply for most of its
purchased products. The Company’s Net sales include the
product sales of the Company’s own stores, product sales to
stores licensed by the Company and product sales of the
Company’s Supply chain services business to independent
retail customers.
The following table provides additional detail on the percentage
of Net sales for each group of similar products sold in the
Retail food and Supply chain services segments:
| |
|
|
|
|
|
|
|
|
|
|
|
|
|
|
|
2010
|
|
|
2009
|
|
|
2008
|
|
|
|
|
Retail food:
|
|
|
|
|
|
|
|
|
|
|
|
|
|
Nonperishable grocery
products(1)
|
|
|
43
|
%
|
|
|
41
|
%
|
|
|
40
|
%
|
|
Perishable grocery
products(2)
|
|
|
21
|
|
|
|
23
|
|
|
|
23
|
|
|
General merchandise and health and beauty care
products(3)
|
|
|
5
|
|
|
|
6
|
|
|
|
7
|
|
|
Pharmacy products
|
|
|
6
|
|
|
|
6
|
|
|
|
6
|
|
|
Fuel
|
|
|
2
|
|
|
|
1
|
|
|
|
1
|
|
|
Other
|
|
|
1
|
|
|
|
1
|
|
|
|
1
|
|
|
|
|
|
|
|
|
|
|
|
|
|
|
|
|
|
|
|
78
|
|
|
|
78
|
|
|
|
78
|
|
|
Supply chain services:
|
|
|
|
|
|
|
|
|
|
|
|
|
|
Product sales to independent retail customers
|
|
|
22
|
|
|
|
21
|
|
|
|
21
|
|
|
Services to supply chain customers
|
|
|
—
|
|
|
|
1
|
|
|
|
1
|
|
|
|
|
|
|
|
|
|
|
|
|
|
|
|
|
|
|
|
22
|
|
|
|
22
|
|
|
|
22
|
|
|
|
|
|
|
|
|
|
|
|
|
|
|
|
|
Net sales
|
|
|
100
|
%
|
|
|
100
|
%
|
|
|
100
|
%
|
|
|
|
|
|
|
|
|
|
|
|
|
|
|
|
|
|
|
(1) |
|
Includes such items as dry goods, beverages, dairy, frozen foods
and candy |
|
(2) |
|
Includes such items as meat, produce, deli and bakery |
|
(3) |
|
Includes such items as household products,
over-the-counter
medication, beauty care, personal care, seasonal items and
tobacco |
Private-Label
Products
The Company’s private-label products are produced to the
Company’s specification by many suppliers and compete in
many areas of the Company’s stores. Private-label products
include: the premium brand Culinary
Circletm,
which offers unique, premium quality products in highly
competitive categories; first tier brands, including Wild
Harvesttm,
Flavoritetm,
Richfoodtm,
equalinetm,
HomeLifetm
and several others, which provide shoppers quality national
brand equivalent products at a competitive price; and the value
brand, Shopper’s
Valuetm,
which offers budget conscious consumers a quality alternative to
national brands at substantial savings.
Trademarks
The Company offers some independent retail customers the
opportunity to franchise a concept or license a service mark.
This program helps these customers compete by providing, as part
of the franchise or license program, a complete business
concept, group advertising, private-label products and other
benefits. The Company is the franchisor or licensor of certain
service marks such as CUB FOODS,
SAVE-A-LOT,
SENTRY, FESTIVAL FOODS, COUNTY MARKET, SHOP ’N SAVE,
NEWMARKET, FOODLAND, JUBILEE, SUPERVALU and SUPERVALU PHARMACIES.
In connection with the Acquisition, the Company entered into a
trademark license agreement with Albertson’s LLC, the
purchaser of the non-core supermarket business of Albertsons,
under which Albertson’s LLC may use legacy Albertsons
trademarks, such as ALBERTSONS, SAV-ON and LUCKY. Under the
trademark license agreement, Albertson’s LLC is also
allowed to enter into sublicense agreements with transferees of
Albertson’s LLC stores, which allows such transferees to
use many of the same legacy Albertsons trademarks.
7
The Company registers a substantial number of its
trademarks/service marks in the United States Patent and
Trademark Office, including many of its private-label product
trademarks and service marks. U.S. trademark and service
mark registrations are generally for a term of 10 years,
renewable every 10 years as long as the trademark is used
in the regular course of trade. The Company considers certain of
its trademarks and service marks to be of material importance to
its Retail food and Supply chain services businesses and
actively defends and enforces such trademarks and service marks.
Working
Capital
Normal operating fluctuations in working capital balances can
result in changes to cash flow from operations presented in the
Consolidated Statements of Cash Flows that are not necessarily
indicative of long-term operating trends. There are no unusual
industry practices or requirements relating to working capital
items.
Competition
The Company’s Retail food and Supply chain services
businesses are highly competitive. The Company believes that the
success of its Retail food and Supply chain services businesses
are dependent upon the ability of its own stores and stores
licensed by the Company, as well as the stores of independent
retail customers it supplies, to compete successfully with other
retail food stores. Principal competition comes from traditional
grocery retailers, including regional and national chains and
independent food store operators, and non-traditional retailers,
such as supercenters, membership warehouse clubs, specialty
supermarkets, drug stores, discount stores, dollar stores,
convenience stores and restaurants. The Company believes that
the principal competitive factors faced by its own stores and
stores licensed by the Company, as well as the stores of
independent retail customers it supplies, include price,
quality, assortment, brand recognition, store location, in-store
marketing and merchandising, promotional strategies and other
competitive activities.
The traditional wholesale distribution component of the
Company’s Supply chain services business competes directly
with a number of traditional grocery wholesalers. The Company
believes it competes in this business on the basis of price,
quality, assortment, schedule and reliability of deliveries,
service fees and distribution facility locations.
Employees
As of February 27, 2010, the Company had approximately
160,000 employees. Approximately 106,000 employees are
covered by collective bargaining agreements. During fiscal 2010,
46 collective bargaining agreements covering approximately
16,000 employees were renegotiated and 33 collective
bargaining agreements covering approximately
29,000 employees expired without their terms being
renegotiated. Negotiations are expected to continue with the
bargaining units representing the employees subject to those
expired agreements. During fiscal 2011, 71 collective bargaining
agreements covering approximately 12,000 employees will
expire. The Company is focused on ensuring competitive cost
structures in each market in which it operates while meeting its
employees’ needs for attractive wages and affordable
healthcare and retirement benefits. The Company believes that it
has generally good relations with its employees and with the
labor unions that represent employees covered by collective
bargaining agreements.
8
EXECUTIVE
OFFICERS OF THE COMPANY
The following table provides certain information concerning the
executive officers of the Company as of April 23, 2010.
| |
|
|
|
|
|
|
|
|
|
|
|
|
|
|
|
|
|
|
|
Calendar Year
|
|
|
|
|
|
|
|
|
|
Elected to
|
|
|
|
|
|
|
|
|
|
Present
|
|
Other Positions Recently Held
|
|
Name
|
|
Age
|
|
Present Position
|
|
Position
|
|
with the Company or Albertsons
|
|
|
|
Jeffrey Noddle
|
|
|
63
|
|
|
Executive Chairman of the Board of Directors
|
|
|
2009
|
|
|
Chairman of the Board of Directors and Chief Executive Officer,
2005-2009
|
|
Craig R.
Herkert(1)
|
|
|
50
|
|
|
Chief Executive Officer and President
|
|
|
2009
|
|
|
|
|
Julie Dexter
Berg(2)
|
|
|
53
|
|
|
Executive Vice President, Chief Marketing Officer
|
|
|
2010
|
|
|
|
|
David L. Boehnen
|
|
|
63
|
|
|
Executive Vice President
|
|
|
1997
|
|
|
|
|
Janel S. Haugarth
|
|
|
54
|
|
|
Executive Vice President; President and Chief Operating Officer,
Supply Chain Services
|
|
|
2006
|
|
|
Senior Vice President; President and Chief Operating Officer,
Supply Chain Services, 2005-2006
|
|
Steven J.
Jungmann(3)
|
|
|
47
|
|
|
Executive Vice President, Merchandising
|
|
|
2010
|
|
|
|
|
Pamela K. Knous
|
|
|
56
|
|
|
Executive Vice President and Chief Financial Officer
|
|
|
1997
|
|
|
|
|
David E. Pylipow
|
|
|
52
|
|
|
Executive Vice President, Human Resources and Communications
|
|
|
2006
|
|
|
Senior Vice President, Human Resources, 2004-2006; Senior Vice
President, Human Resources and Management Services, Save-A-Lot,
2000-2004
|
|
Peter J. Van
Helden(4)
|
|
|
49
|
|
|
Executive Vice President; President, Retail Operations
|
|
|
2009
|
|
|
Executive Vice President, Retail West, 2007-2009 Senior Vice
President; President, Retail West 2006-2007; President and CEO,
California Division, Albertsons, 2004-2006; President, Jewel
Osco Division, Albertsons, 1999-2004
|
|
Sherry M. Smith
|
|
|
48
|
|
|
Senior Vice President, Finance
|
|
|
2002
|
|
|
Senior Vice President, Finance and Treasurer, 2002-2005
|
|
Daniel J.
Zvonek(4)
|
|
|
45
|
|
|
Vice President and Controller
|
|
|
2009
|
|
|
Vice President and Chief Financial Officer, East Retail Region
2006-2009; Division Chief Financial Officer Drugstores 2001-2006
|
|
|
|
|
(1) |
|
Craig R. Herkert was appointed Chief Executive Officer in May
2009 and President in August 2009. Prior to joining the Company,
Mr. Herkert served as President and CEO of the Americas for
Wal-Mart Stores, Inc., from 2004 to 2009. |
|
(2) |
|
Julie Dexter Berg was appointed Executive Vice President, Chief
Marketing Officer in March 2010. Prior to joining the Company,
Ms. Dexter Berg was the Managing Partner at Brandmaking
LLC, a marketing strategy consulting company from 2004 to 2010. |
|
(3) |
|
Steven J. Jungmann was appointed Executive Vice President,
Merchandising in February 2010. Prior to joining the Company,
Mr. Jungmann was the Senior Vice President Consumer Sales
and Marketing at the Solo Cup Company from 2007 to 2010. Prior
to joining Solo Cup Company, he served in 2006 as the Senior
Vice President of Sales for Spectrum Brands, Inc. He previously
served 20 years at Kraft Foods Inc. where he held a number
of sales, corporate planning and strategy roles across multiple
geographies. His last position at Kraft was Vice President of
category sales. |
|
(4) |
|
As part of the acquisition of New Albertsons on June 2,
2006, Mr. Van Helden and Mr. Zvonek became corporate
officers of the Company. |
9
The term of office of each executive officer is from one annual
meeting of the Board of Directors until the next annual meeting
of Board of Directors or until a successor is elected. There are
no arrangements or understandings between any executive officer
of the Company and any other person pursuant to which any
executive officer was selected as an officer of the Company.
There are no family relationships between or among any of the
executive officers of the Company.
Each of the executive officers of the Company has been in the
employ of the Company or its subsidiaries for more than five
consecutive years, except for Craig C. Herkert, Julie Dexter
Berg, Steven J. Jungmann, Peter J. Van Helden and Daniel J.
Zvonek.
Various risks and uncertainties may affect the Company’s
business. Any of the risks described below or elsewhere in this
Annual Report on
Form 10-K
or the Company’s other SEC filings may have a material
impact on the Company’s business, financial condition or
results of operations.
Current
economic conditions
Weakness in the economy and reduced consumer confidence
contributed to the decline in consumer spending and to consumers
trading down to a less expensive mix of products or to consumers
trading down to discounters for grocery items. In addition, in
fiscal 2010, the Company experienced low levels of inflation. In
this uncertain economy, it is difficult to forecast whether
fiscal 2011 will be a period of inflation or deflation. Food
deflation could reduce sales growth and earnings, while food
inflation, combined with reduced consumer spending, could reduce
gross profit margins. If these consumer spending patterns
continue or worsen, along with an ongoing soft economy, the
Company’s financial condition and results of operations may
be adversely affected.
Execution
of initiatives
The Company is positioned in the retail food industry as the
only traditional food retailer with multiple formats and
ownership models that can be used to address differing customer
needs across the United States. Management believes that this
diversity of
go-to-market
options differentiates the Company and is part of its vision of
becoming “America’s Neighborhood Grocer.” The
Company has launched certain initiatives to achieve this vision
and enhance performance through a greater focus on the customer
and simplification of the in-store shopping experience combined
with reducing its overall cost structure and further leveraging
its size. The Company plans to significantly increase the number
of hard-discount stores and to reinvest in its existing store
base through remodels and merchandising initiatives tailored to
the unique needs of each particular store’s neighborhood.
If the Company is unable to execute on these initiatives, the
Company’s financial condition and results of operations may
be adversely affected.
High
level of competition in the Retail food and Supply chain
services businesses
The Company’s Retail food business faces competition for
customers, employees, store sites, products and in other
important areas from traditional grocery retailers, including
regional and national chains and independent food store
operators, and non-traditional retailers, such as supercenters,
membership warehouse clubs, specialty supermarkets, drug stores,
discount stores, dollar stores, convenience stores and
restaurants. The Company’s ability to attract customers in
this business is dependent, in large part, upon a combination of
price, quality, assortment, brand recognition, store location,
in-store marketing and merchandising, promotional strategies and
continued growth into new markets. In addition, the nature and
extent to which our competitors implement various pricing and
promotional activities in response to increasing competition and
the Company’s response to these competitive actions, can
adversely affect profitability.
The Company’s Supply chain services business is primarily
wholesale distribution and includes a third-party logistics
component. The distribution component of the Company’s
Supply chain services business competes
10
with traditional grocery wholesalers on the basis of price,
quality, assortment, schedule and reliability of deliveries,
service fees and distribution facility locations.
Competitive pressures on the Company’s Retail food and
Supply chain services businesses may cause the Company to
experience: (i) reductions in the prices at which the
Company is able to sell products at its retail locations or to
its independent retail customers, (ii) decreases in sales
volume due to increased difficulty in selling the Company’s
products and (iii) difficulty in attracting and retaining
customers. Any of these outcomes may adversely affect the
Company’s financial condition and results of operations.
Food and
drug safety concerns and related unfavorable publicity
There is increasing governmental scrutiny and public awareness
regarding food and drug safety. The Company may be adversely
affected if consumers lose confidence in the safety and quality
of the Company’s food and drug products. Any events that
give rise to actual or potential food contamination, drug
contamination or food-borne illness may result in product
liability claims and a loss of consumer confidence. In addition,
adverse publicity about these types of concerns whether valid or
not, may discourage consumers from buying the Company’s
products or cause production and delivery disruptions, which may
adversely affect the Company’s financial condition and
results of operations.
Substantial
indebtedness
The Company has, and expects to continue to have, a substantial
amount of debt. The Company’s substantial indebtedness may
increase the Company’s borrowing costs and decrease the
Company’s business flexibility, making it more vulnerable
to adverse economic conditions. For example, high levels of debt
could:
|
|
|
| |
•
|
require the Company to use a substantial portion of its cash
flow from operations for the payment of principal and interest
on its indebtedness, thereby reducing the availability of cash
flow to fund working capital, capital expenditures,
acquisitions, and other purposes;
|
| |
| |
•
|
limit the Company’s ability to obtain, or increase the cost
at which the Company is able to obtain financing in order to
refinance existing indebtedness and fund working capital,
capital expenditures, acquisitions and other purposes;
|
| |
| |
•
|
limit the Company’s ability to adjust to changing business
and market conditions placing the Company at a competitive
disadvantage relative to its competitors that have less
debt; and
|
| |
| |
•
|
Increase the Company’s risk of defaulting on debt
obligations or breaching a covenant, which in turn could result
in cross defaults on other debt obligations.
|
Any of these outcomes may adversely affect the Company’s
financial condition and results of operations.
Labor
unions
As of February 27, 2010, the Company is a party to 235
collective bargaining agreements covering approximately 106,000
of its employees, of which 71 covering approximately
12,000 employees are scheduled to expire in fiscal 2011.
These expiring agreements cover approximately 12 percent of
the Company’s union-affiliated employees. In addition,
during fiscal 2010, 33 collective bargaining agreements covering
approximately 29,000 employees expired without their terms
being renegotiated. Negotiations are expected to continue with
the bargaining units representing the employees subject to those
agreements. In future negotiations with labor unions, the
Company expects that, among other issues, rising healthcare,
pension and employee benefit costs will be important topics for
negotiation. There can be no assurance that the Company will be
able to negotiate the terms of any expiring or expired agreement
in a manner acceptable to the Company. Therefore, potential work
disruptions from labor disputes may disrupt the Company’s
businesses and adversely affect the Company’s financial
condition and results of operations.
11
Costs of
employee benefits
The Company provides health benefits and sponsors defined
pension and other post-retirement plans for substantially all
employees not participating in multi-employer health and pension
plans. The Company’s costs to provide such benefits
continue to increase annually and recent legislative and private
sector initiatives regarding healthcare reform could result in
significant changes to the U.S. healthcare system. The
Company is not able at this time to determine the impact that
healthcare reform could have on the Company-sponsored medical
plans. In addition, the Company participates in various
multi-employer health and pension plans for a majority of its
union-affiliated employees, and the Company is required to make
contributions to these plans in amounts established under
collective bargaining agreements. The costs of providing
benefits through such plans have escalated rapidly in recent
years. The amount of any increase or decrease in the
Company’s required contributions to these multi-employer
plans will depend upon many factors, including the outcome of
collective bargaining, actions taken by trustees who manage the
plans, government regulations, the actual return on assets held
in the plans and the potential payment of a withdrawal liability
if the Company chooses to exit a market. Increases in the costs
of benefits under these plans coupled with adverse stock market
developments that have reduced the return on plan assets have
caused some multi-employer plans in which the Company
participates to be underfunded. The unfunded liabilities of
these plans may result in increased future payments by the
Company and the other participating employers, including costs
that may arise with respect to any potential litigation or that
may cause the acceleration of payments to fund any underfunded
plan. The Company’s risk of such increased payments may be
greater if any of the participating employers in these
underfunded plans withdraws from the plan due to insolvency and
is not able to contribute an amount sufficient to fund the
unfunded liabilities associated with its participants in the
plan. If the Company is unable to control healthcare and pension
costs, the Company may experience increased operating costs,
which may adversely affect the Company’s financial
condition and results of operations.
Governmental
regulations
The Company’s businesses are subject to various federal,
state and local laws, regulations and administrative practices.
These laws require the Company to comply with numerous
provisions regulating health and sanitation standards, equal
employment opportunity, minimum wages and licensing for the sale
of food, drugs and alcoholic beverages. The Company’s
inability to timely obtain permits, comply with government
regulations or make capital expenditures required to maintain
compliance with governmental regulations may adversely impact
the Company’s business operations and prospects for future
growth and our ability to participate in federal and state
healthcare programs. In addition, the Company cannot predict the
nature of future laws, regulations, interpretations or
applications, nor can the Company determine the effect that
additional governmental regulations or administrative orders,
when and if promulgated, or disparate federal, state and local
regulatory schemes would have on the Company’s future
business. They may, however, impose additional requirements or
restrictions on the products the Company sells or manner in
which the Company operates its businesses. Any or all of such
requirements may adversely affect the Company’s financial
condition and results of operations.
Insurance
claims
The Company uses a combination of insurance and self-insurance
to provide for potential liabilities for workers’
compensation, automobile and general liability, property
insurance and employee healthcare benefits. The Company
estimates the liabilities associated with the risks retained by
the Company, in part, by considering historical claims
experience, demographic and severity factors and other actuarial
assumptions which, by their nature, are subject to a degree of
variability. Any actuarial projection of losses concerning
workers’ compensation and general and automobile liability
is subject to a degree of variability. Among the causes of this
variability are unpredictable external factors affecting future
inflation rates, discount rates, litigation trends, legal
interpretations, benefit level changes and actual claim
settlement patterns.
Some of the many sources of uncertainty in the Company’s
reserve estimates include changes in benefit levels, medical fee
schedules, medical utilization guidelines, vocation
rehabilitation and apportionment. If the number
12
or severity of claims for which the Company is self-insured
increases, or the Company is required to accrue or pay
additional amounts because the claims prove to be more severe
than the Company’s original assessments, the Company’s
financial condition and results of operations may be adversely
affected.
Litigation
The Company’s businesses are subject to the risk of
litigation by employees, consumers, suppliers, stockholders or
others through private actions, class actions, administrative
proceedings, regulatory actions or other litigation. The outcome
of litigation, particularly class action lawsuits and regulatory
actions, is difficult to assess or quantify. Plaintiffs in these
types of lawsuits may seek recovery of very large or
indeterminate amounts, and the magnitude of the potential loss
relating to such lawsuits may remain unknown for substantial
periods of time. The cost to defend future litigation may be
significant. There may also be adverse publicity associated with
litigation that may decrease consumer confidence in the
Company’s businesses, regardless of whether the allegations
are valid or whether the Company is ultimately found liable. As
a result, litigation may adversely affect the Company’s
financial condition and results of operations.
Information
technology systems
The Company has complex information technology systems that are
important to the operation of its businesses. The Company may
encounter difficulties in developing new systems or maintaining
and upgrading existing systems. Such difficulties may lead to
significant expenses or losses due to disruption in business
operations and, as a result, may adversely affect the
Company’s results of operations.
Additionally, data theft, information espionage or other
criminal activity directed at the grocery or drug store
industry, the transportation industry, or computer or
communications systems may adversely affect the Company’s
businesses by causing the Company to implement costly security
measures in recognition of actual or potential threats, by
requiring the Company to expend significant time and expense
developing, maintaining or upgrading its information technology
systems and by causing the Company to incur significant costs to
reimburse third parties for damages. Such activities may also
adversely affect the Company’s financial condition and
results of operations by reducing consumer confidence in the
marketplace and by modifying consumer spending habits.
Weather
and natural disasters
Severe weather conditions such as hurricanes, earthquakes or
tornadoes, as well as other natural disasters, in areas in which
the Company has stores or distribution facilities or from which
the Company obtains products may cause physical damage to the
Company’s properties, closure of one or more of the
Company’s stores or distribution facilities, lack of an
adequate work force in a market, temporary disruption in the
supply of products, disruption in the transport of goods, delays
in the delivery of goods to the Company’s distribution
centers or stores and a reduction in the availability of
products in the Company’s stores. In addition, adverse
climate conditions and adverse weather patterns, such as drought
or flood, that impact growing conditions and the quantity and
quality of crops yielded by food producers may adversely affect
the availability or cost of certain products within the grocery
supply chain. Any of these factors may disrupt the
Company’s businesses and adversely affect the
Company’s financial condition and results of operations.
Changes
in accounting standards
Accounting principles generally accepted in the Unites States of
America (“accounting standards”) and interpretations
by various governing bodies, including the SEC, for many aspects
of the Company’s business, such as accounting for insurance
and self-insurance, inventories, goodwill and intangible assets,
store closures, leases, income taxes and stock-based
compensation, are complex and involve subjective judgments.
Changes in these rules or their interpretation may significantly
change or add significant volatility to the Company’s
13
reported earnings without a comparable underlying change in cash
flow from operations. As a result, changes in accounting
standards may materially impact the Company’s financial
condition and results of operations.
Impairment
charges for goodwill or other intangible assets
The Company is required to annually test goodwill and intangible
assets with indefinite useful lives, including the goodwill
associated with past acquisitions and any future acquisitions,
to determine if impairment has occurred. Additionally, interim
reviews must be performed whenever events or changes in
circumstances indicate that impairment may have occurred. If the
testing performed indicates that impairment has occurred, the
Company is required to record a non-cash impairment charge for
the difference between the carrying value of the goodwill or
other intangible assets and the implied fair value of the
goodwill or other intangible assets in the period the
determination is made.
The testing of goodwill and other intangible assets for
impairment requires the Company to make significant estimates
about our future performance and cash flows, as well as other
assumptions. These estimates can be affected by numerous
factors, including potential changes in economic, industry or
market conditions, changes in business operations, changes in
competition or changes in the Company’s stock price and
market capitalization. Changes in these factors, or changes in
actual performance compared with estimates of the Company’s
future performance, may affect the fair value of goodwill or
other intangible assets, which may result in an impairment
charge. The Company cannot accurately predict the amount and
timing of any impairment of assets. Should the value of goodwill
or other intangible assets become impaired, the Company’s
financial condition and results of operations may be adversely
affected.
|
|
|
ITEM 1B.
|
UNRESOLVED
STAFF COMMENTS
|
None.
Total retail square footage as of February 27, 2010 was
65 million, of which approximately 62 percent was
leased. Additional information on the Company’s properties
can be found in Part I, Item 1 of this Annual Report
on
Form 10-K.
|
|
|
ITEM 3.
|
LEGAL
PROCEEDINGS
|
The Company is subject to various lawsuits, claims and other
legal matters that arise in the ordinary course of conducting
business, none of which, in management’s opinion, is
expected to have a material adverse effect on the Company’s
financial condition, results of operations or cash flows.
In September 2008, a class action complaint was filed against
the Company, as well as International Outsourcing Services, LLC
(“IOS”), Inmar, Inc., Carolina Manufacturer’s
Services, Inc., Carolina Coupon Clearing, Inc. and Carolina
Services, in the United States District Court in the Eastern
District of Wisconsin. The plaintiffs in the case are a consumer
goods manufacturer, a grocery co-operative and a retailer
marketing services company who allege on behalf of a purported
class that the Company and the other defendants
(i) conspired to restrict the markets for coupon processing
services under the Sherman Act and (ii) were part of an
illegal enterprise to defraud the plaintiffs under the Federal
Racketeer Influenced and Corrupt Organizations Act. The
plaintiffs seek monetary damages, attorneys’ fees and
injunctive relief. The Company intends to vigorously defend this
lawsuit, however all proceedings have been stayed in the case
pending the result of the criminal prosecution of certain former
officers of IOS. Although this lawsuit is subject to the
uncertainties inherent in the litigation process, based on the
information presently available to the Company, management does
not expect that the ultimate resolution of this lawsuit will
have a material adverse effect on the Company’s financial
condition, results of operations or cash flows.
14
In December 2008, a class action complaint was filed in the
United States District Court for the Western District of
Wisconsin against the Company alleging that a 2003 transaction
between the Company and C&S Wholesale Grocers, Inc.
(“C&S”) was a conspiracy to restrain trade and
allocate markets. In the 2003 transaction, the Company purchased
certain assets of the Fleming Corporation as part of Fleming
Corporation’s bankruptcy proceedings and sold certain
assets of the Company to C&S which were located in New
England. Since December 2008, three other retailers have filed
similar complaints in other jurisdictions. The cases have been
consolidated and are proceeding in the United States District
Court for the District of Minnesota. The complaints allege that
the conspiracy was concealed and continued through the use of
non-compete and non-solicitation agreements and the closing down
of the distribution facilities that the Company and C&S
purchased from the other. Plaintiffs are seeking monetary
damages, injunctive relief and attorneys’ fees. The Company
is vigorously defending these lawsuits. On September 14,
2009, the United States Federal Trade Commission
(“FTC”) issued a subpoena to the Company requesting
documents related to the C&S transaction as part of the
FTC’s investigation into whether the Company and C&S
engaged in unfair methods of competition. The Company is
cooperating with the FTC. Although this matter is subject to the
uncertainties inherent in the litigation process, based on the
information presently available to the Company, management does
not expect that the ultimate resolution of this lawsuit or the
FTC investigation will have a material adverse effect on the
Company’s financial condition, results of operations or
cash flows.
In July 2009, a putative class action complaint was filed in the
United States District Court for the Southern District of New
York against the Company, an officer and the Executive Chairman
of the Board alleging fraud under Sections 10(b) and 20(a)
of the Securities Exchange Act of 1934, as amended (the
“Exchange Act”) and
Rule 10b-5
under the Exchange Act. In October 2009, the lawsuit was
transferred to the United States District Court for the District
of Minnesota. The complaint alleged that the Company withheld
negative information from the market by inflating its fiscal
2010 guidance in order to complete the Company’s note
offering which closed on May 7, 2009. On January 13,
2010, the plaintiff voluntarily dismissed the lawsuit without
prejudice and to date has not re-filed the action.
On January 7, 2010, the Company received a subpoena from
the Office of Inspector General for the Department of Health and
Human Services’ Milwaukee Field Office in connection with
an investigation of possible false or otherwise improper claims
for payment under the Medicaid program. The subpoena requests
retail pharmacy claims data for “dual eligible”
customers (i.e., customers with both Medicaid and private
insurance coverage), information concerning the Company’s
retail pharmacy claims processing systems, copies of pharmacy
payor contracts and other documents and records. The Company is
cooperating with the Office of Inspector General. Management
cannot predict with certainty the timing or outcome of any
review by the government of such information.
The Company is also involved in routine legal proceedings
incidental to its operations. Some of these routine proceedings
involve class allegations, many of which are ultimately
dismissed. Management does not expect that the ultimate
resolution of these legal proceedings will have a material
adverse effect on the Company’s financial condition,
results of operations or cash flows.
The statements above reflect management’s current
expectations based on the information presently available to the
Company, however, predicting the outcomes of claims and
litigation and estimating related costs and exposures involves
substantial uncertainties that could cause actual outcomes,
costs and exposures to vary materially from current
expectations. In addition, the Company regularly monitors its
exposure to the loss contingencies associated with these matters
and may from time to time change its predictions with respect to
outcomes and its estimates with respect to related costs and
exposures and believes recorded reserves are adequate. It is
possible, although management believes it is remote, that
material differences in actual outcomes, costs and exposures
relative to current predictions and estimates, or material
changes in such predictions or estimates, could have a material
adverse effect on the Company’s financial condition,
results of operations or cash flows.
|
|
|
ITEM 4.
|
(REMOVED
AND RESERVED)
|
15
PART II
|
|
|
ITEM 5.
|
MARKET
FOR THE REGISTRANT’S COMMON EQUITY, RELATED STOCKHOLDER
MATTERS AND ISSUER PURCHASES OF EQUITY SECURITIES
|
The Company’s common stock is listed on the New York Stock
Exchange under the symbol SVU. As of April 16, 2010, there
were 26,934 stockholders of record.
Common Stock Price
| |
|
|
|
|
|
|
|
|
|
|
|
|
|
|
|
|
|
|
|
|
|
|
|
|
|
|
|
Common Stock Price Range
|
|
|
Dividends Declared Per Share
|
|
|
|
|
2010
|
|
|
2009
|
|
|
2010
|
|
|
2009
|
|
|
Fiscal
|
|
High
|
|
|
Low
|
|
|
High
|
|
|
Low
|
|
|
|
|
|
|
|
|
|
|
First Quarter
|
|
$
|
17.93
|
|
|
$
|
13.45
|
|
|
$
|
35.91
|
|
|
$
|
26.09
|
|
|
$
|
0.1725
|
|
|
$
|
0.1700
|
|
|
Second Quarter
|
|
|
16.16
|
|
|
|
12.13
|
|
|
|
33.65
|
|
|
|
22.95
|
|
|
|
0.1750
|
|
|
|
0.1725
|
|
|
Third Quarter
|
|
|
17.59
|
|
|
|
13.72
|
|
|
|
25.70
|
|
|
|
8.59
|
|
|
|
0.1750
|
|
|
|
0.1725
|
|
|
Fourth Quarter
|
|
|
15.88
|
|
|
|
12.40
|
|
|
|
20.38
|
|
|
|
10.52
|
|
|
|
0.0875
|
|
|
|
0.1725
|
|
|
|
|
|
|
|
|
|
|
|
|
|
|
|
|
|
|
|
|
|
|
|
|
|
|
|
|
Year
|
|
|
17.93
|
|
|
|
12.13
|
|
|
|
35.91
|
|
|
|
8.59
|
|
|
$
|
0.6100
|
|
|
$
|
0.6875
|
|
|
|
|
|
|
|
|
|
|
|
|
|
|
|
|
|
|
|
|
|
|
|
|
|
|
|
Dividend payment dates are on or about the 15th day of
March, June, September and December, subject to the Board of
Directors approval.
Company
Purchases of Equity Securities
The following table sets forth the Company’s purchases of
equity securities for the periods indicated:
| |
|
|
|
|
|
|
|
|
|
|
|
|
|
|
|
|
|
|
|
|
|
|
|
|
|
Total Number of
|
|
|
Approximate
|
|
|
|
|
|
|
|
|
|
|
Shares Purchased
|
|
|
Dollar Value of
|
|
|
|
|
|
|
|
|
|
|
as Part of
|
|
|
Shares that May
|
|
|
|
|
|
|
|
|
|
|
Publicly
|
|
|
Yet be Purchased
|
|
|
|
|
|
|
|
|
|
|
Announced
|
|
|
Under the
|
|
(in millions, except shares and per share
|
|
Total Number
|
|
|
Average
|
|
|
Treasury Stock
|
|
|
Treasury Stock
|
|
amounts)
|
|
of Shares
|
|
|
Price Paid
|
|
|
Purchase
|
|
|
Purchase
|
|
|
Period(1)
|
|
Purchased(2)
|
|
|
Per Share
|
|
|
Program(3)
|
|
|
Program(3)
|
|
|
|
|
First four weeks
|
|
|
|
|
|
|
|
|
|
|
|
|
|
|
|
|
|
December 6, 2009 to January 2, 2010
|
|
|
—
|
|
|
$
|
—
|
|
|
|
—
|
|
|
$
|
70
|
|
|
Second four weeks
|
|
|
|
|
|
|
|
|
|
|
|
|
|
|
|
|
|
January 3, 2010 to January 30, 2010
|
|
|
10,478
|
|
|
$
|
14.48
|
|
|
|
—
|
|
|
$
|
70
|
|
|
Third four weeks
|
|
|
|
|
|
|
|
|
|
|
|
|
|
|
|
|
|
January 31, 2010 to February 27, 2010
|
|
|
3,093
|
|
|
$
|
14.93
|
|
|
|
—
|
|
|
$
|
70
|
|
|
|
|
|
|
|
|
|
|
|
|
|
|
|
|
|
|
|
|
Totals
|
|
|
13,571
|
|
|
$
|
14.59
|
|
|
|
—
|
|
|
$
|
70
|
|
|
|
|
|
|
|
|
|
|
|
|
|
|
|
|
|
|
|
|
|
|
|
(1) |
|
The reported periods conform to the Company’s fiscal
calendar composed of thirteen
28-day
periods. The fourth quarter of fiscal 2010 contains three
28-day
periods. |
| |
|
(2) |
|
These amounts include the deemed surrender by participants in
the Company’s compensatory stock plans of
12,618 shares of previously issued common stock. These are
in payment of the purchase price for shares acquired pursuant to
the exercise of stock options and satisfaction of tax
obligations arising from such exercises, as well as from the
vesting of restricted stock awards granted under such plans. |
| |
|
(3) |
|
On May 28, 2009, the Board of Directors of the Company
adopted and announced a new annual share repurchase program
authorizing the Company to purchase up to $70 of the
Company’s common stock. Stock purchases will be made from
the cash generated from the settlement of stock options. This
annual authorization program replaced all existing share
repurchase programs and continues through June 2010. |
16
Stock
Performance Graph
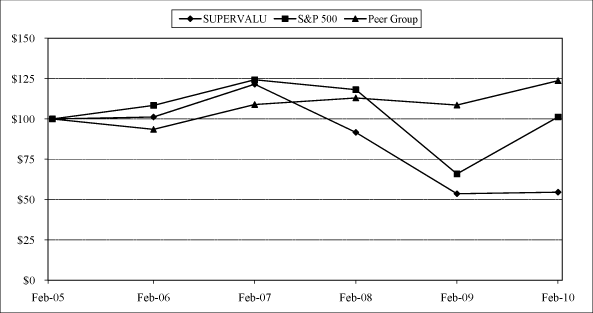
The following graph compares the yearly change in the
Company’s cumulative shareholder return on its common stock
for the period from the end of fiscal 2005 to the end of fiscal
2010 to that of the Standard & Poor’s
(“S&P”) 500 and a group of peer companies in the
retail grocery industry. The stock price performance shown below
is not necessarily indicative of future performance.
COMPARISON
OF CUMULATIVE TOTAL SHAREHOLDER RETURN AMONG
SUPERVALU, S&P 500 AND PEER
GROUP(1)
February 25,
2005 through February 26,
2010(2)
| |
|
|
|
|
|
|
|
|
|
|
|
|
|
Date
|
|
SUPERVALU
|
|
|
S&P 500
|
|
|
Peer
Group(3)
|
|
|
|
|
|
|
|
February 25, 2005
|
|
$
|
100.00
|
|
|
$
|
100.00
|
|
|
$
|
100.00
|
|
|
February 24, 2006
|
|
$
|
101.18
|
|
|
$
|
108.42
|
|
|
$
|
93.53
|
|
|
February 23, 2007
|
|
$
|
121.56
|
|
|
$
|
124.34
|
|
|
$
|
108.93
|
|
|
February 22, 2008
|
|
$
|
91.64
|
|
|
$
|
118.17
|
|
|
$
|
113.03
|
|
|
February 27, 2009
|
|
$
|
53.55
|
|
|
$
|
65.89
|
|
|
$
|
108.61
|
|
|
February 26, 2010
|
|
$
|
54.54
|
|
|
$
|
101.22
|
|
|
$
|
123.74
|
|
|
|
|
|
(1) |
|
Total return assuming $100 invested on February 25, 2005
and reinvestment of dividends on the day they were paid. |
| |
|
(2) |
|
The Company’s fiscal year ends on the last Saturday in
February. |
| |
|
(3) |
|
The Company’s peer group consists of Delhaize Group SA,
Great Atlantic & Pacific Tea Company, Inc.,
Koninklijke Ahold NV, The Kroger Co., Safeway Inc. and Wal-Mart
Stores, Inc. |
The performance graph above is being furnished solely to
accompany this Annual Report on
Form 10-K
pursuant to Item 201(e) of
Regulation S-K,
is not being filed for purposes of Section 18 of the
Exchange Act, and is not to be incorporated by reference into
any filing of the Company, whether made before or after the date
hereof, regardless of any general incorporation language in such
filing.
17
|
|
|
ITEM 6.
|
SELECTED
FINANCIAL DATA
|
| |
|
|
|
|
|
|
|
|
|
|
|
|
|
|
|
|
|
|
|
|
(Dollars and shares in millions, except per
|
|
2010
|
|
|
2009
|
|
|
2008
|
|
|
2007 (1)
|
|
|
2006
|
|
|
share data)
|
|
(52 weeks)
|
|
|
(53 weeks)
|
|
|
(52 weeks)
|
|
|
(52 weeks)
|
|
|
(52 weeks)
|
|
|
|
|
Operating Results
|
|
|
|
|
|
|
|
|
|
|
|
|
|
|
|
|
|
|
|
|
|
Net sales
|
|
$
|
40,597
|
|
|
$
|
44,564
|
|
|
$
|
44,048
|
|
|
$
|
37,406
|
|
|
$
|
19,864
|
|
|
Identical store retail sales increase
(decrease)(2)
|
|
|
(5.1
|
)%
|
|
|
(1.2
|
)%
|
|
|
0.5
|
%
|
|
|
0.4
|
%
|
|
|
(0.5
|
)%
|
|
Cost of sales
|
|
|
31,444
|
|
|
|
34,451
|
|
|
|
33,943
|
|
|
|
29,267
|
|
|
|
16,977
|
|
|
Selling and administrative expenses
|
|
|
7,952
|
|
|
|
8,746
|
|
|
|
8,421
|
|
|
|
6,834
|
|
|
|
2,452
|
|
|
Goodwill and intangible asset impairment
charges(3)
|
|
|
—
|
|
|
|
3,524
|
|
|
|
—
|
|
|
|
—
|
|
|
|
—
|
|
|
Operating earnings (loss)
|
|
|
1,201
|
|
|
|
(2,157
|
)
|
|
|
1,684
|
|
|
|
1,305
|
|
|
|
435
|
|
|
Interest expense, net
|
|
|
569
|
|
|
|
622
|
|
|
|
707
|
|
|
|
558
|
|
|
|
106
|
|
|
Earnings (loss) before income taxes
|
|
|
632
|
|
|
|
(2,779
|
)
|
|
|
977
|
|
|
|
747
|
|
|
|
329
|
|
|
Income tax provision
|
|
|
239
|
|
|
|
76
|
|
|
|
384
|
|
|
|
295
|
|
|
|
123
|
|
|
Net earnings (loss)
|
|
|
393
|
|
|
|
(2,855
|
)
|
|
|
593
|
|
|
|
452
|
|
|
|
206
|
|
|
Net earnings (loss) as a percent of net sales
|
|
|
0.97
|
%
|
|
|
(6.41
|
)%
|
|
|
1.35
|
%
|
|
|
1.21
|
%
|
|
|
1.04
|
%
|
|
Net earnings (loss) per share—diluted
|
|
|
1.85
|
|
|
|
(13.51
|
)
|
|
|
2.76
|
|
|
|
2.32
|
|
|
|
1.46
|
|
|
|
|
|
|
|
|
|
|
|
|
|
|
|
|
|
|
|
|
|
|
|
|
Financial Position
|
|
|
|
|
|
|
|
|
|
|
|
|
|
|
|
|
|
|
|
|
|
Inventories
(FIFO)(4)
|
|
$
|
2,606
|
|
|
$
|
2,967
|
|
|
$
|
2,956
|
|
|
$
|
2,927
|
|
|
$
|
1,114
|
|
|
Working
capital(4)
|
|
|
(192
|
)
|
|
|
(109
|
)
|
|
|
(280
|
)
|
|
|
(67
|
)
|
|
|
821
|
|
|
Property, plant and equipment, net
|
|
|
7,026
|
|
|
|
7,528
|
|
|
|
7,533
|
|
|
|
8,415
|
|
|
|
1,969
|
|
|
Total assets
|
|
|
16,436
|
|
|
|
17,604
|
|
|
|
21,062
|
|
|
|
21,702
|
|
|
|
6,153
|
|
|
Debt and capital lease obligations
|
|
|
7,635
|
|
|
|
8,484
|
|
|
|
8,833
|
|
|
|
9,478
|
|
|
|
1,518
|
|
|
Stockholders’ equity
|
|
|
2,887
|
|
|
|
2,581
|
|
|
|
5,953
|
|
|
|
5,306
|
|
|
|
2,619
|
|
|
|
|
|
|
|
|
|
|
|
|
|
|
|
|
|
|
|
|
|
|
|
|
Other Statistics
|
|
|
|
|
|
|
|
|
|
|
|
|
|
|
|
|
|
|
|
|
|
Return on average stockholders’ equity
|
|
|
14.42
|
%
|
|
|
(59.32
|
)%
|
|
|
10.44
|
%
|
|
|
9.61
|
%
|
|
|
7.95
|
%
|
|
Book value per share
|
|
$
|
13.62
|
|
|
$
|
12.19
|
|
|
$
|
28.13
|
|
|
$
|
25.40
|
|
|
$
|
19.20
|
|
|
Current
ratio(4)
|
|
|
1.04:1
|
|
|
|
0.98:1
|
|
|
|
0.94:1
|
|
|
|
0.99:1
|
|
|
|
1.51:1
|
|
|
Debt to capital
ratio(5)
|
|
|
72.6
|
%
|
|
|
76.7
|
%
|
|
|
59.7
|
%
|
|
|
64.1
|
%
|
|
|
36.7
|
%
|
|
Dividends declared per share
|
|
$
|
0.6100
|
|
|
$
|
0.6875
|
|
|
$
|
0.6750
|
|
|
$
|
0.6575
|
|
|
$
|
0.6400
|
|
|
Weighted average shares outstanding—diluted
|
|
|
213
|
|
|
|
211
|
|
|
|
215
|
|
|
|
196
|
|
|
|
146
|
|
|
Depreciation and amortization
|
|
$
|
957
|
|
|
$
|
1,057
|
|
|
$
|
1,017
|
|
|
$
|
879
|
|
|
$
|
311
|
|
|
Capital
expenditures(6)
|
|
$
|
691
|
|
|
$
|
1,212
|
|
|
$
|
1,227
|
|
|
$
|
910
|
|
|
$
|
365
|
|
|
Retail stores as of fiscal year
end(7)
|
|
|
2,349
|
|
|
|
2,421
|
|
|
|
2,474
|
|
|
|
2,478
|
|
|
|
1,381
|
|
|
|
|
|
(1) |
|
Fiscal 2007 includes 38 weeks of operating results of the
Acquired Operations as well as the assets and liabilities of the
Acquired Operations as of the end of fiscal 2007. |
| |
|
(2) |
|
The change in identical store sales is calculated as the change
in net sales for stores operating for four full quarters,
including store expansions and excluding fuel and planned store
dispositions. Fiscal 2008 and 2007 identical store sales is
calculated as if the Acquired Operations stores were in the
identical store base for four full quarters in fiscal 2008, 2007
and 2006. |
| |
|
(3) |
|
The Company recorded goodwill and intangible asset impairment
charges of $3,524 before tax ($3,326 after tax, or $15.71 per
diluted share) in fiscal 2009. |
18
|
|
|
|
(4) |
|
Inventories (FIFO), working capital and current ratio are
calculated after adding back the LIFO reserve. The LIFO reserve
for each year is as follows: $264 for fiscal 2010, $258 for
fiscal 2009, $180 for fiscal 2008, $178 for fiscal 2007 and $160
for fiscal 2006. |
| |
|
(5) |
|
The debt to capital ratio is calculated as debt and capital
lease obligations divided by the sum of debt and capital lease
obligations and stockholders’ equity. The increase in
fiscal 2009 is due to the write-down of goodwill and intangible
assets. |
| |
|
(6) |
|
Capital expenditures include fixed asset and capital lease
additions. |
| |
|
(7) |
|
Retail stores as of fiscal year end includes licensed
hard-discount food stores and is adjusted for planned sales and
closures as of the end of each fiscal year. |
Historical data is not necessarily indicative of the
Company’s future results of operations or financial
condition. See discussion of “Risk Factors” in
Part I, Item 1A of this Annual Report on
Form 10-K.
|
|
|
ITEM 7.
|
MANAGEMENT’S
DISCUSSION AND ANALYSIS OF FINANCIAL CONDITION AND RESULTS OF
OPERATIONS
|
RESULTS
OF OPERATIONS
Weakness in the economy continued to negatively impact consumer
confidence throughout fiscal 2010. As a result, consumers are
spending less and trading down to a less expensive mix of
products, both of which impacted the Company’s sales. In
addition, low levels of inflation and heightened competitive
activity in fiscal 2010 pressured sales growth. If these
consumer spending, inflationary and competitive trends continue,
they could further impact the Company’s sales and financial
results in fiscal 2011.
The Company has launched certain initiatives to enhance
performance through a greater focus on the customer and
simplification of the in-store shopping experience combined with
reducing its overall cost structure and further leveraging its
size. In addition, the Company will continue to provide capital
spending to fund retail store remodeling activity and new retail
stores.
Highlights of results of operations as reported and as a percent
of Net sales are as follows:
| |
|
|
|
|
|
|
|
|
|
|
|
|
|
|
|
|
|
|
|
|
|
|
|
|
|
|
|
February 27,
|
|
|
February 28,
|
|
|
February 23,
|
|
|
|
|
2010
|
|
|
2009
|
|
|
2008
|
|
|
(In millions, except per share
data)
|
|
(52 weeks)
|
|
|
(53 weeks)
|
|
|
(52 weeks)
|
|
|
|
|
Net sales
|
|
$
|
40,597
|
|
|
|
100.0
|
%
|
|
$
|
44,564
|
|
|
|
100.0
|
%
|
|
$
|
44,048
|
|
|
|
100.0
|
%
|
|
Cost of sales
|
|
|
31,444
|
|
|
|
77.5
|
|
|
|
34,451
|
|
|
|
77.3
|
|
|
|
33,943
|
|
|
|
77.1
|
|
|
|
|
|
|
|
|
|
|
|
|
|
|
|
|
|
|
|
|
|
|
|
|
|
|
|
|
Gross profit
|
|
|
9,153
|
|
|
|
22.5
|
|
|
|
10,113
|
|
|
|
22.7
|
|
|
|
10,105
|
|
|
|
22.9
|
|
|
Selling and administrative expenses
|
|
|
7,952
|
|
|
|
19.6
|
|
|
|
8,746
|
|
|
|
19.6
|
|
|
|
8,421
|
|
|
|
19.1
|
|
|
Goodwill and intangible asset impairment charges
|
|
|
—
|
|
|
|
—
|
|
|
|
3,524
|
|
|
|
7.9
|
|
|
|
—
|
|
|
|
—
|
|
|
|
|
|
|
|
|
|
|
|
|
|
|
|
|
|
|
|
|
|
|
|
|
|
|
|
|
Operating earnings (loss)
|
|
|
1,201
|
|
|
|
3.0
|
|
|
|
(2,157
|
)
|
|
|
(4.8
|
)
|
|
|
1,684
|
|
|
|
3.8
|
|
|
Interest expense, net
|
|
|
569
|
|
|
|
1.4
|
|
|
|
622
|
|
|
|
1.4
|
|
|
|
707
|
|
|
|
1.6
|
|
|
|
|
|
|
|
|
|
|
|
|
|
|
|
|
|
|
|
|
|
|
|
|
|
|
|
|
Earnings (loss) before income taxes
|
|
|
632
|
|
|
|
1.6
|
|
|
|
(2,779
|
)
|
|
|
(6.2
|
)
|
|
|
977
|
|
|
|
2.2
|
|
|
Income tax provision
|
|
|
239
|
|
|
|
0.6
|
|
|
|
76
|
|
|
|
0.2
|
|
|
|
384
|
|
|
|
0.9
|
|
|
|
|
|
|
|
|
|
|
|
|
|
|
|
|
|
|
|
|
|
|
|
|
|
|
|
|
Net earnings (loss)
|
|
$
|
393
|
|
|
|
1.0
|
%
|
|
$
|
(2,855
|
)
|
|
|
(6.4
|
)%
|
|
$
|
593
|
|
|
|
1.3
|
%
|
|
|
|
|
|
|
|
|
|
|
|
|
|
|
|
|
|
|
|
|
|
|
|
|
|
|
|
Net earnings (loss) per share—diluted
|
|
$
|
1.85
|
|
|
|
|
|
|
$
|
(13.51
|
)
|
|
|
|
|
|
$
|
2.76
|
|
|
|
|
|
|
|
|
|
|
|
|
|
|
|
|
|
|
|
|
|
|
|
|
|
|
|
|
|
|
|
19
Comparison
of fifty-two weeks ended February 27, 2010 (fiscal
2010) with fifty-three weeks ended February 28, 2009
(fiscal 2009):
For fiscal 2010, Net sales were $40,597, compared with $44,564
last year. Net earnings for fiscal 2010 were $393 and diluted
net earnings per share were $1.85, compared with net loss of
$2,855 and diluted net loss per share of $13.51 last year.
Results for fiscal 2010 include net charges of $62 before tax
($39 after tax, or $0.18 per diluted share) related to the
planned retail market exits, closure of non-strategic stores
announced in fiscal 2009 and fees received from the early
termination of a supply agreement. Results for fiscal 2009
include charges of $3,762 before tax ($3,470 after tax, or
$16.40 per diluted share) comprised of goodwill and intangible
asset impairment charges of $3,524 before tax ($3,326 after tax,
or $15.71 per diluted share), charges primarily related to the
closure of non-strategic stores announced in fiscal 2009 of $200
before tax ($121 after tax, or $0.58 per diluted share),
settlement costs for a pre-Acquisition Albertsons litigation
matter of $24 before tax ($15 after tax, or $0.07 per diluted
share) and other Acquisition-related costs (defined as one-time
transaction costs, which primarily include supply chain
consolidation costs, employee-related benefit costs and
consultant fees) of $14 before tax ($8 after tax, or $0.04 per
diluted share).
Net
Sales
Net sales for fiscal 2010 were $40,597, compared with $44,564
last year. Retail food sales were 77.9 percent of Net sales
and Supply chain services sales were 22.1 percent of Net
sales for fiscal 2010, compared with 77.8 percent and
22.2 percent, respectively, last year.
Retail food sales for fiscal 2010 were $31,637, compared with
$34,664 last year. Approximately $578 of fiscal 2009 Retail food
sales is attributable to the extra week. The remaining decrease
primarily reflects negative identical store retail sales growth
(defined as stores operating for four full quarters, including
store expansions and excluding fuel and planned store
dispositions) and the impact of store dispositions. For fiscal
2010, as compared to fiscal 2009, identical store retail sales
growth was negative 5.1 percent based on the same 52-week
period for both years. Identical store retail sales performance
was primarily the result of a challenging economic environment,
heightened competitive activity and investments in price and
promotions.
During fiscal 2010, the Company added 40 new stores through new
store development and sold or closed 112 stores, including
planned dispositions.
Total retail square footage as of the end of fiscal 2010 was
approximately 65 million, a decrease of 6.2 percent
from the end of fiscal 2009. Total retail square footage,
excluding actual and planned store dispositions, increased
0.8 percent from the end of fiscal 2009.
Supply chain services sales for fiscal 2010 were $8,960,
compared with $9,900 last year. Approximately $165 of fiscal
2009 Supply chain services sales is attributable to the extra
week. The remaining decrease primarily reflects the completion
of a national retail customer’s previously announced plans
to transition certain volume to self-distribution.
Gross
Profit
Gross profit, as a percent of Net sales, was 22.5 percent
for fiscal 2010 compared with 22.7 percent last year,
primarily reflecting a higher promotional sales mix and
increased investments in price, partially offset by a lower LIFO
charge.
Selling
and Administrative Expenses
Selling and administrative expenses, as a percent of Net sales,
were 19.6 percent for fiscal 2010, compared with
19.6 percent last year. Savings from ongoing cost-reduction
initiatives and lower store disposition-related costs compared
to last year were offset by reduced sales leverage.
20
Goodwill
and intangible asset impairment charges
No goodwill impairment charges were recorded in fiscal 2010.
During fiscal 2009 the Company recorded impairment charges of
$3,524 due to the significant decline in the market price of the
Company’s common stock as of the end of the third quarter
of fiscal 2009 as well as the impact of the unprecedented
decline in the economy on the Company’s plan.
Operating
Earnings (Loss)
Operating earnings for fiscal 2010 were $1,201 compared with an
operating loss of $2,157 last year. Retail food operating
earnings for fiscal 2010 were $989, or 3.1 percent of
Retail food net sales, reflecting $55, or 0.2 percent of
Retail food net sales, of charges related to planned retail
market exits. Retail food operating loss for fiscal 2009 was
$2,315, or negative 6.7 percent of Retail food net sales
last year, reflecting $3,524, or 10.2 percent of Retail
food sales, of goodwill and intangible asset impairment charges
and $162, or 0.5 percent of Retail food sales, of charges
primarily related to the closure of non-strategic stores. The
remaining decrease of $327, or 70 basis points, primarily
reflects the impact of a challenging economic environment,
heightened competitive activity, a higher promotional sales mix,
increased investments in price and reduced sales leverage,
partially offset by a lower LIFO charge. Supply chain services
operating earnings for fiscal 2010 were $299, or
3.3 percent of Supply chain services net sales, compared
with $307, or 3.1 percent of Supply chain services net
sales, last year. The 20 basis point increase in Supply
chain services operating earnings as a percent of Supply chain
services net sales primarily reflects a lower LIFO charge and
fees received from the early termination of a supply agreement
in fiscal 2010.
Net
Interest Expense
Net interest expense was $569 in fiscal 2010, compared with $622
last year, primarily reflecting lower interest rates and debt
levels as well as one less week in fiscal 2010.
Provision
for Income Taxes
Income tax expense was $239, or 37.8 percent of earnings
before income taxes, for fiscal 2010 compared with $76, or
2.7 percent of loss before income taxes, last year. The tax
rate for fiscal 2009 reflects the impact of the goodwill and
intangible asset impairment charges, the majority of which are
non-deductible for income tax purposes, as well as a benefit
attributable to favorable state tax items, non-taxable life
insurance proceeds and a reduction in the statutory rate.
Net
Earnings (Loss)
Net earnings were $393, or $1.86 per basic share and $1.85 per
diluted share, for fiscal 2010 compared with net loss of $2,855,
or $13.51 per basic and diluted share last year. Net earnings
for fiscal 2010 include net charges of $39 after tax, or $0.18
per diluted share, related to the planned retail market exits,
closure of non-strategic stores announced in fiscal 2009 and
fees received from the early termination of a supply agreement.
Net loss for fiscal 2009 includes charges of $3,470 after tax,
or $16.40 per diluted share, comprised of goodwill and
intangible asset impairment charges, charges primarily related
to the closure of non-strategic stores announced in fiscal 2009,
settlement costs for a pre-Acquisition Albertsons litigation
matter and other Acquisition-related costs.
Comparison of fifty-three weeks ended February 28, 2009
(fiscal 2009) with fifty-two weeks ended February 23,
2008 (fiscal 2008):
In fiscal 2009, the Company achieved Net sales of $44,564,
compared with $44,048 in fiscal 2008. Net loss for fiscal 2009
was $2,855 and diluted net loss per share was $13.51, compared
with net earnings of $593 and diluted net earnings per share of
$2.76 for fiscal 2008. Results for fiscal 2009 include charges
of $3,762 before tax ($3,470 after tax, or $16.40 per diluted
share) comprised of goodwill and intangible asset impairment
charges of $3,524 before tax ($3,326 after tax, or $15.71 per
diluted share), charges primarily related to the
21
closure of non-strategic stores of $200 before tax ($121 after
tax, or $0.58 per diluted share), settlement costs for a
pre-Acquisition Albertsons litigation matter of $24 before tax
($15 after tax, or $0.07 per diluted share) and other
Acquisition-related costs (defined as one-time transaction
costs, which primarily include supply chain consolidation costs,
employee-related benefit costs and consultant fees) of $14
before tax ($8 after tax, or $0.04 per diluted share). Results
for fiscal 2008 include Acquisition-related costs of $73 before
tax ($45 after tax, or $0.21 per diluted share).
Net
Sales
Net sales for fiscal 2009 were $44,564, compared with $44,048
for fiscal 2008. Retail food sales were 77.8 percent of Net
sales and Supply chain services sales were 22.2 percent of
Net sales for fiscal 2009, compared with 78.0 percent and
22.0 percent, respectively, for fiscal 2008.
Retail food sales for fiscal 2009 were $34,664, compared with
$34,341 for fiscal 2008, primarily reflecting the extra week of
sales of approximately $578 in fiscal 2009, partially offset by
the impact of store dispositions and negative identical store
retail sales growth (defined as stores operating for four full
quarters, including store expansions and excluding fuel and
planned store dispositions). For fiscal 2009, as compared to
fiscal 2008, identical store retail sales growth was negative
1.2 percent based on the same 52-week period for both
years, as a result of a soft sales environment and higher levels
of competitive activity.
During fiscal 2009, the Company added 44 new stores through new
store development and closed 97 stores, including planned
dispositions.
Total retail square footage as of the end of fiscal 2009 was
approximately 69 million, a decrease of 2.8 percent
from the end of fiscal 2008. Total retail square footage,
excluding store dispositions, increased 1.4 percent from
the end of fiscal 2008.
Supply chain services sales for fiscal 2009 were $9,900,
compared with $9,707 for fiscal 2008, primarily reflecting the
extra week of sales of approximately $165 in fiscal 2009 as well
as the pass through of inflation and new business growth,
partially offset by the on-going transition of a national
retailer’s volume to self distribution.
Gross
Profit
Gross profit, as a percent of Net sales, was 22.7 percent
for fiscal 2009 compared with 22.9 percent for fiscal 2008.
The decrease is primarily attributable to investments in price
and higher levels of promotional spending, higher LIFO charges
and inventory valuation charges, partially offset by lower
shrink.
Selling
and Administrative Expenses
Selling and administrative expenses, as a percent of Net sales,
were 19.6 percent for fiscal 2009, compared with
19.1 percent for fiscal 2008. The increase in Selling and
administrative expenses, as a percent of Net sales, is
attributable to charges primarily related to the closure of
non-strategic stores in the fourth quarter of fiscal 2009,
higher employee-related costs and higher occupancy costs,
partially offset by lower Acquisition-related costs.
Goodwill
and intangible asset impairment charges
In accordance with accounting standards, the Company applies a
fair value-based impairment test to the net book value of
goodwill and intangible assets with indefinite useful lives on
an annual basis and on an interim basis if certain events or
circumstances indicate that an impairment loss may have
occurred. For the third quarter of fiscal 2009, the
Company’s stock price had a significant and sustained
decline and book value per share substantially exceeded the
stock price. The Company recorded impairment charges of $3,524,
comprised of $3,223 to goodwill at certain Retail food reporting
units and $301 to trademarks and tradenames related to the
Acquired Trademarks and other intangible assets. The impairment
of goodwill and intangible assets with indefinite useful lives
reflects the significant decline in the market price of the
Company’s common
22
stock as of the end of the third quarter of fiscal 2009 as well
as the impact of the unprecedented decline in the economy on the
Company’s plan.
Operating
Earnings (Loss)
Operating loss for fiscal 2009 was $2,157, compared with
operating earnings of $1,684 for fiscal 2008. Retail food
operating loss for fiscal 2009 was $2,315, compared with
operating earnings of $1,550 for fiscal 2008, reflecting $3,524
of goodwill and intangible asset impairment charges and $162 of
charges primarily related to the closure of non-strategic stores
with the remaining decrease of $179, or 52 basis points,
attributable to investments in price, higher promotional
spending, higher employee-related costs and higher occupancy
costs. Supply chain services operating earnings for fiscal 2009
were $307, or 3.1 percent of Supply chain services net
sales, compared with $274, or 2.8 percent of Supply chain
services net sales for fiscal 2008, primarily reflecting
improved sales leverage and cost reduction initiatives.
Net
Interest Expense
Net interest expense was $622 in fiscal 2009, compared with $707
for fiscal 2008, primarily reflecting lower debt levels and the
benefit of lower borrowing rates on floating rate debt in fiscal
2009.
Provision
for Income Taxes
Income tax expense was $76, or 2.7 percent of loss before
income taxes, for fiscal 2009 compared with $384, or
39.3 percent of earnings before income taxes, for fiscal
2008. The tax rate for fiscal 2009 reflects the impact of the
goodwill and intangible asset impairment charges, the majority
of which are non-deductible for income tax purposes, as well as
a benefit attributable to favorable state tax items, non-taxable
life insurance proceeds and a reduction in the statutory rate.
Net
Earnings (Loss)
Net loss was $2,855, or $13.51 per basic and diluted share, for
fiscal 2009 compared with net earnings of $593, or $2.80 per
basic share and $2.76 per diluted share for fiscal 2008. Net
loss for fiscal 2009 includes charges of $3,470 after tax, or
$16.40 per diluted share, comprised of goodwill and intangible
asset impairment charges, charges primarily related to the
closure of non-strategic stores, settlement costs for a
pre-Acquisition Albertsons litigation matter and other
Acquisition-related costs. Net earnings for fiscal 2008 include
Acquisition-related costs of $45 after tax, or $0.21 per diluted
share.
CRITICAL
ACCOUNTING POLICIES
The preparation of consolidated financial statements in
conformity with accounting standards requires management to make
estimates and assumptions that affect the reported amounts of
assets and liabilities and disclosure of contingent assets and
liabilities as of the date of the financial statements and the
reported amounts of revenues and expenses during the reporting
period. Actual results could differ from those estimates.
Significant accounting policies are discussed in
Note 1—The Company and Summary of Significant
Accounting Policies in the Notes to Consolidated Financial
Statements included in Part II, Item 8 of this Annual
Report on
Form 10-K.
Management believes the following critical accounting policies
reflect its more subjective or complex judgments and estimates
used in the preparation of the Company’s consolidated
financial statements.
23
Vendor
Funds
The Company receives funds from many of the vendors whose
products the Company buys for resale in its stores. These vendor
funds are provided to increase the sell-through of the related
products. The Company receives vendor funds for a variety of
merchandising activities: placement of the vendors’
products in the Company’s advertising; display of the
vendors’ products in prominent locations in the
Company’s stores; supporting the introduction of new
products into the Company’s retail stores and distribution
system; exclusivity rights in certain categories; and to
compensate for temporary price reductions offered to customers
on products held for sale at retail stores. The Company also
receives vendor funds for buying activities such as volume
commitment rebates, credits for purchasing products in advance
of their need and cash discounts for the early payment of
merchandise purchases. The majority of the vendor fund contracts
have terms of less than a year, with a small proportion of the
contracts longer than one year.
The Company recognizes vendor funds for merchandising activities
as a reduction of Cost of sales when the related products are
sold. Vendor funds that have been earned as a result of
completing the required performance under the terms of the
underlying agreements but for which the product has not yet been
sold are recognized as reductions of inventory. The amount and
timing of recognition of vendor funds as well as the amount of
vendor funds remaining in ending inventory requires management
judgment and estimates. Management determines these amounts
based on estimates of current year purchase volume using
forecast and historical data and review of average inventory
turnover data. These judgments and estimates impact the
Company’s reported operating earnings and inventory
amounts. The historical estimates of the Company have been
reliable in the past, and the Company believes the methodology
will continue to be reliable in the future. Based on previous
experience, the Company does not expect there will be a
significant change in the level of vendor support. However, if
such a change were to occur, cost of sales and advertising
expense could change, depending on the specific vendors
involved. If vendor advertising allowances were substantially
reduced or eliminated, the Company would consider changing the
volume, type and frequency of the advertising, which could
increase or decrease its advertising expense. Similarly, the
Company is not able to assess the impact of vendor advertising
allowances on creating additional revenues as such allowances do
not directly generate revenue for the Company’s stores. For
fiscal 2010, a 1 percent change in total vendor funds
earned, including advertising allowances, with no offsetting
changes to the base price on the products purchased, would
impact gross profit by less than 10 basis points.
Inventories
Inventories are valued at the lower of cost or market.
Substantially all of the Company’s inventory consists of
finished goods. Approximately 79 percent and
81 percent of the Company’s inventories were valued
using the
last-in,
first-out (“LIFO”) method for fiscal 2010 and 2009,
respectively. The Company uses a combination of the retail
inventory method (“RIM”) and replacement cost method
to determine the current cost of its inventory before any LIFO
reserve is applied. Under RIM, the current cost of inventories
and the gross margins are calculated by applying a
cost-to-retail
ratio to the current retail value of inventories. Under the
replacement cost method, the most current unit purchase cost is
used to calculate the current cost of inventories. The
first-in,
first-out method (“FIFO”) is used to determine cost
for some of the remaining highly perishable inventories. If the
FIFO method had been used to determine cost of inventories for
which the LIFO method is used, the Company’s inventories
would have been higher by approximately $264 and $258 as of
February 27, 2010 and February 28, 2009, respectively.
During fiscal 2010, 2009 and 2008, inventory quantities in
certain LIFO layers were reduced. These reductions resulted in a
liquidation of LIFO inventory quantities carried at lower costs
prevailing in prior years as compared with the cost of fiscal
2010, 2009 and 2008 purchases. As a result, Cost of sales
decreased by $22, $10 and $5 in fiscal 2010, 2009 and 2008,
respectively.
In addition, the Company evaluates inventory shortages
throughout the year based on actual physical counts in its
facilities. Allowances for inventory shortages are recorded
based on the results of these counts to provide for estimated
shortages as of the financial statement date. Although the
Company has sufficient current and
24
historical information available to record reasonable estimates
for inventory shortages, it is possible that actual results
could differ. As of February 27, 2010, each 25 basis
point change in the estimated inventory shortages would impact
the allowances for inventory shortages by approximately $12.
Reserves
for Closed Properties and Property, Plant and Equipment-Related
Impairment Charges
The Company maintains reserves for costs associated with
closures of retail stores, distribution centers and other
properties that are no longer being utilized in current
operations. The Company provides for closed property operating
lease liabilities using a discount rate to calculate the present
value of the remaining noncancellable lease payments after the
closing date, reduced by estimated subtenant rentals that could
be reasonably obtained for the property. The closed property
lease liabilities usually are paid over the remaining lease
terms, which generally range from one to 20 years. The
Company estimates subtenant rentals and future cash flows based
on the Company’s experience and knowledge of the market in
which the closed property is located, the Company’s
previous efforts to dispose of similar assets and existing
economic conditions. Adjustments to closed property reserves
primarily relate to changes in subtenant income or actual exit
costs differing from original estimates. Adjustments are made
for changes in estimates in the period in which the changes
become known.
Owned properties, capital lease properties and the related
equipment and leasehold improvements at operating leased
properties that are closed are reduced to their estimated fair
value. The Company estimates fair value based on its experience
and knowledge of the market in which the closed property is
located and, when necessary, utilizes local real estate brokers.
The expectations on timing of disposition and the estimated
sales price or subtenant rentals associated with closed
properties, owned or leased, are impacted by variable factors
including inflation, the general health of the economy,
resultant demand for commercial property, the ability to secure
subleases, the creditworthiness of sublessees and the
Company’s success at negotiating early termination
agreements with lessors. While management believes the current
estimates of reserves for closed properties and related
impairment charges are adequate, it is possible that market and
economic conditions in the real estate market could cause
changes in the Company’s assumptions and may require
additional reserves and asset impairment charges to be recorded.
The Company’s reserve for closed properties was $128, net
of estimated sublease recoveries of $55, as of February 27,
2010 and $167, net of estimated sublease recoveries of $77, as
of February 28, 2009. The Company recognized asset
impairment charges of $52, $75 and $12 in fiscal 2010, 2009 and
2008, respectively.
Goodwill
and Intangible Assets with Indefinite Useful Lives
The Company reviews goodwill for impairment during the fourth
quarter of each year, and also if an event occurs or
circumstances change that would more-likely-than-not reduce the
fair value of a reporting unit below its carrying amount. The
reviews consist of comparing estimated fair value to the
carrying value at the reporting unit level. The Company’s
reporting units are the operating segments of the business. Fair
values are determined by using both the market approach,
applying a multiple of earnings based on guideline for publicly
traded companies, and the income approach, discounting projected
future cash flows based on management’s expectations of the
current and future operating environment. The rates used to
discount projected future cash flows reflect a weighted average
cost of capital based on the Company’s industry, capital
structure and risk premiums including those reflected in the
current market capitalization. If management identifies the
potential for impairment of goodwill, the fair value of the
implied goodwill is calculated as the difference between the
fair value of the reporting unit and the fair value of the
underlying assets and liabilities, excluding goodwill. An
impairment charge is recorded for any excess of the carrying
value over the implied fair value. Fair value calculations
contain significant judgments and estimates related to each
reporting unit’s projected future revenues, profitability
and cash flows. When preparing these estimates, management
considers each reporting unit’s historical results, current
operating trends and specific plans in place. These estimates
are impacted by
25
variable factors including inflation, the general health of the
economy and market competition. The Company has sufficient
current and historical information available to support its
judgments and estimates. However, if actual results are not
consistent with the Company’s estimates, future operating
results may be materially impacted.
For the fourth quarter ended February 27, 2010, the review
of goodwill for impairment indicated that the fair value for one
reporting unit with $2,754 of goodwill exceeded the carrying
value by less than 5 percent and the fair value for another
reporting unit with $807 of goodwill exceeded the carrying value
by greater than 10 percent. The remaining $136 of goodwill
is at a reporting unit with fair value that substantially
exceeds the carrying value. If the Company’s stock price
experiences a significant and sustained decline, the Company
would reassess the fair value of the implied goodwill compared
to the carrying value.
The Company also reviews intangible assets with indefinite
useful lives, which primarily consist of trademarks and
tradenames, for impairment during the fourth quarter of each
year, and also if events or changes in circumstances indicate
that the asset might be impaired. The reviews consist of
comparing estimated fair value to the carrying value. Fair
values of the Company’s trademarks and tradenames are
determined primarily by discounting an assumed royalty value
applied to projected future revenues associated with the
tradename based on management’s expectations of the current
and future operating environment. The royalty cash flows are
then discounted using rates based on the weighted average cost
of capital discussed above and the specific risk profile of the
tradenames relative to the Company’s other assets. These
estimates are impacted by variable factors including inflation,
the general health of the economy and market competition. During
fiscal 2010, the Company recorded impairment charges of $20 to
its Acquired Trademarks as a result of certain market exits.
During fiscal 2009, the Company recorded impairment charges of
$301 to its Acquired Trademarks as a result of its review for
impairment.
For the fourth quarter ended February 27, 2010, the review
of intangible assets with indefinite useful lives for impairment
indicated that the fair value for certain Acquired Trademarks
approximated the carrying value of $970 due to the impairment
charges recorded in fiscal 2010 and 2009. The fair value for the
remaining $79 of intangible assets with indefinite useful lives
substantially exceeds the carrying value. If the variable
factors discussed above change significantly, the Company would
reassess the fair value of the intangible assets with indefinite
useful lives compared to the carrying value.
Self-Insurance
Liabilities
The Company is primarily self-insured for workers’
compensation, healthcare for certain employees and general and
automobile liability costs. It is the Company’s policy to
record its self-insurance liabilities based on management’s
estimate of the ultimate cost of reported claims and claims
incurred but not yet reported and related expenses, discounted
at a risk-free interest rate.
In determining its self-insurance liabilities, the Company
performs a continuing review of its overall position and
reserving techniques. Since recorded amounts are based on
estimates, the ultimate cost of all incurred claims and related
expenses may be more or less than the recorded liabilities. Any
projection of losses concerning workers’ compensation,
healthcare and general and automobile liability is subject to a
degree of variability. Among the causes of this variability are
unpredictable external factors affecting future inflation rates,
discount rates, litigation trends, legal interpretations,
regulatory changes, benefit level changes and actual claim
settlement patterns. The majority of the self-insurance
liability for workers’ compensation is related to claims
occurring in California. California workers’ compensation
has received intense scrutiny from the state’s politicians,
insurers and providers. In recent years, there has been an
increase in the number of legislative reforms and judicial
rulings affecting the handling of claim activity. The impact of
many of these variables on ultimate costs is difficult to
estimate. The effects of changes in such estimated items are
included in results of operations in the period in which the
estimates are changed. Such changes may be material to the
results of operations and could occur in a future period. If, in
the future, the Company was to experience significant volatility
in the amount and timing of cash payments compared to its
earlier estimates, the Company would assess whether to continue
to discount these liabilities. The Company had self-insurance
liabilities of
26
approximately $1,101, net of the discount of $191, and $1,142,
net of the discount of $223, as of February 27, 2010 and
February 28, 2009, respectively. As of February 27,
2010, each 25 basis point change in the discount rate would
impact the self-insurance liabilities by approximately $1.
Benefit
Plans
The Company sponsors pension and other postretirement plans in
various forms covering substantially all employees who meet
eligibility requirements. The determination of the
Company’s obligation and related expense for
Company-sponsored pension and other postretirement benefits is
dependent, in part, on management’s selection of certain
actuarial assumptions used in calculating these amounts. These
assumptions include, among other things, the discount rate, the
expected long-term rate of return on plan assets and the rates
of increase in compensation and healthcare costs. The discount
rate is based on current investment yields on high-quality
fixed-income investments. The expected long-term rate of return
on plan assets is based on the historical experience of the
Company’s investment portfolio and the projected returns by
asset category. Over the
10-year
period ended February 27, 2010 and February 28, 2009,
the average rate of return on plan assets was approximately
4 percent and 2 percent, respectively. The decrease in
the 10-year
average rate of return on pension assets was due to the
unprecedented decline in the economy and continuing credit
market turmoil during fiscal 2009. The Company expects that the
markets will eventually recover to the assumed long-term rate of
return of 8 percent. In accordance with accounting
standards, actual results that differ from the Company’s
assumptions are accumulated and amortized over future periods
and, therefore, affect expense and obligations in future periods.
During fiscal 2010, the Company contributed $126 to its pension
plans and $6 to its postretirement benefit plans, and expects to
contribute $81 to its pension plans and $8 to its postretirement
benefit plans in fiscal 2011.
For fiscal 2011, each 25 basis point reduction in the
discount rate would increase pension expense by approximately $8
and each 25 basis point reduction in expected return on
plan assets would increase pension expense by approximately $4.
Similarly, for postretirement benefits, a 100 basis point
change in the healthcare cost trend rate would impact the
accumulated postretirement benefit obligation as of the end of
fiscal 2010 by approximately $10 and the service and interest
cost by $1 in fiscal 2011. Although the Company believes that
its assumptions are appropriate, the actuarial assumptions may
differ from actual results due to changing market and economic
conditions, higher or lower withdrawal rates and longer or
shorter life spans of participants.
In addition, the Company contributes to various multi-employer
pension plans under collective bargaining agreements, primarily
defined benefit pension plans. These plans generally provide
retirement benefits to participants based on their service to
contributing employers. Based on available information, the
Company believes that some of the multi-employer plans to which
it contributes are underfunded. Company contributions to these
plans are likely to continue to increase in the near term.
However, the amount of any increase or decrease in contributions
will depend on a variety of factors, including the results of
the Company’s collective bargaining efforts, investment
return on the assets held in the plans, actions taken by the
trustees who manage the plans, and requirements under the
Pension Protection Act of 2006 and Section 412(e) of the
Internal Revenue Code of 1986, as amended (the “Internal
Revenue Code”). Furthermore, if the Company were to exit
certain markets or otherwise cease making contributions to these
plans at this time, it could trigger a withdrawal liability that
would require the Company to fund its proportionate share of a
plan’s unfunded vested benefits. The Company contributed
$143, $147 and $142 to these plans for fiscal 2010, 2009 and
2008, respectively.
Income
Taxes
The Company’s current and deferred tax provision is based
on estimates and assumptions that could materially differ from
the actual results reflected in its income tax returns filed
during the subsequent year and could significantly affect the
effective tax rate and cash flows in future years.
27
The Company recognizes deferred tax assets and liabilities for
the expected tax consequences of temporary differences between
the tax bases of assets and liabilities and their reported
amounts using enacted tax rates in effect for the year in which
it expects the differences to reverse.
The Company’s effective tax rate is influenced by tax
planning opportunities available in the various jurisdictions in
which the Company operates. Management’s judgment is
involved in determining the effective tax rate and in evaluating
the ultimate resolution of any uncertain tax positions. In
addition, the Company is currently in various stages of audits,
appeals or other methods of review with taxing authorities from
various taxing jurisdictions. The Company establishes
liabilities for unrecognized tax benefits in a variety of taxing
jurisdictions when, despite management’s belief that the
Company’s tax return positions are supportable, certain
positions may be challenged and may need to be revised. The
Company adjusts these liabilities in light of changing facts and
circumstances, such as the progress of a tax audit. The
effective income tax rate includes the impact of reserve
provisions and changes to those reserves. The Company also
provides interest on these liabilities at the appropriate
statutory interest rate. The actual benefits ultimately realized
for tax positions may differ from the Company’s estimates
due to changes in facts, circumstances and new information. As
of February 27, 2010 and February 28, 2009, the
Company had $133 and $114 of unrecognized tax benefits,
respectively.
The Company records a valuation allowance to reduce the deferred
tax assets to the amount that it is more-likely-than-not to
realize. Forecasted earnings, future taxable income and future
prudent and feasible tax planning strategies are considered in
determining the need for a valuation allowance. In the event the
Company was not able to realize all or part of its net deferred
tax assets in the future, the valuation allowance would be
increased. Likewise, if it was determined that the Company was
more-likely-than-not to realize the net deferred tax assets, the
applicable portion of the valuation allowance would reverse. The
Company had a valuation allowance of $161 and $165 as of
February 27, 2010 and February 28, 2009, respectively.
LIQUIDITY
AND CAPITAL RESOURCES
Net cash provided by operating activities was $1,474, $1,534 and
$1,732 in fiscal 2010, 2009 and 2008, respectively. The decrease
in cash provided by operating activities in fiscal 2010 compared
to fiscal 2009 is primarily attributable to decreased Net
earnings, adjusted for the impact of non-cash impairment
charges, depreciation and amortization and LIFO expense,
substantially offset by the changes in deferred income taxes and
operating assets and liabilities. The decrease in cash provided
by operating activities in fiscal 2009 compared to fiscal 2008
is primarily attributable to changes in deferred income taxes.
Net cash used in investing activities was $459, $1,014 and $968
in fiscal 2010, 2009 and 2008, respectively. The decrease in
cash used in investing activities in fiscal 2010 compared to
fiscal 2009 is primarily attributable to lower capital spending
and higher proceeds from the sale of assets. The increase in
cash used in investing activities in fiscal 2009 compared to
fiscal 2008 is primarily attributable to lower proceeds from the
sale of assets.
Net cash used in financing activities was $1,044, $523 and $806
in fiscal 2010, 2009 and 2008, respectively. The increase in
cash used in financing activities in fiscal 2010 compared to
fiscal 2009 is primarily attributable to higher levels of debt
reduction. The decrease in cash used in financing activities in
fiscal 2009 compared to fiscal 2008 is primarily attributable to
higher levels of borrowing.
Management expects that the Company will continue to replenish
operating assets with internally generated funds. There can be
no assurance, however, that the Company’s business will
continue to generate cash flow at current levels. The Company
will continue to obtain short-term or long-term financing from
its credit facilities. Long-term financing will be maintained
through existing and new debt issuances and its credit
facilities. The Company’s short-term and long-term
financing abilities are believed to be adequate as a supplement
to internally generated cash flows to fund capital expenditures
and acquisitions as opportunities arise. Maturities of debt
issued will depend on management’s views with respect to
the relative attractiveness of interest rates at the time of
issuance and other debt maturities.
28
Certain of the Company’s credit facilities and long-term
debt agreements have restrictive covenants and cross-default
provisions which generally provide, subject to the
Company’s right to cure, for the acceleration of payments
due in the event of a breach of the covenant or a default in the
payment of a specified amount of indebtedness due under certain
other debt agreements. The Company was in compliance with all
such covenants and provisions for all periods presented.
On April 5, 2010, the Company entered into an Amended and
Restated Credit Agreement (the “Credit Agreement”).
The Credit Agreement provides for an extension of the maturity
of portions of the senior secured credit facilities provided
under the original credit agreement, which included a five-year
revolving credit facility (the “Revolving Credit
Facility”), a five-year term loan (“Term Loan A”)
and a six-year term loan (“Term Loan B”). Under the
Credit Agreement, $1,500 of the Revolving Credit Facility was
extended until April 5, 2015 and $500 of Term Loan B was
extended until October 5, 2015. The remaining $600 of the
Revolving Credit Facility will expire on June 2, 2011 and
the remaining $502 of Term Loan B will mature on June 2,
2012. The maturity date of Term Loan A was not extended and will
mature on June 2, 2011.
The fees and rates in effect on outstanding borrowings under the
Credit Agreement are based on the Company’s current credit
ratings. Borrowings under the non-extended portion of the
Revolving Credit Facility, if any, carry an interest rate of
LIBOR plus 1.00 percent, borrowings under Term Loan A carry
an interest rate of LIBOR plus 0.875 percent and borrowings
under the non-extended portion of Term Loan B carry an interest
rate of LIBOR plus 1.25 percent. Borrowings under the
extended portion of the Revolving Credit Facility, if any, carry
an interest rate of LIBOR plus 2.25 percent and borrowings
under the extended portion of Term Loan B carry an interest rate
of LIBOR plus 2.75 percent. Facility fees under the
non-extended and extended portions of the Revolving Credit
Facility are 0.20 percent and 0.50 percent,
respectively. The Company pays fees of up to 2.50 percent
on the outstanding balance of the letters of credit issued under
the extended Revolving Credit Facility. Borrowings under the
extended and non-extended term loans may be repaid, in full or
in part, at any time without penalty.
The Credit Agreement reset covenants which are generally less
restrictive than the covenants that existed prior to
April 5, 2010. Specifically, the Company must maintain a
leverage ratio no greater than 4.25 to 1.0 through
December 30, 2011, 4.0 to 1.0 from December 31, 2011
through December 30, 2012 and 3.75 to 1.0 thereafter.
Additionally, the Company must maintain an interest expense
coverage ratio of not less than 2.20 to 1.0 through
December 30, 2011, 2.25 to 1.0 from December 31, 2011
through December 30, 2012 and 2.30 to 1.0 thereafter.
All obligations under the senior secured credit facilities are
guaranteed by each material subsidiary of the Company. The
obligations are also secured by a pledge of the equity interests
in those same material subsidiaries, limited as required by the
existing public indentures of the Company, such that the
respective debt issued need not be equally and ratably secured.
In May 2009, the Company amended and extended its
364-day
accounts receivable securitization program. The Company can
borrow up to $200 on a revolving basis, with borrowings secured
by eligible accounts receivable, which remain under the
Company’s control. The facility fee in effect on
February 27, 2010, based on the Company’s current
credit ratings, was 1.00 percent. The Company intends to
execute a new $200 program in May 2010.
As of February 27, 2010, the Company had $479 of debt with
current maturities that are classified in Long-term debt in the
Consolidated Balance Sheets due to the Company’s intent to
refinance such obligations with the Revolving Credit Facility or
other long-term debt.
Annual cash dividends declared for fiscal 2010, 2009 and 2008,
were $0.6100, $0.6875 and $0.6750 per share, respectively. In
October 2009, the Board of Directors of the Company voted to
revise the Company’s dividend policy, with the expectation
of reducing the regular quarterly dividend to $0.0875 per share
from $0.175 per share, effective for the dividend payment to
stockholders of record on March 1, 2010. The dividend
reduction would provide annual cash of approximately $75. The
Company’s dividend policy will continue to emphasize a high
level of earnings retention for growth.
29
Capital spending for fiscal 2010 was $691, including $10 of
capital leases. Capital spending primarily included store
remodeling activity, new retail stores and technology
expenditures. The Company’s capital spending for fiscal
2011 is projected to be approximately $700, including capital
leases.
Fiscal 2011 total debt reduction is estimated to be
approximately $600.
OFF-BALANCE
SHEET ARRANGEMENTS
Guarantees
The Company has guaranteed certain leases, fixture financing
loans and other debt obligations of various retailers as of
February 27, 2010. These guarantees were generally made to
support the business growth of independent retail customers. The
guarantees are generally for the entire terms of the leases or
other debt obligations with remaining terms that range from less
than one year to 20 years, with a weighted average
remaining term of approximately nine years. For each guarantee
issued, if the independent retail customer defaults on a
payment, the Company would be required to make payments under
its guarantee. Generally, the guarantees are secured by
indemnification agreements or personal guarantees of the
independent retail customer. The Company reviews performance
risk related to its guarantees of independent retail customers
based on internal measures of credit performance. As of
February 27, 2010, the maximum amount of undiscounted
payments the Company would be required to make in the event of
default of all guarantees was approximately $127 and represented
approximately $93 on a discounted basis. Based on the
indemnification agreements, personal guarantees and results of
the reviews of performance risk, the Company believes the
likelihood that it will be required to assume a material amount
of these obligations is remote. Accordingly, no amount has been
recorded in the Consolidated Balance Sheets for these contingent
obligations under the Company’s guarantee arrangements.
The Company is contingently liable for leases that have been
assigned to various third parties in connection with facility
closings and dispositions. The Company could be required to
satisfy the obligations under the leases if any of the assignees
are unable to fulfill their lease obligations. Due to the wide
distribution of the Company’s assignments among third
parties, and various other remedies available, the Company
believes the likelihood that it will be required to assume a
material amount of these obligations is remote.
The Company is a party to a variety of contractual agreements
under which the Company may be obligated to indemnify the other
party for certain matters, which indemnities may be secured by
operation of law or otherwise, in the ordinary course of
business. These contracts primarily relate to the Company’s
commercial contracts, operating leases and other real estate
contracts, financial agreements, agreements to provide services
to the Company and agreements to indemnify officers, directors
and employees in the performance of their work. While the
Company’s aggregate indemnification obligation could result
in a material liability, the Company is not aware of any matters
that are expected to result in a material liability.
Multi-Employer
Plans
The Company contributes to various multi-employer pension plans
under collective bargaining agreements, primarily defined
benefit pension plans. These plans generally provide retirement
benefits to participants based on their service to contributing
employers. Based on available information, the Company believes
that some of the multi-employer plans to which it contributes
are underfunded. Company contributions to these plans could
increase in the near term. However, the amount of any increase
or decrease in contributions will depend on a variety of
factors, including the results of the Company’s collective
bargaining efforts, investment returns on the assets held in the
plans, actions taken by the trustees who manage the plans and
requirements under the Pension Protection Act and
Section 412(e) of the Internal Revenue Code. Furthermore,
if the Company was to significantly reduce contributions, exit
certain markets or otherwise cease making contributions to these
plans, it could trigger a partial or complete withdrawal that
would require the Company to fund its proportionate share of a
plan’s unfunded vested benefits. The Company contributed
$143, $147 and $142 to these plans for fiscal 2010, 2009 and
2008, respectively.
30
The Company also makes contributions to multi-employer health
and welfare plans in amounts set forth in the related collective
bargaining agreements. A small minority of collective bargaining
agreements contain reserve requirements that may trigger
unanticipated contributions resulting in increased healthcare
expenses. If these healthcare provisions cannot be renegotiated
in a manner that reduces the prospective healthcare cost as the
Company intends, the Company’s Selling and administrative
expenses could increase in the future.
CONTRACTUAL
OBLIGATIONS
The following table represents the Company’s significant
contractual obligations as of February 27, 2010.
| |
|
|
|
|
|
|
|
|
|
|
|
|
|
|
|
|
|
|
|
|
|
|
|
Payments Due Per Period
|
|
|
|
|
|
|
|
Fiscal
|
|
|
Fiscal
|
|
|
Fiscal
|
|
|
|
|
|
|
|
Total
|
|
|
2011
|
|
|
2012-2013
|
|
|
2014-2015
|
|
|
Thereafter
|
|
|
|
|
Contractual Obligations:
|
|
|
|
|
|
|
|
|
|
|
|
|
|
|
|
|
|
|
|
|
|
Long-term
debt(1)
|
|
$
|
6,626
|
|
|
$
|
979
|
|
|
$
|
1,613
|
|
|
$
|
753
|
|
|
$
|
3,281
|
|
|
Interest on long-term
debt(2)
|
|
|
4,088
|
|
|
|
407
|
|
|
|
666
|
|
|
|
586
|
|
|
|
2,429
|
|
|
Capital
leases(3)
|
|
|
2,101
|
|
|
|
154
|
|
|
|
296
|
|
|
|
290
|
|
|
|
1,361
|
|
|
Operating
leases(4)
|
|
|
3,267
|
|
|
|
365
|
|
|
|
649
|
|
|
|
534
|
|
|
|
1,719
|
|
|
Benefit
obligations(5)
|
|
|
6,970
|
|
|
|
132
|
|
|
|
261
|
|
|
|
284
|
|
|
|
6,293
|
|
|
Construction commitments
|
|
|
69
|
|
|
|
69
|
|
|
|
—
|
|
|
|
—
|
|
|
|
—
|
|
|
Deferred income taxes
|
|
|
183
|
|
|
|
(21
|
)
|
|
|
(3
|
)
|
|
|
24
|
|
|
|
183
|
|
|
Purchase
obligations(6)
|
|
|
1,184
|
|
|
|
830
|
|
|
|
316
|
|
|
|
38
|
|
|
|
—
|
|
|
Self-insurance obligations
|
|
|
1,292
|
|
|
|
299
|
|
|
|
370
|
|
|
|
193
|
|
|
|
430
|
|
|
|
|
|
|
|
|
|
|
|
|
|
|
|
|
|
|
|
|
|
|
|
|
Total
|
|
$
|
25,780
|
|
|
$
|
3,214
|
|
|
$
|
4,168
|
|
|
$
|
2,702
|
|
|
$
|
15,696
|
|
|
|
|
|
|
|
|
|
|
|
|
|
|
|
|
|
|
|
|
|
|
|
|
|
|
|
(1) |
|
Long-term debt amounts exclude the net discount on acquired debt
and original issue discounts. |
| |
|
(2) |
|
Amounts include contractual interest payments using the interest
rate as of February 27, 2010 applicable to the
Company’s variable interest debt instruments and stated
fixed rates for all other debt instruments. |
| |
|
(3) |
|
Represents the minimum payments under capital leases, excluding
common area maintenance, insurance or tax payments, for which
the Company is also obligated, offset by minimum subtenant
rentals of $36, $8, $11, $7 and $10, respectively. |
| |
|
(4) |
|
Represents the minimum rents payable under operating leases,
excluding common area maintenance, insurance or tax payments,
for which the Company is also obligated, offset by minimum
subtenant rentals of $308, $58, $103, $54 and $93, respectively. |
| |
|
(5) |
|
The Company’s benefit obligations include the undiscounted
obligations related to sponsored defined benefit pension and
postretirement benefit plans and deferred compensation plans.
The defined benefit pension plan has plan assets of
approximately $1,557 as of the end of February 27, 2010. |
| |
|
(6) |
|
The Company’s purchase obligations include various
obligations that have annual purchase commitments of $1 or
greater. As of February 27, 2010, future purchase
obligations existed that primarily related to supply contracts.
In the ordinary course of business, the Company enters into
supply contracts to purchase products for resale. These supply
contracts typically include either volume commitments or fixed
expiration dates, termination provisions and other standard
contractual considerations. The supply contracts that are
cancelable have not been included above. |
Unrecognized tax benefits as of February 27, 2010 of $133
are not included in the contractual obligations table presented
above because the timing of the settlement of unrecognized tax
benefits cannot be fully determined. However, the Company
expects to resolve $10, net, of unrecognized tax benefits within
the next 12 months.
31
|
|
|
ITEM 7A.
|
QUANTITATIVE
AND QUALITATIVE DISCLOSURES ABOUT MARKET RISK
|
The Company is exposed to market pricing risk consisting of
interest rate risk related to debt obligations outstanding, its
investment in notes receivable and, from time to time,
derivatives employed to hedge interest rate changes on variable
and fixed rate debt. The Company does not use financial
instruments or derivatives for any trading or other speculative
purposes.
The Company manages interest rate risk through the strategic use
of fixed and variable rate debt and, to a limited extent,
derivative financial instruments. Variable interest rate debt
(bank loans, industrial revenue bonds and other variable
interest rate debt) is utilized to help maintain liquidity and
finance business operations. Long-term debt with fixed interest
rates is used to assist in managing debt maturities and to
diversify sources of debt capital.
The Company makes long-term loans to certain Supply chain
customers and as such, holds notes receivable in the normal
course of business. The notes generally bear fixed interest
rates negotiated with each retail customer. The market value of
the fixed rate notes is subject to change due to fluctuations in
market interest rates.
The table below provides information about the Company’s
financial instruments that are sensitive to changes in interest
rates, including notes receivable and debt obligations. For debt
obligations, the table presents principal payments and related
weighted average interest rates by maturity dates, excluding the
net discount on acquired debt and original issue discounts. For
notes receivable, the table presents the expected collection of
principal cash flows and weighted average interest rates by
expected maturity dates.
| |
|
|
|
|
|
|
|
|
|
|
|
|
|
|
|
|
|
|
|
|
|
|
|
|
|
|
|
|
|
|
|
|
|
|
|
Summary of Financial Instruments
|
|
|
|
|
February 27, 2010
|
|
|
Aggregate payments by fiscal year
|
|
|
|
|
Fair
|
|
|
|
|
|
|
|
|
|
|
|
|
|
|
|
|
|
|
|
|
|
|
|
|
|
Value
|
|
|
Total
|
|
|
2011
|
|
|
2012
|
|
|
2013
|
|
|
2014
|
|
|
2015
|
|
|
Thereafter
|
|
|
|
|
(In millions, except rates)
|
|
|
|
|
Notes receivable
|
|
|
|
|
|
|
|
|
|
|
|
|
|
|
|
|
|
|
|
|
|
|
|
|
|
|
|
|
|
|
|
|
|
Principal receivable
|
|
$
|
48
|
|
|
$
|
49
|
|
|
$
|
14
|
|
|
$
|
6
|
|
|
$
|
13
|
|
|
$
|
3
|
|
|
$
|
7
|
|
|
$
|
6
|
|
|
Average rate receivable
|
|
|
|
|
|
|
6.8
|
%
|
|
|
6.5
|
%
|
|
|
8.3
|
%
|
|
|
5.6
|
%
|
|
|
8.0
|
%
|
|
|
6.7
|
%
|
|
|
8.2
|
%
|
|
Debt with variable interest rates
|
|
|
|
|
|
|
|
|
|
|
|
|
|
|
|
|
|
|
|
|
|
|
|
|
|
|
|
|
|
|
|
|
|
Principal payments
|
|
$
|
1,404
|
|
|
$
|
1,444
|
|
|
$
|
123
|
|
|
$
|
309
|
|
|
$
|
984
|
|
|
$
|
10
|
|
|
$
|
18
|
|
|
$
|
—
|
|
|
Average variable rate
|
|
|
|
|
|
|
1.4
|
%
|
|
|
1.1
|
%
|
|
|
1.2
|
%
|
|
|
1.5
|
%
|
|
|
0.3
|
%
|
|
|
0.3
|
%
|
|
|
—
|
%
|
|
Debt with fixed interest rates
|
|
|
|
|
|
|
|
|
|
|
|
|
|
|
|
|
|
|
|
|
|
|
|
|
|
|
|
|
|
|
|
|
|
Principal payments
|
|
$
|
4,910
|
|
|
$
|
5,182
|
|
|
$
|
856
|
|
|
$
|
12
|
|
|
$
|
308
|
|
|
$
|
235
|
|
|
$
|
490
|
|
|
$
|
3,281
|
|
|
Average fixed rate
|
|
|
|
|
|
|
7.6
|
%
|
|
|
7.6
|
%
|
|
|
6.1
|
%
|
|
|
7.5
|
%
|
|
|
7.1
|
%
|
|
|
7.5
|
%
|
|
|
7.7
|
%
|
32
|
|
|
ITEM 8.
|
FINANCIAL
STATEMENTS AND SUPPLEMENTARY DATA
|
Index of
Financial Statements and Schedules
| |
|
|
|
|
|
Page(s)
|
|
|
|
Financial Statements:
|
|
|
|
|
|
34
|
|
|
|
36
|
|
|
|
37
|
|
|
|
38
|
|
|
|
39
|
|
|
|
40
|
|
|
|
41
|
|
|
|
68
|
|
Financial Statement Schedule:
|
|
|
|
|
|
69
|
All other schedules are omitted because they are not applicable
or not required.
33
REPORT OF
INDEPENDENT REGISTERED PUBLIC ACCOUNTING FIRM
The Board of Directors and Stockholders
SUPERVALU INC.:
We have audited the accompanying consolidated balance sheets of
SUPERVALU INC. and subsidiaries as of February 27, 2010 and
February 28, 2009, and the related consolidated statements
of earnings, stockholders’ equity, and cash flows for each
of the fiscal years in the three-year period ended
February 27, 2010. In connection with our audits of the
consolidated financial statements, we have also audited the
accompanying financial statement schedule for each of the fiscal
years in the three-year period ended February 27, 2010. We
also have audited SUPERVALU INC.’s internal control over
financial reporting as of February 27, 2010, based on
criteria established in Internal Control—Integrated
Framework issued by the Committee of Sponsoring Organizations of
the Treadway Commission (COSO). SUPERVALU INC.’s management
is responsible for these consolidated financial statements and
financial statement schedule, for maintaining effective internal
control over financial reporting, and for its assessment of the
effectiveness of internal control over financial reporting,
included in the accompanying Management’s Report on
Internal Control over Financial Reporting. Our responsibility is
to express an opinion on these consolidated financial statements
and financial statement schedule, and an opinion on SUPERVALU
INC.’s internal control over financial reporting, based on
our audits.
We conducted our audits in accordance with the standards of the
Public Company Accounting Oversight Board (United States). Those
standards require that we plan and perform the audits to obtain
reasonable assurance about whether the financial statements are
free of material misstatement and whether effective internal
control over financial reporting was maintained in all material
respects. Our audits of the consolidated financial statements
included examining, on a test basis, evidence supporting the
amounts and disclosures in the financial statements, assessing
the accounting principles used and significant estimates made by
management, and evaluating the overall financial statement
presentation. Our audit of internal control over financial
reporting included obtaining an understanding of internal
control over financial reporting, assessing the risk that a
material weakness exists, and testing and evaluating the design
and operating effectiveness of internal control based on the
assessed risk. Our audits also included performing such other
procedures as we considered necessary in the circumstances. We
believe that our audits provide a reasonable basis for our
opinions.
A company’s internal control over financial reporting is a
process designed to provide reasonable assurance regarding the
reliability of financial reporting and the preparation of
financial statements for external purposes in accordance with
U.S. generally accepted accounting principles. A company’s
internal control over financial reporting includes those
policies and procedures that (1) pertain to the maintenance
of records that, in reasonable detail, accurately and fairly
reflect the transactions and dispositions of the assets of the
company; (2) provide reasonable assurance that transactions
are recorded as necessary to permit preparation of financial
statements in accordance with U.S. generally accepted accounting
principles, and that receipts and expenditures of the company
are being made only in accordance with authorizations of
management and directors of the company; and (3) provide
reasonable assurance regarding prevention or timely detection of
unauthorized acquisition, use, or disposition of the
company’s assets that could have a material effect on the
financial statements.
Because of its inherent limitations, internal control over
financial reporting may not prevent or detect misstatements.
Also, projections of any evaluation of effectiveness to future
periods are subject to the risk that controls may become
inadequate because of changes in conditions, or that the degree
of compliance with the policies or procedures may deteriorate.
In our opinion, the consolidated financial statements referred
to above present fairly, in all material respects, the financial
position of SUPERVALU INC. and subsidiaries as of
February 27, 2010 and February 28, 2009, and the
results of their operations and their cash flows for each of the
fiscal years in the three-year period ended February 27,
2010, in conformity with U.S. generally accepted accounting
principles. In our opinion, the accompanying financial statement
schedule, when considered in relation to the basic consolidated
financial statements taken as a whole, presents fairly, in all
material respects, the information set forth therein. Also in
34
our opinion, SUPERVALU INC. maintained, in all material
respects, effective internal control over financial reporting as
of February 27, 2010, based on criteria established in
Internal Control—Integrated Framework issued by the
Committee of Sponsoring Organizations of the Treadway Commission.
/S/ KPMG LLP
Minneapolis, Minnesota
April 23, 2010
35
SUPERVALU
INC. and Subsidiaries
CONSOLIDATED
SEGMENT FINANCIAL INFORMATION
(In
millions)
| |
|
|
|
|
|
|
|
|
|
|
|
|
|
|
|
February 27, 2010
|
|
|
February 28, 2009
|
|
|
February 23, 2008
|
|
|
|
|
(52 weeks)
|
|
|
(53 weeks)
|
|
|
(52 weeks)
|
|
|
|
|
Net sales
|
|
|
|
|
|
|
|
|
|
|
|
|
|
Retail food
|
|
$
|
31,637
|
|
|
$
|
34,664
|
|
|
$
|
34,341
|
|
|
% of total
|
|
|
77.9
|
%
|
|
|
77.8
|
%
|
|
|
78.0
|
%
|
|
Supply chain services
|
|
|
8,960
|
|
|
|
9,900
|
|
|
|
9,707
|
|
|
% of total
|
|
|
22.1
|
%
|
|
|
22.2
|
%
|
|
|
22.0
|
%
|
|
|
|
|
|
|
|
|
|
|
|
|
|
|
|
Total net sales
|
|
$
|
40,597
|
|
|
$
|
44,564
|
|
|
$
|
44,048
|
|
|
|
|
|
100.0
|
%
|
|
|
100.0
|
%
|
|
|
100.0
|
%
|
|
|
|
|
|
|
|
|
|
|
|
|
|
|
|
Operating earnings (loss)
|
|
|
|
|
|
|
|
|
|
|
|
|
|
Retail food
|
|
$
|
989
|
|
|
$
|
(2,315
|
)
|
|
$
|
1,550
|
|
|
% of sales
|
|
|
3.1
|
%
|
|
|
(6.7
|
)%
|
|
|
4.5
|
%
|
|
Supply chain services
|
|
|
299
|
|
|
|
307
|
|
|
|
274
|
|
|
% of sales
|
|
|
3.3
|
%
|
|
|
3.1
|
%
|
|
|
2.8
|
%
|
|
Corporate
|
|
|
(87
|
)
|
|
|
(149
|
)
|
|
|
(140
|
)
|
|
|
|
|
|
|
|
|
|
|
|
|
|
|
|
Total operating earnings (loss)
|
|
|
1,201
|
|
|
|
(2,157
|
)
|
|
|
1,684
|
|
|
% of sales
|
|
|
3.0
|
%
|
|
|
(4.8
|
)%
|
|
|
3.8
|
%
|
|
Interest expense, net
|
|
|
569
|
|
|
|
622
|
|
|
|
707
|
|
|
|
|
|
|
|
|
|
|
|
|
|
|
|
|
Earnings (loss) before income taxes
|
|
|
632
|
|
|
|
(2,779
|
)
|
|
|
977
|
|
|
Income tax provision
|
|
|
239
|
|
|
|
76
|
|
|
|
384
|
|
|
|
|
|
|
|
|
|
|
|
|
|
|
|
|
Net earnings (loss)
|
|
$
|
393
|
|
|
$
|
(2,855
|
)
|
|
$
|
593
|
|
|
|
|
|
|
|
|
|
|
|
|
|
|
|
|
Depreciation and amortization
|
|
|
|
|
|
|
|
|
|
|
|
|
|
Retail food
|
|
$
|
876
|
|
|
$
|
968
|
|
|
$
|
922
|
|
|
Supply chain services
|
|
|
81
|
|
|
|
89
|
|
|
|
95
|
|
|
|
|
|
|
|
|
|
|
|
|
|
|
|
|
Total
|
|
$
|
957
|
|
|
$
|
1,057
|
|
|
$
|
1,017
|
|
|
|
|
|
|
|
|
|
|
|
|
|
|
|
|
Capital expenditures
|
|
|
|
|
|
|
|
|
|
|
|
|
|
Retail food
|
|
$
|
642
|
|
|
$
|
1,112
|
|
|
$
|
1,166
|
|
|
Supply chain services
|
|
|
49
|
|
|
|
100
|
|
|
|
61
|
|
|
|
|
|
|
|
|
|
|
|
|
|
|
|
|
Total
|
|
$
|
691
|
|
|
$
|
1,212
|
|
|
$
|
1,227
|
|
|
|
|
|
|
|
|
|
|
|
|
|
|
|
|
Identifiable assets
|
|
|
|
|
|
|
|
|
|
|
|
|
|
Retail food
|
|
$
|
14,035
|
|
|
$
|
14,950
|
|
|
$
|
18,265
|
|
|
Supply chain services
|
|
|
2,214
|
|
|
|
2,444
|
|
|
|
2,608
|
|
|
Corporate
|
|
|
187
|
|
|
|
210
|
|
|
|
189
|
|
|
|
|
|
|
|
|
|
|
|
|
|
|
|
|
Total
|
|
$
|
16,436
|
|
|
$
|
17,604
|
|
|
$
|
21,062
|
|
|
|
|
|
|
|
|
|
|
|
|
|
|
|
Refer to Note 15—Segment Information in the
accompanying Notes to Consolidated Financial Statements for
additional information concerning the Company’s reportable
segments.
See Notes to Consolidated Financial Statements.
36
SUPERVALU
INC. and Subsidiaries
CONSOLIDATED
STATEMENTS OF EARNINGS
(In
millions, except per share data)
| |
|
|
|
|
|
|
|
|
|
|
|
|
|
|
|
February 27, 2010
|
|
|
February 28, 2009
|
|
|
February 23, 2008
|
|
|
|
|
(52 weeks)
|
|
|
(53 weeks)
|
|
|
(52 weeks)
|
|
|
|
|
Net sales
|
|
$
|
40,597
|
|
|
$
|
44,564
|
|
|
$
|
44,048
|
|
|
Cost of sales
|
|
|
31,444
|
|
|
|
34,451
|
|
|
|
33,943
|
|
|
|
|
|
|
|
|
|
|
|
|
|
|
|
|
Gross profit
|
|
|
9,153
|
|
|
|
10,113
|
|
|
|
10,105
|
|
|
Selling and administrative expenses
|
|
|
7,952
|
|
|
|
8,746
|
|
|
|
8,421
|
|
|
Goodwill and intangible asset impairment charges
|
|
|
—
|
|
|
|
3,524
|
|
|
|
—
|
|
|
|
|
|
|
|
|
|
|
|
|
|
|
|
|
Operating earnings (loss)
|
|
|
1,201
|
|
|
|
(2,157
|
)
|
|
|
1,684
|
|
|
|
|
|
|
|
|
|
|
|
|
|
|
|
|
Interest
|
|
|
|
|
|
|
|
|
|
|
|
|
|
Interest expense
|
|
|
576
|
|
|
|
633
|
|
|
|
725
|
|
|
Interest income
|
|
|
7
|
|
|
|
11
|
|
|
|
18
|
|
|
|
|
|
|
|
|
|
|
|
|
|
|
|
|
Interest expense, net
|
|
|
569
|
|
|
|
622
|
|
|
|
707
|
|
|
|
|
|
|
|
|
|
|
|
|
|
|
|
|
Earnings (loss) before income taxes
|
|
|
632
|
|
|
|
(2,779
|
)
|
|
|
977
|
|
|
Income tax provision
|
|
|
239
|
|
|
|
76
|
|
|
|
384
|
|
|
|
|
|
|
|
|
|
|
|
|
|
|
|
|
Net earnings (loss)
|
|
$
|
393
|
|
|
$
|
(2,855
|
)
|
|
$
|
593
|
|
|
|
|
|
|
|
|
|
|
|
|
|
|
|
|
Net earnings (loss) per share—basic
|
|
$
|
1.86
|
|
|
$
|
(13.51
|
)
|
|
$
|
2.80
|
|
|
Net earnings (loss) per share—diluted
|
|
$
|
1.85
|
|
|
$
|
(13.51
|
)
|
|
$
|
2.76
|
|
|
Weighted average number of shares outstanding
|
|
|
|
|
|
|
|
|
|
|
|
|
|
Basic
|
|
|
212
|
|
|
|
211
|
|
|
|
211
|
|
|
Diluted
|
|
|
213
|
|
|
|
211
|
|
|
|
215
|
|
See Notes to Consolidated Financial Statements.
37
SUPERVALU
INC. and Subsidiaries
CONSOLIDATED
BALANCE SHEETS
(In
millions, except per share data)
| |
|
|
|
|
|
|
|
|
|
|
|
February 27,
|
|
|
February 28,
|
|
|
|
|
2010
|
|
|
2009
|
|
|
|
|
|
|
ASSETS
|
|
Current assets
|
|
|
|
|
|
|
|
|
|
Cash and cash equivalents
|
|
$
|
211
|
|
|
$
|
240
|
|
|
Receivables, net
|
|
|
814
|
|
|
|
874
|
|
|
Inventories
|
|
|
2,342
|
|
|
|
2,709
|
|
|
Other current assets
|
|
|
344
|
|
|
|
282
|
|
|
|
|
|
|
|
|
|
|
|
|
Total current assets
|
|
|
3,711
|
|
|
|
4,105
|
|
|
|
|
|
|
|
|
|
|
|
|
Property, plant and equipment, net
|
|
|
7,026
|
|
|
|
7,528
|
|
|
Goodwill
|
|
|
3,698
|
|
|
|
3,748
|
|
|
Intangible assets, net
|
|
|
1,493
|
|
|
|
1,584
|
|
|
Other assets
|
|
|
508
|
|
|
|
639
|
|
|
|
|
|
|
|
|
|
|
|
|
Total assets
|
|
$
|
16,436
|
|
|
$
|
17,604
|
|
|
|
|
|
|
|
|
|
|
|
|
|
|
LIABILITIES AND STOCKHOLDERS’ EQUITY
|
|
Current liabilities
|
|
|
|
|
|
|
|
|
|
Accounts payable
|
|
$
|
2,199
|
|
|
$
|
2,441
|
|
|
Accrued vacation, compensation and benefits
|
|
|
576
|
|
|
|
626
|
|
|
Current maturities of long-term debt and capital lease
obligations
|
|
|
613
|
|
|
|
516
|
|
|
Income taxes currently payable
|
|
|
—
|
|
|
|
102
|
|
|
Other current liabilities
|
|
|
779
|
|
|
|
787
|
|
|
|
|
|
|
|
|
|
|
|
|
Total current liabilities
|
|
|
4,167
|
|
|
|
4,472
|
|
|
|
|
|
|
|
|
|
|
|
|
Long-term debt and capital lease obligations
|
|
|
7,022
|
|
|
|
7,968
|
|
|
Other liabilities
|
|
|
2,360
|
|
|
|
2,583
|
|
|
Commitments and contingencies
|
|
|
|
|
|
|
|
|
|
Stockholders’ equity
|
|
|
|
|
|
|
|
|
|
Common stock, $1.00 par value: 400 shares authorized;
230 shares issued
|
|
|
230
|
|
|
|
230
|
|
|
Capital in excess of par value
|
|
|
2,857
|
|
|
|
2,853
|
|
|
Accumulated other comprehensive losses
|
|
|
(478
|
)
|
|
|
(503
|
)
|
|
Retained earnings
|
|
|
806
|
|
|
|
542
|
|
|
Treasury stock, at cost, 18 and 18 shares, respectively
|
|
|
(528
|
)
|
|
|
(541
|
)
|
|
|
|
|
|
|
|
|
|
|
|
Total stockholders’ equity
|
|
|
2,887
|
|
|
|
2,581
|
|
|
|
|
|
|
|
|
|
|
|
|
Total liabilities and stockholders’ equity
|
|
$
|
16,436
|
|
|
$
|
17,604
|
|
|
|
|
|
|
|
|
|
|
|
See Notes to Consolidated Financial Statements.
38
SUPERVALU
INC. and Subsidiaries
CONSOLIDATED
STATEMENTS OF STOCKHOLDERS’ EQUITY
(In
millions, except per share data)
| |
|
|
|
|
|
|
|
|
|
|
|
|
|
|
|
|
|
|
|
|
|
|
|
|
|
|
|
|
|
|
|
|
|
|
Capital in
|
|
|
|
|
|
Accumulated
|
|
|
|
|
|
|
|
|
|
|
|
|
|
|
|
|
Excess
|
|
|
|
|
|
Other
|
|
|
|
|
|
Total
|
|
|
|
|
|
|
|
Common
|
|
|
of Par
|
|
|
Treasury
|
|
|
Comprehensive
|
|
|
Retained
|
|
|
Stockholders’
|
|
|
Comprehensive
|
|
|
|
|
Stock
|
|
|
Value
|
|
|
Stock
|
|
|
Losses
|
|
|
Earnings
|
|
|
Equity
|
|
|
Income (Loss)
|
|
|
|
|
Balances as of February 24, 2007
|
|
$
|
229
|
|
|
$
|
2,708
|
|
|
$
|
(499
|
)
|
|
$
|
(235
|
)
|
|
$
|
3,103
|
|
|
$
|
5,306
|
|
|
|
|
|
|
Effects of changing pension plan measurement date (net of tax of
$20 and $7, respectively)
|
|
|
—
|
|
|
|
—
|
|
|
|
—
|
|
|
|
32
|
|
|
|
(10
|
)
|
|
|
22
|
|
|
|
|
|
|
|
|
|
|
|
|
|
|
|
|
|
|
|
|
|
|
|
|
|
|
|
|
|
|
|
|
|
|
|
|
Beginning balance, as adjusted
|
|
|
229
|
|
|
|
2,708
|
|
|
|
(499
|
)
|
|
|
(203
|
)
|
|
|
3,093
|
|
|
|
5,328
|
|
|
|
|
|
|
Net earnings
|
|
|
—
|
|
|
|
—
|
|
|
|
—
|
|
|
|
—
|
|
|
|
593
|
|
|
|
593
|
|
|
$
|
593
|
|
|
Pension and other postretirement activity (net of tax of $70)
|
|
|
—
|
|
|
|
—
|
|
|
|
—
|
|
|
|
108
|
|
|
|
—
|
|
|
|
108
|
|
|
|
108
|
|
|
Sales of common stock under option plans
|
|
|
—
|
|
|
|
3
|
|
|
|
141
|
|
|
|
—
|
|
|
|
—
|
|
|
|
144
|
|
|
|
—
|
|
|
Cash dividends declared on common stock $0.6750 per share
|
|
|
—
|
|
|
|
—
|
|
|
|
—
|
|
|
|
—
|
|
|
|
(143
|
)
|
|
|
(143
|
)
|
|
|
—
|
|
|
Compensation under employee incentive plans
|
|
|
—
|
|
|
|
49
|
|
|
|
(4
|
)
|
|
|
—
|
|
|
|
—
|
|
|
|
45
|
|
|
|
—
|
|
|
Shares issued in settlement of zero-coupon convertible
debentures and mandatory convertible securities
|
|
|
1
|
|
|
|
62
|
|
|
|
33
|
|
|
|
—
|
|
|
|
—
|
|
|
|
96
|
|
|
|
—
|
|
|
Purchase of shares for treasury
|
|
|
—
|
|
|
|
—
|
|
|
|
(218
|
)
|
|
|
—
|
|
|
|
—
|
|
|
|
(218
|
)
|
|
|
—
|
|
|
|
|
|
|
|
|
|
|
|
|
|
|
|
|
|
|
|
|
|
|
|
|
|
|
|
|
|
|
|
|
Balances as of February 23, 2008
|
|
|
230
|
|
|
|
2,822
|
|
|
|
(547
|
)
|
|
|
(95
|
)
|
|
|
3,543
|
|
|
|
5,953
|
|
|
$
|
701
|
|
|
|
|
|
|
|
|
|
|
|
|
|
|
|
|
|
|
|
|
|
|
|
|
|
|
|
|
|
|
|
|
Net loss
|
|
|
—
|
|
|
|
—
|
|
|
|
—
|
|
|
|
—
|
|
|
|
(2,855
|
)
|
|
|
(2,855
|
)
|
|
$
|
(2,855
|
)
|
|
Pension and other postretirement activity (net of tax of $261)
|
|
|
—
|
|
|
|
—
|
|
|
|
—
|
|
|
|
(408
|
)
|
|
|
—
|
|
|
|
(408
|
)
|
|
|
(408
|
)
|
|
Sales of common stock under option plans
|
|
|
—
|
|
|
|
2
|
|
|
|
12
|
|
|
|
—
|
|
|
|
—
|
|
|
|
14
|
|
|
|
—
|
|
|
Cash dividends declared on common stock $0.6875 per share
|
|
|
—
|
|
|
|
—
|
|
|
|
—
|
|
|
|
—
|
|
|
|
(146
|
)
|
|
|
(146
|
)
|
|
|
—
|
|
|
Compensation under employee incentive plans
|
|
|
—
|
|
|
|
29
|
|
|
|
17
|
|
|
|
—
|
|
|
|
—
|
|
|
|
46
|
|
|
|
—
|
|
|
Purchase of shares for treasury
|
|
|
—
|
|
|
|
—
|
|
|
|
(23
|
)
|
|
|
—
|
|
|
|
—
|
|
|
|
(23
|
)
|
|
|
—
|
|
|
|
|
|
|
|
|
|
|
|
|
|
|
|
|
|
|
|
|
|
|
|
|
|
|
|
|
|
|
|
|
Balances as of February 28, 2009
|
|
|
230
|
|
|
|
2,853
|
|
|
|
(541
|
)
|
|
|
(503
|
)
|
|
|
542
|
|
|
|
2,581
|
|
|
$
|
(3,263
|
)
|
|
|
|
|
|
|
|
|
|
|
|
|
|
|
|
|
|
|
|
|
|
|
|
|
|
|
|
|
|
|
|
Net earnings
|
|
|
—
|
|
|
|
—
|
|
|
|
—
|
|
|
|
—
|
|
|
|
393
|
|
|
|
393
|
|
|
$
|
393
|
|
|
Pension and other postretirement activity (net of tax of $13)
|
|
|
—
|
|
|
|
—
|
|
|
|
—
|
|
|
|
25
|
|
|
|
—
|
|
|
|
25
|
|
|
|
25
|
|
|
Sales of common stock under option plans
|
|
|
—
|
|
|
|
(12
|
)
|
|
|
1
|
|
|
|
—
|
|
|
|
—
|
|
|
|
(11
|
)
|
|
|
—
|
|
|
Cash dividends declared on common stock $0.6100 per share
|
|
|
—
|
|
|
|
—
|
|
|
|
—
|
|
|
|
—
|
|
|
|
(129
|
)
|
|
|
(129
|
)
|
|
|
—
|
|
|
Compensation under employee incentive plans
|
|
|
—
|
|
|
|
16
|
|
|
|
12
|
|
|
|
—
|
|
|
|
—
|
|
|
|
28
|
|
|
|
—
|
|
|
|
|
|
|
|
|
|
|
|
|
|
|
|
|
|
|
|
|
|
|
|
|
|
|
|
|
|
|
|
|
Balances as of February 27, 2010
|
|
$
|
230
|
|
|
$
|
2,857
|
|
|
$
|
(528
|
)
|
|
$
|
(478
|
)
|
|
$
|
806
|
|
|
$
|
2,887
|
|
|
$
|
418
|
|
|
|
|
|
|
|
|
|
|
|
|
|
|
|
|
|
|
|
|
|
|
|
|
|
|
|
|
|
|
|
See Notes to Consolidated Financial Statements.
39
SUPERVALU
INC. and Subsidiaries
CONSOLIDATED
STATEMENTS OF CASH FLOWS
(In
millions)
| |
|
|
|
|
|
|
|
|
|
|
|
|
|
|
|
February 27,
|
|
|
February 28,
|
|
|
February 23,
|
|
|
|
|
2010
|
|
|
2009
|
|
|
2008
|
|
|
|
|
(52 weeks)
|
|
|
(53 weeks)
|
|
|
(52 weeks)
|
|
|
|
|
Cash flows from operating activities
|
|
|
|
|
|
|
|
|
|
|
|
|
|
Net earnings (loss)
|
|
$
|
393
|
|
|
$
|
(2,855
|
)
|
|
$
|
593
|
|
|
Adjustments to reconcile net earnings (loss) to net cash
provided by operating activities:
|
|
|
|
|
|
|
|
|
|
|
|
|
|
Goodwill and intangible asset impairment charges
|
|
|
—
|
|
|
|
3,524
|
|
|
|
—
|
|
|
Asset impairment and other charges
|
|
|
74
|
|
|
|
169
|
|
|
|
14
|
|
|
Gain on sale of assets
|
|
|
(33
|
)
|
|
|
(9
|
)
|
|
|
(23
|
)
|
|
Depreciation and amortization
|
|
|
957
|
|
|
|
1,057
|
|
|
|
1,017
|
|
|
LIFO charge
|
|
|
8
|
|
|
|
78
|
|
|
|
30
|
|
|
Deferred income taxes
|
|
|
151
|
|
|
|
(118
|
)
|
|
|
(74
|
)
|
|
Stock-based compensation
|
|
|
31
|
|
|
|
44
|
|
|
|
52
|
|
|
Other adjustments
|
|
|
27
|
|
|
|
(25
|
)
|
|
|
(15
|
)
|
|
Changes in operating assets and liabilities:
|
|
|
|
|
|
|
|
|
|
|
|
|
|
Receivables
|
|
|
55
|
|
|
|
68
|
|
|
|
103
|
|
|
Inventories
|
|
|
326
|
|
|
|
(12
|
)
|
|
|
(20
|
)
|
|
Accounts payable and accrued liabilities
|
|
|
(267
|
)
|
|
|
(216
|
)
|
|
|
(278
|
)
|
|
Income taxes currently payable
|
|
|
(172
|
)
|
|
|
(83
|
)
|
|
|
319
|
|
|
Other changes in operating assets and liabilities
|
|
|
(76
|
)
|
|
|
(88
|
)
|
|
|
14
|
|
|
|
|
|
|
|
|
|
|
|
|
|
|
|
|
Net cash provided by operating activities
|
|
|
1,474
|
|
|
|
1,534
|
|
|
|
1,732
|
|
|
|
|
|
|
|
|
|
|
|
|
|
|
|
|
Cash flows from investing activities
|
|
|
|
|
|
|
|
|
|
|
|
|
|
Proceeds from sale of assets
|
|
|
215
|
|
|
|
117
|
|
|
|
195
|
|
|
Purchases of property, plant and equipment
|
|
|
(681
|
)
|
|
|
(1,186
|
)
|
|
|
(1,191
|
)
|
|
Other
|
|
|
7
|
|
|
|
55
|
|
|
|
28
|
|
|
|
|
|
|
|
|
|
|
|
|
|
|
|
|
Net cash used in investing activities
|
|
|
(459
|
)
|
|
|
(1,014
|
)
|
|
|
(968
|
)
|
|
|
|
|
|
|
|
|
|
|
|
|
|
|
|
Cash flows from financing activities
|
|
|
|
|
|
|
|
|
|
|
|
|
|
Proceeds from issuance of long-term debt
|
|
|
943
|
|
|
|
215
|
|
|
|
41
|
|
|
Payment of long-term debt and capital lease obligations
|
|
|
(1,830
|
)
|
|
|
(581
|
)
|
|
|
(692
|
)
|
|
Dividends paid
|
|
|
(147
|
)
|
|
|
(145
|
)
|
|
|
(142
|
)
|
|
Net proceeds from the sale of common stock under option plans
and related tax benefits
|
|
|
—
|
|
|
|
11
|
|
|
|
153
|
|
|
Payment for purchase of treasury shares
|
|
|
—
|
|
|
|
(23
|
)
|
|
|
(218
|
)
|
|
Other
|
|
|
(10
|
)
|
|
|
—
|
|
|
|
52
|
|
|
|
|
|
|
|
|
|
|
|
|
|
|
|
|
Net cash used in financing activities
|
|
|
(1,044
|
)
|
|
|
(523
|
)
|
|
|
(806
|
)
|
|
|
|
|
|
|
|
|
|
|
|
|
|
|
|
Net decrease in cash and cash equivalents
|
|
|
(29
|
)
|
|
|
(3
|
)
|
|
|
(42
|
)
|
|
Cash and cash equivalents at beginning of year
|
|
|
240
|
|
|
|
243
|
|
|
|
285
|
|
|
|
|
|
|
|
|
|
|
|
|
|
|
|
|
Cash and cash equivalents at end of year
|
|
$
|
211
|
|
|
$
|
240
|
|
|
$
|
243
|
|
|
|
|
|
|
|
|
|
|
|
|
|
|
|
|
SUPPLEMENTAL CASH FLOW INFORMATION
|
|
The Company’s non-cash activities were as follows:
|
|
|
|
|
|
|
|
|
|
|
|
|
|
Capital lease asset additions and related obligations
|
|
$
|
10
|
|
|
$
|
26
|
|
|
$
|
36
|
|
|
Purchases of property, plant and equipment included in Accounts
payable
|
|
$
|
69
|
|
|
$
|
98
|
|
|
$
|
154
|
|
|
Interest and income taxes paid:
|
|
|
|
|
|
|
|
|
|
|
|
|
|
Interest paid (net of amount capitalized)
|
|
$
|
538
|
|
|
$
|
614
|
|
|
$
|
743
|
|
|
Income taxes paid (net of refunds)
|
|
$
|
187
|
|
|
$
|
274
|
|
|
$
|
107
|
|
See Notes to Consolidated Financial Statements.
40
SUPERVALU
INC. and Subsidiaries
NOTES TO
CONSOLIDATED FINANCIAL STATEMENTS
(Dollars and shares in millions, except per share data, unless
otherwise noted)
NOTE 1—SUMMARY
OF SIGNIFICANT ACCOUNTING POLICIES
Business
Description
SUPERVALU INC. (“SUPERVALU” or the
“Company”) is one of the largest companies in the
United States grocery channel. SUPERVALU conducts its retail
operations under the Acme, Albertsons, Bristol Farms, Cub Foods,
Farm Fresh, Hornbacher’s, Jewel-Osco, Lucky,
Save-A-Lot,
Shaw’s, Shop ’n Save, Shoppers Food &
Pharmacy and Star Market banners as well as in-store pharmacies
under the Osco and Sav-on banners. Additionally, the Company
provides supply chain services, primarily wholesale
distribution, across the United States retail grocery channel.
Principles
of Consolidation
The consolidated financial statements include the accounts of
the Company and all majority-owned subsidiaries. All significant
intercompany accounts and transactions have been eliminated.
References to the Company refer to SUPERVALU INC. and
Subsidiaries.
Fiscal
Year
The Company’s fiscal year ends on the last Saturday in
February. The Company’s first quarter consists of
16 weeks while the second, third and fourth quarters each
consist of 12 weeks, except for the fourth quarter of
fiscal 2009 which included 13 weeks. Because of differences
in the accounting calendars of the Company and its wholly-owned
subsidiary New Albertsons, Inc., the February 27, 2010 and
February 28, 2009 Consolidated Balance Sheets include the
assets and liabilities related to New Albertsons, Inc. as of
February 25, 2010 and February 26, 2009, respectively.
Use of
Estimates
The preparation of the Company’s consolidated financial
statements in conformity with accounting principles generally
accepted in the United States of America (“accounting
standards”) requires management to make estimates and
assumptions that affect the reported amounts of assets and
liabilities and disclosure of contingent assets and liabilities
as of the date of the financial statements and the reported
amounts of revenues and expenses during the reporting period.
Actual results could differ from those estimates.
Revenue
Recognition
Revenues from product sales are recognized at the point of sale
for the Retail food segment and upon delivery for the Supply
chain services segment. Typically, invoicing, shipping, delivery
and customer receipt of Supply chain services product occur on
the same business day. Revenues from services rendered are
recognized immediately after such services have been provided.
Discounts and allowances provided to customers by the Company at
the time of sale, including those provided in connection with
loyalty cards, are recognized as a reduction in Net sales as the
products are sold to customers. Sales tax is excluded from Net
sales.
Revenues and costs from third-party logistics operations are
recorded gross when the Company is the primary obligor in a
transaction, is subject to inventory or credit risk, has
latitude in establishing price and selecting suppliers, or has
several, but not all of these indicators. If the Company is not
the primary obligor and amounts earned have little or no credit
risk, revenue is recorded net as management fees earned.
41
Cost of
Sales
Cost of sales includes cost of inventory sold during the period,
including purchasing and distribution costs and shipping and
handling fees.
Retail food advertising expenses are a component of Cost of
sales in the Consolidated Statements of Earnings and are
expensed as incurred. Retail food advertising expenses, net of
cooperative advertising reimbursements, were $137, $184 and $162
for fiscal 2010, 2009 and 2008, respectively.
The Company recognizes vendor funds for merchandising and buying
activities as a reduction of Cost of sales when the related
products are sold. Vendor funds that have been earned as a
result of completing the required performance under the terms of
the underlying agreements but for which the product has not yet
been sold are recognized as reductions of inventory. When
payments or rebates can be reasonably estimated and it is
probable that the specified target will be met, the payment or
rebate is accrued. However, when attaining the milestone is not
probable, the payment or rebate is recognized only when and if
the milestone is achieved. Any upfront payments received for
multi-period contracts are generally deferred and amortized on a
straight-line basis over the life of the contracts.
Selling
and Administrative Expenses
Selling and administrative expenses consist primarily of store
and corporate employee-related costs, such as salaries and
wages, health and welfare, worker’s compensation and
pension benefits, as well as rent, occupancy and operating
costs, depreciation and amortization and other administrative
costs.
Cash and
Cash Equivalents
The Company considers all highly liquid investments with a
maturity of three months or less at the time of purchase to be
cash equivalents. The Company’s banking arrangements allow
the Company to fund outstanding checks when presented to the
financial institution for payment, resulting in book overdrafts.
Book overdrafts are recorded in Accounts payable in the
Consolidated Balance Sheets and are reflected as an operating
activity in the Consolidated Statements of Cash Flows. As of
February 27, 2010 and February 28, 2009, the Company
had net book overdrafts of $330 and $389, respectively.
Allowances
for Losses on Receivables
Management makes estimates of the uncollectibility of its
accounts and notes receivable portfolios. In determining the
adequacy of the allowances, management analyzes the value of the
collateral, customer financial statements, historical collection
experience, aging of receivables and other economic and industry
factors. The allowance for losses on receivables was $12 and $15
in fiscal 2010 and 2009, respectively. Bad debt expense was $4,
$7 and $10 in fiscal 2010, 2009 and 2008, respectively.
Inventories
Inventories are valued at the lower of cost or market.
Substantially all of the Company’s inventory consists of
finished goods.
As of February 27, 2010 and February 28, 2009
approximately 79 percent and 81 percent, respectively,
of the Company’s inventories were valued using the
last-in,
first-out (“LIFO”) method. The Company uses a
combination of the replacement cost method and the retail
inventory method (“RIM”) to determine the current cost
of its inventory before any LIFO reserve is applied. Under the
replacement cost method, the most current unit purchase cost is
used to calculate the current cost of inventories. Under RIM,
the current cost of inventories and the gross margins are
calculated by applying a
cost-to-retail
ratio to the current retail value of inventories. The
first-in,
first-out method (“FIFO”) is primarily used to
determine cost for some of the remaining highly perishable
inventories. If the FIFO method had been used to determine cost
of inventories
42
for which the LIFO method is used, the Company’s
inventories would have been higher by approximately $264 and
$258 as of February 27, 2010 and February 28, 2009,
respectively.
During fiscal 2010, 2009 and 2008, inventory quantities in
certain LIFO layers were reduced. These reductions resulted in a
liquidation of LIFO inventory quantities carried at lower costs
prevailing in prior years as compared with the cost of fiscal
2010, 2009 and 2008 purchases. As a result, Cost of sales
decreased by $22, $10 and $5 in fiscal 2010, 2009 and 2008,
respectively.
The Company evaluates inventory shortages throughout each fiscal
year based on actual physical counts in its facilities.
Allowances for inventory shortages are recorded based on the
results of these counts to provide for estimated shortages as of
the end of each fiscal year.
Reserves
for Closed Properties
The Company maintains reserves for costs associated with
closures of retail stores, distribution centers and other
properties that are no longer being utilized in current
operations. The Company provides for closed property lease
liabilities using a discount rate to calculate the present value
of the remaining noncancellable lease payments after the closing
date, reduced by estimated subtenant rentals that could be
reasonably obtained for the property. The closed property lease
liabilities usually are paid over the remaining lease terms,
which generally range from one to 20 years. Adjustments to
closed property reserves primarily relate to changes in
subtenant income or actual exit costs differing from original
estimates. Adjustments are made for changes in estimates in the
period in which the changes become known.
Property,
Plant and Equipment
Property, plant and equipment are carried at cost. Depreciation
is based on the estimated useful lives of the assets using the
straight-line method. Estimated useful lives generally are 10 to
40 years for buildings and major improvements, three to
10 years for equipment, and the shorter of the term of the
lease or expected life for leasehold improvements and
capitalized lease assets. Interest on property under
construction of $6, $14 and $8 was capitalized in fiscal 2010,
2009 and 2008, respectively.
Goodwill
and Intangible Assets
The Company reviews goodwill for impairment during the fourth
quarter of each year, and also if an event occurs or
circumstances change that would more-likely-than-not reduce the
fair value of a reporting unit below its carrying amount. The
reviews consist of comparing estimated fair value to the
carrying value at the reporting unit level. The Company’s
reporting units are the operating segments of the business. Fair
values are determined by using both the market approach,
applying a multiple of earnings based on guideline publically
traded companies, and the income approach, discounting projected
future cash flows based on management’s expectations of the
current and future operating environment. The rates used to
discount projected future cash flows reflect a weighted average
cost of capital based on the Company’s industry, capital
structure and risk premiums including those reflected in the
current market capitalization. If management identifies the
potential for impairment of goodwill, the fair value of the
implied goodwill is calculated as the difference between the
fair value of the reporting unit and the fair value of the
underlying assets and liabilities, excluding goodwill. An
impairment charge is recorded for any excess of the carrying
value over the implied fair value.
The Company also reviews intangible assets with indefinite
useful lives, which primarily consist of trademarks and
tradenames, for impairment during the fourth quarter of each
year, and also if events or changes in circumstances indicate
that the asset might be impaired. The reviews consist of
comparing estimated fair value to the carrying value. Fair
values of the Company’s trademarks and tradenames are
determined primarily by discounting an assumed royalty value
applied to projected future revenues associated with the
tradename based on management’s expectations of the current
and future operating environment. The royalty cash flows are
then discounted using rates based on the weighted average cost
of capital discussed above and the specific risk profile of the
tradenames relative to the Company’s other assets.
43
Impairment
of Long-Lived Assets
The Company monitors the recoverability of its long-lived assets
whenever events or changes in circumstances indicate that its
carrying amount may not be recoverable, including current period
losses combined with a history of losses or a projection of
continuing losses, a significant decrease in the market value of
an asset or the Company’s plans for store closures. When
such events or changes in circumstances occur, a recoverability
test is performed by comparing projected undiscounted future
cash flows to the carrying value of the group of assets being
tested. If impairment is identified for long-lived assets to be
held and used, the fair value is compared to the carrying value
of the group of assets and an impairment charge is recorded for
the excess of the carrying value over the discounted future cash
flows. For long-lived assets that are classified as assets held
for sale, the Company recognizes impairment charges for the
excess of the carrying value plus estimated costs of disposal
over the estimated fair value. Fair value is based on current
market values or discounted future cash flows. The Company
estimates fair value based on the Company’s experience and
knowledge of the market in which the property is located and,
when necessary, utilizes local real estate brokers. Long-lived
asset impairment charges are a component of Selling and
administrative expenses in the Consolidated Statements of
Earnings.
Deferred
Rent
The Company recognizes rent holidays, including the time period
during which the Company has access to the property prior to the
opening of the site, as well as construction allowances and
escalating rent provisions, on a straight-line basis over the
term of the operating lease. The deferred rents are included in
Other current liabilities and Other long-term liabilities in the
Consolidated Balance Sheets.
Self-Insurance
Liabilities
The Company is primarily self-insured for workers’
compensation and general and automobile liability costs. It is
the Company’s policy to record its self-insurance
liabilities based on management’s estimate of the ultimate
cost of reported claims and claims incurred but not yet reported
and related expenses, discounted at a risk-free interest rate.
The present value of such claims was calculated using discount
rates ranging from 1.1 percent to 5.1 percent for
fiscal 2010 and fiscal 2009 and 2.4 percent to
5.1 percent for fiscal 2008.
Changes in the Company’s self-insurance liabilities
consisted of the following:
| |
|
|
|
|
|
|
|
|
|
|
|
|
|
|
|
2010
|
|
|
2009
|
|
|
2008
|
|
|
|
|
Beginning balance
|
|
$
|
1,142
|
|
|
$
|
1,132
|
|
|
$
|
992
|
|
|
Expense
|
|
|
190
|
|
|
|
269
|
|
|
|
385
|
|
|
Claim payments
|
|
|
(231
|
)
|
|
|
(259
|
)
|
|
|
(245
|
)
|
|
|
|
|
|
|
|
|
|
|
|
|
|
|
|
Ending balance
|
|
|
1,101
|
|
|
|
1,142
|
|
|
|
1,132
|
|
|
Less current portion
|
|
|
(297
|
)
|
|
|
(321
|
)
|
|
|
(347
|
)
|
|
|
|
|
|
|
|
|
|
|
|
|
|
|
|
Long-term portion
|
|
$
|
804
|
|
|
$
|
821
|
|
|
$
|
785
|
|
|
|
|
|
|
|
|
|
|
|
|
|
|
|
The current portion of the reserves for self-insurance is
included in Other current liabilities and the long-term portion
is included in Other liabilities in the Consolidated Balance
Sheets. The self-insurance liabilities as of the end of the
fiscal year are net of discounts of $191 and $223 as of
February 27, 2010 and February 28, 2009, respectively.
Benefit
Plans
The Company recognizes the funded status of its sponsored
defined benefit plans in its Consolidated Balance Sheets and
gains or losses and prior service costs or credits not yet
recognized as a component of other comprehensive income, net of
tax. The Company sponsors pension and other postretirement plans
in various
44
forms covering substantially all employees who meet eligibility
requirements. The determination of the Company’s obligation
and related expense for Company-sponsored pension and other
postretirement benefits is dependent, in part, on
management’s selection of certain actuarial assumptions in
calculating these amounts. These assumptions include, among
other things, the discount rate, the expected long-term rate of
return on plan assets and the rates of increase in compensation
and healthcare costs.
Derivatives
The Company’s limited involvement with derivatives is
primarily to manage its exposure to changes in interest rates
and foreign exchange rates. The Company uses derivatives only to
manage well-defined risks. The Company does not use financial
instruments or derivatives for any trading or other speculative
purposes.
Stock-based
Compensation
The Company uses the straight-line method to recognize
compensation expense based on the fair value on the date of
grant, net of the estimated forfeiture rate, over the requisite
service period related to each award. The fair value of stock
options is estimated using the Black-Scholes option pricing
model, which incorporates certain assumptions, such as risk-free
interest rate, expected volatility, expected dividend yield and
expected life of options.
Income
Taxes
Deferred income taxes represent future net tax effects resulting
from temporary differences between the financial statement and
tax basis of assets and liabilities using enacted tax rates in
effect for the year in which the differences are expected to be
settled or realized.
The Company is currently in various stages of audits, appeals or
other methods of review with taxing authorities from various
taxing jurisdictions. The Company establishes liabilities for
unrecognized tax benefits in a variety of taxing jurisdictions
when, despite management’s belief that the Company’s
tax return positions are supportable, certain positions may be
challenged and may need to be revised. The Company adjusts these
liabilities in light of changing facts and circumstances, such
as the progress of a tax audit. The Company also provides
interest on these liabilities at the appropriate statutory
interest rate. The Company recognizes interest related to
unrecognized tax benefits in interest expense and penalties in
Selling and administrative expenses in the Consolidated
Statements of Earnings.
Net
Earnings (Loss) Per Share
Basic net earnings (loss) per share is calculated using net
earnings (loss) available to stockholders divided by the
weighted average number of shares outstanding during the period.
Diluted net earnings (loss) per share is similar to basic net
earnings (loss) per share except that the weighted average
number of shares outstanding is after giving effect to the
dilutive impacts of stock options, restricted stock awards and
outstanding convertible securities. In addition, for the
calculation of diluted net earnings (loss) per share, net
earnings (loss) is adjusted to eliminate the after-tax interest
expense recognized during the period related to contingently
convertible debentures.
45
|
|
|
NOTE 2—
|
GOODWILL
AND INTANGIBLE ASSETS
|
Changes in the Company’s Goodwill and Intangible assets
consisted of the following:
| |
|
|
|
|
|
|
|
|
|
|
|
|
|
|
|
|
|
|
|
|
|
|
|
|
|
|
|
|
|
|
|
|
|
|
|
|
|
|
|
February 23,
|
|
|
|
|
|
|
|
|
Other net
|
|
|
February 28,
|
|
|
|
|
|
|
|
|
Other net
|
|
|
February 27,
|
|
|
|
|
2008
|
|
|
Additions
|
|
|
Impairments
|
|
|
adjustments
|
|
|
2009
|
|
|
Additions
|
|
|
Impairments
|
|
|
adjustments
|
|
|
2010
|
|
|
|
|
Goodwill:
|
|
|
|
|
|
|
|
|
|
|
|
|
|
|
|
|
|
|
|
|
|
|
|
|
|
|
|
|
|
|
|
|
|
|
|
|
|
Retail food goodwill
|
|
$
|
6,152
|
|
|
$
|
—
|
|
|
$
|
—
|
|
|
$
|
12
|
|
|
$
|
6,164
|
|
|
$
|
—
|
|
|
$
|
—
|
|
|
$
|
(50
|
)
|
|
$
|
6,114
|
|
|
Accumulated impairment losses
|
|
|
—
|
|
|
|
—
|
|
|
|
(3,223
|
)
|
|
|
—
|
|
|
|
(3,223
|
)
|
|
|
—
|
|
|
|
—
|
|
|
|
—
|
|
|
|
(3,223
|
)
|
|
|
|
|
|
|
|
|
|
|
|
|
|
|
|
|
|
|
|
|
|
|
|
|
|
|
|
|
|
|
|
|
|
|
|
|
|
|
|
Total Retail food goodwill, net
|
|
|
6,152
|
|
|
|
—
|
|
|
|
(3,223
|
)
|
|
|
12
|
|
|
|
2,941
|
|
|
|
—
|
|
|
|
—
|
|
|
|
(50
|
)
|
|
|
2,891
|
|
|
Supply chain services goodwill
|
|
|
805
|
|
|
|
—
|
|
|
|
—
|
|
|
|
2
|
|
|
|
807
|
|
|
|
—
|
|
|
|
—
|
|
|
|
—
|
|
|
|
807
|
|
|
|
|
|
|
|
|
|
|
|
|
|
|
|
|
|
|
|
|
|
|
|
|
|
|
|
|
|
|
|
|
|
|
|
|
|
|
|
|
Total goodwill
|
|
$
|
6,957
|
|
|
$
|
—
|
|
|
$
|
(3,223
|
)
|
|
$
|
14
|
|
|
$
|
3,748
|
|
|
$
|
—
|
|
|
$
|
—
|
|
|
$
|
(50
|
)
|
|
$
|
3,698
|
|
|
|
|
|
|
|
|
|
|
|
|
|
|
|
|
|
|
|
|
|
|
|
|
|
|
|
|
|
|
|
|
|
|
|
|
|
|
|
| |
|
|
|
|
|
|
|
|
|
|
|
|
|
|
|
|
|
|
|
|
|
|
|
|
|
|
|
|
|
|
|
|
|
|
|
|
|
|
|
February 23,
|
|
|
Additions/
|
|
|
|
|
|
Other net
|
|
|
February 28,
|
|
|
Additions/
|
|
|
|
|
|
Other net
|
|
|
February 27,
|
|
|
|
|
2008
|
|
|
Amortization
|
|
|
Impairments
|
|
|
adjustments
|
|
|
2009
|
|
|
Amortization
|
|
|
Impairments
|
|
|
adjustments
|
|
|
2010
|
|
|
|
|
Intangible assets:
|
|
|
|
|
|
|
|
|
|
|
|
|
|
|
|
|
|
|
|
|
|
|
|
|
|
|
|
|
|
|
|
|
|
|
|
|
|
Trademarks and tradenames—indefinite useful lives
|
|
$
|
1,370
|
|
|
$
|
—
|
|
|
$
|
(301
|
)
|
|
$
|
—
|
|
|
$
|
1,069
|
|
|
$
|
—
|
|
|
$
|
(20
|
)
|
|
$
|
—
|
|
|
$
|
1,049
|
|
|
Favorable operating leases, customer lists, customer
relationships and other (accumulated amortization of $238 and
$197, as of February 27, 2010 and February 28, 2009,
respectively)
|
|
|
717
|
|
|
|
14
|
|
|
|
—
|
|
|
|
(25
|
)
|
|
|
706
|
|
|
|
8
|
|
|
|
—
|
|
|
|
(40
|
)
|
|
|
674
|
|
|
Non-compete agreements (accumulated amortization of $5 and $4 as
of February 27, 2010 and February 28, 2009,
respectively)
|
|
|
15
|
|
|
|
1
|
|
|
|
—
|
|
|
|
(6
|
)
|
|
|
10
|
|
|
|
1
|
|
|
|
—
|
|
|
|
2
|
|
|
|
13
|
|
|
|
|
|
|
|
|
|
|
|
|
|
|
|
|
|
|
|
|
|
|
|
|
|
|
|
|
|
|
|
|
|
|
|
|
|
|
|
|
Total intangible assets
|
|
|
2,102
|
|
|
|
15
|
|
|
|
(301
|
)
|
|
|
(31
|
)
|
|
|
1,785
|
|
|
|
9
|
|
|
|
(20
|
)
|
|
|
(38
|
)
|
|
|
1,736
|
|
|
Accumulated amortization
|
|
|
(150
|
)
|
|
|
(65
|
)
|
|
|
—
|
|
|
|
14
|
|
|
|
(201
|
)
|
|
|
(59
|
)
|
|
|
—
|
|
|
|
17
|
|
|
|
(243
|
)
|
|
|
|
|
|
|
|
|
|
|
|
|
|
|
|
|
|
|
|
|
|
|
|
|
|
|
|
|
|
|
|
|
|
|
|
|
|
|
|
Total intangible assets, net
|
|
$
|
1,952
|
|
|
|
|
|
|
|
|
|
|
|
|
|
|
$
|
1,584
|
|
|
|
|
|
|
|
|
|
|
|
|
|
|
$
|
1,493
|
|
|
|
|
|
|
|
|
|
|
|
|
|
|
|
|
|
|
|
|
|
|
|
|
|
|
|
|
|
|
|
|
|
|
|
|
|
|
|
As a result of the planned retail market exits, as of
February 27, 2010 the Company reclassified $36 of Goodwill
and $79 of Property, plant, and equipment and other intangible
assets to assets held for sale. Assets held for sale is a
component of Other current assets in the Consolidated Balance
Sheets. Also, the Company recorded the sale of assets, which
included $14 of Goodwill, and impairment charges of $20 to its
trademarks and tradenames.
During fiscal 2009, the Company recorded impairment charges of
$3,524, comprised of $3,223 to goodwill at certain Retail food
reporting units and $301 to trademarks and tradenames related to
the tradenames acquired in the New Albertsons, Inc. acquisition.
Amortization expense of intangible assets with definite useful
lives of $59, $65 and $55 was recorded in fiscal 2010, 2009 and
2008, respectively. Future amortization expense will be
approximately $46 per year for each of the next five years.
46
|
|
|
NOTE 3—
|
RESERVES
FOR CLOSED PROPERTIES AND PROPERTY, PLANT AND EQUIPMENT-RELATED
IMPAIRMENT CHARGES
|
Reserves
for Closed Properties
Changes in the Company’s reserves for closed properties
consisted of the following:
| |
|
|
|
|
|
|
|
|
|
|
|
|
|
|
|
2010
|
|
|
2009
|
|
|
2008
|
|
|
|
|
Beginning balance
|
|
$
|
167
|
|
|
$
|
97
|
|
|
$
|
118
|
|
|
Additions
|
|
|
13
|
|
|
|
70
|
|
|
|
18
|
|
|
Payments
|
|
|
(48
|
)
|
|
|
(22
|
)
|
|
|
(40
|
)
|
|
Adjustments
|
|
|
(4
|
)
|
|
|
22
|
|
|
|
1
|
|
|
|
|
|
|
|
|
|
|
|
|
|
|
|
|
Ending balance
|
|
$
|
128
|
|
|
$
|
167
|
|
|
$
|
97
|
|
|
|
|
|
|
|
|
|
|
|
|
|
|
|
During fiscal 2010 and 2009, the Company recorded additional
reserves primarily related to the closure of non-strategic
stores announced in fiscal 2009. Adjustments to reserves for
closed properties are primarily related to changes in subtenant
income.
Property,
Plant and Equipment-Related Impairment Charges
During fiscal 2010, the Company recorded $52 of property, plant
and equipment-related impairment charges, of which $43 were
recorded in the fourth quarter as a result of the planned retail
market exits. During fiscal 2009, the Company recorded $75 of
property, plant and equipment-related impairment charges related
to the closure of non-strategic stores announced in fiscal 2009.
During 2008, the Company recorded $14 of property, plant and
equipment-related impairment and other charges.
Additions and adjustments to the reserves for closed properties
and property, plant and equipment-related impairment charges for
fiscal 2010, 2009 and 2008 were primarily related to the Retail
food segment, and were recorded as a component of Selling and
administrative expenses in the Consolidated Statements of
Earnings.
|
|
|
NOTE 4—
|
PROPERTY,
PLANT AND EQUIPMENT
|
Property, plant and equipment, net, consisted of the following:
| |
|
|
|
|
|
|
|
|
|
|
|
2010
|
|
|
2009
|
|
|
|
|
Land
|
|
$
|
1,277
|
|
|
$
|
1,313
|
|
|
Buildings
|
|
|
3,550
|
|
|
|
3,443
|
|
|
Property under construction
|
|
|
232
|
|
|
|
315
|
|
|
Leasehold improvements
|
|
|
1,602
|
|
|
|
1,613
|
|
|
Equipment
|
|
|
4,455
|
|
|
|
4,201
|
|
|
Capitalized lease assets
|
|
|
968
|
|
|
|
1,030
|
|
|
|
|
|
|
|
|
|
|
|
|
Total property plant and equipment
|
|
|
12,084
|
|
|
|
11,915
|
|
|
Accumulated depreciation
|
|
|
(4,724
|
)
|
|
|
(4,091
|
)
|
|
Accumulated amortization on capitalized lease assets
|
|
|
(334
|
)
|
|
|
(296
|
)
|
|
|
|
|
|
|
|
|
|
|
|
Total property, plant and equipment, net
|
|
$
|
7,026
|
|
|
$
|
7,528
|
|
|
|
|
|
|
|
|
|
|
|
Depreciation expense was $852, $945 and $911 for fiscal 2010,
2009 and 2008, respectively. Amortization expense related to
capitalized lease assets was $64, $67 and $64 for fiscal 2010,
2009 and 2008, respectively.
47
|
|
|
NOTE 5—
|
FAIR
VALUE MEASUREMENTS
|
Fair value is defined as the price that would be received to
sell an asset or paid to transfer a liability in an orderly
transaction between market participants at the measurement date.
Assets and liabilities recorded at fair value are categorized
using defined hierarchical levels directly related to the amount
of subjectivity associated with the inputs to fair value
measurements, as follows:
|
|
|
| |
Level 1—
|
Quoted prices in active markets for identical assets or
liabilities;
|
| |
| |
Level 2—
|
Inputs other than quoted prices included within Level 1
that are either directly or indirectly observable;
|
| |
| |
Level 3—
|
Unobservable inputs in which little or no market activity
exists, requiring an entity to develop its own assumptions that
market participants would use to value the asset or liability.
|
Impairment charges recorded during fiscal 2010 discussed in
Note 2—Goodwill and Intangible Assets and
Note 3—Reserves for Closed Properties and Property,
Plant and Equipment-Related Impairment Charges were measured at
fair value using Level 3 inputs.
Financial
Instruments
For certain of the Company’s financial instruments,
including cash and cash equivalents, receivables and accounts
payable, the fair values approximate book values due to their
short maturities.
The estimated fair value of notes receivable was less than the
book value by approximately $1 as of February 27, 2010. The
estimated fair value of notes receivable was less than book
value by approximately $8 as of February 28, 2009. Notes
receivable are valued based on a discounted cash flow approach
applying a rate that is comparable to publicly traded
instruments of similar credit quality.
The estimated fair value of the Company’s long-term debt
(including current maturities) was less than the book value by
approximately $54 and $452 as of February 27, 2010 and
February 28, 2009, respectively. The estimated fair value
was based on market quotes, where available, or market values
for similar instruments.
48
The Company’s long-term debt and capital lease obligations
consisted of the following:
| |
|
|
|
|
|
|
|
|
|
|
|
2010
|
|
|
2009
|
|
|
|
|
1.10% to 3.25% Revolving Credit Facility and Variable Rate Notes
due June 2011—
June 2012
|
|
$
|
1,415
|
|
|
$
|
1,920
|
|
|
8.00% Notes due May 2016
|
|
|
1,000
|
|
|
|
—
|
|
|
7.50% Notes due February 2011
|
|
|
679
|
|
|
|
700
|
|
|
7.45% Debentures due August 2029
|
|
|
650
|
|
|
|
650
|
|
|
7.50% Notes due November 2014
|
|
|
490
|
|
|
|
500
|
|
|
6.34% to 7.15% Medium Term Notes due July 2012—June 2028
|
|
|
440
|
|
|
|
512
|
|
|
8.00% Debentures due May 2031
|
|
|
400
|
|
|
|
400
|
|
|
7.50% Notes due May 2012
|
|
|
300
|
|
|
|
300
|
|
|
8.00% Debentures due June 2026
|
|
|
272
|
|
|
|
272
|
|
|
8.70% Debentures due May 2030
|
|
|
225
|
|
|
|
225
|
|
|
7.75% Debentures due June 2026
|
|
|
200
|
|
|
|
200
|
|
|
7.25% Notes due May 2013
|
|
|
200
|
|
|
|
200
|
|
|
8.35% Notes due May 2010
|
|
|
155
|
|
|
|
275
|
|
|
7.90% Debentures due May 2017
|
|
|
96
|
|
|
|
96
|
|
|
Accounts Receivable Securitization Facility
|
|
|
—
|
|
|
|
120
|
|
|
Notes and debentures paid off during fiscal 2010
|
|
|
—
|
|
|
|
891
|
|
|
Other
|
|
|
104
|
|
|
|
97
|
|
|
Net discount on debt, using an effective interest rate of 6.28%
to 8.97%
|
|
|
(258
|
)
|
|
|
(208
|
)
|
|
Capital lease obligations
|
|
|
1,267
|
|
|
|
1,334
|
|
|
|
|
|
|
|
|
|
|
|
|
Total debt and capital lease obligations
|
|
|
7,635
|
|
|
|
8,484
|
|
|
Less current maturities of long-term debt and capital lease
obligations
|
|
|
(613
|
)
|
|
|
(516
|
)
|
|
|
|
|
|
|
|
|
|
|
|
Long-term debt and capital lease obligations
|
|
$
|
7,022
|
|
|
$
|
7,968
|
|
|
|
|
|
|
|
|
|
|
|
Future maturities of long-term debt, excluding the net discount
on the debt and capital lease obligations, as of
February 27, 2010 consist of the following:
| |
|
|
|
|
|
Fiscal Year
|
|
|
|
|
|
|
2011
|
|
$
|
979
|
|
|
2012
|
|
|
321
|
|
|
2013
|
|
|
1,292
|
|
|
2014
|
|
|
245
|
|
|
2015
|
|
|
508
|
|
|
Thereafter
|
|
|
3,281
|
|
Certain of the Company’s credit facilities and long-term
debt agreements have restrictive covenants and cross-default
provisions which generally provide, subject to the
Company’s right to cure, for the acceleration of payments
due in the event of a breach of the covenant or a default in the
payment of a specified amount of indebtedness due under certain
other debt agreements. The Company was in compliance with all
such covenants and provisions for all periods presented.
During fiscal 2007, the Company entered into senior secured
credit facilities provided by a group of lenders consisting of a
five-year revolving credit facility (the “Revolving Credit
Facility”), a five-year term loan (“Term Loan A”)
and a six-year term loan (“Term Loan B”). As of
February 27, 2010, there was $16 of outstanding borrowings
under the Revolving Credit Facility at 3.25 percent, Term
Loan A had a remaining
49
principal balance of $394 at LIBOR plus 0.875 percent, of
which $113 was classified as current, and Term Loan B had a
remaining principal balance of $1,005 at LIBOR plus
1.25 percent, of which $10 was classified as current.
Letters of credit outstanding under the Revolving Credit
Facility were $333 and the unused available credit under the
Revolving Credit Facility was $1,651. The Company also had $4 of
outstanding letters of credit issued under separate agreements
with financial institutions. These letters of credit primarily
support workers’ compensation, merchandise import programs
and payment obligations.
On April 5, 2010, the Company entered into an Amended and
Restated Credit Agreement (the “Credit Agreement”),
which provides for an extension of the maturity of portions of
the senior secured credit facilities provided under the original
credit agreement. Specifically, $1,500 of the Revolving Credit
Facility was extended until April 5, 2015 and $500 of Term
Loan B was extended until October 5, 2015. The remaining
$600 of the Revolving Credit Facility will expire on
June 2, 2011 and the remaining $502 of Term Loan B will
mature on June 2, 2012. The maturity date of Term Loan A
was not extended and will mature on June 2, 2011.
The fees and rates in effect on outstanding borrowings under the
Credit Agreement are based on the Company’s current credit
ratings. Borrowings under the non-extended portion of the
Revolving Credit Facility, if any, carry an interest rate of
LIBOR plus 1.00 percent, borrowings under Term Loan A carry
an interest rate of LIBOR plus 0.875 percent and borrowings
under the non-extended portion of Term Loan B carry an interest
rate of LIBOR plus 1.25 percent. Borrowings under the
extended portion of the Revolving Credit Facility, if any, carry
an interest rate of LIBOR plus 2.25 percent and borrowings
under the extended portion of Term Loan B carry an interest rate
of LIBOR plus 2.75 percent. Facility fees under the
non-extended and extended portions of the Revolving Credit
Facility are 0.20 percent and 0.50 percent,
respectively. The Company pays fees of up to 2.50 percent
on the outstanding balance of the letters of credit issued under
the extended Revolving Credit Facility. Borrowings under the
extended and non-extended term loans may be repaid, in full or
in part, at any time without penalty.
The Credit Agreement reset covenants which are generally less
restrictive than the covenants that existed prior to
April 5, 2010. Specifically, the Company must maintain a
leverage ratio no greater than 4.25 to 1.0 through
December 30, 2011, 4.0 to 1.0 from December 31, 2011
through December 30, 2012 and 3.75 to 1.0 thereafter.
Additionally, the Company must maintain an interest expense
coverage ratio of not less than 2.20 to 1.0 through
December 30, 2011, 2.25 to 1.0 from December 31, 2011
through December 30, 2012 and 2.30 to 1.0 thereafter.
All obligations under the senior secured credit facilities are
guaranteed by each material subsidiary of the Company. The
obligations are also secured by a pledge of the equity interests
in those same material subsidiaries, limited as required by the
existing public indentures of the Company, such that the
respective debt issued need not be equally and ratably secured.
In May 2009, the Company issued $1,000 in senior notes, which
rank equally with all of the Company’s other senior
unsecured indebtedness. In conjunction with the debt issuance,
the Company paid off $191 of 7.50% Debentures due May 2037
that contained put options exercised in May 2009, early redeemed
$60 of 6.77% Medium Term Notes due July 2009 and purchased
pursuant to a tender offer $232 of 7.875% Notes due August
2009, $177 of 6.95% Notes due August 2009 and $110 of
8.35% Notes due May 2010 for an aggregate payment of $777
in cash. The remainder of the debt issuance proceeds was used to
reduce borrowings under the Revolving Credit Facility.
In May 2009, the Company amended and extended its
364-day
accounts receivable securitization program. The Company can
borrow up to $200 on a revolving basis, with borrowings secured
by eligible accounts receivable, which remain under the
Company’s control. The facility fee in effect on
February 27, 2010, based on the Company’s current
credit ratings, was 1.00 percent. The Company intends to
execute a new $200 program in May 2010.
50
As of February 27, 2010, the Company had $479 of debt with
current maturities that are classified as long-term debt due to
the Company’s intent to refinance such obligations with the
Revolving Credit Facility or other long-term debt.
The Company leases certain retail stores, distribution centers,
office facilities and equipment from third parties. Many of
these leases include renewal options and, to a limited extent,
include options to purchase. Future minimum lease payments to be
made by the Company for noncancellable operating leases and
capital leases as of February 27, 2010 consist of the
following:
| |
|
|
|
|
|
|
|
|
|
|
|
Lease Obligations
|
|
|
|
|
Operating
|
|
|
Capital
|
|
|
Fiscal Year
|
|
Leases
|
|
|
Leases
|
|
|
|
|
2011
|
|
$
|
423
|
|
|
$
|
162
|
|
|
2012
|
|
|
400
|
|
|
|
154
|
|
|
2013
|
|
|
352
|
|
|
|
153
|
|
|
2014
|
|
|
312
|
|
|
|
150
|
|
|
2015
|
|
|
276
|
|
|
|
147
|
|
|
Thereafter
|
|
|
1,812
|
|
|
|
1,371
|
|
|
|
|
|
|
|
|
|
|
|
|
Total future minimum obligations
|
|
$
|
3,575
|
|
|
|
2,137
|
|
|
|
|
|
|
|
|
|
|
|
|
Less interest
|
|
|
|
|
|
|
(870
|
)
|
|
|
|
|
|
|
|
|
|
|
|
Present value of net future minimum obligations
|
|
|
|
|
|
|
1,267
|
|
|
Less current obligations
|
|
|
|
|
|
|
(69
|
)
|
|
|
|
|
|
|
|
|
|
|
|
Long-term obligations
|
|
|
|
|
|
$
|
1,198
|
|
|
|
|
|
|
|
|
|
|
|
Total future minimum obligations have not been reduced for
future minimum subtenant rentals of $308 under certain operating
subleases.
Rent expense and subtenant rentals under operating leases
consisted of the following:
| |
|
|
|
|
|
|
|
|
|
|
|
|
|
|
|
2010
|
|
|
2009
|
|
|
2008
|
|
|
|
|
Minimum rent
|
|
$
|
455
|
|
|
$
|
460
|
|
|
$
|
450
|
|
|
Contingent rent
|
|
|
6
|
|
|
|
8
|
|
|
|
7
|
|
|
|
|
|
|
|
|
|
|
|
|
|
|
|
|
|
|
|
461
|
|
|
|
468
|
|
|
|
457
|
|
|
Subtenant rentals
|
|
|
(66
|
)
|
|
|
(67
|
)
|
|
|
(66
|
)
|
|
|
|
|
|
|
|
|
|
|
|
|
|
|
|
|
|
$
|
395
|
|
|
$
|
401
|
|
|
$
|
391
|
|
|
|
|
|
|
|
|
|
|
|
|
|
|
|
The Company leases certain property to third parties under both
operating and direct financing leases. Under the direct
financing leases, the Company leases buildings to independent
retail customers with terms ranging
51
from five to 20 years. Future minimum lease and subtenant
rentals under noncancellable leases as of February 27, 2010
consist of the following:
| |
|
|
|
|
|
|
|
|
|
|
|
Lease Receipts
|
|
|
|
|
|
|
|
Direct
|
|
|
|
|
Operating
|
|
|
Financing
|
|
|
Fiscal Year
|
|
Leases
|
|
|
Leases
|
|
|
|
|
2011
|
|
$
|
24
|
|
|
$
|
6
|
|
|
2012
|
|
|
22
|
|
|
|
5
|
|
|
2013
|
|
|
21
|
|
|
|
4
|
|
|
2014
|
|
|
12
|
|
|
|
4
|
|
|
2015
|
|
|
7
|
|
|
|
3
|
|
|
Thereafter
|
|
|
22
|
|
|
|
11
|
|
|
|
|
|
|
|
|
|
|
|
|
Total minimum lease receipts
|
|
$
|
108
|
|
|
|
33
|
|
|
|
|
|
|
|
|
|
|
|
|
Less unearned income
|
|
|
|
|
|
|
(8
|
)
|
|
|
|
|
|
|
|
|
|
|
|
Net investment in direct financing leases
|
|
|
|
|
|
|
25
|
|
|
Less current portion
|
|
|
|
|
|
|
(4
|
)
|
|
|
|
|
|
|
|
|
|
|
|
Long-term portion
|
|
|
|
|
|
$
|
21
|
|
|
|
|
|
|
|
|
|
|
|
The carrying value of owned property leased to third parties
under operating leases was as follows:
| |
|
|
|
|
|
|
|
|
|
|
|
2010
|
|
|
2009
|
|
|
|
|
Property, plant and equipment
|
|
$
|
20
|
|
|
$
|
22
|
|
|
Less accumulated depreciation
|
|
|
(6
|
)
|
|
|
(5
|
)
|
|
|
|
|
|
|
|
|
|
|
|
Property, plant and equipment, net
|
|
$
|
14
|
|
|
$
|
17
|
|
|
|
|
|
|
|
|
|
|
|
The provision for income taxes consisted of the following:
| |
|
|
|
|
|
|
|
|
|
|
|
|
|
|
|
2010
|
|
|
2009
|
|
|
2008
|
|
|
|
|
Current
|
|
|
|
|
|
|
|
|
|
|
|
|
|
Federal
|
|
$
|
65
|
|
|
$
|
148
|
|
|
$
|
396
|
|
|
State
|
|
|
9
|
|
|
|
46
|
|
|
|
63
|
|
|
|
|
|
|
|
|
|
|
|
|
|
|
|
|
Total current
|
|
|
74
|
|
|
|
194
|
|
|
|
459
|
|
|
Deferred
|
|
|
165
|
|
|
|
(118
|
)
|
|
|
(75
|
)
|
|
|
|
|
|
|
|
|
|
|
|
|
|
|
|
Total provision
|
|
$
|
239
|
|
|
$
|
76
|
|
|
$
|
384
|
|
|
|
|
|
|
|
|
|
|
|
|
|
|
|
The difference between the actual tax provision and the tax
provision computed by applying the statutory federal income tax
rate to earnings (losses) before income taxes is attributable to
the following:
| |
|
|
|
|
|
|
|
|
|
|
|
|
|
|
|
2010
|
|
|
2009
|
|
|
2008
|
|
|
|
|
Federal taxes based on statutory rate
|
|
$
|
221
|
|
|
$
|
(973
|
)
|
|
$
|
342
|
|
|
State income taxes, net of federal benefit
|
|
|
20
|
|
|
|
(7
|
)
|
|
|
40
|
|
|
Goodwill impairment
|
|
|
—
|
|
|
|
1,060
|
|
|
|
—
|
|
|
Other
|
|
|
(2
|
)
|
|
|
(4
|
)
|
|
|
2
|
|
|
|
|
|
|
|
|
|
|
|
|
|
|
|
|
Total provision
|
|
$
|
239
|
|
|
$
|
76
|
|
|
$
|
384
|
|
|
|
|
|
|
|
|
|
|
|
|
|
|
|
52
Deferred income taxes reflect the net tax effects of temporary
differences between the bases of assets and liabilities for
financial reporting and income tax purposes. The Company’s
deferred tax assets and liabilities consisted of the following:
| |
|
|
|
|
|
|
|
|
|
|
|
2010
|
|
|
2009
|
|
|
|
|
Deferred tax assets:
|
|
|
|
|
|
|
|
|
|
Compensation and benefits
|
|
$
|
505
|
|
|
$
|
575
|
|
|
Self-insurance
|
|
|
239
|
|
|
|
232
|
|
|
Property, plant and equipment and capitalized lease assets
|
|
|
452
|
|
|
|
448
|
|
|
Capital and net operating loss carryforwards
|
|
|
179
|
|
|
|
171
|
|
|
Other
|
|
|
194
|
|
|
|
229
|
|
|
|
|
|
|
|
|
|
|
|
|
Gross deferred tax assets
|
|
|
1,569
|
|
|
|
1,655
|
|
|
Valuation allowance
|
|
|
(161
|
)
|
|
|
(165
|
)
|
|
|
|
|
|
|
|
|
|
|
|
Total deferred tax assets
|
|
|
1,408
|
|
|
|
1,490
|
|
|
|
|
|
|
|
|
|
|
|
|
Deferred tax liabilities:
|
|
|
|
|
|
|
|
|
|
Property, plant and equipment and capitalized lease assets
|
|
|
(385
|
)
|
|
|
(275
|
)
|
|
Inventories
|
|
|
(252
|
)
|
|
|
(277
|
)
|
|
Debt discount
|
|
|
(81
|
)
|
|
|
(81
|
)
|
|
Intangible assets
|
|
|
(473
|
)
|
|
|
(471
|
)
|
|
Other
|
|
|
(34
|
)
|
|
|
(39
|
)
|
|
|
|
|
|
|
|
|
|
|
|
Total deferred tax liabilities
|
|
|
(1,225
|
)
|
|
|
(1,143
|
)
|
|
|
|
|
|
|
|
|
|
|
|
Net deferred tax asset (liability)
|
|
$
|
183
|
|
|
$
|
347
|
|
|
|
|
|
|
|
|
|
|
|
The Company has valuation allowances to reduce deferred tax
assets to the amount that is more-likely-than-not to be
realized. The Company currently has state net operating loss
(“NOL”) carryforwards of $851 for tax purposes. The
NOL carryforwards expire beginning in 2011 and continuing
through 2028 and have a $20 valuation allowance. The remaining
valuation allowance is for capital loss carryforwards which
expire in fiscal 2011.
Changes in the Company’s unrecognized tax benefits
consisted of the following:
| |
|
|
|
|
|
|
|
|
|
|
|
|
|
|
|
2010
|
|
|
2009
|
|
|
2008
|
|
|
|
|
Beginning balance
|
|
$
|
114
|
|
|
$
|
146
|
|
|
$
|
312
|
|
|
Increase based on tax positions related to the current year
|
|
|
7
|
|
|
|
5
|
|
|
|
1
|
|
|
Decrease based on tax positions related to the current year
|
|
|
(4
|
)
|
|
|
—
|
|
|
|
(2
|
)
|
|
Increase based on tax positions related to prior years
|
|
|
34
|
|
|
|
22
|
|
|
|
18
|
|
|
Decrease based on tax positions related to prior years
|
|
|
(14
|
)
|
|
|
(37
|
)
|
|
|
(180
|
)
|
|
Decrease due to lapse of statute of limitations
|
|
|
(4
|
)
|
|
|
(22
|
)
|
|
|
(3
|
)
|
|
|
|
|
|
|
|
|
|
|
|
|
|
|
|
Ending balance
|
|
$
|
133
|
|
|
$
|
114
|
|
|
$
|
146
|
|
|
|
|
|
|
|
|
|
|
|
|
|
|
|
Included in the balance of unrecognized tax benefits as of
February 27, 2010, February 28, 2009 and
February 23, 2008 are tax positions of $58, net of tax,
$57, net of tax, and $29, net of tax, respectively, that would
reduce the Company’s effective tax rate if recognized in
future periods.
The Company expects to resolve $10, net, of unrecognized tax
benefits within the next 12 months, representing several
individually insignificant income tax positions. These
unrecognized tax benefits represent items in which the Company
may not prevail with certain taxing authorities, based on
varying interpretations of the applicable tax law. The Company
is currently in various stages of audits, appeals or other
methods of review with taxing authorities from various taxing
jurisdictions. The resolution of these unrecognized tax benefits
53
would occur as a result of potential settlements from these
negotiations. Based on the information available as of
February 27, 2010, the Company does not anticipate
significant additional changes to its unrecognized tax benefits.
The Company recognized (income) expense related to interest and
penalties, net of settlement adjustments, of $(2), $26 and $14
for fiscal 2010, 2009 and 2008, respectively. In addition to the
liability for unrecognized tax benefits, the Company had a
liability of $44 and $67 as of February 27, 2010 and
February 28, 2009, respectively, related to accrued
interest and penalties for uncertain tax positions recorded in
Other current liabilities and Other liabilities in the
Consolidated Balance Sheets. The Company settled various audits
during fiscal 2010 resulting in payments of $21 for interest and
penalties.
The Company is currently under examination or other methods of
review in several tax jurisdictions and remains subject to
examination until the statute of limitations expires for the
respective taxing jurisdiction or an agreement is reached
between the taxing jurisdiction and the Company. As of
February 27, 2010, the Company is no longer subject to
federal income tax examinations for fiscal years before 2007 and
with few exceptions is no longer subject to state income tax
examinations for fiscal years before 2004.
|
|
|
NOTE 9—
|
STOCK-BASED
AWARDS
|
As of February 27, 2010, the Company has stock options and
restricted stock awards (collectively referred to as
“stock-based awards”) outstanding under the following
plans: 2007 Stock Plan, 2002 Stock Plan, 1997 Stock Plan, 1993
Stock Plan, SUPERVALU/Richfood Stock Incentive Plan, Albertsons
Amended and Restated 1995 Stock-Based Incentive Plan and the
Albertsons 2004 Equity and Performance Incentive Plan. The
Company’s 2007 Stock Plan, as approved by stockholders in
May 2007, is the only plan under which stock-based awards may be
granted. The 2007 Stock Plan provides that the Board of
Directors or the Leadership Development and Compensation
Committee of the Board (the “Compensation Committee”)
may determine at the time of grant whether each stock-based
award granted will be a non-qualified or incentive stock-based
award under the Internal Revenue Code of 1986, as amended (the
“Internal Revenue Code”). The terms of each
stock-based award will be determined by the Board of Directors
or the Compensation Committee. Generally, stock-based awards
granted prior to fiscal 2006 have a term of 10 years and
effective in fiscal 2006, stock-based awards granted will not be
for a term of more than seven years.
Stock options are granted to key salaried employees and to the
Company’s non-employee directors to purchase common stock
at an exercise price not less than 100 percent of the fair
market value of the Company’s common stock on the date of
grant. Generally, stock options vest over four years. Restricted
stock awards are also awarded to key salaried employees. The
vesting of restricted stock awards granted is determined at the
discretion of the Board of Directors or the Compensation
Committee. The restrictions on the restricted stock awards
generally lapse between one and five years from the date of
grant and the expense is recognized over the lapsing period.
The Company reserved 35 shares for grant as part of the
2007 Stock Plan. As of February 27, 2010, there were
23 shares available for grant. Common stock is delivered
out of treasury stock upon the exercise of stock-based awards.
The provisions of future stock-based awards may change at the
discretion of the Board of Directors or the Compensation
Committee.
54
Stock
Options
Stock options granted, exercised and outstanding consisted of
the following:
| |
|
|
|
|
|
|
|
|
|
|
|
|
|
|
|
|
|
|
|
|
|
|
|
|
|
Weighted Average
|
|
|
|
|
|
|
|
Shares
|
|
|
Weighted
|
|
|
Remaining
|
|
|
Aggregate
|
|
|
|
|
Under Option
|
|
|
Average
|
|
|
Contractual Term
|
|
|
Intrinsic Value
|
|
|
|
|
(In thousands)
|
|
|
Exercise Price
|
|
|
(In years)
|
|
|
(In thousands)
|
|
|
|
|
Outstanding, February 28, 2009
|
|
|
21,973
|
|
|
$
|
35.64
|
|
|
|
|
|
|
|
|
|
|
Granted
|
|
|
3,178
|
|
|
|
16.01
|
|
|
|
|
|
|
|
|
|
|
Exercised
|
|
|
(41
|
)
|
|
|
14.51
|
|
|
|
|
|
|
|
|
|
|
Canceled and forfeited
|
|
|
(3,736
|
)
|
|
|
41.92
|
|
|
|
|
|
|
|
|
|
|
|
|
|
|
|
|
|
|
|
|
|
|
|
|
|
|
|
|
Outstanding, February 27, 2010
|
|
|
21,374
|
|
|
$
|
31.67
|
|
|
|
3.66
|
|
|
$
|
186
|
|
|
|
|
|
|
|
|
|
|
|
|
|
|
|
|
|
|
|
|
Vested and expected to vest in future as of February 27,
2010
|
|
|
21,180
|
|
|
$
|
31.75
|
|
|
|
3.64
|
|
|
$
|
182
|
|
|
Exercisable as of February 27, 2010
|
|
|
15,763
|
|
|
$
|
32.58
|
|
|
|
3.09
|
|
|
$
|
153
|
|
The weighted average grant date fair value of all stock options
granted during fiscal 2010, 2009 and 2008 was $4.92, $7.91 and
$8.97 per share, respectively. The total intrinsic value of
stock options exercised during fiscal 2010, 2009, and 2008 was
$1, $4 and $93, respectively. Intrinsic value is measured using
the fair market value as of the date of exercise for stock
options exercised and the fair market value as of
February 27, 2010, less the applicable exercise price.
The fair value of each stock option is estimated as of the date
of grant using the Black-Scholes option pricing model. Expected
volatility is estimated based on an average of actual historical
volatility and implied volatility corresponding to the stock
option’s estimated expected term. The Company believes this
approach to determine volatility is representative of future
stock volatility. The expected term of a stock option is
estimated based on analysis of stock options already exercised
and foreseeable trends or changes in behavior. The risk-free
interest rates are based on the U.S. Treasury securities
maturities as of each applicable grant date. The dividend yield
is based on analysis of actual historical dividend yield.
The significant weighted average assumptions relating to the
valuation of the Company’s stock options consisted of the
following:
| |
|
|
|
|
|
|
|
|
|
|
|
|
|
|
|
2010
|
|
|
2009
|
|
|
2008
|
|
|
|
|
Dividend yield
|
|
|
2.0
|
%
|
|
|
2.0
|
%
|
|
|
2.0
|
%
|
|
Volatility rate
|
|
|
38.4–42.2
|
%
|
|
|
28.1–59.4
|
%
|
|
|
19.1–30.8
|
%
|
|
Risk-free interest rate
|
|
|
1.8–2.8
|
%
|
|
|
1.0–3.6
|
%
|
|
|
3.0–5.1
|
%
|
|
Expected option life
|
|
|
4.0–5.4 years
|
|
|
|
1.0–5.4 years
|
|
|
|
1.0–5.5 years
|
|
Restricted
Stock Awards
Restricted stock award activity consisted of the following:
| |
|
|
|
|
|
|
|
|
|
|
|
Restricted
|
|
|
Weighted Average
|
|
|
|
|
Stock
|
|
|
Grant-Date
|
|
|
|
|
(In thousands)
|
|
|
Fair Value
|
|
|
|
|
Outstanding, February 28, 2009
|
|
|
1,380
|
|
|
$
|
30.05
|
|
|
Granted
|
|
|
728
|
|
|
|
15.83
|
|
|
Lapsed
|
|
|
(704
|
)
|
|
|
15.34
|
|
|
Canceled and forfeited
|
|
|
(101
|
)
|
|
|
20.60
|
|
|
|
|
|
|
|
|
|
|
|
|
Outstanding, February 27, 2010
|
|
|
1,303
|
|
|
$
|
22.28
|
|
|
|
|
|
|
|
|
|
|
|
55
Compensation
Expense
The components of pre-tax stock-based compensation expense
(included primarily in Selling and administrative expenses in
the Consolidated Statements of Earnings) and related tax
benefits were as follows:
| |
|
|
|
|
|
|
|
|
|
|
|
|
|
|
|
2010
|
|
|
2009
|
|
|
2008
|
|
|
|
|
Stock-based compensation
|
|
$
|
31
|
|
|
$
|
44
|
|
|
$
|
52
|
|
|
Income tax benefits
|
|
|
(12
|
)
|
|
|
(17
|
)
|
|
|
(20
|
)
|
|
|
|
|
|
|
|
|
|
|
|
|
|
|
|
Stock-based compensation (net of tax)
|
|
$
|
19
|
|
|
$
|
27
|
|
|
$
|
32
|
|
|
|
|
|
|
|
|
|
|
|
|
|
|
|
The Company realized excess tax benefits (shortfalls) of $(1),
$1, and $20 related to stock-based awards during fiscal 2010,
2009 and 2008, respectively.
Unrecognized
Compensation Expense
As of February 27, 2010, there was $33 of unrecognized
compensation expense related to unvested stock-based awards
granted under the Company’s stock plans. The expense is
expected to be recognized over a weighted average remaining
vesting period of approximately two years.
|
|
|
NOTE 10—
|
TREASURY
STOCK PURCHASE PROGRAM
|
On May 28, 2009, the Board of Directors of the Company
adopted and announced a new annual share repurchase program
authorizing the Company to purchase up to $70 of the
Company’s common stock. Stock purchases will be made from
the cash generated from the settlement of stock options. This
annual authorization program replaced all existing share
repurchase programs and continues through June 2010. As of
February 27, 2010, there remained $70 available to
repurchase the Company’s common stock.
The Company did not purchase any shares during fiscal 2010.
During 2009 and 2008, the Company purchased 0.2 shares and
5 shares, respectively, under former share repurchase
programs.
56
|
|
|
NOTE 11—
|
NET
EARNINGS (LOSS) PER SHARE
|
The following table reflects the calculation of basic and
diluted net earnings (loss) per share:
| |
|
|
|
|
|
|
|
|
|
|
|
|
|
|
|
2010
|
|
|
2009
|
|
|
2008
|
|
|
|
|
Net earnings (loss) per share—basic:
|
|
|
|
|
|
|
|
|
|
|
|
|
|
Net earnings (loss)
|
|
$
|
393
|
|
|
$
|
(2,855
|
)
|
|
$
|
593
|
|
|
Deduct: undistributed net earnings allocable to contingently
convertible debentures
|
|
|
—
|
|
|
|
—
|
|
|
|
(2
|
)
|
|
|
|
|
|
|
|
|
|
|
|
|
|
|
|
Net earnings (loss) available to common stockholders
|
|
$
|
393
|
|
|
$
|
(2,855
|
)
|
|
$
|
591
|
|
|
|
|
|
|
|
|
|
|
|
|
|
|
|
|
Weighted average shares outstanding—basic
|
|
|
212
|
|
|
|
211
|
|
|
|
211
|
|
|
Net earnings (loss) per share—basic
|
|
$
|
1.86
|
|
|
$
|
(13.51
|
)
|
|
$
|
2.80
|
|
|
Net earnings (loss) per share—diluted:
|
|
|
|
|
|
|
|
|
|
|
|
|
|
Net earnings (loss)
|
|
$
|
393
|
|
|
$
|
(2,855
|
)
|
|
$
|
593
|
|
|
Interest related to dilutive contingently convertible
debentures, net of tax
|
|
|
1
|
|
|
|
—
|
|
|
|
1
|
|
|
|
|
|
|
|
|
|
|
|
|
|
|
|
|
Net earnings (loss) used for diluted net earnings per share
calculation
|
|
$
|
394
|
|
|
$
|
(2,855
|
)
|
|
$
|
594
|
|
|
|
|
|
|
|
|
|
|
|
|
|
|
|
|
Weighted average shares outstanding—basic
|
|
|
212
|
|
|
|
211
|
|
|
|
211
|
|
|
Dilutive impact of options and restricted stock outstanding
|
|
|
1
|
|
|
|
—
|
|
|
|
3
|
|
|
Dilutive impact of convertible securities
|
|
|
—
|
|
|
|
—
|
|
|
|
1
|
|
|
|
|
|
|
|
|
|
|
|
|
|
|
|
|
Weighted average shares outstanding—diluted
|
|
|
213
|
|
|
|
211
|
|
|
|
215
|
|
|
|
|
|
|
|
|
|
|
|
|
|
|
|
|
Net earnings (loss) per share—diluted
|
|
$
|
1.85
|
|
|
$
|
(13.51
|
)
|
|
$
|
2.76
|
|
Options and restricted stock of 22 shares were outstanding
during fiscal 2010 and 2009 and 6 shares were outstanding
during fiscal 2008, but were excluded from the computation of
diluted net earnings per share because they were antidilutive.
Substantially all employees of the Company and its subsidiaries
are covered by various contributory and non-contributory
pension, profit sharing or 401(k) plans. Union employees
participate in multi-employer retirement plans under collective
bargaining agreements, unless the collective bargaining
agreement provides for participation in plans sponsored by the
Company. In addition to sponsoring both defined benefit and
defined contribution pension plans, the Company provides
healthcare and life insurance benefits for eligible retired
employees under postretirement benefit plans. The Company also
provides certain health and welfare benefits, including
short-term and long-term disability benefits to inactive
disabled employees prior to retirement. The terms of the
postretirement benefit plans vary based on employment history,
age and date of retirement. For most retirees, the Company
provides a fixed dollar contribution and retirees pay
contributions to fund the remaining cost.
Effective December 31, 2007, the Company authorized
amendments to the SUPERVALU Retirement Plan and certain
supplemental executive retirement benefit plans whereby service
crediting ended in these plans and no employees will become
eligible to participate in these plans after December 31,
2007. Pay increases will continue to be reflected in the amount
of benefit earned in these plans until December 31, 2012.
The amendments to the plans were accounted for as plan
curtailments in fiscal 2008.
Effective January 1, 2009, the Company authorized an
amendment to the SUPERVALU Retiree Benefit Plan to provide for
certain insured Medicare benefits. The result of this amendment
was a reduction in the other postretirement benefit obligation
of $37 with a corresponding decrease to other comprehensive
loss, net of tax.
57
The benefit obligation, fair value of plan assets and funded
status of the defined benefit pension plans and other
postretirement benefit plans consisted of the following:
| |
|
|
|
|
|
|
|
|
|
|
|
|
|
|
|
|
|
|
|
Pension Benefits
|
|
|
Other Postretirement Benefits
|
|
|
|
|
2010
|
|
|
2009
|
|
|
2010
|
|
|
2009
|
|
|
|
|
Change in Benefit Obligation
|
|
|
|
|
|
|
|
|
|
|
|
|
|
|
|
|
|
Benefit obligation at beginning of year
|
|
$
|
1,922
|
|
|
$
|
1,940
|
|
|
$
|
117
|
|
|
$
|
153
|
|
|
Plan amendment
|
|
|
—
|
|
|
|
—
|
|
|
|
—
|
|
|
|
(37
|
)
|
|
Service cost
|
|
|
6
|
|
|
|
7
|
|
|
|
2
|
|
|
|
1
|
|
|
Interest cost
|
|
|
138
|
|
|
|
129
|
|
|
|
8
|
|
|
|
10
|
|
|
Transfers
|
|
|
(1
|
)
|
|
|
2
|
|
|
|
—
|
|
|
|
—
|
|
|
Actuarial loss (gain)
|
|
|
335
|
|
|
|
(85
|
)
|
|
|
10
|
|
|
|
3
|
|
|
Benefits paid
|
|
|
(80
|
)
|
|
|
(71
|
)
|
|
|
(6
|
)
|
|
|
(13
|
)
|
|
|
|
|
|
|
|
|
|
|
|
|
|
|
|
|
|
|
|
Benefit obligation at end of year
|
|
|
2,320
|
|
|
|
1,922
|
|
|
|
131
|
|
|
|
117
|
|
|
|
|
|
|
|
|
|
|
|
|
|
|
|
|
|
|
|
|
Changes in Plan Assets
|
|
|
|
|
|
|
|
|
|
|
|
|
|
|
|
|
|
Fair value of plan assets at beginning of year
|
|
|
1,008
|
|
|
|
1,700
|
|
|
|
—
|
|
|
|
—
|
|
|
Actual return on plan assets
|
|
|
503
|
|
|
|
(649
|
)
|
|
|
—
|
|
|
|
—
|
|
|
Employer contributions
|
|
|
126
|
|
|
|
28
|
|
|
|
6
|
|
|
|
13
|
|
|
Plan participants’ contributions
|
|
|
—
|
|
|
|
—
|
|
|
|
7
|
|
|
|
11
|
|
|
Benefits paid
|
|
|
(80
|
)
|
|
|
(71
|
)
|
|
|
(13
|
)
|
|
|
(24
|
)
|
|
|
|
|
|
|
|
|
|
|
|
|
|
|
|
|
|
|
|
Fair value of plan assets at end of year
|
|
|
1,557
|
|
|
|
1,008
|
|
|
|
—
|
|
|
|
—
|
|
|
|
|
|
|
|
|
|
|
|
|
|
|
|
|
|
|
|
|
Funded status at end of year
|
|
$
|
(763
|
)
|
|
$
|
(914
|
)
|
|
$
|
(131
|
)
|
|
$
|
(117
|
)
|
|
|
|
|
|
|
|
|
|
|
|
|
|
|
|
|
|
|
For the defined benefit pension plans, the benefit obligation is
the projected benefit obligation. For other postretirement
benefit plans, the benefit obligation is the accumulated
postretirement benefit obligation. The Company’s
accumulated benefit obligation for the defined benefit pension
plans was $2,300 and $1,892 as of February 27, 2010 and
February 28, 2009, respectively.
Amounts recognized in the Consolidated Balance Sheets consisted
of the following:
| |
|
|
|
|
|
|
|
|
|
|
|
|
|
|
|
|
|
|
|
Pension Benefits
|
|
|
Other Postretirement Benefits
|
|
|
|
|
2010
|
|
|
2009
|
|
|
2010
|
|
|
2009
|
|
|
|
|
Accrued vacation, compensation and benefits
|
|
$
|
(2
|
)
|
|
$
|
(2
|
)
|
|
$
|
(8
|
)
|
|
$
|
(7
|
)
|
|
Other liabilities
|
|
|
(761
|
)
|
|
|
(912
|
)
|
|
|
(123
|
)
|
|
|
(110
|
)
|
|
|
|
|
|
|
|
|
|
|
|
|
|
|
|
|
|
|
|
|
|
$
|
(763
|
)
|
|
$
|
(914
|
)
|
|
$
|
(131
|
)
|
|
$
|
(117
|
)
|
|
|
|
|
|
|
|
|
|
|
|
|
|
|
|
|
|
|
Amounts recognized in accumulated other comprehensive losses for
the defined benefit pension plans and other postretirement
benefit plans consists of the following:
| |
|
|
|
|
|
|
|
|
|
|
|
|
|
|
|
|
|
|
|
Pension Benefits
|
|
|
Other Postretirement Benefits
|
|
|
|
|
2010
|
|
|
2009
|
|
|
2010
|
|
|
2009
|
|
|
|
|
Prior service benefit
|
|
$
|
—
|
|
|
$
|
—
|
|
|
$
|
33
|
|
|
$
|
39
|
|
|
Net actuarial loss
|
|
|
(780
|
)
|
|
|
(832
|
)
|
|
|
(37
|
)
|
|
|
(29
|
)
|
|
|
|
|
|
|
|
|
|
|
|
|
|
|
|
|
|
|
|
Total recognized in accumulated other comprehensive losses
|
|
$
|
(780
|
)
|
|
$
|
(832
|
)
|
|
$
|
(4
|
)
|
|
$
|
10
|
|
|
|
|
|
|
|
|
|
|
|
|
|
|
|
|
|
|
|
|
Total recognized in accumulated other comprehensive losses, net
of tax
|
|
$
|
(475
|
)
|
|
$
|
(509
|
)
|
|
$
|
(3
|
)
|
|
$
|
6
|
|
|
|
|
|
|
|
|
|
|
|
|
|
|
|
|
|
|
|
58
Net periodic benefit expense (income) for defined benefit
pension plans and other postretirement benefit plans consisted
of the following:
| |
|
|
|
|
|
|
|
|
|
|
|
|
|
|
|
|
|
|
|
|
|
|
|
|
|
|
|
Pension Benefits
|
|
|
Other Postretirement Benefits
|
|
|
|
|
2010
|
|
|
2009
|
|
|
2008
|
|
|
2010
|
|
|
2009
|
|
|
2008
|
|
|
|
|
Net Periodic Benefit Cost
|
|
|
|
|
|
|
|
|
|
|
|
|
|
|
|
|
|
|
|
|
|
|
|
|
|
Service cost
|
|
$
|
6
|
|
|
$
|
7
|
|
|
$
|
27
|
|
|
$
|
2
|
|
|
$
|
1
|
|
|
$
|
2
|
|
|
Interest cost
|
|
|
138
|
|
|
|
129
|
|
|
|
124
|
|
|
|
8
|
|
|
|
10
|
|
|
|
9
|
|
|
Expected return on plan assets
|
|
|
(129
|
)
|
|
|
(142
|
)
|
|
|
(135
|
)
|
|
|
—
|
|
|
|
—
|
|
|
|
—
|
|
|
Amortization of prior service benefit
|
|
|
—
|
|
|
|
—
|
|
|
|
—
|
|
|
|
(6
|
)
|
|
|
(1
|
)
|
|
|
(2
|
)
|
|
Amortization of net actuarial loss
|
|
|
10
|
|
|
|
1
|
|
|
|
13
|
|
|
|
2
|
|
|
|
3
|
|
|
|
5
|
|
|
Settlement
|
|
|
2
|
|
|
|
—
|
|
|
|
—
|
|
|
|
—
|
|
|
|
—
|
|
|
|
—
|
|
|
Curtailment
|
|
|
—
|
|
|
|
—
|
|
|
|
6
|
|
|
|
—
|
|
|
|
—
|
|
|
|
—
|
|
|
|
|
|
|
|
|
|
|
|
|
|
|
|
|
|
|
|
|
|
|
|
|
|
|
|
|
Net periodic benefit expense (income)
|
|
|
27
|
|
|
|
(5
|
)
|
|
|
35
|
|
|
|
6
|
|
|
|
13
|
|
|
|
14
|
|
|
|
|
|
|
|
|
|
|
|
|
|
|
|
|
|
|
|
|
|
|
|
|
|
|
|
|
Other Changes in Plan Assets and Benefit Obligations
Recognized in Other Comprehensive Income (Loss)
|
|
|
|
|
|
|
|
|
|
|
|
|
|
|
|
|
|
|
|
|
|
|
|
|
|
Prior service benefit
|
|
|
—
|
|
|
|
—
|
|
|
|
(6
|
)
|
|
|
—
|
|
|
|
(38
|
)
|
|
|
—
|
|
|
Amortization of prior service benefit
|
|
|
—
|
|
|
|
—
|
|
|
|
—
|
|
|
|
6
|
|
|
|
1
|
|
|
|
2
|
|
|
Net actuarial loss (gain)
|
|
|
(42
|
)
|
|
|
707
|
|
|
|
(139
|
)
|
|
|
10
|
|
|
|
3
|
|
|
|
(17
|
)
|
|
Amortization of net actuarial loss
|
|
|
(10
|
)
|
|
|
(1
|
)
|
|
|
(13
|
)
|
|
|
(2
|
)
|
|
|
(3
|
)
|
|
|
(5
|
)
|
|
|
|
|
|
|
|
|
|
|
|
|
|
|
|
|
|
|
|
|
|
|
|
|
|
|
|
Total recognized in other comprehensive income
|
|
|
(52
|
)
|
|
|
706
|
|
|
|
(158
|
)
|
|
|
14
|
|
|
|
(37
|
)
|
|
|
(20
|
)
|
|
|
|
|
|
|
|
|
|
|
|
|
|
|
|
|
|
|
|
|
|
|
|
|
|
|
|
Total recognized in net periodic benefit expense and other
comprehensive income
|
|
$
|
(25
|
)
|
|
$
|
701
|
|
|
$
|
(123
|
)
|
|
$
|
20
|
|
|
$
|
(24
|
)
|
|
$
|
(6
|
)
|
|
|
|
|
|
|
|
|
|
|
|
|
|
|
|
|
|
|
|
|
|
|
|
|
|
|
The estimated net actuarial loss that will be amortized from
accumulated other comprehensive losses into net periodic benefit
cost for the defined benefit pension plans during fiscal 2011 is
$66. The estimated net amount of prior service benefit and net
actuarial loss for the postretirement benefit plans that will be
amortized from accumulated other comprehensive losses into net
periodic benefit cost during fiscal 2011 is $4.
Assumptions
Weighted average assumptions used to determine benefit
obligations and net periodic benefit cost consisted of the
following:
| |
|
|
|
|
|
|
|
|
|
|
|
|
|
|
|
2010
|
|
|
2009
|
|
|
2008
|
|
|
|
|
Benefit obligation assumptions:
|
|
|
|
|
|
|
|
|
|
|
|
|
|
Discount
rate(2)
|
|
|
6.00
|
%
|
|
|
7.35
|
%
|
|
|
6.75
|
%
|
|
Rate of compensation increase
|
|
|
3.00
|
%
|
|
|
3.25
|
%
|
|
|
3.75
|
%
|
|
Net periodic benefit cost
assumptions:(1)
|
|
|
|
|
|
|
|
|
|
|
|
|
|
Discount
rate(2)
|
|
|
7.35
|
%
|
|
|
6.75
|
%
|
|
|
5.85
|
%
|
|
Rate of compensation increase
|
|
|
3.25
|
%
|
|
|
3.75
|
%
|
|
|
3.00
|
%
|
|
Expected return on plan
assets(3)
|
|
|
8.00
|
%
|
|
|
8.00
|
%
|
|
|
8.00
|
%
|
|
|
|
|
(1) |
|
Net periodic benefit cost is measured using weighted average
assumptions as of the beginning of each year. |
| |
|
(2) |
|
The Company reviews and selects the discount rate to be used in
connection with its pension and other postretirement obligations
annually. In determining the discount rate, the Company uses the
yield on corporate bonds (rated AA or better) that coincides
with the cash flows of the plans’ estimated benefit
payouts. The model uses a yield curve approach to discount each
cash flow of the liability stream at an |
59
|
|
|
|
|
|
interest rate specifically applicable to the timing of each
respective cash flow. The model totals the present values of all
cash flows and calculates the equivalent weighted average
discount rate by imputing the singular interest rate that
equates the total present value with the stream of future cash
flows. This resulting weighted average discount rate is then
used in evaluating the final discount rate to be used by the
Company. |
| |
|
(3) |
|
Expected long-term return on plan assets is estimated by asset
class and is generally based on widely-accepted capital market
principles, long-term return analysis for global fixed income
and equity markets, the active total return-oriented portfolio
management style as well as the diversification needs and
rebalancing characteristics of the plan. Long-term trends are
evaluated relative to market factors such as inflation, interest
rates and fiscal and monetary policies in order to assess the
capital market assumptions. |
For those retirees whose health plans provide for variable
employer contributions, the assumed healthcare cost trend rate
used in measuring the accumulated postretirement benefit
obligation before and after age 65 was 8.0 percent and
8.5 percent, respectively, as of February 27, 2010.
The assumed healthcare cost trend rate for retirees before and
after age 65 will decrease by 0.5 percent each year
for the next six and seven years, respectively, until it reaches
the ultimate trend rate of five percent. For those retirees
whose health plans provide for a fixed employer contribution
rate, a healthcare cost trend is not applicable. The healthcare
cost trend rate assumption has a significant impact on the
amounts reported. For example, a 100 basis point change in
the trend rate would impact the Company’s accumulated
postretirement benefit obligation as of the end of fiscal 2010
by approximately $10 and the service and interest cost by
approximately $1 for fiscal 2011.
Pension
Plan Assets
Plan assets are held in trust and invested in separately managed
accounts and other commingled investment vehicles holding
domestic and international equity securities, domestic fixed
income securities and other investment classes. The Company
employs a total return approach whereby a mix of equities and
fixed income investments are used to maximize the long-term
return of plan assets for a prudent level of risk. Alternative
investments may also be used to enhance risk-adjusted long-term
returns while improving portfolio diversification. Risk
management is accomplished through diversification across asset
classes, multiple investment manager portfolios and both general
and portfolio-specific investment guidelines. Risk tolerance is
established through careful consideration of the plan
liabilities, plan funded status and the Company’s financial
condition. This asset allocation policy mix is reviewed annually
and actual versus target allocations are monitored regularly and
rebalanced on an as-needed basis. Plan assets are invested using
a combination of active and passive investment strategies.
Passive, or “indexed” strategies, attempt to mimic
rather than exceed the investment performance of a market
benchmark. The plan’s active investment strategies employ
multiple investment management firms. Managers within each asset
class cover a range of investment styles and approaches and are
combined in a way that controls for capitalization, and style
biases (equities) and interest rate exposures (fixed income)
versus benchmark indices while focusing primarily on security
selection as a means to add value. Monitoring activities to
evaluate performance against targets and measure investment risk
take place on an ongoing basis through annual liability
measurements, periodic asset/liability studies and quarterly
investment portfolio reviews.
60
The asset allocation guidelines and the actual allocation of
pension plan assets are as follows:
| |
|
|
|
|
|
|
|
|
|
|
|
|
|
Asset Category
|
|
Target
|
|
|
2010
|
|
|
2009
|
|
|
|
|
Domestic equity
|
|
|
31.8
|
%
|
|
|
42.3
|
%
|
|
|
44.0
|
%
|
|
International equity
|
|
|
15.7
|
%
|
|
|
21.6
|
%
|
|
|
20.3
|
%
|
|
Private equity
|
|
|
7.5
|
%
|
|
|
2.2
|
%
|
|
|
1.3
|
%
|
|
Fixed income
|
|
|
35.0
|
%
|
|
|
33.7
|
%
|
|
|
34.0
|
%
|
|
Real estate
|
|
|
10.0
|
%
|
|
|
—
|
|
|
|
—
|
|
|
Cash and other
|
|
|
—
|
|
|
|
0.2
|
%
|
|
|
0.4
|
%
|
|
|
|
|
|
|
|
|
|
|
|
|
|
|
|
Total
|
|
|
100.0
|
%
|
|
|
100.0
|
%
|
|
|
100.0
|
%
|
|
|
|
|
|
|
|
|
|
|
|
|
|
|
The following is a description of the valuation methodologies
used for investments measured at fair value:
Common stock—Valued at the closing price
reported in the active market in which the individual securities
are traded.
Common collective trusts—Valued at Net Asset
Value (“NAV”), which is based on the value of the
underlying securities owned by the fund and divided by the
number of shares outstanding.
Corporate bonds—Valued based on yields
currently available on comparable securities of issuers with
similar credit ratings.
Government securities—Certain government
securities are valued at the closing price reported in the
active market in which the security is traded. Other government
securities are valued based on yields currently available on
comparable securities of issuers with similar credit ratings.
Mortgage-backed securities—Valued based on
yields currently available on comparable securities of issuers
with similar credit ratings.
Private equity—Valued using closing prices of
comparable securities with similar terms or based on acquisition
cost and adjusted annually based on audited financial statements.
Mutual funds—Certain mutual funds are valued
at the closing price reported in the active market in which the
individual securities are traded. Other mutual funds are valued
at NAV, which is based on the value of the underlying securities
owned by the fund and divided by the number of shares
outstanding.
Other—Valued under an approach that maximizes
observable inputs, such as gathering consensus data from the
market participant’s best estimate of mid-market for actual
trades or positions held.
61
The fair value of assets of the Company’s benefit plans
held in a master trust as of February 27, 2010, by asset
category, consisted of the following:
| |
|
|
|
|
|
|
|
|
|
|
|
|
|
|
|
|
|
|
|
Level 1
|
|
|
Level 2
|
|
|
Level 3
|
|
|
Total
|
|
|
|
|
Common stock
|
|
$
|
644
|
|
|
$
|
28
|
|
|
$
|
—
|
|
|
$
|
672
|
|
|
Common collective trusts—equity
|
|
|
—
|
|
|
|
227
|
|
|
|
—
|
|
|
|
227
|
|
|
Common collective trusts—fixed income
|
|
|
—
|
|
|
|
232
|
|
|
|
—
|
|
|
|
232
|
|
|
Corporate bonds
|
|
|
1
|
|
|
|
175
|
|
|
|
—
|
|
|
|
176
|
|
|
Government securities
|
|
|
52
|
|
|
|
86
|
|
|
|
—
|
|
|
|
138
|
|
|
Mortgage backed securities
|
|
|
—
|
|
|
|
65
|
|
|
|
—
|
|
|
|
65
|
|
|
Private equity
|
|
|
—
|
|
|
|
—
|
|
|
|
35
|
|
|
|
35
|
|
|
Mutual funds
|
|
|
1
|
|
|
|
8
|
|
|
|
—
|
|
|
|
9
|
|
|
Other
|
|
|
—
|
|
|
|
3
|
|
|
|
—
|
|
|
|
3
|
|
|
|
|
|
|
|
|
|
|
|
|
|
|
|
|
|
|
|
|
Total plan assets at fair value
|
|
$
|
698
|
|
|
$
|
824
|
|
|
$
|
35
|
|
|
$
|
1,557
|
|
|
|
|
|
|
|
|
|
|
|
|
|
|
|
|
|
|
|
The following is a summary of changes in the fair value for
level 3 investments as of February 27, 2010:
| |
|
|
|
|
|
|
|
Level 3 Assets
|
|
|
|
|
Beginning balance
|
|
$
|
14
|
|
|
Unrealized gains relating to instruments still held at the
reporting date
|
|
|
3
|
|
|
Purchases, sales, issuances and settlements (net)
|
|
|
18
|
|
|
|
|
|
|
|
|
Ending balance
|
|
$
|
35
|
|
|
|
|
|
|
|
Contributions
The Company expects to contribute $81 to its defined benefit
pension plans and $8 to its postretirement benefit plans in
fiscal 2011. The Company’s funding policy for the defined
benefit pension plans is to contribute the minimum contribution
allowed under the Employee Retirement Income Security Act of
1974, with consideration given to contributing larger amounts in
order to be exempt from Pension Benefit Guaranty Corporation
variable rate premiums or participant notices of underfunding.
The Company will recognize contributions in accordance with
applicable regulations, with consideration given to recognition
for the earliest plan year permitted.
Estimated
Future Benefit Payments
The estimated future benefit payments to be paid from the
Company’s defined benefit pension plans and other
postretirement benefit plans, which reflect expected future
service, are as follows:
| |
|
|
|
|
|
|
|
|
|
|
|
|
|
|
Other
|
|
|
|
|
|
|
|
Postretirement
|
|
|
Fiscal Year
|
|
Pension Benefits
|
|
|
Benefits
|
|
|
|
|
2011
|
|
$
|
84
|
|
|
$
|
8
|
|
|
2012
|
|
|
90
|
|
|
|
8
|
|
|
2013
|
|
|
98
|
|
|
|
8
|
|
|
2014
|
|
|
108
|
|
|
|
9
|
|
|
2015
|
|
|
115
|
|
|
|
9
|
|
|
Years
2016-2020
|
|
|
720
|
|
|
|
51
|
|
62
Defined
Contribution Plans
The Company sponsors several defined contribution and profit
sharing plans pursuant to Section 401(k) of the Internal
Revenue Code. The total amount contributed by the Company to the
plans is determined by plan provisions or at the discretion of
the Company. Total contribution expenses for these plans were
$95, $79 and $106 for fiscal 2010, 2009 and 2008, respectively.
Plan assets also include 4 shares of the Company’s
common stock as of February 27, 2010 and February 28,
2009.
Post-Employment
Benefits
The Company recognizes an obligation for benefits provided to
former or inactive employees. The Company is self-insured for
certain of its employees’ short-term and long-term
disability plans, the primary benefits paid to inactive
employees prior to retirement. As of February 27, 2010, the
obligation for post-employment benefits was $63, with $24
included in Accrued vacation, compensation and benefits and $39
included in Other liabilities.
Multi-Employer
Plans
The Company contributes to various multi-employer pension plans
under collective bargaining agreements, primarily defined
benefit pension plans. These plans generally provide retirement
benefits to participants based on their service to contributing
employers. Based on available information, the Company believes
that some of the multi-employer plans to which it contributes
are underfunded. Company contributions to these plans could
increase in the near term. However, the amount of any increase
or decrease in contributions will depend on a variety of
factors, including the results of the Company’s collective
bargaining efforts, investment returns on the assets held in the
plans, actions taken by the trustees who manage the plans and
requirements under the Pension Protection Act and
Section 412(e) of the Internal Revenue Code. Furthermore,
if the Company was to significantly reduce contributions, exit
certain markets or otherwise cease making contributions to these
plans, it could trigger a partial or complete withdrawal that
would require the Company to fund its proportionate share of a
plan’s unfunded vested benefits. The Company contributed
$143, $147 and $142 to these plans for fiscal 2010, 2009 and
2008, respectively.
The Company also makes contributions to multi-employer health
and welfare plans in amounts set forth in the related collective
bargaining agreements. A small minority of collective bargaining
agreements contain reserve requirements that may trigger
unanticipated contributions resulting in increased healthcare
expenses. If these healthcare provisions cannot be renegotiated
in a manner that reduces the prospective healthcare cost as the
Company intends, the Company’s Selling and administrative
expenses could increase in the future.
Collective
Bargaining Agreements
As of February 27, 2010, the Company had approximately
160,000 employees. Approximately 106,000 employees are
covered by collective bargaining agreements. During fiscal 2010,
46 collective bargaining agreements covering approximately
16,000 employees were renegotiated. During fiscal 2010, 33
collective bargaining agreements covering approximately
29,000 employees expired without their terms being
renegotiated. Negotiations are expected to continue with the
bargaining units representing the employees subject to those
agreements. During fiscal 2011, 71 collective bargaining
agreements covering approximately 12,000 employees will
expire.
NOTE 13—COMMITMENTS,
CONTINGENCIES AND OFF-BALANCE SHEET ARRANGEMENTS
Guarantees
The Company has guaranteed certain leases, fixture financing
loans and other debt obligations of various retailers as of
February 27, 2010. These guarantees were generally made to
support the business growth of independent retail customers. The
guarantees are generally for the entire terms of the leases or
other debt
63
obligations with remaining terms that range from less than one
year to 20 years, with a weighted average remaining term of
approximately nine years. For each guarantee issued, if the
independent retail customer defaults on a payment, the Company
would be required to make payments under its guarantee.
Generally, the guarantees are secured by indemnification
agreements or personal guarantees of the independent retail
customer. The Company reviews performance risk related to its
guarantees of independent retail customers based on internal
measures of credit performance. As of February 27, 2010,
the maximum amount of undiscounted payments the Company would be
required to make in the event of default of all guarantees was
approximately $127 and represented approximately $93 on a
discounted basis. Based on the indemnification agreements,
personal guarantees and results of the reviews of performance
risk, the Company believes the likelihood that it will be
required to assume a material amount of these obligations is
remote. Accordingly, no amount has been recorded in the
Consolidated Balance Sheets for these contingent obligations
under the Company’s guarantee arrangements.
The Company is contingently liable for leases that have been
assigned to various third parties in connection with facility
closings and dispositions. The Company could be required to
satisfy the obligations under the leases if any of the assignees
are unable to fulfill their lease obligations. Due to the wide
distribution of the Company’s assignments among third
parties, and various other remedies available, the Company
believes the likelihood that it will be required to assume a
material amount of these obligations is remote.
In the ordinary course of business, the Company enters into
supply contracts to purchase products for resale. These
contracts typically include either volume commitments or fixed
expiration dates, termination provisions and other standard
contractual considerations. As of February 27, 2010, the
Company had approximately $1,184 of non-cancelable future
purchase obligations primarily related to supply contracts.
The Company is a party to a variety of contractual agreements
under which the Company may be obligated to indemnify the other
party for certain matters, which indemnities may be secured by
operation of law or otherwise, in the ordinary course of
business. These contracts primarily relate to the Company’s
commercial contracts, operating leases and other real estate
contracts, financial agreements, agreements to provide services
to the Company and agreements to indemnify officers, directors
and employees in the performance of their work. While the
Company’s aggregate indemnification obligation could result
in a material liability, the Company is aware of no current
matter that it expects to result in a material liability.
Legal
Proceedings
The Company is subject to various lawsuits, claims and other
legal matters that arise in the ordinary course of conducting
business, none of which, in management’s opinion, is
expected to have a material adverse effect on the Company’s
financial condition, results of operations or cash flows.
In September 2008, a class action complaint was filed against
the Company, as well as International Outsourcing Services, LLC
(“IOS”), Inmar, Inc., Carolina Manufacturer’s
Services, Inc., Carolina Coupon Clearing, Inc. and Carolina
Services, in the United States District Court in the Eastern
District of Wisconsin. The plaintiffs in the case are a consumer
goods manufacturer, a grocery co-operative and a retailer
marketing services company who allege on behalf of a purported
class that the Company and the other defendants
(i) conspired to restrict the markets for coupon processing
services under the Sherman Act and (ii) were part of an
illegal enterprise to defraud the plaintiffs under the Federal
Racketeer Influenced and Corrupt Organizations Act. The
plaintiffs seek monetary damages, attorneys’ fees and
injunctive relief. The Company intends to vigorously defend this
lawsuit, however all proceedings have been stayed in the case
pending the result of the criminal prosecution of certain former
officers of IOS. Although this lawsuit is subject to the
uncertainties inherent in the litigation process, based on the
information presently available to the Company, management does
not expect that the ultimate resolution of this lawsuit will
have a material adverse effect on the Company’s financial
condition, results of operations or cash flows.
In December 2008, a class action complaint was filed in the
United States District Court for the Western District of
Wisconsin against the Company alleging that a 2003 transaction
between the Company and C&S Wholesale Grocers, Inc.
(“C&S”) was a conspiracy to restrain trade and
allocate markets. In the 2003
64
transaction, the Company purchased certain assets of the Fleming
Corporation as part of Fleming Corporation’s bankruptcy
proceedings and sold certain assets of the Company to C&S
which were located in New England. Since December 2008, three
other retailers have filed similar complaints in other
jurisdictions. The cases have been consolidated and are
proceeding in the United States District Court for the District
of Minnesota. The complaints allege that the conspiracy was
concealed and continued through the use of non-compete and
non-solicitation agreements and the closing down of the
distribution facilities that the Company and C&S purchased
from the other. Plaintiffs are seeking monetary damages,
injunctive relief and attorneys’ fees. The Company is
vigorously defending these lawsuits. On September 14, 2009,
the United States Federal Trade Commission (“FTC”)
issued a subpoena to the Company requesting documents related to
the C&S transaction as part of the FTC’s investigation
into whether the Company and C&S engaged in unfair methods
of competition. The Company is cooperating with the FTC.
Although this matter is subject to the uncertainties inherent in
the litigation process, based on the information presently
available to the Company, management does not expect that the
ultimate resolution of this lawsuit or the FTC investigation
will have a material adverse effect on the Company’s
financial condition, results of operations or cash flows.
In July 2009, a putative class action complaint was filed in the
United States District Court for the Southern District of New
York against the Company, an officer and the Executive Chairman
of the Board alleging fraud under Sections 10(b) and 20(a)
of the Securities Exchange Act of 1934, as amended (the
“Exchange Act”) and
Rule 10b-5
under the Exchange Act. In October 2009, the lawsuit was
transferred to the United States District Court for the District
of Minnesota. The complaint alleged that the Company withheld
negative information from the market by inflating its fiscal
2010 guidance in order to complete the Company’s note
offering which closed on May 7, 2009. On January 13,
2010, the plaintiff voluntarily dismissed the lawsuit without
prejudice and to date has not re-filed the action.
On January 7, 2010, the Company received a subpoena from
the Office of Inspector General for the Department of Health and
Human Services’ Milwaukee Field Office in connection with
an investigation of possible false or otherwise improper claims
for payment under the Medicaid program. The subpoena requests
retail pharmacy claims data for “dual eligible”
customers (i.e., customers with both Medicaid and private
insurance coverage), information concerning the Company’s
retail pharmacy claims processing systems, copies of pharmacy
payor contracts and other documents and records. The Company is
cooperating with the Office of Inspector General. Management
cannot predict with certainty the timing or outcome of any
review by the government of such information.
The Company is also involved in routine legal proceedings
incidental to its operations. Some of these routine proceedings
involve class allegations, many of which are ultimately
dismissed. Management does not expect that the ultimate
resolution of these legal proceedings will have a material
adverse effect on the Company’s financial condition,
results of operations or cash flows.
The statements above reflect management’s current
expectations based on the information presently available to the
Company, however, predicting the outcomes of claims and
litigation and estimating related costs and exposures involves
substantial uncertainties that could cause actual outcomes,
costs and exposures to vary materially from current
expectations. In addition, the Company regularly monitors its
exposure to the loss contingencies associated with these matters
and may from time to time change its predictions with respect to
outcomes and its estimates with respect to related costs and
exposures and believes recorded reserves are adequate. It is
possible, although management believes it is remote, that
material differences in actual outcomes, costs and exposures
relative to current predictions and estimates, or material
changes in such predictions or estimates, could have a material
adverse effect on the Company’s financial condition,
results of operations or cash flows.
|
|
|
NOTE 14—
|
SHAREHOLDER
RIGHTS PLAN
|
On April 24, 2000, the Company announced that the Board of
Directors adopted a Shareholder Rights Plan under which one
preferred stock purchase right is distributed for each
outstanding share of common stock and
65
were exercisable only under certain conditions, and may be
redeemed by the Board of Directors for $0.01 per right. The
rights expired on April 12, 2010 and were not renewed.
|
|
|
NOTE 15—
|
SEGMENT
INFORMATION
|
Refer to the Consolidated Segment Financial Information for
financial information concerning the Company’s operations
by reportable segment.
The Company’s operating segments reflect the manner in
which the business is managed and how the Company allocates
resources and assesses performance internally. The
Company’s chief operating decision maker is the Chief
Executive Officer.
The Company offers a wide variety of grocery products, general
merchandise and health and beauty care, pharmacy, fuel and other
items and services. The Company’s business is classified by
management into two reportable segments: Retail food and Supply
chain services. These reportable segments are two distinct
businesses, one retail and one wholesale, each with a different
customer base, marketing strategy and management structure. The
Retail food reportable segment is an aggregation of the
Company’s retail operating segments, which are organized
based on format (traditional retail food stores and
hard-discount
food stores).
The Retail food operating segments are aggregated as the
products sold in the grocery stores are substantially the same,
focusing on food and related products; the customer or potential
customer for each of the retail operating segments is the same,
any consumer of food and related products; each of the retail
operating segments use the same distribution method for its
products, the sale of items through grocery stores; and all of
the Company’s retail operating segments are subject to
similar regulation. Additionally, the retail operating segments
are aggregated into one Retail food reportable segment as they
have similar economic characteristics and are expected to have
similar long-term financial performance, based on operating
earnings as a percent of sales.
The Retail food reportable segment derives revenues from the
sale of groceries at retail locations operated by the Company
(both the Company’s own stores and stores licensed by the
Company). The Supply chain services reportable segment derives
revenues from wholesale distribution to independently owned
retail food stores, mass merchants and other customers
(collectively referred to as “independent retail
customers”) and logistics support services.
The Company offers a wide variety of nationally advertised brand
name and private-label products, primarily including grocery
(both perishable and nonperishable), general merchandise and
health and beauty care, pharmacy and fuel, which are sold
through the Company’s own and licensed retail food stores
to shoppers and through its Supply chain services business to
independent retail customers. The amounts and percentages of
66
Net sales for each group of similar products sold in the Retail
food and Supply chain services segments consisted of the
following:
| |
|
|
|
|
|
|
|
|
|
|
|
|
|
|
|
|
|
|
|
|
|
|
|
|
|
|
|
2010
|
|
|
2009
|
|
|
2008
|
|
|
|
|
Retail food:
|
|
|
|
|
|
|
|
|
|
|
|
|
|
|
|
|
|
|
|
|
|
|
|
|
|
Nonperishable grocery
products(1)
|
|
$
|
17,233
|
|
|
|
43
|
%
|
|
$
|
18,031
|
|
|
|
41
|
%
|
|
$
|
17,553
|
|
|
|
40
|
%
|
|
Perishable grocery
products(2)
|
|
|
8,655
|
|
|
|
21
|
|
|
|
9,963
|
|
|
|
23
|
|
|
|
9,923
|
|
|
|
23
|
|
|
General merchandise and health and beauty care
products(3)
|
|
|
2,081
|
|
|
|
5
|
|
|
|
2,738
|
|
|
|
6
|
|
|
|
2,922
|
|
|
|
7
|
|
|
Pharmacy products
|
|
|
2,541
|
|
|
|
6
|
|
|
|
2,701
|
|
|
|
6
|
|
|
|
2,706
|
|
|
|
6
|
|
|
Fuel
|
|
|
581
|
|
|
|
2
|
|
|
|
645
|
|
|
|
1
|
|
|
|
638
|
|
|
|
1
|
|
|
Other
|
|
|
546
|
|
|
|
1
|
|
|
|
586
|
|
|
|
1
|
|
|
|
599
|
|
|
|
1
|
|
|
|
|
|
|
|
|
|
|
|
|
|
|
|
|
|
|
|
|
|
|
|
|
|
|
|
|
|
|
|
31,637
|
|
|
|
78
|
|
|
|
34,664
|
|
|
|
78
|
|
|
|
34,341
|
|
|
|
78
|
|
|
Supply chain services:
|
|
|
|
|
|
|
|
|
|
|
|
|
|
|
|
|
|
|
|
|
|
|
|
|
|
Product sales to independent retail customers
|
|
|
8,788
|
|
|
|
22
|
|
|
|
9,595
|
|
|
|
21
|
|
|
|
9,405
|
|
|
|
21
|
|
|
Services to supply chain customers
|
|
|
172
|
|
|
|
—
|
|
|
|
305
|
|
|
|
1
|
|
|
|
302
|
|
|
|
1
|
|
|
|
|
|
|
|
|
|
|
|
|
|
|
|
|
|
|
|
|
|
|
|
|
|
|
|
|
|
|
|
8,960
|
|
|
|
22
|
|
|
|
9,900
|
|
|
|
22
|
|
|
|
9,707
|
|
|
|
22
|
|
|
|
|
|
|
|
|
|
|
|
|
|
|
|
|
|
|
|
|
|
|
|
|
|
|
|
|
Net sales
|
|
$
|
40,597
|
|
|
|
100
|
%
|
|
$
|
44,564
|
|
|
|
100
|
%
|
|
$
|
44,048
|
|
|
|
100
|
%
|
|
|
|
|
|
|
|
|
|
|
|
|
|
|
|
|
|
|
|
|
|
|
|
|
|
|
|
|
|
|
(1) |
|
Includes such items as dry goods, beverages, dairy, frozen
foods, and candy |
| |
|
(2) |
|
Includes such items as meat, produce, deli and bakery |
| |
|
(3) |
|
Includes such items as household products,
over-the-counter
medication, beauty care, personal care, seasonal items and
tobacco |
67
Quarterly Financial Information
UNAUDITED
QUARTERLY FINANCIAL INFORMATION
(In millions, except per share data)
Unaudited quarterly financial information for SUPERVALU INC. and
subsidiaries is as follows:
| |
|
|
|
|
|
|
|
|
|
|
|
|
|
|
|
|
|
|
|
|
|
|
|
2010
|
|
|
|
|
First
|
|
|
Second
|
|
|
Third
|
|
|
Fourth
|
|
|
Fiscal Year
|
|
|
|
|
(16 wks)
|
|
|
(12 wks)
|
|
|
(12 wks)
|
|
|
(12 wks)
|
|
|
(52 wks)
|
|
|
|
|
Net sales
|
|
$
|
12,715
|
|
|
$
|
9,461
|
|
|
$
|
9,216
|
|
|
$
|
9,205
|
|
|
$
|
40,597
|
|
|
Gross profit
|
|
$
|
2,847
|
|
|
$
|
2,089
|
|
|
$
|
2,060
|
|
|
$
|
2,157
|
|
|
$
|
9,153
|
|
|
Net earnings
|
|
$
|
113(1
|
)
|
|
$
|
74
|
|
|
$
|
109(1
|
)
|
|
$
|
97
|
(1)
|
|
$
|
393
|
|
|
Net earnings per share—diluted
|
|
$
|
0.53
|
|
|
$
|
0.35
|
|
|
$
|
0.51
|
|
|
$
|
0.46
|
|
|
$
|
1.85
|
|
|
Dividends declared per share
|
|
$
|
0.1725
|
|
|
$
|
0.1750
|
|
|
$
|
0.1750
|
|
|
$
|
0.0875
|
|
|
$
|
0.6100
|
|
|
Weighted average shares—diluted
|
|
|
212
|
|
|
|
213
|
|
|
|
213
|
|
|
|
213
|
|
|
|
213
|
|
| |
|
|
|
|
|
|
|
|
|
|
|
|
|
|
|
|
|
|
|
|
|
|
|
2009
|
|
|
|
|
First
|
|
|
Second
|
|
|
Third
|
|
|
Fourth
|
|
|
Fiscal Year
|
|
|
|
|
(16 wks)
|
|
|
(12 wks)
|
|
|
(12 wks)
|
|
|
(13 wks)
|
|
|
(53 wks)
|
|
|
|
|
Net sales
|
|
$
|
13,347
|
|
|
$
|
10,226
|
|
|
$
|
10,171
|
|
|
$
|
10,820
|
|
|
$
|
44,564
|
|
|
Gross profit
|
|
$
|
3,065
|
|
|
$
|
2,289
|
|
|
$
|
2,280
|
|
|
$
|
2,479
|
|
|
$
|
10,113
|
|
|
Net earnings (loss)
|
|
$
|
162
|
|
|
$
|
128
|
|
|
$
|
(2,944
|
)(2)
|
|
$
|
(201
|
)(2)(3)
|
|
$
|
(2,855
|
)
|
|
Net earnings (loss) per
share—diluted(4)
|
|
$
|
0.76
|
|
|
$
|
0.60
|
|
|
$
|
(13.95
|
)(5)
|
|
$
|
(0.95
|
)(5)
|
|
$
|
(13.51
|
)
|
|
Dividends declared per share
|
|
$
|
0.1700
|
|
|
$
|
0.1725
|
|
|
$
|
0.1725
|
|
|
$
|
0.1725
|
|
|
$
|
0.6875
|
|
|
Weighted average shares—diluted
|
|
|
214
|
|
|
|
213
|
|
|
|
211
|
|
|
|
211
|
|
|
|
211
|
|
|
|
|
|
(1) |
|
During fiscal 2010 the Company recorded charges of $39, after
tax, related to the planned retail market exits, closure of
non-strategic stores announced in fiscal 2009 and fees received
from the early termination of a supply agreement of which $3,
after tax, were recorded in the first quarter of fiscal 2010,
$2, after tax, were recorded in the third quarter of fiscal 2010
and $34, after tax, were recorded in the fourth quarter of
fiscal 2010. |
| |
|
(2) |
|
During fiscal 2009 the Company recorded goodwill and intangible
asset impairment charges of $3,326, after tax, of which $3,076,
after tax, were recorded in the third quarter of fiscal 2009 and
$250, after tax, were recorded in the fourth quarter of fiscal
2009. |
| |
|
(3) |
|
During the fourth quarter of fiscal 2009 the Company recorded
charges primarily related to closure of non-strategic stores
announced in fiscal 2009 of $121, after tax, and a
pre-Acquisition Albertsons legal settlement of $15, after tax. |
| |
|
(4) |
|
The sum of the quarterly Net earnings (loss) per
share—diluted amounts does not equal the fiscal year amount
due to rounding. |
| |
|
(5) |
|
As a result of the net loss for the third and fourth quarters of
fiscal 2009 and fiscal year 2009, all potentially dilutive
shares were antidilutive and therefore excluded from the
calculation of Net earnings (loss) per share—diluted. |
68
Schedule Of Valuation And Qualifying Accounts Disclosure
| |
|
|
|
|
|
|
|
|
|
|
|
|
|
|
|
|
|
|
|
Balance at
|
|
|
|
|
|
|
|
|
Balance at
|
|
|
|
|
Beginning of
|
|
|
|
|
|
|
|
|
End of Fiscal
|
|
|
Description
|
|
Fiscal Year
|
|
|
Additions
|
|
|
Deductions
|
|
|
Year
|
|
|
|
|
Allowance for losses on receivables:
|
|
|
|
|
|
|
|
|
|
|
|
|
|
|
|
|
|
2010
|
|
$
|
15
|
|
|
|
6
|
|
|
|
(9
|
)
|
|
$
|
12
|
|
|
2009
|
|
|
20
|
|
|
|
15
|
|
|
|
(20
|
)
|
|
|
15
|
|
|
2008
|
|
|
28
|
|
|
|
13
|
|
|
|
(21
|
)
|
|
|
20
|
|
69
|
|
|
ITEM 9.
|
CHANGES
IN AND DISAGREEMENTS WITH ACCOUNTANTS ON ACCOUNTING AND
FINANCIAL DISCLOSURE
|
Not
applicable.
|
|
|
ITEM 9A.
|
CONTROLS
AND PROCEDURES
|
Disclosure
Controls and Procedures
The Company carried out an evaluation, under the supervision and
with the participation of the Company’s management,
including the Company’s Chief Executive Officer and its
Chief Financial Officer, of the effectiveness of the design and
operation of the Company’s disclosure controls and
procedures (as defined in
Rule 13a-15(e)
under the Exchange Act) as of February 27, 2010, the end of
the period covered by this Annual Report on
Form 10-K.
Based on this evaluation, the Chief Executive Officer and Chief
Financial Officer concluded that, as of February 27, 2010,
the Company’s disclosure controls and procedures are
effective to provide reasonable assurance that information
required to be disclosed by the Company in the reports that it
files or submits under the Exchange Act is (1) recorded,
processed, summarized and reported within the time periods
specified by the SEC’s rules and forms and
(2) accumulated and communicated to the Company’s
management, including the Company’s Chief Executive Officer
and Chief Financial Officer, in a manner that allows timely
decisions regarding required disclosure.
Management’s
Annual Report on Internal Control Over Financial
Reporting
The financial statements, financial analyses and all other
information included in this Annual Report on
Form 10-K
were prepared by the Company’s management, which is
responsible for establishing and maintaining adequate internal
control over financial reporting.
The Company’s internal control over financial reporting is
designed to provide reasonable assurance regarding the
reliability of financial reporting and the preparation of
financial statements for external purposes in accordance with
generally accepted accounting principles. The Company’s
internal control over financial reporting includes those
policies and procedures that:
|
|
|
| |
i.
|
pertain to the maintenance of records that, in reasonable
detail, accurately and fairly reflect the transactions and
dispositions of the assets of the Company;
|
| |
| |
ii.
|
provide reasonable assurance that transactions are recorded as
necessary to permit preparation of financial statements in
accordance with generally accepted accounting principles, and
that receipts and expenditures of the Company are being made
only in accordance with authorizations of management and
directors of the Company; and
|
| |
| |
iii.
|
provide reasonable assurance regarding prevention or timely
detection of unauthorized acquisition and use or disposition of
the Company’s assets that could have a material effect on
the financial statements.
|
There are inherent limitations in the effectiveness of any
internal control, including the possibility of human error and
the circumvention or overriding of controls. Accordingly, even
effective internal controls can provide only reasonable
assurances with respect to financial statement preparation.
Further, because of changes in conditions, the effectiveness of
internal controls may vary over time.
Management assessed the design and effectiveness of the
Company’s internal control over financial reporting as of
February 27, 2010. In making this assessment, management
used the criteria set forth by the Committee of Sponsoring
Organizations of the Treadway Commission in Internal
Control—Integrated Framework. Based on
management’s assessment using this framework, as of
February 27, 2010, the Company’s internal control over
financial reporting is effective.
70
The effectiveness of the Company’s internal control over
financial reporting as of February 27, 2010 has been
audited by KPMG LLP, the Company’s independent registered
public accounting firm. Their report, which is set forth in
Part II, Item 8 of this Annual Report on
Form 10-K,
expresses an unqualified opinion on the effectiveness of the
Company’s internal control over financial reporting as of
February 27, 2010.
Changes
in Internal Control Over Financial Reporting
During the fiscal quarter ended February 27, 2010, there
has been no change in the Company’s internal control over
financial reporting (as defined in
Rule 13a-15(f)
under the Exchange Act) that has materially affected, or is
reasonably likely to materially affect, the Company’s
internal control over financial reporting.
|
|
|
ITEM 9B.
|
OTHER
INFORMATION
|
None.
71
PART III
|
|
|
ITEM 10.
|
DIRECTORS,
EXECUTIVE OFFICERS AND CORPORATE GOVERNANCE
|
The information called for by Item 10, as to compliance
with Section 16(a) of the Exchange Act, is incorporated by
reference to the Company’s definitive Proxy Statement to be
filed with the SEC pursuant to Regulation 14A in connection
with the Company’s 2010 Annual Meeting of Stockholders
under the heading “Other
Information—Section 16(a) Beneficial Ownership
Reporting Compliance.” The information called for by
Item 10, as to the audit committee and the audit committee
financial expert, is incorporated by reference to the
Company’s definitive Proxy Statement to be filed with the
SEC pursuant to Regulation 14A in connection with the
Company’s 2010 Annual Meeting of Stockholders under the
heading “Meetings of the Board of Directors and Committees
of the Board—Audit Committee.” The information called
for by Item 10, as to executive officers, is set forth
under “Executive Officers of the Company” in
Part I, Item 1 of this Annual Report on
Form 10-K.
The information called for by Item 10, as to directors, is
incorporated by reference to the Company’s definitive Proxy
Statement to be filed with the SEC pursuant to
Regulation 14A in connection with the Company’s 2010
Annual Meeting of Stockholders under the headings “Election
of Directors (Item 1)” and “Board
Practices—Other Matters Relating to Directors.”
The Company has adopted a code of ethics that applies to its
principal executive officer, principal financial officer,
principal accounting officer or controller, or persons
performing similar functions, and all other employees and
non-employee directors of the Company. This code of ethics is
posted on the Company’s website (www.supervalu.com).
The Company intends to satisfy the disclosure requirement under
Item 5.05 of
Form 8-K
regarding an amendment to, or waiver from, a provision of the
code of ethics that applies to the Company’s principal
executive officer, principal financial officer, principal
accounting officer or controller, or persons performing similar
functions, by posting such information on the Company’s
website, at the address specified above.
The Company’s Corporate Governance Principles and charters
for each Committee of its Board of Directors are also available
on the Company’s website. The code of ethics, Corporate
Governance Principles and charters are also available in print
to any stockholder who submits a request to: Corporate
Secretary, SUPERVALU INC., P.O. Box 990, Minneapolis,
Minnesota 55440.
Information on the Company’s website is not deemed to be
incorporated by reference into this Annual Report on
Form 10-K.
|
|
|
ITEM 11.
|
EXECUTIVE
COMPENSATION
|
The information called for by Item 11 is incorporated by
reference to the Company’s definitive Proxy Statement to be
filed with the SEC pursuant to Regulation 14A in connection
with the Company’s 2010 Annual Meeting of Stockholders
under the headings “Director Compensation,”
“Compensation Discussion and Analysis,”
“Executive Compensation” and “Report of
Leadership Development and Compensation Committee.”
|
|
|
ITEM 12.
|
SECURITY
OWNERSHIP OF CERTAIN BENEFICIAL OWNERS AND MANAGEMENT AND
RELATED STOCKHOLDER MATTERS
|
The information called for by Item 12, as to security
ownership of certain beneficial owners, directors and
management, is incorporated by reference to the Company’s
definitive Proxy Statement to be filed with the SEC pursuant to
Regulation 14A in connection with the Company’s 2010
Annual Meeting of Stockholders under the headings “Security
Ownership of Certain Beneficial Owners” and “Security
Ownership of Management.”
72
The following table sets forth information as of
February 27, 2010 about the Company’s common stock
that may be issued under all of its equity compensation plans:
Equity
Compensation Plan Information
| |
|
|
|
|
|
|
|
|
|
|
|
|
|
|
|
|
|
|
|
|
|
Number of
|
|
|
|
|
|
|
|
Weighted
|
|
|
securities
|
|
|
|
|
Number of
|
|
|
average
|
|
|
remaining available
|
|
|
|
|
securities to be
|
|
|
exercise
|
|
|
for future issuance
|
|
|
|
|
issued upon
|
|
|
price of
|
|
|
under equity
|
|
|
|
|
exercise of
|
|
|
outstanding
|
|
|
compensation plans
|
|
|
|
|
outstanding
|
|
|
options,
|
|
|
(excluding
|
|
(shares not in millions)
|
|
options, warrants
|
|
|
warrants
|
|
|
securities reflected
|
|
|
Plan Category
|
|
and rights
|
|
|
and rights
|
|
|
in column (a))
|
|
|
|
|
(a)
|
|
|
(b)
|
|
|
(c)
|
|
|
|
|
Equity compensation plans approved by security
holders(1)
|
|
|
20,127,119(2
|
)(3)
|
|
$
|
31.98(2
|
)(3)(4)
|
|
|
22,921,668
|
(5)
|
|
Equity compensation plans not approved by security
holders(6)
|
|
|
2,070,112
|
|
|
$
|
28.78
|
|
|
|
—
|
|
|
|
|
|
|
|
|
|
|
|
|
|
|
|
|
Total
|
|
|
22,197,231
|
|
|
$
|
31.67
|
|
|
|
22,921,668
|
|
|
|
|
|
|
|
|
|
|
|
|
|
|
|
|
|
|
|
(1) |
|
Includes the Company’s 1993 Stock Plan, 2002 Stock Plan,
2007 Stock Plan, SUPERVALU/Richfood Stock Incentive Plan,
Albertson’s, Inc. Amended and Restated 1995 Stock-Based
Incentive Plan and Albertson’s, Inc. 2004 Equity and
Performance Incentive Plan. |
| |
|
(2) |
|
Includes options for 425,299 shares under the
Albertson’s, Inc. 2004 Equity and Performance Incentive
Plan at a weighted average exercise price of $28.87 per share
that were assumed in connection with the Acquisition. |
| |
|
(3) |
|
Includes options for 2,961,912 shares under the
Albertson’s, Inc. 1995 Stock-Based Incentive Plan at a
weighted average exercise price of $31.93 per share that were
assumed in connection with the Acquisition. |
| |
|
(4) |
|
Excludes 826,115 restricted stock units included in column
(a) which do not have an exercise price. Such units vest
and are payable in shares after the expiration of the time
periods set forth in their restricted stock unit agreements. |
| |
|
(5) |
|
In addition to grants of options, warrants or rights, includes
shares available for issuance in the form of restricted stock,
performance awards and other types of stock-based awards under
the Company’s 2007 Stock Plan. |
| |
|
(6) |
|
Includes the Company’s 1997 Stock Plan. |
1997 Stock Plan. The Board of Directors adopted the 1997
Stock Plan on April 9, 1997 to provide for the granting of
non-qualified stock options, restoration options, stock
appreciation rights, restricted stock, restricted stock units
and performance awards to key employees of the Company or any of
its subsidiaries. A total of 10,800,000 (not in millions) shares
were authorized for awards under the 1997 Stock Plan. The Board
of Directors amended this plan in each of August 18, 1998,
March 14, 2000 and April 10, 2002. The 1997 Stock Plan
expired on April 9, 2007 and, therefore, no further awards
may be granted under the 1997 Stock Plan. Stock options covering
a total of 2,070,112 (not in millions) shares remained
outstanding under the 1997 Stock Plan as of February 27,
2010. All employees, consultants or independent contractors
providing services to the Company, other than officers or
directors of the Company or any of its affiliates who are
subject to Section 16 of the Exchange Act, were eligible to
participate in the 1997 Stock Plan. The Board of Directors
administers the 1997 Stock Plan and has discretion to set the
terms of all awards made under the 1997 Stock Plan, except as
otherwise expressly provided in the 1997 Stock Plan. Options
granted under the 1997 Stock Plan may not have an exercise price
less than 100 percent of the fair market value of the
Company’s common stock on the
73
date of the grant. Unless the Board of Directors otherwise
specifies, restricted stock and restricted stock units will be
forfeited and reacquired by the Company if an employee is
terminated.
|
|
|
ITEM 13.
|
CERTAIN
RELATIONSHIPS AND RELATED TRANSACTIONS, AND DIRECTOR
INDEPENDENCE
|
The information called for by Item 13, as to director
independence, is incorporated by reference to the Company’s
definitive Proxy Statement to be filed with the SEC pursuant to
Regulation 14A in connection with the Company’s 2010
Annual Meeting of Stockholders under the heading “Board
Practices—Director Independence.” The information
called for by Item 13, as to related person transactions,
is incorporated by reference to the Company’s definitive
Proxy Statement to be filed with the SEC pursuant to
Regulation 14A in connection with the Company’s 2010
Annual Meeting of Stockholders under the heading “Board
Practices—Policy and Procedures Regarding Transactions with
Related Persons.”
|
|
|
ITEM 14.
|
PRINCIPAL
ACCOUNTING FEES AND SERVICES
|
The information called for by Item 14 is incorporated by
reference to the Company’s definitive Proxy Statement to be
filed with the SEC pursuant to Regulation 14A in connection
with the Company’s 2010 Annual Meeting of Stockholders
under the heading “Independent Registered Public
Accountants’ Fees.”
PART IV
|
|
|
ITEM 15.
|
EXHIBITS AND
FINANCIAL STATEMENT SCHEDULES
|
|
|
|
| |
(a)(1)
|
Financial Statements:
|
The consolidated financial statements to the Company listed in
the accompanying “Index of Financial Statements and
Schedules” together with the reports of KPMG LLP,
independent registered public accountants, are filed as part of
this Annual Report on
Form 10-K.
|
|
|
| |
(2)
|
Financial Statement Schedules:
|
The consolidated financial statement schedule to the Company
listed in the accompanying “Index of Financial Statements
and Schedules.”
|
|
|
| |
(2)
|
Plan of Acquisition, Reorganization, Arrangement, Liquidation or
Succession:
|
|
|
|
| |
2.1
|
Agreement and Plan of Merger, dated January 22, 2006, by
and among Albertson’s Inc., New Aloha Corporation (n/k/a
New Albertson’s, Inc.), New Diamond Sub, Inc., SUPERVALU
INC., and Emerald Acquisition Sub, Inc. is incorporated herein
by reference to Annex A of the Registration Statement on
Form S-4
(Registration
No. 333-132397-01)
of SUPERVALU INC. and New Albertson’s, Inc., filed on
April 28, 2006.
|
|
|
|
| |
(3)
|
Articles of Incorporation and Bylaws:
|
|
|
|
| |
3.1
|
Restated Certificate of Incorporation is incorporated herein by
reference to Exhibit (3)(i) to the Company’s Annual Report
on
Form 10-K
for the year ended February 28, 2004.
|
| |
| |
3.2
|
Restated Bylaws, as amended, is incorporated herein by reference
to Exhibit 3.1 to the Company’s Current Report on
Form 8-K
filed with the SEC on April 20, 2010.
|
74
|
|
|
| |
(4)
|
Instruments defining the rights of security holders, including
indentures:
|
|
|
|
| |
4.1
|
Indenture dated as of July 1, 1987, between the Company and
Bankers Trust Company, as Trustee, is incorporated herein
by reference to Exhibit 4.1 to the Company’s
Registration Statement on
Form S-3
(Registration
No. 33-52422).
|
| |
| |
4.2
|
First Supplemental Indenture dated as of August 1, 1990,
between the Company and Bankers Trust Company, as Trustee,
to Indenture dated as of July 1, 1987, between the Company
and Bankers Trust Company, as Trustee, is incorporated
herein by reference to Exhibit 4.2 to the Company’s
Registration Statement on
Form S-3
(Registration
No. 33-52422).
|
| |
| |
4.3
|
Second Supplemental Indenture dated as of October 1, 1992,
between the Company and Bankers Trust Company, as Trustee, to
Indenture dated as of July 1, 1987, between the Company and
Bankers Trust Company, as Trustee, is incorporated herein
by reference to Exhibit 4.1 to the Company’s Current
Report on
Form 8-K
dated November 13, 1992.
|
| |
| |
4.4
|
Third Supplemental Indenture dated as of September 1, 1995,
between the Company and Bankers Trust Company, as Trustee, to
Indenture dated as of July 1, 1987, between the Company and
Bankers Trust Company, as Trustee, is incorporated herein
by reference to Exhibit 4.1 to the Company’s Current
Report on
Form 8-K
filed with the SEC on October 2, 1995.
|
| |
| |
4.5
|
Fourth Supplemental Indenture dated as of August 4, 1999,
between the Company and Bankers Trust Company, as Trustee, to
Indenture dated as of July 1, 1987, between the Company and
Bankers Trust Company, as Trustee, is incorporated herein
by reference to Exhibit 4.2 to the Company’s Quarterly
Report on
Form 10-Q
for the quarterly period (16 weeks) ended
September 11, 1999.
|
| |
| |
4.6
|
Fifth Supplemental Indenture dated as of September 17,
1999, between the Company and Bankers Trust Company, as Trustee,
to Indenture dated as of July 1, 1987, between the Company
and Bankers Trust Company, as Trustee, is incorporated
herein by reference to Exhibit 4.3 to the Company’s
Quarterly Report on
Form 10-Q
for the quarterly period (16 weeks) ended
September 11, 1999.
|
| |
| |
4.7
|
Rights Agreement dated as of April 12, 2000, between the
Company and Wells Fargo Bank Minnesota, N.A. (formerly Norwest
Bank Minnesota, N.A.), as Rights Agent, including as
Exhibit B the forms of Rights Certificate and Election to
Exercise, is incorporated herein by reference to
Exhibit 4.1 to the Company’s Current Report on
Form 8-K
filed with the SEC on April 17, 2000.
|
| |
| |
4.8
|
Indenture dated as of November 2, 2001, between the Company
and The Chase Manhattan Bank, as Trustee, including form of
Liquid Yield
Optiontm
Note due 2031 (Zero Coupon — Senior), is incorporated
herein by reference to Exhibit 4.1 to the Company’s
Registration Statement on
Form S-3
(Registration
No. 333-81252)
filed with the SEC on January 23, 2002.
|
| |
| |
4.9
|
Credit Agreement, dated as of June 1, 2006, by and among
the Company, The Royal Bank of Scotland PLC, Bank of America,
Citibank, Rabobank International, Cobank, ACB, U.S. Bank
National Association, and various financial institutions and
other persons from time to time parties hereto is incorporated
herein by reference to Exhibit 4.1 to the Company’s
Current Report on
Form 8-K
filed with the SEC on June 7, 2006.
|
75
|
|
|
| |
4.10
|
First Amendment to Credit Agreement, dated March 8, 2007,
among SUPERVALU INC., The Royal Bank of Scotland PLC, as
Administrative Agent, and the Lenders, is incorporated herein by
reference to Exhibit 4.12 to the Company’s Annual
Report on
Form 10-K
for the year ended February 24, 2007.
|
| |
| |
4.11
|
Amended and Restated Credit Agreement, dated April 5, 2010,
by and among SUPERVALU INC., The Royal Bank of Scotland PLC,
Credit Suisse Securities (USA) LLC, CoBank, ACB, U.S. Bank
N.A., Rabobank International, RBS Securities Inc.,
Barclay’s Capital and various financial institutions and
other persons from time to time parties hereto, is incorporated
herein by reference to Exhibit 4.1 to the Company’s
Current Report on
Form 8-K
filed with the SEC on April 9, 2010.
|
| |
| |
4.12
|
Indenture dated as of May 1, 1992, between
Albertson’s, Inc. and Morgan Guaranty Trust Company of
New York, as Trustee, is incorporated herein by reference to
Exhibit 4.1 to the Registration Statement on
Form S-3
of Albertson’s, Inc. (Reg.
No. 333-41793)
filed with the SEC on December 9, 1997.
|
| |
| |
4.13
|
Supplemental Indenture No. 1, dated as of May 7, 2004,
between Albertson’s, Inc. and U.S. Bank
Trust National Association, as Trustee, is incorporated
herein by reference to Exhibit 4.14 to the Company’s
Annual Report on
Form 10-K
for the year ended February 24, 2007.
|
| |
| |
4.14
|
Supplemental Indenture No. 2 dated as of June 1, 2006,
between Albertson’s LLC, New Albertson’s, Inc. and
U.S. Bank Trust National Association, as Trustee, to
Indenture dated as of May 1, 1992, between
Albertson’s, Inc. and Morgan Guaranty Trust Company of
New York, as Trustee, is incorporated herein by reference to
Exhibit 4.9 to the Company’s Current Report on
Form 8-K
filed with the SEC on June 7, 2006.
|
| |
| |
4.15
|
Supplemental Indenture No. 3 dated as December 29,
2008, between NAI, Inc., New Albertson’s, Inc. and
U.S. Bank Trust National Association, as Trustee, to
Indenture dated as of May 1, 1992, between
Albertson’s, Inc. and Morgan Guaranty Trust Company of
New York, as Trustee, is incorporated herein by reference to
Exhibit 4.1 to the Company’s Quarterly Report on
Form 10-Q
for the quarter ended November 29, 2008.
|
Pursuant to Item 601(b)(4)(iii) of
Regulation S-K,
copies of certain instruments defining the rights of holders of
certain long-term debt to the Company and its subsidiaries are
not filed and, in lieu thereof, the Company agrees to furnish
copies thereof to the Securities and Exchange Commission upon
request.
|
|
|
| |
10.1
|
SUPERVALU INC. 2002 Stock Plan, as amended, is incorporated
herein by reference to Exhibit 10.1 to the Company’s
Annual Report on
Form 10-K
for the year ended February 24, 2007, is incorporated
herein by reference to Exhibit 10.2 to the Company’s Annual
Report on
Form 10-K
for the year ended February 24, 2007.*
|
| |
| |
10.2
|
Form of SUPERVALU INC. 2002 Stock Plan Stock Option Agreement
and Stock Option Terms and Conditions for Key Executives, as
amended on April 17, 2007, is incorporated herein by
reference to Exhibit 10.2 to the Company’s Annual
Report on
Form 10-K
for the year ended February 24, 2007.*
|
76
|
|
|
| |
10.3
|
Form of SUPERVALU INC. 2002 Stock Plan Stock Option Agreement
and Stock Option Terms and Conditions for Key Executives, as
amended, is incorporated herein by reference to
Exhibit 10.31 to the Company’s Annual Report on Form
10-K for the
year ended February 25, 2006.*
|
| |
| |
10.4
|
Form of SUPERVALU INC. 2002 Stock Plan Restoration Stock Option
Agreement and Restoration Stock Option Terms and Conditions for
Key Executives, as amended, is incorporated herein by reference
to Exhibit 10.32 to the Company’s Annual Report on
Form 10-K
for the year ended February 25, 2006.*
|
| |
| |
10.5
|
Form of SUPERVALU INC. 2002 Stock Plan Stock Option Agreement
for Non-Employee Directors and Stock Option Terms and Conditions
for Non-Employee Directors is incorporated herein by reference
to Exhibit 10.3 to the Company’s Quarterly Report on
Form 10-Q
for the quarterly period (12 weeks) ended
September 11, 2004.*
|
| |
| |
10.6
|
Form of SUPERVALU INC. 2002 Stock Plan Restoration Stock Option
Agreement for Non-Employee Directors and Restoration Stock
Option Terms and Conditions for Non-Employee Directors is
incorporated herein by reference to Exhibit 10.4 to the
Company’s Quarterly Report on
Form 10-Q
for the quarterly period (12 weeks) ended
September 11, 2004.*
|
| |
| |
10.7
|
Form of SUPERVALU INC. 2002 Stock Plan Supplemental
Non-Qualified Stock Option Agreement for Non-Employee Directors
and Terms and Conditions for Supplemental Stock Options for
Non-Employee Directors is incorporated herein by reference to
Exhibit 10.5 to the Company’s Quarterly Report on
Form 10-Q
for the quarterly period (12 weeks) ended
September 11, 2004.*
|
| |
| |
10.8
|
Form of SUPERVALU INC. 2002 Stock Plan Restricted Stock Award
Certificate and Restricted Stock Award Terms and Conditions, as
amended, is incorporated herein by reference to
Exhibit 10.37 to the Company’s Annual Report on Form
10-K for the
year ended February 25, 2006.*
|
|
|
|
| |
10.9
|
SUPERVALU INC. 2002 Stock Plan Restricted Stock Unit Award
Agreement dated as of October 12, 2006 for Jeffrey Noddle
is incorporated herein by reference to Exhibit 99.1 to the
Company’s Current Report on
Form 8-K
filed with the SEC on October 13, 2006.*
|
|
|
|
| |
10.10
|
Intentionally omitted.
|
| |
| |
10.11
|
Intentionally omitted.
|
| |
| |
10.12
|
Intentionally omitted.
|
| |
| |
10.13
|
SUPERVALU INC. 1997 Stock Plan, as amended, is incorporated
herein by reference to Exhibit 10.13 to the Company’s
Annual Report on
Form 10-K
for the year ended February 24, 2007.*
|
| |
| |
10.14
|
SUPERVALU INC. 1993 Stock Plan, as amended, is incorporated
herein by reference to Exhibit 10.14 to the Company’s
Annual Report on
Form 10-K
for the year ended February 24, 2007.*
|
| |
| |
10.15
|
SUPERVALU INC. 1993 Stock Plan Restricted Stock Unit Award
Agreement for Jeffrey Noddle is incorporated herein by reference
to Exhibit 10.27 to the Company’s Annual Report on
Form 10-K
for the year ended February 22, 2003.*
|
77
|
|
|
| |
10.16
|
SUPERVALU INC. 1993 Stock Plan Restricted Stock Unit Award
Agreement for David L. Boehnen, as amended, is incorporated
herein by reference to Exhibit 10.25 to the Company’s
Annual Report on
Form 10-K
for the year ended February 28, 2004.*
|
| |
| |
10.17
|
SUPERVALU INC. 1993 Stock Plan Restricted Stock Unit Award
Agreement for Pamela K. Knous, as amended, is incorporated
herein by reference to Exhibit 10.26 to the Company’s
Annual Report on
Form 10-K
for the year ended February 28, 2004.*
|
| |
| |
10.18
|
SUPERVALU/Richfood Stock Incentive Plan, as amended, is
incorporated herein by reference to Exhibit 10.18 to the
Company’s Annual Report on
Form 10-K
for the year ended February 24, 2007.*
|
| |
| |
10.19
|
SUPERVALU INC. Executive Incentive Bonus Plan is incorporated
herein by reference to Exhibit (10) c. to the
Company’s Annual Report on
Form 10-K
for the year ended February 22, 1997.*
|
| |
| |
10.20
|
SUPERVALU INC. Annual Cash Bonus Plan for Designated Corporate
Officers, as amended, is incorporated herein by reference to
Exhibit 10.20 to the Company’s Annual Report on
Form 10-K
for the year ended February 24, 2001.*
|
| |
| |
10.21
|
Performance Criteria for Awards Under the Company’s Annual
Cash Bonus Plan for Designated Corporate Officers and the
Executive Incentive Bonus Plan is incorporated herein by
reference to Exhibit 10.1 to the Company’s Quarterly
Report on
Form 10-Q
for the quarterly period (12 weeks) ended December 4,
2004.*
|
| |
| |
10.22
|
Albertson’s, Inc. 2004 Equity and Performance Incentive
Plan, as amended, is incorporated herein by reference to
Exhibit 10.28 to the Company’s Annual Report on Form
10-K for the
year ended February 24, 2007.*
|
| |
| |
10.23
|
Form of Albertson’s, Inc. 2004 Equity and Performance
Incentive Plan Stock Option Agreement and Stock Option Terms and
Conditions for Employees, is incorporated herein by reference to
Exhibit 10.29 to the Company’s Annual Report on
Form 10-K
for the year ended February 24, 2007.*
|
| |
| |
10.24
|
Form of Albertson’s, Inc. 2004 Equity and Performance
Incentive Plan Award of Deferred Restricted Stock Units is
incorporated herein by reference to Exhibit 10.58 to the
Current Report on
Form 8-K
of Albertson’s, Inc. (Commission File Number 1-6187) filed
with the SEC on December 20, 2004.*
|
| |
| |
10.25
|
Form of Albertson’s, Inc. 2004 Equity and Performance
Incentive Plan Non-Employee Director Deferred Share Units
Agreement is incorporated herein by reference to
Exhibit 10.58 to the Quarterly Report on
Form 10-Q
of Albertson’s, Inc. (Commission File Number 1-6187) for
the quarter ended May 5, 2005.*
|
| |
| |
10.26
|
Form of Albertson’s, Inc. 2004 Equity and Performance
Incentive Plan Award of Deferrable Restricted Stock Units is
incorporated herein by reference to Exhibit 10.60 to the
Quarterly Report on
Form 10-Q
of Albertson’s, Inc. (Commission File Number 1-6187) for
the quarter ended May 5, 2005.*
|
| |
| |
10.27
|
Form of Albertson’s, Inc. 2004 Equity and Performance
Incentive Plan Non-Qualified Stock Option Award Agreement is
incorporated herein by reference to Exhibit 10.61 to the
Quarterly Report on
Form 10-Q
of Albertson’s, Inc. (Commission File Number 1-6187) for
the quarter ended August 4, 2005.*
|
78
|
|
|
| |
10.28
|
Form of Albertson’s, Inc. 2004 Equity and Performance
Incentive Plan Award of Deferrable Restricted Stock Units is
incorporated herein by reference to Exhibit 10.62 to the
Current Report on
Form 8-K
of Albertson’s, Inc. (Commission File Number 1-6187) filed
with the SEC on January 31, 2006.*
|
| |
| |
10.29
|
Albertson’s Inc. 1995 Stock-Based Incentive Plan, as
amended, is incorporated herein by reference to
Exhibit 10.36 to the Company’s Annual Report on
Form 10-K
for the year ended February 24, 2007.*
|
| |
| |
10.30
|
Form of Albertson’s, Inc. 1995 Stock-Based Incentive Plan
Stock Option Agreement is incorporated herein by reference to
Exhibit 10.24.1 to the Annual Report on
Form 10-K
of Albertson’s, Inc. (Commission File Number 1-6187) for
the year ended February 1, 1996.*
|
| |
| |
10.31
|
Form of Albertson’s, Inc. Amended and Restated 1995
Stock-Based Incentive Plan Award of Stock Option is incorporated
herein by reference to Exhibit 10.46.1 to the Quarterly
Report on
Form 10-Q
of Albertson’s, Inc. (Commission File Number 1-6187) for
the quarter ended October 31, 2002.*
|
| |
| |
10.32
|
Form of Albertson’s, Inc. Amended and Restated 1995
Stock-Based Incentive Plan Award of Deferred Stock Units is
incorporated herein by reference to Exhibit 10.46.2 to the
Quarterly Report on
Form 10-Q
of Albertson’s, Inc. (Commission File Number 1-6187) for
the quarter ended October 31, 2002.*
|
| |
| |
10.33
|
Form of Albertson’s, Inc. Amended and Restated 1995
Stock-Based Plan Award of Deferred Restricted Stock Units is
incorporated herein by reference to Exhibit 10.57 to the
Current Report on
Form 8-K
of Albertson’s, Inc. (Commission File Number 1-6187) filed
with the SEC on December 20, 2004.*
|
| |
| |
10.34
|
Form of Albertson’s, Inc. Amended and Restated 1995
Stock-Based Incentive Plan Award of Deferrable Restricted Stock
Units is incorporated herein by reference to Exhibit 10.59
to the Current Report on
Form 8-K
of Albertson’s, Inc. (Commission File Number 1-6187) filed
with the SEC on December 20, 2004.*
|
| |
| |
10.35
|
SUPERVALU INC. Deferred Compensation Plan for Non-Employee
Directors, as amended, is incorporated herein by reference to
Exhibit 10.11 to the Company’s Annual Report on
Form 10-K
for the year ended February 22, 2003.*
|
| |
| |
10.36
|
SUPERVALU INC. Excess Benefit Plan Restatement, as amended, is
incorporated herein by reference to Exhibit 10.12 to the
Company’s Annual Report on
Form 10-K
for the year ended February 22, 2003.*
|
| |
| |
10.37
|
Third Amendment of SUPERVALU INC. Excess Benefits Plan
Restatement is incorporated herein by reference to
Exhibit 10.37 to the Company’s Annual Report on Form
10-K for the
year ended February 28, 2009.*
|
| |
| |
10.38
|
SUPERVALU INC. Executive Deferred Compensation Plan, as amended,
is incorporated herein by reference to Exhibit 10.14 to the
Company’s Annual Report on
Form 10-K
for the year ended February 22, 2003.*
|
| |
| |
10.39
|
SUPERVALU INC. Executive Deferred Compensation Plan II, as
amended, is incorporated herein by reference to
Exhibit 10.15 to the Company’s Annual Report on Form
10-K for the
year ended February 22, 2003.*
|
| |
| |
10.40
|
Form of Agreement used in connection with the Company’s
Executive Post Retirement Survivor Benefit Program is
incorporated herein by reference to
|
79
|
|
|
| |
|
Exhibit (10)I. to the Company’s Quarterly Report on
Form 10-Q
for the quarterly period (12 weeks) ended
September 12, 1998.*
|
|
|
|
| |
10.41
|
Form of Change of Control Severance Agreements entered into with
certain officers to the Company, as amended, incorporated herein
by reference to Exhibit 10.2 to the Company’s
Quarterly Report on
Form 10-Q
for the quarterly period (12 weeks) ended December 2,
2006.*
|
| |
| |
10.42
|
SUPERVALU INC. Directors Retirement Program, as amended, is
incorporated herein by reference to Exhibit 10.18 to the
Company’s Annual Report on
Form 10-K
for the year ended February 22, 2003.*
|
| |
| |
10.43
|
SUPERVALU INC. Non-Qualified Supplemental Executive Retirement
Plan is incorporated herein by reference to Exhibit (10) r.
to the Company’s Annual Report on
Form 10-K
for the year ended February 24, 1990.*
|
| |
| |
10.44
|
First Amendment to SUPERVALU INC. Non-Qualified Supplemental
Executive Retirement Plan is incorporated herein by reference to
Exhibit (10)a. to the Company’s Quarterly Report on
Form 10-Q
for the quarterly period (12 weeks) ended September 7,
1996.*
|
| |
| |
10.45
|
Second Amendment to SUPERVALU INC. Non-Qualified Supplemental
Executive Retirement Plan is incorporated herein by reference to
Exhibit (10)r. to the Company’s Annual Report on
Form 10-K
for the year ended February 28, 1998.*
|
| |
| |
10.46
|
Third Amendment to SUPERVALU INC. Non-Qualified Supplemental
Executive Retirement Plan is incorporated herein by reference to
Exhibit (10)h. to the Company’s Quarterly Report on
Form 10-Q
for the quarterly period (12 weeks) ended
September 12, 1998.*
|
| |
| |
10.47
|
Fourth Amendment to SUPERVALU INC. Non-Qualified Supplement
Executive Retirement Plan is incorporated herein by reference to
Exhibit 10.23 to the Company’s Annual Report on
Form 10-K
for the year ended February 22, 2003.*
|
| |
| |
10.48
|
Sixth Amendment to SUPERVALU INC. Non-Qualified Supplement
Executive Retirement Plan, is incorporated herein by reference
to Exhibit 10.48 to the Company’s Annual Report on
Form 10-K
for the year ended February 28, 2009.*
|
| |
| |
10.49
|
SUPERVALU INC. Non-Employee Directors Deferred Stock Plan, as
amended, is incorporated herein by reference to
Exhibit 10.24 to the Company’s Annual Report on
Form 10-K
for the year ended February 22, 2003.*
|
| |
| |
10.50
|
Amended and Restated SUPERVALU INC. Grantor Trust dated as of
May 1, 2002 is incorporated herein by reference to
Exhibit 10.3 to the Company’s Quarterly Report on
Form 10-Q
for the quarterly period (16 weeks) ended June 15,
2002.*
|
| |
| |
10.51
|
Annual discretionary CEO Bonus Pool is incorporated herein by
reference to Exhibit 10.40 to the Company’s Annual
Report on
Form 10-K
for the year ended February 25, 2006.*
|
| |
| |
10.52
|
Intentionally omitted.
|
| |
| |
10.53
|
Letter Agreement, including Appendix A thereto, dated as of
August 11, 2006, between the Company and Pete Van Helden is
incorporated herein by reference to Exhibit 99.2 to the
Company’s Current Report on
Form 8-K
filed with the SEC on August 15, 2006. *
|
80
|
|
|
| |
10.54
|
Intentionally omitted.
|
| |
| |
10.55
|
Lead Director annual retainer is incorporated herein by
reference to the Company’s Current Report on
Form 8-K
filed with the SEC on September 27, 2006.*
|
| |
| |
10.56
|
Albertson’s, Inc. 2000 Deferred Compensation Plan, dated as
of January 1, 2000, is incorporated herein by reference to
Exhibit 10.10 to the Annual Report on
Form 10-K
of Albertson’s, Inc. (Commission File Number 1-6187) for
the year ended February 3, 2000.*
|
| |
| |
10.57
|
First Amendment to the Albertson’s, Inc. 2000 Deferred
Compensation Plan, dated as of May 25, 2001, is
incorporated herein by reference to Exhibit 10.10.1 to the
Annual Report on
Form 10-K
of Albertson’s, Inc. (Commission File Number 1-6187) for
the year ended January 30, 2003.*
|
| |
| |
10.58
|
Second Amendment to the Albertson’s, Inc. 2000 Deferred
Compensation Plan, dated as of July 18, 2001, is
incorporated herein by reference to Exhibit 10.10.2 to the
Annual Report on
Form 10-K
of Albertson’s, Inc. (Commission File Number 1-6187) for
the year ended January 30, 2003.*
|
| |
| |
10.59
|
Third Amendment to the Albertson’s, Inc. 2000 Deferred
Compensation Plan, dated as of December 31, 2001, is
incorporated herein by reference to Exhibit 10.10.3 to the
Annual Report on
Form 10-K
of Albertson’s, Inc. (Commission File Number 1-6187) for
the year ended January 30, 2003.*
|
| |
| |
10.60
|
Fourth Amendment to the Albertson’s, Inc. 2000 Deferred
Compensation Plan, dated as of December 22, 2003, is
incorporated herein by reference to Exhibit 10.10.4 to the
Annual Report on
Form 10-K
of Albertson’s, Inc. (Commission File Number 1-6187) for
the year ended January 29, 2004.*
|
| |
| |
10.61
|
Sixth Amendment to the Albertson’s, Inc. 2000 Deferred
Compensation Plan, dated as of April 28, 2006, is
incorporated herein by reference to Exhibit 10.10.5 to the
Quarterly Report on
Form 10-Q
of Albertson’s, Inc. (Commission File Number 1-6187) for
the quarter ended May 4, 2006.*
|
| |
| |
10.62
|
Albertson’s, Inc. Executive Pension Makeup Plan, amended
and restated as of February 1, 1989, is incorporated herein
by reference to Exhibit 10.13 to the Annual Report on
Form 10-K
of Albertson’s, Inc. (Commission File Number 1-6187) for
the year ended February 2, 1989.*
|
| |
| |
10.63
|
First Amendment to the Albertson’s, Inc. Executive Pension
Makeup Plan, dated as of June 8, 1989, is incorporated
herein by reference to Exhibit 10.13.1 to the Quarterly
Report on
Form 10-Q
of Albertson’s, Inc. (Commission File Number 1-6187) for
the quarter ended May 4, 1989.*
|
| |
| |
10.64
|
Second Amendment to the Albertson’s, Inc. Executive Pension
Makeup Plan, dated as of January 12, 1990, is incorporated
herein by reference to Exhibit 10.13.2 to the Annual Report
on
Form 10-K
of Albertson’s, Inc. (Commission File Number 1-6187) for
the year ended February 1, 1990.*
|
| |
| |
10.65
|
Third Amendment to the Albertson’s, Inc. Executive Pension
Makeup Plan, dated as of January 31, 1990, is incorporated
herein by reference to Exhibit 10.13.3 to the Quarterly
Report on
Form 10-Q
of Albertson’s, Inc. (Commission File Number 1-6187) for
the quarter ended August 2, 1990.*
|
81
|
|
|
| |
10.66
|
Fourth Amendment to the Albertson’s, Inc. Executive Pension
Makeup Plan, effective as of January 1, 1995, is
incorporated herein by reference to Exhibit 10.13.4 to the
Annual Report on
Form 10-K
of Albertson’s, Inc. (Commission File Number 1-6187) for
the year ended February 2, 1995.*
|
| |
| |
10.67
|
Amendment to the Albertson’s, Inc. Executive Pension Makeup
Plan, retroactive to January 1, 1990, is incorporated
herein by reference to Exhibit 10.13.5 to the Annual Report
on
Form 10-K
of Albertson’s, Inc. (Commission File Number 1-6187) for
the year ended February 1, 1996.*
|
| |
| |
10.68
|
Amendment to the Albertson’s, Inc. Executive Pension Makeup
Plan, retroactive to October 1, 1999, is incorporated
herein by reference to Exhibit 10.13.6 to the Annual Report
on
Form 10-K
of Albertson’s, Inc. (Commission File Number 1-6187) for
the year ended February 3, 2000.*
|
| |
| |
10.69
|
Amendment to the Albertson’s, Inc. Executive Pension Makeup
Plan, dated as of June 1, 2001, is incorporated herein by
reference to Exhibit 10.13.7 to the Annual Report on
Form 10-K
of Albertson’s, Inc. (Commission File Number 1-6187) for
the year ended January 30, 2003.*
|
| |
| |
10.70
|
Second Amendment to the Albertson’s, Inc. Executive Pension
Makeup Plan, dated as of April 28, 2006, is incorporated
herein by reference to Exhibit 10.13.8 to the Quarterly
Report on
Form 10-Q
of Albertson’s, Inc. (Commission File Number 1-6187) for
the quarter ended May 4, 2006.*
|
| |
| |
10.71
|
Third Amendment to the Albertson’s, Inc. Executive Pension
Makeup Plan, dated as of April 28, 2006, is incorporated
herein by reference to Exhibit 10.13.9 to the Quarterly
Report on
Form 10-Q
of Albertson’s, Inc. (Commission File Number 1-6187) for
the quarter ended May 4, 2006.*
|
| |
| |
10.72
|
Third Amendment to the Albertson’s, Inc. Executive Pension
Makeup Plan, effective as of January 1, 2008, is
incorporated herein by reference to Exhibit 10.72 to the
Company’s Annual Report on
Form 10-K
for the year ended February 28, 2009.*
|
| |
| |
10.73
|
Albertson’s, Inc. Executive ASRE Makeup Plan, dated as of
September 26, 1999, is incorporated herein by reference to
Exhibit 10.14 to the Annual Report on Form
10-K of
Albertson’s, Inc. (Commission File Number 1-6187) for the
year ended February 3, 2000.*
|
| |
| |
10.74
|
First Amendment to the Albertson’s, Inc. Executive ASRE
Makeup Plan, dated as of May 25, 2001, is incorporated
herein by reference to Exhibit 10.14.1 to the Annual Report
on
Form 10-K
of Albertson’s, Inc. (Commission File Number 1-6187) for
the year ended January 30, 2003.*
|
| |
| |
10.75
|
Second Amendment to the Albertson’s, Inc. Executive ASRE
Makeup Plan, dated as of December 31, 2001, is incorporated
herein by reference to Exhibit 10.14.2 to the Annual Report
on
Form 10-K
of Albertson’s, Inc. (Commission File Number 1-6187) for
the year ended January 30, 2003.*
|
| |
| |
10.76
|
Fourth Amendment to the Albertson’s Inc. Executive ASRE
Makeup Plan, dated as of April 28, 2006, is incorporated
herein by reference to Exhibit 10.14.3 to the Quarterly
Report on
Form 10-Q
of Albertson’s, Inc. (Commission File Number 1-6187) for
the quarter ended May 4, 2006.*
|
| |
| |
10.77
|
Albertson’s, Inc. Executive Pension Makeup Trust, dated as
of February 1, 1989, is incorporated herein by reference to
Exhibit 10.18 to the Annual Report on
|
82
|
|
|
| |
|
Form 10-K
of Albertson’s, Inc. (Commission File Number 1-6187) for
the year ended February 2, 1989.*
|
|
|
|
| |
10.78
|
Amendment to the Albertson’s, Inc. Executive Pension Makeup
Trust, dated as of July 24, 1998, is incorporated herein by
reference to Exhibit 10.18.1 to the Annual Report on
Form 10-K
of Albertson’s, Inc. (Commission File Number 1-6187) for
the year ended February 3, 2000.*
|
| |
| |
10.79
|
Amendment to the Albertson’s, Inc. Executive Pension Makeup
Trust, dated as of December 1, 1998, is incorporated herein
by reference to Exhibit 10.18.1 to the Quarterly Report on
Form 10-Q
of Albertson’s, Inc. (Commission File Number 1-6187) for
the quarter ended October 29, 1998.*
|
| |
| |
10.80
|
Amendment to the Albertson’s, Inc. Executive Pension Makeup
Trust, dated as of December 1, 1999, is incorporated herein
by reference to Exhibit 10.18.3 to the Annual Report on
Form 10-K
of Albertson’s, Inc. (Commission File Number 1-6187) for
the year ended February 3, 2000.*
|
| |
| |
10.81
|
Amendment to the Albertson’s, Inc. Executive Pension Makeup
Trust, dated as of March 31, 2000, is incorporated herein
by reference to Exhibit 10.18.4 to the Annual Report on
Form 10-K
of Albertson’s, Inc. (Commission File Number 1-6187) for
the year ended February 1, 2001.*
|
| |
| |
10.82
|
Albertson’s, Inc. 1990 Deferred Compensation Plan is
incorporated herein by reference to Exhibit 10.20 to the Annual
Report on
Form 10-K
of Albertson’s, Inc. (Commission File Number 1-6187) for
the year ended January 31, 1991.*
|
| |
| |
10.83
|
Amendment to the Albertson’s, Inc. 1990 Deferred
Compensation Plan, dated as of April 12, 1994, is
incorporated herein by reference to Exhibit 10.20.1 to the
Quarterly Report on
Form 10-Q
of Albertson’s, Inc. (Commission File Number 1-6187) for
the quarter ended August 4, 1994.*
|
| |
| |
10.84
|
Amendment to the Albertson’s, Inc. 1990 Deferred
Compensation Plan, dated as of November 5, 1997, is
incorporated herein by reference to Exhibit 10.20.2 to the
Annual Report on
Form 10-K
of Albertson’s, Inc. (Commission File Number 1-6187) for
the year ended January 29, 1998.*
|
| |
| |
10.85
|
Amendment to the Albertson’s, Inc. 1990 Deferred
Compensation Plan, dated as of November 1, 1998, is
incorporated herein by reference to Exhibit 10.20.3 to the
Quarterly Report on Form
10-Q of
Albertson’s, Inc. (Commission File Number 1-6187) for the
quarter ended October 29, 1998.*
|
| |
| |
10.86
|
Termination of the Albertson’s, Inc. 1990 Deferred
Compensation Plan, dated as of December 31, 1999, is
incorporated herein by reference to Exhibit 10.20.4 to the
Annual Report on
Form 10-K
of Albertson’s, Inc. (Commission File Number 1-6187) for
the year ended January 30, 2003.*
|
| |
| |
10.87
|
Amendment to the Albertson’s, Inc. 1990 Deferred
Compensation Plan, dated as of May 1, 2001, is incorporated
herein by reference to Exhibit 10.20.5 to the Annual Report
on
Form 10-K
of Albertson’s, Inc. (Commission File Number 1-6187) for
the year ended January 30,2003.*
|
| |
| |
10.88
|
Amendment to the Albertson’s, Inc. 1990 Deferred
Compensation Plan, effective as of May 1, 2001, is
incorporated herein by reference to Exhibit 10.20.6 of
Annual Report on
Form 10-K
of Albertson’s, Inc. (Commission File Number 1-6187) for
the year ended January 30, 2003.*
|
83
|
|
|
| |
10.89
|
Amendment to the Albertson’s, Inc. 1990 Deferred
Compensation Plan, dated as of April 28, 2006, is
incorporated herein by reference to Exhibit 10.20.7 to the
Quarterly Report on
Form 10-Q
of Albertson’s, Inc. (Commission File Number 1-6187) for
the quarter ended May 4, 2006.*
|
| |
| |
10.90
|
Albertson’s, Inc. Non-Employee Directors’ Deferred
Compensation Plan is incorporated herein by reference to
Exhibit 10.21 to the Annual Report on
Form 10-K
of Albertson’s, Inc. (Commission File Number 1-6187) for
the year ended January 31, 1991.*
|
| |
| |
10.91
|
Amendment to the Albertson’s, Inc. Non-Employee
Directors’ Deferred Compensation Plan, dated as of
December 15, 1998, is incorporated herein by reference to
Exhibit 10.21.1 to the Annual Report on
Form 10-K
of Albertson’s, Inc. (Commission File Number 1-6187) for
the year ended February 3, 2000.*
|
| |
| |
10.92
|
Amendment to the Albertson’s, Inc. Non-Employee
Directors’ Deferred Compensation Plan, dated as of
March 15, 2001, is incorporated herein by reference to
Exhibit 10.21.2 to the Annual Report on
Form 10-K
of Albertson’s, Inc. (Commission File Number 1-6187) for
the year ended February 1, 2001.*
|
| |
| |
10.93
|
Amendment to the Albertson’s, Inc. Non-Employee
Directors’ Deferred Compensation Plan, dated as of
May 1, 2001, is incorporated herein by reference to Exhibit
10.21.3 to the Annual Report on
Form 10-K
of Albertson’s, Inc. (Commission File Number 1-6187) for
the year ended January 30, 2003.*
|
| |
| |
10.94
|
Amendment to the Albertson’s, Inc. Non-Employee
Directors’ Deferred Compensation Plan, dated as of
December 22, 2003, is incorporated herein by reference to
Exhibit 10.21.4 to the Annual Report on
Form 10-K
of Albertson’s, Inc. (Commission File Number 1-6187) for
the year ended January 29, 2004.*
|
| |
| |
10.95
|
Fifth Amendment to the Albertson’s, Inc. Non-Employees
Directors’ Deferred Compensation Plan, dated as of
April 28, 2006, is incorporated herein by reference to
Exhibit 10.21.5 to the Quarterly Report on
Form 10-Q
of Albertson’s, Inc. (Commission File Number 1-6187) for
the quarter ended May 4, 2006.*
|
| |
| |
10.96
|
Albertson’s, Inc. 1990 Deferred Compensation Trust, dated
as of November 20, 1990, is incorporated herein by
reference to Exhibit 10.22 to the Annual Report on Form
10-K of
Albertson’s, Inc. (Commission File Number 1-6187) for the
year ended January 31, 1991.*
|
| |
| |
10.97
|
Amendment to the Albertson’s, Inc. 1990 Deferred
Compensation Trust, dated as of July 24, 1998, is
incorporated herein by reference to Exhibit 10.22.1 to the
Annual Report on
Form 10-K
of Albertson’s, Inc. (Commission File Number 1-6187) for
the year ended February 3, 2000.*
|
| |
| |
10.98
|
Amendment to the Albertson’s, Inc. 1990 Deferred
Compensation Trust, dated as of December 1, 1998, is
incorporated herein by reference to Exhibit 10.22.1 of
Quarterly Report on
Form 10-Q
of Albertson’s, Inc. (Commission File Number 1-6187) for
the quarter ended October 29, 1998.*
|
| |
| |
10.99
|
Amendment to the Albertson’s, Inc. 1990 Deferred
Compensation Trust, dated as of December 1, 1999, is
incorporated herein by reference to Exhibit 10.22.3 to the
Annual Report on
Form 10-K
of Albertson’s, Inc. (Commission File Number 1-6187) for
the year ended February 3, 2000.*
|
84
|
|
|
| |
10.100
|
Amendment to the Albertson’s, Inc. 1990 Deferred
Compensation Trust, dated as of March 31, 2000, is
incorporated herein by reference to Exhibit 10.22.4 to the
Annual Report on
Form 10-K
of Albertson’s, Inc. (Commission File Number 1-6187) for
the year ended February 1, 2001.*
|
| |
| |
10.101
|
Albertson’s, Inc. 2000 Deferred Compensation Trust, dated
as of January 1, 2000, is incorporated herein by reference
to Exhibit 10.23 to the Annual Report on
Form 10-K
of Albertson’s, Inc. (Commission File Number 1-6187) for
the year ended February 3, 2000.*
|
| |
| |
10.102
|
Amendment to the Albertson’s, Inc. 2000 Deferred
Compensation Trust, dated as of March 31, 2000, is
incorporated herein by reference to Exhibit 10.23.1 to the
Annual Report on
Form 10-K
of Albertson’s, Inc. (Commission File Number 1-6187) for
the year ended February 1, 2001.*
|
| |
| |
10.103
|
American Stores Company Supplemental Executive Retirement Plan
1998 Restatement is incorporated herein by reference to Exhibit
4.1 of the Registration Statement on
Form S-8
of American Stores Company (Commission File Number 1-5392) filed
with the SEC on July 13, 1998.*
|
| |
| |
10.104
|
Amendment to the American Stores Company Supplemental Executive
Retirement Plan 1998 Restatement, dated as of September 15,
1998, is incorporated herein by reference to Exhibit 10.4
to the Quarterly Report on
Form 10-Q
of American Stores Company (Commission File Number 1-5392) filed
with the SEC on December 11, 1998.*
|
| |
| |
10.105
|
Sixth Amendment to the American Stores Company Supplemental
Executive Retirement Plan, dated as of April 28, 2006, is
incorporated herein by reference to Exhibit 10.30.2 to the
Quarterly Report on
Form 10-Q
of Albertson’s, Inc. (Commission File Number 1-6187) for
the quarter ended May 4, 2006.*
|
| |
| |
10.106
|
Albertsons Inc. Change in Control Severance Benefit Trust, dated
as of August 1, 2004, by and between Albertson’s, Inc.
and Atlantic Trust Company, N.A. is incorporated herein by
reference to Exhibit 10.62 to the Quarterly Report on
Form 10-Q
of Albertson’s, Inc. (Commission File Number 1-6187) for
the quarter ended November 3, 2005.*
|
| |
| |
10.107
|
SUPERVALU INC. 2007 Stock Plan, as amended, is incorporated
herein by reference to Exhibit 10.1 to the Company’s
Current Report on
Form 8-K
filed with the SEC on May 31, 2007. *
|
| |
| |
10.108
|
SUPERVALU INC. 2007 Stock Plan Form of Stock Appreciation Rights
Agreement is incorporated herein by reference to
Exhibit 10.1 to the Company’s Current Report on
Form 8-K
filed with the SEC on July 20, 2007.*
|
| |
| |
10.109
|
SUPERVALU INC. 2007 Stock Plan Form of Stock Option Agreement is
incorporated herein by reference to Exhibit 10.2 to the
Company’s Current Report on
Form 8-K
filed with the SEC on July 20, 2007.*
|
| |
| |
10.110
|
SUPERVALU INC. 2007 Stock Plan Form of Restoration Stock Option
Agreement is incorporated herein by reference to
Exhibit 10.3 to the Company’s Current Report on
Form 8-K
filed with the SEC on July 20, 2007.*
|
| |
| |
10.111
|
SUPERVALU INC. 2007 Stock Plan Form of Restricted Stock Award
Agreement is incorporated herein by reference to
Exhibit 10.1 to the Company’s Quarterly Report on
Form 10-Q
for the quarter ended September 8, 2007.*
|
85
|
|
|
| |
10.112
|
SUPERVALU INC. 2007 Stock Plan Form of Performance Stock Unit
Award Agreement (restricted stock settled) is incorporated
herein by reference to Exhibit 10.2 to the Company’s
Quarterly Report on
Form 10-Q
for the quarter ended June 14, 2008.*
|
| |
| |
10.113
|
SUPERVALU INC. 2007 Stock Plan Form of Performance Stock Unit
Terms and Conditions (restricted stock settled) is incorporated
herein by reference to Exhibit 10.3 to the Company’s
Quarterly Report on
Form 10-Q
for the quarter ended June 14, 2008.*
|
| |
| |
10.114
|
SUPERVALU INC. 2007 Stock Plan Form of Performance Stock Unit
Award Agreement (cash-settled units) is incorporated herein by
reference to Exhibit 10.4 to the Company’s Quarterly
Report on
Form 10-Q
for the quarter ended June 14, 2008.*
|
| |
| |
10.115
|
SUPERVALU INC. 2007 Stock Plan Form of Performance Stock Unit
Award Terms and Conditions (cash-settled units) is incorporated
herein by reference to Exhibit 10.5 to the Company’s
Quarterly Report on
Form 10-Q
for the quarter ended June 14, 2008.*
|
| |
| |
10.116
|
SUPERVALU INC. 2007 Stock Plan Form of Restricted Stock Award
Agreement is incorporated herein by reference to
Exhibit 10.6 to the Company’s Quarterly Report on
Form 10-Q
for the quarter ended June 14, 2008.*
|
| |
| |
10.117
|
SUPERVALU INC. 2007 Stock Plan Form of Restricted Stock Award
Terms and Conditions is incorporated herein by reference to
Exhibit 10.7 to the Company’s Quarterly Report on
Form 10-Q
for the quarter ended June 14, 2008.*
|
| |
| |
10.118
|
Excess Plan Agreement for Michael L. Jackson dated May 27,
2008 by and between SUPERVALU INC. and Michael L. Jackson is
incorporated herein by reference to Exhibit 10.1 to the
Company’s Quarterly Report on
Form 10-Q
for the quarter ended June 14, 2008.*
|
| |
| |
10.119
|
Summary of Non-Employee Director Compensation is incorporated
herein by reference to Exhibit 10.1 to the Company’s
Quarterly Report on
Form 10-Q
for the quarter ended December 1, 2007.*
|
| |
| |
10.120
|
SUPERVALU Executive Deferred Compensation Plan (2008 Statement)
is incorporated herein by reference to Exhibit 10.1 to the
Company’s Quarterly Report on
Form 10-Q
for the quarter ended November 29, 2008.*
|
| |
| |
10.121
|
SUPERVALU Directors’ Deferred Compensation Plan (2009
Statement) is incorporated herein by reference to
Exhibit 10.2 to the Company’s Quarterly Report on
Form 10-Q
for the quarter ended November 29, 2008.*
|
| |
| |
10.122
|
Omnibus 409a Amendment of New Albertsons Nonqualified Plans,
effective January 1, 2009, is incorporated herein by
reference to Exhibit 10.122 to the Company’s Annual
Report on
Form 10-K
for the year ended February 28, 2009.*
|
| |
| |
10.123
|
Form of Change of Control Severance Agreement, as amended, is
incorporated herein by reference to Exhibit 10.1 to the
Company’s Quarterly Report on
Form 10-Q
for the quarter ended June 20, 2009.*
|
| |
| |
10.124
|
Executive & Officer Severance Pay Plan is incorporated
herein by reference to Exhibit 10.1 to the Company’s
Quarterly Report on
Form 10-Q
for the quarter ended September 12, 2009.*
|
86
|
|
|
| |
10.125
|
Summary of Non-Employee Director Compensation is incorporated
herein by reference to Exhibit 10.2 to the Company’s
Quarterly Report on
Form 10-Q
for the quarter ended September 12, 2009.*
|
| |
| |
10.126
|
Form of 2007 Stock Plan Stock Option Agreement and Stock Option
Terms and Conditions for Officers, is incorporated herein by
reference to Exhibit 10.2 to the Company’s Current
Report on
Form 8-K
filed with the SEC on April 20, 2010.*
|
| |
| |
10.127
|
Form of 2007 Stock Plan Restricted Stock Award Agreement and
Restricted Stock Award Terms and Conditions for Officers, is
incorporated herein by reference to Exhibit 10.3 to the
Company’s Current Report on
Form 8-K
filed with the SEC on April 20, 2010.*
|
| |
| |
10.128
|
Form of 2007 Stock Plan Restricted Stock Unit Award Agreement
and Restricted Stock Unit Award Terms and Conditions for
Officers, is incorporated herein by reference to
Exhibit 10.4 to the Company’s Current Report on
Form 8-K
filed with the SEC on April 20, 2010.*
|
| |
| |
10.129
|
Form of SUPERVALU INC. 2007 Stock Plan Stock Appreciation Rights
Agreement for Officers, is incorporated herein by reference to
Exhibit 10.5 to the Company’s Current Report on
Form 8-K
filed with the SEC on April 20, 2010.*
|
| |
| |
10.130
|
Form of SUPERVALU INC. 2007 Stock Plan Performance Stock Unit
Award Agreement and Performance Stock Unit Award Terms and
Conditions (restricted common stock settled), is incorporated
herein by reference to Exhibit 10.6 to the Company’s
Current Report on
Form 8-K
filed with the SEC on April 20, 2010.*
|
| |
| |
10.131
|
Form of SUPERVALU INC. 2007 Stock Plan Performance Stock Unit
Award Agreement and Performance Stock Unit Award Terms and
Conditions (cash settled), is incorporated herein by reference
to Exhibit 10.7 to the Company’s Current Report on
Form 8-K
filed with the SEC on April 20, 2010.*
|
| |
| |
10.132
|
Amendment No. 1 to Unit Award Agreement between SUPERVALU
INC. and Jeffrey Noddle, dated April 16, 2010 is
incorporated herein by reference to Exhibit 10.1 to the
Company’s Current Report on
Form 8-K
filed with the SEC on April 20, 2010.*
|
|
|
|
| |
(12)
|
Statement re Computation of Ratios.
|
|
|
|
| |
12.1.
|
Ratio of Earnings to Fixed Charges.
|
|
|
|
| |
(21)
|
Subsidiaries to the Company.
|
|
|
|
| |
21.1.
|
SUPERVALU INC. Subsidiaries.
|
|
|
|
| |
(23)
|
Consents of Experts and Counsel.
|
|
|
|
| |
23.1.
|
Consent of KPMG LLP.
|
|
|
|
| |
(31)
|
Rule 13a-14(a)/15d-14(a)
Certifications.
|
|
|
|
| |
31.1.
|
Chief Executive Officer Certification of Periodic Financial
Report pursuant to Section 302 of the Sarbanes-Oxley Act of
2002.
|
87
|
|
|
| |
31.2.
|
Chief Financial Officer Certification of Periodic Financial
Report pursuant to Section 302 of the Sarbanes-Oxley Act of
2002.
|
|
|
|
| |
(32)
|
Section 1350 Certifications.
|
|
|
|
| |
32.1.
|
Chief Executive Officer Certification of Periodic Financial
Report pursuant to Section 906 of the Sarbanes-Oxley Act of
2002.
|
|
|
|
| |
32.2.
|
Chief Financial Officer Certification of Periodic Financial
Report pursuant to Section 906 of the Sarbanes-Oxley Act of
2002.
|
|
|
|
| |
(101)
|
Interactive Data File.
|
|
|
|
| |
101.
|
The following materials from the SUPERVALU INC. Annual Report on
Form 10-K
for the fiscal year ended February 27, 2010 formatted in
Extensible Business Reporting Language (XBRL): (i) the
Consolidated Segment Financial Information (ii) the
Consolidated Statements of Earnings, (iii) the Consolidated
Balance Sheets, (iv) the Consolidated Statements of
Stockholders’ Equity, (v) the Consolidated Statements
of Cash Flows and (vi) the Notes to Consolidated Financial
Statements, tagged as blocks of text.
|
88
SIGNATURES
Pursuant to the requirements of Section 13 or 15(d) of
the Securities Exchange Act of 1934, SUPERVALU has duly caused
this Annual Report on
Form 10-K
to be signed on its behalf by the undersigned, thereunto duly
authorized.
SUPERVALU INC.
(Registrant)
|
|
| DATE: April 23,
2010 By:
|
/s/ CRAIG
R. HERKERT
|
Craig R. Herkert
Chief Executive
Officer
Pursuant to the requirements of the Securities Exchange Act
of 1934, this Annual Report on
Form 10-K
has been signed below by the following persons on behalf of
SUPERVALU and in the capacities and on the dates indicated:
| |
|
|
|
|
|
|
|
Signature
|
|
Title
|
|
Date
|
|
|
|
|
|
|
|
|
|
/s/ CRAIG
R. HERKERT
Craig
R. Herkert
|
|
Chief Executive Officer and President;
Director (principal executive officer)
|
|
April 23, 2010
|
|
|
|
|
|
|
|
/s/ PAMELA
K. KNOUS
Pamela
K. Knous
|
|
Executive Vice President, Chief Financial
Officer (principal financial officer)
|
|
April 23, 2010
|
|
|
|
|
|
|
|
/s/ SHERRY
M. SMITH
Sherry
M. Smith
|
|
Senior Vice President, Finance (principal accounting officer)
|
|
April 23, 2010
|
|
|
|
|
|
|
|
/s/ IRWIN
COHEN*
Irwin
Cohen
|
|
Director
|
|
|
|
|
|
|
|
|
|
/s/ RONALD
E. DALY*
Ronald
E. Daly
|
|
Director
|
|
|
|
|
|
|
|
|
|
/s/ LAWRENCE
A. DEL SANTO*
Lawrence
A. Del Santo
|
|
Director
|
|
|
|
|
|
|
|
|
|
/s/ SUSAN
E. ENGEL*
Susan
E. Engel
|
|
Director
|
|
|
|
|
|
|
|
|
|
/s/ PHILIP
L. FRANCIS*
Philip
L. Francis
|
|
Director
|
|
|
|
|
|
|
|
|
|
/s/ EDWIN
C. GAGE*
Edwin
C. Gage
|
|
Director
|
|
|
|
|
|
|
|
|
|
/s/ GARNETT
L. KEITH, JR.*
Garnett
L. Keith, Jr.
|
|
Director
|
|
|
|
|
|
|
|
|
|
/s/ CHARLES
M. LILLIS*
Charles
M. Lillis
|
|
Director
|
|
|
|
|
|
|
|
|
|
/s/ JEFFREY
NODDLE
Jeffrey
Noddle
|
|
Director and Executive Chairman
|
|
|
|
|
|
|
|
|
|
/s/ STEVEN
S. ROGERS*
Steven
S. Rogers
|
|
Director
|
|
|
|
|
|
|
|
|
|
/s/ WAYNE
C. SALES*
Wayne
C. Sales
|
|
Director
|
|
|
89
| |
|
|
|
|
|
|
|
Signature
|
|
Title
|
|
Date
|
|
|
|
|
|
|
|
|
|
/s/ KATHI
P. SEIFERT*
Kathi
P. Seifert
|
|
Director
|
|
|
|
|
|
|
*
|
|
Executed this 23rd day of April
2010, on behalf of the indicated Directors by David L. Boehnen,
duly appointed Attorney-in-Fact.
|
David L. Boehnen
Attorney-in-fact
90