Attached files
| file | filename |
|---|---|
| EX-32.2 - EX 32.2 - SUPERVALU INC | f17form10-kex322.htm |
| EX-32.1 - EX 32.1 - SUPERVALU INC | f17form10-kex321.htm |
| EX-31.2 - EX 31.2 - SUPERVALU INC | f17form10-kex312.htm |
| EX-31.1 - EX 31.1 - SUPERVALU INC | f17form10-kex311.htm |
| EX-24.1 - EX 24.1 - SUPERVALU INC | f17form10-kex241.htm |
| EX-23.1 - EX 23.1 - SUPERVALU INC | f17form10-kex231.htm |
| EX-21.1 - EX 21.1 - SUPERVALU INC | f17form10-kex211.htm |
| EX-12.1 - EX 12.1 - SUPERVALU INC | f17form10-kex121.htm |
UNITED STATES
SECURITIES AND EXCHANGE COMMISSION
Washington, D.C. 20549
FORM 10-K
(Mark One)
ý | ANNUAL REPORT PURSUANT TO SECTION 13 OR 15(d) OF THE SECURITIES EXCHANGE ACT OF 1934 |
For the fiscal year ended February 25, 2017
OR
¨ | TRANSITION REPORT PURSUANT TO SECTION 13 OR 15(d) OF THE SECURITIES EXCHANGE ACT OF 1934 |
For the transition period from to .
Commission file number: 1-5418
SUPERVALU INC.
(Exact name of registrant as specified in its charter)
DELAWARE | 41-0617000 | |
(State or other jurisdiction of incorporation or organization) | (I.R.S. Employer Identification No.) | |
11840 VALLEY VIEW ROAD EDEN PRAIRIE, MINNESOTA | 55344 | |
(Address of principal executive offices) | (Zip Code) | |
Registrant’s telephone number, including area code: (952) 828-4000
Securities registered pursuant to Section 12(b) of the Act:
Title of each class | Name of each exchange on which registered | |
Common Stock, par value $0.01 per share | New York Stock Exchange | |
Securities registered pursuant to Section 12(g) of the Act: None
Indicate by check mark if the registrant is a well-known seasoned issuer, as defined in Rule 405 of the Securities Act. Yes ý No ¨
Indicate by check mark if the registrant is not required to file reports pursuant to Section 13 or Section 15(d) of the Act. Yes ¨ No ý
Indicate by check mark whether the registrant (1) has filed all reports required to be filed by Section 13 or 15(d) of the Securities Exchange Act of 1934 during the preceding 12 months (or for such shorter period that the registrant was required to file such reports), and (2) has been subject to such filing requirements for the past 90 days. Yes ý No ¨
Indicate by check mark whether the registrant has submitted electronically and posted on its corporate Web site, if any, every Interactive Data File required to be submitted and posted pursuant to Rule 405 of Regulation S-T (§232.405 of this chapter) during the preceding 12 months (or for such shorter period that the registrant was required to submit and post such files). Yes ý No ¨
Indicate by check mark if disclosure of delinquent filers pursuant to Item 405 of Regulation S-K (§229.405 of this chapter) is not contained herein, and will not be contained, to the best of registrant’s knowledge, in definitive proxy or information statements incorporated by reference in Part III of this Form 10-K or any amendment to this Form 10-K. ý
Indicate by check mark whether the registrant is a large accelerated filer, an accelerated filer, a non-accelerated filer, smaller reporting company, or an emerging growth company. See the definitions of "large accelerated filer," "accelerated filer" and "smaller reporting company" and “emerging growth company” in Rule 12b-2 of the Exchange Act.
Large accelerated filer x | Accelerated filer ¨ | Non-accelerated filer ¨ | Smaller reporting company ¨ | Emerging growth company ¨ | ||||
If an emerging growth company, indicate by check mark if the registrant has elected not to use extended transition period for complying with any new or revised financial accounting standards provided pursuant to Section 13(a) of the Exchange Act. ¨
Indicate by check mark if the registrant is a shell company (as defined in Rule 12b-2 of the Exchange Act). Yes ¨ No ý
The aggregate market value of the voting and non-voting stock held by non-affiliates of the registrant as of September 9, 2016 was approximately $1,248,780,826 (based upon the closing price of registrant’s Common Stock on the New York Stock Exchange).
As of April 21, 2017, there were 267,676,000 shares of the registrant’s common stock outstanding.
DOCUMENTS INCORPORATED BY REFERENCE
Portions of registrant’s definitive Proxy Statement filed for the registrant’s 2017 Annual Meeting of Stockholders are incorporated by reference into Part III, as specifically set forth in Part III.
SUPERVALU INC.
Annual Report on Form 10-K
TABLE OF CONTENTS
Item | Page | |
1. | ||
1A. | ||
1B. | ||
2. | ||
3. | ||
4. | ||
5. | ||
6. | ||
7. | ||
7A. | ||
8. | ||
9. | ||
9A. | ||
9B. | ||
10. | ||
11. | ||
12. | ||
13. | ||
14. | ||
15. | ||
2
CAUTIONARY STATEMENTS FOR PURPOSES OF THE SAFE HARBOR PROVISIONS OF THE SECURITIES LITIGATION REFORM ACT
Any statements contained in this Annual Report on Form 10-K regarding the outlook for Supervalu’s businesses and their respective markets, such as projections of future performance, guidance, statements of Supervalu’s plans and objectives, forecasts of market trends and other matters, are forward-looking statements based on Supervalu’s assumptions and beliefs. Such statements may be identified by such words or phrases as “will likely result,” “are expected to,” “will continue,” “may continue,” “outlook,” “is anticipated,” “estimate,” “project,” “believes,” “intends” or similar expressions. These forward-looking statements are subject to certain risks and uncertainties that could cause actual results to differ materially from those discussed in such statements and no assurance can be given that the results in any forward-looking statement will be achieved. For these statements, Supervalu claims the protection of the safe harbor for forward-looking statements contained in the Private Securities Litigation Reform Act of 1995. Any forward-looking statement speaks only as of the date on which it is made, and Supervalu disclaims any obligation to subsequently revise any forward-looking statement to reflect events or circumstances after such date or to reflect the occurrence of anticipated or unanticipated events.
Certain factors could cause Supervalu’s future results to differ materially from those expressed or implied in any forward-looking statements contained in this Annual Report on Form 10-K. These factors include the factors discussed in Part I, Item 1A of this Annual Report on Form 10-K under the heading “Risk Factors” and any other cautionary statements, written or oral, which may be made or referred to in connection with any such forward-looking statements. Since it is not possible to foresee all such factors, these factors should not be considered as complete or exhaustive.
PART I
ITEM 1. BUSINESS
Unless otherwise indicated, all references to “Supervalu,” “we,” “us,” “our” and the “Company” in this Annual Report on Form 10-K relate to SUPERVALU INC. and its wholly and majority-owned subsidiaries. All dollar and share amounts in this Annual Report on Form 10-K are in millions, except per share data and where otherwise noted.
Business Overview
Supervalu is the largest public company grocery distributor to wholesale customers across the United States through its Wholesale segment, operates five retail grocery banners in six geographic regions through its Retail segment and provides professional service solutions to retail operators and other entities, the results of which are included within Wholesale or Corporate depending on the customer type. Supervalu leverages its distribution operations by providing wholesale distribution and logistics service solutions to wholesale customers as well as wholesale distribution to Supervalu’s Retail stores. SUPERVALU INC., a Delaware corporation, was organized in 1925 as the successor to two wholesale grocery firms established in the 1870s.
Supervalu’s business is classified by management into two reportable segments: Wholesale and Retail. These reportable segments are two distinct businesses. The Wholesale reportable segment derives revenues from wholesale distribution of groceries and other products, logistics services and professional service solutions to retail stores and other customers (collectively referred to as “wholesale customers”). The Retail reportable segment derives revenues from the sale of groceries and other products at retail locations operated by Supervalu. Substantially all of Supervalu’s operations are domestic.
Supervalu operates on a 52/53 week fiscal year basis, with its fiscal year ending on the last Saturday in February. All references to fiscal 2017, 2016 and 2015 relate to the 52-week fiscal year ended February 25, 2017, the 52-week fiscal year ended February 27, 2016 and the 53-week fiscal year ended February 28, 2015, respectively.
Wholesale
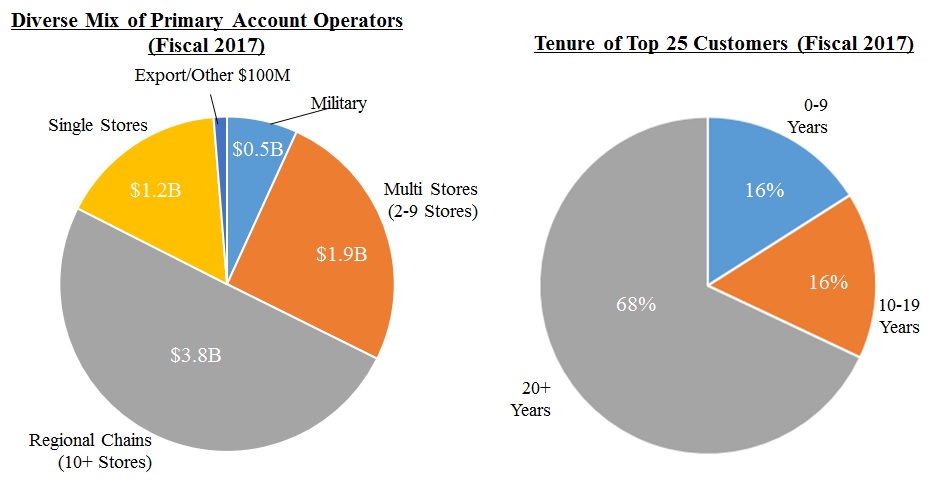
Supervalu organizes and operates its Wholesale segment through two geographic regions: East and West. As of February 25, 2017, the Wholesale network spans 40 states and Supervalu serves as primary grocery supplier to approximately 1,902 stores of wholesale customers, in addition to Supervalu’s own Retail stores, as well as serving as secondary grocery supplier to approximately 244 wholesale customer stores. Supervalu’s wholesale customers include single and multiple grocery store operators, regional chains and the military, many of whom are long tenured Supervalu customers. The following charts depict the composition of Supervalu’s wholesale customer mix and tenure of Supervalu’s top 25 customers by net sales:
3
Supervalu has established a network of strategically located distribution centers utilizing a multi-tiered logistics system. The network includes facilities that carry slow turn or fast turn groceries, perishables, general merchandise and home, health and beauty care products. As of February 25, 2017, the network is comprised of 18 distribution facilities, ten of which supply Supervalu’s own Retail stores in addition to stores of wholesale customers, and one distribution center dedicated to supplying the Shop ’n Save banner in the St. Louis, Missouri area. In March 2017, Supervalu acquired an additional distribution center in Harrisburg, Pennsylvania that has approximately 732 thousand square footage that will eventually replace the Lancaster, Pennsylvania facility that is owned by New Albertson’s, Inc. (“NAI”) and operated by Supervalu. Wholesale distribution sales to Supervalu’s own Retail stores are eliminated within the Wholesale segment in Supervalu’s financial statements. Deliveries to retail stores are made from Supervalu’s distribution centers by Company-owned trucks, third-party independent trucking companies or customer-owned trucks.
Supervalu offers wholesale customers a wide variety of food and non-food products, including national and regional brands, and Supervalu’s own extensive lines of private label products. Supervalu also offers a broad array of professional services that provide wholesale customers with cost-effective and scalable solutions. These services include pass-through programs in which vendors provide services directly to our wholesale customers, as well as services and solutions developed and provided directly by Supervalu. Supervalu’s services include retail store support, advertising, couponing, e-Commerce, network and data hosting solutions, training and certifications classes, as well as administrative back-office solutions. The sales and operating results for these services are included within Wholesale.
As a logistics provider, efficiency is an important customer service measure. Supervalu optimizes its facilities to implement leading warehouse technology, ranging from radio-frequency devices guiding selectors to mechanized facilities with completely automated order selection for dry groceries that help Supervalu deliver aisle-ready pallets to wholesale customers. The Wholesale segment also focuses on improving its supply chain to achieve labor and cost efficiencies.
Retail
Supervalu conducts its Retail operations through a total of 217 stores, as of February 25, 2017, primarily organized under five retail grocery banners of Cub Foods, Shoppers Food & Pharmacy, Shop ’n Save in the St. Louis market, Farm Fresh, Shop ’n Save in the east coast market and Hornbacher’s, plus two Rainbow stores. Retail stores provide an extensive grocery offering and, depending on size, a variety of additional products, including general merchandise, home, health and beauty care, and pharmacy, Supervalu’s Retail stores offer, national and regional brands as well as Supervalu’s own private label products. A typical Retail store carries approximately 14,000 to 21,000 core SKUs, depending on the retail banner, and ranges in size from approximately 40,000 to 60,000 square feet, varying by banner.
Supervalu believes its Retail banners have strong local and regional brand recognition in the markets in which they operate. Supervalu’s Retail operations are supplied by one dedicated distribution center and nine distribution centers that are part of the Wholesale segment providing wholesale distribution to both Supervalu’s Retail stores and stores of wholesale customers. Refer to Item 2—Properties for additional information regarding Retail stores by banner and the markets in which they operate.
Sale of Save-A-Lot
On December 5, 2016, Supervalu completed the sale of Supervalu’s Save-A-Lot business to SAL Acquisition Corp (f/k/a Smith Acquisition Corp), an affiliate of Onex Partners Managers LP, for a purchase price of $1,365 in cash, subject to customary closing adjustments that were estimated at the time of the sale to reduce the purchase price by approximately $61. The sale of Save-A-Lot was completed pursuant to the terms of the Agreement and Plan of Merger, dated as of October 16, 2016 (“SAL
4
Merger Agreement”), by and among SAL Acquisition Corp, SAL Merger Sub Corp (f/k/a Smith Merger Sub Corp), a newly formed wholly owned subsidiary of the SAL Acquisition Corp, Supervalu and Moran Foods, LLC, a wholly owned subsidiary of Supervalu prior to the sale. Concurrently with entering into the SAL Merger Agreement, Supervalu and Moran Foods also entered into a Separation Agreement (the “Separation Agreement”) pursuant to which, among other things, the assets and liabilities of the Save-A-Lot business were transferred to and assumed by Moran Foods, LLC prior to the completion of the sale. The assets, liabilities, operating results, and cash flows of Save-A-Lot have been presented separately as discontinued operations in the Consolidated Financial Statements for all periods presented.
Corporate
In connection with the completion of Supervalu’s sale of Save-A-Lot on December 5, 2016, Supervalu and Moran Foods entered into a Services Agreement whereby Supervalu is providing certain technical, human resources, finance and other operational services to Save-A-Lot for a term of five years, on the terms and subject to the conditions set forth therein. Moran Foods paid Supervalu $30 upon entry into the Services Agreement, which will be credited against fees due under the Services Agreement. The initial annual base charge under the Services Agreement is $30, subject to adjustments. Pursuant to this Services Agreement, Save-A-Lot may also request new services through the “change control” procedures described therein, and Supervalu may also agree to conduct non-recurring projects for Save-A-Lot pursuant to project orders.
Moran Foods may terminate the Services Agreement in the event of Supervalu’s material breach, if Supervalu breaches its non-compete obligations under the Merger Agreement, if Supervalu is acquired by a third party that engages in a Competing Business (as defined in the Merger Agreement) or in the event of Supervalu’s bankruptcy or insolvency, in each case, subject to certain limitations set forth in the Services Agreement. In addition, Moran Foods may terminate certain services or service categories if Supervalu commits a breach that is material to the service category or if Supervalu fails to meet certain minimum specified service levels, in each case, subject to certain limitations set forth in the Services Agreement. Supervalu may terminate the Services Agreement in the event of Moran Foods’ material breach, for Moran Foods’ failure to make timely payment, for certain legal or regulatory changes and in the event of Moran Foods’ bankruptcy or insolvency, in each case, subject to certain limitations set forth in the Services Agreement. The Services Agreement generally requires each party to indemnify the other party against third-party claims arising out of the performance of or the provision or receipt of services under the Services Agreement.
Supervalu provides back-office administrative support services under the transition services agreements (“TSA”) with NAI and Albertson’s LLC and is also providing services as needed to transition and wind down the TSA with NAI and Albertson’s LLC. Supervalu estimates that the complete transition and wind down of the TSA with NAI and Albertson’s LLC could take approximately two to three more years. In September 2016, NAI and Albertson’s LLC each notified Supervalu that it was again exercising its right to renew the term of their respective TSA for an additional year, which extended the expiration date of the NAI and Albertson’s LLC TSA to September 21, 2018, unless renewed again by notice given no later than September 21, 2017. The wind down of the TSA will result in the loss of significant revenue for Supervalu.
In connection with Haggen’s bankruptcy process, Haggen has now closed or sold all 164 of its stores. The transition and wind down of the Haggen transition services agreement occurred in the second quarter of fiscal 2017, with Supervalu now providing limited services in connection with the wind down of the Haggen estate.
Products
Supervalu offers a wide variety of nationally advertised brand name and private-label products, including grocery (both perishable and nonperishable), general merchandise, home, health and beauty care, and pharmacy, which are sold through Supervalu’s Wholesale segment to Wholesale customers and through Company-operated Retail stores to shoppers. Supervalu believes that it has adequate and alternative sources of supply for most of its purchased products.
The following table provides additional detail on the amounts and percentages of Net sales for each group of similar products sold in the Wholesale and Retail segments, and service agreement revenue discussed in “—Professional Services” in Corporate:
5
2017 (52 weeks) | 2016 (52 weeks) | 2015 (53 weeks) | ||||||||||||||||||
Wholesale: | ||||||||||||||||||||
Nonperishable grocery products(1) | $ | 5,579 | 45 | % | $ | 5,753 | 45 | % | $ | 5,939 | 45 | % | ||||||||
Perishable grocery products(2) | 1,969 | 16 | 2,025 | 16 | 2,099 | 16 | ||||||||||||||
Services to wholesale customers and other | 157 | 1 | 157 | 1 | 160 | 1 | ||||||||||||||
7,705 | 62 | % | 7,935 | 61 | % | 8,198 | 62 | % | ||||||||||||
Retail: | ||||||||||||||||||||
Nonperishable grocery products(1) | $ | 2,511 | 20 | % | $ | 2,607 | 20 | % | $ | 2,677 | 20 | % | ||||||||
Perishable grocery products(2) | 1,494 | 12 | 1,549 | 12 | 1,574 | 12 | ||||||||||||||
Pharmacy products | 500 | 4 | 511 | 4 | 510 | 4 | ||||||||||||||
Fuel | 55 | 1 | 67 | 1 | 83 | 1 | ||||||||||||||
Other | 36 | — | 35 | — | 40 | — | ||||||||||||||
4,596 | 37 | % | 4,769 | 37 | % | 4,884 | 37 | % | ||||||||||||
Corporate: | ||||||||||||||||||||
Service agreement revenue | $ | 179 | 1 | % | $ | 203 | 2 | % | $ | 195 | 1 | % | ||||||||
Net sales | $ | 12,480 | 100 | % | $ | 12,907 | 100 | % | $ | 13,277 | 100 | % | ||||||||
(1) | Includes such items as dry goods, dairy, frozen foods, beverages, general merchandise, home, health and beauty care and candy |
(2) | Includes such items as meat, produce, deli and bakery |
Private-Label Products
Supervalu’s private-label products are produced to Supervalu’s specification by many suppliers and compete in most categories. Private-label products include: the premium brands Culinary Circle® and Stockman & Dakota®, which offer unique, premium quality products in highly competitive categories; Wild Harvest®, which is free from over 100 undesirable ingredients; core brands Essential Everyday®, EQUALINE®, and category-specific brands Arctic Shores Seafood Company®, Baby Basics®, Farm Stand®, Stone Ridge Creamery® and Super Chill®, which provide shoppers quality national brand equivalent products at a competitive price; and the value brand Shopper’s Value®, which offers budget conscious consumers a quality alternative to national brands at substantial savings.
Trademarks
Supervalu offers Wholesale customers the opportunity to franchise a concept or license a service mark. These programs help our Wholesale customers compete by providing, as part of the franchise or license program, a complete business concept, group advertising, private-label products and other benefits. Supervalu is the franchisor or licensor of certain banner store service marks such as CUB FOODS, FESTIVAL FOODS, SENTRY, COUNTY MARKET, SHOP ’N SAVE, NEWMARKET, FOODLAND, JUBILEE and SUPERVALU. In conjunction with its licensing and franchise arrangements, Supervalu maintains wholesale distribution agreements with its licensees and franchisees, primarily under the Cub Foods, Festival Foods, Sentry and Rainbow banners.
Supervalu files a substantial number of its trademarks/service marks with the United States Patent and Trademark Office, including for many of its private-label product brands. U.S. trademark and service mark registrations are for a term of ten years, and renewable every ten years as long as the trademark is used in the regular course of trade. Supervalu considers certain of its trademarks and service marks to be of material importance to its Wholesale and Retail segments and actively defends and enforces such trademarks and service marks.
Working Capital
Normal operating fluctuations in working capital balances can result in changes to cash flow from operations presented in the Consolidated Statements of Cash Flows that are not necessarily indicative of long-term operating trends. Supervalu’s working capital needs are generally greater during the months leading up to high sales periods, such as the time period from prior to Thanksgiving through December. Supervalu typically finances these working capital needs with funds provided by operating activities and short-term borrowings. Inventories are managed primarily through demand forecasting and replenishing depleted inventories. There are no unusual industry practices or requirements relating to working capital.
6
Seasonality
Overall product sales are fairly balanced throughout the year, although demand for certain products of a seasonal nature may be influenced by holidays, changes in seasons or other annual events. Our first quarter consists of 16 weeks, while all of our other quarters consist of 12 weeks, and all of our quarters typically include a major holiday.
Competition
Wholesale and Retail each operate in a highly competitive environment.
Wholesale competes directly with a number of traditional and specialty grocery wholesalers and retailers that maintain or develop self-distribution systems. Supervalu believes it competes in this business on the basis of price, quality, assortment, schedule and reliability of deliveries and services, service fees and distribution facility locations.
Principal competition for Supervalu’s Retail segment comes from traditional grocery retailers, including regional and national chains and independent grocery store operators, and non-traditional retailers, such as supercenters, membership warehouse clubs, specialty supermarkets, hard discount stores, dollar stores, online retailers, convenience stores, drug stores and restaurants. Supervalu’s ability to differentiate itself from its competitors and create an attractive value proposition for its customers is dependent upon a combination of price, quality, customer service, convenience, e-commerce offerings, assortment, in-stock levels, brand perception, store location and conditions, in-store marketing and merchandising and promotional strategies.
Supervalu believes that the success of its Wholesale and Retail segments is dependent upon the ability of its own stores, as well as the stores of wholesale customers it supplies, to compete successfully. Supervalu also competes to attract and maintain licensed and franchised operators to operate stores to which it provides wholesale distribution and services. This competition generally takes the form of alternative investment formats, such as a potential or existing licensee’s investment in fast food restaurants, dollar stores, specialty supermarkets, drug stores and other potential investments.
Recent and ongoing consolidation within the grocery industry has resulted in, and is expected to continue to result in, increased competition, including from some competitors that have greater financial, marketing and other resources than Supervalu.
Employees
As of February 25, 2017, Supervalu had approximately 29,000 employees. Approximately 16,000 employees are covered by 48 collective bargaining agreements. During fiscal 2017, twenty collective bargaining agreements covering approximately 9,200 employees were renegotiated. Also, three collective bargaining agreements covering approximately 140 employees have already expired without their terms being renegotiated. Negotiations are expected to continue with the bargaining units representing the employees subject to those expired agreements. During fiscal 2018, twenty-three collective bargaining agreements covering approximately 6,000 employees will expire. The majority of employees covered by these expiring collective bargaining agreements are located in Eastern markets. Supervalu is focused on ensuring competitive cost structures in each market in which it operates while meeting its employees’ needs for attractive wages and affordable healthcare and retirement benefits. Supervalu believes that it has generally good relations with its employees and with the labor unions that represent employees covered by collective bargaining agreements.
Where You Can Find More Information
Supervalu’s principal executive offices are located at 11840 Valley View Road, Eden Prairie, Minnesota 55344 (Telephone: 952-828-4000). Supervalu makes available free of charge at its Internet website (www.supervalu.com) its annual reports on Form 10-K, quarterly reports on Form 10-Q, current reports on Form 8-K and any amendments to these reports filed or furnished pursuant to Section 13(a) or 15(d) of the Securities Exchange Act of 1934, as amended (the “Exchange Act”), as soon as reasonably practicable after such material is electronically filed with or furnished to the Securities and Exchange Commission (the “SEC”). Information on Supervalu’s website is not deemed to be incorporated by reference into this Annual Report on Form 10-K. Supervalu will also provide its SEC filings free of charge upon written request to Investor Relations, SUPERVALU INC., P.O. Box 990, Minneapolis, MN 55440.
7
EXECUTIVE OFFICERS OF SUPERVALU INC.
The following table provides certain information concerning the executive officers of Supervalu as of April 25, 2017.
Name | Age | Present Position | Calendar Year Elected to Present Position | Other Positions Recently Held with Supervalu | ||||
Mark Gross(1) | 54 | President and Chief Executive Officer | 2016 | |||||
Bruce H. Besanko(2) | 58 | Executive Vice President, Chief Operating Officer and Chief Financial Officer | 2016 | Executive Vice President, Chief Operating Officer, 2015-April 2016; Executive Vice President, Chief Financial Officer, 2013-2015 | ||||
Randy G. Burdick(3) | 59 | Executive Vice President, Chief Information Officer | 2013 | |||||
Anne M. Dament(4) | 50 | Senior Vice President, Retail, Merchandising and Marketing | 2017 | |||||
Susan S. Grafton(5) | 60 | Senior Vice President, Finance, and Chief Accounting Officer | 2016 | Executive Vice President, Chief Financial Officer, 2015-April 2016; Senior Vice President, Finance, and Chief Accounting Officer, 2014-2015 | ||||
Karla C. Robertson | 46 | Executive Vice President, General Counsel and Corporate Secretary | 2013 | Executive Vice President, Legal 2013; Vice President, Employment, Compensation and Benefits Law, 2012-2013; Director, Employment Law, 2011-2012; Senior Labor and Employment Counsel, 2009-2011 | ||||
Michael C. Stigers(6) | 58 | Executive Vice President, Wholesale | 2015 | President of Cub Foods, 2014-2015; President, Northern and Western Region of Wholesale, 2013-2014; President of Shaw’s, 2011-2013 | ||||
James W. Weidenheimer(7) | 58 | Executive Vice President, Corporate Development and Chief Innovation Officer | 2016 | |||||
Rob N. Woseth(8) | 46 | Executive Vice President, Chief Strategy Officer | 2013 | |||||
(1) | Mark Gross was appointed President and Chief Executive Officer in February 2016. Prior to joining Supervalu, Mr. Gross served since 2006 as President of Surry Investment Advisors LLC, an advisory firm that Mr. Gross founded to provide consulting services to grocery distributors and retailers with respect to strategic and operational matters. From 1997-2006, Mr. Gross held various positions at C&S Wholesale Grocers, including serving as Co-President of C&S’s overall operations from 2005-2006. Additionally, during his tenure with C&S, Mr. Gross served as Chief Financial Officer, General Counsel, and President of its affiliated retail grocery operations. |
(2) | Bruce H. Besanko was appointed Executive Vice President, Chief Operating Officer and Chief Financial Officer in April 2016. Prior to that, Mr. Besanko served as Executive Vice President, Chief Operating Officer from October 2015 to April 2016, and as Executive Vice President, Chief Financial Officer from August 2013 to October 2015. Prior to joining Supervalu, Mr. Besanko served as Executive Vice President and Chief Financial Officer since February 2009, and as Chief Administrative Officer since October 2009, for OfficeMax. Mr. Besanko previously served as Executive Vice President and Chief Financial Officer of Circuit City Stores, Inc. (“Circuit City”), a specialty retailer of consumer electronics and related services, from July 2007 to February 2009. Prior to that, Mr. Besanko served as Senior Vice President, Finance and Chief Financial Officer for The Yankee Candle Company, Inc., a designer, manufacturer, wholesaler and retailer of premium scented candles, since April 2005. On November 10, 2008, Circuit City and several of its subsidiaries filed voluntary petitions for relief under Chapter 11 of the United States Bankruptcy Code in the United States Bankruptcy Court for the Eastern District of Virginia. Circuit City’s Chapter 11 plan of liquidation was confirmed by the Bankruptcy Court on September 14, 2010. |
(3) | Randy G. Burdick was appointed Executive Vice President, Chief Information Officer in March 2013. Prior to joining Supervalu, Mr. Burdick served as Executive Vice President and Chief Information Officer at OfficeMax from 2005-2013. |
(4) | Anne M. Dament was appointed Senior Vice President, Retail, Merchandising and Marketing in January 2017. Prior to joining Supervalu, Ms. Dament served as Senior Vice President, Merchandising at Target Corporation, a general merchandise retailer, from April 2015 to November 2016. Ms. Dament previously served as Vice President, Merchandising Solutions from 2009 to September 2012 and as Vice President, Services from September 2012 to April 2015 at PetSmart, Inc., a specialty retailer of services and solutions for pets. |
(5) | Susan S. Grafton was appointed Senior Vice President, Finance, and Chief Accounting Officer in April 2016. Prior to that, Ms. Grafton served as Executive Vice President, Chief Financial Officer from October 2015 to April 2016, and as Senior Vice President, Finance, and Chief Accounting Officer for Supervalu from February 2014 to October 2015. Prior to joining Supervalu, Ms. Grafton served as Senior Vice President, Controller and Chief Accounting Officer from 2011-2014 and as Vice President, Controller and Chief Accounting Officer from 2006-2011 at Best Buy Co., Inc., a retailer of consumer electronics and related products. |
(6) | Prior to joining Supervalu in 2011, Michael C. Stigers served as President of PW Supermarkets, Inc., an operator of retail grocery supermarkets, from 2006-2010 and as Chief Executive Officer in 2010. In April 2011, creditors filed a petition for involuntary bankruptcy against PW Supermarkets in U.S. Bankruptcy Court, Northern District of California to force PW Supermarkets into a |
8
Chapter 7 liquidation. The bankruptcy case was transferred to the Oakland Division in October 2014 and continues to be an active case in that court.
(7) | James W. Weidenheimer was appointed Executive Vice President, Corporate Development and Chief Innovation Officer in April 2016. Prior to joining Supervalu, Mr. Weidenheimer served as Senior Vice President of Corporate Development for C&S Wholesale Grocers from 2008 to January 2016, where Mr. Weidenheimer oversaw significant M&A activity and led the development of procurement and distribution outsourcing plans. From 1998 to 2008, Mr. Weidenheimer had operating responsibility for finance, treasury, procurement, facilities, internal audit, quality assurance and inventory control at C&S. |
(8) | Rob N. Woseth was appointed Executive Vice President, Chief Strategy Officer effective March 2013. Prior to joining Supervalu, Mr. Woseth served as Vice President Business Development and Strategy at Albertson’s LLC from 2006-2013. |
The term of office of each executive officer is from one annual meeting of the Board of Directors until the next annual meeting of Board of Directors or until a successor is elected. There are no family relationships between or among any of the executive officers of Supervalu.
ITEM 1A. RISK FACTORS
Various risks and uncertainties may affect Supervalu’s business. Any of the risks described below or elsewhere in this Annual Report on Form 10-K or Supervalu’s other SEC filings may have a material impact on Supervalu’s business, financial condition or results of operations.
Strategic and Operational Risks
Supervalu faces intense competition.
The grocery business is intensely competitive, and the recent and ongoing consolidation within the grocery industry is expected to result in increased competition, including from some competitors that have greater financial, marketing and other resources than Supervalu. The grocery industry is characterized by relatively small operating margins, and as competition in certain areas intensifies and as the industry continues to consolidate, Supervalu’s results of operations may be negatively impacted through a loss of sales and reductions in gross margins. See “Business—Competition” for a discussion of the competitive environment.
If Supervalu is unable to appropriately respond to competition and execute on its initiatives to improve the competitive position or profitability of Supervalu, and differentiate Supervalu’s offerings, Supervalu’s sales, financial condition and results of operations may be adversely affected.
Supervalu may engage in acquisitions and divestitures, and may encounter difficulties integrating acquired businesses or disposing divested businesses and may not realize the anticipated benefits of these acquisitions and divestitures.
Supervalu may engage in strategic transactions. Acquisitions and dispositions present significant challenges and risks relating to the integration of acquired businesses and the separation of disposed businesses. The risks include Supervalu’s due diligence reviews may not identify all of the material issues, Supervalu may incur unanticipated costs or expenses, and Supervalu may not be able to integrate acquisitions with its operations or separate divested businesses and related obligations from its operations as planned. Supervalu may also not realize the degree or timing of benefits or synergies it anticipates when it first enters into a transaction. There can be no assurances that Supervalu will manage acquisitions and dispositions successfully, that strategic opportunities will be available to Supervalu on acceptable terms or at all, or that Supervalu will be able to consummate desired transactions. Any of the foregoing could materially adversely affect Supervalu’s competitive position, financial condition, results of operations or cash flows.
On April 10, 2017, Supervalu entered into a definitive merger agreement to acquire Unified Grocers, Inc., a West Coast focused wholesale grocery and specialty distributor, in a transaction valued at approximately $375, comprised of approximately $114 in cash for 100% of the outstanding stock of Unified Grocers plus the assumption and pay-off of Unified Grocers’ net debt at closing, which was approximately $261 as of April 1, 2017. There are no purchase price adjustments for any changes in Unified Grocers’ net debt between signing and closing or otherwise. The process of consummating the proposed acquisition of Unified Grocers may be disruptive to Supervalu’s business operations and may distract Supervalu’s management team from their day-to-day responsibilities. The acquisition is subject to customary closing conditions, which may not be obtained or satisfied, and as a result and due to other factors outside Supervalu’s control, the acquisition may not be completed on the current terms or on the timing currently contemplated, or at all. There can also be no assurance the Supervalu will be able to successfully integrate Unified Grocers to achieve the operational efficiencies, including synergistic and other benefits of the proposed acquisition, or effectively retain key employees and maintain and grow customer relationships. Any of these risks or uncertainties, including the inability to complete the proposed acquisition in the time period and on the terms contemplated, could adversely affect Supervalu’s business, financial condition, results of operations or cash flows.
9
Supervalu’s Wholesale distribution business could be adversely affected if Supervalu is not able to affiliate new customers or retain existing customers, or if Supervalu’s Wholesale customers fail to perform.
The profitability of Supervalu’s Wholesale segment is dependent upon sufficient volume to support Supervalu’s operating infrastructure, which is dependent on the ability of Supervalu to attract new customers and retain existing customers. The inability to attract new customers or the loss of existing customers to a competing wholesaler or due to closure, vertical integration by an existing customer converting to self-distribution, or industry consolidation may negatively impact Supervalu’s sales and operating margins.
Supervalu’s success also relies in part on the financial success and cooperation of its Wholesale customers. These Wholesale customers manage their businesses independently, and therefore are responsible for the day-to-day operation of their stores. They may not experience an acceptable level of sales or profitability, and Supervalu’s revenues and gross margins could be negatively affected as a result. Supervalu may also need to extend credit to its Wholesale customers, including through loans, market support or guarantees, and while Supervalu seeks to obtain security interests and other credit support in connection with the financial accommodations Supervalu extends, such collateral may not be sufficient to cover its exposure. If sales trends or profitability worsen for Wholesale customers, their financial results may deteriorate, which could result in, among other things, lost business for Supervalu, delayed or reduced payments to Supervalu or defaults on payments or other liabilities owed by Wholesale customers to Supervalu, any of which could adversely impact Supervalu’s financial condition and results of operations as well as its ability to grow its Wholesale business. In this regard, Supervalu’s Wholesale customers are affected by the same economic conditions, including food deflation, and competition that Supervalu’s Retail segment is facing. The magnitude of these risks increases as the size of Supervalu’s Wholesale customers increases.
Failure to affiliate new customers and retain existing customers for Supervalu’s professional services, or the failure to perform the services as required, could adversely impact Supervalu’s results of operations.
Supervalu provides numerous services to its Wholesale customers to support the operation of their businesses and stores. Supervalu has been working to leverage its experience, infrastructure and investments to engage new customers and expand the scope of services received by existing customers. If Supervalu is unable to successfully implement this strategy, including differentiating the quality and breadth of Supervalu’s services to customers, in a highly competitive and consolidating environment, or if Supervalu is unable to perform the services up to the customers’ expectations, Supervalu’s results of operations could be adversely impacted.
Supervalu has significant service relationships with Albertson’s LLC, NAI and Save-A-Lot, and the wind-down of Supervalu’s relationship with Albertson’s LLC and NAI (and any future wind down of Save-A-Lot) could adversely impact Supervalu’s results of operations.
Supervalu has provided significant support services to Albertson’s since 2006 and to Save-A-Lot since Supervalu divested it in December 2016. Despite Supervalu believing that it met service expectations, Albertson’s has determined to wind down its services relationship with Supervalu after it acquired Safeway and now has access to these services from Safeway’s platform. Supervalu expects its services to Albertson’s to be fully wound down over the next approximately two to three years. Supervalu will lose a significant amount of revenue and corresponding operating earnings as a result of this wind down. Supervalu has been executing on its plan to reduce costs, grow its sales and enhance its margins over the past several years. These efforts have contributed to Supervalu's profitability, including the TSA. As the revenue Supervalu receives from the TSA continues to decline, Supervalu does not believe that it will be able to grow sales quickly enough or further eliminate costs or enhance margin to fully mitigate the lost revenue as the TSA unwinds. Failure to execute on Supervalu’s services offering and growth strategy, including making the necessary capital investments for that growth while managing additional cost reductions, could further adversely impact Supervalu’s results of operations. Supervalu’s results of operations could also be adversely impacted if Supervalu is not able to transition and wind down the Albertson’s services in the manner or timeline anticipated. Supervalu is working closely with Albertson’s on the wind down but the execution of that wind down is dependent on Albertson’s.
Supervalu’s large professional services agreements, including Supervalu’s agreement with Save-A-Lot, provide certain rights for the customers. The services agreement will typically include a fixed term but provide the customer certain termination rights, including in the event of Supervalu’s material breach, and may give the customer certain termination and monetary rights with respect to specified services or service categories in the event Supervalu does not perform to agreed-upon minimum levels of service. The services agreement will also generally require Supervalu to indemnify the customer against third-party claims arising out of the performance of the services under the agreement. Termination of services agreements, in whole or in part, and in particular the services agreement with Save-A-Lot and the wind-down of the services agreement with Albertson’s, could adversely affect Supervalu’s business or results of operations.
10
Supervalu’s inability to maintain or increase its operating margins could adversely affect its results of operations and the price of Supervalu’s stock.
As competition increases, the grocery industry consolidates and Supervalu attempts to affiliate larger Wholesale customers, Supervalu expects to continue to face pressure on its operating margins. If Supervalu is not able to continue to capture scale efficiencies and enhance its merchandise offerings, Supervalu may not be able to achieve its goals with respect to operating margins. In addition, if Supervalu does not continuously refine and improve its systems, Supervalu may not be able to increase sales, effectively manage inventory and procurement processes or effectively manage customer pricing plans. As a result, Supervalu’s operating margins may stagnate or decline, which could adversely affect the price of Supervalu’s stock.
Supervalu may not be able to grow or maintain its levels of identical store sales.
Supervalu has experienced negative identical store sales in its Retail operations in recent periods. A variety of factors affect identical store sales and profitability, including in-store performance, consumer tastes, competition, current economic conditions, pricing, deflation or inflation, and weather conditions, and many of these factors are beyond our control and can be difficult to predict in advance. If Supervalu’s identical store sales continue to decline or fail to meet market expectations, Supervalu’s results of operations could be adversely affected and the price of Supervalu’s stock could decline.
Supervalu’s indebtedness could decrease Supervalu’s financial and operational flexibility and Supervalu’s borrowing costs could increase.
Supervalu’s credit facilities contain covenants that limit Supervalu’s ability to acquire assets, dispose of assets and use the proceeds thereof, create liens on property, incur or prepay indebtedness and pay dividends, among other things and subject to certain exceptions. These covenants may affect Supervalu’s operating and financial flexibility and may require Supervalu to seek the consent of the lenders for certain transactions that Supervalu may wish to effect. There can be no assurances that Supervalu would be able to obtain such consent. There can also be no assurances that Supervalu will be able to refinance its existing indebtedness on similar terms. Tightening of credit, reduced liquidity or volatility in the capital markets could result in diminished availability of credit and higher costs of borrowing, making it more difficult for Supervalu to obtain or amend debt financing on favorable terms. Additionally, if Supervalu fails to comply with any of its covenants or other restrictions, the related indebtedness (and other unrelated indebtedness) could become due and payable prior to its stated maturity and Supervalu may not be able to repay the indebtedness that becomes due. A default under Supervalu’s debt instruments may also significantly affect Supervalu’s ability to obtain additional or alternative financing.
A significant portion of Supervalu’s debt portfolio has a variable interest rate component. Volatility in interest rates causes volatility in interest expense, potentially resulting in an adverse impact to earnings.
Increased healthcare, pension and other costs under Supervalu’s and multiemployer benefit plans, or failure to maintain satisfactory labor relations, could adversely affect Supervalu’s financial condition and results of operations.
Supervalu provides health, defined benefit pension, defined contribution and other postretirement benefits to many of its employees and the costs of such benefits continue to increase. The amount of any increase depends on a number of different factors, many of which are beyond Supervalu’s control. These factors include governmental regulations such as The Patient Protection and Affordable Care Act, which has resulted in changes to the U.S. healthcare system and imposes mandatory types of coverage, reporting and other requirements; return on assets held in plans; changes in actuarial valuations used to determine Supervalu’s benefit obligations for certain benefit plans, which require the use of significant estimates, including the discount rate, expected long-term rate of return on plan assets, mortality rates and the rates of increase in compensation and health care costs; and for multiemployer plans, the outcome of collective bargaining and actions taken by trustees who manage the plans. If Supervalu is unable to control these benefits and costs, Supervalu may experience increased operating costs, which may adversely affect Supervalu’s financial condition and results of operations.
Additionally, Company-sponsored plans and multiemployer pension plans are underfunded with the projected benefit obligations exceeding the fair value of those plans’ assets. Withdrawal liabilities from multiemployer plans could be material, and potential exposure to withdrawal liabilities could cause Supervalu to forgo business opportunities. Many of these plans have required rehabilitation plans or funding improvement plans, and Supervalu can give no assurances of the extent to which a rehabilitation plan or a funding improvement plan will improve the funded status of the plan. Supervalu expects that the unfunded liabilities of these plans will result in increased future payments by Supervalu and the other participating employers over the next few years. A significant increase to funding requirements could adversely affect Supervalu’s financial condition, results of operations or cash flows. The financial condition of these pension plans may also negatively impact Supervalu’s debt ratings, which may increase the cost of borrowing or adversely affect Supervalu’s ability to access one or more financial markets.
11
Supervalu is party to collective bargaining agreements that impose certain work rules and other restrictions on Supervalu that limit its flexibility in managing the business and cost structure. See “Business—Employees” for information about the collective bargaining agreements. There can be no assurance that Supervalu will be able to negotiate the terms of expiring or expired agreements in a manner acceptable to Supervalu. Therefore, potential increases in operating costs, reduced operational flexibility or work disruptions from labor disputes, strikes or picketing could disrupt Supervalu’s businesses and adversely affect Supervalu’s financial condition and results of operations. Certain of Supervalu’s operations have employees who are non-union, and while Supervalu believes its employee relations are strong, there can be no assurance that these operations will not experience pressure from labor unions or become the target of campaigns to unionize.
Supervalu’s success depends in part on the retention of its executive officers and key management, and its ability to hire and retain key personnel.
Supervalu’s success depends on the experience, performance and skills of its executive officers, senior management and other key employees. Competition for skilled and experienced personnel is intense, and Supervalu’s future success will also depend on its ability to attract and retain qualified personnel. Failure to attract and retain qualified personnel could have an adverse effect on Supervalu’s operations. There can be no assurance that Supervalu’s executive succession planning, retention or hiring efforts will be successful.
Disruptions to Supervalu’s or third-party information technology systems, including cyber-attacks and security breaches, and the costs of maintaining secure and effective information technology systems could negatively affect Supervalu’s business and results of operations.
The efficient operation of Supervalu’s businesses is highly dependent on computer hardware and software systems, including customized information technology systems. Additionally, Supervalu’s businesses increasingly involve the receipt, storage and transmission of sensitive data, including personal information about Supervalu’s customers and employees and proprietary business information of Supervalu and its customers and vendors. Supervalu also shares information with vendors. Information systems are vulnerable to not functioning as designed and to disruptions and security breaches by computer hackers and cyber terrorists.
In fiscal 2015, Supervalu experienced separate criminal intrusions into the portion of its computer network that processes payment card transactions for some of its owned and franchised retail food stores, including some of the associated stand-alone liquor stores. Supervalu has incurred and expects to incur costs and expenses related to these intrusions, and may also be adversely affected by claims from customers, financial institutions, payment card brands, Albertson’s LLC and NAI for stores owned and operated by them that experienced related criminal intrusions, stockholders and others and by costly inquiries or enforcement actions on the part of regulatory authorities.
Despite Supervalu continuing to take actions to strengthen the security of its information technology systems, these measures and technology may not adequately anticipate or prevent security breaches in the future or Supervalu may not be able to timely implement these measures and technology. Cyber-attacks are rapidly evolving and becoming increasingly sophisticated and difficult to detect. The failure to promptly detect, determine the extent of and appropriately respond to and contain a significant data security attack or breach of the systems of Supervalu or any third party systems used by Supervalu could have a material adverse impact on Supervalu’s business, financial condition and results of operations. Supervalu could also lose credibility with its customers and suffer damage to its reputation and future sales, including through negative publicity and social media. In addition, the unavailability of the information systems or failure of these systems or software to perform as anticipated for any reason and any inability to respond to, or recover from, such an event, could disrupt Supervalu’s business, impact Supervalu’s customers and could result in decreased performance, increased overhead costs and increased risk for liability, causing Supervalu’s business and results of operations to suffer.
As a merchant that accepts debit and credit cards for payment, Supervalu is subject to the Payment Card Industry Data Security Standard (“PCI DSS”), issued by the PCI Council. Additionally, Supervalu is subject to PCI DSS as a service provider, which is a business entity that is not a payment brand directly involved in the processing, storage, or transmission of cardholder data. PCI DSS contains compliance guidelines and standards with regard to Supervalu’s security surrounding the physical and electronic storage, processing and transmission of individual cardholder data. By accepting debit cards for payment, Supervalu is also subject to compliance with American National Standards Institute data encryption standards and payment network security operating guidelines. The cost of complying with stricter privacy and information security laws, standards and guidelines, including evolving PCI DSS standards, and developing, maintaining and upgrading technology systems to address future advances in technology, could be significant and Supervalu could experience problems and interruptions associated with the implementation of new or upgraded systems and technology or with maintenance or adequate support of existing systems. Failure to comply with such laws, standards and guidelines, or payment card industry standards such as accepting Europay,
12
MasterCard, and Visa (EMV) transactions, could have a material adverse impact on Supervalu’s business, financial condition and results of operations.
Changes in the military commissary system or decreases in governmental funding could negatively impact the sales and operating performance of Supervalu’s military business.
Supervalu’s Wholesale segment sells and distributes grocery products to military commissaries and exchanges in the United States. The commissary system is experiencing material changes as the Defense Commissary Agency (“DeCA”) looks to reduce the level of governmental funding required for the system, including to lower prices from suppliers and to offer its own private label products. The military food distribution industry already has narrow operating margins making economies of scale critical for distributors. These changes could have an adverse impact on the sales and operating performance of Supervalu’s military business. Additionally, Supervalu’s military business faces competition from large national and regional food distributors as well as smaller food distributors, and the military commissaries and exchanges face competition from low-cost retailers.
Supervalu’s insurance and self-insurance programs may not be adequate to cover future claims.
Supervalu uses a combination of insurance and self-insurance to provide for potential liabilities for workers’ compensation, automobile and general liability, director and officer liability, property risk, cyber and privacy risks and employee healthcare benefits. Supervalu estimates the liabilities and required reserves associated with the risks retained by Supervalu. Any such estimates and actuarial projection of losses is subject to a degree of variability. Among the causes of this variability are changes in benefit levels, medical fee schedules, medical utilization guidelines, vocation rehabilitation and apportionment and unpredictable external factors affecting inflation rates, discount rates, rising health care costs, litigation trends, legal interpretations, benefit level changes and actual claim settlement patterns. If the number or severity of claims for which Supervalu is self-insured increases, or Supervalu is required to accrue or pay additional amounts because the claims prove to be more severe than Supervalu’s original assessments, Supervalu’s financial condition and results of operations may be adversely affected.
Impairment charges for long-lived assets or goodwill may adversely affect Supervalu’s financial condition and results of operations.
Supervalu monitors the recoverability of its long-lived assets such as buildings and equipment and evaluates their carrying value for impairment whenever events or changes in circumstances indicate that the carrying amount of such assets may not be fully recoverable. Supervalu annually reviews goodwill to determine if impairment has occurred. Additionally, interim reviews are performed whenever events or changes in circumstances indicate that impairment may have occurred. If the testing performed indicates that impairment has occurred, Supervalu is required to record a non-cash impairment charge for the difference between the carrying value of the long-lived assets or goodwill and the fair value of long-lived assets and the implied fair value of the goodwill, respectively, in the period the determination is made. The testing of long-lived assets and goodwill for impairment requires Supervalu to make estimates that are subject to significant variability about its future revenue, profitability, cash flows, fair value of assets and liabilities, weighted average cost of capital, as well as other assumptions. Changes in these estimates, or changes in actual performance compared with these estimates, may affect the fair value of long-lived assets or goodwill, which may result in an impairment charge.
Supervalu cannot accurately predict the amount or timing of any impairment of assets. Should the value of long-lived assets or goodwill become impaired, Supervalu’s financial condition and results of operations may be adversely affected.
Supervalu’s stock price is subject to market and other conditions and may be volatile.
The market price of Supervalu’s common stock may fluctuate significantly in response to a number of factors. These factors, some of which may be beyond Supervalu’s control, include the perceived prospects and actual operating results of Supervalu’s business; changes in estimates of Supervalu’s operating results by analysts, investors or Supervalu; trading activity by our large stockholders; trading activity by sophisticated algorithms (high-frequency trading); Supervalu’s actual operating results relative to such estimates or expectations; actions or announcements by Supervalu or its competitors; litigation and judicial decisions; legislative or regulatory actions; and changes in general economic or market conditions. In addition, the stock market in general has from time to time experienced extreme price and volume fluctuations. These market fluctuations could reduce the market price of Supervalu’s common stock for reasons unrelated to Supervalu’s operating performance.
13
Economic Risks
Changes in commodity prices, including due to deflation or inflation, or worsening economic conditions could adversely impact Supervalu’s financial condition and operating results.
Prices for the commodities and supplies that Supervalu purchases can be volatile. Supervalu has more recently experienced continued deflation in commodities that it purchases for resale. Decreases in these input costs have caused Supervalu to lower its prices and thereby reduce its revenues and gross margins. Continued deflation could adversely affect Supervalu’s operating results. Additionally, Supervalu’s operations are dependent on the availability of energy and fuel to store and transport products. While Supervalu has entered into contracts to purchase fuel, electricity and natural gas at fixed prices to satisfy a portion of its expected needs, an increase in these costs could adversely affect Supervalu’s results of operations. Supervalu has also invested in semitrailer trucks powered by compressed natural gas, which operations are subject to risks of defects, malfunctions and other damages.
The vast majority of Supervalu’s operations and customers are located in the United States, making its results highly dependent on U.S. economic conditions including consumer confidence and spending habits. Further, a significant portion of Supervalu’s total sales for its Retail operations is derived from stores located in Minnesota, Missouri and the Washington D.C./Baltimore market, resulting in further dependence on local economic conditions in these states. There can be no assurance that Supervalu will be able to identify and respond effectively to changing economic conditions and trends. Additionally, these economic conditions can increase Supervalu’s cost of sales and selling, general and administrative expenses, and otherwise adversely affect Supervalu’s results of operations.
Severe weather and natural disasters may harm Supervalu’s business.
Severe weather conditions and natural disasters in areas in which Supervalu or its customers operate or from which Supervalu obtains products may adversely affect Supervalu’s financial condition and results of operations, including as a result of physical damage to Supervalu’s properties, closure of one or more of Supervalu’s or its customers’ stores, offices or distribution facilities, lack of an adequate work force in a market, temporary disruption in the supply of products, disruption in the transport of goods, delays in the delivery of goods to distribution centers or stores, a reduction in customer volume and a reduction in the availability of products. In addition, adverse climate conditions and adverse weather patterns, such as drought or flood, that impact growing conditions and the quantity and quality of crops yielded by food producers may adversely affect the availability or cost of certain products within the grocery supply chain.
Disruption to Supervalu’s supply chain and distribution network could have an adverse impact on Supervalu’s sales and results of operations.
Supervalu’s sales and operating results could be adversely impacted if Supervalu is not able to provide goods and services to Supervalu and its customers in a timely and cost-effective manner. Factors that may disrupt Supervalu’s ability to maintain an uninterrupted supply chain and distribution network include adverse climate conditions, product recalls, crop conditions, availability of key commodities, regulatory actions, disruptions in technology, political or financial instability of suppliers, performance by outsourced service providers, transportation interruptions, labor supply or stoppages or vendor defaults or disputes, as well as other risk factors mentioned herein, any of which could also have an adverse effect on Supervalu’s sales and operating results.
Legal and Regulatory Risks
Supervalu’s businesses are subject to laws and governmental regulations that could adversely impact Supervalu’s financial condition and results of operations.
Supervalu’s businesses are subject to various federal, state and local laws, regulations and administrative practices that require Supervalu to comply with numerous provisions regulating areas such as environmental, health and sanitation standards, food safety, marketing of natural or organically produced food, facilities, pharmacies, equal employment opportunity, public accessibility, employee benefits, wages and hours worked and licensing for the sale of food, drugs and alcoholic beverages, among others. For example:
Environmental, Health and Safety: Supervalu’s operations are subject to extensive and increasingly stringent laws and regulations pertaining to the protection of the environment, including those relating to the discharge of materials into the environment, the disposal of food by-products, the handling, treatment and disposal of wastes, maintenance of refrigeration systems and remediation of soil and groundwater contamination. Compliance with existing or changing environmental and safety requirements, including more stringent limitations imposed or expected to be imposed in recently renewed or soon-to-be renewed environmental permits, may require capital expenditures.
14
Food Safety: There is increasing governmental scrutiny, regulations and public awareness regarding food quality and food and drug safety. Supervalu may be adversely affected if consumers lose confidence in the safety and quality of Supervalu’s food and drug products. Any events that give rise to actual or potential food contamination, drug contamination or food-borne illness or injury, or events that give rise to claims that Supervalu’s products are not of the quality or composition claimed to be, may result in product liability claims from individuals, consumers and governmental agencies, penalties and enforcement actions from government agencies, a loss of consumer confidence, harm to Supervalu’s reputation and could cause production and delivery disruptions, which may adversely affect Supervalu’s financial condition and results of operations. It may be necessary for Supervalu to recall unsafe, contaminated or defective products or Supervalu may recall products that it determines do not satisfy its quality standards. Recall costs and product liability claims can be material. While Supervalu generally seeks contractual indemnification and insurance coverage from its suppliers, it might not be able to recover these significant costs from its suppliers.
Pharmacy: Supervalu is required to meet various security and operating standards and comply with the Controlled Substances Act and its accompanying regulations governing the sale, marketing, packaging, holding, record keeping and distribution of controlled substances. During the past several years, the United States health care industry has been subject to an increase in governmental regulation and audits at both the federal and state levels. For example, see Note 15—Commitments, Contingencies and Off-Balance Sheet Arrangements in Part II, Item 8 of this Annual Report on Form 10-K under the caption “Legal Proceedings” for a discussion of the administrative subpoena issued to Supervalu by the DEA requesting, among other things, information on Supervalu’s pharmacy policies and procedures generally as well as the production of documents that are required to be kept and maintained by Supervalu pursuant to the Controlled Substances Act and its implementing regulations. Additionally, the Patient Protection and Affordable Care Act made several significant changes to Medicaid rebates and to reimbursement. One of these changes was to revise the definition of the Average Manufacturer Price, a pricing element common to most payment formulas, and the reimbursement formula for multi-source (i.e., generic) drugs. This change will affect Supervalu’s reimbursement. In addition, the Patient Protection and Affordable Care Act made other changes that affect the coverage and plan designs that are or will be provided by many of Supervalu’s health plan clients, including the requirement for health insurers to meet a minimum medical loss ratio to avoid having to pay rebates to enrollees. These Patient Protection and Affordable Care Act changes may not affect Supervalu’s business directly, but they could indirectly impact Supervalu’s services and/or business practices.
Wage Rates and Paid Leave: Changes in federal or state minimum wage and overtime laws or employee paid leave laws could cause Supervalu to incur additional wage costs, which could adversely affect Supervalu’s operating margins.
Foreign Operations: Supervalu’s supplier base includes domestic and foreign suppliers. Accordingly, political or financial instability in these foreign countries, changes in U.S. and foreign relationships, laws and regulations affecting the importation and taxation of goods, including duties, tariffs and quotas, or changes in the enforcement of those laws and regulations could adversely impact Supervalu’s financial condition and results of operations. In addition, Supervalu is required to comply with laws and regulations governing ethical, anti-bribery and similar business practices such as the Foreign Correct Practices Act. Additionally, foreign currency exchange rates and fluctuations may have an effect on our future costs or on future cash flows from our foreign operations, and could adversely affect our financial condition and results of operations.
Failure to comply with government laws and regulations or make capital expenditures required to maintain compliance with governmental laws and regulations may adversely impact Supervalu’s business operations and prospects for future growth and its ability to participate in federal and state healthcare programs and may also result in monetary liabilities, claims, fines, penalties or other sanctions and may adversely affect Supervalu’s business, financial condition and operating results. Supervalu cannot predict the nature of future laws, regulations, interpretations or applications, nor can Supervalu determine the effect that additional governmental regulations or administrative orders, when and if promulgated, or disparate federal, state and local regulatory schemes would have on Supervalu’s future business.
Supervalu’s businesses may become subject to legal proceedings that may adversely affect Supervalu’s financial condition and results of operations.
Supervalu’s businesses are subject to the risk of legal proceedings by employees, unions, consumers, customers, suppliers, stockholders, debt holders, governmental agencies or others through private actions, class actions, administrative proceedings, regulatory actions or other litigation or proceeding. The outcome of litigation, particularly class action lawsuits and regulatory actions, is difficult to assess or quantify. Plaintiffs in these types of lawsuits may seek recovery of very large amounts, and the magnitude of the potential loss relating to such lawsuits may remain unknown for substantial periods of time. The cost to defend future litigation may be significant. There may also be adverse publicity associated with litigation that may decrease consumer confidence in Supervalu’s businesses, regardless of whether the allegations are valid or whether Supervalu is ultimately found liable. As a result, litigation may adversely affect Supervalu’s financial condition and results of operations. See also “Item 3 Legal Proceedings” below.
15
Efforts to reduce pharmacy reimbursement levels and alter health care financing practices may adversely affect Supervalu’s results of operations.
The continued efforts of health maintenance organizations, managed care organizations, pharmacy benefit managers, government entities and other third party payors to reduce prescription drug costs and pharmacy reimbursement rates may impact Supervalu’s profitability. In particular, increased utilization of generic pharmaceuticals (which normally yield a higher gross profit rate than equivalent brand named drugs) has resulted in pressure to decrease reimbursement payments to Supervalu’s pharmacies for generic drugs, causing a reduction in Supervalu’s generic profit rate. Additionally, there has been significant consolidation within the generic manufacturing industry, and it is possible that this and other external factors may enhance the ability of manufacturers to sustain or increase pricing of generic pharmaceuticals and diminish Supervalu’s ability to negotiate reduced acquisition costs. The increase in preferred pharmacy networks has also had a negative impact on pharmacy reimbursement rates. Any inability to offset increased costs or to modify Supervalu’s activities to lessen the impact could have an adverse effect on Supervalu’s results of operations.
Supervalu may be unable to adequately protect its intellectual property rights, which could harm Supervalu’s business.
Supervalu relies on a combination of trademark, trade secret, copyright and domain name law and internal procedures and nondisclosure agreements to protect its intellectual property. Supervalu believes its trademarks, private label products and domain names are valuable assets. However, Supervalu’s intellectual property rights may not be sufficient to distinguish Supervalu’s products and services from those of its competitors and to provide Supervalu with a competitive advantage. From time to time, third parties may use names, logos and slogans similar to Supervalu’s, may apply to register trademarks or domain names similar to Supervalu’s, and may infringe or otherwise violate Supervalu’s intellectual property rights. Supervalu’s intellectual property rights may not be successfully asserted against such third parties or may be invalidated, circumvented or challenged. Asserting or defending Supervalu’s intellectual property rights could be time consuming and costly and could distract management’s attention and resources. If Supervalu is unable to prevent its competitors from using names, logos, slogans and domain names similar to Supervalu’s, consumer confusion could result, the perception of Supervalu’s brands and products could be negatively affected, and Supervalu’s sales and profitability could suffer as a result. In addition, if Supervalu’s Wholesale customers receive negative publicity or fail to maintain the quality of the goods and services used in connection with Supervalu’s trademarks, Supervalu’s rights to, and the value of, its trademarks could potentially be harmed. Failure to protect Supervalu’s proprietary information could also have an adverse effect on its business.
Supervalu may also be subject to claims that its activities or the products it sells infringe, misappropriate or otherwise violate the intellectual property rights of others. Any such claims can be time consuming and costly to defend and may distract management’s attention and resources, even if the claims are without merit, and may prevent Supervalu from using its trademarks in certain geographies or in connection with certain products and services, any of which could have an adverse effect on Supervalu’s business.
ITEM 1B. UNRESOLVED STAFF COMMENTS
None.
ITEM 2. PROPERTIES
Supervalu’s properties are in good condition, well maintained and suitable to carry on its business. Substantially all of Supervalu’s owned and ground-leased real estate are subject to mortgages to secure Supervalu’s credit facilities. Additional information on Supervalu’s properties can be found in Part I, Item 1 of this Annual Report on Form 10-K.
Distribution Centers
Supervalu operates and manages its distribution centers by geographic region. The following table is a summary of Supervalu’s distribution centers as of February 25, 2017. In March 2017, Supervalu acquired an additional distribution center in Harrisburg, Pennsylvania that has approximately 732 thousand square feet that will eventually replace the Lancaster, Pennsylvania facility that is owned by NAI and operated by Supervalu.
16
Distribution Center | Wholesale Region | Owned Square Footage (Approximate in thousands) | Leased Square Footage (Approximate in thousands) | Total Square Footage (Approximate in thousands) | |||||||
Hopkins, MN | West | 1,847 | — | 1,847 | |||||||
Lancaster, PA | East | — | — | 1,559 | |||||||
Mechanicsville, VA | East | 1,192 | — | 1,192 | |||||||
Champaign, IL | West | 893 | — | 893 | |||||||
Green Bay, WI | West | 433 | 448 | 881 | |||||||
Fort Wayne, IN | West | 856 | — | 856 | |||||||
Quincy, FL | East | 787 | — | 787 | |||||||
Pittsburgh, PA | East | 771 | — | 771 | |||||||
Tacoma, WA | West | 683 | — | 683 | |||||||
Anniston, AL | East | 456 | 105 | 561 | |||||||
St. Louis, MO(1) | n/a | 547 | — | 547 | |||||||
Indianola, MS | East | 540 | — | 540 | |||||||
Stevens Point, WI | West | 431 | — | 431 | |||||||
Fargo, ND | West | 324 | — | 324 | |||||||
Oglesby, IL | West | 321 | — | 321 | |||||||
Billings, MT | West | 239 | — | 239 | |||||||
Anniston, AL | East | 231 | — | 231 | |||||||
Bismarck, ND | West | 210 | — | 210 | |||||||
West Newell, IL | West | 174 | — | 174 | |||||||
Total | 10,935 | 553 | 13,047 | ||||||||
(1) | St. Louis, MO distribution center is dedicated to providing products to the Shop ’n Save retail stores in the St. Louis, Missouri market. |
Retail Stores
Retail operates and manages its properties by retail banner. The following table summarizes Retail stores under each banner as of February 25, 2017:
Retail Banner | Number of Stores | Primary Geographic Market Area | Owned Square Footage (Approximate in thousands) | Leased Square Footage (Approximate in thousands) | Total Square Footage (Approximate in thousands) | |||||||||
Cub Foods(1) | 53 | Minneapolis / St. Paul, Minnesota | 1,132 | 2,452 | 3,584 | |||||||||
Shoppers | 52 | Washington D.C. / Baltimore, Maryland | — | 2,915 | 2,915 | |||||||||
Shop ’n Save | 40 | St. Louis, Missouri | 417 | 1,767 | 2,184 | |||||||||
Farm Fresh | 40 | Virginia Beach, Virginia | 58 | 1,834 | 1,892 | |||||||||
Shop ’n Save | 22 | West Virginia, Maryland, Pennsylvania and Virginia | 122 | 667 | 789 | |||||||||
Hornbacher’s | 8 | Fargo, North Dakota | 167 | 245 | 412 | |||||||||
Rainbow(2) | 2 | Minneapolis / St. Paul, Minnesota | — | 123 | 123 | |||||||||
Total | 217 | 1,896 | 10,003 | 11,899 | ||||||||||
(1) | Cub Foods stores includes stores in which Supervalu has a controlling ownership interest, and excludes Supervalu’s 28 franchised Cub Foods stores in which Supervalu has a minority interest or no interest. |
(2) | Rainbow store count excludes one licensed Rainbow store. |
Corporate
Supervalu had approximately 2 million building square feet of surplus retail stores and warehouses, 94 percent of which was leased, and approximately 2 million of owned vacant land as of February 25, 2017. In April 2017, Supervalu exited approximately 154 thousand leased surplus warehouse square footage.
In addition to its principal executive offices in Eden Prairie, Minnesota, Supervalu maintains a store support center in Boise, Idaho (which is owned by NAI and leased to Supervalu, but at which Supervalu has employees and provides services to NAI and Albertson’s LLC).
17
ITEM 3. LEGAL PROCEEDINGS
Supervalu is subject to various lawsuits, claims and other legal matters that arise in the ordinary course of conducting business. In the opinion of management, based upon currently available facts, the likelihood that the ultimate outcome of any lawsuits, claims and other proceedings will have a material adverse effect on the overall results of Supervalu’s operations, its cash flows or its financial position is remote. See Note 15—Commitments, Contingencies and Off-Balance Sheet Arrangements in Part II, Item 8 of this Annual Report on Form 10-K under the caption “Legal Proceedings” for a discussion of certain of Supervalu’s legal proceedings.
ITEM 4. MINE SAFETY DISCLOSURES
Not applicable.
PART II
ITEM 5. MARKET FOR THE REGISTRANT’S COMMON EQUITY, RELATED STOCKHOLDER MATTERS AND ISSUER PURCHASES OF EQUITY SECURITIES
Supervalu’s common stock is listed on the New York Stock Exchange under the symbol SVU. As of April 21, 2017, there were 16,366 stockholders of record.
Common Stock Price
Common Stock Price Range | ||||||||||||||||
2017 | 2016 | |||||||||||||||
Fiscal | High | Low | High | Low | ||||||||||||
First Quarter | $ | 6.17 | $ | 4.41 | $ | 12.00 | $ | 8.22 | ||||||||
Second Quarter | 5.74 | 4.14 | 9.37 | 7.26 | ||||||||||||
Third Quarter | 5.49 | 4.08 | 8.27 | 6.15 | ||||||||||||
Fourth Quarter | 5.13 | 3.64 | 7.17 | 3.94 | ||||||||||||
Year | $ | 6.17 | $ | 3.64 | $ | 12.00 | $ | 3.94 | ||||||||
Common Stock Dividends
Supervalu did not declare any dividends in fiscal 2016 or fiscal 2017 and Supervalu has no current intent to pay dividends. Supervalu is limited in the aggregate amount of dividends that it may pay under the terms of Supervalu’s term loan facility (the “Secured Term Loan Facility”) and Supervalu’s $1,000 asset-based revolving credit facility (the “Revolving ABL Credit Facility”) and would need to meet certain conditions under these credit facilities before paying a dividend, as described in Note 8—Long-Term Debt in Part II, Item 8 of this Annual Report on Form 10-K. The payment of any future dividends is subject to the discretion of Supervalu’s Board of Directors and the requirements of Delaware law, and will depend on a variety of factors that Supervalu’s Board of Directors may deem relevant.
Purchases of Equity Securities
The following table sets forth Supervalu’s purchases of equity securities for the periods indicated:
(in millions, except shares and per share amounts) Period (1) | Total Number of Shares Purchased (2) | Average Price Paid Per Share | Total Number of Shares Purchased as Part of Publicly Announced Plans or Programs | Approximate Dollar Value of Shares that May Yet be Purchased Under the Plans or Programs | ||||||||||
First four weeks | ||||||||||||||
December 4, 2016 to December 31, 2016 | — | $ | — | — | $ | — | ||||||||
Second four weeks | ||||||||||||||
January 1, 2017 to January 28, 2017 | 123,537 | $ | 4.78 | — | $ | — | ||||||||
Third four weeks | ||||||||||||||
January 29, 2017 to February 25, 2017 | — | $ | — | — | $ | — | ||||||||
Totals | 123,537 | $ | 4.78 | — | $ | — | ||||||||
18
(1) | The reported periods conform to Supervalu’s fiscal calendar composed of thirteen 28-day periods. The fourth quarter of fiscal 2017 contains three 28-day periods. |
(2) | These amounts represent the deemed surrender by participants in Supervalu’s compensatory stock plans of 123,537 shares of previously issued common stock. These amounts are in payment of the purchase price for shares acquired pursuant to the exercise of stock options and satisfaction of tax obligations arising from such exercises, as well as from the vesting of restricted stock awards granted under such plans. |
Stock Performance Graph
The following graph compares the yearly change in Supervalu’s cumulative stockholder return on its common stock for the period from the end of fiscal 2012 to the end of fiscal 2017 to that of the Standard & Poor’s (“S&P”) SmallCap 600, a group of peer companies in the grocery distribution and retail industries, and Supervalu’s fiscal 2016 peer group. The stock price performance shown below is not necessarily indicative of future performance.
COMPARISON OF CUMULATIVE TOTAL SHAREHOLDER RETURN AMONG
Supervalu, S&P SmallCap 600 and Peer Group(1)
February 25, 2012 through February 25, 2017(2)
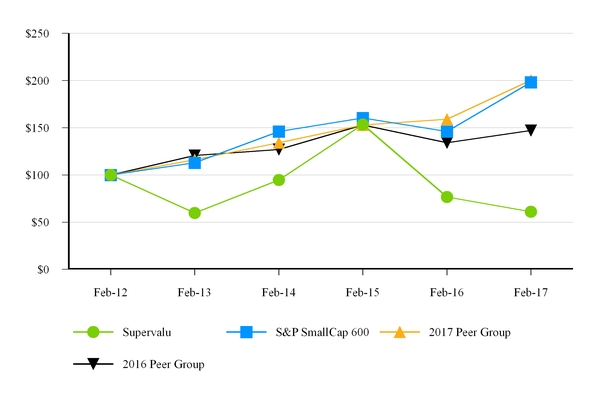
Date | Supervalu | S&P SmallCap 600 | 2017 Peer Group(3) | 2016 Peer Group(4) | ||||||||||||
(in dollars) | ||||||||||||||||
February 24, 2012 | $ | 100.00 | $ | 100.00 | $ | 100.00 | $ | 100.00 | ||||||||
February 22, 2013 | $ | 59.78 | $ | 112.94 | $ | 116.02 | $ | 120.71 | ||||||||
February 21, 2014 | $ | 94.72 | $ | 146.08 | $ | 134.13 | $ | 126.97 | ||||||||
February 27, 2015 | $ | 153.42 | $ | 160.40 | $ | 153.01 | $ | 152.98 | ||||||||
February 26, 2016 | $ | 76.55 | $ | 146.11 | $ | 158.93 | $ | 134.18 | ||||||||
February 24, 2017 | $ | 60.87 | $ | 198.30 | $ | 200.37 | $ | 147.00 | ||||||||
(1) | Total return assuming $100 invested on February 24, 2012 and reinvestment of dividends on the day they were paid. |
(2) | Supervalu’s fiscal year ends on the last Saturday in February. |
(3) | Supervalu revised its peer group in fiscal 2017 to better reflect companies related to Supervalu’s business and strategies, including the sale of Save-A-Lot. Supervalu’s fiscal 2017 peer group consists of SpartanNash Corporation, United Natural Foods, Incorporated, Sysco Corporation and Ingles Incorporated. |
19
(4) | Supervalu’s fiscal 2016 peer group consists of SpartanNash Corporation, Wal-Mart Stores, Inc., Target Corporation, Sysco Corporation, The Fresh Market, Inc., Delhaize Group SA and Roundy’s, Inc. Roundy’s Inc. was included in Supervalu’s peer group until it was acquired in late calendar year 2015. |
The performance graph above is being furnished solely to accompany this Annual Report on Form 10-K pursuant to Item 201(e) of Regulation S-K, is not being filed for purposes of Section 18 of the Exchange Act and shall not be deemed soliciting material, and is not to be incorporated by reference into any filing of Supervalu, whether made before or after the date hereof, regardless of any general incorporation language in such filing.
20
ITEM 6. SELECTED FINANCIAL DATA
(Dollars and shares in millions, except per share data and stores) | 2017 (52 weeks) | 2016 (52 weeks) | 2015 (53 weeks) | 2014 (52 weeks) | 2013 (52 weeks) | ||||||||||||||
Results of Operations | |||||||||||||||||||
Net sales | $ | 12,480 | $ | 12,907 | $ | 13,277 | $ | 12,997 | $ | 13,017 | |||||||||
Cost of sales | 10,693 | 11,033 | 11,379 | 11,111 | 11,345 | ||||||||||||||
Gross profit | 1,787 | 1,874 | 1,898 | 1,886 | 1,672 | ||||||||||||||
Selling and administrative expenses | 1,589 | 1,570 | 1,648 | 1,647 | 1,981 | ||||||||||||||
Goodwill and intangible asset impairment charges | 15 | 6 | — | — | 6 | ||||||||||||||
Operating earnings (loss)(1) | 183 | 298 | 250 | 239 | (315 | ) | |||||||||||||
Interest expense, net(2) | 181 | 195 | 242 | 404 | 269 | ||||||||||||||
Equity earnings in unconsolidated affiliates | (5 | ) | (5 | ) | (4 | ) | (2 | ) | (3 | ) | |||||||||
Earnings (loss) from continuing operations before income taxes(1)(2) | 7 | 108 | 12 | (163 | ) | (581 | ) | ||||||||||||
Income tax (benefit) provision(3) | (20 | ) | 24 | (13 | ) | (69 | ) | (163 | ) | ||||||||||
Net earnings (loss) from continuing operations | 27 | 84 | 25 | (94 | ) | (418 | ) | ||||||||||||
Income (loss) from discontinued operations, net of tax | 627 | 102 | 174 | 283 | (1,038 | ) | |||||||||||||
Net earnings (loss) including noncontrolling interests | 654 | 186 | 199 | 189 | (1,456 | ) | |||||||||||||
Less net earnings attributable to noncontrolling interests | (4 | ) | (8 | ) | (7 | ) | (7 | ) | (10 | ) | |||||||||
Net earnings (loss) attributable to SUPERVALU INC. | $ | 650 | $ | 178 | $ | 192 | $ | 182 | $ | (1,466 | ) | ||||||||
Net earnings (loss) from continuing operations per share— diluted | $ | 0.09 | $ | 0.28 | $ | 0.07 | $ | (0.40 | ) | $ | (2.02 | ) | |||||||
Financial Position of Continuing Operations | |||||||||||||||||||
Working capital(4) | $ | 528 | $ | 248 | $ | 319 | $ | 288 | $ | 50 | |||||||||
Total assets(5) | $ | 3,580 | $ | 3,381 | $ | 3,466 | $ | 3,423 | $ | 3,621 | |||||||||
Total debt and capital lease obligations | $ | 1,475 | $ | 2,514 | $ | 2,689 | $ | 2,729 | $ | 2,806 | |||||||||
Stockholders’ equity (deficit) | $ | 376 | $ | (441 | ) | $ | (646 | ) | $ | (738 | ) | $ | (1,415 | ) | |||||
Other Statistics of Continuing Operations | |||||||||||||||||||
Dividends declared per share | $ | — | $ | — | $ | — | $ | — | $ | 0.0875 | |||||||||
Weighted average shares outstanding—diluted(6) | 268 | 268 | 264 | 258 | 212 | ||||||||||||||
Depreciation and amortization | $ | 207 | $ | 210 | $ | 223 | $ | 242 | $ | 301 | |||||||||
Capital expenditures(7) | $ | 199 | $ | 172 | $ | 162 | $ | 70 | $ | 154 | |||||||||
Adjusted EBITDA(8) | $ | 483 | $ | 527 | $ | 550 | $ | 516 | $ | 229 | |||||||||
Stores Supplied and Operated: | |||||||||||||||||||
Wholesale primary stores | 1,902 | 1,796 | 1,825 | 1,819 | 1,901 | ||||||||||||||
Retail stores | 217 | 200 | 194 | 190 | 191 | ||||||||||||||
Subtotal | 2,119 | 1,996 | 2,019 | 2,009 | 2,092 | ||||||||||||||
Wholesale secondary stores(9) | 244 | 232 | 208 | 424 | 441 | ||||||||||||||
Total number of stores | 2,363 | 2,228 | 2,227 | 2,433 | 2,533 | ||||||||||||||
(1) | Pre-tax items recorded in fiscal 2017 included $42 of non-cash pension settlement charges, a $41 non-cash asset impairment charge, a $15 non-cash goodwill impairment charge and $5 of store closure charges and costs, offset in part by a $9 supply agreement termination fee, a $2 sales and use tax refund and a $1 severance benefit. |
Pre-tax items recorded in fiscal 2016 included $7 of store closure charges and costs, $6 of severance costs and $6 of non-cash intangible asset impairment charges.
Pre-tax items recorded in fiscal 2015 included $64 of non-cash pension settlement charges, a $5 benefit plan charge, $2 of net information technology intrusion costs and $1 of severance costs.
Pre-tax items recorded in fiscal 2014 included $42 of severance costs and accelerated stock-based compensation charges, $13 of non-cash asset impairment and other charges, $6 of contract breakage and other costs and $3 of multi-employer pension withdrawal charges, offset in part by a $15 gain on sale of property.
Pre-tax items recorded in fiscal 2013 included $214 of non-cash asset impairment and other charges, $32 of severance costs, $6 of non-cash intangible asset impairment charges and $4 of multi-employer pension withdrawal charges, offset in part by $10 in a cash settlement received from credit card companies.
(2) | Pre-tax items recorded in fiscal 2017 included $17 of non-cash unamortized financing cost charges and $2 of debt refinancing costs, within Interest expense, net. |
Pre-tax items recorded in fiscal 2016 included $6 of debt refinancing costs and $4 of non-cash unamortized financing cost charges, within Interest expense, net.
Pre-tax items recorded in fiscal 2015 included $37 of debt refinancing costs and $6 of non-cash unamortized financing cost charges, within Interest expense, net.
21
Pre-tax items recorded in fiscal 2014 included $99 of non-cash unamortized financing cost charges and original issue discount acceleration and $75 of debt refinancing costs, within Interest expense, net.
A pre-tax item recorded in fiscal 2013 included $22 of non-cash unamortized financing charges within Interest expense, net.
(3) | Tax items recorded in fiscal 2017 included discrete deferred tax benefits of $9. These tax items and amounts do not contemplate the tax effect of the pre-tax items noted in footnotes (1) and (2) above. |
(4) | Working capital of continuing operations is calculated using the first-in, first-out method (“FIFO”), after adding back the last-in, first-out method (“LIFO”) reserve. The LIFO reserve for each year is as follows: $216 for fiscal 2017, $215 for fiscal 2016, $211 for fiscal 2015, $202 for fiscal 2014 and $211 for fiscal 2013. Current assets of discontinued operations at the end of each fiscal year were as follows: $0 for fiscal 2017, $376 for fiscal 2016, $410 for fiscal 2015, $329 for fiscal 2014 and $1,788 for fiscal 2013. Current liabilities of discontinued operations at the end of each fiscal year were as follows: $0 for fiscal 2017, $346 for fiscal 2016, $335 for fiscal 2015, $315 for fiscal 2014 and $2,997 for fiscal 2013. |
(5) | Total assets of continuing operations are calculated as Total assets of Supervalu excluding current assets and long-term assets of discontinued operations. |
(6) | Weighted average shares outstanding—diluted, as presented here, represents the diluted weighted average shares outstanding utilized in the computation of Net earnings (loss) from continuing operations per share—diluted. |
(7) | Capital expenditures include cash payments for purchases of property, plant and equipment and non-cash capital lease additions, and exclude cash payments for business acquisitions. |
(8) | Adjusted EBITDA is a non-GAAP financial measure that Supervalu provides as a supplement to results of operations and related analysis, and should not be considered superior to, a substitute for or an alternative to any financial measure of performance prepared and presented in accordance with GAAP (defined below). Refer to the “Non-GAAP Financial Measures” section of Part II, Item 7 of this Annual Report on Form 10-K for a reconciliation to the applicable GAAP financial measure and additional information regarding Supervalu’s use of non-GAAP financial measures. |
(9) | Wholesale secondary stores is defined as a customer location that falls under a certain dollar threshold of Wholesale sales for each of the last three fiscal periods in a given quarter. |
Historical data is not necessarily indicative of Supervalu’s future results of operations or financial condition. See discussion of “Risk Factors” in Part I, Item 1A of this Annual Report on Form 10-K.
ITEM 7. MANAGEMENT’S DISCUSSION AND ANALYSIS OF FINANCIAL CONDITION AND RESULTS OF OPERATIONS
(Dollars and shares in millions, except per share data)
This Management’s Discussion and Analysis of Financial Condition and Results of Operations should be read in conjunction with the audited Consolidated Financial Statements and the information contained under the captions “Risk Factors” and “Cautionary Statements for Purposes of the Safe Harbor Provisions of the Private Securities Litigation Reform Act” contained in this Annual Report on Form 10-K.
The results of operations, financial position and cash flows of Save-A-Lot are reported as discontinued operations for all periods presented.
EXECUTIVE OVERVIEW
Business Overview
Supervalu is the largest public company grocery distributor to wholesale customers across the United States through its Wholesale segment, operates five retail grocery banners in six geographic regions through its Retail segment and provides professional service solutions to Wholesale customers and other entities, the results of which are included within Wholesale or Corporate depending on the customer type. Supervalu leverages its distribution operations by providing wholesale distribution and logistics service solutions to Wholesale customers as well as wholesale distribution to Supervalu’s Retail stores. Supervalu’s business is classified by management into two reportable segments: Wholesale and Retail.
Business Strategies and Initiatives
Supervalu’s vision, which continues to guide its strategic and operational decisions, is to become the leading distributor of consumable products and provider of services to retailers in the United States. Initiatives in each of Supervalu’s segments include:
Wholesale:
• | Retaining existing customers by differentiating ourselves through our service levels, pricing, product offerings and growing professional services offerings |
• | Growing our business with existing customers by marketing our fresh product offerings, such as produce, and Supervalu’s professional services offerings, including merchandise and promotional planning, design and administrative back-office solutions |
22
• | Targeting sales growth by affiliating new customers, including larger chain businesses, and aggressively pursuing external growth and market opportunities |
• | Improving the efficiency of Supervalu’s operations, including its information technology infrastructure and maximizing the use of trucking miles and warehouse capacity |
• | Strengthening core merchandising and marketing programs, including leveraging Supervalu’s private-label programs, such as the Essential Everyday® and Equaline® labels, while marketing and adding depth to the Wild Harvest® and Culinary Circle® brands |
Retail:
• | Driving profitable sales by investing in price and promotions, and enhancing product offerings and merchandising displays |
• | Driving improved store performance, including reducing inventory shrink rates and levels of out-of-stocks, through standardizing certain store processes |
• | Continued development and introduction of Supervalu’s private-label products, including organic products, by providing innovative products in multiple channels across Retail and Wholesale |
• | Investing capital in new stores, relocations and targeted store remodels |
Corporate:
• | Continued management of Supervalu’s overhead cost structure to enable investments in lower prices to customers |
• | Providing high-quality administrative support services by enhancing Supervalu’s service offerings and information technology systems |
• | Leverage our professional services capabilities to grow our services business |
Fiscal 2017 Overview
Wholesale Business Developments
In fiscal 2017, Supervalu affiliated several large Wholesale customers through long-term supply agreements, which we expect to contribute meaningfully to Wholesale revenue growth in fiscal 2018. These affiliations included the following:
• | In November 2016, Supervalu entered into a long-term supply agreement to serve as a grocery wholesaler and distributor to America’s Food Basket, a regional cooperative that serves 47 neighborhood stores located primarily in New York and parts of New England. Supervalu completed the transition of these stores at the end of the fourth quarter of fiscal 2017. |
• | Supervalu began transitioning over 170 stores operated by The Fresh Market in late February 2017 under the long-term supply agreement entered into with The Fresh Market in August 2016 and has now completed this onboarding process. |
• | Supervalu completed the transition of and began supplying approximately 70 Marsh Supermarkets and O’Malia Food Markets under the long-term supply agreement Supervalu entered into with Marsh Supermarkets in August 2016. |
Retail Business Developments
In September 2016, Supervalu paid $17 to acquire 22 Food Lion stores located in northern West Virginia, western Maryland, south central Pennsylvania and northwestern Virginia. The acquired stores, included in Supervalu’s Retail segment, were converted to Supervalu’s Shop ‘n Save format currently used by certain of Supervalu’s Wholesale customers in those regions.
Sale of Save-A-Lot
On December 5, 2016, Supervalu completed the sale of its Save-A-Lot business, for a purchase price of $1,365 in cash, subject to customary closing adjustments that reduced the purchase price by approximately $61. In connection with the completion of the sale, on December 5, 2016, Supervalu and Moran Foods entered into a Services Agreement, whereby Supervalu is providing certain professional services to Save-A-Lot for a period of five years, on and subject to the terms and conditions set forth therein. The results of operations, financial position and cash flows of Save-A-Lot are reported as discontinued operations for all periods presented.
Supervalu used a portion of the cash proceeds from the sale of Save-A-Lot, net of transaction-related fees, expenses and taxes, to make a mandatory prepayment of $832 against Supervalu’s outstanding balance under its Secured Term Loan Facility, that caused Supervalu’s Total Secured Leverage Ratio, on a pro forma basis giving effect to such prepayment, to be no higher than 1.50:1.00. Supervalu also used a portion of the net cash proceeds to repay the outstanding balance under its Revolving ABL Credit Facility and to make a $25 contribution to the SUPERVALU Retirement Plan as required under the agreement Supervalu entered into with the Pension Benefit Guaranty Corporation (“PBGC”) in connection with the sale. The agreement with the PBGC required Supervalu to contribute an additional $35 to the SUPERVALU Retirement Plan, which Supervalu fulfilled in the fourth quarter of fiscal 2017.
23
The following table provides the composition of the gain on the sale:
2017 (52 weeks) | |||
Purchase price | $ | 1,304 | |
Disposed of balance sheet assets and liabilities, net | (635 | ) | |
Transaction costs and other | (32 | ) | |
Pre-tax gain on sale | 637 | ||
Income tax provision | (60 | ) | |
After-tax gain on sale | $ | 577 | |
Income taxes on the gain were recorded at a significantly reduced effective rate due to the anticipated utilization of capital loss carryforwards and the release of valuation allowances of approximately $244. Income tax on the gain on sale of Save-A-Lot are expected to be paid in Supervalu’s first quarter of fiscal 2018. The closing adjustments under the SAL merger agreement are subject to finalization, which may impact the final calculation of the purchase price and gain on sale. Supervalu believes that any potential adjustment to the purchase price from the closing adjustments will be insignificant.
Prior to the sale of Save-A-Lot, Supervalu assessed the carrying value of its assets held-for-sale for impairment and determined the carrying value of the Save-A-Lot corporate stores reporting unit was in excess of its fair value. As a result, Supervalu recorded a non-cash goodwill impairment charge of $37 in the third quarter of fiscal 2017.
Continuing Operations Financial Highlights for Fiscal 2017 Compared to Fiscal 2016:
• | Net sales were $12,480, a decrease of $427 or 3.3 percent, primarily due to lower sales from Wholesale customers primarily lost last year, lower identical store sales in our Retail business, lower sales to existing Wholesale customers and lower sales from closed Retail stores, offset in part by higher sales from new Wholesale customers and stores, and newly acquired Retail stores. |
• | Gross profit was $1,787, a decrease of $87 or 4.6 percent, which primarily reflects declines in Retail and Wholesale sales, lower fees earned under services agreements and lower base margins, offset in part by higher vendor allowances. |
• | Operating earnings were $183, a decrease of $115, which reflects $72 of higher net charges and costs compared to last year, primarily due to a pension settlement charge, an asset impairment charge, a goodwill impairment charge and store closure charges and costs in fiscal 2017, offset in part by a supply agreement termination fee and other items in fiscal 2017, offset by an intangible asset impairment charge, store closure charges and costs and severance costs last year. When adjusted for these items (refer to the Operating Earnings section below for descriptions of these charges and costs), Operating earnings decreased $43, primarily due to lower gross profit from decreased sales, higher employee costs, lower fees earned under services agreements and lower base margins, partially offset by lower pension expense and higher vendor allowances. |
• | Interest expense, net was $181, a decrease of $14, primarily due to lower average outstanding debt balances. |
• | Net earnings from continuing operations was $27, a decrease of $57, and diluted net earnings per share from continuing operations decreased $0.19, in each case, primarily due to the items described above. |
• | Net cash provided by operating activities of continuing operations was $308, an increase of $63, primarily due to lower levels of cash utilized in operating assets and liabilities, offset in part by lower cash generated from earnings and higher contributions to benefit plans. |
• | Net cash used in investing activities of continuing operations was $198, an increase of $11, primarily due to an increase in cash paid for capital expenditures and business acquisitions, offset in part by a decrease in cash paid for other intangible assets. |
• | Net cash used in financing activities of continuing operations was $1,106, an increase of $914, primarily due to a net increase in cash paid towards debt and capital lease obligations, including required prepayments of outstanding loans under the Secured Term Loan Facility of $832 following the sale of Save-A-Lot and $99 from fiscal 2016 Excess Cash Flow (as defined in the facility), and a decrease in proceeds from the sale of common stock, offset in part by proceeds from the increased borrowings under the Revolving ABL Credit Facility, lower distributions to noncontrolling interests and lower debt financing cost payments. |
Agreement to Acquire Unified Grocers
On April 10, 2017, Supervalu, a newly formed wholly owned subsidiary of Supervalu (“UG Merger Sub”), and Unified Grocers, Inc. (“Unified Grocers”), entered into an Agreement and Plan of Merger (the “UG Merger Agreement”) pursuant to which Supervalu agreed to acquire Unified Grocers in a transaction valued at approximately $375, comprised of approximately $114 in cash for 100% of the outstanding stock of Unified Grocers plus the assumption and payoff of Unified Grocers’ net debt at closing (approximately $261 as of April 1, 2017). Founded in 1922, Unified Grocers is a retailer-owned wholesale grocery
24
distribution cooperative that supplies independent retailers throughout the western United States and has annual sales of approximately $3.8 billion. Supervalu expects to use cash on hand and available liquidity under its credit facilities to fund the acquisition and payoff Unified Grocers’ net debt.
On the terms and subject to the conditions set forth in the UG Merger Agreement, at the closing of the transactions contemplated thereby (the “UG Closing”), UG Merger Sub will merge with and into Unified Grocers (the “UG Merger”) with Unified Grocers surviving the UG Merger as a wholly owned subsidiary of Supervalu, and the shares of Unified Grocers will be converted into the right to receive from Supervalu at the UG Closing approximately $114 in cash in the aggregate.
As further provided in the UG Merger Agreement, the consummation of the transactions contemplated by the UG Merger Agreement is subject to certain closing conditions, including (i) approval of the UG Merger by the shareholders of Unified Grocers, (ii) any applicable waiting periods (or extensions thereof) under the Hart-Scott-Rodino Antitrust Improvements Act of 1976 having expired or been terminated, (iii) the absence of any order by any governmental entity that restrains, enjoins or otherwise prohibits the UG Merger, (iv) the accuracy of the representations and warranties of the parties (generally subject to a material adverse effect standard), (v) material compliance by the parties with their respective obligations under the UG Merger Agreement, (vi) no material adverse effect having occurred with respect to the Unified Grocers business after entry into the UG Merger Agreement, and (vii) other customary closing conditions. The transaction is currently expected to be completed in mid- to late summer 2017.
Under the terms of the UG Merger Agreement, Supervalu will be entitled to receive a termination fee of $8, plus reimbursement of up to $1 in costs and expenses, in the event that the UG Merger Agreement is terminated by Unified Grocers under certain circumstances, including as a result of a change in the recommendation of the board of directors of Unified Grocers. In addition, a reverse termination fee of $9.5 may be payable by Supervalu to Unified Grocers upon termination of the UG Merger Agreement under certain circumstances, including if Supervalu is unable to obtain antitrust approval before January 5, 2018.
In connection with entry into the UG Merger Agreement, Supervalu entered into voting agreements with each shareholder of Unified Grocers that has a representative on the board of directors of Unified Grocers. The voting agreements require such shareholders to vote shares over which they have voting control in favor of the approval of the UG Merger and the UG Merger Agreement.
Impact of Inflation and Deflation
Supervalu monitors product cost inflation and deflation and evaluates whether to absorb cost increases or decreases, or pass on pricing changes. Supervalu has experienced a mix of inflation and deflation across product categories within its business segments during fiscal 2017.
In aggregate across all of Supervalu’s businesses and taking into account the mix of products, management estimates Supervalu’s businesses experienced low single digit cost deflation in fiscal 2017. The Wholesale and Retail business segments sustained higher levels of cost deflation within the meat, egg and produce product categories. Cost deflation estimates are based on individual like items sold by Supervalu during the periods being compared.
Changes in merchandising, customer buying habits and competitive pressures create inherent difficulties in measuring the impact of inflation and deflation on Net sales and Gross profit. Absent any changes in units sold or the mix of units sold, deflation has the effect of decreasing sales.
Competitive Environment
The United States grocery business is highly competitive and management expects operating results will continue to be impacted by the effects of operating in a highly competitive and price-sensitive marketplace. In fiscal 2017, Supervalu’s Retail segment was impacted to a greater degree than anticipated by price competition, competitive store openings and a challenging sales and operating environment. This environment contributed to lower sales from identical retail stores, which impacted gross profit and operating earnings. These factors affecting the Retail segment are expected to impact fiscal 2018 as well.
25
RESULTS OF OPERATIONS
Consolidated results of operations for fiscal 2017, 2016 and 2015 are as follows:
2017 (52 weeks) | 2016 (52 weeks) | 2015 (53 weeks) | ||||||||||||||||||
Net sales | $ | 12,480 | 100.0 | % | $ | 12,907 | 100.0 | % | $ | 13,277 | 100.0 | % | ||||||||
Cost of sales | 10,693 | 85.7 | 11,033 | 85.5 | 11,379 | 85.7 | ||||||||||||||
Gross profit | 1,787 | 14.3 | 1,874 | 14.5 | 1,898 | 14.3 | ||||||||||||||
Selling and administrative expenses | 1,589 | 12.7 | 1,570 | 12.2 | 1,648 | 12.4 | ||||||||||||||
Goodwill and intangible asset impairment charges | 15 | 0.1 | 6 | — | — | — | ||||||||||||||
Operating earnings | 183 | 1.5 | 298 | 2.3 | 250 | 1.9 | ||||||||||||||
Interest expense, net | 181 | 1.4 | 195 | 1.5 | 242 | 1.8 | ||||||||||||||
Equity in earnings of unconsolidated affiliates | (5 | ) | — | (5 | ) | — | (4 | ) | — | |||||||||||
Earnings from continuing operations before income taxes | 7 | 0.1 | 108 | 0.8 | 12 | 0.1 | ||||||||||||||
Income tax (benefit) provision | (20 | ) | (0.2 | ) | 24 | 0.2 | (13 | ) | (0.1 | ) | ||||||||||
Net earnings from continuing operations | 27 | 0.2 | 84 | 0.6 | 25 | 0.2 | ||||||||||||||
Income from discontinued operations, net of tax | 627 | 5.0 | 102 | 0.8 | 174 | 1.3 | ||||||||||||||
Net earnings including noncontrolling interests | 654 | 5.2 | 186 | 1.4 | 199 | 1.5 | ||||||||||||||
Less net earnings attributable to noncontrolling interests | (4 | ) | — | (8 | ) | (0.1 | ) | (7 | ) | (0.1 | ) | |||||||||
Net earnings attributable to SUPERVALU INC. | $ | 650 | 5.2 | % | $ | 178 | 1.4 | % | $ | 192 | 1.4 | % | ||||||||
Basic net earnings per share attributable to SUPERVALU INC.: | ||||||||||||||||||||
Continuing operations | $ | 0.09 | $ | 0.29 | $ | 0.07 | ||||||||||||||
Discontinued operations | $ | 2.37 | $ | 0.39 | $ | 0.67 | ||||||||||||||
Basic net earnings per share | $ | 2.45 | $ | 0.68 | $ | 0.74 | ||||||||||||||
Diluted net earnings per share attributable to SUPERVALU INC.: | ||||||||||||||||||||
Continuing operations | $ | 0.09 | $ | 0.28 | $ | 0.07 | ||||||||||||||
Discontinued operations | $ | 2.34 | $ | 0.38 | $ | 0.66 | ||||||||||||||
Diluted net earnings per share | $ | 2.43 | $ | 0.66 | $ | 0.73 | ||||||||||||||
The following discussion summarizes operating results for fiscal 2017 compared to fiscal 2016, and fiscal 2016 compared to fiscal 2015. References to last year refer to fiscal 2016.
Net Sales
The following table outlines the composition of and variances in Net sales, which are discussed in the paragraphs below:
Fiscal Year | Variance | ||||||||||||||||||
2017 (52 weeks) | 2016 (52 weeks) | 2015 (53 weeks) | 2017 Change | 2016 Change | |||||||||||||||
Wholesale | $ | 7,705 | $ | 7,935 | $ | 8,198 | $ | (230 | ) | $ | (263 | ) | |||||||
Retail | 4,596 | 4,769 | 4,884 | (173 | ) | (115 | ) | ||||||||||||
Corporate | 179 | 203 | 195 | (24 | ) | 8 | |||||||||||||
Total Net sales | $ | 12,480 | $ | 12,907 | $ | 13,277 | $ | (427 | ) | $ | (370 | ) | |||||||
Fiscal 2017 Compared to Fiscal 2016
Wholesale’s net sales decreased primarily due to $514 of lower sales from Wholesale customers primarily lost last year that Supervalu no longer supplies, including lost primary stores for which Supervalu continues to supply certain product categories, $84 of lower sales to existing customers, and $54 of lower military sales, offset in part by $277 from increased sales to new customers, $141 from increased sales to new stores of existing customers and $4 of higher other revenue. Lost sales to stores no longer supplied by Supervalu include certain Albertson’s LLC stores in the Southeast region that have transitioned to self-distribution and reflect that Supervalu is no longer supplying Haggen and Gordy’s stores. Supervalu anticipates new customer sales to more than offset the existing lost business in fiscal 2018, as was seen in the third and fourth quarters of fiscal 2017.
26
Retail’s net sales decreased primarily due to $245 of lower sales from negative identical store sales primarily driven by lower customer counts and lower average basket size, $54 of lower sales from closed stores and $15 of lower other revenue, including fuel sales, offset in part by a sales increase of $71 from new stores and $70 from acquired stores. In fiscal 2018, Supervalu expects identical store sales to be negative.
Corporate’s net sales decreased primarily due to $31 of lower fees under transition services agreements from a lower number of stores serviced, offset in part by $7 of higher sales from the professional services agreement with Save-A-Lot that began in December 2016.
Revenues generated from existing transition services agreements with Albertson’s LLC and NAI, which are expected to wind-down over the next approximately two to three years, are anticipated to contribute to lower Corporate net sales and operating earnings in fiscal 2018. In fiscal 2018, Supervalu expects transition services agreement revenue to decrease approximately $40, which will be partially offset by increases in revenue from the professional services agreement with Save-A-Lot.
Fiscal 2016 Compared to Fiscal 2015
Wholesale’s net sales decrease included a contribution of $143 from the additional week in fiscal 2015. Excluding the additional week of sales in fiscal 2015, Wholesale net sales decreased $120 primarily due to $286 of lower sales from lost customers and $210 of lower sales to existing customers, offset in part by $375 of higher sales from new stores operated by new and existing customers.
Retail’s net sales decrease included a contribution of $87 from the additional week in fiscal 2015. Excluding the additional week of sales in fiscal 2015, Retail net sales decreased $28 primarily due to $109 of negative identical store sales, $26 of lower sales from closed stores and $14 from lower fuel sales, offset in part by $122 of higher sales from acquired and new stores. Management believes the lower Retail identical store sales and customer count in fiscal 2016 compared to fiscal 2015 were driven by adjustments to pricing and promotional activity to partially mitigate compressed pharmacy margins.
Corporate’s net sales increase was net of a decrease from the additional week in fiscal 2015 which previously contributed $4 to net sales. Excluding the additional week of sales in fiscal 2015, Corporate net sales increased $12 due to additional transition service fees from the transition services agreement with Haggen and wind-down transition service revenues from Albertson’s LLC and NAI, offset in part by lower TSA fees from a lower number of NAI and Albertson’s LLC stores under their TSA.
Retail Identical Store Sales Variances
The following table summarizes identical store sales variances in percentages for Supervalu’s Retail segment compared to the prior fiscal year:
Fiscal Year Variance | |||||
2017 (52 weeks) | 2016 (52 weeks) | ||||
Identical store sales percent variance(1) | (5.5 | )% | (2.5 | )% | |
Average basket percent variance(2) | (1.0 | )% | 0.7 | % | |
Customer count percent variance(3) | (4.5 | )% | (3.2 | )% | |
(1) | Retail identical store sales are defined as net sales from stores operating for four full quarters, including store expansions and excluding fuel and announced planned store dispositions. The variance calculation for fiscal 2016 excludes the additional week of sales from fiscal 2015. |
(2) | Average basket is defined as the average purchases by Supervalu’s customers per transaction within its Retail stores operating for four full quarters, including store expansions and excluding fuel and planned store dispositions. |
(3) | Customer count is defined as the number of transactions by Supervalu’s customers within its Retail stores operating for four full quarters, including store expansions and excluding fuel and planned store dispositions. |
27
Gross Profit
The following table outlines the composition of and variances in Gross profit, which are discussed in the paragraphs below:
Fiscal Year | Variance | ||||||||||||||||||
2017 (52 weeks) | 2016 (52 weeks) | 2015 (53 weeks) | 2017 Change | 2016 Change | |||||||||||||||
Wholesale | $ | 367 | $ | 383 | $ | 388 | $ | (16 | ) | $ | (5 | ) | |||||||
% of Wholesale sales | 4.8 | % | 4.8 | % | 4.7 | % | — | % | 0.1 | % | |||||||||
Retail | 1,241 | 1,288 | 1,317 | (47 | ) | (29 | ) | ||||||||||||
% of Retail sales | 27.0 | % | 27.0 | % | 27.0 | % | — | % | — | % | |||||||||
Corporate | 179 | 203 | 193 | (24 | ) | 10 | |||||||||||||
Total Gross profit | $ | 1,787 | $ | 1,874 | $ | 1,898 | $ | (87 | ) | $ | (24 | ) | |||||||
% of total Net sales | 14.3 | % | 14.5 | % | 14.3 | % | (0.2 | )% | 0.2 | % | |||||||||
Fiscal 2017 Compared to Fiscal 2016
Wholesale gross profit decreased $16, and was flat to last year as a percentage of net sales, primarily due to $30 of lower gross margin from net decreased sales driven by lost customers, $18 of higher employee-related costs driven by higher distribution center labor rates and hours incurred and $3 of higher logistics costs, offset in part by $21 of higher vendor allowances, $6 of favorable inventory reclamation, $4 of reduced costs from incremental vendor back-haul allowances and $3 of lower pension expense.
Retail gross profit decreased $47, and was flat to last year as a percentage of net sales. Retail gross profit included $1 of store closure charges and costs related to inventory write-downs. When adjusted for this item, Retail gross profit decreased $46 primarily due to $52 of lower gross margin from net decreased sales, including the impact of incremental gross margin from acquired stores, and $21 of lower gross margins driven by strategic investments to lower prices to customers, offset in part by $10 of higher vendor allowances, $9 of lower inventory shrink costs, $4 of lower employee-related costs and $3 of lower logistics costs.
Corporate gross profit decreased $24 primarily due to a lower number of stores serviced under transition services agreements, net of fees earned under the professional services agreement with Save-A-Lot, discussed in the net sales variances above. The shared service center costs incurred to support back office functions related to the services agreements represent administrative overhead and are recorded in Selling and administrative expenses.
Fiscal 2016 Compared to Fiscal 2015
Wholesale gross profit decreased $5 or increased 10 basis points as a percentage of net sales. The additional week in fiscal 2015 contributed approximately $8 to Wholesale gross profit. Excluding the additional week, Wholesale gross profit increased $3 primarily due to $14 of higher base margins primarily from vendor rebates and allowances, $11 of lower logistics costs, $4 of higher trucking back-haul income and $3 of lower pension expense, offset in part by $19 of higher employee-related costs and $10 of higher occupancy costs primarily associated with new distribution center capacity and repair and maintenance expenses on existing facilities.
Retail gross profit decreased $29 and was flat as a percentage of net sales. The additional week in fiscal 2015 contributed approximately $25 to Retail gross profit. Excluding the additional week, Retail gross profit decreased $4 primarily due to $14 of higher inventory shrink costs and $7 of lower gross profit from lower sales, offset in part by $7 of higher base margins, $6 of lower logistics costs and $5 of lower employee-related costs.
Corporate gross profit increased by $10. The additional week in fiscal 2015 contributed $4 to Corporate gross profit. Excluding the additional week, Corporate gross profit increased by $14, primarily due to the variances discussed in Corporate net sales above.
Selling and Administrative Expenses
Fiscal 2017 Compared to Fiscal 2016
Selling and administrative expenses for fiscal 2017 were $1,589 compared with $1,570 last year, an increase of $19 or 1.2 percent. Selling and administrative expenses for fiscal 2017 included net charges and costs of $75, comprised of non-cash pension settlement charges of $42, a non-cash asset impairment charge of $41 and store closure charges and costs of $4, offset in part by a supply agreement termination fee of $9, a sales and use tax refund of $2 and a severance benefit of $1. Last year’s Selling and
28
administrative expenses included net charges and costs of $13, comprised of store closure charges and costs of $7 and severance costs of $6. When adjusted for these items, the remaining decrease of $43 in Selling and administrative expenses is primarily due to $53 of lower pension expense, $8 of lower other operating costs, $7 of lower bad debt expense and $5 of lower depreciation expense, offset in part by $25 of higher total employee costs driven by higher Retail employee costs from new stores and $5 of higher contracted services.
Fiscal 2016 Compared to Fiscal 2015
Selling and administrative expenses for fiscal 2016 were $1,570 compared with $1,648 for fiscal 2015, a decrease of $78 or 4.7 percent. Selling and administrative expenses for fiscal 2016 included net charges and costs of $13, comprised of store closure charges and costs of $7 and severance costs of $6. Selling and administrative expenses for fiscal 2015 included net charges and costs of $72, comprised of non-cash pension settlement charges of $64, a benefit plan charge of $5, information technology intrusion costs, net of insurance recoverable, of $2 and severance costs of $1. The additional week in fiscal 2015 contributed approximately $23 to Selling and administrative expenses. When adjusted for these items, Selling and administrative expenses increased $4 primarily due to $16 of lower depreciation expense and $4 of lower occupancy costs, offset in part by $8 of higher pension expense, $7 from lower other administrative costs primarily due to death benefits and fees received from a supply agreement termination in fiscal 2015, and higher expenses from independent retailer marketing costs in fiscal 2016, $4 of higher payment processing and bad debt expense and $4 of higher contracted services costs.
Goodwill and Intangible Asset Impairment Charges
During fiscal 2017, Supervalu conducted an interim impairment review of the carrying value of its reporting units in conjunction with its impairment review of Save-A-Lot’s goodwill and due to declines in sales and cash flows within Retail. The review indicated that the estimated fair value of the Wholesale reporting unit was substantially in excess of 100 percent of its carrying value. The review also indicated that the carrying value of the Retail reporting unit exceeded its estimated fair value, as determined utilizing the income approach and market approach. As a result, Supervalu performed the step 2 assessment and recorded a non-cash goodwill impairment charge of $15 in the Retail segment during the third quarter of fiscal 2017. The calculation of the impairment charge contains significant judgments and estimates including weighted average cost of capital, future revenue, profitability, cash flows and fair values of assets and liabilities.
During fiscal 2016, Supervalu received a notice pursuant to which it could exercise certain purchase options. As a result, Supervalu performed a review of the associated indefinite-lived intangible assets for impairment, which indicated the carrying value of the intangible assets exceeded its estimated value, and a non-cash intangible asset impairment charge of $6 was recorded within Wholesale.
Operating Earnings
The following table outlines the composition of and variances in Operating earnings, which are discussed in the paragraphs below:
Fiscal Year | Variance | ||||||||||||||||||
2017 (52 weeks) | 2016 (52 weeks) | 2015 (53 weeks) | 2017 Change | 2016 Change | |||||||||||||||
Wholesale | $ | 238 | $ | 230 | $ | 243 | $ | 8 | $ | (13 | ) | ||||||||
% of Wholesale sales | 3.1 | % | 2.9 | % | 3.0 | % | 0.2 | % | (0.1 | )% | |||||||||
Retail | (45 | ) | 94 | 122 | (139 | ) | (28 | ) | |||||||||||
% of Retail sales | (1.0 | )% | 2.0 | % | 2.5 | % | (3.0 | )% | (0.5 | )% | |||||||||
Corporate | (10 | ) | (26 | ) | (115 | ) | 16 | 89 | |||||||||||
Total Operating earnings | $ | 183 | $ | 298 | $ | 250 | $ | (115 | ) | $ | 48 | ||||||||
% of total Net sales | 1.5 | % | 2.3 | % | 1.9 | % | (0.8 | )% | 0.4 | % | |||||||||
Fiscal 2017 Compared to Fiscal 2016
Wholesale operating earnings for fiscal 2017 increased $8, or 20 basis points as a percentage of net sales. Wholesale operating earnings for fiscal 2017 include a fee received from a supply agreement termination of $9. Last year’s Wholesale operating earnings included an intangible asset impairment charge of $6. When adjusted for these items, the remaining decrease of $7 in Wholesale operating earnings is primarily due to $30 of lower gross margin from net decreased sales driven by lost customers and $19 of higher employee-related costs driven by higher distribution center labor rates and hours incurred, offset in part by $21 of higher vendor allowances, $7 of lower bad debt expense and customer recoveries, $6 of favorable inventory reclamation, $4 of reduced costs from incremental vendor back-haul allowances and $3 of lower pension expense.
29
Retail operating earnings for fiscal 2017 decreased $139, or 300 basis points as a percentage of net sales. Retail operating loss for fiscal 2017 included a non-cash asset impairment charge of $41, a non-cash goodwill impairment charge of $15 and store closure charges and costs of $5. Last year’s Retail operating earnings included store closure charges and costs of $1. When adjusted for these items, the remaining decrease in Retail operating earnings of $79 is primarily due to $53 of lower gross margin from net decreased sales, including the impact of incremental gross margin from acquired and new stores, $21 of lower base margins driven by strategic investment to lower prices to customers, $21 of higher employee-related costs driven by existing, acquired and new stores, net of lower costs from closed stores, $5 of higher occupancy costs driven by acquired stores, $5 of higher other operating expenses and $3 of higher contracted services costs, offset in part by $10 of higher vendor allowances, $9 of lower inventory shrink costs, $7 of lower depreciation expense and $3 of lower logistics costs. In fiscal 2018, Supervalu expects identical store sales to be negative, which will negatively impact Retail operating earnings.
Corporate operating loss for fiscal 2017 decreased $16. Corporate operating loss for fiscal 2017 included non-cash pension settlement charges of $42, offset in part by a sales and use tax refund of $2 and a severance benefit of $1. Last year’s Corporate operating loss included severance costs of $6, and store closure charges and costs of $6. When adjusted for these items, the remaining increase in Corporate operating earnings of $43 is primarily due to $51 of lower pension expense, $9 of lower salary, wages and incentive compensation, $8 of lower infrastructure costs driven by information technology, $3 of lower bad debt expense and $3 of lower other operating expenses, offset in part by $24 of lower fees earned under services agreements discussed in Corporate net sales above and $7 of higher employee benefit costs. In fiscal 2018, the expected $40 decrease in transition services agreement revenue from Albertson’s LLC and NAI is expected to negatively impact Corporate operating loss in an amount equal to approximately three-quarters of the lost revenue.
Fiscal 2016 Compared to Fiscal 2015
Wholesale operating earnings for fiscal 2016 decreased $13, or 10 basis points as a percentage of net sales. Wholesale operating earnings for fiscal 2016 included $6 of an intangible asset impairment charge. Wholesale operating earnings for fiscal 2015 included $1 of severance costs. The additional week in fiscal 2015 contributed approximately $7 to Wholesale operating earnings. When adjusted for these items, the remaining $1 decrease in Wholesale operating earnings is primarily due to $20 of higher employee-related costs, $9 of higher occupancy costs primarily associated with new distribution center capacity and repair and maintenance expenses on existing facilities, $7 of higher administrative costs as a result of fees received from a supply agreement termination for fiscal 2015 and higher expenses from independent retailer marketing costs in fiscal 2016, offset in part by $14 of higher base margins primarily from vendor rebates and allowances, $11 of lower logistics costs primarily from lower diesel costs, $4 of higher trucking back-haul income and $3 of lower pension expense.
Retail operating earnings for fiscal 2016 decreased $28, or 50 basis points as a percentage of net sales. Retail operating earnings for fiscal 2016 include $1 of store closure charges and costs. The additional week in fiscal 2015 contributed approximately $7 to Retail operating earnings. When adjusted for these items, the remaining $20 decrease in Retail operating earnings is primarily due to $21 of higher employee-related costs primarily driven by new retail stores, $14 of higher inventory shrink costs, $7 of lower gross profit from lower sales and $4 of higher occupancy costs, offset in part by $14 of lower depreciation expense, $7 of higher base margins and $6 of lower logistics costs.
Corporate operating loss for fiscal 2016 decreased $89. Corporate operating loss for fiscal 2016 included $6 of severance costs and $6 of store closure charges and costs. Corporate operating loss for fiscal 2015 included $64 of non-cash pension settlement charges, a $5 benefit plan charge and $2 of information technology intrusion costs, net of insurance recoverable. The additional week in fiscal 2015 contributed approximately $1 of expense to Corporate operating loss. When adjusted for these items, the remaining $29 net decrease in Corporate operating loss was primarily due to $28 of lower employee-related costs, primarily due to lower benefits and entity-wide incentive compensation, $12 of higher transition service agreement fees and $8 of lower occupancy costs, offset in part by $12 of higher pension expense and $5 of higher contracted services.
Interest Expense, Net
Interest expense, net for fiscal 2017 was $181, compared with $195 for last year. Interest expense, net for fiscal 2017 included charges of $19 related to prepayments and the amendment of the Secured Term Loan Facility, comprised of unamortized financing cost charges of $17 and refinancing costs of $2. Interest expense, net for fiscal 2016 includes $6 of debt refinancing costs related to the redemption of the remaining $278 of Supervalu’s outstanding 8.00 percent Senior Notes due May 2016 (the “2016 Notes”) and $4 of non-cash unamortized financing cost charges related to the 2016 Notes redemption and an amendment to the Revolving ABL Credit Facility. When adjusted for these items, Interest expense, net decreased $23 primarily due to lower average outstanding debt balances.
Interest expense, net for fiscal 2016 was $195, compared with $242 for fiscal 2015. Interest expense, net for fiscal 2016 includes $10 of debt refinancing costs and non-cash unamortized financing cost charges as described above. Interest expense for fiscal 2015 included $37 of debt refinancing costs related to the redemption of $350 of the 2016 Notes and costs related to the
30
incremental carry costs of the 7.75 percent Senior Notes due November 2022 (the “2022 Notes”) outstanding during the 2016 Notes 30-day redemption period, and $6 of non-cash unamortized financing cost charges related to the 2016 Notes redemption and the amendments to the Revolving ABL Credit Facility. The additional week in fiscal 2015 contributed additional interest expense of approximately $3. When adjusted for these items, the remaining $11 decrease in Interest expense, net is primarily due to lower average outstanding debt balances.
Income Tax (Benefit) Provision
Income tax benefit on earnings from continuing operations for fiscal 2017 was $20 or 279.9 percent of earnings from continuing operations before income taxes, compared with income tax expense of $24 or 21.8 percent of earnings from continuing operations before income taxes last year. The change in the effective tax rate is primarily due to lower pre-tax income in fiscal 2017, as permanent and discrete tax items have a greater rate impact with lower pre-tax income, as well as certain fiscal 2017 discrete deferred tax items and the tax effects related to the fiscal 2017 pension settlement charges and goodwill impairment charges.
Income tax expense for fiscal 2016 was $24, or 21.8 percent of earnings from continuing operations before income taxes, compared with income tax benefit of $13 or 107.4 percent of earnings from continuing operations for fiscal 2015. The change in the effective tax rate is primarily due to the tax effects related to the pension settlement charge included in fiscal 2015, partially offset by a favorable mix of income in state tax jurisdictions in fiscal 2016.
Net Earnings from Continuing Operations
Net earnings from continuing operations for fiscal 2017 were $27, compared with $84 last year. Net earnings from continuing operations for fiscal 2017 included after-tax costs and charges of $56, comprised of asset impairment charges of $25, a pension settlement charge of $24, unamortized financing cost charges of $10, a goodwill impairment charge of $9, store closure charges and costs of $4 and debt refinancing costs of $1, offset in part by a deferred income tax benefit of $9, a fee received from a supply agreement termination of $6, a sales and use tax refund of $1 and a severance benefit of $1. Net earnings from continuing operations for fiscal 2016 included after-tax costs and charges of $17, comprised of an intangible asset impairment charge of $4, store closure charges and costs of $4, debt refinancing costs of $4, severance costs of $3 and unamortized financing cost charges of $2. When adjusted for these items, the remaining $18 after-tax decrease is due to the variances discussed in the Operating Earnings, Interest Expense, Net and Income Tax (Benefit) Provision sections above.
Net earnings from continuing operations for fiscal 2016 were $84, compared with $25 for fiscal 2015. Net earnings from continuing operations for fiscal 2016 included after-tax costs and charges of $17, comprised of an intangible asset impairment charge of $4, store closure charges and costs of $4, debt refinancing costs of $4, severance costs of $3 and unamortized financing cost charges of $2. Net earnings from continuing operations for fiscal 2015 included $68 of after-tax charges and costs comprised of non-cash pension settlement charges of $36, debt refinancing costs of $23, unamortized financing cost charges of $4, a benefit plan charge of $3, net information technology intrusion costs of $1 and severance costs of $1. The additional week in fiscal 2015 contributed approximately $4 to Net earnings from continuing operations. When adjusted for these items, the remaining $12 after-tax increase in Net earnings from continuing operations is primarily due to the variances as discussed in the Operating Earnings, Interest Expense, Net, and Income Tax Provision sections above.
Income from Discontinued Operations, Net of Tax
Discontinued operations primarily include the Save-A-Lot business that was previously disclosed as a separate reporting segment of Supervalu, adjusted for assets, liabilities, operating results, and cash flows of the Save-A-Lot business as provided under the SAL Merger Agreement and the Separation Agreement. In addition, discontinued operations include the results of operations and cash flows attributed to the assets and liabilities of the NAI business. Refer to Note 17—Discontinued Operations in the Notes to Consolidated Financial Statements for further information regarding these discontinued operations.
Fiscal 2017 Compared to Fiscal 2016
Net sales from discontinued operations for fiscal 2017 were $3,529, compared with $4,621 last year. The sale of the Save-A-Lot business occurred on the first business day of our fourth quarter of fiscal 2017 (December 5, 2016), resulting in a partial fiscal year of operations in fiscal 2017. Net sales from discontinued operations decreased $1,054 due to the reduction in fourth quarter sales relative to the prior year due to the sale of the Save-A-Lot business. The remaining $38 decrease is primarily due to lower identical licensee store sales, lower identical corporate store sales, lower sales due to closed licensee stores and lower sales due to closed corporate stores, offset in part by higher sales from new corporate stores, higher sales from new licensee stores and higher sales from corporate store conversions.
Operating earnings from discontinued operations for fiscal 2017 were $708, compared with $147 last year. Fiscal 2017 operating earnings from discontinued operations included a pre-tax gain on sale of $637 and a goodwill impairment charge of $37. The
31
remaining decrease of $39 is primarily due to lower earnings from a partial fiscal year of operations in fiscal 2017, higher employee-related costs driven by new corporate stores and higher inventory shrink, offset in part by higher base margins driven by higher product margin rates.
Income from discontinued operations, net of tax for fiscal 2017 was $627, compared with $102 last year. Fiscal 2017 income from discontinued operations includes an after-tax gain on sale of $577, which includes a tax benefit from the anticipated utilization of capital loss carryforwards and the release of valuation allowances of approximately $244. The remaining decrease of $52 was due to the after-tax impact of the operating earnings variances discussed above and the applicable tax provision, which included certain tax matters.
Fiscal 2016 Compared to Fiscal 2015
Net sales from discontinued operations for fiscal 2016 were $4,621, compared with $4,639 for fiscal 2015, a decrease of $18 or 0.4 percent. The additional week in fiscal 2015 contributed $79 to net sales. Excluding the additional week of sales in fiscal 2015, net sales from discontinued operations increased $61 primarily due to $124 of higher sales from new corporate stores, $60 of higher sales from new licensee stores, $56 of higher sales from corporate stores that were acquired and converted to licensee stores and $11 of higher sales at existing corporate stores, offset in part by lower sales of $70 from lower sales to existing licensees, $55 from stores that were disposed of by licensees, $41 from licensee stores that were converted to corporate stores and $31 from corporate stores that were closed.
Operating earnings from discontinued operations for fiscal 2016 were $147, compared to $176 for fiscal 2015. Operating earnings from discontinued operations for fiscal 2016 included $5 of store closure charges and costs and $2 of severance costs. Operating earnings from discontinued operations for fiscal 2015 included store closure charges and costs of $3. The additional week in fiscal 2015 contributed approximately $4 to Operating earnings from discontinued operations. When adjusted for these items, the remaining $21 decrease is primarily due to Save-A-Lot related variances of higher occupancy and employee costs, and higher depreciation expense, offset in part by higher base margins driven by a higher mix of corporate stores relative to licensee stores and product costs declining faster than retail prices, higher gross profit from higher sales, lower logistics costs and higher trucking back-haul income.
Income from discontinued operations, net of tax for fiscal 2016 was $102, compared to $174 for fiscal 2015, primarily reflecting the after tax impact of the operating earnings variances discussed above and the net tax benefits of $66 for fiscal 2015 primarily related to tangible property repair regulations and other deduction related changes, property tax refunds and interest income resulting from the settlement of income tax audits.
NON-GAAP FINANCIAL MEASURES
Use of Non-GAAP Financial Measures
Supervalu’s Consolidated Financial Statements are prepared and presented in accordance with generally accepted accounting principles (“GAAP”). In addition to the above analysis of results of operations, Supervalu also considers certain non-GAAP financial measures to assess the performance of its business and understand underlying operating performance and core business trends, which it uses to facilitate operating performance comparisons of its business on a consistent basis over time. The measures and items identified below, such as Adjusted EBITDA, are provided as a supplement to Supervalu’s results of operations and related analysis, and should not be considered superior to, a substitute for or an alternative to any financial measure of performance prepared and presented in accordance with GAAP. In each of these measures, certain items are being omitted either because they are non-cash items or are items that are not considered in Supervalu’s supplemental assessment of on-going business performance. Certain of these adjustments are considered in similar supplemental analyses by other companies, such as Depreciation and amortization, impairment charges and certain other adjustments.
Supervalu believes these non-GAAP measures are useful to investors and financial institutions because Adjusted EBITDA provides additional understanding of other factors and trends affecting its business, which are used in the business planning process to understand expected performance, to evaluate results against those expectations, and as one of the compensation performance measures under certain compensation programs and plans. Supervalu believes Adjusted EBITDA is more reflective of factors that affect its underlying operating performance and facilitate operating performance comparisons of our business segments on a consistent basis over time.
Limitations of Use
Investors are cautioned that there are material limitations associated with the use of non-GAAP financial measures as an analytical tool. Certain adjustments to our GAAP financial measures reflected below exclude items that may be considered
32
recurring in nature and may be reflected in Supervalu’s financial results for the foreseeable future. These measurements and items may be different from non-GAAP financial measures used by other companies. All measurements are provided with a reconciliation from a GAAP measurement. The non-GAAP financial measures below should only be considered as an additional supplement to Supervalu’s financial results reported in accordance with GAAP and should be reviewed in conjunction with Supervalu’s results reported in accordance with GAAP in this Annual Report on Form 10-K for the fiscal year ended February 25, 2017.
There are significant limitations to using Adjusted EBITDA as a financial measure including, but not limited to, it not reflecting cash expenditures for capital assets or contractual commitments, changes in working capital, income taxes, capital lease obligations and debt service expenses that are recurring in Supervalu’s results of operations.
Definitions
Supervalu defines Adjusted EBITDA as Net (loss) earnings from continuing operations, plus Interest expense, net and Income tax (benefit) provision, less Net earnings attributable to noncontrolling interests calculated in accordance with GAAP, plus non-GAAP adjustments for Depreciation and amortization, LIFO charge (credit), certain employee-related costs and pension-related charges (including severance costs, pension settlement charges, multiemployer pension withdrawal charges, accelerated stock-based compensation charges and other items), certain non-cash asset impairment and other charges (including asset write-offs, store closures and market exits), certain gains and losses on the sale of property, goodwill and intangible asset impairment charges, costs related to the separation of businesses, legal settlement charges and gains, contract breakage costs and certain other non-cash charges or items, as determined by management.
The following table reconciles Adjusted EBITDA to Net (loss) earnings from continuing operations:
2017 (52 weeks) | 2016 (52 weeks) | 2015 (53 weeks) | 2014 (52 weeks) | 2013 (52 weeks) | |||||||||||||||
Net earnings (loss) from continuing operations | $ | 27 | $ | 84 | $ | 25 | $ | (94 | ) | $ | (418 | ) | |||||||
Less net earnings attributable to noncontrolling interests | (4 | ) | (8 | ) | (7 | ) | (7 | ) | (10 | ) | |||||||||
Income tax (benefit) provision | (20 | ) | 24 | (13 | ) | (69 | ) | (163 | ) | ||||||||||
Interest expense, net | 181 | 195 | 242 | 404 | 269 | ||||||||||||||
Depreciation and amortization | 207 | 210 | 223 | 242 | 301 | ||||||||||||||
LIFO charge (credit) | 1 | 3 | 8 | (9 | ) | 4 | |||||||||||||
Pension, multi-employer and benefit plan settlement charges(1) | 42 | — | 69 | 3 | 4 | ||||||||||||||
Asset impairment and other charges, net of gains(2) | 41 | — | — | (2 | ) | 214 | |||||||||||||
Goodwill and intangible asset impairment charges(3) | 15 | 6 | — | — | 6 | ||||||||||||||
Store closure charges and costs(4) | 5 | 7 | — | — | — | ||||||||||||||
Contract breakage costs and certain other charges(5) | — | — | — | 6 | — | ||||||||||||||
Information technology intrusion costs, net of insurance recoverable(6) | — | — | 2 | — | — | ||||||||||||||
Legal settlement gain(7) | — | — | — | — | (10 | ) | |||||||||||||
Severance (benefits) costs(8) | (1 | ) | 6 | 1 | 42 | 32 | |||||||||||||
Sales and use tax refunds(9) | (2 | ) | — | — | — | — | |||||||||||||
Supply agreement termination fees(10) | (9 | ) | — | — | — | — | |||||||||||||
Adjusted EBITDA | $ | 483 | $ | 527 | $ | 550 | $ | 516 | $ | 229 | |||||||||
(1) | Pension settlement charges in fiscal 2017 and 2015 reflect accelerated amortization of accumulated actuarial loss associated with lump sum settlement payments made to certain deferred vested pension plan participants made by the SUPERVALU Retirement Plan under a lump sum payment option window. |
(2) | Asset impairment charges include non-cash charges related to Supervalu’s Retail business in fiscal 2017 and amounts related to Supervalu’s Retail and Wholesale business in fiscal 2014 and 2013, with an offsetting gain on the sale of property in fiscal 2014 related to the Wholesale business. |
(3) | Goodwill and intangible asset impairment charges include a non-cash goodwill impairment charge related to Supervalu’s Retail business in fiscal 2017, a non-cash intangible asset impairment charge related to Supervalu’s non-exercise of certain options to purchase operating assets in fiscal 2016 and a non-cash intangible asset impairment charge related to a tradename within the Wholesale business in fiscal 2013. |
(4) | Store closure charges and costs include impairment, severance and related costs due to store closures. |
(5) | Contract breakage costs relate to continuing operations break-up costs from the sale of NAI. |
(6) | Information technology intrusion costs include costs related to the intrusions discussed in Note 15—Commitments, Contingencies and Off-Balance Sheet Arrangements in Part II, Item 8 of this Annual Report on Form 10-K. |
(7) | Legal settlement gain relates to cash gains from favorable settlements. |
(8) | Severance (benefits) costs include separation-related costs for former employees, including accelerated non-cash stock-based compensation charges. The fiscal 2017 severance benefit includes a reversal of a portion of severance costs in fiscal 2016. |
33
(9) | Sales and use tax refunds reflect refunds received related to prior years. |
(10) | Supply agreement termination fees reflect cash gains related to the termination of supply agreements. |
LIQUIDITY AND CAPITAL RESOURCES
Overview
• | Unused available credit under the Revolving ABL Credit Facility increased $4 to $748 as of February 25, 2017 from $744 as of February 27, 2016. The increase reflects $138 of lower borrowings under the facility and $16 of lower letters of credit outstanding, partially offset by a lower borrowing base of approximately $150 primarily due to the disposition of Save-A-Lot. |
• | Cash and cash equivalents increased $290 to $332 as of February 25, 2017 from $42 as of February 27, 2016. |
• | Total debt was $1,263 and $2,297 as of February 25, 2017 and February 27, 2016, respectively, net of unamortized debt financing costs and original issue discount, under senior secured credit agreements and debentures. |
• | In connection with the sale of Save-A-Lot, Supervalu received proceeds of $1,301 in cash, including estimated customary closing adjustments, and used the proceeds to: |
◦ | make mandatory prepayments of $832 against outstanding loans under the Secured Term Loan Facility comprised of (1) 100% of the first $750 of Net Cash Proceeds (as defined in the Secured Term Loan Facility) received and (2) up to 50% of the Net Cash Proceeds in excess of $750 up to an aggregate amount that reduced Supervalu’s Total Secured Leverage Ratio (as defined in the Secured Term Loan Facility) on a pro forma basis after giving effect to such prepayment to be no higher than 1.50:1.00; |
◦ | contribute $60 to the SUPERVALU Retirement Plan, fulfilling its remaining obligations for pension contributions under its agreement with the PBGC; and |
◦ | pay off the outstanding balance of the Revolving ABL Credit Facility. |
• | Subsequent to the sale of Save-A-Lot and the related Secured Term Loan Facility prepayments described above, no scheduled debt maturities are due in fiscal 2018 and 2019, exclusive of any potential excess cash flow prepayment requirements under the Secured Term Loan Facility from Supervalu’s subsequent years’ results of operations and cash flows. |
• | Payments to reduce capital lease obligations are expected to be approximately $26 for fiscal 2018. |
• | Working capital of continuing operations increased $280 to $528 as of February 25, 2017 from $248 as of February 27, 2016, excluding the impacts of the LIFO reserve. The working capital increase is primarily due to an increase in Cash and cash equivalents, which includes the residual proceeds from the sale of Save-A-Lot, lower current maturities of long-term debt from the required excess cash flow prepayment in fiscal 2017 and higher inventories within Wholesale and Retail. These increases in working capital were partially offset by higher accounts payable from the higher inventory levels and higher income taxes payable driven by the income tax provision on the sale of Save-A-Lot, expected to be paid in the first quarter of fiscal 2018. |
• | Management expects that Supervalu will be able to fund debt maturities through internally generated funds, borrowings under the Revolving ABL Credit Facility, additional term loans under the Secured Term Loan Facility (subject to identifying term loan lenders or other institutional lenders and satisfying certain terms and conditions) or through new debt issuances. |
• | No minimum pension contributions are required under Employee Retirement Income Security Act of 1974, as amended (“ERISA”) for fiscal 2018. |
Sources and Uses of Cash
Management expects that Supervalu will continue to replenish operating assets with internally generated funds and pay down debt obligations with internally generated funds and new debt issuances or existing credit facilities. A significant reduction in operating earnings or the incurrence of operating losses could have a negative impact on Supervalu’s operating cash flow, which may limit Supervalu’s ability to pay down its outstanding indebtedness as planned. Supervalu’s credit facilities are secured by a substantial portion of Supervalu’s total assets.
Supervalu’s primary sources of liquidity are from internally generated funds and from borrowing capacity under its credit facilities. Supervalu will continue to obtain short-term or long-term financing from its credit facilities. Long-term financing will be maintained through existing and new debt issuances and its credit facilities. Supervalu’s short-term and long-term financing abilities are believed to be adequate as a supplement to internally generated cash flows to fund debt obligations and to fund capital expenditures as opportunities arise. There can be no assurance, however, that Supervalu’s business will continue to generate cash flow at current levels or that it will continually have access to credit on acceptable terms. Maturities of debt issued will depend on management’s views with respect to the relative attractiveness of interest rates at the time of issuance and other debt maturities.
34
Primary uses of cash include debt servicing and maturities, capital expenditures, working capital maintenance, contributions to various benefit plans and income tax payments. Supervalu’s working capital needs are generally greater during the months leading up to high sales periods, such as the time period from prior to Thanksgiving through December. Supervalu typically finances these working capital needs with cash provided from operating activities and short-term borrowings. Inventories are managed primarily through demand forecasting and replenishing depleted inventories. Strategic and operational investments in Supervalu’s businesses are funded by cash provided from operating activities and on a short-term basis through available liquidity.
Supervalu’s continued access to short-term and long-term financing through credit markets depends on numerous factors including the condition of the credit markets and Supervalu’s results of operations, cash flows, financial position and credit ratings.
Supervalu does not pay dividends, and there is no current intent to pay dividends. Supervalu is limited in the aggregate amount of dividends that it may pay under the terms of its Secured Term Loan Facility and its Revolving ABL Credit Facility and is required to meet certain conditions under these credit facilities before paying a dividend, as described in Note 8—Long-Term Debt in Part II, Item 8 of this Annual Report on Form 10-K. The payment of future dividends is subject to the discretion of Supervalu’s Board of Directors and the requirements of Delaware law, and will depend on a variety of factors that Supervalu’s Board of Directors may deem relevant.
Cash Flow Information
The following summarizes Supervalu’s Consolidated Statements of Cash Flows:
Fiscal Year | Variance | ||||||||||||||||||
2017 (52 weeks) | 2016 (52 weeks) | 2015 (53 weeks) | 2017 Change | 2016 Change | |||||||||||||||
Cash flow activities | |||||||||||||||||||
Net cash provided by operating activities – continuing operations | $ | 308 | $ | 245 | $ | 211 | $ | 63 | $ | 34 | |||||||||
Net cash used in investing activities—continuing operations | (198 | ) | (187 | ) | (194 | ) | (11 | ) | 7 | ||||||||||
Net cash used in financing activities—continuing operations | (1,106 | ) | (192 | ) | (92 | ) | (914 | ) | (100 | ) | |||||||||
Net cash provided by discontinued operations | 1,271 | 77 | 106 | 1,194 | (29 | ) | |||||||||||||
Net increase (decrease) in cash and cash equivalents | 275 | (57 | ) | 31 | 332 | (88 | ) | ||||||||||||
Cash and cash equivalents at beginning of year | 57 | 114 | 83 | (57 | ) | 31 | |||||||||||||
Cash and cash equivalents at the end of year | $ | 332 | $ | 57 | $ | 114 | $ | 275 | $ | (57 | ) | ||||||||
Operating Activities
The increase in net cash provided by operating activities from continuing operations in fiscal 2017 compared to fiscal 2016 is primarily due to lower levels of cash utilized in operating assets and liabilities, offset in part by lower cash generated from earnings and $22 of higher contributions to benefit plans.
The increase in net cash provided by operating activities from continuing operations in fiscal 2016 compared to fiscal 2015 is primarily due to $129 of lower pension and other postretirement benefit plan contributions from lower required and discretionary pension contributions and higher cash generated from operating earnings, offset in part by higher levels of cash utilized in operating assets and liabilities.
Investing Activities
The increase in net cash used in investing activities in fiscal 2017 compared to fiscal 2016 includes a $36 increase in cash paid for capital expenditures and business combinations, offset in part by a $23 decrease in cash paid for other intangible assets.
The decrease in cash used in investing activities in fiscal 2016 compared to fiscal 2015 is primarily due to a $34 decrease in cash paid for business combinations and capital expenditures, offset in part by an increase of $25 in cash paid for intangible assets.
Financing Activities
The increase in net cash used in financing activities in fiscal 2017 compared to fiscal 2016 is primarily due to a $995 net increase in cash paid towards debt and capital lease obligations, of which $832 related to required prepayments of outstanding loans under the Secured Term Loan Facility following the sale of Save-A-Lot, and a $7 decrease in proceeds from the sale of
35
common stock, offset in part by $80 of proceeds from increased borrowings under the Revolving ABL Credit Facility, $3 of lower distributions to noncontrolling interests and $3 of lower debt financing cost payments.
The increase in net cash used in financing activities in fiscal 2016 compared to fiscal 2015 is primarily due to lower proceeds from the issuance of long-term debt, offset in part by lower payments on long-term debt and debt financing costs. Proceeds from the issuance of long-term debt decreased primarily due to the issuance of $350 of the 2022 Notes in fiscal 2015, compared with a $138 net increase in borrowings under the Revolving ABL Credit Facility in fiscal 2016 to partially fund the redemption of $278 of the 2016 Notes. Long-term debt payments decreased primarily due to a smaller amount of redemptions of the 2016 Notes in fiscal 2016 compared to fiscal 2015. Payments used on debt financing costs were lower due to lower redemption premiums, credit facility amendment costs and new debt issuance costs.
Discontinued Operation Activities
The increase in net cash provided by discontinued operations in fiscal 2017 compared to last year is primarily due to $1,301 of proceeds received from the sale of Save-A-Lot, offset in part by lower cash generated from earnings from discontinued operations due to the partial fiscal year in 2017.
The decrease in net cash provided by discontinued operations in fiscal 2016 compared to fiscal 2015 is primarily due to higher levels of cash utilized in operating assets and liabilities, and lower cash generated from earnings from discontinued operations.
Credit Facilities and Debt Agreements
Supervalu’s credit facilities and certain long-term debt agreements have restrictive covenants and cross-default provisions which generally provide, subject to Supervalu’s right to cure, for the acceleration of payments due in the event of a breach of a covenant or a default in the payment of a specified amount of indebtedness due under certain other debt agreements. Supervalu was in compliance with all such covenants and provisions for all periods presented.
Total debt and capital lease obligations, net of unamortized debt financing costs and original issue discount, decreased $1,039 to $1,475 as of February 25, 2017 from $2,514 as of February 27, 2016. This decrease is primarily due to a $935 lower balance outstanding on the Secured Term Loan Facility as a result of payments required to be made in connection with the sale of Save-A-Lot, the required excess cash flow prepayment from fiscal 2016 made in fiscal 2017, and the payoff of the remaining balance of the Revolving ABL Credit Facility, which contributed $138 to the decrease in debt, a $33 decrease in debt financing costs, $14 of which related to the Revolving ABL Credit Facility and was presented as a long-term asset because the facility did not have an outstanding balance, and a net decrease in total capital lease obligations of $6.
Refer to Note 8—Long-Term Debt in Part II, Item 8 of this Annual Report on Form 10-K for a detailed discussion of the provisions of Supervalu’s credit facilities and certain long-term debt agreements and additional information.
Capital Expenditures
The following summarizes capital expenditures and payments for business combinations of continuing operations:
• | Capital expenditures in fiscal 2017 were $199 and primarily consisted of Retail store remodels, new Retail stores and information technology investments. In addition, during fiscal 2017, Supervalu paid $19 for 24 acquired stores. |
• | Capital expenditures in fiscal 2016 were $172 and primarily consisted of Retail stores, store remodels and information technology investments. |
Capital expenditures for fiscal 2018 are estimated to be approximately $240 to $265 and primarily relate to an acquisition of a distribution center and related improvements, investments in existing distribution centers, Retail store remodels and information technology investments. The anticipated increase in capital expenditures for fiscal 2018 in comparison to fiscal 2017 primarily relates to the acquisition of the distribution center and distribution center improvements.
Supervalu defines capital expenditures as cash payments for purchases of property, plant and equipment and non-cash capital lease additions, and excludes payments for business acquisitions and capitalized property, plant and equipment obligation for which cash payment has not been made and obligations exist within Accounts payable.
36
Pension and Other Postretirement Benefit Obligations
Cash contributions to defined benefit pension and other postretirement benefit plans were $62, $40 and $169 in fiscal 2017, 2016 and 2015, respectively. The increase in cash contributions in fiscal 2017 compared to fiscal 2016 is primarily due to $60 of contributions to the SUPERVALU Retirement Plan in excess of required minimum contributions as required under the agreement with the PBGC entered into in connection with the sale of Save-A-Lot. Cash contributions decreased in fiscal 2016 compared to fiscal 2015 due to lower required and discretionary defined benefit pension plan contributions. Cash contributions in fiscal 2015 included a $50 discretionary contribution on top of required minimum contributions.
Supervalu currently expects that no minimum pension contributions will be required to its pension plans in fiscal 2018 consistent with its obligations under ERISA. Supervalu anticipates fiscal 2018 discretionary pension contributions and required minimum other postretirement benefit plan contributions will be approximately $5 to $10.
Supervalu funds its defined benefit pension plans based on the minimum contribution amount required under ERISA, the Pension Protection Act of 2006 and other applicable laws, as determined by Supervalu’s external actuarial consultant, and additional contributions made at Supervalu’s discretion. Supervalu may accelerate contributions or undertake contributions in excess of the minimum requirements from time to time subject to the availability of cash in excess of operating and financing needs or other factors as may be applicable. Supervalu assesses the relative attractiveness of the use of cash to accelerate contributions considering such factors as expected return on assets, discount rates, cost of debt, reducing or eliminating required PBGC variable rate premiums or in order to achieve exemption from participant notices of underfunding.
CRITICAL ACCOUNTING POLICIES
The preparation of Consolidated Financial Statements in conformity with accounting principles generally accepted in the United States of America (“Accounting Standards”) requires management to make estimates and assumptions that affect the reported amounts of assets and liabilities and disclosure of contingent assets and liabilities as of the date of the financial statements and the reported amounts of revenues and expenses during the reporting period. Actual results could differ from those estimates.
Significant accounting policies are discussed in Note 1—Summary of Significant Accounting Policies in the Notes to Consolidated Financial Statements included in Part II, Item 8 of this Annual Report on Form 10-K. Management believes the following critical accounting policies reflect its more subjective or complex judgments and estimates used in the preparation of Supervalu’s Consolidated Financial Statements.
Inventories, Net
Inventories are valued at the lower of cost or market. Substantially all of Supervalu’s inventory consists of finished goods. Inventories are recorded net of vendor allowances and cash discounts. Supervalu evaluates inventory shortages (shrink) throughout each fiscal year based on actual physical counts in its facilities. Allowances for inventory shortages are recorded based on the results of these counts to provide for estimated shortages as of the end of each fiscal year.
To value discrete inventory items at lower of cost or market before application of any LIFO reserve, Supervalu uses the weighted average cost method, the retail inventory method (“RIM”) or replacement cost method. Inventories were valued at the lower of cost or market under the following methods as of February 25, 2017: weighted average cost method, 72 percent; RIM, 19 percent; and replacement cost method, 9 percent.
The replacement cost approach under the first-in, first-out (“FIFO”) method is predominantly utilized in determining the value of high turnover perishable items, including produce, deli, bakery, meat and floral, and pharmacy inventory. Under the replacement cost method applied on a LIFO basis, the most recent purchase cost is used to calculate the current cost of inventory before application of any LIFO reserve. The replacement cost approach results in inventories valued at the lower of cost or market because of the high inventory turnover and the resulting low inventory days supply on hand combined with infrequent vendor price changes for these items of inventory.
RIM is used in valuing retail inventories. Under this method, the valuation of inventories is at cost and the resulting gross margins are calculated by applying a calculated cost-to-retail ratio to the retail value of inventories. RIM is an averaging method that has been widely used in the retail industry. Inherent in the RIM calculations are certain significant management judgments and estimates, including inventory shortages and cost-to-retail ratios, which impact the ending inventory valuation at cost, as well as the resulting gross margins. Management consistently applies its application of RIM valuations by product category and believes that Supervalu’s RIM provides an inventory valuation that reasonably approximates cost. For fiscal 2017, a one percent change in the cost-to-retail ratios used to value inventories would impact Gross profit by less than 30 basis points.
37
As of February 25, 2017 and February 27, 2016, approximately 73 percent and 75 percent, respectively, of Supervalu’s inventories were valued under the LIFO method. During fiscal 2017 and 2016, inventory quantities in certain LIFO layers were reduced. These reductions resulted in a liquidation of LIFO inventory quantities carried at lower costs prevailing in prior years as compared with the cost of fiscal 2017 and 2016 purchases. As a result, Cost of sales decreased by $2 and $1 in fiscal 2017 and 2016, respectively. If the FIFO method had been used to determine cost of inventories for which the LIFO method is used, Supervalu’s inventories would have been higher by approximately $216 and $215 as of February 25, 2017 and February 27, 2016, respectively.
Vendor Funds
Supervalu receives funds from many of the vendors whose products Supervalu buys for resale. These vendor funds are provided to increase the sell-through of the related products. Supervalu receives vendor funds for a variety of merchandising activities: placement of the vendors’ products in Supervalu’s advertising; display of the vendors’ products in prominent locations in Supervalu’s stores; supporting the introduction of new products into Supervalu’s Retail stores and distribution system; exclusivity rights in certain categories; and to compensate for temporary price reductions offered to customers on products held for sale. Supervalu also receives vendor funds for buying activities such as volume commitment rebates, credits for purchasing products in advance of their need and cash discounts for the early payment of merchandise purchases. The majority of the vendor fund contracts have terms of less than a year, with a small proportion of the contracts longer than one year.
Supervalu recognizes vendor funds for merchandising activities as a reduction of Cost of sales when the related products are sold. Vendor funds that have been earned as a result of completing the required performance under the terms of the underlying agreements but for which the product has not yet been sold are recognized as reductions of inventory.
The amount and timing of recognition of vendor funds as well as the amount of vendor funds to be recognized as a reduction to ending inventory requires management judgment and estimates. Management determines these amounts based on estimates of current year purchase volume using forecast and historical data and review of average inventory turnover data. These judgments and estimates impact Supervalu’s reported gross profit, operating earnings (loss) and inventory amounts. The historical estimates of Supervalu have been reliable in the past, and Supervalu believes the methodology will continue to be reliable in the future. Based on previous experience, Supervalu does not expect significant changes in the level of vendor support. However, if such changes were to occur, cost of sales and advertising expense could change, depending on the specific vendors involved. If vendor advertising allowances were substantially reduced or eliminated, Supervalu would consider changing the volume, type and frequency of the advertising, which could increase or decrease its advertising expense. Similarly, Supervalu is not able to assess the impact of vendor advertising allowances on increasing revenues as such allowances do not directly generate revenue for Supervalu’s stores. For fiscal 2017, a one percent change in total vendor funds earned, including advertising allowances, with no offsetting changes to the base price on the products purchased, would impact Gross profit by less than 10 basis points.
Allowances for Doubtful Accounts and Credit Risk
Supervalu uses a combination of measurements, analyses and techniques to evaluate the collectability of its accounts and notes receivable, and up-front customer advances, and also assesses the probability of default on guarantees and subleased property provided to customers. Supervalu obtains collateral from certain of its customers in the form of letters of credit, personal and other entity guarantees, priority claims on customer property and customer deposits. A customer’s credit-worthiness is evaluated on an ongoing basis to determine the appropriate level of reserves. Management performs customer-specific analyses and utilizes a variety of specific techniques including, an aged receivables analysis, historical collections and write-off trends, analysis of customers’ financial statements, economic or industry factors, customer bankruptcy, store closures or liquidity deterioration. These measurements, analyses and techniques are continually evaluated to estimate the recoverability of accounts and notes receivable, and the possibility for Supervalu to perform on its customer guarantees. This evaluation process contains significant management judgments and estimates that are used in accounting for allowance for doubtful accounts and credit risk. Refer to Note 3—Allowance for Doubtful Accounts in the Notes to Consolidated Financial Statements included in Part II, Item 8 of this Annual Report on Form 10-K for further information.
Long-Lived Assets
Supervalu monitors the recoverability of its long-lived assets and tests them for impairment whenever events or changes in circumstances indicate that the carrying amount of such assets may not be fully recoverable. If impairment is identified for long-lived assets to be held and used, the fair value is compared to the carrying value of the group of assets and an impairment charge is recorded for the excess of the carrying value over the fair value. Refer to Note 1—Summary of Significant Accounting Policies in the Notes to Consolidated Financial Statements included in Part II, Item 8 of this Annual Report on
38
Form 10-K for further information regarding Supervalu’s monitoring, testing and impairment calculations for its long-lived assets.
Significant management judgments and estimates are used in accounting for long-lived assets, including, but not limited to, the determination of useful lives estimates, dependency of identifiable cash flows, projected undiscounted cash flows and fair values based on current market values or discounted cash flows using Level 3 inputs.
Determinations of geographic markets utilized in grouping assets and the interdependency of cash flows rely on significant judgments by management. Supervalu believes that revenue and cash flow dependencies exist among stores within its markets and operates its stores on that basis. Supervalu reviews its long-lived asset groupings at least annually or as facts and circumstances arise during interim periods that indicate a review should occur. Supervalu conducted reviews during the fourth quarter of fiscal 2017 and 2016, and no changes to geographic market asset groupings were made as a result of these reviews. Due to the highly competitive environment and ongoing business transformation, Supervalu continues to evaluate its long-lived asset policy and current asset groups to determine if additional modifications to the estimation approach of Supervalu’s long-lived asset groups are necessary. Future changes to Supervalu’s assessment of its long-lived asset policy and changes in circumstances, operating results or other events may result in additional asset impairment testing and charges.
Supervalu estimates fair value based on Supervalu’s experience and knowledge of the market in which the property is located, including local real estate brokers and advisers. Supervalu’s estimate of undiscounted cash flows attributable to the asset groups includes only future cash flows that are directly associated with and that are expected to arise as a direct result of the use and eventual disposition of the asset group.
To calculate projected future cash flows, Supervalu utilizes business plans that take into account operational changes, competitive factors and inflation, among other factors. Using different assumptions or estimates could result in a change in estimated cash flows and fair values that could produce different results. The composition of cash flows for identifiable cash flows that are grouped include additional projected cash outflows of operating that asset group as a whole, whereas the composition of cash flows evaluated at the retail store-level and at the distribution center level include only the cash flows required to operate those individual long-lived assets.
During fiscal 2017, asset impairment charges of $41 were recorded as a result of Supervalu’s annual impairment review. Refer to Note 4—Reserves for Closed Properties and Property, Plant and Equipment-related Impairment Charges in the Notes to Consolidated Financial Statements included in Part II, Item 8 of this Annual Report on Form 10-K for additional information on reserves for closed properties and Property, plant and equipment-related impairment charges.
Reserves for Closed Properties
Supervalu maintains reserves for costs associated with closures of Retail stores, distribution centers and other properties that are no longer being utilized in current operations. Supervalu provides for closed property operating lease liabilities using a discount rate to calculate the present value of the remaining noncancellable lease payments after the closing date, reduced by estimated subtenant rentals that could be reasonably obtained for the property. The closed property lease liabilities usually are paid over the remaining lease terms, which generally range from one to 15 years. Supervalu estimates subtenant rentals and future cash flows based on Supervalu’s experience and knowledge of the market in which the closed property is located, Supervalu’s previous efforts to dispose of similar assets and existing economic conditions. Adjustments to closed property reserves primarily relate to changes in subtenant income or actual exit costs differing from original estimates. Adjustments are made for changes in estimates in the period in which the changes become known.
Owned properties, capital lease properties and the related equipment and leasehold improvements at operating leased properties that are closed are reduced to their estimated fair value. Supervalu estimates fair value based on its experience and knowledge of the market in which the closed property is located and, when necessary, utilizes local real estate brokers to assist in the valuation.
The expectations on timing of disposition and the estimated sales price or subtenant rentals associated with closed properties, owned or leased, are impacted by variable factors including inflation, the general health of the economy, resultant demand for commercial property, the ability to secure subleases, the creditworthiness of sublessees and Supervalu’s success at negotiating early termination agreements with lessors. While management believes the current estimates of reserves for closed properties and related impairment charges are adequate, it is possible that market and economic conditions in the real estate market could cause changes in Supervalu’s assumptions and may require additional reserves and asset impairment charges to be recorded.
Supervalu’s net reserve for closed properties was $22, net of estimated sublease recoveries of $16, as of February 25, 2017, and $24, net of estimated sublease recoveries of $19, as of February 27, 2016.
39
Goodwill
Goodwill is reviewed at least annually for impairment and more frequently if events or changes in circumstances indicate that the asset might be impaired. A qualitative review may be conducted to determine whether it is more likely than not that the fair value of a reporting unit is less than its carrying amount. If the qualitative review is bypassed or it is determined that it is more likely than not that the carrying value is greater than the fair value of the reporting unit, a quantitative impairment test must be performed. The quantitative impairment test is performed using a two-step process. In the first step, the fair value of each reporting unit is compared with the carrying amount of the reporting unit, including goodwill. If the estimated fair value is less than the carrying amount of the reporting unit, there is an indication that goodwill impairment exists and a second step is completed in order to determine the amount of the goodwill impairment, if any, that should be recorded. In the second step, an impairment loss is recognized for any excess of the carrying amount of the reporting unit’s goodwill over the implied fair value of that goodwill.
For the purposes of goodwill impairment testing, Supervalu has two goodwill reporting units: Wholesale and Retail; which are the same as Supervalu’s reportable segments. The determination of reporting units considers the quantitative and qualitative characteristics of aggregation of each of the components within the Wholesale and Retail operating segments. The significant qualitative and economic characteristics used in determining our components to support their aggregation include types of businesses and the manner in which the components operate, consideration of key impacts to net sales, cost of sales, competitive risks and the extent to which components share assets and other resources. Goodwill was assigned to the Wholesale reporting unit as of the acquisition date, with no amounts being allocated between reporting units.
The Wholesale reporting unit is primarily comprised of the aggregation of two geographic distribution areas, which are organized based on region components: East and West. Supervalu’s Retail reporting unit is comprised of the aggregation of six retail components under five banners: Cub Foods, Shoppers Food & Pharmacy, Shop ’n Save, Farm Fresh and Hornbacher’s.
The fair values of Supervalu’s reporting units are determined by using both the market approach, applying a multiple of earnings and revenue based on guidelines for publicly traded companies, and the income approach, discounting projected future cash flows based on management’s expectations of the current and future operating environment. The rates used to discount projected future cash flows reflect a weighted average cost of capital based on Supervalu’s industry, capital structure and risk premiums including those reflected in the current market capitalization.
Fair value calculations contain significant judgments and estimates related to each reporting unit’s projected weighted average cost of capital, future revenue, profitability, cash flows and fair values of assets and liabilities. When preparing these estimates, management considers each reporting unit’s historical results, current operating trends and specific plans in place. These estimates are impacted by variable factors, including inflation, the general health of the economy and market competition. Supervalu has sufficient current and historical information available to support its judgments and estimates. However, if actual results are not consistent with Supervalu’s estimates, future operating results may be materially impacted.
Supervalu performed a quantitative goodwill impairment test during the third quarter of fiscal 2017 that resulted in the write-off of the remaining Retail goodwill. Discount rates in this analysis ranged between 10 percent and 13 percent to discount projected future cash flows for each reporting unit and perpetual growth rates that ranged between 2 percent and 3 percent. For Supervalu’s annual impairment review during the fourth quarter of fiscal 2017, a qualitative assessment was performed on the Wholesale goodwill but did not result in Supervalu proceeding to the first step of the goodwill impairment test.
Management performed sensitivity analyses on the fair values resulting from the discounted cash flow analysis utilizing alternate assumptions that reflect reasonably possible changes to future assumptions. Based upon Supervalu’s analysis of the Wholesale reporting unit, a 100 basis point increase in the discount rate utilized in the discounted cash flow analysis would not have resulted in the Wholesale reporting unit failing step one of the impairment test. Additionally, a 100 basis point decrease in the estimated perpetual sales growth rates utilized in the discounted cash flow analysis would not have resulted in the Wholesale reporting unit failing step one of the impairment test. The fair value of Supervalu’s Wholesale reporting unit was substantially in excess of its carrying value. If Supervalu’s stock price experiences a significant and sustained decline, or other events or changes in circumstances, such as a material shortfall of operating results to plan, Supervalu would reassess the fair value of Supervalu’s reporting units to their carrying value.
Benefit Plans
Supervalu sponsors pension and other postretirement plans in various forms covering substantially all employees who meet eligibility requirements. Pension benefits associated with these plans are generally based on each participant’s years of service, compensation, and age at retirement or termination. Supervalu’s defined benefit pension plan, the SUPERVALU Retirement Plan, and certain supplemental executive retirement plans were closed to new participants and service crediting ended for all participants as of December 31, 2007.
40
While Supervalu believes the valuation methods used to determine the fair value of plan assets are appropriate and consistent with other market participants, the use of different methodologies or assumptions to determine the fair value of certain financial instruments could result in a different estimate of fair value at the reporting date.
The determination of Supervalu’s obligation and related expense for Company-sponsored pension and other postretirement benefits is dependent, in part, on management’s selection of certain actuarial assumptions used in calculating these amounts. These assumptions include, among other things, the discount rate, the expected long-term rate of return on plan assets and the rates of increase in compensation and healthcare costs. Refer to Note 10—Benefit Plans in the Notes to Consolidated Financial Statements included in Part II, Item 8 of this Annual Report on Form 10-K for information related to the actuarial assumptions used in determining pension and postretirement health care liabilities and expenses.
Supervalu reviews and selects the discount rate to be used in connection with its pension and other postretirement obligations annually. The discount rate reflects the current rate at which the associated liabilities could be effectively settled at the end of the year. Supervalu sets its rate to reflect the yield of a portfolio of high quality, fixed-income debt instruments that would produce cash flows sufficient in timing and amount to settle projected future benefits.
Supervalu’s expected long-term rate of return on plan assets assumption is determined based on the portfolio’s actual and target composition, current market conditions, forward-looking return and risk assumptions by asset class, and historical long-term investment performance. The assumed long-term rate of return on pension assets was 6.5 percent for fiscal 2017 and 2016. The 10-year rolling average annualized return for a portfolio of investments applied in a manner consistent with our target allocations have generated average returns of approximately 8.1 percent based on returns from 1990 to 2016. In accordance with Accounting Standards, actual results that differ from Supervalu’s assumptions are accumulated and amortized over future periods and, therefore, affect expense and obligations in future periods.
For fiscal 2018, each 25 basis point reduction in the discount rate would decrease pension expense by approximately $1 and each 25 basis point reduction in expected return on plan assets would increase pension expense by approximately $5. Similarly, for postretirement benefits, a 100 basis point increase in the healthcare cost trend rate would increase the accumulated postretirement benefit obligation by approximately $2 as of the end of fiscal 2017 and would increase service and interest cost by less than $1. Conversely, a 100 basis point decrease in the healthcare cost trend rate would decrease the accumulated postretirement benefit obligation as of the end of fiscal 2017 by approximately $2, and would decrease service and interest cost by less than $1. Although Supervalu believes that its assumptions are appropriate, the actuarial assumptions may differ from actual results due to changing market and economic conditions, higher or lower withdrawal rates and longer or shorter life spans of participants.
Amortization of net actuarial loss expense recognition
Effective for fiscal 2018, Supervalu expects to begin recognizing the amortization of net actuarial loss on the SUPERVALU Retirement Plan over the remaining life expectancy of inactive participants based on its determination that almost all of the defined benefit pension plan participants are inactive and the plan is frozen to new participants. For the purposes of inactive participants, Supervalu utilized an over approximately 90 percent threshold established under Supervalu policy. This change did not affect the measurement of total benefit obligations in fiscal 2017, and instead impacts the recognition of certain components of net periodic pension expense prospectively beginning in fiscal 2018. The impact of the change in estimate is an anticipated reduction of the interest and service cost components within net periodic benefit cost in fiscal 2018 by approximately $31 for the defined benefit pension plans.
Full yield curve expense recognition
Effective fiscal 2017, Supervalu adopted the “full yield curve” approach for determining the interest and service cost components of net periodic benefit cost for defined benefit pension and other postretirement benefit plans. Under this method, the discount rate assumption used in the interest and service cost components of net periodic benefit cost is built through applying the specific spot rates along the yield curve used in the determination of the benefit obligation described above, to the relevant projected future cash flows of Supervalu’s pension and other postretirement benefit plans. Prior to fiscal 2017, the interest and service cost components of pension expense were estimated using a single weighted-average discount rate derived from the yield curve used to measure the projected benefit obligation at the beginning of the period.
Supervalu believes the “full yield curve” approach reflects a greater correlation between projected benefit cash flows and the corresponding yield curve spot rates and to provide a more precise measurement of interest and service costs. This change did not affect the measurement of total benefit obligation. Supervalu concluded that the application of the full yield curve approach was a change in estimate and, accordingly, recognized the effect beginning in fiscal 2017. The impact of the change in estimate reduced interest and service cost components within net periodic benefit cost in fiscal 2017 by approximately $22 for the defined benefit pension plans and less than $1 for postretirement benefit plans compared to the fiscal 2016 approach.
41
Income Taxes
Supervalu’s current and deferred income tax provision is based on estimates and assumptions that could materially differ from the actual results reflected in its income tax returns filed during the subsequent year and could significantly affect the effective tax rate and cash flows in future years.
Supervalu recognizes deferred tax assets and liabilities for the expected tax consequences of temporary differences between the tax bases of assets and liabilities and their reported amounts using enacted tax rates in effect for the year in which it expects the differences to reverse.
Supervalu’s effective tax rate is influenced by tax planning opportunities available in the various jurisdictions in which Supervalu operates. Management’s judgment is involved in determining the effective tax rate and in evaluating the ultimate resolution of any uncertain tax positions. In addition, Supervalu is currently in various stages of audits, appeals or other methods of review with taxing authorities from various taxing jurisdictions. Supervalu establishes liabilities for unrecognized tax benefits in a variety of taxing jurisdictions when, despite management’s belief that Supervalu’s tax return positions are supportable, certain positions may be challenged and may need to be revised. Supervalu adjusts these liabilities in light of changing facts and circumstances, such as the progress of a tax audit. The effective income tax rate includes the impact of reserve provisions and changes to those reserves. Supervalu also provides interest on these liabilities at the appropriate statutory interest rate. The actual benefits ultimately realized for tax positions may differ from Supervalu’s estimates due to changes in facts, circumstances and new information. As of February 25, 2017 and February 27, 2016, Supervalu had $59 and $70 of unrecognized tax benefits, respectively.
Supervalu records a valuation allowance to reduce the deferred tax assets to the amount that it is more-likely-than-not to realize. Forecasted earnings, future taxable income and future prudent and feasible tax planning strategies are considered in determining the need for a valuation allowance. In the event Supervalu was not able to realize all or part of its net deferred tax assets in the future, the valuation allowance would be increased. Likewise, if it was determined that Supervalu was more-likely-than-not to realize the net deferred tax assets, the applicable portion of the valuation allowance would reverse. Supervalu had a valuation allowance of $1,196 and $1,408 as of February 25, 2017 and February 27, 2016, respectively.
Included in discontinued operations is the recognition of the additional tax basis in the shares of NAI offset by a valuation allowance on the estimated capital loss. In fiscal 2017, Supervalu utilized a portion of the capital loss offset by a matching release of the valuation allowance on the capital loss. Supervalu has recorded a valuation allowance against the remaining capital loss as there is no evidence that the capital loss will be used prior to its expiration in fiscal 2019.
Self-Insurance Liabilities
Supervalu uses a combination of insurance and self-insurance for workers’ compensation, automobile and general liability costs. It is Supervalu’s policy to record its self-insurance liabilities based on management’s estimate of the ultimate cost of reported claims and claims incurred but not yet reported and related expenses, discounted at a risk-free interest rate.
In determining its self-insurance liabilities, Supervalu performs a continuing review of its overall position and reserving techniques. Since recorded amounts are based on estimates, the ultimate cost of all incurred claims and related expenses may be more or less than the recorded liabilities. Any projection of losses concerning workers’ compensation, healthcare and general and automobile liability is subject to a degree of variability. Among the causes of this variability are unpredictable external factors affecting future inflation rates, discount rates, litigation trends, legal interpretations, regulatory changes, benefit level changes and actual claim settlement patterns.
If, in the future, Supervalu were to experience significant volatility in the amount and timing of cash payments compared to its earlier estimates, Supervalu would assess whether to continue to discount these liabilities. Supervalu had net self-insurance liabilities of approximately $67, net of the discount of $5, and $69, net of the discount of $5, as of February 25, 2017 and February 27, 2016, respectively. For the claims that occurred during the fiscal year ending February 25, 2017, each 25 basis point change in the discount rate would impact the net self-insurance liabilities by less than $1.
42
OFF-BALANCE SHEET ARRANGEMENTS
Guarantees and Contingent Liabilities
Supervalu has outstanding guarantees related to certain leases, fixture financing loans and other debt obligations of various retailers as of February 25, 2017. Supervalu is contingently liable for leases that have been assigned to various third parties in connection with facility closings and dispositions. Supervalu is also a party to a variety of contractual agreements under which it may be obligated to indemnify the other party for certain matters in the ordinary course of business, which indemnities may be secured by operation of law or otherwise. Refer to Note 15—Commitments, Contingencies and Off-Balance Sheet Arrangements in the Notes to Consolidated Financial Statements included in Part II, Item 8 of this Annual Report on Form 10-K for further information regarding Supervalu’s outstanding guarantees and contingent liabilities.
Multiemployer Benefit Plans
Supervalu contributes to various multiemployer pension plans under collective bargaining agreements, primarily defined benefit pension plans. These multiemployer plans generally provide retirement benefits to participants based on their service to contributing employers. The benefits are paid from assets held in trust for that purpose. Plan trustees typically are responsible for determining the level of benefits to be provided to participants as well as the investment of the assets and plan administration. Trustees are appointed in equal number by employers and unions that are parties to the collective bargaining agreement.
Expense is recognized in connection with these plans as contributions are funded, in accordance with Accounting Standards. Supervalu made contributions to these plans, and recognized expense, of $43, $43 and $39 in fiscal 2017, 2016 and 2015, respectively. Company contributions to these plans could increase in the near term. However, the amount of any increase or decrease in contributions will depend on a variety of factors, including the results of Supervalu’s collective bargaining efforts, investment returns on the assets held in the plans, actions taken by the trustees who manage the plans and requirements under the Pension Protection Act of 2006, the Multiemployer Pension Reform Act and Section 412(e) of the Internal Revenue Code. Furthermore, if Supervalu were to significantly reduce contributions, exit certain markets or otherwise cease making contributions to these plans, it could trigger a partial or complete withdrawal that could require Supervalu to make withdrawal liability payments to the fund.
Based on the assessment of the most recent information available from the multiemployer plans, Supervalu believes that most of the plans to which it contributes are underfunded. Supervalu is only one of a number of employers contributing to these plans and the underfunding is not a direct obligation or liability of Supervalu. However, Supervalu has attempted, as of February 25, 2017, to estimate its “proportionate share” of the underfunding of multiemployer plans to which Supervalu contributes, based on the ratio of its contributions to the total of all contributions to these plans in a year. As of February 25, 2017, using methods Supervalu believes are consistent with those used by the plans to establish the underfunded position, the estimate of Supervalu’s share of the underfunding of multiemployer plans to which it contributes was $598, pre-tax, or $368, after-tax. This represents an increase in Supervalu’s estimated proportionate share of the underfunding of approximately $11, pre-tax, or $9, after-tax, as of February 25, 2017, compared to February 27, 2016. The estimate is based on the most current information available to Supervalu including actuarial evaluations and other data, and may be outdated or otherwise unreliable. Supervalu’s proportionate share of underfunding described above is an estimate and could change based on the results of collective bargaining efforts, investment returns on the assets held in the plans, actions taken by trustees who manage the plans’ benefit payments and requirements under the Pension Protection Act of 2006, the Multiemployer Pension Reform Act and Section 412(e) of the Internal Revenue Code. This share of underfunding does not represent a multiemployer pension withdrawal obligation.
Company contributions can fluctuate from year to year due to store closures and reductions in headcount. In fiscal 2018, Supervalu expects to contribute approximately $40 to $50 to the multiemployer pension plans, subject to the outcome of collective bargaining and capital market conditions. Furthermore, if Supervalu were to significantly reduce contributions, exit certain markets or otherwise cease making contributions to these plans, it could trigger a partial or complete withdrawal that would require Supervalu to record a withdrawal liability. Any withdrawal liability would be recorded when it is probable that a liability exists and can be reasonably estimated, in accordance with Accounting Standards.
Supervalu also makes contributions to multiemployer health and welfare plans in amounts set forth in the related collective bargaining agreements. A small minority of collective bargaining agreements contain reserve requirements that may trigger unanticipated contributions resulting in increased healthcare expenses. If these healthcare provisions cannot be renegotiated in a manner that reduces the prospective healthcare cost as Supervalu intends, Supervalu’s Selling and administrative expenses could increase in the future.
43
Refer to Note 10—Benefit Plans in the Notes to Consolidated Financial Statements included in Part II, Item 8 of this Annual Report on Form 10-K for further information regarding the plans in which Supervalu participates.
RECENTLY ISSUED ACCOUNTING STANDARDS
Refer to Note 1—Summary of Significant Accounting Policies in Part II, Item 8 of this Annual Report on Form 10-K under the caption “Recently Issued Accounting Standards” for a discussion of other recently issued accounting standards not yet adopted by Supervalu, and for which Supervalu is currently evaluating their impact on its consolidated financial statements.
CONTRACTUAL OBLIGATIONS
The following table represents Supervalu’s significant contractual obligations as of February 25, 2017:
Payments Due Per Period | |||||||||||||||||||
Total | Fiscal 2018 | Fiscal 2019-2020 | Fiscal 2021-2022 | Thereafter | |||||||||||||||
Contractual obligations(1)(2): | |||||||||||||||||||
Long-term debt(3) | $ | 1,274 | $ | — | $ | 524 | $ | 400 | $ | 350 | |||||||||
Interest on long-term debt(4) | 355 | 88 | 145 | 95 | 27 | ||||||||||||||
Operating leases(5) | 377 | 65 | 118 | 78 | 116 | ||||||||||||||
Capital leases(6) | 259 | 37 | 73 | 55 | 94 | ||||||||||||||
Purchase obligations(7) | 322 | 190 | 81 | 51 | — | ||||||||||||||
Self-insurance obligations(8) | 72 | 21 | 23 | 10 | 18 | ||||||||||||||
Total contractual obligations | $ | 2,659 | $ | 401 | $ | 964 | $ | 689 | $ | 605 | |||||||||
(1) | Because the timing of future payments beyond fiscal 2018 cannot be reasonably determined, contractual obligations payments due per fiscal period presented here exclude Supervalu’s discretionary funding of its pension and required funding of its postretirement benefit obligations, which totaled $62 for fiscal 2017, and multiemployer pension plan contributions, which totaled $43 for fiscal 2017. Pension and postretirement benefit obligations were $322 as of February 25, 2017. Supervalu expects to contribute $5 to $10 to pension and postretirement benefit plans during fiscal 2018, but is not required to make minimum pension contributions. |
(2) | Unrecognized tax benefits, which totaled $59 as of February 25, 2017, were excluded from the contractual obligations table because an estimate of the timing of future tax settlements cannot be reasonably determined. |
(3) | Long-term debt amounts exclude original issue discounts and deferred financing costs. Long-term debt payments due per fiscal period for 2018 through thereafter exclude any Excess Cash Flow prepayments which may be required under the provisions of the Secured Term Loan Facility because the amount of future prepayment amounts, if any, are not reasonably estimable as of February 25, 2017. |
(4) | Amounts include contractual interest payments using the interest rate as of February 25, 2017 applicable to Supervalu’s variable interest debt instruments (including variable interest rates under the Secured Term Loan Facility that have been swapped to fixed interest rates) and stated fixed rates for all other debt instruments. |
(5) | Represents the minimum rents payable under operating leases, excluding common area maintenance, insurance or tax payments, for which Supervalu is also obligated, offset by minimum subtenant rentals of $56, $11, $19, $9 and $17, respectively. |
(6) | Represents the minimum payments under capital leases, excluding common area maintenance, insurance or tax payments, for which Supervalu is also obligated, offset by minimum subtenant rentals of $23, $5, $6, $5 and $7, respectively. |
(7) | Supervalu’s purchase obligations include various obligations that have annual purchase commitments of $1 or greater. As of February 25, 2017, future purchase obligations existed that primarily related to fixed asset and information technology commitments. In addition, in the ordinary course of business, Supervalu enters into supply contracts to purchase product for resale to consumers and to Wholesale customers, which are typically of a short-term nature with limited or no purchase commitments. The majority of Supervalu’s supply contracts are short-term in nature and relate to fixed assets, information technology and contracts to purchase product for resale. These supply contracts typically include either volume commitments or fixed expiration dates, termination provisions and other standard contractual considerations. The supply contracts that are cancelable have not been included above. |
(8) | Supervalu’s insurance reserves include the undiscounted obligations related to workers’ compensation, general and automobile liabilities at the estimated ultimate cost of reported claims and claims incurred but not yet reported and related expenses. |
44
ITEM 7A. QUANTITATIVE AND QUALITATIVE DISCLOSURES ABOUT MARKET RISK
Supervalu does not use financial instruments or derivatives for any trading or other speculative purposes.
Interest Rate Risk
Supervalu is exposed to market pricing risk consisting of interest rate risk related to debt obligations and notes receivable outstanding. Interest rate risk is managed through the strategic use of fixed and variable rate debt and, to a limited extent, derivative financial instruments. Variable interest rate debt (bank loans and revolving lines of credit) is utilized to help maintain liquidity and finance business operations. Variable rate borrowings consist primarily of LIBOR and prime rate based loans, some of which contain interest rate floors. Long-term debt with fixed interest rates is used to assist in managing debt maturities and to diversify sources of debt capital. Changes in interest rates related to debt with fixed interest rates do not have an impact upon future results of operations and cash flow while outstanding; however, if additional debt issuances are required to fund fixed rate debt maturities, future results of operations or cash flows may be impacted.
Long-term loans are extended to certain Wholesale customers in the normal course of business through notes receivable. The notes generally bear fixed interest rates negotiated with each Wholesale customer. The market value of the fixed rate notes is subject to change due to fluctuations in market interest rates.
In February 2016, Supervalu effectively converted $300 of variable rate debt under Supervalu’s Secured Term Loan Facility to a fixed rate by swapping the variable LIBOR rate component to a fixed rate of 2.0075 percent through an outstanding interest rate swap agreement, which matures in March 2019, concurrent with the Secured Term Loan Facility’s maturity. This transaction was entered into to reduce Supervalu’s exposure to changes in market interest rates associated with its variable rate debt. Changes in market interest rates affecting the fair value of the financial instrument and unfavorable changes in interest expense, and counterparty credit risk are some of the risks associated with utilizing interest rate swaps. At the inception of the interest rate swap, the all-in rate of this $300 tranche was 5.5075 percent. On May 20, 2016, Supervalu entered into a third amendment to the Secured Term Loan Facility which increased the interest rate for the term loan from LIBOR plus 3.50 percent to LIBOR plus 4.50 percent. Following this amendment, the all-in rate for this $300 tranche was 6.5075 percent. As of February 25, 2017, a 100 basis point increase in forward LIBOR interest rates would increase the fair value of the interest rate swap by approximately $5; a 100 basis point decrease would decrease the fair value by approximately $2.
The table below provides information about Supervalu’s financial instruments that are sensitive to changes in interest rates, including debt obligations, notes receivable and interest rate swaps. For debt obligations, the table presents principal payments and related weighted average interest rates by year of maturity using interest rates as of February 25, 2017, applicable to variable interest debt instruments and stated fixed rates for all other debt instruments, excluding any original issue discounts and deferred financing costs. For notes receivable, the table presents the expected collection of principal cash flows and weighted average interest rates by expected year of maturity. For the interest rate swap agreement, the table presents the differential between interest payable and interest receivable under the swap agreement utilized to compute the fair value of the interest rate swaps.
45
Interest Rate Positions as of February 25, 2017 | |||||||||||||||||||||||||||||||
February 25, 2017 | Aggregate Payments/Receipts by Fiscal Year | ||||||||||||||||||||||||||||||
Fair Value | Total | 2018 | 2019 | 2020 | 2021 | 2022 | Thereafter | ||||||||||||||||||||||||
(in millions, except rates) | |||||||||||||||||||||||||||||||
Debt with variable interest rates | |||||||||||||||||||||||||||||||
Principal payments | $ | 226 | $ | 224 | $ | — | $ | — | $ | 224 | $ | — | $ | — | $ | — | |||||||||||||||
Variable interest rate | 5.5 | % | — | % | — | % | 5.5 | % | — | % | — | % | — | % | |||||||||||||||||
Debt with fixed interest rates | |||||||||||||||||||||||||||||||
Principal payments on senior notes | $ | 745 | $ | 750 | $ | — | $ | — | $ | — | $ | — | $ | 400 | $ | 350 | |||||||||||||||
Average fixed rate | 7.2 | % | — | % | — | % | — | % | — | % | 6.8 | % | 7.8 | % | |||||||||||||||||
Principal payments on floating rate debt converted to fixed rate debt(1) | $ | 302 | $ | 300 | $ | — | $ | — | $ | 300 | $ | — | $ | — | $ | — | |||||||||||||||
Fixed interest rate | 6.5 | % | — | % | — | % | 6.5 | % | — | % | — | % | — | % | |||||||||||||||||
Notes receivable | |||||||||||||||||||||||||||||||
Principal receivable | $ | 28 | $ | 28 | $ | 8 | $ | 6 | $ | 4 | $ | 4 | $ | 3 | $ | 3 | |||||||||||||||
Average rate receivable | 5.1 | % | 5.6 | % | 5.8 | % | 5.3 | % | 4.7 | % | 4.0 | % | 3.8 | % | |||||||||||||||||
Interest rate swap related to debt with variable interest rates:(1) | |||||||||||||||||||||||||||||||
Forward starting fixed rate paid | 2.0 | % | — | % | — | % | 2.0 | % | — | % | — | % | — | % | |||||||||||||||||
Forward starting variable rate received | Rate A(2) | — | % | — | % | Rate A(2) | — | % | — | % | — | % | |||||||||||||||||||
(1) | Relates to the $300 of debt with variable interest payments under the Secured Term Loan Facility that Supervalu converted the variable LIBOR rate component to a fixed rate of 2.0075 percent through an outstanding interest rate swap agreement. Fixed rate payments began in February 2016 and conclude in March 2019. The fair value of this instrument represents a liability of $3 as of February 25, 2017. |
(2) | One-month LIBOR, subject to a 1.00 percent floor. |
Investment Risk
The SUPERVALU Retirement Plan, which is a Company-sponsored qualified defined benefit pension plan, holds investments in public and private equity, fixed income and real estate securities, which is described further in Note 10—Benefit Plans in Part II, Item 8 of this Annual Report on Form 10-K. Changes in SUPERVALU Retirement Plan assets can affect the amount of Supervalu’s anticipated future contributions. In addition, increases or decreases in SUPERVALU Retirement Plan assets and can result in a related increase or decrease to Supervalu’s equity through Accumulated other comprehensive loss. As of February 25, 2017, a 10 percent unfavorable change in the value of investments held by the SUPERVALU Retirement Plan would not have had an impact on Supervalu’s minimum contributions required under ERISA for fiscal 2017, but would have resulted in an unfavorable change in net periodic pension expense for fiscal 2018 of $8 and would have reduced stockholders’ equity by $218 on a pre-tax basis as of February 25, 2017.
46
ITEM 8. FINANCIAL STATEMENTS AND SUPPLEMENTARY DATA
Index of Consolidated Financial Statements
Page | |
Consolidated Financial Statements: | |
All other schedules are omitted because they are not applicable or not required. | |
47
REPORT OF INDEPENDENT REGISTERED PUBLIC ACCOUNTING FIRM
The Board of Directors and Stockholders
SUPERVALU INC.:
We have audited the accompanying consolidated balance sheets of SUPERVALU INC. and subsidiaries as of February 25, 2017 and February 27, 2016, and the related consolidated statements of operations, comprehensive income, stockholders’ equity (deficit), and cash flows for each of the fiscal years in the three-year period ended February 25, 2017. We also have audited SUPERVALU INC.’s internal control over financial reporting as of February 25, 2017, based on criteria established in Internal Control—Integrated Framework (2013) issued by the Committee of Sponsoring Organizations of the Treadway Commission (COSO). SUPERVALU INC.’s management is responsible for these consolidated financial statements, for maintaining effective internal control over financial reporting, and for its assessment of the effectiveness of internal control over financial reporting, included in the accompanying Management’s Annual Report on Internal Control over Financial Reporting. Our responsibility is to express an opinion on these consolidated financial statements, and an opinion on the Company’s internal control over financial reporting based on our audits.
We conducted our audits in accordance with the standards of the Public Company Accounting Oversight Board (United States). Those standards require that we plan and perform the audits to obtain reasonable assurance about whether the financial statements are free of material misstatement and whether effective internal control over financial reporting was maintained in all material respects. Our audits of the consolidated financial statements included examining, on a test basis, evidence supporting the amounts and disclosures in the financial statements, assessing the accounting principles used and significant estimates made by management, and evaluating the overall financial statement presentation. Our audit of internal control over financial reporting included obtaining an understanding of internal control over financial reporting, assessing the risk that a material weakness exists, and testing and evaluating the design and operating effectiveness of internal control based on the assessed risk. Our audits also included performing such other procedures as we considered necessary in the circumstances. We believe that our audits provide a reasonable basis for our opinions.
A company’s internal control over financial reporting is a process designed to provide reasonable assurance regarding the reliability of financial reporting and the preparation of financial statements for external purposes in accordance with generally accepted accounting principles. A company’s internal control over financial reporting includes those policies and procedures that (1) pertain to the maintenance of records that, in reasonable detail, accurately and fairly reflect the transactions and dispositions of the assets of the company; (2) provide reasonable assurance that transactions are recorded as necessary to permit preparation of financial statements in accordance with generally accepted accounting principles, and that receipts and expenditures of the company are being made only in accordance with authorizations of management and directors of the company; and (3) provide reasonable assurance regarding prevention or timely detection of unauthorized acquisition, use, or disposition of the company’s assets that could have a material effect on the financial statements.
Because of its inherent limitations, internal control over financial reporting may not prevent or detect misstatements. Also, projections of any evaluation of effectiveness to future periods are subject to the risk that controls may become inadequate because of changes in conditions, or that the degree of compliance with the policies or procedures may deteriorate.
In our opinion, the consolidated financial statements referred to above present fairly, in all material respects, the financial position of SUPERVALU INC. and subsidiaries as of February 25, 2017 and February 27, 2016, and the results of their operations and their cash flows for each of the years in the three-year period ended February 25, 2017, in conformity with U.S. generally accepted accounting principles. Also in our opinion, SUPERVALU INC. maintained, in all material respects, effective internal control over financial reporting as of February 25, 2017, based on criteria established in Internal Control—Integrated Framework (2013) issued by the Committee of Sponsoring Organizations of the Treadway Commission.
/s/ KPMG LLP
Minneapolis, Minnesota
April 25, 2017
48
SUPERVALU INC. and Subsidiaries
CONSOLIDATED SEGMENT FINANCIAL INFORMATION
(In millions)
Fiscal Years Ended | |||||||||||
February 25, 2017 (52 weeks) | February 27, 2016 (52 weeks) | February 28, 2015 (53 weeks) | |||||||||
Net sales | |||||||||||
Wholesale | $ | 7,705 | $ | 7,935 | $ | 8,198 | |||||
% of total | 61.7 | % | 61.5 | % | 61.7 | % | |||||
Retail | 4,596 | 4,769 | 4,884 | ||||||||
% of total | 36.8 | % | 36.9 | % | 36.8 | % | |||||
Corporate | 179 | 203 | 195 | ||||||||
% of total | 1.5 | % | 1.6 | % | 1.5 | % | |||||
Total net sales | $ | 12,480 | $ | 12,907 | $ | 13,277 | |||||
100.0 | % | 100.0 | % | 100.0 | % | ||||||
Operating earnings | |||||||||||
Wholesale | $ | 238 | $ | 230 | $ | 243 | |||||
% of Wholesale sales | 3.1 | % | 2.9 | % | 3.0 | % | |||||
Retail | (45 | ) | 94 | 122 | |||||||
% of Retail sales | (1.0 | )% | 2.0 | % | 2.5 | % | |||||
Corporate | (10 | ) | (26 | ) | (115 | ) | |||||
Total operating earnings | 183 | 298 | 250 | ||||||||
% of total net sales | 1.5 | % | 2.3 | % | 1.9 | % | |||||
Interest expense, net | 181 | 195 | 242 | ||||||||
Equity in earnings of unconsolidated affiliates | (5 | ) | (5 | ) | (4 | ) | |||||
Earnings from continuing operations before income taxes | 7 | 108 | 12 | ||||||||
Income tax (benefit) provision | (20 | ) | 24 | (13 | ) | ||||||
Net earnings from continuing operations | 27 | 84 | 25 | ||||||||
Income from discontinued operations, net of tax | 627 | 102 | 174 | ||||||||
Net earnings including noncontrolling interests | 654 | 186 | 199 | ||||||||
Less net earnings attributable to noncontrolling interests | (4 | ) | (8 | ) | (7 | ) | |||||
Net earnings attributable to SUPERVALU INC. | $ | 650 | $ | 178 | $ | 192 | |||||
Depreciation and amortization | |||||||||||
Wholesale | $ | 54 | $ | 49 | $ | 48 | |||||
Retail | 145 | 153 | 172 | ||||||||
Corporate | 8 | 8 | 3 | ||||||||
Total | $ | 207 | $ | 210 | $ | 223 | |||||
Capital expenditures | |||||||||||
Wholesale | $ | 87 | $ | 76 | $ | 73 | |||||
Retail | 112 | 96 | 89 | ||||||||
Total | $ | 199 | $ | 172 | $ | 162 | |||||
Identifiable assets | |||||||||||
Wholesale | $ | 2,075 | $ | 1,998 | $ | 1,997 | |||||
Retail | 1,217 | 1,328 | 1,381 | ||||||||
Corporate | 288 | 45 | 78 | ||||||||
Discontinued operations | — | 999 | 978 | ||||||||
Total | $ | 3,580 | $ | 4,370 | $ | 4,434 | |||||
Refer to Note 16—Segment Information in the accompanying Notes to Consolidated Financial Statements for additional information concerning Supervalu’s reportable segments.
See Notes to Consolidated Financial Statements.
49
SUPERVALU INC. and Subsidiaries
CONSOLIDATED STATEMENTS OF OPERATIONS
(In millions, except per share data)
Fiscal Years Ended | |||||||||||
February 25, 2017 (52 weeks) | February 27, 2016 (52 weeks) | February 28, 2015 (53 weeks) | |||||||||
Net sales | $ | 12,480 | $ | 12,907 | $ | 13,277 | |||||
Cost of sales | 10,693 | 11,033 | 11,379 | ||||||||
Gross profit | 1,787 | 1,874 | 1,898 | ||||||||
Selling and administrative expenses | 1,589 | 1,570 | 1,648 | ||||||||
Goodwill and intangible asset impairment charges | 15 | 6 | — | ||||||||
Operating earnings | 183 | 298 | 250 | ||||||||
Interest expense, net | 181 | 195 | 242 | ||||||||
Equity in earnings of unconsolidated affiliates | (5 | ) | (5 | ) | (4 | ) | |||||
Earnings from continuing operations before income taxes | 7 | 108 | 12 | ||||||||
Income tax (benefit) provision | (20 | ) | 24 | (13 | ) | ||||||
Net earnings from continuing operations | 27 | 84 | 25 | ||||||||
Income from discontinued operations, net of tax | 627 | 102 | 174 | ||||||||
Net earnings including noncontrolling interests | 654 | 186 | 199 | ||||||||
Less net earnings attributable to noncontrolling interests | (4 | ) | (8 | ) | (7 | ) | |||||
Net earnings attributable to SUPERVALU INC. | $ | 650 | $ | 178 | $ | 192 | |||||
Basic net earnings per share attributable to SUPERVALU INC.: | |||||||||||
Continuing operations | $ | 0.09 | $ | 0.29 | $ | 0.07 | |||||
Discontinued operations | $ | 2.37 | $ | 0.39 | $ | 0.67 | |||||
Basic net earnings per share | $ | 2.45 | $ | 0.68 | $ | 0.74 | |||||
Diluted net earnings per share attributable to SUPERVALU INC.: | |||||||||||
Continuing operations | $ | 0.09 | $ | 0.28 | $ | 0.07 | |||||
Discontinued operations | $ | 2.34 | $ | 0.38 | $ | 0.66 | |||||
Diluted net earnings per share | $ | 2.43 | $ | 0.66 | $ | 0.73 | |||||
Weighted average number of shares outstanding: | |||||||||||
Basic | 265 | 263 | 260 | ||||||||
Diluted | 268 | 268 | 264 | ||||||||
See Notes to Consolidated Financial Statements.
50
SUPERVALU INC. and Subsidiaries
CONSOLIDATED STATEMENTS OF COMPREHENSIVE INCOME
(In millions)
Fiscal Years Ended | |||||||||||
February 25, 2017 (52 weeks) | February 27, 2016 (52 weeks) | February 28, 2015 (53 weeks) | |||||||||
Net earnings including noncontrolling interests | $ | 654 | $ | 186 | $ | 199 | |||||
Other comprehensive income (loss): | |||||||||||
Recognition of pension and other postretirement benefit obligations(1) | 142 | 5 | (116 | ) | |||||||
Recognition of interest rate swap cash flow hedge(2) | 2 | (4 | ) | — | |||||||
Total other comprehensive income (loss) | 144 | 1 | (116 | ) | |||||||
Comprehensive income including noncontrolling interests | 798 | 187 | 83 | ||||||||
Less comprehensive income attributable to noncontrolling interests | (4 | ) | (8 | ) | (7 | ) | |||||
Comprehensive income attributable to SUPERVALU INC. | $ | 794 | $ | 179 | $ | 76 | |||||
(1) Amounts are net of tax expense (benefit) of $70, $14, and $(27) for fiscal 2017, fiscal 2016 and fiscal 2015, respectively.
(2) Amounts are net of tax expense (benefit) of $1, $(2), and $0 for fiscal 2017, fiscal 2016 and fiscal 2015, respectively.
See Notes to Consolidated Financial Statements
51
SUPERVALU INC. and Subsidiaries
CONSOLIDATED BALANCE SHEETS
(In millions, except par value data)
February 25, 2017 | February 27, 2016 | ||||||
ASSETS | |||||||
Current assets | |||||||
Cash and cash equivalents | $ | 332 | $ | 42 | |||
Receivables, net | 386 | 406 | |||||
Inventories, net | 764 | 738 | |||||
Other current assets | 59 | 73 | |||||
Current assets of discontinued operations | — | 376 | |||||
Total current assets | 1,541 | 1,635 | |||||
Property, plant and equipment, net | 1,004 | 1,021 | |||||
Goodwill | 710 | 725 | |||||
Intangible assets, net | 39 | 47 | |||||
Deferred tax assets | 165 | 238 | |||||
Other assets | 121 | 91 | |||||
Long-term assets of discontinued operations | — | 613 | |||||
Total assets | $ | 3,580 | $ | 4,370 | |||
LIABILITIES AND STOCKHOLDERS’ EQUITY (DEFICIT) | |||||||
Current liabilities | |||||||
Accounts payable | $ | 881 | $ | 829 | |||
Accrued vacation, compensation and benefits | 150 | 148 | |||||
Current maturities of long-term debt and capital lease obligations | 26 | 123 | |||||
Other current liabilities | 172 | 126 | |||||
Current liabilities of discontinued operations | — | 346 | |||||
Total current liabilities | 1,229 | 1,572 | |||||
Long-term debt | 1,263 | 2,197 | |||||
Long-term capital lease obligations | 186 | 194 | |||||
Pension and other postretirement benefit obligations | 322 | 578 | |||||
Long-term tax liabilities | 63 | 75 | |||||
Other long-term liabilities | 134 | 145 | |||||
Long-term liabilities of discontinued operations | — | 42 | |||||
Commitments and contingencies | |||||||
Stockholders’ equity (deficit) | |||||||
Common stock, $0.01 par value: 400 shares authorized; 268 and 266 shares issued, respectively | 3 | 3 | |||||
Capital in excess of par value | 2,828 | 2,808 | |||||
Treasury stock, at cost, 0 and 1 shares, respectively | (2 | ) | (5 | ) | |||
Accumulated other comprehensive loss | (278 | ) | (422 | ) | |||
Accumulated deficit | (2,175 | ) | (2,825 | ) | |||
Total SUPERVALU INC. stockholders’ equity (deficit) | 376 | (441 | ) | ||||
Noncontrolling interests | 7 | 8 | |||||
Total stockholders’ equity (deficit) | 383 | (433 | ) | ||||
Total liabilities and stockholders’ equity (deficit) | $ | 3,580 | $ | 4,370 | |||
See Notes to Consolidated Financial Statements.
52
SUPERVALU INC. and Subsidiaries
CONSOLIDATED STATEMENTS OF STOCKHOLDERS’ EQUITY (DEFICIT)
(In millions, except per share data)
Common Stock | Capital in Excess of Par Value | Treasury Stock | Accumulated Other Comprehensive Loss | Accumulated Deficit | SUPERVALU INC. Stockholders’ Equity (Deficit) | Noncontrolling interests | Total Stockholders’ Equity (Deficit) | ||||||||||||||||||||||||
Balances as of February 22, 2014 | $ | 3 | $ | 2,862 | $ | (101 | ) | $ | (307 | ) | $ | (3,195 | ) | $ | (738 | ) | $ | 8 | $ | (730 | ) | ||||||||||
Net earnings | — | — | — | — | 192 | 192 | 7 | 199 | |||||||||||||||||||||||
Other comprehensive loss, net of tax of $27 | — | — | — | (116 | ) | — | (116 | ) | — | (116 | ) | ||||||||||||||||||||
Sales of common stock under option plans | — | (62 | ) | 69 | — | — | 7 | — | 7 | ||||||||||||||||||||||
Stock-based compensation | — | 22 | — | — | — | 22 | — | 22 | |||||||||||||||||||||||
Distributions to noncontrolling interests | — | — | — | — | — | — | (8 | ) | (8 | ) | |||||||||||||||||||||
Contributions from noncontrolling interests | — | — | — | — | — | — | 3 | 3 | |||||||||||||||||||||||
Tax impact on stock-based awards and other | — | (12 | ) | (1 | ) | — | — | (13 | ) | — | (13 | ) | |||||||||||||||||||
Balances as of February 28, 2015 | 3 | 2,810 | (33 | ) | (423 | ) | (3,003 | ) | (646 | ) | 10 | (636 | ) | ||||||||||||||||||
Net earnings | — | — | — | — | 178 | 178 | 8 | 186 | |||||||||||||||||||||||
Other comprehensive income, net of tax of $12 | — | — | — | 1 | — | 1 | — | 1 | |||||||||||||||||||||||
Sales of common stock under option plans | — | (12 | ) | 22 | — | — | 10 | — | 10 | ||||||||||||||||||||||
Stock-based compensation | — | 25 | — | — | — | 25 | — | 25 | |||||||||||||||||||||||
Distributions to noncontrolling interests | — | — | — | — | — | — | (10 | ) | (10 | ) | |||||||||||||||||||||
Tax impact on stock-based awards and other | — | (15 | ) | 6 | — | — | (9 | ) | — | (9 | ) | ||||||||||||||||||||
Balances as of February 27, 2016 | 3 | 2,808 | (5 | ) | (422 | ) | (2,825 | ) | (441 | ) | 8 | (433 | ) | ||||||||||||||||||
Net earnings | — | — | — | — | 650 | 650 | 4 | 654 | |||||||||||||||||||||||
Other comprehensive income, net of tax of $71 | — | — | — | 144 | — | 144 | — | 144 | |||||||||||||||||||||||
Sales of common stock under option plans | — | (3 | ) | 6 | — | — | 3 | — | 3 | ||||||||||||||||||||||
Stock-based compensation | — | 22 | — | — | — | 22 | — | 22 | |||||||||||||||||||||||
Distributions to noncontrolling interests | — | — | — | — | — | — | (7 | ) | (7 | ) | |||||||||||||||||||||
Tax impact on stock-based awards and other | — | 1 | (3 | ) | — | — | (2 | ) | 2 | — | |||||||||||||||||||||
Balances as of February 25, 2017 | $ | 3 | $ | 2,828 | $ | (2 | ) | $ | (278 | ) | $ | (2,175 | ) | $ | 376 | $ | 7 | $ | 383 | ||||||||||||
See Notes to Consolidated Financial Statements.
53
SUPERVALU INC. and Subsidiaries
CONSOLIDATED STATEMENTS OF CASH FLOWS
(In millions)
Fiscal Years Ended | |||||||||||
February 25, 2017 (52 weeks) | February 27, 2016 (52 weeks) | February 28, 2015 (53 weeks) | |||||||||
Cash flows from operating activities | |||||||||||
Net earnings including noncontrolling interests | $ | 654 | $ | 186 | $ | 199 | |||||
Income from discontinued operations, net of tax | 627 | 102 | 174 | ||||||||
Net earnings from continuing operations | 27 | 84 | 25 | ||||||||
Adjustments to reconcile Net earnings from continuing operations to Net cash provided by operating activities—continuing operations: | |||||||||||
Goodwill and intangible asset impairment charges | 15 | 6 | — | ||||||||
Asset impairment and other charges | 47 | 8 | 4 | ||||||||
Loss on debt extinguishment | 19 | 10 | 38 | ||||||||
Net gain on sale of assets and exits of surplus leases | (1 | ) | (2 | ) | (13 | ) | |||||
Depreciation and amortization | 207 | 210 | 223 | ||||||||
LIFO charge | 1 | 3 | 8 | ||||||||
Deferred income taxes | 2 | 1 | 4 | ||||||||
Stock-based compensation | 18 | 22 | 20 | ||||||||
Net pension and other postretirement benefits costs | 18 | 34 | 96 | ||||||||
Contributions to pension and other postretirement benefit plans | (62 | ) | (40 | ) | (169 | ) | |||||
Other adjustments | 3 | 20 | 29 | ||||||||
Changes in operating assets and liabilities, net of effects from business combinations: | |||||||||||
Receivables | 27 | 22 | 7 | ||||||||
Inventories | (18 | ) | (52 | ) | (71 | ) | |||||
Accounts payable and accrued liabilities | 36 | (33 | ) | 59 | |||||||
Income taxes | (23 | ) | (8 | ) | (14 | ) | |||||
Other changes in operating assets and liabilities | (8 | ) | (40 | ) | (35 | ) | |||||
Net cash provided by operating activities—continuing operations | 308 | 245 | 211 | ||||||||
Net cash provided by operating activities—discontinued operations | 53 | 179 | 197 | ||||||||
Net cash provided by operating activities | 361 | 424 | 408 | ||||||||
Cash flows from investing activities | |||||||||||
Proceeds from sale of assets | 4 | 2 | 4 | ||||||||
Purchases of property, plant and equipment | (182 | ) | (158 | ) | (162 | ) | |||||
Payments for business acquisition | (19 | ) | (7 | ) | (37 | ) | |||||
Other | (1 | ) | (24 | ) | 1 | ||||||
Net cash used in investing activities—continuing operations | (198 | ) | (187 | ) | (194 | ) | |||||
Net cash provided by (used in) investing activities—discontinued operations | 1,219 | (101 | ) | (91 | ) | ||||||
Net cash provided by (used in) investing activities | 1,021 | (288 | ) | (285 | ) | ||||||
Cash flows from financing activities | |||||||||||
Proceeds from issuance of debt | 218 | 138 | 350 | ||||||||
Proceeds from the sale of common stock | 3 | 10 | 7 | ||||||||
Payments of debt and capital lease obligations | (1,315 | ) | (320 | ) | (399 | ) | |||||
Payments for debt financing costs | (6 | ) | (9 | ) | (42 | ) | |||||
Distributions to noncontrolling interests | (7 | ) | (10 | ) | (8 | ) | |||||
Other | 1 | (1 | ) | — | |||||||
Net cash used in financing activities—continuing operations | (1,106 | ) | (192 | ) | (92 | ) | |||||
Net cash used in financing activities—discontinued operations | (1 | ) | (1 | ) | — | ||||||
Net cash used in financing activities | (1,107 | ) | (193 | ) | (92 | ) | |||||
Net increase (decrease) in cash and cash equivalents | 275 | (57 | ) | 31 | |||||||
Cash and cash equivalents at beginning of year | 57 | 114 | 83 | ||||||||
Cash and cash equivalents at end of year | $ | 332 | $ | 57 | $ | 114 | |||||
Less cash and cash equivalents of discontinued operations at end of year | — | (15 | ) | (39 | ) | ||||||
Cash and cash equivalents of continuing operations at end of year | $ | 332 | $ | 42 | $ | 75 | |||||
SUPPLEMENTAL CASH FLOW INFORMATION | |||||||||||
Supervalu’s non-cash activities were as follows: | |||||||||||
Purchases of property, plant and equipment included in Accounts payable | $ | 33 | $ | 28 | $ | 21 | |||||
Capital lease asset additions | $ | 17 | $ | 20 | $ | 1 | |||||
Interest and income taxes paid: | |||||||||||
Interest paid, net of amounts capitalized | $ | 156 | $ | 176 | $ | 180 | |||||
Income taxes paid (refunded), net | $ | 24 | $ | 91 | $ | (7 | ) | ||||
See Notes to Consolidated Financial Statements.
54
SUPERVALU INC. and Subsidiaries
NOTES TO CONSOLIDATED FINANCIAL STATEMENTS
(Dollars and shares in millions, except per share data, unless otherwise noted)
NOTE 1—SUMMARY OF SIGNIFICANT ACCOUNTING POLICIES
Business Description and Principles of Consolidation
SUPERVALU INC. and its subsidiaries (“Supervalu” or the “Company”) operates primarily in the United States grocery channel. Supervalu provides supply chain services, primarily wholesale distribution and support services, and operates five retail grocery banners in six geographic regions under the Cub Foods, Shoppers Food & Pharmacy, Shop ’n Save, Farm Fresh and Hornbacher’s banners. The Consolidated Financial Statements include the accounts of Supervalu and all its wholly and majority-owned subsidiaries. All intercompany accounts and transactions have been eliminated in consolidation.
On December 5, 2016, Supervalu completed the sale of Supervalu’s Save-A-Lot business to SAL Acquisition Corp (f/k/a Smith Acquisition Corp), an affiliate of Onex Partners Managers LP, for a purchase price of $1,365 in cash, subject to customary closing adjustments that reduced the purchase price by approximately $61. The sale of Save-A-Lot was completed pursuant to the terms of the Agreement and Plan of Merger, dated as of October 16, 2016 (the “SAL Merger Agreement”), by and among SAL Acquisition Corp, SAL Merger Sub Corp (f/k/a Smith Merger Sub Corp), a newly formed wholly owned subsidiary of the SAL Acquisition Corp, Supervalu and Moran Foods, LLC, a wholly owned subsidiary of Supervalu prior to the sale (“Moran Foods”). Concurrently with entering into the SAL Merger Agreement, Supervalu and Moran Foods also entered into a Separation Agreement (the “Separation Agreement”) pursuant to which, among other things, the assets and liabilities of the Save-A-Lot business were transferred to and assumed by Moran Foods prior to the completion of the sale. Also in connection with the completion of the sale, Supervalu and Moran Foods entered into a Services Agreement, whereby Supervalu is providing certain professional services to Save-A-Lot for a period of five years, on and subject to the terms and conditions set forth therein. The assets, liabilities, operating results, and cash flows of Save-A-Lot have been presented separately as discontinued operations in the Consolidated Financial Statements for all periods presented. In addition, discontinued operations include the results of operations and cash flows attributed to the assets and liabilities of the New Albertson’s, Inc. business that Supervalu sold during fiscal 2013. See Note 17—Discontinued Operations for additional information regarding these discontinued operations.
Unless otherwise indicated, references to the Consolidated Statements of Operations and the Consolidated Balance Sheets in the Notes to the Consolidated Financial Statements exclude all amounts related to discontinued operations.
Fiscal Year
Supervalu operates on a 52/53 week fiscal year basis, with its fiscal year ending on the last Saturday in February. All references to fiscal 2017, 2016 and 2015 relate to the 52-week fiscal year ended February 25, 2017, the 52-week fiscal year ended February 27, 2016 and the 53-week fiscal year ended February 28, 2015, respectively.
Use of Estimates
The preparation of Supervalu’s Consolidated Financial Statements in conformity with accounting principles generally accepted in the United States requires management to make estimates and assumptions that affect the reported amounts of assets and liabilities and disclosure of contingent assets and liabilities at the date of the financial statements, and the reported amounts of revenues and expenses for the reporting periods presented. Actual results could differ from those estimates.
Revenue Recognition
Revenues from Wholesale product sales are recognized upon delivery or shipment. Revenues from Retail product sales are recognized at the point of sale. Typically, invoicing, shipping, delivery and customer receipt of Wholesale product occur on the same business day. Revenues from fixed price services contracts are recognized on a straight-line basis unless revenues are earned and performance obligations are fulfilled under a different pattern. In certain circumstances, Supervalu provides incentives to Wholesale customers through upfront cash payments. Incentives are recognized as a reduction of Net sales over the term of the incentive agreements when clawback rights exist for such payments, which typically coincides with the term of the supply agreements. When no clawback provisions exist, these incentives are recognized immediately. Discounts and allowances provided to customers by Supervalu at the time of sale are recognized as a reduction in Net sales as the products are sold to customers. Sales tax is excluded from Net sales.
55
Revenues and costs from professional services and third-party logistics operations are recorded gross when Supervalu is the primary obligor in a transaction, is subject to inventory or credit risk, has latitude in establishing price and selecting suppliers, or has several, but not all, of these indicators. If Supervalu is not the primary obligor and amounts earned have little or no inventory or credit risk, revenue is recorded net as management fees when earned.
Revenue is recognized only when evidence of an arrangement exists, the price is fixed and determinable, the products and services have been rendered and collectability is reasonably assured.
Cost of Sales
Cost of sales in the Consolidated Statements of Operations includes cost of inventory sold during the period, including purchasing, receiving, warehousing and distribution costs, and shipping and handling fees.
Retail store advertising expenses and Wholesale advertising services provided to Wholesale customers are components of Cost of sales and are expensed as incurred. Retail advertising expenses, net of cooperative advertising reimbursements, were $32, $29 and $28 for fiscal 2017, 2016 and 2015, respectively.
Supervalu receives allowances and credits from vendors for volume incentives, promotional allowances and, to a lesser extent, new product introductions, which are typically based on contractual arrangements covering a period of one year or less. Supervalu recognizes vendor funds for merchandising and buying activities as a reduction of Cost of sales when the related products are sold. Vendor funds that have been earned as a result of completing the required performance under the terms of the underlying agreements but for which the product has not yet been sold are recognized as reductions of inventory. When payments or rebates can be reasonably estimated and it is probable that the specified target will be met, the payment or rebate is accrued. However, when attaining the milestone is not probable, the payment or rebate is recognized only when and if the milestone is achieved. Any upfront payments received for multi-period contracts are generally deferred and amortized on a straight-line basis over the life of the contracts.
Selling and Administrative Expenses
Selling and administrative expenses consist primarily of store and corporate employee-related costs, such as salaries and wages, incentive compensation, health and welfare and workers’ compensation, as well as net periodic pension expense, occupancy costs, including rent, utilities and operating costs of retail stores, depreciation and amortization, impairment charges on property, plant and equipment and other administrative costs. The shared service center costs incurred to support back office functions related to services agreements represent administrative overhead and are recorded in Selling and administrative expenses.
Cash and Cash Equivalents
Supervalu considers all highly liquid investments with a maturity of three months or less at the time of purchase to be cash equivalents. Cash and cash equivalents include amounts due from credit card sales transactions that are settled early in the following period. Supervalu’s banking arrangements allow Supervalu to fund outstanding checks when presented to the financial institution for payment. Supervalu funds all intraday bank balance overdrafts during the same business day. Checks outstanding in excess of bank balances create book overdrafts, which are recorded in Accounts payable in the Consolidated Balance Sheets and are reflected as an operating activity in the Consolidated Statements of Cash Flows. As of February 25, 2017 and February 27, 2016, Supervalu had net book overdrafts of $91 and $79, respectively.
Allowances for Losses on Receivables
Management makes estimates of the uncollectability of its accounts and notes receivable. In determining the adequacy of the allowances, management analyzes customer creditworthiness, aging of receivables, the value of the collateral, customer financial statements, historical collection experience, aging of receivables and other economic and industry factors. It is possible that the accuracy of the estimation process could be materially impacted by different judgments, estimations and assumptions based on the information considered and result in a further deterioration of accounts and notes receivable. Bad debt (income) expense was $(5), $3 and $0 in fiscal 2017, 2016 and 2015, respectively.
Inventories, Net
Inventories are valued at the lower of cost or market. Substantially all of Supervalu’s inventory consists of finished goods.
Supervalu uses the weighted average cost method, the retail inventory method (“RIM”) or replacement cost method to value discrete inventory items at lower of cost or market under the first-in, first-out (“FIFO”) method before application of any last-
56
in, first-out (“LIFO”) reserve. As of February 25, 2017 and February 27, 2016, approximately 73 percent and 75 percent, respectively, of Supervalu’s inventories were valued under the LIFO method.
As of February 25, 2017 and February 27, 2016, approximately 9 percent of Supervalu’s inventories were valued under the replacement cost method before application of any LIFO reserve. The weighted average cost and RIM methods of inventory valuation together comprised approximately 91 percent and 91 percent of inventory as of February 25, 2017 and February 27, 2016, respectively, before application of any LIFO reserve.
Under the replacement cost method applied on a LIFO basis, the most recent purchase cost is used to calculate the current cost of inventory before application of any LIFO reserve. The replacement cost approach results in inventories being valued at the lower of cost or market because of the high inventory turnover and the resulting low inventory days supply on hand combined with infrequent vendor price changes for these items of inventory.
The replacement cost approach under the FIFO method is predominantly utilized in determining the value of high turnover perishable items, including produce, deli, bakery, meat and floral, and pharmacy inventory.
As of February 25, 2017 and February 27, 2016, approximately 25 percent and 23 percent, respectively, of Supervalu’s inventories were valued using the weighted average cost, RIM and replacement cost methods under the FIFO method of inventory accounting. The remaining 2 percent and 2 percent of Supervalu’s inventories as of February 25, 2017 and February 27, 2016, respectively, were valued using the replacement cost approach under the FIFO method of inventory accounting. The replacement cost approach applied under the FIFO method results in inventories recorded at the lower of cost or market because of the very high inventory turnover and the resulting low inventory days supply for these items of inventory.
During fiscal 2017 and 2016, inventory quantities in certain LIFO layers were reduced. These reductions resulted in a liquidation of LIFO inventory quantities carried at lower costs prevailing in prior years as compared with the cost of fiscal 2017 and 2016 purchases. As a result, Cost of sales decreased by $2 and $1 in fiscal 2017 and 2016, respectively. If the FIFO method had been used to determine cost of inventories for which the LIFO method is used, Supervalu’s inventories would have been higher by approximately $216 and $215 as of February 25, 2017 and February 27, 2016, respectively.
Supervalu evaluates inventory shortages throughout each fiscal year based on actual physical counts in its stores and distribution facilities. Allowances for inventory shortages are recorded based on the results of these counts to provide for estimated shortages as of the end of each fiscal year.
Property, Plant and Equipment, Net
Property, plant and equipment are carried at cost. Depreciation is based on the estimated useful lives of the assets using the straight-line method. Estimated useful lives generally are ten to 40 years for buildings and major improvements, three to ten years for equipment, and the shorter of the term of the lease or expected life for leasehold improvements and capitalized lease assets. Interest on property under construction of $1, $1 and $1 was capitalized in fiscal 2017, 2016 and 2015, respectfully.
Business Dispositions
Supervalu reviews the presentation of planned business dispositions in the Consolidated Financial Statements based on the available information and events that have occurred.
The review consists of evaluating whether the business meets the definition as a component for which the operations and cash flows are clearly distinguishable from the other components of the business, and if so, whether it is anticipated that after the disposal the cash flows of the component would be eliminated from continuing operations and whether the disposition represents a strategic transaction that has a major effect on operations and financial results. In addition, Supervalu evaluates whether the business has met the criteria as a business held for sale. In order for a planned disposition to be classified as a business held for sale, the established criteria must be met as of the reporting date, including an active program to market the business and the expected disposition of the business within one year.
Planned business dispositions are presented as discontinued operations when all the criteria described above are met. Operations of the business components meeting the discontinued operations requirements are presented within Income from discontinued operations, net of tax in the Consolidated Statements of Operations, and assets and liabilities of the business component planned to be disposed of are presented as separate lines within the Consolidated Balance Sheets. See Note 17—Discontinued Operations for additional information.
Businesses held for sale are reviewed for recoverability of the carrying value of the business upon meeting the classification requirements. Evaluating the recoverability of the assets of a business classified as held for sale follows a defined order in which property and intangible assets subject to amortization are considered only after the recoverability of goodwill, indefinite
57
lived intangible assets and other assets are assessed. After the valuation process is completed, the held for sale business is reported at the lower of its carrying value or fair value less cost to sell, and no additional depreciation or amortization expense is recognized. The carrying value of a held for sale business includes the portion of the accumulated other comprehensive loss associated with pension and postretirement benefit obligations of the operations of the business.
There are inherent judgments and estimates used in determining impairment charges. The sale of a business can result in the recognition of a gain or loss that differs from that anticipated prior to closing.
Goodwill
Supervalu reviews goodwill for impairment during the fourth quarter of each year, and at other points in the fiscal year if events occur or circumstances change that would more-likely-than-not reduce the fair value of a reporting unit below its carrying value. The reviews consist of comparing estimated fair value to the carrying value at the reporting unit level. Supervalu’s reporting units are the operating segments of the business, which consist of Wholesale and Retail. Goodwill was assigned to these reporting units as of the applicable acquisition dates, with no amounts being allocated between reporting units. Fair values are determined by using both the market approach, applying a multiple of earnings and revenue based on guidelines for publicly traded companies, and the income approach, discounting projected future cash flows based on management’s expectations of the current and future operating environment. The rates used to discount projected future cash flows reflect a weighted average cost of capital based on Supervalu’s industry, capital structure and risk premiums in each reporting unit, including those reflected in the current market capitalization. If management identifies the potential for impairment of goodwill, the implied fair value of the goodwill is calculated as the difference between the fair value of the reporting unit and the fair value of the underlying assets and liabilities, excluding goodwill. An impairment charge is recorded for any excess of the carrying value over the implied fair value.
Supervalu reviews the composition of its reporting units on an annual basis and on an interim basis if events or circumstances indicate that the composition of Supervalu’s reporting units may have changed. There were no changes in Supervalu’s reporting units as a result of the fiscal 2017 review. During the fiscal 2016 review, Supervalu separated the Save-A-Lot reporting unit into the Licensee Distribution and Corporate Stores reporting units. See Note 6—Goodwill and Intangible Assets for additional information.
Intangible Assets, Net
Supervalu reviews intangible assets with indefinite useful lives, which primarily consist of trademarks and tradenames, for impairment during the fourth quarter of each year, and also if events or changes in circumstances indicate that the asset might be impaired. The reviews consist of comparing estimated fair value to the carrying value. Fair values of Supervalu’s trademarks and tradenames are determined primarily by discounting an assumed royalty value applied to management’s estimate of projected future revenues associated with the tradename using management’s expectations of the current and future operating environment. The royalty cash flows are discounted using rates based on the weighted average cost of capital discussed above and the specific risk profile of the tradenames relative to Supervalu’s other assets. These estimates are impacted by variable factors, including inflation, the general health of the economy and market competition. The impairment review calculation contains significant judgments and estimates, including the weighted average cost of capital, any specified risk profile of the tradename, and future revenue and profitability. See Note 6—Goodwill and Intangible Assets for additional information.
Impairment of Long-Lived Assets
Supervalu monitors the recoverability of its long-lived assets such as buildings and equipment, and evaluates their carrying value for impairment whenever events or changes in circumstances indicate that the carrying value of such assets may not be fully recoverable. Events that may trigger such an evaluation include current period losses combined with a history of losses or a projection of continuing losses, a significant decrease in the market value of an asset or Supervalu’s plans for closures. When such events or changes in circumstances occur, a recoverability test is performed by comparing projected undiscounted future cash flows to the carrying value of the group of assets being tested.
If impairment is identified for long-lived assets to be held and used, the fair value is compared to the carrying value of the group of assets and an impairment charge is recorded for the excess of the carrying value over the fair value. For long-lived assets that are classified as assets held for sale, Supervalu recognizes impairment charges for the excess of the carrying value plus estimated costs of disposal over the estimated fair value. Fair value is based on current market values or discounted future cash flows using Level 3 inputs. Supervalu estimates fair value based on Supervalu’s experience and knowledge of the market in which the property is located, including the use of local real estate brokers and advisers. Supervalu’s estimate of undiscounted cash flows attributable to the asset groups includes only future cash flows that are directly associated with and that are expected to arise as a direct result of the use and eventual disposition of the asset group. Long-lived asset impairment charges are a component of Selling and administrative expenses in the Consolidated Statements of Operations.
58
Supervalu groups long-lived assets with other assets at the lowest level for which identifiable cash flows are largely independent of the cash flows of other assets, which historically has predominately been at the geographic market level for retail stores, but individual store asset groupings have been assessed in certain circumstances. Retail’s long-lived assets are reviewed for impairment at the geographic market group level for six geographic market groupings of individual retail stores. Wholesale’s long-lived assets are reviewed for impairment at the distribution center level.
Due to the ongoing business transformation and highly competitive environment, Supervalu will continue to evaluate its long-lived asset policy and current asset groups to determine if additional modifications to the policy are necessary. Future changes to Supervalu’s assessment of its long-lived asset policy and changes in circumstances, operating results or other events may result in additional asset impairment testing and charges.
Reserves for Closed Properties
Supervalu maintains reserves for costs associated with closures of retail stores, distribution centers and other properties that are no longer being utilized in current operations. Supervalu provides for closed property operating lease liabilities using a discount rate to calculate the present value of the remaining noncancellable lease payments after the closing date, reduced by estimated subtenant rentals that could be reasonably obtained for the property. Lease reserve impairment charges are recorded as a component of Selling and administrative expenses in the Consolidated Statements of Operations.
The closed property lease liabilities usually are paid over the remaining lease terms, which generally range from one to 15 years. Adjustments to closed property reserves primarily relate to changes in subtenant income or actual exit costs differing from original estimates. Adjustments are made for changes in estimates in the period in which the changes become known.
The calculation of the closed property charges requires significant judgments and estimates, including estimated subtenant rentals, discount rates and future cash flows based on Supervalu’s experience and knowledge of the market in which the closed property is located, previous efforts to dispose of similar assets and the assessment of existing market conditions. Reserves for closed properties are included in Other current liabilities and Other long-term liabilities in the Consolidated Balance Sheets.
Deferred Rent
Supervalu recognizes rent holidays, including the time period during which Supervalu has access to the property prior to the opening of the site, as well as construction allowances and escalating rent provisions, on a straight-line basis over the term of the operating lease. The deferred rents are included in Other current liabilities and Other long-term liabilities in the Consolidated Balance Sheets.
Self-Insurance Liabilities
Supervalu uses a combination of insurance and self-insurance for workers’ compensation, automobile and general liability costs. It is Supervalu’s policy to record its insurance liabilities based on management’s estimate of the ultimate cost of reported claims and claims incurred but not yet reported and related expenses, discounted at a risk-free interest rate. The present value of such claims was calculated using discount rates ranging from 0.3 percent to 5.1 percent for fiscal 2017, 0.3 percent to 5.1 percent for fiscal 2016 and 0.3 percent to 5.1 percent for fiscal 2015.
Changes in Supervalu’s insurance liabilities consisted of the following:
2017 | 2016 | 2015 | |||||||||
Beginning balance | $ | 69 | $ | 67 | $ | 74 | |||||
Expense | 16 | 17 | 20 | ||||||||
Claim payments | (18 | ) | (16 | ) | (20 | ) | |||||
Reclassification of insurance recoveries to receivables | — | 1 | (7 | ) | |||||||
Ending balance | 67 | 69 | 67 | ||||||||
Less current portion | (21 | ) | (22 | ) | (21 | ) | |||||
Long-term portion | $ | 46 | $ | 47 | $ | 46 | |||||
The current portion of reserves for self-insurance is included in Other current liabilities and the long-term portion is included in Other long-term liabilities in the Consolidated Balance Sheets. The insurance liabilities as of the end of the fiscal year are net of discounts of $5 and $5 as of February 25, 2017 and February 27, 2016, respectively. Amounts due from insurance companies were $9 and $9 as of February 25, 2017 and February 27, 2016, respectively. The current portion of the insurance receivables is included in Receivables, net and the long-term portion is included in Other assets in the Consolidated Balance Sheets.
59
Benefit Plans
Supervalu recognizes the funded status of its Company-sponsored defined benefit plans in its Consolidated Balance Sheets and gains or losses and prior service costs or credits not yet recognized as a component of Accumulated other comprehensive loss, net of tax, in the Consolidated Balance Sheets. Supervalu sponsors pension and other postretirement plans in various forms covering substantially all employees who meet eligibility requirements. The determination of Supervalu’s obligation and related expense for Company-sponsored pension and other postretirement benefits is dependent, in part, on management’s selection of certain actuarial assumptions in calculating these amounts. These assumptions include, among other things, the discount rate, the expected long-term rate of return on plan assets and the rates of increase in healthcare and compensation costs. These assumptions are disclosed in Note 10—Benefit Plans. Actual results that differ from the assumptions are accumulated and amortized over future periods in accordance with generally accepted accounting standards.
Supervalu contributes to various multiemployer pension plans under collective bargaining agreements, primarily defined benefit pension plans. Pension expense for these plans is recognized as contributions are funded. See Note 10—Benefit Plans for additional information on Supervalu’s participation in multiemployer plans.
Supervalu also contributes to an employee 401(k) retirement savings plan.
Fair Value Measurements
Fair value is defined as the price that would be received to sell an asset or paid to transfer a liability in an orderly transaction between market participants at the measurement date. Assets and liabilities recorded at fair value are categorized using defined hierarchical levels directly related to the amount of subjectivity associated with the inputs to fair value measurements, as follows:
Level 1 - | Quoted prices in active markets for identical assets or liabilities. |
Level 2 - | Inputs other than quoted prices included within Level 1 that are either directly or indirectly observable. |
Level 3 - | Unobservable inputs in which little or no market activity exists, requiring an entity to develop its own assumptions that market participants would use to value the asset or liability. |
Supervalu utilized fair value measurements in reporting results of operations and financial position within its Consolidated Financial Statements for the following:
• | Acquired assets and liabilities discussed in Note 2—Business Acquisitions were measured at fair value using Level 3 inputs. |
• | Impairment charges related to lease reserves and properties held and used and held for sale, as discussed in Note 4—Reserves for Closed Properties and Property, Plant and Equipment-related Impairment Charges, were measured at fair value using Level 3 inputs. |
• | Goodwill and intangible asset impairment charges and acquired intangible assets, as discussed in Note 6—Goodwill and Intangible Assets, were measured at fair value using Level 3 inputs. |
• | Assets and liabilities measured at fair value on a recurring basis using Level 1 and Level 2 inputs as discussed in Note 7—Fair Value Measurements. |
• | Stock-based compensation awards were measured at their grant date fair value upon issuance using Level 3 inputs as discussed in Note 13—Stock-based Awards. |
• | Discontinued operations goodwill impairment charges were recorded in Income from discontinued operations, net of tax, as discussed in Note 17—Discontinued Operations, and were measured at fair value using Level 3 inputs. |
Derivatives
Supervalu uses derivatives only to manage well-defined risks. Supervalu does not use financial instruments or derivatives for any trading or other speculative purposes.
Interest rate swap contracts are entered into to mitigate Supervalu’s exposure to changes in market interest rates. These contracts are reviewed for hedging effectiveness at hedge inception and on an ongoing basis. If these contracts are designated as a cash flow hedge and are determined to be highly effective, changes in the fair value of these instruments are recognized in Accumulated other comprehensive loss in the Consolidated Balance Sheets and reclassified into earnings in the period in which the hedged transaction affects earnings. Hedging ineffectiveness, if any, is recognized in earnings in the Consolidated Statements of Operations.
Supervalu’s limited involvement with diesel fuel derivatives is primarily to manage its exposure to changes in fuel prices utilized in the shipping process. These contracts are economic hedges of price risk and are not designated or accounted for as
60
hedging instruments for accounting purposes. Changes in the fair value of these instruments are recognized in earnings in the Consolidated Statements of Operations.
In addition, Supervalu enters into energy commitments for certain amounts of electricity and natural gas purchases that it expects to utilize in the normal course of business. Changes in the fair value of these purchase obligations are not recognized in earnings until the underlying commitment is utilized in the normal course of business.
Stock-Based Compensation
Stock-based compensation expense is measured by the fair value of the award on the date of grant, net of the estimated forfeiture rate. Supervalu uses the straight-line method to recognize stock-based compensation expense over the requisite service period related to each award.
The fair value of stock options is estimated as of the date of grant using the Black-Scholes option pricing model using Level 3 inputs. The fair value of performance stock units is estimated as of the date of the grant using the Monte Carlo option pricing model using Level 3 inputs.
The estimation of the fair value of stock options incorporates certain assumptions, such as the risk-free interest rate and expected volatility, dividend yield and life of options. Restricted stock awards and restricted stock units are recorded as stock-based compensation expense over the requisite service period based on the market value of Supervalu’s common stock on the date of grant.
Income Taxes
Deferred income taxes represent future net tax effects resulting from temporary differences between the financial statement amounts and tax bases of assets and liabilities and are measured using enacted tax rates in effect for the year in which the differences are expected to be settled or realized. See Note 14—Income Taxes for the types of differences that give rise to significant portions of deferred income tax assets and liabilities. Deferred income tax assets are reported as a noncurrent asset or liability based on the classification of the related asset or liability or according to the expected date of reversal.
Supervalu is currently in various stages of audits, appeals or other methods of review with authorities from various taxing jurisdictions. Supervalu establishes liabilities for unrecognized tax benefits in a variety of taxing jurisdictions when, despite management’s belief that Supervalu’s tax return positions are supportable, certain positions may be challenged and may need to be revised. Supervalu adjusts these liabilities in light of changing facts and circumstances, such as the progress of a tax audit. Supervalu also provides interest on these liabilities at the appropriate statutory interest rate, and accrues penalties as applicable. Supervalu recognizes interest related to unrecognized tax benefits in Interest expense and penalties in Selling and administrative expenses in the Consolidated Statements of Operations.
Recently Adopted Accounting Standards
In May 2015, the Financial Accounting Standards Board (“FASB”) issued authoritative guidance under Accounting Standard Update (“ASU”) 2015-07, Fair Value Measurement: Disclosures for Investments in Certain Entities That Calculate Net Asset Value per Share (or its Equivalent). ASU 2015-07 amended ASC 820, Fair Value Measurements and Disclosures, to remove the requirement to categorize within the fair value hierarchy all investments for which fair value is measured using the net asset value per share practical expedient. The amendment also removes the requirement to make certain disclosures for these investments. ASU 2015-07 has been adopted retrospectively in Supervalu’s consolidated financial statements for the year ended February 25, 2017. Disclosures within Note 10—Benefit Plans have been updated to reflect the revised guidance.
Recently Issued Accounting Standards
In March 2017, the FASB issued authoritative guidance under ASU 2017-07, Compensation—Retirement Benefits (Topic 715): Improving the Presentation of Net Periodic Pension Cost and Net Periodic Postretirement Benefit Cost. ASU 2017-07 changes how benefit plan costs for defined benefit pension and other postretirement benefit plans are presented in the statement of operations. Supervalu is required to adopt this new guidance in the first quarter of fiscal 2019. Early adoption is permitted as of the beginning of an annual period for which financial statements (interim or annual) have not been issued or made available for issuance. Supervalu is currently evaluating the potential impact of adoption of this standard on its consolidated financial statements.
In January 2017, the FASB issued authoritative guidance under ASU 2017-04, Intangibles—Goodwill and Other (Topic 350). ASU 2017-04 simplifies the subsequent measurement of goodwill by eliminating step 2 of the goodwill impairment test. If a reporting unit fails step 1 of the goodwill impairment test, entities are no longer required to compute the implied fair value of goodwill following the same procedure that would be required in determining the fair value of assets acquired and liabilities
61
assumed in a business combination. Instead, the guidance requires an entity to perform its annual or interim goodwill impairment test by comparing the fair value of a reporting unit with its carrying value, and recognize an impairment charge for the amount by which the carrying amount exceeds the reporting unit’s fair value. Supervalu is required to adopt this new guidance in the first quarter of fiscal 2021. Early adoption is permitted for interim or annual goodwill impairment tests performed on testing dates after January 1, 2017. Supervalu is currently evaluating the potential impact of adoption of this standard on its consolidated financial statements.
In August 2016, the FASB issued authoritative guidance under ASU 2016-15, Statement of Cash Flows (Topic 320): Classification of Certain Cash Receipts and Cash Payments. ASU 2016-15 clarifies how certain cash receipts and payments should be presented in the statement of cash flows. Supervalu is required to adopt this new guidance in the first quarter of fiscal 2019. Supervalu is currently evaluating the potential impact of adoption of this standard on its consolidated financial statements.
In June 2016, the FASB issued authoritative guidance under ASU 2016-13, Financial Instruments—Credit Losses (Topic 326): Measurement of Credit Losses on Financial Instruments. ASU 2016-13 changes the impairment model for most financial assets and certain other instruments. For trade and other receivables, held-to-maturity debt securities, loans and other instruments, entities will be required to use a new forward-looking “expected loss” model that will replace today’s “incurred loss” model and generally will result in the earlier recognition of allowances for losses. For available-for-sale debt securities with unrealized losses, entities will measure credit losses in a manner similar to current practice, except that the losses will be recognized as an allowance. Supervalu is required to adopt this new guidance in the first quarter of fiscal 2021. Supervalu is currently evaluating the potential impact of adoption of this standard on its consolidated financial statements.
In March 2016, the FASB issued authoritative guidance under ASU 2016-09, Compensation-Stock Compensation (Topic 718): Improvements to Employee Share-Based Payment Accounting. ASU 2016-09 provides for simplification of several aspects of the accounting for share-based payment transactions, including income tax consequences, classification of awards as either equity or liabilities and classification on the statement of cash flows. Supervalu is required to adopt this new guidance in the first quarter of fiscal 2018. Supervalu is currently evaluating the potential impact of adoption of this standard on its consolidated financial statements.
In February 2016, the FASB issued authoritative guidance under ASU 2016-02, Leases (Topic 842). ASU 2016-02 provides new comprehensive lease accounting guidance that supersedes existing lease guidance. Upon adoption of ASU 2016-02, Supervalu will be required to recognize most leases on its balance sheet at the beginning of the earliest comparative period presented with a corresponding adjustment to stockholders’ equity (deficit). ASU 2016-02 requires Supervalu to capitalize most current operating lease obligations as right-of-use assets with a corresponding liability based on the present value of future operating leases. Criteria for distinguishing leases between finance and operating are substantially similar to criteria for distinguishing between capital leases and operating leases in existing lease guidance. Supervalu is required to adopt this new authoritative guidance in the first quarter of fiscal 2020. Supervalu is currently evaluating the potential adoption impact on its financial statements. For a quantification of Supervalu’s off-balance sheet operating leases subject to capitalization under ASU 2016-02, besides those reserved for as a closed property and certain agreements that may be deemed leases under the new authoritative guidance, refer to total operating lease obligations within Note 9—Leases.
In January 2016, the FASB issued authoritative guidance under ASU 2016-01, Financial Instruments—Overall (Subtopic 825-10): Recognition and Measurement of Financial Assets and Financial Liabilities. ASU 2016-01 revises the classification, measurement and disclosure of investments in equity securities. Supervalu is required to adopt this new guidance in the first quarter of fiscal 2019. Supervalu is currently evaluating the potential impact of adoption of this standard on its consolidated financial statements.
In May 2014, the FASB issued authoritative guidance under ASU 2014-09, Revenue from Contracts with Customers (Topic 606): Revenue from Contracts with Customers. ASU 2014-09 supersedes existing revenue recognition requirements and provides a new comprehensive revenue recognition model that requires entities to recognize revenue to depict the transfer of goods or services to a customer at an amount that reflects the consideration it expects to receive in exchange for those goods or services. The new guidance will likely be adopted by Supervalu during the first quarter of fiscal 2019, as permitted by ASU 2015-14, Revenue from Contracts with Customers (Topic 606): Deferral of the Effective Date. The adoption will include updates as provided under ASU 2016-08, Revenue from Contracts with Customers (Topic 606): Principal versus Agent Considerations (Reporting Revenue Gross versus Net); ASU 2016-10, Revenue from Contracts with Customers: Identifying Performance Obligations and Licensing; ASU 2016-12, Revenue from Contracts with Customers: Narrow-Scope Improvements and Practical Expedients; ASU 2016-20, Technical Corrections and Improvements to Topic 606, Revenue from Contracts with Customers. Adoption is allowed by either the full retrospective or modified retrospective approach. Supervalu is currently evaluating which approach it will apply and the potential impact of the adoption on its consolidated financial statements.
62
Supervalu is currently in the process of evaluating the impact of adoption of the revised revenue standards on its consolidated financial statements. Supervalu believes that there will be few, if any, changes to its Retail segment. Arrangements where Supervalu has determined it was a principal versus an agent are expected to remain relatively unchanged. Distribution contracts within Wholesale contain certain immaterial promises for goods or services that Supervalu believes will be immaterial in the context of the contracts. Supervalu expects to complete its evaluation in fiscal 2018 and is currently in the assessment phase of determining the impact of the revised guidance. Upon conclusion of the revised revenue assessment, Supervalu will determine whether to adopt the guidance under the full retrospective or modified retrospective approach.
NOTE 2—BUSINESS ACQUISITIONS
The Consolidated Financial Statements reflect the final purchase accounting allocations of the acquisitions discussed below. Pro forma information for the acquisitions discussed below are not presented since the results of operations of the acquired businesses, both individually and in the aggregate, are not material to Supervalu’s Consolidated Financial Statements.
During fiscal 2017, Supervalu paid $17 to acquire 22 Food Lion stores located in northern West Virginia, western Maryland, south central Pennsylvania and northwestern Virginia, and separately paid $2 to acquire inventories and buildings of two retail stores. The acquisition of the Food Lion stores included certain store assets, including inventories, property, plant, and equipment, and capital and operating leases. The fair value of the 22 Food Lion stores acquired was $17, including property, plant and equipment of $18, inventories of $8, favorable operating lease intangibles of $1 and other current assets of $1, and the assumption of capital lease obligations of $11. The acquired Food Lion stores were converted to Supervalu’s Shop ‘n Save format that is currently used by certain of Supervalu’s Wholesale customers in that region. The results of these stores are included within Retail.
During fiscal 2016, Supervalu paid $7 to acquire equipment and leasehold improvements, identifiable finite-lived intangible assets and inventories of four retail stores from multiple Wholesale customers. The purchase price was allocated to the acquired store assets and such assets were recognized at their estimated fair values and included inventories, property, plant and equipment, and goodwill.
During fiscal 2015, Supervalu completed the purchase of seven Rainbow Foods grocery stores, 11 Rainbow Foods pharmacy locations and one Rainbow Foods liquor store from RBF, LLC and Roundy’s Supermarkets, Inc. Five of the grocery stores, each of the pharmacies and the liquor store are operating under the Cub Foods banner, and two of the grocery stores are operating as Rainbow Foods grocery stores. Total consideration for the stores and pharmacies acquired by Supervalu was $34 plus cash payments of $5 for inventories. Supervalu assumed certain off-balance sheet obligations, including operating leases and multiemployer pension obligations with respect to the acquired stores. In addition, Supervalu also acquired the RAINBOW™ trademark. The fair value of assets acquired was $39, including property, plant and equipment of $15, goodwill of $14, inventories of $5, identifiable finite-lived intangible assets of $4 and other current assets of $1.
NOTE 3—ALLOWANCE FOR DOUBTFUL ACCOUNTS
Changes in Supervalu’s allowance for doubtful accounts and notes receivable consisted of the following:
2017 | 2016 | 2015 | |||||||||
Beginning balance | $ | 11 | $ | 17 | $ | 18 | |||||
Additions charged to costs and expenses | 2 | 3 | 1 | ||||||||
Deductions | (7 | ) | (9 | ) | (2 | ) | |||||
Ending balance | $ | 6 | $ | 11 | $ | 17 | |||||
NOTE 4—RESERVES FOR CLOSED PROPERTIES AND PROPERTY, PLANT AND EQUIPMENT-RELATED IMPAIRMENT CHARGES
Reserves for Closed Properties
Changes in Supervalu’s reserves for closed properties consisted of the following:
63
2017 | 2016 | 2015 | |||||||||
Beginning balance | $ | 24 | $ | 31 | $ | 42 | |||||
Additions | 3 | 3 | 2 | ||||||||
Payments | (9 | ) | (9 | ) | (10 | ) | |||||
Adjustments | 4 | (1 | ) | (3 | ) | ||||||
Ending balance | $ | 22 | $ | 24 | $ | 31 | |||||
In fiscal 2017, Supervalu closed four non-strategic leased Retail stores and one leased warehouse. Supervalu recorded an impairment charge of $1 related to the operating leases for these locations within the Retail and Wholesale segments.
Property, Plant and Equipment Impairment Charges
The following table presents impairment charges related to property, plant and equipment measured at fair value on a non-recurring basis:
2017 | 2016 | 2015 | |||||||||
Property, plant and equipment: | |||||||||||
Carrying value | $ | 80 | $ | 1 | $ | 1 | |||||
Fair value measured using Level 3 inputs | 35 | 0 | — | ||||||||
Impairment charges | $ | 45 | $ | 1 | $ | 1 | |||||
In the third quarter of fiscal 2017, Supervalu performed interim impairment reviews of certain Retail geographic market asset groups in conjunction with its impairment review of goodwill and due to declines in sales and cash flows within Retail. The review indicated that there was no impairment for Supervalu’s long-lived assets within the asset groups. During the fourth quarter of fiscal 2017, the results of operations and cash flows of certain Retail asset groups continued to decline, and as a result, revised projected financial information was used in the fourth quarter asset impairment review, which resulted in one of the Retail asset groups failing its step 1 long-lived asset recoverability test. Accordingly, a fair value assessment was performed over one Retail banner’s long-lived assets. The carrying value of the assets within this asset group exceeded the estimated fair value and was reduced until all long-lived assets were recorded at the lower of their carrying value or fair value, resulting in an impairment charge of $41 within Selling and administrative expenses and the Retail segment. Fiscal 2017 impairment charges also included impairment charges related to the closure of non-strategic Retail stores.
NOTE 5—PROPERTY, PLANT AND EQUIPMENT
Property, plant and equipment, net, consisted of the following:
2017 | 2016 | ||||||
Land | $ | 81 | $ | 78 | |||
Buildings | 1,017 | 1,002 | |||||
Property under construction | 57 | 39 | |||||
Leasehold improvements | 487 | 501 | |||||
Equipment | 1,742 | 1,645 | |||||
Capitalized lease assets | 293 | 283 | |||||
Total property, plant and equipment | 3,677 | 3,548 | |||||
Accumulated depreciation | (2,467 | ) | (2,332 | ) | |||
Accumulated amortization on capitalized lease assets | (206 | ) | (195 | ) | |||
Total property, plant and equipment, net | $ | 1,004 | $ | 1,021 | |||
Depreciation expense was $179, $184 and $198 for fiscal 2017, 2016 and 2015, respectively. Amortization expense related to capitalized lease assets was $17, $17 and $18 for fiscal 2017, 2016 and 2015, respectively.
64
NOTE 6—GOODWILL AND INTANGIBLE ASSETS
Changes in Supervalu’s Goodwill and Intangible assets, net consisted of the following:
February 28, 2015 | Additions | Impairments | Other net adjustments | February 27, 2016 | Additions | Impairments | Other net adjustments | February 25, 2017 | |||||||||||||||||||||||||||
Goodwill: | |||||||||||||||||||||||||||||||||||
Wholesale | $ | 710 | $ | — | $ | — | $ | — | $ | 710 | $ | — | $ | — | $ | — | $ | 710 | |||||||||||||||||
Retail | 14 | 1 | — | — | 15 | — | (15 | ) | — | — | |||||||||||||||||||||||||
Total goodwill | $ | 724 | $ | 1 | $ | — | $ | — | $ | 725 | $ | — | $ | (15 | ) | $ | — | $ | 710 | ||||||||||||||||
Intangible assets: | |||||||||||||||||||||||||||||||||||
Favorable operating leases, prescription files, customer lists and other | $ | 120 | $ | 22 | $ | (6 | ) | $ | (1 | ) | $ | 135 | $ | 2 | $ | — | $ | 4 | $ | 141 | |||||||||||||||
Tradenames and trademarks—indefinite useful lives | 9 | — | — | — | 9 | — | — | (4 | ) | 5 | |||||||||||||||||||||||||
Total intangible assets | 129 | 22 | (6 | ) | (1 | ) | 144 | 2 | — | — | 146 | ||||||||||||||||||||||||
Accumulated amortization | (88 | ) | (10 | ) | — | 1 | (97 | ) | (11 | ) | — | 1 | (107 | ) | |||||||||||||||||||||
Total intangible assets, net | $ | 41 | $ | 47 | $ | 39 | |||||||||||||||||||||||||||||
Supervalu applies a fair value based impairment test to the net book value of goodwill and intangible assets with indefinite useful lives on an annual basis and on an interim basis if events or circumstances indicate that an impairment loss may have occurred.
During the third quarter of fiscal 2017, Supervalu conducted an interim impairment review of the carrying value of Supervalu’s reporting units in conjunction with its impairment review of Save-A-Lot’s goodwill and due to declines in sales and cash flows within Retail. The review indicated that the estimated fair value of the Wholesale reporting unit was substantially in excess of its carrying value. The review also indicated that the carrying value of the Retail reporting unit exceeded its estimated fair value, as determined utilizing the income approach and market approach. As a result, Supervalu performed the step 2 assessment and recorded a non-cash goodwill impairment charge of $15 in the Retail segment during the third quarter of fiscal 2017. The calculation of the impairment charge contains significant judgments and estimates including weighted average cost of capital, future revenue, profitability, cash flows and fair values of assets and liabilities.
Supervalu conducted an annual impairment review of the net book value of goodwill and intangible assets with indefinite useful lives during the fourth quarter of fiscal 2017, which indicated that it is not more than likely that the fair value of each goodwill reporting unit is less than their respective carrying values and the carrying value of intangible assets were in excess of their fair value. As a result, the first and second steps of goodwill and intangible assets impairment testing was unnecessary.
In the first quarter ended June 20, 2015, Supervalu recorded intangible assets using valuations based on Level 3 inputs consisting primarily of certain distribution center operation rights, purchase options and other intangibles received by Supervalu under the letter agreement Supervalu entered into with Albertson’s dated May 28, 2015, as described in Note 15—Commitments, Contingencies and Off-Balance Sheet Arrangements.
In the third quarter ended December 5, 2015, Supervalu received a notice pursuant to which Supervalu could exercise certain purchase options under the letter agreement. As a result, Supervalu performed a review of the associated intangible assets for impairment, which indicated the carrying value of the intangible exceeded its estimated value. Supervalu recorded a non-cash intangible impairment charge of $6 within its Wholesale segment.
Annual impairment testing and the related calculation of the impairment charges contain significant judgments and estimates including weighted average cost of capital, future revenue, profitability, cash flows and fair values of assets and liabilities.
Amortization expense of intangible assets with definite useful lives of $11, $10 and $8 was recorded in fiscal 2017, 2016 and 2015, respectively. The estimated future amortization expense for the next five fiscal years on intangible assets outstanding as of February 25, 2017 consists of the following:
65
Fiscal Year | |||
2018 | $ | 9 | |
2019 | 5 | ||
2020 | 3 | ||
2021 | 3 | ||
2022 | 3 | ||
Thereafter | 11 | ||
NOTE 7—FAIR VALUE MEASUREMENTS
Recurring fair value measurements were as follows:
February 25, 2017 | |||||||||||||||||
Balance Sheet Location | Level 1 | Level 2 | Level 3 | Total | |||||||||||||
Assets: | |||||||||||||||||
Deferred compensation | Other assets | $ | 5 | $ | — | $ | — | $ | 5 | ||||||||
Total | $ | 5 | $ | — | $ | — | $ | 5 | |||||||||
Liabilities: | |||||||||||||||||
Diesel fuel derivatives | Other current liabilities | — | 0 | — | — | ||||||||||||
Interest rate swap derivative | Other current liabilities | — | 2 | — | 2 | ||||||||||||
Interest rate swap derivative | Other long-term liabilities | — | 1 | — | 1 | ||||||||||||
Total | $ | — | $ | 3 | $ | — | $ | 3 | |||||||||
February 27, 2016 | |||||||||||||||||
Balance Sheet Location | Level 1 | Level 2 | Level 3 | Total | |||||||||||||
Assets: | |||||||||||||||||
Deferred compensation | Other assets | $ | 6 | $ | — | $ | — | $ | 6 | ||||||||
Total | $ | 6 | $ | — | $ | — | $ | 6 | |||||||||
Liabilities: | |||||||||||||||||
Diesel fuel derivatives | Other current liabilities | — | 2 | — | 2 | ||||||||||||
Interest rate swap derivative | Other current liabilities | — | 3 | — | 3 | ||||||||||||
Interest rate swap derivative | Other long-term liabilities | — | 3 | — | 3 | ||||||||||||
Total | $ | — | $ | 8 | $ | — | $ | 8 | |||||||||
Deferred Compensation
Deferred compensation assets consist of mutual fund investments used to fund certain deferred compensation plans. The fair values of deferred compensation assets are based on quoted market prices of the mutual funds held by the plan at each reporting period. Mutual funds traded in active markets are classified within Level 1 of the fair value hierarchy. Deferred compensation assets are restricted for use to pay deferred compensation liabilities. Deferred compensation liabilities consist of obligations to participants in deferred compensation plans, and are determined based on the fair value of the related deferred compensation plan investments or designated phantom investments of the plan at each reporting period.
Diesel Fuel Derivatives
Commodity derivatives consist of forward fixed price purchase diesel fuel contracts. The fair value of Supervalu’s diesel fuel derivatives is measured using Level 2 inputs due to Supervalu’s use of observable market quotations without significant adjustments to determine fair values.
66
Fuel derivative gains (losses) are included within Cost of sales in the Consolidated Statements of Operations and were $0, $(3) and $(1) for fiscal 2017, 2016 and 2015, respectively.
Interest Rate Swap Derivatives
In February 2016, Supervalu effectively converted $300 of variable rate debt under Supervalu’s Secured Term Loan Facility to a fixed rate by swapping the variable LIBOR rate component to a fixed rate of 2.0075 percent, which matures in March 2019, concurrent with the Secured Term Loan Facility’s maturity. On May 20, 2016, Supervalu entered into a third amendment to the Secured Term Loan Facility which increased the interest rate for the term loan from LIBOR plus 3.50 percent to LIBOR plus 4.50 percent. Following this amendment, the all-in rate for this $300 tranche was 6.5075 percent. This transaction was entered into to reduce Supervalu’s exposure to changes in market interest rates associated with its variable rate debt. Supervalu designated this derivative as a cash flow hedge of the variability in expected cash outflows for interest payments.
In fiscal 2017, 2016 and 2015, no amounts were recorded in the Consolidated Statements of Operations for interest rate swap derivative ineffectiveness or reclassifications from Accumulated other comprehensive loss into earnings.
The fair value of the interest rate swap is measured using Level 2 inputs. The interest rate swap agreement is valued using an income approach interest rate swap valuation model incorporating observable market inputs including interest rates, LIBOR swap rates and credit default swap rates. As of February 25, 2017, a 100 basis point increase in forward LIBOR interest rates would increase the fair value of the interest rate swap by approximately $5; and a 100 basis point decrease in forward LIBOR interest rates would decrease the fair value of the interest rate swap by approximately $2.
Fair Value Estimates
For certain of Supervalu’s financial instruments, including cash and cash equivalents, receivables, accounts payable, accrued salaries and other current assets and liabilities, the fair values approximate carrying values due to their short maturities.
The estimated fair value of notes receivable was greater than the carrying value by $0 and $1 as of February 25, 2017 and February 27, 2016, respectively. The estimated fair value of notes receivable was calculated using a discounted cash flow approach applying a market rate for similar instruments using Level 3 inputs.
The estimated fair value of Supervalu’s long-term debt was greater than the carrying amount, excluding debt financing costs, by approximately $0 as of February 25, 2017 and less than the carrying amount by approximately $236 as of February 27, 2016. The estimated fair value was based on market quotes, where available, or market values for similar instruments, using Level 2 and 3 inputs.
Supervalu utilized Level 3 fair value inputs in measuring certain non-recurring transactions in fiscal 2016. See Note 1—Summary of Significant Accounting Policies.
NOTE 8—LONG-TERM DEBT
Supervalu’s long-term debt consisted of the following:
February 25, 2017 | February 27, 2016 | ||||||
5.50% Secured Term Loan Facility due March 2019 | $ | 524 | $ | 1,459 | |||
6.75% Senior Notes due June 2021 | 400 | 400 | |||||
7.75% Senior Notes due November 2022 | 350 | 350 | |||||
1.69% to 3.75% Revolving ABL Credit Facility due February 2021 | — | 138 | |||||
Debt financing costs, net | (10 | ) | (45 | ) | |||
Original issue discount on debt | (1 | ) | (5 | ) | |||
Total debt | 1,263 | 2,297 | |||||
Less current maturities of long-term debt | — | (100 | ) | ||||
Long-term debt | $ | 1,263 | $ | 2,197 | |||
Future maturities of long-term debt, excluding the original issue discount on debt and debt financing costs, as of February 25, 2017, consist of the following:
67
Fiscal Year | |||
2018 | $ | — | |
2019 | — | ||
2020 | 524 | ||
2021 | — | ||
2022 | 400 | ||
Thereafter | 350 | ||
Supervalu’s credit facilities and certain long-term debt agreements have restrictive covenants and cross-default provisions, which generally provide, subject to Supervalu’s right to cure, for the acceleration of payments due in the event of a breach of a covenant or a default in the payment of a specified amount of indebtedness due under certain other debt agreements. Supervalu was in compliance with all such covenants and provisions for all periods presented.
Senior Secured Credit Agreements
As of February 25, 2017 and February 27, 2016, Supervalu had outstanding borrowings of $524 and $1,459, respectively, under its secured term loan facility (the “Secured Term Loan Facility”), which is secured by substantially all of Supervalu’s real estate, equipment and certain other assets, and bears interest at the rate of LIBOR plus 4.50 percent subject to a floor on LIBOR of 1.00 percent. The Secured Term Loan Facility is guaranteed by Supervalu’s material subsidiaries (together with Supervalu, the “Term Loan Parties”). To secure their obligations under the Secured Term Loan Facility, the Term Loan Parties have granted a perfected first-priority security interest in substantially all of their intellectual property and a first priority mortgage lien and security interest in certain owned or ground-leased real estate and associated equipment pledged as collateral. As of February 25, 2017, there was $520 of owned or ground-leased real estate and associated equipment pledged as collateral, which was included in Property, plant and equipment, net in the Consolidated Balance Sheets. As of February 27, 2016, there was $781 of owned or ground-leased real estate and associated equipment pledged as collateral, $507 of which was included in Property, plant and equipment, net and $274 of which was included in Long-term assets of discontinued operations in the Consolidated Balance Sheets. In addition, the obligations of the Term Loan Parties under the Secured Term Loan Facility are secured by second-priority security interests in the collateral securing Supervalu’s $1,000 asset-based revolving credit facility (the “Revolving ABL Credit Facility”). As of February 25, 2017 and February 27, 2016, $0 and $102 of the Secured Term Loan Facility was classified as current, respectively excluding debt financing costs and original issue discount.
On May 20, 2016, Supervalu entered into a third amendment to the Secured Term Loan Facility (the “Third Term Loan Amendment”) that would permit Supervalu and its subsidiaries to undertake certain transactions reasonably determined by Supervalu to be necessary to effectuate a separation of the Save-A-Lot business. The Third Term Loan Amendment also increased the interest rate for the term loan from LIBOR plus 3.50 percent to LIBOR plus 4.50 percent with the floor on LIBOR remaining at 1.00 percent, subject to a further increase of 0.25 percent if certain rating conditions are not satisfied. During the first quarter ended June 18, 2016, in connection with the completion of the Third Term Loan Amendment, Supervalu paid debt financing costs of approximately $5, of which $4 was capitalized and $1 was expensed in Interest expense, net, and recognized non-cash charges of approximately $3 in Interest expense, net for the write-off of existing unamortized debt financing costs and $1 for the accelerated amortization of original issue discount.
The loans under the Secured Term Loan Facility may be voluntarily prepaid in certain minimum principal amounts, subject to the payment of breakage or similar costs. Pursuant to the Secured Term Loan Facility, Supervalu must, subject to certain customary reinvestment rights, apply 100 percent of Net Cash Proceeds (as defined in the facility) from certain types of asset sales (excluding proceeds of the collateral security of the Revolving ABL Credit Facility and other secured indebtedness) to prepay the loans outstanding under the Secured Term Loan Facility. Supervalu must also prepay loans outstanding under the facility no later than 90 days after the fiscal year end in an aggregate principal amount equal to a percentage (which percentage ranges from 0 to 50 percent depending on Supervalu’s Total Secured Leverage Ratio (as defined in the facility) as of the last day of such fiscal year) of Excess Cash Flow (as defined in the facility) for the fiscal year then ended, minus any voluntary prepayments made during such fiscal year with Internally Generated Cash (as defined in the facility). Based on Supervalu’s Excess Cash Flow in fiscal 2016, a $99 prepayment was required and paid in the first quarter ended June 18, 2016. Based on Supervalu’s Total Secured Leverage Ratio (as defined in the facility) as of February 25, 2017, no prepayment from Excess Cash Flow in fiscal 2017 will be required in fiscal 2018.
Supervalu consummated the sale of its Save-A-Lot business on December 5, 2016. Pursuant to the Secured Term Loan Facility, Supervalu made prepayments in an aggregate amount of $832 towards the Secured Term Loan Facility, which represents $750 plus 50% of the Net Cash Proceeds in excess of $750 that caused Supervalu’s Total Secured Leverage Ratio, on a pro forma basis after giving effect to such prepayment, to be no higher than 1.50:1.00. In connection with these mandatory prepayments, Supervalu recognized non-cash charges of approximately $10 in Interest expense, net for the write-off of existing unamortized
68
debt financing costs and $2 for the accelerated amortization of original issue discount based on the aggregate amount of the prepayments in the fourth quarter of fiscal 2017. Additionally, the security interests in the equity interests of Moran Foods and the Save-A-Lot assets were released under the Secured Term Loan Facility and the Revolving ABL Credit Facility at the time of the sale.
As of February 25, 2017 and February 27, 2016, there were $0 and $138, respectively, of outstanding borrowings under the Revolving ABL Credit Facility. As of February 25, 2017, letters of credit outstanding under the Revolving ABL Credit Facility were $53 at fees of 1.375 percent, and the unused available credit under this facility was $748 with facility fees of 0.25 percent. As of February 27, 2016, letters of credit outstanding under the Revolving ABL Credit Facility were $69 at fees of 1.625 percent, and the unused available credit under this facility was $744 with facility fees of 0.25 percent. As of February 25, 2017, the Revolving ABL Credit Facility was secured on a first-priority basis by $949 of certain inventory assets included in Inventories, net, $228 of certain receivables included in Receivables, net, $19 of certain amounts included in Cash and cash equivalents and all of Supervalu’s pharmacy scripts included in Intangible assets, net, in the Consolidated Balance Sheets. As of February 27, 2016, the Revolving ABL Credit Facility was secured on a first-priority basis by $931 of certain inventory assets included in Inventories, net, $222 of certain receivables included in Receivables, net, $16 of certain amounts included in Cash and cash equivalents and all of Supervalu’s pharmacy scripts included in Intangible assets, net and $314 of certain amounts included in Current assets of discontinued operations in the Consolidated Balance Sheets.
The revolving loans under the Revolving ABL Credit Facility may be voluntarily prepaid in certain minimum principal amounts, in whole or in part, without premium or penalty, subject to breakage or similar costs. Supervalu and those subsidiaries named as borrowers under the Revolving ABL Credit Facility are required to repay the revolving loans in cash and provide cash collateral under this facility to the extent that the revolving loans and letters of credit exceed the lesser of the borrowing base then in effect or the aggregate amount of the lenders’ commitments under the Revolving ABL Credit Facility. During fiscal 2017, Supervalu borrowed $2,837 and repaid $2,975 under its Revolving ABL Credit Facility. During fiscal 2016, Supervalu borrowed $840 and repaid $702 under its Revolving ABL Credit Facility. Certain of Supervalu’s material subsidiaries are co-borrowers under the Revolving ABL Credit Facility, and this facility is guaranteed by the rest of Supervalu’s material subsidiaries (Supervalu and those subsidiaries named as borrowers and guarantors under the Revolving ABL Credit Facility, the “ABL Loan Parties”). To secure their obligations under this facility, the ABL Loan Parties have granted a perfected first-priority security interest for the benefit of the facility lenders in their present and future inventory, credit card, wholesale trade, pharmacy and certain other receivables, prescription files and related assets. In addition, the obligations under the Revolving ABL Credit Facility are secured by second-priority liens on and security interests in the collateral securing the Secured Term Loan Facility, subject to certain limitations to ensure compliance with Supervalu’s outstanding debt instruments and leases.
Both the Secured Term Loan Facility and the Revolving ABL Credit Facility limit Supervalu’s ability to make Restricted Payments (as defined in both the Secured Term Loan Facility and the Revolving ABL Credit Facility), which include dividends to stockholders. The Secured Term Loan Facility caps the aggregate amount of Restricted Payments that may be made over the life of the Secured Term Loan Facility. That aggregate cap can fluctuate over time and the cap could be reduced by certain other actions taken by Supervalu, including certain debt prepayments and Permitted Investments (as defined in the Secured Term Loan Facility). As of February 25, 2017, that aggregate cap on Restricted Payments was approximately $398. The Revolving ABL Credit Facility permits dividends up to $75 per fiscal year, not to exceed $175 in the aggregate over the life of the Revolving ABL Credit Facility, as long as no Cash Dominion Event (as defined in the Revolving ABL Credit Facility) exists. Those caps could be reduced by certain debt prepayments made by Supervalu. The Revolving ABL Credit Facility permits other Restricted Payments as long as the Payment Conditions (as defined in the Revolving ABL Credit Facility) are met.
Debentures
The $400 of 6.75 percent Senior Notes due June 2021, and the $350 of 7.75 percent Senior Notes due November 2022 contain operating covenants, including limitations on liens and on sale and leaseback transactions. Supervalu was in compliance with all such covenants and provisions for all periods presented.
NOTE 9—LEASES
Supervalu leases most of its Retail stores and certain distribution centers, office facilities and equipment from third parties. Many of these leases include renewal options and, in certain instances, also include options to purchase. Future minimum lease payments to be made by Supervalu for noncancellable operating leases and capital leases as of February 25, 2017 consist of the following:
69
Lease Obligations | |||||||
Fiscal Year | Operating Leases | Capital Leases | |||||
2018 | $ | 76 | $ | 42 | |||
2019 | 74 | 41 | |||||
2020 | 63 | 38 | |||||
2021 | 51 | 33 | |||||
2022 | 36 | 27 | |||||
Thereafter | 133 | 101 | |||||
Total future minimum obligations | $ | 433 | 282 | ||||
Less interest | (70 | ) | |||||
Present value of net future minimum obligations | 212 | ||||||
Less current capital lease obligations | (26 | ) | |||||
Long-term capital lease obligations | $ | 186 | |||||
Total future minimum obligations have not been reduced for future minimum subtenant rentals under certain operating subleases.
Rent expense, other operating lease expense and subtenant rentals all under operating leases consisted of the following:
2017 | 2016 | 2015 | |||||||||
Minimum rent | $ | 92 | $ | 96 | $ | 95 | |||||
Contingent rent | 4 | 4 | 6 | ||||||||
Rent expense | 96 | 100 | 101 | ||||||||
Less subtenant rentals | (27 | ) | (27 | ) | (27 | ) | |||||
Total net rent expense | $ | 69 | $ | 73 | $ | 74 | |||||
Supervalu leases certain property to third parties under operating, capital and direct financing leases. Under the direct financing leases, Supervalu leases buildings to Wholesale customers with terms ranging from one to three years.
Future minimum lease and subtenant rentals to be received under noncancellable operating and deferred financing income leases, under which Supervalu is the lessor, as of February 25, 2017, consist of the following:
Lease Receipts | |||||||
Fiscal Year | Operating Leases | Direct Financing Leases | |||||
2018 | $ | 17 | $ | — | |||
2019 | 16 | — | |||||
2020 | 11 | 1 | |||||
2021 | 7 | — | |||||
2022 | 6 | — | |||||
Thereafter | 28 | — | |||||
Total minimum lease receipts | $ | 85 | 1 | ||||
Less interest | — | ||||||
Net investment in direct financing leases | 1 | ||||||
Less current portion | — | ||||||
Long-term portion | $ | 1 | |||||
The carrying value of owned property leased to third parties under operating leases was as follows:
2017 | 2016 | ||||||
Property, plant and equipment | $ | 4 | $ | 4 | |||
Less accumulated depreciation | (3 | ) | (3 | ) | |||
Property, plant and equipment, net | $ | 1 | $ | 1 | |||
70
NOTE 10—BENEFIT PLANS
Substantially all employees of Supervalu are covered by various contributory and non-contributory pension, profit sharing or 401(k) plans. Supervalu’s primary defined benefit pension plan, the SUPERVALU Retirement Plan, and certain supplemental executive retirement plans were closed to new participants and service crediting ended for all participants as of December 31, 2007. Pay increases were reflected in the amount of benefits accrued in these plans until December 31, 2012. Most union employees participate in multiemployer retirement plans under collective bargaining agreements, unless the collective bargaining agreement provides for participation in plans sponsored by Supervalu. In addition to sponsoring both defined benefit and defined contribution pension plans, Supervalu provides healthcare and life insurance benefits for eligible retired employees under postretirement benefit plans. Supervalu also provides certain health and welfare benefits, including short-term and long-term disability benefits, to inactive disabled employees prior to retirement. The terms of the postretirement benefit plans vary based on employment history, age and date of retirement. For many retirees, Supervalu provides a fixed dollar contribution and retirees pay contributions to fund the remaining cost.
In fiscal 2016, Supervalu amended the Supervalu Retiree Benefit Plan which provides medical, prescription drug, dental and life benefits, to eliminate benefits provided by the plan for certain participants under a collective bargaining agreement. As a result of the plan amendment, certain Supervalu Retiree Benefit Plan obligations were re-measured using a discount rate of 4.25 percent and the MP-2015 mortality improvement scale. This re-measurement resulted in a $28 reduction in postretirement benefit obligations within Pension and other postretirement benefit obligations with a corresponding decrease to Accumulated other comprehensive loss.
The benefit obligation, fair value of plan assets and funded status of Supervalu’s defined benefit pension plans and other postretirement benefit plans consisted of the following:
Pension Benefits | Other Postretirement Benefits | ||||||||||||||
2017 | 2016 | 2017 | 2016 | ||||||||||||
Changes in Benefit Obligation | |||||||||||||||
Benefit obligation at beginning of year | $ | 2,664 | $ | 2,849 | $ | 54 | $ | 82 | |||||||
Plan amendment | — | — | (7 | ) | (21 | ) | |||||||||
Service cost | — | — | 1 | — | |||||||||||
Interest cost | 84 | 106 | 2 | 3 | |||||||||||
Actuarial loss (gain) | 37 | (175 | ) | (3 | ) | (6 | ) | ||||||||
Settlements paid | (200 | ) | (1 | ) | — | — | |||||||||
Benefits paid | (105 | ) | (115 | ) | (3 | ) | (4 | ) | |||||||
Benefit obligation at end of year | 2,480 | 2,664 | 44 | 54 | |||||||||||
Changes in Plan Assets | |||||||||||||||
Fair value of plan assets at beginning of year | 2,119 | 2,317 | 15 | 4 | |||||||||||
Actual return (loss) on plan assets | 307 | (109 | ) | — | — | ||||||||||
Employer contributions | 62 | 27 | 4 | 15 | |||||||||||
Plan participants’ contributions | — | — | 2 | 2 | |||||||||||
Settlements paid | (200 | ) | (1 | ) | — | — | |||||||||
Benefits paid | (105 | ) | (115 | ) | (5 | ) | (6 | ) | |||||||
Other | — | — | — | — | |||||||||||
Fair value of plan assets at end of year | 2,183 | 2,119 | 16 | 15 | |||||||||||
Unfunded status at end of year | $ | (297 | ) | $ | (545 | ) | $ | (28 | ) | $ | (39 | ) | |||
For the defined benefit pension plans, the accumulated benefit obligation is equal to the projected benefit obligation.
Amounts recognized in the Consolidated Balance Sheets consist of the following:
Pension Benefits | Other Postretirement Benefits | ||||||||||||||
2017 | 2016 | 2017 | 2016 | ||||||||||||
Accrued vacation, compensation and benefits | $ | (2 | ) | $ | (2 | ) | $ | (1 | ) | $ | (4 | ) | |||
Pension and other postretirement benefit obligations | (295 | ) | (543 | ) | (27 | ) | (35 | ) | |||||||
Total | $ | (297 | ) | $ | (545 | ) | $ | (28 | ) | $ | (39 | ) | |||
71
Amounts recognized in Accumulated other comprehensive loss for the defined benefit pension and other postretirement benefit plans consist of the following:
Pension Benefits | Other Postretirement Benefits | ||||||||||||||
2017 | 2016 | 2017 | 2016 | ||||||||||||
Prior service benefit | $ | — | $ | — | $ | 42 | $ | 50 | |||||||
Net actuarial loss | (478 | ) | (693 | ) | (13 | ) | (17 | ) | |||||||
Total recognized in Accumulated other comprehensive loss | $ | (478 | ) | $ | (693 | ) | $ | 29 | $ | 33 | |||||
Total recognized in Accumulated other comprehensive loss, net of tax | $ | (293 | ) | $ | (438 | ) | $ | 17 | $ | 20 | |||||
Net periodic benefit cost (income) and other changes in plan assets and benefit obligations recognized in Other comprehensive income (loss) for defined benefit pension and other postretirement benefit plans consist of the following:
Pension Benefits | Other Postretirement Benefits | ||||||||||||||||||||||
2017 | 2016 | 2015 | 2017 | 2016 | 2015 | ||||||||||||||||||
Net Periodic Benefit Cost (Income) | |||||||||||||||||||||||
Service cost | $ | — | $ | — | $ | — | $ | 1 | $ | — | $ | 1 | |||||||||||
Interest cost | 84 | 106 | 121 | 2 | 3 | 4 | |||||||||||||||||
Expected return on plan assets | (141 | ) | (142 | ) | (149 | ) | — | — | — | ||||||||||||||
Amortization of prior service benefit | — | — | — | (15 | ) | (15 | ) | (16 | ) | ||||||||||||||
Amortization of net actuarial loss | 43 | 79 | 68 | 2 | 3 | 3 | |||||||||||||||||
Settlement | 42 | — | 64 | — | — | — | |||||||||||||||||
Net periodic benefit cost (income) | 28 | 43 | 104 | (10 | ) | (9 | ) | (8 | ) | ||||||||||||||
Other Changes in Plan Assets and Benefit Obligations Recognized in Other Comprehensive Income (Loss) | |||||||||||||||||||||||
Prior service benefit | — | — | — | (7 | ) | (21 | ) | (5 | ) | ||||||||||||||
Amortization of prior service benefit | — | — | — | 15 | 15 | 16 | |||||||||||||||||
Net actuarial (gain) loss | (172 | ) | 76 | 195 | (3 | ) | (7 | ) | 6 | ||||||||||||||
Amortization of net actuarial loss | (43 | ) | (79 | ) | (66 | ) | (2 | ) | (3 | ) | (3 | ) | |||||||||||
Total expense (benefit) recognized in Other comprehensive income (loss) | (215 | ) | (3 | ) | 129 | 3 | (16 | ) | 14 | ||||||||||||||
Total expense (benefit) recognized in net periodic benefit cost (income) and Other comprehensive income (loss) | $ | (187 | ) | $ | 40 | $ | 233 | $ | (7 | ) | $ | (25 | ) | $ | 6 | ||||||||
The estimated net actuarial loss that will be amortized from Accumulated other comprehensive loss into net periodic benefit cost for the defined benefit pension plans during fiscal 2018 is $11. The estimated net amount of prior service benefit and net actuarial loss for the postretirement benefit plans that will be amortized from Accumulated other comprehensive loss into net periodic benefit cost during fiscal 2018 is $14.
Assumptions
Weighted average assumptions used to determine benefit obligations and net periodic benefit cost consisted of the following:
2017 | 2016 | 2015 | ||||||
Benefit obligation assumptions: | ||||||||
Discount rate | 3.92 – 3.78% | 4.16 – 3.95% | 3.80 | % | ||||
Rate of compensation increase | — | % | — | % | — | % | ||
Net periodic benefit cost assumptions:(1) | ||||||||
Discount rate | 4.16 | % | 3.80 | % | 4.65 – 4.10% | |||
Rate of compensation increase | — | % | — | % | — | % | ||
Expected return on plan assets(2) | 6.50 | % | 6.50 | % | 7.00 – 6.50% | |||
(1) | For fiscal 2017 and prior, net periodic benefit cost is measured using weighted average assumptions as of the beginning of each year. |
72
(2) | Expected return on plan assets is estimated by utilizing forward-looking, long-term return, risk and correlation assumptions developed and updated annually by Supervalu. These assumptions are weighted by the actual or target allocation to each underlying asset class represented in the pension plan asset portfolio. Supervalu also assesses the expected long-term return on plan assets assumption by comparison to long-term historical performance on an asset class to ensure the assumption is reasonable. Long-term trends are also evaluated relative to market factors such as inflation, interest rates, and fiscal and monetary policies in order to assess the capital market assumptions. |
Supervalu reviews and selects the discount rate to be used in connection with measuring its pension and other postretirement benefit obligations annually. In determining the discount rate, Supervalu uses the yield on corporate bonds (rated AA or better) that coincides with the cash flows of the plans’ estimated benefit payouts. The model uses a yield curve approach to discount each cash flow of the liability stream at an interest rate specifically applicable to the timing of each respective cash flow. The model totals the present values of all cash flows and calculates the equivalent weighted average discount rate by imputing the singular interest rate that equates the total present value with the stream of future cash flows. This resulting weighted average discount rate is then used in evaluating the final discount rate to be used by Supervalu.
Effective for fiscal 2018, Supervalu expects to begin recognizing the amortization of net actuarial loss on the SUPERVALU Retirement Plan over the remaining life expectancy of inactive participants based on its determination that almost all of the defined benefit pension plan participants are inactive and the plan is frozen to new participants. For the purposes of inactive participants, Supervalu utilized an over approximately 90 percent threshold established under Supervalu policy. This change did not affect the measurement of total benefit obligations in fiscal 2017, and instead impacts the recognition of certain components of net periodic pension expense prospectively beginning in fiscal 2018. The impact of the change in estimate is an anticipated reduction of the interest and service cost components within net periodic benefit cost in fiscal 2018 by approximately $31 for the defined benefit pension plans.
Effective fiscal 2017, Supervalu adopted the “full yield curve” approach for determining the interest and service cost components of net periodic benefit cost for defined benefit pension and other postretirement benefit plans. Under this method, the discount rate assumption used in the interest and service cost components of net periodic benefit cost was built through applying the specific spot rates along the yield curve used in the determination of the benefit obligation described above, to the relevant projected future cash flows of Supervalu’s pension and other postretirement benefit plans. Prior to fiscal 2017, the interest and service cost components of pension expense were estimated using a single weighted-average discount rate derived from the yield curve used to measure the projected benefit obligation at the beginning of the period.
The alternative approach improves the correlation between projected benefit cash flows and the corresponding yield curve spot rates and provides a more precise measurement of interest and service costs. This change did not affect the measurement of total benefit obligations. Supervalu has concluded that the application of the full yield curve approach was a change in estimate and, accordingly, recognized the effect prospectively beginning in fiscal 2017. The impact of the change in estimate was an anticipated reduction of the interest and service cost components within net periodic benefit cost in fiscal 2017 by approximately $22 for the defined benefit pension plans and less than $1 for postretirement benefit plans compared to the fiscal 2016 approach.
For those retirees whose health plans provide for variable employer contributions, the assumed healthcare cost trend rate used in measuring the accumulated postretirement benefit obligation before age 65 was 6.75 percent as of February 25, 2017. The assumed healthcare cost trend rate for retirees before age 65 will decrease by 0.25 percent for each year through fiscal 2026, until it reaches the ultimate trend rate of 4.50 percent. For those retirees whose health plans provide for variable employer contributions, the assumed healthcare cost trend rate used in measuring the accumulated postretirement benefit obligation after age 65 was 7.50 percent as of February 25, 2017. The assumed healthcare cost trend rate for retirees after age 65 will decrease through fiscal 2026, until it reaches the ultimate trend rate of 4.50 percent. For those retirees whose health plans provide for a fixed employer contribution rate, a healthcare cost trend is not applicable. The healthcare cost trend rate assumption would have had the following impact on the amounts reported: a 100 basis point increase in the trend rate would have impacted Supervalu’s service and interest cost by less than $1 for fiscal 2017; a 100 basis point decrease in the trend rate would have decreased Supervalu’s accumulated postretirement benefit obligation as of the end of fiscal 2017 by approximately $2; and a 100 basis point increase would have increased Supervalu’s accumulated postretirement benefit obligation by approximately $2.
Pension Plan Assets
Pension plan assets are held in a master trust and invested in separately managed accounts and other commingled investment vehicles holding domestic and international equity securities, domestic fixed income securities and other investment classes. Supervalu employs a total return approach whereby a diversified mix of asset class investments is used to maximize the long-term return of plan assets for an acceptable level of risk. Alternative investments are also used to enhance risk-adjusted long-term returns while improving portfolio diversification. Risk is managed through diversification across asset classes, multiple investment manager portfolios and both general and portfolio-specific investment guidelines. Risk tolerance is established
73
through careful consideration of the plan liabilities, plan funded status and Supervalu’s financial condition. This asset allocation policy mix is reviewed annually and actual versus target allocations are monitored regularly and rebalanced on an as-needed basis. Plan assets are invested using a combination of active and passive investment strategies. Passive, or “indexed” strategies, attempt to mimic rather than exceed the investment performance of a market benchmark. The plan’s active investment strategies employ multiple investment management firms. Managers within each asset class cover a range of investment styles and approaches and are combined in a way that controls for capitalization, and style biases (equities) and interest rate exposures (fixed income) versus benchmark indices. Monitoring activities to evaluate performance against targets and measure investment risk take place on an ongoing basis through annual liability measurements, periodic asset/liability studies and quarterly investment portfolio reviews.
The asset allocation targets and the actual allocation of pension plan assets are as follows:
Asset Category | Target | 2017 | 2016 | |||||
Domestic equity | 22.1 | % | 22.0 | % | 22.4 | % | ||
International equity | 9.2 | % | 9.5 | % | 11.1 | % | ||
Private equity | 5.9 | % | 5.9 | % | 6.6 | % | ||
Fixed income | 53.9 | % | 54.1 | % | 47.3 | % | ||
Real estate | 8.9 | % | 8.5 | % | 12.6 | % | ||
Total | 100.0 | % | 100.0 | % | 100.0 | % | ||
The following is a description of the valuation methodologies used for investments measured at fair value:
Common stock—Valued at the closing price reported in the active market in which the individual securities are traded.
Common collective trusts—Investments in common/collective trust funds are stated at net asset value (“NAV”) as determined by the issuer of the common/collective trust funds and is based on the fair value of the underlying investments held by the fund less its liabilities. The majority of the common/collective trust funds have a readily determinable fair value and classified as level 2. Other investments in common/collective trust funds determine NAV on a less frequent basis and/or have redemption restrictions. For these investments, NAV is used as a practical expedient to estimate fair value.
Corporate bonds—Valued based on yields currently available on comparable securities of issuers with similar credit ratings. When quoted prices are not available for identical or similar bonds, the fair value is based upon an industry valuation model, which maximizes observable inputs.
Government securities—Certain government securities are valued at the closing price reported in the active market in which the security is traded. Other government securities are valued based on yields currently available on comparable securities of issuers with similar credit ratings.
Mortgage backed securities—Valued based on yields currently available on comparable securities of issuers with similar credit ratings. When quoted prices are not available for identical or similar securities, the fair value is based upon an industry valuation model, which maximizes observable inputs.
Mutual funds—Mutual funds are valued at the closing price reported in the active market in which the individual securities are traded.
Private equity and real estate partnerships—Valued based on NAV provided by the investment manager, updated for any subsequent partnership interests’ cash flows or expected changes in fair value. The NAV is used as a practical expedient to estimate fair value.
Other—Valued under an approach that maximizes observable inputs, such as gathering consensus data from the market participant’s best estimate of mid-market pricing for actual trades or positions held.
The valuation methods described above may produce a fair value calculation that may not be indicative of net realizable value or reflective of future fair values. Furthermore, while Supervalu believes its valuation methods are appropriate and consistent with other market participants, the use of different methodologies or assumptions to determine the fair value of certain financial instruments could result in a different fair value measurement.
74
The fair value of assets of Supervalu’s defined benefit pension plans held in a master trust as of February 25, 2017, by asset category, consisted of the following:
Level 1 | Level 2 | Level 3 | Measured at NAV | Total | |||||||||||||||
Common stock | $ | 366 | $ | — | $ | — | $ | — | $ | 366 | |||||||||
Common collective trusts | — | 735 | — | 102 | 837 | ||||||||||||||
Corporate bonds | — | 248 | — | — | 248 | ||||||||||||||
Government securities | 27 | 133 | — | — | 160 | ||||||||||||||
Mutual funds | 54 | 205 | — | — | 259 | ||||||||||||||
Mortgage-backed securities | — | 18 | — | — | 18 | ||||||||||||||
Other | 4 | 5 | — | — | 9 | ||||||||||||||
Private equity and real estate partnerships | — | — | — | 286 | 286 | ||||||||||||||
Total plan assets at fair value | $ | 451 | $ | 1,344 | $ | — | $ | 388 | $ | 2,183 | |||||||||
The fair value of assets of Supervalu’s defined benefit pension plans held in a master trust as of February 27, 2016, by asset category, consisted of the following:
Level 1 | Level 2 | Level 3 | Measured at NAV | Total | |||||||||||||||
Common stock | $ | 432 | $ | — | $ | — | $ | — | $ | 432 | |||||||||
Common collective trusts | — | 555 | — | 211 | 766 | ||||||||||||||
Corporate bonds | — | 201 | — | — | 201 | ||||||||||||||
Government securities | 49 | 114 | — | — | 163 | ||||||||||||||
Mutual funds | 56 | 179 | — | — | 235 | ||||||||||||||
Mortgage-backed securities | — | 14 | — | — | 14 | ||||||||||||||
Other | — | 3 | — | — | 3 | ||||||||||||||
Private equity and real estate partnerships | — | — | — | 305 | 305 | ||||||||||||||
Total plan assets at fair value | $ | 537 | $ | 1,066 | $ | — | $ | 516 | $ | 2,119 | |||||||||
Contributions
In August 2014, the Highway and Transportation Funding Act of 2014, which included an extension of pension funding interest rate relief, was signed into law. The Highway and Transportation Funding Act includes a provision for interest rate stabilization for defined benefit employee pension plans. As a result of this stabilization provision, Supervalu’s required pension contributions to the SUPERVALU Retirement Plan decreased significantly in fiscal 2016 compared to fiscal 2015 and Supervalu expects that to continue for the next several years. Supervalu expects to contribute approximately $5 to $10 to its defined benefit pension plans and postretirement benefit plans in fiscal 2018.
Supervalu funds its defined benefit pension plans based on the minimum contribution required under the Employee Retirement Income Security Act of 1974, as amended, the Pension Protection Act of 2006 and other applicable laws, as determined by Supervalu’s external actuarial consultant, and additional contributions made at Supervalu’s discretion. In connection with the sale of Save-A-Lot, Supervalu agreed with the Pension Benefit Guarantee Corporation (the “PBGC”) to make $60 in aggregate contributions to the SUPERVALU Retirement Plan in excess of required minimum contributions. Supervalu made those contributions in the fourth quarter of fiscal 2017 and has fully fulfilled its obligations under its agreement with the PBGC. Supervalu will recognize contributions in accordance with applicable regulations, with consideration given to recognition for the earliest plan year permitted.
At Supervalu’s discretion, additional funds may be contributed to the pension plan. Supervalu may accelerate contributions or undertake contributions in excess of the minimum requirements from time to time subject to the availability of cash in excess of operating and financing needs or other factors as may be applicable. Supervalu assesses the relative attractiveness of the use of cash including such factors as expected return on assets, discount rates, cost of debt, reducing or eliminating required PBGC variable rate premiums or the ability to achieve exemption from participant notices of underfunding.
75
Lump Sum Pension Settlement
During fiscal 2017, the SUPERVALU Retirement Plan made lump sum settlement payments to certain deferred vested pension plan participants under a lump sum payment option window. The payments were equal to the present value of the participant’s pension benefits, and were made to certain former employees who were deferred vested participants in the SUPERVALU Retirement Plan, who had not yet begun receiving monthly pension benefit payments and who elected to participate in the lump sum payment option window. In fiscal 2017, the SUPERVALU Retirement Plan made lump sum settlement payments of approximately $200. The lump sum settlement payments resulted in a non-cash pension settlement charge of $42 from the acceleration of a portion of the accumulated unrecognized actuarial loss. As a result of the lump sum settlements, the SUPERVALU Retirement Plan assets and liabilities were re-measured at December 3, 2016 using a discount rate of 4.1 percent, an expected rate of return on plan assets of 6.5 percent and the RP-2014 Aggregate Mortality Table adjusted back to 2006 using projection scale MP-2014, and then projected forward using MP-2016. The settlement and subsequent re-measurement resulted in a decrease to accumulated other comprehensive loss of $172 pre-tax ($105 after-tax) and a corresponding increase to the SUPERVALU Retirement Plan’s funded status.
During fiscal 2015, the SUPERVALU Retirement Plan made lump sum settlement payments to certain deferred vested pension plan participants under a lump sum payment option window similar to that completed in 2017. The payments were equal to the present value of the participant’s pension benefits, and were made to certain former employees who were deferred vested participants in the SUPERVALU Retirement Plan, who had not yet begun receiving monthly pension benefit payments and who elected to participate in the lump sum payment option window. In fiscal 2015, the SUPERVALU Retirement Plan made lump sum settlement payments of approximately $272. The lump sum settlement payments resulted in a non-cash pension settlement charge of $64 from the acceleration of a portion of the accumulated unrecognized actuarial loss. As a result of the lump sum settlements, the SUPERVALU Retirement Plan assets and liabilities were re-measured at November 29, 2014 using a discount rate of 4.1 percent, an expected rate of return on plan assets of 6.5 percent and the RP-2014 Mortality Table with generational projection scale using MP-2014. The November 29, 2014 re-measurement resulted in an increase to Accumulated other comprehensive loss of $200 pre-tax ($141 after-tax) and a corresponding decrease to the SUPERVALU Retirement Plan’s funded status.
Estimated Future Benefit Payments
The estimated future benefit payments to be made from Supervalu’s defined benefit pension and other postretirement benefit plans, which reflect expected future service, are as follows:
Fiscal Year | Pension Benefits | Other Postretirement Benefits | |||||
2018 | $ | 156 | $ | 4 | |||
2019 | 138 | 4 | |||||
2020 | 144 | 3 | |||||
2021 | 150 | 3 | |||||
2022 | 155 | 3 | |||||
Years 2023-2027 | 793 | 15 | |||||
Defined Contribution Plans
Supervalu sponsors defined contribution and profit sharing plans pursuant to Section 401(k) of the Internal Revenue Code. Employees may contribute a portion of their eligible compensation to the plans on a pre-tax basis. Supervalu matches a portion of certain employee contributions by contributing cash into the investment options selected by the employees. The total amount contributed by Supervalu to the plans is determined by plan provisions or at the discretion of Supervalu. Total employer contribution expenses for these plans were $13, $8 and $16 for fiscal 2017, 2016 and 2015, respectively. Matching contributions were reduced or eliminated in January 2013 for most employees. Supervalu made a discretionary match for fiscal 2017 for eligible employees. There were no discretionary matches made in fiscal 2016. Supervalu adopted and made a discretionary match for fiscal 2015 for employees who had their matching contributions eliminated. Since June 2014, plan investment options do not include shares of Supervalu’s common stock.
Post-Employment Benefits
Supervalu recognizes an obligation for benefits provided to former or inactive employees. Supervalu is self-insured for certain disability plan programs, which comprise the primary benefits paid to inactive employees prior to retirement.
Amounts recognized in the Consolidated Balance Sheets consisted of the following:
76
Post-Employment Benefits | ||||||||
2017 | 2016 | |||||||
Accrued vacation, compensation and benefits | $ | 3 | $ | 5 | ||||
Other long-term liabilities | 7 | 8 | ||||||
Total | $ | 10 | $ | 13 | ||||
Multiemployer Plans
Supervalu contributes to various multiemployer pension plans under collective bargaining agreements, primarily defined benefit pension plans. These multiemployer plans generally provide retirement benefits to participants based on their service to contributing employers. The benefits are paid from assets held in trust for that purpose. Plan trustees typically are responsible for determining the level of benefits to be provided to participants as well as the investment of the assets and plan administration. Trustees are appointed in equal number by employers and the unions that are parties to the collective bargaining agreement.
Expense is recognized in connection with these plans as contributions are funded, in accordance with U.S. generally accepted accounting standards. Supervalu contributed $43, $43 and $39 to these plans for fiscal years 2017, 2016 and 2015, respectively. The risks of participating in these multiemployer plans are different from the risks associated with single-employer plans in the following respects:
a. | Assets contributed to the multiemployer plan by one employer are held in trust and may be used to provide benefits to employees of other participating employers. |
b. | If a participating employer stops contributing to the plan, the unfunded obligations of the plan may be borne by the remaining participating employers. |
c. | If Supervalu chooses to stop participating in some multiemployer plans, or makes market exits or closures or otherwise has participation in the plan drop below certain levels, Supervalu may be required to pay those plans an amount based on the underfunded status of the plan, referred to as a withdrawal liability. |
Supervalu’s participation in these plans is outlined in the table below. The EIN-Pension Plan Number column provides the Employer Identification Number (“EIN”) and the three-digit plan number, if applicable. Unless otherwise noted, the most recent Pension Protection Act (“PPA”) zone status available in 2017 and 2016 relates to the plans’ two most recent fiscal year-ends. The zone status is based on information that Supervalu received from the plan and is certified by each plan’s actuary. Among other factors, red zone status plans are generally less than 65 percent funded and are considered in critical status, plans in yellow zone status are less than 80 percent funded and are considered in endangered or seriously endangered status, and green zone plans are at least 80 percent funded. The Multiemployer Protection Act of 2014 (“MPRA”) created a new zone status called “critical and declining” or “Deep Red”. Plans are generally considered Deep Red if they are projected to become insolvent within 15 years. The FIP/RP Status Pending/Implemented column indicates plans for which a funding improvement plan (“FIP”) or a rehabilitation plan (“RP”) is either pending or has been implemented by the trustees of each plan.
Certain plans have been aggregated in the All Other Multiemployer Pension Plans line in the following table, as the contributions to each of these plans are not individually material. None of Supervalu’s collective bargaining agreements require that a minimum contribution be made to these plans. Multiemployer pension plan contributions and participants were generally comparable for fiscal 2017, 2016 and 2015.
At the date the financial statements were issued, Forms 5500 were generally not available for the plan years ending in 2016.
77
The following table contains information about Supervalu’s multiemployer plans:
EIN—Pension Plan Number | Plan Month/Day End Date | Pension Protection Act Zone Status | FIP/RP Status Pending/ Implemented | Contributions | Surcharges Imposed(1) | Amortization Provisions | |||||||||||||||||||
Pension Fund | 2017 | 2016 | 2017 | 2016 | 2015 | ||||||||||||||||||||
Minneapolis Food Distributing Industry Pension Plan | 416047047-001 | 12/31 | Green | Green | Implemented | $ | 10 | $ | 10 | $ | 10 | No | Yes | ||||||||||||
Minneapolis Retail Meat Cutters and Food Handlers Pension Fund | 410905139-001 | 2/29 | Green | Yellow | No | 9 | 9 | 7 | No | No | |||||||||||||||
Central States, Southeast and Southwest Areas Pension Fund | 366044243-001 | 12/31 | Deep Red | Red | Implemented | 8 | 8 | 8 | No | No | |||||||||||||||
UFCW Unions and Participating Employers Pension Fund | 526117495-002 | 12/31 | Red | Red | Implemented | 6 | 5 | 4 | Yes | No | |||||||||||||||
Western Conference of Teamsters Pension Plan | 916145047-001 | 12/31 | Green | Green | No | 4 | 4 | 4 | No | No | |||||||||||||||
UFCW Union Local 655 Food Employers Joint Pension Plan | 436058365-001 | 12/31 | Green | Green | No | 2 | 2 | 2 | No | No | |||||||||||||||
UFCW Unions and Employers Pension Plan | 396069053-001 | 10/31 | Red | Red | Implemented | 2 | 2 | 1 | Yes | Yes | |||||||||||||||
All Other Multiemployer Pension Plans(2) | 2 | 3 | 3 | ||||||||||||||||||||||
Total | $ | 43 | $ | 43 | $ | 39 | |||||||||||||||||||
(1) | PPA surcharges are 5 percent or 10 percent of eligible contributions and may not apply to all collective bargaining agreements or total contributions to each plan. |
(2) | All Other Multiemployer Pension Plans includes 9 plans, none of which is individually significant when considering Supervalu’s contributions to the plan, severity of the underfunded status or other factors. |
The following table describes the expiration of Supervalu’s collective bargaining agreements associated with the significant multiemployer plans in which Supervalu participates:
Most Significant Collective Bargaining Agreement | |||||||||||
Pension Fund | Range of Collective Bargaining Agreement Expiration Dates | Total Collective Bargaining Agreements | Expiration Date | % of Associates under Collective Bargaining Agreement (1) | Over 5% Contribution 2017 | ||||||
Minneapolis Food Distributing Industry Pension Plan | 5/31/2018 | 1 | 5/31/2018 | 100.0 | % | Yes | |||||
Minneapolis Retail Meat Cutters and Food Handlers Pension Fund | 3/3/2018 | 1 | 3/3/2018 | 100.0 | % | Yes | |||||
Central States, Southeast and Southwest Areas Pension Fund | 6/1/2017 – 7/13/2019 | 10 | 5/31/2019 | 28.1 | % | No | |||||
UFCW Unions and Participating Employers Pension Plan | 7/8/2017 | 2 | 7/8/2017 | 68.3 | % | Yes | |||||
Western Conference of Teamsters Pension Plan | 7/15/2017 – 9/26/2020 | 8 | 9/26/2020 | 42.3 | % | No | |||||
UFCW Union Local 655 Food Employers Joint Pension Plan | 5/11/2019 | 1 | 5/11/2019 | 100.0 | % | Yes | |||||
UFCW Unions and Employers Pension Plan | 4/6/2019 | 2 | 4/6/2019 | 75.5 | % | Yes | |||||
(1) | Company participating employees in the most significant collective bargaining agreement as a percent of all Company employees participating in the respective fund. |
78
Multiemployer Postretirement Benefit Plans Other than Pensions
Supervalu also makes contributions to multiemployer health and welfare plans in amounts set forth in the related collective bargaining agreements. These plans provide medical, dental, pharmacy, vision and other ancillary benefits to active employees and retirees as determined by the trustees of each plan. The vast majority of Supervalu’s contributions benefit active employees and as such, may not constitute contributions to a postretirement benefit plan. However, Supervalu is unable to separate contribution amounts to postretirement benefit plans from contribution amounts paid to benefit active employees.
Supervalu contributed $97, $95 and $89 for fiscal 2017, 2016 and 2015, respectively, to multiemployer health and welfare plans. If healthcare provisions within these plans cannot be renegotiated in a manner that reduces the prospective healthcare cost as Supervalu intends, Supervalu’s Selling and administrative expenses could increase in the future.
Collective Bargaining Agreements
As of February 25, 2017, Supervalu had approximately 29,000 employees. Approximately 16,000 employees are covered by 48 collective bargaining agreements. During fiscal 2017, 20 collective bargaining agreements covering approximately 9,200 employees were renegotiated. Also, three collective bargaining agreements covering approximately 140 employees have already expired without their terms being renegotiated. Negotiations are expected to continue with the bargaining units representing the employees subject to those agreements. During fiscal 2018, 23 collective bargaining agreements covering approximately 6,000 employees are scheduled to expire.
NOTE 11—NET EARNINGS PER SHARE
The following table reflects the calculation of basic and diluted net earnings per share:
2017 | 2016 | 2015 | |||||||||
Net earnings from continuing operations | $ | 27 | $ | 84 | $ | 25 | |||||
Less net earnings attributable to noncontrolling interests | (4 | ) | (8 | ) | (7 | ) | |||||
Net earnings from continuing operations attributable to SUPERVALU INC. | 23 | 76 | 18 | ||||||||
Income from discontinued operations, net of tax | 627 | 102 | 174 | ||||||||
Net earnings attributable to SUPERVALU INC. | $ | 650 | $ | 178 | $ | 192 | |||||
Weighted average number of shares outstanding—basic | 265 | 263 | 260 | ||||||||
Dilutive impact of stock-based awards | 3 | 5 | 4 | ||||||||
Weighted average number of shares outstanding—diluted | 268 | 268 | 264 | ||||||||
Basic net earnings per share attributable to SUPERVALU INC.: | |||||||||||
Continuing operations | $ | 0.09 | $ | 0.29 | $ | 0.07 | |||||
Discontinued operations | $ | 2.37 | $ | 0.39 | $ | 0.67 | |||||
Basic net earnings per share | $ | 2.45 | $ | 0.68 | $ | 0.74 | |||||
Diluted net earnings per share attributable to SUPERVALU INC.: | |||||||||||
Continuing operations | $ | 0.09 | $ | 0.28 | $ | 0.07 | |||||
Discontinued operations | $ | 2.34 | $ | 0.38 | $ | 0.66 | |||||
Diluted net earnings per share | $ | 2.43 | $ | 0.66 | $ | 0.73 | |||||
Stock-based awards of 15, 10 and 10 that were outstanding during fiscal 2017, 2016 and 2015, respectively, were excluded from the calculation of Net earnings from continuing operations per share—diluted, Net earnings from discontinued operations per share—diluted and Net earnings per share—diluted for the periods because their inclusion would be antidilutive.
79
NOTE 12—COMPREHENSIVE INCOME (LOSS) AND ACCUMULATED COMPREHENSIVE LOSS
Supervalu reports comprehensive income (loss) in the Consolidated Statements of Comprehensive Income. Comprehensive income includes all changes in stockholders’ equity (deficit) during the reporting period, other than those resulting from investments by and distributions to stockholders. Supervalu’s comprehensive income (loss) is calculated as net earnings (loss) including noncontrolling interests, plus or minus adjustments for pension and other postretirement benefit obligations and interest rate swaps, net of tax, less comprehensive income attributable to noncontrolling interests.
Accumulated other comprehensive loss represents the cumulative balance of other comprehensive income (loss), net of tax, as of the end of the reporting period and relates to pension and other postretirement benefit obligation adjustments, net of tax, and interest rate swaps designated as hedges, net of tax. Changes in Accumulated other comprehensive loss by component are as follows:
Benefit Plans | Interest Rate Swap | Total | ||||||
February 22, 2014 accumulated other comprehensive loss | (307 | ) | — | (307 | ) | |||
Other comprehensive loss before reclassifications | (188 | ) | — | (188 | ) | |||
Pension settlement charge(2) | 39 | — | 39 | |||||
Amortization of amounts included in net periodic benefit cost(1) | 33 | — | 33 | |||||
Net Other comprehensive loss | (116 | ) | — | (116 | ) | |||
February 28, 2015 accumulated other comprehensive loss | (423 | ) | — | (423 | ) | |||
Other comprehensive loss before reclassifications | (37 | ) | (4 | ) | (41 | ) | ||
Amortization of amounts included in net periodic benefit cost(1) | 42 | — | 42 | |||||
Net Other comprehensive income (loss) | 5 | (4 | ) | 1 | ||||
February 27, 2016 accumulated other comprehensive loss | (418 | ) | (4 | ) | (422 | ) | ||
Other comprehensive income before reclassifications | 97 | — | 97 | |||||
Amortization of amounts included in net periodic benefit cost(1) | 19 | — | 19 | |||||
Amortization of cash flow hedge | — | 2 | 2 | |||||
Pension settlement charges(2) | 26 | — | 26 | |||||
Net Other comprehensive income | 142 | 2 | 144 | |||||
February 25, 2017 accumulated other comprehensive loss | (276 | ) | (2 | ) | (278 | ) | ||
(1) | Amortization of amounts included in net periodic benefit cost includes amortization of prior service benefit and amortization of net actuarial loss as reflected in Note 10—Benefit Plans. |
(2) | Refer to Note 10—Benefit Plans for additional information on Supervalu’s fiscal 2017 and 2015 pension settlement charges. |
80
Items reclassified out of Accumulated other comprehensive loss had the following impact on the Consolidated Statements of Operations:
2017 | 2016 | 2015 | Affected Line Item on Consolidated Statements of Operations | ||||||||||
Pension and postretirement benefit plan obligations: | |||||||||||||
Amortization of amounts included in net periodic benefit expense(1) | $ | 28 | $ | 59 | $ | 43 | Selling and administrative expenses | ||||||
Amortization of amounts included in net periodic benefit expense(1) | 2 | 8 | 11 | Cost of sales | |||||||||
Pension settlement charges | 42 | — | 64 | Selling and administrative expenses | |||||||||
Total reclassifications | 72 | 67 | 118 | ||||||||||
Income tax benefit | (27 | ) | (25 | ) | (46 | ) | Income tax (benefit) provision | ||||||
Total reclassifications, net of tax | $ | 45 | $ | 42 | $ | 72 | |||||||
Interest rate swap cash flow hedge: | |||||||||||||
Reclassification of cash flow hedge | $ | 3 | $ | — | $ | — | Interest expense, net | ||||||
Income tax benefit | (1 | ) | — | — | Income tax (benefit) provision | ||||||||
Total reclassifications, net of tax | $ | 2 | $ | — | $ | — | |||||||
(1) | Amortization of amounts included in net periodic benefit cost include amortization of prior service benefit and amortization of net actuarial loss as reflected in Note 10—Benefit Plans. |
No amounts were reclassified out of Accumulated other comprehensive loss related to the interest rate swap designated as a cash flow hedge. As of February 25, 2017, Supervalu expects to reclassify $3 out of Accumulated other comprehensive loss into Interest expense, net during the following twelve-month period.
NOTE 13—STOCK-BASED AWARDS
As of February 25, 2017, Supervalu has stock options, restricted stock awards, restricted stock units and performance share units (collectively referred to as “stock-based awards”) outstanding under the 2012 Stock Plan and 2007 Stock Plan. Supervalu’s 2012 Stock Plan, which was amended and restated in fiscal 2015 and further amended in fiscal 2017 (as amended, the “2012 Stock Plan”), is the only plan under which stock-based awards may be granted to employees. The 2012 Stock Plan provides that the Board of Directors or the Leadership Development and Compensation Committee of the Board (the “Compensation Committee”) may determine at the time of grant whether each stock-based award granted will be a non-qualified or incentive stock-based award under the Internal Revenue Code of 1986, as amended (the “Internal Revenue Code”). The terms of each stock-based award will be determined by the Board of Directors or the Compensation Committee. Generally, stock-based awards granted from fiscal 2006 to fiscal 2012 generally have a term of seven years, and starting in fiscal 2013 stock-based awards granted generally have a term of ten years.
At the discretion of the Board of Directors or the Compensation Committee, Supervalu has granted stock options to purchase common stock at an exercise price not less than 100 percent of the fair market value of Supervalu’s common stock on the date of grant, restricted stock awards, restricted stock units and performance share units (“PSUs”) to executive officers and other key salaried employees. Stock options have also been granted to Supervalu’s non-employee directors. All recently issued stock options, restricted stock awards, restricted stock units and PSUs vest either pro rata over three years or cliff vest after three years. The restrictions on the restricted stock awards and restricted stock units generally lapse between one and five years from the date of grant. The performance metrics of PSUs are determined at the discretion of the Board of Directors or Compensation Committee.
As of February 25, 2017, there were 27 shares available for future issuance of stock-based awards under the 2012 Stock Plan. Common stock has been delivered out of treasury stock or newly issued shares upon the exercise or vesting of stock-based awards. The provisions of future stock-based awards may change at the discretion of the Board of Directors or the Compensation Committee.
81
Stock Options
Stock options granted, exercised and outstanding consisted of the following:
Shares Under Option (In thousands) | Weighted Average Exercise Price | Weighted Average Remaining Contractual Term (In years) | Aggregate Intrinsic Value (In thousands) | |||||||||
Outstanding, February 22, 2014 | 23,335 | $ | 14.87 | 5.41 | $ | 15,982 | ||||||
Granted | 5,022 | 7.54 | ||||||||||
Exercised | (1,944 | ) | 3.71 | |||||||||
Canceled and forfeited | (5,533 | ) | 30.68 | |||||||||
Outstanding, February 28, 2015 | 20,880 | $ | 9.98 | 6.55 | $ | 61,073 | ||||||
Granted | 5,531 | 7.44 | ||||||||||
Exercised | (1,723 | ) | 5.84 | |||||||||
Canceled and forfeited | (3,336 | ) | 24.94 | |||||||||
Outstanding, February 27, 2016 | 21,352 | $ | 7.37 | 5.93 | $ | 6,827 | ||||||
Granted | 960 | 5.64 | ||||||||||
Exercised | (1,745 | ) | 3.65 | |||||||||
Canceled and forfeited | (4,982 | ) | 9.73 | |||||||||
Outstanding, February 25, 2017 | 15,585 | $ | 6.92 | 5.99 | $ | 2,161 | ||||||
Vested and expected to vest in the future as of February 25, 2017 | 15,152 | $ | 6.95 | 5.92 | $ | 2,161 | ||||||
Exercisable as of February 25, 2017 | 11,313 | $ | 6.97 | 5.17 | $ | 2,161 | ||||||
For Supervalu’s annual grant made in the first quarter of fiscal 2017, 2016 and 2015, Supervalu granted 1, 4 and 5, respectively, of non-qualified stock options to certain employees under the 2012 Stock Plan with a weighted average grant date fair value of $2.67, $3.67 and $3.28 per share, respectively. These stock options vest over a period of three years, and were awarded as part of a broad-based employee incentive initiative designed to retain and motivate employees across Supervalu.
In fiscal 2016, Supervalu’s Board of Directors granted 2 stock options to Supervalu’s Chief Executive Officer. The stock options have a grant date fair value of $2.08 per share and vest over three years.
Supervalu used the Black Scholes option pricing model to estimate the fair value of the options at grant date based upon the following assumptions:
2017 | 2016 | 2015 | ||||||
Dividend yield | — | % | — | % | — | % | ||
Volatility rate | 54.2 | % | 49.0 – 56.5% | 50.8 – 53.2% | ||||
Risk-free interest rate | 1.3 | % | 1.2 – 1.4% | 1.2 – 1.6% | ||||
Expected option life | 5.0 years | 4.0 years | 4.0 – 5.0 years | |||||
82
Restricted Stock
Restricted stock awards and restricted stock unit activity consisted of the following:
Restricted Stock Units (In thousands) | Restricted Stock Awards (In thousands) | Weighted Average Grant Date Fair Value(1) | |||||||
Outstanding, February 22, 2014 | — | 937 | 9.09 | ||||||
Granted | 2,274 | 18 | 7.11 | ||||||
Lapsed | (133 | ) | (417 | ) | 6.54 | ||||
Canceled and forfeited | (90 | ) | (2 | ) | 6.09 | ||||
Outstanding, February 28, 2015 | 2,051 | 536 | 11.02 | ||||||
Granted | 65 | 2,339 | 8.74 | ||||||
Lapsed | (742 | ) | (456 | ) | 6.82 | ||||
Canceled and forfeited | (125 | ) | (239 | ) | 8.79 | ||||
Outstanding, February 27, 2016 | 1,249 | 2,180 | $ | 8.68 | |||||
Granted | 4,575 | 11 | 5.64 | ||||||
Lapsed | (834 | ) | (756 | ) | 8.59 | ||||
Canceled and forfeited | (1,333 | ) | (550 | ) | 8.79 | ||||
Outstanding, February 25, 2017 | 3,657 | 885 | $ | 8.64 | |||||
(1) Weighted average grant date fair value is only used for restricted stock awards.
In fiscal 2017 and 2015, Supervalu granted restricted stock units that vest over a three-year period from the date of the grant. In fiscal 2016, Supervalu granted restricted stock awards that vest over a three-year period from the date of grant. The fair value of restricted stock awards and restricted stock units is based on the closing price of Supervalu’s common stock on the date of grant.
Performance Share Units
In fiscal 2017, Supervalu granted 1 PSUs to certain employees under the 2012 Stock Plan. The PSUs have a fiscal 2017-2019 performance period and settle in shares of Supervalu’s stock. Supervalu used the Monte Carlo method to estimate the fair value of the PSUs at grant date based upon the following assumptions:
2017 | ||
Dividend yield | — | % |
Volatility rate | 41.3 | % |
Risk-free interest rate | 0.9 | % |
Expected PSU life | 2.8 years | |
Performance share unit activity consisted of the following:
Performance Share Units (In thousands) | Weighted Average Grant Date Fair Value | |||||
Outstanding, February 27, 2016 | — | $ | — | |||
Granted | 1,410 | 6.65 | ||||
Lapsed | — | — | ||||
Canceled and forfeited | (204 | ) | 6.65 | |||
Outstanding, February 25, 2017 | 1,206 | $ | 6.65 | |||
83
Stock-Based Compensation Expense
The components of pre-tax stock-based compensation expense are included primarily in Selling and administrative expenses in the Consolidated Statements of Operations. The expense recognized and related tax benefits were as follows:
2017 | 2016 | 2015 | |||||||||
Stock-based compensation | $ | 18 | $ | 22 | $ | 20 | |||||
Income tax benefits | (7 | ) | (9 | ) | (8 | ) | |||||
Stock-based compensation, net of tax | $ | 11 | $ | 13 | $ | 12 | |||||
Supervalu realized excess tax shortfalls of $1, $1 and $1 on the exercise of stock-based awards in fiscal 2017, 2016 and 2015, respectively.
Unrecognized Stock-Based Compensation Expense
As of February 25, 2017, there was $25 of unrecognized compensation expense related to unvested stock-based awards granted under Supervalu’s stock plans. The expense is expected to be recognized over a weighted average remaining vesting period of approximately two years.
NOTE 14—INCOME TAXES
Income Tax Provision
The income tax (benefit) provision consisted of the following:
2017 | 2016 | 2015 | |||||||||
Current | |||||||||||
Federal | $ | (25 | ) | $ | 25 | $ | (22 | ) | |||
State | 6 | — | (6 | ) | |||||||
Total current | (19 | ) | 25 | (28 | ) | ||||||
Deferred | (1 | ) | (1 | ) | 15 | ||||||
Total income tax (benefit) provision | $ | (20 | ) | $ | 24 | $ | (13 | ) | |||
The difference between the actual tax provision and the tax provision computed by applying the statutory federal income tax rate to Earnings from continuing operations before income taxes is attributable to the following:
2017 | 2016 | 2015 | |||||||||
Federal taxes based on statutory rate | $ | 3 | $ | 38 | $ | 4 | |||||
State income taxes, net of federal benefit | (1 | ) | 2 | (3 | ) | ||||||
Tax contingency | (1 | ) | (9 | ) | (2 | ) | |||||
Change in valuation allowance | 1 | 4 | — | ||||||||
Pension | (9 | ) | (4 | ) | (7 | ) | |||||
Deferred tax adjustment | (9 | ) | — | — | |||||||
Other | (4 | ) | (7 | ) | (5 | ) | |||||
Total income tax (benefit) provision | $ | (20 | ) | $ | 24 | $ | (13 | ) | |||
Deferred Income Taxes
Deferred income taxes reflect the net tax effects of temporary differences between the basis in assets and liabilities for financial reporting and income tax purposes. Supervalu’s deferred tax assets and liabilities consisted of the following:
84
2017 | 2016 | ||||||
Deferred tax assets: | |||||||
Compensation and benefits | $ | 163 | $ | 235 | |||
Self-insurance | 16 | 27 | |||||
Property, plant and equipment and capitalized lease assets | 39 | 47 | |||||
Loss on sale of discontinued operations | 1,174 | 1,388 | |||||
Net operating loss carryforwards | 15 | 15 | |||||
Other | 76 | 83 | |||||
Gross deferred tax assets | 1,483 | 1,795 | |||||
Valuation allowance | (1,196 | ) | (1,408 | ) | |||
Total deferred tax assets | 287 | 387 | |||||
Deferred tax liabilities: | |||||||
Property, plant and equipment and capitalized lease assets | (92 | ) | (108 | ) | |||
Inventories | (15 | ) | (6 | ) | |||
Intangible assets | (7 | ) | (24 | ) | |||
Other | (8 | ) | (21 | ) | |||
Total deferred tax liabilities | (122 | ) | (159 | ) | |||
Net deferred tax assets | $ | 165 | $ | 228 | |||
Net deferred tax assets are recorded in the Consolidated Balance Sheet as follows:
2017 | 2016 | ||||||
Deferred tax assets | $ | 165 | $ | 238 | |||
Long-term assets of discontinued operations | — | (10 | ) | ||||
Net deferred tax assets | 165 | 228 | |||||
Supervalu has valuation allowances to reduce deferred tax assets to the amount that is more-likely-than-not to be realized. Supervalu currently has state net operating loss (“NOL”) carryforwards of $276 for tax purposes. The NOL carryforwards expire beginning in fiscal 2018 and continuing through fiscal 2035 and have a $10 valuation allowance.
In fiscal 2014, the sale of NAI resulted in an allocation of tax expense between continuing and discontinued operations and the recognition of the additional tax basis in the shares of NAI offset by a valuation allowance on the capital loss that resulted from the sale of shares. In fiscal 2017, Supervalu utilized a portion of the capital loss offset by a matching release of the valuation allowance on the capital loss. Supervalu has recorded a valuation allowance against the remaining capital loss as there is no evidence that the capital loss will be used prior to its expiration in fiscal 2019.
Uncertain Tax Positions
Changes in Supervalu’s unrecognized tax positions consisted of the following:
2017 | 2016 | 2015 | |||||||||
Beginning balance | $ | 70 | $ | 94 | $ | 76 | |||||
Increase based on tax positions related to the current year | 7 | 5 | 15 | ||||||||
Decrease based on tax positions related to the current year | — | — | — | ||||||||
Increase based on tax positions related to prior years | — | — | 15 | ||||||||
Decrease based on tax positions related to prior years | (15 | ) | (23 | ) | (4 | ) | |||||
Decrease related to settlements with taxing authorities | 1 | — | (3 | ) | |||||||
Decrease due to lapse of statute of limitations | (4 | ) | (6 | ) | (5 | ) | |||||
Ending balance | $ | 59 | $ | 70 | $ | 94 | |||||
Included in the balance of unrecognized tax benefits as of February 25, 2017, February 27, 2016 and February 28, 2015 are tax positions, net of tax, of $33, $34 and $36, respectively, which would reduce Supervalu’s effective tax rate if recognized in future periods.
85
Because existing tax positions will continue to generate increased liabilities for Supervalu for unrecognized tax benefits over the next 12 months, and since Supervalu is routinely under audit by various taxing authorities, it is reasonably possible that the amount of unrecognized tax benefits will change during the next 12 months. An estimate of the amount or range of such change cannot be made at this time. However, Supervalu does not expect the change, if any, to have a material effect on Supervalu’s Consolidated Balance Sheets, Operations, or Cash Flows within the next 12 months.
Supervalu recognized interest income of $3, $9 and $7 in fiscal 2017, 2016 and 2015 in Income from discontinued operations, net of tax and Interest expense, respectively, and penalty (income) expense of $(2), $5, and $0 in fiscal 2017, 2016 and 2015 in Income from discontinued operations, net of tax and Selling and administrative expenses, respectively, in the Consolidated Statements of Operations. At February 25, 2017 and February 27, 2016, Supervalu had accrued interest of $11 and $16, respectively, related to uncertain tax positions recorded in Other current liabilities, and Long-term tax liabilities in the Consolidated Balance Sheets. At February 25, 2017 and February 27, 2016, Supervalu had accrued penalties of $2 and $5, respectively, related to uncertain tax positions recorded in Long-term tax liabilities in the Consolidated Balance Sheets.
Supervalu is currently under examination or other methods of review in several tax jurisdictions and remains subject to examination until the statute of limitations expires for the respective taxing jurisdiction or an agreement is reached between the taxing jurisdiction and Supervalu. As of February 25, 2017, Supervalu is no longer subject to federal income tax examinations for fiscal years before 2014 and in most states is no longer subject to state income tax examinations for fiscal years before 2007.
NOTE 15—COMMITMENTS, CONTINGENCIES AND OFF-BALANCE SHEET ARRANGEMENTS
Guarantees and Contingent Liabilities
Supervalu has outstanding guarantees related to certain leases, fixture financing loans and other debt obligations of various retailers as of February 25, 2017. These guarantees were generally made to support the business growth of Wholesale customers. The guarantees are generally for the entire terms of the leases, fixture financing loans and other debt obligations with remaining terms that range from less than one year to fourteen years, with a weighted average remaining term of approximately eight years. For each guarantee issued, if the Wholesale customer or other third party defaults on a payment, Supervalu would be required to make payments under its guarantee. Generally, the guarantees are secured by indemnification agreements or personal guarantees of the Wholesale customer.
Supervalu reviews performance risk related to its guarantee obligations based on internal measures of credit performance. As of February 25, 2017, the maximum amount of undiscounted payments Supervalu would be required to make in the event of default of all guarantees was $66 ($52 on a discounted basis). Based on the indemnification agreements, personal guarantees and results of the reviews of performance risk, Supervalu believes the likelihood that it will be required to assume a material amount of these obligations is remote. No amount has been recorded in the Consolidated Balance Sheets for these contingent obligations under Supervalu’s guarantee arrangements as the fair value has been determined to be de minimus.
Supervalu is contingently liable for leases that have been assigned to various third parties in connection with facility closings and dispositions. Supervalu could be required to satisfy the obligations under the leases if any of the assignees are unable to fulfill their lease obligations. Due to the wide distribution of Supervalu’s lease assignments among third parties, and various other remedies available, Supervalu believes the likelihood that it will be required to assume a material amount of these obligations is remote. No amount has been recorded in the Consolidated Balance Sheets for these contingent obligations under Supervalu’s guarantee arrangements as the fair value has been determined to be de minimus.
Supervalu is a party to a variety of contractual agreements under which it may be obligated to indemnify the other party for certain matters in the ordinary course of business, which indemnities may be secured by operation of law or otherwise. These agreements primarily relate to Supervalu’s commercial contracts, service agreements, contracts entered into for the purchase and sale of stock or assets, operating leases and other real estate contracts, financial agreements, agreements to provide services to Supervalu and agreements to indemnify officers, directors and employees in the performance of their work. While Supervalu’s aggregate indemnification obligations could result in a material liability, Supervalu is not aware of any matters that are expected to result in a material liability. No amount has been recorded in the Consolidated Balance Sheets for these contingent obligations as the fair value has been determined to be de minimus.
Following the sale of NAI on March 21, 2013, Supervalu remains contingently liable with respect to certain self-insurance commitments and other guarantees as a result of parental guarantees issued by Supervalu with respect to the obligations of NAI that were incurred while NAI was a subsidiary of Supervalu. As of February 25, 2017, using actuarial estimates as of December 31, 2016, the total undiscounted amount of all such guarantees was estimated at $122 ($109 on a discounted basis). Based on the expected settlement of the self-insurance claims that underlie Supervalu’s commitments, Supervalu believes that such contingent liabilities will continue to decline. Subsequent to the sale of NAI, NAI collateralized most of these obligations with
86
letters of credit and surety bonds to numerous states. Because NAI remains a primary obligor on these self-insurance and other obligations and has collateralized most of the self-insurance obligations for which Supervalu remains contingently liable, Supervalu believes that the likelihood that it will be required to assume a material amount of these obligations is remote. No amount has been recorded in the Consolidated Balance Sheets for these contingent obligations and guarantee arrangements as the fair value has been determined to be de minimus.
Agreements with Save-A-Lot and Onex
The SAL Merger Agreement contains customary indemnification obligations of each party with respect to breaches of their respective representations, warranties and covenants, and certain other specified matters, on the terms and subject to the limitations set forth in the SAL Merger Agreement. Similarly, the Separation Agreement contains indemnification obligations and covenants related to the separation of the assets and liabilities of the Save-A-Lot business from Supervalu. Pursuant to the Services Agreement, Supervalu is providing Save-A-Lot various technical, human resources, finance and other operational services for a term of five years, subject to termination provisions that can be exercised by each party. Save-A-Lot paid Supervalu $30 upon entry into the Services Agreement, which will be credited against fees due under the Services Agreement, of which $7 was recognized in Corporate net sales in fiscal 2017. The initial annual base charge under the Services Agreement is $30, subject to adjustments. The Services Agreement generally requires each party to indemnify the other party against third-party claims arising out of the performance of or the provision or receipt of services under the Services Agreement. While Supervalu’s aggregate indemnification obligations to Save-A-Lot and Onex could result in a material liability, Supervalu is not aware of any matters that are expected to result in a material liability. The Company has recorded the fair value of the guarantee in the Consolidated Balance Sheets.
Agreements with AB Acquisition LLC and Affiliates
In connection with the sale of NAI, Supervalu entered into various agreements with AB Acquisition LLC and its affiliates related to on-going operations, including a Transition Services Agreement with each of NAI and Albertson’s LLC (collectively, the “TSA”). At the time of the sale of NAI, the TSA had initial terms of approximately 30 months, and are subject to renewal by the parties thereto and also include termination provisions that can be exercised by each party. On September 6, 2016, NAI and Albertson’s LLC each notified Supervalu that it was again exercising its right to renew the term of their respective TSA for an additional year. Pursuant to this notice, each TSA will now expire on September 21, 2018 unless renewed again by notice given no later than September 21, 2017. In addition, Supervalu operates a distribution center in Lancaster, Pennsylvania that is owned by NAI. In March 2017, Supervalu acquired a distribution center in Harrisburg, Pennsylvania that will eventually replace the Lancaster facility.
On April 16, 2015, Supervalu entered into a letter agreement pursuant to which Supervalu is providing services to NAI and Albertson’s LLC as needed to transition and wind down the TSA. In exchange for these transition and wind down services, Supervalu is entitled to receive eight payments of approximately $6 every six months for aggregate fees of $50. These payments are separate from and incremental to the fixed and variable fees Supervalu receives under the TSA. Supervalu estimates that the complete transition and wind down of the TSA could take approximately two to three more years.
On May 28, 2015, Supervalu entered into a letter agreement with NAI and Albertson’s LLC pursuant to which Supervalu received certain additional rights and benefits, and Supervalu and NAI and Albertson’s LLC (and certain of their affiliates, including Safeway, with respect to provisions of the letter agreement applicable to them) agreed to resolve several issues. Among other matters resolved, NAI, Albertson’s LLC and AB Acquisition agreed to no longer challenge, and waive all rights relating to, Supervalu’s filing with the IRS in fiscal 2015 for a change in accounting method for NAI and its subsidiaries pursuant to the tangible property repair regulations. In consideration for the granting of the additional rights and benefits to Supervalu and the resolution of the various matters under the letter agreement, Supervalu paid $35 to AB Acquisition, the parent entity of NAI and Albertson’s LLC.
Haggen
In connection with Haggen’s bankruptcy process, Haggen has now closed or sold all 164 of its stores. The transition and wind down of the Haggen transition services agreement occurred in the second quarter of fiscal 2017, with Supervalu now providing limited services in connection with the wind down of the Haggen estate. Supervalu filed approximately $2 of administrative 503(b)(9) priority claims and approximately $8 of unsecured claims with the bankruptcy court, including a number of contingent claims. On September 30, 2016, the bankruptcy court approved settlement agreements resolving Supervalu’s unsecured claims against Haggen. In accordance with the terms of the settlement agreements, Supervalu received approximately $3 from Haggen on October 11, 2016, and it anticipates Haggen will make further payments of approximately $2 on account of Supervalu’s claims. Pursuant to the settlement agreement, Haggen has agreed not to pursue claw-backs of any transfers made to Supervalu. Supervalu could be exposed to claims from third parties from which Supervalu sourced products, services, licenses and similar benefits on behalf of Haggen. Supervalu has reserved for possible losses related to a portion of
87
these third party claims. It is reasonably possible that Supervalu could experience losses in excess of the amount of such reserves; however, at this time Supervalu cannot reasonably estimate a range of such excess losses because of the factual and legal issues related to whether Supervalu would have liability for any such third-party claims, if such third-party claims were asserted against Supervalu.
Information Technology Intrusions
Computer Network Intrusions - In fiscal 2015, Supervalu announced it had experienced two separate criminal intrusions into the portion of its computer network that processes payment card transactions for some of its owned and franchised retail stores, including some of its associated stand-alone liquor stores.
Some stores owned and operated by Albertson’s LLC and NAI experienced related criminal intrusions. Supervalu provides information technology services to these Albertson’s LLC and NAI stores pursuant to the TSA. Supervalu believes that any losses incurred by Albertson’s LLC or NAI as a result of the intrusions affecting their stores would not be Supervalu’s responsibility.
Investigations and Proceedings - As a result of the criminal intrusions, the payment card brands are conducting investigations and, although Supervalu’s network has previously been found to be compliant with applicable data security standards, the forensic investigator working on behalf of the payment card brands has concluded that Supervalu was not in compliance at the time of the intrusions and that the alleged non-compliance caused at least some portion of the compromise of payment card data that allegedly occurred during the intrusions. On August 1, 2016, MasterCard provided notice of its assessment of non-ordinary course expenses and incremental counterfeit fraud losses allegedly incurred by it or its issuers as a result of the criminal intrusions. On September 1, 2016, Supervalu submitted an appeal of the assessment to MasterCard and, on December 5, 2016, MasterCard denied the appeal and imposed a reduced assessment. Supervalu expects the other payment card brands to also allege that Supervalu was not compliant with the applicable data security standards at the time of the intrusions and that such alleged non-compliance caused the compromise of payment card data during the intrusions. Supervalu believes theses payment card brands will also make claims against Supervalu for non-ordinary course operating expenses and incremental counterfeit fraud losses allegedly incurred by them or their issuers by reason of the intrusions and Supervalu expects to dispute those claims. While Supervalu does not believe that a loss is probable by reason of these as yet unasserted claims, Supervalu believes that a loss in connection with these claims, should they be asserted, is reasonably possible; however, at this time Supervalu cannot reasonably estimate a range of possible losses because the payment card brands’ investigation is ongoing and the payment card brands have not alleged what payment cards they consider to have been compromised, what data from those cards they consider to have been compromised, or the amount of their and/or their issuers’ claimed losses. Similar to the assessment imposed by MasterCard, Supervalu does not currently believe that any amount that may be paid for other payment card brand claims that might be asserted will be material to Supervalu’s consolidated results of operations, cash flows or financial condition. In addition, one payment card brand has placed Supervalu in a “probationary status” for a period of two years following Supervalu’s re-validation as PCI-DSS compliant, during which time Supervalu’s failure to comply with the probationary requirements set forth by the payment card brand could result in the imposition of further conditions, including but not limited to disqualification from the payment system. Supervalu does not anticipate material costs to comply with the probationary requirements.
On October 23, 2015, Supervalu received a letter from a multistate group of Attorneys General seeking information regarding the intrusions. Supervalu is cooperating with the request. To date, no claims have been asserted against Supervalu related to this inquiry. If any claims are asserted, Supervalu expects to dispute those claims.
As discussed in more detail below in this Note 15 under Legal Proceedings, four class action complaints related to the intrusions have been filed against Supervalu and consolidated into one action and are currently pending. As indicated below, Supervalu believes that the likelihood of a material loss from the four class actions is remote. It is possible that other similar complaints by consumers, banks or others may be filed against Supervalu in connection with the intrusions.
Insurance Coverage and Expenses - Supervalu had $50 of cyber threat insurance above a per incident deductible of $1 at the time of the intrusions, which it believes should mitigate the financial effect of these intrusions, including claims made or that might be made against Supervalu based on these intrusions. Supervalu now maintains $90 of cyber threat insurance above a per incident deductible of approximately $3, in each case subject to certain sublimits.
Other Contractual Commitments
In the ordinary course of business, Supervalu enters into supply contracts to purchase products for resale and purchase, and service contracts for fixed asset and information technology commitments. These contracts typically include either volume commitments or fixed expiration dates, termination provisions and other standard contractual considerations. As of February 25, 2017, Supervalu had approximately $322 of non-cancelable future purchase obligations.
88
Legal Proceedings
Supervalu is subject to various lawsuits, claims and other legal matters that arise in the ordinary course of conducting business. In the opinion of management, based upon currently-available facts, the likelihood that the ultimate outcome of any lawsuits, claims and other proceedings will have a material adverse effect on the overall results of Supervalu’s operations, its cash flows or its financial position is remote.
In September 2008, a class action complaint was filed against Supervalu, as well as International Outsourcing Services, LLC (“IOS”); Inmar, Inc.; Carolina Manufacturer’s Services, Inc.; Carolina Coupon Clearing, Inc. and Carolina Services in the United States District Court in the Eastern District of Wisconsin. The plaintiffs in the case are a consumer goods manufacturer, a grocery co-operative and a retailer marketing services company that allege on behalf of a purported class that Supervalu and the other defendants (i) conspired to restrict the markets for coupon processing services under the Sherman Act and (ii) were part of an illegal enterprise to defraud the plaintiffs under the Federal Racketeer Influenced and Corrupt Organizations Act. The plaintiffs seek monetary damages, attorneys’ fees and injunctive relief. All proceedings had been stayed in the case pending the conclusion of the criminal prosecution of certain former officers of IOS. The final criminal trial concluded in December 2016. The District Court has indicated that it will release the stay of the civil case and issue a scheduling order. A mediation has been scheduled for May 22, 2017.
In December 2008, a class action complaint was filed in the United States District Court for the Western District of Wisconsin against Supervalu alleging that a 2003 transaction between Supervalu and C&S Wholesale Grocers, Inc. (“C&S”) was a conspiracy to restrain trade and allocate markets. In the 2003 transaction, Supervalu purchased certain assets of the Fleming Corporation as part of Fleming Corporation’s bankruptcy proceedings and sold certain assets of Supervalu to C&S that were located in New England. Three other retailers filed similar complaints in other jurisdictions and the cases were consolidated and are proceeding in the United States District Court in Minnesota. The complaints allege that the conspiracy was concealed and continued through the use of non-compete and non-solicitation agreements and the closing down of the distribution facilities that Supervalu and C&S purchased from each other. Plaintiffs are seeking monetary damages, injunctive relief and attorneys’ fees. On July 5, 2011, the District Court granted Supervalu’s Motion to Compel Arbitration for those plaintiffs with arbitration agreements and plaintiffs appealed. On July 16, 2012, the District Court denied plaintiffs’ Motion for Class Certification, and on January 11, 2013, the District Court granted Supervalu’s Motion for Summary Judgment and dismissed the case regarding the non-arbitration plaintiffs. On February 12, 2013, the 8th Circuit reversed the District Court decision requiring plaintiffs with arbitration agreements to arbitrate and remanded to the District Court. On October 30, 2013, the parties attended a District Court ordered mandatory mediation, which was not successful in resolving the matter. On May 21, 2014, the 8th Circuit (1) reversed the District Court’s decision granting summary judgment in favor of Supervalu and (2) affirmed the District Court’s decision denying class certification of a class consisting of all retailers located in the States of Illinois, Indiana, Iowa, Michigan, Minnesota, Ohio and Wisconsin that purchased wholesale grocery products from Supervalu between December 31, 2004 and September 13, 2008, but remanded the case for the District Court to consider whether to certify a narrower class of purchasers supplied from Supervalu’s Champaign, Illinois distribution center and potentially other distribution centers. On June 19, 2015, the District Court Magistrate Judge entered an order that decided a number of matters including granting plaintiffs’ request to seek class certification for certain Midwest Distribution Centers and denying plaintiffs’ request to add an additional New England plaintiff and denying plaintiffs’ request to seek class certification for a group of New England retailers. On August 20, 2015, the District Court affirmed the Magistrate Judge’s order. In September 2015, the plaintiffs appealed to the 8th Circuit the denial of the request to add an additional New England plaintiff and to seek class certification for a group of New England retailers and the hearing before the 8th Circuit occurred on May 17, 2016. On March 1, 2016, the plaintiffs filed a class certification motion seeking to certify five District Court classes of retailers in the Midwest and Supervalu filed its response on May 6, 2016. On September 7, 2016, the District Court granted plaintiffs’ motion to certify five Midwest distribution center classes, only one of which is suing Supervalu (the non-arbitration Champaign distribution center class). On March 1, 2017, the 8th Circuit denied plaintiffs’ appeals seeking to join an additional New England plaintiff and the appeal seeking the ability to move for class certification of a smaller New England class. The District Court’s mandatory settlement conference set for February 14-15, 2017 was cancelled by the court and a mediation is scheduled for May 25, 2017. Supervalu continues to vigorously defend this lawsuit. Due to the mediation, it is probable that the parties will engage in settlement negotiations, which may result in a settlement of the matter. However, Supervalu cannot reasonably estimate the range of loss, if any, that may result from this matter due to the procedural status of the case and the lack of a formal demand on Supervalu by the plaintiffs.
In August and November 2014, four class action complaints were filed against Supervalu relating to the criminal intrusions into its computer network announced by Supervalu in fiscal 2015 (the “Criminal Intrusion”). The cases were centralized in the Federal District Court for the District of Minnesota under the caption In Re: SUPERVALU Inc. Customer Data Security Breach Litigation. On June 26, 2015, the plaintiffs filed a Consolidated Class Action Complaint. Supervalu filed a Motion to Dismiss the Consolidated Class Action Complaint and the hearing took place on November 3, 2015. On January 7, 2016, the District Court granted the Motion to Dismiss and dismissed the case without prejudice, holding that the plaintiffs did not have standing
89
to sue as they had not met their burden of showing any compensable damages. On February 4, 2016, the plaintiffs filed a motion to vacate the District Court’s dismissal of the complaint or in the alternative to conduct discovery and file an amended complaint, and Supervalu filed its response in opposition on March 4, 2016. On April 20, 2016, the District Court denied plaintiffs’ motion to vacate the District Court’s dismissal or in the alternative to amend the complaint. On May 18, 2016, plaintiffs appealed to the 8th Circuit and on May 31, 2016, Supervalu filed a cross-appeal to preserve its additional arguments for dismissal of the plaintiffs’ complaint. The hearing on the appeal before the 8th Circuit is set for May 10, 2017.
On June 30, 2015, Supervalu received a letter from the Office for Civil Rights of the U.S. Department of Health and Human Services (“OCR”) seeking documents and information regarding Supervalu’s HIPAA breach notification and reporting from 2009 to the present. The letter indicates that the OCR Midwest Region is doing a compliance review of Supervalu’s alleged failure to report small breaches of protected health information related to its pharmacy operations (e.g., any incident involving less than 500 individuals). On September 4, 2015, Supervalu submitted its response to OCR’s letter. While Supervalu does not believe that a loss is probable by reason of the compliance review, Supervalu believes that a loss is reasonably possible; however, at this time Supervalu cannot estimate a range of possible losses because the OCR’s review is at the early stages and Supervalu does not know if OCR will find a violation(s) and, if so, what violation(s) and whether OCR will proceed with corrective action, issuance of penalties or monetary settlement. The potential penalties related to the issues being investigated are up to $50 thousand per violation (which can be counted per day) with a $1.5 per calendar year maximum for multiple violations of a single provision (with the potential for finding violations of multiple provisions each with a separate $1.5 per calendar year maximum); however, as noted above, any actual penalties will be determined only after consideration by OCR of various factors, including the nature of any violation, remedial actions taken by Supervalu and other factors determined relevant by OCR.
On September 21, 2016, Supervalu received an administrative subpoena issued by the Drug Enforcement Administration (“DEA”) on September 9, 2016. In addition to requesting information on Supervalu’s pharmacy policies and procedures generally, the subpoena also requested the production of documents that are required to be kept and maintained by Supervalu pursuant to the Controlled Substances Act and its implementing regulations. On November 23, 2016, Supervalu responded to the subpoena and is cooperating fully with DEA’s additional requests for information. While Supervalu cannot predict the outcome of this matter at this time, Supervalu does not believe that a monetary loss is probable. However, Supervalu believes that a monetary loss is reasonably possible, but cannot estimate the amount of any such loss as Supervalu does not know what violation(s) the DEA will find and whether the DEA will pursue corrective action or monetary penalties.
Predicting the outcomes of claims and litigation and estimating related costs and exposures involves substantial uncertainties that could cause actual outcomes, costs and exposures to vary materially from current expectations. Supervalu regularly monitors its exposure to the loss contingencies associated with these matters and may from time to time change its predictions with respect to outcomes and its estimates with respect to related costs and exposures.
With respect to the IOS, Criminal Intrusion and OCR matters discussed above, Supervalu believes the chance of a material loss is remote. It is possible, although management believes that the likelihood is remote, that material differences in actual outcomes, costs and exposures relative to current predictions and estimates, or material changes in such predictions or estimates, could have a material adverse effect on Supervalu’s financial condition, results of operations or cash flows.
NOTE 16—SEGMENT INFORMATION
Refer to the Consolidated Segment Financial Information for financial information concerning Supervalu’s operations and financial position by reportable segment.
Supervalu’s operating segments reflect the manner in which the business is managed and how Supervalu allocates resources and assesses performance internally. Supervalu’s chief operating decision maker is the Chief Executive Officer.
Supervalu offers a wide variety of grocery products, general merchandise and health and beauty care, pharmacy, fuel and other items and services. Supervalu’s business is classified by management into two reportable segments: Wholesale and Retail. These reportable segments are two distinct businesses, each with a different customer base, marketing strategy and management structure. Supervalu reviews its reportable segments on an annual basis, or more frequently if events or circumstances indicate a change in reportable segments has occurred.
The Wholesale reportable segment derives revenues from wholesale distribution and services to retail food stores and other customers (collectively referred to as “Wholesale customers”). The Retail reportable segment derives revenues from the sale of groceries and other products at retail locations operated by Supervalu. Substantially all of Supervalu’s operations are domestic.
Supervalu offers a wide variety of nationally advertised brand name and private-label products, primarily including grocery (both perishable and nonperishable), general merchandise and health and beauty care, pharmacy and fuel, which are sold
90
through Supervalu’s owned and franchised retail stores to shoppers and through its Wholesale segment to Wholesale customers. The following table provides additional detail on the amounts and percentages of Net sales for each group of similar products sold in the Wholesale and Retail segments, and service agreement revenue in Corporate:
2017 | 2016 | 2015 | ||||||||||||||||||
Wholesale: | ||||||||||||||||||||
Nonperishable grocery products(1) | $ | 5,579 | 45 | % | $ | 5,753 | 45 | % | $ | 5,939 | 45 | % | ||||||||
Perishable grocery products(2) | 1,969 | 16 | 2,025 | 16 | 2,099 | 16 | ||||||||||||||
Services to Wholesale customers and other | 157 | 1 | 157 | 1 | 160 | 1 | ||||||||||||||
7,705 | 62 | % | 7,935 | 61 | % | 8,198 | 62 | % | ||||||||||||
Retail: | ||||||||||||||||||||
Nonperishable grocery products(1) | $ | 2,511 | 20 | % | $ | 2,607 | 20 | % | $ | 2,677 | 20 | % | ||||||||
Perishable grocery products(2) | 1,494 | 12 | 1,549 | 12 | 1,574 | 12 | ||||||||||||||
Pharmacy products | 500 | 4 | 511 | 4 | 510 | 4 | ||||||||||||||
Fuel | 55 | 1 | 67 | 1 | 83 | 1 | ||||||||||||||
Other | 36 | — | 35 | — | 40 | — | ||||||||||||||
4,596 | 37 | % | 4,769 | 37 | % | 4,884 | 37 | % | ||||||||||||
Corporate: | — | |||||||||||||||||||
Services agreement revenue | $ | 179 | 1 | % | $ | 203 | 2 | % | $ | 195 | 1 | % | ||||||||
Net sales | $ | 12,480 | 100 | % | $ | 12,907 | 100 | % | $ | 13,277 | 100 | % | ||||||||
(1) | Includes such items as dry goods, dairy, frozen foods, beverages, general merchandise, home, health and beauty care and candy |
(2) | Includes such items as meat, produce, deli and bakery |
Segment operating earnings include revenues and costs attributable to each of the respective business segments and allocated corporate overhead, based on the segment’s estimated consumption of corporately managed resources. Variances to planned corporate overhead allocated to business segments remain in Corporate because allocated corporate overhead affecting segment operating profit is centrally managed. Reported segment information is presented on the same basis as it is reviewed by executive management.
The presentation of identifiable assets by reportable segment includes allocations from Wholesale to Retail of shared assets based on estimated usage. The presentation of capital expenditures by reportable segment includes allocations of corporate expenditures for information technology and other investments from Corporate to Wholesale and Retail based on estimated usage.
NOTE 17—DISCONTINUED OPERATIONS
Supervalu determined that the Save-A-Lot business met the criteria to be held-for-sale and classified as a discontinued operation during the third quarter of fiscal 2017. The Save-A-Lot business was previously disclosed as a separate reporting segment of Supervalu. The assets, liabilities, operating results, and cash flows of the Save-A-Lot business have been presented separately as discontinued operations in the Consolidated Financial Statements for all periods presented in a manner consistent with the SAL Merger Agreement and the Separation Agreement. In addition, discontinued operations include the results of operations and cash flows attributed to the assets and liabilities of the NAI business.
Results of Discontinued Operations
The following table provides the composition of the gain on the sale of Save-A-Lot:
2017 | |||
Purchase price | $ | 1,304 | |
Disposed of balance sheet assets and liabilities, net | (635 | ) | |
Transaction costs and other | (32 | ) | |
Pre-tax gain on sale | 637 | ||
Income tax provision | (60 | ) | |
After-tax gain on sale | $ | 577 | |
Income taxes on the gain were recorded at a significantly reduced effective rate due to the anticipated utilization of capital loss carryforwards and the release of valuation allowances of approximately $244. Income tax on the gain on sale of Save-A-Lot are expected to be paid in Supervalu’s first quarter of fiscal 2018. The closing adjustments under the SAL Merger Agreement are still subject to finalization, which may impact the final calculation of the purchase price and gain on sale. Supervalu believes that any potential adjustment to the purchase price from the closing adjustments will be insignificant.
91
The following is a summary of Supervalu’s operating results and certain other directly attributable expenses that are included in discontinued operations:
2017 | 2016 | 2015 | |||||||||
Net sales | $ | 3,529 | $ | 4,621 | $ | 4,639 | |||||
Cost of sales | 2,969 | 3,911 | 3,949 | ||||||||
Gross profit | 560 | 710 | 690 | ||||||||
Selling and administrative expenses | 452 | 563 | 514 | ||||||||
Goodwill impairment charge | 37 | — | — | ||||||||
Gain on sale | (637 | ) | — | — | |||||||
Operating earnings | 708 | 147 | 176 | ||||||||
Interest income, net | (5 | ) | (7 | ) | (3 | ) | |||||
Earnings from discontinued operations before income taxes | 713 | 154 | 179 | ||||||||
Income tax provision | 86 | 52 | 5 | ||||||||
Income from discontinued operations, net of tax | $ | 627 | $ | 102 | $ | 174 | |||||
The carrying amounts of major classes of assets and liabilities that were classified as discontinued operations on the Consolidated Balance Sheets were as follows:
February 27, 2016 | |||
Current assets | |||
Cash and cash equivalents | $ | 15 | |
Receivables, net | 45 | ||
Inventories, net | 298 | ||
Other current assets | 18 | ||
Total current assets of discontinued operations | 376 | ||
Long-term assets | |||
Property, plant and equipment, net | 460 | ||
Goodwill | 142 | ||
Intangible assets, net | 8 | ||
Deferred tax assets | (10 | ) | |
Other assets | 13 | ||
Total long-term assets of discontinued operations | 613 | ||
Total assets of discontinued operations | $ | 989 | |
Current liabilities | |||
Accounts payable | $ | 289 | |
Accrued vacation, compensation and benefits | 34 | ||
Current maturities of capital lease obligations | 1 | ||
Other current liabilities | 22 | ||
Total current liabilities of discontinued operations | 346 | ||
Long-term liabilities | |||
Long-term capital lease obligations | 9 | ||
Long-term tax liabilities | 6 | ||
Other long-term liabilities | 27 | ||
Total long-term liabilities of discontinued operations | 42 | ||
Total liabilities of discontinued operations | 388 | ||
Net assets of discontinued operations | $ | 601 | |
92
Impairment Charge
Prior to the classification of the Save-A-Lot business as held-for-sale, Supervalu assessed the carrying value of the Save-A-Lot business for impairment in accordance with generally accepted accounting principles to determine if the carrying value of the Save-A-Lot assets exceeded their estimated fair value, prior to measuring the held-for-sale business at fair value less cost to sell. The carrying value of the total net assets of the Save-A-Lot reporting units were compared to their estimated fair value based on the proceeds expected to be received pursuant to the SAL Merger Agreement. Supervalu’s review of goodwill indicated that the estimated fair value of the Save-A-Lot licensee distribution reporting unit was in excess of its carrying value, but that the carrying value of the Save-A-Lot corporate stores reporting unit exceeded its estimated fair value. Supervalu recorded a non-cash goodwill impairment charge of $37 before tax during the third quarter of fiscal 2017, which was included as a component of Income from discontinued operations, net of tax, resulting from a decline in discounted cash flows under the income approach and indicated reporting unit fair values under the market approach. The calculation of the impairment charge contains significant judgments and estimates including weighted average cost of capital, future revenue, profitability, cash flows and fair values of assets and liabilities.
Income Taxes
Income before income taxes from discontinued operations for fiscal 2015 primarily reflects $6 of property tax refunds and interest income resulting from settlement of income tax audits. The income tax benefit included as a component of Income from discontinued operations, net of tax for fiscal 2015 includes $66 of net tax benefits, primarily related to tangible property repair regulations and other deduction-related changes.
93
NOTE 18—SUBSEQUENT EVENTS
On April 10, 2017, Supervalu, a newly formed wholly owned subsidiary of Supervalu (“UG Merger Sub”), and Unified Grocers, Inc. (“Unified Grocers”), entered into an Agreement and Plan of Merger (the “UG Merger Agreement”) pursuant to which Supervalu agreed to acquire Unified Grocers in a transaction valued at approximately $375, comprised of approximately $114 in cash for 100% of the outstanding stock of Unified Grocers plus the assumption and payoff of Unified Grocers net debt at closing (approximately $261 as of April 1, 2017). Founded in 1922, Unified Grocers is a retailer-owned wholesale grocery distribution cooperative that supplies independent retailers throughout the western United States and has annual sales of approximately $3.8 billion. Supervalu expects to use cash on hand and available liquidity under its credit facilities to fund the acquisition and payoff Unified Grocers’ net debt.
On the terms and subject to the conditions set forth in the UG Merger Agreement, at the closing of the transactions contemplated thereby (the “UG Closing”), UG Merger Sub will merge with and into Unified Grocers (the “UG Merger”) with Unified Grocers surviving the UG Merger as a wholly owned subsidiary of Supervalu, and the shares of Unified Grocers will be converted into the right to receive from Supervalu at the UG Closing approximately $114 in cash in the aggregate.
As further provided in the UG Merger Agreement, the consummation of the transactions contemplated by the UG Merger Agreement is subject to certain closing conditions, including (i) approval of the UG Merger by the shareholders of Unified Grocers, (ii) any applicable waiting periods (or extensions thereof) under the Hart-Scott-Rodino Antitrust Improvements Act of 1976 having expired or been terminated, (iii) the absence of any order by any governmental entity that restrains, enjoins or otherwise prohibits the UG Merger, (iv) the accuracy of the representations and warranties of the parties (generally subject to a material adverse effect standard), (v) material compliance by the parties with their respective obligations under the UG Merger Agreement, (vi) no material adverse effect having occurred with respect to the Unified Grocers business after entry into the UG Merger Agreement, and (vii) other customary closing conditions. The transaction is currently expected to be completed in mid- to late summer 2017.
Under the terms of the UG Merger Agreement, Supervalu will be entitled to receive a termination fee of $8, plus reimbursement of up to $1 in costs and expenses, in the event that the UG Merger Agreement is terminated by Unified Grocers under certain circumstances, including as a result of a change in the recommendation of the board of directors of Unified Grocers. In addition, a reverse termination fee of $9.5 may be payable by Supervalu to Unified Grocers upon termination of the UG Merger Agreement under certain circumstances, including if Supervalu is unable to obtain antitrust approval before January 5, 2018.
94
UNAUDITED QUARTERLY FINANCIAL INFORMATION
(In millions, except per share data)
Unaudited quarterly financial information for SUPERVALU INC. and its subsidiaries is as follows:
2017 | |||||||||||||||||||
First (16 weeks) | Second (12 weeks) | Third (12 weeks) | Fourth (12 weeks) | Fiscal Year (52 weeks) | |||||||||||||||
Net sales | $ | 3,765 | $ | 2,805 | $ | 3,003 | $ | 2,907 | $ | 12,480 | |||||||||
Gross profit | $ | 549 | $ | 396 | $ | 407 | $ | 435 | $ | 1,787 | |||||||||
Net earnings (loss) from continuing operations(1) | $ | 3 | $ | 29 | $ | (11 | ) | $ | 6 | $ | 27 | ||||||||
Net earnings (loss) attributable to SUPERVALU INC. | $ | 46 | $ | 31 | $ | (26 | ) | $ | 599 | $ | 650 | ||||||||
Net earnings (loss) per share from continuing operations attributable to SUPERVALU INC.—diluted(1) | $ | 0.01 | $ | 0.11 | $ | (0.04 | ) | $ | 0.02 | $ | 0.09 | ||||||||
Net earnings (loss) per share attributable to SUPERVALU INC.—diluted | $ | 0.17 | $ | 0.12 | $ | (0.10 | ) | $ | 2.23 | $ | 2.43 | ||||||||
Dividends declared per share | $ | — | $ | — | $ | — | $ | — | $ | — | |||||||||
Weighted average shares—diluted | 267 | 267 | 265 | 269 | 268 | ||||||||||||||
2016 | |||||||||||||||||||
First (16 weeks) | Second (12 weeks) | Third (12 weeks) | Fourth (12 weeks) | Fiscal Year (52 weeks) | |||||||||||||||
Net sales | $ | 4,000 | $ | 2,971 | $ | 3,045 | $ | 2,891 | $ | 12,907 | |||||||||
Gross profit | $ | 587 | $ | 420 | $ | 436 | $ | 431 | $ | 1,874 | |||||||||
Net earnings from continuing operations(2) | $ | 6 | $ | 32 | $ | 16 | $ | 30 | $ | 84 | |||||||||
Net earnings attributable to SUPERVALU INC. | $ | 61 | $ | 31 | $ | 34 | $ | 52 | $ | 178 | |||||||||
Net earnings per share from continuing operations attributable to SUPERVALU INC.—diluted(2) | $ | 0.01 | $ | 0.12 | $ | 0.05 | $ | 0.10 | $ | 0.28 | |||||||||
Net earnings per share attributable to SUPERVALU INC.—diluted | $ | 0.23 | $ | 0.11 | $ | 0.13 | $ | 0.20 | $ | 0.66 | |||||||||
Dividends declared per share | $ | — | $ | — | $ | — | $ | — | $ | — | |||||||||
Weighted average shares—diluted | 268 | 268 | 268 | 267 | 268 | ||||||||||||||
(1) | Results from continuing operations for the fiscal year ended February 25, 2017 include net charges and costs of $110 before tax ($56 after tax, or $0.20 per diluted share). Refer to “Selected Financial Data” in Part II, Item 6 of this Annual Report on Form 10-K for a discussion of these items. |
(2) | Results from continuing operations for the fiscal year ended February 27, 2016 include net charges and costs of $29 before tax ($17 after tax, or $0.06 per diluted share). Refer to “Selected Financial Data” in Part II, Item 6 of this Annual Report on Form 10-K for a discussion of these items. |
95
ITEM 9. CHANGES IN AND DISAGREEMENTS WITH ACCOUNTANTS ON ACCOUNTING AND FINANCIAL DISCLOSURE
None.
ITEM 9A. CONTROLS AND PROCEDURES
Disclosure Controls and Procedures
Supervalu carried out an evaluation, under the supervision and with the participation of Supervalu’s management, including Supervalu’s Chief Executive Officer and its Chief Financial Officer, of the effectiveness of the design and operation of Supervalu’s disclosure controls and procedures (as defined in Rule 13a-15(e) under the Exchange Act) as of February 25, 2017, the end of the period covered by this Annual Report on Form 10-K. Based on this evaluation, the Chief Executive Officer and Chief Financial Officer concluded that, as of February 25, 2017, Supervalu’s disclosure controls and procedures are effective to provide reasonable assurance that information required to be disclosed by Supervalu in the reports that it files or submits under the Exchange Act is (1) recorded, processed, summarized and reported within the time periods specified by the SEC’s rules and forms and (2) accumulated and communicated to Supervalu’s management, including Supervalu’s Chief Executive Officer and Chief Financial Officer, in a manner that allows timely decisions regarding required disclosure.
Management’s Annual Report on Internal Control Over Financial Reporting
The financial statements, financial analyses and all other information included in this Annual Report on Form 10-K were prepared by Supervalu’s management, which is responsible for establishing and maintaining adequate internal control over financial reporting.
Supervalu’s internal control over financial reporting is designed to provide reasonable assurance regarding the reliability of financial reporting and the preparation of financial statements for external purposes in accordance with generally accepted accounting principles. Supervalu’s internal control over financial reporting includes those policies and procedures that:
i. | pertain to the maintenance of records that, in reasonable detail, accurately and fairly reflect the transactions and dispositions of the assets of Supervalu; |
ii. | provide reasonable assurance that transactions are recorded as necessary to permit preparation of financial statements in accordance with generally accepted accounting principles, and that receipts and expenditures of Supervalu are being made only in accordance with authorizations of management and directors of Supervalu; and |
iii. | provide reasonable assurance regarding prevention or timely detection of unauthorized acquisition and use or disposition of Supervalu’s assets that could have a material effect on the financial statements. |
There are inherent limitations in the effectiveness of any internal control, including the possibility of human error and the circumvention or overriding of controls. Accordingly, even effective internal control can provide only reasonable assurances with respect to financial statement preparation. Further, because of changes in conditions, the effectiveness of internal control may vary over time.
Management assessed the design and effectiveness of Supervalu’s internal control over financial reporting as of February 25, 2017. In making this assessment, management used the criteria set forth by the Committee of Sponsoring Organizations of the Treadway Commission (COSO) in Internal Control—Integrated Framework (2013). Based on management’s assessment under the framework in Internal Control - Integrated Framework (2013), as of February 25, 2017, Supervalu’s internal control over financial reporting is effective.
The effectiveness of Supervalu’s internal control over financial reporting as of February 25, 2017 has been audited by KPMG LLP, Supervalu’s independent registered public accounting firm. Their report, which is set forth in Part II, Item 8 of this Annual Report on Form 10-K, expresses an unqualified opinion on the effectiveness of Supervalu’s internal control over financial reporting as of February 25, 2017.
Changes in Internal Control Over Financial Reporting
In connection with the divestiture of the Save-A-Lot business, Supervalu reviewed its internal control over financial reporting. During the fourth quarter of fiscal 2017, Supervalu identified certain controls that were not related to Supervalu’s continuing operations but were solely related to the Save-A-Lot business. Because those controls did not relate to Supervalu’s continuing operations, they were discontinued in the fourth quarter of fiscal 2017. Overall, there has been no change to Supervalu’s internal control over financial reporting (as defined in Rule 13a-15(f) under the Exchange Act) that has materially affected, or is reasonably likely to materially affect, Supervalu’s internal control over financial reporting.
96
ITEM 9B. OTHER INFORMATION
On April 20, 2017, the Leadership Development and Compensation Committee (the “LDCC”) approved or, in the case of compensation and awards for Mr. Gross, the LDCC recommended and, on April 21, 2017, the independent members of the Board of Directors of Supervalu ratified, certain executive compensation changes and awards for the Company’s named executive officers. The material changes and grants are as follows (amounts presented in dollars):
• | Cash incentive payments were approved for certain of Supervalu’s executive officers, other than the CEO, including Mr. Besanko ($155,000) and Ms. Grafton ($15,000), in recognition of significant project-based accomplishments in fiscal 2017, including the sale of Save-A-Lot and new Wholesale customer affiliations; |
• | An increase in Mr. Gross’s base salary to $1,150,000 effective April 23, 2017, and an increase in his annual cash incentive target to 130% of his base salary; |
• | A revised structure for the annual incentive plan for fiscal 2018. The plan for fiscal 2018 contains three incentive metrics: consolidated Adjusted EBITDA, consolidated Net sales, and progress towards Supervalu’s business transformation. Achieving a consolidated Adjusted EBITDA equal to at least 85% of the target consolidated Adjusted EBITDA is required for payouts on the consolidated Adjusted EBITDA and consolidated Net sales metrics; and |
• | Incremental changes to Supervalu’s long-term incentive compensation plan for fiscal 2018, whereby the metrics for the performance share units (PSUs) will consist of relative and absolute total shareholder return growth. Additionally, the LDCC and the independent members of the Board approved and ratified, as applicable, incremental amounts of PSUs having the same terms as the annual grants to be made to executive officers for fiscal 2018, including an incremental amount for Mr. Besanko ($130,000). The incremental amount of the PSU awards varied for the executive officers and was determined based on a variety of factors, including current incentive compensation, scope of responsibilities and role in driving Supervalu’s strategic transformation. In addition to the PSUs discussed above, the long-term incentive plan for fiscal 2018 includes restricted stock unit (RSU) grants similar to fiscal 2017. Mr. Gross was granted stock options pursuant to the terms of his employment agreement and, separate from his employment agreement, he received a PSU award ($1,500,000) consistent with the terms above and a time-based RSU award ($800,000) for retention and to further incentivize progress on Supervalu’s business transformation. |
On April 25, 2017, Supervalu announced that the employment of Susan S. Grafton, Supervalu’s Senior Vice President, Finance, and Chief Accounting Officer, would terminate effective May 20, 2017, in connection with a reorganization of certain of Supervalu’s administration functions, including the finance department. In connection with the termination, Ms. Grafton is entitled to severance benefits under Supervalu’s executive severance plan. Bruce H. Besanko, Supervalu’s Executive Vice President, Chief Operating Officer and Chief Financial Officer, will become Supervalu’s Chief Accounting Officer effective May 21, 2017. Mr. Besanko previously served as Supervalu’s Chief Accounting Officer from August 7, 2013 to February 16, 2014, and his biography is included above under “Executive Officers of SUPERVALU INC.”
PART III
ITEM 10. DIRECTORS, EXECUTIVE OFFICERS AND CORPORATE GOVERNANCE
The information called for by Item 10, as to compliance with Section 16(a) of the Exchange Act, is incorporated by reference to Supervalu’s definitive Proxy Statement to be filed with the SEC pursuant to Regulation 14A in connection with Supervalu’s 2017 Annual Meeting of Stockholders under the heading “Other Information—Section 16(a) Beneficial Ownership Reporting Compliance.” The information called for by Item 10, as to the audit committee and the audit committee financial expert, is incorporated by reference to Supervalu’s definitive Proxy Statement to be filed with the SEC pursuant to Regulation 14A in connection with Supervalu’s 2017 Annual Meeting of Stockholders under the heading “Committees of the Board of Directors—Audit Committee.” The information called for by Item 10, as to executive officers, is set forth under “Executive Officers of Supervalu” in Part I, Item 1 of this Annual Report on Form 10-K. The information called for by Item 10, as to directors, is incorporated by reference to Supervalu’s definitive Proxy Statement to be filed with the SEC pursuant to Regulation 14A in connection with Supervalu’s 2017 Annual Meeting of Stockholders under the heading “Election of Directors (Item 1).”
Supervalu has adopted a code of ethics called the Code of Business Conduct that applies to its principal executive officer, principal financial officer, principal accounting officer and controller, or persons performing similar functions and all other employees, and a Code of Business Conduct and Ethics that applies to its directors. The Codes are posted on Supervalu’s website (www.supervalu.com). Supervalu intends to satisfy the disclosure requirement under Item 5.05 of Form 8-K regarding an amendment to, or waiver from, a provision of the code of ethics that applies to Supervalu’s principal executive officer, principal financial officer, principal accounting officer and controller, or persons performing similar functions, by posting such information on Supervalu’s website at the address specified above.
97
Supervalu’s Governance Principles and charters for each Committee of its Board of Directors are also available on Supervalu’s website. The Codes, Governance Principles and charters are also available in print to any stockholder who submits a request to: Corporate Secretary, SUPERVALU INC., P.O. Box 990, Minneapolis, Minnesota 55440.
Information on Supervalu’s website is not deemed to be incorporated by reference into this Annual Report on Form 10-K.
ITEM 11. EXECUTIVE COMPENSATION
The information called for by Item 11 is incorporated by reference to Supervalu’s definitive Proxy Statement to be filed with the SEC pursuant to Regulation 14A in connection with Supervalu’s 2017 Annual Meeting of Stockholders under the headings “Board Practices—Compensation Risk Assessment,” “Director Compensation,” “Committees of the Board of Directors—Leadership Development and Compensation Committee—Compensation Committee Interlocks and Insider Participation,” “Compensation Discussion and Analysis,” “Executive Compensation” and “Report of the Leadership Development and Compensation Committee.”
ITEM 12. SECURITY OWNERSHIP OF CERTAIN BENEFICIAL OWNERS AND MANAGEMENT AND RELATED STOCKHOLDER MATTERS
The information called for by Item 12 is incorporated by reference to Supervalu’s definitive Proxy Statement to be filed with the SEC pursuant to Regulation 14A in connection with Supervalu’s 2017 Annual Meeting of Stockholders under the headings “Security Ownership of Certain Beneficial Owners” and “Security Ownership of Management.”
The following table sets forth information as of February 25, 2017 about Supervalu’s common stock that may be issued under all of its equity compensation plans:
Equity Compensation Plan Information
(shares not in millions) Plan Category | Number of securities to be issued upon exercise of outstanding options, warrants and rights | Weighted average exercise price of outstanding options, warrants and rights | Number of securities remaining available for future issuance under equity compensation plans (excluding securities reflected in column (a)) | |||||||
(a) | (b) | (c) | ||||||||
Equity compensation plans approved by security holders(1) | 15,360,007 | $ | 6.91 | 29,069,799 | (2) | |||||
Equity compensation plans not approved by security holders | — | $ | — | — | ||||||
Total | 15,360,007 | $ | 6.91 | 29,069,799 | (2) | |||||
(1) | Includes Supervalu’s 2007 Stock Plan, the 2012 Stock Plan and Supervalu’s Director’s Deferred Compensation Plan. |
(2) | Consists of 26,610,674 shares available for issuance under the 2012 Stock Plan and 2,459,125 shares available for issuance under the Director’s Deferred Compensation Plan. The 2012 Stock Plan provides that any shares subject to awards under the 2007 Stock Plan as of May 23, 2016 that cease for any reason to be subject to such awards (other than by reason of exercise or settlement of such awards to the extent they are exercised for or settled in vested and non-forfeitable shares) are added to the 2012 Stock Plan reserve for issuance. The 26,610,674 shares available for issuance under the 2012 Stock Plan includes 1,513,670 shares that have been added from awards that had been outstanding under the 2007 Stock Plan as of May 23, 2016. |
ITEM 13. CERTAIN RELATIONSHIPS AND RELATED TRANSACTIONS, AND DIRECTOR INDEPENDENCE
The information called for by Item 13, as to director independence, is incorporated by reference to Supervalu’s definitive Proxy Statement to be filed with the SEC pursuant to Regulation 14A in connection with Supervalu’s 2017 Annual Meeting of Stockholders under the heading “Board Practices—Director Independence.” The information called for by Item 13, as to related person transactions, is incorporated by reference to Supervalu’s definitive Proxy Statement to be filed with the SEC pursuant to Regulation 14A in connection with Supervalu’s 2017 Annual Meeting of Stockholders under the heading “Board Practices—Policy and Procedures Regarding Transactions with Related Persons.”
ITEM 14. PRINCIPAL ACCOUNTING FEES AND SERVICES
98
The information called for by Item 14 is incorporated by reference to Supervalu’s definitive Proxy Statement to be filed with the SEC pursuant to Regulation 14A in connection with Supervalu’s 2017 Annual Meeting of Stockholders under the heading “Independent Registered Public Accounting Firm’s Fees.”
99
PART IV
ITEM 15. EXHIBITS AND FINANCIAL STATEMENT SCHEDULES
(a)(1) | Financial Statements: | |||||
The Consolidated Financial Statements to Supervalu listed in the accompanying “Index of Consolidated Financial Statements” together with the report of KPMG LLP, independent registered public accountants, are filed as part of this Annual Report on Form 10-K. | ||||||
(2) | Financial Statement Schedules: | |||||
The consolidated financial statement schedule of Supervalu listed in the accompanying “Index of Consolidated Financial Statements.” | ||||||
(3) | Exhibits: | |||||
(2) | Plan of Acquisition, Reorganization, Arrangement, Liquidation or Succession: | |||||
2.1 | Stock Purchase Agreement, dated January 10, 2013, by and among SUPERVALU INC., AB Acquisition LLC and New Albertson’s, Inc., is incorporated herein by reference to Exhibit 2.1 to Supervalu’s Current Report on Form 8-K filed with the SEC on January 14, 2013 (Schedules have been omitted pursuant to Item 601(b)(2) of Regulation S-K. A copy of any omitted schedule will be furnished supplementally to the SEC upon request.) | |||||
2.2 | Tender Offer Agreement, dated January 10, 2013, by and between SUPERVALU INC., Symphony Investors LLC and Cerberus Capital Management, L.P., is incorporated herein by reference to Exhibit 2.2 to Supervalu’s Current Report on Form 8-K filed with the SEC on January 14, 2013 (Schedules have been omitted pursuant to Item 601(b)(2) of Regulation S-K. A copy of any omitted schedule will be furnished supplementally to the SEC upon request.) | |||||
2.3 | Asset Purchase Agreement, dated May 6, 2014, by and among RBF, LLC, Roundy’s Supermarkets, Inc., SUPERVALU INC., Supervalu Pharmacies, Inc. and Supervalu Gold, LLC., is incorporated herein by reference to Exhibit 2.1 to Supervalu’s Current Report on Form 8-K filed with the SEC on May 7, 2014 (Schedules have been omitted pursuant to Item 601(b)(2) of Regulation S-K. A copy of any omitted schedule will be furnished supplementally to the SEC upon request.) | |||||
2.4 | Agreement and Plan of Merger, dated as of October 16, 2016, by and among Smith Acquisition Corp., Smith Merger Sub Corp., Moran Foods, LLC and SUPERVALU INC. is incorporated by reference to Exhibit 2.1 to Supervalu’s Current Report on Form 8-K filed with the SEC on October 17, 2016 (Schedules and exhibits have been omitted pursuant to Item 601(b)(2) of Regulation S-K. A copy of any omitted schedule or exhibit will be furnished supplementally to the SEC upon request.) | |||||
2.5 | Separation Agreement, dated as of October 16, 2016, by and among SUPERVALU INC. and Moran Foods, LLC is incorporated by reference to Exhibit 2.2 to Supervalu’s Current Report on Form 8-K filed with the SEC on October 17, 2016 (Schedules and exhibits have been omitted pursuant to Item 601(b)(2) of Regulation S-K. A copy of any omitted schedule or exhibit will be furnished supplementally to the SEC upon request.) | |||||
2.6 | Agreement and Plan of Merger, dated as of April 10, 2017, by and among Unified Grocers, Inc., SUPERVALU INC., and West Acquisition Corporation is incorporated by reference to Exhibit 2.1 to Supervalu’s Current Report on Form 8-K filed with the SEC on April 11, 2017 (Schedules and exhibits have been omitted pursuant to Item 601(b)(2) of Regulation S-K. A copy of any omitted schedule or exhibit will be furnished supplementally to the SEC upon request.) | |||||
(3) | Articles of Incorporation and Bylaws: | |||||
3.1 | Restated Certificate of Incorporation is incorporated herein by reference to Exhibit 3.1 to Supervalu’s Current Report on Form 8-K filed with the SEC on July 18, 2012. | |||||
3.2 | Amended and Restated Bylaws of SUPERVALU INC., effective January 18, 2017, are incorporated herein by reference to Exhibit 3.1 to Supervalu’s Current Report on Form 8-K filed with the SEC on January 23, 2017. | |||||
(4) | Instruments defining the rights of security holders, including indentures: | |||||
4.1 | Indenture dated as of July 1, 1987, between Supervalu and Bankers Trust Company, as Trustee, is incorporated herein by reference to Exhibit 4.1 to Supervalu’s Registration Statement on Form S-3 (Registration No. 33-52422). | |||||
100
4.2 | First Supplemental Indenture dated as of August 1, 1990, between Supervalu and Bankers Trust Company, as Trustee, to Indenture dated as of July 1, 1987, between Supervalu and Bankers Trust Company, as Trustee, is incorporated herein by reference to Exhibit 4.2 to Supervalu’s Registration Statement on Form S-3 (Registration No. 33-52422). | |||||
4.3 | Second Supplemental Indenture dated as of October 1, 1992, between Supervalu and Bankers Trust Company, as Trustee, to Indenture dated as of July 1, 1987, between Supervalu and Bankers Trust Company, as Trustee, is incorporated herein by reference to Exhibit 4.1 to Supervalu’s Current Report on Form 8-K dated November 13, 1992. | |||||
4.4 | Third Supplemental Indenture dated as of September 1, 1995, between Supervalu and Bankers Trust Company, as Trustee, to Indenture dated as of July 1, 1987, between Supervalu and Bankers Trust Company, as Trustee, is incorporated herein by reference to Exhibit 4.1 to Supervalu’s Current Report on Form 8-K filed with the SEC on October 2, 1995. | |||||
4.5 | Fourth Supplemental Indenture dated as of August 4, 1999, between Supervalu and Bankers Trust Company, as Trustee, to Indenture dated as of July 1, 1987, between Supervalu and Bankers Trust Company, as Trustee, is incorporated herein by reference to Exhibit 4.2 to Supervalu’s Quarterly Report on Form 10-Q for the quarterly period (16 weeks) ended September 11, 1999. | |||||
4.6 | Fifth Supplemental Indenture dated as of September 17, 1999, between Supervalu and Bankers Trust Company, as Trustee, to Indenture dated as of July 1, 1987, between Supervalu and Bankers Trust Company, as Trustee, is incorporated herein by reference to Exhibit 4.3 to Supervalu’s Quarterly Report on Form 10-Q for the quarterly period (16 weeks) ended September 11, 1999. | |||||
4.7 | Officers’ Certificate and Authentication Order dated May 7, 2009 for the 8.000% Senior Notes due 2016 (which includes the form of Note) issued pursuant to the Indenture dated as of July 1, 1987, as amended and supplemented by the First Supplemental Indenture dated as of August 1, 1990, the Second Supplemental Indenture dated as of October 1, 1992, the Third Supplemental Indenture dated as of September 1, 1995, the Fourth Supplemental Indenture dated as of August 4, 1999, and the Fifth Supplemental Indenture dated as of September 17, 1999, each between Supervalu and Deutsche Bank Trust Company Americas (formerly known as Bankers Trust Company), as Trustee, is incorporated herein by reference to Exhibit 4.1 to Supervalu’s Current Report on Form 8-K filed with the SEC on May 7, 2009. | |||||
4.8 | Officers’ Certificate and Authentication Order dated May 21, 2013 for the 6.750% Senior Notes due 2021 (which includes the form of Note) issued pursuant to the Indenture dated as of July 1, 1987, as amended and supplemented by the First Supplemental Indenture dated as of August 1, 1990, the Second Supplemental Indenture dated as of October 1, 1992, the Third Supplemental Indenture dated as of September 1, 1995, the Fourth Supplemental Indenture dated as of August 4, 1999, and the Fifth Supplemental Indenture dated as of September 17, 1999, each between Supervalu and Deutsche Bank Trust Company Americas (formerly known as Bankers Trust Company), as Trustee, is incorporated herein by reference to Exhibit 4.1 to Supervalu’s Current Report on Form 8-K filed with the SEC on May 21, 2013). | |||||
4.9 | Officers’ Certificate and Authentication Order dated November 14, 2014 for the 7.750% Senior Notes due 2022 (which includes the form of Note) issued pursuant to the Indenture dated as of July 1, 1987, as amended and supplemented by the First Supplemental Indenture dated as of August 1, 1990, the Second Supplemental Indenture dated as of October 1, 1992, the Third Supplemental Indenture dated as of September 1, 1995, the Fourth Supplemental Indenture dated as of August 4, 1999, and the Fifth Supplemental Indenture dated as of September 17, 1999, each between Supervalu and Deutsche Bank Trust Company Americas (formerly known as Bankers Trust Company), as Trustee, is incorporated herein by reference to Exhibit 4.1 to Supervalu’s Current Report on Form 8-K filed with the SEC on November 14, 2014. | |||||
Pursuant to Item 601(b)(4)(iii) of Regulation S-K, copies of certain instruments defining the rights of holders of certain long-term debt to Supervalu and its subsidiaries are not filed and, in lieu thereof, Supervalu agrees to furnish copies thereof to the SEC upon request. | ||||||
(10) | Material Contracts: | |||||
10.1 | SUPERVALU INC. Excess Benefit Plan Restatement, as amended, is incorporated herein by reference to Exhibit 10.12 to Supervalu’s Annual Report on Form 10-K for the year ended February 22, 2003.* | |||||
10.2 | Third Amendment of SUPERVALU INC. Excess Benefits Plan Restatement is incorporated herein by reference to Exhibit 10.37 to Supervalu’s Annual Report on Form 10-K for the year ended February 28, 2009.* | |||||
101
10.3 | SUPERVALU INC. Executive Deferred Compensation Plan, as amended, is incorporated herein by reference to Exhibit 10.14 to Supervalu’s Annual Report on Form 10-K for the year ended February 22, 2003.* | |||||
10.4 | SUPERVALU INC. Executive Deferred Compensation Plan II, as amended, is incorporated herein by reference to Exhibit 10.15 to Supervalu’s Annual Report on Form 10-K for the year ended February 22, 2003.* | |||||
10.5 | Form of Agreement used in connection with Supervalu’s Executive Post Retirement Survivor Benefit Program is incorporated herein by reference to Exhibit (10)I. to Supervalu’s Quarterly Report on Form 10-Q for the quarterly period (12 weeks) ended September 12, 1998.* | |||||
10.6 | SUPERVALU INC. Directors Retirement Program, as amended, is incorporated herein by reference to Exhibit 10.18 to Supervalu’s Annual Report on Form 10-K for the year ended February 22, 2003.* | |||||
10.7 | SUPERVALU INC. Deferred Compensation Plan for Non-Employee Directors, as amended, is incorporated herein by reference to Exhibit 10.11 to Supervalu’s Annual Report on Form 10-K for the year ended February 22, 2003.* | |||||
10.8 | SUPERVALU INC. Non-Employee Directors Deferred Stock Plan, as amended, is incorporated herein by reference to Exhibit 10.24 to Supervalu’s Annual Report on Form 10-K for the year ended February 22, 2003.* | |||||
10.9 | Amended and Restated SUPERVALU INC. Grantor Trust dated as of May 1, 2002 is incorporated herein by reference to Exhibit 10.3 to Supervalu’s Quarterly Report on Form 10-Q for the quarterly period (16 weeks) ended June 15, 2002.* | |||||
10.10 | Annual discretionary CEO Bonus Pool is incorporated herein by reference to Exhibit 10.40 to Supervalu’s Annual Report on Form 10-K for the year ended February 25, 2006.* | |||||
10.11 | Albertson’s, Inc. Executive ASRE Makeup Plan, dated as of September 26, 1999, is incorporated herein by reference to Exhibit 10.3 to Supervalu’s Quarterly Report on Form 10-Q filed with the SEC on October 20, 2010.* | |||||
10.12 | First Amendment to the Albertson’s, Inc. Executive ASRE Makeup Plan, dated as of May 25, 2001, is incorporated herein by reference to Exhibit 10.14.1 to the Annual Report on Form 10-K of Albertson’s, Inc. (Commission File Number 1-6187) for the year ended January 30, 2003.* | |||||
10.13 | Second Amendment to the Albertson’s, Inc. Executive ASRE Makeup Plan, dated as of December 31, 2001, is incorporated herein by reference to Exhibit 10.14.2 to the Annual Report on Form 10-K of Albertson’s, Inc. (Commission File Number 1-6187) for the year ended January 30, 2003.* | |||||
10.14 | Fourth Amendment to the Albertson’s Inc. Executive ASRE Makeup Plan, dated as of April 28, 2006, is incorporated herein by reference to Exhibit 10.14.3 to the Quarterly Report on Form 10-Q of Albertson’s, Inc. (Commission File Number 1-6187) for the quarter ended May 4, 2006.* | |||||
10.15 | SUPERVALU INC. 2007 Stock Plan, as amended, is incorporated herein by reference to Exhibit 10.1 to Supervalu’s Current Report on Form 8-K filed with the SEC on May 31, 2007.* | |||||
10.16 | Form of 2007 Stock Plan Stock Option Agreement and Stock Option Terms and Conditions for Officers is incorporated herein by reference to Exhibit 10.2 to Supervalu’s Current Report on Form 8-K filed with the SEC on April 20, 2010.* | |||||
10.17 | Supervalu Executive Deferred Compensation Plan (2008 Statement) is incorporated herein by reference to Exhibit 10.1 to Supervalu’s Quarterly Report on Form 10-Q for the quarter ended November 29, 2008.* | |||||
10.18 | Form of Change of Control Severance Agreement, as amended, is incorporated herein by reference to Exhibit 10.1 to Supervalu’s Quarterly Report on Form 10-Q for the quarter ended June 20, 2009.* | |||||
10.19 | Form of Change of Control Severance Agreement is incorporated herein by reference to Exhibit 10.1 to Supervalu’s Current Report on Form 8-K filed with the SEC on November 22, 2013.* | |||||
10.20 | Executive & Officer Severance Pay Plan is incorporated herein by reference to Exhibit 10.1 to Supervalu’s Quarterly Report on Form 10-Q for the quarter ended September 12, 2009.* | |||||
10.21 | Amendment No. 1 to Executive and Officer Severance Pay Plan is incorporated by reference to Supervalu’s Annual Report on Form 10-K filed with the SEC on April 19, 2012.* | |||||
102
10.22 | Second Amendment to the SUPERVALU INC. Executive and Officer Severance Pay Plan is incorporated herein by reference to Exhibit 10.2 to Supervalu’s Current Report on Form 8-K filed with the SEC on January 14, 2013.* | |||||
10.23 | Third Amendment to the SUPERVALU INC. Executive and Officer Severance Pay Plan is incorporated herein by reference to Exhibit 10.3 to Supervalu’s Current Report on Form 8-K filed with the SEC on January 14, 2013.* | |||||
10.24 | Summary of Non-Employee Director Compensation is incorporated herein by reference to Supervalu’s Annual Report on Form 10-K filed with the SEC on April 28, 2015.* | |||||
10.25 | SUPERVALU INC. 2012 Stock Plan Form of Stock Option Agreement is incorporated herein by reference to Exhibit 10.2 to Supervalu’s Current Report on Form 8-K filed with the SEC on July 18, 2012.* | |||||
10.26 | SUPERVALU INC. 2012 Stock Plan Form of Stock Option Terms and Conditions (For Employees) is incorporated herein by reference to Exhibit 10.3 to Supervalu’s Current Report on Form 8-K filed with the SEC on July 18, 2012.* | |||||
10.27 | SUPERVALU INC. 2012 Stock Plan Form of Stock Option Agreement and Terms and Conditions (Employees) adopted May 6, 2013 is incorporated herein by reference to Exhibit 10.2 to Supervalu’s Current Report on Form 8-K filed with the SEC on May 8, 2013.* | |||||
10.28 | SUPERVALU INC. 2012 Stock Plan Form of Stock Option Agreement and Terms and Conditions (Directors) adopted May 6, 2013 is incorporated herein by reference to Exhibit 10.3 to Supervalu’s Current Report on Form 8-K filed with the SEC on May 8, 2013.* | |||||
10.29 | SUPERVALU INC. 2012 Stock Plan (As Amended July 20, 2016), is incorporated herein by reference to Exhibit 10.1 to Supervalu’s Current Report on Form 8-K filed with the SEC on July 22, 2016.* | |||||
10.30 | SUPERVALU INC. Directors’ Deferred Compensation Plan (2009 Statement), as amended, is incorporated herein by reference to Exhibit 10.7 to Supervalu’s Current Report on Form 8-K filed with the SEC on July 18, 2012.* | |||||
10.31 | Amended and Restated SUPERVALU INC. Grantor Trust dated as of May 1, 2002 is incorporated herein by reference to Exhibit 10.3 to Supervalu’s Quarterly Report on Form 10-Q for the quarterly period (16 weeks) ended June 15, 2002.* | |||||
10.32 | Trust Agreement Amendment, dated January 9, 2013, by and between SUPERVALU INC. and Wells Fargo Bank Minnesota, N.A., is incorporated herein by reference to Exhibit 10.4 to Supervalu’s Current Report on Form 8-K filed with the SEC on January 14, 2013.* | |||||
10.33 | Form of Retention Agreement, dated as of July 16, 2012, between SUPERVALU INC. and certain key employees, is incorporated herein by reference to Exhibit 10.1 to Supervalu’s Quarterly Report on Form 10-Q filed with the SEC on July 23, 2012.* | |||||
10.34 | Amended and Restated Credit Agreement, dated March 21, 2013, among SUPERVALU INC., as Lead Borrower, the subsidiaries of Supervalu named as borrowers therein, the subsidiaries of Supervalu named as guarantors therein, Wells Fargo Bank, National Association, as Administrative Agent, Swing Line Lender and LC Issuer, certain other lenders party thereto, as LC Issuers, and the lenders party thereto, U.S. Bank, National Association and Rabobank Nederland, New York Branch, as Co-Syndication Agents, Wells Fargo Bank, National Association, as collateral agent, Goldman Sachs Bank USA, Credit Suisse AG, Morgan Stanley Senior Funding, Inc., Barclays Bank PLC and Bank of America, N.A., as Co-Documentation Agents, BMO Harris Bank N.A., RBS Citizens Business Capital, a division of RBS Asset Finance, Inc., Regions Bank and Union Bank, N.A., as Senior Managing Agents, and Wells Fargo Bank, National Association, U.S. Bank, National Association, Goldman Sachs Bank USA, Credit Suisse Securities (USA) LLC, Morgan Stanley Senior Funding, Inc., Barclays Bank PLC, Rabobank Nederland, New York Branch and Merrill Lynch, Pierce, Fenner & Smith Incorporated, as Joint Lead Arrangers and Joint Bookrunners, is incorporated herein by reference to Exhibit 10.3 to Supervalu’s Current Report on Form 8-K filed with the SEC on March 26, 2013.** | |||||
103
10.35 | Term Loan Credit Agreement, dated March 21, 2013, among SUPERVALU INC., as Borrower, the subsidiaries of Supervalu named as guarantors therein, the lenders parties thereto, Goldman Sachs Bank USA, as Administrative Agent and Collateral Agent, Goldman Sachs Bank USA, Credit Suisse Securities (USA) LLC, Morgan Stanley Senior Funding, Inc., Merrill Lynch, Pierce, Fenner & Smith Incorporated and Barclays Bank PLC, as Joint Lead Bookrunners and Joint Lead Arrangers, Credit Suisse Securities (USA) LLC and Morgan Stanley Senior Funding, Inc., as Syndication Agents, and Merrill Lynch, Pierce, Fenner & Smith Incorporated and Barclays Bank PLC, as Documentation Agents, is incorporated herein by reference to Exhibit 10.4 to Supervalu’s Current Report on Form 8-K filed with the SEC on March 26, 2013.** | |||||
10.36 | Amendment Agreement, dated May 16, 2013, among SUPERVALU INC., as Borrower, the subsidiaries of Supervalu named as loan parties therein, Goldman Sachs Bank USA, as Administrative Agent and Collateral Agent, and the lenders parties thereto, is incorporated herein by reference to Exhibit 10.1 to Supervalu’s Current Report on Form 8-K filed with the SEC on May 22, 2013.** | |||||
10.37 | Amendment Agreement, dated January 31, 2014, among SUPERVALU INC., as Borrower, the subsidiaries of Supervalu named as loan parties therein, Goldman Sachs Bank USA, as Administrative Agent and Collateral Agent, and the lenders parties thereto is incorporated herein by reference to Exhibit 10.1 to Supervalu’s Current Report on Form 8-K filed with the SEC on February 4, 2014.** | |||||
10.38 | Third Amendment and Consent Agreement, dated May 20, 2016, to the Second Amended and Restated Term Loan Credit Agreement, dated January 31, 2014, among SUPERVALU INC., as Borrower, the subsidiaries of Supervalu named as Loan Parties therein, Goldman Sachs Bank USA, as Administrative Agent and Collateral Agent, and the lenders party thereto is incorporated herein by reference to Exhibit 10.1 to Supervalu’s Current Report on Form 8-K filed with the SEC on May 23, 2016. | |||||
10.39 | Amendment No. 1 to Amended and Restated Credit Agreement, dated April 17, 2014, among SUPERVALU INC., as Borrower, the subsidiaries of Supervalu named as loan parties therein, Wells Fargo, N.A., as Administrative Agent and Collateral Agent, and the lenders parties thereto, is incorporated by reference to Exhibit 2.1 to Supervalu’s Current Report on Form 8-K filed with the SEC on April 18, 2014.** | |||||
10.40 | Amendment No. 2 to Amended and Restated Credit Agreement, dated September 30, 2014, among SUPERVALU INC., as Lead Borrower, the subsidiaries of Supervalu named as borrowers therein, the subsidiaries of Supervalu named as guarantors therein, Wells Fargo Bank, National Association, as Administrative Agent and Collateral Agent and the lenders parties thereto, is incorporated herein by reference to Exhibit 10.1 to Supervalu’s Current Report on Form 8-K filed with the SEC on October 1, 2014. | |||||
10.41 | Transition Services Agreement, dated as of March 21, 2013, by and between SUPERVALU INC. and Albertson’s LLC, is incorporated herein by reference to Exhibit 10.1 to Supervalu’s Current Report on Form 8-K filed with the SEC on March 26, 2013.** | |||||
10.42 | Transition Services Agreement, dated as of March 21, 2013, by and between SUPERVALU INC. and New Albertson’s, Inc., is incorporated herein by reference to Exhibit 10.2 to Supervalu’s Current Report on Form 8-K filed with the SEC on March 26, 2013.** | |||||
10.43 | Letter Agreement, dated April 16, 2015, to each of the Transition Services Agreement between SUPERVALU INC. and New Albertson’s, Inc. dated March 21, 2013, and the Transition Services Agreement between SUPERVALU INC. and Albertson’s LLC dated March 21, 2013 is incorporated herein by reference to Exhibit 10.1 to Supervalu’s Current Report on Form 8-K filed with the SEC on April 17, 2015. | |||||
10.44 | Letter Agreement, dated August 2, 2012, between SUPERVALU INC. and Wayne C. Sales, is incorporated herein by reference to Exhibit 10.10 to Supervalu’s Quarterly Report on Form 10-Q filed with the SEC on October 19, 2012.* | |||||
10.45 | Letter Agreement Amendment, dated February 3, 2013 between SUPERVALU INC. and Wayne C. Sales, is incorporated herein by reference to Exhibit 10.2 to Supervalu’s Current Report on Form 8-K filed with the SEC on February 4, 2013.* | |||||
10.46 | Letter Agreement, dated January 10, 2013, between SUPERVALU INC. and Sam Duncan, is incorporated herein by reference to Exhibit 10.1 to Supervalu’s Current Report on Form 8-K filed with the SEC on January 14, 2013.* | |||||
10.47 | Letter Agreement Amendment, dated February 3, 2013 between SUPERVALU INC. and Sam K. Duncan, is incorporated herein by reference to Exhibit 10.1 to Supervalu’s Current Report on Form 8-K filed with the SEC on February 4, 2013.* | |||||
104
10.48 | Letter Agreement, dated May 7, 2013, between SUPERVALU INC. and Sherry M. Smith is incorporated herein by reference to Exhibit 10.11 to Supervalu’s Quarterly Report on Form 10-Q for the quarterly period (16 weeks) ended June 15, 2013 filed with the SEC on July 24, 2013.* | |||||
10.49 | Letter Agreement, dated July 23, 2013, between SUPERVALU INC. and Bruce H. Besanko is incorporated by reference herein to Exhibit 10.1 to Supervalu’s Current Report on Form 8-K filed with the SEC on July 24, 2013.* | |||||
10.50 | SUPERVALU INC. 2012 Stock Plan Form of Stock Option Agreement is incorporated herein by reference to Exhibit 10.1 to Supervalu’s Quarterly Report on Form 10-Q filed with the SEC on July 24, 2014.* | |||||
10.51 | SUPERVALU INC. 2012 Stock Plan Form of Restricted Stock Award Agreement, is incorporated herein by reference to Exhibit 10.2 to Supervalu’s Quarterly Report on Form 10-Q filed with the SEC on July 24, 2014.* | |||||
10.52 | SUPERVALU INC. 2012 Stock Plan Form of Restricted Stock Unit Award Agreement (Stock-Settled), is incorporated herein by reference to Exhibit 10.3 to Supervalu’s Quarterly Report on Form 10-Q filed with the SEC on July 24, 2014.* | |||||
10.53 | SUPERVALU INC. 2012 Stock Plan Form of Restricted Stock Unit Award Agreement and Restricted Stock Unit Award Terms and Conditions for Employees (Cash-Settled) is incorporated herein by reference to Supervalu’s Annual Report on Form 10-K filed with the SEC on April 28, 2015.* | |||||
10.54 | SUPERVALU INC. 2012 Stock Plan Form of Stock Option Agreement is incorporated herein by reference to Exhibit 10.1 to Supervalu’s Quarterly Report on Form 10-Q filed with the SEC on July 28, 2015.* | |||||
10.55 | SUPERVALU INC. 2012 Stock Plan Form of Restricted Stock Award Agreement is incorporated herein by reference to Exhibit 10.2 to Supervalu’s Quarterly Report on Form 10-Q filed with the SEC on July 28, 2015.* | |||||
10.56 | SUPERVALU INC. 2012 Stock Plan Form of Restricted Stock Unit Award Agreement (Stock-Settled) is incorporated herein by reference to Exhibit 10.3 to Supervalu’s Quarterly Report on Form 10-Q filed with the SEC on July 28, 2015.* | |||||
10.57 | SUPERVALU INC. 2012 Stock Plan Revised Form of Performance Share Unit Award Agreement is incorporated herein by reference to Exhibit 10.4 to Supervalu’s Quarterly Report on Form 10-Q for the quarter ended June 18, 2016 filed with the SEC on July 27, 2016.* | |||||
10.58 | Letter Agreement, dated December 2, 2015, between SUPERVALU INC. and Eric Claus is incorporated herein by reference to Supervalu’s Quarterly Report on Form 10-Q filed with the SEC on January 13, 2016.* | |||||
10.59 | Letter Agreement Amendment, dated May 27, 2016 between SUPERVALU INC. and Eric Claus is incorporated herein by reference to Exhibit 10.7 to Supervalu’s Quarterly Report on Form 10-Q for the quarter ended June 18, 2016 filed with the SEC on July 27, 2016.* | |||||
10.60 | Letter Agreement, dated February 2, 2016, between SUPERVALU INC. and Mark Gross is incorporated herein by reference to Exhibit 10.1 to Supervalu’s Current Report on Form 8-K filed with the SEC on February 3, 2016.* | |||||
10.61 | Letter Agreement Amendment, dated July 25, 2016 between SUPERVALU INC. and Mark Gross is incorporated herein by reference to Exhibit 10.6 to Supervalu’s Quarterly Report on Form 10-Q for the quarter ended June 18, 2016 filed with the SEC on July 27, 2016.* | |||||
10.62 | Letter Agreement, dated January 31, 2014, between SUPERVALU INC. and Susan Grafton is incorporated herein by reference to Exhibit 10.76 to Supervalu’s Annual Report on Form 10-K for the fiscal year ended February 27, 2016 filed with the SEC on April 26, 2016.* | |||||
10.63 | Aircraft Time Sharing Agreement, dated March 8, 2016, between SUPERVALU INC. and Mark Gross is incorporated herein by reference to Exhibit 10.1 to Supervalu’s Current Report on Form 8-K filed with the SEC on March 10, 2016. | |||||
10.64 | Amendment No. 3 to Amended and Restated Credit Agreement, dated February 3, 2016, among SUPERVALU INC., as Lead Borrower, the subsidiaries of Supervalu named as borrowers therein, the subsidiaries of Supervalu named as guarantors therein, Wells Fargo Bank, National Association, as Administrative Agent and Collateral Agent and the lenders parties thereto is incorporated herein by reference to Exhibit 10.1 to Supervalu’s Current Report on Form 8-K filed with the SEC on February 4, 2016. ** | |||||
105
10.65 | Services Agreement, dated as of December 5, 2016, between SUPERVALU INC. and Moran Foods, LLC is incorporated herein by reference to Exhibit 10.1 to Supervalu’s Current Report on Form 8-K filed with the SEC on December 9, 2016. ** | |||||
(12) | Statements re computation of ratios. | |||||
12.1 | Ratio of Earnings to Fixed Charges. | |||||
(21) | Subsidiaries of Supervalu. | |||||
21.1. | SUPERVALU INC. Subsidiaries. | |||||
(23) | Consents of Experts and Counsel. | |||||
23.1. | Consent of KPMG LLP. | |||||
(24) | Power of Attorney. | |||||
24.1. | Power of Attorney. | |||||
(31) | Rule 13a-14(a)/15d-14(a) Certifications. | |||||
31.1. | Chief Executive Officer Certification of Periodic Financial Report pursuant to Section 302 of the Sarbanes-Oxley Act of 2002. | |||||
31.2. | Chief Financial Officer Certification of Periodic Financial Report pursuant to Section 302 of the Sarbanes-Oxley Act of 2002. | |||||
(32) | Section 1350 Certifications. | |||||
32.1. | Chief Executive Officer Certification of Periodic Financial Report pursuant to Section 906 of the Sarbanes-Oxley Act of 2002. | |||||
32.2. | Chief Financial Officer Certification of Periodic Financial Report pursuant to Section 906 of the Sarbanes-Oxley Act of 2002. | |||||
(101) | Interactive Data File. | |||||
101. | The following materials from the SUPERVALU INC. Annual Report on Form 10-K for the fiscal year ended February 25, 2017 formatted in Extensible Business Reporting Language (XBRL): (i) the Consolidated Segment Financial Information (ii) the Consolidated Statements of Operations, (iii) the Consolidated Statements of Comprehensive Income, (iv) the Consolidated Balance Sheets, (v) the Consolidated Statements of Stockholders’ Equity (Deficit), (vi) the Consolidated Statements of Cash Flows and (vii) the Notes to Consolidated Financial Statements. | |||||
* | Indicates management contracts, compensatory plans or arrangements required to be filed pursuant to Item 601(b)(10)(iii)(A) of Regulation S-K. |
** | Pursuant to Rule 24b-2 of the Securities Exchange Act of 1934, as amended, confidential portions of this exhibit have been deleted and filed separately with the SEC pursuant to a request for confidential treatment. |
106
SIGNATURES
Pursuant to the requirements of Section 13 or 15(d) of the Securities Exchange Act of 1934, SUPERVALU INC. has duly caused this Annual Report on Form 10-K to be signed on its behalf by the undersigned, thereunto duly authorized.
SUPERVALU INC. | |||
(Registrant) | |||
Dated: April 25, 2017 | By: | /S/ MARK GROSS | |
Mark Gross | |||
Chief Executive Officer and President | |||
Pursuant to the requirements of the Securities Exchange Act of 1934, this Annual Report on Form 10-K has been signed below by the following persons on behalf of SUPERVALU INC. and in the capacities and on the dates indicated:
Signature | Title | Date | ||
/S/ MARK GROSS | President and Chief Executive Officer and Director | April 25, 2017 | ||
Mark Gross | (Principal Executive Officer) | |||
/S/ BRUCE H. BESANKO | Executive Vice President, Chief Operating Officer and Chief Financial Officer | April 25, 2017 | ||
Bruce H. Besanko | (Principal Financial Officer) | |||
/S/ SUSAN S. GRAFTON | Senior Vice President, Finance, and Chief Accounting Officer | April 25, 2017 | ||
Susan S. Grafton | (Principal Accounting Officer) | |||
/S/ DONALD R. CHAPPEL* | Director | |||
Donald R. Chappel | ||||
/S/ IRWIN S. COHEN* | Director | |||
Irwin S. Cohen | ||||
/S/ PHILIP L. FRANCIS* | Director | |||
Philip L. Francis | ||||
/S/ ERIC G. JOHNSON* | Director | |||
Eric G. Johnson | ||||
/S/ MATHEW M. PENDO* | Director | |||
Mathew M. Pendo | ||||
/S/ FRANCESCA RUIZ DE LUZURIAGA* | Director | |||
Francesca Ruiz de Luzuriaga | ||||
/S/ WAYNE C. SALES* | Director | |||
Wayne C. Sales | ||||
/S/ FRANK A. SAVAGE* | Director | |||
Frank A. Savage | ||||
/S/ GERALD L. STORCH* | Director and Non-Executive Chairman | |||
Gerald L. Storch | ||||
/S/ MARY A. WINSTON* | Director | |||
Mary A. Winston | ||||
* | Executed this 25th day of April 2017, on behalf of the indicated Directors by Karla C. Robertson, duly appointed Attorney-in-Fact. |
By: | /S/ KARLA C. ROBERTSON | |
Karla C. Robertson | ||
Attorney-in-Fact | ||
107