Attached files
| file | filename |
|---|---|
| EX-12.1 - EX 12.1 - SUPERVALU INC | f16form10-kex121.htm |
| EX-31.2 - EX 31.2 - SUPERVALU INC | f16form10-kex312.htm |
| EX-23.1 - EX 23.1 - SUPERVALU INC | f16form10-kex231.htm |
| EX-31.1 - EX 31.1 - SUPERVALU INC | f16form10-kex311.htm |
| EX-24.1 - EX 24.1 - SUPERVALU INC | f16form10-kex241.htm |
| EX-32.1 - EX 32.1 - SUPERVALU INC | f16form10-kex321.htm |
| EX-32.2 - EX 32.2 - SUPERVALU INC | f16form10-kex322.htm |
| EX-21.1 - EX 21.1 - SUPERVALU INC | f16form10-kex211.htm |
| EX-10.76 - EXHIBIT 10.76 - SUPERVALU INC | f16form10-kex1076.htm |
UNITED STATES
SECURITIES AND EXCHANGE COMMISSION
Washington, D.C. 20549
FORM 10-K
(Mark One)
ý | ANNUAL REPORT PURSUANT TO SECTION 13 OR 15(d) OF THE SECURITIES EXCHANGE ACT OF 1934 |
For the fiscal year ended February 27, 2016
OR
¨ | TRANSITION REPORT PURSUANT TO SECTION 13 OR 15(d) OF THE SECURITIES EXCHANGE ACT OF 1934 |
For the transition period from to .
Commission file number: 1-5418

SUPERVALU INC.
(Exact name of registrant as specified in its charter)
DELAWARE | 41-0617000 | |
(State or other jurisdiction of incorporation or organization) | (I.R.S. Employer Identification No.) | |
11840 VALLEY VIEW ROAD EDEN PRAIRIE, MINNESOTA | 55344 | |
(Address of principal executive offices) | (Zip Code) | |
Registrant’s telephone number, including area code: (952) 828-4000
Securities registered pursuant to Section 12(b) of the Act:
Title of each class | Name of each exchange on which registered | |
Common Stock, par value $0.01 per share | New York Stock Exchange | |
Securities registered pursuant to Section 12(g) of the Act: None
Indicate by check mark if the registrant is a well-known seasoned issuer, as defined in Rule 405 of the Securities Act. Yes ý No ¨
Indicate by check mark if the registrant is not required to file reports pursuant to Section 13 or Section 15(d) of the Act. Yes ¨ No ý
Indicate by check mark whether the registrant (1) has filed all reports required to be filed by Section 13 or 15(d) of the Securities Exchange Act of 1934 during the preceding 12 months (or for such shorter period that the registrant was required to file such reports), and (2) has been subject to such filing requirements for the past 90 days. Yes ý No ¨
Indicate by check mark whether the registrant has submitted electronically and posted on its corporate Web site, if any, every Interactive Data File required to be submitted and posted pursuant to Rule 405 of Regulation S-T (§232.405 of this chapter) during the preceding 12 months (or for such shorter period that the registrant was required to submit and post such files). Yes ý No ¨
Indicate by check mark if disclosure of delinquent filers pursuant to Item 405 of Regulation S-K (§229.405 of this chapter) is not contained herein, and will not be contained, to the best of registrant’s knowledge, in definitive proxy or information statements incorporated by reference in Part III of this Form 10-K or any amendment to this Form 10-K. ý
Indicate by check mark whether the registrant is a large accelerated filer, an accelerated filer, a non-accelerated filer, or a smaller reporting company. See definitions of “large accelerated filer,” “accelerated filer” and “smaller reporting company” in Rule 12b-2 of the Exchange Act.
Large accelerated filer x | Accelerated filer ¨ | Non-accelerated filer ¨ | Smaller reporting company ¨ | |||
Indicate by check mark if the registrant is a shell company (as defined in Rule 12b-2 of the Exchange Act). Yes ¨ No ý
The aggregate market value of the voting and non-voting stock held by non-affiliates of the registrant as of September 11, 2015 was approximately $2,062,978,553 (based upon the closing price of registrant’s Common Stock on the New York Stock Exchange).
As of April 22, 2016, there were 265,635,564 shares of the registrant’s common stock outstanding.
DOCUMENTS INCORPORATED BY REFERENCE
Portions of registrant’s definitive Proxy Statement filed for the registrant’s 2016 Annual Meeting of Stockholders are incorporated by reference into Part III, as specifically set forth in Part III.
SUPERVALU INC.
Annual Report on Form 10-K
TABLE OF CONTENTS
Item | Page | |
1. | ||
1A. | ||
1B. | ||
2. | ||
3. | ||
4. | ||
5. | ||
6. | ||
7. | ||
7A. | ||
8. | ||
9. | ||
9A. | ||
9B. | ||
10. | ||
11. | ||
12. | ||
13. | ||
14. | ||
15. | ||
2
CAUTIONARY STATEMENTS FOR PURPOSES OF THE SAFE HARBOR PROVISIONS OF THE SECURITIES LITIGATION REFORM ACT
Any statements contained in this Annual Report on Form 10-K regarding the outlook for the Company’s businesses and their respective markets, such as projections of future performance, guidance, statements of the Company’s plans and objectives, forecasts of market trends and other matters, are forward-looking statements based on the Company’s assumptions and beliefs. Such statements may be identified by such words or phrases as “will likely result,” “are expected to,” “will continue,” “may continue,” “outlook,” “is anticipated,” “estimate,” “project,” “believes,” “intends” or similar expressions. These forward-looking statements are subject to certain risks and uncertainties that could cause actual results to differ materially from those discussed in such statements and no assurance can be given that the results in any forward-looking statement will be achieved. For these statements, SUPERVALU INC. claims the protection of the safe harbor for forward-looking statements contained in the Private Securities Litigation Reform Act of 1995. Any forward-looking statement speaks only as of the date on which it is made, and we disclaim any obligation to subsequently revise any forward-looking statement to reflect events or circumstances after such date or to reflect the occurrence of anticipated or unanticipated events.
Certain factors could cause the Company’s future results to differ materially from those expressed or implied in any forward-looking statements contained in this Annual Report on Form 10-K. These factors include the factors discussed in Part I, Item 1A of this Annual Report on Form 10-K under the heading “Risk Factors,” the factors discussed below and any other cautionary statements, written or oral, which may be made or referred to in connection with any such forward-looking statements. Since it is not possible to foresee all such factors, these factors should not be considered as complete or exhaustive.
Competition and Execution of Operations
• | The Company’s ability to attract and retain customers, and the success of the Company’s independent retail customers and licensees and their ability to maintain and grow sales |
• | Increased competition resulting from consolidation in the grocery industry, and the Company’s ability to effectively respond |
• | Competition from other food or drug retail chains, supercenters, hard discount, dollar stores, online retailers, non-traditional competitors and alternative formats in the Company’s markets |
• | Customer reaction to the increased presence of competitors, including non-traditional competitors, in the Company’s markets |
• | Competition for employees, store sites and products |
• | The ability of the Company’s Wholesale business to maintain or increase sales and profitability due to wholesaler competition, increased competition faced by customers and increased customer self-distribution |
• | The Company's ability to maintain or improve levels of identical store sales and operating margins |
• | Changes in economic conditions or consumer preferences that affect consumer spending or buying habits |
• | The success of the Company’s promotional and sales programs and the Company’s ability to respond to the promotional and pricing practices of competitors |
• | The Company's ability to keep pace with changing customer expectations and new developments and technology investments by competitors |
Execution of Initiatives
• | The Company’s ability to identify and effectively execute on performance improvement and customer service initiatives |
• | The Company’s ability to offer competitive products and services at low prices and maintain high levels of productivity and efficiency |
• | The ability to grow by driving sales, attracting new customers and new licensees and successfully opening new locations |
• | The ability to successfully execute on initiatives involving acquisitions or dispositions |
• | The Company’s ability to continue to become a more cost-efficient organization |
• | The Company’s ability to respond appropriately to competitors’ initiatives |
• | The Company’s ability to execute on its exploration process for a separation of Save-A-Lot and, to the extent any transaction or other change in the Company’s overall structure or business model is ultimately completed, to deliver anticipated benefits and enhanced shareholder value |
Substantial Indebtedness
• | The impact of the Company’s substantial indebtedness, including the restrictive operating covenants in the underlying debt instruments, on its business and financial flexibility |
• | The Company’s ability to comply with debt covenants or to refinance or amend the Company’s debt obligations |
• | A downgrade in the Company’s debt ratings, which may increase the cost of borrowing or adversely affect the Company’s ability to access one or more financial markets |
• | The availability of favorable credit and trade terms |
3
Increased Employee Benefit Costs and Labor Relations
• | Increased operating costs resulting from rising employee benefit costs |
• | Potential increases in health plan costs resulting from health care reform |
• | Pension funding obligations related to current and former employees of the Company and the Company’s divested operations |
• | Required funding of multiemployer pension plans and any withdrawal liability |
• | The effect of the financial condition of the Company’s pension plans on the Company’s debt ratings |
• | The Company’s ability to renegotiate labor agreements with its unions |
• | Resolution of issues associated with rising pension, healthcare and employee benefit costs |
• | Potential for work disruption from labor disputes |
Wind Down of Relationships with Albertson’s LLC, New Albertson’s, Inc. (“NAI”) and Haggen
• | Ability to effectively manage the Company’s cost structure and identify new revenue opportunities as each of the Transition Services Agreement with each of Albertson’s LLC and NAI (collectively, the “TSA”) and the Transition Services Agreement with Haggen (the “Haggen TSA”) wind down |
• | Ability to provide services and transition and wind down services to NAI and Albertson’s LLC under the TSA and the letter agreement regarding the transition and wind down of the TSA, as well as the wind down of the Haggen TSA, in an efficient manner that is not disruptive to the Company, while eliminating costs directly and not directly tied to providing these services |
• | Ability to attract and retain qualified personnel to perform services under the TSA |
• | The effect of the information technology intrusions that also impacted Albertson’s LLC and NAI |
• | Impact of the Albertson's acquisition of Safeway on the Company's operating agreement under which the Company operates a distribution center owned by NAI that services both NAI and certain of the Company's independent retail customers |
Intrusions to and Disruptions of Information Technology Systems
• | Dependence of the Company’s businesses on computer hardware and software systems that are vulnerable to technical malfunction or security breach by computer hackers and cyber terrorists |
• | Risk of misappropriation of sensitive data, including customer and employee data, as a result of the information technology intrusions or any future cyber-attack or breach and potential related claims |
• | Costs of responding to inquiries, claims or enforcement actions in connection with the information technology intrusions or any future attack or breach resulting in fees and penalties, the loss, damage or misappropriation of information, and potential related damage to the Company’s reputation |
• | Inability to timely obtain future PCI DSS report on compliance that could result in fines or assessments |
• | Costs of complying with stricter privacy and information security laws |
• | Ability of the information technology systems of the Company or its vendors to operate properly and to prevent, contain or detect cyber-attacks or security breaches |
• | Difficulties in developing, maintaining or upgrading information technology systems |
• | Major disasters, business disruptions or losses resulting from failure of these systems to perform as anticipated for any reason or data theft, information espionage, or other criminal activity directed at the Company’s computer or communications systems |
• | Inability to keep pace with changing customer expectations and new developments and technology investments by the Company’s competitors, including relating to the increase in information sharing and multichannel retailing |
Economic Conditions
• | Worsening economic conditions, consumer confidence or unemployment rates, each of which affect consumer spending or buying habits |
• | Increases in unemployment, insurance, healthcare or energy costs and changes in commodity prices, which could impact consumer spending or buying habits and the cost of doing business |
• | Increases in interest rates, labor costs and tax rates, and other changes in applicable law |
• | Food and drug inflation or deflation |
• | The Company's ability to address the compression of pharmacy gross margins |
Governmental Regulation
• | Costs of compliance with existing laws and regulations and changes in applicable laws and regulations that impose additional requirements or restrictions on the operation of the Company’s businesses |
• | The ability to timely obtain permits, comply with government regulations or make capital expenditures required to maintain compliance with government regulations, including those governing ethical, anti-bribery and similar business practices |
4
• | Potential costs of compliance with additional foreign laws and regulations if the Company seeks and attains a larger international footprint |
• | Potential costs of compliance with environmental laws and regulations, including relating to disposal of hazardous waste and any required removal or remediation of contamination at current or former locations |
Food and Drug Safety
• | Events that give rise to actual or potential food contamination, drug contamination or foodborne illness or injury or any adverse publicity relating to these types of concerns, whether valid or not |
• | Potential recall costs and product liability claims or claims that the Company's products are not of the quality or composition claimed |
Legal Proceedings
• | Unfavorable outcomes and the costs to defend litigation, governmental or administrative proceedings or other disputes, including those related to the information technology intrusions experienced by the Company |
• | Adverse publicity related to such unfavorable outcomes |
• | Risks related to infringement of the Company's intellectual property rights |
Severe Weather, Natural Disasters and Adverse Climate Changes
• | Property damage or business disruption resulting from severe weather conditions and natural disasters that affect the Company and the Company’s customers or suppliers |
• | Unseasonably adverse climate conditions that impact the availability or cost of certain products in the grocery supply chain |
Disruption to Supply Chain and Distribution Network
• | The Company’s ability to effectively maintain its supply chain and distribution network without interruption |
• | Disruptions due to weather, product recalls, crop conditions, regulatory actions, supplier instability, transportation interruptions, labor supply or vendor disputes |
Changes in Military Business
• | Competition in the Company’s military business |
• | Changes in the commissary system or operating model, reductions in government expenditures or funding, or changes in military staffing levels or the locations of bases |
Adequacy of Insurance
• | Variability in actuarial projections regarding workers’ compensation liability and associated medical costs and automobile and general liability |
• | Potential increase in the number or severity of claims for which the Company is self-insured |
• | Adequacy of cybersecurity insurance maintained by the Company to offset any losses or damages related to the information technology intrusions and any future intrusions experienced by the Company |
Volatility in Fuel and Energy Costs
• | Availability and cost of energy and fuel to store and transport products |
• | Volatility of fuel, energy and natural gas prices |
• | Risks associated with possession of compressed natural gas equipment and a fueling station |
Asset Impairment Charges
• | Unfavorable changes in the Company’s industry, the broader economy, market conditions, business operations, competition or the Company’s stock price and market capitalization that could require impairment to intangible assets, including goodwill, and tangible assets, including property, plant and equipment |
Stock Price Volatility
• | Fluctuations in the Company’s stock price related to actual or perceived operating performance, any of the factors listed above or general stock market fluctuations |
5
PART I
ITEM 1. BUSINESS
Unless otherwise indicated, all references to the “Company,” “we,” “us,” “our” and “Supervalu” in this Annual Report on Form 10-K relate to SUPERVALU INC. and its wholly and majority-owned subsidiaries. All dollar and share amounts in this Annual Report on Form 10-K are in millions, except per share data and where otherwise noted.
Business Overview
SUPERVALU INC., a Delaware corporation, was organized in 1925 as the successor to two wholesale grocery firms established in the 1870s. Supervalu today is one of the largest public company grocery wholesale distributors to independent retail customers across the United States through its Wholesale segment, one of the nation’s largest hard discount grocery retailers by store count through its Save-A-Lot segment and operates five regionally-based traditional format grocery banners through its Retail segment. Substantially all of the Company's operations are domestic.
Distribution operations are leveraged by providing wholesale distribution and logistics service solutions to independent retail customers and Save-A-Lot licensee customers, as well as wholesale distribution to the Company's Retail and Save-A-Lot corporate stores.
The Company’s business is classified by management into three reportable segments: Wholesale (formerly referred to as Independent Business), Save-A-Lot and Retail (formerly referred to as Retail Food). These reportable segments are three distinct businesses. The Wholesale reportable segment derives revenues from wholesale distribution and logistics and professional service solutions to independently-owned retail stores and other customers (collectively referred to as “independent retail customers”). The Save-A-Lot reportable segment derives revenues from the sale of groceries and other products at retail locations operated by the Company and from stores licensed to licensees to which the Company provides wholesale distribution. The Retail reportable segment derives revenues from the sale of groceries and other products at retail locations operated by the Company.
Supervalu's fiscal year ends on the last Saturday of February. This resulted in a fiscal 2016 52-week year ended February 27, 2016, a fiscal 2015 53-week year ended February 28, 2015 and a fiscal 2014 52-week year ended February 22, 2014.
On March 21, 2013, the Company completed the sale (the “NAI Banner Sale”) of New Albertson’s, Inc. (“NAI”) to AB Acquisition LLC (“AB Acquisition”). The NAI Banner Sale was completed through a Stock Purchase Agreement (the “Stock Purchase Agreement”) providing for a sale of NAI stock by Supervalu to AB Acquisition. Results of operations of NAI are reported as discontinued operations for all periods presented.
Wholesale
The Company’s Wholesale segment primarily provides wholesale distribution of products to independent retail customers and is the largest public company grocery wholesaler in the United States. Wholesale is organized and operated by its management through two geographic regions: East and West.
The Company’s Wholesale network spans 40 states and serves as primary grocery supplier to approximately 1,796 stores of independent retail customers, in addition to the Company’s own Retail stores, as well as serving as secondary grocery supplier to approximately 232 stores of independent retail customers. The Company’s independent retail customers include single and multiple grocery store independent operators, regional chains and the military.
The Company has established a network of strategically located distribution centers utilizing a multi-tiered logistics system. The network includes facilities that carry slow turn or fast turn groceries, perishables, general merchandise and home, health and beauty care products. The network is comprised of 18 distribution facilities, ten of which supply the Company’s own Retail stores in addition to stores of independent retail customers. Wholesale distribution sales to Retail stores are eliminated within the Wholesale segment in the Company's financial statements. Deliveries to retail stores are made from the Company’s distribution centers by Company-owned trucks, third-party independent trucking companies or customer-owned trucks.
The Company offers independent retail customers a wide variety of food and non-food products, including national and regional brands, and the Company’s own lines of private label products. The Company has also developed a broad line of professional services through which independent retail customers can access solutions that are both cost-effective and scalable. These professional and facilitative services include pass-through programs in which vendors provide services directly to independent retail customers, as well as services and solutions developed and scaled by the Company. Services offered by the Company include advertising, accounting, retail pricing and more. These services continue to be augmented with new offerings, such as digital couponing, data mining and point-of-sale system solutions.
6
As a logistics provider, efficiency is an important customer service measure. The Company optimizes its facilities to implement leading warehouse technology, ranging from radio-frequency devices guiding selectors to facilities with complete automated order selection for dry groceries that help the Company deliver aisle-ready pallets to independent retail customers. The Wholesale segment also focuses on improving its supply chain to be as labor- and cost-efficient as possible.
Save-A-Lot
Save-A-Lot is one of the largest hard discount grocery retailers by store count in the United States. Save-A-Lot provides a specific and edited assortment of high volume, conveniently sized and low-priced items selected to fit its target customer's needs. A typical Save-A-Lot corporate store is approximately 17,000 gross square feet in size (with approximately 11,000 square feet of retail selling space on average) and carries approximately 3,000 core stock-keeping units ("SKUs"). Most Save-A-Lot stores are located in the southern and eastern geography of the United States. Save-A-Lot's private-label program provides budget conscious customers a high-quality, low-priced alternative to national brands and accounts for approximately 60 percent and 55 percent of corporate stores and licensee store retail sales (excluding fresh meat and produce), respectively.
The Company conducts its Save-A-Lot operations through a total of 1,360 stores under the Save-A-Lot banner, including 897 licensed Save-A-Lot stores and 463 Company-operated stores. The Company expects to open approximately 75 new corporate and licensee stores on a gross basis during fiscal 2017, including in existing and new geographic markets.
The Company's Save-A-Lot network spans 37 states, along with the Caribbean and Central America, and is the primary grocery supplier to its licensed stores. The Company's licensees operate under the Save-A-Lot name and are provided access to Save-A-Lot's private-label brands, store programs, operating standards and supervisory support. Licensee operators are obligated to purchase their inventory from the Company with some exceptions. Save-A-Lot's 17 dedicated distribution centers provide distribution to the Company’s own stores and licensed Save-A-Lot stores. Distribution sales to Save-A-Lot corporate-operated stores are eliminated within the Save-A-Lot segment.
On July 28, 2015, the Company announced that it is exploring a separation of its Save-A-Lot segment, and as part of that process it had begun preparations to allow for a possible spin-off of Save-A-Lot into a stand-alone, publicly traded company. On January 7, 2016, Save-A-Lot, Inc. filed a Form 10 with the Securities and Exchange Commission (the “SEC”) as part of the potential separation from the Company. No specific timetable for a separation has been set and there can be no assurance that a separation will be completed or that any other change in the Company’s overall structure or business model will occur.
Retail
The Company conducts its Retail operations through a total of 200 stores primarily organized under five regionally-based retail banners of Cub Foods, Shoppers Food & Pharmacy, Shop 'n Save, Farm Fresh and Hornbacher’s, plus two Rainbow and two County Market stores. Retail stores provide an extensive grocery offering and, depending on size, a variety of additional products, including general merchandise, home, health and beauty care, and pharmacy, including national and regional brands, and the Company’s own private label products. A typical Retail store carries approximately 14,000 to 21,000 core SKUs, depending on the retail banner, and ranges in size from approximately 40,000 to 60,000 square feet, again varying by banner.
The Company’s Retail operations are supplied by one dedicated distribution center and nine distribution centers that are part of the Wholesale segment providing wholesale distribution to both the Company’s own stores and stores of independent retail customers.
All of the Company's five primary retail banners have strong local and regional brand recognition in the markets in which they operate. The Company's 51 wholly and majority owned Cub Foods stores and two Rainbow stores operate primarily in the Minneapolis / St. Paul market; the Company's 54 Shoppers Food & Pharmacy stores operate in the Washington D.C. / Baltimore market; the Company's 42 Shop 'n Save stores operate in the St. Louis market; the Company's 41 Farm Fresh stores operate in the Virginia Beach, Virginia market; the Company's eight Hornbacher's stores operate primarily in the Fargo, North Dakota market; and the Company's two County Market stores operate in the Seattle market. In addition, the Company franchises 30 Cub Foods stores in which the Company has no ownership interest or a minority ownership interest, primarily in the Minneapolis / St. Paul market.
7
Products
The Company offers a wide variety of nationally advertised brand name and private-label products, including grocery (both perishable and nonperishable), general merchandise and home, health and beauty care, and pharmacy, which are sold through Company-operated and licensed Retail and Save-A-Lot stores to shoppers and through its Wholesale segment to independent retail customers. The Company believes that it has adequate and alternative sources of supply for most of its purchased products. The Company’s Net sales primarily include the product sales of the Company’s own retail stores, wholesale product sales to stores licensed by the Company and product sales of the Company’s Wholesale segment to independent retail customers.
The following table provides additional detail on the amounts and percentages of Net sales for each group of similar products sold in the Wholesale, Save-A-Lot and Retail segments, and service agreement revenue discussed in "—Transition Services Agreements" in Corporate:
2016 (52 weeks) | 2015 (53 weeks) | 2014 (52 weeks) | ||||||||||||||||||
Wholesale: | ||||||||||||||||||||
Nonperishable grocery products(1) | $ | 5,753 | 33 | % | $ | 5,939 | 33 | % | $ | 6,000 | 35 | % | ||||||||
Perishable grocery products(2) | 2,025 | 12 | 2,099 | 12 | 1,951 | 11 | ||||||||||||||
Services to independent retail customers and other | 157 | 1 | 160 | 1 | 151 | 1 | ||||||||||||||
7,935 | 45 | % | 8,198 | 46 | % | 8,102 | 47 | % | ||||||||||||
Save-A-Lot: | ||||||||||||||||||||
Nonperishable grocery products(1) | $ | 2,956 | 17 | % | $ | 2,989 | 17 | % | $ | 2,823 | 17 | % | ||||||||
Perishable grocery products(2) | 1,597 | 9 | 1,587 | 9 | 1,373 | 8 | ||||||||||||||
Services to licensees and other | 70 | — | 65 | — | 59 | — | ||||||||||||||
4,623 | 26 | % | 4,641 | 26 | % | 4,255 | 25 | % | ||||||||||||
Retail: | ||||||||||||||||||||
Nonperishable grocery products(1) | $ | 2,607 | 15 | % | $ | 2,677 | 15 | % | $ | 2,600 | 15 | % | ||||||||
Perishable grocery products(2) | 1,549 | 9 | 1,574 | 9 | 1,463 | 9 | ||||||||||||||
Pharmacy products | 511 | 3 | 510 | 3 | 491 | 3 | ||||||||||||||
Fuel | 67 | — | 83 | — | 67 | — | ||||||||||||||
Other | 35 | — | 40 | — | 34 | — | ||||||||||||||
4,769 | 27 | % | 4,884 | 27 | % | 4,655 | 27 | % | ||||||||||||
Corporate: | ||||||||||||||||||||
Transition services revenue | $ | 202 | 1 | % | $ | 194 | 1 | % | $ | 240 | 1 | % | ||||||||
Net sales | $ | 17,529 | 100 | % | $ | 17,917 | 100 | % | $ | 17,252 | 100 | % | ||||||||
(1) | Includes such items as dry goods, dairy, frozen foods, beverages, general merchandise, home, health and beauty care and candy |
(2) | Includes such items as meat, produce, deli and bakery |
Private-Label Products
The Company’s private-label products are produced to the Company’s specification by many suppliers and compete in most areas of the Company’s stores. Private-label products include: the premium brands Culinary Circle® and Stockman & Dakota®, which offer unique, premium quality products in highly competitive categories; Wild Harvest®, which is free from over 100 undesirable ingredients; core brands Essential Everyday®, EQUALINE®, and category-specific brands Arctic Shores Seafood Company®, Baby Basics®, Farm Stand®, Stone Ridge Creamery® and Super Chill®, which provide shoppers quality national brand equivalent products at a competitive price; and the value brand Shopper’s Value®, which offers budget conscious consumers a quality alternative to national brands at substantial savings. Additionally, Save-A-Lot's private label products include Coburn Farms®, Fairgrounds®, Ginger Evans®, J. Higgs®, Wylwood®, Tio Santi™, and Save-A-Lot's newest private label brand, America's Choice®.
8
Trademarks
The Company offers independent retail customers the opportunity to franchise a concept or license a service mark and Save-A-Lot licensees license the Save-A-Lot name. Save-A-Lot's licensee distribution business is not a franchise arrangement and does not charge a royalty fee for the use of the Save-A-Lot name that it provides to its licensees. These programs help these customers and licensees compete by providing, as part of the franchise or license program, a complete business concept, group advertising, private-label products and other benefits. The Company is the franchisor or licensor of certain service marks such as SAVE-A-LOT, CUB FOODS, FESTIVAL FOODS, SENTRY, COUNTY MARKET, SHOP 'N SAVE, NEWMARKET, FOODLAND, JUBILEE and SUPERVALU. In conjunction with its licensing and franchise arrangements, the Company maintains wholesale distribution agreements with its licensees and franchisees, primarily under the Save-A-Lot, Cub Foods, Festival Foods and Sentry banners.
The Company has a trademark license agreement with Albertson's LLC for the use of trademarks, such as ALBERTSONS, JEWEL-OSCO, SHAW’S, ACME MARKETS, SAV-ON and LUCKY. In conjunction with the NAI Banner Sale, the Company entered into certain cross-licensing arrangements and assignments for certain tradenames and trademarks associated with the NAI Banner Sale, which permits each of the Company, Albertson’s LLC and NAI and their affiliates to use tradenames and trademarks that are owned by the respective parties as is necessary for the operation of their respective businesses. These tradenames and trademarks include private-label products.
The Company registers a substantial number of its trademarks/service marks in the United States Patent and Trademark Office, including many of its private-label product trademarks and service marks. U.S. trademark and service mark registrations are generally for a term of ten years, renewable every ten years as long as the trademark is used in the regular course of trade. The Company considers certain of its trademarks and service marks to be of material importance to its Wholesale, Save-A-Lot and Retail segments and actively defends and enforces such trademarks and service marks.
Transition Services Agreements
In addition to the services that the Company provides to its independent retail customers and licensees, the Company is party to a transition services agreement ("TSA") with each of NAI, Albertson's LLC and Haggen pursuant to which the Company provides various back-office services such as information technology, finance and human resources. In April 2015, the Company entered into a letter agreement regarding the TSA with NAI and Albertson’s LLC pursuant to which the Company is providing services to NAI and Albertson’s LLC as needed to transition and wind down the TSA. The Company estimates that a complete transition and wind down of the TSA with NAI and Albertson's LLC will take approximately two to three years. In September 2015, Haggen filed voluntary petitions for reorganization under Chapter 11 of the U.S. Bankruptcy Code. Through the bankruptcy process, Haggen has now closed, sold or agreed to sell all 164 stores. The Company estimates that a complete transition and wind down of the TSA with Haggen will occur in second quarter of fiscal 2017. The Company is focused on executing its plans to mitigate the impact of the wind down of these TSAs, see "Risk Factors---The Company's relationships with NAI, Albertson's LLC and Haggen are winding down, which could adversely impact the Company's results of operations" in Part I, Item 1A of this Annual Report on Form 10-K.
Working Capital
Normal operating fluctuations in working capital balances can result in changes to cash flow from operations presented in the Consolidated Statements of Cash Flows that are not necessarily indicative of long-term operating trends. The Company’s working capital needs are generally greater during the months leading up to high sales periods, such as the time period from prior to Thanksgiving through December. The Company typically finances these working capital needs with funds provided by operating activities and short-term borrowings. Inventories are managed primarily through demand forecasting and replenishing depleted inventories. There are no unusual industry practices or requirements relating to working capital.
Seasonality
The majority of the Company's revenues are generally not seasonal in nature. However, revenues are higher during major holidays during the Company's fiscal year. The Company's first quarter consists of 16 weeks, while all of the Company's other quarters consist of 12 weeks, and all quarters typically include a major holiday.
Competition
Wholesale, Save-A-Lot and Retail each operate in a highly competitive environment. The Company believes that the principal competitive factors faced by its own stores and licensed stores, as well as the stores of independent retail customers it supplies, include price, quality, store locations, customer service, convenience, assortment, in-stock levels, brand recognition, store conditions, in-store marketing and merchandising, promotional strategies and other competitive activities.
9
Wholesale competes directly with a number of traditional and specialty grocery wholesalers. The Company believes it competes in this business on the basis of price, quality, assortment, schedule and reliability of deliveries and services, service fees and distribution facility locations. The Company's Wholesale segment also faces competition from retailers that maintain or develop self-distribution systems as a result of industry consolidation or otherwise.
Principal competition for the Company’s Save-A-Lot and Retail segments comes from traditional grocery retailers, including regional and national chains and independent food store operators, and non-traditional retailers, such as supercenters, membership warehouse clubs, specialty supermarkets, drug stores, hard discount stores, dollar stores, convenience stores, online retailers and restaurants. The Company's ability to differentiate itself from its competitors and create an attractive value proposition for its customers is dependent upon a combination of price, quality, customer service, convenience, assortment, in-stock levels, brand perception, store location and conditions, in-store marketing and merchandising and promotional strategies.
The Company believes that the success of its Wholesale, Save-A-Lot and Retail segments is dependent upon the ability of its own stores and stores licensed by the Company, as well as the stores of independent retail customers it supplies, to compete successfully. Save-A-Lot also competes to attract and maintain licensed operators to operate stores to which it provides distribution. This competition generally takes the form of alternative investment formats, such as a potential or existing licensee’s investment in fast food restaurants, dollar stores, specialty supermarkets, drug stores and other potential investments.
Recent and ongoing consolidation within the grocery industry has resulted in, and is expected to continue to result in, increased competition, including from some competitors that have greater financial, marketing and other resources than the Company.
Employees
As of February 27, 2016, the Company had approximately 38,000 employees. Approximately 16,000 employees are covered by 55 collective bargaining agreements. During fiscal 2016, nine collective bargaining agreements covering approximately 1,600 employees were renegotiated and three collective bargaining agreements covering approximately 110 employees expired without their terms being renegotiated. Also, four collective bargaining agreements covering approximately 700 employees expired prior to fiscal 2016 without their terms being renegotiated. Negotiations are expected to continue with the bargaining units representing the employees subject to those expired agreements. During fiscal 2017, twenty-four collective bargaining agreements covering approximately 8,400 employees will expire. The majority of employees covered by these expiring collective bargaining agreements are located in Midwestern markets. The Company is focused on ensuring competitive cost structures in each market in which it operates while meeting its employees’ needs for attractive wages and affordable healthcare and retirement benefits. The Company believes that it has generally good relations with its employees and with the labor unions that represent employees covered by collective bargaining agreements. Upon the expiration of collective bargaining agreements with employees, work stoppages could occur if we are unable to negotiate new contracts. A prolonged work stoppage at distribution centers or a significant number of stores may have a material impact on the Company’s business, financial condition or results of operations.
Where You Can Find More Information
The Company’s principal executive offices are located at 11840 Valley View Road, Eden Prairie, Minnesota 55344 (Telephone: 952-828-4000). The Company makes available free of charge at its Internet website (www.supervalu.com) its annual reports on Form 10-K, quarterly reports on Form 10-Q, current reports on Form 8-K and any amendments to these reports filed or furnished pursuant to Section 13(a) or 15(d) of the Securities Exchange Act of 1934, as amended (the “Exchange Act”) as soon as reasonably practicable after such material is electronically filed with or furnished to the SEC. Information on the Company’s website is not deemed to be incorporated by reference into this Annual Report on Form 10-K. The Company will also provide its SEC filings free of charge upon written request to Investor Relations, SUPERVALU INC., P.O. Box 990, Minneapolis, MN 55440.
10
EXECUTIVE OFFICERS OF THE COMPANY
The following table provides certain information concerning the executive officers of the Company as of April 26, 2016.
Name | Age | Present Position | Calendar Year Elected to Present Position | Other Positions Recently Held with the Company | ||||
Mark Gross(1) | 53 | President and Chief Executive Officer | 2016 | |||||
Bruce H. Besanko(2) | 57 | Executive Vice President, Chief Operating Officer and Chief Financial Officer | 2016 | Executive Vice President, Chief Operating Officer, 2015-April 2016; Executive Vice President, Chief Financial Officer, 2013-2015 | ||||
Randy Burdick(3) | 58 | Executive Vice President, Chief Information Officer | 2013 | |||||
Eric A. Claus(4) | 59 | Chief Executive Officer, Save-A-Lot | 2015 | |||||
Susan S. Grafton(5) | 59 | Senior Vice President, Finance, and Chief Accounting Officer | 2016 | Executive Vice President, Chief Financial Officer, 2015-April 2016; Senior Vice President, Finance, and Chief Accounting Officer, 2014-2015 | ||||
Michele A. Murphy(6) | 62 | Executive Vice President, Human Resources and Communications | 2013 | Senior Vice President, Human Resources & Labor Relations, 2010-2013; Senior Vice President, Labor & Employee Relations, 2006-2010 | ||||
Karla C. Robertson | 45 | Executive Vice President, General Counsel and Corporate Secretary | 2013 | Executive Vice President, Legal 2013; Vice President, Employment, Compensation and Benefits Law, 2012-2013; Director, Employment Law, 2011-2012; Senior Labor and Employment Counsel, 2009-2011 | ||||
Michael Stigers(7) | 57 | Executive Vice President, Wholesale | 2015 | President of Cub Foods, 2014-2015; President, Northern and Western Region of Wholesale, 2013-2014; President of Shaw’s, 2011-2013 | ||||
Mark Van Buskirk(8) | 58 | Executive Vice President, Merchandising, Marketing, Retail & Pharmacy | 2013 | |||||
James Weidenheimer(9) | 57 | Executive Vice President, Corporate Development and Chief Innovation Officer | 2016 | |||||
Rob Woseth(10) | 45 | Executive Vice President, Chief Strategy Officer | 2013 | |||||
(1) | Mark Gross was appointed to President and Chief Executive Officer in February 2016. Prior to joining the Company, Mr. Gross served since 2006 as President of Surry Investment Advisors LLC, an advisory firm that Mr. Gross founded to provide consulting services to grocery distributors and retailers with respect to strategic and operational matters. From 1997-2006, Mr. Gross held various positions at C&S Wholesale Grocers, including serving as Co-President of C&S's overall operations from 2005-2006. Additionally, during his tenure with C&S, Mr. Gross served as Chief Financial Officer, General Counsel, and President of its affiliated retail grocery operations. |
(2) | Bruce H. Besanko was appointed Executive Vice President, Chief Operating Officer and Chief Financial Officer in April 2016. Prior to that, Mr. Besanko served as Executive Vice President, Chief Operating Officer from October 2015 to April 2016, and as Executive Vice President, Chief Financial Officer from August 2013 to October 2015. Prior to joining the Company, Mr. Besanko served as Executive Vice President and Chief Financial Officer since February 2009, and as Chief Administrative Officer since October 2009, for OfficeMax. Mr. Besanko previously served as Executive Vice President and Chief Financial Officer of Circuit City Stores, Inc. (“Circuit City”), a specialty retailer of consumer electronics and related services, from July 2007 to February 2009. Prior to that, Mr. Besanko served as Senior Vice President, Finance and Chief Financial Officer for The Yankee Candle Company, Inc., a designer, manufacturer, wholesaler and retailer of premium scented candles, since April 2005. On November 10, 2008, Circuit City and several of its subsidiaries filed voluntary petitions for relief under Chapter 11 of the United States Bankruptcy Code in the United States Bankruptcy Court for the Eastern District of Virginia. Circuit City’s Chapter 11 plan of liquidation was confirmed by the Bankruptcy Court on September 14, 2010. |
(3) | Randy Burdick was appointed Executive Vice President, Chief Information Officer in March 2013. Prior to joining the Company, Mr. Burdick served as Executive Vice President and Chief Information Officer at OfficeMax from 2005-2013. |
(4) | Eric Claus was appointed Chief Executive Officer, Save-A-Lot in December 2015. Prior to joining the Company, from July 2013 until December 2015, Mr. Claus served as the Chairman, President and Chief Executive Officer of Red Apple Stores Inc., a 155-store value-oriented clothing, general merchandise and food chain in Canada. From 2012-2013, Mr. Claus served as Executive Chairman of TBS Acquireco Inc. ("TBS"), overseeing under-performing assets. Mr. Claus joined TBS to restructure that company and in February 2013, the Ontario Superior Court of Justice granted protection to TBS from its creditors pursuant to the Companies' Creditors Arrangement Act. Pursuant to court order in July 2013, the assets and continuing operations of TBS were sold to Red Apple Stores Inc. In September 2013, TBS made a voluntary assignment in bankruptcy pursuant to the Bankruptcy and Insolvency Act. From 2009-2012, Mr. Claus |
11
worked with various private equity firms analyzing potential transactions. Mr. Claus served as Chief Executive Officer and President of The Great Atlantic & Pacific Tea Company, Inc. (“A&P”) from 2005-2009. He joined A&P in 2002, serving as Chief Executive Officer and President of A&P Canada of The Great Atlantic & Pacific Tea Company Inc., Canada from 2002-2005. In December 2010, A&P filed voluntary petitions for relief under Chapter 11 of the United States Bankruptcy Code in the United States Bankruptcy Court for the Southern District of New York. A&P’s Chapter 11 reorganization plan was confirmed by the Bankruptcy Court in February 2012. Prior to joining A&P, Mr. Claus served as Chief Executive Officer of Co-Op Atlantic from 1997-2002.
(5) | Susan S. Grafton was appointed Senior Vice President, Finance, and Chief Accounting Officer in April 2016. Prior to that, Ms. Grafton served as Executive Vice President, Chief Financial Officer from October 2015 to April 2016, and as Senior Vice President, Finance, and Chief Accounting Officer for the Company from February 2014 to October 2015. Prior to joining the Company, Ms. Grafton served as Senior Vice President, Controller and Chief Accounting Officer from 2011-2014 and as Vice President, Controller and Chief Accounting Officer from 2006-2011 at Best Buy Co., Inc., a retailer of consumer electronics and related products. |
(6) | Michele A. Murphy has notified the Company of her intention to retire as Executive Vice President, Human Resources and Communications of the Company effective May 20, 2016. |
(7) | Prior to joining the Company in 2011, Michael Stigers served as President of PW Supermarkets, Inc., an operator of retail grocery supermarkets, from 2006-2010 and as Chief Executive Officer in 2010. In April 2011, creditors filed a petition for involuntary bankruptcy against PW Supermarkets in U.S. Bankruptcy Court, Northern District of California to force PW Supermarkets into a Chapter 7 liquidation. The bankruptcy case was transferred to the Oakland Division in October 2014 and continues to be an active case in that court. |
(8) | Mark Van Buskirk was appointed Executive Vice President, Merchandising, Marketing, Retail & Pharmacy in March 2013. Prior to joining the Company, Mr. Van Buskirk served as Vice President of Meat and Seafood Merchandising and Procurement at the Kroger Co., a retail grocery company, from 2006-2013. |
(9) | James Weidenheimer was appointed Executive Vice President, Corporate Development and Chief Innovation Officer in April 2016. Prior to joining the Company, Mr. Weidenheimer served as Senior Vice President of Corporate Development for C&S Wholesale Grocers from 2008 to January 2016, where Mr. Weidenheimer oversaw significant M&A activity and led the development of procurement and distribution outsourcing plans. |
(10) | Rob Woseth was appointed Executive Vice President, Chief Strategy Officer effective March 2013. Prior to joining the Company, Mr. Woseth served as Vice President Business Development and Strategy at Albertson’s LLC from 2006-2013. |
The term of office of each executive officer is from one annual meeting of the Board of Directors until the next annual meeting of Board of Directors or until a successor is elected. There are no family relationships between or among any of the executive officers of the Company.
ITEM 1A. RISK FACTORS
Various risks and uncertainties may affect the Company’s business. Any of the risks described below or elsewhere in this Annual Report on Form 10-K or the Company’s other SEC filings may have a material impact on the Company’s business, financial condition or results of operations.
The Company’s Wholesale, Save-A-Lot and Retail segments face intense competition, and the Company’s failure to compete successfully may adversely affect its sales, financial condition and operating results.
The grocery business is intensely competitive, and the recent and ongoing consolidation within the grocery industry is expected to result in increased competition, including from some competitors that have greater financial, marketing and other resources than the Company. The grocery industry is characterized by relatively small operating margins, and as competition in certain areas intensifies and as the industry continues to consolidate, the Company’s results of operations may be negatively impacted through a loss of sales and reductions in gross margins. Where necessary, in order to compete effectively with competitors, the Company may need to lower its prices on goods for sale and services. The Company may also need to extend additional credit to its Wholesale customers, including through loans, market support or guarantees, and while the Company seeks to obtain security interests and other credit support in connection with the financial accommodations the Company extends, such collateral may not be sufficient to cover its exposure. The nature and extent to which the Company’s competitors implement various pricing, credit support and promotional activities in response to increasing competition and the Company’s response, or failure to respond effectively, to these competitive actions can adversely affect profitability and the Company’s operating results.
The Company’s Wholesale segment is primarily wholesale distribution and services, which competes with traditional grocery wholesalers as well as specialty wholesalers on the basis of price, quality, assortment, schedule and reliability of deliveries and services, service fees and distribution facility locations. The profitability of the Wholesale segment is dependent upon sufficient volume to support the Company’s operating infrastructure, which is dependent on the ability of the Company to attract new customers and retain existing customers, as well as the ability of the Company and its independent retail customers to
12
distinguish themselves from competitors in the grocery channel. The Company’s Wholesale segment also faces competition from retailers that maintain or develop self-distribution systems as a result of industry consolidation or otherwise. The inability to attract new customers, the loss of existing customers to a competing wholesaler or due to closure, vertical integration such as an existing customer converting to self-distribution, or industry consolidation, or the inability of the Company’s customers to compete successfully with other grocery retailers and non-traditional retailers may negatively impact the Company’s sales and gross margin.
The Company’s Retail and Save-A-Lot segments face significant competition for customers, managers, employees, store sites and products from traditional grocery retailers, including regional and national chains and independent food store operators, and non-traditional retailers, such as supercenters, membership warehouse clubs, specialty supermarkets, drug stores, discount stores, dollar stores, convenience stores, online retailers and restaurants. Competitors continue to increase their presence in the Company’s markets, including certain non-traditional competitors that have entered the grocery retailing business. The Company’s ability to differentiate itself from its competitors and create an attractive value proposition for its customers is dependent upon a combination of price, quality, customer service, convenience, assortment, in-stock levels, brand perception, store location and conditions, in-store marketing and merchandising and promotional strategies. Any failure to positively differentiate the Company’s stores, as well as the inability to identify and respond to changes in economic conditions and trends in consumer preferences, could decrease the number of customer transactions at the Company’s stores and decrease the amount customers spend when they visit the Company’s stores.
In addition, customers are increasingly using tablets, mobile phones, computers and other devices to shop in stores and online and provide feedback and public commentary on their shopping experience, including prices. Multichannel retailing is rapidly evolving. If the Company does not keep pace with changing customer expectations and new developments and technology investments by its competitors, the Company’s ability to compete and results of operations could be adversely affected.
The Company may not be able to successfully identify and execute on initiatives to increase its sales and profits.
The Company’s ability to grow sales and profits depends on many factors, including its ability to attract new customers and licensees throughout its existing network of distribution centers, political, social and economic conditions, and the Company’s ability to successfully identify and execute on growth and profit-enhancing opportunities. The Company continuously evaluates the changing business environments in which it operates and seeks out opportunities to improve performance, customer service and growth through selected initiatives. The Company’s ability to execute on these initiatives is dependent, in part, upon its ability to continue to provide a high level of customer service, offer competitive products at low prices, maintain high levels of productivity, become a more cost-efficient organization and offer services that provide value. There are no assurances that the Company will be able to identify the appropriate course of action, including which initiatives will be the most effective in improving the competitive position or profitability of the Company, or that the Company will be able to respond appropriately to competitors’ initiatives. If the Company is unable to execute on its initiatives, the Company’s financial condition and results of operations may be adversely affected.
The Company may engage in acquisitions and divestitures, and may encounter difficulties integrating acquired businesses with, or disposing of divested businesses from, the Company’s current operations; therefore, the Company may not realize the anticipated benefits of these acquisitions and divestitures.
The Company may engage in strategic acquisitions. The Company’s due diligence reviews may not identify all of the material issues necessary to accurately estimate the cost and potential loss contingencies of a particular transaction, including potential exposure to regulatory sanctions resulting from an acquisition target’s previous activities. The Company may incur unanticipated costs or expenses, including post-closing asset impairment charges, expenses associated with eliminating duplicate facilities, litigation and other liabilities. The Company also may encounter difficulties in integrating acquisitions with its operations, applying its internal controls processes to these acquisitions or in managing strategic investments. Additionally, the Company may not realize the degree or timing of benefits it anticipates when it first enters into a transaction. Any of the foregoing could materially adversely affect the Company’s competitive position, financial condition, operating results or cash flows. Furthermore, the Company may make strategic divestitures from time to time. Any divestitures may result in continued financial involvement in the divested businesses, such as through guarantees or other financial arrangements or continued supply and services arrangements, following the transaction. Under these arrangements, non-performance by those divested businesses could result in obligations imposed on the Company and could have an adverse effect on the Company’s competitive position, financial condition, operating results or cash flows. The success of future acquisitions and divestitures will depend on the satisfaction of conditions precedent to, and consummation of, the transactions, the timing of consummation of these transactions and the ability of the parties to secure any required regulatory approvals in a timely manner, among other things.
13
The results and impact of the Company’s announcement that it is exploring a separation of its Save-A-Lot segment and that it has begun preparations to allow for a possible spin-off of Save-A-Lot into a stand-alone, publicly traded company are uncertain and cannot be determined.
On July 28, 2015, the Company announced that it is exploring a separation of its Save-A-Lot segment, and that as part of that process it has begun preparations to allow for a possible spin-off of Save-A-Lot into a stand-alone, publicly traded company, including engaging financial and legal advisors. On January 7, 2016, Save-A-Lot, Inc. filed a Form 10 with the SEC as part of the ongoing exploration of a potential separation from the Company. No specific timetable for a separation has been set and there can be no assurance that a separation will be completed or that any other change in the Company’s overall structure or business model will occur. Any transaction or other change in the Company’s overall structure or business model that is ultimately completed may not deliver the anticipated benefits or enhance shareholder value. The Company has, and expects to continue to, incur expenses associated with preparing for a possible spin-off, and the process of considering, preparing for and implementing such a course of action may distract the Company’s management team from their day-to-day responsibilities and make it more difficult to retain employees, and may otherwise be disruptive to the Company’s business operations. Any of these risks or uncertainties could adversely affect the Company’s business, financial condition, results of operations or cash flows.
The Company’s Wholesale and Save-A-Lot licensee distribution business models present a number of risks.
The Company’s success relies in part on the financial success and cooperation of its independent retail customers and Save-A-Lot licensees. These independent retail customers and licensees manage their businesses independently, and therefore are responsible for the day-to-day operation of their stores. The revenues the Company realizes from these independent retail customers and licensees are largely dependent on their ability to maintain and grow their sales. They may not experience sales growth or achieve an acceptable level of sales or profitability, and the Company’s revenues and gross margins could be negatively affected as a result. If sales trends or profitability worsen for independent retail customers or licensees, their financial results may deteriorate, which could result in, among other things, store closures or delayed or reduced payments to the Company and could adversely impact the Company’s ability to grow its Wholesale or Save-A-Lot licensee business. Additionally, if licensees do not successfully operate stores in a manner consistent with the Company’s required standards, the Save-A-Lot brand’s image and reputation could be harmed, which in turn could hurt the Company’s business and operating results.
The Company may not be able to grow or maintain its levels of identical store sales.
The Company has experienced both positive and negative identical store sales in recent periods. If the Company’s identical store sales decline or fail to meet market expectations, the price of the Company’s stock could decline. A variety of factors affect identical store sales and profitability, including consumer tastes, competition, current economic conditions, pricing, inflation, deflation and weather conditions, and many of these factors are beyond our control and can be difficult to predict in advance. These factors may cause the Company’s identical store sales results to be materially lower than recent periods, which could harm the Company’s results of operations and result in a decline in the price of the Company’s stock.
The Company’s inability to maintain or increase its operating margins could adversely affect its results of operations and the price of the Company’s stock.
The Company may not be able to maintain or increase its operating margins. If the Company is not able to continue to capture scale efficiencies, improve its systems and discipline and enhance its merchandise offerings, the Company may not be able to achieve its goals with respect to operating margins. In addition, if the Company does not continuously refine and improve its various ordering, tracking and allocation systems, the Company may not be able to increase sales and reduce inventory shrinkage. As a result, the Company’s operating margins may stagnate or decline, which could adversely affect the price of the Company’s stock.
The Company has substantial indebtedness that could increase the Company’s borrowing costs and decrease the Company’s financial and operational flexibility.
The Company has, and expects to continue to have, a substantial amount of debt. The Company’s indebtedness may increase the Company’s borrowing costs and decrease the Company’s business flexibility, making it more vulnerable to adverse economic conditions. For example, substantial levels of debt could:
• | require the Company to use a substantial portion of its cash flow from operations for the payment of principal and interest on its indebtedness, thereby reducing the availability of cash flow to fund working capital, growth opportunities, capital expenditures, acquisitions and for other purposes; |
14
• | limit the Company’s ability to obtain, or increase the cost at which the Company is able to obtain, amendments to its existing indebtedness or financing in order to refinance existing indebtedness and fund working capital, store growth opportunities, capital expenditures, acquisitions and for other purposes; |
• | limit the Company’s ability to adjust to changing business and market conditions and to respond to market opportunities, placing the Company at a competitive disadvantage relative to its competitors that have less debt. |
A significant portion of the Company’s debt portfolio has a variable interest rate component. Volatility in interest rates causes volatility in interest expense, potentially resulting in an adverse impact to earnings. Additionally, pursuant to the Company’s debt agreements, the Company has created a security interest in substantially all of its assets to secure certain debt instruments. The Company has also agreed to certain limitations on its ability to acquire or dispose of assets and is required to use the proceeds of such dispositions to pay down its debt, subject to certain exceptions. There are also various restrictive covenants and cross-default covenants in the Company’s debt instruments that could limit the Company’s operating and financial flexibility.
If the Company fails to comply with any of these requirements, the related indebtedness (and other unrelated indebtedness) could become due and payable prior to its stated maturity and the Company may not be able to repay the indebtedness that becomes due. A default under the Company’s debt instruments may also significantly affect the Company’s ability to obtain additional or alternative financing.
The Company’s ability to comply with the covenants or to refinance the Company’s obligations with respect to the Company’s indebtedness will depend on the Company’s operating and financial performance, which in turn is subject to prevailing economic conditions and to financial, business and other factors beyond the Company’s control. In particular, the Company’s ability to obtain additional financing through the capital markets may be adversely impacted by global economic conditions. Tightening of credit, low liquidity or volatility in the capital markets could result in diminished availability of credit and higher costs of borrowing, making it more difficult for the Company to obtain or amend debt financing on favorable terms. These conditions and factors may also negatively impact the Company’s debt ratings, which may increase the cost of borrowing or adversely affect the Company’s ability to access one or more financial markets.
Any of these outcomes may adversely affect the Company’s financial condition and results of operations.
Increased healthcare, pension and other costs under the Company’s and multiemployer benefit plans, or failure to maintain satisfactory labor relations, could adversely affect the Company’s financial condition and results of operations.
The Company provides health benefits to many of its employees and the costs of such benefits continue to increase annually. The amount of any increase or decrease in the cost of Company-sponsored health plans will depend on a number of different factors, many of which are beyond the Company’s control, such as The Patient Protection and Affordable Care Act, which has resulted in changes to the U.S. healthcare system and imposes mandatory types of coverage and reporting and other requirements on Company-sponsored health plans. If the Company is unable to control healthcare benefits and pension costs, the Company may experience increased operating costs, which may adversely affect the Company’s financial condition and results of operations.
The Company sponsors defined benefit pension, defined contribution pension, and other postretirement benefit plans for substantially all employees not participating in multiemployer health and pension plans. The Company’s costs to provide these benefits generally continue to increase annually. Additionally, the projected benefit obligations of the Company-sponsored plans exceed the fair value of those plans’ assets. The Company uses actuarial valuations to determine the Company’s benefit obligations for certain benefit plans, which require the use of significant estimates, including the discount rate, expected long-term rate of return on plan assets, mortality rates and the rates of increase in compensation and health care costs. Changes to these significant estimates could increase the cost of these plans, which could also have an adverse effect on the Company’s financial condition and results of operations.
In addition, the Company participates in various multiemployer health and pension plans for a majority of its union-affiliated employees, and the Company is required to make contributions to these plans in amounts established under collective bargaining agreements. The costs of providing benefits through such plans have increased in recent years. The amount of any increase or decrease in the Company’s required contributions to these multiemployer plans will depend upon many factors, including the outcome of collective bargaining, actions taken by trustees who manage the plans, government regulations, the actual return on assets held in the plans and the potential payment of a withdrawal liability if the Company chooses to exit a market. Withdrawal liabilities could be material, and potential exposure to withdrawal liabilities may influence business decisions and could cause the Company to forgo business opportunities. Increases in the costs of benefits under these plans, coupled with both performance below the plans’ assumed rates of return in the equity and fixed income markets in past years
15
and withdrawals of other companies from these plans, have caused most multiemployer pension plans in which the Company participates to be underfunded. Many of these plans have required rehabilitation plans or funding improvement plans, and the Company can give no assurances of the extent to which a rehabilitation plan or a funding improvement plan will improve the funded status of the plan. The Company expects that the unfunded liabilities of these plans will result in increased future payments by the Company and the other participating employers over the next few years. Underfunded multiemployer pension plans may, in certain situations, impose a surcharge requiring additional pension contributions. The Company’s risk of such increased payments may be greater if any of the participating employers in these underfunded plans withdraws from the plan due to insolvency and is not able to contribute an amount sufficient to fund the unfunded liabilities associated with its participants in the plan. A significant increase to funding requirements could adversely affect the Company’s financial condition, results of operations or cash flows.
The financial condition of these pension plans may also negatively impact the Company’s debt ratings, which may increase the cost of borrowing, adversely affect the Company’s ability to access one or more financial markets or result in a default under the Company’s debt instruments.
As of February 27, 2016, the Company is a party to 55 collective bargaining agreements covering approximately 16,000 of its employees, of which 24 collective bargaining agreements covering approximately 8,400 employees are scheduled to expire in fiscal 2017. In addition, during fiscal 2016, nine collective bargaining agreements covering approximately 1,600 employees were renegotiated. In fiscal 2016, three collective bargaining agreements covering approximately 110 employees expired without their terms being renegotiated. Also four collective bargaining agreements covering approximately 700 employees expired prior to fiscal 2016 without terms being negotiated. Negotiations are expected to continue with the bargaining units representing the employees subject to those agreements. In future negotiations with labor unions, the Company expects that, among other issues, rising healthcare, pension and employee benefit and wage costs and operational flexibility will be important topics for negotiation. There can be no assurance that the Company will be able to negotiate the terms of expiring or expired agreements in a manner acceptable to the Company. Therefore, potential increases in operating costs or work disruptions from labor disputes could disrupt the Company’s businesses and adversely affect the Company’s financial condition and results of operations. Certain of the Company’s operations have employees who are non-union, and while the Company believes its employee relations are strong, there can be no assurance that these operations will not experience pressure from labor unions or become the target of campaigns to unionize.
The Company’s relationships with NAI, Albertson’s LLC and Haggen are winding down, which could adversely impact the Company’s results of operations.
In connection with the sale of NAI in March 2013, the Company entered into the TSA with each of NAI and Albertson’s LLC to support the divested NAI banners and the continuing operations of Albertson’s LLC. The Company continues to perform services under the TSA with each of NAI and Albertson’s LLC, and the Company is also providing services as needed to transition and wind down these TSA. The Company estimates that the complete transition and wind down of the TSA could take approximately two to three more years. This estimate is based on the transition completed to date and information currently known to the Company and could change.
The transition and wind down of the TSA could be time consuming and resource intensive for the Company. The Company is working with NAI and Albertson’s LLC to coordinate the requirements to fully transition and wind down the TSA. While the transition and wind down has proceeded smoothly to date, this work is on-going and could lead to disputes with NAI and Albertson’s LLC, including related to what services the Company must perform to transition and wind down these TSA, the manner or timeline in which these transition and wind down services are performed and the cost to perform these services, which could cause disruptions and adversely impact the Company’s results of operations.
The amount of revenue the Company receives under the TSA with each of NAI and Albertson’s LLC is based on the number of NAI and Albertson’s LLC stores and distribution centers receiving services under the TSA. Pursuant to the terms of the TSA, NAI and Albertson’s have notified the Company, and will continue to notify the Company during the transition and wind down of the TSA, that NAI and Albertson's LLC have decided to not receive further services at stores or distribution centers. As stores and distributions centers are removed from the TSA, the variable fee the Company receives under the TSA is reduced beginning shortly after the Company receives notice of such removal and the store or distribution center is no longer receiving services. The fixed portion of the TSA fee for stores and distribution centers also resets each September 22 (beginning September 22, 2015) based on the number of stores and distribution centers receiving services as of such date.
The Company entered into the Haggen TSA in December 2014 to provide services to 164 stores and also entered into a supply agreement with Haggen to supply certain of the stores in two states. In September 2015, Haggen filed voluntary petitions for reorganization under Chapter 11 of the U.S. Bankruptcy Code. Through the bankruptcy process, Haggen has now closed, sold
16
or agreed to sell all 164 stores. While the Company continues to provide services under the Haggen TSA, it expects that all such services will cease under the Haggen TSA in the second quarter of fiscal 2017. Certain of the stores under the Haggen TSA will or have been sold to Albertson's LLC and will or have been added to the TSA with Albertson's LLC. The Company has filed for approximately $2 of administrative 503(b)(9) priority claims and for approximately $8 of other claims with the bankruptcy court. The Company could also be exposed to claims from third parties from which the Company sourced products, services, licenses and similar benefits on behalf of Haggen. Failure to recover the amounts payable by Haggen or any adverse results from any such claims from third parties could adversely impact the Company’s results of operations.
The impact of the wind down of the TSA with NAI and Albertson’s LLC and the Haggen TSA on the Company’s results of operations depends on the amount and timing of lost revenue compared to the Company’s ability to identify and execute on cost reductions (including costs not directly related to providing TSA services), new services relationships, growth strategies and additional investments in the business that accelerate revenue growth. The Company expects that the decline in TSA revenue from stores and distribution centers no longer receiving services under the TSA as part of the transition and wind down of the TSA will happen earlier than the decline in TSA services the Company is required to perform, which the Company expects will prevent it from being able to take out certain costs until some period of time after the TSA revenue declines. This timing difference creates challenges for the Company in managing its costs and could adversely impact the Company’s results of operations in any given period.
The Company continues to develop and engage in cost reduction initiatives and other strategies to generate services revenue streams. There can be no assurance that the Company will be able to successfully implement and execute on these initiatives and strategies or that the Company will otherwise be able to fully address the impact of the termination of these TSAs and failure to do so could adversely impact the Company’s results of operations.
The Company’s ability to continue to perform services under the TSAs at the applicable service level, and to provide transition and wind down services for the TSA, will depend partly on its ability to attract and retain qualified personnel. Retaining such personnel may be more difficult in connection with the transition and wind down of the TSA. A shortage of qualified employees who devote time to services under the TSAs could increase the Company’s costs and decrease the Company’s ability to effectively serve these customers. The Company could face claims for disruptions or other impacts to the businesses of NAI, Albertson’s LLC or Haggen.
The Company is also a party to an Operating and Supply Agreement with NAI under which the Company operates a distribution center owned by NAI. The Company provides wholesale distribution of products to certain NAI banners and to certain of the Company’s independent retail customers from this distribution center. This agreement may be terminated by either party on 24 months’ notice. If the Company were not able to supply its independent retail customers from this distribution center, it would need to identify an alternative distribution center to service those customers. Identifying, and potentially building, a replacement distribution center could be time consuming and resource intensive for the Company and a delay or failure to do so could adversely impact the Company’s results of operations.
The Company experienced information technology intrusions in fiscal 2015 that could adversely impact its business and future operating results.
In fiscal 2015, the Company experienced separate criminal intrusions into the portion of its computer network that processes payment card transactions for some of its owned and franchised retail food stores, including some of the associated stand-alone liquor stores. These intrusions may have resulted in the theft of account numbers, and in some cases also the expiration date, other numerical information and/or the cardholder’s name, from payment cards used at some point of sale systems at some of the Company’s owned and franchised stores.
While the costs that the Company has incurred to date in connection with the intrusions primarily include professional advisory and legal costs relating to its continuing investigation of the intrusions, the Company expects to incur additional costs and expenses related to the intrusions in the future. The Company may also be adversely affected by claims from customers, financial institutions, payment card brands, stockholders and others and by costly inquiries or enforcement actions on the part of regulatory authorities.
The Company has also expended significant time and resources on enhanced protective technology. The Company continues to take actions to implement further security enhancements and the Company is committed to continuing to improve its information security safeguards to protect its stores against intrusions. The time and resources devoted to enhancing the Company’s information security can be disruptive to the day-to-day operations of the Company’s businesses, which could adversely affect the Company’s results of operations.
17
Some stores owned and operated by Albertson’s LLC and NAI experienced related criminal intrusions. The Company provides information technology services to these Albertson’s LLC and NAI stores pursuant to the TSA, and the Company has been working together with Albertson’s LLC and NAI to respond to the intrusion into their stores. While the Company believes that any losses incurred by Albertson’s LLC or NAI as a result of the intrusion affecting their stores would not be the Company’s responsibility, the Company could face claims by Albertson’s LLC and NAI related to the intrusions, or other third parties seeking to hold the Company responsible for the intrusions into the stores of Albertson’s LLC and NAI. The Company also cannot be certain whether the intrusions could adversely affect the Company’s relationships with Albertson’s LLC and NAI.
The Company is currently subject to private litigation and claims relating to the intrusions, and an inquiry from a multistate group of Attorneys General. In the future the Company may be subject to additional litigation and claims and to governmental investigations or proceedings relating to one or both of the intrusions. The Company’s financial liability arising from such litigation, claims, investigations or proceedings will depend on many factors, including:
• | the results of the payment card brands’ investigations of the intrusions; |
• | whether, at the time of the intrusions, the portion of its network that handles payment card data was in compliance with applicable payment card industry standards; |
• | whether, and if so to what extent, any fraud losses or other expenses experienced by cardholders, card issuers and/or the payment card brands on or with respect to the payment card accounts affected by the intrusions can be properly attributed to these intrusions and whether, and if so to what extent, those expenses would be the Company’s legal responsibility; |
• | the nature and extent of any losses to Albertson’s LLC or NAI from the intrusions and any claims asserted against the Company for such losses; and |
• | the adequacy of the Company’s insurance. |
Disruptions to the Company’s or third-party information technology systems, including future cyber-attacks and security breaches, and the costs of maintaining secure and effective information technology systems could negatively affect the Company’s business and results of operations.
The efficient operation of the Company’s businesses is highly dependent on computer hardware and software systems, including customized information technology systems. Information systems are vulnerable to disruptions and security breaches by computer hackers and cyber terrorists. The Company relies on industry accepted security measures and technology to securely maintain confidential and proprietary information stored on the Company’s information systems, and continues to invest in maintaining and upgrading the systems and applications to control risk. The Company also relies on third-party systems and software that are critical to the operation of its business, including accepting credit, debit, EBT and gift cards. In response to the information technology intrusions the Company experienced in fiscal 2015, the Company has taken and is continuing to take actions to strengthen the security of its information technology systems. Nevertheless, these measures and technology may not adequately prevent security breaches in the future or the Company may not be able to timely implement these measures and technology. There can be no assurance that the Company will not suffer another intrusion or that a third-party that is relied on by the Company will not suffer an intrusion, that unauthorized parties will not gain access to confidential or personal information, or that any such incident will be discovered promptly. The techniques used by criminals to obtain unauthorized access to sensitive data change frequently and often are not recognized until launched against a target, and the Company or its third-party provider may be unable to anticipate these techniques or implement adequate preventative measures. The failure to promptly detect, determine the extent of and appropriately respond to a significant data security breach could have a material adverse impact on the Company’s business, financial condition and results of operations. In addition, the unavailability of the information systems or failure of these systems or software to perform as anticipated for any reason, including a major disaster, technical malfunction or business interruption, and any inability to respond to, or recover from, such an event, or any inability to timely implement new security measures or technology, could disrupt the Company’s business, impact the Company’s customers and could result in decreased performance, increased overhead costs and increased risk for liability, causing the Company’s business and results of operations to suffer.
Additionally, the Company’s businesses involve the receipt, storage and transmission of sensitive data, including personal information about the Company’s customers and employees and proprietary business information of the Company and its customers and vendors. The Company may also share information with vendors that assist the Company in conducting its business, as required by law, with the permission of the individual or as permitted under the Company’s privacy policy. The sharing of information continues to increase as customers are increasingly using tablets, mobile phones, computers and other devices to shop in stores and online and provide feedback and public commentary on their shopping experience, including prices. Multichannel retailing is rapidly evolving. If the Company’s or a vendor’s customer-facing technology systems do not reliably function as designed, the Company may experience a loss of customer confidence or data security breaches or be exposed to fraudulent purchases, which, if significant, could adversely affect the Company’s reputation and results of operations. As a merchant that accepts debit and credit cards for payment, the Company is subject to the Payment Card
18
Industry Data Security Standard (“PCI DSS”), issued by the PCI Council. PCI DSS contains compliance guidelines and standards with regard to the Company’s security surrounding the physical and electronic storage, processing and transmission of individual cardholder data. By accepting debit cards for payment, the Company is also subject to compliance with American National Standards Institute data encryption standards and payment network security operating guidelines. The payment card industry set October 1, 2015 as the date on which it began to shift liability for certain transactions to retailers who are not able to accept Europay, MasterCard, and Visa (EMV) transactions. The Company expects to implement the EMV technology in calendar year 2016. As a result, before the implementation of the EMV technology, the Company may be liable for costs incurred by payment card issuing banks and other third parties or subject to fines and higher transaction fees. As a result of the intrusions, the Company engaged a new third-party security firm to provide the Company a report on compliance with PCI DSS. This transition of security firms delayed the Company’s receipt of its report on PCI DSS compliance. On June 30, 2015, the Company received its merchant report on compliance and on September 30, 2015, the Company received its service provider report on compliance with respect to PCI DSS version 3.1.
Despite any certifications and the utilization of other information security measures, the Company cannot be certain that all of its information technology ("IT") systems or the IT systems of its vendors operate properly or will be able to prevent, contain or detect any future cyber-attacks or security breaches from known malware, malware that may be developed in the future or otherwise. Cyber-attacks are rapidly evolving and becoming increasingly sophisticated and difficult to detect, and therefore, the Company may be unable to anticipate these attacks or implement adequate preventive measures. Additionally, unauthorized parties may attempt to gain access to the Company’s or a vendor’s systems or facilities through fraud, trickery or other forms of deception involving the Company’s employees or vendors. To the extent that any attack or breach results in the loss, damage or misappropriation of information, the Company may be adversely affected by claims from customers, financial institutions, payment card brands, stockholders and others and by costly inquiries or enforcement actions on the part of regulatory authorities. The Company’s operations could also be significantly disrupted by these claims, as well as by the need to spend significant time and resources/funds to upgrade, fix or replace its systems. The Company could also lose credibility with its customers and suffer damage to its reputation and future sales, including through negative publicity and social media. In addition, the cost of complying with stricter privacy and information security laws and standards, including PCI DSS version 3.1, and developing, maintaining and upgrading technology systems to address future advances in technology, could be significant and the Company could experience problems and interruptions associated with the implementation of new or upgraded systems and technology or with maintenance or adequate support of existing systems.
Worsening economic conditions could adversely impact consumer spending, increase costs of doing business or otherwise adversely affect the Company’s operating results.
The vast majority of the Company’s operations and customers are located in the United States, making its results highly dependent on U.S. consumer confidence and spending habits. In recent economic cycles, the U.S. economy has experienced economic recession, higher unemployment rates, higher energy costs, higher insurance and healthcare costs, a decline in the housing market, and greater restrictions on the availability of credit, all of which contributed to reduced consumer confidence and increased price competition.
While the U.S. economy and consumer confidence have improved recently, the sustainability of these improvements remains uncertain. There can be no assurance that the Company will be able to identify and respond to changes and trends in consumer spending and preferences and/or maintain the competitive position of its operations. Additionally, these economic factors, along with higher interest rates, costs of labor and tax rates, and other changes in tax, healthcare and other laws and regulations, can increase the Company’s cost of sales and selling, general and administrative expenses, and otherwise adversely affect the Company’s operating results.
Changes in commodity prices, including due to inflation or deflation, and availability of commodities may affect the Company’s financial condition and operating results.
Many products the Company sells include ingredients such as wheat, corn, oils, milk, eggs, sugar, cocoa and other commodities. In addition, the Company purchases and uses significant quantities of packaging materials to package its products and energy for its distribution centers, stores and offices. Prices for these raw materials, other supplies and energy are volatile and can fluctuate due to conditions that are difficult to predict. These conditions include global competition for resources, currency fluctuations, political conditions, severe weather, the potential longer-term consequences of climate change on agricultural productivity, crop disease or pests, water risk, health pandemics, consumer or industrial demand, and changes in governmental trade, alternative energy and agricultural programs.
We believe the Company’s Save-A-Lot segment is impacted to a greater degree by inflation and deflation than traditional grocery formats due to product mix, its edited assortment of products and product sourcing on private-label products.
19
Continued volatility in the prices of commodities and other supplies the Company purchases could increase or decrease the costs of the Company’s products, and its sales and profitability could suffer as a result. Moreover, increases in the price of the Company’s products to cover increased input costs may result in lower sales volumes, while decreases in input costs could cause the Company to lower its prices and thereby affect its revenues or gross margins. Likewise, constraints in the supply of key commodities may limit the Company’s ability to grow its net revenues. If the Company’s mitigation activities are not effective, if the Company is unable to increase prices to cover increased costs or must reduce its prices, or if the Company is limited by supply constraints, the Company’s financial condition and results of operations could be adversely affected.
The Company’s businesses are subject to laws and governmental regulations that could adversely impact the Company’s financial condition and results of operations.
The Company’s businesses are subject to various federal, state and local laws, regulations and administrative practices. These laws require the Company to comply with numerous provisions regulating health and sanitation standards, food safety, marketing of natural or organically produced food, facilities, environmental, equal employment opportunity, public accessibility, employee benefits, wages and hours worked and licensing for the sale of food, drugs and alcoholic beverages, among others. The Company is also required to meet various security and operating standards and comply with the Controlled Substances Act and its accompanying regulations governing the sale, marketing, packaging, holding and distribution of controlled substances. The Company’s inability to timely obtain permits, comply with government regulations or make capital expenditures required to maintain compliance with governmental regulations may adversely impact the Company’s business operations and prospects for future growth and its ability to participate in federal and state healthcare programs. In addition, changes in federal or state minimum wage and overtime laws could cause the Company to incur additional wage costs, which could adversely affect the Company's operating margins.
The Company cannot predict the nature of future laws, regulations, interpretations or applications, nor can the Company determine the effect that additional governmental regulations or administrative orders, when and if promulgated, or disparate federal, state and local regulatory schemes would have on the Company’s future business. They may, however, impose additional requirements or restrictions on the products the Company sells, require that the Company recall or discontinue sale of certain products, make substantial changes to the Company’s facilities or operations, or otherwise result in changes to the manner in which the Company operates its businesses. Any or all of such requirements may adversely affect the Company’s financial condition and results of operations.
The Company’s supplier base includes domestic and foreign suppliers, and the Company has a small number of licensed stores in foreign countries. Accordingly, political or financial instability in these foreign countries, changes in U.S. and foreign relationships, laws and regulations affecting the importation and taxation of goods, including duties, tariffs and quotas, or changes in the enforcement of those laws and regulations could adversely impact the Company’s financial condition and results of operations. In addition, the Company is required to comply with laws and regulations governing ethical, anti-bribery and similar business practices. In our foreign operations, the Company is subject to the risk that one or more of its employees, contractors or agents could engage in business practices prohibited by U.S. laws and regulations that are applicable to the Company, such as the Foreign Corrupt Practices Act, including those based in or from countries where practices that violate U.S. laws and regulations or the laws and regulations of other countries may be customary, or will engage in business practices that are prohibited by the Company’s policies or circumvent its compliance programs. Any of these violations could adversely affect the Company’s business, financial condition and operating results. The Company may choose to pursue further expansion into international markets. If the Company seeks and attains a larger international footprint, it would be required to comply with additional foreign laws and regulations. Any failure to comply with these laws or regulations could result in civil and/or criminal sanctions and could adversely affect the Company’s financial condition and results of operations. Further, foreign currency exchange rates and fluctuations may have an effect on our future costs or on future cash flows from our foreign operations, and could adversely affect our financial condition and operating results.
The Company may face significant costs for compliance with existing or changing environmental, health, food safety and safety requirements and for potential environmental obligations relating to current or discontinued operations.
The Company’s operations are subject to extensive and increasingly stringent federal, state, local and foreign laws and regulations pertaining to the protection of the environment, including those relating to the discharge of materials into the environment, the disposal of food by-products, the handling, treatment and disposal of wastes and remediation of soil and groundwater contamination. Failure to comply with these requirements could have serious consequences for the Company, including criminal, as well as civil and administrative penalties, claims for property damage, personal injury and damage to natural resources and negative publicity. Compliance with existing or changing environmental requirements, including more stringent limitations imposed or expected to be imposed in recently renewed or soon-to-be renewed environmental permits, may require capital expenditures.
20
Operations at many of the Company’s facilities require the treatment and disposal of wastewater, storm-water and agricultural and food processing wastes, the use and maintenance of refrigeration systems, including ammonia-based chillers, noise, odor and dust management, the operation of mechanized processing equipment, and other operations that potentially could affect the environment, health and safety. Some of the Company’s facilities have been operating for many years, and were built before current environmental standards were imposed, and/or in areas that recently have become subject to residential and commercial development pressures. Failure to comply with current and future environmental, health and safety standards could result in the imposition of fines and penalties, and the Company has been subject to such sanctions from time to time. New environmental, health and safety requirements, stricter interpretations of existing requirements, or obligations related to the investigation or clean-up of contaminated sites, may materially affect the Company’s business or operations in the future.
Real or perceived food quality and food or drug safety issues and related unfavorable publicity could adversely affect the Company’s operating results and reputation.
There is increasing governmental scrutiny, regulations and public awareness regarding food quality and food and drug safety. The Company may be adversely affected if consumers lose confidence in the safety and quality of the Company’s food and drug products. Any events that give rise to actual or potential food contamination, drug contamination or food-borne illness or injury, or events that give rise to claims that the Company’s products are not of the quality or composition claimed to be, may result in product liability claims from individuals, consumers and governmental agencies, penalties and enforcement actions from government agencies, a loss of consumer confidence and harm to the Company’s reputation. In addition, adverse publicity about these types of concerns, whether valid or not, may discourage consumers from buying the Company’s products or cause production and delivery disruptions, which may adversely affect the Company’s financial condition and results of operations. It may be necessary for the Company to recall unsafe, contaminated or defective products. Recall costs and product liability claims can be material. While the Company generally seeks contractual indemnification and insurance coverage from its suppliers, it might not be able to recover these significant costs from its suppliers.
The Company’s businesses may become subject to legal proceedings that may adversely affect the Company’s financial condition and results of operations.
The Company’s businesses are subject to the risk of legal proceedings by employees, unions, consumers, customers, suppliers, stockholders, debt holders, governmental agencies or others through private actions, class actions, administrative proceedings, regulatory actions or other litigation or proceeding. The outcome of litigation, particularly class action lawsuits and regulatory actions, is difficult to assess or quantify. Plaintiffs in these types of lawsuits may seek recovery of very large amounts, and the magnitude of the potential loss relating to such lawsuits may remain unknown for substantial periods of time. The cost to defend future litigation may be significant. There may also be adverse publicity associated with litigation that may decrease consumer confidence in the Company’s businesses, regardless of whether the allegations are valid or whether the Company is ultimately found liable. As a result, litigation may adversely affect the Company’s financial condition and results of operations. See also “Item 3 Legal Proceedings” below.
Efforts to reduce pharmacy reimbursement levels and alter health care financing practices may adversely affect the Company’s results of operations.
The continued efforts of health maintenance organizations, managed care organizations, pharmacy benefit managers, government entities and other third party payors to reduce prescription drug costs and pharmacy reimbursement rates may impact the Company’s profitability. In particular, increased utilization of generic pharmaceuticals (which normally yield a higher gross profit rate than equivalent brand named drugs) has resulted in pressure to decrease reimbursement payments to the Company’s pharmacies for generic drugs, causing a reduction in the Company’s generic profit rate. Additionally, there has been significant consolidation within the generic manufacturing industry, and it is possible that this and other external factors may enhance the ability of manufacturers to sustain or increase pricing of generic pharmaceuticals and diminish the Company’s ability to negotiate reduced acquisition costs. Any inability to offset increased costs or to modify the Company’s activities to lessen the impact could have an adverse effect on the Company’s results of operations.
In addition, during the past several years, the United States health care industry has been subject to an increase in governmental regulation and audits at both the federal and state levels. Efforts to control health care costs, including prescription drug costs, are continuing at the federal and state government levels. Changing political, economic and regulatory influences may significantly affect health care financing and reimbursement practices. A change in the composition of pharmacy prescription volume toward programs offering lower reimbursement rates could negatively impact the Company’s profitability. The Patient Protection and Affordable Care Act made several significant changes to Medicaid rebates and to reimbursement. One of these changes was to revise the definition of the Average Manufacturer Price, a pricing element common to most payment formulas,
21
and the reimbursement formula for multi-source (i.e., generic) drugs. This change will affect the Company’s reimbursement. In addition, the Patient Protection and Affordable Care Act made other changes that affect the coverage and plan designs that are or will be provided by many of the Company’s health plan clients, including the requirement for health insurers to meet a minimum medical loss ratio to avoid having to pay rebates to enrollees. These Patient Protection and Affordable Care Act changes may not affect the Company’s business directly, but they could indirectly impact the Company’s services and/or business practices.
The Company may be unable to adequately protect its intellectual property rights, which could harm the Company’s business.
The Company relies on a combination of trademark, trade secret, copyright and domain name law and internal procedures and nondisclosure agreements to protect its intellectual property. The Company believes its trademarks, private label products and domain names are valuable assets. However, the Company’s intellectual property rights may not be sufficient to distinguish the Company’s products and services from those of its competitors and to provide the Company with a competitive advantage. From time to time, third parties may use names, logos and slogans similar to the Company’s, may apply to register trademarks or domain names similar to the Company’s, and may infringe or otherwise violate the Company’s intellectual property rights. The Company’s intellectual property rights may not be successfully asserted against such third parties or may be invalidated, circumvented or challenged. Asserting or defending the Company’s intellectual property rights could be time consuming and costly and could distract management’s attention and resources. If the Company is unable to prevent its competitors from using names, logos, slogans and domain names similar to the Company’s, consumer confusion could result, the perception of the Company’s brands and products could be negatively affected, and the Company’s sales and profitability could suffer as a result. In addition, if the Company’s independent retail customers or Save-A-Lot licensees receive negative publicity or fail to maintain the quality of the goods and services used in connection with the Company’s trademarks, the Company’s rights to, and the value of, its trademarks could potentially be harmed. Failure to protect the Company’s proprietary information could also have an adverse effect on its business.
The Company may also be subject to claims that its activities or the products it sells infringe, misappropriate or otherwise violate the intellectual property rights of others. Any such claims can be time consuming and costly to defend and may distract management’s attention and resources, even if the claims are without merit. Such claims may also require the Company to enter into costly settlement or license agreements (which could, for example, prevent the Company from using its trademarks in certain geographies or in connection with certain products and services), pay costly damage awards, and face a temporary or permanent injunction prohibiting the Company from marketing or providing the affected products and services, any of which could have an adverse effect on the Company’s business.
Severe weather and natural disasters may harm the Company’s business.
Severe weather conditions and natural disasters such as hurricanes, earthquakes, floods, extended winter storms or tornadoes, as well as other natural disasters, in areas in which the Company or its independent retail customers or licensees have stores, offices or distribution facilities or from which the Company obtains products may cause physical damage to the Company’s properties, closure of one or more of the Company’s or its independent retail customers’ or licensees’ stores, offices or distribution facilities, lack of an adequate work force in a market, temporary disruption in the supply of products, disruption in the transport of goods, delays in the delivery of goods to distribution centers or stores, a reduction in customer volume and a reduction in the availability of products in the Company’s or its independent retail customers’ or licensees’ stores. In addition, adverse climate conditions and adverse weather patterns, such as drought or flood, that impact growing conditions and the quantity and quality of crops yielded by food producers may adversely affect the availability or cost of certain products within the grocery supply chain. Any of these factors may disrupt the Company’s businesses and adversely affect the Company’s financial condition and results of operations.
Disruption to the supply chain and distribution network could have an adverse impact on the Company’s sales and operating results.
The Company’s sales and operating results could be adversely impacted if the Company is not able to provide goods to the Company’s stores and its customers’ and licensees’ stores in a timely and cost-effective manner, to maintain continued supply, pricing or access to new products or to identify alternative sources of merchandise without delay and at similar cost and quality levels. Additionally, perishable products make up an increasingly significant portion of our sales, and we rely on various suppliers to provide and deliver our perishable product inventory on a continuous basis.
Factors that may disrupt the Company’s ability to maintain an uninterrupted supply chain and distribution network include weather, product recalls, crop conditions, regulatory actions, disruptions in technology, political or financial instability for
22
suppliers, transportation interruptions, labor supply or stoppages or vendor defaults or disputes, as well as other risk factors mentioned, any of which could also have an adverse effect on the Company’s sales and operating results. Disruptions to the national and international transportation infrastructure that lead to delays or interruptions of deliveries could also negatively affect the Company’s business.
Changes in the military commissary system or decreases in governmental funding could negatively impact the sales and operating performance of the Company’s military business.
The Company’s Wholesale segment sells and distributes grocery products to military commissaries and exchanges in the United States. The Company’s military business faces competition from large national and regional food distributors as well as smaller food distributors. Due to the narrow operating margins in the military food distribution industry, it is of critical importance for distributors to achieve economies of scale. Any material changes in the commissary system, the level of governmental funding to the Defense Commissary Agency (“DeCA”), military staffing levels, or the locations of bases may have a corresponding impact on the sales and operating performance of the Company’s military business. Mandated reductions in government expenditures, including those imposed as a result of sequestration, may impact the level of funding to the DeCA and could have a material impact on the Company’s operations.
The Company’s insurance and self-insurance programs may not be adequate to cover future claims.
The Company uses a combination of insurance and self-insurance to provide for potential liabilities for workers’ compensation, automobile and general liability, director and officer liability, property risk, cyber and privacy risks and employee healthcare benefits. The Company estimates the liabilities associated with the risks retained by the Company, in part, by considering historical claims experience, demographic and severity factors and other actuarial assumptions, which, by their nature, are subject to a degree of variability. Any actuarial projection of losses concerning workers’ compensation and general and automobile liability is subject to a degree of variability. Among the causes of this variability are unpredictable external factors affecting future inflation rates, discount rates, rising health care costs, litigation trends, legal interpretations, benefit level changes and actual claim settlement patterns. For example, the Company believes that its insurance coverage will mitigate the financial impact of the criminal intrusions to the Company’s information technology systems that it experienced in fiscal 2015; however, the Company cannot be certain that its coverage will fully mitigate the financial impact of the intrusions or that such coverage will not be disputed.
Some of the many sources of uncertainty in the Company’s reserve estimates include changes in benefit levels, medical fee schedules, medical utilization guidelines, vocation rehabilitation and apportionment. If the number or severity of claims for which the Company is self-insured increases, or the Company is required to accrue or pay additional amounts because the claims prove to be more severe than the Company’s original assessments, the Company’s financial condition and results of operations may be adversely affected.
Volatility in fuel and energy costs and risk associated with the Company’s compressed natural gas program could adversely affect the Company’s results of operations.
The Company’s operations are dependent on the availability of a significant amount of energy and fuel to store and transport products. Energy and fuel costs are influenced by supply as well as international, political and economic circumstances and have experienced volatility over time. To reduce the impact of volatile fuel and energy costs, the Company has entered into contracts to purchase fuel, electricity and natural gas at fixed prices to satisfy a portion of its expected needs. Additionally, the Company has invested in approximately 60 semitrailer trucks powered by compressed natural gas. In the recent past, the price of natural gas has been volatile, and this volatility may continue. Additionally, having compressed natural gas equipment and a fueling station entails inherent risks, including equipment defects, malfunctions and failures and natural disasters, which could result in flows of natural gas, fires, explosions and other damages, and could subject the Company to additional regulation. Volatility in fuel and energy costs that exceeds offsetting contractual arrangements, or failure to recognize the anticipated benefits from the compressed natural gas program, could adversely affect the Company’s results of operations.
23
Impairment charges for long-lived assets or goodwill may adversely affect the Company’s financial condition and results of operations.
The Company monitors the recoverability of its long-lived assets such as buildings and equipment and evaluates their carrying value for impairment whenever events or changes in circumstances indicate that the carrying amount of such assets may not be fully recoverable. Events that may trigger such an evaluation include current period losses combined with a history of losses or a projection of continuing losses, a significant decrease in the market value of an asset or the Company’s plans for store closures. When such events or changes in circumstances occur, a recoverability test is performed by comparing projected undiscounted future cash flows to the carrying value of the group of assets being tested.
The Company annually reviews goodwill to determine if impairment has occurred. Additionally, interim reviews are performed whenever events or changes in circumstances indicate that impairment may have occurred. If the testing performed indicates that impairment has occurred, the Company is required to record a non-cash impairment charge for the difference between the carrying value of the goodwill and the implied fair value of the goodwill in the period the determination is made.
The testing of goodwill for impairment requires the Company to make significant estimates about its weighted average cost of capital, future revenue, profitability, cash flows, fair value of assets and liabilities, as well as other assumptions. These estimates may be affected by significant variability, including potential changes in economic, industry or market conditions, changes in business operations and market strategies, changes in competition or changes in the Company’s stock price and market capitalization. Changes in these factors, or changes in actual performance compared with estimates of the Company’s future performance, may affect the fair value of goodwill, which may result in an impairment charge.
The Company cannot accurately predict the amount or timing of any impairment of assets. Should the value of long-lived assets or goodwill become impaired, the Company’s financial condition and results of operations may be adversely affected.
The Company’s stock price is subject to market and other conditions and may be volatile.
The market price of the Company’s common stock may fluctuate significantly in response to a number of factors. These factors, some of which may be beyond the Company’s control, include the perceived prospects and actual operating results of the Company’s business; changes in estimates of the Company’s operating results by analysts, investors or the Company; trading activity by our large stockholders; the Company’s actual operating results relative to such estimates or expectations; actions or announcements by the Company or its competitors; litigation and judicial decisions; legislative or regulatory actions; and changes in general economic or market conditions. In addition, the stock market in general has from time to time experienced extreme price and volume fluctuations. These market fluctuations could reduce the market price of the Company’s common stock for reasons unrelated to the Company’s operating performance.
ITEM 1B. UNRESOLVED STAFF COMMENTS
None.
ITEM 2. PROPERTIES
The Company’s properties are in good condition, well maintained and suitable to carry on its business. Substantially all of the Company’s owned and ground-leased real estate are subject to mortgages to secure the Company’s bank credit facilities. Additional information on the Company’s properties can be found in Part I, Item 1 of this Annual Report on Form 10-K.
24
Total Wholesale distribution center square footage as of February 27, 2016 was approximately 13 million, of which 17 percent was leased or owned by NAI and operated by the Company, comprised of 7 million used to provide wholesale distribution to independent retail customers, of which 8 percent was leased, and 5 million used to provide wholesale distribution to independent retail customers and Company-operated retail stores in the Retail segment, of which 30 percent was leased or owned by NAI and operated by the Company. The percentages referring to property being leased or owned by NAI and operated by the Company refer to a facility in Pennsylvania that is owned by NAI and that the Company operates under an operating agreement that has an initial term of five years, subject to renewal at the Company's option for two additional five-year terms and certain termination rights for both the Company and NAI. The Company has exercised its first extension option, subject to such termination rights.
Total Save-A-Lot corporate-owned store square footage as of February 27, 2016 was approximately 8 million, of which 92 percent was leased. The Company’s Save-A-Lot operations are supplied by dedicated distribution centers with total square footage of 5 million, of which approximately 28 percent was leased, as of February 27, 2016. Total Retail store square footage was 11 million, of which approximately 83 percent was leased, and dedicated distribution center square footage was approximately one million related to an owned facility that provides wholesale distribution to a Retail banner, as of February 27, 2016.
In addition to its principal executive offices in Eden Prairie, Minnesota, the Company maintains store support centers in Boise, Idaho (which is owned by NAI and leased to the Company, but at which the Company has employees and provides services to NAI and Albertson’s LLC) and St. Louis, Missouri.
The Company has 3 million of square footage of surplus retail stores and distribution centers, 95 percent of which was leased, including square footage that is vacant or sub-leased, as of February 27, 2016.
ITEM 3. LEGAL PROCEEDINGS
The Company is subject to various lawsuits, claims and other legal matters that arise in the ordinary course of conducting business. In the opinion of management, based upon currently available facts, the likelihood that the ultimate outcome of any lawsuits, claims and other proceedings will have a material adverse effect on the overall results of the Company’s operations, its cash flows or its financial position is remote. See Note 14—Commitments, Contingencies and Off-Balance Sheet Arrangements in Part II, Item 8 of this Annual Report on Form 10-K under the caption “Legal Proceedings” for a discussion of certain of the Company’s legal proceedings.
ITEM 4. MINE SAFETY DISCLOSURES
Not applicable.
25
PART II
ITEM 5. MARKET FOR THE REGISTRANT’S COMMON EQUITY, RELATED STOCKHOLDER MATTERS AND ISSUER PURCHASES OF EQUITY SECURITIES
The Company’s common stock is listed on the New York Stock Exchange under the symbol SVU. As of April 22, 2016, there were 17,081 stockholders of record.
Common Stock Price
Common Stock Price Range | ||||||||||||||||
2016 | 2015 | |||||||||||||||
Fiscal | High | Low | High | Low | ||||||||||||
First Quarter | $ | 12.00 | $ | 8.22 | $ | 8.12 | $ | 6.05 | ||||||||
Second Quarter | 9.37 | 7.26 | 9.78 | 7.57 | ||||||||||||
Third Quarter | 8.27 | 6.15 | 9.76 | 7.83 | ||||||||||||
Fourth Quarter | 7.17 | 3.94 | 10.49 | 8.72 | ||||||||||||
Year | $ | 12.00 | $ | 3.94 | $ | 10.49 | $ | 6.05 | ||||||||
The Company did not declare any dividends in fiscal 2015 or fiscal 2016 and the Company has no current intent to pay dividends. The Company is limited in the aggregate amount of dividends that it may pay under the terms of the Company's $1,500 term loan facility (the “Secured Term Loan Facility”) and the Company’s $1,000 asset-based revolving ABL credit facility (the “Revolving ABL Credit Facility”) and would need to meet certain conditions under these credit facilities before paying a dividend, as described in Note 7—Long-Term Debt in Part II, Item 8 of this Annual Report on Form 10-K. The payment of future dividends is subject to the discretion of the Company’s Board of Directors and the requirements of Delaware law, and will depend on a variety of factors that the Company’s Board of Directors may deem relevant.
Company Purchases of Equity Securities
The following table sets forth the Company’s purchases of equity securities for the periods indicated:
(in millions, except shares and per share amounts) Period (1) | Total Number of Shares Purchased (2) | Average Price Paid Per Share | Total Number of Shares Purchased as Part of Publicly Announced Plans or Programs | Approximate Dollar Value of Shares that May Yet be Purchased Under the Plans or Programs | ||||||||||
First four weeks | ||||||||||||||
December 6, 2015 to January 2, 2016 | 6,499 | $ | 7.01 | — | $ | — | ||||||||
Second four weeks | ||||||||||||||
January 3, 2016 to January 30, 2016 | 762 | $ | 4.32 | — | $ | — | ||||||||
Third four weeks | ||||||||||||||
January 31, 2016 to February 27, 2016 | — | $ | — | — | $ | — | ||||||||
Totals | 7,261 | $ | 6.73 | — | $ | — | ||||||||
(1) | The reported periods conform to the Company’s fiscal calendar composed of thirteen 28-day periods. |
(2) | These amounts represent the deemed surrender by participants in the Company’s compensatory stock plans of 7,261 shares of previously issued common stock. These amounts are in payment of the purchase price for shares acquired pursuant to the exercise of stock options and satisfaction of tax obligations arising from such exercises, as well as from the vesting of restricted stock awards granted under such plans. |
Stock Performance Graph
The following graph compares the yearly change in the Company’s cumulative shareholder return on its common stock for the period from the end of fiscal 2011 to the end of fiscal 2016 to that of the Standard & Poor’s (“S&P”) MidCap 400, a group of peer companies in the retail grocery and distribution industries, which are the same peer companies as used in fiscal 2015 other than Spartan Stores Inc. is now SpartanNash Corporation. The stock price performance shown below is not necessarily indicative of future performance.
26
COMPARISON OF CUMULATIVE TOTAL SHAREHOLDER RETURN AMONG
Supervalu, S&P MidCap 400 and Peer Group(1)
February 26, 2011 through February 27, 2016(2)
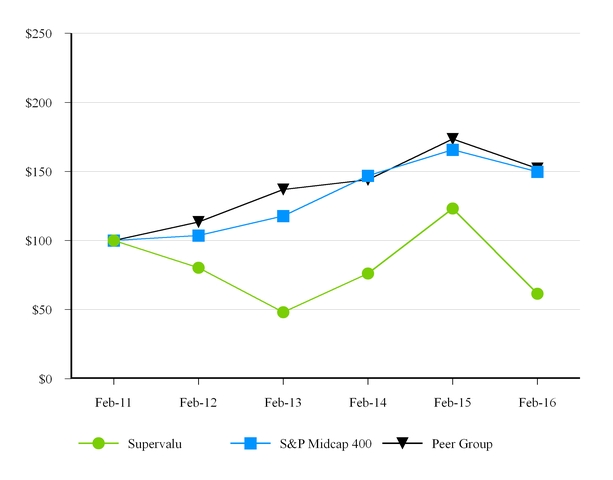
Date | Supervalu | S&P Midcap 400 | Peer Group(3) | |||||||||
(in dollars) | ||||||||||||
February 25, 2011 | $ | 100.00 | $ | 100.00 | $ | 100.00 | ||||||
February 24, 2012 | $ | 80.29 | $ | 103.62 | $ | 113.44 | ||||||
February 22, 2013 | $ | 48.00 | $ | 117.84 | $ | 136.93 | ||||||
February 21, 2014 | $ | 76.05 | $ | 146.98 | $ | 144.03 | ||||||
February 27, 2015 | $ | 123.18 | $ | 165.70 | $ | 173.54 | ||||||
February 26, 2016 | $ | 61.46 | $ | 149.82 | $ | 152.21 | ||||||
(1) | Total return assuming $100 invested on February 25, 2011 and reinvestment of dividends on the day they were paid. |
(2) | The Company’s fiscal year ends on the last Saturday in February. |
(3) | The Company's peer group consists of SpartanNash Corporation, Wal-Mart Stores, Inc., Target Corporation, Sysco Corporation, The Fresh Market, Inc., Delhaize Group SA and Roundy's, Inc. Roundy's Inc. has been included in the Company's peer group until it was acquired in late calendar year 2015. |
The performance graph above is being furnished solely to accompany this Annual Report on Form 10-K pursuant to Item 201(e) of Regulation S-K, is not being filed for purposes of Section 18 of the Exchange Act and shall not be deemed soliciting material, and is not to be incorporated by reference into any filing of the Company, whether made before or after the date hereof, regardless of any general incorporation language in such filing.
27
ITEM 6. SELECTED FINANCIAL DATA
(Dollars and shares in millions, except per share data and stores) | 2016 (52 weeks) | 2015(1) (53 weeks) | 2014(1) (52 weeks) | 2013(1) (52 weeks) | 2012(1) (52 weeks) | ||||||||||||||
Results of Operations | |||||||||||||||||||
Net sales | $ | 17,529 | $ | 17,917 | $ | 17,252 | $ | 17,236 | $ | 17,479 | |||||||||
Cost of sales | 14,945 | 15,329 | 14,712 | 14,893 | 15,017 | ||||||||||||||
Gross profit | 2,584 | 2,588 | 2,540 | 2,343 | 2,462 | ||||||||||||||
Selling and administrative expenses | 2,124 | 2,164 | 2,117 | 2,487 | 2,266 | ||||||||||||||
Goodwill and intangible asset impairment charges | 6 | — | — | 6 | 92 | ||||||||||||||
Operating earnings (loss)(2) | 454 | 424 | 423 | (150 | ) | 104 | |||||||||||||
Interest expense, net(3) | 196 | 243 | 407 | 269 | 247 | ||||||||||||||
Equity earnings in unconsolidated affiliates | (5 | ) | (4 | ) | (2 | ) | (3 | ) | (5 | ) | |||||||||
Earnings (loss) from continuing operations before income taxes(2)(3) | 263 | 185 | 18 | (416 | ) | (138 | ) | ||||||||||||
Income tax provision (benefit) | 85 | 58 | 5 | (163 | ) | (41 | ) | ||||||||||||
Net earnings (loss) from continuing operations | 178 | 127 | 13 | (253 | ) | (97 | ) | ||||||||||||
Income (loss) from discontinued operations, net of tax | 8 | 72 | 176 | (1,203 | ) | (930 | ) | ||||||||||||
Net earnings (loss) including noncontrolling interests | 186 | 199 | 189 | (1,456 | ) | (1,027 | ) | ||||||||||||
Less net earnings attributable to noncontrolling interests | (8 | ) | (7 | ) | (7 | ) | (10 | ) | (13 | ) | |||||||||
Net earnings attributable to SUPERVALU INC. | $ | 178 | $ | 192 | $ | 182 | $ | (1,466 | ) | $ | (1,040 | ) | |||||||
Net earnings (loss) from continuing operations per share—diluted(2)(3) | $ | 0.63 | $ | 0.45 | $ | 0.02 | $ | (1.24 | ) | $ | (0.52 | ) | |||||||
Financial Position of Continuing Operations | |||||||||||||||||||
Working capital(4) | $ | 278 | $ | 394 | $ | 302 | $ | 48 | $ | (216 | ) | ||||||||
Total assets(5) | $ | 4,370 | $ | 4,434 | $ | 4,283 | $ | 4,472 | $ | 5,008 | |||||||||
Total debt and capital lease obligations | $ | 2,524 | $ | 2,693 | $ | 2,734 | $ | 2,809 | $ | 3,177 | |||||||||
Stockholders’ (deficit) equity | $ | (441 | ) | $ | (646 | ) | $ | (738 | ) | $ | (1,415 | ) | $ | 21 | |||||
Other Statistics | |||||||||||||||||||
Dividends declared per share | $ | — | $ | — | $ | — | $ | 0.0875 | $ | 0.3500 | |||||||||
Weighted average shares outstanding—diluted(6) | 268 | 264 | 258 | 212 | 212 | ||||||||||||||
Depreciation and amortization | $ | 276 | $ | 285 | $ | 302 | $ | 365 | $ | 355 | |||||||||
Capital expenditures(7) | $ | 281 | $ | 240 | $ | 113 | $ | 241 | $ | 403 | |||||||||
Adjusted EBITDA(8) | $ | 771 | $ | 789 | $ | 772 | $ | 493 | $ | 574 | |||||||||
Stores Supplied and Operated: | |||||||||||||||||||
Wholesale primary stores | 1,796 | 1,825 | 1,819 | 1,901 | 1,948 | ||||||||||||||
Wholesale secondary stores | 232 | 208 | 424 | 441 | 765 | ||||||||||||||
Save-A-Lot licensee stores | 897 | 903 | 948 | 950 | 935 | ||||||||||||||
Save-A-Lot corporate stores | 463 | 431 | 382 | 381 | 397 | ||||||||||||||
Retail stores | 200 | 194 | 190 | 191 | 191 | ||||||||||||||
Total number of stores | 3,588 | 3,561 | 3,763 | 3,864 | 4,236 | ||||||||||||||
(1) | The presentation of certain professional services and certain other transactions has been revised to conform to the current year presentation. Refer to Note 1—Summary of Significant Accounting Policies within Part II, Item 8 of this Annual Report on Form 10-K for additional information. |
(2) | Pre-tax items recorded in fiscal 2016 included $15 of costs related to the potential separation of Save-A-Lot, $12 of store closure and impairment charges, $8 of severance costs and $6 of intangible asset impairment charges. |
Pre-tax items recorded in fiscal 2015 included $64 of non-cash pension settlement charges, a $5 benefit plan charge, $3 of store closure charges, $2 of net information technology intrusion costs and $1 of severance costs.
Pre-tax items recorded in fiscal 2014 included $46 of severance costs and accelerated stock-based compensation charges, $16 of non-cash asset impairment and other charges, $6 of contract breakage and other costs, a $5 legal settlement charge, and a $3 multi-employer pension withdrawal charge, offset in part by a $15 gain on sale of property.
Pre-tax items recorded in fiscal 2013 included $227 of non-cash asset impairment and other charges, $36 of severance costs and a multiemployer pension withdrawal charge, $22 of store closure impairment charges and costs and $6 of non-cash intangible asset impairment charges, offset in part by $10 in a cash settlement received from credit card companies.
Pre-tax items recorded in fiscal 2012 included $92 of non-cash goodwill impairment charges and severance costs of $15.
(3) | Pre-tax items recorded in fiscal 2016 included $6 of debt refinancing costs and $4 of non-cash unamortized financing cost charges, within interest expense, net. |
Pre-tax items recorded in fiscal 2015 included $37 of debt refinancing costs and $6 of non-cash unamortized financing cost charges, within interest expense, net.
Pre-tax items recorded in fiscal 2014 included $99 of non-cash unamortized financing cost charges and original issue discount acceleration and $75 of debt refinancing costs, both reflected within interest expense, net.
28
A pre-tax item recorded in fiscal 2013 included $22 of non-cash unamortized financing charges within interest expense, net.
(4) | Working capital of continuing operations is calculated using the first-in, first-out method (“FIFO”), after adding back the last-in, first-out method (“LIFO”) reserve. The LIFO reserve for each year is as follows: $215 for fiscal 2016, $211 for fiscal 2015, $202 for fiscal 2014, $211 for fiscal 2013 and $207 for fiscal 2012. Current assets of discontinued operations at the end of each fiscal year were as follows: $0 for fiscal 2016, 2015 and 2014, $1,494 for fiscal 2013 and $1,616 for fiscal 2012. Current liabilities of discontinued operations at the end of each fiscal year were as follows: $0 for fiscal 2016, 2015 and 2014, $2,701 for fiscal 2013 and $1,606 for fiscal 2012. |
(5) | Total assets of continuing operations are calculated as Total assets of the Company excluding current assets and long-term assets of discontinued operations. |
(6) | Weighted average shares outstanding—diluted, as presented here, represents the diluted weighted average shares outstanding utilized in the computation of Net earnings (loss) from continuing operations per share—diluted. |
(7) | Capital expenditures include cash payments for purchases of property, plant and equipment and non-cash capital lease additions, and exclude cash payments for business acquisitions. |
(8) | Adjusted EBITDA is a non-GAAP financial measure that the Company provides as a supplement to our results of operations and related analysis, and should not be considered superior to, a substitute for or an alternative to any financial measure of performance prepared and presented in accordance with GAAP (defined below). Refer to the “Non-GAAP Financial Measures” section of Part II, Item 7 of this Annual Report on Form 10-K for a reconciliation to the applicable GAAP financial measure and additional information regarding the Company’s use of non-GAAP financial measures. |
Historical data is not necessarily indicative of the Company’s future results of operations or financial condition. See discussion of “Risk Factors” in Part I, Item 1A of this Annual Report on Form 10-K.
29
ITEM 7. MANAGEMENT’S DISCUSSION AND ANALYSIS OF FINANCIAL CONDITION AND RESULTS OF OPERATIONS
(Dollars and shares in millions, except per share data)
This Management’s Discussion and Analysis of Financial Condition and Results of Operations should be read in conjunction with the audited Consolidated Financial Statements and the information contained under the captions “Risk Factors” and “Cautionary Statements for Purposes of the Safe Harbor Provisions of the Private Securities Litigation Reform Act” contained in this Annual Report on Form 10-K.
MANAGEMENT OVERVIEW
Business Overview
Supervalu operates its business in three segments: Wholesale, Save-A-Lot and Retail. Supervalu, through its Wholesale segment, is one of the largest wholesale distributors to independent retail customers across the United States. Save-A-Lot is one of the nation’s largest hard discount grocery retailers by store count. The Company's Retail business operates traditional grocery stores under the five regionally-based banners of Cub Foods, Shoppers Food & Pharmacy, Shop 'n Save, Farm Fresh and Hornbacher’s, and also operates two retail stores under the Rainbow banner and two retail stores under the County Market banner. The Company leverages its distribution operations by providing wholesale distribution and business service solutions to its independent retail customers and distribution to its Retail stores through the Wholesale segment. The Company's Save-A-Lot distribution operations are leveraged by providing wholesale distribution and service solutions to its licensees, and distribution to Save-A-Lot corporate stores.
Business Strategies and Initiatives
The Company continues to be focused on increasing sales and operating cash flow, improving its balance sheet and generating returns for its stockholders. Effective February 5, 2016, Mark Gross was appointed as the Company’s President and Chief Executive Officer. The Company’s vision, which has and will continue to guide its strategic and operational decisions, is for the Company to be the leading distributor of consumable products and provider of services to retailers in the United States. Initiatives in each of the Company’s segments include:
Wholesale:
• | Targeting sales growth by continuing to affiliate new customers, including affiliations of larger chain businesses, and more aggressively pursuing external growth and market opportunities |
• | Driving sales to existing customers by enhancing the Company's offerings through professional services, including merchandise and promotional planning, design and back-office technical and financial services, and product offerings, such as produce |
• | Improving the efficiency of the Company's operations, including its IT infrastructure and maximizing the use of trucking miles and warehouse capacity |
• | Strengthening core merchandising and marketing programs, including leveraging the Company's private-label programs such as the Essential Everyday® and Equaline® labels while marketing and adding depth to the Wild Harvest® and Culinary Circle® brands |
• | Reducing inventory shrink rates within the Company's warehouses |
Save-A-Lot:
• | Increasing sales and performance in the existing Save-A-Lot network of stores by expanding the sales per square foot of existing corporate stores through store resets, product assortment alterations, ad strategy changes, continued refinement of private-label programs, and differentiation through fresh offerings |
• | Growing the Save-A-Lot store footprint through new corporate and licensed store openings |
• | Optimizing the store network; opportunistically converting corporate stores to licensed stores and vice versa for profitable growth |
• | Improving operational efficiencies and managing costs to offer compelling value to customers |
Retail:
• | Driving profitable sales by investing in price, optimizing promotions and enhancing product offerings and displays with local, growing and private label categories |
• | Driving store performance by managing inventory levels and reducing inventory shrink rates, as well as standardizing certain store processes |
30
• | Continued development and sales penetration of the Company's private label product offerings, including organic products, by providing innovative products in multiple channels across Retail and Wholesale |
• | Increasing capital spending on new stores, relocations and targeted store remodels |
Corporate:
• | Continued management of the Company's overhead cost structure to enable investments in lower prices to customers |
• | Providing high-quality administrative support services by enhancing the Company's service offerings and information technology systems |
• | Continued exploration of a potential separation of the Save-A-Lot business |
◦ | On July 28, 2015, the Company announced that it is exploring a separation of its Save-A-Lot segment, and that as part of that process it had begun preparations to allow for a possible spin-off of Save-A-Lot into a stand-alone, publicly traded company. On January 7, 2016, Save-A-Lot, Inc. filed a Form 10 with the SEC as part of its potential separation from the Company. No specific timetable for a separation has been set and there can be no assurance that a separation will be completed or that any other change in the Company’s overall structure or business model will occur. |
◦ | Building a quality Save-A-Lot management team, including Eric Claus as Chief Executive Officer, who brings over thirty years of experience in the retail industry where he has gained deep experience in both hard discount and grocery retail in both the United States and Canada. |
Fiscal 2016 Highlights
Improvements to the Company's financial condition include:
• | Redeemed the remaining $278 of the Company's 8.00% Senior Notes due May 2016 with borrowings under the Revolving ABL Credit Facility and internally generated funds, which reduced borrowings, extended debt maturities and lowered the prevailing interest rate on borrowings |
• | Amended, repriced and extended the Revolving ABL Credit Facility to reduce the rates on borrowings and letters of credit and the facility fees, as well as extend its maturity by approximately sixteen months to February 3, 2021. This amendment also provides flexibility for a spin-off of Save-A-Lot |
• | Funded $25 of discretionary pension contributions |
Financial highlights for fiscal 2016 compared to fiscal 2015 include:
• | Net sales decreased $388, which included a decrease of $313 from the additional week in fiscal 2015. Excluding the additional week of sales in fiscal 2015, Net sales decreased by $75 primarily related to lower sales from closed stores, lost customers and lower identical store sales, offset in part by new store sales, sales to new customers and higher transition service agreement fees. |
◦ | Wholesale Net sales were negatively impacted in fiscal 2016 by the loss of distribution to certain Albertson's stores in the Southeast along with softer year-over-year sales to existing customers. |
◦ | Save-A-Lot opened 80 new stores, comprised of 42 new corporate stores and 38 new licensee stores, and closed 54 Save-A-Lot stores, comprised of 36 licensee stores and 18 corporate stores. In addition, eight Save-A-Lot licensee stores were converted to corporate stores. The Company plans to open approximately 75 new Save-A-Lot stores in fiscal 2017. |
◦ | Within Retail, management believes pricing and promotional adjustments in fiscal 2016 to partially mitigate compressed pharmacy margins due to lower managed care reimbursement rates negatively impacted Retail traffic levels and Net sales in fiscal 2016. This pharmacy margin compression is expected to continue to impact Retail's results of operations. |
◦ | The Company's private brands product assortment and offerings resonated with customers in fiscal 2016, resulting in an improvement to the Company's private brands penetration rate of approximately 100 basis points within Save-A-Lot and Retail. |
• | Gross profit decreased $4, which included a decrease of $49 from the additional week of sales in fiscal 2015. Excluding the additional week of sales in fiscal 2015, Gross profit increased $45 primarily due to higher base margins, lower logistics costs, higher transition service agreement fees and higher trucking back-haul income, offset in part by higher employee-related costs, inventory shrink and occupancy costs. |
• | Operating earnings increased $30 driven by lower net charges and costs in fiscal 2016 compared to last year. When adjusted for these items (refer to the fiscal 2016 Operating Earnings section below for descriptions and a reconciliation of these charges and costs) and excluding an approximate benefit of $17 from an additional week of sales in fiscal 2015, Operating earnings increased $13 primarily due to higher gross profit base margins, lower logistics costs, higher transition service agreement fees, lower depreciation and amortization expense and higher trucking back-haul income, offset in part by higher occupancy, inventory shrink and other administrative costs, and higher payment processing, bad debt, contracted services and pension expenses. |
31
• | Interest expense, net decreased $47 due to $33 of lower debt refinancing charges and costs and $14 of lower interest expense primarily due to lower average outstanding debt balances. |
• | Net earnings from continuing operations increased $51 and Diluted earnings per share from continuing operations increased $0.18 primarily due to the above items. |
• | Net cash provided by operating activities of continuing operations increased $88 primarily due to lower pension and other postretirement benefit contributions, offset in part by lower cash generated from earnings after the impacts of net non-cash expenses, such as net pension and postretirement benefit costs and depreciation, and when adjusted for payments for debt refinancing costs included in earnings. |
• | Net cash used in investing activities of continuing operations increased $3 due to a $27 net increase in cash paid for intangible and other assets driven by acquired intangible assets for Wholesale, and $22 of additional cash used in capital expenditures reflecting new Save-A-Lot corporate and Retail stores, offset in part by $46 of lower cash used in business acquisitions within Retail and Save-A-Lot. |
• | Net cash used in financing activities of continuing operations increased $101 primarily due to lower proceeds from the issuance of long-term debt, offset in part by lower payments on long-term debt and lower payments for debt financing costs. |
Transition Services Agreements
The Company provides back-office administrative support services under the TSA with NAI and Albertson's LLC and the Haggen TSA and is also providing services as needed to transition and wind down the TSA with NAI and Albertson's LLC. The Company estimates that the complete transition and wind down of the TSA with NAI and Albertson's LLC could take approximately two to three more years. In September 2015, Haggen filed voluntary petitions for reorganization under Chapter 11 of the U.S. Bankruptcy Code. Through the bankruptcy process, Haggen has now closed, sold or agreed to sell all 164 stores. While the Company continues to provide services under the Haggen TSA, it believes it is likely that all such services under the Haggen TSA will cease in the second quarter of fiscal 2017.
The Company is focused on executing its plans to mitigate the impact of the wind down of these TSAs on the Company's results of operations, financial position and cash flows. For additional discussion of the TSAs, see “Risk Factors—The Company’s relationships with NAI, Albertson’s LLC and Haggen are winding down, which could adversely impact the Company’s results of operations” in Part I, Item 1A of this Annual Report on Form 10-K.
Impact of Inflation and Deflation
The Company monitors product cost inflation and deflation and evaluates whether to absorb cost increases or decreases, or pass on pricing changes. The Company has experienced a mix of inflation and deflation across product categories within all three of its business segments during fiscal 2016, with higher deflation levels in certain meat and dairy categories.
In fiscal 2016, when taking into account the overall mix of products, management estimates Save-A-Lot experienced cost deflation in the mid-single digits, and Wholesale and Retail experienced approximately flat cost inflation. Save-A-Lot cost deflation is primarily due to deflation within certain meat and dairy categories. The impact of deflation was greater at Save-A-Lot, particularly its wholesale business, compared to Wholesale and Retail due to product mix and product sourcing on private-label products. This deflationary environment in certain product categories in fiscal 2016 was more significant than management’s expectations for fiscal 2016.
Changes in merchandising, customer buying habits and competitive pressures create inherent difficulties in measuring the impact of inflation and deflation on Net sales and Gross profit.
Competitive Environment
The United States grocery channel is highly competitive and management expects operating results will continue to be impacted by the effects of operating in a highly competitive and price-sensitive marketplace.
32
RESULTS OF OPERATIONS
Consolidated results of operations for fiscal 2016, 2015 and 2014 are as follows:
Fiscal Years Ended | ||||||||||||||||||||
February 27, 2016 (52 weeks) | February 28, 2015 (53 weeks) | February 22, 2014 (52 weeks) | ||||||||||||||||||
Net sales | $ | 17,529 | 100.0 | % | $ | 17,917 | 100.0 | % | $ | 17,252 | 100.0 | % | ||||||||
Cost of sales | 14,945 | 85.3 | 15,329 | 85.6 | 14,712 | 85.3 | ||||||||||||||
Gross profit | 2,584 | 14.7 | 2,588 | 14.4 | 2,540 | 14.7 | ||||||||||||||
Selling and administrative expenses | 2,124 | 12.1 | 2,164 | 12.1 | 2,117 | 12.3 | ||||||||||||||
Intangible asset impairment charge | 6 | — | — | — | — | — | ||||||||||||||
Operating earnings | 454 | 2.6 | 424 | 2.4 | 423 | 2.5 | ||||||||||||||
Interest expense, net | 196 | 1.1 | 243 | 1.4 | 407 | 2.4 | ||||||||||||||
Equity in earnings of unconsolidated affiliates | (5 | ) | — | (4 | ) | — | (2 | ) | — | |||||||||||
Earnings from continuing operations before income taxes | 263 | 1.5 | 185 | 1.0 | 18 | 0.1 | ||||||||||||||
Income tax provision | 85 | 0.5 | 58 | 0.3 | 5 | — | ||||||||||||||
Net earnings from continuing operations | 178 | 1.0 | 127 | 0.7 | 13 | 0.1 | ||||||||||||||
Income from discontinued operations, net of tax | 8 | — | 72 | 0.4 | 176 | 1.0 | ||||||||||||||
Net earnings including noncontrolling interests | 186 | 1.1 | 199 | 1.1 | 189 | 1.1 | ||||||||||||||
Less net earnings attributable to noncontrolling interests | (8 | ) | — | (7 | ) | — | (7 | ) | — | |||||||||||
Net earnings attributable to SUPERVALU INC. | $ | 178 | 1.0 | % | $ | 192 | 1.1 | % | $ | 182 | 1.1 | % | ||||||||
Basic net earnings per share attributable to SUPERVALU INC.: | ||||||||||||||||||||
Continuing operations | $ | 0.64 | $ | 0.46 | $ | 0.02 | ||||||||||||||
Discontinued operations | $ | 0.03 | $ | 0.28 | $ | 0.69 | ||||||||||||||
Basic net earnings per share | $ | 0.68 | $ | 0.74 | $ | 0.71 | ||||||||||||||
Diluted net earnings per share attributable to SUPERVALU INC.: | ||||||||||||||||||||
Continuing operations | $ | 0.63 | $ | 0.45 | $ | 0.02 | ||||||||||||||
Discontinued operations | $ | 0.03 | $ | 0.27 | $ | 0.68 | ||||||||||||||
Diluted net earnings per share | $ | 0.66 | $ | 0.73 | $ | 0.70 | ||||||||||||||
The following table summarizes identical store sales variances in percentages compared to the prior fiscal year:
Fiscal Years Ended | |||||
February 27, 2016 (52 weeks) | February 28, 2015 (53 weeks)(6) | ||||
Save-A-Lot Network: | |||||
Identical store sales percent variance(1) | (1.4 | )% | 5.8 | % | |
Corporate Save-A-Lot Stores: | |||||
Identical store sales percent variance(2) | 0.6 | % | 7.6 | % | |
Average basket percent variance(3) | 1.3 | % | 2.1 | % | |
Customer count percent variance(4) | (0.7 | )% | 5.4 | % | |
Retail: | |||||
Identical store sales percent variance(5) | (2.5 | )% | 1.0 | % | |
Average basket percent variance(3) | 0.7 | % | (1.4 | )% | |
Customer count percent variance(4) | (3.2 | )% | 2.4 | % | |
(1) | Save-A-Lot network identical store sales are defined as the sales attributable to Company-operated stores and sales to licensee stores operating for four full quarters, including store expansions and excluding planned store dispositions. |
(2) | Corporate stores identical store sales are defined as the sales attributable to Company-operated stores operating for four full quarters, including store expansions and excluding planned store dispositions. |
(3) | Average basket is defined as the average purchases by the Company's customers per transaction within its corporate retail stores operating for four full quarters, including store expansions and excluding fuel and planned store dispositions. |
33
(4) | Customer count is defined as the number of transactions by the Company's retail customers within its corporate retail stores operating for four full quarters, including store expansions and excluding fuel and planned store dispositions. |
(5) | Retail identical store sales are defined as net sales from stores operating for four full quarters, including store expansions and excluding fuel and announced planned store dispositions. |
(6) | Reported identical store sales variances for the fiscal year ended February 28, 2015 exclude the impact of the additional week in fiscal 2015 for comparative purposes. |
Planned store dispositions are Save-A-Lot or Retail stores that the Company has announced it will close or licensee stores that a licensee has notified the Company it will close, although these stores may not have been closed by the end of the applicable reporting period.
Comparison of fiscal 2016 ended February 27, 2016 and fiscal 2015 ended February 28, 2015:
Net Sales
Net sales for fiscal 2016 were $17,529, compared with $17,917 last year, a decrease of $388 or 2.2 percent. Fiscal 2015 contained an additional week, which added approximately $313 to Net sales in fiscal 2015. Wholesale net sales were 45.3 percent of Net sales, Save-A-Lot net sales were 26.4 percent of Net sales, Retail net sales were 27.2 percent of Net sales and Corporate fees earned under the TSA with NAI and Albertson's LLC and the Haggen TSA were 1.1 percent of Net sales for fiscal 2016, compared with 45.8 percent, 25.8 percent, 27.3 percent and 1.1 percent, respectively, for last year.
Wholesale net sales for fiscal 2016 were $7,935, compared with $8,198 last year, a decrease of $263 or 3.2 percent. The additional week in fiscal 2015 contributed $143 to net sales. Excluding the additional week of sales in fiscal 2015, Wholesale net sales decreased $120 primarily due to $286 of lower sales from lost customers and $210 of lower sales to existing customers, offset in part by $375 of higher sales from new stores operated by new and existing customers.
Save-A-Lot net sales for fiscal 2016 were $4,623, compared with $4,641 last year, a decrease of $18 or 0.4 percent. The additional week in fiscal 2015 contributed $79 to net sales. Excluding the additional week of sales in fiscal 2015, Save-A-Lot net sales increased $61 primarily due to $124 of higher sales from new corporate stores, $60 of higher sales from new licensee stores, $56 of higher sales from corporate stores that were acquired and converted to licensee stores and $11 of higher sales at existing corporate stores, offset in part by lower sales of $70 from lower sales to existing licensees, $55 from stores that were disposed of by licensees, $41 from licensee stores that were converted to corporate stores and $31 from corporate stores that were closed. Management believes the lower Save-A-Lot network identical store sales in fiscal 2016 compared to fiscal 2015 were driven by a lower number of product units sold and product cost deflation passed on to licensees. Management also believes the lower Save-A-Lot corporate stores customer count in fiscal 2016 compared to fiscal 2015 was driven by lower promotional activity.
Retail net sales for fiscal 2016 were $4,769, compared with $4,884 last year, a decrease of $115 or 2.4 percent. The additional week in fiscal 2015 contributed $87 to net sales. Excluding the additional week of sales in fiscal 2015, Retail net sales decreased $28 primarily due to $109 of negative identical store sales, $26 of lower sales from closed stores and $14 from lower fuel sales, offset in part by $122 of higher sales from acquired and new stores. Management believes the lower Retail identical store sales and customer count in fiscal 2016 compared to fiscal 2015 were driven by adjustments to pricing and promotional activity to partially mitigate compressed pharmacy margins.
Corporate net sales for fiscal 2016 include fees earned under transition service agreements of $202, compared with $194 last year, an increase of $8. The additional week in fiscal 2015 contributed $4 to net sales. Excluding the additional week of sales in fiscal 2015, Corporate net sales increased $12 due to the additional transition service fees from the Haggen TSA and wind-down transition service revenues from Albertson’s LLC and NAI, offset in part by lower TSA fees from a lower number of NAI and Albertson's LLC stores under their TSA. The Company anticipates TSA revenues to continue to decline in future years as transition support services under the existing TSA are reduced.
Gross Profit
Gross profit for fiscal 2016 was $2,584, compared with $2,588 last year, a decrease of $4 or 0.2 percent. Gross profit as a percent of Net sales was 14.7 percent for fiscal 2016, compared with 14.4 percent last year. The additional week in fiscal 2015 contributed approximately $49 to Gross profit. Excluding the additional week, Gross profit increased $45 primarily due to $40 of higher base margins, $24 of lower logistics costs primarily driven by lower diesel costs, $12 of higher transition service agreement fees, $8 of higher trucking back-haul income and $3 of lower pension expense, offset in part by $17 of higher employee-related costs, $16 of higher inventory shrink costs and $10 of higher occupancy costs.
Wholesale gross profit was $383 or 4.8 percent of Wholesale net sales, compared with $388 or 4.7 percent last year. The additional week in fiscal 2015 contributed approximately $8 to Wholesale gross profit. Excluding the additional week, Wholesale gross profit increased $3 primarily due to $14 of higher base margins primarily from vendor rebates and allowances, $11 of lower logistics costs, $4 of higher trucking back-haul income and $3 of lower pension expense, offset in part by $19 of higher
34
employee-related costs and $10 of higher occupancy costs primarily associated with new distribution center capacity and repair and maintenance expenses on existing facilities.
Save-A-Lot gross profit was $710 or 15.4 percent of Save-A-Lot net sales, compared with $689 or 14.9 percent last year. The additional week in fiscal 2015 contributed approximately $12 to Save-A-Lot gross profit. Excluding the additional week, Save-A-Lot gross profit increased $33 primarily due to $19 of higher base margins driven by a higher mix of corporate stores relative to licensee stores and product costs declining faster than retail prices, $10 of higher gross profit from higher sales and $8 of lower logistics costs, offset in part by $4 of higher inventory shrink costs.
Retail gross profit was $1,288 or 27.0 percent of Retail net sales, compared with $1,317 or 27.0 percent last year. The additional week in fiscal 2015 contributed approximately $25 to Retail gross profit. Excluding the additional week, Retail gross profit decreased $4 primarily due to $14 of higher inventory shrink costs and $7 of lower gross profit from lower sales, offset in part by $7 of higher base margins, $6 of lower logistics costs and $5 of lower employee-related costs.
Selling and Administrative Expenses
Selling and administrative expenses for fiscal 2016 were $2,124 compared with $2,164 last year, a decrease of $40 or 1.8 percent. Selling and administrative expenses for fiscal 2016 include costs and charges of $35, comprised of costs related to the potential separation of Save-A-Lot of $15, store closure and impairment charges of $12 and severance costs of $8. Selling and administrative expenses for last year included net charges and costs of $75, comprised of non-cash pension settlement charges of $64, a benefit plan charge of $5, store closure and impairment charges of $3, information technology intrusion costs, net of insurance recoverable, of $2 and severance costs of $1. The additional week in fiscal 2015 contributed approximately $32 to Selling and administrative expenses. When adjusted for these items, Selling and administrative expenses increased $32 primarily due to $15 from lower other administrative costs primarily due to death benefits and fees received from a supply agreement termination in fiscal 2015, and higher expenses from independent retailer marketing costs and store opening costs in fiscal 2016, $9 of higher occupancy costs driven by a higher number of retail stores, $8 of higher pension expense, $7 of higher payment processing and bad debt expense, and $6 of higher contracted services costs, offset in part by $13 of lower depreciation and amortization expense.
Intangible Asset Impairment Charge
During fiscal 2016, the Company received a notice pursuant to which the Company could exercise certain purchase options. As a result, the Company performed a review of the associated indefinite-lived intangible assets for impairment, which indicated the carrying value of the intangible asset exceeded its estimated value. The Company recorded a non-cash intangible asset impairment charge of $6 within Wholesale.
Operating Earnings
Operating earnings for fiscal 2016 were $454, compared with $424 last year, an increase of $30 or 7.1 percent. Operating earnings for fiscal 2016 include charges and costs of $41, comprised of costs related to the potential separation of Save-A-Lot, store closure and impairment charges, severance costs and an intangible asset impairment charge. Operating earnings for fiscal 2015 included net charges and costs of $75, comprised of non-cash pension settlement charges, a benefit plan charge, store closure and impairment charges, information technology intrusion costs, net of insurance recoverable and severance costs. The additional week in fiscal 2015 contributed approximately $17 to Operating earnings. When adjusted for these items, the remaining $13 increase in Operating earnings is primarily due to $40 of higher base margins from all three business segments, $24 of lower logistics costs, $12 of higher transition service agreement fees, $9 of lower depreciation and amortization expense and $8 of higher trucking back-haul income, offset in part by $19 of higher employee-related costs, $19 of higher occupancy costs, $16 of higher inventory shrink costs, $15 of lower other administrative costs due to death benefits and fees received from a supply agreement termination in fiscal 2015, and higher expenses from independent retailer marketing costs and store opening costs in fiscal 2016, $7 of higher payment process and bad debt expense, $7 of higher contracted services costs and $5 of higher pension expense.
Wholesale operating earnings for fiscal 2016 were $230, or 2.9 percent of Wholesale net sales, compared with $243, or 3.0 percent last year. Wholesale operating earnings for fiscal 2016 include $6 of intangible asset impairment charges. Wholesale operating earnings for last year included $1 of severance costs. The additional week in fiscal 2015 contributed approximately $7 to Wholesale operating earnings. When adjusted for these items, the remaining $1 decrease in Wholesale operating earnings is primarily due to $20 of higher employee-related costs, $9 of higher occupancy costs primarily associated with new distribution center capacity and repair and maintenance expenses on existing facilities, $7 of higher administrative costs as a result of fees received from a supply agreement termination last year and higher expenses from independent retailer marketing costs in fiscal 2016, offset in part by $14 of higher base margins primarily from vendor rebates and allowances, $11 of lower logistics costs primarily from lower diesel costs, $4 of higher trucking back-haul income and $3 of lower pension expense.
35
Save-A-Lot operating earnings for fiscal 2016 were $129, or 2.8 percent of Save-A-Lot net sales, compared with $153, or 3.3 percent last year. Save-A-Lot operating earnings for fiscal 2016 include $11 of store closure and impairment charges and $2 of severance costs. Save-A-Lot operating earnings for last year included store closure and impairment charges of $3. The additional week in fiscal 2015 contributed approximately $4 to Save-A-Lot operating earnings. When adjusted for these items, the remaining $10 decrease in Save-A-Lot operating earnings is primarily due to $16 of higher occupancy costs primarily driven by a higher number of corporate stores, $16 of higher employee-related costs primarily driven by a higher number of corporate stores, $6 of higher depreciation expense, $4 of higher inventory shrink costs and $4 of higher contracted services costs, offset in part by $19 of higher base margins driven by a higher mix of corporate stores relative to licensee stores and product costs declining faster than retail prices, $10 of higher gross profit from higher sales, $8 of lower logistics costs and $4 of higher trucking back-haul income.
Retail operating earnings for fiscal 2016 were $94, or 2.0 percent of Retail net sales, compared with $122, or 2.5 percent last year. Retail operating earnings for fiscal 2016 include $1 of store closure and impairment charges. The additional week in fiscal 2015 contributed approximately $7 to Retail operating earnings. When adjusted for these items, the remaining $20 decrease in Retail operating earnings is primarily due to $21 of higher employee-related costs primarily driven by new retail stores, $14 of higher inventory shrink costs, $7 of lower gross profit from lower sales and $4 of higher occupancy costs, offset in part by $14 of lower depreciation expense, $7 of higher base margins and $6 of lower logistics costs.
Corporate operating earnings for fiscal 2016 were $1, compared with an operating loss of $94 for last year. Corporate expenses for fiscal 2016 include $15 of costs related to the potential separation of Save-A-Lot and $6 of severance costs. Corporate expenses for fiscal 2015 included $64 of non-cash pension settlement charges, a $5 benefit plan charge and $2 of information technology intrusion costs, net of insurance recoverable. The additional week in fiscal 2015 contributed expense of approximately $1 to Corporate operating loss. When adjusted for these items, the remaining $44 net increase in Corporate operating earnings was primarily due to $37 of lower employee-related costs, primarily due to lower benefits and entity-wide incentive compensation, $12 of higher transition service agreement fees and $10 of lower occupancy costs, offset in part by $12 of higher pension expense and $6 of higher administrative expenses.
Interest Expense, Net
Interest expense, net for fiscal 2016 was $196, compared with $243 last year. Interest expense, net for fiscal 2016 includes $6 of debt refinancing costs related to the redemption of the remaining $278 of the Company's outstanding 8.00 percent Senior Notes due May 2016 (the "2016 Notes") and $4 of non-cash unamortized financing cost charges related to the 2016 Notes redemption and the amendment to the Revolving ABL Credit Facility. Interest expense for last year included $37 of debt refinancing costs related to the redemption of $350 of the 2016 Notes and costs related to the incremental carry costs of the 7.75 percent Senior Notes due November 2022 (the “2022 Notes”) outstanding during the 2016 Notes 30-day redemption period, and $6 of non-cash unamortized financing cost charges related to the 2016 Notes redemption and the amendments to the Revolving ABL Credit Facility. The additional week in fiscal 2015 contributed additional interest expense of approximately $3. When adjusted for these items, the remaining $11 decrease in Interest expense, net is primarily due to lower average outstanding debt balances.
Income Tax Provision
Income tax expense on earnings from continuing operations for fiscal 2016 was $85, or 32.3 percent of earnings from continuing operations before income taxes, compared with $58, or 31.2 percent last year. The increase in the effective tax rate is primarily due to the pension settlement charge included in the prior year, partially offset by a favorable mix of income in state tax jurisdictions in the current year.
Net Earnings from Continuing Operations
Net earnings from continuing operations for fiscal 2016 were $178, compared with $127 last year. Net earnings from continuing operations for fiscal 2016 include $34 of after-tax charges and costs related to costs for the potential Save-A-Lot separation, store closure and impairment charges, severance costs, intangible asset impairment charges, debt refinancing costs and unamortized financing cost charges as discussed above. Net earnings from continuing operations for last year included $70 of after-tax charges and costs related to the non-cash pension settlement charges, debt refinancing costs, unamortized financing cost charges, store closure and impairment charges, a benefit plan charge, net information technology intrusion costs and severance costs as discussed above. The additional week in fiscal 2015 contributed approximately $8 to Net earnings from continuing operations. When adjusted for these items, the remaining $23 after-tax increase in Net earnings from continuing operations is primarily due to the variances as discussed in the Operating Earnings, Interest Expense, Net, and Income Tax Provision sections above.
36
Income from Discontinued Operations, Net of Tax
Income from discontinued operations, net of tax, for fiscal 2016 was $8, compared with $72 last year. The $64 decrease in income from discontinued operations, net of tax is due to net tax benefits of $66 last year primarily related to tangible property repair regulations and other deduction related changes, property tax refunds and interest income resulting from the settlement of income tax audits.
Comparison of fiscal 2015 ended February 28, 2015 and fiscal 2014 ended February 22, 2014:
Net Sales
Net sales for fiscal 2015 were $17,917, compared with $17,252 for fiscal 2014, an increase of $665 or 3.9 percent. The 53rd week added approximately $313 to Net sales in fiscal 2015. Wholesale net sales were 45.8 percent of Net sales, Save-A-Lot net sales were 25.8 percent of Net sales, Retail net sales were 27.3 percent of Net sales and Corporate fees earned under the TSA were 1.1 percent of Net sales for fiscal 2015, compared with 47.0 percent, 24.6 percent, 27.0 percent and 1.4 percent, respectively, for fiscal 2014.
Wholesale net sales for fiscal 2015 were $8,198, compared with $8,102 for fiscal 2014, an increase of $96 or 1.2 percent. The increase is primarily due to $143 from an additional week of sales in fiscal 2015, and $375 from new accounts, existing customers and new affiliations, offset in part by $421 from lost accounts, including an NAI banner that completed the transition to self-distribution part way through the year and the loss of one of the Company's larger customers.
Save-A-Lot net sales for fiscal 2015 were $4,641, compared with $4,255 for fiscal 2014, an increase of $386 or 9.1 percent. The increase is primarily due to positive network identical store sales of 5.8 percent or $226 (defined as net sales from Company-operated stores and sales to licensee stores operating for four full quarters, including store expansions and excluding planned store dispositions), $147 of sales due to new store openings and other revenue and $79 from an additional week of sales in fiscal 2015, offset in part by a decrease of $67 due to store dispositions by licensees.
Save-A-Lot identical store sales for Company-operated stores (defined as net sales from Company-operated stores operating for four full quarters, including store expansions and excluding planned store dispositions) were positive 7.6 percent or $127 for fiscal 2015. Save-A-Lot corporate identical store sales performance was primarily a result of a 5.4 percent increase in customer count and a 2.1 percent increase in average basket size.
Retail net sales for fiscal 2015 were $4,884 compared with $4,655 for fiscal 2014, an increase of $229 or 4.9 percent. The increase in Retail net sales was driven by several factors, including a $101 increase in sales due to newly acquired stores, an $87 increase from an additional week of sales in fiscal 2015, a $47 improvement from positive identical store sales of 1.0 percent (defined as net sales from stores operating for four full quarters, including store expansions and excluding fuel and planned store dispositions) and $17 of higher fuel sales, offset in part by lower sales from three store closures. Retail positive identical store sales performance was primarily a result of a 2.4 percent customer count increase, offset in part by a 1.4 percent decrease in average basket size.
Corporate net sales for fiscal 2015 include fees earned under the TSA of $194, compared with $240 for fiscal 2014, a decrease of $46. The net sales decrease reflects a one-year transition fee earned under the TSA in fiscal 2014 of $60, offset in part by higher fees earned during the first quarter of fiscal 2015 due to the timing of the sale of NAI and $4 from an additional week of sales in fiscal 2015.
Gross Profit
Gross profit for fiscal 2015 was $2,588, compared with $2,540 for fiscal 2014, an increase of $48 or 1.9 percent. Gross profit as a percent of Net sales was 14.4 percent for fiscal 2015, compared to 14.7 percent in fiscal 2014. TSA fees included within Gross profit declined by $46, impacting Gross profit as a percent of Net sales by 30 basis points. Fiscal 2014's Gross profit included a $3 multiemployer pension plan withdrawal charge. The remaining $91 increase in Gross profit is primarily due to $126 of higher gross profit from increased sales, $12 of lower logistics costs and $9 of lower employee-related costs, offset in part by $33 of incremental investments to lower prices to customers, higher shrink, stronger private brands' pricing support and other margin investments, an $18 higher LIFO charge and $12 of higher advertising costs.
Wholesale gross profit was $388 or 4.7 percent of Wholesale net sales for fiscal 2015, compared with $385 or 4.8 percent for fiscal 2014. Wholesale gross profit for fiscal 2014 included a $3 multiemployer pension plan withdrawal charge. When adjusted for this item, Wholesale gross profit for fiscal 2015 was approximately flat with fiscal 2014, but included lower logistics and employee-related costs and higher gross profit from increased sales volume, offset by stronger private brands' pricing support and other margin investments and a higher LIFO charge.
37
Save-A-Lot gross profit was $689 or 14.9 percent of Save-A-Lot net sales for fiscal 2015, compared with $654 or 15.4 percent for fiscal 2014. Save-A-Lot gross profit increased $59 from higher sales. The 50 basis point decrease in Save-A-Lot gross profit rate is primarily due to $15 of higher advertising costs and $12 of incremental investments to lower prices to customers and higher shrink.
Retail gross profit was $1,317 or 27.0 percent of Retail net sales for fiscal 2015, compared with $1,261 or 27.1 percent for fiscal 2014. Retail gross profit increased $62 from higher sales. The 10 basis point decline in Retail gross profit rate is primarily due to an $11 higher LIFO charge and $10 of higher incremental investments to lower prices to customers and shrink, offset in part by $7 of lower employee-related costs.
Selling and Administrative Expenses
Selling and administrative expenses for fiscal 2015 were $2,164 compared with $2,117 for fiscal 2014, an increase of $47 or 2.2 percent. Selling and administrative expenses for fiscal 2015 include net charges and costs of $75, comprised of non-cash pension settlement charges of $64, a benefit plan charge of $5, store closure charges of $3, information technology intrusion costs, net of insurance recoverable, of $2, and severance costs of $1. Selling and administrative expenses for fiscal 2014 included net charges and costs of $58, comprised of severance costs and accelerated stock-based compensation charges of $46, asset impairment and other charges of $16, contract breakage and other costs of $6 and a legal settlement charge of $5, offset in part by a gain on sale of property of $15. When adjusted for these items, the remaining $30 increase in Selling and administrative expenses is primarily due to $102 of higher expenses from increased sales volume and $8 of higher employee-related costs, offset in part by $43 of lower net periodic pension expense and $42 of reduced depreciation and amortization expense and occupancy costs.
Selling and administrative expenses for fiscal 2015 were 12.1 percent of Net sales, compared with 12.3 percent of Net sales for fiscal 2014. Selling and administrative expenses as a percent of Net sales for fiscal 2015 include 40 basis points from the net charges and costs of $75 described above. Selling and administrative expenses as a percent of Net sales for fiscal 2014 included 30 basis points from net charges and costs of $58 described above. The remaining 30 basis points net reduction in Selling and administrative expenses as a percent of Net sales is primarily due to lower net periodic pension expense and reduced depreciation and amortization expense and occupancy costs, offset in part by higher employee-related costs.
Operating Earnings
Operating earnings for fiscal 2015 were $424, compared with $423 for fiscal 2014, an increase of $1 or 0.2 percent. Operating earnings for fiscal 2015 included net charges and costs of $75, comprised of the non-cash pension settlement charges, a benefit plan charge, store closure charges, information technology intrusion costs, net of insurance recoverable, and severance costs as discussed above. Operating earnings for fiscal 2014 included net charges and costs of $61, comprised of severance costs and accelerated stock-based compensation charges, asset impairment and other charges, contract breakage and other costs, a legal settlement charge and a multi-employer pension plan withdrawal charge, offset in part by a gain on sale of property as discussed above. The remaining $15 increase in Operating earnings is primarily due to $43 of lower net periodic pension expense, $42 of reduced depreciation and amortization expense and occupancy costs, $24 of higher earnings from increased sales and $12 of lower logistics costs, offset in part by $46 of lower TSA fees primarily due to the one-year transition fee recognized in fiscal 2014, $33 of incremental investments to lower prices to customers, higher shrink, stronger private brands pricing support and other margin investments, an $18 higher LIFO charge and $12 of higher advertising costs.
Wholesale operating earnings for fiscal 2015 were $243, or 3.0 percent of Wholesale net sales, compared with $235, or 2.9 percent for fiscal 2014. Wholesale operating earnings for fiscal 2015 included $1 of severance costs. Wholesale operating earnings for fiscal 2014 included net charges and costs of $8, comprised of severance costs and accelerated stock-based compensation costs of $17, a multi-employer pension plan withdrawal charge of $3, asset impairment and other charges of $2 and contract breakage costs of $1, offset in part by a gain on sale of property of $15. The remaining $1 increase in Wholesale operating earnings is primarily due to lower logistics costs and fees received from early supply agreement termination, higher earnings from increased sales and lower depreciation expense, offset in part by lower margins from stronger private brands pricing support and other margin investments, higher employee-related costs and a higher LIFO charge.
Save-A-Lot operating earnings for fiscal 2015 were $153, or 3.3 percent of Save-A-Lot net sales, compared with $167, or 3.9 percent for fiscal 2014. Save-A-Lot operating earnings for fiscal 2015 included store closure charges of $3. Save-A-Lot operating earnings for fiscal 2014 included charges and costs of $10, comprised of a legal settlement charge of $5, asset impairment and other charges of $3 and severance costs of $2. The remaining $21 decrease in Save-A-Lot’s operating earnings is primarily due to $15 of higher advertising costs, $12 of higher shrink and incremental investments to lower prices to customers and $12 of higher employee-related and occupancy costs, offset in part by $16 of higher earnings from increased sales.
Retail operating earnings for fiscal 2015 were $122, or 2.5 percent of Retail net sales, compared with $77, or 1.7 percent for fiscal 2014. Retail operating earnings for fiscal 2014 included charges and costs of $19, comprised of asset impairment and other
38
charges of $9, severance costs and accelerated stock-based compensation charges of $8 and contract breakage costs of $2. The remaining $26 increase in Retail’s operating earnings is primarily due to $25 of lower depreciation expense and occupancy costs, $8 of contracted services, $7 of lower logistics costs and $5 of higher earnings from increased sales, offset in part by $11 of a higher LIFO charge and $10 of incremental investments to lower prices to customers.
Corporate operating loss for fiscal 2015 was $94, compared with $56 for fiscal 2014. Corporate expenses for fiscal 2015 included charges and costs of $71, comprised of $64 of non-cash pension settlement charges, a $5 benefit plan charge and $2 of information technology intrusion costs, net of insurance recoverable. Corporate expenses for fiscal 2014 included charges of $24, comprised of severance costs and accelerated stock-based compensation charges of $19, contract breakage and other costs of $3 and asset impairment charges of $2. The remaining $9 net decrease in Corporate operating loss was primarily due to $42 of lower net periodic pension expense, $12 of lower occupancy costs and $7 of lower employee-related costs, offset in part by $46 of lower TSA fees primarily due to the one-year transition fee recognized in fiscal 2014 and $4 of higher other administrative and other costs of sales.
Interest Expense, Net
Interest expense, net for fiscal 2015 was $243, compared with $407 for fiscal 2014. Interest expense, net for fiscal 2015 included $37 of debt refinancing costs related to the redemption of $350 of the 2016 Notes and costs related to the expense of the 2022 Notes outstanding during the 30-day redemption period, and $6 of non-cash unamortized financing cost charges related to the 2016 Notes redemption and the amendments to the Revolving ABL Credit Facility. Interest expense, net for fiscal 2014 included $99 of unamortized financing cost charges and original issue discount acceleration and $75 of debt refinancing costs related to refinancing activities in conjunction with the sale of NAI and subsequent refinancing activities. When adjusted for these items, the remaining $33 decrease in Interest expense, net is primarily due to lower average interest rates on lower outstanding debt balances.
Income Tax Provision
Income tax expense on earnings from continuing operations for fiscal 2015 was $58, or 31.2 percent of earnings from continuing operations before income taxes, compared with $5, or 30.9 percent for fiscal 2014. The change in the effective tax rate is primarily due to $22 of discrete tax benefits, primarily related to audit settlements, partnership income and the pension settlement charge, and $10 of discrete tax expenses related to insignificant discrete tax items recorded in fiscal 2015. The tax rate for fiscal 2014 included certain insignificant discrete tax items that together gave rise to the difference between the combined federal and state statutory tax rates and the effective tax rate.
Net Earnings from Continuing Operations
Net earnings from continuing operations for fiscal 2015 were $127, compared with $13 for fiscal 2014. Net earnings from continuing operations for fiscal 2015 included $70 of after-tax charges and costs related to the non-cash pension settlement charges, debt refinancing costs, unamortized financing cost charges, store closure charges, a benefit plan charge, net information technology intrusion costs and severance costs as discussed above. Net earnings from continuing operations for fiscal 2014 included $144 of after-tax net charges and costs primarily related to the debt refinancing activities, severance costs and acceleration of stock-based compensation charges, asset impairment, contract breakage costs, a legal settlement charge and a multiemployer pension plan withdrawal charge, offset in part by the gain on sale of property as discussed above. When adjusted for these items, the remaining $40 after-tax increase in Net earnings from continuing operations is primarily due to the variances as discussed in the Operating Earnings, Interest Expense, Net, and Income Tax Provision sections above.
Income from Discontinued Operations, Net of Taxes
Income from discontinued operations, net of tax, for fiscal 2015 was $72, compared with $176 for fiscal 2014. Income from discontinued operations for fiscal 2015 reflects net tax benefits of $66 primarily related to recognition of tangible property repair regulations and other deduction related changes, property tax refunds, and interest income resulting from the settlement of income tax audits.
Discontinued operations results for fiscal 2014 reflected the completion of the sale of NAI on March 21, 2013, net discrete tax benefits of $105 and a reduction to the loss on sale of NAI of $90, offset in part by severance and other costs of $13.
39
NON-GAAP FINANCIAL MEASURES
The Company’s Consolidated Financial Statements are prepared and presented in accordance with generally accepted accounting principles (“GAAP”). In addition to the above analysis of results of operations, the Company also considers certain other non-GAAP financial measures to assess the performance of our businesses. The measures and items identified below, such as Adjusted EBITDA, are provided as a supplement to our results of operations and related analysis, and should not be considered superior to, a substitute for or an alternative to any financial measure of performance prepared and presented in accordance with GAAP. Investors are cautioned that there are material limitations associated with the use of non-GAAP financial measures as an analytical tool. Certain adjustments to our GAAP financial measures reflected below exclude certain items that are occasionally recurring in nature and may be reflected in our financial results for the foreseeable future. These measurements and items may be different from non-GAAP financial measures used by other companies. All measurements are provided with a reconciliation from a GAAP measurement. The non-GAAP financial measures below should only be considered as an additional supplement to the Company’s financial results prepared in accordance with GAAP and should be reviewed in conjunction with the Company’s results reported in accordance with GAAP in this Annual Report on Form 10-K for the fiscal year ended February 27, 2016.
The Company utilizes certain non-GAAP measures, including Adjusted EBITDA, to analyze underlying core business trends to understand operating performance and as a compensation performance measure. Adjusted EBITDA is a non-GAAP supplemental performance measure the Company uses to facilitate operating performance comparisons of our businesses on a consistent basis. In addition, management believes Adjusted EBITDA as a measure of business performance provides investors with useful supplemental information. Adjusted EBITDA provides additional understanding of other factors and trends affecting our business, which are used in the business planning process to understand expected performance, to evaluate results against those expectations, and as one of the compensation performance measures under certain compensation programs and plans.
The Company defines Adjusted EBITDA as Net earnings (loss) from continuing operations, plus Interest expense, net and Income tax provision (benefit), less Net earnings attributable to noncontrolling interests calculated in accordance with GAAP, plus non-GAAP adjustments for Depreciation and amortization, LIFO charge (credit), certain non-recurring or unusual employee-related costs and pension related items (including severance costs, accelerated stock-based compensation charges, pension settlement charges, multiemployer pension withdrawal charges and other items), charges and costs related to debt financing activities, non-cash asset impairment and other charges and gains (including asset write-offs, store closures, market exits and certain gains on the sale of property), goodwill and intangible asset impairment charges, costs related to the separation of businesses, legal settlement charges and gains, contract breakage costs and certain other non-cash charges or unusual items.
These items are omitted either because they are non-cash items or are items that are not considered in our supplemental assessment of our on-going business performance. Certain of these adjustments are considered in similar supplemental analyses by other companies, such as Depreciation and amortization, LIFO charge (credit) and certain other adjustments. Adjusted EBITDA is less disposed to variances in actual performance resulting from depreciation, amortization and other non-cash charges and credits, and more reflective of other factors that affect the Company’s underlying operating performance.
There are significant limitations to using Adjusted EBITDA as a financial measure including, but not limited to, it not reflecting cash expenditures for capital assets or contractual commitments, changes in working capital, income taxes and debt service expenses that are recurring in the Company's results of operations.
40
The following summarizes the calculation of Adjusted EBITDA for fiscal 2016, 2015, 2014, 2013 and 2012:
2016 (52 weeks) | 2015 (53 weeks) | 2014 (52 weeks) | 2013 (52 weeks) | 2012 (52 weeks) | |||||||||||||||
Net earnings (loss) from continuing operations | $ | 178 | $ | 127 | $ | 13 | $ | (253 | ) | $ | (97 | ) | |||||||
Less net earnings attributable to noncontrolling interests | (8 | ) | (7 | ) | (7 | ) | (10 | ) | (13 | ) | |||||||||
Income tax provision (benefit) | 85 | 58 | 5 | (163 | ) | (41 | ) | ||||||||||||
Interest expense, net | 196 | 243 | 407 | 269 | 247 | ||||||||||||||
Depreciation and amortization | 276 | 285 | 302 | 365 | 355 | ||||||||||||||
LIFO charge (credit) | 3 | 8 | (9 | ) | 4 | 16 | |||||||||||||
Unusual employee-related costs and pension related items | 8 | 70 | 49 | 36 | 15 | ||||||||||||||
Asset impairment and other charges, net of gains | 12 | 3 | 1 | 249 | — | ||||||||||||||
Intangible asset and goodwill impairment charges | 6 | — | — | 6 | 92 | ||||||||||||||
Costs related to the potential separation of Save-A-Lot | 15 | — | — | — | — | ||||||||||||||
Legal settlement charges (gains) | — | — | 5 | (10 | ) | — | |||||||||||||
Contract breakage costs and certain other charges | — | — | 6 | — | — | ||||||||||||||
Information technology intrusion costs, net of insurance recoverable | — | 2 | — | — | — | ||||||||||||||
Adjusted EBITDA | $ | 771 | $ | 789 | $ | 772 | $ | 493 | $ | 574 | |||||||||
Comparison of Fiscal 2016 Adjusted EBITDA to Fiscal 2015 Adjusted EBITDA
Adjusted EBITDA for fiscal 2016 was $771, or 4.4 percent of Net sales, compared to $789, or 4.4 percent of Net sales last year, a decrease of $18. The additional week in fiscal 2015 contributed approximately $17 to Adjusted EBITDA. When adjusted for the additional week, the decrease of $1 was primarily driven by higher employee-related and occupancy costs from new retail stores and added distribution center capacity, higher inventory shrink and other costs, offset in part by higher gross profit from increased base margins, lower logistics costs, higher TSA fees and back-haul trucking income.
Comparison of Fiscal 2015 Adjusted EBITDA to Fiscal 2014 Adjusted EBITDA
Adjusted EBITDA for fiscal 2015 was $789, or 4.4 percent of Net sales, compared to $772, or 4.5 percent of Net sales for fiscal 2014, an increase of $17. The increase in Adjusted EBITDA is primarily due to $43 of lower net periodic pension expense, $39 of higher earnings from increased sales, including the additional week in fiscal 2015, and $12 of lower logistics costs, $9 of lower occupancy costs and $3 of lower other administrative costs, offset in part by $46 of lower TSA fees primarily due to the one-year transition fee recognized in fiscal 2014, which covered transitional employee and occupancy costs included within Adjusted EBITDA, $33 of incremental investments to lower prices to customers, higher shrink, stronger private brands pricing support and other margin investments, and $12 of higher advertising costs.
LIQUIDITY AND CAPITAL RESOURCES
Liquidity and Capital Resource Highlights
• | Unused available credit under the Revolving ABL Credit Facility decreased to $744 from $871 as of February 27, 2016 compared to February 28, 2015, primarily due to the Company's net increase of $138 of borrowings under the Revolving ABL Credit Facility to partially fund the redemption of the $278 balance of the 2016 Notes in the fourth quarter of fiscal 2016. The borrowings under the Revolving ABL Credit Facility were used together with cash from operations to fund the redemption of the remaining 2016 Notes and to pay accrued and unpaid interest on the redeemed 2016 Notes, and the applicable redemption premium of approximately $6. |
• | Amended, repriced and extended the Company's Revolving ABL Credit Facility to reduce the rates on borrowings and letters of credit and the facility fees, as well as extend its maturity by approximately sixteen months to February 3, 2021. This amendment also provides flexibility for a spin-off of Save-A-Lot. |
• | As of February 27, 2016, scheduled debt maturities and mandatory prepayments due in fiscal 2017 and fiscal 2018 were $102 and $0, respectively. The Company has classified $99 of its Secured Term Loan Facility as a current maturity due to the requirement under the facility to prepay loans outstanding under the facility no later than 90 days after the fiscal year end based on the Company's excess cash flow, as defined by the Secured Term Loan agreement. |
41
• | Payments to reduce Capital lease obligations are expected to total approximately $24 in each of fiscal 2017 and fiscal 2018. |
• | Working capital decreased $116 from $394 as of February 28, 2015 to $278 as of February 27, 2016, excluding the impacts of the LIFO reserve, primarily due to the classification of $99 of the Secured Term Loan Facility as a current maturity, a decrease in Cash and cash equivalents and a decrease in Other current assets due to the utilization of the Company's income tax receivable, offset in part by higher Wholesale inventory from new business. |
• | Management expects that the Company will be able to fund debt maturities through internally generated funds, borrowings under the Revolving ABL Credit Facility, additional term loans under the Secured Term Loan Facility (subject to identifying term loan lenders or other institutional lenders and satisfying certain terms and conditions) or through new debt issuances. |
• | Total debt was $2,297 and $2,454 as of February 27, 2016 and February 28, 2015, respectively, net of unamortized debt refinancing costs and original issue discount, under senior secured credit agreements and debentures. |
• | No minimum pension contributions were required under ERISA for fiscal 2016. The Company made discretionary pension contributions and required minimum other postretirement benefit plan contributions totaling $40. |
Sources and Uses of Cash
Management expects that the Company will continue to replenish operating assets with internally generated funds and pay down debt obligations with internally generated funds and new debt issuances or existing credit facilities. A significant reduction in operating earnings or the incurrence of operating losses could have a negative impact on the Company’s operating cash flow, which may limit the Company’s ability to pay down its outstanding indebtedness as planned. The Company's credit facilities are secured by a substantial portion of the Company's total assets and certain subsidiary equity interests.
The Company’s primary sources of liquidity are from internally generated funds and from borrowing capacity under its credit facilities. The Company will continue to obtain short-term or long-term financing from its credit facilities. Long-term financing will be maintained through existing and new debt issuances and its credit facilities. The Company’s short-term and long-term financing abilities are believed to be adequate as a supplement to internally generated cash flows to fund debt obligations and to fund capital expenditures as opportunities arise. There can be no assurance, however, that the Company’s business will continue to generate cash flow at current levels or that it will continually have access to credit on acceptable terms. Maturities of debt issued will depend on management’s views with respect to the relative attractiveness of interest rates at the time of issuance and other debt maturities.
Primary uses of cash include debt servicing and maturities, capital expenditures, working capital maintenance, contributions to various benefit plans and income tax payments. The Company’s working capital needs are generally greater during the months leading up to high sales periods, such as the time period from prior to Thanksgiving through December. The Company typically finances these working capital needs with cash provided from operating activities and short-term borrowings. Inventories are managed primarily through demand forecasting and replenishing depleted inventories. Strategic and operational investments in the Company’s businesses are funded by cash provided from operating activities and on a short-term basis through available liquidity.
The Company’s continued access to short-term and long-term financing through credit markets depends on numerous factors including the condition of the credit markets and the Company’s results of operations, cash flows, financial position and credit ratings.
The Company does not pay dividends, and there is no current intent to pay dividends. The Company is limited in the aggregate amount of dividends that it may pay under the terms of its Secured Term Loan Facility and its Revolving ABL Credit Facility and would need to meet certain conditions under these credit facilities before paying a dividend, as described in Note 7—Long-Term Debt in Part II, Item 8 of this Annual Report on Form 10-K. The payment of future dividends is subject to the discretion of the Company’s Board of Directors and the requirements of Delaware law, and will depend on a variety of factors that the Company’s Board of Directors may deem relevant.
42
Cash Flow Information
The following summarizes our Consolidated Statements of Cash Flows:
Fiscal Year | Variance | ||||||||||||||||||
2016 (52 weeks) | 2015 (53 weeks) | 2014 (52 weeks) | 2016 Change | 2015 Change | |||||||||||||||
Cash flow activities | |||||||||||||||||||
Net cash provided by operating activities – continuing operations | $ | 421 | $ | 333 | $ | 129 | $ | 88 | $ | 204 | |||||||||
Net cash used in investing activities—continuing operations | (288 | ) | (285 | ) | (86 | ) | (3 | ) | (199 | ) | |||||||||
Net cash used in financing activities—continuing operations | (193 | ) | (92 | ) | (107 | ) | (101 | ) | 15 | ||||||||||
Net cash provided by (used in) discontinued operations | 3 | 75 | (2 | ) | (72 | ) | 77 | ||||||||||||
Net (decrease) increase in cash and cash equivalents | (57 | ) | 31 | (66 | ) | (88 | ) | 97 | |||||||||||
Cash and cash equivalents at beginning of period | 114 | 83 | 149 | 31 | (66 | ) | |||||||||||||
Cash and cash equivalents at the end of period | $ | 57 | $ | 114 | $ | 83 | $ | (57 | ) | $ | 31 | ||||||||
Operating Activities
The increase in net cash provided by operating activities from continuing operations in fiscal 2016 compared to last year is primarily due to $129 of lower pension and other postretirement benefit plan contributions from lower required and discretionary pension contributions, offset in part by lower cash generated from operating earnings after the impacts of net non-cash expenses, such as net pension and postretirement benefit costs and depreciation, and when adjusted for payments for debt refinancing costs included in earnings. Cash generated from operating assets and liabilities decreased slightly, but included higher cash utilized in accounts payable driven by lower inventory increases and incentive compensation accruals compared to last year, offset in part by lower cash utilized in inventory build last year.
The increase in net cash provided by operating activities from continuing operations in fiscal 2015 compared to fiscal 2014 is primarily attributable to cash uses in fiscal 2014 following the NAI Banner Sale, including an increase in cash used in accounts payable and accrued liabilities in fiscal 2014 due to $96 of employee-related payables primarily attributable to the fiscal 2014 workforce reduction and an increase in cash provided by receivables of $63 primarily due to shipping method changes, extension of trade receivables to NAI and vendor fund receivable changes in fiscal 2014. Cash used in continuing operations for income taxes decreased $64 primarily due to lower continuing operations tax payments and discrete tax items. These increases in cash provided by operating activities were offset in part by an increase in pension contributions of $45 primarily due to a $50 discretionary pension contribution made in the fourth quarter of fiscal 2015.
Net cash provided by discontinued operations in fiscal 2015 primarily relates to tax refunds from tangible property repair regulations and other deduction-related changes.
Investing Activities
The increase in cash used in investing activities in fiscal 2016 compared to last year is primarily due to an increase of $27 in cash paid for intangible and other assets driven by acquired intangible assets for Wholesale and $22 of additional cash used in capital expenditures reflecting new Save-A-Lot corporate and Retail stores, offset in part by $46 of lower cash used in business acquisitions within Retail and Save-A-Lot.
The increase in cash used in investing activities in fiscal 2015 compared to fiscal 2014 is primarily attributable to $128 of additional cash used in capital expenditures reflecting Retail store remodels, new Save-A-Lot stores and supply chain investments, and $55 of cash used in business acquisitions.
Financing Activities
The increase in net cash used in financing activities in fiscal 2016 compared to last year is primarily due to lower proceeds from the issuance of long-term debt, offset in part by lower payments on long-term debt and debt financing costs. Proceeds from the issuance of long-term debt decreased primarily due to the issuance of $350 of the 2022 Notes last year, compared with the $138 net increase in borrowings under the Revolving ABL Credit Facility in fiscal 2016 to partially fund the redemption of $278 of the 2016 Notes. Long-term debt payments decreased primarily due to a smaller amount of redemptions of the 2016 Notes in fiscal 2016 compared to fiscal 2015. Payments used in debt financing costs were lower due to lower redemption premiums, credit facility amendment costs and new debt issuance costs.
43
The decrease in cash used in financing activities in fiscal 2015 compared to fiscal 2014 is primarily due to lower proceeds from the sale of common stock, offset in part by lower debt financing costs.
The Company has no current intent to pay dividends and such payments are subject to limitations under the Company's credit facilities as discussed in Note 7—Long-Term Debt in Part II, Item 8 of this Annual Report on Form 10-K.
Credit Facilities and Debt Agreements
The Company’s credit facilities and certain long-term debt agreements have restrictive covenants and cross-default provisions which generally provide, subject to the Company’s right to cure, for the acceleration of payments due in the event of a breach of a covenant or a default in the payment of a specified amount of indebtedness due under certain other debt agreements. The Company was in compliance with all such covenants and provisions for all periods presented. Refer to Note 7—Long-Term Debt in Part II, Item 8 of this Annual Report on Form 10-K for a detailed discussion of the provisions of the Company's credit facilities and certain long-term debt agreements and additional information.
Senior Secured Credit Agreements
As of February 27, 2016 and February 28, 2015, the Company had outstanding borrowings of $1,459 and $1,469, respectively, under its Secured Term Loan Facility, which is secured by substantially all of the Company’s real estate, equipment and certain other assets, and bears interest at the rate of LIBOR plus 3.50 percent subject to a floor on LIBOR of 1.00 percent. The Secured Term Loan Facility is guaranteed by the Company’s material subsidiaries (together with the Company, the “Term Loan Parties”). To secure their obligations under the Secured Term Loan Facility, the Company granted a perfected first-priority security interest for the benefit of the facility lenders in the Term Loan Parties’ equity interests in Moran Foods, LLC, the main operating entity of the Company’s Save-A-Lot business, and the Term Loan Parties granted a perfected first priority security interest in substantially all of their intellectual property and a first priority mortgage lien and security interest in certain owned or ground-leased real estate and associated equipment pledged as collateral. As of February 27, 2016 and February 28, 2015, there was $781 and $776, respectively, of owned or ground-leased real estate and associated equipment pledged as collateral, which was included in Property, plant and equipment, net in the Consolidated Balance Sheets. In addition, the obligations of the Term Loan Parties under the Secured Term Loan Facility are secured by second-priority security interests in the collateral securing the Revolving ABL Credit Facility. Including the original issue discount, current debt financing costs, and the Excess Cash Flow (as defined in the facility) prepayment required under the Secured Term Loan Facility as described below, $102 and $11 of the Secured Term Loan Facility was classified as current as of February 27, 2016 and February 28, 2015, respectively.
The loans under the Secured Term Loan Facility may be voluntarily prepaid in certain minimum principal amounts, subject to the payment of breakage or similar costs. Pursuant to the Secured Term Loan Facility, the Company must, subject to certain customary reinvestment rights, apply 100 percent of Net Cash Proceeds (as defined in the facility) from certain types of asset sales (excluding proceeds of the collateral security of the Revolving ABL Credit Facility and other secured indebtedness) to prepay the loans outstanding under the Secured Term Loan Facility. The Company must also prepay loans outstanding under the facility no later than 90 days after the fiscal year end in an aggregate principal amount equal to a percentage (which percentage ranges from 0 to 50 percent depending on the Company’s Total Secured Leverage Ratio (as defined in the facility) as of the last day of such fiscal year) of Excess Cash Flow (as defined in the facility) for the fiscal year then ended minus any voluntary prepayments made during such fiscal year with Internally Generated Cash (as defined in the facility). Based on the Company's Excess Cash Flow for the fiscal year ended February 27, 2016, a $99 prepayment will be required under the Secured Term Loan Facility no later than 90 days after the fiscal year ended February 27, 2016.
On February 3, 2016, the Company entered into Amendment No. 3 (the "Third ABL Amendment") to the Revolving ABL Credit Facility that extended the maturity date of the facility to February 3, 2021 from its prior maturity date of September 30, 2019. The Third ABL Amendment also reduced the rate at which interest is paid on loans under the Revolving ABL Credit Facility by 25 basis points to, at the Company's election, LIBOR plus an interest rate margin between 1.25 percent to 1.75 percent or prime plus an interest rate margin between 0.25 percent to 0.75 percent, in each case, depending on quarterly average excess availability. This Third ABL Amendment also reduced the letter of credit fee under the Revolving ABL Credit Facility to 1.25 percent to 1.75 percent, depending on quarterly average excess availability. Further, the amount of the facility fee required to be paid quarterly in arrears by the Company was reduced to 0.25 percent multiplied by the aggregate unused commitments under the Revolving ABL Credit Facility. The Third ABL Amendment also permits the Company and its subsidiaries to undertake certain transactions reasonably determined by the Company to be necessary to effectuate a spin-off of Save-A-Lot. In addition, the Third ABL Amendment also modifies certain representations and warranties, covenants and events of default set forth in the Revolving ABL Credit Facility, and provides for the adjustment of certain covenants in the event a spin-off of Save-A-Lot is consummated.
As of February 27, 2016 and February 28, 2015, the Company had $138 and $0 of outstanding borrowings under the Revolving ABL Credit Facility, respectively. As of February 27, 2016, letters of credit outstanding under the Revolving ABL Credit
44
Facility were $69 at fees of 1.625 percent, and the unused available credit under this facility was $744 with facility fees of 0.25 percent. As of February 28, 2015, letters of credit outstanding under the Revolving ABL Credit Facility were $76 at fees of 1.625 percent, and the unused available credit under this facility was $871 with facility fees of 0.375 percent. As of February 27, 2016, the Revolving ABL Credit Facility was secured on a first-priority basis by $1,238 of certain inventory assets included in Inventories, net, $222 of certain receivables included in Receivables, net, $23 of certain amounts included in Cash and cash equivalents and all of the Company’s pharmacy scripts included in Intangible assets, net, in the Consolidated Balance Sheets. As of February 28, 2015, the Revolving ABL Credit Facility was secured on a first-priority basis by $1,188 of certain inventory assets included in Inventories, net, $220 of certain receivables included in Receivables, net, $28 of certain amounts included in Cash and cash equivalents and all of the Company’s pharmacy scripts included in Intangible assets, net, in the Consolidated Balance Sheets.
The revolving loans under the Revolving ABL Credit Facility may be voluntarily prepaid in certain minimum principal amounts, in whole or in part, without premium or penalty, subject to breakage or similar costs. The Company and those subsidiaries named as borrowers under the Revolving ABL Credit Facility are required to repay the revolving loans in cash and provide cash collateral under this facility to the extent that the revolving loans and letters of credit exceed the lesser of the borrowing base then in effect or the aggregate amount of the lenders’ commitments under the Revolving ABL Credit Facility. During the fiscal year ended February 27, 2016, the Company borrowed $840 and repaid $702 under the Revolving ABL Credit Facility. During the fiscal year ended February 28, 2015, the Company borrowed $3,268 and repaid $3,268 under the Revolving ABL Credit Facility. Certain of the Company’s material subsidiaries are co-borrowers under the Revolving ABL Credit Facility, and this facility is guaranteed by the rest of the Company’s material subsidiaries (the Company and those subsidiaries named as borrowers and guarantors under the Revolving ABL Credit Facility, the “ABL Loan Parties”). To secure their obligations under this facility, the ABL Loan Parties have granted a perfected first-priority security interest for the benefit of the facility lenders in their present and future inventory, credit card, wholesale trade, pharmacy and certain other receivables, prescription files and related assets. In addition, the obligations under the Revolving ABL Credit Facility are secured by second-priority liens on and security interests in the collateral securing the Secured Term Loan Facility, subject to certain limitations to ensure compliance with the Company’s outstanding debt instruments and leases.
Both the Secured Term Loan Facility and the Revolving ABL Credit Facility limit the Company’s ability to make Restricted Payments (as defined in both the Secured Term Loan Facility and the Revolving ABL Credit Facility), which include dividends to stockholders. The Secured Term Loan Facility caps the aggregate amount of Restricted Payments that may be made over the life of the Secured Term Loan Facility. That aggregate cap can fluctuate over time and the cap could be reduced by certain other actions taken by the Company, including certain debt prepayments and Permitted Investments (as defined in the Secured Term Loan Facility). As of February 27, 2016, that aggregate cap on Restricted Payments was approximately $401. The Revolving ABL Credit Facility permits dividends up to $75 per fiscal year, not to exceed $175 in the aggregate over the life of the Revolving ABL Credit Facility, as long as no Cash Dominion Event (as defined in the Revolving ABL Credit Facility) exists. Those caps could be reduced by certain debt prepayments made by the Company. The Revolving ABL Credit Facility permits other Restricted Payments as long as the Payment Conditions (as defined in the Revolving ABL Credit Facility) are met.
Debentures
On January 6, 2016, the Company used borrowings under the Revolving ABL Credit Facility and cash from operations to fund the redemption of the remaining $278 of 8.00 percent Senior Notes due May 2016 (the "2016 Notes"), and to pay accrued and unpaid interest on the redeemed 2016 Notes and the applicable redemption premium of approximately $6, which was expensed. In addition, non-cash charges of $1 for the write-off of the remaining unamortized financing costs on the redeemed 2016 Notes were incurred.
The $400 of 6.75 percent Senior Notes due June 2021, and the $350 of 7.75 Senior Notes due November 2022 contain, and before their redemption the 2016 Notes contained, operating covenants, including limitations on liens and on sale and leaseback transactions. The Company was in compliance with all such covenants and provisions for all periods presented.
Capital Expenditures
Capital expenditures in fiscal 2016 were $281 compared with $240 last year, excluding cash paid for business acquisitions but including $19 of higher capital lease additions related to Retail stores and a Save-A-Lot distribution center in fiscal 2016, and primarily consisted of capital investments into new Retail and Save-A-Lot corporate stores and a higher number of Save-A-Lot corporate store remodels. During fiscal 2016, the Company paid $9 to acquire 12 Save-A-Lot and Retail stores. During fiscal 2015, the Company paid $55 for the purchase of certain Rainbow and licensed Save-A-Lot stores.
Capital expenditures for fiscal 2017 are projected to be approximately $325 to $350. The increase in capital expenditures over fiscal 2016 is primarily due to new and remodeled corporate Save-A-Lot and Retail stores.
45
Pension and Other Postretirement Benefit Obligations
Cash contributions to defined benefit pension and other postretirement benefit plans were $40, $169 and $124 in fiscal 2016, 2015 and 2014, respectively, in accordance with the Employee Retirement Income Security Act of 1974, as amended (“ERISA”), minimum requirements along with certain discretionary contributions made by the Company. Cash contributions decreased in fiscal 2016 due to lower required and discretionary defined benefit pension plan contributions. Cash contributions increased in fiscal 2015 primarily due to a $50 discretionary contribution made in fiscal 2015 that helped to offset the decrease in the funded status of the SUPERVALU Retirement Plan resulting from the plan’s assets and liabilities being re-measured at November 29, 2014.
The Company anticipates fiscal 2017 contributions to pension and other postretirement benefit plans will be approximately $30 to $35, which primarily reflect discretionary defined benefit pension contributions and required minimum other postretirement benefit plan contributions. The Company currently expects that no minimum pension contributions will be required to the Company's pension plans in fiscal 2017.
In August 2014, the Highway and Transportation Funding Act of 2014, which included an extension of pension funding interest rate relief, was signed into law. The Highway and Transportation Funding Act includes a provision for interest rate stabilization for defined benefit employee pension plans. As a result of this stabilization provision, the Company expects to not be required to make pension contributions to the SUPERVALU INC. Retirement Plan in fiscal 2017.
The Company funds its defined benefit pension plans based on the minimum contribution amount required under ERISA, the Pension Protection Act of 2006 and other applicable laws, as determined by the Company’s external actuarial consultant, and additional contributions made at the Company's discretion. The Company may accelerate contributions or undertake contributions in excess of the minimum requirements from time to time subject to the availability of cash in excess of operating and financing needs or other factors as may be applicable. The Company assesses the relative attractiveness of the use of cash to accelerate contributions considering such factors as expected return on assets, discount rates, cost of debt, reducing or eliminating required PBGC variable rate premiums or in order to achieve exemption from participant notices of underfunding.
During the third quarter of fiscal 2015, the Company made lump sum settlement payments to certain deferred vested pension plan participants under a lump sum payment option window. The payments were equal to the present value of the participants' pension benefits, and were made to certain former employees who were deferred vested participants in the SUPERVALU Retirement Plan, who had not yet begun receiving monthly pension benefit payments and who elected to participate in the lump sum payment option window. In fiscal 2015, the SUPERVALU Retirement Plan made lump sum settlement payments of approximately $272. The lump sum settlement payments resulted in a non-cash pension settlement charge of $64 from the acceleration of a portion of the accumulated unrecognized actuarial loss.
CRITICAL ACCOUNTING POLICIES
The preparation of Consolidated Financial Statements in conformity with accounting principles generally accepted in the United States of America (“Accounting Standards”) requires management to make estimates and assumptions that affect the reported amounts of assets and liabilities and disclosure of contingent assets and liabilities as of the date of the financial statements and the reported amounts of revenues and expenses during the reporting period. Actual results could differ from those estimates.
Significant accounting policies are discussed in Note 1—Summary of Significant Accounting Policies in the Notes to Consolidated Financial Statements included in Part II, Item 8 of this Annual Report on Form 10-K. Management believes the following critical accounting policies reflect its more subjective or complex judgments and estimates used in the preparation of the Company’s Consolidated Financial Statements.
Vendor Funds
The Company receives funds from many of the vendors whose products the Company buys for resale in its stores. These vendor funds are provided to increase the sell-through of the related products. The Company receives vendor funds for a variety of merchandising activities: placement of the vendors’ products in the Company’s advertising; display of the vendors’ products in prominent locations in the Company’s stores; supporting the introduction of new products into the Company’s retail stores and distribution system; exclusivity rights in certain categories; and to compensate for temporary price reductions offered to customers on products held for sale at retail stores. The Company also receives vendor funds for buying activities such as
46
volume commitment rebates, credits for purchasing products in advance of their need and cash discounts for the early payment of merchandise purchases. The majority of the vendor fund contracts have terms of less than a year, with a small proportion of the contracts longer than one year.
The Company recognizes vendor funds for merchandising activities as a reduction of Cost of sales when the related products are sold. Vendor funds that have been earned as a result of completing the required performance under the terms of the underlying agreements but for which the product has not yet been sold are recognized as reductions of inventory.
The amount and timing of recognition of vendor funds as well as the amount of vendor funds to be recognized as a reduction to ending inventory requires management judgment and estimates. Management determines these amounts based on estimates of current year purchase volume using forecast and historical data and review of average inventory turnover data. These judgments and estimates impact the Company’s reported gross profit, operating earnings (loss) and inventory amounts. The historical estimates of the Company have been reliable in the past, and the Company believes the methodology will continue to be reliable in the future. Based on previous experience, the Company does not expect significant changes in the level of vendor support. However, if such changes were to occur, cost of sales and advertising expense could change, depending on the specific vendors involved. If vendor advertising allowances were substantially reduced or eliminated, the Company would consider changing the volume, type and frequency of the advertising, which could increase or decrease its advertising expense. Similarly, the Company is not able to assess the impact of vendor advertising allowances on increasing revenues as such allowances do not directly generate revenue for the Company’s stores. For fiscal 2016, a 1 percent change in total vendor funds earned, including advertising allowances, with no offsetting changes to the base price on the products purchased, would impact Gross profit by less than 10 basis points.
Inventories, Net
Inventories are valued at the lower of cost or market. Substantially all of the Company’s inventory consists of finished goods. Inventories are recorded net of vendor allowances and cash discounts. The Company evaluates inventory shortages (shrink) throughout each fiscal year based on actual physical counts in its facilities. Allowances for inventory shortages are recorded based on the results of these counts to provide for estimated shortages as of the end of each fiscal year.
To value discrete inventory items at lower of cost or market before application of any last-in, first-out (“LIFO”) reserve, the Company uses the weighted average cost method, the retail inventory method (“RIM”) or replacement cost method. Inventories were valued at the lower of cost or market under the following methods as of February 27, 2016: weighted average cost method, 56 percent; replacement cost method, 22 percent; and RIM, 22 percent.
The replacement cost approach under the FIFO method is predominantly utilized in determining the value of high turnover perishable items, including produce, deli, bakery, meat and floral. Under the replacement cost method applied on a LIFO basis, the most recent purchase cost is used to calculate the current cost of inventory before application of any LIFO reserve. The replacement cost approach results in inventories valued at the lower of cost or market because of the high inventory turnover and the resulting low inventory days supply on hand combined with infrequent vendor price changes for these items of inventory.
RIM is used in valuing retail inventories. Under this method, the valuation of inventories is at cost and the resulting gross margins are calculated by applying a calculated cost-to-retail ratio to the retail value of inventories. RIM is an averaging method that has been widely used in the retail industry. Inherent in the RIM calculations are certain significant management judgments and estimates, including inventory shortages and cost-to-retail ratios, which impact the ending inventory valuation at cost, as well as the resulting gross margins. Management consistently applies its application of RIM valuations by product category and believes that the Company’s RIM provides an inventory valuation that reasonably approximates cost. For fiscal 2016, a 1 percent change in the cost-to-retail ratios used to value inventories would impact Gross profit by less than 10 basis points.
As of February 27, 2016 and February 28, 2015, approximately 57 percent and 55 percent, respectively, of the Company’s inventories were valued under the LIFO method. During fiscal 2015 and 2014, inventory quantities in certain LIFO layers were reduced. These reductions resulted in a liquidation of LIFO inventory quantities carried at lower costs prevailing in prior years as compared with the cost of fiscal 2015 and 2014 purchases. As a result, Cost of sales decreased by $1 and $14 in fiscal 2015 and 2014, respectively. If the FIFO method had been used to determine cost of inventories for which the LIFO method is used, the Company’s inventories would have been higher by approximately $215 and $211 as of February 27, 2016 and February 28, 2015, respectively.
47
Long-Lived Assets
The Company monitors the recoverability of its long-lived assets and tests them for impairment whenever events or changes in circumstances indicate that the carrying amount of such assets may not be fully recoverable. If impairment is identified for long-lived assets to be held and used, the fair value is compared to the carrying value of the group of assets and an impairment charge is recorded for the excess of the carrying value over the fair value. Refer to Note 1—Summary of Significant Accounting Policies in the Notes to Consolidated Financial Statements included in Part II, Item 8 of this Annual Report on Form 10-K for further information regarding the Company's monitoring, testing and impairment calculations for its long-lived assets.
Significant management judgments and estimates are used in accounting for long-lived assets, including, but not limited to, the determination of useful lives estimates, dependency of identifiable cash flows, projected undiscounted cash flows and fair values based on current market values or discounted cash flows using Level 3 inputs.
Determinations of geographic markets utilized in grouping assets and the interdependency of cash flows rely on significant judgments by management. The Company believes that revenue and cash flow dependencies exist among stores within its markets and operates its stores on that basis. The Company reviews its long-lived asset groupings at least annually or as facts and circumstances arise during interim periods that indicate a review should occur. The Company conducted reviews during the fourth quarter of fiscal 2016 and 2015, and no changes to geographic market asset groupings were made as a result of these reviews. Due to the highly competitive environment and ongoing business transformation, the Company continues to evaluate its long-lived asset policy and current asset groups to determine if additional modifications to the estimation approach of the Company’s long-lived asset groups are necessary. Future changes to the Company’s assessment of its long-lived asset policy and changes in circumstances, operating results or other events may result in additional asset impairment testing and charges.
The Company estimates fair value based on the Company’s experience and knowledge of the market in which the property is located and, when necessary, utilizes local real estate brokers. The Company’s estimate of undiscounted cash flows attributable to the asset groups includes only future cash flows that are directly associated with and that are expected to arise as a direct result of the use and eventual disposition of the asset group.
To calculate projected future cash flows, the Company utilizes business plans that take into account operational changes, competitive factors and inflation, among other factors. Using different assumptions or estimates could result in a change in estimated cash flows and fair values that could produce different results. The composition of cash flows for identifiable cash flows that are grouped include additional projected cash outflows of operating that asset group as a whole, whereas the composition of cash flows evaluated at the retail store-level and at the distribution center level include only the cash flows required to operate those individual long-lived assets.
The Company recognized Property, plant and equipment-related impairment charges of $8, $3 and $24 in fiscal 2016, 2015 and 2014, respectively. During fiscal 2016, no impairment charges were recorded as a result of the Company’s annual impairment review. Refer to Note 4—Reserves for Closed Properties and Property, Plant and Equipment-related Impairment Charges in the Notes to Consolidated Financial Statements included in Part II, Item 8 of this Annual Report on Form 10-K for additional information on reserves for closed properties and Property, plant and equipment-related impairment charges.
Reserves for Closed Properties
The Company maintains reserves for costs associated with closures of retail stores, distribution centers and other properties that are no longer being utilized in current operations. The Company provides for closed property operating lease liabilities using a discount rate to calculate the present value of the remaining noncancellable lease payments after the closing date, reduced by estimated subtenant rentals that could be reasonably obtained for the property. The closed property lease liabilities usually are paid over the remaining lease terms, which generally range from one to 15 years. The Company estimates subtenant rentals and future cash flows based on the Company’s experience and knowledge of the market in which the closed property is located, the Company’s previous efforts to dispose of similar assets and existing economic conditions. Adjustments to closed property reserves primarily relate to changes in subtenant income or actual exit costs differing from original estimates. Adjustments are made for changes in estimates in the period in which the changes become known.
Owned properties, capital lease properties and the related equipment and leasehold improvements at operating leased properties that are closed are reduced to their estimated fair value. The Company estimates fair value based on its experience and knowledge of the market in which the closed property is located and, when necessary, utilizes local real estate brokers to assist in the valuation.
The expectations on timing of disposition and the estimated sales price or subtenant rentals associated with closed properties, owned or leased, are impacted by variable factors including inflation, the general health of the economy, resultant demand for
48
commercial property, the ability to secure subleases, the creditworthiness of sublessees and the Company’s success at negotiating early termination agreements with lessors. While management believes the current estimates of reserves for closed properties and related impairment charges are adequate, it is possible that market and economic conditions in the real estate market could cause changes in the Company’s assumptions and may require additional reserves and asset impairment charges to be recorded.
The Company’s net reserve for closed properties was $29, net of estimated sublease recoveries of $19, as of February 27, 2016, and $34, net of estimated sublease recoveries of $22, as of February 28, 2015.
Goodwill
Goodwill is tested at least annually for impairment and more frequently if events or changes in circumstances indicate that the asset might be impaired. The impairment test is performed using a two-step process. In the first step, the fair value of each reporting unit is compared with the carrying amount of the reporting unit, including goodwill. If the estimated fair value is less than the carrying amount of the reporting unit, there is an indication that goodwill impairment exists and a second step is completed in order to determine the amount of the goodwill impairment, if any, that should be recorded. In the second step, an impairment loss is recognized for any excess of the carrying amount of the reporting unit’s goodwill over the implied fair value of that goodwill.
The Company’s determination of reporting units considers the quantitative and qualitative characteristics of aggregation of each of the components within the Wholesale and Retail operating segments. The significant qualitative and economic characteristics used in determining our components to support their aggregation include types of businesses and the manner in which the components operate, consideration of key impacts to net sales, cost of sales, competitive risks and the extent to which components share assets and other resources. For Wholesale and Retail, the Company’s reporting units are the operating segments of the business, which consist of Wholesale and Retail. Goodwill was assigned to these reporting units as of the acquisition date, with no amounts being allocated between reporting units. For Save-A-Lot, the reporting units are the components of the business: Licensee Distribution and Corporate Stores. Goodwill has been allocated between the Save-A-Lot reporting units on a relative fair value basis.
The Wholesale reporting unit is comprised of the aggregation of two geographic distribution areas, which are organized based on region components: East and West. The Company’s Retail reporting unit is comprised of the aggregation of five traditional retail food store components under five banners: Cub Foods, Shoppers Food & Pharmacy, Shop 'n Save, Farm Fresh and Hornbacher’s.
The fair values of the Company’s reporting units are determined by using both the market approach, applying a multiple of earnings and revenue based on guidelines for publicly traded companies, and the income approach, discounting projected future cash flows based on management’s expectations of the current and future operating environment. The rates used to discount projected future cash flows reflect a weighted average cost of capital based on the Company’s industry, capital structure and risk premiums including those reflected in the current market capitalization.
Fair value calculations contain significant judgments and estimates related to each reporting unit’s projected weighted average cost of capital, future revenue, profitability, cash flows and fair values of assets and liabilities. When preparing these estimates, management considers each reporting unit’s historical results, current operating trends and specific plans in place. These estimates are impacted by variable factors, including inflation, the general health of the economy and market competition. The Company has sufficient current and historical information available to support its judgments and estimates. However, if actual results are not consistent with the Company’s estimates, future operating results may be materially impacted.
The Company performed its annual test of goodwill during the fourth quarter of fiscal 2016, utilizing discount rates ranging between 10 percent and 13 percent to discount projected future cash flows for each reporting unit and perpetual growth rates that ranged between 2 percent and 3 percent.
Management performed sensitivity analyses on the fair values resulting from the discounted cash flow analysis utilizing alternate assumptions that reflect reasonably possible changes to future assumptions. Based upon the Company’s analysis of the Wholesale, Save-A-Lot and Retail reporting units, a 100 basis point increase in the discount rate utilized in the discounted cash flow analysis would not have resulted in any reporting unit failing step one of the impairment test. Additionally, a 100 basis point decrease in the estimated perpetual sales growth rates utilized in the discounted cash flow analysis would not have resulted in any reporting unit failing the first step of the impairment tests. The fair values of the Company’s Retail, Wholesale and Save-A-Lot Corporate Stores reporting units exceeded their carrying values by approximately 100 percent, 95 percent and 35 percent, respectively. The fair value of goodwill for the Company’s Save-A-Lot Licensee Distribution reporting unit was in excess of 100 percent of its carrying value. If the Company’s stock price experiences a significant and sustained decline, or
49
other events or changes in circumstances, such as a material shortfall of operating results to plan, the Company would reassess the fair value of the Company’s reporting units to their carrying value.
The Company completed step one of the annual goodwill impairment evaluation during the fourth quarter for fiscal 2016 and 2015 with each reporting unit’s fair value exceeding its carrying value. Accordingly, step two of the impairment analysis was not required for fiscal 2016 and 2015.
Benefit Plans
The Company sponsors pension and other postretirement plans in various forms covering substantially all employees who meet eligibility requirements. Pension benefits associated with these plans are generally based on each participant’s years of service, compensation, and age at retirement or termination. The Company’s defined benefit pension plan, the SUPERVALU Retirement Plan, and certain supplemental executive retirement plans were closed to new participants and service crediting ended for all participants as of December 31, 2007.
While the Company believes the valuation methods used to determine the fair value of plan assets are appropriate and consistent with other market participants, the use of different methodologies or assumptions to determine the fair value of certain financial instruments could result in a different estimate of fair value at the reporting date.
The determination of the Company’s obligation and related expense for Company-sponsored pension and other postretirement benefits is dependent, in part, on management’s selection of certain actuarial assumptions used in calculating these amounts. These assumptions include, among other things, the discount rate, the expected long-term rate of return on plan assets and the rates of increase in compensation and healthcare costs. During fiscal 2016, the Retirement Plans Experience Committee of the Society of Actuaries ("RPEC") issued an update to Mortality Improvement Scale MP-2014, which was released in October 2014, named MP-2015. This updated scale was created using two additional years of historical data and the same RPEC 2014 model that was used to produce MP-2014. The Company used MP-2015 to calculate the fiscal 2016 projected benefit obligation. Refer to Note 11—Benefit Plans in the Notes to Consolidated Financial Statements included in Part II, Item 8 of this Annual Report on Form 10-K for additional discussion of actuarial assumptions used in determining pension and postretirement health care liabilities and expenses.
The Company reviews and selects the discount rate to be used in connection with its pension and other postretirement obligations annually. The discount rate reflects the current rate at which the associated liabilities could be effectively settled at the end of the year. The Company sets its rate to reflect the yield of a portfolio of high quality, fixed-income debt instruments that would produce cash flows sufficient in timing and amount to settle projected future benefits.
The Company’s expected long-term rate of return on plan assets assumption is determined based on the portfolio’s actual and target composition, current market conditions, forward-looking return and risk assumptions by asset class, and historical long-term investment performance. The assumed long-term rate of return on pension assets was 6.5 percent for fiscal 2016 and 6.5 percent and 7.0 percent for fiscal 2015. The 10-year rolling average annualized return for a portfolio of investments applied in a manner consistent with our target allocations have generated average returns of approximately 8.2 percent based on returns from 1990 to 2015. In accordance with Accounting Standards, actual results that differ from the Company’s assumptions are accumulated and amortized over future periods and, therefore, affect expense and obligations in future periods.
Effective for fiscal 2017, the Company adopted an alternative approach for determining the interest and service cost components of net periodic benefit cost for defined benefit pension and other postretirement benefit plans, the "full yield curve" approach. Under this method, the discount rate assumption used in the interest and service cost components of net periodic benefit cost was built through applying the specific spot rates along the yield curve used in the determination of the benefit obligation described above, to the relevant projected future cash flows of the Company's pension and other postretirement benefit plans. Prior to fiscal 2017, including for the current fiscal year 2016 being reported, the interest and service cost components of pension expense were estimated using a single weighted-average discount rate derived from the yield curve used to measure the projected benefit obligation at the beginning of the period.
The Company adopted the alternative approach to improve the correlation between projected benefit cash flows and the corresponding yield curve spot rates and to provide a more precise measurement of interest and service costs. This change does not affect the measurement of total benefit obligation. The Company has concluded that the application of the full yield curve approach is a change in estimate and, accordingly, will recognize the effect prospectively beginning in fiscal 2017. The impact of the change in estimate is an anticipated reduction of the interest and service cost components within net periodic benefit cost in fiscal 2017 by approximately $22 for the defined benefit pension plans and less than $1 for postretirement benefit plans compared to the prior year approach.
50
For fiscal 2017, each 25 basis point reduction in the discount rate would increase pension expense by approximately $8 and each 25 basis point reduction in expected return on plan assets would increase pension expense by approximately $6. Similarly, for postretirement benefits, a 100 basis point increase in the healthcare cost trend rate would increase the accumulated postretirement benefit obligation as of the end of fiscal 2016 by approximately $3, and would increase service and interest cost by less than $1. Conversely, a 100 basis point decrease in the healthcare cost trend rate would decrease the accumulated postretirement benefit obligation as of the end of fiscal 2016 by approximately $3, and would decrease service and interest cost by less than $1. Although the Company believes that its assumptions are appropriate, the actuarial assumptions may differ from actual results due to changing market and economic conditions, higher or lower withdrawal rates and longer or shorter life spans of participants.
Income Taxes
The Company’s current and deferred tax provision is based on estimates and assumptions that could materially differ from the actual results reflected in its income tax returns filed during the subsequent year and could significantly affect the effective tax rate and cash flows in future years.
The Company recognizes deferred tax assets and liabilities for the expected tax consequences of temporary differences between the tax bases of assets and liabilities and their reported amounts using enacted tax rates in effect for the year in which it expects the differences to reverse.
The Company’s effective tax rate is influenced by tax planning opportunities available in the various jurisdictions in which the Company operates. Management’s judgment is involved in determining the effective tax rate and in evaluating the ultimate resolution of any uncertain tax positions. In addition, the Company is currently in various stages of audits, appeals or other methods of review with taxing authorities from various taxing jurisdictions. The Company establishes liabilities for unrecognized tax benefits in a variety of taxing jurisdictions when, despite management’s belief that the Company’s tax return positions are supportable, certain positions may be challenged and may need to be revised. The Company adjusts these liabilities in light of changing facts and circumstances, such as the progress of a tax audit. The effective income tax rate includes the impact of reserve provisions and changes to those reserves. The Company also provides interest on these liabilities at the appropriate statutory interest rate. The actual benefits ultimately realized for tax positions may differ from the Company’s estimates due to changes in facts, circumstances and new information. As of February 27, 2016 and February 28, 2015, the Company had $70 and $94 of unrecognized tax benefits, respectively.
The Company records a valuation allowance to reduce the deferred tax assets to the amount that it is more-likely-than-not to realize. Forecasted earnings, future taxable income and future prudent and feasible tax planning strategies are considered in determining the need for a valuation allowance. In the event the Company was not able to realize all or part of its net deferred tax assets in the future, the valuation allowance would be increased. Likewise, if it was determined that the Company was more-likely-than-not to realize the net deferred tax assets, the applicable portion of the valuation allowance would reverse. The Company had a valuation allowance of $1,408 and $1,404 as of February 27, 2016 and February 28, 2015, respectively.
Included in discontinued operations is the recognition of the additional tax basis in the shares of NAI offset by a valuation allowance on the estimated capital loss, as there is no current evidence that the capital loss will be used prior to its expiration.
Self-Insurance Liabilities
The Company uses a combination of insurance and self-insurance for workers’ compensation, automobile and general liability costs. It is the Company’s policy to record its self-insurance liabilities based on management’s estimate of the ultimate cost of reported claims and claims incurred but not yet reported and related expenses, discounted at a risk-free interest rate.
In determining its self-insurance liabilities, the Company performs a continuing review of its overall position and reserving techniques. Since recorded amounts are based on estimates, the ultimate cost of all incurred claims and related expenses may be more or less than the recorded liabilities. Any projection of losses concerning workers’ compensation, healthcare and general and automobile liability is subject to a degree of variability. Among the causes of this variability are unpredictable external factors affecting future inflation rates, discount rates, litigation trends, legal interpretations, regulatory changes, benefit level changes and actual claim settlement patterns.
If, in the future, the Company were to experience significant volatility in the amount and timing of cash payments compared to its earlier estimates, the Company would assess whether to continue to discount these liabilities. The Company had net self-insurance liabilities of approximately $95, net of the discount of $6, and $93, net of the discount of $6, as of February 27, 2016 and February 28, 2015, respectively. For the claims that occurred during the fiscal year ending February 27, 2016, each 25 basis point change in the discount rate would impact the net self-insurance liabilities by less than $1.
51
OFF-BALANCE SHEET ARRANGEMENTS
Guarantees and Contingent Liabilities
The Company has outstanding guarantees related to certain leases, fixture financing loans and other debt obligations of various retailers as of February 27, 2016. These guarantees were generally made to support the business growth of independent retail customers. The guarantees are generally for the entire terms of the leases or other debt obligations with remaining terms that range from less than one year to 14 years, with a weighted average remaining term of approximately eight years. For each guarantee issued, if the independent retail customer defaults on a payment, the Company would be required to make payments under its guarantee. Generally, the guarantees are secured by indemnification agreements or personal guarantees of the independent retail customer.
The Company reviews performance risk related to its guarantees of independent retail customer obligations based on internal measures of credit performance. As of February 27, 2016, the maximum amount of undiscounted payments the Company would be required to make in the event of default of all guarantees was $70 ($44 on a discounted basis). Based on the indemnification agreements, personal guarantees and results of the reviews of performance risk, the Company believes the likelihood that it will be required to assume a material amount of these obligations is remote. Accordingly, no amount has been recorded in the Consolidated Balance Sheets for these contingent obligations under the Company’s guarantee arrangements.
The Company is contingently liable for leases that have been assigned to various third parties in connection with facility closings and dispositions. The Company could be required to satisfy the obligations under the leases if any of the assignees are unable to fulfill their lease obligations. Due to the wide distribution of the Company’s assignments among third parties, and various other remedies available, the Company believes the likelihood that it will be required to assume a material amount of these obligations is remote.
The Company is a party to a variety of contractual agreements under which it may be obligated to indemnify the other party for certain matters in the ordinary course of business, which indemnities may be secured by operation of law or otherwise. These agreements primarily relate to the Company’s commercial contracts, the TSA, contracts entered into for the purchase and sale of stock or assets, operating leases and other real estate contracts, financial agreements, agreements to provide services to the Company and agreements to indemnify officers, directors and employees in the performance of their work. While the Company’s aggregate indemnification obligation could result in a material liability, the Company is not aware of any matters that are expected to result in a material liability.
Following the sale of NAI, the Company remains contingently liable with respect to certain self-insurance commitments and other guarantees as a result of parental guarantees issued by SUPERVALU INC. with respect to the obligations of NAI that were incurred while NAI was a subsidiary of the Company. As of February 27, 2016, using actuarial estimates as of December 31, 2015, the total undiscounted amount of all such guarantees was estimated at $167 ($150 on a discounted basis). Based on the expected settlement of the self-insurance claims that underlie the Company’s commitments, the Company believes that such contingent liabilities will continue to decline. Subsequent to the sale of NAI, NAI collateralized most of these obligations with letters of credit and surety bonds to numerous states. Because NAI remains a primary obligor on these self-insurance and other obligations and has collateralized most of the self-insurance obligations for which the Company remains contingently liable, the Company believes that the likelihood that it will be required to assume a material amount of these obligations is remote. Accordingly, no amount has been recorded in the Consolidated Balance Sheets for these guarantees.
Multiemployer Plans
The Company contributes to various multiemployer pension plans under collective bargaining agreements, primarily defined benefit pension plans. These multiemployer plans generally provide retirement benefits to participants based on their service to contributing employers. The benefits are paid from assets held in trust for that purpose. Plan trustees typically are responsible for determining the level of benefits to be provided to participants as well as the investment of the assets and plan administration. Trustees are appointed in equal number by employers and unions that are parties to the collective bargaining agreement.
Expense is recognized in connection with these plans as contributions are funded, in accordance with Accounting Standards. The Company made contributions to these plans, and recognized expense, of $43, $39 and $39 in fiscal 2016, 2015 and 2014, respectively. Company contributions to these plans could increase in the near term. However, the amount of any increase or decrease in contributions will depend on a variety of factors, including the results of the Company’s collective bargaining efforts, investment returns on the assets held in the plans, actions taken by the trustees who manage the plans and requirements under the Pension Protection Act, the Multiemployer Pension Reform Act and Section 412(e) of the Internal Revenue Code. Furthermore, if the Company were to significantly reduce contributions, exit certain markets or otherwise cease making
52
contributions to these plans, it could trigger a partial or complete withdrawal that would require the Company to fund its proportionate share of a plan’s unfunded vested benefits.
Based on the assessment of the most recent information available from the multiemployer plans, the Company believes that most of the plans to which it contributes are underfunded. The Company is only one of a number of employers contributing to these plans and the underfunding is not a direct obligation or liability of the Company. However, the Company has attempted, as of February 27, 2016, to estimate its “proportionate share” of the underfunding of multiemployer plans to which the Company contributes, based on the ratio of its contributions to the total of all contributions to these plans in a year. As of February 27, 2016, using methods the Company believes are consistent with those used by the plans to establish the underfunded position, the estimate of the Company’s share of the underfunding of multiemployer plans to which it contributes was $587, pre-tax, or $359, after-tax. This represents an increase in the Company's estimated proportionate share of the underfunding of approximately $140, pre-tax, or $51, after-tax, as of February 27, 2016, compared to February 28, 2015. The increase in the Company’s proportionate share of underfunding is primarily attributable to lower than anticipated returns on assets. The estimate is based on the most current information available to the Company including actuarial evaluations and other data, and may be outdated or otherwise unreliable. The Company’s proportionate share of underfunding described above is an estimate and could change based on the results of collective bargaining efforts, investment returns on the assets held in the plans, actions taken by trustees who manage the plans’ benefit payments and requirements under the Pension Protection Act of 2006, the Multiemployer Pension Reform Act and Section 412(e) of the Internal Revenue Code. This share of underfunding does not represent a multiemployer pension withdrawal obligation.
Company contributions can fluctuate from year to year due to store closures and reductions in headcount. In fiscal 2017, the Company expects to contribute approximately $40 to $50 to the multiemployer pension plans, subject to the outcome of collective bargaining and capital market conditions. Furthermore, if the Company were to significantly reduce contributions, exit certain markets or otherwise cease making contributions to these plans, it could trigger a partial or complete withdrawal that would require the Company to record a withdrawal liability. Any withdrawal liability would be recorded when it is probable that a liability exists and can be reasonably estimated, in accordance with Accounting Standards.
The Company also makes contributions to multiemployer health and welfare plans in amounts set forth in the related collective bargaining agreements. A small minority of collective bargaining agreements contain reserve requirements that may trigger unanticipated contributions resulting in increased healthcare expenses. If these healthcare provisions cannot be renegotiated in a manner that reduces the prospective healthcare cost as the Company intends, the Company’s Selling and administrative expenses could increase in the future.
RECENTLY ISSUED ACCOUNTING STANDARDS
In February 2016, the Financial Accounting Standards Board issued authoritative guidance under accounting standard update ("ASU") 2016-02, Leases (Topic 842). ASU 2016-02 provides new comprehensive lease accounting guidance that supersedes existing lease guidance. Upon adoption of ASU 2016-02, the Company will be required to recognize most leases on its balance sheet at the beginning of the earliest comparative period presented with a corresponding adjustment to stockholders' equity. ASU 2016-02 requires the Company to capitalize most current operating lease obligations as right-of-use assets with a corresponding liability based on the present value of future operating leases. Criteria for distinguishing leases between finance and operating are substantially similar to criteria for distinguishing between capital leases and operating leases in existing lease guidance. The Company is required to adopt this new authoritative guidance in the first quarter of fiscal 2020. The Company is currently evaluating the potential adoption impact on its financial statements. For a quantification of the Company's off-balance sheet operating leases subject to capitalization under ASU 2016-02, besides those reserved for as a closed property, refer to the operating lease payments by fiscal year within the "Contractual Obligations" section below.
Refer to Note 1—Summary of Significant Accounting Policies in Part II, Item 8 of this Annual Report on Form 10-K under the caption “Recently Issued Accounting Standards” for a discussion of other recently issued accounting standards not yet adopted by the Company, and for which the Company is currently evaluating their impact on its financial statements.
53
CONTRACTUAL OBLIGATIONS
The following table represents the Company’s significant contractual obligations as of February 27, 2016:
Payments Due Per Period | |||||||||||||||||||
Total | Fiscal 2017 | Fiscal 2018-2019 | Fiscal 2020-2021 | Thereafter | |||||||||||||||
Contractual obligations(1)(2): | |||||||||||||||||||
Long-term debt(3) | $ | 2,347 | $ | 102 | $ | — | $ | 1,495 | $ | 750 | |||||||||
Interest on long-term debt(4) | 575 | 125 | 249 | 133 | 68 | ||||||||||||||
Operating leases(5) | 642 | 126 | 210 | 140 | 166 | ||||||||||||||
Capital leases(6) | 300 | 41 | 77 | 65 | 117 | ||||||||||||||
Purchase obligations(7) | 291 | 206 | 74 | 11 | — | ||||||||||||||
Self-insurance obligations(8) | 101 | 31 | 34 | 15 | 21 | ||||||||||||||
Total contractual obligations | $ | 4,256 | $ | 631 | $ | 644 | $ | 1,859 | $ | 1,122 | |||||||||
(1) | Contractual obligations payments due per period presented here exclude the Company’s discretionary funding of its pension and required funding of its postretirement benefit obligations, which totaled $40 for fiscal 2016, and multiemployer pension plan contributions, which totaled $43 for fiscal 2016, because the timing of future payments beyond fiscal 2017 cannot be reasonably determined. Pension and postretirement benefit obligations were $585 as of February 27, 2016. The Company expects to contribute $30 to $35 to pension and postretirement benefit plans during fiscal 2017, but is not required to make minimum pension contributions. |
(2) | Unrecognized tax benefits, which totaled $70 as of February 27, 2016, were excluded from the contractual obligations table because an estimate of the timing of future tax settlements cannot be reasonably determined. |
(3) | Long-term debt amounts exclude any original issue discounts and deferred financing costs. Long-term debt payments due for fiscal 2017 include the Excess Cash Flow prepayment required under the provisions of the Secured Term Loan Facility. Long-term debt payments due per period for fiscal 2018 through thereafter exclude any Excess Cash Flow prepayments required under the provisions of the Secured Term Loan Facility because the amount of future prepayment amounts, if any, are not reasonably estimable as of February 27, 2016. |
(4) | Amounts include contractual interest payments using the interest rate as of February 27, 2016 applicable to the Company’s variable interest debt instruments (including variable interest rates under the Secured Term Loan Facility that have been swapped to fixed interest rates) and stated fixed rates for all other debt instruments. |
(5) | Represents the minimum rents payable under operating leases, excluding common area maintenance, insurance or tax payments, for which the Company is also obligated, offset by minimum subtenant rentals of $44, $16, $21, $7 and $1, respectively. |
(6) | Represents the minimum payments under capital leases, excluding common area maintenance, insurance or tax payments, for which the Company is also obligated, offset by minimum subtenant rentals of $15, $3, $5, $2 and $5, respectively. |
(7) | The Company’s purchase obligations include various obligations that have annual purchase commitments of $1 or greater. As of February 27, 2016, future purchase obligations existed that primarily related to fixed asset and information technology commitments. In addition, in the ordinary course of business, the Company enters into supply contracts to purchase product for resale to consumers and to Wholesale customers, which are typically of a short-term nature with limited or no purchase commitments. The majority of the Company's supply contracts are short-term in nature and relate to fixed assets, information technology and contracts to purchase product for resale. These supply contracts typically include either volume commitments or fixed expiration dates, termination provisions and other standard contractual considerations. The supply contracts that are cancelable have not been included above. |
(8) | The Company’s insurance reserves include the undiscounted obligations related to workers’ compensation, general and automobile liabilities at the estimated ultimate cost of reported claims and claims incurred but not yet reported and related expenses. |
ITEM 7A. QUANTITATIVE AND QUALITATIVE DISCLOSURES ABOUT MARKET RISK
The Company does not use financial instruments or derivatives for any trading or other speculative purposes.
Interest Rate Risk
The Company is exposed to market pricing risk consisting of interest rate risk related to debt obligations and notes receivable outstanding. Interest rate risk is managed through the strategic use of fixed and variable rate debt and, to a limited extent, derivative financial instruments. Variable interest rate debt (bank loans and revolving lines of credit) is utilized to help maintain liquidity and finance business operations. Variable rate borrowings consist primarily of LIBOR and prime rate based loans, some of which contain interest rate floors. Long-term debt with fixed interest rates is used to assist in managing debt maturities and to diversify sources of debt capital. Changes in interest rates related to debt with fixed interest rates do not have an impact upon future results of operations and cash flow while outstanding; however, if additional debt issuances are required to fund fixed rate debt maturities, future results of operations or cash flows may be impacted.
54
Long-term loans are extended to certain independent retail customers in the normal course of business through notes receivable. The notes generally bear fixed interest rates negotiated with each independent retail customer. The market value of the fixed rate notes is subject to change due to fluctuations in market interest rates.
On February 24, 2015, the Company entered into a forward starting interest rate swap agreement effectively converting $300 of variable rate debt under the Company's Secured Term Loan Facility to a fixed rate of 5.5075 percent, effective beginning in February 2016 through the Secured Term Loan Facility's maturity in March 2019. This transaction was entered into to reduce the Company's exposure to changes in market interest rates associated with its variable rate debt. Changes in market interest rates affecting the fair value of the financial instrument and unfavorable changes in interest expense, and counterparty credit risk are some of the risks associated with utilizing interest rate swaps. As of February 27, 2016, a 100 basis point increase in forward LIBOR interest rates would increase the fair value of the interest rate swap by approximately $6; a 100 basis point decrease would decrease the fair value by approximately $3.
The table below provides information about the Company’s financial instruments that are sensitive to changes in interest rates, including debt obligations, notes receivable and interest rate swaps. For debt obligations, the table presents principal payments and related weighted average interest rates by year of maturity using interest rates as of February 27, 2016, applicable to variable interest debt instruments and stated fixed rates for all other debt instruments, excluding any original issue discounts and deferred financing costs. For notes receivable, the table presents the expected collection of principal cash flows and weighted average interest rates by expected year of maturity. For the interest rate swap agreement, the table presents the differential between interest payable and interest receivable under the swap agreement utilized to compute the fair value of the interest rate swaps.
Interest Rate Positions as of February 27, 2016 | |||||||||||||||||||||||||||||||
February 27, 2016 | Aggregate Payments by Fiscal Year | ||||||||||||||||||||||||||||||
Fair Value | Total | 2017 | 2018 | 2019 | 2020 | 2021 | Thereafter | ||||||||||||||||||||||||
(in millions, except rates) | |||||||||||||||||||||||||||||||
Debt with variable interest rates | |||||||||||||||||||||||||||||||
Principal payments | $ | 1,233 | $ | 1,297 | $ | 102 | $ | — | $ | — | $ | 1,057 | $ | 138 | $ | — | |||||||||||||||
Variable interest rate | 4.4 | % | 4.5 | % | — | % | — | % | 4.5 | % | 4.0 | % | — | % | |||||||||||||||||
Debt with fixed interest rates | |||||||||||||||||||||||||||||||
Principal payments on senior notes | $ | 588 | $ | 750 | $ | — | $ | — | $ | — | $ | — | $ | — | $ | 750 | |||||||||||||||
Average fixed rate | 7.2 | % | — | % | — | % | — | % | — | % | — | % | 7.2 | % | |||||||||||||||||
Principal payments on floating rate debt converted to fixed rate debt(1) | $ | 284 | $ | 300 | $ | — | $ | — | $ | — | $ | 300 | $ | — | $ | — | |||||||||||||||
Fixed interest rate | 5.5 | % | — | % | — | % | — | % | 5.5 | % | — | % | — | % | |||||||||||||||||
Notes receivable | |||||||||||||||||||||||||||||||
Principal receivable | $ | 23 | $ | 22 | $ | 6 | $ | 4 | $ | 4 | $ | 3 | $ | 2 | $ | 3 | |||||||||||||||
Average rate receivable | 7.3 | % | 7.2 | % | 8.8 | % | 8.1 | % | 7.1 | % | 6.3 | % | 5.1 | % | |||||||||||||||||
Interest rate swap related to debt with variable interest rates:(1) | |||||||||||||||||||||||||||||||
Forward starting fixed rate paid | 2.0 | % | — | % | — | % | — | % | 2.0 | % | — | % | — | % | |||||||||||||||||
Forward starting variable rate received | Rate A(2) | — | % | — | % | — | % | Rate A(2) | — | % | — | % | |||||||||||||||||||
(1) | Pay fixed-receive variable interest rate swap relates to the $300 of debt with variable interest payments under the Secured Term Loan Facility. Fixed rate payments began in February 2016 and conclude in March 2019. The fair value of this instrument represents a liability of $6 as of February 27, 2016. |
(2) | Rate A - One-month LIBOR, subject to a 1.00 percent floor. |
55
Investment Risk
The SUPERVALU Retirement Plan, which is a Company-sponsored qualified pension plan, holds investments in public and private equity, fixed income and real estate securities, which is described further in Note 11—Benefit Plans in Part II, Item 8 of this Annual Report on Form 10-K. Changes in SUPERVALU Retirement Plan assets can affect the amount of the Company's anticipated future contributions. In addition, increases or decreases in SUPERVALU Retirement Plan assets and can result in a related increase or decrease to the Company's equity through Accumulated other comprehensive loss. As of February 27, 2016, a 10 percent unfavorable change in the value of investments held by the SUPERVALU Retirement Plan would not have an impact on the Company's minimum contributions required under ERISA for fiscal 2016, but would result in an unfavorable change in net periodic pension expense for fiscal 2016 by $16 and would reduce stockholder's equity by $212 on a pre-tax basis as of February 27, 2016.
Fuel Price Risk
The Company is exposed to potential volatility in fuel prices due to the Company's use of diesel fuel in distribution. The Company's supply arrangements in the majority of the circumstances provides for sharing fluctuations in fuel market prices with its independent retail customers and Save-A-Lot licensees. The Company’s limited involvement with diesel fuel derivatives is primarily to manage its exposure to changes in energy prices utilized in the shipping process and are only utilized to manage well-defined risks. The fair value of the Company’s fuel derivatives represents a liability of $2 as of February 27, 2016.
56
ITEM 8. FINANCIAL STATEMENTS AND SUPPLEMENTARY DATA
Index of Financial Statements and Schedules
Page | |
Consolidated Financial Statements: | |
Financial Statement Schedule: | |
All other schedules are omitted because they are not applicable or not required. | |
57
REPORT OF INDEPENDENT REGISTERED PUBLIC ACCOUNTING FIRM
The Board of Directors and Stockholders
SUPERVALU INC.:
We have audited the accompanying consolidated balance sheets of SUPERVALU INC. and subsidiaries as of February 27, 2016 and February 28, 2015, and the related consolidated statements of operations, comprehensive income, stockholders’ deficit, and cash flows for each of the fiscal years in the three-year period ended February 27, 2016. In connection with our audits of the consolidated financial statements, we have audited the accompanying financial statement schedule. We also have audited SUPERVALU INC.’s internal control over financial reporting as of February 27, 2016, based on criteria established in Internal Control—Integrated Framework (2013) issued by the Committee of Sponsoring Organizations of the Treadway Commission (COSO). SUPERVALU INC.’s management is responsible for these consolidated financial statements and the financial statement schedule, for maintaining effective internal control over financial reporting, and for its assessment of the effectiveness of internal control over financial reporting, included in the accompanying Management’s Annual Report on Internal Control over Financial Reporting. Our responsibility is to express an opinion on these consolidated financial statements and the financial statement schedule, and an opinion on the Company’s internal control over financial reporting based on our audits.
We conducted our audits in accordance with the standards of the Public Company Accounting Oversight Board (United States). Those standards require that we plan and perform the audits to obtain reasonable assurance about whether the financial statements are free of material misstatement and whether effective internal control over financial reporting was maintained in all material respects. Our audits of the consolidated financial statements included examining, on a test basis, evidence supporting the amounts and disclosures in the financial statements, assessing the accounting principles used and significant estimates made by management, and evaluating the overall financial statement presentation. Our audit of internal control over financial reporting included obtaining an understanding of internal control over financial reporting, assessing the risk that a material weakness exists, and testing and evaluating the design and operating effectiveness of internal control based on the assessed risk. Our audits also included performing such other procedures as we considered necessary in the circumstances. We believe that our audits provide a reasonable basis for our opinions.
A company’s internal control over financial reporting is a process designed to provide reasonable assurance regarding the reliability of financial reporting and the preparation of financial statements for external purposes in accordance with generally accepted accounting principles. A company’s internal control over financial reporting includes those policies and procedures that (1) pertain to the maintenance of records that, in reasonable detail, accurately and fairly reflect the transactions and dispositions of the assets of the company; (2) provide reasonable assurance that transactions are recorded as necessary to permit preparation of financial statements in accordance with generally accepted accounting principles, and that receipts and expenditures of the company are being made only in accordance with authorizations of management and directors of the company; and (3) provide reasonable assurance regarding prevention or timely detection of unauthorized acquisition, use, or disposition of the company’s assets that could have a material effect on the financial statements.
Because of its inherent limitations, internal control over financial reporting may not prevent or detect misstatements. Also, projections of any evaluation of effectiveness to future periods are subject to the risk that controls may become inadequate because of changes in conditions, or that the degree of compliance with the policies or procedures may deteriorate.
In our opinion, the consolidated financial statements referred to above present fairly, in all material respects, the financial position of SUPERVALU INC. and subsidiaries as of February 27, 2016 and February 28, 2015, and the results of their operations and their cash flows for each of the fiscal years in the three-year period ended February 27, 2016, in conformity with U.S. generally accepted accounting principles. In our opinion, the accompanying financial statement schedule, when considered in relation to the basic consolidated financial statements taken as a whole, presents fairly, in all material respects, the information set forth therein. Also in our opinion, SUPERVALU INC. maintained, in all material respects, effective internal control over financial reporting as of February 27, 2016, based on criteria established in Internal Control—Integrated Framework (2013) issued by the Committee of Sponsoring Organizations of the Treadway Commission.
/s/ KPMG LLP
Minneapolis, Minnesota
April 26, 2016
58
SUPERVALU INC. and Subsidiaries
CONSOLIDATED SEGMENT FINANCIAL INFORMATION
(In millions)
Fiscal Years Ended | |||||||||||
February 27, 2016 (52 weeks) | February 28, 2015 (53 weeks) | February 22, 2014 (52 weeks) | |||||||||
Net sales | |||||||||||
Wholesale | $ | 7,935 | $ | 8,198 | $ | 8,102 | |||||
% of total | 45.3 | % | 45.8 | % | 47.0 | % | |||||
Save-A-Lot | 4,623 | 4,641 | 4,255 | ||||||||
% of total | 26.4 | % | 25.8 | % | 24.6 | % | |||||
Retail | 4,769 | 4,884 | 4,655 | ||||||||
% of total | 27.2 | % | 27.3 | % | 27.0 | % | |||||
Corporate | 202 | 194 | 240 | ||||||||
% of total | 1.1 | % | 1.1 | % | 1.4 | % | |||||
Total net sales | $ | 17,529 | $ | 17,917 | $ | 17,252 | |||||
100.0 | % | 100.0 | % | 100.0 | % | ||||||
Operating earnings | |||||||||||
Wholesale | $ | 230 | $ | 243 | $ | 235 | |||||
% of Wholesale sales | 2.9 | % | 3.0 | % | 2.9 | % | |||||
Save-A-Lot | 129 | 153 | 167 | ||||||||
% of Save-A-Lot sales | 2.8 | % | 3.3 | % | 3.9 | % | |||||
Retail | 94 | 122 | 77 | ||||||||
% of Retail sales | 2.0 | % | 2.5 | % | 1.7 | % | |||||
Corporate | 1 | (94 | ) | (56 | ) | ||||||
Total operating earnings | 454 | 424 | 423 | ||||||||
% of total net sales | 2.6 | % | 2.4 | % | 2.5 | % | |||||
Interest expense, net | 196 | 243 | 407 | ||||||||
Equity in earnings of unconsolidated affiliates | (5 | ) | (4 | ) | (2 | ) | |||||
Earnings from continuing operations before income taxes | 263 | 185 | 18 | ||||||||
Income tax provision | 85 | 58 | 5 | ||||||||
Net earnings from continuing operations | 178 | 127 | 13 | ||||||||
Income from discontinued operations, net of tax | 8 | 72 | 176 | ||||||||
Net earnings including noncontrolling interests | 186 | 199 | 189 | ||||||||
Less net earnings attributable to noncontrolling interests | (8 | ) | (7 | ) | (7 | ) | |||||
Net earnings attributable to SUPERVALU INC. | $ | 178 | $ | 192 | $ | 182 | |||||
Depreciation and amortization | |||||||||||
Wholesale | $ | 49 | $ | 48 | $ | 51 | |||||
Save-A-Lot | 71 | 65 | 64 | ||||||||
Retail | 153 | 172 | 187 | ||||||||
Corporate | 3 | — | — | ||||||||
Total | $ | 276 | $ | 285 | $ | 302 | |||||
Capital expenditures | |||||||||||
Wholesale | $ | 69 | $ | 70 | $ | 24 | |||||
Save-A-Lot | 122 | 97 | 42 | ||||||||
Retail | 90 | 73 | 47 | ||||||||
Total | $ | 281 | $ | 240 | $ | 113 | |||||
Identifiable assets | |||||||||||
Wholesale | $ | 1,998 | $ | 1,997 | $ | 1,964 | |||||
Save-A-Lot | 1,045 | 1,028 | 925 | ||||||||
Retail | 1,327 | 1,381 | 1,367 | ||||||||
Corporate | — | 28 | 27 | ||||||||
Total | $ | 4,370 | $ | 4,434 | $ | 4,283 | |||||
Refer to Note 15—Segment Information in the accompanying Notes to Consolidated Financial Statements for additional information concerning the Company’s reportable segments.
See Notes to Consolidated Financial Statements.
59
SUPERVALU INC. and Subsidiaries
CONSOLIDATED STATEMENTS OF OPERATIONS
(In millions, except per share data)
Fiscal Years Ended | |||||||||||
February 27, 2016 (52 weeks) | February 28, 2015 (53 weeks) | February 22, 2014 (52 weeks) | |||||||||
Net sales | $ | 17,529 | $ | 17,917 | $ | 17,252 | |||||
Cost of sales | 14,945 | 15,329 | 14,712 | ||||||||
Gross profit | 2,584 | 2,588 | 2,540 | ||||||||
Selling and administrative expenses | 2,124 | 2,164 | 2,117 | ||||||||
Intangible asset impairment charge | 6 | — | — | ||||||||
Operating earnings | 454 | 424 | 423 | ||||||||
Interest expense, net | 196 | 243 | 407 | ||||||||
Equity in earnings of unconsolidated affiliates | (5 | ) | (4 | ) | (2 | ) | |||||
Earnings from continuing operations before income taxes | 263 | 185 | 18 | ||||||||
Income tax provision | 85 | 58 | 5 | ||||||||
Net earnings from continuing operations | 178 | 127 | 13 | ||||||||
Income from discontinued operations, net of tax | 8 | 72 | 176 | ||||||||
Net earnings including noncontrolling interests | 186 | 199 | 189 | ||||||||
Less net earnings attributable to noncontrolling interests | (8 | ) | (7 | ) | (7 | ) | |||||
Net earnings attributable to SUPERVALU INC. | $ | 178 | $ | 192 | $ | 182 | |||||
Basic net earnings per share attributable to SUPERVALU INC.: | |||||||||||
Continuing operations | $ | 0.64 | $ | 0.46 | $ | 0.02 | |||||
Discontinued operations | $ | 0.03 | $ | 0.28 | $ | 0.69 | |||||
Basic net earnings per share | $ | 0.68 | $ | 0.74 | $ | 0.71 | |||||
Diluted net earnings per share attributable to SUPERVALU INC.: | |||||||||||
Continuing operations | $ | 0.63 | $ | 0.45 | $ | 0.02 | |||||
Discontinued operations | $ | 0.03 | $ | 0.27 | $ | 0.68 | |||||
Diluted net earnings per share | $ | 0.66 | $ | 0.73 | $ | 0.70 | |||||
Weighted average number of shares outstanding: | |||||||||||
Basic | 263 | 260 | 255 | ||||||||
Diluted | 268 | 264 | 258 | ||||||||
See Notes to Consolidated Financial Statements.
60
SUPERVALU INC. and Subsidiaries
CONSOLIDATED STATEMENTS OF COMPREHENSIVE INCOME
(In millions)
Fiscal Years Ended | |||||||||||
February 27, 2016 (52 weeks) | February 28, 2015 (53 weeks) | February 22, 2014 (52 weeks) | |||||||||
Net earnings including noncontrolling interests | $ | 186 | $ | 199 | $ | 189 | |||||
Other comprehensive income (loss): | |||||||||||
Recognition of pension and other postretirement benefits income (loss), net of tax(1) | 5 | (116 | ) | 257 | |||||||
Change in fair value of cash flow hedges(2) | (4 | ) | — | — | |||||||
Total other comprehensive income (loss) | 1 | (116 | ) | 257 | |||||||
Comprehensive income including noncontrolling interests | 187 | 83 | 446 | ||||||||
Less comprehensive income attributable to noncontrolling interests | (8 | ) | (7 | ) | (7 | ) | |||||
Comprehensive income attributable to SUPERVALU INC. | $ | 179 | $ | 76 | $ | 439 | |||||
(1) Amounts are net of tax expense (benefit) of $14, $27, and $(123) for fiscal 2016, fiscal 2015 and fiscal 2014, respectively.
(2) Amounts are net of tax (benefit) expense of $(2), $0, and $0 for fiscal 2016, fiscal 2015 and fiscal 2014, respectively.
See Notes to Consolidated Financial Statements
61
SUPERVALU INC. and Subsidiaries
CONSOLIDATED BALANCE SHEETS
(In millions, except par value data)
February 27, 2016 | February 28, 2015 | ||||||
ASSETS | |||||||
Current assets | |||||||
Cash and cash equivalents | $ | 57 | $ | 114 | |||
Receivables, net | 451 | 482 | |||||
Inventories, net | 1,036 | 984 | |||||
Other current assets | 91 | 120 | |||||
Total current assets | 1,635 | 1,700 | |||||
Property, plant and equipment, net | 1,481 | 1,470 | |||||
Goodwill | 867 | 865 | |||||
Intangible assets, net | 55 | 48 | |||||
Deferred tax assets | 228 | 250 | |||||
Other assets | 104 | 101 | |||||
Total assets | $ | 4,370 | $ | 4,434 | |||
LIABILITIES AND STOCKHOLDERS’ DEFICIT | |||||||
Current liabilities | |||||||
Accounts payable | $ | 1,118 | $ | 1,121 | |||
Accrued vacation, compensation and benefits | 182 | 204 | |||||
Current maturities of long-term debt and capital lease obligations | 124 | 35 | |||||
Other current liabilities | 148 | 157 | |||||
Total current liabilities | 1,572 | 1,517 | |||||
Long-term debt | 2,197 | 2,445 | |||||
Long-term capital lease obligations | 203 | 213 | |||||
Pension and other postretirement benefit obligations | 578 | 602 | |||||
Long-term tax liabilities | 81 | 119 | |||||
Other long-term liabilities | 172 | 174 | |||||
Commitments and contingencies | |||||||
Stockholders’ deficit | |||||||
Common stock, $0.01 par value: 400 shares authorized; 266 and 262 shares issued, respectively | 3 | 3 | |||||
Capital in excess of par value | 2,808 | 2,810 | |||||
Treasury stock, at cost, 1 and 2 shares, respectively | (5 | ) | (33 | ) | |||
Accumulated other comprehensive loss | (422 | ) | (423 | ) | |||
Accumulated deficit | (2,825 | ) | (3,003 | ) | |||
Total SUPERVALU INC. stockholders’ deficit | (441 | ) | (646 | ) | |||
Noncontrolling interests | 8 | 10 | |||||
Total stockholders’ deficit | (433 | ) | (636 | ) | |||
Total liabilities and stockholders’ deficit | $ | 4,370 | $ | 4,434 | |||
See Notes to Consolidated Financial Statements.
62
SUPERVALU INC. and Subsidiaries
CONSOLIDATED STATEMENTS OF STOCKHOLDERS’ DEFICIT
(In millions, except per share data)
Common Stock | Capital in Excess of Par Value | Treasury Stock | Accumulated Other Comprehensive Loss | Accumulated Deficit | SUPERVALU INC. Stockholders’ Deficit | Noncontrolling interests | Total Stockholders' Deficit | ||||||||||||||||||||||||
Balances as of February 23, 2013 | $ | 2 | $ | 3,046 | $ | (474 | ) | $ | (612 | ) | $ | (3,377 | ) | $ | (1,415 | ) | $ | 10 | $ | (1,405 | ) | ||||||||||
Net earnings | — | — | — | — | 182 | 182 | 7 | 189 | |||||||||||||||||||||||
Other comprehensive income, net of tax of $123 | — | — | — | 257 | — | 257 | — | 257 | |||||||||||||||||||||||
Divestiture of New Albertsons, Inc.’s pension accumulated comprehensive loss, net of tax of $31 | — | — | — | 48 | — | 48 | — | 48 | |||||||||||||||||||||||
Common stock issued and sold in connection with New Albertsons, Inc. divesture | 1 | 12 | 157 | — | — | 170 | — | 170 | |||||||||||||||||||||||
Sales of common stock under option plans | — | (134 | ) | 141 | — | — | 7 | — | 7 | ||||||||||||||||||||||
Stock-based compensation | — | (54 | ) | 79 | — | — | 25 | — | 25 | ||||||||||||||||||||||
Distributions to noncontrolling interests | — | — | — | — | — | — | (9 | ) | (9 | ) | |||||||||||||||||||||
Tax impact on stock-based awards and other | — | (8 | ) | (4 | ) | — | — | (12 | ) | — | (12 | ) | |||||||||||||||||||
Balances as of February 22, 2014 | 3 | 2,862 | (101 | ) | (307 | ) | (3,195 | ) | (738 | ) | 8 | (730 | ) | ||||||||||||||||||
Net earnings | — | — | — | — | 192 | 192 | 7 | 199 | |||||||||||||||||||||||
Other comprehensive loss, net of tax of $27 | — | — | — | (116 | ) | — | (116 | ) | — | (116 | ) | ||||||||||||||||||||
Sales of common stock under option plans | — | (62 | ) | 69 | — | — | 7 | — | 7 | ||||||||||||||||||||||
Stock-based compensation | — | 22 | — | — | — | 22 | — | 22 | |||||||||||||||||||||||
Distributions to noncontrolling interests | — | — | — | — | — | — | (8 | ) | (8 | ) | |||||||||||||||||||||
Contributions from noncontrolling interests | — | — | — | — | — | — | 3 | 3 | |||||||||||||||||||||||
Tax impact on stock-based awards and other | — | (12 | ) | (1 | ) | — | — | (13 | ) | — | (13 | ) | |||||||||||||||||||
Balances as of February 28, 2015 | 3 | 2,810 | (33 | ) | (423 | ) | (3,003 | ) | (646 | ) | 10 | (636 | ) | ||||||||||||||||||
Net earnings | — | — | — | — | 178 | 178 | 8 | 186 | |||||||||||||||||||||||
Other comprehensive loss, net of tax of $12 | — | — | — | 1 | — | 1 | — | 1 | |||||||||||||||||||||||
Sales of common stock under option plans | — | (12 | ) | 22 | — | — | 10 | — | 10 | ||||||||||||||||||||||
Stock-based compensation | — | 25 | — | — | — | 25 | — | 25 | |||||||||||||||||||||||
Distributions to noncontrolling interests | — | — | — | — | — | — | (10 | ) | (10 | ) | |||||||||||||||||||||
Tax impact on stock-based awards and other | — | (15 | ) | 6 | — | — | (9 | ) | — | (9 | ) | ||||||||||||||||||||
Balances as of February 27, 2016 | $ | 3 | $ | 2,808 | $ | (5 | ) | $ | (422 | ) | $ | (2,825 | ) | $ | (441 | ) | $ | 8 | $ | (433 | ) | ||||||||||
See Notes to Consolidated Financial Statements.
63
SUPERVALU INC. and Subsidiaries
CONSOLIDATED STATEMENTS OF CASH FLOWS
(In millions)
Fiscal Years Ended | |||||||||||
February 27, 2016 (52 weeks) | February 28, 2015 (53 weeks) | February 22, 2014 (52 weeks) | |||||||||
Cash flows from operating activities | |||||||||||
Net earnings including noncontrolling interests | $ | 186 | $ | 199 | $ | 189 | |||||
Income from discontinued operations, net of tax | 8 | 72 | 176 | ||||||||
Net earnings from continuing operations | 178 | 127 | 13 | ||||||||
Adjustments to reconcile Net earnings from continuing operations to Net cash provided by operating activities—continuing operations: | |||||||||||
Intangible asset impairment charge | 6 | — | — | ||||||||
Asset impairment and other charges | 15 | 4 | 19 | ||||||||
Loss on debt extinguishment | 10 | 41 | 175 | ||||||||
Net gain on sale of assets and exits of surplus leases | (3 | ) | (14 | ) | (17 | ) | |||||
Depreciation and amortization | 276 | 285 | 302 | ||||||||
LIFO charge (credit) | 3 | 8 | (9 | ) | |||||||
Deferred income taxes | (1 | ) | 4 | (39 | ) | ||||||
Stock-based compensation | 26 | 23 | 22 | ||||||||
Net pension and other postretirement benefits cost | 34 | 96 | 79 | ||||||||
Contributions to pension and other postretirement benefit plans | (40 | ) | (169 | ) | (124 | ) | |||||
Other adjustments | 26 | 30 | 34 | ||||||||
Changes in operating assets and liabilities, net of effects from business combinations: | |||||||||||
Receivables | 22 | 9 | (54 | ) | |||||||
Inventories | (52 | ) | (124 | ) | 2 | ||||||
Accounts payable and accrued liabilities | (30 | ) | 75 | (127 | ) | ||||||
Income taxes | (8 | ) | (15 | ) | (79 | ) | |||||
Other changes in operating assets and liabilities | (41 | ) | (47 | ) | (68 | ) | |||||
Net cash provided by operating activities—continuing operations | 421 | 333 | 129 | ||||||||
Net cash provided by (used in) operating activities—discontinued operations | 3 | 75 | (101 | ) | |||||||
Net cash provided by operating activities | 424 | 408 | 28 | ||||||||
Cash flows from investing activities | |||||||||||
Proceeds from sale of assets | 7 | 7 | 14 | ||||||||
Purchases of property, plant and equipment | (261 | ) | (239 | ) | (111 | ) | |||||
Payments for business acquisition | (9 | ) | (55 | ) | — | ||||||
Other | (25 | ) | 2 | 11 | |||||||
Net cash used in investing activities—continuing operations | (288 | ) | (285 | ) | (86 | ) | |||||
Net cash provided by (used in) investing activities—discontinued operations | — | — | 135 | ||||||||
Net cash (used in) provided by investing activities | (288 | ) | (285 | ) | 49 | ||||||
Cash flows from financing activities | |||||||||||
Proceeds from issuance of debt | 138 | 350 | 2,098 | ||||||||
Proceeds from the sale of common stock | 10 | 7 | 177 | ||||||||
Payments of debt and capital lease obligations | (321 | ) | (400 | ) | (2,221 | ) | |||||
Payments for debt financing costs | (9 | ) | (42 | ) | (151 | ) | |||||
Distributions to noncontrolling interests | (10 | ) | (8 | ) | (9 | ) | |||||
Other | (1 | ) | 1 | (1 | ) | ||||||
Net cash used in financing activities—continuing operations | (193 | ) | (92 | ) | (107 | ) | |||||
Net cash used in financing activities—discontinued operations | — | — | (36 | ) | |||||||
Net cash used in financing activities | (193 | ) | (92 | ) | (143 | ) | |||||
Net (decrease) increase in cash and cash equivalents | (57 | ) | 31 | (66 | ) | ||||||
Cash and cash equivalents at beginning of year | 114 | 83 | 149 | ||||||||
Cash and cash equivalents of continuing operations at end of year | $ | 57 | $ | 114 | $ | 83 | |||||
SUPPLEMENTAL CASH FLOW INFORMATION | |||||||||||
The Company’s non-cash activities were as follows: | |||||||||||
Purchases of property, plant and equipment included in Accounts payable | $ | 28 | $ | 21 | $ | 19 | |||||
Capital lease asset additions | $ | 20 | $ | 1 | $ | 2 | |||||
Interest and income taxes paid: | |||||||||||
Interest paid, net of amounts capitalized | $ | 176 | $ | 180 | $ | 227 | |||||
Income taxes paid (refunded), net | $ | 91 | $ | (7 | ) | $ | 118 | ||||
See Notes to Consolidated Financial Statements.
64
SUPERVALU INC. and Subsidiaries
NOTES TO CONSOLIDATED FINANCIAL STATEMENTS
(Dollars and shares in millions, except per share data, unless otherwise noted)
NOTE 1—SUMMARY OF SIGNIFICANT ACCOUNTING POLICIES
Business Description and Principles of Consolidation
SUPERVALU INC. and its subsidiaries (“Supervalu” or the “Company”) operates primarily in the United States grocery channel. Supervalu provides supply chain services, primarily wholesale distribution, operates hard discount retail stores and licenses stores to independent operators under the Save-A-Lot banner, and operates five competitive, regionally-based traditional format grocery banners under the Cub Foods, Shoppers Food & Pharmacy, Shop 'n Save, Farm Fresh and Hornbacher’s banners. The Consolidated Financial Statements include the accounts of the Company and all its wholly and majority-owned subsidiaries. All significant intercompany accounts and transactions have been eliminated in consolidation.
During fiscal 2013, the Company entered into a stock purchase agreement (the “Stock Purchase Agreement”) to sell the Company’s New Albertson’s, Inc. subsidiary (“New Albertsons” or “NAI”), including the Acme, Albertsons, Jewel-Osco, Shaw’s and Star Market retail banners and the associated Osco and Sav-on in-store pharmacies (the “NAI Banner Sale”) to AB Acquisition LLC (“AB Acquisition”). The NAI Banner Sale was completed effective March 21, 2013, during the Company’s first quarter of fiscal 2014. The NAI operations disposed of under the NAI Banner Sale are reported as discontinued operations in the Consolidated Statements of Operations for all periods presented. Unless otherwise indicated, references to the Consolidated Statements of Operations and the Consolidated Balance Sheets in the Notes to the Consolidated Financial Statements exclude all amounts related to discontinued operations. See Note 16—Discontinued Operations for additional information regarding these discontinued operations.
Fiscal Year
Supervalu operates on a 52/53 week fiscal year basis, with its fiscal year ending on the last Saturday in February. References to fiscal 2016 and 2014 relate to Supervalu's fiscal years ended February 27, 2016 and February 22, 2014, respectively, each consisting of 52 weeks. References to fiscal 2015 relate to Supervalu's fiscal year ended February 28, 2015 consisting of 53 weeks.
Use of Estimates
The preparation of the Company’s Consolidated Financial Statements in conformity with accounting principles generally accepted in the United States requires management to make estimates and assumptions that affect the reported amounts of assets and liabilities and disclosure of contingent assets and liabilities at the date of the financial statements, and the reported amounts of revenues and expenses for the reporting periods presented. Actual results could differ from those estimates.
Revenue Recognition
Revenues from product sales are recognized upon delivery for the Wholesale segment, at the point of sale for the Retail Segment and Save-A-Lot’s corporate retail operations, and upon delivery for Save-A-Lot’s licensee distribution operations. Typically, invoicing, shipping, delivery and customer receipt of Wholesale product occur on the same business day. Revenues from services rendered are recognized immediately after such services have been provided. Discounts and allowances provided to customers by the Company at the time of sale, including those provided in connection with loyalty cards, are recognized as a reduction in Net sales as the products are sold to customers. Sales tax is excluded from Net sales.
Revenues and costs from professional services and third-party logistics operations are recorded gross when the Company is the primary obligor in a transaction, is subject to inventory or credit risk, has latitude in establishing price and selecting suppliers, or has several, but not all, of these indicators. If the Company is not the primary obligor and amounts earned have little or no inventory or credit risk, revenue is recorded net as management fees when earned.
Incentives in the form of upfront cash payments to Save-A-Lot licensees are provided by the Company to help offset independent operator costs associated with opening and initially operating a store. Licensee incentives are recognized as a reduction of Net sales over the term of the incentive agreements, which coincides with the term of the license and supply agreements. Licensee incentive assets are included in Other current assets and Other long-term assets in the Consolidated Balance Sheets.
65
Cost of Sales
Cost of sales in the Consolidated Statements of Operations includes cost of inventory sold during the period, including purchasing, receiving, warehousing and distribution costs, and shipping and handling fees.
Save-A-Lot and Retail store advertising expenses are a component of Cost of sales and are expensed as incurred. Save-A-Lot and Retail advertising expenses, net of cooperative advertising reimbursements, were $64, $62 and $77 for fiscal 2016, 2015 and 2014, respectively. Costs related to Wholesale and Save-A-Lot advertising services provided to independent retail customers and licensees, respectively, are included within cost of sales.
The Company receives allowances and credits from vendors for volume incentives, promotional allowances and, to a lesser extent, new product introductions, which are typically based on contractual arrangements covering a period of one year or less. The Company recognizes vendor funds for merchandising and buying activities as a reduction of Cost of sales when the related products are sold. Vendor funds that have been earned as a result of completing the required performance under the terms of the underlying agreements but for which the product has not yet been sold are recognized as reductions of inventory. When payments or rebates can be reasonably estimated and it is probable that the specified target will be met, the payment or rebate is accrued. However, when attaining the milestone is not probable, the payment or rebate is recognized only when and if the milestone is achieved. Any upfront payments received for multi-period contracts are generally deferred and amortized on a straight-line basis over the life of the contracts.
Selling and Administrative Expenses
Selling and administrative expenses consist primarily of store and corporate employee-related costs, such as salaries and wages, incentive compensation, health and welfare and workers' compensation, as well as net periodic pension expense, occupancy costs, including rent, utilities and operating costs of retail stores, depreciation and amortization, impairment charges on property, plant and equipment and other administrative costs.
Cash and Cash Equivalents
The Company considers all highly liquid investments with a maturity of three months or less at the time of purchase to be cash equivalents. Cash and cash equivalents include amounts due from credit card sales transactions that are settled early in the following period. The Company’s banking arrangements allow the Company to fund outstanding checks when presented to the financial institution for payment. The Company funds all intraday bank balance overdrafts during the same business day. Checks outstanding in excess of bank balances create book overdrafts, which are recorded in Accounts payable in the Consolidated Balance Sheets and are reflected as an operating activity in the Consolidated Statements of Cash Flows. As of February 27, 2016 and February 28, 2015, the Company had net book overdrafts of $131 and $145, respectively.
Allowances for Losses on Receivables
Management makes estimates of the uncollectibility of its accounts and notes receivable portfolios. In determining the adequacy of the allowances, management analyzes the value of the collateral, customer financial statements, historical collection experience, aging of receivables and other economic and industry factors. It is possible that the accuracy of the estimation process could be materially impacted by different judgments, estimations and assumptions based on the information considered and result in a further deterioration of accounts and notes receivable. The allowance for losses on receivables was $13 and $18 at February 27, 2016 and February 28, 2015, respectively. Bad debt expense was $6, $6 and $16 in fiscal 2016, 2015 and 2014, respectively.
Inventories, Net
Inventories are valued at the lower of cost or market. Substantially all of the Company’s inventory consists of finished goods.
The Company uses the weighted average cost method, the retail inventory method (“RIM”) or replacement cost method to value discrete inventory items at lower of cost or market under the first-in, first-out (“FIFO”) method before application of any last-in, first-out (“LIFO”) reserve. As of February 27, 2016 and February 28, 2015, approximately 57 percent and 55 percent, respectively, of the Company’s inventories were valued under the LIFO method.
As of February 27, 2016 and February 28, 2015, approximately 5 percent of the Company’s inventories were valued under the replacement cost method before application of any LIFO reserve. The weighted average cost and RIM methods of inventory valuation together comprised approximately 52 percent and 50 percent of inventory as of February 27, 2016 and February 28, 2015, respectively, before application of any LIFO reserve.
66
Under the replacement cost method applied on a LIFO basis, the most recent purchase cost is used to calculate the current cost of inventory before application of any LIFO reserve. The replacement cost approach results in inventories being valued at the lower of cost or market because of the high inventory turnover and the resulting low inventory days supply on hand combined with infrequent vendor price changes for these items of inventory.
The replacement cost approach under the FIFO method is predominantly utilized in determining the value of high turnover perishable items, including produce, deli, bakery, meat and floral.
As of February 27, 2016 and February 28, 2015, approximately 26 percent and 26 percent, respectively, of the Company’s inventories were valued using the cost, weighted average cost and RIM methods under the FIFO method of inventory accounting. The remaining 17 percent and 19 percent of the Company’s inventories as of February 27, 2016 and February 28, 2015, respectively, were valued using the replacement cost approach under the FIFO method of inventory accounting. The replacement cost approach applied under the FIFO method results in inventories recorded at the lower of cost or market because of the very high inventory turnover and the resulting low inventory days supply for these items of inventory.
During fiscal 2016 and 2014, inventory quantities in certain LIFO layers were reduced. These reductions resulted in a liquidation of LIFO inventory quantities carried at lower costs prevailing in prior years as compared with the cost of fiscal 2016 and 2014 purchases. As a result, Cost of sales decreased by $1 and $14 in fiscal 2016 and 2014, respectively. If the FIFO method had been used to determine cost of inventories for which the LIFO method is used, the Company’s inventories would have been higher by approximately $215 and $211 as of February 27, 2016 and February 28, 2015, respectively.
The Company evaluates inventory shortages throughout each fiscal year based on actual physical counts in its stores and distribution facilities. Allowances for inventory shortages are recorded based on the results of these counts to provide for estimated shortages as of the end of each fiscal year.
Property, Plant and Equipment, Net
Property, plant and equipment are carried at cost. Depreciation is based on the estimated useful lives of the assets using the straight-line method. Estimated useful lives generally are ten to 40 years for buildings and major improvements, three to ten years for equipment, and the shorter of the term of the lease or expected life for leasehold improvements and capitalized lease assets. Interest on property under construction of $1, $1 and $1 was capitalized in fiscal 2016, 2015 and 2014, respectfully.
Business Dispositions
The Company reviews the presentation of planned business dispositions in the Consolidated Financial Statements based on the available information and events that have occurred.
The review consists of evaluating whether the business meets the definition as a component for which the operations and cash flows are clearly distinguishable from the other components of the business, and if so, whether it is anticipated that after the disposal the cash flows of the component would be eliminated from continuing operations and whether the disposition represents a strategic transaction that has a major effect on operations and financial results. In addition, the Company evaluates whether the business has met the criteria as a business held for sale. In order for a planned disposition to be classified as a business held for sale, the established criteria must be met as of the reporting date, including an active program to market the business and the expected disposition of the business within one year.
Planned business dispositions are presented as discontinued operations when all the criteria described above are met. Operations of the business components meeting the discontinued operations requirements are presented within Income from discontinued operations, net of tax in the Consolidated Statements of Operations, and assets and liabilities of the business component planned to be disposed of are presented as separate lines within the Consolidated Balance Sheets. See Note 16—Discontinued Operations for additional information.
Businesses held for sale are reviewed for recoverability of the carrying value of the business upon meeting the classification requirements. Evaluating the recoverability of the assets of a business classified as held for sale follows a defined order in which property and intangible assets subject to amortization are considered only after the recoverability of goodwill, indefinite lived intangible assets and other assets are assessed. After the valuation process is completed, the held for sale business is reported at the lower of its carrying value or fair value less cost to sell, and no additional depreciation or amortization expense is recognized. The carrying value of a held for sale business includes the portion of the accumulated other comprehensive loss associated with pension and postretirement benefit obligations of the operations of the business.
There are inherent judgments and estimates used in determining impairment charges. The sale of a business can result in the recognition of a gain or loss that differs from that anticipated prior to closing.
67
Goodwill
The Company reviews goodwill for impairment during the fourth quarter of each year, and also if events occur or circumstances change that would more-likely-than-not reduce the fair value of a reporting unit below its carrying value. The reviews consist of comparing estimated fair value to the carrying value at the reporting unit level. For Wholesale and Retail, the Company’s reporting units are the operating segments of the business, which consist of Wholesale and Retail. Goodwill was assigned to these reporting units as of the acquisition date, with no amounts being allocated between reporting units. For Save-A-Lot, the reporting units are the components of the business: Licensee Distribution and Corporate Stores. Goodwill has been allocated between the Save-A-Lot reporting units on a relative fair value basis. Fair values are determined by using both the market approach, applying a multiple of earnings and revenue based on guidelines for publicly traded companies, and the income approach, discounting projected future cash flows based on management’s expectations of the current and future operating environment. The rates used to discount projected future cash flows reflect a weighted average cost of capital based on the Company’s industry, capital structure and risk premiums in each reporting unit, including those reflected in the current market capitalization. If management identifies the potential for impairment of goodwill, the implied fair value of the goodwill is calculated as the difference between the fair value of the reporting unit and the fair value of the underlying assets and liabilities, excluding goodwill. An impairment charge is recorded for any excess of the carrying value over the implied fair value.
The Company reviews the composition of its reporting units on an annual basis and on an interim basis if events or circumstances indicate that the composition of the Company’s reporting units may have changed. During the fiscal 2016 review, the Company separated the Save-A-Lot reporting unit into the Licensee Distribution and Corporate Stores reporting units. There were no changes in the Company’s reporting units as a result of the fiscal 2015 review.
Intangible Assets, Net
The Company reviews intangible assets with indefinite useful lives, which primarily consist of trademarks and tradenames, for impairment during the fourth quarter of each year, and also if events or changes in circumstances indicate that the asset might be impaired. The reviews consist of comparing estimated fair value to the carrying value. Fair values of the Company’s trademarks and tradenames are determined primarily by discounting an assumed royalty value applied to management’s estimate of projected future revenues associated with the tradename using management’s expectations of the current and future operating environment. The royalty cash flows are discounted using rates based on the weighted average cost of capital discussed above and the specific risk profile of the tradenames relative to the Company’s other assets. These estimates are impacted by variable factors, including inflation, the general health of the economy and market competition. The impairment review calculation contains significant judgments and estimates, including the weighted average cost of capital, any specified risk profile of the tradename, and future revenue and profitability. See Note 3—Goodwill and Intangible Assets for additional information.
Impairment of Long-Lived Assets
The Company monitors the recoverability of its long-lived assets such as buildings and equipment, and evaluates their carrying value for impairment whenever events or changes in circumstances indicate that the carrying value of such assets may not be fully recoverable. Events that may trigger such an evaluation include current period losses combined with a history of losses or a projection of continuing losses, a significant decrease in the market value of an asset or the Company’s plans for store closures. When such events or changes in circumstances occur, a recoverability test is performed by comparing projected undiscounted future cash flows to the carrying value of the group of assets being tested.
If impairment is identified for long-lived assets to be held and used, the fair value is compared to the carrying value of the group of assets and an impairment charge is recorded for the excess of the carrying value over the fair value. For long-lived assets that are classified as assets held for sale, the Company recognizes impairment charges for the excess of the carrying value plus estimated costs of disposal over the estimated fair value. Fair value is based on current market values or discounted future cash flows using Level 3 inputs. The Company estimates fair value based on the Company’s experience and knowledge of the market in which the property is located and, when necessary, utilizes local real estate brokers. The Company’s estimate of undiscounted cash flows attributable to the asset groups includes only future cash flows that are directly associated with and that are expected to arise as a direct result of the use and eventual disposition of the asset group. Long-lived asset impairment charges are a component of Selling and administrative expenses in the Consolidated Statements of Operations.
The Company groups long-lived assets with other assets at the lowest level for which identifiable cash flows are largely independent of the cash flows of other assets, which historically has predominately been at the geographic market level for retail stores, but individual store asset groupings have been assessed in certain circumstances. Wholesale’s long-lived assets are reviewed for impairment at the distribution center level. Save-A-Lot’s long-lived assets are reviewed for impairment at the geographic market level for 13 geographic market groupings of individual corporate-owned stores and related dedicated
68
distribution centers, individual corporate store level for 28 individual corporate stores, which were part of previous asset groups for which management determined that the cash flows in those geographic market areas were no longer interdependent, and at the distribution center level for two distribution centers without corporate stores. Retail’s long-lived assets are reviewed for impairment at the geographic market group level for six geographic market groupings of individual retail stores.
Due to the ongoing business transformation and highly competitive environment, the Company will continue to evaluate its long-lived asset policy and current asset groups to determine if additional modifications to the policy are necessary. Future changes to the Company’s assessment of its long-lived asset policy and changes in circumstances, operating results or other events may result in additional asset impairment testing and charges.
Reserves for Closed Properties
The Company maintains reserves for costs associated with closures of retail stores, distribution centers and other properties that are no longer being utilized in current operations. The Company provides for closed property operating lease liabilities using a discount rate to calculate the present value of the remaining noncancellable lease payments after the closing date, reduced by estimated subtenant rentals that could be reasonably obtained for the property. Lease reserve impairment charges are recorded as a component of Selling and administrative expenses in the Consolidated Statements of Operations.
The closed property lease liabilities usually are paid over the remaining lease terms, which generally range from one to 15 years. Adjustments to closed property reserves primarily relate to changes in subtenant income or actual exit costs differing from original estimates. Adjustments are made for changes in estimates in the period in which the changes become known.
The calculation of the closed property charges requires significant judgments and estimates, including estimated subtenant rentals, discount rates and future cash flows based on the Company’s experience and knowledge of the market in which the closed property is located, previous efforts to dispose of similar assets and the assessment of existing market conditions. Reserves for closed properties are included in Other current liabilities and Other long-term liabilities in the Consolidated Balance Sheets.
Deferred Rent
The Company recognizes rent holidays, including the time period during which the Company has access to the property prior to the opening of the site, as well as construction allowances and escalating rent provisions, on a straight-line basis over the term of the operating lease. The deferred rents are included in Other current liabilities and Other long-term liabilities in the Consolidated Balance Sheets.
Self-Insurance Liabilities
The Company uses a combination of insurance and self-insurance for workers’ compensation, automobile and general liability costs. It is the Company’s policy to record its insurance liabilities based on management’s estimate of the ultimate cost of reported claims and claims incurred but not yet reported and related expenses, discounted at a risk-free interest rate. The present value of such claims was calculated using discount rates ranging from 0.3 percent to 5.1 percent for fiscal 2016, 0.3 percent to 5.1 percent for fiscal 2015 and 0.3 percent to 5.1 percent for fiscal 2014.
Changes in the Company’s insurance liabilities consisted of the following:
2016 | 2015 | 2014 | |||||||||
Beginning balance | $ | 93 | $ | 103 | $ | 97 | |||||
Expense | 29 | 31 | 34 | ||||||||
Claim payments | (28 | ) | (32 | ) | (33 | ) | |||||
Reclassification of insurance recoveries to receivables | 1 | (9 | ) | 5 | |||||||
Ending balance | 95 | 93 | 103 | ||||||||
Less current portion | (31 | ) | (30 | ) | (33 | ) | |||||
Long-term portion | $ | 64 | $ | 63 | $ | 70 | |||||
The current portion of reserves for self-insurance is included in Other current liabilities and the long-term portion is included in Other long-term liabilities in the Consolidated Balance Sheets. The insurance liabilities as of the end of the fiscal year are net of discounts of $6 and $6 as of February 27, 2016 and February 28, 2015, respectively. Amounts due from insurance companies were $11 and $9 as of February 27, 2016 and February 28, 2015, respectively. The current portion of the insurance receivables is included in Receivables, net and the long-term portion is included in Other assets in the Consolidated Balance Sheets.
69
Benefit Plans
The Company recognizes the funded status of its Company-sponsored defined benefit plans in its Consolidated Balance Sheets and gains or losses and prior service costs or credits not yet recognized as a component of Accumulated other comprehensive income (loss), net of tax, in the Consolidated Balance Sheets. The Company sponsors pension and other postretirement plans in various forms covering substantially all employees who meet eligibility requirements. The determination of the Company’s obligation and related expense for Company-sponsored pension and other postretirement benefits is dependent, in part, on management’s selection of certain actuarial assumptions in calculating these amounts. These assumptions include, among other things, the discount rate, the expected long-term rate of return on plan assets and the rates of increase in healthcare and compensation costs. These assumptions are disclosed in Note 11—Benefit Plans. Actual results that differ from the assumptions are accumulated and amortized over future periods in accordance with generally accepted accounting standards.
Effective for fiscal 2017, the Company adopted an alternative approach for determining the interest and service cost components of net periodic benefit cost for defined benefit pension and other postretirement benefit plans. The Company has elected to use the full yield curve approach in the estimation of these components of net periodic benefit cost effective in fiscal 2017 by applying the specific spot rates along the yield curve used in the determination of the projected benefit obligation to the relevant projected cash flows. The change does not affect the measurement of the total benefit obligation. See Note 11—Benefit Plans for additional information on the impact of the change in estimate.
The Company contributes to various multiemployer pension plans under collective bargaining agreements, primarily defined benefit pension plans. Pension expense for these plans is recognized as contributions are funded. See Note 11—Benefit Plans for additional information on the Company’s participation in multiemployer plans.
The Company also contributes to an employee 401(k) retirement savings plan.
Fair Value Measurements
Fair value is defined as the price that would be received to sell an asset or paid to transfer a liability in an orderly transaction between market participants at the measurement date. Assets and liabilities recorded at fair value are categorized using defined hierarchical levels directly related to the amount of subjectivity associated with the inputs to fair value measurements, as follows:
Level 1 - | Quoted prices in active markets for identical assets or liabilities; |
Level 2 - | Inputs other than quoted prices included within Level 1 that are either directly or indirectly observable; |
Level 3 - | Unobservable inputs in which little or no market activity exists, requiring an entity to develop its own assumptions that market participants would use to value the asset or liability. |
The Company utilized fair value measurements in reporting results of operation and financial position within its Consolidated Financial Statements for the following:
• | Acquired assets and liabilities discussed in Note 2—Business Acquisitions were measured at fair value using Level 3 inputs. |
• | Acquired intangible assets and intangible asset impairment charges discussed in Note 3—Goodwill and Intangible Assets were measured at fair value using Level 3 inputs. |
• | Impairment charges related to lease reserves and properties held and used and held for sale, as discussed in Note 4—Reserves for Closed Properties and Property, Plant and Equipment-related Impairment Charges, were measured at fair value using Level 3 inputs. |
• | Assets and liabilities measured at fair value on a recurring basis using Level 1 and Level 2 inputs as discussed in Note 6—Fair Value Measurements. |
• | Stock-based compensation awards were measured at their grant date fair value upon issuance using Level 3 inputs as discussed in Note 10—Stock-based Awards. |
• | Discontinued operations property, plant and equipment impairment charges and finalization adjustments related to the sale of NAI were recorded in Income from discontinued operations, net of tax, as discussed in Note 16—Discontinued Operations, and were measured at fair value using Level 3 inputs. |
Derivatives
The Company uses derivatives only to manage well-defined risks. The Company does not use financial instruments or derivatives for any trading or other speculative purposes.
Interest rate swap contracts are entered into to mitigate the Company's exposure to changes in market interest rates. These contracts are reviewed for hedging effectiveness at hedge inception and on an ongoing basis. If these contracts are designated
70
as a cash flow hedge and are determined to be highly effective, changes in the fair value of these instruments are recognized in Accumulated other comprehensive loss in the Consolidated Balance Sheets reclassified into earnings in the period in which the hedged transaction affects earnings. Hedging ineffectiveness, if any, is recognized in earnings in the Consolidated Statements of Operations.
The Company’s limited involvement with diesel fuel derivatives is primarily to manage its exposure to changes in energy prices utilized in the shipping process. These contracts are economic hedges of price risk and are not designated or accounted for as hedging instruments for accounting purposes. Changes in the fair value of these instruments are recognized in earnings in the Consolidated Statements of Operations.
In addition, the Company enters into energy commitments for certain amounts of electricity and natural gas purchases that it expects to utilize in the normal course of business. Changes in the fair value of these purchase obligations are not recognized in earnings until the underlying commitment is utilized in the normal course of business.
Stock-Based Compensation
Stock-based compensation expense is measured by the fair value of the award on the date of grant, net of the estimated forfeiture rate. The Company uses the straight-line method to recognize stock-based compensation expense over the requisite service period related to each award.
The fair value of stock options is estimated as of the date of grant using the Black-Scholes option pricing model using Level 3 inputs. The estimation of the fair value of stock options incorporates certain assumptions, such as the risk-free interest rate and expected volatility, dividend yield and life of options. Restricted stock awards and units are recorded as stock-based compensation expense over the requisite service period based on the market value of the Company's common stock on the date of grant.
Income Taxes
Deferred income taxes represent future net tax effects resulting from temporary differences between the financial statement amounts and tax bases of assets and liabilities and are measured using enacted tax rates in effect for the year in which the differences are expected to be settled or realized. See Note 9—Income Taxes for the types of differences that give rise to significant portions of deferred income tax assets and liabilities. Deferred income tax assets are reported as a noncurrent asset or liability based on the classification of the related asset or liability or according to the expected date of reversal.
The Company is currently in various stages of audits, appeals or other methods of review with authorities from various taxing jurisdictions. The Company establishes liabilities for unrecognized tax benefits in a variety of taxing jurisdictions when, despite management’s belief that the Company’s tax return positions are supportable, certain positions may be challenged and may need to be revised. The Company adjusts these liabilities in light of changing facts and circumstances, such as the progress of a tax audit. The Company also provides interest on these liabilities at the appropriate statutory interest rate, and accrues penalties as applicable. The Company recognizes interest related to unrecognized tax benefits in Interest expense and penalties in Selling and administrative expenses in the Consolidated Statements of Operations.
Common and Treasury Stock
Concurrent with the execution of the Stock Purchase Agreement in fiscal 2013, the Company entered into a Tender Offer Agreement (the “Tender Offer Agreement”) with Symphony Investors LLC, which was owned by a Cerberus Capital Management, L.P. (“Cerberus”)-led investor consortium (“Symphony Investors”), and Cerberus, pursuant to which, upon the terms and subject to the conditions of the Tender Offer Agreement, and contingent upon the NAI Banner Sale, Symphony Investors tendered for up to 30 percent of the issued and outstanding common stock of the Company at a purchase price of $4.00 per share in cash (the “Tender Offer”). Approximately 12 shares were validly tendered, representing approximately 5.5 percent of the issued and outstanding shares at the time of the Tender Offer expiration on March 20, 2013. All shares that were validly tendered and not properly withdrawn were accepted as tendered in accordance with the terms of Tender Offer.
In addition, pursuant to the terms of the Tender Offer Agreement, on March 21, 2013, the Company issued approximately 42 additional shares of common stock (representing approximately 19.9 percent of the outstanding shares prior to the share issuance) to Symphony Investors at the Tender Offer price per share of $4.00, resulting in $170 in cash proceeds to the Company, which brought Symphony Investors' ownership percentage to 21.2 percent after the share issuance. On April 28, 2015, Symphony Investors distributed its shares of Supervalu common stock to its members on a pro rata basis. As a result, Cerberus Iceberg LLC received 21 shares, which were beneficially owned by Mr. Stephen Feinberg, which subsequently sold all or a portion of these shares. No other member of Symphony Investors received more than five percent of the Company’s issued and outstanding common stock.
71
Revisions
In the first quarter of fiscal 2016, the Company completed an assessment of its revenue and expense presentation primarily related to professional services and certain other transactions. Expenses related to transactions in which the Company determined it was the principal were previously presented net of related revenues within Net sales in the Consolidated Statements of Operations. The presentation of these expenses has been revised to include them within Cost of sales and Selling and administrative expenses. These revisions had the effect of increasing Net sales with a corresponding increase to Cost of sales and Selling and administrative expenses. These revisions did not impact Operating earnings, Earnings from continuing operations before income taxes, Net earnings attributable to SUPERVALU INC., cash flows, or financial position for any period reported. These revisions have similarly impacted the Company's Consolidated Financial Statements across fiscal periods. Management determined that these revisions are not material to any period reported. Prior period amounts have been revised to conform to the current period presentation as shown below.
The following tables present the impact of these revisions on the Company's previously reported results, and the revised amounts as reported in this Annual Report on Form 10-K:
February 28, 2015 (53 weeks) | February 22, 2014 (52 weeks) | |||||||||||||||||||||||
As Originally Reported | Revision | As Revised | As Originally Reported | Revision | As Revised | |||||||||||||||||||
Net sales | $ | 17,820 | $ | 97 | $ | 17,917 | $ | 17,153 | $ | 99 | $ | 17,252 | ||||||||||||
Cost of sales | 15,242 | 87 | 15,329 | 14,623 | 89 | 14,712 | ||||||||||||||||||
Gross profit | 2,578 | 10 | 2,588 | 2,530 | 10 | 2,540 | ||||||||||||||||||
Selling and administrative expenses | 2,154 | 10 | 2,164 | 2,107 | 10 | 2,117 | ||||||||||||||||||
Operating earnings | $ | 424 | $ | — | $ | 424 | $ | 423 | $ | — | $ | 423 | ||||||||||||
February 28, 2015 (53 weeks) | February 22, 2014 (52 weeks) | |||||||||||||||||||||||
As Originally Reported | Revision | As Revised | As Originally Reported | Revision | As Revised | |||||||||||||||||||
Net sales | ||||||||||||||||||||||||
Wholesale | $ | 8,134 | $ | 64 | $ | 8,198 | $ | 8,036 | $ | 66 | $ | 8,102 | ||||||||||||
% of total | 45.6 | % | 0.2 | % | 45.8 | % | 46.9 | % | 0.1 | % | 47.0 | % | ||||||||||||
Save-A-Lot | 4,613 | 28 | 4,641 | 4,228 | 27 | 4,255 | ||||||||||||||||||
% of total | 25.9 | % | (0.1 | )% | 25.8 | % | 24.6 | % | — | % | 24.6 | % | ||||||||||||
Retail | 4,879 | 5 | 4,884 | 4,649 | 6 | 4,655 | ||||||||||||||||||
% of total | 27.4 | % | (0.1 | )% | 27.3 | % | 27.1 | % | (0.1 | )% | 27.0 | % | ||||||||||||
Corporate | 194 | — | 194 | 240 | — | 240 | ||||||||||||||||||
% of total | 1.1 | % | — | % | 1.1 | % | 1.4 | % | — | % | 1.4 | % | ||||||||||||
Total net sales | $ | 17,820 | $ | 97 | $ | 17,917 | $ | 17,153 | $ | 99 | $ | 17,252 | ||||||||||||
100.0 | % | — | % | 100.0 | % | 100.0 | % | — | % | 100.0 | % | |||||||||||||
Reclassifications
In fiscal 2016, losses on the early termination of debt are included in the Consolidated Statements of Cash Flows as a separate line item entitled Loss on debt extinguishment. In prior years, losses on the early termination of debt were classified as Asset impairment and other charges. Prior year amounts have been reclassified to conform to current year presentation. These reclassifications did not impact net cash provided by operating activities or net cash from investing activities or financing activities for any period presented.
72
In November 2015, the Financial Accounting Standards Board (“FASB”) issued authoritative guidance under accounting standard update (“ASU”) 2015-17, Income Taxes (Topic 740): Balance Sheet Classification of Deferred Taxes. ASU 2015-17 requires all deferred income tax assets and liabilities to be classified as non-current in a classified balance sheet. The Company adopted ASU 2015-17 in fiscal 2016 on a retrospective basis resulting in a $15 reduction of Deferred tax assets and Other current liabilities within the Company's Consolidated Balance Sheets as of February 28, 2015.
In April 2015, the FASB issued authoritative guidance under ASU 2015-03, Interest—Imputation of Interest (Subtopic 835-30): Simplifying the Presentation of Debt Issuance Costs. ASU 2015-03 requires debt issuance costs to be presented in the balance sheet as a direct deduction from the carrying amount of the related debt obligation. The Company adopted ASU 2015-03 in fiscal 2016 on a retrospective basis resulting in a $35 reduction of Other assets and Long-term debt within the Company's Consolidated Balance Sheets as of February 28, 2015. Debt financing costs for the Company's revolving credit facility are presented as a reduction of the related borrowings when a balance is drawn on the facility and as an asset within Other assets when no balance is drawn on the facility.
Recently Issued Accounting Standards
In March 2016, the FASB issued authoritative guidance under ASU 2016-09, Compensation-Stock Compensation (Topic 718) Improvements to Employee Share-Based Payment Accounting. ASU 2016-09 provides for simplification of several aspects of the accounting for share-based payment transactions, including income tax consequences, classification of awards as either equity or liabilities and classification on the statement of cash flows. The Company is required to adopt this new authoritative guidance in the first quarter of fiscal 2018. The Company is currently evaluating the potential impact of adoption of this standard on its consolidated financial statements.
In February 2016, the FASB issued authoritative guidance under ASU 2016-02, Leases (Topic 842). ASU 2016-02 provides new comprehensive lease accounting guidance that supersedes existing lease guidance. Upon adoption of ASU 2016-02, the Company will be required to recognize most leases on its balance sheet at the beginning of the earliest comparative period presented with a corresponding adjustment to stockholders' equity. ASU 2016-02 requires the Company to capitalize most current operating lease obligations as right-of-use assets based on the present value of future operating lease payments and to recognize a corresponding liability. Criteria for distinguishing leases between finance and operating are substantially similar to criteria for distinguishing between capital leases and operating leases in existing lease guidance. The Company is required to adopt this new authoritative guidance in the first quarter of fiscal 2020. The Company is currently evaluating the potential impact of adoption of this standard on its consolidated financial statements.
In January 2016, the FASB issued authoritative guidance under ASU 2016-01, Financial Instruments—Overall (Subtopic 825-10): Recognition and Measurement of Financial Assets and Financial Liabilities. ASU 2016-01 revises the classification, measurement and disclosure of investments in equity securities. The Company is required to adopt this new authoritative guidance in the first quarter of fiscal 2019. Due to the Company's current limited involvement in investments in equity securities, the Company does not expect that this standard will have a material impact on its consolidated financial statements.
In May 2014, the FASB issued authoritative guidance under ASU 2014-09, Revenue from Contracts with Customers (Topic 606): Revenue from Contracts with Customers. ASU 2014-09 supersedes existing revenue recognition requirements and provides a new comprehensive revenue recognition model that requires entities to recognize revenue to depict the transfer of goods or services to a customer at an amount that reflects the consideration it expects to receive in exchange for those goods or services. The new authoritative guidance will likely be adopted by the Company during the first quarter of fiscal 2019, as permitted by ASU 2015-14, Revenue from Contracts with Customers (Topic 606): Deferral of the Effective Date. The adoption will include updates as provided under ASU 2016-08, Revenue from Contracts with Customers (Topic 606): Principal versus Agent Considerations (Reporting Revenue Gross versus Net). Adoption is allowed by either the full retrospective or modified retrospective approach. The Company is currently evaluating which approach it will apply and the potential impact of the adoption on its consolidated financial statements.
NOTE 2—BUSINESS ACQUISITIONS
The Consolidated Financial Statements reflect the final purchase accounting allocations of the acquisitions discussed below. Pro forma information for the acquisitions discussed below are not presented since the results of operations of the acquired businesses, both individually and in the aggregate, are not material to the Company’s Consolidated Financial Statements. Recognized goodwill represents future economic benefits expected to arise from the Company’s presence in the retail market.
73
Retail Stores
During fiscal 2016, the Company paid $7 to acquire equipment and leasehold improvements, identifiable finite-lived intangible assets and inventories of four retail stores from multiple independent retail customers. The purchase price was allocated to the acquired store assets and such assets were recognized at their estimated fair values and included inventories, property, plant and equipment, and goodwill.
During fiscal 2015, the Company completed the purchase of seven Rainbow Foods grocery stores, 11 Rainbow Foods pharmacy locations and one Rainbow Foods liquor store from RBF, LLC and Roundy’s Supermarkets, Inc. (“Roundy’s”). Five of the grocery stores, each of the pharmacies and the liquor store are operating under the Cub Foods banner, and two of the grocery stores are operating as Rainbow Foods grocery stores.
Total consideration for the stores and pharmacies acquired by the Company was $34 plus cash payments of $5 for inventories. The Company assumed certain off-balance sheet obligations, including operating leases and multiemployer pension obligations with respect to the acquired stores. In addition, the Company also acquired Roundy’s RAINBOW™ trademark.
The fair value of assets acquired was $39, including property, plant and equipment of $15, goodwill of $14, inventories of $5, identifiable finite-lived intangible assets of $4 and other current assets of $1.
Save-A-Lot Licensee Stores
During fiscal 2016, the Company paid $2 to acquire equipment and leasehold improvements, identifiable finite-lived intangible assets and inventories associated with eight licensed Save-A-Lot stores from multiple licensee operators. The acquired store assets were recognized at their estimated fair values and included favorable operating lease intangible assets, goodwill, inventories and property, plant and equipment. The remaining terms of the favorable operating leases ranged from five to ten years.
During fiscal 2015, the Company paid $19 to acquire 38 licensed Save-A-Lot stores from multiple licensee operators through 20 separate purchase agreements. The fair value of acquired store assets were recognized at their estimated fair values and included $8 of favorable operating lease intangible assets, $5 of goodwill, $3 of inventories and $3 of property, plant and equipment. The remaining terms of the favorable operating leases ranged from three to thirteen years.
74
NOTE 3—GOODWILL AND INTANGIBLE ASSETS
Changes in the Company’s Goodwill and Intangible assets, net consisted of the following:
February 22, 2014 | Additions | Impairments | Other net adjustments | February 28, 2015 | Additions | Impairments | Other net adjustments | February 27, 2016 | |||||||||||||||||||||||||||
Goodwill: | |||||||||||||||||||||||||||||||||||
Wholesale | $ | 710 | $ | — | $ | — | $ | — | $ | 710 | $ | — | $ | — | $ | — | $ | 710 | |||||||||||||||||
Save-A-Lot | 137 | 4 | — | — | 141 | 1 | — | — | 142 | ||||||||||||||||||||||||||
Retail | — | 14 | — | — | 14 | 1 | — | — | 15 | ||||||||||||||||||||||||||
Total goodwill | $ | 847 | $ | 18 | $ | — | $ | — | $ | 865 | $ | 2 | $ | — | $ | — | $ | 867 | |||||||||||||||||
Intangible assets: | |||||||||||||||||||||||||||||||||||
Favorable operating leases, prescription files, customer lists and other (accumulated amortization of $97 and $86 as of February 27, 2016 and February 28, 2015, respectively) | $ | 111 | $ | 13 | $ | — | $ | — | $ | 124 | $ | 25 | $ | (6 | ) | $ | (1 | ) | $ | 142 | |||||||||||||||
Tradenames and trademarks—indefinite useful lives | 9 | — | — | — | 9 | — | — | — | 9 | ||||||||||||||||||||||||||
Non-compete agreements (accumulated amortization of $2 and $2 as of February 27, 2016 and February 28, 2015, respectively) | 3 | — | — | — | 3 | — | — | — | 3 | ||||||||||||||||||||||||||
Total intangible assets | 123 | 13 | — | — | 136 | 25 | (6 | ) | (1 | ) | 154 | ||||||||||||||||||||||||
Accumulated amortization | (80 | ) | (8 | ) | — | — | (88 | ) | (11 | ) | — | — | (99 | ) | |||||||||||||||||||||
Total intangible assets, net | $ | 43 | $ | 48 | $ | 55 | |||||||||||||||||||||||||||||
The Company applies a fair value based impairment test to the net book value of goodwill and intangible assets with indefinite useful lives on an annual basis and on an interim basis if events or circumstances indicate that an impairment loss may have occurred.
The Company conducted an annual impairment test of the net book value of goodwill and intangible assets with indefinite useful lives during the fourth quarter of fiscal 2016, which indicated the fair value of the Retail, Wholesale and the Save-A-Lot Corporate Stores reporting units exceeded their carrying values by approximately 100 percent, 95 percent and 35 percent, respectively. The fair value of the Save-A-Lot Licensee Distribution reporting unit was in excess of 100 percent of its carrying value and the fair values of intangible assets with indefinite useful lives was in excess of their carrying values.
In the first quarter ended June 20, 2015, the Company recorded intangible assets using valuations based on Level 3 inputs consisting primarily of certain distribution center operation rights, purchase options and other intangibles received by the Company under the letter agreement the Company entered into with Albertson's dated May 28, 2015, as described in Note 14—Commitments, Contingencies and Off-Balance Sheet Arrangements.
In the third quarter ended December 5, 2015, the Company received a notice pursuant to which the Company could exercise certain purchase options. As a result, the Company performed a review of the associated intangible assets for impairment, which indicated the carrying value of the intangible exceeded its estimated value. The Company recorded a non-cash intangible impairment charge of $6 within its Wholesale segment.
Annual impairment testing and the related calculation of the impairment charges contains significant judgments and estimates including weighted average cost of capital, future revenue, profitability, cash flows and fair values of assets and liabilities.
Amortization expense of intangible assets with definite useful lives of $11, $8 and $8 was recorded in fiscal 2016, 2015 and 2014, respectively. Future amortization expense is expected to average approximately $7 per year for the next five years.
75
NOTE 4—RESERVES FOR CLOSED PROPERTIES AND PROPERTY, PLANT AND EQUIPMENT-RELATED IMPAIRMENT CHARGES
Reserves for Closed Properties
Changes in the Company’s reserves for closed properties consisted of the following:
2016 | 2015 | 2014 | |||||||||
Beginning balance | $ | 34 | $ | 47 | $ | 61 | |||||
Additions | 8 | 4 | 4 | ||||||||
Payments | (12 | ) | (12 | ) | (16 | ) | |||||
Adjustments | (1 | ) | (5 | ) | (2 | ) | |||||
Ending balance | $ | 29 | $ | 34 | $ | 47 | |||||
In fiscal 2016, the Company determined it would close 15 non-strategic Save-A-Lot corporate stores and recorded an impairment charge of $5 related to the operating leases for these stores in the Save-A-Lot segment.
Property, Plant and Equipment Impairment Charges
The following table presents impairment charges related to property, plant and equipment measured at fair value on a non-recurring basis:
2016 | 2015 | 2014 | |||||||||
Property, plant and equipment: | |||||||||||
Carrying value | $ | 11 | $ | 4 | $ | 45 | |||||
Fair value measured using Level 3 inputs | 3 | 1 | 21 | ||||||||
Impairment charge | $ | 8 | $ | 3 | $ | 24 | |||||
Fiscal 2016 and 2015 impairment charges are primarily related to the closure of non-strategic Save-A-Lot corporate stores. Fiscal 2014 impairment charges were primarily related to the write-off of certain software tools that would no longer be utilized in operations within Retail, and impairments of Wholesale distribution centers and Save-A-Lot stores.
NOTE 5—PROPERTY, PLANT AND EQUIPMENT
Property, plant and equipment, net, consisted of the following:
2016 | 2015 | ||||||
Land | $ | 104 | $ | 104 | |||
Buildings | 1,295 | 1,252 | |||||
Property under construction | 79 | 71 | |||||
Leasehold improvements | 722 | 709 | |||||
Equipment | 2,082 | 2,021 | |||||
Capitalized lease assets | 294 | 314 | |||||
Total property, plant and equipment | 4,576 | 4,471 | |||||
Accumulated depreciation | (2,897 | ) | (2,779 | ) | |||
Accumulated amortization on capitalized lease assets | (198 | ) | (222 | ) | |||
Total property, plant and equipment, net | $ | 1,481 | $ | 1,470 | |||
Depreciation expense was $248, $258 and $275 for fiscal 2016, 2015 and 2014, respectively. Amortization expense related to capitalized lease assets was $18, $19 and $19 for fiscal 2016, 2015 and 2014, respectively.
76
NOTE 6—FAIR VALUE MEASUREMENTS
Recurring fair value measurements were as follows:
February 27, 2016 | |||||||||||||||||
Balance Sheet Location | Level 1 | Level 2 | Level 3 | Total | |||||||||||||
Assets: | |||||||||||||||||
Deferred compensation | Other assets | $ | 6 | $ | — | $ | — | $ | 6 | ||||||||
Total | $ | 6 | $ | — | $ | — | $ | 6 | |||||||||
Liabilities: | |||||||||||||||||
Deferred compensation | Other current liabilities | $ | — | $ | 7 | $ | — | $ | 7 | ||||||||
Deferred compensation | Other long-term liabilities | — | 35 | — | 35 | ||||||||||||
Diesel fuel derivatives | Other current liabilities | — | 2 | — | 2 | ||||||||||||
Interest rate swap derivative | Other current liabilities | — | 3 | — | 3 | ||||||||||||
Interest rate swap derivative | Other long-term liabilities | — | 3 | — | 3 | ||||||||||||
Total | $ | — | $ | 50 | $ | — | $ | 50 | |||||||||
February 28, 2015 | |||||||||||||||||
Balance Sheet Location | Level 1 | Level 2 | Level 3 | Total | |||||||||||||
Assets: | |||||||||||||||||
Deferred compensation | Other assets | $ | 7 | $ | — | $ | — | $ | 7 | ||||||||
Total | $ | 7 | $ | — | $ | — | $ | 7 | |||||||||
Liabilities: | |||||||||||||||||
Deferred compensation | Other current liabilities | $ | — | $ | 13 | $ | — | $ | 13 | ||||||||
Deferred compensation | Other long-term liabilities | — | 33 | — | 33 | ||||||||||||
Diesel fuel derivatives | Other current liabilities | — | 1 | — | 1 | ||||||||||||
Total | $ | — | $ | 47 | $ | — | $ | 47 | |||||||||
Deferred Compensation
Deferred compensation assets consist of mutual fund investments used to fund certain deferred compensation plans. The fair values of deferred compensation assets are based on quoted market prices of the mutual funds held by the plan at each reporting period. Mutual funds traded in active markets are classified within Level 1 of the fair value hierarchy. Deferred compensation assets are restricted for use to pay deferred compensation liabilities. Deferred compensation liabilities consist of obligations to participants in deferred compensation plans, and are determined based on the fair value of the related deferred compensation plan investments or designated phantom investments of the plan at each reporting period.
Diesel Fuel Derivatives
Commodity derivatives consist of forward fixed price purchase diesel fuel contracts. The fair value of the Company’s diesel fuel derivatives are measured using Level 2 inputs due to the Company’s use of observable market quotations without significant adjustments to determine fair values.
Fuel derivative losses are included within Cost of sales in the Consolidated Statements of Operations and were $3, $1 and $0 for fiscal 2016, 2015 and 2014, respectively.
Interest Rate Swap Derivatives
On February 24, 2015, the Company entered into a forward starting interest rate swap agreement effectively converting $300 of variable rate debt under the Company's Secured Term Loan Facility (defined below) to a fixed rate of 5.5075 percent, effective beginning in February 2016 and through the Secured Term Loan Facility's maturity in March 2019. This transaction was
77
entered into to reduce the Company's exposure to changes in market interest rates associated with its variable rate debt. The Company designated this derivative as a cash flow hedge of the variability in expected cash outflows for interest payments.
In fiscal 2016 and 2015, no amounts were recorded in the Consolidated Statements of Operations for interest rate swap derivative ineffectiveness or reclassifications from Accumulated other comprehensive loss into earnings.
The fair value of the interest rate swap is measured using Level 2 inputs. The interest rate swap agreement is valued using an income approach interest rate swap valuation model incorporating observable market inputs including interest rates, LIBOR swap rates and credit default swap rates. As of February 27, 2016, a 100 basis point increase in forward LIBOR interest rates would increase the fair value of the interest rate swap by approximately $6; and a 100 basis point decrease in forward LIBOR interest rates would decrease the fair value of the interest rate swap by approximately $3.
The Company utilized Level 3 fair value inputs in measuring certain non-recurring transactions in fiscal 2016. See Note 1—Summary of Significant Accounting Policies.
Fair Value Estimates
For certain of the Company’s financial instruments, including cash and cash equivalents, receivables, accounts payable, accrued salaries and other current assets and liabilities, the fair values approximate carrying values due to their short maturities.
The estimated fair value of notes receivable was greater than the carrying value by $1 and $2 as of February 27, 2016 and February 28, 2015, respectively. The estimated fair value of notes receivable was calculated using a discounted cash flow approach applying a market rate for similar instruments using Level 3 inputs.
The estimated fair value of the Company’s long-term debt was less than the carrying amount, excluding debt financing costs, by approximately $236 as of February 27, 2016 and greater than the carrying amount by approximately $59 as of February 28, 2015. The estimated fair value was based on market quotes, where available, or market values for similar instruments, using Level 2 and 3 inputs.
NOTE 7—LONG-TERM DEBT
The Company’s long-term debt consisted of the following:
February 27, 2016 | February 28, 2015 | ||||||
4.50% Secured Term Loan Facility due March 2019 | $ | 1,459 | $ | 1,469 | |||
6.75% Senior Notes due June 2021 | 400 | 400 | |||||
7.75% Senior Notes due November 2022 | 350 | 350 | |||||
8.00% Senior Notes due May 2016 | — | 278 | |||||
1.93% to 4.00% Revolving ABL Credit Facility due February 2021 | 138 | — | |||||
Debt financing costs, net | (45 | ) | (35 | ) | |||
Original issue discount on debt | (5 | ) | (8 | ) | |||
Total debt | 2,297 | 2,454 | |||||
Less current maturities of long-term debt | (100 | ) | (9 | ) | |||
Long-term debt | $ | 2,197 | $ | 2,445 | |||
Future maturities of long-term debt, excluding the original issue discount on debt and debt financing costs, as of February 27, 2016, consist of the following:
Fiscal Year | |||
2017 | $ | 102 | |
2018 | — | ||
2019 | — | ||
2020 | 1,357 | ||
2021 | 138 | ||
Thereafter | 750 | ||
78
The Company’s credit facilities and certain long-term debt agreements have restrictive covenants and cross-default provisions, which generally provide, subject to the Company’s right to cure, for the acceleration of payments due in the event of a breach of a covenant or a default in the payment of a specified amount of indebtedness due under certain other debt agreements. The Company was in compliance with all such covenants and provisions for all periods presented.
Senior Secured Credit Agreements
As of February 27, 2016 and February 28, 2015, the Company had outstanding borrowings of $1,459 and $1,469, respectively, under its $1,500 term loan facility (the “Secured Term Loan Facility”), which is secured by substantially all of the Company’s real estate, equipment and certain other assets, and bears interest at the rate of LIBOR plus 3.50 percent subject to a floor on LIBOR of 1.00 percent. The Secured Term Loan Facility is guaranteed by the Company’s material subsidiaries (together with the Company, the “Term Loan Parties”). To secure their obligations under the Secured Term Loan Facility, the Company granted a perfected first-priority security interest for the benefit of the facility lenders in the Term Loan Parties’ equity interests in Moran Foods, LLC, the main operating entity of the Company’s Save-A-Lot business, and the Term Loan Parties granted a perfected first priority security interest in substantially all of their intellectual property and a first priority mortgage lien and security interest in certain owned or ground-leased real estate and associated equipment pledged as collateral. As of February 27, 2016 and February 28, 2015, there was $781 and $776, respectively, of owned or ground-leased real estate and associated equipment pledged as collateral, which was included in Property, plant and equipment, net in the Consolidated Balance Sheets. In addition, the obligations of the Term Loan Parties under the Secured Term Loan Facility are secured by second-priority security interests in the collateral securing the Company’s $1,000 asset-based revolving ABL credit facility (the “Revolving ABL Credit Facility”). As of February 27, 2016 and February 28, 2015, $102 and $11 of the Secured Term Loan Facility was classified as current, respectively.
The loans under the Secured Term Loan Facility may be voluntarily prepaid in certain minimum principal amounts, subject to the payment of breakage or similar costs. Pursuant to the Secured Term Loan Facility, the Company must, subject to certain customary reinvestment rights, apply 100 percent of Net Cash Proceeds (as defined in the facility) from certain types of asset sales (excluding proceeds of the collateral security of the Revolving ABL Credit Facility and other secured indebtedness) to prepay the loans outstanding under the Secured Term Loan Facility. The Company must also prepay loans outstanding under the facility no later than 90 days after the fiscal year end in an aggregate principal amount equal to a percentage (which percentage ranges from 0 to 50 percent depending on the Company’s Total Secured Leverage Ratio (as defined in the facility) as of the last day of such fiscal year) of Excess Cash Flow (as defined in the facility) for the fiscal year then ended minus any voluntary prepayments made during such fiscal year with Internally Generated Cash (as defined in the facility). Based on the Company's Excess Cash Flow for the fiscal year ended February 27, 2016, a $99 prepayment will be required under the Secured Term Loan Facility no later than 90 days after the fiscal year ended February 27, 2016.
On February 3, 2016, the Company entered into Amendment No. 3 (the "Third ABL Amendment") to the Revolving ABL Credit Facility that extended the maturity date of the facility to February 3, 2021 from its prior maturity date of September 30, 2019. The Third ABL Amendment also reduced the rate at which interest is paid on loans under the Revolving ABL Credit Facility by 25 basis points to, at the Company’s election, LIBOR plus an interest rate margin between 1.25 percent to 1.75 percent or prime plus an interest rate margin between 0.25 percent to 0.75 percent, in each case, depending on quarterly average excess availability. The Third ABL Amendment also reduced the letter of credit fee under the Revolving ABL Credit Facility to 1.25 percent to 1.75 percent, depending on quarterly average excess availability. Further, the amount of the facility fee required to be paid quarterly in arrears by the Company was reduced to 0.25 percent multiplied by the aggregate unused commitments under the Revolving ABL Credit Facility. This Third ABL Amendment also permits the Company and its subsidiaries to undertake certain transactions reasonably determined by the Company to be necessary to effectuate a spin-off of Save-A-Lot. In addition, the Third ABL Amendment also modifies certain representations and warranties, covenants and events of default set forth in the Revolving ABL Credit Facility, and provides for the adjustment of certain covenants in the event a spin-off of Save-A-Lot is consummated.
As of February 27, 2016 and February 28, 2015, the Company had $138 and $0 of outstanding borrowings under the Revolving ABL Credit Facility, respectively. As of February 27, 2016, letters of credit outstanding under the Revolving ABL Credit Facility were $69 at fees of 1.625 percent, and the unused available credit under this facility was $744 with facility fees of 0.25 percent. As of February 28, 2015, letters of credit outstanding under the Company's Revolving ABL Credit Facility were $76 at fees of 1.625 percent, and the unused available credit under this facility was $871 with facility fees of 0.375 percent. As of February 27, 2016, the Revolving ABL Credit Facility was secured on a first-priority basis by $1,238 of certain inventory assets included in Inventories, net, $222 of certain receivables included in Receivables, net, $23 of certain amounts included in Cash and cash equivalents and all of the Company’s pharmacy scripts included in Intangible assets, net, in the Consolidated Balance Sheets. As of February 28, 2015, the Revolving ABL Credit Facility was secured on a first-priority basis by $1,188 of certain inventory assets included in Inventories, net, $220 of certain receivables included in Receivables, net, $28 of certain amounts
79
included in Cash and cash equivalents and all of the Company’s pharmacy scripts included in Intangible assets, net, in the Consolidated Balance Sheets.
The revolving loans under the Revolving ABL Credit Facility may be voluntarily prepaid in certain minimum principal amounts, in whole or in part, without premium or penalty, subject to breakage or similar costs. The Company and those subsidiaries named as borrowers under the Revolving ABL Credit Facility are required to repay the revolving loans in cash and provide cash collateral under this facility to the extent that the revolving loans and letters of credit exceed the lesser of the borrowing base then in effect or the aggregate amount of the lenders’ commitments under the Revolving ABL Credit Facility. During the fiscal year ended February 27, 2016, the Company borrowed $840 and repaid $702 under its Revolving ABL Credit Facility. During the fiscal year ended February 28, 2015, the Company borrowed $3,268 and repaid $3,268 under the Revolving ABL Credit Facility. Certain of the Company’s material subsidiaries are co-borrowers under the Revolving ABL Credit Facility, and this facility is guaranteed by the rest of the Company’s material subsidiaries (the Company and those subsidiaries named as borrowers and guarantors under the Revolving ABL Credit Facility, the “ABL Loan Parties”). To secure their obligations under this facility, the ABL Loan Parties have granted a perfected first-priority security interest for the benefit of the facility lenders in their present and future inventory, credit card, wholesale trade, pharmacy and certain other receivables, prescription files and related assets. In addition, the obligations under the Revolving ABL Credit Facility are secured by second-priority liens on and security interests in the collateral securing the Secured Term Loan Facility, subject to certain limitations to ensure compliance with the Company’s outstanding debt instruments and leases.
Both the Secured Term Loan Facility and the Revolving ABL Credit Facility limit the Company’s ability to make Restricted Payments (as defined in both the Secured Term Loan Facility and the Revolving ABL Credit Facility), which include dividends to stockholders. The Secured Term Loan Facility caps the aggregate amount of Restricted Payments that may be made over the life of the Secured Term Loan Facility. That aggregate cap can fluctuate over time and the cap could be reduced by certain other actions taken by the Company, including certain debt prepayments and Permitted Investments (as defined in the Secured Term Loan Facility). As of February 27, 2016, that aggregate cap on Restricted Payments was approximately $401. The Revolving ABL Credit Facility permits dividends up to $75 per fiscal year, not to exceed $175 in the aggregate over the life of the Revolving ABL Credit Facility, as long as no Cash Dominion Event (as defined in the Revolving ABL Credit Facility) exists. Those caps could be reduced by certain debt prepayments made by the Company. The Revolving ABL Credit Facility permits other Restricted Payments as long as the Payment Conditions (as defined in the Revolving ABL Credit Facility) are met.
Debentures
On January 6, 2016, the Company used borrowings under the Revolving ABL Credit Facility and cash from operations to fund the redemption of the remaining $278 of 8.00 percent Senior Notes due May 2016 (the "2016 Notes"), and to pay accrued and unpaid interest on the redeemed 2016 Notes and the applicable redemption premium of approximately $6, which was expensed. In addition, non-cash charges of $1 for the write-off of the remaining unamortized financing costs on the redeemed 2016 Notes were incurred.
The $400 of 6.75 percent Senior Notes due June 2021, and the $350 of 7.75 percent Senior Notes due November 2022 contain, and before their redemption the 2016 Notes contained, operating covenants, including limitations on liens and on sale and leaseback transactions. The Company was in compliance with all such covenants and provisions for all periods presented.
NOTE 8—LEASES
The Company leases most of its retail stores and certain distribution centers, office facilities and equipment from third parties. Many of these leases include renewal options and, to a limited extent, include options to purchase. Future minimum lease payments to be made by the Company for noncancellable operating leases and capital leases as of February 27, 2016 consist of the following:
80
Lease Obligations | |||||||
Fiscal Year | Operating Leases | Capital Leases | |||||
2017 | $ | 141 | $ | 42 | |||
2018 | 126 | 42 | |||||
2019 | 105 | 39 | |||||
2020 | 85 | 36 | |||||
2021 | 62 | 31 | |||||
Thereafter | 167 | 122 | |||||
Total future minimum obligations | $ | 686 | 312 | ||||
Less interest | (85 | ) | |||||
Present value of net future minimum obligations | 227 | ||||||
Less current capital lease obligations | (24 | ) | |||||
Long-term capital lease obligations | $ | 203 | |||||
Total future minimum obligations have not been reduced for future minimum subtenant rentals under certain operating subleases.
Rent expense, other operating lease expense and subtenant rentals all under operating leases consisted of the following:
2016 | 2015 | 2014 | |||||||||
Minimum rent | $ | 156 | $ | 148 | $ | 143 | |||||
Contingent rent | 5 | 6 | 5 | ||||||||
Rent expense | 161 | 154 | 148 | ||||||||
Less subtenant rentals | (29 | ) | (29 | ) | (27 | ) | |||||
Total net rent expense | $ | 132 | $ | 125 | $ | 121 | |||||
The Company leases certain property to third parties under operating, capital and direct financing leases. Under the direct financing leases, the Company leases buildings to independent retail customers with terms ranging from one to five years.
Future minimum lease and subtenant rentals to be received under noncancellable operating and deferred financing income leases, under which the Company is the lessor, as of February 27, 2016, consist of the following:
Lease Receipts | |||||||
Fiscal Year | Operating Leases | Direct Financing Leases | |||||
2017 | $ | 21 | $ | 1 | |||
2018 | 18 | 1 | |||||
2019 | 12 | — | |||||
2020 | 7 | — | |||||
2021 | 3 | — | |||||
Thereafter | 11 | — | |||||
Total minimum lease receipts | $ | 72 | 2 | ||||
Less interest | — | ||||||
Net investment in direct financing leases | 2 | ||||||
Less current portion | (1 | ) | |||||
Long-term portion | $ | 1 | |||||
The carrying value of owned property leased to third parties under operating leases was as follows:
2016 | 2015 | ||||||
Property, plant and equipment | $ | 4 | $ | 4 | |||
Less accumulated depreciation | (3 | ) | (3 | ) | |||
Property, plant and equipment, net | $ | 1 | $ | 1 | |||
81
NOTE 9—INCOME TAXES
Income Tax Provision
The provision (benefit) for income taxes consisted of the following:
2016 | 2015 | 2014 | |||||||||
Current | |||||||||||
Federal | $ | 77 | $ | 35 | $ | 30 | |||||
State | 10 | 7 | 5 | ||||||||
Total current | 87 | 42 | 35 | ||||||||
Deferred | (2 | ) | 16 | (30 | ) | ||||||
Total income tax provision | $ | 85 | $ | 58 | $ | 5 | |||||
The difference between the actual tax provision and the tax provision computed by applying the statutory federal income tax rate to Earnings from continuing operations before income taxes is attributable to the following:
2016 | 2015 | 2014 | |||||||||
Federal taxes based on statutory rate | $ | 92 | $ | 62 | $ | 4 | |||||
State income taxes, net of federal benefit | 6 | 12 | — | ||||||||
Tax contingency | (6 | ) | (1 | ) | (1 | ) | |||||
Change in valuation allowance | 4 | — | (1 | ) | |||||||
Pension | (4 | ) | (8 | ) | — | ||||||
Other | (7 | ) | (7 | ) | 3 | ||||||
Total income tax provision | $ | 85 | $ | 58 | $ | 5 | |||||
Deferred Income Taxes
Deferred income taxes reflect the net tax effects of temporary differences between the basis in assets and liabilities for financial reporting and income tax purposes. The Company’s deferred tax assets and liabilities consisted of the following:
2016 | 2015 | ||||||
Deferred tax assets: | |||||||
Compensation and benefits | $ | 235 | $ | 234 | |||
Self-insurance | 27 | 25 | |||||
Property, plant and equipment and capitalized lease assets | 47 | 72 | |||||
Loss on sale of discontinued operations | 1,388 | 1,387 | |||||
Net operating loss carryforwards | 15 | 19 | |||||
Other | 83 | 69 | |||||
Gross deferred tax assets | 1,795 | 1,806 | |||||
Valuation allowance | (1,408 | ) | (1,404 | ) | |||
Total deferred tax assets | 387 | 402 | |||||
Deferred tax liabilities: | |||||||
Property, plant and equipment and capitalized lease assets | (108 | ) | (88 | ) | |||
Inventories | (6 | ) | (14 | ) | |||
Intangible assets | (24 | ) | (27 | ) | |||
Other | (21 | ) | (23 | ) | |||
Total deferred tax liabilities | (159 | ) | (152 | ) | |||
Net deferred tax assets | $ | 228 | $ | 250 | |||
During the fourth quarter of fiscal 2016, the Company early adopted ASU 2015-17, which requires that all deferred taxes be presented as non-current on the Consolidated Balance Sheet. Refer to Note 1—Summary of Significant Accounting Policies, for further information on this balance sheet reclassification.
82
The Company has valuation allowances to reduce deferred tax assets to the amount that is more-likely-than-not to be realized. The Company currently has state net operating loss (“NOL”) carryforwards of $315 for tax purposes. The NOL carryforwards expire beginning in fiscal 2017 and continuing through fiscal 2035 and have a $6 valuation allowance. In fiscal 2014, the sale of NAI resulted in an allocation of tax expense between continuing and discontinued operations and the recognition of the additional tax basis in the shares of NAI offset by a valuation allowance on the capital loss that resulted from the sale of shares. The Company has recorded a valuation allowance against the projected capital loss as there is no evidence that the capital loss will be used prior to its expiration in fiscal 2019.
Uncertain Tax Positions
Changes in the Company’s unrecognized tax positions consisted of the following:
2016 | 2015 | 2014 | |||||||||
Beginning balance | $ | 94 | $ | 76 | $ | 187 | |||||
Increase based on tax positions related to the current year | 5 | 15 | 15 | ||||||||
Decrease based on tax positions related to the current year | — | — | — | ||||||||
Increase based on tax positions related to prior years | — | 15 | 8 | ||||||||
Decrease based on tax positions related to prior years | (23 | ) | (4 | ) | (2 | ) | |||||
Decrease related to settlements with taxing authorities | — | (3 | ) | (128 | ) | ||||||
Decrease due to lapse of statute of limitations | (6 | ) | (5 | ) | (4 | ) | |||||
Ending balance | $ | 70 | $ | 94 | $ | 76 | |||||
Included in the balance of unrecognized tax benefits as of February 27, 2016, February 28, 2015 and February 22, 2014 are tax positions, net of tax, of $34, $36 and $48, respectively, which would reduce the Company’s effective tax rate if recognized in future periods.
Because existing tax positions will continue to generate increased liabilities for the Company for unrecognized tax benefits over the next 12 months, and since the Company is routinely under audit by various taxing authorities, it is reasonably possible that the amount of unrecognized tax benefits will change during the next 12 months. An estimate of the amount or range of such change cannot be made at this time. However, the Company does not expect the change, if any, to have a material effect on the Company's Consolidated Balance Sheets, Consolidated Statements of Operations, or Consolidated Statements of Cash Flows within the next 12 months.
The Company recognized interest income of $9, $7 and $4 in fiscal 2016, 2015 and 2014 in Interest expense, respectively, and penalty expense of $5 in fiscal 2016 in Selling and administrative expenses, in the Consolidated Statements of Operations. At February 27, 2016 and February 28, 2015, the Company had accrued interest of $16 and $26, respectively, related to uncertain tax positions recorded in Other current liabilities, and Long-term tax liabilities in the Consolidated Balance Sheets. At February 27, 2016 and February 28, 2015, the Company had accrued penalties of $5 and $0, respectively, related to uncertain tax positions recorded in Long-term tax liabilities in the Consolidated Balance Sheets.
The Company is currently under examination or other methods of review in several tax jurisdictions and remains subject to examination until the statute of limitations expires for the respective taxing jurisdiction or an agreement is reached between the taxing jurisdiction and the Company. As of February 27, 2016, the Company is no longer subject to federal income tax examinations for fiscal years before 2014 and in most states is no longer subject to state income tax examinations for fiscal years before 2006.
NOTE 10—STOCK-BASED AWARDS
As of February 27, 2016, the Company has stock options, restricted stock awards and restricted stock units (collectively referred to as “stock-based awards”) outstanding under the 2012 Stock Plan and 2007 Stock Plan. The Company’s amended and restated 2012 Stock Plan (the "2012 Stock Plan"), as approved by stockholders in fiscal 2015, is the only plan under which stock-based awards may be granted. The 2012 Stock Plan provides that the Board of Directors or the Leadership Development and Compensation Committee of the Board (the “Compensation Committee”) may determine at the time of grant whether each stock-based award granted will be a non-qualified or incentive stock-based award under the Internal Revenue Code of 1986, as amended (the “Internal Revenue Code”). The terms of each stock-based award will be determined by the Board of Directors or the Compensation Committee. Generally, stock-based awards granted prior to fiscal 2006 have a term of ten years, stock-based awards granted from fiscal 2006 to fiscal 2012 generally have a term of seven years, and starting in fiscal 2013 stock-based awards granted generally have a term of ten years.
83
At the discretion of the Board of Directors or the Compensation Committee, the Company has granted stock options to purchase common stock at an exercise price not less than 100 percent of the fair market value of the Company’s common stock on the date of grant, restricted stock awards, restricted stock units and performance awards to executive officers and other key salaried employees. Stock options have also been granted to the Company’s non-employee directors. Prior to fiscal 2013, stock options vested over four years and starting in fiscal 2013, stock options vest over three years. The vesting of restricted stock awards and restricted stock units is determined at the discretion of the Board of Directors or the Compensation Committee. The restrictions on the restricted stock awards and restricted stock units generally lapse between one and five years from the date of grant and the expense is recognized over the period during which the restrictions expire.
As of February 27, 2016, there were 18 shares available for future issuance of stock-based awards under the 2012 Stock Plan. Common stock has been delivered out of treasury stock or newly issued shares upon the exercise or vesting of stock-based awards. The provisions of future stock-based awards may change at the discretion of the Board of Directors or the Compensation Committee.
On March 20, 2013, the Company completed the Tender Offer and issued common stock to Symphony Investors, which the Company’s Board of Directors deemed to be a change-in-control for purposes of the Company’s outstanding stock-based awards, immediately accelerating the vesting of certain stock-based awards. The Company recognized $9 of accelerated stock-based compensation charges in Selling and administrative expenses in fiscal 2014 as a result of the deemed change-in-control, comprised of $5 from long-term incentive programs, $3 from restricted stock awards and $1 from stock options.
Stock Options
Stock options granted, exercised and outstanding consisted of the following:
Shares Under Option (In thousands) | Weighted Average Exercise Price | Weighted Average Remaining Contractual Term (In years) | Aggregate Intrinsic Value (In thousands) | |||||||||
Outstanding, February 23, 2013 | 22,246 | $ | 19.20 | 4.63 | $ | 10,402 | ||||||
Granted | 10,083 | 6.58 | ||||||||||
Exercised | (3,121 | ) | 2.29 | |||||||||
Canceled and forfeited | (5,873 | ) | 23.70 | |||||||||
Outstanding, February 22, 2014 | 23,335 | 14.87 | 5.41 | $ | 15,982 | |||||||
Granted | 5,022 | 7.54 | ||||||||||
Exercised | (1,944 | ) | 3.71 | |||||||||
Canceled and forfeited | (5,533 | ) | 30.68 | |||||||||
Outstanding, February 28, 2015 | 20,880 | 9.98 | 6.55 | $ | 61,073 | |||||||
Granted | 5,531 | 7.44 | ||||||||||
Exercised | (1,723 | ) | 5.84 | |||||||||
Canceled and forfeited | (3,336 | ) | 24.94 | |||||||||
Outstanding, February 27, 2016 | 21,352 | $ | 7.37 | 5.93 | $ | 6,827 | ||||||
Vested and expected to vest in the future as of February 27, 2016 | 20,089 | $ | 7.39 | 5.77 | $ | 6,558 | ||||||
Exercisable as of February 27, 2016 | 10,888 | $ | 7.48 | 4.28 | $ | 5,722 | ||||||
For the Company's annual grant made in the first quarter of fiscal 2016, 2015 and 2014, the Company granted 4, 5 and 9, respectively, of non-qualified stock options to certain employees under the Company’s 2012 Stock Plan with a weighted average grant date fair value of $3.67, $3.28 and $2.78 per share, respectively. These stock options vest over a period of three years, and were awarded as part of a broad-based employee incentive initiative designed to retain and motivate employees across the Company.
In fiscal 2016, the Company's Board of Directors granted 2 stock options to the Company's Chief Executive Officer. The stock options have a grant date fair value of $2.08 per share and vest over three years.
The Company used the Black Scholes option pricing model to estimate the fair value of the options at grant date based upon the following assumptions:
84
2016 | 2015 | 2014 | ||||||
Dividend yield | — | % | — | % | — | % | ||
Volatility rate | 49.0 – 56.5% | 50.8 – 53.2% | 49.3 – 51.3% | |||||
Risk-free interest rate | 1.2 – 1.4% | 1.2 – 1.6% | 0.6 – 1.0% | |||||
Expected option life | 4.0 – 4.0 years | 4.0 – 5.0 years | 4.0 – 6.0 years | |||||
Restricted Stock
Restricted stock awards and restricted stock unit activity consisted of the following:
Restricted Stock Units (In thousands) | Restricted Stock Awards (In thousands) | Weighted Average Grant Date Fair Value(1) | |||||||
Outstanding, February 23, 2013 | 972 | 1,443 | $ | 7.83 | |||||
Granted | 296 | 491 | 6.98 | ||||||
Lapsed | (1,268 | ) | (967 | ) | 6.23 | ||||
Canceled and forfeited | — | (30 | ) | 6.08 | |||||
Outstanding, February 22, 2014 | — | 937 | 9.09 | ||||||
Granted | 2,274 | 18 | 7.11 | ||||||
Lapsed | (133 | ) | (417 | ) | 6.54 | ||||
Canceled and forfeited | (90 | ) | (2 | ) | 6.09 | ||||
Outstanding, February 28, 2015 | 2,051 | 536 | 11.02 | ||||||
Granted | 65 | 2,339 | 8.74 | ||||||
Lapsed | (742 | ) | (456 | ) | 6.82 | ||||
Canceled and forfeited | (125 | ) | (239 | ) | 8.79 | ||||
Outstanding, February 27, 2016 | 1,249 | 2,180 | $ | 8.68 | |||||
(1) Weighted average grant date fair value is only used for restricted stock awards.
In fiscal 2016, the Company granted 2 shares of restricted stock awards to certain employees under the Company's 2012 Stock Plan. The restricted stock awards vest over a three year period from the date of the grant.
In fiscal 2015, the Company granted 2 shares of restricted stock units to certain employees under the Company's 2012 Stock Plan. The restricted stock awards vest over a three year period from the date of the grant.
Stock-Based Compensation Expense
The components of pre-tax stock-based compensation expense are included primarily in Selling and administrative expenses in the Consolidated Statements of Operations. The expense recognized and related tax benefits were as follows:
2016 | 2015 | 2014 | |||||||||
Stock-based compensation | $ | 25 | $ | 23 | $ | 22 | |||||
Income tax benefits | (10 | ) | (9 | ) | (8 | ) | |||||
Stock-based compensation, net of tax | $ | 15 | $ | 14 | $ | 14 | |||||
The Company realized excess tax shortfalls of $1, $1 and $1 on the exercise of stock-based awards in fiscal 2016, 2015 and 2014, respectively.
Unrecognized Stock-Based Compensation Expense
As of February 27, 2016, there was $31 of unrecognized compensation expense related to unvested stock-based awards granted under the Company’s stock plans. The expense is expected to be recognized over a weighted average remaining vesting period of approximately two years.
85
NOTE 11—BENEFIT PLANS
Substantially all employees of the Company are covered by various contributory and non-contributory pension, profit sharing or 401(k) plans. The Company’s primary defined benefit pension plan, the SUPERVALU INC. Retirement Plan (the "SUPERVALU Retirement Plan"), and certain supplemental executive retirement plans were closed to new participants and service crediting ended for all participants as of December 31, 2007. Pay increases were reflected in the amount of benefit earned in these plans until December 31, 2012. Most union employees participate in multiemployer retirement plans under collective bargaining agreements, unless the collective bargaining agreement provides for participation in plans sponsored by the Company. In addition to sponsoring both defined benefit and defined contribution pension plans, the Company provides healthcare and life insurance benefits for eligible retired employees under postretirement benefit plans. The Company also provides certain health and welfare benefits, including short-term and long-term disability benefits, to inactive disabled employees prior to retirement. The terms of the postretirement benefit plans vary based on employment history, age and date of retirement. For many retirees, the Company provides a fixed dollar contribution and retirees pay contributions to fund the remaining cost.
In fiscal 2016, the Company amended the SUPERVALU Retiree Benefit Plan which provides medical, prescription drug, dental and life benefits, to eliminate benefits provided by the plan for certain participants under a collective bargaining agreement. As a result of the plan amendment, certain SUPERVALU Retiree Benefit Plan obligations were re-measured using a discount rate of 4.25 percent and the MP-2015 mortality improvement scale. This re-measurement resulted in a $28 reduction of postretirement benefit obligations within Pension and other postretirement benefit obligations with a corresponding decrease to Accumulated other comprehensive loss.
The benefit obligation, fair value of plan assets and funded status of the defined benefit pension plans and other postretirement benefit plans consisted of the following:
Pension Benefits | Other Postretirement Benefits | ||||||||||||||
2016 | 2015 | 2016 | 2015 | ||||||||||||
Changes in Benefit Obligation | |||||||||||||||
Benefit obligation at beginning of year | $ | 2,849 | $ | 2,726 | $ | 82 | $ | 81 | |||||||
Plan amendment | — | — | (21 | ) | (5 | ) | |||||||||
Service cost | — | — | — | 1 | |||||||||||
Interest cost | 106 | 121 | 3 | 4 | |||||||||||
Actuarial (gain) loss | (175 | ) | 371 | (6 | ) | 5 | |||||||||
Settlements paid | (1 | ) | (272 | ) | — | — | |||||||||
Benefits paid | (115 | ) | (97 | ) | (4 | ) | (4 | ) | |||||||
Benefit obligation at end of year | 2,664 | 2,849 | 54 | 82 | |||||||||||
Changes in Plan Assets | |||||||||||||||
Fair value of plan assets at beginning of year | 2,317 | 2,261 | 4 | — | |||||||||||
Actual return on plan assets | (109 | ) | 260 | — | — | ||||||||||
Employer contributions | 27 | 165 | 15 | 4 | |||||||||||
Plan participants’ contributions | — | — | 2 | 3 | |||||||||||
Settlements paid | (1 | ) | (272 | ) | — | — | |||||||||
Benefits paid | (115 | ) | (97 | ) | (6 | ) | (7 | ) | |||||||
Other | — | — | — | 4 | |||||||||||
Fair value of plan assets at end of year | 2,119 | 2,317 | 15 | 4 | |||||||||||
Unfunded status at end of year | $ | (545 | ) | $ | (532 | ) | $ | (39 | ) | $ | (78 | ) | |||
For the defined benefit pension plans, the accumulated benefit obligation is equal to the projected benefit obligation.
86
Amounts recognized in the Consolidated Balance Sheets consist of the following:
Pension Benefits | Other Postretirement Benefits | ||||||||||||||
2016 | 2015 | 2016 | 2015 | ||||||||||||
Accrued vacation, compensation and benefits | $ | (2 | ) | $ | (2 | ) | $ | (4 | ) | $ | (6 | ) | |||
Pension and other postretirement benefit obligations | (543 | ) | (530 | ) | (35 | ) | (72 | ) | |||||||
Total | $ | (545 | ) | $ | (532 | ) | $ | (39 | ) | $ | (78 | ) | |||
Amounts recognized in Accumulated other comprehensive loss for the defined benefit pension and other postretirement benefit plans consist of the following:
Pension Benefits | Other Postretirement Benefits | ||||||||||||||
2016 | 2015 | 2016 | 2015 | ||||||||||||
Prior service benefit | $ | — | $ | — | $ | 50 | $ | 45 | |||||||
Net actuarial loss | (693 | ) | (696 | ) | (17 | ) | (28 | ) | |||||||
Total recognized in Accumulated other comprehensive loss | $ | (693 | ) | $ | (696 | ) | $ | 33 | $ | 17 | |||||
Total recognized in Accumulated other comprehensive loss, net of tax | $ | (438 | ) | $ | (432 | ) | $ | 20 | $ | 9 | |||||
Net periodic benefit cost (income) and other changes in plan assets and benefit obligations recognized in Other comprehensive income (loss) for defined benefit pension and other postretirement benefit plans consist of the following:
Pension Benefits | Other Postretirement Benefits | ||||||||||||||||||||||
2016 | 2015 | 2014 | 2016 | 2015 | 2014 | ||||||||||||||||||
Net Periodic Benefit Cost (Income) | |||||||||||||||||||||||
Service cost | $ | — | $ | — | $ | — | $ | — | $ | 1 | $ | 2 | |||||||||||
Interest cost | 106 | 121 | 121 | 3 | 4 | 4 | |||||||||||||||||
Expected return on plan assets | (142 | ) | (149 | ) | (141 | ) | — | — | — | ||||||||||||||
Amortization of prior service benefit | — | — | — | (15 | ) | (16 | ) | (13 | ) | ||||||||||||||
Amortization of net actuarial loss | 79 | 68 | 101 | 3 | 3 | 5 | |||||||||||||||||
Settlement | — | 64 | — | — | — | — | |||||||||||||||||
Net periodic benefit cost (income) | 43 | 104 | 81 | (9 | ) | (8 | ) | (2 | ) | ||||||||||||||
Other Changes in Plan Assets and Benefit Obligations Recognized in Other Comprehensive Income (Loss) | |||||||||||||||||||||||
Prior service benefit | — | — | — | (21 | ) | (5 | ) | (11 | ) | ||||||||||||||
Amortization of prior service benefit | — | — | — | 15 | 16 | 12 | |||||||||||||||||
Net actuarial loss (gain) | 76 | 195 | (259 | ) | (7 | ) | 6 | (16 | ) | ||||||||||||||
Amortization of net actuarial loss | (79 | ) | (66 | ) | (101 | ) | (3 | ) | (3 | ) | (5 | ) | |||||||||||
Total expense (benefit) recognized in Other comprehensive income (loss) | (3 | ) | 129 | (360 | ) | (16 | ) | 14 | (20 | ) | |||||||||||||
Total expense (benefit) recognized in net periodic benefit cost (income) and Other comprehensive income (loss) | $ | 40 | $ | 233 | $ | (279 | ) | $ | (25 | ) | $ | 6 | $ | (22 | ) | ||||||||
The estimated net actuarial loss that will be amortized from Accumulated other comprehensive loss into net periodic benefit cost for the defined benefit pension plans during fiscal 2017 is $45. The estimated net amount of prior service benefit and net actuarial loss for the postretirement benefit plans that will be amortized from Accumulated other comprehensive loss into net periodic benefit cost during fiscal 2017 is $13.
87
Assumptions
Weighted average assumptions used to determine benefit obligations and net periodic benefit cost consisted of the following:
2016 | 2015 | 2014 | ||||||
Benefit obligation assumptions: | ||||||||
Discount rate | 4.16 – 3.95% | 3.80 | % | 4.65 | % | |||
Rate of compensation increase | — | % | — | % | — | % | ||
Net periodic benefit cost assumptions:(1) | ||||||||
Discount rate | 3.80 | % | 4.65 – 4.10% | 4.25 | % | |||
Rate of compensation increase | — | % | — | % | 2.00 | % | ||
Expected return on plan assets(2) | 6.50 | % | 7.00 – 6.50% | 7.00 | % | |||
(1) | For fiscal 2016 and prior, net periodic benefit cost is measured using weighted average assumptions as of the beginning of each year. |
(2) | Expected return on plan assets is estimated by utilizing forward-looking, long-term return, risk and correlation assumptions developed and updated annually by the Company. These assumptions are weighted by the actual or target allocation to each underlying asset class represented in the pension plan asset portfolio. The Company also assesses the expected long-term return on plan assets assumption by comparison to long-term historical performance on an asset class to ensure the assumption is reasonable. Long-term trends are also evaluated relative to market factors such as inflation, interest rates, and fiscal and monetary policies in order to assess the capital market assumptions. |
The Company reviews and selects the discount rate to be used in connection with measuring its pension and other postretirement benefit obligations annually. In determining the discount rate, the Company uses the yield on corporate bonds (rated AA or better) that coincides with the cash flows of the plans’ estimated benefit payouts. The model uses a yield curve approach to discount each cash flow of the liability stream at an interest rate specifically applicable to the timing of each respective cash flow. The model totals the present values of all cash flows and calculates the equivalent weighted average discount rate by imputing the singular interest rate that equates the total present value with the stream of future cash flows. This resulting weighted average discount rate is then used in evaluating the final discount rate to be used by the Company.
Effective for fiscal 2017, the Company adopted an alternative approach for determining the interest and service cost components of net periodic benefit cost for defined benefit pension and other postretirement benefit plans, the "full yield curve" approach. Under this method, the discount rate assumption used in the interest and service cost components of net periodic benefit cost was built through applying the specific spot rates along the yield curve used in the determination of the benefit obligation described above, to the relevant projected future cash flows of the Company's pension and other postretirement benefit plans. Prior to fiscal 2017, including for the current fiscal 2016 year being reported, the interest and service cost components of pension expense were estimated using a single weighted-average discount rate derived from the yield curve used to measure the projected benefit obligation at the beginning of the period.
The Company adopted the alternative approach to improve the correlation between projected benefit cash flows and the corresponding yield curve spot rates and to provide a more precise measurement of interest and service costs. This change does not affect the measurement of total benefit obligation. The Company has concluded that the application of the full yield curve approach is a change in estimate and, accordingly, will recognize the effect prospectively beginning in fiscal 2017. The impact of the change in estimate is an anticipated reduction of the interest and service cost components within net periodic benefit cost in fiscal 2017 by approximately $22 for the defined benefit pension plans and less than $1 for postretirement benefit plans compared to the prior year approach.
During fiscal 2016, the Retirement Plans Experience Committee of the Society of Actuaries ("RPEC") issued an update to Mortality Improvement Scale MP-2014, which was released in October 2014, named MP-2015. This updated scale was created using two additional years of historical data and the same RPEC 2014 model that was used to produce MP-2014. The Company used MP-2015 to calculate its fiscal 2016 projected benefit obligation.
During fiscal 2015, the Company converted to the RP-2014 Aggregate mortality table for calculating the pension and other postretirement obligations and the annual expense. This change increased the projected benefit obligation by $182 and the accumulated postretirement benefit obligation by $6.
The Company calculates its expected return on plan assets by using the market related value of plan assets. The market related value of plan assets is determined by adjusting the actual fair value of plan assets for unrecognized gains or losses on plan assets. Unrecognized gains or losses represent the difference between actual returns and expected returns on plan assets for each fiscal year and are recognized by the Company evenly over a three year period. Since the market related value of assets
88
recognizes gains or losses over a three year period, the future value of assets will be impacted as previously deferred gains or losses are recognized.
For those retirees whose health plans provide for variable employer contributions, the assumed healthcare cost trend rate used in measuring the accumulated postretirement benefit obligation before age 65 was 7.00 percent as of February 27, 2016. The assumed healthcare cost trend rate for retirees before age 65 will decrease by 0.25 percent for each year through fiscal 2026, until it reaches the ultimate trend rate of 4.50 percent. For those retirees whose health plans provide for variable employer contributions, the assumed healthcare cost trend rate used in measuring the accumulated postretirement benefit obligation after age 65 was 7.80 percent as of February 27, 2016. The assumed healthcare cost trend rate for retirees after age 65 will decrease through fiscal 2026, until it reaches the ultimate trend rate of 4.50 percent. For those retirees whose health plans provide for a fixed employer contribution rate, a healthcare cost trend is not applicable. The healthcare cost trend rate assumption would have the following impact on the amounts reported: a 100 basis point increase in the trend rate would impact the Company’s service and interest cost by less than $1 for fiscal 2016; a 100 basis point decrease in the trend rate would decrease the Company’s accumulated postretirement benefit obligation as of the end of fiscal 2016 by approximately $3; and a 100 basis point increase would increase the Company’s accumulated postretirement benefit obligation by approximately $3.
Pension Plan Assets
Plan assets are held in a master trust and invested in separately managed accounts and other commingled investment vehicles holding domestic and international equity securities, domestic fixed income securities and other investment classes. The Company employs a total return approach whereby a diversified mix of asset class investments is used to maximize the long-term return of plan assets for an acceptable level of risk. Alternative investments are also used to enhance risk-adjusted long-term returns while improving portfolio diversification. Risk is managed through diversification across asset classes, multiple investment manager portfolios and both general and portfolio-specific investment guidelines. Risk tolerance is established through careful consideration of the plan liabilities, plan funded status and the Company’s financial condition. This asset allocation policy mix is reviewed annually and actual versus target allocations are monitored regularly and rebalanced on an as-needed basis. Plan assets are invested using a combination of active and passive investment strategies. Passive, or “indexed” strategies, attempt to mimic rather than exceed the investment performance of a market benchmark. The plan’s active investment strategies employ multiple investment management firms. Managers within each asset class cover a range of investment styles and approaches and are combined in a way that controls for capitalization, and style biases (equities) and interest rate exposures (fixed income) versus benchmark indices. Monitoring activities to evaluate performance against targets and measure investment risk take place on an ongoing basis through annual liability measurements, periodic asset/liability studies and quarterly investment portfolio reviews.
The asset allocation targets and the actual allocation of pension plan assets are as follows:
Asset Category | Target | 2016 | 2015 | |||||
Domestic equity | 22.2 | % | 22.4 | % | 24.8 | % | ||
International equity | 11.1 | % | 11.1 | % | 11.3 | % | ||
Private equity | 6.6 | % | 6.6 | % | 6.2 | % | ||
Fixed income | 47.5 | % | 47.3 | % | 48.1 | % | ||
Real estate | 12.6 | % | 12.6 | % | 9.6 | % | ||
Total | 100.0 | % | 100.0 | % | 100.0 | % | ||
The following is a description of the valuation methodologies used for investments measured at fair value:
Common stock—Valued at the closing price reported in the active market in which the individual securities are traded.
Common collective trusts—Valued at net asset value (“NAV”), which is based on the fair value of the underlying securities owned by the fund divided by the number of shares outstanding. The NAV unit price is quoted on a private market that is not active. However, the NAV is based on the fair value of the underlying securities within the fund, which are traded on an active market, and valued at the closing price reported on the active market on which those individual securities are traded.
Corporate bonds—Valued based on yields currently available on comparable securities of issuers with similar credit ratings. When quoted prices are not available for identical or similar bonds, the fair value is based upon an industry valuation model, which maximizes observable inputs.
Government securities—Certain government securities are valued at the closing price reported in the active market in which the security is traded. Other government securities are valued based on yields currently available on comparable securities of issuers with similar credit ratings.
89
Mortgage backed securities—Valued based on yields currently available on comparable securities of issuers with similar credit ratings. When quoted prices are not available for identical or similar securities, the fair value is based upon an industry valuation model, which maximizes observable inputs.
Private equity and real estate partnerships—Valued using the most recent general partner statement of fair value, updated for any subsequent partnership interests’ cash flows or expected changes in fair value.
Mutual funds—Mutual funds are valued at the closing price reported in the active market in which the individual securities are traded.
Synthetic guaranteed investment contract—Valued by discounting the related cash flows based on current yields of similar instruments with comparable durations considering the credit-worthiness of the issuer.
Other—Valued under an approach that maximizes observable inputs, such as gathering consensus data from the market participant’s best estimate of mid-market pricing for actual trades or positions held.
The valuation methods described above may produce a fair value calculation that may not be indicative of net realizable value or reflective of future fair values. Furthermore, while the Company believes its valuation methods are appropriate and consistent with other market participants, the use of different methodologies or assumptions to determine the fair value of certain financial instruments could result in a different fair value measurement.
The fair value of assets of the Company’s defined benefit pension plans held in a master trust as of February 27, 2016, by asset category, consisted of the following:
Level 1 | Level 2 | Level 3 | Total | ||||||||||||
Common stock | $ | 432 | $ | — | $ | — | $ | 432 | |||||||
Common collective trusts—fixed income | — | 554 | — | 554 | |||||||||||
Common collective trusts—equity | — | 212 | — | 212 | |||||||||||
Government securities | 49 | 114 | — | 163 | |||||||||||
Mutual funds | 56 | 179 | — | 235 | |||||||||||
Corporate bonds | — | 201 | — | 201 | |||||||||||
Real estate partnerships | — | — | 164 | 164 | |||||||||||
Private equity | — | — | 141 | 141 | |||||||||||
Mortgage-backed securities | — | 14 | — | 14 | |||||||||||
Other | — | 3 | — | 3 | |||||||||||
Total plan assets at fair value | $ | 537 | $ | 1,277 | $ | 305 | $ | 2,119 | |||||||
The fair value of assets of the Company’s defined benefit pension plans held in a master trust as of February 28, 2015, by asset category, consisted of the following:
Level 1 | Level 2 | Level 3 | Total | ||||||||||||
Common stock | $ | 489 | $ | — | $ | — | $ | 489 | |||||||
Common collective trusts—fixed income | — | 259 | — | 259 | |||||||||||
Common collective trusts—equity | — | 336 | — | 336 | |||||||||||
Government securities | 95 | 130 | — | 225 | |||||||||||
Mutual funds | 53 | 286 | — | 339 | |||||||||||
Corporate bonds | — | 292 | — | 292 | |||||||||||
Real estate partnerships | — | — | 162 | 162 | |||||||||||
Private equity | — | — | 144 | 144 | |||||||||||
Mortgage-backed securities | — | 17 | — | 17 | |||||||||||
Other | 48 | 6 | — | 54 | |||||||||||
Total plan assets at fair value | $ | 685 | $ | 1,326 | $ | 306 | $ | 2,317 | |||||||
90
The following is a summary of changes in the fair value of Level 3 investments for 2016 and 2015:
Real Estate Partnerships | Private Equity | ||||||
Ending balance, February 22, 2014 | $ | 149 | $ | 125 | |||
Purchases | 10 | 36 | |||||
Sales | (7 | ) | (21 | ) | |||
Unrealized gains | 10 | 4 | |||||
Realized gains and losses | — | — | |||||
Ending balance, February 28, 2015 | 162 | 144 | |||||
Purchases | 7 | 25 | |||||
Sales | (18 | ) | (18 | ) | |||
Unrealized gains | 9 | (10 | ) | ||||
Realized gains and losses | 4 | — | |||||
Ending balance, February 27, 2016 | $ | 164 | $ | 141 | |||
Contributions
In August 2014, the Highway and Transportation Funding Act of 2014, which included an extension of pension funding interest rate relief, was signed into law. The Highway and Transportation Funding Act includes a provision for interest rate stabilization for defined benefit employee pension plans. As a result of this stabilization provision, the Company's required pension contributions to the SUPERVALU Retirement Plan decreased significantly in fiscal 2016 compared to fiscal 2015 and the Company expects that to continue for the next several years. The Company expects to contribute approximately $30 to $35 to its defined benefit pension plans and postretirement benefit plans in fiscal 2017.
The Company funds its defined benefit pension plans based on the minimum contribution required under the Employee Retirement Income Security Act of 1974, as amended, the Pension Protection Act of 2006 and other applicable laws, as determined by the Company’s external actuarial consultant, and additional contributions made at the Company's discretion. The Company had agreed to make $100 in aggregate contributions to the SUPERVALU Retirement Plan in excess of the minimum required contributions pursuant to a term sheet entered into with the Pension Benefit Guarantee Corporation (the “PBGC”) in connection with the sale of NAI. On September 11, 2014, the Company, AB Acquisition and the PBGC amended the term sheet. Pursuant to that amendment, the Company made excess contributions of $47 to the SUPERVALU Retirement Plan and the Company no longer has any obligations or restrictions under the term sheet. The Company will recognize contributions in accordance with applicable regulations, with consideration given to recognition for the earliest plan year permitted.
At the Company’s discretion, additional funds may be contributed to the pension plan. The Company may accelerate contributions or undertake contributions in excess of the minimum requirements from time to time subject to the availability of cash in excess of operating and financing needs or other factors as may be applicable. The Company assesses the relative attractiveness of the use of cash including such factors as expected return on assets, discount rates, cost of debt, reducing or eliminating required PBGC variable rate premiums or the ability to achieve exemption from participant notices of underfunding.
Lump Sum Pension Settlement
During fiscal 2015, the Company made lump sum settlement payments to certain deferred vested pension plan participants under a lump sum payment option window. The payments were equal to the present value of the participant’s pension benefits, and were made to certain former employees who were deferred vested participants in the SUPERVALU Retirement Plan, who had not yet begun receiving monthly pension benefit payments and who elected to participate in the lump sum payment option window. In fiscal 2015, the SUPERVALU Retirement Plan made lump sum settlement payments of approximately $272. The lump sum settlement payments resulted in a non-cash pension settlement charge of $64 from the acceleration of a portion of the accumulated unrecognized actuarial loss. As a result of the lump sum settlements, the SUPERVALU Retirement Plan assets and liabilities were re-measured at November 29, 2014 using a discount rate of 4.1 percent, an expected rate of return on plan assets of 6.5 percent and the RP-2014 Generational Mortality Table. The November 29, 2014 re-measurement resulted in an increase to Accumulated other comprehensive loss of $200 pre-tax ($141 after-tax) and a corresponding decrease to the SUPERVALU Retirement Plan's funded status.
91
Estimated Future Benefit Payments
The estimated future benefit payments to be made from the Company’s defined benefit pension and other postretirement benefit plans, which reflect expected future service, are as follows:
Fiscal Year | Pension Benefits | Other Postretirement Benefits | |||||
2017 | $ | 154 | $ | 4 | |||
2018 | 135 | 4 | |||||
2019 | 140 | 4 | |||||
2020 | 148 | 4 | |||||
2021 | 158 | 4 | |||||
Years 2022-2026 | 843 | 20 | |||||
Defined Contribution Plans
The Company sponsors defined contribution and profit sharing plans pursuant to Section 401(k) of the Internal Revenue Code. Employees may contribute a portion of their eligible compensation to the plans on a pre-tax basis. The Company matches a portion of employee contributions by contributing cash into the investment options selected by the employees. The total amount contributed by the Company to the plans is determined by plan provisions or at the discretion of the Company. Total employer contribution expenses for these plans were $8, $16 and $11 for fiscal 2016, 2015 and 2014, respectively. Matching contributions were reduced or eliminated in January 2013 for most employees. The Company adopted and made a discretionary match for fiscal 2015 for employees who had their matching contributions eliminated. There were no discretionary matches made in fiscal 2016. Since June 2014, plan investment options do not include shares of the Company's common stock.
Post-Employment Benefits
The Company recognizes an obligation for benefits provided to former or inactive employees. The Company is self-insured for certain disability plan programs, which comprise the primary benefits paid to inactive employees prior to retirement.
Amounts recognized in the Consolidated Balance Sheets consisted of the following:
Post-Employment Benefits | ||||||||
2016 | 2015 | |||||||
Accrued vacation, compensation and benefits | $ | 5 | $ | 8 | ||||
Other long-term liabilities | 8 | 10 | ||||||
Total | $ | 13 | $ | 18 | ||||
Multiemployer Plans
The Company contributes to various multiemployer pension plans under collective bargaining agreements, primarily defined benefit pension plans. These multiemployer plans generally provide retirement benefits to participants based on their service to contributing employers. The benefits are paid from assets held in trust for that purpose. Plan trustees typically are responsible for determining the level of benefits to be provided to participants as well as the investment of the assets and plan administration. Trustees are appointed in equal number by employers and the unions that are parties to the collective bargaining agreement.
Expense is recognized in connection with these plans as contributions are funded, in accordance with U.S. generally accepted accounting standards. The Company contributed $43, $39 and $39 to these plans for fiscal years 2016, 2015 and 2014, respectively. The risks of participating in these multiemployer plans are different from the risks associated with single-employer plans in the following respects:
a. | Assets contributed to the multiemployer plan by one employer are held in trust and may be used to provide benefits to employees of other participating employers. |
b. | If a participating employer stops contributing to the plan, the unfunded obligations of the plan may be borne by the remaining participating employers. |
c. | If the Company chooses to stop participating in some multiemployer plans, or makes market exits or store closures or otherwise has participation in the plan drop below certain levels, the Company may be required to pay those plans an amount based on the underfunded status of the plan, referred to as a withdrawal liability. |
92
The Company’s participation in these plans is outlined in the table below. The EIN-Pension Plan Number column provides the Employer Identification Number (“EIN”) and the three-digit plan number, if applicable. Unless otherwise noted, the most recent Pension Protection Act (“PPA”) zone status available in 2016 and 2015 relates to the plans’ two most recent fiscal year-ends. The zone status is based on information that the Company received from the plan and is certified by each plan’s actuary. Among other factors, red zone status plans are generally less than 65 percent funded and are considered in critical status, plans in yellow zone status are less than 80 percent funded and are considered in endangered or seriously endangered status, and green zone plans are at least 80 percent funded. The FIP/RP Status Pending/Implemented column indicates plans for which a funding improvement plan (“FIP”) or a rehabilitation plan (“RP”) is either pending or has been implemented by the trustees of each plan.
Certain plans have been aggregated in the All Other Multiemployer Pension Plans line in the following table, as the contributions to each of these plans are not individually material. None of the Company’s collective bargaining agreements require that a minimum contribution be made to these plans. Multiemployer pension plan contributions and participants were generally comparable for fiscal 2016, 2015 and 2014.
At the date the financial statements were issued, Forms 5500 were generally not available for the plan years ending in 2015.
The following table contains information about the Company’s multiemployer plans:
EIN—Pension Plan Number | Plan Month/Day End Date | Pension Protection Act Zone Status | FIP/RP Status Pending/ Implemented | Contributions | Surcharges Imposed(1) | Amortization Provisions | |||||||||||||||||||
Pension Fund | 2016 | 2015 | 2016 | 2015 | 2014 | ||||||||||||||||||||
Minneapolis Food Distributing Industry Pension Plan | 416047047-001 | 12/31 | Green | Green | Implemented | $ | 10 | $ | 10 | $ | 9 | No | Yes | ||||||||||||
Central States, Southeast and Southwest Areas Pension Fund | 366044243-001 | 12/31 | Red | Red | Implemented | 8 | 8 | 8 | No | No | |||||||||||||||
Minneapolis Retail Meat Cutters and Food Handlers Pension Fund | 410905139-001 | 2/28 | Green | Yellow | Implemented | 9 | 7 | 8 | No | No | |||||||||||||||
UFCW Unions and Participating Employers Pension Fund | 526117495-002 | 12/31 | Red | Red | Implemented | 5 | 4 | 4 | Yes | No | |||||||||||||||
Western Conference of Teamsters Pension Plan | 916145047-001 | 12/31 | Green | Green | No | 4 | 4 | 3 | No | No | |||||||||||||||
UFCW Union Local 655 Food Employers Joint Pension Plan | 436058365-001 | 12/31 | Green | Green | No | 2 | 2 | 2 | No | No | |||||||||||||||
UFCW Unions and Employers Pension Plan | 396069053-001 | 10/31 | Red | Red | Implemented | 2 | 1 | 2 | Yes | No | |||||||||||||||
All Other Multiemployer Pension Plans(2) | 3 | 3 | 3 | ||||||||||||||||||||||
Total | $ | 43 | $ | 39 | $ | 39 | |||||||||||||||||||
(1) | PPA surcharges are 5 percent or 10 percent of eligible contributions and may not apply to all collective bargaining agreements or total contributions to each plan. |
(2) | All Other Multiemployer Pension Plans includes 11 plans, none of which is individually significant when considering the Company's contributions to the plan, severity of the underfunded status or other factors. |
93
The following table describes the expiration of the Company’s collective bargaining agreements associated with the significant multiemployer plans in which the Company participates:
Most Significant Collective Bargaining Agreement | |||||||||||
Pension Fund | Range of Collective Bargaining Agreement Expiration Dates | Total Collective Bargaining Agreements | Expiration Date | % of Associates under Collective Bargaining Agreement (1) | Over 5% Contribution 2015 | ||||||
Minneapolis Food Distributing Industry Pension Plan | 6/1/2015 – 5/31/2018 | 1 | 5/31/2018 | 100.0 | % | Yes | |||||
Central States, Southeast and Southwest Areas Pension Fund | 6/1/2011 – 8/31/2017 | 10 | 6/14/2017 | 27.5 | % | No | |||||
Minneapolis Retail Meat Cutters and Food Handlers Pension Fund | 3/6/2016 – 3/4/2018 | 1 | 3/4/2018 | 100.0 | % | Yes | |||||
UFCW Unions and Participating Employers Pension Plan | 7/13/2014 – 7/8/2017 | 2 | 7/8/2017 | 68.0 | % | Yes | |||||
Western Conference of Teamsters Pension Plan | 6/15/2011 – 7/15/2017 | 8 | 7/15/2017 | 44.8 | % | No | |||||
UFCW Union Local 655 Food Employers Joint Pension Plan | 5/13/2013 – 5/8/2016 | 1 | 5/8/2016 | 100.0 | % | Yes | |||||
UFCW Unions and Employers Pension Plan | 4/6/2014 – 4/2/2016 | 2 | 4/2/2016 | 76.5 | % | Yes | |||||
(1) | Company participating employees in the most significant collective bargaining agreement as a percent of all Company employees participating in the respective fund. |
Multiemployer Postretirement Benefit Plans Other than Pensions
The Company also makes contributions to multiemployer health and welfare plans in amounts set forth in the related collective bargaining agreements. These plans provide medical, dental, pharmacy, vision and other ancillary benefits to active employees and retirees as determined by the trustees of each plan. The vast majority of the Company’s contributions benefit active employees and as such, may not constitute contributions to a postretirement benefit plan. However, the Company is unable to separate contribution amounts to postretirement benefit plans from contribution amounts paid to benefit active employees.
The Company contributed $95, $89 and $87 for fiscal 2016, 2015 and 2014, respectively, to multiemployer health and welfare plans. If healthcare provisions within these plans cannot be renegotiated in a manner that reduces the prospective healthcare cost as the Company intends, the Company’s Selling and administrative expenses could increase in the future.
Collective Bargaining Agreements
As of February 27, 2016, the Company had approximately 38,000 employees. Approximately 16,000 employees are covered by 55 collective bargaining agreements. During fiscal 2016, nine collective bargaining agreements covering approximately 1,600 employees were renegotiated and three collective bargaining agreements covering approximately 110 employees expired without their terms being renegotiated. Also, four collective bargaining agreements covering approximately 700 employees expired prior to fiscal 2016 without their terms being renegotiated. Negotiations are expected to continue with the bargaining units representing the employees subject to those agreements. During fiscal 2017, 24 collective bargaining agreements covering approximately 8,400 employees are scheduled to expire.
94
NOTE 12—NET EARNINGS PER SHARE
The following table reflects the calculation of basic and diluted net earnings per share:
2016 | 2015 | 2014 | |||||||||
Net earnings from continuing operations | $ | 178 | $ | 127 | $ | 13 | |||||
Less net earnings attributable to noncontrolling interests | (8 | ) | (7 | ) | (7 | ) | |||||
Net earnings from continuing operations attributable to SUPERVALU INC. | 170 | 120 | 6 | ||||||||
Income from discontinued operations, net of tax | 8 | 72 | 176 | ||||||||
Net earnings attributable to SUPERVALU INC. | $ | 178 | $ | 192 | $ | 182 | |||||
Weighted average number of shares outstanding—basic | 263 | 260 | 255 | ||||||||
Dilutive impact of stock-based awards | 5 | 4 | 3 | ||||||||
Weighted average number of shares outstanding—diluted | 268 | 264 | 258 | ||||||||
Basic net earnings per share attributable to SUPERVALU INC.: | |||||||||||
Continuing operations | $ | 0.64 | $ | 0.46 | $ | 0.02 | |||||
Discontinued operations | $ | 0.03 | $ | 0.28 | $ | 0.69 | |||||
Basic net earnings per share | $ | 0.68 | $ | 0.74 | $ | 0.71 | |||||
Diluted net earnings per share attributable to SUPERVALU INC.: | |||||||||||
Continuing operations | $ | 0.63 | $ | 0.45 | $ | 0.02 | |||||
Discontinued operations | $ | 0.03 | $ | 0.27 | $ | 0.68 | |||||
Diluted net earnings per share | $ | 0.66 | $ | 0.73 | $ | 0.70 | |||||
Stock-based awards of 10, 10 and 18 that were outstanding during fiscal 2016, 2015 and 2014, respectively, were excluded from the calculation of Net earnings from continuing operations per share—diluted, Net earnings from discontinued operations per share—diluted and Net earnings per share—diluted for the periods because their inclusion would be antidilutive.
NOTE 13—COMPREHENSIVE INCOME (LOSS) AND ACCUMULATED COMPREHENSIVE LOSS
The Company reports comprehensive income in the Consolidated Statements of Comprehensive Income. Comprehensive income includes all changes in stockholders’ deficit during the reporting period, other than those resulting from investments by and distributions to stockholders. The Company’s comprehensive income is calculated as net earnings (loss) including noncontrolling interests, plus or minus adjustments for pension and other postretirement benefit obligations, net of tax, less comprehensive income attributable to noncontrolling interests.
Accumulated other comprehensive loss represents the cumulative balance of other comprehensive income (loss), net of tax, as of the end of the reporting period and relates to pension and other postretirement benefit obligation adjustments, net of tax, and interest rate swaps designated as hedges, net of tax. Changes in Accumulated other comprehensive loss by component are as follows:
95
Benefit Plans | Interest Rate Swap | Total | |||||||||
February 23, 2013 accumulated other comprehensive loss | $ | (612 | ) | $ | — | $ | (612 | ) | |||
Other comprehensive income before reclassifications | 202 | — | 202 | ||||||||
Amortization of amounts included in net periodic benefit cost(1) | 55 | — | 55 | ||||||||
Net Other comprehensive income | 257 | — | 257 | ||||||||
Divestiture of NAI pension plan | 48 | — | 48 | ||||||||
February 22, 2014 accumulated other comprehensive loss | (307 | ) | — | (307 | ) | ||||||
Other comprehensive loss before reclassifications | (188 | ) | — | (188 | ) | ||||||
Pension settlement charge(2) | 39 | — | 39 | ||||||||
Amortization of amounts included in net periodic benefit cost(1) | 33 | — | 33 | ||||||||
Net Other comprehensive loss | (116 | ) | — | (116 | ) | ||||||
February 28, 2015 accumulated other comprehensive loss | (423 | ) | — | (423 | ) | ||||||
Other comprehensive loss before reclassifications | (37 | ) | (4 | ) | (41 | ) | |||||
Amortization of amounts included in net periodic benefit cost(1) | 42 | — | 42 | ||||||||
Net Other comprehensive income (loss) | 5 | (4 | ) | 1 | |||||||
February 27, 2016 accumulated other comprehensive loss | $ | (418 | ) | $ | (4 | ) | $ | (422 | ) | ||
(1) | Amortization of amounts included in net periodic benefit cost includes amortization of prior service benefit and amortization of net actuarial loss as reflected in Note 11—Benefit Plans. |
(2) | Refer to Note 11—Benefit Plans for additional information on the Company's fiscal 2015 pension settlement charge. |
Upon completion of the sale of NAI in the first quarter of fiscal 2014, the Company disposed of approximately $48 of Accumulated other comprehensive loss, which was a component of Stockholders’ deficit in the Consolidated Balance Sheet as of February 23, 2013, due to NAI’s assumption of a defined benefit pension plan established and operated under NAI.
Accumulated other comprehensive loss related to the Company's interest rate swap was insignificant as of February 28, 2015.
Items reclassified out of pension and postretirement benefit plan accumulated other comprehensive loss had the following impact on the Consolidated Statements of Operations:
2016 | 2015 | 2014 | Affected Line Item on Consolidated Statements of Operations | ||||||||||
Pension and postretirement benefit plan obligations: | |||||||||||||
Amortization of amounts included in net periodic benefit expense(1) | $ | 59 | $ | 43 | $ | 82 | Selling and administrative expenses | ||||||
Amortization of amounts included in net periodic benefit expense(1) | 8 | 11 | 11 | Cost of sales | |||||||||
Pension settlement charge | — | 64 | — | Selling and administrative expenses | |||||||||
Total reclassifications | 67 | 118 | 93 | ||||||||||
Income tax benefit | (25 | ) | (46 | ) | (38 | ) | Income tax provision | ||||||
Total reclassifications, net of tax | $ | 42 | $ | 72 | $ | 55 | |||||||
(1) | Amortization of amounts included in net periodic benefit cost include amortization of prior service benefit and amortization of net actuarial loss as reflected in Note 11—Benefit Plans. |
No amounts were reclassified out of Accumulated other comprehensive loss related to the interest rate swap designated as a cash flow hedge. As of February 27, 2016, the Company expects to reclassify $3 out of Accumulated other comprehensive loss into Interest expense, net during the following twelve month period.
96
NOTE 14—COMMITMENTS, CONTINGENCIES AND OFF-BALANCE SHEET ARRANGEMENTS
Potential Separation of Save-A-Lot Business
On July 28, 2015, the Company announced that it is exploring a separation of its Save-A-Lot segment, and that as part of that process it had begun preparations to allow for a possible spin-off of Save-A-Lot into a stand-alone, publicly traded company. On January 7, 2016, Save-A-Lot, Inc. filed a Form 10 with the Securities and Exchange Commission (the “SEC”) as part of the potential separation from the Company. No specific timetable for a separation has been set and there can be no assurance that a separation will be completed or that any other change in the Company’s overall structure or business model will occur.
Guarantees and Contingent Liabilities
The Company has outstanding guarantees related to certain leases, fixture financing loans and other debt obligations of various retailers as of February 27, 2016. These guarantees were generally made to support the business growth of independent retail customers. The guarantees are generally for the entire terms of the leases or other debt obligations with remaining terms that range from less than one year to 14 years, with a weighted average remaining term of approximately eight years. For each guarantee issued, if the independent retail customer defaults on a payment, the Company would be required to make payments under its guarantee. Generally, the guarantees are secured by indemnification agreements or personal guarantees of the independent retail customer.
The Company reviews performance risk related to its guarantees of independent retail customer obligations based on internal measures of credit performance. As of February 27, 2016, the maximum amount of undiscounted payments the Company would be required to make in the event of default of all guarantees was $67 and represented $43 on a discounted basis. Based on the indemnification agreements, personal guarantees and results of the reviews of performance risk, the Company believes the likelihood that it will be required to assume a material amount of these obligations is remote. Accordingly, no amount has been recorded in the Consolidated Balance Sheets for these contingent obligations under the Company’s guarantee arrangements.
The Company is contingently liable for leases that have been assigned to various third parties in connection with facility closings and dispositions. The Company could be required to satisfy the obligations under the leases if any of the assignees are unable to fulfill their lease obligations. Due to the wide distribution of the Company’s assignments among third parties, and various other remedies available, the Company believes the likelihood that it will be required to assume a material amount of these obligations is remote.
The Company is a party to a variety of contractual agreements under which it may be obligated to indemnify the other party for certain matters in the ordinary course of business, which indemnities may be secured by operation of law or otherwise. These agreements primarily relate to the Company’s commercial contracts, the TSA (as defined below), contracts entered into for the purchase and sale of stock or assets, operating leases and other real estate contracts, financial agreements, agreements to provide services to the Company and agreements to indemnify officers, directors and employees in the performance of their work. While the Company’s aggregate indemnification obligation could result in a material liability, the Company is not aware of any matters that are expected to result in a material liability.
Following the sale of NAI, the Company remains contingently liable with respect to certain self-insurance commitments and other guarantees as a result of parental guarantees issued by SUPERVALU INC. with respect to the obligations of NAI that were incurred while NAI was a subsidiary of the Company. As of February 27, 2016, using actuarial estimates as of December 31, 2015, the total undiscounted amount of all such guarantees was estimated at $167 ($150 on a discounted basis). Based on the expected settlement of the self-insurance claims that underlie the Company’s commitments, the Company believes that such contingent liabilities will continue to decline. Subsequent to the sale of NAI, NAI collateralized most of these obligations with letters of credit and surety bonds to numerous states. Because NAI remains a primary obligor on these self-insurance and other obligations and has collateralized most of the self-insurance obligations for which the Company remains contingently liable, the Company believes that the likelihood that it will be required to assume a material amount of these obligations is remote. Accordingly, no amount has been recorded in the Consolidated Balance Sheets for these guarantees.
Agreements with AB Acquisition LLC and Affiliates
In connection with the sale of NAI on March 21, 2013, the Company entered into various agreements with AB Acquisition LLC and its affiliates related to on-going operations, including a Transition Services Agreement with each of NAI and Albertson’s LLC (collectively, the “TSA”) and operating and supply agreements. At the time of the sale of NAI, these arrangements had initial terms ranging from 12 months to five years, and are generally subject to renewal upon mutual agreement by the parties thereto and also include termination provisions that can be exercised by each party. The Company operates a distribution center owned by NAI for an initial term of five years, subject to renewal at the Company's option for two
97
additional five year terms and certain termination rights for each of the Company and NAI. The Company has exercised its first extension option, subject to such termination rights.
On April 16, 2015, the Company entered into a letter agreement pursuant to which the Company is providing services to NAI and Albertson’s LLC as needed to transition and wind down the TSA. In exchange for these transition and wind down services, the Company is entitled to receive eight payments of approximately $6 every six months for aggregate fees of $50. These payments are separate from and incremental to the fixed and variable fees the Company receives under the TSA. The Company estimates that the complete transition and wind down of the TSA could take approximately two to three more years.
On May 28, 2015, the Company entered into a letter agreement with NAI and Albertson's LLC pursuant to which the Company received certain additional rights and benefits, and the Company and NAI and Albertson's LLC (and certain of their affiliates, including Safeway, with respect to provisions of the letter agreement applicable to them) agreed to resolve several issues. Among other matters resolved, NAI, Albertson's LLC and AB Acquisition agreed to no longer challenge, and waive all rights relating to, the Company's filing with the IRS in fiscal 2015 for a change in accounting method for NAI and its subsidiaries pursuant to the tangible property repair regulations. In consideration for the granting of the additional rights and benefits to the Company and the resolution of the various matters under the letter agreement, the Company paid $35 to AB Acquisition, the parent entity of NAI and Albertson's LLC.
Haggen
The Company entered into a transition services agreement with Haggen in December 2014 (the “Haggen TSA”) to provide certain services to 164 stores owned and being acquired by Haggen in five states. The Company also entered into a supply agreement with Haggen to supply goods and products to Haggen stores in Washington and Oregon. On September 8, 2015, Haggen filed voluntary petitions for reorganization under Chapter 11 of the U.S. Bankruptcy Code. Through the bankruptcy process, Haggen has now closed, sold or agreed to sell all 164 stores. The Company estimates that a complete transition and wind down of the Haggen TSA and supply agreement will occur in the second quarter of fiscal 2017. The Company has filed for approximately $2 of administrative 503(b)(9) priority claims and for approximately $8 of other claims with the bankruptcy court. The Company could be exposed to claims from third parties from which the Company sourced products, services, licenses and similar benefits on behalf of Haggen. The Company has reserved for probable losses related to a portion of these claims and receivables. It is reasonably possible that the Company could experience losses in excess of the amount of such reserves; however, at this time the Company cannot reasonably estimate a range of such excess losses because of the factual and legal issues related to whether the Company would have liability for any such third-party claims, if such third-party claims were asserted against the Company.
Information Technology Intrusions
Computer Network Intrusions - In fiscal 2015, the Company announced it had experienced two separate criminal intrusions into the portion of its computer network that processes payment card transactions for some of its owned and franchised retail stores, including some of its associated stand-alone liquor stores. An investigation of those intrusions supported by third-party data forensics experts is ongoing. Given the continuing nature of the investigation, it is possible that it will be determined that information was stolen from the Company during one or both of these intrusions or that new or different time frames, locations, at-risk data, and/or other facts will be identified in the future.
Some stores owned and operated by Albertson’s LLC and NAI experienced related criminal intrusions. The Company provides information technology services to these Albertson’s LLC and NAI stores pursuant to the TSA, and the Company has been working together with Albertson’s LLC and NAI to respond to the intrusions into their stores. The Company believes that any losses incurred by Albertson’s LLC or NAI as a result of the intrusions affecting their stores would not be the Company’s responsibility.
Investigations and Proceedings - As a result of the criminal intrusions, the payment card brands are conducting investigations and, although the Company’s network has previously been found to be compliant with applicable data security standards, the forensic investigator working on behalf of the payment card brands has concluded that the Company was not in compliance at the time of the intrusions and that the alleged non-compliance caused at least some portion of the compromise of payment card data that allegedly occurred during the intrusions. As a result, the Company expects the payment card brands to allege that the Company was not compliant with the applicable data security standards at the time of the intrusions and that such alleged non-compliance caused the compromise of payment card data during the intrusions. The Company believes the payment card brands will make claims against the Company for non-ordinary course operating expenses and incremental counterfeit fraud losses allegedly incurred by them or their issuers by reason of the intrusions and the Company expects to dispute those claims. While the Company does not believe that a loss is probable by reason of these as yet unasserted claims, the Company believes that a loss in connection with these claims, should they be asserted, is reasonably possible; however, at this time the Company cannot
98
reasonably estimate a range of possible losses because the payment card brands’ investigation is ongoing and the payment card brands have not alleged what payment cards they consider to have been compromised, what data from those cards they consider to have been compromised, or the amount of their and/or their issuers' claimed losses. The Company does not currently believe that the amount, if any, paid on any payment card brand claims that might be asserted would be material to the Company’s consolidated results of operations, cash flows or financial condition. In addition, one payment card brand has placed us in a "probationary status" for a period of two years following our re-validation as PCI-DSS compliant, during which time our failure to comply with the probationary requirements set forth by the payment card brand could result in the imposition of further conditions, including but not limited to disqualification from the payment system. The Company does not anticipate material costs to comply with the probationary requirements and is continuing to engage with the payment card brand about the nature of any final probationary requirements.
On October 23, 2015, the Company received a letter from a multistate group of Attorneys General seeking information regarding the intrusions. The Company is cooperating with the request. To date, no claims have been asserted against the Company related to this inquiry. If any claims are asserted, the Company expects to dispute those claims.
As discussed in more detail below in this Note 14 under Legal Proceedings, four class action complaints related to the intrusions have been filed against the Company and consolidated into one action and are currently pending. As indicated in this Note 14, the Company believes that the likelihood of a material loss from the four class actions is remote. It is possible that other similar complaints by consumers, banks or others may be filed against the Company in connection with the intrusions.
Insurance Coverage and Expenses - The Company had $50 of cyber threat insurance above a per incident deductible of $1 at the time of the intrusions, which it believes should mitigate the financial effect of these intrusions, including claims made or that might be made against the Company based on these intrusions. The Company now maintains $90 of cyber threat insurance above a per incident deductible of approximately $3, in each case subject to certain sublimits. In fiscal 2016, the Company recorded $2 of intrusion related costs, and received and anticipated insurance proceeds of $2. These amounts were recorded within Selling and administrative expenses in the Consolidated Statements of Operations. Anticipated insurance proceeds recorded for the insurance receivable were based on the Company’s insurance recovery assessment. This assessment included the review of applicable insurance policies, correspondence with the insurance carriers and analysis by legal counsel.
Other Contractual Commitments
In the ordinary course of business, the Company enters into supply contracts to purchase products for resale and purchase, and service contracts for fixed asset and information technology commitments. These contracts typically include either volume commitments or fixed expiration dates, termination provisions and other standard contractual considerations. As of February 27, 2016, the Company had approximately $291 of non-cancelable future purchase obligations.
Legal Proceedings
The Company is subject to various lawsuits, claims and other legal matters that arise in the ordinary course of conducting business. In the opinion of management, based upon currently-available facts, the likelihood that the ultimate outcome of any lawsuits, claims and other proceedings will have a material adverse effect on the overall results of the Company’s operations, its cash flows or its financial position is remote.
In September 2008, a class action complaint was filed against the Company, as well as International Outsourcing Services, LLC (“IOS”); Inmar, Inc.; Carolina Manufacturer’s Services, Inc.; Carolina Coupon Clearing, Inc. and Carolina Services in the United States District Court in the Eastern District of Wisconsin. The plaintiffs in the case are a consumer goods manufacturer, a grocery co-operative and a retailer marketing services company that allege on behalf of a purported class that the Company and the other defendants (i) conspired to restrict the markets for coupon processing services under the Sherman Act and (ii) were part of an illegal enterprise to defraud the plaintiffs under the Federal Racketeer Influenced and Corrupt Organizations Act. The plaintiffs seek monetary damages, attorneys’ fees and injunctive relief. The Company intends to vigorously defend this lawsuit; however, all proceedings have been stayed in the case pending the result of the criminal prosecution of certain former officers of IOS.
In December 2008, a class action complaint was filed in the United States District Court for the Western District of Wisconsin against the Company alleging that a 2003 transaction between the Company and C&S Wholesale Grocers, Inc. (“C&S”) was a conspiracy to restrain trade and allocate markets. In the 2003 transaction, the Company purchased certain assets of the Fleming Corporation as part of Fleming Corporation’s bankruptcy proceedings and sold certain assets of the Company to C&S that were located in New England. Since December 2008, three other retailers have filed similar complaints in other jurisdictions. The cases were consolidated and are proceeding in the United States District Court in Minnesota. The complaints allege that the conspiracy was concealed and continued through the use of non-compete and non-solicitation agreements and the closing down of the distribution facilities that the Company and C&S purchased from each other. Plaintiffs are seeking monetary damages,
99
injunctive relief and attorneys’ fees. On July 5, 2011, the District Court granted the Company’s Motion to Compel Arbitration for those plaintiffs with arbitration agreements and plaintiffs appealed. On July 16, 2012, the District Court denied plaintiffs’ Motion for Class Certification, and on January 11, 2013, the District Court granted the Company’s Motion for Summary Judgment and dismissed the case regarding the non-arbitration plaintiffs. On February 12, 2013, the 8th Circuit reversed the District Court decision requiring plaintiffs with arbitration agreements to arbitrate and remanded to the District Court. On October 30, 2013, the parties attended a District Court ordered mandatory mediation, which was not successful in resolving the matter. On May 21, 2014, a panel of the 8th Circuit (1) reversed the District Court’s decision granting summary judgment in favor of the Company and (2) affirmed the District Court’s decision denying class certification of a class consisting of all retailers located in the States of Illinois, Indiana, Iowa, Michigan, Minnesota, Ohio and Wisconsin that purchased wholesale grocery products from the Company between December 31, 2004 and September 13, 2008, but remanded the case for the District Court to consider whether to certify a narrower class of purchasers supplied from the Company’s Champaign, Illinois distribution center and potentially other distribution centers. On January 16, 2015, the Company filed a Petition for Certiorari to the United States Supreme Court seeking to appeal certain aspects of the 8th Circuit decision, and on June 8, 2015, the United States Supreme Court denied the Petition. On June 19, 2015, the District Court Magistrate Judge entered an order that decided a number of matters including granting plaintiffs' request to seek class certification for certain Midwest Distribution Centers and denying plaintiffs' request to add an additional New England plaintiff and denying plaintiffs' request to seek class certification for a group of New England retailers. On August 20, 2015, the District Court affirmed the Magistrate Judge's order. In September 2015, the plaintiffs appealed to the 8th Circuit the denial of the request to add an additional New England plaintiff and to seek class certification for a group of New England retailers. On March 1, 2016, the plaintiffs filed a class certification motion seeking to certify five District Court classes of retailers in the Midwest. The Company's response to the motion to certify is due May 6, 2016.
In August and November 2014, four class action complaints were filed against the Company relating to the criminal intrusions into its computer network announced by the Company in fiscal 2015 (the "Criminal Intrusion"). The cases were centralized in the Federal District Court for the District of Minnesota under the caption In Re: Supervalu Inc. Customer Data Security Breach Litigation. On June 26, 2015, the plaintiffs filed a Consolidated Class Action Complaint. The Company filed a Motion to Dismiss the Consolidated Class Action Complaint and the hearing took place on November 3, 2015. On January 7, 2016, the District Court granted the Motion to Dismiss and dismissed the case without prejudice, holding that the plaintiffs did not have standing to sue as they had not met their burden of showing any compensable damages. On February 4, 2016, the plaintiffs filed a motion to vacate the District Court's dismissal of the complaint or in the alternative to conduct discovery and file an amended complaint, and the Company filed its response in opposition on March 4, 2016. On April 20, 2016, the District Court denied plaintiffs’ motion to vacate the District Court’s dismissal or in the alternative to amend the complaint.
On June 30, 2015, the Company received a letter from the Office for Civil Rights of the U.S. Department of Health and Human Services (“OCR”) seeking documents and information regarding the Company’s HIPAA breach notification and reporting from 2009 to the present. The letter indicates that the OCR Midwest Region is doing a compliance review of the Company’s alleged failure to report small breaches of protected health information related to its pharmacy operations (e.g., any incident involving less than 500 individuals). On September 4, 2015, the Company submitted its response to OCR’s letter. While the Company does not believe that a loss is probable by reason of the compliance review, the Company believes that a loss is reasonably possible; however, at this time the Company cannot reasonably estimate a range of possible losses because the OCR's review is at the very early stages and the Company does not know if OCR will find a violation(s) and, if so, what violation(s) and whether OCR will proceed with corrective action, issuance of penalties or monetary settlement. The potential penalties related to the issues being investigated are up to $50 thousand per violation (which can be counted per day) with a $1.5 per calendar year maximum for multiple violations of a single provision (with the potential for finding violations of multiple provisions each with a separate $1.5 per calendar year maximum); however, as noted above, any actual penalties will be determined only after consideration by OCR of various factors, including the nature of any violation, remedial actions taken by the Company and other factors determined relevant by OCR.
Predicting the outcomes of claims and litigation and estimating related costs and exposures involves substantial uncertainties that could cause actual outcomes, costs and exposures to vary materially from current expectations. The Company regularly monitors its exposure to the loss contingencies associated with these matters and may from time to time change its predictions with respect to outcomes and its estimates with respect to related costs and exposures.
With respect to the IOS, C&S, Criminal Intrusion and OCR matters discussed above, the Company believes the chance of a material loss is remote. It is possible, although management believes that the likelihood is remote, that material differences in actual outcomes, costs and exposures relative to current predictions and estimates, or material changes in such predictions or estimates, could have a material adverse effect on the Company’s financial condition, results of operations or cash flows.
100
NOTE 15—SEGMENT INFORMATION
Refer to the Consolidated Segment Financial Information for financial information concerning the Company’s operations and financial position by reportable segment.
The Company’s operating segments reflect the manner in which the business is managed and how the Company allocates resources and assesses performance internally. The Company’s chief operating decision maker is the Chief Executive Officer.
The Company offers a wide variety of grocery products, general merchandise and health and beauty care, pharmacy, fuel and other items and services. The Company’s business is classified by management into three reportable segments: Wholesale, Save-A-Lot and Retail. These reportable segments are three distinct businesses, each with a different customer base, marketing strategy and management structure. The Company reviews its reportable segments on an annual basis, or more frequently if events or circumstances indicate a change in reportable segments has occurred.
The Wholesale reportable segment derives revenues from wholesale distribution and services to independently owned retail food stores and other customers (collectively referred to as “independent retail customers”). The Save-A-Lot reportable segment derives revenues from the sale of groceries at retail locations operated and licensed by the Company (both the Company’s own stores and stores licensed by the Company to which the Company distributes wholesale products). The Retail reportable segment derives revenues from the sale of groceries and other products at retail locations operated by the Company. Substantially all of the Company’s operations are domestic.
The Company offers a wide variety of nationally advertised brand name and private-label products, primarily including grocery (both perishable and nonperishable), general merchandise and health and beauty care, pharmacy and fuel, which are sold through the Company’s owned, licensed and franchised retail stores to shoppers and through its Wholesale segment to independent retail customers. The following table provides additional detail on the amounts and percentages of Net sales for each group of similar products sold in the Wholesale, Save-A-Lot and Retail segments, and service agreement revenue in Corporate:
2016 | 2015 | 2014 | ||||||||||||||||||
Wholesale: | ||||||||||||||||||||
Nonperishable grocery products(1) | $ | 5,753 | 33 | % | $ | 5,939 | 33 | % | $ | 6,000 | 35 | % | ||||||||
Perishable grocery products(2) | 2,025 | 12 | 2,099 | 12 | 1,951 | 11 | ||||||||||||||
Services to independent retail customers and other | 157 | 1 | 160 | 1 | 151 | 1 | ||||||||||||||
7,935 | 45 | % | 8,198 | 46 | % | 8,102 | 47 | % | ||||||||||||
Save-A-Lot: | ||||||||||||||||||||
Nonperishable grocery products(1) | $ | 2,956 | 17 | % | $ | 2,989 | 17 | % | $ | 2,823 | 17 | % | ||||||||
Perishable grocery products(2) | 1,597 | 9 | 1,587 | 9 | 1,373 | 8 | ||||||||||||||
Services to licensees and other | 70 | — | 65 | — | 59 | — | ||||||||||||||
4,623 | 26 | % | 4,641 | 26 | % | 4,255 | 25 | % | ||||||||||||
Retail: | ||||||||||||||||||||
Nonperishable grocery products(1) | $ | 2,607 | 15 | % | $ | 2,677 | 15 | % | $ | 2,600 | 15 | % | ||||||||
Perishable grocery products(2) | 1,549 | 9 | 1,574 | 9 | 1,463 | 9 | ||||||||||||||
Pharmacy products | 511 | 3 | 510 | 3 | 491 | 3 | ||||||||||||||
Fuel | 67 | — | 83 | — | 67 | — | ||||||||||||||
Other | 35 | — | 40 | — | 34 | — | ||||||||||||||
4,769 | 27 | % | 4,884 | 27 | % | 4,655 | 27 | % | ||||||||||||
Corporate: | ||||||||||||||||||||
Transition services revenue | $ | 202 | 1 | % | $ | 194 | 1 | % | $ | 240 | 1 | % | ||||||||
Net sales | $ | 17,529 | 100 | % | $ | 17,917 | 100 | % | $ | 17,252 | 100 | % | ||||||||
(1) | Includes such items as dry goods, dairy, frozen foods, beverages, general merchandise, home, health and beauty care and candy |
(2) | Includes such items as meat, produce, deli and bakery |
Segment operating earnings include revenues and costs attributable to each of the respective business segments and allocated corporate overhead, based on the segment's estimated consumption of corporately managed resources. Variances to planned corporate overhead allocated to business segments remain in Corporate because allocated corporate overhead affecting segment
101
operating profit is centrally managed. Reported segment information is presented on the same basis as it is reviewed by executive management.
NOTE 16—DISCONTINUED OPERATIONS
NAI Banner Sale
On March 21, 2013, the Company sold NAI to AB Acquisition, which resulted in the sale of the NAI banners, including Albertsons, Acme, Jewel-Osco, Shaw’s and Star Market and related Osco and Sav-on in-store pharmacies (collectively, the “NAI Banners”).
The Company received net proceeds of approximately $100 and a short-term note receivable of approximately $44 for the stock of NAI. AB Acquisition assumed approximately $3,200 of debt and capital leases, excluding original issue discounts. In addition, AB Acquisition assumed the underfunded status of NAI’s related share of the multiemployer pension plans to which the Company contributed. AB Acquisition’s portion of the underfunded status of the multiemployer pension plans was estimated to be approximately $1,138 before tax, based on the Company’s estimated “proportionate share” of underfunding calculated as of February 23, 2013.
In connection with the sale of NAI, the Company entered into various agreements with AB Acquisition and its affiliates related to on-going operations, including the TSA and operating and supply agreements. At the time of the sale of NAI, these arrangements had initial terms ranging from 12 months to five years, and are generally subject to renewal upon mutual agreement by the parties thereto and also include termination provisions that can be exercised by each party. TSA fees earned are reflected in Net sales in the Consolidated Statements of Operations. The shared service center costs incurred to support back office functions related to the NAI banners represent administrative overhead and are recorded in Selling and administrative expenses. For additional discussion of the TSA and this letter agreement, see “Risk Factors—The Company’s relationships with NAI, Albertson’s LLC and Haggen are winding down, which could adversely impact the Company’s results of operations"” in Part I, Item 1A of this Annual Report on Form 10-K and Note 14—Commitments, Contingencies and Off-Balance Sheet Arrangements.
The Company operates a distribution center owned by NAI for an initial term of five years, subject to renewal at the Company's option for two additional five-year terms and certain termination rights for each of the Company and NAI. The Company has exercised its first extension option, subject to such termination rights.
In fiscal 2014, the Company provided certain additional finance and accounting services to NAI and Albertson’s LLC under the TSA. NAI and Albertson’s LLC paid the Company approximately $13 for these services, most of which the Company provided through third parties.
Results of Discontinued Operations
The Company determined that the continuing cash flows generated by these arrangements are not significant in proportion to the cash flows that the Company would have generated had the NAI Banner sale not occurred, and that the arrangements do not provide the Company the ability to significantly influence the operating or financial policies of the NAI Banners. Accordingly, the above arrangements do not constitute significant continuing involvement in the operations of the NAI Banners. The assets, liabilities, operating results, and cash flows of the NAI Banners have been presented separately as discontinued operations in the Consolidated Financial Statements for all periods presented.
During the fourth quarter of fiscal 2013, the Company presented the assets and liabilities of NAI as discontinued operations and accordingly assessed the long-lived assets of the disposal group for impairment by comparing the carrying value of the total net assets of discontinued operations to their estimated fair value based on the proceeds expected to be received and debt expected to be assumed by AB Acquisition pursuant to the Stock Purchase Agreement less the estimated costs to sell. The Company recorded a preliminary estimated pre-tax loss on contract for the disposal of NAI of approximately $1,150 and a pre-tax property, plant and equipment-related impairment of $203. The loss on sale calculation was finalized during fiscal 2014, including the finalization of the working capital adjustment. The total loss on sale of NAI was $1,263, comprised of $1,081 of contract loss and $182 of property, plant and equipment-related impairment, resulting in a $90 pre-tax reduction to the preliminary estimated loss on sale of NAI during fiscal 2014, which was recorded as a component of Income from discontinued operations, net of tax in the Consolidated Statements of Operations. The Company determined the pre-tax property, plant and equipment-related impairment using Level 3 inputs.
The following is a summary of the Company’s operating results and certain other directly attributable expenses that are included in discontinued operations:
102
2016 | 2015 | 2014 | |||||||||
Net sales | $ | — | $ | — | $ | 1,235 | |||||
(Loss) income before income taxes from discontinued operations | (1 | ) | 6 | 121 | |||||||
Income tax benefit | (9 | ) | (66 | ) | (55 | ) | |||||
Income from discontinued operations, net of tax | $ | 8 | $ | 72 | $ | 176 | |||||
Income from discontinued operations, net of tax for fiscal 2016 primarily reflects tax settlement matters, including discrete tax benefits and expenses, and pre-tax resolution matters.
Income before income taxes from discontinued operations for fiscal 2015 primarily reflects $6 of property tax refunds and interest income resulting from settlement of income tax audits. The income tax benefit included as a component of Income from discontinued operations, net of tax for fiscal 2015 includes $66 of net tax benefits, primarily related to tangible property repair regulations and other deduction-related changes.
The tax rate for the income tax benefit included as a component of Income from discontinued operations, net of tax for fiscal 2014 included $105 of discrete tax benefits primarily resulting from the settlement of IRS audits for the fiscal 2010, 2009 and 2008 tax years and an adjustment to decrease the loss on sale of NAI reported at February 23, 2013.
UNAUDITED QUARTERLY FINANCIAL INFORMATION
(In millions, except per share data)
Unaudited quarterly financial information for SUPERVALU INC. and subsidiaries is as follows:
2016 | |||||||||||||||||||
First (16 weeks) | Second (12 weeks) | Third (12 weeks) | Fourth (12 weeks) | Fiscal Year (52 weeks) | |||||||||||||||
Net sales | $ | 5,407 | $ | 4,062 | $ | 4,114 | $ | 3,946 | $ | 17,529 | |||||||||
Gross profit | $ | 810 | $ | 583 | $ | 601 | $ | 590 | $ | 2,584 | |||||||||
Net earnings from continuing operations(1) | $ | 63 | $ | 31 | $ | 35 | $ | 49 | $ | 178 | |||||||||
Net earnings attributable to SUPERVALU INC. | $ | 61 | $ | 31 | $ | 34 | $ | 52 | $ | 178 | |||||||||
Net earnings per share from continuing operations attributable to SUPERVALU INC.—diluted(1) | $ | 0.23 | $ | 0.11 | $ | 0.13 | $ | 0.18 | $ | 0.63 | |||||||||
Net earnings per share attributable to SUPERVALU INC.—diluted | $ | 0.23 | $ | 0.11 | $ | 0.13 | $ | 0.20 | $ | 0.66 | |||||||||
Dividends declared per share | $ | — | $ | — | $ | — | $ | — | $ | — | |||||||||
Weighted average shares—diluted | 268 | 268 | 268 | 267 | 268 | ||||||||||||||
2015 | |||||||||||||||||||
First (16 weeks) | Second (12 weeks) | Third (12 weeks) | Fourth (13 weeks) | Fiscal Year (53 weeks) | |||||||||||||||
Net sales | $ | 5,264 | $ | 4,041 | $ | 4,225 | $ | 4,387 | $ | 17,917 | |||||||||
Gross profit | $ | 755 | $ | 574 | $ | 596 | $ | 663 | $ | 2,588 | |||||||||
Net earnings from continuing operations(2) | $ | 48 | $ | 31 | $ | 12 | $ | 36 | $ | 127 | |||||||||
Net earnings attributable to SUPERVALU INC. | $ | 43 | $ | 31 | $ | 79 | $ | 39 | $ | 192 | |||||||||
Net earnings per share from continuing operations attributable to SUPERVALU INC.—diluted(2) | $ | 0.18 | $ | 0.11 | $ | 0.04 | $ | 0.13 | $ | 0.45 | |||||||||
Net earnings per share attributable to SUPERVALU INC.—diluted | $ | 0.17 | $ | 0.11 | $ | 0.30 | $ | 0.14 | $ | 0.73 | |||||||||
Dividends declared per share | $ | — | $ | — | $ | — | $ | — | $ | — | |||||||||
Weighted average shares—diluted | 262 | 264 | 265 | 266 | 264 | ||||||||||||||
(1) | Results from continuing operations for the fiscal year ended February 27, 2016 include net charges and costs of $51 before tax ($34 after tax, or $0.13 per diluted share). Refer to Item 6 Selected Financial Data in Part II, Item 8 of this Annual Report on Form 10-K for a discussion of these items. |
103
(2) | Results from continuing operations for the fiscal year ended February 28, 2015 include net charges and costs of $118 before tax ($70 after tax, or $0.27 per diluted share). Refer to Item 6 Selected Financial Data in Part II, Item 8 of this Annual Report on Form 10-K for a discussion of these items. |
104
SUPERVALU INC. and Subsidiaries
SCHEDULE II—Valuation and Qualifying Accounts
(In millions)
Description | Balance at Beginning of Fiscal Year | Additions | Deductions | Balance at End of Fiscal Year | |||||||||
Allowance for losses on accounts and notes receivable: | |||||||||||||
2016 | $ | 18 | 6 | (11 | ) | $ | 13 | ||||||
2015 | 19 | 6 | (7 | ) | 18 | ||||||||
2014 | 16 | 16 | (13 | ) | 19 | ||||||||
105
ITEM 9. CHANGES IN AND DISAGREEMENTS WITH ACCOUNTANTS ON ACCOUNTING AND FINANCIAL DISCLOSURE
None.
ITEM 9A. CONTROLS AND PROCEDURES
Disclosure Controls and Procedures
The Company carried out an evaluation, under the supervision and with the participation of the Company’s management, including the Company’s Chief Executive Officer and its Chief Financial Officer, of the effectiveness of the design and operation of the Company’s disclosure controls and procedures (as defined in Rule 13a-15(e) under the Exchange Act) as of February 27, 2016, the end of the period covered by this Annual Report on Form 10-K. Based on this evaluation, the Chief Executive Officer and Chief Financial Officer concluded that, as of February 27, 2016, the Company’s disclosure controls and procedures are effective to provide reasonable assurance that information required to be disclosed by the Company in the reports that it files or submits under the Exchange Act is (1) recorded, processed, summarized and reported within the time periods specified by the SEC’s rules and forms and (2) accumulated and communicated to the Company’s management, including the Company’s Chief Executive Officer and Chief Financial Officer, in a manner that allows timely decisions regarding required disclosure.
Management’s Annual Report on Internal Control Over Financial Reporting
The financial statements, financial analyses and all other information included in this Annual Report on Form 10-K were prepared by the Company’s management, which is responsible for establishing and maintaining adequate internal control over financial reporting.
The Company’s internal control over financial reporting is designed to provide reasonable assurance regarding the reliability of financial reporting and the preparation of financial statements for external purposes in accordance with generally accepted accounting principles. The Company’s internal control over financial reporting includes those policies and procedures that:
i. | pertain to the maintenance of records that, in reasonable detail, accurately and fairly reflect the transactions and dispositions of the assets of the Company; |
ii. | provide reasonable assurance that transactions are recorded as necessary to permit preparation of financial statements in accordance with generally accepted accounting principles, and that receipts and expenditures of the Company are being made only in accordance with authorizations of management and directors of the Company; and |
iii. | provide reasonable assurance regarding prevention or timely detection of unauthorized acquisition and use or disposition of the Company’s assets that could have a material effect on the financial statements. |
There are inherent limitations in the effectiveness of any internal control, including the possibility of human error and the circumvention or overriding of controls. Accordingly, even effective internal control can provide only reasonable assurances with respect to financial statement preparation. Further, because of changes in conditions, the effectiveness of internal control may vary over time.
Management assessed the design and effectiveness of the Company’s internal control over financial reporting as of February 27, 2016. In making this assessment, management used the criteria set forth by the Committee of Sponsoring Organizations of the Treadway Commission (COSO) in Internal Control—Integrated Framework (2013). Based on management’s assessment under the framework in Internal Control - Integrated Framework (2013), as of February 27, 2016, the Company’s internal control over financial reporting is effective.
The effectiveness of the Company’s internal control over financial reporting as of February 27, 2016 has been audited by KPMG LLP, the Company’s independent registered public accounting firm. Their report, which is set forth in Part II, Item 8 of this Annual Report on Form 10-K, expresses an unqualified opinion on the effectiveness of the Company’s internal control over financial reporting as of February 27, 2016.
Changes in Internal Control Over Financial Reporting
During the fiscal year ended February 27, 2016, there has been no change to the Company’s internal control over financial reporting (as defined in Rule 13a-15(f) under the Exchange Act) that has materially affected, or is reasonably likely to materially affect, the Company’s internal control over financial reporting.
106
ITEM 9B. OTHER INFORMATION
None.
107
PART III
ITEM 10. DIRECTORS, EXECUTIVE OFFICERS AND CORPORATE GOVERNANCE
The information called for by Item 10, as to compliance with Section 16(a) of the Exchange Act, is incorporated by reference to the Company’s definitive Proxy Statement to be filed with the SEC pursuant to Regulation 14A in connection with the Company’s 2016 Annual Meeting of Stockholders under the heading “Other Information—Section 16(a) Beneficial Ownership Reporting Compliance.” The information called for by Item 10, as to the audit committee and the audit committee financial expert, is incorporated by reference to the Company’s definitive Proxy Statement to be filed with the SEC pursuant to Regulation 14A in connection with the Company’s 2016 Annual Meeting of Stockholders under the heading “Committees of the Board of Directors—Audit Committee.” The information called for by Item 10, as to executive officers, is set forth under “Executive Officers of the Company” in Part I, Item 1 of this Annual Report on Form 10-K. The information called for by Item 10, as to directors, is incorporated by reference to the Company’s definitive Proxy Statement to be filed with the SEC pursuant to Regulation 14A in connection with the Company’s 2016 Annual Meeting of Stockholders under the heading “Election of Directors (Item 1).”
The Company has adopted a code of ethics called the Code of Business Conduct that applies to its principal executive officer, principal financial officer, principal accounting officer and controller, or persons performing similar functions and all other employees, and a Code of Business Conduct and Ethics that applies to its directors. The Codes are posted on the Company’s website (www.supervalu.com). The Company intends to satisfy the disclosure requirement under Item 5.05 of Form 8-K regarding an amendment to, or waiver from, a provision of the code of ethics that applies to the Company’s principal executive officer, principal financial officer, principal accounting officer and controller, or persons performing similar functions, by posting such information on the Company’s website at the address specified above.
The Company’s Governance Principles and charters for each Committee of its Board of Directors are also available on the Company’s website. The codes of ethics, Governance Principles and charters are also available in print to any stockholder who submits a request to: Corporate Secretary, SUPERVALU INC., P.O. Box 990, Minneapolis, Minnesota 55440.
Information on the Company’s website is not deemed to be incorporated by reference into this Annual Report on Form 10-K.
ITEM 11. EXECUTIVE COMPENSATION
The information called for by Item 11 is incorporated by reference to the Company’s definitive Proxy Statement to be filed with the SEC pursuant to Regulation 14A in connection with the Company’s 2016 Annual Meeting of Stockholders under the headings “Board Practices—Compensation Risk Assessment,” “Director Compensation,” “Committees of the Board of Directors—Leadership Development and Compensation Committee—Compensation Committee Interlocks and Insider Participation,” “Compensation Discussion and Analysis,” “Executive Compensation” and “Report of the Leadership Development and Compensation Committee.”
ITEM 12. SECURITY OWNERSHIP OF CERTAIN BENEFICIAL OWNERS AND MANAGEMENT AND RELATED STOCKHOLDER MATTERS
The information called for by Item 12 is incorporated by reference to the Company’s definitive Proxy Statement to be filed with the SEC pursuant to Regulation 14A in connection with the Company’s 2016 Annual Meeting of Stockholders under the headings “Security Ownership of Certain Beneficial Owners,” “Security Ownership of Management” and "Equity Compensation Plan Information."
ITEM 13. CERTAIN RELATIONSHIPS AND RELATED TRANSACTIONS, AND DIRECTOR INDEPENDENCE
The information called for by Item 13, as to director independence, is incorporated by reference to the Company’s definitive Proxy Statement to be filed with the SEC pursuant to Regulation 14A in connection with the Company’s 2016 Annual Meeting of Stockholders under the heading “Board Practices—Director Independence.” The information called for by Item 13, as to related person transactions, is incorporated by reference to the Company’s definitive Proxy Statement to be filed with the SEC pursuant to Regulation 14A in connection with the Company’s 2016 Annual Meeting of Stockholders under the heading “Board Practices—Policy and Procedures Regarding Transactions with Related Persons.”
108
ITEM 14. PRINCIPAL ACCOUNTING FEES AND SERVICES
The information called for by Item 14 is incorporated by reference to the Company’s definitive Proxy Statement to be filed with the SEC pursuant to Regulation 14A in connection with the Company’s 2016 Annual Meeting of Stockholders under the heading “Independent Registered Public Accounting Firm's Fees.”
109
PART IV
ITEM 15. EXHIBITS AND FINANCIAL STATEMENT SCHEDULES
(a)(1) | Financial Statements: | |||||
The Consolidated Financial Statements to the Company listed in the accompanying “Index of Financial Statements and Schedules” together with the report of KPMG LLP, independent registered public accountants, are filed as part of this Annual Report on Form 10-K. | ||||||
(2) | Financial Statement Schedules: | |||||
The consolidated financial statement schedule of the Company listed in the accompanying “Index of Financial Statements and Schedules.” | ||||||
(3) | Exhibits: | |||||
(2) | Plan of Acquisition, Reorganization, Arrangement, Liquidation or Succession: | |||||
2.1 | Stock Purchase Agreement, dated January 10, 2013, by and among SUPERVALU INC., AB Acquisition LLC and New Albertson’s, Inc., is incorporated herein by reference to Exhibit 2.1 to the Company’s Current Report on Form 8-K filed with the SEC on January 14, 2013 (Schedules have been omitted pursuant to Item 601(b)(2) of Regulation S-K. A copy of any omitted schedule will be furnished supplementally to the SEC upon request.) | |||||
2.2 | Tender Offer Agreement, dated January 10, 2013, by and between SUPERVALU INC., Symphony Investors LLC and Cerberus Capital Management, L.P., is incorporated herein by reference to Exhibit 2.2 to the Company’s Current Report on Form 8-K filed with the SEC on January 14, 2013 (Schedules have been omitted pursuant to Item 601(b)(2) of Regulation S-K. A copy of any omitted schedule will be furnished supplementally to the SEC upon request.) | |||||
2.3 | Asset Purchase Agreement, dated May 6, 2014, by and among RBF, LLC, Roundy’s Supermarkets, Inc., SUPERVALU INC., SUPERVALU Pharmacies, Inc. and SUPERVALU Gold, LLC., is incorporated herein by reference to Exhibit 2.1 to the Company's Current Report on Form 8-K filed with the SEC on May 7, 2014 (Schedules have been omitted pursuant to Item 601(b)(2) of Regulation S-K. A copy of any omitted schedule will be furnished supplementally to the SEC upon request.) | |||||
(3) | Articles of Incorporation and Bylaws: | |||||
3.1 | Restated Certificate of Incorporation is incorporated herein by reference to Exhibit 3.1 to the Company’s Current Report on Form 8-K filed with the SEC on July 18, 2012. | |||||
3.2 | Amended and Restated Bylaws, as amended and restated, are incorporated herein by reference to Exhibit 3.1 to the Company’s Current Report on Form 8-K filed with the SEC on April 25, 2016. | |||||
(4) | Instruments defining the rights of security holders, including indentures: | |||||
4.1 | Indenture dated as of July 1, 1987, between the Company and Bankers Trust Company, as Trustee, is incorporated herein by reference to Exhibit 4.1 to the Company’s Registration Statement on Form S-3 (Registration No. 33-52422). | |||||
4.2 | First Supplemental Indenture dated as of August 1, 1990, between the Company and Bankers Trust Company, as Trustee, to Indenture dated as of July 1, 1987, between the Company and Bankers Trust Company, as Trustee, is incorporated herein by reference to Exhibit 4.2 to the Company’s Registration Statement on Form S-3 (Registration No. 33-52422). | |||||
4.3 | Second Supplemental Indenture dated as of October 1, 1992, between the Company and Bankers Trust Company, as Trustee, to Indenture dated as of July 1, 1987, between the Company and Bankers Trust Company, as Trustee, is incorporated herein by reference to Exhibit 4.1 to the Company’s Current Report on Form 8-K dated November 13, 1992. | |||||
4.4 | Third Supplemental Indenture dated as of September 1, 1995, between the Company and Bankers Trust Company, as Trustee, to Indenture dated as of July 1, 1987, between the Company and Bankers Trust Company, as Trustee, is incorporated herein by reference to Exhibit 4.1 to the Company’s Current Report on Form 8-K filed with the SEC on October 2, 1995. | |||||
4.5 | Fourth Supplemental Indenture dated as of August 4, 1999, between the Company and Bankers Trust Company, as Trustee, to Indenture dated as of July 1, 1987, between the Company and Bankers Trust Company, as Trustee, is incorporated herein by reference to Exhibit 4.2 to the Company’s Quarterly Report on Form 10-Q for the quarterly period (16 weeks) ended September 11, 1999. | |||||
110
4.6 | Fifth Supplemental Indenture dated as of September 17, 1999, between the Company and Bankers Trust Company, as Trustee, to Indenture dated as of July 1, 1987, between the Company and Bankers Trust Company, as Trustee, is incorporated herein by reference to Exhibit 4.3 to the Company’s Quarterly Report on Form 10-Q for the quarterly period (16 weeks) ended September 11, 1999. | |||||
4.7 | Officers’ Certificate and Authentication Order dated May 7, 2009 for the 8.000% Senior Notes due 2016 (which includes the form of Note) issued pursuant to the Indenture dated as of July 1, 1987, as amended and supplemented by the First Supplemental Indenture dated as of August 1, 1990, the Second Supplemental Indenture dated as of October 1, 1992, the Third Supplemental Indenture dated as of September 1, 1995, the Fourth Supplemental Indenture dated as of August 4, 1999, and the Fifth Supplemental Indenture dated as of September 17, 1999, each between the Company and Deutsche Bank Trust Company Americas (formerly known as Bankers Trust Company), as Trustee, is incorporated herein by reference to Exhibit 4.1 to the Company’s Current Report on Form 8-K filed with the SEC on May 7, 2009. | |||||
4.8 | Officers’ Certificate and Authentication Order dated May 21, 2013 for the 6.750% Senior Notes due 2021 (which includes the form of Note) issued pursuant to the Indenture dated as of July 1, 1987, as amended and supplemented by the First Supplemental Indenture dated as of August 1, 1990, the Second Supplemental Indenture dated as of October 1, 1992, the Third Supplemental Indenture dated as of September 1, 1995, the Fourth Supplemental Indenture dated as of August 4, 1999, and the Fifth Supplemental Indenture dated as of September 17, 1999, each between the Company and Deutsche Bank Trust Company Americas (formerly known as Bankers Trust Company), as Trustee, is incorporated herein by reference to Exhibit 4.1 to the Company’s Current Report on Form 8-K filed with the SEC on May 21, 2013). | |||||
4.9 | Officers’ Certificate and Authentication Order dated November 14, 2014 for the 7.750% Senior Notes due 2022 (which includes the form of Note) issued pursuant to the Indenture dated as of July 1, 1987, as amended and supplemented by the First Supplemental Indenture dated as of August 1, 1990, the Second Supplemental Indenture dated as of October 1, 1992, the Third Supplemental Indenture dated as of September 1, 1995, the Fourth Supplemental Indenture dated as of August 4, 1999, and the Fifth Supplemental Indenture dated as of September 17, 1999, each between the Company and Deutsche Bank Trust Company Americas (formerly known as Bankers Trust Company), as Trustee, is incorporated herein by reference to Exhibit 4.1 to the Company’s Current Report on Form 8-K filed with the SEC on November 14, 2014. | |||||
Pursuant to Item 601(b)(4)(iii) of Regulation S-K, copies of certain instruments defining the rights of holders of certain long-term debt to the Company and its subsidiaries are not filed and, in lieu thereof, the Company agrees to furnish copies thereof to the SEC upon request. | ||||||
(10) | Material Contracts: | |||||
10.1 | SUPERVALU INC. Excess Benefit Plan Restatement, as amended, is incorporated herein by reference to Exhibit 10.12 to the Company’s Annual Report on Form 10-K for the year ended February 22, 2003.* | |||||
10.2 | Third Amendment of SUPERVALU INC. Excess Benefits Plan Restatement is incorporated herein by reference to Exhibit 10.37 to the Company’s Annual Report on Form 10-K for the year ended February 28, 2009.* | |||||
10.3 | SUPERVALU INC. Executive Deferred Compensation Plan, as amended, is incorporated herein by reference to Exhibit 10.14 to the Company’s Annual Report on Form 10-K for the year ended February 22, 2003.* | |||||
10.4 | SUPERVALU INC. Executive Deferred Compensation Plan II, as amended, is incorporated herein by reference to Exhibit 10.15 to the Company’s Annual Report on Form 10-K for the year ended February 22, 2003.* | |||||
10.5 | Form of Agreement used in connection with the Company’s Executive Post Retirement Survivor Benefit Program is incorporated herein by reference to Exhibit (10)I. to the Company’s Quarterly Report on Form 10-Q for the quarterly period (12 weeks) ended September 12, 1998.* | |||||
10.6 | SUPERVALU INC. Directors Retirement Program, as amended, is incorporated herein by reference to Exhibit 10.18 to the Company’s Annual Report on Form 10-K for the year ended February 22, 2003.* | |||||
10.7 | SUPERVALU INC. Deferred Compensation Plan for Non-Employee Directors, as amended, is incorporated herein by reference to Exhibit 10.11 to the Company’s Annual Report on Form 10-K for the year ended February 22, 2003.* | |||||
111
10.8 | SUPERVALU INC. Non-Employee Directors Deferred Stock Plan, as amended, is incorporated herein by reference to Exhibit 10.24 to the Company’s Annual Report on Form 10-K for the year ended February 22, 2003.* | |||||
10.9 | Amended and Restated SUPERVALU INC. Grantor Trust dated as of May 1, 2002 is incorporated herein by reference to Exhibit 10.3 to the Company’s Quarterly Report on Form 10-Q for the quarterly period (16 weeks) ended June 15, 2002.* | |||||
10.10 | Annual discretionary CEO Bonus Pool is incorporated herein by reference to Exhibit 10.40 to the Company’s Annual Report on Form 10-K for the year ended February 25, 2006.* | |||||
10.11 | Albertson’s, Inc. Executive ASRE Makeup Plan, dated as of September 26, 1999, is incorporated herein by reference to Exhibit 10.3 to the Company’s Quarterly Report on Form 10-Q filed with the SEC on October 20, 2010.* | |||||
10.12 | First Amendment to the Albertson’s, Inc. Executive ASRE Makeup Plan, dated as of May 25, 2001, is incorporated herein by reference to Exhibit 10.14.1 to the Annual Report on Form 10-K of Albertson’s, Inc. (Commission File Number 1-6187) for the year ended January 30, 2003.* | |||||
10.13 | Second Amendment to the Albertson’s, Inc. Executive ASRE Makeup Plan, dated as of December 31, 2001, is incorporated herein by reference to Exhibit 10.14.2 to the Annual Report on Form 10-K of Albertson’s, Inc. (Commission File Number 1-6187) for the year ended January 30, 2003.* | |||||
10.14 | Fourth Amendment to the Albertson’s Inc. Executive ASRE Makeup Plan, dated as of April 28, 2006, is incorporated herein by reference to Exhibit 10.14.3 to the Quarterly Report on Form 10-Q of Albertson’s, Inc. (Commission File Number 1-6187) for the quarter ended May 4, 2006.* | |||||
10.15 | SUPERVALU INC. 2007 Stock Plan, as amended, is incorporated herein by reference to Exhibit 10.1 to the Company’s Current Report on Form 8-K filed with the SEC on May 31, 2007.* | |||||
10.16 | SUPERVALU INC. 2007 Stock Plan Form of Stock Appreciation Rights Agreement is incorporated herein by reference to Exhibit 10.1 to the Company’s Current Report on Form 8-K filed with the SEC on July 20, 2007.* | |||||
10.17 | SUPERVALU INC. 2007 Stock Plan Form of Stock Option Agreement is incorporated herein by reference to Exhibit 10.2 to the Company’s Current Report on Form 8-K filed with the SEC on July 20, 2007.* | |||||
10.18 | SUPERVALU INC. 2007 Stock Plan Form of Restoration Stock Option Agreement is incorporated herein by reference to Exhibit 10.3 to the Company’s Current Report on Form 8-K filed with the SEC on July 20, 2007.* | |||||
10.19 | SUPERVALU INC. 2007 Stock Plan Form of Restricted Stock Award Agreement is incorporated herein by reference to Exhibit 10.1 to the Company’s Quarterly Report on Form 10-Q for the quarter ended September 8, 2007.* | |||||
10.20 | SUPERVALU INC. 2007 Stock Plan Form of Restricted Stock Award Agreement is incorporated herein by reference to Exhibit 10.6 to the Company’s Quarterly Report on Form 10-Q for the quarter ended June 14, 2008.* | |||||
10.21 | SUPERVALU INC. 2007 Stock Plan Form of Restricted Stock Award Terms and Conditions is incorporated herein by reference to Exhibit 10.7 to the Company’s Quarterly Report on Form 10-Q for the quarter ended June 14, 2008.* | |||||
10.22 | Form of 2007 Stock Plan Stock Option Agreement and Stock Option Terms and Conditions for Officers is incorporated herein by reference to Exhibit 10.2 to the Company’s Current Report on Form 8-K filed with the SEC on April 20, 2010.* | |||||
10.23 | Form of 2007 Stock Plan Restricted Stock Award Agreement and Restricted Stock Award Terms and Conditions for Officers is incorporated herein by reference to Exhibit 10.3 to the Company’s Current Report on Form 8-K filed with the SEC on April 20, 2010.* | |||||
10.24 | Form of 2007 Stock Plan Restricted Stock Unit Award Agreement and Restricted Stock Unit Award Terms and Conditions for Officers, is incorporated herein by reference to Exhibit 10.4 to the Company’s Current Report on Form 8-K filed with the SEC on April 20, 2010.* | |||||
10.25 | SUPERVALU INC. 2007 Stock Plan Fiscal 2013-2015 Multi-Year Performance Award Terms and Conditions is incorporated herein by reference to Exhibit 10.1 to the Company’s Current Report on Form 8-K filed with the SEC on April 20, 2012.* | |||||
112
10.26 | SUPERVALU Executive Deferred Compensation Plan (2008 Statement) is incorporated herein by reference to Exhibit 10.1 to the Company’s Quarterly Report on Form 10-Q for the quarter ended November 29, 2008.* | |||||
10.27 | Form of Change of Control Severance Agreement, as amended, is incorporated herein by reference to Exhibit 10.1 to the Company’s Quarterly Report on Form 10-Q for the quarter ended June 20, 2009.* | |||||
10.28 | Form of Change of Control Severance Agreement is incorporated herein by reference to Exhibit 10.1 to the Company’s Current Report on Form 8-K filed with the SEC on November 22, 2013.* | |||||
10.29 | Executive & Officer Severance Pay Plan is incorporated herein by reference to Exhibit 10.1 to the Company’s Quarterly Report on Form 10-Q for the quarter ended September 12, 2009.* | |||||
10.30 | Amendment No. 1 to Executive and Officer Severance Pay Plan is incorporated by reference to the Company’s Annual Report on Form 10-K filed with the SEC on April 19, 2012.* | |||||
10.31 | Second Amendment to the SUPERVALU INC. Executive and Officer Severance Pay Plan is incorporated herein by reference to Exhibit 10.2 to the Company’s Current Report on Form 8-K filed with the SEC on January 14, 2013.* | |||||
10.32 | Third Amendment to the SUPERVALU INC. Executive and Officer Severance Pay Plan is incorporated herein by reference to Exhibit 10.3 to the Company’s Current Report on Form 8-K filed with the SEC on January 14, 2013.* | |||||
10.33 | Summary of Non-Employee Director Compensation is incorporated herein by reference to the Company's Annual Report on Form 10-K filed with the SEC on April 28, 2015.* | |||||
10.34 | SUPERVALU INC. 2012 Stock Plan (As Amended and Restated July 16, 2014), is incorporated herein by reference to Exhibit 10.1 to the Company's Current Report on Form 8-K filed with the SEC on July 21, 2014.* | |||||
10.35 | SUPERVALU INC. 2012 Stock Plan Form of Stock Option Agreement is incorporated herein by reference to Exhibit 10.2 to the Company’s Current Report on Form 8-K filed with the SEC on July 18, 2012.* | |||||
10.36 | SUPERVALU INC. 2012 Stock Plan Form of Stock Option Terms and Conditions (For Employees) is incorporated herein by reference to Exhibit 10.3 to the Company’s Current Report on Form 8-K filed with the SEC on July 18, 2012.* | |||||
10.37 | SUPERVALU INC. 2012 Stock Plan Form of Restricted Stock Award Agreement is incorporated herein by reference to Exhibit 10.4 to the Company’s Current Report on Form 8-K filed with the SEC on July 18, 2012.* | |||||
10.38 | SUPERVALU INC. 2012 Stock Plan Form of Restricted Stock Award Terms and Conditions is incorporated herein by reference to Exhibit 10.5 to the Company’s Current Report on Form 8-K filed with the SEC on July 18, 2012.* | |||||
10.39 | SUPERVALU INC. 2012 Stock Plan Form of Fiscal 2013-2015 Multi-Year Performance Award Terms and Conditions is incorporated herein by reference to Exhibit 10.6 to the Company’s Current Report on Form 8-K filed with the SEC on July 18, 2012.* | |||||
10.40 | SUPERVALU INC. 2012 Stock Plan as amended May 6, 2013 is incorporated herein by reference to Exhibit 10.1 to the Company’s Current Report on Form 8-K filed with the SEC on May 8, 2013.* | |||||
10.41 | SUPERVALU INC. 2012 Stock Plan Form of Stock Option Agreement and Terms and Conditions (Employees) adopted May 6, 2013 is incorporated herein by reference to Exhibit 10.2 to the Company’s Current Report on Form 8-K filed with the SEC on May 8, 2013.* | |||||
10.42 | SUPERVALU INC. 2012 Stock Plan Form of Stock Option Agreement and Terms and Conditions (Directors) adopted May 6, 2013 is incorporated herein by reference to Exhibit 10.3 to the Company’s Current Report on Form 8-K filed with the SEC on May 8, 2013.* | |||||
10.43 | SUPERVALU INC. 2012 Stock Plan Form of Restricted Stock Award Agreement and Terms and Conditions adopted May 6, 2013 is incorporated herein by reference to Exhibit 10.4 to the Company’s Current Report on Form 8-K filed with the SEC on May 8, 2013.* | |||||
10.44 | SUPERVALU INC. 2012 Stock Plan Form of Bonus Restricted Stock Award Agreement and Terms and Conditions adopted May 6, 2013 is incorporated herein by reference to Exhibit 10.5 to the Company’s Current Report on Form 8-K filed with the SEC on May 8, 2013.* | |||||
113
10.45 | SUPERVALU INC. Directors’ Deferred Compensation Plan (2009 Statement), as amended, is incorporated herein by reference to Exhibit 10.7 to the Company’s Current Report on Form 8-K filed with the SEC on July 18, 2012.* | |||||
10.46 | Amended and Restated SUPERVALU INC. Grantor Trust dated as of May 1, 2002 is incorporated herein by reference to Exhibit 10.3 to the Company’s Quarterly Report on Form 10-Q for the quarterly period (16 weeks) ended June 15, 2002.* | |||||
10.47 | Trust Agreement Amendment, dated January 9, 2013, by and between SUPERVALU INC. and Wells Fargo Bank Minnesota, N.A., is incorporated herein by reference to Exhibit 10.4 to the Company’s Current Report on Form 8-K filed with the SEC on January 14, 2013.* | |||||
10.48 | Form of Retention Agreement, dated as of July 16, 2012, between SUPERVALU, INC. and certain key employees, is incorporated herein by reference to Exhibit 10.1 to the Company’s Quarterly Report on Form 10-Q filed with the SEC on July 23, 2012.* | |||||
10.49 | Amended and Restated Credit Agreement, dated March 21, 2013, among SUPERVALU INC., as Lead Borrower, the subsidiaries of the Company named as borrowers therein, the subsidiaries of the Company named as guarantors therein, Wells Fargo Bank, National Association, as Administrative Agent, Swing Line Lender and LC Issuer, certain other lenders party thereto, as LC Issuers, and the lenders party thereto, U.S. Bank, National Association and Rabobank Nederland, New York Branch, as Co-Syndication Agents, Wells Fargo Bank, National Association, as collateral agent, Goldman Sachs Bank USA, Credit Suisse AG, Morgan Stanley Senior Funding, Inc., Barclays Bank PLC and Bank of America, N.A., as Co-Documentation Agents, BMO Harris Bank N.A., RBS Citizens Business Capital, a division of RBS Asset Finance, Inc., Regions Bank and Union Bank, N.A., as Senior Managing Agents, and Wells Fargo Bank, National Association, U.S. Bank, National Association, Goldman Sachs Bank USA, Credit Suisse Securities (USA) LLC, Morgan Stanley Senior Funding, Inc., Barclays Bank PLC, Rabobank Nederland, New York Branch and Merrill Lynch, Pierce, Fenner & Smith Incorporated, as Joint Lead Arrangers and Joint Bookrunners, is incorporated herein by reference to Exhibit 10.3 to the Company’s Current Report on Form 8-K filed with the SEC on March 26, 2013.** | |||||
10.50 | Term Loan Credit Agreement, dated March 21, 2013, among SUPERVALU INC., as Borrower, the subsidiaries of the Company named as guarantors therein, the lenders parties thereto, Goldman Sachs Bank USA, as Administrative Agent and Collateral Agent, Goldman Sachs Bank USA, Credit Suisse Securities (USA) LLC, Morgan Stanley Senior Funding, Inc., Merrill Lynch, Pierce, Fenner & Smith Incorporated and Barclays Bank PLC, as Joint Lead Bookrunners and Joint Lead Arrangers, Credit Suisse Securities (USA) LLC and Morgan Stanley Senior Funding, Inc., as Syndication Agents, and Merrill Lynch, Pierce, Fenner & Smith Incorporated and Barclays Bank PLC, as Documentation Agents, is incorporated herein by reference to Exhibit 10.4 to the Company’s Current Report on Form 8-K filed with the SEC on March 26, 2013.** | |||||
10.51 | Amendment Agreement, dated May 16, 2013, among SUPERVALU INC., as Borrower, the subsidiaries of the Company named as loan parties therein, Goldman Sachs Bank USA, as Administrative Agent and Collateral Agent, and the lenders parties thereto, is incorporated herein by reference to Exhibit 10.1 to the Company’s Current Report on Form 8-K filed with the SEC on May 22, 2013.** | |||||
10.52 | Amendment Agreement, dated January 31, 2014, among SUPERVALU INC., as Borrower, the subsidiaries of the Company named as loan parties therein, Goldman Sachs Bank USA, as Administrative Agent and Collateral Agent, and the lenders parties thereto is incorporated herein by reference to Exhibit 10.1 to the Company’s Current Report on Form 8-K filed with the SEC on February 4, 2014.** | |||||
10.53 | Amendment No. 1 to Amended and Restated Credit Agreement, dated April 17, 2014, among SUPERVALU INC., as Borrower, the subsidiaries of the Company named as loan parties therein, Wells Fargo, N.A., as Administrative Agent and Collateral Agent, and the lenders parties thereto, is incorporated by reference to Exhibit 2.1 to the Company’s Current Report on Form 8-K filed with the SEC on April 18, 2014.** | |||||
10.54 | Amendment No. 2 to Amended and Restated Credit Agreement, dated September 30, 2014, among SUPERVALU INC., as Lead Borrower, the subsidiaries of the Company named as borrowers therein, the subsidiaries of the Company named as guarantors therein, Wells Fargo Bank, National Association, as Administrative Agent and Collateral Agent and the lenders parties thereto, is incorporated herein by reference to Exhibit 10.1 to the Company's Current Report on Form 8-K filed with the SEC on October 1, 2014. | |||||
10.55 | Transition Services Agreement, dated as of March 21, 2013, by and between SUPERVALU INC. and Albertson’s LLC, is incorporated herein by reference to Exhibit 10.1 to the Company’s Current Report on Form 8-K filed with the SEC on March 26, 2013.** | |||||
114
10.56 | Transition Services Agreement, dated as of March 21, 2013, by and between SUPERVALU INC. and New Albertson’s, Inc., is incorporated herein by reference to Exhibit 10.2 to the Company’s Current Report on Form 8-K filed with the SEC on March 26, 2013.** | |||||
10.57 | Letter Agreement, dated April 16, 2015, to each of the Transition Services Agreement between SUPERVALU INC. and New Albertson’s, Inc. dated March 21, 2013, and the Transition Services Agreement between SUPERVALU INC. and Albertson’s LLC dated March 21, 2013 is incorporated herein by reference to Exhibit 10.1 to the Company's Current Report on Form 8-K filed with the SEC on April 17, 2015. | |||||
10.58 | Letter Agreement, dated August 2, 2012, between SUPERVALU INC. and Wayne C. Sales, is incorporated herein by reference to Exhibit 10.10 to the Company’s Quarterly Report on Form 10-Q filed with the SEC on October 19, 2012.* | |||||
10.59 | Letter Agreement Amendment, dated February 3, 2013 between SUPERVALU INC. and Wayne C. Sales, is incorporated herein by reference to Exhibit 10.2 to the Company’s Current Report on Form 8-K filed with the SEC on February 4, 2013.* | |||||
10.60 | Letter Agreement, dated January 10, 2013, between SUPERVALU INC. and Sam Duncan, is incorporated herein by reference to Exhibit 10.1 to the Company’s Current Report on Form 8-K filed with the SEC on January 14, 2013.* | |||||
10.61 | Letter Agreement Amendment, dated February 3, 2013 between SUPERVALU INC. and Sam K. Duncan, is incorporated herein by reference to Exhibit 10.1 to the Company’s Current Report on Form 8-K filed with the SEC on February 4, 2013.* | |||||
10.62 | SUPERVALU INC. Inducement Grant Stock Option Agreement and Terms and Conditions, effective as of February 4, 2013, between SUPERVALU INC. and Sam Duncan is incorporated herein by reference to the Company’s Annual Report on Form 10-K filed with the SEC on April 24, 2013.* | |||||
10.63 | Letter Agreement, dated May 7, 2013, between SUPERVALU INC. and Sherry M. Smith is incorporated herein by reference to Exhibit 10.11 to the Company’s Quarterly Report on Form 10-Q for the quarterly period (16 weeks) ended June 15, 2013 filed with the SEC on July 24, 2013.* | |||||
10.64 | Letter Agreement, dated July 23, 2013, between SUPERVALU INC. and Bruce H. Besanko is incorporated by reference herein to Exhibit 10.1 to the Company’s Current Report on Form 8-K filed with the SEC on July 24, 2013.* | |||||
10.65 | SUPERVALU INC. 2012 Stock Plan Form of Restricted Stock Unit Award Agreement and Restricted Stock Unit Award Terms and Conditions for Employees (Cash-Settled) is incorporated herein by reference to Exhibit 10.1 to the Company's Current Report on Form 8-K filed with the SEC on May 20, 2014.* | |||||
10.66 | SUPERVALU INC. 2012 Stock Plan Form of Stock Option Agreement is incorporated herein by reference to Exhibit 10.1 to the Company's Quarterly Report on Form 10-Q filed with the SEC on July 24, 2014.* | |||||
10.67 | SUPERVALU INC. 2012 Stock Plan Form of Restricted Stock Award Agreement, is incorporated herein by reference to Exhibit 10.2 to the Company's Quarterly Report on Form 10-Q filed with the SEC on July 24, 2014.* | |||||
10.68 | SUPERVALU INC. 2012 Stock Plan Form of Restricted Stock Unit Award Agreement (Stock-Settled), is incorporated herein by reference to Exhibit 10.3 to the Company's Quarterly Report on Form 10-Q filed with the SEC on July 24, 2014.* | |||||
10.69 | SUPERVALU INC. 2012 Stock Plan Form of Restricted Stock Unit Award Agreement and Restricted Stock Unit Award Terms and Conditions for Employees (Cash-Settled) is incorporated herein by reference to the Company's Annual Report on Form 10-K filed with the SEC on April 28, 2015.* | |||||
10.70 | SUPERVALU INC. 2012 Stock Plan Form of Stock Option Agreement is incorporated herein by reference to Exhibit 10.1 to the Company's Quarterly Report on Form 10-Q filed with the SEC on July 28, 2015.* | |||||
10.71 | SUPERVALU INC. 2012 Stock Plan Form of Restricted Stock Award Agreement is incorporated herein by reference to Exhibit 10.2 to the Company's Quarterly Report on Form 10-Q filed with the SEC on July 28, 2015.* | |||||
10.72 | SUPERVALU INC. 2012 Stock Plan Form of Restricted Stock Unit Award Agreement (Stock-Settled) is incorporated herein by reference to Exhibit 10.3 to the Company's Quarterly Report on Form 10-Q filed with the SEC on July 28, 2015.* | |||||
115
10.73 | SUPERVALU INC. 2012 Stock Plan Form of Performance Share Unit Award Agreement is incorporated herein by reference to Exhibit 10.1 to the Company's Current Report on Form 8-K filed with the SEC on April 25, 2016.* | |||||
10.74 | Letter Agreement, dated December 2, 2015, between SUPERVALU INC. and Eric Claus is incorporated herein by reference to the Company’s Quarterly Report on Form 10-Q filed with the SEC on January 13, 2016.* | |||||
10.75 | Letter Agreement, dated February 2, 2016, between SUPERVALU INC. and Mark Gross is incorporated herein by reference to Exhibit 10.1 to the Company’s Current Report on Form 8-K filed with the SEC on February 3, 2016.* | |||||
10.76 | Letter Agreement, dated January 31, 2014, between SUPERVALU INC. and Susan Grafton.* | |||||
10.77 | Aircraft Time Sharing Agreement, dated March 8, 2016, between SUPERVALU INC. and Mark Gross is incorporated herein by reference to Exhibit 10.1 to the Company’s Current Report on Form 8-K filed with the SEC on March 10, 2016. | |||||
10.78 | Amendment No. 3 to Amended and Restated Credit Agreement, dated February 3, 2016, among SUPERVALU INC., as Lead Borrower, the subsidiaries of the Company named as borrowers therein, the subsidiaries of the Company named as guarantors therein, Wells Fargo Bank, National Association, as Administrative Agent and Collateral Agent and the lenders parties thereto is incorporated herein by reference to Exhibit 10.1 to the Company’s Current Report on Form 8-K filed with the SEC on February 4, 2016. ** | |||||
(12) | Statements re computation of ratios. | |||||
12.1 | Ratio of Earnings to Fixed Charges. | |||||
(21) | Subsidiaries of the Company. | |||||
21.1. | SUPERVALU INC. Subsidiaries. | |||||
(23) | Consents of Experts and Counsel. | |||||
23.1. | Consent of KPMG LLP. | |||||
(24) | Power of Attorney. | |||||
24.1. | Power of Attorney. | |||||
(31) | Rule 13a-14(a)/15d-14(a) Certifications. | |||||
31.1. | Chief Executive Officer Certification of Periodic Financial Report pursuant to Section 302 of the Sarbanes-Oxley Act of 2002. | |||||
31.2. | Chief Financial Officer Certification of Periodic Financial Report pursuant to Section 302 of the Sarbanes-Oxley Act of 2002. | |||||
(32) | Section 1350 Certifications. | |||||
32.1. | Chief Executive Officer Certification of Periodic Financial Report pursuant to Section 906 of the Sarbanes-Oxley Act of 2002. | |||||
32.2. | Chief Financial Officer Certification of Periodic Financial Report pursuant to Section 906 of the Sarbanes-Oxley Act of 2002. | |||||
(101) | Interactive Data File. | |||||
101. | The following materials from the SUPERVALU INC. Annual Report on Form 10-K for the fiscal year ended February 27, 2016 formatted in Extensible Business Reporting Language (XBRL): (i) the Consolidated Segment Financial Information (ii) the Consolidated Statements of Operations, (iii) the Consolidated Statements of Comprehensive Income, (iv) the Consolidated Balance Sheets, (v) the Consolidated Statements of Stockholders’ Deficit, (vi) the Consolidated Statements of Cash Flows and (vii) the Notes to Consolidated Financial Statements. | |||||
* | Indicates management contracts, compensatory plans or arrangements required to be filed pursuant to Item 601(b)(10)(iii)(A) of Regulation S-K. |
** | Pursuant to Rule 24b-2 of the Securities Exchange Act of 1934, as amended, confidential portions of this exhibit have been deleted and filed separately with the SEC pursuant to a request for confidential treatment. |
116
SIGNATURES
Pursuant to the requirements of Section 13 or 15(d) of the Securities Exchange Act of 1934, SUPERVALU INC. has duly caused this Annual Report on Form 10-K to be signed on its behalf by the undersigned, thereunto duly authorized.
SUPERVALU INC. | |||
(Registrant) | |||
Dated: April 26, 2016 | By: | /S/ MARK GROSS | |
Mark Gross | |||
Chief Executive Officer and President | |||
Pursuant to the requirements of the Securities Exchange Act of 1934, this Annual Report on Form 10-K has been signed below by the following persons on behalf of SUPERVALU INC. and in the capacities and on the dates indicated:
Signature | Title | Date | ||
/s/ MARK GROSS | Chief Executive Officer, President and Director (principal executive officer) | April 26, 2016 | ||
Mark Gross | ||||
/S/ BRUCE H. BESANKO | Executive Vice President, Chief Operating Officer and Chief Financial Officer (principal financial officer) | April 26, 2016 | ||
Bruce H. Besanko | ||||
/S/ SUSAN S. GRAFTON | Senior Vice President, Finance, and Chief Accounting Officer (principal accounting officer) | April 26, 2016 | ||
Susan S. Grafton | ||||
/S/ DONALD R. CHAPPEL* | Director | |||
Donald R. Chappel | ||||
/S/ IRWIN S. COHEN* | Director | |||
Irwin S. Cohen | ||||
/S/ PHILIP L. FRANCIS* | Director | |||
Philip L. Francis | ||||
/S/ ERIC G. JOHNSON* | Director | |||
Eric G. Johnson | ||||
/S/ MATHEW M. PENDO* | Director | |||
Mathew M. Pendo | ||||
/S/ MATTHEW E. RUBEL* | Director | |||
Matthew E. Rubel | ||||
/S/ FRANCESCA RUIZ DE LUZURIAGA* | Director | |||
Francesca Ruiz de Luzuriaga | ||||
/S/ WAYNE C. SALES* | Director | |||
Wayne C. Sales | ||||
/S/ FRANK A. SAVAGE* | Director | |||
Frank A. Savage | ||||
/S/ GERALD L. STORCH* | Director and Non-Executive Chairman | |||
Gerald L. Storch | ||||
* | Executed this 26th day of April 2016, on behalf of the indicated Directors by Karla C. Robertson, duly appointed Attorney-in-Fact. |
By: | /S/ KARLA C. ROBERTSON | |
Karla C. Robertson | ||
Attorney-in-Fact | ||
117