Attached files
| file | filename |
|---|---|
| EX-99.2 - EXHIBIT 99.2 - TIAA REAL ESTATE ACCOUNT | ex992093018.htm |
| 8-K - 8-K - TIAA REAL ESTATE ACCOUNT | tiaarealestate8-k93018.htm |
TIAA Retirement Annuity Accounts | Exhibit 99.1 | |||||||||||||
TIAA Real Estate Account | ||||||||||||||
Real Estate | As of 09/30/18 | |||||||||||||
Portfolio Net Assets $25.6 Billion | Inception Date 10/2/1995 | Symbol QREARX | Estimated Annual Expenses1 2 0.79% | |||||||||||
Portfolio Strategies | Performance | |||||||||||||
This variable annuity account seeks to generate favorable total returns primarily through the rental income and appreciation of a diversified portfolio of directly held, private real estate and real estate-related investments while offering investors guaranteed, daily liquidity. The Account will also invest in non-real-estate-related publicly traded securities and short-term, higher quality liquid investments that are easily converted to cash to enable the Account to meet participant redemption requests, purchase or improve properties or cover other expense needs. The Account intends to have between 75% and 85% of its net assets invested directly in real estate or real estate-related assets with the goal of producing favorable long-term returns. The Account’s principal strategy is to purchase direct ownership interests in income-producing properties, primarily office, industrial, retail and multi-family residential properties. The Account may also make foreign real estate investments. Under the Account’s investment guidelines, investments in direct foreign real estate, together with foreign real estate-related securities and foreign non-real-estate-related liquid investments, may not comprise more than 25% of the Account’s net assets. The Account will invest the remaining portion of its assets (targeted between 15% and 25% of net assets) in publicly traded, liquid investments. | Total Return | Average Annual Total Return | ||||||||||||
3 Months | YTD | 1 Year | 3 Years | 5 Years | 10 Years | Since Inception | ||||||||
TIAA Real Estate Account | 1.17% | 3.80% | 5.14% | 5.02% | 7.05% | 2.99% | 6.31% | |||||||
The returns quoted represent past performance, which is no guarantee of future results. Returns and the principal value of your investment will fluctuate. Current performance may be higher or lower than that shown, and you may have a gain or a loss when you redeem your accumulation units. For current performance information, including performance to the most recent month-end, please visit TIAA.org, or call 800-842-2252. Performance may reflect waivers or reimbursements of certain expenses. Absent these waivers or reimbursement arrangements, performance may be lower. | ||||||||||||||
1 The total annual expense deduction, which includes investment management, administration, and distribution expenses, mortality and expense risk charges, and the liquidity guarantee, is estimated each year based on projected expense and asset levels. Differences between actual expenses and the estimate are adjusted quarterly and are reflected in current investment results. Historically, adjustments have been small. | ||||||||||||||
2 The Account’s total annual expense deduction appears in the Account’s prospectus, and may be different than that shown herein due to rounding. Please refer to the prospectus for further details. | ||||||||||||||
Learn More | Hypothetical Growth of $10,000 | |||||||||||||
For more information please contact: 800-842-2252 Weekdays, 8 a.m. to 10 p.m. (ET), Saturdays, 9 a.m. to 6 p.m. (ET), or visit TIAA.org | ||||||||||||||
The chart illustrates the performance of a hypothetical $10,000 investment on September 30, 2008 and redeemed on September 30, 2018. | 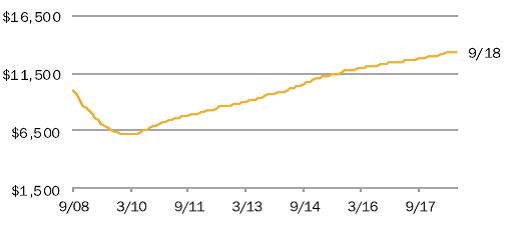 | |||||||||||||
— TIAA Real Estate Account | $13,428 | |||||||||||||
The total returns are not adjusted to reflect sales charges, the effects of taxation or redemption fees, but are adjusted to reflect actual ongoing expenses, and assume reinvestment of dividends and capital gains, net of all recurring costs. | ||||||||||||||
Properties by Type | (As of 09/30/18) | Properties by Region | (As of 09/30/18) | |||||||||||
% of Real Estate Investments3 4 | % of Real Estate Investments3 | |||||||||||||
Office | 38.1 | % | West | 39.5% | ||||||||||
Apartment | 24.1 | % | East | 34.3% | ||||||||||
Retail | 19.7 | % | South | 23.8% | ||||||||||
Industrial | 14.7 | % | Midwest | 2.4% | ||||||||||
Other | 3.4 | % | ||||||||||||
 | 3 Wholly owned properties are represented at fair value and gross of any debt, while joint venture properties are represented at the net equity value. | |||||||||||||
4 Other properties represents interest in Storage Portfolio investments, a fee interest encumbered by a ground lease real estate investment and land. | ||||||||||||||
TIAA Retirement Annuity Accounts | ||||||||||||||||
TIAA Real Estate Account | ||||||||||||||||
Real Estate | As of 09/30/18 | |||||||||||||||
Portfolio Composition | As of 09/30/18 | Market Recap | ||||||||||||||
Investments by Type | % of Net Assets | Economic Conditions stay strong, Real Estate tags along | ||||||||||||||
Real Estate Properties (Net Of Debt) | 49.1 | % | The Bureau of Labor Statistics reported that the U.S. economy added 569,000 jobs during the third quarter of 2018 compared to 651,000 jobs during the second quarter of 2018. The economy created an average of 190,000 jobs over the past three months, below the 12-month average of 211,000. After ending the second quarter 4.0%, the unemployment rate decreased to 3.7% in the third quarter. Finance and professional & business services have been the traditional drivers of demand for office space. The financial services sector saw an increase in jobs added, from 27,000 in the second quarter to 28,000 in the third quarter while the professional and business services sector, which includes many facets of technology-related employment increased as well, adding 158,000 jobs during the third quarter as compared to 155,000 during the second quarter. With the suburban and downtown vacancy rates either decreasing or remaining steady, vacancy nationwide decreased from 12.9% in the second quarter of 2018 to 12.8% for the third quarter, as reported by CB Richard Ellis Econometric Advisors ("CBRE-EA"). Vacancy rates declined in 35 of the 63 markets tracked by CBRE-EA. The national industrial availability rate ticked down to 7.1% in the third quarter, as compared to 7.2% in the second quarter. Overall, availability rates decreased in 37 of the 64 industrial markets tracked by CBRE-EA. Continuing strength in domestic economic fundamentals including gains in employment, real disposable income, and households’ net worth continue to be supportive of strong consumer activity, suggesting that the industrial sector still has ways to go in its growth cycle. Preliminary data from the U.S. Census Bureau indicate that retail sales excluding motor vehicles and parts increased 2.1% during the third quarter and 7.3% on a year-over-year basis. Availability rates decreased to 9.1% for the third quarter as compared to 9.3% during the second quarter. Economic conditions have led to increased consumer spending, potentially increasing a higher demand for retail space in the coming quarters. Note: Data subject to revision | |||||||||||||
Real Estate Joint Venture And Limited Partnerships | 23.2 | % | ||||||||||||||
Short Term Investments | 18.9 | % | ||||||||||||||
Marketable Securities Real Estate-Related | 5.6 | % | ||||||||||||||
Loans Receivable | 3.3 | % | ||||||||||||||
Other (Net Receivable/Liability) | (0.1 | )% | ||||||||||||||
Top 10 Holdings5 | As of 09/30/18 | |||||||||||||||
% of Total Investments6 | ||||||||||||||||
Fashion Show | 4.0 | % | ||||||||||||||
DDR | 3.9 | % | ||||||||||||||
The Florida Mall | 3.0 | % | ||||||||||||||
1001 Pennsylvania Avenue | 2.5 | % | ||||||||||||||
Colorado Center | 1.9 | % | ||||||||||||||
Fourth and Madison | 1.9 | % | ||||||||||||||
99 High Street | 1.6 | % | ||||||||||||||
425 Park Avenue | 1.5 | % | ||||||||||||||
Four Oaks Place | 1.4 | % | ||||||||||||||
780 Third Avenue | 1.3 | % | ||||||||||||||
Total | 23.0 | % | ||||||||||||||
Important Information | ||||||||||||||||
5 | The top 10 holdings are subject to change and may not be representative of the Account’s current or future investments. The holdings listed only include the Account’s long-term investments. Money market instruments and/or futures contracts, if applicable, are excluded. The holdings do not include the Account’s entire investment portfolio and should not be considered a recommendation to buy or sell a particular security. | |||||||||||||||
6 | Real estate fair value is presented gross of debt. Investments in joint ventures are presented at the Account's ownership interest. | |||||||||||||||
Fashion Show is held in a joint venture with Brookfield Property Partners LP, in which the Account holds a 50% interest, and is presented gross of debt. As of September 30, 2018, this debt had a fair value of $413.8 million. DDR Joint Venture, in which the Account holds an 85% interest, consists of 23 retail properties located in 10 states, and is presented gross of debt. As of September 30, 2018, this debt had a fair value of $587.7 million. The Florida Mall is held in a joint venture with Simon Property Group, L.P., in which the Account holds a 50% interest, and is presented gross of debt. As of September 30, 2018, this debt had a fair value of $164.7 million. 1001 Pennsylvania Avenue is presented gross of debt. As of September 30, 2018, this debt had a fair value of $322.4 million. Colorado Center is held in a joint venture with EOP Operating LP, in which the Account holds a 50% interest, and is presented gross of debt. As of September 30, 2018, this debt had a fair value of $261.2 million. Fourth and Madison is presented gross of debt. As of September 30, 2018, this debt had a fair value of $284.4 million. 99 High Street is presented gross of debt. As of September 30, 2018, this debt had a fair value of $269.6 million. Four Oaks Place is held in a joint venture with Allianz US Private REIT LP, in which the Account holds 51% interest, and is presented gross of debt. As of September 30, 2018, this debt had a fair value of $80.2 million. 780 Third Avenue is presented gross of debt. As of September 30, 2018, this debt had a fair value of $165.5 million. | ||||||||||||||||
Real estate investment portfolio turnover rate was 2.7% for the year ended 12/31/2017. Real estate investment portfolio turnover rate is calculated by dividing the lesser of purchases or sales of real estate property investments (including contributions to, or return of capital distributions received from, existing joint venture and limited partnership investments) by the average value of the portfolio of real estate investments held during the period. Marketable securities portfolio turnover rate was 5.7% for the year ended 12/31/2017. Marketable securities portfolio turnover rate is calculated by | ||||||||||||||||
Continued on next page… | ||||||||||||||||
TIAA Retirement Annuity Accounts | |||||||||||||||
TIAA Real Estate Account | |||||||||||||||
Real Estate | As of 09/30/18 | ||||||||||||||
dividing the lesser of purchases or sales of securities, excluding securities having maturity dates at acquisition of one year or less, by the average value of the portfolio securities held during the period. | |||||||||||||||
This material is for informational or educational purposes only and does not constitute investment advice under ERISA. This material does not take into account any specific objectives or circumstances of any particular investor, or suggest any specific course of action. Investment decisions should be made based on the investor's own objectives and circumstances. | |||||||||||||||
Teachers Insurance and Annuity Association of America (TIAA), New York, NY, issues annuity contracts and certificates. | |||||||||||||||
TIAA-CREF Individual & Institutional Services, LLC, Teachers Personal Investors Services, Inc., Members FINRA and SIPC, distribute securities products. | |||||||||||||||
Investment, insurance and annuity products are not FDIC insured, are not bank guaranteed, are not deposits, are not insured by any federal government agency, are not a condition to any banking service or activity and may lose value. | |||||||||||||||
THIS MATERIAL MUST BE PRECEDED OR ACCOMPANIED BY A CURRENT PROSPECTUS FOR THE TIAA REAL ESTATE ACCOUNT. PLEASE CAREFULLY CONSIDER THE INVESTMENT OBJECTIVES, RISKS, CHARGES, AND EXPENSES BEFORE INVESTING AND CAREFULLY READ THE PROSPECTUS. ADDITIONAL COPIES OF THE PROSPECTUS CAN BE OBTAINED BY CALLING 877-518-9161. | |||||||||||||||
A Note About Risks | |||||||||||||||
In general, the value of the TIAA Real Estate Account will fluctuate based on the underlying value of the direct real estate or real estate-related securities in which it invests. | |||||||||||||||
The risks associated with investing in the Real Estate Account include the risks associated with real estate ownership including among other things fluctuations in property values, higher expenses or lower income than expected, risks associated with borrowing and potential environmental problems and liability, as well as risks associated with participant flows and conflicts of interest. For a more complete discussion of these and other risks, please consult the prospectus. | |||||||||||||||
©2018 Teachers Insurance and Annuity Association of America-College Retirement Equities Fund, 730 Third Avenue, New York, NY 10017 | |||||||||||||||
534348 | |||||||||||||||