Attached files
| file | filename |
|---|---|
| EXCEL - IDEA: XBRL DOCUMENT - TIAA REAL ESTATE ACCOUNT | Financial_Report.xls |
| EX-31 - TIAA REAL ESTATE ACCOUNT | c67395_ex31.htm |
| EX-32 - TIAA REAL ESTATE ACCOUNT | c67395_ex32.htm |
UNITED STATES
SECURITIES AND EXCHANGE COMMISSION
Washington, D.C. 20549
FORM 10-Q
(Mark One)
S QUARTERLY REPORT PURSUANT TO SECTION 13 OR 15(d) OF THE SECURITIES
EXCHANGE ACT OF 1934
For the quarterly period ended September 30, 2011
OR
£ TRANSITION REPORT PURSUANT TO SECTION 13 OR 15(d) OF THE SECURITIES
EXCHANGE ACT OF 1934
For the transition period from to
Commission file number: 33-92990; 333-172900
TIAA REAL ESTATE ACCOUNT
(Exact name of registrant as specified in its charter)
NEW YORK
(State or other jurisdiction
of incorporation or organization)
NOT APPLICABLE
(I.R.S. Employer Identification No.)
C/O TEACHERS INSURANCE AND
ANNUITY ASSOCIATION OF AMERICA
730 THIRD AVENUE
NEW YORK, NEW YORK 10017-3206
(Address of principal executive offices, including zip code)
Registrant’s telephone number, including area code: (212) 490-9000
Indicate by check mark whether the Registrant (1) has filed all reports required to be filed by Section 13 or 15(d) of the Securities Exchange Act of 1934 during the preceding 12 months (or for such shorter period that the Registrant was required to file such reports), and (2) has been subject to such filing requirements for the past 90 days.
YES S NO £
Indicate by check mark whether the registrant has submitted electronically and posted on its corporate Web site, if any, every Interactive Data File required to be submitted and posted pursuant to Rule 405 of Regulation S-T (§232.405 of this chapter) during the preceding 12 months (or for such shorter period that the registrant was required to submit and post such files).
YES S NO £
Indicate by check mark whether the registrant is a large accelerated filer, an accelerated filer, a non-accelerated filer, or smaller reporting company. See the definitions of “large accelerated filer,” “accelerated filer” and “smaller reporting company” in Rule 12b-2 of the Exchange Act. (Check one):
|
|
|
Large accelerated filer £ |
Accelerated filer £ |
|
Non-accelerated filer S |
Smaller Reporting Company £ |
|
(Do not check if a smaller reporting company) |
|
|
Indicate by check mark whether the registrant is a shell company (as defined in Rule 12b-2 of the Exchange Act).
YES £ NO S
PART I. FINANCIAL INFORMATION ITEM 1. UNAUDITED CONSOLIDATED FINANCIAL STATEMENTS. INDEX TO UNAUDITED CONSOLIDATED FINANCIAL STATEMENTS
Page
3
4
5
6
7
23 2
TIAA REAL ESTATE ACCOUNT
SEPTEMBER 30, 2011
TIAA REAL ESTATE ACCOUNT
September 30,
December 31,
(Unaudited) ASSETS Investments, at fair value: Real estate properties
$
9,827.9
$
8,115.5 Real estate joint ventures and limited partnerships
1,866.6
1,629.1 Marketable securities: Real estate-related
813.0
495.3 Other
2,385.8
2,396.7 Total investments (cost: $15,903.4 and $14,549.4)
14,893.3
12,636.6 Cash and cash equivalents
1.9
12.9 Due from investment advisor
9.6
11.1 Other
224.2
179.3 TOTAL ASSETS
15,129.0
12,839.9 LIABILITIES Mortgage loans payable—Note 8
1,956.7
1,860.2 Accrued real estate property level expenses
169.6
153.7 Other
29.2
22.9 TOTAL LIABILITIES
2,155.5
2,036.8 COMMITMENTS AND CONTINGENCIES—Note 11 NET ASSETS Accumulation Fund
12,677.2
10,535.7 Annuity Fund
296.3
267.4 TOTAL NET ASSETS
12,973.5
10,803.1 NUMBER OF ACCUMULATION UNITS
52.5
48.1 NET ASSET VALUE, PER ACCUMULATION UNIT—Note 9
$
241.482
$
219.173 See notes to the consolidated financial statements 3
CONSOLIDATED STATEMENTS OF ASSETS AND LIABILITIES
(In millions, except per accumulation unit amounts)
2011
2010
(cost: $10,386.0 and $9,449.1)
(cost: $2,238.4 and $2,223.3)
(cost: $893.4 and $480.4)
(cost: $2,385.6 and $2,396.6)
(principal outstanding: $1,931.5 and $1,842.9)
OUTSTANDING—Notes 9 and 10
TIAA REAL ESTATE ACCOUNT
For the Three Months
For the Nine Months
2011
2010
2011
2010 INVESTMENT INCOME Real estate income, net: Rental income
$
223.9
$
222.6
$
657.9
$
652.0 Real estate property level expenses and taxes: Operating expenses
53.0
56.4
164.8
163.4 Real estate taxes
27.9
28.4
82.4
88.2 Interest expense
27.4
30.4
81.2
79.8 Total real estate property level expenses and taxes
108.3
115.2
328.4
331.4 Real estate income, net
115.6
107.4
329.5
320.6 Income from real estate joint ventures and limited partnerships
19.8
28.1
72.9
69.5 Interest
0.7
1.0
2.8
2.1 Dividends
5.8
1.1
12.6
1.1 TOTAL INVESTMENT INCOME
141.9
137.6
417.8
393.3 Expenses—Note 2: Investment advisory charges
13.2
13.6
39.4
36.5 Administrative charges
7.5
5.4
21.8
15.1 Distribution charges
2.3
1.5
6.3
4.2 Mortality and expense risk charges
1.6
1.1
4.5
3.1 Liquidity guarantee charges
6.8
3.4
16.8
9.3 TOTAL EXPENSES
31.4
25.0
88.8
68.2 INVESTMENT INCOME, NET
110.5
112.6
329.0
325.1 NET REALIZED AND UNREALIZED GAIN (LOSS) ON INVESTMENTS AND MORTGAGE LOANS PAYABLE Net realized gain (loss) on investments: Real estate properties
(62.1
)
0.1
(71.4
)
(1.2
) Real estate joint ventures and limited partnerships
(2.1
)
(3.5
)
(10.6
)
(156.7
) Marketable securities
1.3
—
5.0
— Net realized loss on investments
(62.9
)
(3.4
)
(77.0
)
(157.9
) Net change in unrealized appreciation (depreciation) on: Real estate properties
309.0
249.8
775.4
273.0 Real estate joint ventures and limited partnerships
83.6
62.2
236.5
218.2 Marketable securities
(142.4
)
(2.3
)
(92.0
)
(2.2
) Mortgage loans receivable
—
2.3
—
3.7 Mortgage loans payable
(6.4
)
(7.8
)
(6.9
)
(42.1
) Net change in unrealized appreciation on investments
243.8
304.2
913.0
450.6 NET REALIZED AND UNREALIZED
180.9
300.8
836.0
292.7 NET INCREASE IN NET ASSETS
$
291.4
$
413.4
$
1,165.0
$
617.8 See notes to the consolidated financial statements 4
CONSOLIDATED STATEMENTS OF OPERATIONS
(In millions)
(Unaudited)
Ended September 30,
Ended September 30,
and mortgage loans payable
GAIN ON INVESTMENTS AND
MORTGAGE LOANS PAYABLE
RESULTING FROM OPERATIONS
TIAA REAL ESTATE ACCOUNT
For the Three Months
For the Nine Months
2011
2010
2011
2010 FROM OPERATIONS Investment income, net
$
110.5
$
112.6
$
329.0
$
325.1 Net realized loss on investments
(62.9
)
(3.4
)
(77.0
)
(157.9
) Net change in unrealized appreciation on investments and mortgage loans payable
243.8
304.2
913.0
450.6 NET INCREASE IN NET ASSETS RESULTING FROM OPERATIONS
291.4
413.4
1,165.0
617.8 FROM PARTICIPANT TRANSACTIONS Premiums
497.3
773.1
1,876.7
1,720.9 Annuity payments
(5.5
)
(4.4
)
(17.3
)
(14.7
) Withdrawals and death benefits
(433.0
)
(170.4
)
(854.0
)
(630.8
) NET INCREASE IN NET ASSETS
58.8
598.3
1,005.4
1,075.4 NET INCREASE IN NET ASSETS
350.2
1,011.7
2,170.4
1,693.2 NET ASSETS Beginning of period
12,623.3
8,561.4
10,803.1
7,879.9 End of period
$
12,973.5
$
9,573.1
$
12,973.5
$
9,573.1 See notes to the consolidated financial statements 5
CONSOLIDATED STATEMENTS OF CHANGES IN NET ASSETS
(In millions)
(Unaudited)
Ended September 30,
Ended September 30,
RESULTING FROM PARTICIPANT TRANSACTIONS
TIAA REAL ESTATE ACCOUNT
For the Nine Months
2011
2010 CASH FLOWS FROM OPERATING ACTIVITIES Net increase in net assets resulting from operations
$
1,165.0
$
617.8 Adjustments to reconcile net increase in net assets resulting from operations to net cash used in operating activities: Net realized loss on investments
77.0
157.9 Net change in unrealized appreciation on investments and mortgage loans payable
(913.0
)
(450.6
) Purchases of real estate properties
(1,108.9
)
— Capital improvements on real estate properties
(120.9
)
(88.9
) Proceeds from sale of real estate properties
228.3
— Proceeds from mortgage loan receivable
—
75.0 Purchases of long term investments
(458.1
)
(369.4
) Proceeds from sale of long term investments
34.4
52.8 Decrease (increase) in other investments
18.4
(1,030.3
) Change in due to/(from) investment advisor
1.5
(8.2
) (Increase) decrease in other assets
(44.6
)
3.0 Increase in accrued real estate property level expenses
8.5
4.9 Increase in other liabilities
6.3
1.5 NET CASH USED IN OPERATING ACTIVITIES
(1,106.1
)
(1,034.5
) CASH FLOWS FROM FINANCING ACTIVITIES Mortgage loans proceeds received
105.0
273.2 Principal payments on mortgage loans payable
(15.3
)
(329.6
) Premiums
1,876.7
1,720.9 Annuity payments
(17.3
)
(14.7
) Withdrawals and death benefits
(854.0
)
(630.8
) NET CASH PROVIDED BY FINANCING ACTIVITIES
1,095.1
1,019.0 NET DECREASE IN CASH AND CASH EQUIVALENTS
(11.0
)
(15.5
) CASH AND CASH EQUIVALENTS Beginning of period
12.9
24.9 End of period
$
1.9
$
9.4 SUPPLEMENTAL DISCLOSURES: Cash paid for interest
$
81.3
$
79.7 See notes to the consolidated financial statements 6
CONSOLIDATED STATEMENTS OF CASH FLOWS
(In millions)
(Unaudited)
Ended September 30,
TIAA REAL ESTATE ACCOUNT Note 1—Organization and Significant Accounting Policies Business: The TIAA Real Estate Account (“Account”) is a segregated investment account of Teachers Insurance and Annuity Association of America (“TIAA”) and was established by resolution of TIAA’s Board of Trustees (the “Board”) on February 22, 1995, under the insurance laws of the State of New York,
for the purpose of funding variable annuity contracts issued by TIAA. The Account offers individual and group accumulating annuity contracts (with contributions made on a pre-tax or after-tax basis), as well as individual lifetime and term-certain variable payout annuity contracts (including the payment of death
benefits to beneficiaries). Investors are entitled to transfer funds to or from the Account, and make withdrawals from the Account on a daily basis under certain circumstances. Funds invested in the Account for each category of contract are expressed in terms of units, and unit values will fluctuate depending on the
Account’s performance. The investment objective of the Account is to seek favorable long-term returns primarily through rental income and capital appreciation from real estate and real estate-related investments owned by the Account. The Account holds real estate properties directly and through subsidiaries wholly owned by TIAA for
the benefit of the Account. The Account also holds interests in real estate joint ventures and limited partnerships in which the Account does not hold a controlling interest; as such, such interests are not consolidated into these consolidated financial statements. The Account also has invested in mortgage loans
receivable collateralized by commercial real estate properties. Additionally, the Account invests in real estate-related and non real estate-related publicly-traded securities, cash and other instruments to maintain adequate liquidity levels for operating expenses, capital expenditures and to fund benefit payments
(withdrawals, transfers and related transactions). The consolidated financial statements were prepared in accordance with accounting principles generally accepted in the United States of America, which may require the use of estimates made by management. Actual results may vary from those estimates and such differences may be material. These unaudited
interim consolidated financial statements reflect, in the opinion of management, all material adjustments necessary to fairly state the results of operations and financial position for the periods presented. The following is a summary of the significant accounting policies of the Account. Basis of Presentation: The accompanying consolidated financial statements include the Account and those subsidiaries wholly owned by TIAA for the benefit of the Account. All significant intercompany accounts and transactions between the Account and such subsidiaries have been eliminated. The Accumulation
Unit Value (“AUV”) used for financial reporting purposes may differ from the AUV used for processing transactions. The AUV used for financial reporting purposes includes security and participant transactions effective through the date of the report. Determination of Investments at Fair Value: The Account reports all investments at fair value in accordance with the Financial Accounting Standards Board (“FASB”) Accounting Standard Codification (“ASC”) 946, Financial Services—Investment Companies. Further in accordance with the adoption of the fair value
option allowed under ASC 825, Financial Instruments, and at the election of Account management, mortgage loans payable are reported at fair value. The FASB has defined fair value as the price that would be received to sell an asset or paid to transfer a liability in an orderly transaction between market
participants. The following is a description of the valuation methodologies used to determine the fair value of the Account’s investments and investment related mortgage loans payable. Valuation of Real Estate Properties—Investments in real estate properties are stated at fair value, as determined in accordance with policies and procedures reviewed by the Investment Committee of the Board and in accordance with the responsibilities of the Board as a whole. Accordingly, the Account does not
record depreciation. Determination of fair value involves significant levels of judgment because the actual fair value of real estate can be determined only by negotiation between the parties in a sales transaction. The Account’s primary objective when valuing its real estate investments will be to produce a valuation
that represents a reasonable estimate of the fair value of its investments. Implicit in the Account’s definition of fair value are the consummation of a sale as of a specified date and the passing of title from seller to buyer under conditions whereby: 7
NOTES TO THE CONSOLIDATED FINANCIAL STATEMENTS
•
Buyer and seller are typically motivated; • Both parties are well informed or well advised, and acting in what they consider their best interests; • A reasonable time is allowed for exposure in the open market; • Payment is made in terms of cash or in terms of financial arrangements comparable thereto; and • The price represents the normal consideration for the property sold unaffected by special or creative financing or sales concessions granted by anyone associated with the sale. Property and investment values are affected by, among other things, the availability of capital, occupancy rates, rental rates, and interest and inflation rates. As a result, determining real estate and investment values involves many assumptions. Key inputs and assumptions include rental income and expense
amounts, related rental income and expense growth rates, discount rates and capitalization rates. Valuation techniques include discounted cash flow analysis, prevailing market capitalization rates or multiples applied to earnings from the property, analysis of recent comparable sales transactions, actual sale
negotiations and bona fide purchase offers received from third parties. Amounts ultimately realized from each investment may vary significantly from the fair value presented. Real estate properties owned by the Account are initially valued based on an independent third party appraisal, as reviewed by TIAA’s internal appraisal staff and as applicable the Account’s independent fiduciary at the time of the closing of the purchase, which may result in a potential unrealized gain or loss
reflecting the difference between an investment’s fair value (i.e., exit price) and its cost basis (which is inclusive of transaction costs). Subsequently, each property is appraised each quarter by an independent third party appraiser, reviewed by TIAA’s internal appraisal staff and as applicable the Account’s independent fiduciary. In general, the Account obtains appraisals of its real estate properties spread out throughout the quarter, which is
intended to result in appraisal adjustments, and thus, adjustments to the valuations of its holdings (to the extent such adjustments are made) that happen regularly throughout each quarter and not on one specific day or month in each period. Further, management reserves the right to order an appraisal and/or conduct another valuation outside of the normal quarterly process when facts or circumstances at a specific property change. For example, under certain circumstances a valuation adjustment could be made when the account receives a bona fide
bid for the sale of a property held within the Account or one of the Account’s joint ventures. In addition, adjustments may be made for events or circumstances indicating an impairment of a tenant’s ability to pay amounts due to the Account under a lease (including due to a bankruptcy filing of that tenant).
Alternatively, adjustments may be made to reflect the execution or renewal of a significant lease. Also, adjustments may be made to reflect factors (such as sales values for comparable properties or local employment rate) bearing uniquely on a particular region in which the Account holds properties. TIAA’s
internal appraisal staff oversees the entire appraisal process, in conjunction with the Account’s independent fiduciary (the independent fiduciary is more fully described in the paragraph below). Any differences in the conclusions of TIAA’s internal appraisal staff and the independent appraiser will be reviewed by
the independent fiduciary, which will make a final determination on the matter (which may include ordering a subsequent independent appraisal). The independent fiduciary, Real Estate Research Corporation, has been appointed by a special subcommittee of the Investment Committee of the Board to, among other things, oversee the appraisal process. The independent fiduciary must approve all independent appraisers used by the Account. All appraisals are
performed in accordance with Uniform Standards of Professional Appraisal Practices, the real estate appraisal industry standards created by The Appraisal Foundation. Real estate appraisals are estimates of property values based on a professional’s opinion. Appraisals of properties held outside of the U.S. are
performed in accordance with industry standards commonly applied in the applicable jurisdiction. These independent appraisers are always expected to be MAI-designated members of the Appraisal Institute (or its European equivalent, Royal Institute of Chartered Surveyors) and state certified appraisers from
national or regional firms with relevant property type experience and market knowledge. Under the Account’s current procedures, each independent appraisal firm will be rotated off of a particular property at least every three 8
years, although such appraisal firm may perform appraisals of other Account properties subsequent to such rotation. Also, the independent fiduciary can require additional appraisals if factors or events have occurred that could materially change a property’s value (including those identified above) and such change is not reflected in the quarterly valuation review, or otherwise to ensure that the Account is valued appropriately.
The independent fiduciary must also approve any valuation change of real estate-related assets where a property’s value changed by more than 6% from the most recent independent annual appraisal, or if the value of the Account would change by more than 4% within any calendar quarter or more than 2% since
the prior calendar month. When a real estate property is subject to a mortgage, the property is valued independently of the mortgage and the property and mortgage fair values are reported separately (see “Valuation of Mortgage Loans Payable” below). The independent fiduciary reviews and approves all
mortgage valuation adjustments before such adjustments are recorded by the Account. The Account continues to use the revised value for each real estate property and mortgage loan payable to calculate the Account’s daily net asset value until the next valuation review or appraisal. Valuation of Real Estate Joint Ventures—Real estate joint ventures are stated at the fair value of the Account’s ownership interests of the underlying entities. The Account’s ownership interests are valued based on the fair value of the underlying real estate, any related mortgage loans payable, and other factors, such
as ownership percentage, ownership rights, buy/sell agreements, distribution provisions and capital call obligations. Upon the disposition of all real estate investments by an investee entity, the Account will continue to state its equity in the remaining net assets of the investee entity during the wind down period, if
any, which occurs prior to the dissolution of the investee entity. Valuation of Real Estate Limited Partnerships—Limited partnership interests are stated at the fair value of the Account’s ownership in the partnership which is based on the most recent net asset value of the partnership, as reported by the sponsor. Since market quotations are not readily available, the limited
partnership interests are valued at fair value as determined in good faith under the direction of the Investment Committee of the Board and in accordance with the responsibilities of the Board as a whole. Valuation of Marketable Securities—Equity securities listed or traded on any national market or exchange are valued at the last sale price as of the close of the principal securities market or exchange on which such securities are traded or, if there is no sale, at the mean of the last bid and asked prices on such market
or exchange, exclusive of transaction costs. Debt securities, other than money market instruments, are generally valued at the most recent bid price or the equivalent quoted yield for such securities (or those of comparable maturity, quality and type). Money market instruments, with maturities of one year or less, are valued in the same manner as debt
securities or derived from a pricing matrix. Equity and fixed income securities traded on a foreign exchange or in foreign markets are valued using their closing values under the valuation methods generally accepted in the country where traded, as of the valuation date. This value is converted to U.S. dollars at the exchange rate in effect on the valuation day.
Under certain circumstances (for example, if there are significant movements in the United States markets and there is an expectation the securities traded on foreign markets will adjust based on such movements when the foreign markets open the next day), the Account may adjust the value of equity or fixed
income securities that trade on a foreign exchange or market after the foreign exchange or market has closed. Valuation of Mortgage Loans Receivable—Mortgage loans receivable are stated at fair value and are initially valued at the face amount of the mortgage loan funding. Subsequently, mortgage loans receivable are valued at least quarterly based on market factors, such as market interest rates and spreads for comparable
loans, the liquidity for mortgage loans of similar characteristics, the performance of the underlying collateral and the credit quality of the counterparty. The Account’s mortgage loans receivable were repaid in full during the year ended December 31, 2010. Valuation of Mortgage Loans Payable—Mortgage loans payable are stated at fair value. The estimated fair values of mortgage loans payable are based on the amount at which the liability could be transferred to a third party exclusive of transaction costs. Mortgage loans payable are valued internally by TIAA’s
internal valuation department, as reviewed by the Account’s independent fiduciary, at least quarterly based on market factors, such as market interest rates and spreads for comparable loans, the performance of the 9
underlying collateral (such as the loan-to-value ratio and the cash flow of the underlying collateral), the liquidity for mortgage loans of similar characteristics, the maturity date of the loan, the return demands of the market, and the credit quality of the Account. Interest expense for mortgage loans payable is
recorded on the accrual basis taking into account the outstanding principal and contractual interest rates. See Note 5—Assets and Liabilities Measured at Fair Value on a Recurring Basis for further discussion and disclosure regarding the determination of the fair value of the Account’s investments. Foreign Currency Transactions and Translation: Portfolio investments and other assets and liabilities denominated in foreign currencies are translated into U.S. dollars at the exchange rates prevailing at the end of the period. Purchases and sales of securities, income receipts and expense payments made in foreign
currencies are translated into U.S. dollars at the exchange rates prevailing on the respective dates of the transactions. The effect of any changes in foreign currency exchange rates on portfolio investments and mortgage loans payable are included in net realized and unrealized gains and losses on real estate
properties and mortgage loans payable. Net realized gains and losses on foreign currency transactions include disposition of foreign currencies, and currency gains and losses between the accrual and receipt dates of portfolio investment income and between the trade and settlement dates of portfolio investment
transactions. Accumulation and Annuity Funds: The accumulation fund represents the net assets attributable to participants in the accumulation phase of their investment (“Accumulation Fund”). The annuity fund represents the net assets attributable to the participants currently receiving annuity payments (“Annuity Fund”).
The net increase or decrease in net assets from investment operations is apportioned between the accounts based upon their relative daily net asset values. Once an Account participant begins receiving lifetime annuity income benefits, payment levels cannot be reduced as a result of the Account’s actual mortality
experience. In addition, the contracts pursuant to which the Account is offered are required to stipulate the maximum expense charge for all Account level expenses that can be assessed, which is not to exceed to 2.5% of average net assets per year. The Account pays a fee to TIAA to assume mortality and expense
risks. Accounting for Investments: The investments held by the Account are accounted as follows: Real Estate Properties—Rent from real estate properties consists of all amounts earned under tenant operating leases, including base rent, recoveries of real estate taxes and other expenses and charges for miscellaneous services provided to tenants. Rental income is recognized in accordance with the billing terms of
the lease agreements. The Account bears the direct expenses of the real estate properties owned. These expenses include, but are not limited to, fees to local property management companies, property taxes, utilities, maintenance, repairs, insurance, and other operating and administrative costs. An estimate of the
net operating income earned from each real estate property is accrued by the Account on a daily basis and such estimates are adjusted when actual operating results are determined. Real Estate Joint Ventures—The Account has limited ownership interests in various real estate joint ventures (collectively, the “Joint Ventures”). The Account records its contributions as increases to its investments in the Joint Ventures, and distributions from the Joint Ventures are treated as income within income
from real estate joint ventures and limited partnerships in the Account’s consolidated statements of operations. Distributions that are identified as returns of capital or capital gains or losses are recorded as unrealized gains and realized gains and losses, respectively. Income from the Joint Ventures is recorded based
on the Account’s proportional interest of the income distributed by the Joint Ventures. Income earned but not yet distributed to the Account by the Joint Ventures is recorded as unrealized gains and losses. Limited Partnerships—The Account has limited ownership interests in various private real estate funds (primarily limited partnerships) and a private real estate investment trust (collectively, the “Limited Partnerships”). The Account records its contributions as increases to the investments, and distributions from the
investments are treated as income within income from real estate joint ventures and limited partnerships in the Account’s consolidated statements of operations. Distributions that are identified as returns of capital or capital gains or losses are recorded as unrealized gains and realized gains and losses, respectively.
Unrealized gains and losses are recorded based upon the changes in the net asset values of the Limited Partnerships as determined from the financial statements of the Limited Partnerships when received by the Account. Prior to the receipt of the financial statements from the Limited Partnerships, the Account
estimates the value of its interest in good faith and will from time to time seek input from the issuer or the 10
sponsor of the investments. Changes in value based on such estimates are recorded by the Account as unrealized gains and losses. Marketable Securities—Transactions in marketable securities are accounted for as of the date the securities are purchased or sold (trade date). Interest income is recorded as earned. Dividend income is recorded on the ex-dividend date within dividend income. Dividends that are identified as returns of capital or
capital gains or losses are recorded as unrealized gains and realized gains and losses, respectively. Realized gains and losses on securities transactions are accounted for on the specific identification method. Realized and Unrealized Gains and Losses—Realized gains and losses are recorded at the time an investment is sold or a distribution is received in relation to an investment sale from a Joint Venture or Limited Partnership. Real estate transactions are accounted for as of the date on which the purchase or sale
transactions for the real estate properties close (settlement date). The Account recognizes a realized gain on the sale of a real estate property to the extent that the contract sales price exceeds the cost-to-date of the property being sold. A realized loss occurs when the cost-to-date exceeds the sales price. Unrealized gains and losses are recorded as the fair values of the Account’s investments are adjusted, and as discussed within the Real Estate Joint Ventures and Limited Partnership sections above. Net Assets—The Account’s net assets as of the close of each valuation day are valued by taking the sum of:
•
the value of the Account’s cash; cash equivalents, and short-term and other debt instruments; • the value of the Account’s other securities and other non-real estate assets; • the value of the individual real properties (based on the most recent valuation of that property) and other real estate-related investments owned by the Account; • an estimate of the net operating income accrued by the Account from its properties, other real estate-related investments and non-real estate-related investments (including short-term marketable securities) since the end of the prior valuation day; and • actual net operating income earned from the Account’s properties, other real estate-related investments and non-real estate-related investments (but only to the extent any such item of income differs from the estimated income accrued for on such investments), and then reducing the sum by liabilities held within the Account, including the daily investment management fee, administration and distribution fees, mortality and expense fee, and liquidity guarantee fee, and certain other expenses attributable to operating the Account. Daily estimates of net operating income are
adjusted to reflect actual net operating income on a monthly basis, at which time such adjustments (if any) are reflected in the Account’s unit value. After the end of every quarter, the Account reconciles the amount of expenses deducted from the Account (which is established in order to approximate the costs that the Account will incur) with the expenses the Account actually incurred. If there is a difference, the Account adds it to or deducts it from the
Account in equal daily installments over the remaining days of the following quarter. Material differences may be repaid in the current calendar quarter. The Account’s at-cost deductions are based on projections of Account assets and overall expenses, and the size of any adjusting payments will be directly affected
by the difference between management’s projections and the Account’s actual assets or expenses. Cash and Cash Equivalents: Cash and cash equivalents are balances held by the Account in bank deposit accounts which, at times, exceed federally insured limits. The Account’s management monitors these balances to mitigate the exposure of risk due to concentration and has not experienced any losses from such
concentration. Federal Income Taxes: Based on provisions of the Internal Revenue Code, Section 817, the Account is taxed as a segregated asset account of TIAA and as such, the Account should incur no material federal income tax attributable to the net investment activity of the Account. Management has analyzed the
Account’s tax positions taken for all open federal income tax years (2007-2010) and has concluded no provisions for federal income tax are required as of September 30, 2011. Restricted Cash: The Account held $37.3 million and $18.9 million as of September 30, 2011 and December 31, 2010, respectively, in escrow accounts for property taxes, insurance, and various other property related 11
matters as required by certain creditors related to the Account’s outstanding mortgage loans payable. These amounts are recorded within other assets on the Consolidated Statements of Assets and Liabilities. See Note 8—Mortgage Loans Payable for additional information regarding the Account’s outstanding
mortgage loans payable. Changes in Net Assets: Premiums include premiums paid by existing accumulation unit holders in the Account and transfers into the Account. Withdrawals and death benefits include withdrawals out of the Account which include transfers out of the Account and required minimum distributions. Due to/from Investment Advisor: Due to/from investment advisor represents amounts that were paid or received by TIAA on behalf of the Account. Amounts generally are paid or received by the Account within one or two business days and no interest is contractually charged on these amounts. Reclassifications: The Account has reclassified the presentation in the consolidated statements of changes in net assets with regard to transfers to and from TIAA, CREF Accounts, and TIAA-CREF Funds. Transfers into the Account have been reclassified to Premiums, and transfers out of the Account have been
reclassified amongst annuity and withdrawals and death benefits as appropriate. Certain other prior period amounts have been reclassified to conform to the current presentation. These reclassifications did not affect the Account’s total net assets, results of operations or net changes in net assets previously reported. Note 2—Management Agreements and Arrangements Investment advisory services for the Account are provided by TIAA employees, under the direction of the Board and its Investment Committee, pursuant to investment management procedures adopted by TIAA for the Account. TIAA’s investment management decisions for the Account are subject to review by
the Account’s independent fiduciary. TIAA also provides various portfolio accounting and related services for the Account. The Account is a party to the Distribution Agreement for the Contracts Funded by the TIAA Real Estate Account (the “Distribution Agreement”), dated January 1, 2008, by and among TIAA, for itself and on behalf of the Account, and TIAA-CREF Individual and Institutional Services, LLC (“Services”), a wholly
owned subsidiary of TIAA, a registered broker-dealer and a member of the Financial Industry Regulatory Authority. Pursuant to the Distribution Agreement, Services performs distribution services for the Account which include, among other things, (i) distribution of annuity contracts issued by TIAA and funded
by the Account, (ii) advising existing annuity contract owners in connection with their accumulations and (iii) helping employers implement and manage retirement plans. In addition, TIAA performs administrative functions for the Account, which include, among other things, (i) computing the Account’s daily unit
value, (ii) maintaining accounting records and performing accounting services, (iii) receiving and allocating premiums, (iv) calculating and making annuity payments, (v) processing withdrawal requests, (vi) providing regulatory compliance and reporting services, (vii) maintaining the Account’s records of contract
ownership and (viii) otherwise assisting generally in all aspects of the Account’s operations. Both distribution services (pursuant to the Distribution Agreement) and administrative services are provided to the Account by Services and TIAA, as applicable, on an at cost basis. The Distribution Agreement is terminable by either party upon 60 days written notice and terminates automatically upon any assignment thereof. TIAA and Services provide investment management, administrative and distribution services at cost. TIAA and Services receive payments from the Account on a daily basis according to formulas established each year and adjusted periodically with the objective of keeping the payments as close as possible to the
Account’s expenses actually incurred. Any differences between actual expenses and the amounts paid by the Account are adjusted quarterly. TIAA also provides a liquidity guarantee to the Account, for a fee, to ensure that sufficient funds are available to meet participant transfer and cash withdrawal requests in the event that the Account’s cash flows and liquid investments are insufficient to fund such requests. TIAA ensures sufficient funds are
available for such transfer and withdrawal requests by purchasing accumulation units of the Account. See Note 3—Related Party Transactions below. 12
To the extent TIAA owns accumulation units issued pursuant to the liquidity guarantee, the independent fiduciary monitors and oversees, among other things, TIAA’s ownership interest in the Account and may require TIAA to eventually redeem some of its units, particularly when the Account has uninvested
cash or liquid investments available. TIAA also receives a fee for assuming certain mortality and expense risks. The expenses for the services noted above that are provided to the Account by TIAA and Services are identified in the accompanying Consolidated Statements of Operations and are reflected in Note 9—Condensed Financial Information. Note 3—Related Party Transactions Pursuant to its existing liquidity guarantee obligation, as of September 30, 2011, the TIAA General Account owned 4.7 million accumulation units (which are generally referred to as “liquidity units”) issued by the Account. Since December 2008 and through September 30, 2011, TIAA paid an aggregate of $1.2
billion to purchase these liquidity units in multiple transactions. TIAA has purchased no liquidity units since June 1, 2009. In accordance with this liquidity guarantee obligation, TIAA guarantees that all participants in the Account may redeem their accumulation units at their accumulation unit value next determined after their transfer or cash withdrawal request is received in good order. Liquidity units owned by TIAA are valued in
the same manner as accumulation units owned by the Account’s participants. Management believes that TIAA has the ability to meet its obligations under the liquidity guarantee. As discussed in the Account’s prospectus and in accordance with a prohibited transaction exemption from the U.S. Department of Labor (PTE 96-76), the Account’s independent fiduciary, Real Estate Research Corporation, has certain responsibilities with respect to the Account that it has undertaken or is
currently undertaking with respect to TIAA’s purchase of liquidity units, including among other things, reviewing the purchase and redemption of liquidity units by TIAA to ensure the Account uses the correct unit values. In addition, as set forth in PTE 96-76, the independent fiduciary’s responsibilities include:
•
establishing the percentage of total accumulation units that TIAA’s ownership should not exceed (the “trigger point”) and creating a method for changing the trigger point; • approving any adjustment of TIAA’s ownership interest in the Account and, in its discretion, requiring an adjustment if TIAA’s ownership of liquidity units reaches the trigger point; and • once the trigger point has been reached, participating in any program to reduce TIAA’s ownership in the Account by utilizing cash flow or liquid investments in the Account, or by utilizing the proceeds from asset sales. The independent fiduciary’s role in participating in any such asset sales program
would include (i) participating in the selection of properties for sale, (ii) providing sales guidelines and (iii) approving those sales if, in the independent fiduciary’s opinion, such sales are desirable to reduce TIAA’s ownership of liquidity units. The independent fiduciary, which has the right to adjust the trigger point, has established the trigger point at 45% of the outstanding accumulation units and it will continue to monitor TIAA’s ownership interest in the Account and provide further recommendations as necessary. As of September 30, 2011, TIAA
owned approximately 9.0% of the outstanding accumulation units of the Account. The independent fiduciary has indicated to management its intention to initiate systematic redemptions of the liquidity units held by the TIAA General Account from time to time. The independent fiduciary currently intends to cause such redemptions only (i) if recent historical net participant activity has been
positive, i.e. net participant in-flows and (ii) if the Account is projected to hold at least 22% of its net assets in cash and cash equivalents and publicly traded liquid non-real estate related securities, after taking into account certain projected sources and uses of cash flow into the Account. In addition, the
independent fiduciary’s intention is that redemptions over any given period would not exceed recent historical net participant activity. In administering redemptions, the independent fiduciary has indicated to management that it intends to evaluate, among other things (i) projected acquisitions and dispositions of
real estate and real estate related investments, (ii) participant inflow and outflow trends, (iii) the Account’s net income and (iv) obligations to make debt service payments and pay principal balances of mortgages on Account properties. The independent fiduciary is vested with oversight and approval over any
redemption of liquidity 13
units owned by TIAA, acting in the best interests of Account participants. Pursuant to PTE 96-76, the independent fiduciary may authorize or direct the redemption of all or a portion of liquidity units at any time and TIAA will request the approval of the independent fiduciary before any liquidity units are
redeemed. As of September 30, 2011 the Account was not required to redeem any liquidity units. As discussed in Note 2—Management Agreements and Arrangements, TIAA and Services provide certain services to the Account on an at cost basis. See Note 9—Condensed Financial Information for details of the expense charge and expense ratio. Note 4—Credit Risk Concentrations Concentrations of credit risk may arise when a number of properties or tenants are located in a similar geographic region such that the economic conditions of that region could impact tenants’ obligations to meet their contractual obligations or cause the values of individual properties to decline. The Account has
no significant concentrations of tenants as no single tenant has annual contract rent that makes up more than 2.1% of the rental income of the Account. The substantial majority of the Account’s wholly owned real estate investments and investments in joint ventures are located in the United States. The following table represents the diversification of the Account’s portfolio by region and property type: Diversification by Fair Value(1)
East
West
South
Midwest
Foreign(2)
Total Office
22.7
%
15.8
%
9.3
%
0.4
%
2.3
%
50.5
% Apartment
6.8
%
5.6
%
4.9
%
0.0
%
0.0
%
17.3
% Industrial
1.3
%
6.7
%
4.4
%
1.2
%
0.0
%
13.6
% Retail
2.9
%
2.8
%
7.6
%
0.1
%
1.9
%
15.3
% Other(3)
3.0
%
0.2
%
0.1
%
0.0
%
0.0
%
3.3
% Total
36.7
%
31.1
%
26.3
%
1.7
%
4.2
%
100.0
%
(1)
Wholly-owned properties are represented at fair value and gross of any debt, while joint venture properties are represented at the net equity value. (2) Represents real estate investments in the United Kingdom and France. (3) Represents interest in Storage Portfolio investment and fee interest encumbered by a ground lease real estate investment. Properties in the “East” region are located in: CT, DC, DE, KY, MA, MD, ME, NC, NH, NJ, NY, PA, RI, SC, VA, VT, WV Properties in the “West” region are located in: AK, AZ, CA, CO, HI, ID, MT, NM, NV, OR, UT, WA, WY Properties in the “South” region are located in: AL, AR, FL, GA, LA, MS, OK, TN, TX Properties in the “Midwest” region are located in: IA, IL, IN, KS, MI, MN, MO, ND, NE, OH, SD, WI Note 5—Assets and Liabilities Measured at Fair Value on a Recurring Basis Valuation Hierarchy: The Account’s fair value measurements are grouped categorically into three levels, as defined by the FASB. The levels are defined as follows: Level 1—Valuations using unadjusted quoted prices for assets traded in active markets, such as stocks listed on the New York Stock Exchange. Active markets are defined as having the following characteristics for the measured asset or liability: (i) many transactions, (ii) current prices, (iii) price quotes not varying
substantially among market makers, (iv) narrow bid/ask spreads and (v) most information regarding the issuer is publicly available. Level 1 assets held by the Account are generally marketable equity securities. Level 2—Valuations for assets and liabilities traded in less active, dealer or broker markets. Fair values are primarily obtained from third party pricing services for identical or comparable assets or liabilities. Level 2 14
inputs for fair value measurements are inputs, other than quoted prices included within Level 1, that are observable for the asset or liability, either directly or indirectly. Level 2 inputs include: a. Quoted prices for similar assets or liabilities in active markets; b. Quoted prices for identical or similar assets or liabilities in markets that are not active (that is, markets in which there are few transactions for the asset (or liability), the prices are not current, price quotations vary substantially either over time or among market makers (for example, some brokered
markets), or in which little information is released publicly); c. Inputs other than quoted prices that are observable within the market for the asset (or liability) (for example, interest rates and yield curves, volatilities, prepayment speeds, loss severities, credit risks, and default rates that are observable at commonly quoted intervals); and d. Inputs that are derived principally from or corroborated by observable market data by correlation or other means (for example, market-corroborated inputs). Examples of securities which may be held by the Account and included in Level 2 include certificates of deposit, commercial paper, government agency notes, variable notes, United States Treasury securities, and debt securities. Level 3—Valuations for assets and liabilities that are derived from other valuation methodologies, including pricing models, discounted cash flow models and similar techniques, and are not based on market exchange, dealer, or broker-traded transactions. Level 3 valuations incorporate certain assumptions and
projections that are not observable in the market, and require significant professional judgment in determining the fair value assigned to such assets or liabilities. Examples of Level 3 assets and liabilities which may be held by the Account from time to time include investments in real estate, investments in joint
ventures and limited partnerships, and mortgage loans receivable and payable. An investment’s categorization within the valuation hierarchy described above is based upon the lowest level of input that is significant to the fair value measurement. The Account’s determination of fair value is based upon quoted market prices, where available. If listed prices or quotes are not available, fair value is based upon vendor-provided, evaluated prices or internally-developed models that primarily use market-based or independently-sourced market data, including
interest rate yield curves, market spreads, and currency rates. Valuation adjustments will be made to reflect changes in credit quality, counterparty’s creditworthiness, the Account’s creditworthiness, liquidity, and other observable and unobservable inputs that are applied consistently over time. The methods described above are considered to produce fair values that represent a good faith estimate of what an unaffiliated buyer in the marketplace would pay to purchase the asset or would receive to transfer the liability. Since fair value calculations involve significant professional judgment in the application
of both observable and unobservable attributes, actual realizable values or future fair values may differ from amounts reported. Furthermore, while the Account believes its valuation methods are appropriate and consistent with other market participants, the use of different methodologies or assumptions to
determine the fair value of certain financial instruments, while reasonable, could result in different estimates of fair value at the reporting date. As discussed in Note 1—Organization and Significant Accounting Policies in more detail, the Account generally obtains independent third party appraisals on a quarterly
basis; there may be circumstances in the interim in which the true realizable value of a property is not reflected in the Account’s daily net asset value calculation or in the Account’s periodic financial statements. This disparity may be more apparent when the commercial and/or residential real estate markets
experience an overall and possibly dramatic decline (or increase) in property values in a relatively short period of time between appraisals. 15
The following tables show the major categories of assets and liabilities measured at fair value on a recurring basis as of September 30, 2011 (unaudited) and December 31, 2010, using unadjusted quoted prices in active markets for identical assets (Level 1); significant other observable inputs (Level 2); and significant
unobservable inputs (Level 3) (in millions, unaudited): Description
Level 1:
Level 2:
Level 3:
Total at Real estate properties
$
—
$
—
$
9,827.9
$
9,827.9 Real estate joint ventures
—
—
1,564.3
1,564.3 Limited partnerships
—
—
302.3
302.3 Marketable securities: Real Estate Related
813.0
—
—
813.0 Government Agency Notes
—
1,631.7
1,631.7 United States Treasury securities
—
754.1
754.1 Total Investments at September 30, 2011
$
813.0
$
2,385.8
$
11,694.5
$
14,893.3 Mortgage loans payable
$
—
$
—
$
(1,956.7
)
$
(1,956.7
) Description
Level 1:
Level 2:
Level 3:
Total at Real estate properties
$
—
$
—
$
8,115.5
$
8,115.5 Real estate joint ventures
—
—
1,358.8
1,358.8 Limited partnerships
—
—
270.3
270.3 Marketable securities: Real Estate Related
495.3
—
—
495.3 Government Agency Notes
—
1,484.8
—
1,484.8 United States Treasury securities
—
911.9
—
911.9 Total Investments at December 31, 2010
$
495.3
$
2,396.7
$
9,744.6
$
12,636.6 Mortgage loans payable
$
—
$
—
$
(1,860.2
)
$
(1,860.2
) The following tables show the reconciliation of the beginning and ending balances for assets and liabilities measured at fair value on a recurring basis using significant unobservable inputs (Level 3) during the three and nine months ended September 30, 2011 and September 30, 2010 (in millions, unaudited):
Real Estate
Real Estate
Limited
Total
Mortgage For the three months ended Beginning balance July 1, 2011
$
9,452.6
$
1,495.2
$
287.0
$
11,234.8
$
(1,952.6
) Total realized and unrealized gains (losses) included in changes in net assets
246.9
71.2
10.3
328.4
(6.4
) Purchases(1)
318.8
0.2
8.8
327.8
— Sales
(189.4
)
—
—
(189.4
)
— Settlements(2)
(1.0
)
(2.3
)
(3.8
)
(7.1
)
2.3 Ending balance September 30, 2011
$
9,827.9
$
1,564.3
$
302.3
$
11,694.5
$
(1,956.7
) 16
Quoted
Prices in
Active Markets
for Identical
Assets
Significant
Other
Observable
Inputs
Significant
Unobservable
Inputs
September 30,
2011
Quoted
Prices in
Active Markets
for Identical
Assets
Significant
Other
Observable
Inputs
Significant
Unobservable
Inputs
December 31,
2010
Properties
Joint Ventures
Partnerships
Level 3
Investments
Loans
Payable
September 30, 2011
Real Estate
Real Estate
Limited
Total
Mortgage For the nine months ended Beginning balance January 1, 2011
$
8,115.5
$
1,358.8
$
270.3
$
9,744.6
$
(1,860.2
) Total realized and unrealized gains (losses) included in changes in net assets
704.0
193.9
32.0
929.9
(6.9
) Purchases(1)
1,237.0
13.9
10.0
1,260.9
(105.0
) Sales
(228.3
)
—
—
(228.3
)
— Settlements(2)
(0.3
)
(2.3
)
(10.0
)
(12.6
)
15.4 Ending balance September 30, 2011
$
9,827.9
$
1,564.3
$
302.3
$
11,694.5
$
(1,956.7
)
Real Estate
Real Estate
Limited
Mortgage
Total
Mortgage For the three months ended Beginning balance
$
7,517.3
$
1,347.7
$
227.2
$
72.7
$
9,164.9
$
(1,890.0
) Total realized and unrealized gains (losses) included in changes in net assets
249.8
47.9
10.8
2.3
310.8
(7.8
) Purchases(1)
48.1
3.8
—
—
51.9
— Sales
—
(28.3
)
—
—
(28.3
)
— Settlements(2)
—
(65.6
)
—
(75.0
)
(140.6
)
53.9 Ending balance
$
7,815.2
$
1,305.5
$
238.0
$
—
$
9,358.7
$
(1,843.9
)
Real Estate
Real Estate
Limited
Mortgage
Total
Mortgage For the nine months ended Beginning balance
$
7,437.3
$
1,314.6
$
200.3
$
71.3
$
9,023.5
$
(1,858.1
) Total realized and unrealized gains (losses) included in changes in net assets
271.9
32.1
29.3
3.7
337.0
(42.1
) Purchases(1)
106.0
84.1
8.4
—
198.5
— Sales
—
(57.1
)
—
—
(57.1
)
— Settlements(2)
—
(68.2
)
—
(75.0
)
(143.2
)
56.3 Ending balance
$
7,815.2
$
1,305.5
$
238.0
$
—
$
9,358.7
$
(1,843.9
)
(1)
Includes purchases, contributions for joint ventures and limited partnerships, and capital expenditures. (2) Includes operating income for real estate joint ventures and limited partnerships, net of distributions and principal payments on mortgage loans payable. 17
Properties
Joint Ventures
Partnerships
Level 3
Investments
Loans
Payable
September 30, 2011:
Properties
Joint Ventures
Partnerships
Loans
Receivable
Level 3
Investments
Loans
Payable
September 30, 2010:
July 1, 2010
September 30, 2010
Properties
Joint Ventures
Partnerships
Loans
Receivable
Level 3
Investments
Loans
Payable
September 30, 2010:
January 1, 2010
September 30, 2010
During the nine months ended September 30, 2011 and 2010 there were no transfers in or out of Levels 1, 2 or 3. The amount of net unrealized gains included in changes in net assets attributable to investments and mortgage loans payable using significant unobservable inputs still held as of the reporting date is as
follows (in millions, unaudited):
Real Estate
Real Estate
Limited
Total
Mortgage For the three months ended
$
362.5
$
75.1
$
10.3
$
447.9
$
(6.4
) For the nine months ended
$
840.4
$
213.8
$
32.1
$
1,086.3
$
(6.9
) For the three months ended
$
249.7
$
47.9
$
10.8
$
308.4
$
(7.8
) For the nine months ended
$
273.0
$
37.4
$
29.3
$
339.7
$
(42.1
) Note 6—Investments in Joint Ventures The Account owns interests in several real estate properties through joint ventures and receives distributions and allocations of profits and losses from the joint ventures based on the Account’s ownership interest percentages. Several of these joint ventures have mortgage loans payable on the properties owned by
the joint ventures. At September 30, 2011, the Account held 11 investments in joint ventures with non-controlling ownership interest percentages that ranged from 50% to 85%. Certain joint ventures are subject to adjusted distribution percentages when earnings in the investment reach a pre-determined threshold.
The Account’s equity in the joint ventures was $1.6 billion and $1.4 billion at September 30, 2011 and December 31, 2010, respectively. The Account’s most significant joint venture investment is the DDR TC LLC joint venture (“DDR Joint Venture”), which represented 2.6% of the Account’s net assets. The Account’s proportionate share of the mortgage loans payable within the joint venture investments at fair value was $1.6 billion at September 30, 2011 and December 31, 2010. The Account’s share in the outstanding principal of the mortgage loans payable within the joint ventures was $1.6 billion at September
30, 2011 and December 31, 2010. A condensed summary of the financial position and results of operations of the joint ventures are shown below (in millions, unaudited):
September 30, 2011
December 31, 2010
(Unaudited) Assets Real estate properties, at fair value
$
4,812.8
$
4,454.9 Other assets
134.8
141.8 Total assets
$
4,947.6
$
4,596.7 Liabilities and Equity Mortgage loans payable, at fair value
$
2,269.6
$
2,276.9 Other liabilities
91.4
97.5 Total liabilities
2,361.0
2,374.4 Equity
2,586.6
2,222.3 Total liabilities and equity
$
4,947.6
$
4,596.7 18
Properties
Joint Ventures
Partnerships
Level 3
Investments
Loans
Payable
September 30, 2011
September 30, 2011
September 30, 2010
September 30, 2010
For the Nine
For the Nine
(Unaudited)
(Unaudited) Operating Revenues and Expenses Revenues
$
338.7
$
350.4 Expenses
208.0
219.0 Excess of revenues over expenses
$
130.7
$
131.4 Management of the Account monitors the financial position of the Account’s joint venture partners. To the extent that management of the Account determines that a joint venture partner has financial or liquidity concerns, management will evaluate all actions and remedies available to the Account under the
applicable joint venture agreement to minimize any potential adverse implications to the Account. Note 7—Investments in Limited Partnerships The Account invests in limited partnerships that own real estate properties and real estate-related securities and the Account receives distributions from the limited partnerships based on the Account’s ownership interest percentages. At September 30, 2011, the Account held five limited partnership investments and
one private real estate equity investment trust (all of which featured non-controlling ownership interests) with ownership interest percentages that ranged from 5.3% to 18.5%. Under the terms of the partnership agreements governing such investments, and based upon the expected term of each such partnership,
the partnerships could engage in liquidation activities beginning in 2012 through 2015. The Account’s ownership interest in limited partnerships was $302.3 million and $270.3 million at September 30, 2011 and December 31, 2010, respectively. 19
Months Ended
September 30, 2011
Months Ended
September 30, 2010
Note 8—Mortgage Loans Payable At September 30, 2011, the Account had outstanding mortgage loans payable secured by the following properties (in millions, unaudited):
Property
Interest Rate and
Principal
Maturity 1 & 7 Westferry Circus(1)(2)(5)
5.40% paid quarterly
$
205.6
November 15, 2012 Reserve at Sugarloaf(1)(5)
5.49% paid monthly
24.4
June 1, 2013 South Frisco Village
5.85% paid monthly
26.3
June 1, 2013 Fourth & Madison
6.40% paid monthly
145.0
August 21, 2013 1001 Pennsylvania Avenue
6.40% paid monthly
210.0
August 21, 2013 50 Fremont
6.40% paid monthly
135.0
August 21, 2013 Pacific Plaza(1)(5)
5.55% paid monthly
8.2
September 1, 2013 Wilshire Rodeo Plaza(5)
5.28% paid monthly
112.7
April 11, 2014 1401 H Street(1)(5)
5.97% paid monthly
112.6
December 7, 2014 1050 Lenox Park Apartments(5)
4.43% paid monthly
24.0
August 1, 2015 San Montego Apartments(5)(6)
4.47% paid monthly
21.8
August 1, 2015 Montecito Apartments(5)(6)
4.47% paid monthly
20.3
August 1, 2015 Phoenician Apartments(5)(6)
4.47% paid monthly
21.3
August 1, 2015 The Colorado(1)(5)
5.65% paid monthly
84.7
November 1, 2015 99 High Street
5.52% paid monthly
185.0
November 11, 2015 The Legacy at Westwood(1)(5)
5.95% paid monthly
40.6
December 1, 2015 Regents Court(1)(5)
5.76% paid monthly
34.6
December 1, 2015 The Caruth(1)(5)
5.71% paid monthly
40.5
December 1, 2015 Lincoln Centre
5.51% paid monthly
153.0
February 1, 2016 The Legend at Kierland(5)(7)
4.97% paid monthly
21.8
August 1, 2017 The Tradition at Kierland(5)(7)
4.97% paid monthly
25.8
August 1, 2017 Red Canyon at Palomino Park(5)(8)
5.34% paid monthly
27.1
August 1, 2020 Green River at Palomino Park(5)(8)
5.34% paid monthly
33.2
August 1, 2020 Blue Ridge at Palomino Park(5)(8)
5.34% paid monthly
33.4
August 1, 2020 Ashford Meadows(5)
5.17% paid monthly
44.6
August 1, 2020 The Corner(5)
4.66% paid monthly
105.0
June 1, 2021 Publix at Weston Commons(5)
5.08% paid monthly
35.0
January 1, 2036 Total Principal Outstanding
$
1,931.5 Fair Value Adjustment(4)
25.2 Total mortgage loans payable
$
1,956.7
(1)
The mortgage is adjusted monthly for principal payments. (2) The mortgage is denominated in British pounds and the principal payment had been converted to U.S. dollars using the exchange rate as of September 30, 2011. The interest rate is fixed. The cumulative foreign currency translation adjustment (since inception) was an unrealized gain of $23.5 million. Foreign currency translation adjustments recorded during the nine months ended
September 30, 2011 was an unrealized gain of $1.0 million. (3) Interest rates are fixed, unless stated otherwise. (4) The fair value adjustment consists of the difference (positive or negative) between the principal amount of the outstanding debt and the fair value of the outstanding debt. See Note 1—Organization and Significant Accounting Policies. (5) These properties are each owned by separate wholly owned subsidiaries of TIAA for benefit of the Account. The assets and credit of each of these borrowings entities are not available to satisfy the debts and other obligations of the Account or any other entity or person other than such borrowing entity. (6) Represents mortgage loans payable on these individual properties which are held within the Houston Apartment Portfolio. (7) Represents mortgage loans payable on these individual properties which are held within the Kierland Apartment Portfolio. (8) Represents mortgage loans payable on these individual properties which are held within Palomino Park. 20
Payment Frequency(3)
Amounts as of
September 30, 2011
Note 9—Condensed Financial Information Selected condensed financial information for an Accumulation Unit of the Account is presented below.
For the Nine
Years Ended December 31,
2010
2009
2008
(Unaudited) Per Accumulation Unit data: Rental income
$
13.080
$
19.516
$
22.649
$
18.794 Real estate property level expenses and taxes
6.529
9.987
11.193
9.190 Real estate income, net
6.551
9.529
11.456
9.604 Other income
1.755
2.214
2.778
3.808 Total income
8.306
11.743
14.234
13.412 Expense charges(1)
1.765
2.167
2.280
2.937 Investment income, net
6.541
9.576
11.954
10.475 Net realized and unrealized gain (loss) on investments and mortgage loans payable
15.768
16.143
(85.848
)
(54.541
) Net (decrease) increase in Accumulation Unit Value
22.309
25.719
(73.894
)
(44.066
) Accumulation Unit Value: Beginning of period
219.173
193.454
267.348
311.414 End of period
$
241.482
$
219.173
$
193.454
$
267.348 Total return
10.18
%
13.29
%
-27.64
%
-14.15
% Ratios to Average net Assets(2): Expenses(1)
0.73
%
1.09
%
1.01
%
0.95
% Investment income, net
2.72
%
4.84
%
5.29
%
3.38
% Portfolio turnover rate(2): Real estate properties(3)
2.16
%
1.01
%
0.75
%
0.64
% Marketable securities(4)
0.93
%
19.18
%
0.00
%
25.67
% Accumulation Units outstanding at end of period
52.5
48.1
39.5
41.5 Net assets end of period (in millions)
$
12,973.5
$
10,803.1
$
7,879.9
$
11,508.9
(1)
Expense charges per Accumulation Unit and the Ratio of Expenses to average net assets reflect the year to date Account-level expenses and exclude real estate property level expenses which are included in real estate income, net. If the real estate property level expenses were included, the expense charge per Accumulation Unit for the nine months ended September 30, 2011 would be
$8.294 ($12.154, $13.473, and $12.127, for the years ended December 31, 2010, 2009, and 2008, respectively), and the Ratio of Expenses to average net assets for the nine months ended September 30, 2011 would be 3.45% (6.14%, 5.96%, and 3.91%, for the years ended December 31, 2010, 2009, and 2008, respectively). (2) Amounts for the nine month period ended September 30, 2011 are not annualized. (3) Real estate investment portfolio turnover rate is calculated by dividing the lesser of purchases or sales of real estate property investments (including contributions to, or return of capital distributions received from, existing joint venture and limited partnership investments) by the average value of the portfolio of real estate investments held during the period. Amounts for the twelve months
ended December 31, 2010 are not annualized. (4) Marketable securities portfolio turnover rate is calculated by dividing the lesser of purchases or sales of securities, excluding securities having maturity dates at acquisition of one year or less, by the average value of the portfolio securities held during the period. 21
Months Ended
September 30,
2011
(in millions)
Note 10—Accumulation Units Changes in the number of Accumulation Units outstanding were as follows (in millions):
For the
For the Year Ended
(Unaudited) Outstanding: Beginning of period
48.1
39.5 Credited for premiums
8.1
12.9 Annuity, other periodic payments, withdrawals and death benefits
(3.7
)
(4.3
) End of period
52.5
48.1 Note 11—Commitments, Contingencies and Subsequent Events Commitments—As of September 30, 2011, the Account had outstanding commitments to purchase additional interests in three of its limited partnership investments. During the three month period ended September 30, 2011, the Account funded an additional $8.8 million towards its outstanding commitments. As of
September 30, 2011, the Account’s remaining commitments totaled $25.5 million, which can be called in full or in part by each limited partnership at any time. Contingencies—The Account is party to various claims and routine litigation arising in the ordinary course of business. Management of the Account does not believe the results of any such claims or litigation, individually, or in the aggregate, will have a material effect on the Account’s business, financial position, or
results of operations. Note 12—New Accounting Pronouncements In June 2009, the FASB issued Statement of Financial Accounting Standards No. 167, Amendments to FASB Interpretation No. 46(R) (“SFAS No. 167”), which amends guidance related to the identification of a variable interest entity, variable interests, the primary beneficiary, and expands required note
disclosures to provide greater transparency to the users of financial statements. In December 2009, the FASB issued Accounting Standards Update (“ASU”) No. 2009-17, “Improvements to Financial Reporting by Enterprises Involved with Variable Interest Entities,” which amended the Codification with the
guidance contained in SFAS No. 167. In February 2010, the FASB issued ASU No. 2010-10, “Amendments for Certain Investment Funds,” which defers the applicability of ASU No. 2009-17 in certain instances. These standards were effective on January 1, 2010 and did not result in a significant impact to the
Account’s financial position or results of operations. In January 2010, the FASB issued ASU No. 2010-06, “Improving Disclosures about Fair Value Measurements” which requires new disclosures related to transfers in and out of levels 1 and 2, and the separate disclosure of purchases, sales, issuances and settlements when reconciling activity in level 3. This ASU also
amends prior disclosure requirements to call for the disaggregation of assets and liabilities into appropriate subsets, and the disclosure of valuation techniques and inputs for recurring and nonrecurring fair value measurements in levels 2 and 3. The new disclosure requirement for reconciling level 3 activity was
effective January 1, 2011. All other new or amended disclosure requirements were effective January 1, 2010 for the Account and are reflected in the notes to the consolidated financial statements. These changes did not impact the Account’s financial position or results of operations. In May 2011, the FASB issued ASU No. 2011-04, “Amendments to Achieve Common Fair Value Measurements and Disclosure Requirements in U.S. GAAP and IFRSs”, with the intention to converge fair value standards between U.S. GAAP and International Financial and Reporting Standards. This ASU is
largely consistent with existing fair value measurement principles in U.S. GAAP, it expands ASC 820’s existing disclosure requirements for fair value measurements and makes other amendments. Many of these amendments are being made to eliminate unnecessary wording differences between U.S. GAAP and
IFRS. However, some could change how the fair value measurement guidance in ASC 820 is applied. Changes in applying fair value standards and additional disclosure requirements are effective on January 1, 2012. The Account is currently assessing the impact of applying the revised standards but does not
anticipate a material impact to the Account’s financial position or results of operations. 22
Nine Months
Ended
September 30, 2011
December 31, 2010
TIAA REAL ESTATE ACCOUNT REAL ESTATE PROPERTIES—65.99% and 64.22%
Location/Description
Type
Fair Value
2011
2010
(Unaudited) Arizona: Camelback Center
Office
$
33.9
$
33.2 Kierland Apartment Portfolio
Apartments
100.3
(1)
96.0
(1) Phoenix Apartment Portfolio
Apartments
25.4
23.0 California: 3 Hutton Centre Drive
Office
37.9
32.2 50 Fremont Street
Office
327.6
(1)
315.1
(1) 88 Kearny Street
Office
80.1
65.4 275 Battery Street
Office
206.0
180.4 Rancho Cucamonga Industrial Portfolio
Industrial
94.9
83.4 Centerside I
Office
40.1
34.0 Centre Pointe and Valley View
Industrial
21.2
19.9 Great West Industrial Portfolio
Industrial
95.7
73.5 Larkspur Courts
Apartments
84.2
70.1 Northpark Village Square
Retail
40.5
— Northern CA RA Industrial Portfolio
Industrial
42.1
39.7 Ontario Industrial Portfolio
Industrial
268.7
(1)
223.7
(1) Pacific Plaza
Office
60.1
(1)
56.2
(1) Regents Court
Apartments
68.0
(1)
65.0
(1) Southern CA RA Industrial Portfolio
Industrial
77.9
75.5 The Forum at Carlsbad
Office
178.0
(1)
—
(1) The Legacy at Westwood
Apartments
96.5
(1)
93.2
(1) Wellpoint
Office
—
41.0 Westcreek
Apartments
30.8
29.6 West Lake North Business Park
Office
43.9
40.8 Westwood Marketplace
Retail
97.0
89.0 Wilshire Rodeo Plaza
Office
171.5
(1)
165.5
(1) Colorado: Palomino Park
Apartments
192.8
(1)
168.7
(1) The Lodge at Willow Creek
Apartments
46.6
39.7 Connecticut: Ten & Twenty Westport Road
Office
134.8
100.7 Florida: 701 Brickell Avenue
Office
218.5
201.2 North 40 Office Complex
Office
35.1
36.4 Plantation Grove
Retail
10.2
9.4 Pointe on Tampa Bay
Office
37.3
35.2 Publix at Weston Commons
Retail
45.7
(1)
45.2
(1) Quiet Waters at Coquina Lakes
Apartments
25.5
23.7 Seneca Industrial Park
Industrial
68.3
63.3 South Florida Apartment Portfolio
Apartments
69.7
60.0 Suncrest Village Shopping Center
Retail
12.2
12.6 The Fairways of Carolina
Apartments
23.7
22.3 Urban Centre
Office
91.5
89.7 Weston Business Center
Industrial
84.1
— 23
CONSOLIDATED STATEMENTS OF INVESTMENTS
September 30, 2011 and December 31, 2010
(Dollar values shown in millions)
TIAA REAL ESTATE ACCOUNT
Location/Description
Type
Fair Value
2011
2010
(Unaudited) France: Printemps de L’Homme
Retail
$
216.8
$
223.7 Georgia: Atlanta Industrial Portfolio
Industrial
42.4
38.8 Glenridge Walk
Apartments
35.5
33.6 Reserve at Sugarloaf
Apartments
45.0
(1)
43.7
(1) Shawnee Ridge Industrial Portfolio
Industrial
51.8
49.0 Windsor at Lenox Park
Apartments
53.1
(1)
50.8
(1) Illinois: Chicago Caleast Industrial Portfolio
Industrial
54.7
50.8 Chicago Industrial Portfolio
Industrial
64.7
58.9 Oak Brook Regency Towers
Office
—
70.6 Parkview Plaza
Office
42.8
43.1 Maryland: Broadlands Business Park
Industrial
27.6
24.2 GE Appliance East Coast Distribution Facility
Industrial
34.2
29.1 Massachusetts: 99 High Street
Office
329.5
(1)
255.0
(1) Needham Corporate Center
Office
18.1
18.6 Northeast RA Industrial Portfolio
Industrial
26.7
22.1 Residence at Rivers Edge
Apartments
80.0
— The Newbry
Office
291.8
252.0 Minnesota: Champlin Marketplace
Retail
—
12.7 Nevada: Fernley Distribution Facility
Industrial
6.3
7.1 New Jersey: Konica Photo Imaging Headquarters
Industrial
18.7
14.5 Marketfair
Retail
67.2
66.2 Morris Corporate Center III
Office
—
71.9 Plainsboro Plaza
Retail
26.5
27.5 South River Road Industrial
Industrial
45.7
38.5 New York: 425 Park Avenue
Ground Lease
320.0
— 780 Third Avenue
Office
336.1
300.6 The Colorado
Apartments
152.0
(1)
123.0
(1) The Corner
Apartments
215.0
(1)
— Pennsylvania: Lincoln Woods
Apartments
30.4
29.1 The Pepper Building
Apartments
52.9
— Tennessee: Airways Distribution Center
Industrial
12.2
12.1 Summit Distribution Center
Industrial
15.5
15.8 24
CONSOLIDATED STATEMENTS OF INVESTMENTS
September 30, 2011 and December 31, 2010
(Dollar values shown in millions)
TIAA REAL ESTATE ACCOUNT
Location/Description
Type
Fair Value
2011
2010
(Unaudited) Texas: Dallas Industrial Portfolio
Industrial
$
151.5
$
140.6 Four Oaks Place
Office
416.4
383.7 Houston Apartment Portfolio
Apartments
198.9
(1)
186.9
(1) Lincoln Centre
Office
209.6
(1)
195.4
(1) Pinnacle Industrial Portfolio
Industrial
40.1
38.4 South Frisco Village
Retail
29.0
(1)
29.0
(1) The Caruth
Apartments
61.8
(1)
56.1
(1) The Maroneal
Apartments
42.2
37.6 United Kingdom: 1 & 7 Westferry Circus
Office
263.6
(1)
260.0
(1) Virginia: 8270 Greensboro Drive
Office
29.8
27.9 The Palantine
Apartments
141.5
— Ashford Meadows Apartments
Apartments
101.2
(1)
95.4
(1) One Virginia Square
Office
61.3
51.7 The Ellipse at Ballston
Office
82.2
76.7 Washington: Creeksides at Centerpoint
Office
17.5
16.6 Fourth and Madison
Office
379.1
(1)
330.0
(1) Millennium Corporate Park
Office
127.7
125.2 Northwest RA Industrial Portfolio
Industrial
22.1
17.0 Rainier Corporate Park
Industrial
74.5
66.8 Regal Logistics Campus
Industrial
62.2
52.5 Washington DC: 1001 Pennsylvania Avenue
Office
655.2
(1)
589.8
(1) 1401 H Street, NW
Office
206.7
(1)
179.3
(1) 1900 K Street, NW
Office
241.6
246.4 Mazza Gallerie
Retail
80.7
76.0 TOTAL REAL ESTATE PROPERTIES (Cost $10,386.0 and $9,449.1)
$
9,827.9
$
8,115.5 25
CONSOLIDATED STATEMENTS OF INVESTMENTS
September 30, 2011 and December 31, 2010
(Dollar values shown in millions)
TIAA REAL ESTATE ACCOUNT OTHER REAL ESTATE-RELATED INVESTMENTS—12.53% and 12.89%
Location/Description
Fair Value
2011
2010
(Unaudited) California: CA—Colorado Center LP Yahoo Center (50% Account Interest)
$
193.1
(2)
$
157.5
(2) CA—Treat Towers LP Treat Towers (75% Account Interest)
77.2
67.1 Florida: Florida Mall Associates, Ltd The Florida Mall (50% Account Interest)
283.6
(2)
239.0
(2) TREA Florida Retail, LLC Florida Retail Portfolio (80% Account Interest)
166.1
165.5 West Dade Associates Miami International Mall (50% Account Interest)
109.4
(2)
93.2
(2) Georgia: GA—Buckhead LLC Prominence in Buckhead (75% Account Interest)
49.9
39.8 Massachusetts: MA—One Boston Place REIT One Boston Place (50.25% Account Interest)
193.3
150.3 Tennessee: West Town Mall, LLC West Town Mall (50% Account Interest)
51.8
(2)
50.6
(2) Various: DDR TC LLC DDR Joint Venture (85% Account Interest)
331.7
(2,3)
303.7
(2,3) Storage Portfolio I, LLC Storage Portfolio (75% Account Interest)
64.6
(2,3)
52.8
(2,3) Strategic Ind Portfolio I, LLC IDI Nationwide Industrial Portfolio (60% Account Interest)
43.6
(2,3)
39.3
(2,3) TOTAL REAL ESTATE JOINT VENTURES (Cost $1,937.6 and $1,922.4)
$
1,564.3
$
1,358.8 LIMITED PARTNERSHIPS—2.03% and 2.14% Cobalt Industrial REIT (10.998% Account Interest)
$
24.9
$
26.3 Colony Realty Partners LP (5.27% Account Interest)
21.3
18.1 Heitman Value Partners Fund (8.43% Account Interest)
18.3
17.3 Lion Gables Apartment Fund (18.46% Account Interest)
217.6
190.0 MONY/Transwestern Mezz RP II (16.67% Account Interest)
3.5
9.7 Transwestern Mezz Realty Partners III, LLC (11.708% Account Interest)
16.7
8.9 TOTAL LIMITED PARTNERSHIPS (Cost $300.8 and $300.9)
$
302.3
$
270.3 TOTAL REAL ESTATE JOINT VENTURES AND LIMITED PARTNERSHIPS (Cost $2,238.4 and $2,223.3)
$
1,866.6
$
1,629.1 26
CONSOLIDATED STATEMENTS OF INVESTMENTS
September 30, 2011 and December 31, 2010
(Dollar values shown in millions)
REAL ESTATE JOINT VENTURES—10.50% and 10.75%
TIAA REAL ESTATE ACCOUNT MARKETABLE SECURITIES—21.48% and 22.89%
Shares Issuer
Fair Value
2011
2010
2011
2010
(Unaudited)
92,462
50,398 Acadia Realty Trust
$
1.7
$
0.9
25,960
11,416 Agree Realty Corporation
0.6
0.3
3,783
2,574 Alexander’s, Inc.
1.4
1.1
136,507
66,883 Alexandria Real Estate Equities, Inc.
8.4
4.9
—
200,791 AMB Property Corporation
—
6.4
88,603
— American Assets Trust Inc
1.6
—
153,339
81,463 American Campus Communities, Inc.
5.7
2.6
264,043
142,051 Apartment Investment and Management Company
5.8
3.7
149,993
65,637 Ashford Hospitality Trust, Inc.
1.1
0.6
92,295
52,433 Associated Estates Realty Corporation
1.4
0.8
204,720
102,725 Avalonbay Communities, Inc.
23.3
11.6
287,597
155,007 BioMed Realty Trust, Inc.
4.8
2.9
315,964
168,877 Boston Properties, Inc.
28.2
14.5
294,369
157,851 Brandywine Realty Trust
2.4
1.8
164,258
77,519 BRE Properties, Inc.
7.0
3.4
154,216
83,321 Camden Property Trust
8.5
4.5
82,558
37,593 Campus Crest Communities, Inc.
0.9
0.5
150,899
75,517 CapLease, Inc.
0.5
0.4
327,317
167,965 CBL & Associates Properties, Inc.
3.7
2.9
152,815
70,256 Cedar Shopping Centers, Inc.
0.5
0.4
39,517
8,763 Chatham Lodging Trust
0.4
0.2
74,212
20,047 Chesapeake Lodging Trust
0.9
0.4
116,477
54,270 Cogdell Spencer Inc.
0.4
0.3
188,864
95,610 Colonial Properties Trust
3.4
1.7
48,303
20,917 CoreSite Realty Corporation
0.7
0.3
157,193
80,891 Corporate Office Properties Trust
3.4
2.8
239,606
123,682 Cousins Properties Incorporated
1.4
1.0
220,040
— Cubesmart
1.9
—
533,880
253,113 DCT Industrial Trust Inc.
2.3
1.3
614,068
309,541 Developers Diversified Realty Corporation
6.7
4.4
367,697
188,954 DiamondRock Hospitality Company
2.6
2.3
216,122
107,907 Digital Realty Trust, Inc.
11.9
5.6
205,213
113,097 Douglas Emmett, Inc.
3.5
1.9
560,086
298,785 Duke Realty Corporation
5.9
3.7
134,746
72,632 DuPont Fabros Technology, Inc.
2.7
1.5
59,989
33,167 EastGroup Properties, Inc.
2.3
1.4
158,681
65,151 Education Realty Trust, Inc.
1.4
0.5
103,012
56,762 Entertainment Properties Trust
4.0
2.6
87,088
37,659 Equity Lifestyle Properties, Inc.
5.5
2.1
127,616
58,543 Equity One, Inc.
2.0
1.1
638,750
339,604 Equity Residential
33.1
17.6
72,289
38,018 Essex Property Trust, Inc.
8.7
4.3
65,065
21,898 Excel Trust, Inc.
0.6
0.3
207,842
107,440 Extra Space Storage Inc.
3.9
1.9
137,296
73,740 Federal Realty Investment Trust
11.3
5.7 27
CONSOLIDATED STATEMENTS OF INVESTMENTS
September 30, 2011 and December 31, 2010
(Dollar values shown in millions)
REAL ESTATE-RELATED MARKETABLE SECURITIES—5.46% and 3.92%
TIAA REAL ESTATE ACCOUNT
Shares Issuer
Fair Value
2011
2010
2011
2010
(Unaudited)
271,895
122,336 FelCor Lodging Trust Incorporated
$
0.6
$
0.9
191,213
71,146 First Industrial Realty Trust, Inc.
1.5
0.6
110,661
57,529 First Potomac Realty Trust
1.4
1.0
181,429
98,729 Franklin Street Properties Corp.
2.1
1.4
1,017,890
560,577 General Growth Properties, Inc.
12.3
8.7
56,458
28,271 Getty Realty Corp.
0.8
0.9
20,610
10,676 Gladstone Commercial Corporation
0.3
0.2
220,762
107,080 Glimcher Realty Trust
1.6
0.9
78,067
38,023 Government Properties Income Trust
1.7
1.0
881,276
387,498 HCP, Inc.
30.9
14.3
382,735
175,223 Health Care REIT, Inc.
17.9
8.3
160,772
79,299 Healthcare Realty Trust Incorporated
2.7
1.7
372,823
209,343 Hersha Hospitality Trust
1.3
1.4
155,319
84,755 Highwoods Properties, Inc.
4.4
2.7
103,500
45,795 Home Properties, Inc.
5.9
2.5
273,810
150,100 Hospitality Properties Trust
5.8
3.5
1,533,536
798,787 Host Hotels & Resorts, Inc.
16.8
14.3
180,198
88,294 HRPT Properties Trust
3.4
2.3
59,902
20,487 Hudson Pacific Properties, Inc.
0.7
0.3
198,739
109,424 Inland Real Estate Corporation
1.4
1.0
176,691
98,903 Investors Real Estate Trust
1.3
0.9
1,500,000
1,500,000 iShares Dow Jones US Real Estate Index Fund
75.8
83.9
129,963
61,706 Kilroy Realty Corporation
4.1
2.3
879,374
485,461 Kimco Realty Corporation
13.2
8.8
146,123
83,099 Kite Realty Group Trust
0.5
0.5
187,282
86,269 LaSalle Hotel Properties
3.6
2.3
345,585
165,849 Lexington Realty Trust
2.3
1.3
251,650
138,566 Liberty Property Trust
7.3
4.4
68,836
30,038 LTC Properties, Inc.
1.7
0.8
189,553
93,900 Mack-Cali Realty Corporation
5.1
3.1
114,299
53,134 Maguire Properties, Inc.
0.2
0.1
247,227
136,282 Medical Properties Trust, Inc.
2.2
1.5
81,264
41,729 Mid-America Apartment Communities, Inc.
4.9
2.6
36,864
20,269 Mission West Properties, Inc.
0.3
0.1
81,077
44,989 Monmouth Real Estate Investment Corporation
0.6
0.4
63,644
34,293 National Health Investors, Inc.
2.7
1.5
207,000
101,670 National Retail Properties, Inc.
5.6
2.7
—
152,266 Nationwide Health Properties, Inc.
—
5.5
226,273
120,251 Omega Healthcare Investors, Inc.
3.6
2.7
38,237
16,016 One Liberty Properties, Inc.
0.6
0.3
52,329
27,787 Parkway Properties, Inc.
0.6
0.5
113,497
— Pebblebrook Hotel Trust
1.8
—
122,245
63,708 Pennsylvania Real Estate Investment Trust
0.9
0.9
379,392
77,918 Piedmont Office Realty Trust, Inc.
6.1
1.6
359,167
196,790 Plum Creek Timber Company, Inc.
12.5
7.4
106,883
59,612 Post Properties, Inc.
3.7
2.2
88,608
49,003 Potlatch Corporation
2.8
1.6
997,591
681,117 ProLogis
24.2
9.8 28
CONSOLIDATED STATEMENTS OF INVESTMENTS
September 30, 2011 and December 31, 2010
(Dollar values shown in millions)
TIAA REAL ESTATE ACCOUNT
Shares Issuer
Fair Value
2011
2010
2011
2010
(Unaudited)
41,980
22,706 PS Business Parks, Inc.
$
2.1
$
1.3
277,416
153,807 Public Storage, Inc.
30.9
15.6
87,600
42,225 Ramco-Gershenson Properties Trust
0.7
0.5
261,199
97,616 Rayonier Inc.
9.6
5.1
279,343
141,919 Realty Income Corporation
9.0
4.9
68,656
— Retail Opportunity Investment
0.8
—
197,908
97,060 Regency Centers Corporation
7.0
4.1
69,694
— RLJ Lodging Trust
0.9
—
33,036
17,498 Saul Centers, Inc.
1.1
0.8
330,697
150,706 Senior Housing Properties Trust
7.1
3.3
636,140
352,460 Simon Property Group, Inc.
70.0
35.1
183,739
93,168 SL Green Realty Corp.
10.7
6.3
61,829
34,147 Sovran Self Storage, Inc.
2.3
1.3
20,050
— Stag Industrial Inc
0.2
—
385,489
186,401 Strategic Hotels & Resorts, Inc.
1.7
1.0
59,168
— Summit Hotel Properties Inc
0.4
—
46,326
24,737 Sun Communities, Inc.
1.6
0.8
60,363
29,324 Sun Healthcare Group, Inc.
0.6
0.5
262,606
137,832 Sunstone Hotel Investors, L.L.C.
1.5
1.4
178,864
49,191 Tanger Factory Outlet Centers, Inc.
4.6
2.5
126,129
50,042 Taubman Centers, Inc.
6.3
2.5
16,174
11,532 Terreno Realty Corporation
0.2
0.2
286,812
155,462 The Macerich Company
12.2
7.4
472,751
220,400 UDR, Inc.
10.5
5.2
21,414
5,400 UMH Properties, Inc.
0.2
0.1
30,218
16,113 Universal Health Realty Income Trust
1.0
0.6
50,503
27,120 Urstadt Biddle Properties Inc.
0.8
0.5
—
119,610 U-Store-It Trust
—
1.1
623,780
188,915 Ventas, Inc.
30.8
9.9
399,663
219,149 Vornado Realty Trust
29.8
18.3
145,677
78,376 Washington Real Estate Investment Trust
4.1
2.4
262,970
142,411 Weingarten Realty Investors
5.6
3.4
1,164,958
646,348 Weyerhaeuser Company
18.1
12.2
61,407
22,256 Winthrop Realty Trust
0.5
0.3 TOTAL REAL ESTATE EQUITY SECURITIES
$
813.0
$
495.3 29
CONSOLIDATED STATEMENTS OF INVESTMENTS
September 30, 2011 and December 31, 2010
(Dollar values shown in millions)
(Cost $893.4 and $480.4)
TIAA REAL ESTATE ACCOUNT OTHER MARKETABLE SECURITIES—16.02% and 18.97%
Principal Issuer
Yield(4)
Maturity
Fair Value
2011
2010
2011
2010
(Unaudited)
$
—
$
15.1 Fannie Mae Discount Notes
0.172%
1/18/11
$
—
$
15.1
—
21.2 Fannie Mae Discount Notes
0.172%
2/1/11
—
21.2
—
43.6 Fannie Mae Discount Notes
0.183%
2/3/11
—
43.6
—
13.5 Fannie Mae Discount Notes
0.183%
2/14/11
—
13.5
—
50.0 Fannie Mae Discount Notes
0.137%
2/15/11
—
50.0
—
32.5 Fannie Mae Discount Notes
0.162%-0.178%
3/1/11
—
32.5
—
32.4 Fannie Mae Discount Notes
0.172%
3/2/11
—
32.4
—
14.0 Fannie Mae Discount Notes
0.162%
3/8/11
—
14.0
—
19.6 Fannie Mae Discount Notes
0.178%
3/21/11
—
19.6
—
31.9 Fannie Mae Discount Notes
0.162%
3/23/11
—
31.9
—
20.2 Fannie Mae Discount Notes
0.178%
4/13/11
—
20.2
16.9
— Fannie Mae Discount Notes
0.030%
10/3/11
16.9
—
34.3
— Fannie Mae Discount Notes
0.041%
10/19/11
34.3
—
25.0
— Fannie Mae Discount Notes
0.025%
10/24/11
25.0
—
43.5
— Fannie Mae Discount Notes
0.061%
10/26/11
43.5
—
46.3
— Fannie Mae Discount Notes
0.061%-0.081%
11/2/11
46.3
—
11.0
— Fannie Mae Discount Notes
0.101%
11/23/11
11.0
—
40.0
— Fannie Mae Discount Notes
0.152%
12/1/11
40.0
—
100.0
— Fannie Mae Discount Notes
0.041%
12/2/11
100.0
—
50.0
— Fannie Mae Discount Notes
0.081%
12/7/11
50.0
—
50.0
— Fannie Mae Discount Notes
0.071%
12/9/11
50.0
—
27.5
— Fannie Mae Discount Notes
0.081%
12/12/11
27.5
—
7.9
— Fannie Mae Discount Notes
0.041%
12/29/11
7.9
—
36.9
— Fannie Mae Discount Notes
0.051%
1/3/12
36.9
—
50.0
— Fannie Mae Discount Notes
0.152%
5/3/12
50.0
—
52.5
— Fannie Mae Discount Notes
0.051%-0.142%
11/2/11
52.5
—
—
30.0 Federal Home Loan Bank Discount Notes
0.162%
1/5/11
—
30.0
—
25.0 Federal Home Loan Bank Discount Notes
0.162%
1/7/11
—
25.0
—
30.0 Federal Home Loan Bank Discount Notes
0.172%
1/12/11
—
30.0
—
50.0 Federal Home Loan Bank Discount Notes
0.183%
1/14/11
—
50.0
—
30.0 Federal Home Loan Bank Discount Notes
0.177%
1/19/11
—
30.0
—
15.8 Federal Home Loan Bank Discount Notes
0.157%
1/20/11
—
15.8
—
30.0 Federal Home Loan Bank Discount Notes
0.177%
1/21/11
—
30.0
—
36.4 Federal Home Loan Bank Discount Notes
0.122%
1/26/11
—
36.4
—
50.0 Federal Home Loan Bank Discount Notes
0.157%-0.172%
1/28/11
—
50.0
—
39.1 Federal Home Loan Bank Discount Notes
0.167%-0.178%
2/2/11
—
39.1
—
30.0 Federal Home Loan Bank Discount Notes
0.167%
2/4/11
—
30.0
—
20.1 Federal Home Loan Bank Discount Notes
0.157%
2/9/11
—
20.1
—
47.0 Federal Home Loan Bank Discount Notes
0.147%
2/16/11
—
47.0
—
41.4 Federal Home Loan Bank Discount Notes
0.157%-0.183%
2/18/11
—
41.4
—
35.4 Federal Home Loan Bank Discount Notes
0.183%
2/23/11
—
35.4
—
25.0 Federal Home Loan Bank Discount Notes
0.188%
2/25/11
—
25.0
—
32.8 Federal Home Loan Bank Discount Notes
0.162%
3/9/11
—
32.8
—
27.7 Federal Home Loan Bank Discount Notes
0.162%
3/11/11
—
27.7
—
25.0 Federal Home Loan Bank Discount Notes
0.162%
3/16/11
—
25.0
—
23.8 Federal Home Loan Bank Discount Notes
0.178%
4/15/11
—
23.8 30
CONSOLIDATED STATEMENTS OF INVESTMENTS
September 30, 2011 and December 31, 2010
(Dollar values shown in millions)
GOVERNMENT AGENCY NOTES—10.96% and 11.75%
Date
TIAA REAL ESTATE ACCOUNT
Principal Issuer
Yield(4)
Maturity
Fair Value
2011
2010
2011
2010
(Unaudited)
$
—
$
16.1 Federal Home Loan Bank Discount Notes
0.178%
4/29/11
$
—
$
16.1
—
20.0 Federal Home Loan Bank Discount Notes
0.211%
5/6/11
—
20.0
—
31.8 Federal Farm Credit Bank Discount Notes
0.172%
5/9/11
—
31.8
—
100.0 Federal Home Loan Bank Discount Notes
0.217%
8/12/11
—
100.0
36.7
— Federal Home Loan Bank Discount Notes
0.041%
10/5/11
36.7
—
38.4
— Federal Home Loan Bank Discount Notes
0.051%
10/7/11
38.4
—
43.0
— Federal Home Loan Bank Discount Notes
0.041%
10/21/11
43.0
—
15.7
— Federal Home Loan Bank Discount Notes
0.020%
11/2/11
15.7
—
10.0
— Federal Home Loan Bank Discount Notes
0.051%
11/4/11
10.0
—
36.1
— Federal Home Loan Bank Discount Notes
0.030%-0.051%
11/14/11
36.1
—
22.5
— Federal Home Loan Bank Discount Notes
0.030%
11/16/11
22.5
—
62.5
— Federal Home Loan Bank Discount Notes
0.020%-0.046%
11/18/11
62.4
—
6.7
— Federal Home Loan Bank Discount Notes
0.020%
11/23/11
6.7
—
20.5
— Federal Home Loan Bank Discount Notes
0.015%
12/7/11
20.5
—
46.4
— Federal Home Loan Bank Discount Notes
0.046%-0.152%
12/14/11
46.4
—
50.0
— Federal Home Loan Bank Discount Notes
0.025%-0.030%
12/16/11
50.0
—
5.8
— Federal Home Loan Bank Discount Notes
0.030%
12/23/11
5.8
—
11.5
— Federal Home Loan Bank Discount Notes
0.071%
2/17/12
11.5
—
7.2
— Federal Home Loan Bank Discount Notes
0.071%
2/24/12
7.2
—
16.1
— Federal Home Loan Bank Discount Notes
0.112%
3/7/12
16.1
—
20.0
— Federal Home Loan Bank Discount Notes
0.164%
1/13/12
20.0
—
—
45.9 Freddie Mac Discount Notes
0.157%-0.162%
1/3/11
—
45.9
—
82.7 Freddie Mac Discount Notes
0.183%
1/10/11
—
82.7
—
28.0 Freddie Mac Discount Notes
0.152%
1/25/11
—
28.0
—
28.2 Freddie Mac Discount Notes
0.172%
1/31/11
—
28.1
—
18.1 Freddie Mac Discount Notes
0.142%
2/22/11
—
18.1
—
49.4 Freddie Mac Discount Notes
0.162%-0.178%
3/7/11
—
49.4
—
26.7 Freddie Mac Discount Notes
0.162%
3/14/11
—
26.7
—
14.9 Freddie Mac Discount Notes
0.172%
3/21/11
—
14.9
—
24.6 Freddie Mac Discount Notes
0.183%
4/18/11
—
24.6
—
10.1 Freddie Mac Discount Notes
0.193%
4/19/11
—
10.1
—
50.0 Freddie Mac Discount Notes
0.133%-0.137%
11/9/11
—
49.9
15.0
— Freddie Mac Discount Notes
0.051%
11/14/11
15.0
—
52.6
— Freddie Mac Discount Notes
0.020%-0.081%
11/7/11
52.6
—
50.0
— Freddie Mac Discount Notes
0.143%-0.147%
11/9/11
50.0
—
19.8
— Freddie Mac Discount Notes
0.117%
10/17/11
19.8
—
9.9
— Freddie Mac Discount Notes
0.071%
10/19/11
9.9
—
13.4
— Freddie Mac Discount Notes
0.041%
11/3/11
13.4
—
50.0
— Freddie Mac Discount Notes
0.051%
11/10/11
50.0
—
45.2
— Freddie Mac Discount Notes
0.020%-0.061%
11/21/11
45.2
—
25.0
— Freddie Mac Discount Notes
0.020%
11/22/11
25.0
—
50.0
— Freddie Mac Discount Notes
0.107%
11/28/11
50.0
—
51.6
— Freddie Mac Discount Notes
0.046%-0.061%
12/5/11
51.6
—
25.0
— Freddie Mac Discount Notes
0.081%
12/12/11
25.0
—
9.6
— Freddie Mac Discount Notes
0.035%
12/19/11
9.6
—
26.9
— Freddie Mac Discount Notes
0.091%
12/20/11
26.9
—
31.3
— Freddie Mac Discount Notes
0.152%
12/21/11
31.3
—
40.0
— Freddie Mac Discount Notes
0.041%
12/27/11
40.0
— 31
CONSOLIDATED STATEMENTS OF INVESTMENTS
September 30, 2011 and December 31, 2010
(Dollar values shown in millions)
Date
TIAA REAL ESTATE ACCOUNT
Principal Issuer
Yield(4)
Maturity
Fair Value
2011
2010
2011
2010
(Unaudited)
$
22.1
$
— Freddie Mac Discount Notes
0.056%-0.076%
12/28/11
$
22.1
$
—
20.0
— Freddie Mac Discount Notes
0.051%
2/14/12
20.0
—
28.0
— Freddie Mac Discount Notes
0.101%
2/21/12
28.0
—
5.5
— Freddie Mac Discount Notes
0.091%
3/19/12
5.5
— TOTAL GOVERNMENT AGENCY NOTES
$
1,631.7
$
1,484.8 32
CONSOLIDATED STATEMENTS OF INVESTMENTS
September 30, 2011 and December 31, 2010
(Dollar values shown in millions)
Date
(Cost $1,631.6 and $1,484.7)
TIAA REAL ESTATE ACCOUNT UNITED STATES TREASURY SECURITIES—5.06% and 7.22%
Principal Issuer
Yield(4)
Maturity
Fair Value
2011
2010
2011
2010
(Unaudited)
$
—
$
32.3 United States Treasury Bills
0.130%
1/13/11
$
—
$
32.3
—
31.6 United States Treasury Bills
0.152%
1/27/11
—
31.6
—
32.4 United States Treasury Bills
0.129%
2/10/11
—
32.4
—
30.0 United States Treasury Bills
0.133%
2/17/11
—
30.0
—
30.0 United States Treasury Bills
0.140%
2/24/11
—
30.0
—
91.0 United States Treasury Bills
0.106%-0.137%
3/3/11
—
91.0
—-
41.4 United States Treasury Bills
0.132%-0.178%
3/10/11
—
41.4
—
46.3 United States Treasury Bills
0.142%-0.163%
3/17/11
—
46.3
—
34.0 United States Treasury Bills
0.141%
3/24/11
—
34.0
—
30.0 United States Treasury Bills
0.147%
3/31/11
—
30.0
—
50.0 United States Treasury Bills
0.137%
4/7/11
—
50.0
—
38.2 United States Treasury Bills
0.148%-0.173%
4/14/11
—
38.1
—
30.0 United States Treasury Bills
0.133%-0.173%
4/21/11
—
30.0
—
25.0 United States Treasury Bills
0.173%
4/28/11
—
25.0
—
28.6 United States Treasury Bills
0.153%
5/5/11
—
28.6
—
55.0 United States Treasury Bills
0.162%-0.184%
5/12/11
—
55.0
—
49.2 United States Treasury Bills
0.190%-0.210%
5/19/11
—
49.2
—
47.1 United States Treasury Bills
0.170%-0.200%
5/26/11
—
47.1
—
0.2 United States Treasury Bills
0.061%-0.167%
6/9/11
—
0.2
—
19.3 United States Treasury Bills
0.137%-0.178%
6/16/11
—
19.3
—
4.3 United States Treasury Bills
0.168%-0.181%
6/23/11
—
4.3
68.4
— United States Treasury Bills
0.020%-0.158%
10/20/11
68.4
—
66.9
— United States Treasury Bills
0.053%-0.059%
10/6/11
66.9
—
47.4
— United States Treasury Bills
0.052%-0.109%
10/13/11
47.4
—
50.0
— United States Treasury Bills
0.041%
10/27/11
50.0
—
50.7
— United States Treasury Bills
0.076%-0.089%
11/10/11
50.7
—
13.0
— United States Treasury Bills
0.099%-0.107%
11/25/11
13.0
—
18.7
— United States Treasury Bills
0.086%-0.101%
12/1/11
18.7
—
25.0
— United States Treasury Bills
0.071%
12/22/11
25.0
—
9.6
— United States Treasury Bills
0.015%
12/29/11
9.6
—
—
29.5 United States Treasury Notes
0.148%
2/28/11
—
29.5
—
50.8 United States Treasury Notes
0.174%-0.227%
3/31/11
—
50.9
—
21.5 United States Treasury Notes
0.245%
4/30/11
—
21.5
—
33.7 United States Treasury Notes
0.237%
6/30/11
—
33.8
—
30.4 United States Treasury Notes
0.267%
9/30/11
—
30.4
25.0
— United States Treasury Notes
0.276%
12/15/11
25.1
—
50.0
— United States Treasury Notes
0.259%
1/15/12
50.2
—
20.0
— United States Treasury Notes
0.345%
2/15/12
20.1
—
15.0
— United States Treasury Notes
0.078%
3/15/12
15.1
—
50.0
— United States Treasury Notes
0.106%
6/15/12
50.5
—
47.3
— United States Treasury Notes
0.156%
8/15/12
48.0
—
32.1
— United States Treasury Notes
0.169%
10/31/11
32.1
—
11.5
— United States Treasury Notes
0.024%
1/31/12
11.5
— 33
CONSOLIDATED STATEMENTS OF INVESTMENTS
September 30, 2011 and December 31, 2010
(Dollar values shown in millions)
Date
TIAA REAL ESTATE ACCOUNT
Principal Issuer
Yield(4)
Maturity
Fair Value
2011
2010
2011
2010
(Unaudited)
$
50.0
$
— United States Treasury Notes
0.200%
11/30/11
$
50.1
$
—
30.6
— United States Treasury Notes
0.138%
2/29/12
30.6
—
6.3
— United States Treasury Notes
0.264%
3/31/12
6.3
—
53.4
— United States Treasury Notes
0.101%-0.115%
5/31/12
53.6
—
11.1
— United States Treasury Notes
0.119%
7/31/12
11.2
— TOTAL UNITED STATES TREASURY SECURITIES
$
754.1
$
911.9 TOTAL OTHER MARKETABLE SECURITIES
$
2,385.8
$
2,396.7 TOTAL MARKETABLE SECURITIES
$
3,198.8
$
2,892.0 TOTAL INVESTMENTS
$
14,893.3
$
12,636.6
(1)
The investment has a mortgage loan payable outstanding, as indicated in Note 8. (2) The market value reflects the Account’s interest in the joint venture and is net of debt. (3) Properties within this investment are located throughout the United States. (4) Yield represents the annualized yield at the date of purchase. 34
CONSOLIDATED STATEMENTS OF INVESTMENTS
September 30, 2011 and December 31, 2010
(Dollar values shown in millions)
Date
(Cost $754.0 and $911.9)
(Cost $2,385.6 and $2,396.6)
(Cost $3,279.0 and $2,877.0)
(Cost $15,903.4 and $14,549.4)
ITEM 2. MANAGEMENT’S DISCUSSION AND ANALYSIS OF FINANCIAL CONDITION AND RESULTS OF OPERATIONS The following discussion and analysis of our financial condition and results of operations should be read together with our consolidated financial statements and notes contained in this report and with consideration to the sub-section entitled “Forward-Looking Statements,” which begins below, and the section of the
Account’s Annual Report on Form 10-K for the year ended December 31, 2010 (the “Form 10-K”) entitled “Item 1A. Risk Factors.” The past performance of the Account is not indicative of future results. Forward-Looking Statements Some statements in this Form 10-Q which are not historical facts may be “forward-looking statements” within the meaning of Section 27A of the Securities Act of 1933, Section 21E of the Securities Exchange Act of 1934 and the Private Securities Litigation Reform Act of 1995. Forward-looking statements include
statements about management’s expectations, beliefs, intentions or strategies for the future, include the assumptions underlying these forward-looking statements, and are based on current expectations, estimates and projections about the real estate industry, domestic and global economic conditions, including conditions in
the credit and capital markets, the sectors and markets in which the Account invests and operates, and the transactions described in this Form 10-Q. While management believes the assumptions underlying any of its forward-looking statements and information to be reasonable, such information may be subject to
uncertainties and may involve certain risks which may be difficult to predict and are beyond management’s control. These risks and uncertainties could cause actual results to differ materially from those contained in any forward-looking statement. These risks and uncertainties include, but are not limited to, the following:
•
Acquiring and Owning Real Estate: The risks associated with acquiring and owning real property, including general economic and real estate market conditions, the availability of, and economic cost associated with, financing the Account’s properties, the risk that the Account’s properties become too concentrated
(whether by geography, sector or by tenant mix), competition for acquiring real estate properties, leasing risk (including tenant defaults) and the risk of uninsured losses at properties (including due to terrorism and acts of violence); • Selling Real Estate: The risk that the sales price of a property might differ, perhaps significantly, from its estimated or appraised value, leading to losses or reduced profits to the Account, the risk that the Account might not be able to sell a property at a particular time for a price which management believes
represents its fair or full value, the lack of availability of financing (for potential purchasers of the Account’s properties), disruptions in the credit and capital markets, and the risk that the Account may be required to make significant expenditures before the Account is able to market and/or sell a property; • Valuation: The risks associated with property valuations, including the fact that appraisals can be subjective in a number of respects, the fact that the Account’s appraisals are generally obtained on a quarterly basis and the fact that there may be periods in between appraisals of a property during which the value
attributed to the property for purposes of the Account’s daily accumulation unit value may be more or less than the actual realizable value of the property; • Borrowing: Risks associated with financing the Account’s properties, including the risk of default on loans secured by the Account’s properties or properties held in a joint venture in which the Account has an interest (which could lead to foreclosure), the risk associated with high loan to value ratios on the
Account’s properties (including the fact that the Account may have limited, or no net value in such a property), the risk that significant sums of cash could be required to make principal and interest payments on the loans and the risk that the Account may not have the ability to obtain financing or refinancing on
favorable terms (or at all), which may be aggravated by general disruptions in credit and capital markets; • Participant Transactions and Cash Management: Investment risk associated with participant transactions, in particular that (i) significant net participant transfers out of the Account may impair our ability to pursue or consummate new investment opportunities that are otherwise attractive to the Account and/or
may result in sales of real estate-related assets to generate liquidity and (ii) significant net participant transfers into the Account may result, on a temporary basis, in our cash holdings and/or 35
holdings in liquid real estate- related investments exceeding the Account’s long-term targeted holding levels; • Joint Venture Investments: The risks associated with joint venture partnerships, including the risk that a co-venturer may have interests or goals inconsistent with that of the Account, that a co-venturer may have financial difficulties, and the risk that the Account may have limited rights with respect to operation of
the property and transfer of the Account’s interest; • Regulatory Matters: Uncertainties associated with environmental liability and regulations and other governmental regulatory matters such as zoning laws, rent control laws, and property taxes; • Foreign Investments: The risks associated with purchasing, owning and disposing of foreign investments (primarily real estate properties), including political risk, the risk associated with currency fluctuations, regulatory and taxation risks and risks of enforcing judgments; • Conflicts of Interest: Conflicts of interest associated with TIAA serving as investment manager of the Account and provider of the liquidity guarantee at the same time as TIAA and its affiliates are serving as an investment manager to other real estate accounts or funds, including conflicts associated with satisfying
its fiduciary duties to all such accounts and funds associated with purchasing, selling and leasing of properties; • Required Property Sales: The risk that, if TIAA were to own too large a percentage of the Account’s accumulation units through funding the liquidity guarantee (as determined by the independent fiduciary), the independent fiduciary could require the sales of properties to reduce TIAA’s ownership interest, which
sales could occur at times and at prices that depress the sale proceeds to the Account; • Government and Government Agency Securities: Risks associated with investment securities issued by U.S. government agencies and U.S. government-sponsored entities, including the risk that the issuer may not have their securities backed by the full faith and credit of the U.S. government, and that transaction
activity may fluctuate significantly from time to time, which could negatively impact the value of the securities and the Account’s ability to dispose of a security at a favorable time; • Liquid Assets and Securities: Risks associated with investments in real estate-related liquid assets (which could include, from time to time, REIT securities and CMBS), and non-real estate-related liquid assets, including:
•
Financial/credit risk—Risks that the issuer will not be able to pay principal and interest when due or that the issuer’s earnings will fall; • Market volatility risk—Risk that the changing conditions in financial markets may cause the Account’s investments to experience price volatility; • Interest rate volatility risk—Risk that interest rate volatility may affect the Account’s current income from an investment; and • Deposit/money market risk—Risk that the Account could experience losses if banks fail; and
•
Other factors, including the risk factors discussed in “Item 1A. Risk Factors” in the Form 10-K.
More detailed discussions of certain risk factors are also contained in this Form 10-Q including in the section entitled “Item 3. Quantitative and Qualitative Disclosures About Market Risk.” Caution should be taken not to place undue reliance on management’s forward-looking statements, which represent management’s views only as of the date that this report is filed. Neither management nor the Account undertake any obligation to update publicly or revise any forward-looking statement, whether as a
result of new information, changed assumptions, future events or otherwise. ABOUT THE TIAA REAL ESTATE ACCOUNT The TIAA Real Estate Account was established in February 1995 as a separate account of TIAA and interests in the Account were first offered to eligible participants on October 2, 1995. The Account offers individual and group accumulating annuity contracts (with contributions made on a pre-tax or after-tax
basis), as well as individual lifetime and term-certain variable payout annuity contracts (including the 36
payment of death benefits to beneficiaries). Investors are entitled to transfer funds to or from the Account under certain circumstances. Funds invested in the Account for each category of contract are expressed in terms of units, and unit values will fluctuate depending on the Account’s performance. Investment Objective and Strategy The Account seeks favorable long-term returns primarily through rental income and appreciation of real estate investments owned by the Account. The Account will also invest in non-real estate-related publicly traded securities and short-term higher quality liquid investments that are easily converted to cash
to enable the Account to meet participant redemption requests, purchase or improve properties or cover other expense needs. Real Estate-Related Investments. The Account intends to have between 75% and 85% of its net assets invested directly in real estate or real estate-related investments with the goal of producing favorable long-term returns primarily through rental income and appreciation. These investments may consist of:
Direct ownership interests in real estate, • Direct ownership of real estate through interests in joint ventures, • Indirect interests in real estate through real estate-related securities, such as:
•
real estate limited partnerships, • real estate investment trusts (“REITs”), which investments may consist of common or preferred stock interests, • investments in equity or debt securities of companies whose operations involve real estate (i.e., that primarily own or manage real estate) which may not be REITs, and • conventional mortgage loans, participating mortgage loans, and collateralized mortgage obligations, including commercial mortgage-backed securities (“CMBS”) and other similar investments. The Account’s principal strategy is to purchase direct ownership interests in income-producing real estate, primarily office, industrial, retail and multi-family residential properties. The Account is targeted to hold between 65% and 80% of the Account’s net assets in such direct ownership interests at any time.
Historically, over 70% of the Account’s net assets have been comprised of such direct ownership interests in real estate. In addition, while the Account is authorized to hold up to 25% of its net assets in liquid real estate-related securities, such as REITs and CMBS, management intends that the Account will not hold more than 10% of its net assets in such securities on a long-term basis. Historically, less than 10% of the
Account’s net assets have been comprised of interests in these securities. In particular, under the Account’s current investment guidelines, the Account is authorized to hold up to 10% of its net assets in CMBS. Non-Real Estate-Related Investments. The Account will invest the remaining portion of its assets (targeted to be between 15% and 25% of its net assets) in publicly-traded, liquid investments; namely:
•
U.S. treasury securities, • securities issued by U.S. government agencies or U.S. government sponsored entities, • corporate debt securities, • money market instruments, and • stock of companies that do not primarily own or manage real estate. However, from time to time (and most recently between late 2008 and mid 2010), the Account’s non-real estate-related liquid investments may comprise less than 15% (and possibly less than 10%) of its assets (on a net basis and/or a gross basis), especially during and immediately following periods of significant
net participant outflows, in particular due to significant participant transfer activity. In addition, the Account, from time to time and on a temporary basis, may hold in excess of 25% of its net assets in non-real estate-related liquid investments, particularly during times of significant inflows into the Account and/or
there is a lack of attractive real estate-related investments available in the market. 37
•
Liquid Securities. Primarily due to management’s need to manage fluctuations in cash flows, in particular during and immediately following periods of significant participant net transfer activity into or out of the Account, the Account may, on a temporary basis (i) exceed the upper end of its targeted holdings
(currently 35% of the Account’s net assets) in liquid securities of all types, including both publicly-traded non-real estate-related liquid investments and liquid real estate-related securities, such as REITs and CMBS, or (ii) be below the low end of its targeted holdings in such liquid securities (currently 15% of the
Account’s net assets).
•
The portion of the Account’s net assets invested in liquid investments of all types may exceed the upper end of its target, for example, if (i) the Account receives a large inflow of money in a short period of time, in particular due to significant participant transfer activity into the Account, (ii) the Account
receives significant proceeds from sales of direct real estate assets, (iii) there is a lack of attractive direct real estate investments available on the market, and/or (iv) the Account anticipates more near-term cash needs, including to apply to acquire direct real estate investments, pay expenses or repay
indebtedness.
Foreign Investments. The Account from time to time will also make foreign real estate investments. Under the Account’s investment guidelines, investments in direct foreign real estate, together with foreign real estate-related securities and foreign non-real estate-related liquid investments, may not comprise
more than 25% of the Account’s net assets. However, through the date of this Form 10-Q, such foreign real estate-related investments have never represented more than 7.5% of the Account’s net assets and management does not intend such foreign investments to exceed 10% of the Account’s net assets. THIRD QUARTER 2011 U.S. ECONOMIC AND COMMERCIAL REAL ESTATE OVERVIEW Commercial real estate market statistics discussed in this section are obtained by the Account from sources that management considers reliable, but some of the data are preliminary for the period ended September 30, 2011 and may be subsequently revised. Prior period data may have been adjusted to reflect updated
calculations. Investors should not rely exclusively on the data presented below in forming a judgment regarding the current or prospective performance of the commercial real estate market generally. The Account invests primarily in high-quality, core commercial real estate in order to meet its investment objective of obtaining favorable long-term returns through rental income and the appreciation of its real estate holdings. The Account does not directly invest in either single-family residential real estate,
nor does it currently invest in residential mortgage-backed securities, although it may invest in such securities in the future. Economic and Capital Markets Overview and Outlook The U.S. economy generally remained sluggish during the third quarter of 2011, but the pace of economic growth increased modestly. The Bureau of Economic Analysis’s advance estimate of Gross Domestic Product (“GDP”) in the third quarter of 2011 improved to 2.5%, as compared to 1.3% in the second
quarter of 2011 and 0.4% in the first quarter of 2011. Economic activity in the third quarter was hampered by domestic factors, including the negative impacts of the downgrade of U.S. government debt following the impasse over debt ceiling negotiations, and global factors, particularly the ongoing sovereign debt
crisis in Europe. As Federal Reserve Chairman Ben Bernanke noted in his October 4, 2011 speech before the Joint Economic Committee, U.S. Congress, the recovery since the financial crisis has been extremely weak, with economic output still below the aggregate level generated before the crisis. Chairman
Bernanke observed that more sluggish growth in the first half of the year was attributable in large part to temporary factors that were expected to fade; however, “...incoming data suggest that other, more persistent factors also continue to restrain the pace of recovery.” These factors include cautious household
spending, an extremely weak job market, a depressed housing market, lingering stress from the global financial crisis, and the drag from layoffs and spending cuts by the government sector. The Federal Open Market Committee (“FOMC”) now expects a slower pace of economic growth over coming quarters than it
previously did at the time of its June 2011 meeting, when its last economic forecasts were provided. In the same October 4, 2011 speech, Chairman Bernanke observed that there have been many positive developments since the financial crisis started some three years ago. These include the improved functioning of the U.S. financial and banking system, a 15% rise in manufacturing production since its
recessionary trough, a decline in the trade deficit, continued business investment in equipment and software, and sizeable 38
productivity gains in a number of industries. Still, the recovery since the crisis has been far less robust than was expected. Employment growth, in particular, has been anemic. U.S. employment grew by 287,000 during the third quarter of 2011, which was virtually identical to the 290,000 increase in the second
quarter, but well short of the 497,000 gain in the first quarter of 2011. The unemployment rate remains stuck at 9.1% as the pace of job growth is not sufficient to absorb both new entrants into the labor force and the currently unemployed. Tepid job growth, in turn, has resulted in lackluster consumer spending
which accounts for approximately 70% of economic activity. The housing market continues to be another drag on the economy. While home prices appear to be stabilizing and the inventory of available homes is being worked down slowly, the downturn in home prices has eliminated trillions of dollars in household wealth and undermined consumer confidence. Academic
studies estimate that consumer spending in 2010 was approximately $240 billion lower than it would have been as a result of the decline in home values over the 2005-2009 period. Residential construction, which has historically provided a boost to the economy following a recession, is currently at a historic low,
given current market conditions. Prospects for an increase in consumer spending have also been dampened by recent stock market volatility resulting from the escalation of Europe’s sovereign debt crisis. Investors have become skittish that a potential default by Greece could trigger defaults by Ireland and Portugal and even Italy or Spain.
Sovereign defaults, in turn, would likely result in sizeable losses at many European banks which hold significant amounts of European government debt. The tepid response of the European Central Bank also fanned investor fears as did the wavering support of the German and French governments plans to provide
the necessary capital for a bailout fund. In late October, a new rescue plan was announced in which banks and insurers agreed to take a 50% loss on Greek bond holdings, the European Financial Stability Facility was leveraged to increase its bailout capacity to 1 trillion euros, and measures were implemented to
recapitalize European banks. However, full details still need to be worked out, and the ongoing support of Germany, France, and other Eurozone members will be required. While Europe’s troubles thus far have had only an indirect negative effect on the U.S. economy through weakened household and business
confidence, 72% of economists surveyed as part of the October 1 Blue Chip Financial Forecast publication believe that spillover effects from the European crisis pose the biggest threat to continued growth in the U.S. economy in the coming year. Uncertainties about the global economy and particularly the European sovereign debt crisis resulted in sizeable declines in global equity markets during the third quarter. The Dow Jones Industrial Average lost 13% in the third quarter of 2011, while the S&P 500 dropped 15%. The bond market was the primary
beneficiary of investor skittishness and a new round of bond buying by the Federal Reserve, with the yield on the 10-year Treasury falling from 3.20% at the start of the quarter to under 2.00% at the end of the quarter. Gold and commodity prices, which had surged through the first half of the year, tumbled as
evidence accumulated that the global economy was slowing. In its September 21, 2011 statement, the FOMC observed that “there are significant downside risks to the economic outlook, including strains in global financial markets.” Consequently, the FOMC reiterated its plans to keep the target range for the federal funds rate at 0 to ¼ percent and expects that economic
conditions will warrant keeping the target rate at this level until mid-2013. The FOMC will also take steps to provide additional stimulus to the economy by purchasing $400 billion of Treasuries with longer term maturities and selling an equal amount of securities with shorter maturities. “Operation Twist”, which
would be accomplished over an 18 month period, is expected to put downward pressure on long-term interest rates and thereby make broad financial conditions more supportive of economic growth. Shortly after the announcement, yields on 10-year Treasuries fell below 2% but have since ticked up to around
2.25% which is still very low by historic standards. Many private sector economists are skeptical that Operation Twist will provide a substantial economic boost given the already low interest rate environment. Economists have also begun cutting their forecasts for the U.S. economy. A primary concern is that the extremely fragile nature of the recovery makes the economy particularly vulnerable to exogenous shocks and/or policy mistakes that could trigger a recession. The consensus of economists surveyed as part of
the October 1 Blue Chip Financial Forecast publication puts the odds of recession by the end of 2011 at 35%. However, most of these same economists continue to believe that the U.S. economy will not fall into recession but will continue on its slow growth path into 2012. While sub-par growth is expected,
improvement in the U.S. economy is expected over the course of 2012. 39
Election year politics could impact upcoming negotiations on the $1.5 trillion in additional budget cuts that were mandated by the debt ceiling compromise along with job bill proposals, proposals to extend unemployment benefits and other long-standing issues like Social Security. As Chairman Bernanke
observed in his October 4, 2011 testimony, there is a need to put in place a credible plan for reducing future federal budget deficits over the longer term that does not impede the economic recovery in the short term: “In sum, the nation faces difficult and fundamental fiscal choices, which cannot be safely or
responsibly postponed.” However, an election year is an especially challenging time to fully address issues of this magnitude. Recent trends in key economic indicators are summarized in the table below. Evidence of the slowdown in economic activity is apparent in the sluggish GDP and employment growth over the course of 2011. The meager gains in employment, particularly compared with the fourth quarter of 2010 and the first
quarter of 2011 are especially noteworthy. Note, however, that growth of private sector payrolls (not shown below) was stronger, with a gain of 352,000 in the third quarter of 2011, 415,000 in the second quarter and 574,000 in the first quarter of 2011. Employment cuts by state and local governments, and more
recently, the federal government, have measurably reduced overall employment growth. The unemployment rate remained at 9.1% in September, but economists expect it to decline gradually over the course of 2012. Forecasts for 2012 indicate that U.S. employment is expected to grow by 1.0 to 1.6 million, or
around 335,000 to 525,000 per quarter. This relatively wide range of 2012 forecast employment growth is indicative of the uncertain economic outlook, with forecast outcomes predicated on key assumptions on interest rates, government policy initiatives, and the like. Economic Indicators*
2010
2010Q4
2011Q1
2011Q2
2011Q3
Forecast
2011
2012 Economy(1) Gross Domestic Product (GDP)
3.0
%
2.3
%
0.4
%
1.3
%
2.5
%
1.7
%
2.0
% Employment Growth (Thousands)
940
416
497
290
287
1,200-1,400
1,000-1,600 Interest Rates(2) 10 Year Treasury
3.21
%
2.86
%
3.46
%
3.21
%
2.43
%
2.80
%
2.60
% Federal Funds Rate
0.0-0.25
%
0.0-0.25
%
0.0-0.25
%
0.0-0.25
%
0.0-0.25
%
0.0-0.25
%
0.0-0.25
% Sources: BEA, BLS, Federal Reserve, Blue Chip Consensus Forecasts, and Moody’s Analytics
*
Data subject to revision (1) GDP growth rates are annual rates. (2) The Treasury rates are an average over the stated time period. The Federal Funds rates are as of the end of the stated time period. N/A indicates data not available. Other indicators of U.S. economic activity, including those summarized in the table below, highlight the modest growth of the U.S. economy. Retail sales increased during the third quarter of 2011; however, consumers are becoming more cautious according to anecdotal reports from major retailers. The housing
market continues to limp along with existing home sales declining 3.0% in September and median home prices (not shown) down 3.5% compared with September 2010. While mortgage interest rates are very attractive, realtors believe that tight underwriting standards and lagging appraisal values have curtailed
sales. Broad Economic Indicators*
Full Year
July
Aug.
Sep.
2009
2010 % Change from prior month or year Inflation (Consumer Price Index)
-0.4
%
1.6
%
0.5
%
0.4
%
0.3
% Retail Sales (excl. auto, parts & gas)
-2.9
%
4.2
%
0.3
%
0.5
%
0.5
% Existing Home Sales
4.9
%
-4.8
%
-3.5
%
8.4
%
-3.0
% New Home Sales
-22.9
%
-13.9
%
-2.0
%
-0.3
%
5.7
% Single-family Housing Starts
-28.5
%
5.9
%
-4.2
%
-2.8
%
1.7
% Annual or Monthly Average Unemployment Rate
9.3
%
9.6
%
9.1
%
9.1
%
9.1
%
*
Data subject to revision
Inflation is the year-over-year percentage change in the unadjusted annual average. Sources: Census Bureau, Bureau of Labor Statistics, National Association of Realtors, Moody’s Analytics 40
2011
2011
2011
The October 19, 2011 Beige Book reported that economic activity continued to expand in all twelve Federal Reserve Districts (“Districts”) since the September 7, 2011 report. However, many Districts reported the pace of growth as “modest” or “slight”, with weaker or less certain outlooks for business
conditions being noted. Consistent with recently released economic data, consumer spending was up slightly in most Districts. Similarly, business spending increased at a modest rate, but many Districts noted restraint in hiring and capital spending. Manufacturing activity generally continued to expand, and
particularly in Districts involved in the production of autos and other transportation-related equipment. A few Districts reported slight improvement in construction and real estate activity. Residential real estate conditions remained exceptionally weak though rental demand continued to rise in a number of
Districts. Commercial real estate construction also remained weak, but increased leasing activity and an increase in demand for distribution facilities was noted in several Districts. In short, regional reports provided confirmation of the moderation in economic activity that continued during the third quarter of 2011. The general consensus of both public and private economists is that economic activity will gain strength over the course of 2012. There is a wide range of views as to how strong economic activity will be in 2012, but a pickup in growth is expected as forces which slowed economic activity in the first half of 2011
dissipate. Monetary policy initiatives should provide additional support by improving credit availability and boosting consumer and business confidence. Considerable downside risk remains from a variety of factors including the desire of businesses and households to reduce overall debt levels rather than increase
spending, the negative effects of greater than expected fiscal tightening by the federal government, and detrimental spillover effects from a worsening of the European debt crisis. Nonetheless, most economists expect the economy to continue on its slow growth path during 2012. The consensus of economists
surveyed as part of the October 1 Blue Chip Financial Forecast publication is for U.S. GDP to grow at a 2.0% rate during the fourth quarter of 2011 and to be followed by growth of 2.0%, 2.3%, 2.6% and 2.8% in the subsequent quarters of 2012. Similarly, the consensus of Blue Chip economists is for employment
growth to average a meager 80,000 over each of the last four months of 2011 but to grow to grow by an average of 130,000 per month in all of 2012. While GDP and employment growth of this magnitude would be historically weak compared with other post-recession periods, it would provide support for further
improvement in commercial real estate market conditions over the course of 2012. Real Estate Market Conditions and Outlook Commercial real estate market statistics discussed in this section are obtained by the Account from sources that Management considers reliable, but some of the data are preliminary for the quarter ended September 30, 2011 and may subsequently be revised. Prior period numbers may have been adjusted to reflect
updated data. Industry sources such as CB Richard Ellis Economic Advisors calculate vacancy based on square footage. Except where otherwise noted, the Account’s vacancy data is calculated as a percentage of net rentable space leased, weighted by square footage, in keeping with industry standards. Investors should
not rely exclusively on the data presented below in forming a judgment regarding the current or prospective performance of the real estate market generally. Commercial real estate investment activity remained healthy during the third quarter of 2011; however, there were anecdotal reports that leasing activity moderated in the latter part of the quarter as concerns about the global economy and sovereign debt crisis increased. Nonetheless, commercial real estate
fundamentals remained largely steady, except in the apartment market where increased demand and solid rent growth were reported in markets across the country. Improvements in office, industrial and retail market conditions were more modest, but still noteworthy given the lackluster economy. Given the modest
economic growth, commercial real estate fundamentals could soften in the coming quarters since the commercial real estate industry tends to lag broader economic trends. Commercial property sales activity remained healthy in the third quarter but it also tapered off in the latter part of the quarter as concerns grew about the cooling of the global economy. According to Real Capital Analytics (“RCA”), sales of office, industrial, retail and apartment properties totaled $50 billion
in the third quarter of 2011, up 38% from the third quarter of 2010 but down 14% compared to the second quarter of 2011. The sales growth rate moderated in each month during the quarter as investor concerns grew, but cap rates and prices held firm according to RCA, and particularly for high quality properties.
Sales volume through the first three quarters of 2011 totaled $140 million, which already exceeds the full year total for 2010. The office and apartment sectors continued to be the most active, with investor interest 41
concentrated on major markets such as Washington DC, New York, Boston, San Francisco and Los Angeles. RCA notes that sales activity in some secondary markets also picked up as investors broadened their geographical targets. The moderation in economic and sales activity was reflected in Green Street Advisors’ Commercial Property Price Index (“CPPI”). The CPPI, which is based on sales transactions and weighted by property value such that the larger properties have a proportionally larger impact on the index, increased 1% in
the third quarter of 2011 as compared with a 5% increase in the second quarter of 2011. The slowdown in momentum was evident in August and September when the CPPI registered no increase. Commercial property prices as measured by the index have recovered much of the decline experienced during the 2007-
2009 downturn; however, prices are still some 10% below their August 2007 highs. According to Green Street, three factors are responsible for the rebound in prices: (1) plunging return hurdles across most asset classes; (2) a dearth of distressed sellers; and (3) a quicker than expected rebound in fundamentals in
some major property sectors. Asset values continued to rise in the third quarter of 2011, contributing to healthy total returns for the commercial property sector. For the four quarter period ending September 30, 2011, NCREIF Property Index (“NPI”) returns were 16.1%, consisting of a 6.3% income return and a 9.4% capital return. By
comparison, returns for the four quarter period ending June 30, 2011 were 16.7%. Returns have now been positive across the four major property types for seven consecutive quarters. Data for the Account’s top five markets in terms of market value as of September 30, 2011 are provided below. These markets represent 43.4% of the Account’s total real estate portfolio. The Account’s top five markets were unchanged compared with the second quarter. Occupancies fell below 90% in both
Washington, DC and San Francisco due to the relocation of two large tenants from the Account’s office buildings in those markets. Metropolitan Area
Account %
# of Property
Metro Areas as a
Metro Area as a Washington-Arlington-
84.8%
9
14.1%
10.7% New York-Wayne-White Plains NY-NJ
97.9%
5
9.1%
7.0% Boston-Quincy MA
90.3%
5
7.5%
5.8% Los Angeles-Long Beach-Glendale CA
91.1%
8
6.5%
5.0% San Francisco-San Mateo-Redwood City CA
80.9%
4
6.1%
4.7%
*
Weighted by market value, which differs from the calculations provided for market comparisons to CBRE-EA data and are used here to reflect the fair market value of the Account’s monetary investments in those markets.
Office According to CB Richard Ellis Economic Advisors (“CBRE-EA”), the national office vacancy rate was 16.2% in the third quarter of 2011, which was unchanged from the second quarter of 2011. The vacancy rate had declined in the prior four consecutive quarters as a result of the improving national economy
but held steady during the third quarter as a result of the moderation in economic activity. By comparison, the vacancy rate for the Account’s office portfolio remained well below the national average but increased to 12.8% as of the third quarter of 2011 as compared with 10.3% in the second quarter of 2011. As
shown in the table below, the vacancy rate of properties owned by the Account in three of its top five office markets—Boston, Seattle and Houston—declined and remained well below their respective market averages. The vacancy rate of the Account’s properties in its top market, Washington DC, increased to 18.3%
as the result of a relocation by a large tenant in one of the Account’s properties. The recently vacated space is currently being marketed to new tenants with proposals out for approximately one-third of the space. Similarly, the vacancy rate of the Account’s properties in San Francisco jumped to 21.5% in the third
quarter from 6.2% in the second quarter due to the loss of a large tenant. The recently vacated space is being marketed with negotiations underway to re-lease a large portion of the space to a new tenant. 42
Leased
Market Value
Weighted*
Investments
% of Total Real
Estate Portfolio
% of Total
Investments
Alexandria DC-VA-MD-WV
Account
Metropolitan
Sector Metropolitan Area
Total Sector
% of Total
2011Q3
2011Q2
2011Q3
2011Q2
Office Account/Nation
12.8%
10.3%
16.2%
16.2%
1 Washington-Arlington-
$
1,276.8
8.6%
18.3%
6.4%
13.2%
13.3%
2 Boston-Quincy MA
$
832.6
5.6%
10.5%
12.1%
13.0%
13.1%
3 San Francisco-San Mateo-Redwood City CA
$
613.7
4.1%
21.5%
6.2%
11.7%
12.0%
4 Seattle-Bellevue-Everett WA
$
524.1
3.5%
8.7%
10.2%
15.9%
15.8%
5 Houston-Sugar Land-Baytown TX
$
416.4
2.8%
4.7%
6.2%
15.1%
15.3%
*
Source: CBRE-EA. Vacancy is defined as the percentage of space vacant. The Account’s vacancy is defined as the weighted percentage of unleased space.
The Account’s results for the third quarter of 2011 are largely consistent with the moderation in office market conditions at the national level. Demand for office space is driven largely by job growth in the financial and professional and business services sectors. During the third quarter of 2011, the financial
sector shed 6,000 jobs after a loss of 2,000 jobs in the second quarter of 2011. Banks and financial firms have been paring payrolls largely because of pending regulatory changes that will be instituted as a result of the financial crisis, and several major banks have announced layoffs after third quarter earnings fell far
short of Wall Street’s estimates. The professional and business services sector continued to expand in the third quarter, albeit at a still modest pace, adding 125,000 jobs in the quarter, following a gain of 102,000 in the second quarter of 2011. Further improvement in office market conditions depends upon an
increase in office employment. While office employment growth is the primary driver of aggregate demand for space, the leasing activity that occurs each quarter is to a large extent a function of the expiration of leases signed in prior years, which in turn constitute a second source of demand for vacant space. In the current economic and
market environment, many companies are looking for opportunities to upgrade their space and plan for the long term as leases expire, but they are often leasing less space in order to reduce overhead costs. Similarly, many companies are moving from older, less efficient buildings to newer, technologically functional
buildings where they are able to reduce their space requirements by reducing the average square feet per employee and eliminating or reducing the amount of meeting rooms and common space. This reevaluation of space needs has presented tenants with options: relocate to space in other buildings but incur the
time and physical expense of moving or renew leases at existing buildings, thereby, saving moving costs and upheaval, but enduring the period of construction required to upgrade space. Class A buildings have been the primary beneficiaries of a “flight to quality”. The Account’s investments in a number of major
markets are well positioned to benefit from this trend; however, two of the Account’s buildings in Washington, DC and San Francisco have lost large tenants which moved to new buildings in order to avoid the disruption from retrofitting existing space. Industrial Conditions in the industrial market are influenced to a large degree by growth in GDP, industrial production and international trade flows. After nine consecutive quarters of GDP growth, a 5.1% increase in industrial production during the third quarter of 2011, and a rebound of global trade flows, U.S.
industrial market conditions continued to improve, particularly in coastal markets where global trade activity is centered. During the third quarter of 2011, the national industrial availability rate declined for the fourth consecutive quarter to 13.7% as compared to 13.9% in the second quarter of 2011. By comparison,
the vacancy rate for the Account’s industrial property portfolio declined to an average of 4.9% in the third quarter of 2011 as compared with 6.8% in the second quarter of 2011. The vacancy rate of the Account’s properties in four of its top five industrial markets remained well below their respective market
averages. The vacancy rate of the Account’s properties in Los Angeles increased to 12.1% from 8.8% in the second quarter due to the relocation of a medium sized tenant. 43
Weighted
Average
Vacancy
Area
Vacancy*
by Metro Area
($M)
Investments
Alexandria DC-VA-MD-WV
Account
Metropolitan
Sector Metropolitan Area
Total Sector
% of Total
2011Q3
2011Q2
2011Q3
2011Q2
Industrial Account/Nation
4.9%
6.8%
13.7%
13.9%
1 Riverside-San Bernardino-Ontario CA
$
459.3
3.1%
5.0%
3.5%
12.1%
12.5%
2 Dallas-Plano-Irving TX
$
191.6
1.3%
1.3%
1.3%
15.3%
15.3%
3 Fort Lauderdale-Pompano Beach-Deerfield Beach FL
$
152.4
1.0%
3.9%
6.9%
13.9%
13.9%
4 Chicago-Naperville-Joliet IL
$
119.4
0.8%
3.7%
3.7%
15.4%
15.8%
5 Los Angeles-Long Beach-Glendale CA
$
99.1
0.7%
12.1%
8.8%
6.8%
7.3%
*
Source: CBRE-EA. Availability is defined as the percentage of space available for rent. Account vacancy is defined as the weighted percentage of unleased space.
Multi-Family Apartment markets tightened further during the third quarter of 2011. The national vacancy rate declined to an average of 5.1% in the third quarter of 2011 as compared to 5.8% in the third quarter of 2010. Year-over-year comparisons are necessary to account for seasonal leasing patterns. Effective rents,
which include concessions such as free rent, increased in virtually all markets tracked by CBRE-EA. The improvement in market conditions has been due to a combination of a decline in home-ownership rates as a result of the housing crisis and an increase in household formations as a result of modest job growth.
Consistent with conditions at the national level, the vacancy rate of the Account’s multi-family portfolio remained low at an average of 2.7% in the third quarter of 2011 versus 2.3% in the second quarter of 2011. As shown in the table below, the average vacancy rate for the Account’s properties in most of the top
apartment markets increased slightly in the third quarter, but all remained low compared to their respective market averages.
Account
Metropolitan
Sector Metropolitan Statistical Area
Total Sector
% of Total
2011Q3
2011Q2
2011Q3
2011Q2
Apartment Account/Nation
2.7%
2.3%
5.1%
5.8%
1 New York-Wayne-White Plains NY-NJ
$
367.0
2.5%
2.0%
0.9%
4.0%
5.4%
2 Washington-Arlington-Alexandria DC-VA-MD-WV
$
242.7
1.6%
5.3%
3.2%
3.9%
3.8%
3 Houston-Bay Town-Sugar Land TX
$
241.1
1.6%
2.8%
2.3%
8.5%
8.8%
4 Denver-Aurora CO
$
239.2
1.6%
2.1%
0.6%
4.7%
4.6%
5 Atlanta-Sandy Springs-Marietta GA
$
133.7
0.9%
2.0%
2.8%
9.0%
9.0%
*
Source: CBRE-EA. Vacancy is defined as the percentage of units vacant. The Account’s vacancy is defined as the weighted percentage of unleased units.
Retail Retail market conditions continued to reflect softness in consumer spending due to job worries, persistently high unemployment and stagnant home prices. Preliminary data from the U.S. Census Bureau indicate that retail sales excluding motor vehicles and parts increased 1.1% in the third quarter of 2011 over 44
Weighted
Average
Vacancy
Area
Availability*
by Metro Area
($M)
Investments
Weighted
Average
Vacancy
Area
Vacancy*
by Metro Area
($M)
Investments
the second quarter of 2011, and 8.1% over the third quarter of 2010. Availability rates in neighborhood and community centers averaged 13.2% in the third quarter of 2011, unchanged from the second quarter of 2011, as retailers remained cautious about opening new stores given the modest growth in retail sales.
Additionally, Gap announced plans to close 20% of its Gap stores, and it is possible that other retail chains will close underperforming stores if retail sales remain soft, which could cause retail availability rates to rise. Contrary to trends at the national level, the vacancy rate for the Account’s retail portfolio declined
to 8.9% during the third quarter of 2011 as compared with 10.8% in the second quarter of 2011. The vacancy rate of the Account’s retail portfolio is well below-average, and the portfolio vacancy rate has now declined for three consecutive quarters. Outlook Despite continued moderation in the U.S. and global economic activity, commercial real estate market conditions improved modestly in the third quarter of 2011. Similarly, commercial property values and returns remained healthy but did not increase compared to the second quarter. Recent softness in the
economy coupled with European debt concerns provide a somewhat uncertain backdrop for commercial real estate as business leaders require a clearer picture of their business prospects when making long-term space decisions. Indeed, anecdotal reports from local market contacts indicate that corporate leasing
decisions now typically involve both extended negotiations and an extended timeframe for completion. Small business owners are acting with greater speed but are still highly rate sensitive. While activity slowed in the third quarter of 2011, aggregate leasing velocity has increased in most markets over the first three
quarters of 2011 as compared with the first three quarters of 2010. We believe leasing is likely to remain modest during the last quarter of 2011 given the uncertain economic outlook, but if economic conditions do strengthen over the course of 2012 as economists expect, commercial real estate fundamentals could
see further improvement. If economic growth does not strengthen, commercial real estate fundamentals could weaken as businesses postpone leasing and expansion decisions. Nonetheless, moderate economic growth in combination with minimal construction has historically provided a favorable backdrop for the
commercial real estate sector. Management continued to implement its strategy to rebalance the property portfolio’s geographic and property sector concentrations. During the third quarter of 2011, the Account acquired a lifestyle shopping center in a major California market and an industrial property in the South Florida market. The
Account also disposed of two office buildings and a retail center in non-target markets and a self storage facility, which was part of a larger storage portfolio joint venture investment held by the Account. Management has also focused on maintaining the Account’s income returns through aggressive property
management and leasing in combination with expense management. Management believes that these activities in combination with the repositioning strategy implemented in 2010 and 2011 are consistent with the Account’s objectives and positively benefited the Account’s performance. As of the third quarter of
2011, the Account’s commercial property holdings were 91.9% leased as compared with 91.6% as of the second quarter of 2011. During the third quarter of 2011, the Account’s real estate assets experienced a 1.67% income return and a 3.49% capital return. As shown in the graph below, returns for the third
quarter of 2011 were the sixth consecutive quarter of positive income and capital returns. 45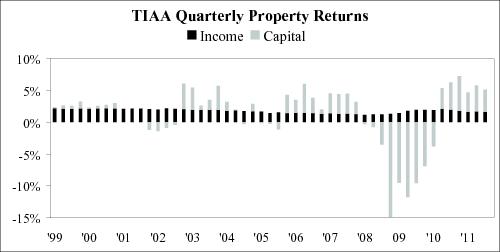
Participant inflows were positive over entire third quarter of 2011, but significant outflows occurred in early August which were correlated with the uncertain economic climate and stock market volatility during the month. Given recent market volatility and the uncertain macroeconomic environment,
Management has heightened its focus on maintaining the Account’s cash position at a level that is sufficient to fully support TIAA’s liquidity guarantee. Investment activities will include the active pursuit of new investment acquisitions with a focus on direct, privately owned real estate, along with liquid real estate-
related securities. Potential acquisitions will continue to be evaluated in the context of overall Account objectives, with an emphasis on industrial, retail, and multi-family properties in order to rebalance the Account’s exposure to the office sector, which has declined through 2011 as a result of Management’s
strategic efforts. Ninety percent of all office assets are now located in target markets. Management believes that the combination of repositioning objectives, which started in 2010 and continued through the first three quarters of 2011, coupled with a disciplined and strategic acquisitions program in the final quarter
of 2011, should position the Account to benefit from the ongoing improvement in commercial real estate market conditions and investors’ focus on major metropolitan markets. While commercial property prices have increased measurably from their lows in the latter half of 2009, Management believes that
properties can still be acquired at prices that represent reasonable value particularly in comparison to replacement cost. Emphasis will continue to be given to institutional quality properties that have a strong occupancy history and favorable tenant rollover schedules. Investments as of September 30, 2011 As of September 30, 2011, the Account had total net assets of $13.0 billion, a 20.1% increase from December 31, 2010. The increase of the Account’s net assets as of September 30, 2011 as compared to December 31, 2010 was primarily caused by the appreciation in value of the Account’s wholly owned real
estate properties and those owned in joint venture investments, purchase of eight real estate investments, as well as net participant activity into the Account during the period. As of September 30, 2011, the Account owned a total of 103 real estate property investments (92 of which were wholly owned, 11 of which were held in joint ventures). The real estate portfolio included 36 office property investments (four of which were held in joint ventures and one located in London,
England), 26 industrial property investments (including one held in a joint venture), 23 apartment complexes, 16 retail property investments (including five held in joint ventures and one located in Paris, France), one 75% owned joint venture interest in a portfolio of storage facilities, and one fee interest
encumbered by a ground lease. Of the 103 real estate property investments, 30 are subject to debt (including seven joint venture property investments). The outstanding principal on mortgage loans payable on the Account’s wholly owned real estate portfolio as of September 30, 2011 was $1.9 billion. The Account’s proportionate share of outstanding principal on mortgage loans payable within its joint venture investments was $1.6 billion, which is netted against
the underlying properties when determining the joint venture investments fair value presented on the Consolidated Statements of Investments. When the mortgage loans payable within the joint venture investments are considered, total outstanding principal on the Account’s portfolio as of September 30, 2011 was
$3.5 billion, which represented a loan to value ratio of 21.3%. The Account currently has no Account-level debt. Management believes that the Account’s real estate portfolio is diversified by location and property type. The Account’s largest investment, 1001 Pennsylvania Avenue located in Washington, DC, represented 5.8% of total real estate investments and 4.4% of total investments. As discussed in the Account’s
prospectus, the Account does not intend to buy and sell its real estate investments simply to make short-term profits, although proceeds from sales of real estate investments do play a role in the Account’s cash management generally. Rather, the Account’s general strategy in selling real estate investments is to
dispose of those assets that management believes: (i) have either maximized in value, (ii) have underperformed or face deteriorating property-specific or market conditions, (iii) need significant capital infusions in the future, (iv) are appropriate to dispose of in order to remain consistent with its intent to diversify
the Account by property type and geographic location, including to reallocate the Account’s exposure to or away from certain property types in certain geographic locations; and/or (v) otherwise do not satisfy the investment objectives or strategy of the Account. The Account will reinvest any sale proceeds that
management doesn’t believe it will need to pay operating expenses, fund other obligations (such as debt obligations and funding 46
commitments under limited partnership agreements) or to meet redemption requests (e.g., cash withdrawals or transfers). The following charts reflect the diversification of the Account’s real estate assets by region and property type and list its ten largest investments. All information is based on the fair values of the investments at September 30, 2011. Diversification by Fair Value(1)
East
West
South
Midwest
Foreign(2)
Total Office
22.7
%
15.8
%
9.3
%
0.4
%
2.3
%
50.5
% Apartment
6.8
%
5.6
%
4.9
%
0.0
%
0.0
%
17.3
% Industrial
1.3
%
6.7
%
4.4
%
1.2
%
0.0
%
13.6
% Retail
2.9
%
2.8
%
7.6
%
0.1
%
1.9
%
15.3
% Other(3)
3.0
%
0.2
%
0.1
%
0.0
%
0.0
%
3.3
% Total
36.7
%
31.1
%
26.3
%
1.7
%
4.2
%
100.0
%
(1)
Wholly-owned properties are represented at fair value and gross of any debt, while joint venture properties are represented at the net equity value. (2) Represents real estate investments in the United Kingdom and France. (3) Represents interest in Storage Portfolio investment and fee interest encumbered by a ground lease real estate investment. Properties in the “East” region are located in: CT, DC, DE, KY, MA, MD, ME, NC, NH, NJ, NY, PA, RI, SC, VA, VT, WV Properties in the “West” region are located in: AK, AZ, CA, CO, HI, ID, MT, NM, NV, OR, UT, WA, WY Properties in the “South” region are located in: AL, AR, FL, GA, LA, MS, OK, TN, TX Properties in the “Midwest” region are located in: IA, IL, IN, KS, MI, MN, MO, ND, NE, OH, SD, WI Top Ten Largest Real Estate Investments
Property Investment Name
City
State
Type
Value ($M)(a)
Property as a
Property as a
1001 Pennsylvania Avenue
Washington
DC
Office
655.2
(b)
5.75
4.40
Four Oaks Place
Houston
TX
Office
416.4
3.66
2.80
Fourth and Madison
Seattle
WA
Office
379.1
(c)
3.33
2.55
780 Third Avenue
New York City
NY
Office
336.1
2.95
2.26
DDR Joint Venture
Various
USA
Retail
331.7
(d)
2.91
2.23
99 High Street
Boston
MA
Office
329.5
(e)
2.89
2.21
50 Fremont
San Francisco
CA
Office
327.6
(f)
2.88
2.20
425 Park Avenue
New York
NY
Land
320.0
2.81
2.15
The Newbry
Boston
MA
Office
291.8
2.56
1.96
The Florida Mall
Orlando
FL
Retail
283.6
(g)
2.49
1.90
(a)
Value as reported in the September, 30, 2011 Statement of Investments. Investments owned 100% by the Account are reported based on fair value. Investments in joint ventures are reported at fair value and are presented at the Account’s ownership interest. (b) This property investment is presented gross of debt. The value of the Account’s interest less the fair value of leverage is $218.4M. (c) This property investment is presented gross of debt. The value of the Account’s interest less the fair value of leverage is $149.3M. (d) This property is held in a 85% / 15% joint venture with Developers Diversified Realty Corporation (“DDR”), and consists of 41 retail properties located in 13 states and is presented net of debt with a fair value of $999.5 million. (e) This property investment is presented gross of debt. The value of the Account’s interest less the fair value of leverage is $190.2M. (f) This property investment is presented gross of debt. The value of the Account’s interest less the fair value of leverage is $136.5M. (g) This property investment is a 50% / 50% joint venture with Simon Property Group, L.P., and is presented net of debt with a fair value of $186.0 million. As of September 30, 2011, the Account also held investments in real estate limited partnerships representing 2.0% of total investments, real estate-related marketable securities representing 5.5% of total investments, and U.S. Treasury securities and government agency notes representing 16.0% of total
investments. 47
% of Total
Real Estate
Portfolio
% of Total
Investments
Results of Operations Nine months ended September 30, 2011 compared to nine months ended September 30, 2010 Performance The Account’s total return was 10.2% for the nine months ended September 30, 2011 as compared to 7.2% for the nine months ended September 30, 2010. The Account’s performance during 2011 reflects an increase in the aggregate net asset value of the Account’s real estate property investments, including
investments owned in joint ventures and limited partnerships, income from property investments and marketable securities, and an increase in unrealized gains on investments. The
Account’s annualized total returns (after expenses) over the one, three,
five, and ten year periods ended September 30, 2011 were 16.4%, -7.8%,
-2.1%, and 3.8%, respectively. As of September 30, 2011, the Account’s
annualized total return since inception was 5.6%. The Account’s total net assets increased to $13.0 billion at September 30, 2011 from $9.6 billion at September 30, 2010. The primary driver of this 35.5% increase was net participant activity into the Account and the appreciation of the Account’s invested assets. Net Investment Income The table below shows the results of operations for the nine months ended September 30, 2011 and 2010 and the dollar and percentage changes for those periods (dollars in millions, unaudited).
For the Nine Months
Change
2011
2010
$
% INVESTMENT INCOME Real estate income, net: Rental income
$
657.9
$
652.0
$
5.9
0.9
% Real estate property level expenses and taxes: Operating expenses
164.8
163.4
1.4
0.9
% Real estate taxes
82.4
88.2
(5.8
)
-6.6
% Interest expense
81.2
79.8
1.4
1.8
% Total real estate property level expenses and taxes
328.4
331.4
(3.0
)
-0.9
% Real estate income, net
329.5
320.6
8.9
2.8
% Income from real estate joint ventures and limited partnerships
72.9
69.5
3.4
4.9
% Interest
2.8
2.1
0.7
33.3
% Dividends
12.6
1.1
11.5
N/M TOTAL INVESTMENT INCOME
417.8
393.3
24.5
6.2
% Expenses—Note 2: Investment advisory charges
39.4
36.5
2.9
7.9
% Administrative charges
21.8
15.1
6.7
44.4
% Distribution charges
6.3
4.2
2.1
50.0
% Mortality and expense risk charges
4.5
3.1
1.4
45.2
% Liquidity guarantee charges
16.8
9.3
7.5
80.6
% TOTAL EXPENSES
88.8
68.2
20.6
30.2
% INVESTMENT INCOME, NET
$
329.0
$
325.1
$
3.9
1.2
%
N/M
– Not Meaningful
Real estate rental income increased $5.9 million or 0.9% during the first nine months of 2011 as compared to the comparable period of 2010. The increase was directly related to the acquisitions discussed above offset by property dispositions during the first and third quarters. 48
Ended September 30,
Operating expenses increased during the first nine months of 2011 as compared to the comparable period of 2010 by $1.4 million, or 0.9%. The increase was driven by property acquisitions during the year offset by property dispositions. Real estate taxes decreased $5.8 million or 6.6% during the first nine months of 2011 as compared to the comparable period of 2010. The decrease in real estate taxes is a result of lower tax assessments at various properties and property dispositions offset by current property acquisitions. Interest expense increased $1.4 million, or 1.8% during the first nine months of 2011 as compared to the comparable period of 2010. The increase was attributable to mortgage loans payable having higher interest rates during the first nine months of 2011 as compared to the comparable period of 2010, as a
result of debt obligations added during the third quarter of 2010 having higher interest rates than the debt obligations repaid during the same quarter. Income from real estate joint ventures and limited partnerships increased $3.4 million or 4.9% during the first nine months of 2011 as compared to the comparable period of 2010. The increase was attributable to increased distributions from the joint ventures and limited partnerships as a result of increased
revenues. Dividend income was $12.6 million for the first nine months of 2011, an increase of $11.5 million from the comparable period of 2010. The increase in dividend income solely relates to the Account’s increased investment in real estate related securities held throughout the year, $813.0 million as of September
30, 2011 as compared to $274.7 million as of September 30, 2010. The Account’s expenses increased $20.6 million or 30.2% during the first nine months of 2011 as compared to the comparable period of 2010. The increase in Account level expenses was primarily due to the increase in the Account’s net assets as of September 30, 2011 as compared to September 30, 2010. The
Account’s net assets were $13.0 billion at September 30, 2011 as compared to $9.6 billion as of September 30, 2010, a 35.5% increase in net assets. Investment advisory, administrative and distribution charges are costs charged to the Account associated with managing the Account. These costs are primarily fixed, but
generally correspond to the level of assets under management. During the current year these fixed costs have risen at a slower pace than the Account’s net assets. Mortality and expense risk charges increased as a result of higher net assets; however, the overall basis point charge to the Account has remained at five
basis points of net assets. The increase in the liquidity guarantee charge was associated with the six basis point increase effective May 1, 2011. See Note 2—Management Agreements and Arrangements to the financial statements included herein for further discussion related to these expenses. Net Realized and Unrealized Gains and Losses on Investments and Mortgage Loans Payable The table below shows the net realized and unrealized gains and losses on investments and mortgage loans payable for the nine months ended September 30, 2011 and 2010 and the dollar and percentage changes for those periods (dollars in millions, unaudited). 49
For the Nine Months
Change
2011
2010
$
% NET REALIZED AND UNREALIZED GAIN (LOSS) Net realized gain (loss) on investments: Real estate properties
$
(71.4
)
$
(1.2
)
$
(70.2
)
N/M Real estate joint ventures and limited partnerships
(10.6
)
(156.7
)
146.1
-93.2
% Marketable securities
5.0
—
5.0
N/M Net realized loss on investments
(77.0
)
(157.9
)
80.9
-51.2
% Net change in unrealized appreciation (depreciation) on: Real estate properties
775.4
273.0
502.4
184.0
% Real estate joint ventures and limited partnerships
236.5
218.2
18.3
8.4
% Marketable securities
(92.0
)
(2.2
)
(89.8
)
N/M Mortgage loans receivable
—
3.7
(3.7
)
-100.0
% Mortgage loans payable
(6.9
)
(42.1
)
35.2
-83.6
% Net change in unrealized appreciation on investments
913.0
450.6
462.4
102.6
% NET REALIZED AND UNREALIZED GAIN ON INVESTMENTS AND MORTGAGE LOANS PAYABLE
$
836.0
$
292.7
$
543.3
185.6
%
N/M
– Not Meaningful
Real estate properties: During the first nine months of 2011, the Account experienced net realized and unrealized gains on investments and mortgage loans payable of $836.0 million compared to net realized and unrealized gain of $292.7 million for the comparable period of 2010. Net realized losses in the Account are due to the sale of real estate property and joint venture investments. See the Recent Transactions section herein for additional discussions regarding the sale of real estate property underlying the Account’s investments in joint ventures. Net unrealized gains in the Account are attributed to improved market conditions resulting in capitalization rate declines, higher market rents, and generally better occupancy levels. Additionally, the Account experienced foreign exchange gains of $4.8 million from its two international properties during the
first nine months of 2011 as compared to losses of $18.7 million for the comparable period of 2010. Real estate joint ventures and limited partnerships: Real estate joint ventures and limited partnerships experienced net realized and unrealized gains of $225.9 million for the first nine months of 2011 compared to net realized and unrealized gains of $61.5 million for the comparable period of 2010. Net realized losses in the Account are due to the sale of real estate property underlying the Account’s investments in joint ventures. See the Recent Transactions section herein for additional disclosure regarding the sale of real estate property. Net unrealized gains on joint ventures and limited partnerships were due to increases in value of the existing real estate assets underlying the investments due to improved market conditions resulting in capitalization rate declines, higher market rents, and generally better occupancy levels. Marketable securities: The Account’s marketable securities position was $3.2 billion, which was comprised of $813.0 million of real estate related marketable securities and $2.4 billion of other short term marketable securities, comprised of U. S. Treasury securities and government agency notes. The Account experienced net realized
and 50
Ended September 30,
ON INVESTMENTS AND MORTGAGE LOANS
PAYABLE
and mortgage loans payable
unrealized losses of $87.0 million from marketable securities as a result of decreases in the value of its real estate related marketable securities as a result of overall equity market volatility experienced during the nine month period ended September 30, 2011. Mortgage loans receivable: During the year ended December 31, 2010 the Account settled in full its mortgage loan receivable investment at its face value. Mortgage loans payable: Mortgage loans payable experienced unrealized losses of $6.9 million during the first nine months of 2011 compared to unrealized losses of $42.1 million during the comparable period of 2010. Valuation adjustments to mortgage loans payable are highly dependent upon interest rates, investment return
demands, the performance of the underlying real estate investment, and where applicable, foreign exchange rates. Of the $6.9 million unrealized loss $7.9 million was related to valuation decreases offset by $1.0 million from foreign exchange adjustments as a result of a weakening U.S. dollar. Three months ended September 30, 2011 compared to three months ended September 30, 2010 Performance The Account’s total return was 2.3% for the third quarter of September 30, 2011 as compared to 4.7% for the comparable period of 2010. The Account’s performance during 2011 reflects an increase in the aggregate net asset value of the Account’s real estate property investments, including investments owned
in joint ventures and limited partnerships, income from property investments and marketable securities, and an increase in unrealized gains on investments. 51
Net Investment Income The table below shows the results of operations for the third quarter ended September 30, 2011 and 2010 and the dollar and percentage changes for those periods (dollars in millions, unaudited).
For the Three Months
Change
2011
2010
$
% INVESTMENT INCOME Real estate income, net: Rental income
$
223.9
$
222.6
$
1.3
0.6
% Real estate property level expenses and taxes: Operating expenses
53.0
56.4
(3.4
)
-6.0
% Real estate taxes
27.9
28.4
(0.5
)
-1.8
% Interest expense
27.4
30.4
(3.0
)
-9.9
% Total real estate property level expenses and taxes
108.3
115.2
(6.9
)
-6.0
% Real estate income, net
115.6
107.4
8.2
7.6
% Income from real estate joint ventures and limited partnerships
19.8
28.1
(8.3
)
-29.5
% Interest
0.7
1.0
(0.3
)
-30.0
% Dividends
5.8
1.1
4.7
N/M TOTAL INVESTMENT INCOME
141.9
137.6
4.3
3.1
% Expenses—Note 2: Investment advisory charges
13.2
13.6
(0.4
)
-2.9
% Administrative charges
7.5
5.4
2.1
38.9
% Distribution charges
2.3
1.5
0.8
53.3
% Mortality and expense risk charges
1.6
1.1
0.5
45.5
% Liquidity guarantee charges
6.8
3.4
3.4
100.0
% TOTAL EXPENSES
31.4
25.0
6.4
25.6
% INVESTMENT INCOME, NET
$
110.5
$
112.6
$
(2.1
)
-1.9
%
N/M
– Not Meaningful
Real estate rental income increased $1.3 million or 0.6% during the third quarter of 2011 as compared to the comparable period of 2010. The increase was primarily a result of the property acquisitions during the second quarter of 2011, offset by property dispositions. Operating expenses decreased during the third quarter of 2011 as compared to the comparable period of 2010 by $3.4 million or 6.0%. The decrease in operating expenses is directly related to property dispositions during the quarter and during 2010, offset by increases in operating expenses related to property
acquisitions during the quarter. Real estate taxes decreased $0.5 million or 1.8% during the third quarter of 2011 as compared to the comparable period of 2010. The decrease in real estate taxes is a result of lower tax assessments at various properties and property dispositions offset by current property acquisitions. Interest expense decreased $3.0 million or 9.9% during the third quarter of 2011 as compared to the comparable period of 2010. The decrease from the comparable quarter of 2010 was related to the write off of deferred financing costs associated with the extinguishment of debt during the third quarter of 2010. Income from real estate joint ventures and limited partnerships decreased $8.3 million or 29.5% during the third quarter of 2011 as compared to the comparable period of 2010. The decrease was attributable to decreased distributions from the joint ventures during the quarter as compared to the third of 2010. Dividend income was $5.8 million for the third quarter of 2011, an increase of $4.7 million from the comparable period of 2010. The increase in dividend income solely relates to the Account’s increased investment in real estate related securities held throughout the quarter, $813.0 million as of September 30,
2011 as compared to $274.7 million as of September 30, 2010. 52
Ended September 30,
The Account’s expenses increased $6.4 million or 25.6% during the third quarter of 2011 as compared to the comparable period of 2010. The increase in Account level expenses was due to the increase in the Account’s net assets as of September 30, 2011 as compared to September 30, 2010. The Account’s net
assets were $13.0 billion at September 30, 2011 as compared to $9.6 billion at September 30, 2010, a 35.5% increase in net assets. Investment advisory, administrative and distribution charges are costs charged to the Account, associated with managing the Account. These costs are primarily fixed, but generally
correspond to the level of assets under management. During the current year these fixed costs have risen at a slower pace than the Account’s net assets. Mortality and expense risk charges increases as a result of higher net assets, however the overall basis point charge to the Account has remained at five basis
points of net assets. The increase in the liquidity guarantee charge was associated with the six basis point increase effective May 1, 2011. See Note 2—Management Agreements and Arrangements to the financial statements included herein for further discussion related to these expenses. Net Realized and Unrealized Gains and Losses on Investments and Mortgage Loans Payable The table below shows the net realized and unrealized gains and losses on investments and mortgage loans payable for the third quarter of September 30, 2011 and 2010 and the dollar and percentage changes for those periods (dollars in millions, unaudited).
For the Three Months
Change
2011
2010
$
% NET REALIZED AND UNREALIZED GAIN (LOSS) ON INVESTMENTS AND MORTGAGE LOANS PAYABLE Net realized gain (loss) on investments: Real estate properties
$
(62.1
)
$
0.1
$
(62.2
)
N/M Real estate joint ventures and limited partnerships
(2.1
)
(3.5
)
1.4
-40.0
% Marketable securities
1.3
—
1.3
N/M Net realized loss on investments
(62.9
)
(3.4
)
(59.5
)
1750.0
% Net change in unrealized appreciation (depreciation) on: Real estate properties
309.0
249.8
59.2
23.7
% Real estate joint ventures and limited partnerships
83.6
62.2
21.4
34.4
% Marketable securities
(142.4
)
(2.3
)
(140.1
)
N/M Mortgage loans receivable
—
2.3
(2.3
)
-100.0
% Mortgage loans payable
(6.4
)
(7.8
)
1.4
-17.9
% Net change in unrealized appreciation on investments
243.8
304.2
(60.4
)
-19.9
% NET REALIZED AND UNREALIZED GAIN ON INVESTMENTS AND MORTGAGE LOANS PAYABLE
$
180.9
$
300.8
$
(119.9
)
-39.9
%
N/M
– Not Meaningful
Real estate properties: During the third quarter of 2011, the Account experienced net realized and unrealized gains on investments and mortgage loans payable of $180.9 million compared to net realized and unrealized gains of $300.8 million for the comparable period of 2010. Net realized losses in the Account are due to the sale of real estate property investments. See the Recent Transactions section herein for additional discussions regarding the sale of real estate property underlying the Account’s investments in joint ventures. Net unrealized gains in the Account are attributed to improved market conditions resulting in capitalization rate declines, higher market rents, and generally better occupancy levels. Also, the Account experienced foreign exchange losses of $25.4 million from its two international properties during the third
quarter of 2011 as compared to losses of $24.9 million for the comparable period of 2010. 53
Ended September 30,
and mortgage loans payable
Real estate joint ventures and limited partnerships: Real estate joint ventures and limited partnerships experienced net realized and unrealized gains of $81.5 million for the third quarter of 2011 compared to net realized and unrealized gains of $58.7 million for the comparable period of 2010. Net realized losses in the Account are due to the sale of real estate property underlying the Account’s investments in joint ventures. See the Recent Transactions section herein for additional disclosure regarding the sale of real estate property. Net unrealized gains on joint ventures and limited partnerships were due to increases in value of the existing real estate assets underlying the investments due to improved market conditions resulting in capitalization rate declines, higher market rents, and generally better occupancy levels. Marketable securities: The Account’s marketable securities position was $3.2 billion, which was comprised of $813.0 million of real estate related marketable securities and $2.4 billion of other short term marketable securities, comprised of U. S. Treasury securities and government agency notes. The Account experienced net realized
and unrealized losses of $141.1 million from marketable securities as a result of decreases in the value of its real estate related marketable securities as a result of overall equity market volatility experienced during the current quarter. Mortgage loans receivable: During the year ended December 31, 2010 the Account settled in full its mortgage loan receivable investment at its face value. Mortgage loans payable: Mortgage loans payable experienced unrealized losses of $6.4 million during the third quarter of 2011 compared to unrealized losses of $7.8 million during the comparable period of 2010. Valuation adjustments to mortgage loans payable are highly dependent upon interest rates, investment return demands, the
performance of the underlying real estate investment, and where applicable, foreign exchange rates. Of the $6.4 million unrealized loss, $12.8 million was related to valuation increases and $6.4 million from foreign exchange adjustments as a result of a strengthening U.S. dollar. Liquidity and Capital Resources As of September 30, 2011 and December 31, 2010, the Account’s cash, cash equivalents and non-real estate-related marketable securities had a value of $2.4 billion (18.4% and 22.3% of the Account’s net assets at such dates, respectively). When compared to December 31, 2010, the Account’s non-real estate-
related liquid assets have decreased $21.9 million. This decrease is primarily the result of decreased net participant activity into the Account (in particular, net participant transfers into the Account) in the third quarter of 2011. Participant Activity Third Quarter 2011 Compared to Second Quarter 2011 During the third quarter of 2011, the Account received $497.3 million in premiums as compared to $559.8 million received during the second quarter of 2011. Premiums received included $314.8 million of participant transfers as compared to $369.4 million during the second quarter of 2011. The Account had
participant outflows of $438.4 million during the third quarter of 2011 as compared to $209.9 million during the second quarter of 2011, the vast majority of which was comprised of withdrawals and death benefits, which included $317.9 million of participant transfers out of the Account. 54
First Nine Months of 2011 Compared to First Nine Months of 2010 During the first nine months of 2011, the Account received $1.9 billion in premiums, which included $1.3 billion of participant transfers into the Account. The Account had outflows of $871.3 million in annuity payments, withdrawals and death benefits, which included $542.9 million of participant transfers out
of the Account. During the first nine months of 2010, the Account received $1.7 billion in premiums, which included $1.2 billion of participant transfers into the Account. The Account had outflows of $645.6 million in annuity payments, withdrawals and death benefits, which included $413.2 million of participant
transfers out of the Account. See Note 1—Organization and Significant Accounting Policies of the consolidated financial statements as included herein. Management believes that the reduction in transfers into the Account is primarily related to the transfer limitation on the Account which was effective March 31, 2011, as discussed in more detail in the paragraph below. Effective March 31, 2011 (or such later date as indicated in the contract or contract endorsement) individual participants will be limited from making “internal funding vehicle transfers” into their Account accumulation if, after giving effect to such transfer, the total value of such participant’s Account
accumulation (under all contracts issued to such participant) would exceed $150,000. This limitation is subject to certain exceptions and currently impacts those participants with contracts issued in a jurisdiction that has approved the limitation. Management believes that, compared to periods prior to the transfer
limitation being in effect, participant transfer inflow activity will continue to be tempered following the effective date of this limitation as jurisdictions approve such limitation. Liquidity Guarantee Primarily as a result of significant net participant transfers out of the Account during late 2008 and early 2009, pursuant to TIAA’s existing liquidity guarantee obligation, the TIAA general account purchased approximately $1.2 billion of liquidity units issued by the Account in a number of separate transactions
between December 24, 2008 and June 1, 2009. During the period June 2, 2009 through September 30, 2011, the TIAA general account did not purchase or redeem any additional liquidity units. As disclosed under “Establishing and Managing the Account—the Role of TIAA—Liquidity Guarantee” in the Account’s
prospectus, in accordance with this liquidity guarantee obligation, TIAA guarantees that all participants in the Account may redeem their accumulation units at their accumulation unit value next determined after their transfer or cash withdrawal request is received in good order. Net participant transfers out of the Account significantly slowed following the first quarter of 2009, and net participant transfer activity turned to inflows in early 2010, which has continued through the date of this report. As a result, while management cannot predict whether any future TIAA liquidity unit
purchases will be required under this liquidity guarantee, it is unlikely that additional purchases will be required in the near term. However, management cannot predict for how long net inflows will continue to occur. If net outflows were to occur (even if not at the same intensity as in 2008 and early 2009), it could
have a negative impact on the Account’s operations and returns and could require TIAA to purchase additional liquidity units, perhaps to a significant degree, as was the case in late 2008 and early 2009. TIAA’s obligation to provide Account participants liquidity through purchases of liquidity units is not subject to an express regulatory or contractual limitation, although as described in the paragraph below, the independent fiduciary may (but is not obligated to) require the reduction of TIAA’s interest
through sales of assets from the Account if TIAA’s interest exceeds the trigger point. Even if the independent fiduciary so requires, TIAA’s obligation to provide liquidity under the guarantee, which is required by the New York State Insurance Department, will continue. Management believes that TIAA has the
ability to meet its obligations under this liquidity guarantee. Whenever TIAA owns liquidity units, the duties of the Account’s independent fiduciary, as part of its monitoring of the Account, include reviewing the purchase and redemption of liquidity units by TIAA to ensure the Account uses the correct accumulation unit values. In addition, the independent fiduciary’s
responsibilities include:
establishing the percentage of total accumulation units that TIAA’s ownership should not exceed (the “trigger point”) and creating a method for reviewing the trigger point;
55
•
• approving any adjustment of TIAA’s ownership interest in the Account and, in its discretion, requiring an adjustment if TIAA’s ownership of liquidity units reaches the trigger point; and • once the trigger point has been reached, participating in any program to reduce TIAA’s ownership in the Account by utilizing cash flow or liquid investments in the Account, or by utilizing the proceeds from asset sales. If the independent fiduciary were to determine that TIAA’s ownership should be reduced
following the trigger point, its role in participating in any asset sales program would include (i) participating in the selection of properties for sale, (ii) providing sales guidelines and (iii) approving those sales if, in the independent fiduciary’s opinion, such sales are desirable to reduce TIAA’s ownership of
liquidity units. As of the date of this Form 10-Q, the independent fiduciary, which has the right to adjust the trigger point, has established the trigger point at 45% of the outstanding accumulation units and it will continue to monitor TIAA’s ownership interest in the Account and provide further recommendations as
necessary. As of September 30, 2011, TIAA owned approximately 9.0% of the outstanding accumulation units of the Account. In establishing the appropriate trigger point, including whether or not to require certain actions once the trigger point has been reached, the independent fiduciary will assess, among other
things and to the extent consistent with the Prohibited Transaction Exemption (PTE 96-76) issued by the U.S. Department of Labor in 1996 with respect to the liquidity guarantee and the independent fiduciary’s duties under ERISA, the risk that a conflict of interest could arise due to the level of TIAA’s ownership
interest in the Account. The independent fiduciary is vested with oversight and approval over any redemption of TIAA’s liquidity units, acting in the best interests of Real Estate Account participants. The independent fiduciary has indicated to management its intention to initiate systematic redemptions of the liquidity units held by
the TIAA General Account at such times as it deems appropriate. The independent fiduciary currently intends to cause such redemptions only (i) if recent historical net participant activity has been positive and (ii) if the Account is projected to hold at least 22% of its net assets in cash, cash equivalents and publicly
traded liquid non-real estate related securities, after taking into account certain projected sources and uses of cash flow into the Account. In addition, the independent fiduciary’s intention is that redemptions over any given period would not exceed recent historical net participant activity. As of September 30, 2011
no liquidity units were required to be redeemed by the Account, which as of September 30, 2011 held 18.4% of its net assets in liquid non-real estate-related investments (along with its cash and cash equivalents). In administering redemptions, the independent fiduciary has indicated to management that it intends to evaluate, among other things (i) projected acquisitions and dispositions of real estate and real estate related investments, (ii) participant inflow and outflow trends, (iii) the Account’s net income and (iv)
obligations to make debt service payments and pay principal balances of mortgages on Account properties. The independent fiduciary is vested with oversight and approval over any redemption of liquidity units owned by TIAA, acting in the best interests of Real Estate Account participants. The independent fiduciary may authorize or direct the redemption of all or a portion of liquidity units at any time and TIAA will request the approval of the independent fiduciary before any liquidity units are redeemed. There is no guarantee that the independent fiduciary will cause redemptions in the near
term and even if redemptions do commence, management cannot predict the time period over which such redemptions would continue. Further, neither management nor the independent fiduciary can predict when TIAA’s liquidity units may be redeemed in full. Upon termination and liquidation of the Account (wind-up), any liquidity units held by TIAA will be the last units redeemed, unless the independent fiduciary directs otherwise. The Account pays TIAA for the risk associated with providing the liquidity guarantee through a daily deduction from the Account’s
net assets. The Account’s net investment income continues to be an additional source of liquidity for the Account. Net investment income increased to $329.0 million for the nine months ended September 30, 2011 from $325.1 million for the comparable period of 2010. Total investment income increased as a result of
increased income from joint ventures and limited partnerships, interest income, and dividend income, offset by higher Account expenses as a result of higher average net assets over the period. As of September 30, 2011, cash and cash equivalents, along with real estate-related and non real estate-related marketable securities comprised 24.7% of the Account’s net assets. The Account’s liquid assets 56
continue to be available to purchase additional suitable real estate properties, meet the Account’s debt obligations, expense needs, and participant redemption requests (i.e., cash withdrawals, benefit payments, or transfers). As of September 30, 2011, $765.3 million in principal amount of debt obligations will mature through September 30, 2012, all of which is related to the Account’s share of debt associated with its investments in joint ventures. An aggregate of $634.6 million in principal amount of debt obligations (which
represents the Account’s share) secured by a total of 30 properties in the Account’s DDR Joint Venture investment matures in February 2012 and March 2012. In particular, 17 properties and a $15.0 million letter of credit within the DDR Joint Venture investment secure $471.8 million in principal amount of debt
obligations (which represents the Account’s share) maturing in March 2012 and effectively, as of September 30, 2011, the Account’s net investment value in these properties was zero. Management is evaluating the full range of options available to the Account in its capacity as an investor in these joint
ventures. Management believes that the Account and the joint venture entities in which the Account invests will have the ability to address these non-recourse obligations in a number of ways, including among others, repaying the principal due at maturity, refinancing such debt, restructuring such debt, and/or
electing to default on the loans secured by such properties if the joint ventures were unable to reach a satisfactory resolution with respect to such obligations. Leverage The Account may borrow money and assume or obtain a mortgage on a property (i.e., to make leveraged real estate investments). Also, to meet any short-term cash needs, the Account may obtain a line of credit that may be unsecured and/or contain terms that may require the Account to secure the loan with
one or more of its properties. The Account is authorized to borrow money in accordance with its investment guidelines. Under the Account’s current investment guidelines, the Account’s loan to value ratio (as defined below) is to be maintained at or below 30%. However, until December 31, 2011, the Account is authorized to incur and/or
maintain indebtedness on its properties in an aggregate principal amount not to exceed the aggregate principal amount of debt outstanding as of the date of adoption of such guidelines in July 2009 (approximately $4.0 billion). Such incurrences of debt from time to time may include:
placing new debt on properties; • refinancing outstanding debt; • assuming debt on acquired properties or interests in the Account’s properties; and/or • extending the maturity date of outstanding debt. In calculating this limit, only the Account’s actual percentage interest in any borrowings is included, and not that percentage interest held by any joint venture partner. Further, the Account may only borrow up to 70% of the then-current value of a property, although construction loans may be for 100% of the
costs incurred in developing a property. As of September 30, 2011 the Account did not have any construction loans. Also, at the time the Account (or a joint venture in which the Account is a partner) enters into a revolving line of credit, management deems the maximum amount which may be drawn under that
line of credit as fully incurred, regardless of whether the maximum amount available has been drawn from time to time. As of September 30, 2011, management has reduced the Account’s ratio of outstanding principal amount of debt to total gross asset value (i.e., a “loan to value ratio”) to less than 30% and intends to maintain its loan to value ratio at or below 30% (this ratio is measured at the time of incurrence and after
giving effect thereto). The Account’s total gross asset value, for these purposes, is equal to the total fair value of the Account’s assets (including the fair value of the Account’s interest in joint ventures), with no reduction associated with any indebtedness on such assets. In times of high net inflow activity, in particular during times of high net participant transfer inflows, management may determine to apply a portion of such cash flows to make prepayments of indebtedness prior to scheduled maturity, which would have the effect of reducing the Account’s loan to value ratio. As of September 30, 2011, the Account’s loan to value ratio was 21.3%. 57
•
Recent Transactions The following describes property transactions by the Account during the third quarter of 2011. Except as noted, the expenses for operating the properties purchased are either borne or reimbursed, in whole or in part, by the property tenants, although the terms vary under each lease. The Account is responsible for
operating expenses not reimbursed under the terms of a lease. All rental rates are quoted on an annual basis unless otherwise noted. Purchases Weston Business Center—Weston, FL On August 26, 2011, the Account purchased an industrial property located in Weston, Florida, for $84.8 million. The Weston Business Center (the “Property”) is a 679,918 square foot (“SF”) industrial park built in 1998 and 1999 comprised of four Class A warehouse distribution buildings on 10.4 acres in
Weston, Florida. The four buildings represent 63% of the entire park, which consists of six buildings and 1,076,000 square feet. The buildings are 100% leased to six tenants. The three largest tenants are Anda, Inc. (152,176 SF), American Express (224,650 SF) and Office Depot (230,670 SF). Rental rates average
$7.21 per SF. The Forum at Carlsbad—Carlsbad, CA On September 9, 2011, the Account purchased a retail property located in Carlsbad, Florida, for $183.3 million. The property is a premier grocery anchored lifestyle center in San Diego’s northwest county. Constructed in 2003 and located along El Camino Real in Carlsbad, CA, the property consists of 264,619
square feet of institutional quality retail space, divided among eight separate buildings, that were 99.1% leased at time of purchase to a variety of local and national retailers including: H&M (19,479 SF), Urban Outfitters (12,659 SF), Jimbo’s (18,000 SF), and Bed, Bath & Beyond (28,000 SF). Sales Oak Brook Regency Towers—Oak Brook, IL On July 6, 2011, the Account sold an apartment building located in Oak Brook, Illinois for a net sale price of $69.4 million and realized a loss from sale of $20.3 million, the majority of which had been previously recognized as an unrealized loss in the Account’s consolidated statements of operations. The
Account’s cost basis (excluding selling costs) in the property as of the date of sale was $89.7 million according to the records of the Account. Morris Corporate Center III—Parsippany, NJ On July 7, 2011, the Account sold an office building located in Parsippany, New Jersey for a net sale price of $107.3 million and realized a loss from sale of $36.0 million, the majority of which had been previously recognized as an unrealized loss in the Account’s consolidated statements of operations. The
Account’s cost basis (excluding selling costs) in the property as of the date of sale was $143.3 million according to the records of the Account. Storage Portfolio I, LLC—Various On July 14, 2011, self storage warehouses located in Kansas City, KS, and Raytown, MS were sold by the Account’s Storage Portfolio I, LLC Joint Venture (the “Storage Portfolio”). The Account holds a 75.0% interest in the Storage Portfolio. The Account’s portion of the net sales price was $2.2 million. The
Account realized a loss from the sale of $1.9 million, the majority of which had been previously recognized as an unrealized loss in the Account’s consolidated statements of operations. The Account’s portion of its cost basis (excluding selling costs) in the property at the date of the sale was $4.1 million according to
the records of the Account. Champlin Marketplace—Champlin, MN On September 21, 2011, the Account sold a retail building located in Champlin, Minnesota for a net sale price of $12.7 million and realized a loss from sale of $5.8 million, the majority of which had been previously recognized as an unrealized loss in the Account’s consolidated statements of operations. The
Account’s cost basis (excluding selling costs) in the property as of the date of sale was $18.5 million according to the records of the Account. 58
Financings NA Critical Accounting Policies The consolidated financial statements of the Account are prepared in conformity with accounting principles generally accepted in the United States of America. In preparing the Account’s financial statements, management is required to make estimates and judgments that affect the reported amounts of assets, liabilities, revenues, and expenses. Management bases its estimates on historical experience and assumptions that are believed to be reasonable under the
circumstances, the results of which form the basis for making judgments about the carrying value of assets and liabilities that are not readily apparent from other sources. Actual results may differ from these estimates. Determination of Investments at Fair Value: The Account reports all investments at fair value in accordance with FASB ASC 946, Financial Services—Investment Companies. With the adoption of the fair value option allowed under ASC 825, Financial Instruments, and at the election of Account management,
mortgage loans payable are reported at fair value. The FASB has defined fair value as the price that would be received to sell an asset or paid to transfer a liability in an orderly transaction between market participants. The following is a description of the valuation methodologies used to determine the fair value of the Account’s investments and investment related mortgage loans payable. Valuation of Real Estate Properties—Investments in real estate properties are stated at fair value, as determined in accordance with policies and procedures reviewed by the Investment Committee of the Board and in accordance with the responsibilities of the Board as a whole. Accordingly, the Account does not
record depreciation. Determination of fair value involves judgment because the actual fair value of real estate can be determined only by negotiation between the parties in a sales transaction. The Account’s primary objective when valuing its real estate investments will be to produce a valuation that represents a
reasonable estimate of the fair value of its investments. Implicit in the Account’s definition of fair value are the consummation of a sale as of a specified date and the passing of title from seller to buyer under conditions whereby:
•
Buyer and seller are typically motivated; • Both parties are well informed or well advised, and acting in what they consider their best interests; • A reasonable time is allowed for exposure in the open market; • Payment is made in terms of cash or in terms of financial arrangements comparable thereto; and • The price represents the normal consideration for the property sold unaffected by special or creative financing or sales concessions granted by anyone associated with the sale. Property and investment values are affected by, among other things, the availability of capital, occupancy rates, rental rates, and interest and inflation rates. As a result, determining real estate and investment values involves many assumptions. Key inputs and assumptions include rental income and expense
amounts, related rental income and expense growth rates, discount rates and capitalization rates. Valuation techniques include discounted cash flow analysis, prevailing market capitalization rates or multiples applied to earnings from the property, analysis of recent comparable sales transactions, actual sale
negotiations and bona fide purchase offers received from third parties. Amounts ultimately realized from each investment may vary significantly from the fair value presented. Real estate properties owned by the Account are initially valued based on an independent third party appraisal, as reviewed by TIAA’s internal appraisal staff and as applicable the Account’s independent fiduciary at the time of the closing of the purchase, which may result in a potential unrealized gain or loss
reflecting the difference between an investment’s fair value (i.e., exit price) and its cost basis (which is inclusive of transaction costs). 59
Subsequently, each property is appraised each quarter by an independent third party appraiser, reviewed by TIAA’s internal appraisal staff and as applicable the Account’s independent fiduciary. In general, the Account obtains appraisals of its real estate properties spread out throughout the quarter, which is
intended to result in appraisal adjustments, and thus, adjustments to the valuations of its holdings (to the extent such adjustments are made) that happen regularly throughout each quarter and not on one specific day or month in each period. Further, management reserves the right to order an appraisal and/or conduct another valuation outside of the normal quarterly process when facts or circumstances at a specific property change. For example, under certain circumstances a valuation adjustment could be made when the account receives a bona
fide bid for the sale of a property held within the Account or one of the Account’s joint ventures. In addition, adjustments may be made for events or circumstances indicating an impairment of a tenant’s ability to pay amounts due to the Account under a lease (including due to a bankruptcy filing of that tenant).
Alternatively, adjustments may be made to reflect the execution or renewal of a significant lease. Also, adjustments may be made to reflect factors (such as sales values for comparable properties or local employment rate) bearing uniquely on a particular region in which the Account holds properties. TIAA’s
internal appraisal staff oversees the entire appraisal process, in conjunction with the Account’s independent fiduciary (the independent fiduciary is more fully described in the paragraph below). Any differences in the conclusions of TIAA’s internal appraisal staff and the independent appraiser will be reviewed by
the independent fiduciary, which will make a final determination on the matter (which may include ordering a subsequent independent appraisal). The independent fiduciary, Real Estate Research Corporation, has been appointed by a special subcommittee of the Investment Committee of the Board to, among other things, oversee the appraisal process. The independent fiduciary must approve all independent appraisers used by the Account. All
appraisals are performed in accordance with Uniform Standards of Professional Appraisal Practices, the real estate appraisal industry standards created by The Appraisal Foundation. Real estate appraisals are estimates of property values based on a professional’s opinion. Appraisals of properties held outside of the
U.S. are performed in accordance with industry standards commonly applied in the applicable jurisdiction. These independent appraisers are always expected to be MAI-designated members of the Appraisal Institute (or its European equivalent, Royal Institute of Chartered Surveyors) and state certified appraisers
from national or regional firms with relevant property type experience and market knowledge. Under the Account’s current procedures, each independent appraisal firm will be rotated off of a particular property at least every three years, although such appraisal firm may perform appraisals of other Account
properties subsequent to such rotation. Also, the independent fiduciary can require additional appraisals if factors or events have occurred that could materially change a property’s value (including those identified above) and such change is not reflected in the quarterly valuation review, or otherwise to ensure that the Account is valued
appropriately. The independent fiduciary must also approve any valuation change of real estate-related assets where a property’s value changed by more than 6% from the most recent independent annual appraisal, or if the value of the Account would change by more than 4% within any calendar quarter or more
than 2% since the prior calendar month. When a real estate property is subject to a mortgage, the property is valued independently of the mortgage and the property and mortgage fair values are reported separately (see “Valuation of Mortgage Loans Payable” below). The independent fiduciary reviews and
approves all mortgage valuation adjustments before such adjustments are recorded by the Account. The Account continues to use the revised value for each real estate property and mortgage loan payable to calculate the Account’s daily net asset value until the next valuation review or appraisal. Valuation of Real Estate Joint Ventures—Real estate joint ventures are stated at the fair value of the Account’s ownership interests of the underlying entities. The Account’s ownership interests are valued based on the fair value of the underlying real estate, any related mortgage loans payable, and other factors,
such as ownership percentage, ownership rights, buy/sell agreements, distribution provisions and capital call obligations. Upon the disposition of all real estate investments by an investee entity, the Account will continue to state its equity in the remaining net assets of the investee entity during the wind down period,
if any, which occurs prior to the dissolution of the investee entity. Valuation of Real Estate Limited Partnerships—Limited partnership interests are stated at the fair value of the Account’s ownership in the partnership which is based on the most recent net asset value of the 60
partnership, as reported by the sponsor. Since market quotations are not readily available, the limited partnership interests are valued at fair value as determined in good faith under the direction of the Investment Committee of the Board and in accordance with the responsibilities of the Board as a whole. Valuation of Marketable Securities—Equity securities listed or traded on any national market or exchange are valued at the last sale price as of the close of the principal securities market or exchange on which such securities are traded or, if there is no sale, at the mean of the last bid and asked prices on such
market or exchange, exclusive of transaction costs. Debt securities, other than money market instruments, are generally valued at the most recent bid price or the equivalent quoted yield for such securities (or those of comparable maturity, quality and type). Money market instruments, with maturities of one year or less, are valued in the same manner as debt
securities or derived from a pricing matrix. Equity and fixed income securities traded on a foreign exchange or in foreign markets are valued using their closing values under the valuation methods generally accepted in the country where traded, as of the valuation date. This value is converted to U.S. dollars at the exchange rate in effect on the valuation
day. Under certain circumstances (for example, if there are significant movements in the United States markets and there is an expectation the securities traded on foreign markets will adjust based on such movements when the foreign markets open the next day), the Account may adjust the value of equity or fixed
income securities that trade on a foreign exchange or market after the foreign exchange or market has closed. Valuation of Mortgage Loans Receivable—Mortgage loans receivable are stated at fair value and are initially valued at the face amount of the mortgage loan funding. Subsequently, mortgage loans receivable are valued at least quarterly based on market factors, such as market interest rates and spreads for
comparable loans, the liquidity for mortgage loans of similar characteristics, the performance of the underlying collateral and the credit quality of the counterparty. The Account’s mortgage loans receivable were repaid in full during the year ended December 31, 2010. Valuation of Mortgage Loans Payable—Mortgage loans payable are stated at fair value. The estimated fair value of mortgage loans payable are based on the amount at which the liability could be transferred to a third party exclusive of transaction costs. Mortgage loans payable are valued internally by TIAA’s
internal valuation department, as reviewed by the Account’s independent fiduciary, at least quarterly based on market factors, such as market interest rates and spreads for comparable loans, the performance of the underlying collateral (such as the loan-to-value ratio and the cash flow of the underlying collateral),
the liquidity for mortgage loans of similar characteristics, the maturity date of the loan, the return demands of the market, and the credit quality of the Account. Interest expense for mortgage loans payable is recorded on the accrual basis taking into account the outstanding principal and contractual interest rates. See Note 5—Assets and Liabilities Measured at Fair Value on a Recurring Basis to the consolidated financial statements included herein, for further discussion and disclosure regarding the determination of the Account’s investments fair values. Foreign currency transactions and translation: Portfolio investments and other assets and liabilities denominated in foreign currencies are translated into U.S. dollars at the exchange rates prevailing at the end of the period. Purchases and sales of securities, income receipts and expense payments made in foreign
currencies are translated into U.S. dollars at the exchange rates prevailing on the respective dates of the transactions. The effect of any changes in foreign currency exchange rates on portfolio investments and mortgage loans payable are included in net realized and unrealized gains and losses on real estate
properties and mortgage loans payable. Net realized gains and losses on foreign currency transactions include disposition of foreign currencies, and currency gains and losses between the accrual and receipt dates of portfolio investment income and between the trade and settlement dates of portfolio investment
transactions. Accumulation and Annuity Funds: The accumulation fund represents the net assets attributable to participants in the accumulation phase of their investment (“Accumulation Fund”). The annuity fund represents the net assets attributable to the participants currently receiving annuity payments (“Annuity
Fund”). The net increase or decrease in net assets from investment operations is apportioned between the accounts based upon their relative daily net asset values. Once an Account participant begins receiving lifetime annuity income benefits, payment levels cannot be reduced as a result of the Account’s actual
mortality experience. In addition, the contracts pursuant to which the Account is offered are required to 61
stipulate the maximum expense charge for all Account level expenses that can be assessed, which is not to exceed to 2.5% of average net assets per year. The Account pays a fee to TIAA to assume mortality and expense risks. Accounting for Investments: The investments held by the Account are accounted as follows: Real Estate Properties—Rent from real estate properties consists of all amounts earned under tenant operating leases, including base rent, recoveries of real estate taxes and other expenses and charges for miscellaneous services provided to tenants. Rental income is recognized in accordance with the billing terms
of the lease agreements. The Account bears the direct expenses of the real estate properties owned. These expenses include, but are not limited to, fees to local property management companies, property taxes, utilities, maintenance, repairs, insurance, and other operating and administrative costs. An estimate of
the net operating income earned from each real estate property is accrued by the Account on a daily basis and such estimates are adjusted when actual operating results are determined. Real Estate Joint Ventures—The Account has limited ownership interests in various real estate joint ventures (collectively, the “Joint Ventures”). The Account records its contributions as increases to its investments in the Joint Ventures, and distributions from the Joint Ventures are treated as income within
income from real estate joint ventures and limited partnerships in the Account’s Consolidated Statements of Operations. Distributions that are identified as returns of capital or capital gains or losses are recorded as unrealized gains and realized gains and losses, respectively. Income from the Joint Ventures is
recorded based on the Account’s proportional interest of the income distributed by the Joint Ventures. Income earned but not yet distributed to the Account by the Joint Ventures is recorded as unrealized gains and losses. Limited Partnerships—The Account has limited ownership interests in various private real estate funds (primarily limited partnerships) and a private real estate investment trust (collectively, the “Limited Partnerships”). The Account records its contributions as increases to the investments, and distributions from
the investments are treated as income within income from real estate joint ventures and limited partnerships in the Account’s Consolidated Statements of Operations. Distributions that are identified as returns of capital or capital gains or losses are recorded as unrealized gains and realized gains and losses,
respectively. Unrealized gains and losses are recorded based upon the changes in the net asset values of the Limited Partnerships as determined from the financial statements of the Limited Partnerships when received by the Account. Prior to the receipt of the financial statements from the Limited Partnerships, the
Account estimates the value of its interest in good faith and will from time to time seek input from the issuer or the sponsor of the investment. Changes in value based on such estimates are recorded by the Account as unrealized gains and losses. Marketable Securities—Transactions in marketable securities are accounted for as of the date the securities are purchased or sold (trade date). Interest income is recorded as earned. Dividend income is recorded on the ex-dividend date within dividend income. Dividends that are identified as returns of capital or
capital gains or losses are recorded as unrealized gains and realized gains or losses, respectively. Realized gains and losses on securities transactions are accounted for on the specific identification method. Realized and Unrealized Gains and Losses—Realized gains and losses are recorded at the time an investment is sold or a distribution is received in relation to an investment sale from a Joint Venture or Limited Partnership. Real estate transactions are accounted for as of the date on which the purchase or sale
transactions for the real estate properties close (settlement date). The Account recognizes a realized gain on the sale of a real estate property to the extent that the contract sales price exceeds the cost-to-date of the property being sold. A realized loss occurs when the cost-to-date exceeds the sales price. Unrealized gains and losses are recorded as the fair values of the Accounts investments are adjusted, and as discussed within the Real Estate Joint Ventures and Limited Partnership sections above. Net Assets—The Account’s net assets as of the close of each valuation day are valued by taking the sum of:
•
the value of the Account’s cash; cash equivalents, and short-term and other debt instruments; • the value of the Account’s other securities and other non-real estate assets; • the value of the individual real properties (based on the most recent valuation of that property) and other real estate-related investments owned by the Account; 62
• an estimate of the net operating income accrued by the Account from its properties, other real estate-related investments and non real estate-related investments (including short-term marketable securities) since the end of the prior valuation day; and • actual net operating income earned from the Account’s properties, other real estate-related investments and non real estate-related investments (but only to the extent any such item of income differs from the estimated income accrued for on such investments), and then reducing the sum by liabilities held within the Account, including the daily investment management fee, administration and distribution fees and certain other expenses attributable to operating the Account. Daily estimates of net operating income are adjusted to reflect actual net operating income on a
monthly basis, at which time such adjustments (if any) are reflected in the Account’s unit value. After the end of every quarter, the Account reconciles the amount of expenses deducted from the Account (which is established in order to approximate the costs that the Account will incur) with the expenses the Account actually incurred. If there is a difference, the Account adds it to or deducts it from the
Account in equal daily installments over the remaining days of the following quarter. Material differences may be repaid in the current calendar quarter. The Account’s at-cost deductions are based on projections of Account assets and overall expenses, and the size of any adjusting payments will be directly affected
by the difference between management’s projections and the Account’s actual assets or expenses. New Accounting Pronouncements In June 2009, the FASB issued Statement of Financial Accounting Standards No. 167, Amendments to FASB Interpretation No. 46(R) (“SFAS No. 167”), which amends guidance related to the identification of a variable interest entity, variable interests, the primary beneficiary, and expands required note
disclosures to provide greater transparency to the users of financial statements. In December 2009, the FASB issued Accounting Standards Update (“ASU”) No. 2009-17, “Improvements to Financial Reporting by Enterprises Involved with Variable Interest Entities,” which amended the Codification with the
guidance contained in SFAS No. 167. In February 2010, the FASB issued ASU No. 2010-10, “Amendments for Certain Investment Funds,” which defers the applicability of ASU No. 2009-17 in certain instances. These standards were effective on January 1, 2010 and did not result in a significant impact to the
Account’s financial position or results of operations. In January 2010, the FASB issued ASU No. 2010-06, “Improving Disclosures about Fair Value Measurements” which requires new disclosures related to transfers in and out of levels 1 and 2, and the separate disclosure of purchases, sales, issuances and settlements when reconciling activity in level 3. This ASU
also amends prior disclosure requirements to call for the disaggregation of assets and liabilities into appropriate subsets, and the disclosure of valuation techniques and inputs for recurring and nonrecurring fair value measurements in levels 2 and 3. The new disclosure requirement for reconciling level 3 activity is
effective January 1, 2011. All other new or amended disclosure requirements were effective January 1, 2010 for the Account and are reflected in the notes to the financial statements. These changes did not impact the Account’s financial position or results of operations. In May 2011, the FASB issued ASU No. 2011-04, “Amendments to Achieve Common Fair Value Measurements and Disclosure Requirements in U.S. GAAP and IFRSs”, with the intention to converge fair value standards between U.S. GAAP and International Financial and Reporting Standards. This ASU is
largely consistent with existing fair value measurement principles in U.S. GAAP, it expands ASC 820’s existing disclosure requirements for fair value measurements and makes other amendments. Many of these amendments are being made to eliminate unnecessary wording differences between U.S. GAAP and
IFRS. However, some could change how the fair value measurement guidance in ASC 820 is applied. Changes in applying fair value standards and additional disclosure requirements are effective on January 1, 2012. The Account is currently assessing the impact of applying the revised standards but does not
anticipate a material impact to the Account’s financial position or results of operations. ITEM 3. QUANTITATIVE AND QUALITATIVE DISCLOSURES ABOUT MARKET RISK. The Account’s real estate holdings, including real estate joint ventures and limited partnerships, which, as of September 30, 2011, represented 78.5% of the Account’s total investments, expose the Account to a variety of risks. These risks include, but are not limited to: 63
•
General Real Estate Risk—The risk that the Account’s property values or rental and occupancy rates could go down due to general economic conditions, a weak market for real estate generally, disruptions in the credit and/or capital markets, or changing supply and demand for certain types of properties; • Appraisal Risk—The risk that the sale price of an Account property (i.e., the value that would be determined by negotiations between independent parties) might differ substantially from its estimated or appraised value, leading to losses or reduced profits to the Account upon sale; • Risk Relating to Property Sales—The risk that the Account might not be able to sell a property at a particular time for its full value, particularly in a poor market. This might make it difficult to raise cash quickly and also could lead to Account losses; • Risks of Borrowing—The risk that interest rate changes may impact Account returns if the Account takes out a mortgage on a property, buys a property subject to a mortgage or holds a property subject to a mortgage; and • Foreign Currency Risk—The risk that the value of the Account’s foreign investments, related debt, or rental income could increase or decrease due to changes in foreign currency exchange rates or foreign currency exchange control regulations, and hedging against such changes, if undertaken by the Account,
may entail additional costs and be unsuccessful. The Account believes the diversification of its real estate portfolio, both geographically and by sector, along with its quarterly valuation procedure, helps manage the real estate and appraisal risks described above. As of September 30, 2011, 21.5% of the Account’s total investments were comprised of marketable securities which included high-quality publicly traded debt instruments (i.e., government agency notes) and equity securities, primarily REIT securities. The Consolidated Statements of Investments for the
Account sets forth the general financial terms of these instruments, along with their fair values, as determined in accordance with procedures described in Note 1—Organization and Significant Accounting Policies to the Account’s consolidated financial statements herein. The Account’s marketable securities are
considered held for trading purposes. Currently, the Account does not invest in derivative financial investments, nor does the Account engage in any hedging activity. Risks associated with investments in real estate-related liquid assets (which could include, from time to time, REIT securities and CMBS), and non-real estate-related liquid assets, including financial/credit risk, market volatility risk, interest rate volatility risk and deposit/money market risk.
•
Financial/Credit Risk—The risk, for debt securities, that the issuer will not be able to pay principal and interest when due (and/or declare bankruptcy or be subject to receivership) and, for equity securities such as common or preferred stock, that the issuer’s current earnings will fall or that its overall financial
soundness will decline, reducing the security’s value. • Market Volatility Risk—The risk that the Account’s investments will experience price volatility due to changing conditions in the financial markets regardless of the credit quality or financial condition of the underlying issuer. This risk is particularly acute to the extent the Account holds equity securities, which
have experienced significant short-term price volatility over the past few years. Also, to the extent the Account holds debt securities; changes in overall interest rates can cause price fluctuations. • Interest Rate Volatility—The risk that interest rate volatility may affect the Account’s current income from an investment. • Deposit/Money Market Risk—The risk that, to the extent the Account’s cash held in bank deposit accounts exceeds federally insured limits as to that bank, the Account could experience losses if banks fail. The Account does not believe it has exposure to significant concentration of deposit risk. In addition,
there is some risk that investments held in money market accounts can suffer losses. In addition, to the extent the Account were to hold mortgage-backed securities (including commercial mortgage-backed securities) these securities are subject to prepayment risk or extension risk (i.e., the risk that borrowers will repay the loans earlier or later than anticipated). If the underlying mortgage assets
experience faster than anticipated repayments of principal, the Account could fail to recoup some or all of its 64
initial investment in these securities, since the original price paid by the Account was based in part on assumptions regarding the receipt of interest payments. If the underlying mortgage assets are repaid later than anticipated, the Account could lose the opportunity to reinvest the anticipated cash flows at a time
when interest rates might be rising. The rate of prepayment depends on a variety of geographic, social and other functions, including prevailing market interest rates and general economic factors. The market value of these securities is also highly sensitive to changes in interest rates. Note that the potential for
appreciation, which could otherwise be expected to result from a decline in interest rates, may be limited by any increased prepayments. These securities may be harder to sell than other securities. In addition to these risks, real estate-related equity and debt securities (such as REIT stocks and mortgage-backed securities) are subject to many of the same general risks inherent in real estate investing, making mortgage loans and investing in debt securities. For more information on the risks associated with
all of the Account’s investments, see the Account’s most recent prospectus. ITEM 4. CONTROLS AND PROCEDURES. (a) The registrant maintains a system of disclosure controls and procedures that are designed to provide reasonable assurance that information required to be disclosed in the registrant’s reports under the Securities Exchange Act of 1934, as amended (the “Exchange Act”), is recorded, processed, summarized
and reported within the time periods specified in the SEC’s rules and forms, and that such information is accumulated and communicated to management, including the registrant’s Chief Executive Officer (“CEO”) and the Chief Financial Officer (“CFO”), as appropriate, to allow timely decisions regarding
required disclosure. Under the supervision and participation of the registrant’s management, including the registrant’s CEO and CFO, the registrant conducted an evaluation of the effectiveness of the registrant’s disclosure controls and procedures as defined in Rule 13a-15(e) under the Exchange Act as of September 30, 2011.
Based upon management’s review, the CEO and the CFO concluded that the registrant’s disclosure controls and procedures were effective as of September 30, 2011. (b) Changes in internal control over financial reporting. There have been no changes in the registrant’s internal control over financial reporting that occurred during the registrant’s last fiscal quarter that materially affected, or are reasonably likely to materially affect, the registrant’s internal control over
financial reporting. PART II. OTHER INFORMATION ITEM 1. LEGAL PROCEEDINGS. There are no material legal proceedings to which the Account is a party, or to which the Account’s assets are subject. ITEM 1A. RISK FACTORS. There have been no material changes from our risk factors as previously reported in the Account’s Annual Report on Form 10-K for the year ended December 31, 2010. ITEM 2. UNREGISTERED SALES OF EQUITY SECURITIES AND USE OF PROCEEDS. Not applicable. ITEM 3. DEFAULTS UPON SENIOR SECURITIES. Not applicable. ITEM 4. [REMOVED AND RESERVED]. ITEM 5. OTHER INFORMATION. The Code of Ethics for TIAA’s senior financial officers, including its principal executive officer, principal financial officer, principal accounting officer, or controller, and persons performing similar functions, has been filed as an exhibit to the Account’s Annual Report on Form 10-K for the year ended December 31,
2010 and can also be found on the following two web sites, http://www.tiaa-cref.org/public/prospectuses/index.html and http://www.tiaa-cref.org/about/governance/corporate/topics/annual_reports.html. 65
ITEM 6. EXHIBITS
(1)
(A)
Distribution Agreement for the Contracts Funded by the TIAA Real Estate Account, dated as of January 1, 2008, by and among Teachers Insurance and Annuity Association of America, for itself and on behalf of the Account, and TIAA-CREF Individual & Institutional Services, LLC.(5)
(3)
(A)
Charter of TIAA.(8)
(B)
Restated Bylaws of TIAA (as amended).(9)
(4)
(A)
Forms of RA, GRA, GSRA, SRA, IRA Real Estate Account Endorsements,(2) Keogh Contract,(3) Retirement Select and Retirement Select Plus Contracts and Endorsements(1) and Retirement Choice and Retirement Choice Plus Contracts.(3)
(B)
Forms of Income-Paying Contracts(2)
(C)
Form of Contract Endorsement for Internal Transfer Limitation(10)
(D)
Form of Accumulation Contract(11)
(10)
(A)
Independent Fiduciary Agreement, dated February 22, 2006, by and among TIAA, the Registrant, and Real Estate Research Corporation(4)
(B)
Amendment to Independent Fiduciary Agreement, dated December 17, 2008, between TIAA, on behalf of the Registrant, and Real Estate Research Corporation(6)
(C)
Custodian Agreement, dated as of March 3, 2008, by and between TIAA, on behalf of the Registrant, and State Street Bank and Trust Company, N.A.(7)
*(31)
Rule 13a-15(e)/15d-15(e) Certifications
*(32)
Section 1350 Certifications
**(101)
The following financial information from the Quarterly Report on Form 10-Q
for the periods ended September 30, 2011, formatted in XBRL (Extensible
Business Reporting Language): (i) the Statements of Assets and Liabilities,
(ii) the Statements of Operations, (iii) the Statements of Changes
in Net Assets, (iv) the Statements of Cash Flows, and (v) the Notes
to the Financial Statements
*
Filed herewith. ** Furnished electronically herewith. (1) Previously filed and incorporated herein by reference to the Account’s Pre-Effective Amendment No. 1 to the Registration Statement on Form S-1 filed April 29, 2004 (File No. 333-113602). (2) Previously filed and incorporated herein by reference to the Account’s Post-Effective Amendment No. 2 to the Registration Statement on Form S-1 filed April 30, 1996 (File No. 33-92990). (3) Previously filed and incorporated herein by reference to the Account’s Post-Effective Amendment No. 1 to the Registration Statement on Form S-1 filed May 2, 2005 (File No. 333-121493). (4) Previously filed and incorporated herein by reference to Exhibit 10.(a) to the Annual Report on Form 10-K of the Account for the period ended December 31, 2005, filed with the Commission on March 15, 2006 (File No. 33-92990). (5) Previously filed and incorporated herein by reference to the Account’s Current Report on Form 8-K, filed with the Commission on January 7, 2008 (File No. 33-92990). (6) Previously filed and incorporated herein by reference to the Account’s Current Report on Form 8-K, filed with the Commission on December 22, 2008 (File No. 33-92990). (7) Previously filed and incorporated herein by reference to Exhibit 10.(b) to the Annual Report on Form 10-K of the Account for the fiscal year ended December 31, 2007 and filed with the Commission on March 20, 2008 (File No. 33-92990). (8) Previously filed and incorporated by reference to Exhibit 3(A) to the Account’s Quarterly Report on Form 10-Q for the quarter ended June 30, 2009 and filed with the Commission on August 13, 2009 (File No. 33-92990). (9) Previously filed and incorporated by reference to Exhibit 3(B) to the Account’s Quarterly Report on Form 10-Q for the quarter ended June 30, 2009 and filed with the Commission on August 13, 2009 (File No. 33-92990). (10) Previously filed and incorporated by reference to Exhibit 4(C) to the Account’s Quarterly Report on Form 10-Q for the quarter ended September 30, 2010 and filed with the Commission on November 12, 2010 (File No. 33-92990). (11) Previously filed and incorporated by reference to Exhibit 4(D) to the Account’s Pre-Effective Amendment No. 1 to the Registration Statement on Form S-1 filed April 27, 2011 (File No. 333-172900). 66
SIGNATURES Pursuant to the requirements of the Securities Exchange Act of 1934, as amended, the registrant, TIAA Real Estate Account, has duly caused this Report to be signed on its behalf by the undersigned, thereunto duly authorized, in New York, New York, on the 14th day of November, 2011.
TIAA REAL ESTATE ACCOUNT
By:
TEACHERS INSURANCE AND ANNUITY
November 14, 2011
By:
/s/ Roger W. Ferguson, Jr.
Roger W. Ferguson, Jr.
November 14, 2011
By:
/s/ Virginia M. Wilson
Virginia M. Wilson 67
ASSOCIATION OF AMERICA
President and
Chief Executive Officer
Executive Vice President and
Chief Financial Officer