Attached files
| file | filename |
|---|---|
| EX-32 - TIAA REAL ESTATE ACCOUNT | c82886_ex32.htm |
| EX-31 - TIAA REAL ESTATE ACCOUNT | c82886_ex31.htm |
UNITED STATES
SECURITIES AND EXCHANGE COMMISSION
Washington, D.C. 20549
FORM 10-Q
(Mark One)
x QUARTERLY REPORT PURSUANT TO SECTION 13 OR 15(d) OF THE SECURITIES EXCHANGE ACT OF 1934 For the quarterly period ended September 30, 2015
OR
o TRANSITION REPORT PURSUANT TO SECTION 13 OR 15(d) OF THE SECURITIES EXCHANGE ACT OF 1934
For the transition period from to
Commission file number: 33-92990; 333-202583
TIAA REAL ESTATE ACCOUNT
(Exact name of registrant as specified in its charter)
NEW YORK
(State or other jurisdiction
of incorporation or organization)
NOT APPLICABLE
(I.R.S. Employer Identification No.)
C/O TEACHERS INSURANCE AND
ANNUITY ASSOCIATION OF AMERICA
730 THIRD AVENUE
NEW YORK, NEW YORK 10017-3206
(Address of principal executive offices, including zip code)
Registrant’s telephone number, including area code: (212) 490-9000
Indicate by check mark whether the Registrant (1) has filed all reports required to be filed by Section 13 or 15(d) of the Securities Exchange Act of 1934 during the preceding 12 months (or for such shorter period that the Registrant was required to file such reports), and (2) has been subject to such filing requirements for the past 90 days.
YES x NO o
Indicate by check mark whether the registrant has submitted electronically and posted on its corporate Web site, if any, every Interactive Data File required to be submitted and posted pursuant to Rule 405 of Regulation S-T (§232.405 of this chapter) during the preceding 12 months (or for such shorter period that the registrant was required to submit and post such files).
YES x NO o
Indicate by check mark whether the registrant is a large accelerated filer, an accelerated filer, a non-accelerated filer, or smaller reporting company. See the definitions of “large accelerated filer,” “accelerated filer” and “smaller reporting company” in Rule 12b-2 of the Exchange Act. (Check one):
|
|
|
Large accelerated filer o |
Accelerated filer o |
|
Non-accelerated filer x (Do not check if a smaller reporting company) |
Smaller Reporting Company o |
Indicate by check mark whether the registrant is a shell company (as defined in Rule 12b-2 of the Exchange Act).
YES o NO x
PART I. FINANCIAL INFORMATION
ITEM 1. UNAUDITED CONSOLIDATED FINANCIAL STATEMENTS.
INDEX TO UNAUDITED CONSOLIDATED FINANCIAL STATEMENTS
TIAA REAL ESTATE ACCOUNT
September 30, 2015
|
|
|
|||||
|
|
Page |
||||||
|
|
3 |
|||||
|
|
4 |
|||||
|
|
5 |
|||||
|
|
6 |
|||||
|
|
7 |
|||||
|
|
22 |
|||||
2
TIAA REAL ESTATE ACCOUNT
CONSOLIDATED STATEMENTS OF ASSETS AND LIABILITIES
(In millions, except per accumulation unit amounts)
|
|
|
|
|
||||||||||
|
|
September 30, |
December 31, |
||||||||||||
|
|
(Unaudited) |
|
|
|||||||||||
|
ASSETS |
|
|
|
|
||||||||||
|
Investments, at fair value: |
|
|
|
|
||||||||||
|
Real estate properties (cost: $11,975.8 and $11,309.0) |
|
|
$ |
|
14,213.5 |
|
|
$ |
|
13,139.0 |
||||
|
Real estate joint ventures and limited partnerships |
|
|
3,622.7 |
|
|
3,379.6 |
||||||||
|
Marketable securities: |
|
|
|
|
||||||||||
|
Real estate related |
|
|
1,690.5 |
|
|
1,818.4 |
||||||||
|
Other |
|
|
3,893.8 |
|
|
3,831.1 |
||||||||
|
Loan Receivable |
|
|
100.1 |
|
|
— |
||||||||
|
|
|
|
|
|
||||||||||
|
Total investments |
|
|
23,520.6 |
|
|
22,168.1 |
||||||||
|
|
|
|
|
|
||||||||||
|
Cash and cash equivalents |
|
|
5.7 |
|
|
36.5 |
||||||||
|
Due from investment manager |
|
|
11.4 |
|
|
7.2 |
||||||||
|
Other |
|
|
229.3 |
|
|
196.9 |
||||||||
|
|
|
|
|
|
||||||||||
|
TOTAL ASSETS |
|
|
23,767.0 |
|
|
22,408.7 |
||||||||
|
|
|
|
|
|
||||||||||
|
LIABILITIES |
|
|
|
|
||||||||||
|
Mortgage loans payable, at fair value—Note 5 |
|
|
1,831.7 |
|
|
2,373.8 |
||||||||
|
Accrued real estate property expenses |
|
|
190.3 |
|
|
165.5 |
||||||||
|
Other |
|
|
50.5 |
|
|
40.4 |
||||||||
|
|
|
|
|
|
||||||||||
|
TOTAL LIABILITIES |
|
|
2,072.5 |
|
|
2,579.7 |
||||||||
|
|
|
|
|
|
||||||||||
|
COMMITMENTS AND CONTINGENCIES—Note 8 |
|
|
|
|
||||||||||
|
NET ASSETS |
|
|
|
|
||||||||||
|
Accumulation Fund |
|
|
21,240.4 |
|
|
19,409.7 |
||||||||
|
Annuity Fund |
|
|
454.1 |
|
|
419.3 |
||||||||
|
|
|
|
|
|
||||||||||
|
TOTAL NET ASSETS |
|
|
$ |
|
21,694.5 |
|
|
$ |
|
19,829.0 |
||||
|
|
|
|
|
|
||||||||||
|
NUMBER OF ACCUMULATION UNITS |
|
|
59.5 |
|
|
57.9 |
||||||||
|
|
|
|
|
|
||||||||||
|
NET ASSET VALUE, PER ACCUMULATION UNIT—Note 6 |
|
|
$ |
|
356.965 |
|
|
$ |
|
335.393 |
||||
|
|
|
|
|
|
||||||||||
See notes to the consolidated financial statements
3
TIAA REAL ESTATE ACCOUNT
CONSOLIDATED STATEMENTS OF OPERATIONS
(In millions)
(Unaudited)
|
|
|
|
|
|
|
|
|
||||||||||||||||||||
|
|
For the Three Months |
For the Nine Months |
||||||||||||||||||||||||||
2015 |
2014 |
2015 |
2014 |
|||||||||||||||||||||||||
|
INVESTMENT INCOME |
|
|
|
|
|
|
|
|
||||||||||||||||||||
|
Real estate income, net: |
|
|
|
|
|
|
|
|
||||||||||||||||||||
|
Rental income |
|
|
$ |
|
236.1 |
|
|
$ |
|
232.1 |
|
|
$ |
|
676.4 |
|
|
$ |
|
669.3 |
||||||||
|
|
|
|
|
|
|
|
|
|
||||||||||||||||||||
|
Real estate property level expenses: |
|
|
|
|
|
|
|
|
||||||||||||||||||||
|
Operating expenses |
|
|
52.5 |
|
|
52.1 |
|
|
154.5 |
|
|
153.8 |
||||||||||||||||
|
Real estate taxes |
|
|
36.7 |
|
|
34.4 |
|
|
107.4 |
|
|
100.6 |
||||||||||||||||
|
Interest expense |
|
|
18.8 |
|
|
25.0 |
|
|
63.6 |
|
|
73.2 |
||||||||||||||||
|
|
|
|
|
|
|
|
|
|
||||||||||||||||||||
|
Total real estate property level expenses |
|
|
108.0 |
|
|
111.5 |
|
|
325.5 |
|
|
327.6 |
||||||||||||||||
|
|
|
|
|
|
|
|
|
|
||||||||||||||||||||
|
Real estate income, net |
|
|
128.1 |
|
|
120.6 |
|
|
350.9 |
|
|
341.7 |
||||||||||||||||
|
Income from real estate joint ventures and limited partnerships |
|
|
36.2 |
|
|
32.5 |
|
|
104.4 |
|
|
106.9 |
||||||||||||||||
|
Interest |
|
|
3.1 |
|
|
0.6 |
|
|
6.4 |
|
|
2.1 |
||||||||||||||||
|
Dividends |
|
|
13.0 |
|
|
11.3 |
|
|
35.2 |
|
|
30.5 |
||||||||||||||||
|
|
|
|
|
|
|
|
|
|
||||||||||||||||||||
|
TOTAL INVESTMENT INCOME |
|
|
180.4 |
|
|
165.0 |
|
|
496.9 |
|
|
481.2 |
||||||||||||||||
|
|
|
|
|
|
|
|
|
|
||||||||||||||||||||
|
Expenses: |
|
|
|
|
|
|
|
|
||||||||||||||||||||
|
Investment advisory charges |
|
|
17.6 |
|
|
17.8 |
|
|
51.4 |
|
|
53.0 |
||||||||||||||||
|
Administrative charges |
|
|
13.1 |
|
|
10.8 |
|
|
39.7 |
|
|
32.9 |
||||||||||||||||
|
Distribution charges |
|
|
6.1 |
|
|
4.5 |
|
|
17.0 |
|
|
12.8 |
||||||||||||||||
|
Mortality and expense risk charges |
|
|
0.3 |
|
|
0.2 |
|
|
0.8 |
|
|
0.6 |
||||||||||||||||
|
Liquidity guarantee charges |
|
|
8.1 |
|
|
7.0 |
|
|
23.4 |
|
|
21.8 |
||||||||||||||||
|
|
|
|
|
|
|
|
|
|
||||||||||||||||||||
|
TOTAL EXPENSES |
|
|
45.2 |
|
|
40.3 |
|
|
132.3 |
|
|
121.1 |
||||||||||||||||
|
|
|
|
|
|
|
|
|
|
||||||||||||||||||||
|
INVESTMENT INCOME, NET |
|
|
135.2 |
|
|
124.7 |
|
|
364.6 |
|
|
360.1 |
||||||||||||||||
|
|
|
|
|
|
|
|
|
|
||||||||||||||||||||
|
NET REALIZED AND UNREALIZED GAIN (LOSS) ON INVESTMENTS AND MORTGAGE LOANS PAYABLE |
|
|
|
|
|
|
|
|
||||||||||||||||||||
|
Net realized gain (loss) on investments: |
|
|
|
|
|
|
|
|
||||||||||||||||||||
|
Real estate properties |
|
|
— |
|
|
(17.3 |
) |
|
|
|
216.9 |
|
|
(19.9 |
) |
|
||||||||||||
|
Real estate joint ventures and limited partnerships |
|
|
(0.2 |
) |
|
|
|
(35.8 |
) |
|
|
|
152.5 |
|
|
(40.1 |
) |
|
||||||||||
|
Marketable securities |
|
|
4.5 |
|
|
4.9 |
|
|
46.1 |
|
|
53.9 |
||||||||||||||||
|
|
|
|
|
|
|
|
|
|
||||||||||||||||||||
|
Net realized gain (loss) on investments |
|
|
4.3 |
|
|
(48.2 |
) |
|
|
|
415.5 |
|
|
(6.1 |
) |
|
||||||||||||
|
|
|
|
|
|
|
|
|
|
||||||||||||||||||||
|
Net change in unrealized appreciation (depreciation) on: |
|
|
|
|
|
|
|
|
||||||||||||||||||||
|
Real estate properties |
|
|
166.5 |
|
|
342.3 |
|
|
407.7 |
|
|
740.4 |
||||||||||||||||
|
Real estate joint ventures and limited partnerships |
|
|
105.7 |
|
|
93.1 |
|
|
262.7 |
|
|
249.6 |
||||||||||||||||
|
Marketable securities |
|
|
(0.8 |
) |
|
|
|
(57.8 |
) |
|
|
|
(162.6 |
) |
|
|
|
118.7 |
||||||||||
|
Loans Receivable |
|
|
0.1 |
|
|
— |
|
|
0.1 |
|
|
— |
||||||||||||||||
|
Mortgage loans payable |
|
|
11.4 |
|
|
(26.2 |
) |
|
|
|
3.5 |
|
|
(52.8 |
) |
|
||||||||||||
|
|
|
|
|
|
|
|
|
|
||||||||||||||||||||
|
Net change in unrealized appreciation on |
|
|
282.9 |
|
|
351.4 |
|
|
511.4 |
|
|
1,055.9 |
||||||||||||||||
|
|
|
|
|
|
|
|
|
|
||||||||||||||||||||
NET REALIZED AND UNREALIZED GAIN ON INVESTMENTS AND MORTGAGE LOANS PAYABLE |
|
|
287.2 |
|
|
303.2 |
|
|
926.9 |
|
|
1,049.8 |
||||||||||||||||
|
|
|
|
|
|
|
|
|
|
||||||||||||||||||||
|
NET INCREASE IN NET ASSETS RESULTING FROM OPERATIONS |
|
|
$ |
|
422.4 |
|
|
$ |
|
427.9 |
|
|
$ |
|
1,291.5 |
|
|
$ |
|
1,409.9 |
||||||||
|
|
|
|
|
|
|
|
|
|
||||||||||||||||||||
See notes to the consolidated financial statements
4
TIAA REAL ESTATE ACCOUNT
CONSOLIDATED STATEMENTS OF CHANGES IN NET ASSETS
(In millions)
(Unaudited)
|
|
|
|
|
|
|
|
|
||||||||||||||||||||
|
|
For the Three Months |
For the Nine Months |
||||||||||||||||||||||||||
2015 |
2014 |
2015 |
2014 |
|||||||||||||||||||||||||
|
FROM OPERATIONS |
|
|
|
|
|
|
|
|
||||||||||||||||||||
|
Investment income, net |
|
|
$ |
|
135.2 |
|
|
$ |
|
124.7 |
|
|
$ |
|
364.6 |
|
|
$ |
|
360.1 |
||||||||
|
Net realized gain (loss) on investments |
|
|
4.3 |
|
|
(48.2 |
) |
|
|
|
415.5 |
|
|
(6.1 |
) |
|
||||||||||||
|
Net change in unrealized appreciation on investments and mortgage loans payable |
|
|
282.9 |
|
|
351.4 |
|
|
511.4 |
|
|
1,055.9 |
||||||||||||||||
|
|
|
|
|
|
|
|
|
|
||||||||||||||||||||
|
NET INCREASE IN NET ASSETS RESULTING |
|
|
422.4 |
|
|
427.9 |
|
|
1,291.5 |
|
|
1,409.9 |
||||||||||||||||
|
|
|
|
|
|
|
|
|
|
||||||||||||||||||||
|
FROM PARTICIPANT TRANSACTIONS |
|
|
|
|
|
|
|
|
||||||||||||||||||||
|
Premiums |
|
|
712.7 |
|
|
581.4 |
|
|
2,067.4 |
|
|
1,742.9 |
||||||||||||||||
|
Annuity payments |
|
|
(9.3 |
) |
|
|
|
(8.1 |
) |
|
|
|
(26.9 |
) |
|
|
|
(23.6 |
) |
|
||||||||
|
Withdrawals and death benefits |
|
|
(527.2 |
) |
|
|
|
(416.4 |
) |
|
|
|
(1,466.5 |
) |
|
|
|
(1,114.8 |
) |
|
||||||||
|
|
|
|
|
|
|
|
|
|
||||||||||||||||||||
NET INCREASE IN NET ASSETS |
|
|
176.2 |
|
|
156.9 |
|
|
574.0 |
|
|
604.5 |
||||||||||||||||
|
|
|
|
|
|
|
|
|
|
||||||||||||||||||||
|
NET INCREASE IN NET ASSETS |
|
|
598.6 |
|
|
584.8 |
|
|
1,865.5 |
|
|
2,014.4 |
||||||||||||||||
|
NET ASSETS |
|
|
|
|
|
|
|
|
||||||||||||||||||||
|
Beginning of period |
|
|
21,095.9 |
|
|
18,337.5 |
|
|
19,829.0 |
|
|
16,907.9 |
||||||||||||||||
|
|
|
|
|
|
|
|
|
|
||||||||||||||||||||
|
End of period |
|
|
$ |
|
21,694.5 |
|
|
$ |
|
18,922.3 |
|
|
$ |
|
21,694.5 |
|
|
$ |
|
18,922.3 |
||||||||
|
|
|
|
|
|
|
|
|
|
||||||||||||||||||||
See notes to the consolidated financial statements
5
TIAA REAL ESTATE ACCOUNT
CONSOLIDATED STATEMENTS OF CASH FLOWS
(In millions)
(Unaudited)
|
|
|
|
|
||||||||||
|
|
For the Nine Months |
|||||||||||||
2015 |
2014 |
|||||||||||||
|
CASH FLOWS FROM OPERATING ACTIVITIES |
|
|
|
|
||||||||||
|
Net increase in net assets resulting from operations |
|
|
$ |
|
1,291.5 |
|
|
$ |
|
1,409.9 |
||||
|
Adjustments to reconcile net changes in net assets resulting from operations to net cash used in operating activities: |
|
|
|
|
||||||||||
|
Net realized (gain) loss on investments |
|
|
(415.5 |
) |
|
|
|
6.1 |
||||||
|
Net change in unrealized appreciation on investments |
|
|
(511.4 |
) |
|
|
|
(1,055.9 |
) |
|
||||
|
Reinvestment of Limited Partnership distributions |
|
|
(0.7 |
) |
|
|
|
— |
||||||
|
Purchase of real estate properties |
|
|
(946.4 |
) |
|
|
|
(1,073.7 |
) |
|
||||
|
Capital improvements on real estate properties |
|
|
(114.9 |
) |
|
|
|
(148.2 |
) |
|
||||
|
Proceeds from sale of real estate properties |
|
|
421.4 |
|
|
243.6 |
||||||||
|
Purchases of long term investments |
|
|
(366.4 |
) |
|
|
|
(371.6 |
) |
|
||||
|
Proceeds from long term investments |
|
|
549.6 |
|
|
317.8 |
||||||||
|
Increase in loans receivable |
|
|
(100.0 |
) |
|
|
|
— |
||||||
|
Increase in other investments |
|
|
(61.9 |
) |
|
|
|
(7.5 |
) |
|
||||
|
Change in due from investment manager |
|
|
(4.2 |
) |
|
|
|
(7.4 |
) |
|
||||
|
(Increase) decrease in other assets |
|
|
(32.4 |
) |
|
|
|
37.4 |
||||||
|
Increase in other liabilities |
|
|
25.1 |
|
|
14.6 |
||||||||
|
|
|
|
|
|
||||||||||
|
NET CASH USED IN OPERATING ACTIVITIES |
|
|
(266.2 |
) |
|
|
|
(634.9 |
) |
|
||||
|
|
|
|
|
|
||||||||||
|
CASH FLOWS FROM FINANCING ACTIVITIES |
|
|
|
|
||||||||||
|
Mortgage loan proceeds received |
|
|
— |
|
|
137.5 |
||||||||
|
Payments of mortgage loans |
|
|
(338.6 |
) |
|
|
|
(114.6 |
) |
|
||||
|
Premiums |
|
|
2,067.4 |
|
|
1,742.9 |
||||||||
|
Annuity payments |
|
|
(26.9 |
) |
|
|
|
(23.6 |
) |
|
||||
|
Withdrawals and death benefits |
|
|
(1,466.5 |
) |
|
|
|
(1,114.8 |
) |
|
||||
|
|
|
|
|
|
||||||||||
|
NET CASH PROVIDED BY FINANCING ACTIVITIES |
|
|
235.4 |
|
|
627.4 |
||||||||
|
|
|
|
|
|
||||||||||
|
NET DECREASE IN CASH AND CASH EQUIVALENTS |
|
|
(30.8 |
) |
|
|
|
(7.5 |
) |
|
||||
|
CASH AND CASH EQUIVALENTS |
|
|
|
|
||||||||||
|
Beginning of period |
|
|
36.5 |
|
|
14.6 |
||||||||
|
|
|
|
|
|
||||||||||
|
End of period |
|
|
$ |
|
5.7 |
|
|
$ |
|
7.1 |
||||
|
|
|
|
|
|
||||||||||
|
SUPPLEMENTAL DISCLOSURES: |
|
|
|
|
||||||||||
|
Cash paid for interest |
|
|
$ |
|
64.8 |
|
|
$ |
|
73.6 |
||||
|
|
|
|
|
|
||||||||||
|
Loan assignment as part of a real estate disposition |
|
|
$ |
|
200.0 |
|
|
$ |
|
— |
||||
|
|
|
|
|
|
||||||||||
|
Conversion of note receivable |
|
|
$ |
|
100.6 |
|
|
$ |
|
— |
||||
|
|
|
|
|
|
||||||||||
See notes to the consolidated financial statements
6
TIAA REAL ESTATE ACCOUNT
NOTES TO THE CONSOLIDATED FINANCIAL STATEMENTS
Note 1—Organization and Significant Accounting Policies
Business: The TIAA Real Estate Account (“Account”) is an insurance separate account of Teachers Insurance and Annuity Association of America (“TIAA”) and was established by resolution of TIAA’s Board of Trustees (the “Board”) on February 22, 1995, under the insurance laws of the State of New York, for the purpose of funding variable annuity contracts issued by TIAA. The Account offers individual and group accumulating annuity contracts (with contributions made on a pre-tax or after-tax basis), as well as individual lifetime and term-certain variable payout annuity contracts (including the payment of death benefits to beneficiaries). Investors are entitled to transfer funds to or from the Account, and make withdrawals from the Account on a daily basis, under certain circumstances. Funds invested in the Account for each category of contract are expressed in terms of units, and unit values will fluctuate depending on the Account’s performance.
The investment objective of the Account is to seek favorable long-term returns primarily through rental income and capital appreciation from real estate and real estate-related investments owned by the Account. The Account holds real estate properties directly and through subsidiaries wholly owned by TIAA for the benefit of the Account. The Account also holds interests in real estate joint ventures and limited partnerships in which the Account does not hold a controlling interest; as such, such interests are not consolidated into these consolidated financial statements. The Account also holds an investment in a loan receivable with a commercial real estate property as underlying collateral. Additionally, the Account invests in real estate-related and non-real estate-related publicly traded securities, cash and other instruments to maintain adequate liquidity levels for operating expenses, capital expenditures and to fund benefit payments (withdrawals, transfers and related transactions).
The consolidated financial statements were prepared in accordance with accounting principles generally accepted in the United States of America, which requires the use of estimates made by management. Actual results may vary from those estimates and such differences may be material. The following is a summary of the significant accounting policies of the Account.
Basis of Presentation: The accompanying consolidated financial statements include the Account and those subsidiaries wholly owned by TIAA for the benefit of the Account. All significant intercompany accounts and transactions between the Account and such subsidiaries have been eliminated.
The Accumulation Unit Value (“AUV”) used for financial reporting purposes may differ from the AUV used for processing transactions. The AUV used for financial reporting purposes includes security and participant transactions effective through the period end date to which this report relates. Total return is computed based on the AUV used for processing transactions.
Certain prior year amounts have been reclassified to conform to the current period presentation.
Determination of Investments at Fair Value: The Account reports all investments at fair value in accordance with the Financial Accounting Standards Board (“FASB”) Accounting Standards Codification (“ASC”) 946, Financial Services—Investment Companies. Further, in accordance with the adoption of the fair value option allowed under ASC 825, Financial Instruments, and at the election of Account management, mortgage loans payable are reported at fair value. The FASB has defined fair value as the price that would be received to sell an asset or paid to transfer a liability in an orderly transaction between market participants.
The following is a description of the valuation methodologies used to determine the fair value of the Account’s investments and investment related mortgage loans payable.
Valuation of Real Estate Properties—Investments in real estate properties are stated at fair value, as determined in accordance with policies and procedures reviewed by the Investment Committee of the Board and in accordance with the responsibilities of the Board as a whole. Accordingly, the Account does not record depreciation. Determination of fair value involves significant levels of judgment because the actual fair value of real estate can be determined only by negotiation between the parties in a sales transaction. The Account’s primary objective when valuing its real estate investments will be to produce a valuation that represents a reasonable estimate of the fair value of its investments. Implicit in the Account’s definition of
7
fair value, are the consummation of a sale as of a specified date and the passing of title from seller to buyer under conditions whereby:
• |
Buyer and seller are typically motivated; |
|||||||||||||||||||||||||||||||||||||||||||||||||||||||||||||||||||||||||||||||||||||||||||||||||
• |
Both parties are well informed or well advised, and acting in what they consider their best interests; |
|||||||||||||||||||||||||||||||||||||||||||||||||||||||||||||||||||||||||||||||||||||||||||||||||
• |
A reasonable time is allowed for exposure in the open market; |
|||||||||||||||||||||||||||||||||||||||||||||||||||||||||||||||||||||||||||||||||||||||||||||||||
• |
Payment is made in terms of cash or in terms of financial arrangements comparable thereto; and |
|||||||||||||||||||||||||||||||||||||||||||||||||||||||||||||||||||||||||||||||||||||||||||||||||
• |
The price represents the normal consideration for the property sold unaffected by special or creative financing or sales concessions granted by anyone associated with the sale. |
|||||||||||||||||||||||||||||||||||||||||||||||||||||||||||||||||||||||||||||||||||||||||||||||||
Property and investment values are affected by, among other things, the availability of capital, occupancy rates, rental rates, and interest and inflation rates. As a result, determining real estate and investment values involves many assumptions. Key inputs and assumptions include rental income and expense amounts, related rental income and expense growth rates, discount rates and capitalization rates. Valuation techniques include discounted cash flow analysis, prevailing market capitalization rates or multiples applied to earnings from the property, analysis of recent comparable sales transactions, actual sale negotiations and bona fide purchase offers received from third parties. Amounts ultimately realized from each investment may vary significantly from the fair value presented.
Real estate properties owned by the Account are initially valued based on an independent third party appraisal, as reviewed by TIAA’s internal appraisal staff and as applicable by the Account’s independent fiduciary at the time of the closing of the purchase. Such initial valuation may result in a potential unrealized gain or loss reflecting the difference between an investment’s fair value (i.e., exit price) and its cost basis (which is inclusive of transaction costs).
Subsequently, each property is appraised each quarter by an independent third party appraiser, reviewed by TIAA’s internal appraisal staff and as applicable the Account’s independent fiduciary. In general, the Account obtains appraisals of its real estate properties spread out throughout the quarter, which is intended to result in appraisal adjustments, and thus, adjustments to the valuations of its holdings (to the extent such adjustments are made) that happen regularly throughout each quarter and not on one specific day or month in each period.
Further, management reserves the right to order an appraisal and/or conduct another valuation outside of the normal quarterly process when facts or circumstances at a specific property change. For example, under certain circumstances a valuation adjustment could be made when the account receives a bona fide bid for the sale of a property held within the Account or one of the Account’s joint ventures. In addition, adjustments may be made for events or circumstances indicating an impairment of a tenant’s ability to pay amounts due to the Account under a lease (including due to a bankruptcy filing of that tenant). Alternatively, adjustments may be made to reflect the execution or renewal of a significant lease. Also, adjustments may be made to reflect factors (such as sales values for comparable properties or local employment rate) bearing uniquely on a particular region in which the Account holds properties. TIAA’s internal appraisal staff oversees the entire appraisal process, in conjunction with the Account’s independent fiduciary (the independent fiduciary is more fully described in the paragraph below). Any differences in the conclusions of TIAA’s internal appraisal staff and the independent appraiser will be reviewed by the independent fiduciary, which will make a final determination on the matter (which may include ordering a subsequent independent appraisal).
The independent fiduciary, RERC, LLC, has been appointed by a special subcommittee of the Investment Committee of the Board to, among other things, oversee the appraisal process. The independent fiduciary must approve all independent appraisers used by the Account. All appraisals are performed in accordance with Uniform Standards of Professional Appraisal Practices, the real estate appraisal industry standards created by The Appraisal Foundation. Real estate appraisals are estimates of property values based on a professional’s opinion. Appraisals of properties held outside of the U.S. are performed in accordance with industry standards commonly applied in the applicable jurisdiction. These independent appraisers are always expected to be MAI-designated members of the Appraisal Institute (or its European equivalent, Royal Institute of Chartered Surveyors) and state certified appraisers from national or regional firms with relevant
8
property type experience and market knowledge. Under the Account’s current procedures, each independent appraisal firm will be rotated off of a particular property at least every three years, although such appraisal firm may perform appraisals of other Account properties subsequent to such rotation.
Also, the independent fiduciary can require additional appraisals if factors or events have occurred that could materially change a property’s value (including those identified above) and such change is not reflected in the quarterly valuation review, or otherwise to ensure that the Account is valued appropriately. The independent fiduciary must also approve any valuation change of real estate-related assets where a property’s value changed by more than 6% from the most recent independent annual appraisal, or if the value of the Account would change by more than 4% within any calendar quarter or more than 2% since the prior calendar month. When a real estate property is subject to a mortgage, the property is valued independently of the mortgage and the property and mortgage fair values are reported separately (see Valuation of Mortgage Loans Payable). The independent fiduciary reviews and approves all mortgage valuation adjustments before such adjustments are recorded by the Account. The Account continues to use the revised value for each real estate property, loan receivable and mortgage loan payable to calculate the Account’s daily net asset value until the next valuation review or appraisal.
Valuation of Real Estate Joint Ventures—Real estate joint ventures are stated at the fair value of the Account’s ownership interests of the underlying entities. The Account’s ownership interests are valued based on the fair value of the underlying real estate, any related mortgage loans payable, and other factors, such as ownership percentage, ownership rights, buy/sell agreements, distribution provisions and capital call obligations. Upon the disposition of all real estate investments by an investee entity, the Account will continue to state its equity in the remaining net assets of the investee entity during the wind down period, if any, which occurs prior to the dissolution of the investee entity.
Valuation of Real Estate Limited Partnerships—Limited partnership interests are stated at the fair value of the Account’s ownership in the partnership which are recorded based upon the changes in the net asset values of the limited partnerships as determined from the financial statements of the limited partnerships when received by the Account. Prior to the receipt of the financial statements from the limited partnerships, the Account estimates the value of its interest in good faith and will from time to time seek input from the issuer or the sponsor of the investments. Since market quotations are not readily available, the limited partnership interests are valued at fair value as determined in good faith by management under the direction of the Investment Committee of the Board and in accordance with the responsibilities of the Board as a whole.
Valuation of Marketable Securities—Equity securities listed or traded on any national market or exchange are valued at the last sale price as of the close of the principal securities market or exchange on which such securities are traded or, if there is no sale, at the mean of the last bid and asked prices on such market or exchange, exclusive of transaction costs.
Debt securities with readily available market quotations, other than money market instruments, are generally valued at the most recent bid price or the equivalent quoted yield for such securities (or those of comparable maturity, quality and type). Debt securities for which market quotations are not readily available, are valued at fair value as determined in good faith by the Investment Committee of the Board and in accordance with the responsibilities of the Board as a whole.
Short-term investments are valued in the same manner as debt securities, as described above.
Money market instruments are valued at amortized cost, which approximates fair value.
Equity and fixed income securities traded on a foreign exchange or in foreign markets are valued using their closing values under the valuation methods generally accepted in the country where traded, as of the valuation date. This value is converted to U.S. dollars at the exchange rate in effect on the valuation day. Under certain circumstances (for example, if there are significant movements in the U.S. markets and there is an expectation the securities traded on foreign markets will adjust based on such movements when the foreign markets open the next day), the Account may adjust the value of equity or fixed income securities that trade on a foreign exchange or market after the foreign exchange or market has closed.
Valuation of Loans Receivable—Loans receivable are stated at fair value and are initially valued at the face amount of the loan funding. Subsequently, loans receivable are valued at least quarterly by TIAA’s internal valuation department based on market factors, such as market interest rates and spreads for comparable
9
loans, the liquidity for loans of similar characteristics, the performance of the underlying collateral (such as the loan-to-value ratio and the cash flow of the underlying collateral) and the credit quality of the counterparty. The Account’s loan receivable is classified within level 3 of the valuation hierarchy.
Valuation of Mortgage Loans Payable—Mortgage loans payable are stated at fair value. The estimated fair values of mortgage loans payable are based on the amount at which the liability could be transferred to a third party exclusive of transaction costs. Mortgage loans payable are valued internally by TIAA’s internal valuation department, as reviewed by the Account’s independent fiduciary, at least quarterly based on market factors, such as market interest rates and spreads for comparable loans, the performance of the underlying collateral (such as the loan-to-value ratio and the cash flow of the underlying collateral), the liquidity for mortgage loans of similar characteristics, the maturity date of the loan and the return demands of the market.
See Note 4—Assets and Liabilities Measured at Fair Value on a Recurring Basis for further discussion and disclosure regarding the determination of the fair value of the Account’s investments.
Foreign Currency Transactions and Translation: Portfolio investments and other assets and liabilities denominated in foreign currencies are translated into U.S. dollars at the exchange rates prevailing at the end of the period. Purchases and sales of securities, income receipts and expense payments made in foreign currencies are translated into U.S. dollars at the exchange rates prevailing on the respective dates of the transactions. The effect of any changes in foreign currency exchange rates on portfolio investments and mortgage loans payable are included in net realized and unrealized gains and losses on real estate properties and mortgage loans payable. Net realized gains and losses on foreign currency transactions include disposition of foreign currencies, and currency gains and losses between the accrual and receipt dates of portfolio investment income and between the trade and settlement dates of portfolio investment transactions.
Accumulation and Annuity Funds: The accumulation fund represents the net assets attributable to participants in the accumulation phase of their investment (“Accumulation Fund”). The annuity fund represents the net assets attributable to the participants currently receiving annuity payments (“Annuity Fund”). The net increase or decrease in net assets from investment operations is apportioned between the accounts based upon their relative daily net asset values. Once an Account participant begins receiving lifetime annuity income benefits, payment levels cannot be reduced as a result of the Account’s actual mortality experience. In addition, the contracts pursuant to which the Account is offered are required to stipulate the maximum expense charge for all Account level expenses that can be assessed, which is not to exceed 2.5% of average net assets per year. The Account pays a fee to TIAA to assume mortality and expense risks.
Accounting for Investments: The investments held by the Account are accounted for as follows:
Real Estate Properties—Rent from real estate properties consists of all amounts earned under tenant operating leases, including base rent, recoveries of real estate taxes and other expenses and charges for miscellaneous services provided to tenants. Rental income is recognized in accordance with the billing terms of the lease agreements. The Account bears the direct expenses of the real estate properties owned. These expenses include, but are not limited to, fees to local property management companies, property taxes, utilities, maintenance, repairs, insurance, and other operating and administrative costs. An estimate of the net operating income earned from each real estate property is accrued by the Account on a daily basis and such estimates are adjusted when actual operating results are determined.
Real Estate Joint Ventures—The Account has limited ownership interests in various real estate joint ventures (collectively, the “joint ventures”). The Account records its contributions as increases to its investments in the joint ventures, and distributions from the joint ventures are treated as income within income from real estate joint ventures and limited partnerships in the Account’s consolidated statements of operations. Distributions that are identified as returns of capital are recorded as a reduction to the cost basis of the investment, whereas distributions identified as capital gains or losses are recorded as realized gains or losses. Income from the joint ventures is recorded based on the Account’s proportional interest of the income distributed by the joint ventures. Income earned but not yet distributed to the Account by the joint ventures is recorded as unrealized gains and losses.
Limited Partnerships—The Account has limited ownership interests in various private real estate funds (primarily limited partnerships) and a private real estate investment trust (collectively, the “limited
10
partnerships”). The Account records its contributions as increases to the investments, and distributions from the investments are treated as income within income from real estate joint ventures and limited partnerships in the Account’s consolidated statements of operations. Distributions that are identified as returns of capital are recorded as a reduction to the cost basis of the investment, whereas distributions identified as capital gains or losses are recorded as realized gains or losses. Unrealized gains and losses are recorded based upon the changes in the net asset values of the limited partnerships as determined from the financial statements of the limited partnerships when received by the Account. Prior to the receipt of the financial statements from the limited partnerships, the Account estimates the value of its interest in good faith and will from time to time seek input from the issuer or the sponsor of the investments. Changes in value based on such estimates are recorded by the Account as unrealized gains and losses.
Marketable Securities—Transactions in marketable securities are accounted for as of the date the securities are purchased or sold (trade date). Interest income is recorded as earned. Dividend income is recorded on the ex-dividend date within dividend income. Dividends that are identified as returns of capital are recorded as a reduction to the cost basis of the investment, whereas dividends identified as capital gains or losses are recorded as realized gains or losses. Realized gains and losses on securities transactions are accounted for on the specific identification method.
Loan Receivable—The Account has a single ownership interest in a loan receivable. Loans receivable are stated at fair value and are initially valued at the face amount of the loan funding. Subsequently, loans receivable are valued at least quarterly by TIAA’s internal valuation department with changes in fair value flowing through unrealized gain (loss). Interest income from loans receivable is recognized using the effective interest method over the expected life of the loan.
Realized and Unrealized Gains and Losses—Realized gains and losses are recorded at the time an investment is sold or a distribution is received in relation to an investment sale from a joint venture or limited partnership. Real estate transactions are accounted for as of the date on which the purchase or sale transactions for the real estate properties close (settlement date). The Account recognizes a realized gain on the sale of a real estate property to the extent that the contract sales price exceeds the cost-to-date of the property being sold. A realized loss occurs when the cost-to-date exceeds the sales price.
Unrealized gains and losses are recorded as the fair values of the Account’s investments are adjusted, and as discussed within the Real Estate Joint Ventures and Limited Partnerships sections above.
Net Assets—The Account’s net assets as of the close of each valuation day are valued by taking the sum of:
• |
the value of the Account’s cash; cash equivalents, and short-term and other debt instruments; |
|||||||||||||||||||||||||||||||||||||||||||||||||||||||||||||||||||||||||||||||||||||||||||||||||
• |
the value of the Account’s other securities and other non-real estate assets; |
|||||||||||||||||||||||||||||||||||||||||||||||||||||||||||||||||||||||||||||||||||||||||||||||||
• |
the value of the individual real properties (based on the most recent valuation of that property) and other real estate-related investments owned by the Account; |
|||||||||||||||||||||||||||||||||||||||||||||||||||||||||||||||||||||||||||||||||||||||||||||||||
• |
an estimate of the net operating income accrued by the Account from its properties, other real estate-related investments and non-real estate-related investments (including short-term marketable securities) since the end of the prior valuation day; and |
|||||||||||||||||||||||||||||||||||||||||||||||||||||||||||||||||||||||||||||||||||||||||||||||||
• |
actual net operating income earned from the Account’s properties, other real estate-related investments and non-real estate-related investments (but only to the extent any such item of income differs from the estimated income accrued on such investments), |
|||||||||||||||||||||||||||||||||||||||||||||||||||||||||||||||||||||||||||||||||||||||||||||||||
and then reducing the sum by liabilities held within the Account, including the daily investment management fee, administration and distribution fees, mortality and expense fee, and liquidity guarantee fee, and certain other expenses attributable to operating the Account. Daily estimates of net operating income are adjusted to reflect actual net operating income on a monthly basis, at which time such adjustments (if any) are reflected in the Account’s unit value.
After the end of every quarter, the Account reconciles the amount of expenses deducted from the Account (which is established in order to approximate the costs that the Account will incur) with the expenses the Account actually incurred. If there is a difference, the Account adds it to or deducts it from the Account in equal daily installments over the remaining days of the following quarter. Material differences may be repaid in the current calendar quarter. The Account’s at-cost deductions are based on projections of Account assets
11
and overall expenses, and the size of any adjusting payments will be directly affected by the difference between management’s projections and the Account’s actual assets or expenses.
Cash and Cash Equivalents: Cash and cash equivalents are balances held by the Account in bank deposit accounts which, at times, exceed federally insured limits. The Account’s management monitors these balances to mitigate the exposure of risk due to concentration and has not experienced any losses from such concentration.
Other Assets and Other Liabilities: Other assets and other liabilities are comprised of operating assets and liabilities utilized and held at each individual real estate property investment. Other assets consist of, amongst other items, cash, tenant receivables and prepaid expenses; whereas other liabilities primarily consist of security deposits.
Federal Income Taxes: Based on provisions of the Internal Revenue Code, Section 817, the Account is taxed as a segregated asset account of TIAA and as such, the Account incurs no material federal income tax attributable to the net investment activity of the Account. The Account’s federal income tax return is generally subject to examination for a period of three years after filed. State and local tax returns may be subject to examination for an additional period of time depending on the jurisdiction. Management has analyzed the Account’s tax positions taken for all open federal income tax years and has concluded that no provision for federal income tax is required in the Account’s consolidated financial statements.
Restricted Cash: The Account held $50.6 million and $20.4 million as of September 30, 2015 and December 31, 2014, respectively, in escrow accounts for property taxes, insurance, and various other property related matters as required by certain creditors related to outstanding mortgage loans payable collateralized by certain real estate investments. These amounts are recorded within other assets on the consolidated statements of assets and liabilities. See Note 5—Mortgage Loans Payable for additional information regarding the Account’s outstanding mortgage loans payable.
Changes in Net Assets: Premiums include premiums paid by existing accumulation unit holders in the Account and transfers into the Account. Withdrawals and death benefits include withdrawals out of the Account which include transfers out of the Account and required minimum distributions.
Due to/from Investment Manager: Due to/from investment manager represents amounts that are to be paid or received by TIAA on behalf of the Account. Amounts generally are paid or received by the Account within one or two business days and no interest is contractually charged on these amounts.
New Accounting Pronouncements: In February 2015, the FASB issued Accounting Standard Update (“ASU”) No. 2015-02, Amendments to the Consolidation Analysis (“ASU 2015-02”). This ASU amends, amongst other items, the consolidation rules regarding the evaluation of whether a limited partnership or similar entity is a variable interest entity or voting interest entity as well as the elimination of the presumption that a general partner should consolidate a limited partnership. These amendments are effective for public business entities for fiscal years and interim periods within those fiscal years beginning after December 15, 2015. Management is currently evaluating the impact of ASU 2015-02 on the Account’s Consolidated Financial Statements.
In March 2015, the FASB issued ASU No. 2015-03, Interest–Imputation of Interest (“ASU 2015-03”). This ASU amends, amongst other items, the presentation of debt issuance costs on an entity’s balance sheet. These amendments are effective for public business entities for fiscal years and interim periods within those fiscal years beginning after December 15, 2015. Management is currently evaluating the impact of ASU 2015-03 on the Account’s Consolidated Financial Statements.
In May 2015, the FASB issued ASU No. 2015-07, Fair Value Measurement (Topic 820)-Disclosures for Investments in Certain Entities that Calculate Net Asset Value per Share (or Its Equivalent) (“ASU 2015-07”). This ASU removes the requirement to categorize all investments for which the fair value is measured using the net asset value per share practical expedient from the fair value hierarchy. The ASU also removes the requirement to make certain disclosures for investments that are eligible to be measured at fair value using the net asset value per share practical expedient. The disclosures are limited to investments for which the entity has elected to measure the fair value using that practical expedient. These amendments are effective for public business entities for fiscal years and interim periods within those fiscal years beginning after December 15, 2015. Management is currently evaluating the impact of ASU 2015-07 on the Account’s Consolidated Financial Statements.
12
In April 2015, the FASB issued ASU 2015-03 which requires entities to present debt issuance costs as a direct deduction from the carrying amount of the related debt liability. That guidance does not address how debt issuance costs related to line-of-credit arrangements should be presented on the balance sheet or amortized. Given the absence of authoritative guidance within Update 2015-03 for debt issuance costs related to line-of-credit arrangements, ASU 2015-15 clarifies that the SEC staff would not object to an entity deferring and presenting debt issuance costs as an asset and subsequently amortizing the deferred debt issuance costs ratably over the term of the line-of-credit arrangement, regardless of whether there are any outstanding borrowings on the line-of-credit arrangement. The Account currently is not involved with line-of-credit arrangements.
Note 2—Management Agreements, Arrangements and Related Party Transactions
Investment advisory services for the Account are provided by TIAA employees, under the direction of the Board and its Investment Committee, pursuant to investment management procedures adopted by TIAA for the Account. TIAA’s investment management decisions for the Account are subject to review by the Account’s independent fiduciary. TIAA also provides various portfolio accounting and related services for the Account.
The Account is a party to the Distribution Agreement for the Contracts Funded by the TIAA Real Estate Account (the “Distribution Agreement”), dated January 1, 2008, by and among TIAA, for itself and on behalf of the Account, and TIAA-CREF Individual and Institutional Services, LLC (“Services”), a wholly owned subsidiary of TIAA, a registered broker-dealer and a member of the Financial Industry Regulatory Authority. Pursuant to the Distribution Agreement, Services performs distribution services for the Account which include, among other things, (i) distribution of annuity contracts issued by TIAA and funded by the Account, (ii) advising existing annuity contract owners in connection with their accumulations and (iii) helping employers implement and manage retirement plans. In addition, TIAA performs administrative functions for the Account, which include, among other things, (i) maintaining accounting records and performing accounting services, (ii) receiving and allocating premiums, (iii) calculating and making annuity payments, (iv) processing withdrawal requests, (v) providing regulatory compliance and reporting services, (vi) maintaining the Account’s records of contract ownership and (vii) otherwise assisting generally in all aspects of the Account’s operations. Both distribution services (pursuant to the Distribution Agreement) and administrative services are provided to the Account by Services and TIAA, as applicable, on an at cost basis.
The Distribution Agreement is terminable by either party upon 60 days written notice and terminates automatically upon any assignment thereof.
TIAA and Services provide investment management, administrative and distribution services at cost. TIAA and Services receive payments from the Account on a daily basis according to formulas established each year and adjusted periodically with the objective of keeping the payments as close as possible to the Account’s expenses actually incurred. Any differences between actual expenses and the amounts paid by the Account are adjusted quarterly.
TIAA also provides a liquidity guarantee to the Account, for a fee, to ensure that sufficient funds are available to meet participant transfer and cash withdrawal requests in the event that the Account’s cash flows and liquid investments are insufficient to fund such requests. TIAA ensures sufficient funds are available for such transfer and withdrawal requests by purchasing accumulation units of the Account.
To the extent TIAA owns accumulation units issued pursuant to the liquidity guarantee, the independent fiduciary monitors and oversees, among other things, TIAA’s ownership interest in the Account and may require TIAA to eventually redeem some of its units, particularly when the Account has un-invested cash or liquid investments available. TIAA also receives a fee for assuming certain mortality and expense risks.
The expenses for the services noted above that are provided to the Account by TIAA and Services are identified in the accompanying consolidated statements of operations and are reflected in Note 6—Financial Highlights.
Note 3—Credit Risk Concentrations
Concentrations of credit risk may arise when a number of properties or tenants are located in a similar geographic region such that the economic conditions of that region could impact tenants’ obligations to meet
13
their contractual obligations or cause the values of individual properties to decline. The Account has no significant concentrations of tenants as no single tenant has annual contract rent that makes up more than 3% of the Account’s rental income.
The Account’s wholly owned real estate investments and investments in joint ventures are located in the United States. The following table represents the diversification of the Account’s portfolio by region and property type:
Diversification by Fair Value(1)
|
|
|
|
|
|
|
|
|
|
|
|||||||||||||||||||||||||
|
East |
West |
South |
Midwest |
Total |
||||||||||||||||||||||||||||||
|
Office |
|
|
20.9 |
% |
|
|
|
14.2 |
% |
|
|
|
6.7 |
% |
|
|
|
0.3 |
% |
|
|
|
42.1 |
% |
|
||||||||||
|
Apartment |
|
|
10.9 |
% |
|
|
|
9.1 |
% |
|
|
|
4.6 |
% |
|
|
|
— |
|
|
24.6 |
% |
|
||||||||||||
|
Retail |
|
|
3.8 |
% |
|
|
|
3.8 |
% |
|
|
|
7.7 |
% |
|
|
|
0.4 |
% |
|
|
|
15.7 |
% |
|
||||||||||
|
Industrial |
|
|
1.6 |
% |
|
|
|
7.8 |
% |
|
|
|
4.2 |
% |
|
|
|
0.9 |
% |
|
|
|
14.5 |
% |
|
||||||||||
|
Other(2) |
|
|
2.8 |
% |
|
|
|
0.2 |
% |
|
|
|
0.1 |
% |
|
|
|
— |
|
|
3.1 |
% |
|
||||||||||||
|
|
|
|
|
|
|
|
|
|
|
|
|||||||||||||||||||||||||
|
Total |
|
|
40.0 |
% |
|
|
|
35.1 |
% |
|
|
|
23.3 |
% |
|
|
|
1.6 |
% |
|
|
|
100.0 |
% |
|
||||||||||
|
|
|
|
|
|
|
|
|
|
|
|
|||||||||||||||||||||||||
(1) |
Wholly owned properties are represented at fair value and gross of any debt, while joint venture properties are represented at the net equity value. |
|||||||||||||||||||||||||||||||||||||||||||||||||||||||||||||||||||||||||||||||||||||||||||||||||
(2) |
Represents interest in Storage Portfolio investment and a fee interest encumbered by a ground lease real estate investment. |
|||||||||||||||||||||||||||||||||||||||||||||||||||||||||||||||||||||||||||||||||||||||||||||||||
Properties in the “East” region are located in: CT, DC, DE, KY, MA, MD, ME, NC, NH, NJ, NY, PA, RI, SC, VA, VT, WV
Properties in the “West” region are located in: AK, AZ, CA, CO, HI, ID, MT, NM, NV, OR, UT, WA, WY
Properties in the “South” region are located in: AL, AR, FL, GA, LA, MS, OK, TN, TX
Properties in the “Midwest” region are located in: IA, IL, IN, KS, MI, MN, MO, ND, NE, OH, SD, WI
Note 4—Assets and Liabilities Measured at Fair Value on a Recurring Basis
Valuation Hierarchy: The Account’s fair value measurements are grouped categorically into three levels, as defined by the FASB. The levels are defined as follows:
Level 1—Valuations using unadjusted quoted prices for assets traded in active markets, such as stocks listed on the New York Stock Exchange. Active markets are defined as having the following characteristics for the measured asset or liability: (i) many transactions, (ii) current prices, (iii) price quotes not varying substantially among market makers, (iv) narrow bid/ask spreads and (v) most information regarding the issuer is publicly available. Level 1 assets held by the Account are generally marketable equity securities.
Level 2—Valuations for assets and liabilities traded in less active, dealer or broker markets. Fair values are primarily obtained from third party pricing services for identical or comparable assets or liabilities. Level 2 inputs for fair value measurements are inputs, other than quoted prices included within Level 1, that are observable for the asset or liability, either directly or indirectly. Level 2 inputs include:
a. Quoted prices for similar assets or liabilities in active markets;
b. Quoted prices for identical or similar assets or liabilities in markets that are not active (that is, markets in which there are few transactions for the asset (or liability), the prices are not current, price quotations vary substantially either over time or among market makers (for example, some brokered markets), or in which little information is released publicly);
c. Inputs other than quoted prices that are observable within the market for the asset (or liability) (for example, interest rates and yield curves, implied volatilities, prepayment speeds, loss severities, credit risks, and default rates that are observable at commonly quoted intervals); and
d. Inputs that are derived principally from or corroborated by observable market data by correlation or other means (for example, market-corroborated inputs).
Examples of securities which may be held by the Account and included in Level 2 include certificates of deposit, commercial paper, government agency notes, variable notes, United States Treasury securities, and debt securities.
14
Level 3—Valuations for assets and liabilities that are derived from other valuation methodologies, including pricing models, discounted cash flow models and similar techniques, and are not based on market exchange, dealer, or broker-traded transactions. Level 3 valuations incorporate certain assumptions and projections that are not observable in the market, and require significant professional judgment in determining the fair value assigned to such assets or liabilities. Examples of Level 3 assets and liabilities which may be held by the Account from time to time include investments in real estate, investments in joint ventures and limited partnerships, and loans receivable and payable.
An investment’s categorization within the valuation hierarchy described above is based upon the lowest level of input that is significant to the fair value measurement.
The Account’s determination of fair value is based upon quoted market prices, where available. If listed prices or quotes are not available, fair value is based upon vendor-provided, evaluated prices or internally developed models that primarily use market-based or independently sourced market data, including interest rate yield curves, market spreads, and currency rates. Valuation adjustments will be made to reflect changes in credit quality, counterparty’s creditworthiness, the Account’s creditworthiness, liquidity, and other observable and unobservable inputs that are applied consistently over time.
The methods described above are considered to produce fair values that represent a good faith estimate of what an unaffiliated buyer in the marketplace would pay to purchase the asset or would receive to transfer the liability. Since fair value calculations involve significant professional judgment in the application of both observable and unobservable attributes, actual realizable values or future fair values may differ from amounts reported. Furthermore, while the Account believes its valuation methods are appropriate and consistent with other market participants, the use of different methodologies or assumptions to determine the fair value of certain financial instruments, while reasonable, could result in different estimates of fair value at the reporting date. As discussed in Note 1—Organization and Significant Accounting Policies in more detail, the Account generally obtains independent third party appraisals on a quarterly basis; there may be circumstances in the interim in which the true realizable value of a property is not reflected in the Account’s daily net asset value calculation or in the Account’s periodic consolidated financial statements. This disparity may be more apparent when the commercial and/or residential real estate markets experience an overall and possibly dramatic decline (or increase) in property values in a relatively short period of time between appraisals.
The following tables show the major categories of assets and liabilities measured at fair value on a recurring basis as of September 30, 2015 (unaudited) and December 31, 2014, using unadjusted quoted prices in active markets for identical assets (Level 1); significant other observable inputs (Level 2); and significant unobservable inputs (Level 3) (in millions):
|
|
|
|
|
|
|
|
|
||||||||||||||||||||
|
Description |
Level 1: |
Level 2: |
Level 3: |
Total at |
||||||||||||||||||||||||
|
Real estate properties |
|
|
$ |
|
— |
|
|
$ |
|
— |
|
|
$ |
|
14,213.5 |
|
|
14,213.5 |
||||||||||
|
Real estate joint ventures |
|
|
— |
|
|
— |
|
|
3,474.6 |
|
|
3,474.6 |
||||||||||||||||
|
Limited partnerships |
|
|
— |
|
|
— |
|
|
148.1 |
|
|
148.1 |
||||||||||||||||
|
Marketable securities: |
|
|
|
|
|
|
|
|
||||||||||||||||||||
|
Real estate related |
|
|
1,690.5 |
|
|
— |
|
|
— |
|
|
1,690.5 |
||||||||||||||||
|
Commerical paper |
|
|
— |
|
|
448.1 |
|
|
— |
|
|
448.1 |
||||||||||||||||
|
Government agency notes |
|
|
— |
|
|
2,102.2 |
|
|
— |
|
|
2,102.2 |
||||||||||||||||
|
United States Treasury securities |
|
|
— |
|
|
1,343.5 |
|
|
— |
|
|
1,343.5 |
||||||||||||||||
|
Loan receivable |
|
|
— |
|
|
— |
|
|
100.1 |
|
|
100.1 |
||||||||||||||||
|
|
|
|
|
|
|
|
|
|
||||||||||||||||||||
|
Total Investments at September 30, 2015 |
|
|
$ |
|
1,690.5 |
|
|
$ |
|
3,893.8 |
|
|
$ |
|
17,936.3 |
|
|
$ |
|
23,520.6 |
||||||||
|
|
|
|
|
|
|
|
|
|
||||||||||||||||||||
|
Mortgage loans payable |
|
|
$ |
|
— |
|
|
$ |
|
— |
|
|
$ |
|
(1,831.7 |
) |
|
|
|
$ |
|
(1,831.7 |
) |
|
||||
|
|
|
|
|
|
|
|
|
|
||||||||||||||||||||
15
|
|
|
|
|
|
|
|
|
||||||||||||||||||||
|
Description |
Level 1: |
Level 2: |
Level 3: |
Total at |
||||||||||||||||||||||||
|
Real estate properties |
|
|
$ |
|
— |
|
|
$ |
|
— |
|
|
$ |
|
13,139.0 |
|
|
$ |
|
13,139.0 |
||||||||
|
Real estate joint ventures |
|
|
— |
|
|
— |
|
|
3,022.1 |
|
|
3,022.1 |
||||||||||||||||
|
Limited partnerships |
|
|
— |
|
|
— |
|
|
357.5 |
|
|
357.5 |
||||||||||||||||
|
Marketable securities: |
|
|
|
|
|
|
|
|
||||||||||||||||||||
|
Real estate related |
|
|
1,818.4 |
|
|
— |
|
|
— |
|
|
1,818.4 |
||||||||||||||||
|
Government agency notes |
|
|
— |
|
|
2,369.9 |
|
|
— |
|
|
2,369.9 |
||||||||||||||||
|
United States Treasury securities |
|
|
— |
|
|
1,461.2 |
|
|
— |
|
|
1,461.2 |
||||||||||||||||
|
|
|
|
|
|
|
|
|
|
||||||||||||||||||||
|
Total Investments at December 31, 2014 |
|
|
$ |
|
1,818.4 |
|
|
$ |
|
3,831.1 |
|
|
$ |
|
16,518.6 |
|
|
$ |
|
22,168.1 |
||||||||
|
|
|
|
|
|
|
|
|
|
||||||||||||||||||||
|
Mortgage loans payable |
|
|
$ |
|
— |
|
|
$ |
|
— |
|
|
$ |
|
(2,373.8 |
) |
|
|
|
$ |
|
(2,373.8 |
) |
|
||||
|
|
|
|
|
|
|
|
|
|
||||||||||||||||||||
The following tables show the reconciliation of the beginning and ending balances for assets and liabilities measured at fair value on a recurring basis using significant unobservable inputs (Level 3) during the three and nine months ended September 30, 2015 and 2014 (in millions, unaudited):
|
|
|
|
|
|
|
|
|
|
|
|
|
||||||||||||||||||||||||||||||
|
|
Real Estate |
Real Estate |
Limited |
Loan |
Total |
Mortgage |
||||||||||||||||||||||||||||||||||||
|
For the three months ended September 30, 2015 |
|
|
|
|
|
|
|
|
|
|
|
|
||||||||||||||||||||||||||||||
|
Beginning balance July 1, 2015 |
|
|
$ |
|
13,684.9 |
|
|
$ |
|
3,256.3 |
|
|
$ |
|
139.9 |
|
|
$ |
|
— |
|
|
$ |
|
17,081.1 |
|
|
$ |
|
(1,996.3 |
) |
|
||||||||||
|
Total realized and unrealized gains included in changes in net assets |
|
|
166.5 |
|
|
95.0 |
|
|
10.5 |
|
|
0.1 |
|
|
272.1 |
|
|
11.4 |
||||||||||||||||||||||||
|
Purchases(1) |
|
|
362.1 |
|
|
123.6 |
|
|
0.7 |
|
|
100.0 |
|
|
586.4 |
|
|
— |
||||||||||||||||||||||||
|
Sales |
|
|
— |
|
|
— |
|
|
— |
|
|
— |
|
|
— |
|
|
— |
||||||||||||||||||||||||
|
Settlements(2) |
|
|
— |
|
|
(0.3 |
) |
|
|
|
(3.0 |
) |
|
|
|
— |
|
|
(3.3 |
) |
|
|
|
153.2 |
||||||||||||||||||
|
|
|
|
|
|
|
|
|
|
|
|
|
|
||||||||||||||||||||||||||||||
|
Ending balance September 30, 2015 |
|
|
$ |
|
14,213.5 |
|
|
$ |
|
3,474.6 |
|
|
$ |
|
148.1 |
|
|
$ |
|
100.1 |
|
|
$ |
|
17,936.3 |
|
|
$ |
|
(1,831.7 |
) |
|
||||||||||
|
|
|
|
|
|
|
|
|
|
|
|
|
|
||||||||||||||||||||||||||||||
|
|
|
|
|
|
|
|
|
|
|
|
|
||||||||||||||||||||||||||||||
|
|
Real Estate |
Real Estate |
Limited |
Loan |
Total |
Mortgage |
||||||||||||||||||||||||||||||||||||
|
For the nine months ended September 30, 2015 |
|
|
|
|
|
|
|
|
|
|
|
|
||||||||||||||||||||||||||||||
|
Beginning balance January 1, 2015 |
|
|
$ |
|
13,139.0 |
|
|
$ |
|
3,022.1 |
|
|
$ |
|
357.5 |
|
|
$ |
|
— |
|
|
$ |
|
16,518.6 |
|
|
$ |
|
(2,373.8 |
) |
|
||||||||||
|
Total realized and unrealized gains included in changes in net assets |
|
|
624.6 |
|
|
376.3 |
|
|
38.9 |
|
|
0.1 |
|
|
1,039.9 |
|
|
3.5 |
||||||||||||||||||||||||
|
Purchases(1) |
|
|
1,071.3 |
|
|
137.3 |
|
|
101.4 |
|
|
100.0 |
|
|
1,410.0 |
|
|
— |
||||||||||||||||||||||||
|
Sales |
|
|
(621.4 |
) |
|
|
|
— |
|
|
— |
|
|
— |
|
|
(621.4 |
) |
|
|
|
— |
||||||||||||||||||||
|
Settlements(2) |
|
|
— |
|
|
(61.1 |
) |
|
|
|
(349.7 |
) |
|
|
|
— |
|
|
(410.8 |
) |
|
|
|
538.6 |
||||||||||||||||||
|
|
|
|
|
|
|
|
|
|
|
|
|
|
||||||||||||||||||||||||||||||
|
Ending balance September 30, 2015 |
|
|
$ |
|
14,213.5 |
|
|
$ |
|
3,474.6 |
|
|
$ |
|
148.1 |
|
|
$ |
|
100.1 |
|
|
$ |
|
17,936.3 |
|
|
$ |
|
(1,831.7 |
) |
|
||||||||||
|
|
|
|
|
|
|
|
|
|
|
|
|
|
||||||||||||||||||||||||||||||
16
|
|
|
|
|
|
|
|
|
|
|
|||||||||||||||||||||||||
|
|
Real Estate |
Real Estate |
Limited |
Total |
Mortgage |
||||||||||||||||||||||||||||||
|
For the three months ended September 30, 2014 |
|
|
|
|
|
|
|
|
|
|
|||||||||||||||||||||||||
|
Beginning balance July 1, 2014 |
|
|
$ |
|
13,040.8 |
|
|
$ |
|
2,660.8 |
|
|
$ |
|
366.6 |
|
|
$ |
|
16,068.2 |
|
|
$ |
|
(2,191.8 |
) |
|
||||||||
|
Total realized and unrealized gains (losses) included in changes in net assets |
|
|
325.0 |
|
|
49.9 |
|
|
7.4 |
|
|
382.3 |
|
|
(26.2 |
) |
|
||||||||||||||||||
|
Purchases(1) |
|
|
88.8 |
|
|
184.3 |
|
|
— |
|
|
273.1 |
|
|
(137.5 |
) |
|
||||||||||||||||||
|
Sales |
|
|
(248.6 |
) |
|
|
|
— |
|
|
— |
|
|
(248.6 |
) |
|
|
|
— |
||||||||||||||||
|
Settlements(2) |
|
|
— |
|
|
(0.3 |
) |
|
|
|
(0.8 |
) |
|
|
|
(1.1 |
) |
|
|
|
0.7 |
||||||||||||||
|
|
|
|
|
|
|
|
|
|
|
|
|||||||||||||||||||||||||
|
Ending balance September 30, 2014 |
|
|
$ |
|
13,206.0 |
|
|
$ |
|
2,894.7 |
|
|
$ |
|
373.2 |
|
|
$ |
|
16,473.9 |
|
|
$ |
|
(2,354.8 |
) |
|
||||||||
|
|
|
|
|
|
|
|
|
|
|
|
|||||||||||||||||||||||||
|
|
|
|
|
|
|
|
|
|
|
|||||||||||||||||||||||||
|
|
Real Estate |
Real Estate |
Limited |
Total |
Mortgage |
||||||||||||||||||||||||||||||
|
For the nine months ended September 30, 2014 |
|
|
|
|
|
|
|
|
|
|
|||||||||||||||||||||||||
|
Beginning balance January 1, 2014 |
|
|
$ |
|
11,565.1 |
|
|
$ |
|
2,563.6 |
|
|
$ |
|
362.0 |
|
|
$ |
|
14,490.7 |
|
|
$ |
|
(2,279.1 |
) |
|
||||||||
|
Total realized and unrealized gains (losses) included in changes in net assets |
|
|
720.5 |
|
|
192.2 |
|
|
17.3 |
|
|
930.0 |
|
|
(52.8 |
) |
|
||||||||||||||||||
|
Purchases(1) |
|
|
1,214.4 |
|
|
221.4 |
|
|
— |
|
|
1,435.8 |
|
|
(137.5 |
) |
|
||||||||||||||||||
|
Sales |
|
|
(294.0 |
) |
|
|
|
— |
|
|
— |
|
|
(294.0 |
) |
|
|
|
— |
||||||||||||||||
|
Settlements(2) |
|
|
— |
|
|
(82.5 |
) |
|
|
|
(6.1 |
) |
|
|
|
(88.6 |
) |
|
|
|
114.6 |
||||||||||||||
|
|
|
|
|
|
|
|
|
|
|
|
|||||||||||||||||||||||||
|
Ending balance September 30, 2014 |
|
|
$ |
|
13,206.0 |
|
|
$ |
|
2,894.7 |
|
|
$ |
|
373.2 |
|
|
$ |
|
16,473.9 |
|
|
$ |
|
(2,354.8 |
) |
|
||||||||
|
|
|
|
|
|
|
|
|
|
|
|
|||||||||||||||||||||||||
(1) |
Includes purchases, contributions for joint ventures and limited partnerships, capital expenditures, and lending for mortgage loans receivable. |
|||||||||||||||||||||||||||||||||||||||||||||||||||||||||||||||||||||||||||||||||||||||||||||||||
(2) |
Includes operating income for real estate joint ventures and limited partnerships, net of distributions, and principal payments and extinguishments of mortgage loans payable. |
|||||||||||||||||||||||||||||||||||||||||||||||||||||||||||||||||||||||||||||||||||||||||||||||||
17
The following table shows quantitative information about unobservable inputs related to the Level 3 fair value measurements as of September 30, 2015 (unaudited).
|
|
|
|
|
|
|
|
|
Type |
Asset Class |
Valuation |
Unobservable |
Range (Weighted Average) |
||||
|
||||||||
Real Estate Properties and Joint Ventures |
Office |
Income Approach—Discounted Cash Flow |
Discount Rate |
6.0% - 8.3% (6.5%) |
||||
|
|
|||||||
|
|
|
Income Approach—Direct Capitalization |
Overall Capitalization Rate |
3.8% - 7.3% (4.7%) |
|||
|
|
|
||||||
|
Industrial |
Income Approach—Discounted Cash Flow |
Discount Rate |
5.7% - 8.8% (6.8%) |
||||
|
|
|||||||
|
|
|
Income Approach—Direct Capitalization |
Overall Capitalization Rate |
4.0% - 6.2% (5.1%) |
|||
|
|
|
||||||
|
Apartment |
Income Approach—Discounted Cash Flow |
Discount Rate |
5.3% - 7.5% (6.2%) |
||||
|
|
|||||||
|
|
|
Income Approach—Direct Capitalization |
Overall Capitalization Rate |
3.3% - 5.3% (4.1%) |
|||
|
|
|
||||||
|
Retail |
Income Approach—Discounted Cash Flow |
Discount Rate |
5.0% - 10.4% (6.9%) |
||||
|
|
|||||||
|
|
|
Income Approach—Direct Capitalization |
Overall Capitalization Rate |
4.3% - 8.5% (5.4%) |
|||
|
||||||||
Mortgage Loans Payable |
Office and |
Discounted Cash Flow |
Loan to Value Ratio |
32.3% - 47.3% (40.8%) |
||||
|
|
|||||||
|
|
|
Net Present Value |
Loan to Value Ratio |
32.3% - 47.3% (40.8%) |
|||
|
|
|
||||||
|
Apartment |
Discounted Cash Flow |
Loan to Value Ratio |
31.6% - 63.5% (44.3%) |
||||
|
|
|||||||
|
|
|
Net Present Value |
Loan to Value Ratio |
31.6% - 63.5% (44.3%) |
|||
|
|
|
||||||
|
Retail |
Discounted Cash Flow |
Loan to Value Ratio |
21.5% - 48.1% (38.3%) |
||||
|
|
|||||||
|
|
|
Net Present Value |
Loan to Value Ratio |
21.5% - 48.1% (38.3%) |
|||
|
||||||||
Loan Receivable |
Office |
Discounted Cash Flow |
Loan to Value Ratio |
76.1% (76.1%) |
||||
|
||||||||
Real Estate Properties and Joint Ventures: The significant unobservable inputs used in the fair value measurement of the Account’s real estate property and joint venture investments are the selection of certain investment rates (Discount Rate, Terminal Capitalization Rate, and Overall Capitalization Rate). Significant increases (decreases) in any of those inputs in isolation would result in significantly lower (higher) fair value measurements, respectively.
Mortgage Loans Payable: The significant unobservable inputs used in the fair value measurement of the Account’s mortgage loans payable are the loan to value ratios and the selection of certain credit spreads and weighted average cost of capital risk premiums. Significant increases (decreases) in any of those inputs in isolation would result in a significantly lower (higher) fair value, respectively.
Loans Receivable: The significant unobservable inputs used in the fair value measurement of the Account’s loans receivable are the loan to value ratios and the selection of certain credit spreads. Significant increases (decreases) in any of those inputs in isolation would result in a significantly lower (higher) fair value, respectively.
During the nine months ended September 30, 2015 and 2014, there were no transfers between Levels 1, 2 or 3.
The amount of total net unrealized gains (losses) included in changes in net assets attributable to the change in net unrealized gains (losses) relating to Level 3 investments and mortgage loans payable using significant unobservable inputs still held as of the reporting date is as follows (in millions, unaudited):
18
|
|
|
|
|
|
|
|
|
|
|
|
|
||||||||||||||||||||||||||||||
|
|
Real Estate |
Real Estate |
Limited |
Mortgage |
Total |
Mortgage |
||||||||||||||||||||||||||||||||||||
|
For the three months ended September 30, 2015 |
|
|
$ |
|
166.5 |
|
|
$ |
|
95.1 |
|
|
$ |
|
10.5 |
|
|
$ |
|
0.1 |
|
|
$ |
|
272.2 |
|
|
$ |
|
11.4 |
||||||||||||
|
|
|
|
|
|
|
|
|
|
|
|
|
|
||||||||||||||||||||||||||||||
|
For the nine months ended September 30, 2015 |
|
|
$ |
|
640.7 |
|
|
$ |
|
378.5 |
|
|
$ |
|
11.2 |
|
|
$ |
|
0.1 |
|
|
$ |
|
1,030.5 |
|
|
$ |
|
3.5 |
||||||||||||
|
|
|
|
|
|
|
|
|
|
|
|
|
|
||||||||||||||||||||||||||||||
|
For the three months ended September 30, 2014 |
|
|
$ |
|
329.5 |
|
|
$ |
|
49.9 |
|
|
$ |
|
7.4 |
|
|
$ |
|
— |
|
|
$ |
|
386.8 |
|
|
$ |
|
(26.2 |
) |
|
||||||||||
|
|
|
|
|
|
|
|
|
|
|
|
|
|
||||||||||||||||||||||||||||||
|
For the nine months ended September 30, 2014 |
|
|
$ |
|
727.9 |
|
|
$ |
|
192.1 |
|
|
$ |
|
21.7 |
|
|
$ |
|
— |
|
|
$ |
|
941.7 |
|
|
$ |
|
(52.8 |
) |
|
||||||||||
|
|
|
|
|
|
|
|
|
|
|
|
|
|
||||||||||||||||||||||||||||||
Note 5—Mortgage Loans Payable
The Account had outstanding mortgage loans payable secured by the following properties (in millions):
|
|
|
|
|
|
|
|
|
|||||||||||||||
Property |
Interest Rate and |
Principal |
Maturity |
||||||||||||||||||||
September 30, |
December 31, |
||||||||||||||||||||||
|
|
|
|
(Unaudited) |
|
|
|
|
||||||||||||||||
|
99 High Street(4) |
5.52% paid monthly |
|
|
$ |
|
— |
|
|
$ |
|
185.0 |
|
|
November 11, 2015 |
|||||||||
|
Lincoln Centre(10) |
5.51% paid monthly |
|
|
— |
|
|
153.0 |
|
|
February 1, 2016 |
|||||||||||||
|
Charleston Plaza(1)(5) |
5.60% paid monthly |
|
|
34.9 |
|
|
35.5 |
|
|
September 11, 2016 |
|||||||||||||
|
The Legend at Kierland(5)(6) |
4.97% paid monthly |
|
|
21.8 |
|
|
21.8 |
|
|
August 1, 2017 |
|||||||||||||
|
The Tradition at Kierland(5)(6) |
4.97% paid monthly |
|
|
25.8 |
|
|
25.8 |
|
|
August 1, 2017 |
|||||||||||||
|
Mass Court(5) |
2.88% paid monthly |
|
|
92.6 |
|
|
92.6 |
|
|
September 1, 2019 |
|||||||||||||
|
Red Canyon at Palomino Park(5)(7) |
5.34% paid monthly |
|
|
27.1 |
|
|
27.1 |
|
|
August 1, 2020 |
|||||||||||||
|
Green River at Palomino Park(5)(7) |
5.34% paid monthly |
|
|
33.2 |
|
|
33.2 |
|
|
August 1, 2020 |
|||||||||||||
|
Blue Ridge at Palomino Park(5)(7) |
5.34% paid monthly |
|
|
33.4 |
|
|
33.4 |
|
|
August 1, 2020 |
|||||||||||||
|
Ashford Meadows(5) |
5.17% paid monthly |
|
|
44.6 |
|
|
44.6 |
|
|
August 1, 2020 |
|||||||||||||
|
The Corner(5) |
4.66% paid monthly |
|
|
105.0 |
|
|
105.0 |
|
|
June 1, 2021 |
|||||||||||||
|
The Palatine(5) |
4.25% paid monthly |
|
|
80.0 |
|
|
80.0 |
|
|
January 10, 2022 |
|||||||||||||
|
The Forum at Carlsbad(5) |
4.25% paid monthly |
|
|
90.0 |
|
|
90.0 |
|
|
March 1, 2022 |
|||||||||||||
|
The Colorado(5) |
3.69% paid monthly |
|
|
91.7 |
|
|
91.7 |
|
|
November 1, 2022 |
|||||||||||||
|
The Legacy at Westwood(5) |
3.69% paid monthly |
|
|
46.7 |
|
|
46.7 |
|
|
November 1, 2022 |
|||||||||||||
|
Regents Court(5) |
3.69% paid monthly |
|
|
39.6 |
|
|
39.6 |
|
|
November 1, 2022 |
|||||||||||||
|
The Caruth(5) |
3.69% paid monthly |
|
|
45.0 |
|
|
45.0 |
|
|
November 1, 2022 |
|||||||||||||
|
Fourth & Madison(5) |
3.75% paid monthly |
|
|
200.0 |
|
|
200.0 |
|
|
June 1, 2023 |
|||||||||||||
|
1001 Pennsylvania Avenue |
3.70% paid monthly |
|
|
330.0 |
|
|
330.0 |
|
|
June 1, 2023 |
|||||||||||||
|
50 Fremont Street(5)(9) |
3.75% paid monthly |
|
|
— |
|
|
200.0 |
|
|
June 1, 2023 |
|||||||||||||
|
1401 H Street NW(5) |
3.65% paid monthly |
|
|
115.0 |
|
|
115.0 |
|
|
November 5, 2024 |
|||||||||||||
|
780 Third Avenue(5) |
3.55% paid monthly |
|
|
150.0 |
|
|
150.0 |
|
|
August 1, 2025 |
|||||||||||||
|
780 Third Avenue(5) |
3.55% paid monthly |
|
|
20.0 |
|
|
20.0 |
|
|
August 1, 2025 |
|||||||||||||
|
55 Second Street(5)(8) |
3.74% paid monthly |
|
|
137.5 |
|
|
137.5 |
|
|
October 1, 2026 |
|||||||||||||
|
Publix at Weston Commons(5) |
5.08% paid monthly |
|
|
35.0 |
|
|
35.0 |
|
|
January 1, 2036 |
|||||||||||||
|
|
|
|
|
|
|
|
|||||||||||||||||
|
Total Principal Outstanding |
|
|
|
|
$ |
|
1,798.9 |
|
|
$ |
|
2,337.5 |
|
|
|||||||||
|
Fair Value Adjustment(3) |
|
|
|
|
32.8 |
|
|
36.3 |
|
|
|||||||||||||
|
|
|
|
|
|
|
|
|||||||||||||||||
|
Total mortgage loans payable |
|
|
|
|
$ |
|
1,831.7 |
|
|
$ |
|
2,373.8 |
|
|
|||||||||
|
|
|
|
|
|
|
|
|||||||||||||||||
(1) |
The mortgage is adjusted monthly for principal payments. |
|||||||||||||||||||||||||||||||||||||||||||||||||||||||||||||||||||||||||||||||||||||||||||||||||
(2) |
Interest rates are fixed, unless stated otherwise. |
|||||||||||||||||||||||||||||||||||||||||||||||||||||||||||||||||||||||||||||||||||||||||||||||||
(3) |
The fair value adjustment consists of the difference (positive or negative) between the principal amount of the outstanding debt and the fair value of the outstanding debt. See Note 1- Organization and Significant Accounting Policies. |
|||||||||||||||||||||||||||||||||||||||||||||||||||||||||||||||||||||||||||||||||||||||||||||||||
(4) |
Mortgage loan was paid off on May 11, 2015. |
|||||||||||||||||||||||||||||||||||||||||||||||||||||||||||||||||||||||||||||||||||||||||||||||||
19
(5) |
These properties are each owned by separate wholly owned subsidiaries of TIAA for benefit of the Account. The assets and credit of each of these borrowings entities are not available to satisfy the debts and other obligations of the Account or any other entity or person other than such borrowing entity. |
|||||||||||||||||||||||||||||||||||||||||||||||||||||||||||||||||||||||||||||||||||||||||||||||||
(6) |
Represents mortgage loans on these individual properties which are held within the Kierland Apartment portfolio. |
|||||||||||||||||||||||||||||||||||||||||||||||||||||||||||||||||||||||||||||||||||||||||||||||||
(7) |
Represents mortgage loans on these individual properties which are held within Palomino Park portfolio. |
|||||||||||||||||||||||||||||||||||||||||||||||||||||||||||||||||||||||||||||||||||||||||||||||||
(8) |
This mortgage is comprised of three individual loans all with equal recourse against the borrowing entity, interest rate and maturity. The principal balances by loan are $79.0 million, $45.0 million and $13.5 million. |
|||||||||||||||||||||||||||||||||||||||||||||||||||||||||||||||||||||||||||||||||||||||||||||||||
(9) |
This property was sold on February 12, 2015. |
|||||||||||||||||||||||||||||||||||||||||||||||||||||||||||||||||||||||||||||||||||||||||||||||||
(10) |
Mortgage loan was paid off on August 5, 2015. |
|||||||||||||||||||||||||||||||||||||||||||||||||||||||||||||||||||||||||||||||||||||||||||||||||
Note 6—Financial Highlights
Selected condensed financial information for an Accumulation Unit of the Account is presented below. Per Accumulation Unit data is calculated on average units outstanding.
|
|
|
|
|
|
|
|
|
||||||||||||||||||||
|
|
For the Nine |
Years Ended December 31, |
||||||||||||||||||||||||||
2014 |
2013 |
2012 |
||||||||||||||||||||||||||
|
|
(Unaudited) |
|
|
|
|
|
|
|||||||||||||||||||||
|
Per Accumulation Unit data: |
|
|
|
|
|
|
|
|
||||||||||||||||||||
|
Rental income |
|
|
$ |
|
11.523 |
|
|
$ |
|
15.862 |
|
|
$ |
|
15.313 |
|
|
$ |
|
16.345 |
||||||||
|
Real estate property level expenses and taxes |
|
|
5.545 |
|
|
7.788 |
|
|
8.112 |
|
|
9.059 |
||||||||||||||||
|
|
|
|
|
|
|
|
|
|
||||||||||||||||||||
|
Real estate income, net |
|
|
5.978 |
|
|
8.074 |
|
|
7.201 |
|
|
7.286 |
||||||||||||||||
|
Other income |
|
|
2.487 |
|
|
3.459 |
|
|
2.759 |
|
|
2.178 |
||||||||||||||||
|
|
|
|
|
|
|
|
|
|
||||||||||||||||||||
|
Total income |
|
|
8.465 |
|
|
11.533 |
|
|
9.960 |
|
|
9.464 |
||||||||||||||||
|
Expense charges(1) |
|
|
2.254 |
|
|
2.880 |
|
|
2.672 |
|
|
2.562 |
||||||||||||||||
|
|
|
|
|
|
|
|
|
|
||||||||||||||||||||
|
Investment income, net |
|
|
6.211 |
|
|
8.653 |
|
|
7.288 |
|
|
6.902 |
||||||||||||||||
|
Net realized and unrealized gain on investments and mortgage loans payable |
|
|
15.361 |
|
|
27.868 |
|
|
19.015 |
|
|
18.013 |
||||||||||||||||
|
|
|
|
|
|
|
|
|
|
||||||||||||||||||||
|
Net increase in Accumulation Unit Value |
|
|
21.572 |
|
|
36.521 |
|
|
26.303 |
|
|
24.915 |
||||||||||||||||
|
Accumulation Unit Value: |
|
|
|
|
|
|
|
|
||||||||||||||||||||
|
Beginning of period |
|
|
335.393 |
|
|
298.872 |
|
|
272.569 |
|
|
247.654 |
||||||||||||||||
|
|
|
|
|
|
|
|
|
|
||||||||||||||||||||
|
End of period |
|
|
$ |
|
356.965 |
|
|
$ |
|
335.393 |
|
|
$ |
|
298.872 |
|
|
$ |
|
272.569 |
||||||||
|
|
|
|
|
|
|
|
|
|
||||||||||||||||||||
|
Total return |
|
|
6.43% |
|
|
12.22% |
|
|
9.65% |
|
|
10.06% |
||||||||||||||||
|
Ratios to Average net Assets(2): |
|
|
|
|
|
|
|
|
||||||||||||||||||||
|
Expenses(1) |
|
|
0.85% |
|
|
0.89% |
|
|
0.92% |
|
|
0.95% |
||||||||||||||||
|
Investment income, net |
|
|
2.34% |
|
|
2.68% |
|
|
2.50% |
|
|
2.55% |
||||||||||||||||
|
Portfolio turnover rate(3): |
|
|
|
|
|
|
|
|
||||||||||||||||||||
|
Real estate properties(4) |
|
|
4.8% |
|
|
6.5% |
|
|
2.1% |
|
|
10.2% |
||||||||||||||||
|
Marketable securities(5) |
|
|
7.2% |
|
|
15.9% |
|
|
8.4% |
|
|
21.9% |
||||||||||||||||
|
Accumulation Units outstanding at end of period (in millions) |
|
|
59.5 |
|
|
57.9 |
|
|
55.3 |
|
|
53.3 |
||||||||||||||||
|
Net assets end of period (in millions) |
|
|
$ |
|
21,694.5 |
|
|
$ |
|
19,829.0 |
|
|
$ |
|
16,907.9 |
|
|
$ |
|
14,861.1 |
||||||||
(1) |
Expense charges per Accumulation Unit and the Ratio of Expenses to average net assets reflect the year to date Account-level expenses and exclude real estate property level expenses which are included in real estate income, net. |
|||||||||||||||||||||||||||||||||||||||||||||||||||||||||||||||||||||||||||||||||||||||||||||||||
(2) |
Percentages for the nine months ended September 30, 2015 are annualized. |
|||||||||||||||||||||||||||||||||||||||||||||||||||||||||||||||||||||||||||||||||||||||||||||||||
(3) |
Percentages for the nine months ended September 30, 2015 are not annualized. |
|||||||||||||||||||||||||||||||||||||||||||||||||||||||||||||||||||||||||||||||||||||||||||||||||
(4) |
Real estate investment portfolio turnover rate is calculated by dividing the lesser of purchases or sales of real estate property investments (including loans receivable, contributions to, or return of capital distributions received from, existing joint venture and limited partnership investments) by the average value of the portfolio of real estate investments held during the period. |
|||||||||||||||||||||||||||||||||||||||||||||||||||||||||||||||||||||||||||||||||||||||||||||||||
(5) |
Marketable securities portfolio turnover rate is calculated by dividing the lesser of purchases or sales of securities, excluding securities having maturity dates at acquisition of one year or less, by the average value of the portfolio securities held during the period. |
|||||||||||||||||||||||||||||||||||||||||||||||||||||||||||||||||||||||||||||||||||||||||||||||||
20
Note 7—Accumulation Units
Changes in the number of Accumulation Units outstanding were as follows (in millions):
|
|
|
|
|
||||||||||
|
|
For the |
For the Year Ended |
||||||||||||
|
|
(Unaudited) |
|
|
|||||||||||
|
Outstanding: |
|
|
|
|
||||||||||
|
Beginning of period |
|
|
57.9 |
|
|
55.3 |
||||||||
|
Credited for premiums |
|
|
5.9 |
|
|
7.7 |
||||||||
|
Annuity, other periodic payments, withdrawals and death benefits |
|
|
(4.3 |
) |
|
|
|
(5.1 |
) |
|
||||
|
|
|
|
|
|
||||||||||
|
End of period |
|
|
59.5 |
|
|
57.9 |
||||||||
|
|
|
|
|
|
||||||||||
Note 8—Commitments and Contingencies
Commitments—The Account had $0.2 million of outstanding immediately callable commitments to purchase additional interests in the Heitman Value Partners Fund, which is in dissolution. Currently, there is no expectation the limited partnership will call the remaining commitment.
Contingencies—The Account is party to various claims and routine litigation arising in the ordinary course of business. Management of the Account does not believe the results of any such claims or litigation, individually, or in the aggregate, will have a material effect on the Account’s business, financial position, or results of operations.
Note 9—Subsequent Events
Marketable Securities
In October 2015, the Account sold approximately $500 million of real estate-related securities.
21
TIAA REAL ESTATE ACCOUNT
CONSOLIDATED SCHEDULES OF INVESTMENTS
(Dollar values shown in millions)
REAL ESTATE PROPERTIES—60.4% and 59.3%
|
|
|
|
|
|
|
||||||||||
Location/Description |
Type |
Fair Value |
||||||||||||||
September 30, |
December 31, |
|||||||||||||||
|
|
|
|
(Unaudited) |
|
|
|||||||||||
|
Arizona: |
|
|
|
|
|
|
||||||||||
|
Camelback Center |
Office |
|
|
$ |
|
51.1 |
|
|
$ |
|
44.5 |
|||||
|
Kierland Apartment Portfolio |
Apartments |
|
|
126.0 |
(1) |
|
|
|
118.1 |
(1) |
|
|||||
|
California: |
|
|
|
|
|
|
||||||||||
|
3 Hutton Centre Drive |
Office |
|
|
52.0 |
|
|
45.5 |
|||||||||
|
50 Fremont Street(6) |
Office |
|
|
— |
|
|
637.6 |
(1) |
|
|||||||
|
55 Second Street |
Office |
|
|
332.7 |
(1) |
|
|
|
292.2 |
(1) |
|
|||||
|
88 Kearny Street |
Office |
|
|
155.3 |
|
|
130.7 |
|||||||||
|
200 Middlefield Road |
Office |
|
|
54.4 |
|
|
51.0 |
|||||||||
|
Centre Pointe and Valley View |
Industrial |
|
|
39.9 |
|
|
36.3 |
|||||||||
|
Cerritos Industrial Park |
Industrial |
|
|
105.6 |
|
|
98.5 |
|||||||||
|
Charleston Plaza |
Retail |
|
|
89.0 |
(1) |
|
|
|
82.0 |
(1) |
|
|||||
|
Great West Industrial Portfolio |
Industrial |
|
|
156.2 |
|
|
128.8 |
|||||||||
|
Holly Street Village |
Apartments |
|
|
129.1 |
|
|
128.3 |
|||||||||
|
Larkspur Courts |
Apartments |
|
|
135.5 |
|
|
131.6 |
|||||||||
|
Northern CA RA Industrial Portfolio |
Industrial |
|
|
66.3 |
|
|
56.7 |
|||||||||
|
Northpark Village Square |
Retail |
|
|
47.6 |
|
|
45.2 |
|||||||||
|
Oakmont IE West Industrial Portfolio |
Industrial |
|
|
43.5 |
|
|
— |
|||||||||
|
Oceano at Warner Center |
Apartments |
|
|
81.5 |
|
|
81.4 |
|||||||||
|
Ontario Industrial Portfolio |
Industrial |
|
|
414.3 |
|
|
366.4 |
|||||||||
|
Ontario Mills Industrial Portfolio |
Industrial |
|
|
48.5 |
|
|
39.6 |
|||||||||
|
Pacific Plaza |
Office |
|
|
101.7 |
|
|
96.1 |
|||||||||
|
Rancho Cucamonga Industrial Portfolio |
Industrial |
|
|
162.6 |
|
|
143.4 |
|||||||||
|
Regents Court |
Apartments |
|
|
85.3 |
(1) |
|
|
|
81.8 |
(1) |
|
|||||
|
Southern CA RA Industrial Portfolio |
Industrial |
|
|
117.7 |
|
|
105.9 |
|||||||||
|
Stella |
Apartments |
|
|
170.2 |
|
|
170.1 |
|||||||||
|
The Forum at Carlsbad |
Retail |
|
|
212.2 |
(1) |
|
|
|
203.0 |
(1) |
|
|||||
|
The Legacy at Westwood |
Apartments |
|
|
138.6 |
(1) |
|
|
|
134.7 |
(1) |
|
|||||
|
Township Apartments |
Apartments |
|
|
89.4 |
|
|
86.0 |
|||||||||
|
West Lake North Business Park |
Office |
|
|
53.7 |
|
|
49.3 |
|||||||||
|
Westcreek |
Apartments |
|
|
41.2 |
|
|
39.3 |
|||||||||
|
Westwood Marketplace |
Retail |
|
|
125.2 |
|
|
116.5 |
|||||||||
|
Wilshire Rodeo Plaza |
Office |
|
|
300.2 |
|
|
209.8 |
|||||||||
|
Colorado: |
|
|
|
|
|
|
||||||||||
|
Palomino Park |
Apartments |
|
|
291.8 |
(1) |
|
|
|
283.3 |
(1) |
|
|||||
|
South Denver Marketplace |
Retail |
|
|
70.6 |
|
|
70.6 |
|||||||||
|
Connecticut: |
|
|
|
|
|
|
||||||||||
|
Wilton Woods Corporate Campus |
Office |
|
|
142.8 |
|
|
142.8 |
|||||||||
|
Florida: |
|
|
|
|
|
|
||||||||||
|
701 Brickell Avenue |
Office |
|
|
358.7 |
|
|
320.1 |
|||||||||
|
Casa Palma |
Apartments |
|
|
92.5 |
|
|
— |
|||||||||
|
Publix at Weston Commons |
Retail |
|
|
63.0 |
(1) |
|
|
|
58.0 |
(1) |
|
|||||
|
Seneca Industrial Park |
Industrial |
|
|
84.1 |
|
|
79.2 |
|||||||||
|
South Florida Apartment Portfolio |
Apartments |
|
|
89.3 |
|
|
84.1 |
|||||||||
|
The Manor Apartments |
Apartments |
|
|
53.5 |
|
|
52.6 |
|||||||||
|
The Manor at Flagler Village |
Apartments |
|
|
150.3 |
|
|
— |
|||||||||
|
The Residences at the Village of Merrick Park |
Apartments |
|
|
71.0 |
|
|
69.3 |
|||||||||
|
Urban Centre |
Office |
|
|
125.2 |
|
|
113.0 |
|||||||||
|
Weston Business Center |
Industrial |
|
|
90.0 |
|
|
86.6 |
|||||||||
|
Georgia: |
|
|
|
|
|
|
||||||||||
|
Atlanta Industrial Portfolio |
Industrial |
|
|
57.5 |
|
|
47.3 |
|||||||||
|
Shawnee Ridge Industrial Portfolio |
Industrial |
|
|
81.3 |
|
|
71.2 |
|||||||||
22
TIAA REAL ESTATE ACCOUNT
CONSOLIDATED SCHEDULES OF INVESTMENTS
(Dollar values shown in millions)
|
|
|
|
|
|
|
||||||||||
Location/Description |
Type |
Fair Value |
||||||||||||||
September 30, |
December 31, |
|||||||||||||||
|
|
|
|
(Unaudited) |
|
|
|||||||||||
|
Illinois: |
|
|
|
|
|
|
||||||||||
|
Chicago Caleast Industrial Portfolio |
Industrial |
|
|
$ |
|
71.8 |
|
|
$ |
|
66.9 |
|||||
|
Chicago Industrial Portfolio |
Industrial |
|
|
79.5 |
|
|
75.9 |
|||||||||
|
Parkview Plaza |
Office |
|
|
50.8 |
|
|
45.6 |
|||||||||
|
Maryland: |
|
|
|
|
|
|
||||||||||
|
Landover Logistics Center |
Industrial |
|
|
38.2 |
|
|
35.0 |
|||||||||
|
The Shops at Wisconsin Place |
Retail |
|
|
103.7 |
|
|
109.9 |
|||||||||
|
Massachusetts: |
|
|
|
|
|
|
||||||||||
|
99 High Street |
Office |
|
|
498.3 |
|
|
477.2 |
(1) |
|
|||||||
|
501 Boylston Street |
Office |
|
|
434.6 |
|
|
392.1 |
|||||||||
|
Northeast RA Industrial Portfolio |
Industrial |
|
|
38.6 |
|
|
35.9 |
|||||||||
|
Residence at Rivers Edge |
Apartments |
|
|
84.8 |
|
|
84.9 |
|||||||||
|
New Jersey: |
|
|
|
|
|
|
||||||||||
|
200 Milik Street |
Industrial |
|
|
49.8 |
|
|
— |
|||||||||
|
Marketfair |
Retail |
|
|
101.7 |
|
|
99.0 |
|||||||||
|
Mohawk Distribution Center |
Industrial |
|
|
84.0 |
|
|
81.0 |
|||||||||
|
South River Road Industrial |
Industrial |
|
|
66.8 |
|
|
65.5 |
|||||||||
|
New York: |
|
|
|
|
|
|
||||||||||
|
21 Penn Plaza |
Office |
|
|
265.1 |
|
|
246.6 |
|||||||||
|
250 North 10th Street |
Apartments |
|
|
171.0 |
|
|
— |
|||||||||
|
425 Park Avenue |
Ground Lease |
|
|
440.0 |
|
|
420.0 |
|||||||||
|
780 Third Avenue |
Office |
|
|
420.1 |
(1) |
|
|
|
405.4 |
(1) |
|
|||||
|
837 Washington Street |
Office |
|
|
201.7 |
|
|
— |
|||||||||
|
The Colorado |
Apartments |
|
|
249.7 |
(1) |
|
|
|
215.6 |
(1) |
|
|||||
|
The Corner |
Apartments |
|
|
265.0 |
(1) |
|
|
|
270.0 |
(1) |
|
|||||
|
Oregon: |
|
|
|
|
|
|
||||||||||
|
The Cordelia |
Apartments |
|
|
47.8 |
|
|
— |
|||||||||
|
Pennsylvania: |
|
|
|
|
|
|
||||||||||
|
1619 Walnut Street |
Retail |
|
|
23.1 |
|
|
22.4 |
|||||||||
|
The Pepper Building |
Apartments |
|
|
52.2 |
|
|
50.9 |
|||||||||
|
Tennessee: |
|
|
|
|
|
|
||||||||||
|
Southside at McEwen |
Retail |
|
|
47.8 |
|
|
45.1 |
|||||||||
|
Summit Distribution Center |
Industrial |
|
|
21.6 |
|
|
16.9 |
|||||||||
|
Texas: |
|
|
|
|
|
|
||||||||||
|
Beltway North Commerce Center |
Industrial |
|
|
23.4 |
|
|
— |
|||||||||
|
Cliffs at Barton Creek |
Apartments |
|
|
45.6 |
|
|
43.7 |
|||||||||
|
Dallas Industrial Portfolio |
Industrial |
|
|
184.9 |
|
|
182.7 |
|||||||||
|
Houston Apartment Portfolio |
Apartments |
|
|
177.0 |
|
|
176.9 |
|||||||||
|
Lincoln Centre |
Office |
|
|
314.6 |
|
|
317.1 |
(1) |
|
|||||||
|
Northwest Houston Industrial Portfolio |
Industrial |
|
|
68.3 |
|
|
67.0 |
|||||||||
|
Park 10 Distribution |
Industrial |
|
|
12.7 |
|
|
13.0 |
|||||||||
|
Pinnacle Industrial Portfolio |
Industrial |
|
|
46.2 |
|
|
42.4 |
|||||||||
|
Pinto Business Park |
Industrial |
|
|
72.7 |
|
|
— |
|||||||||
|
The Caruth |
Apartments |
|
|
81.3 |
(1) |
|
|
|
80.6 |
(1) |
|
|||||
|
The Maroneal |
Apartments |
|
|
56.9 |
|
|
56.8 |
|||||||||
|
Virginia: |
|
|
|
|
|
|
||||||||||
|
8270 Greensboro Drive |
Office |
|
|
48.2 |
|
|
45.3 |
|||||||||
|
Ashford Meadows Apartments |
Apartments |
|
|
106.1 |
(1) |
|
|
|
106.0 |
(1) |
|
|||||
|
Plaza America |
Retail |
|
|
106.0 |
|
|
99.4 |
|||||||||
|
The Ellipse at Ballston |
Office |
|
|
87.3 |
|
|
86.8 |
|||||||||
|
The Palatine |
Apartments |
|
|
126.2 |
(1) |
|
|
|
125.6 |
(1) |
|
|||||
23
TIAA REAL ESTATE ACCOUNT
CONSOLIDATED SCHEDULES OF INVESTMENTS
(Dollar values shown in millions)
|
|
|
|
|
|
|
||||||||||
Location/Description |
Type |
Fair Value |
||||||||||||||
September 30, |
December 31, |
|||||||||||||||
|
|
|
|
(Unaudited) |
|
|
|||||||||||
|
Washington: |
|
|
|
|
|
|
||||||||||
|
Circa Green Lake |
Apartments |
|
|
$ |
|
91.0 |
|
|
$ |
|
86.1 |
|||||
|
Fourth and Madison |
Office |
|
|
489.4 |
(1) |
|
|
|
455.0 |
(1) |
|
|||||
|
Millennium Corporate Park |
Office |
|
|
188.5 |
|
|
175.0 |
|||||||||
|
Northwest RA Industrial Portfolio |
Industrial |
|
|
28.5 |
|
|
27.1 |
|||||||||
|
Pacific Corporate Park |
Industrial |
|
|
36.7 |
|
|
37.2 |
|||||||||
|
Prescott Wallingford Apartments |
Apartments |
|
|
60.0 |
|
|
54.4 |
|||||||||
|
Rainier Corporate Park |
Industrial |
|
|
92.6 |
|
|
91.3 |
|||||||||
|
Regal Logistics Campus |
Industrial |
|
|
75.3 |
|
|
71.5 |
|||||||||
|
Union - South Lake Union |
Apartments |
|
|
112.3 |
|
|
— |
|||||||||
|
Washington DC: |
|
|
|
|
|
|
||||||||||
|
1001 Pennsylvania Avenue |
Office |
|
|
820.7 |
(1) |
|
|
|
805.4 |
(1) |
|
|||||
|
1401 H Street, NW |
Office |
|
|
243.0 |
(1) |
|
|
|
240.3 |
(1) |
|
|||||
|
1900 K Street, NW |
Office |
|
|
325.0 |
|
|
319.7 |
|||||||||
|
Mass Court |
Apartments |
|
|
168.1 |
(1) |
|
|
|
172.2 |
(1) |
|
|||||
|
Mazza Gallerie |
Retail |
|
|
84.5 |
|
|
88.8 |
|||||||||
|
The Louis at 14th |
Apartments |
|
|
182.4 |
|
|
182.5 |
|||||||||
|
The Woodley |
Apartments |
|
|
202.3 |
|
|
199.0 |
|||||||||
|
|
|
|
|
|
|
|
||||||||||
|
TOTAL REAL ESTATE PROPERTIES |
|
|
|
|
|
|
||||||||||
|
(Cost $11,975.8 and $11,309.0) |
|
|
|
|
$ |
|
14,213.5 |
|
|
$ |
|
13,139.0 |
||||
|
|
|
|
|
|
|
|
||||||||||
24
TIAA REAL ESTATE ACCOUNT
CONSOLIDATED SCHEDULES OF INVESTMENTS
(Dollar values shown in millions)
REAL ESTATE JOINT VENTURES AND LIMITED PARTNERSHIPS—15.4% and 15.2%
REAL ESTATE JOINT VENTURES—14.8% and 13.6%
|
|
|
|
|
|
|
||||||||||
Location/Description |
Type |
Fair Value |
||||||||||||||
September 30, |
December 31, |
|||||||||||||||
|
|
|
|
(Unaudited) |
|
|
|||||||||||
|
California: |
|
|
|
|
|
|
||||||||||
|
CA—Colorado Center LP |
Office |
|
|
$ |
|
549.5 |
|
|
$ |
|
368.1 |
(2) |
|
|||
|
T-C Foundry Square II Venture LLC |
Office |
|
|
182.2 |
(2) |
|
|
|
158.0 |
(2) |
|
|||||
|
Valencia Town Center Associates LP |
Retail |
|
|
120.0 |
(2) |
|
|
|
114.3 |
(2) |
|
|||||
|
Florida: |
|
|
|
|
|
|
||||||||||
|
Florida Mall Associates, Ltd |
Retail |
|
|
626.6 |
(2) |
|
|
|
533.6 |
(2) |
|
|||||
|
TREA Florida Retail, LLC |
Retail |
|
|
130.1 |
|
|
140.1 |
|||||||||
|
West Dade County Associates |
Retail |
|
|
131.5 |
(2) |
|
|
|
119.6 |
(2) |
|
|||||
|
Maryland: |
|
|
|
|
|
|
||||||||||
|
WP Project Developer |
|
|
|
|
|
|
||||||||||
|
The Shops at Wisconsin Place (33.33% Account Interest) |
Retail |
|
|
19.8 |
|
|
15.1 |
|||||||||
|
Massachusetts: |
|
|
|
|
|
|
||||||||||
|
One Boston Place REIT |
Office |
|
|
216.0 |
|
|
208.6 |
|||||||||
|
New York: |
|
|
|
|
|
|
||||||||||
|
401 West 14th Street, LLC |
Retail |
|
|
39.8 |
(2) |
|
|
|
35.3 |
(2) |
|
|||||
|
RGM 42, LLC |
Apartments |
|
|
325.0 |
(2) |
|
|
|
305.2 |
(2) |
|
|||||
|
Tennessee: |
|
|
|
|
|
|
||||||||||
|
West Town Mall, LLC |
Retail |
|
|
115.4 |
(2) |
|
|
|
94.6 |
(2) |
|
|||||
|
Texas: |
|
|
|
|
|
|
||||||||||
|
Four Oaks Venture LP |
Office |
|
|
390.1 |
(2) |
|
|
|
365.8 |
(2) |
|
|||||
|
Various: |
|
|
|
|
|
|
||||||||||
|
DDRTC Core Retail Fund, LLC |
Retail |
|
|
501.6 |
(2,3) |
|
|
|
448.4 |
(2,3) |
|
|||||
|
Storage Portfolio I, LLC |
Storage |
|
|
126.4 |
(2,3) |
|
|
|
114.8 |
(2,3) |
|
|||||
|
Strategic Ind Portfolio I, LLC |
|
|
|
|
|
|
||||||||||
|
IDI Nationwide Industrial Portfolio (60% Account Interest) |
Industrial |
|
|
0.6 |
(5) |
|
|
|
0.6 |
(5) |
|
|||||
|
|
|
|
|
|
|
|
||||||||||
|
TOTAL REAL ESTATE JOINT VENTURES |
|
|
|
|
$ |
|
3,474.6 |
|
|
$ |
|
3,022.1 |
||||
|
|
|
|
|
|
|
|
||||||||||
25
TIAA REAL ESTATE ACCOUNT
CONSOLIDATED SCHEDULES OF INVESTMENTS
(Dollar values shown in millions)
|
|
|
|
|
||||||||||
Location/Description |
Fair Value |
|||||||||||||
September 30, |
December 31, |
|||||||||||||
|
|
(Unaudited) |
|
|
|||||||||||
|
LIMITED PARTNERSHIPS—0.6% and 1.6% |
|
|
|
|
||||||||||
|
Clarion Gables Multi-Family Trust LP (8.32% Account Interest) |
|
|
$ |
|
111.1 |
|
|
$ |
|
— |
||||
|
Cobalt Industrial REIT (10.998% Account Interest) |
|
|
0.9 |
|
|
1.1 |
||||||||
|
Colony Realty Partners LP (5.27% Account Interest) |
|
|
20.3 |
|
|
21.1 |
||||||||
|
Heitman Value Partners Fund (8.43% Account Interest) |
|
|
0.1 |
|
|
0.3 |
||||||||
|
Lion Gables Apartment Fund (18.46% Account Interest) |
|
|
— |
(7) |
|
|
|
314.1 |
||||||
|
Transwestern Mezz Realty Partners III, LLC (11.708% Account Interest) |
|
|
15.7 |
|
|
20.9 |
||||||||
|
|
|
|
|
|
||||||||||
|
TOTAL LIMITED PARTNERSHIPS |
|
|
$ |
|
148.1 |
|
|
$ |
|
357.5 |
||||
|
|
|
|
|
|
||||||||||
|
TOTAL REAL ESTATE JOINT VENTURES AND LIMITED PARTNERSHIPS (Cost $2,595.7 and $2,583.5) |
|
|
$ |
|
3,622.7 |
|
|
$ |
|
3,379.6 |
||||
|
|
|
|
|
|
||||||||||
26
TIAA REAL ESTATE ACCOUNT
CONSOLIDATED SCHEDULES OF INVESTMENTS
(Dollar values shown in millions)
MARKETABLE SECURITIES—23.8% and 25.5%
REAL ESTATE-RELATED MARKETABLE SECURITIES—7.2% and 8.2%
|
|
|
|
|
|
|
|
|
||||||||||||||||||||
Shares |
Issuer |
Fair Value |
||||||||||||||||||||||||||
September 30, |
December 31, |
|||||||||||||||||||||||||||
2015 |
2014 |
|||||||||||||||||||||||||||
|
|
(Unaudited) |
|
|
|||||||||||||||||||||||||
|
144,236 |
|
|
128,562 |
Acadia Realty Trust |
|
|
$ |
|
4.3 |
|
|
$ |
|
4.1 |
|||||||||||||
|
6,364 |
|
|
31,670 |
Agree Realty Corporation |
|
|
0.2 |
|
|
1.0 |
|||||||||||||||||
|
3,574 |
|
|
4,549 |
Alexander’s, Inc. |
|
|
1.3 |
|
|
2.0 |
|||||||||||||||||
|
143,754 |
|
|
132,373 |
Alexandria Real Estate Equities, Inc. |
|
|
12.2 |
|
|
11.7 |
|||||||||||||||||
|
79,522 |
|
|
55,491 |
American Assets Trust, Inc. |
|
|
3.2 |
|
|
2.2 |
|||||||||||||||||
|
238,349 |
|
|
232,629 |
American Campus Communities, Inc. |
|
|
8.6 |
|
|
9.6 |
|||||||||||||||||
|
308,806 |
|
|
331,090 |
American Homes 4 Rent |
|
|
5.0 |
|
|
5.6 |
|||||||||||||||||
|
64,684 |
|
|
40,280 |
American Residential Properties |
|
|
1.1 |
|
|
0.7 |
|||||||||||||||||
|
857,963 |
|
|
851,739 |
American Tower Corp. |
|
|
75.5 |
|
|
84.2 |
|||||||||||||||||
|
295,771 |
|
|
324,603 |
Apartment Investment and Management Company |
|
|
10.9 |
|
|
12.1 |
|||||||||||||||||
|
161,861 |
|
|
— |
Apple Hospitality Inc. |
|
|
3.0 |
|
|
— |
|||||||||||||||||
|
1,511 |
|
|
45,930 |
Armada Hoffler Properties Inc. |
|
|
— |
|
|
0.4 |
|||||||||||||||||
|
37,217 |
|
|
40,976 |
Ashford Hospitality Prime Inc. |
|
|
0.5 |
|
|
0.7 |
|||||||||||||||||
|
228,647 |
|
|
228,348 |
Ashford Hospitality Trust, Inc. |
|
|
1.4 |
|
|
2.4 |
|||||||||||||||||
|
— |
|
|
131,435 |
Associated Estates Realty Corporation |
|
|
— |
|
|
3.1 |
|||||||||||||||||
|
266,825 |
|
|
285,499 |
Avalonbay Communities, Inc. |
|
|
46.7 |
|
|
46.6 |
|||||||||||||||||
|
— |
|
|
82,002 |
Aviv REIT, Inc. |
|
|
— |
|
|
2.8 |
|||||||||||||||||
|
434,255 |
|
|
427,097 |
BioMed Realty Trust, Inc. |
|
|
8.7 |
|
|
9.2 |
|||||||||||||||||
|
310,062 |
|
|
314,607 |
Boston Properties, Inc. |
|
|
36.7 |
|
|
40.5 |
|||||||||||||||||
|
380,958 |
|
|
398,099 |
Brandywine Realty Trust |
|
|
4.7 |
|
|
6.4 |
|||||||||||||||||
|
354,294 |
|
|
238,279 |
Brixmore Porperty Group Inc |
|
|
8.3 |
|
|
5.9 |
|||||||||||||||||
|
173,413 |
|
|
188,626 |
Camden Property Trust |
|
|
12.8 |
|
|
13.9 |
|||||||||||||||||
|
218,121 |
|
|
258,814 |
Campus Crest Communities, Inc. |
|
|
1.2 |
|
|
1.9 |
|||||||||||||||||
|
168,344 |
|
|
— |
Care Capital Properties, Inc. |
|
|
5.5 |
|
|
— |
|||||||||||||||||
|
88,148 |
|
|
— |
CareTrust REIT Inc. |
|
|
1.0 |
|
|
— |
|||||||||||||||||
|
100,768 |
|
|
69,250 |
Catchmark Timber Trust, Inc. |
|
|
1.0 |
|
|
0.8 |
|||||||||||||||||
|
335,345 |
|
|
335,345 |
CBL & Associates Properties, Inc. |
|
|
4.6 |
|
|
6.5 |
|||||||||||||||||
|
177,495 |
|
|
177,495 |
Cedar Shopping Centers, Inc. |
|
|
1.1 |
|
|
1.3 |
|||||||||||||||||
|
471,752 |
|
|
417,369 |
Chambers Street Properties |
|
|
3.1 |
|
|
3.4 |
|||||||||||||||||
|
79,438 |
|
|
73,127 |
Chatham Lodging Trust |
|
|
1.7 |
|
|
2.1 |
|||||||||||||||||
|
131,044 |
|
|
121,692 |
Chesapeake Lodging Trust |
|
|
3.4 |
|
|
4.5 |
|||||||||||||||||
|
229,546 |
|
|
277,710 |
Columbia Property Trust Inc |
|
|
5.3 |
|
|
7.0 |
|||||||||||||||||
|
163,196 |
|
|
— |
Communication Sales & Leasing, Inc. |
|
|
2.9 |
|
|
— |
|||||||||||||||||
|
137,756 |
|
|
70,620 |
Corenergy Infrastructure Trust, Inc. |
|
|
0.6 |
|
|
0.5 |
|||||||||||||||||
|
44,311 |
|
|
48,733 |
CoreSite Realty Corporation |
|
|
2.3 |
|
|
1.9 |
|||||||||||||||||
|
185,313 |
|
|
150,486 |
Corporate Office Properties Trust |
|
|
3.9 |
|
|
4.3 |
|||||||||||||||||
|
199,181 |
|
|
247,990 |
Corrections Corporation of America |
|
|
5.9 |
|
|
9.0 |
|||||||||||||||||
|
471,253 |
|
|
589,552 |
Cousins Properties Incorporated |
|
|
4.3 |
|
|
6.7 |
|||||||||||||||||
|
681,301 |
|
|
728,325 |
Crown Castle International Corporation |
|
|
53.7 |
|
|
57.3 |
|||||||||||||||||
|
327,453 |
|
|
410,111 |
Cubesmart |
|
|
8.9 |
|
|
9.0 |
|||||||||||||||||
|
118,268 |
|
|
78,620 |
CyrusOne Inc |
|
|
3.9 |
|
|
2.2 |
|||||||||||||||||
|
174,739 |
|
|
184,830 |
DCT Industrial Trust, Inc. |
|
|
5.9 |
|
|
6.6 |
|||||||||||||||||
|
660,482 |
|
|
806,645 |
DDR Corp |
|
|
10.2 |
|
|
14.8 |
|||||||||||||||||
|
433,952 |
|
|
440,687 |
DiamondRock Hospitality Company |
|
|
4.8 |
|
|
6.6 |
|||||||||||||||||
|
269,223 |
|
|
301,192 |
Digital Realty Trust, Inc. |
|
|
17.6 |
|
|
20.0 |
|||||||||||||||||
|
280,450 |
|
|
295,214 |
Douglas Emmett, Inc. |
|
|
8.1 |
|
|
8.4 |
|||||||||||||||||
|
680,753 |
|
|
756,115 |
Duke Realty Corporation |
|
|
13.0 |
|
|
15.3 |
|||||||||||||||||
|
116,962 |
|
|
111,572 |
DuPont Fabros Technology, Inc. |
|
|
3.0 |
|
|
3.7 |
|||||||||||||||||
|
14,727 |
|
|
— |
Easterly Government Properties, Inc. |
|
|
0.2 |
|
|
— |
|||||||||||||||||
27
TIAA REAL ESTATE ACCOUNT
CONSOLIDATED SCHEDULES OF INVESTMENTS
(Dollar values shown in millions)
|
|
|
|
|
|
|
|
|
||||||||||||||||||||
Shares |
Issuer |
Fair Value |
||||||||||||||||||||||||||
September 30, |
December 31, |
|||||||||||||||||||||||||||
2015 |
2014 |
|||||||||||||||||||||||||||
|
|
(Unaudited) |
|
|
|||||||||||||||||||||||||
|
68,602 |
|
|
46,023 |
EastGroup Properties, Inc. |
|
|
$ |
|
3.7 |
|
|
$ |
|
2.9 |
|||||||||||||
|
88,873 |
|
|
79,160 |
Education Realty Trust, Inc. |
|
|
2.9 |
|
|
2.9 |
|||||||||||||||||
|
189,640 |
|
|
223,187 |
Empire State Realty Trust |
|
|
3.2 |
|
|
3.9 |
|||||||||||||||||
|
102,109 |
|
|
72,480 |
EPR Properties |
|
|
5.3 |
|
|
4.2 |
|||||||||||||||||
|
115,778 |
|
|
— |
Equinix Inc. |
|
|
31.7 |
|
|
— |
|||||||||||||||||
|
283,893 |
|
|
285,705 |
Equity Commonwealth |
|
|
7.7 |
|
|
7.3 |
|||||||||||||||||
|
154,986 |
|
|
147,548 |
Equity Lifestyle Properties, Inc. |
|
|
9.1 |
|
|
7.6 |
|||||||||||||||||
|
137,621 |
|
|
190,245 |
Equity One, Inc. |
|
|
3.3 |
|
|
4.8 |
|||||||||||||||||
|
728,250 |
|
|
764,996 |
Equity Residential |
|
|
54.7 |
|
|
55.0 |
|||||||||||||||||
|
134,758 |
|
|
136,082 |
Essex Property Trust, Inc. |
|
|
30.1 |
|
|
28.1 |
|||||||||||||||||
|
— |
|
|
131,275 |
Excel Trust, Inc. |
|
|
— |
|
|
1.8 |
|||||||||||||||||
|
214,087 |
|
|
242,082 |
Extra Space Storage, Inc. |
|
|
16.5 |
|
|
14.2 |
|||||||||||||||||
|
137,648 |
|
|
142,140 |
Federal Realty Investment Trust |
|
|
18.8 |
|
|
19.0 |
|||||||||||||||||
|
332,376 |
|
|
284,615 |
FelCor Lodging Trust Incorporated |
|
|
2.3 |
|
|
3.1 |
|||||||||||||||||
|
256,412 |
|
|
295,495 |
First Industrial Realty Trust, Inc. |
|
|
5.4 |
|
|
6.1 |
|||||||||||||||||
|
162,229 |
|
|
133,251 |
First Potomac Realty Trust |
|
|
1.8 |
|
|
1.6 |
|||||||||||||||||
|
215,388 |
|
|
198,119 |
Franklin Street Properties Corp. |
|
|
2.3 |
|
|
2.4 |
|||||||||||||||||
|
189,477 |
|
|
241,051 |
Gaming and Leisure Properties, Inc. |
|
|
5.6 |
|
|
7.1 |
|||||||||||||||||
|
1,033,493 |
|
|
1,116,547 |
General Growth Properties, Inc. |
|
|
26.8 |
|
|
31.4 |
|||||||||||||||||
|
147,868 |
|
|
156,310 |
GEO Group Inc/The |
|
|
4.4 |
|
|
6.3 |
|||||||||||||||||
|
42,200 |
|
|
60,598 |
Getty Realty Corp. |
|
|
0.7 |
|
|
1.1 |
|||||||||||||||||
|
21,263 |
|
|
34,020 |
Gladstone Commercial Corporation |
|
|
0.3 |
|
|
0.6 |
|||||||||||||||||
|
— |
|
|
326,692 |
Glimcher Realty Trust |
|
|
— |
|
|
4.5 |
|||||||||||||||||
|
138,955 |
|
|
200,061 |
Government Properties Income Trust |
|
|
2.2 |
|
|
4.6 |
|||||||||||||||||
|
107,706 |
|
|
403,115 |
Gramercy Property Trust Inc |
|
|
2.2 |
|
|
2.8 |
|||||||||||||||||
|
922,971 |
|
|
951,260 |
HCP, Inc. |
|
|
34.4 |
|
|
41.9 |
|||||||||||||||||
|
— |
|
|
734,406 |
Health Care REIT, Inc. |
|
|
— |
|
|
55.6 |
|||||||||||||||||
|
204,617 |
|
|
211,892 |
Healthcare Realty Trust Inc. |
|
|
5.1 |
|
|
5.8 |
|||||||||||||||||
|
227,330 |
|
|
263,910 |
Healthcare Trust of America |
|
|
5.6 |
|
|
7.1 |
|||||||||||||||||
|
92,292 |
|
|
386,553 |
Hersha Hospitality Trust |
|
|
2.1 |
|
|
2.7 |
|||||||||||||||||
|
192,700 |
|
|
219,746 |
Highwoods Properties, Inc. |
|
|
7.5 |
|
|
9.7 |
|||||||||||||||||
|
111,018 |
|
|
107,460 |
Home Properties, Inc. |
|
|
8.3 |
|
|
7.0 |
|||||||||||||||||
|
299,658 |
|
|
332,850 |
Hospitality Properties Trust |
|
|
7.7 |
|
|
10.3 |
|||||||||||||||||
|
1,558,718 |
|
|
1,641,705 |
Host Hotels & Resorts, Inc. |
|
|
24.6 |
|
|
39.0 |
|||||||||||||||||
|
155,990 |
|
|
123,652 |
Hudson Pacific Properties, Inc. |
|
|
4.5 |
|
|
3.7 |
|||||||||||||||||
|
132,101 |
|
|
190,919 |
Inland Real Estate Corp. |
|
|
1.1 |
|
|
2.1 |
|||||||||||||||||
|
194,355 |
|
|
241,151 |
Investors Real Estate Trust |
|
|
1.5 |
|
|
2.0 |
|||||||||||||||||
|
368,737 |
|
|
298,480 |
Iron Mountain Inc. |
|
|
11.4 |
|
|
11.5 |
|||||||||||||||||
|
1,500,000 |
|
|
1,500,000 |
iShares Dow Jones US Real Estate Index Fund |
|
|
106.4 |
|
|
115.3 |
|||||||||||||||||
|
186,053 |
|
|
183,003 |
Kilroy Realty Corporation |
|
|
12.1 |
|
|
12.6 |
|||||||||||||||||
|
830,317 |
|
|
911,057 |
Kimco Realty Corporation |
|
|
20.3 |
|
|
22.9 |
|||||||||||||||||
|
188,454 |
|
|
254,398 |
Kite Realty Group Trust |
|
|
4.5 |
|
|
7.3 |
|||||||||||||||||
|
172,672 |
|
|
— |
Lamar Advertising Corporation |
|
|
9.0 |
|
|
— |
|||||||||||||||||
|
239,709 |
|
|
259,799 |
LaSalle Hotel Properties |
|
|
6.8 |
|
|
10.5 |
|||||||||||||||||
|
489,502 |
|
|
508,105 |
Lexington Realty Trust |
|
|
4.0 |
|
|
5.6 |
|||||||||||||||||
|
316,249 |
|
|
328,620 |
Liberty Property Trust |
|
|
10.0 |
|
|
12.4 |
|||||||||||||||||
|
65,231 |
|
|
58,133 |
LTC Properties, Inc. |
|
|
2.8 |
|
|
2.5 |
|||||||||||||||||
|
198,141 |
|
|
142,118 |
Mack-Cali Realty Corporation |
|
|
3.7 |
|
|
2.7 |
|||||||||||||||||
|
471,563 |
|
|
385,417 |
Medical Properties Trust, Inc. |
|
|
5.2 |
|
|
5.3 |
|||||||||||||||||
|
159,499 |
|
|
177,150 |
Mid-America Apartment Communities, Inc. |
|
|
13.1 |
|
|
13.2 |
|||||||||||||||||
|
90,359 |
|
|
118,597 |
Monmouth Real Estate Investment Corporation |
|
|
0.9 |
|
|
1.3 |
|||||||||||||||||
|
370,811 |
|
|
— |
Monogram Residential Trust Inc. |
|
|
3.5 |
|
|
— |
|||||||||||||||||
28
TIAA REAL ESTATE ACCOUNT
CONSOLIDATED SCHEDULES OF INVESTMENTS
(Dollar values shown in millions)
|
|
|
|
|
|
|
|
|
||||||||||||||||||||
Shares |
Issuer |
Fair Value |
||||||||||||||||||||||||||
September 30, |
December 31, |
|||||||||||||||||||||||||||
2015 |
2014 |
|||||||||||||||||||||||||||
|
|
(Unaudited) |
|
|
|||||||||||||||||||||||||
|
72,598 |
|
|
65,594 |
National Health Investors, Inc. |
|
|
$ |
|
4.2 |
|
|
$ |
|
4.6 |
|||||||||||||
|
269,023 |
|
|
305,461 |
National Retail Properties, Inc. |
|
|
9.8 |
|
|
12.0 |
|||||||||||||||||
|
41,608 |
|
|
— |
National Storage Affiliates Trust |
|
|
0.6 |
|
|
— |
|||||||||||||||||
|
195,188 |
|
|
237,208 |
New Senior Investment Group |
|
|
2.0 |
|
|
3.9 |
|||||||||||||||||
|
39,714 |
|
|
— |
Nexpoint Residential Trust, Inc. |
|
|
0.5 |
|
|
— |
|||||||||||||||||
|
722,743 |
|
|
570,000 |
Northstar Realty Finance Corp. |
|
|
8.9 |
|
|
10.0 |
|||||||||||||||||
|
314,688 |
|
|
281,073 |
Omega Healthcare Investors, Inc. |
|
|
11.1 |
|
|
11.0 |
|||||||||||||||||
|
15,752 |
|
|
28,607 |
One Liberty Properties, Inc. |
|
|
0.3 |
|
|
0.7 |
|||||||||||||||||
|
287,396 |
|
|
— |
Outfront Media Inc. |
|
|
6.0 |
|
|
— |
|||||||||||||||||
|
331,600 |
|
|
— |
Paramount Group Inc. |
|
|
5.6 |
|
|
— |
|||||||||||||||||
|
195,752 |
|
|
256,813 |
Parkway Properties, Inc. |
|
|
3.0 |
|
|
4.7 |
|||||||||||||||||
|
155,309 |
|
|
179,213 |
Pebblebrook Hotel Trust |
|
|
5.5 |
|
|
8.2 |
|||||||||||||||||
|
143,960 |
|
|
147,065 |
Pennsylvania Real Estate Investment Trust |
|
|
2.9 |
|
|
3.5 |
|||||||||||||||||
|
151,102 |
|
|
168,375 |
Physicians Realty Trust |
|
|
2.3 |
|
|
2.8 |
|||||||||||||||||
|
356,280 |
|
|
271,204 |
Piedmont Office Realty Trust, Inc. |
|
|
6.4 |
|
|
5.1 |
|||||||||||||||||
|
366,041 |
|
|
393,917 |
Plum Creek Timber Company, Inc. |
|
|
14.5 |
|
|
16.9 |
|||||||||||||||||
|
107,829 |
|
|
119,803 |
Post Properties, Inc. |
|
|
6.3 |
|
|
7.0 |
|||||||||||||||||
|
75,512 |
|
|
84,078 |
Potlatch Corporation |
|
|
2.2 |
|
|
3.5 |
|||||||||||||||||
|
1,079,731 |
|
|
1,129,782 |
ProLogis |
|
|
42.0 |
|
|
48.6 |
|||||||||||||||||
|
45,424 |
|
|
44,040 |
PS Business Parks, Inc. |
|
|
3.6 |
|
|
3.5 |
|||||||||||||||||
|
290,479 |
|
|
304,858 |
Public Storage, Inc. |
|
|
61.5 |
|
|
56.4 |
|||||||||||||||||
|
69,208 |
|
|
10,813 |
QTS Realty Trust, Inc. |
|
|
3.0 |
|
|
0.4 |
|||||||||||||||||
|
184,815 |
|
|
168,010 |
Ramco-Gershenson Properties Trust |
|
|
2.8 |
|
|
3.1 |
|||||||||||||||||
|
273,686 |
|
|
345,772 |
Rayonier, Inc. |
|
|
6.0 |
|
|
9.7 |
|||||||||||||||||
|
475,956 |
|
|
517,842 |
Realty Income Corporation |
|
|
22.6 |
|
|
24.7 |
|||||||||||||||||
|
188,900 |
|
|
202,908 |
Regency Centers Corporation |
|
|
11.7 |
|
|
12.9 |
|||||||||||||||||
|
214,312 |
|
|
197,186 |
Retail Opportunity Investment |
|
|
3.5 |
|
|
3.3 |
|||||||||||||||||
|
493,618 |
|
|
520,915 |
Retail Properties of America |
|
|
7.0 |
|
|
8.7 |
|||||||||||||||||
|
121,793 |
|
|
90,510 |
Rexford Industrial Realty Inc |
|
|
1.7 |
|
|
1.4 |
|||||||||||||||||
|
256,603 |
|
|
220,006 |
RLJ Lodging Trust |
|
|
6.5 |
|
|
7.4 |
|||||||||||||||||
|
84,865 |
|
|
83,313 |
Rouse Properties, Inc. |
|
|
1.3 |
|
|
1.5 |
|||||||||||||||||
|
91,528 |
|
|
108,370 |
Ryman Hospitality Properties |
|
|
4.5 |
|
|
5.7 |
|||||||||||||||||
|
137,104 |
|
|
118,843 |
Sabra Health Care REIT Inc |
|
|
3.2 |
|
|
3.6 |
|||||||||||||||||
|
24,721 |
|
|
28,976 |
Saul Centers, Inc. |
|
|
1.3 |
|
|
1.7 |
|||||||||||||||||
|
136,168 |
|
|
83,490 |
Select Income Real Estate Investment Trust |
|
|
2.6 |
|
|
2.0 |
|||||||||||||||||
|
473,101 |
|
|
499,658 |
Senior Housing Properties Trust |
|
|
7.7 |
|
|
11.0 |
|||||||||||||||||
|
106,097 |
|
|
82,090 |
Silver Bay Realty Trust Corp |
|
|
1.7 |
|
|
1.4 |
|||||||||||||||||
|
626,583 |
|
|
674,617 |
Simon Property Group, Inc. |
|
|
115.1 |
|
|
122.9 |
|||||||||||||||||
|
206,113 |
|
|
189,478 |
SL Green Realty Corp. |
|
|
22.3 |
|
|
22.6 |
|||||||||||||||||
|
65,409 |
|
|
53,568 |
Sovran Self Storage, Inc. |
|
|
6.2 |
|
|
4.7 |
|||||||||||||||||
|
912,199 |
|
|
1,080,553 |
Spirit Realty Capital Inc. |
|
|
8.3 |
|
|
12.8 |
|||||||||||||||||
|
150,980 |
|
|
200,698 |
Stag Industrial, Inc. |
|
|
2.7 |
|
|
4.9 |
|||||||||||||||||
|
97,456 |
|
|
89,340 |
Starwood Waypoint Residential Trust |
|
|
2.3 |
|
|
2.4 |
|||||||||||||||||
|
130,390 |
|
|
— |
STORE Capital Corporation |
|
|
2.7 |
|
|
— |
|||||||||||||||||
|
579,377 |
|
|
641,315 |
Strategic Hotels & Resorts, Inc. |
|
|
8.0 |
|
|
8.5 |
|||||||||||||||||
|
181,127 |
|
|
186,578 |
Summit Hotel Properties, Inc. |
|
|
2.1 |
|
|
2.3 |
|||||||||||||||||
|
101,757 |
|
|
100,386 |
Sun Communities, Inc. |
|
|
6.9 |
|
|
6.1 |
|||||||||||||||||
|
441,460 |
|
|
511,462 |
Sunstone Hotel Investors, L.L.C. |
|
|
5.8 |
|
|
8.4 |
|||||||||||||||||
|
191,044 |
|
|
212,284 |
Tanger Factory Outlet Centers, Inc. |
|
|
6.3 |
|
|
7.8 |
|||||||||||||||||
|
115,418 |
|
|
120,329 |
Taubman Centers, Inc. |
|
|
8.0 |
|
|
9.2 |
|||||||||||||||||
|
113,896 |
|
|
70,574 |
Terreno Realty Corporation |
|
|
2.2 |
|
|
1.5 |
|||||||||||||||||
|
317,532 |
|
|
336,472 |
The Macerich Company |
|
|
24.4 |
|
|
28.1 |
|||||||||||||||||
29
TIAA REAL ESTATE ACCOUNT
CONSOLIDATED SCHEDULES OF INVESTMENTS
(Dollar values shown in millions)
|
|
|
|
|
|
|
|
|
||||||||||||||||||||
Shares |
Issuer |
Fair Value |
||||||||||||||||||||||||||
September 30, |
December 31, |
|||||||||||||||||||||||||||
2015 |
2014 |
|||||||||||||||||||||||||||
|
|
(Unaudited) |
|
|
|||||||||||||||||||||||||
|
47,213 |
|
|
— |
Tier Inc. |
|
|
$ |
|
0.7 |
|
|
$ |
|
— |
|||||||||||||
|
535,092 |
|
|
556,651 |
UDR, Inc. |
|
|
18.4 |
|
|
17.2 |
|||||||||||||||||
|
26,221 |
|
|
44,774 |
UMH Properties, Inc. |
|
|
0.2 |
|
|
0.4 |
|||||||||||||||||
|
16,986 |
|
|
29,158 |
Universal Health Realty Income Trust |
|
|
0.8 |
|
|
1.4 |
|||||||||||||||||
|
192,149 |
|
|
— |
Urban Edge Properties |
|
|
4.1 |
|
|
— |
|||||||||||||||||
|
42,852 |
|
|
51,473 |
Urstadt Biddle Properties, Inc. |
|
|
0.8 |
|
|
1.1 |
|||||||||||||||||
|
673,378 |
|
|
652,228 |
Ventas, Inc. |
|
|
37.8 |
|
|
46.8 |
|||||||||||||||||
|
347,020 |
|
|
351,441 |
Vornado Realty Trust |
|
|
31.4 |
|
|
41.4 |
|||||||||||||||||
|
— |
|
|
349,878 |
Washington Prime Group, Inc. |
|
|
— |
|
|
6.0 |
|||||||||||||||||
|
126,208 |
|
|
96,831 |
Washington Real Estate Investment Trust |
|
|
3.1 |
|
|
2.7 |
|||||||||||||||||
|
213,951 |
|
|
190,047 |
Weingarten Realty Investors |
|
|
7.1 |
|
|
6.6 |
|||||||||||||||||
|
703,105 |
|
|
— |
Welltower Inc. |
|
|
47.6 |
|
|
— |
|||||||||||||||||
|
1,046,289 |
|
|
1,119,582 |
Weyerhaeuser Company |
|
|
28.6 |
|
|
40.2 |
|||||||||||||||||
|
18,600 |
|
|
50,900 |
Whitestone Real Estate Investment Trust B |
|
|
0.2 |
|
|
0.8 |
|||||||||||||||||
|
39,142 |
|
|
75,457 |
Winthrop Realty Trust |
|
|
0.6 |
|
|
1.2 |
|||||||||||||||||
|
192,958 |
|
|
246,629 |
WP Carey Inc. |
|
|
11.2 |
|
|
17.3 |
|||||||||||||||||
|
409,452 |
|
|
— |
WP Glimcher Inc. |
|
|
4.8 |
|
|
— |
|||||||||||||||||
|
240,292 |
|
|
— |
Xenia Hotels & Resorts Inc |
|
|
4.2 |
|
|
— |
|||||||||||||||||
|
|
|
|
|
|
|
||||||||||||||||||||||
|
TOTAL REAL ESTATE-RELATED MARKETABLE SECURITIES |
|
|
$ |
|
1,690.5 |
|
|
$ |
|
1,818.4 |
||||||||||||||||||
|
|
|
|
|
|
|
||||||||||||||||||||||
30
TIAA REAL ESTATE ACCOUNT
CONSOLIDATED SCHEDULES OF INVESTMENTS
(Dollar values shown in millions)
OTHER MARKETABLE SECURITIES—16.6% and 17.3%
COMMERCIAL PAPER—1.9%
|
|
|
|
|
|
|
|
|
|
|
|
|
||||||||||||||||||||||||||||||
Principal |
Issuer |
Yield(4) |
Maturity |
Fair Value |
||||||||||||||||||||||||||||||||||||||
September 30, |
December 31, |
|||||||||||||||||||||||||||||||||||||||||
2015 |
2014 |
|||||||||||||||||||||||||||||||||||||||||
|
|
(Unaudited) |
|
|
|||||||||||||||||||||||||||||||||||||||
|
$ |
|
25.0 |
|
|
$ |
|
— |
Apple Inc.(8) |
|
|
0.106% |
|
|
10/1/2015 |
|
|
$ |
|
25.0 |
|
|
$ |
|
— |
|||||||||||||||||
|
25.0 |
|
|
— |
Australia & New Zealand Banking Group Ltd(8) |
|
|
0.366% |
|
|
12/17/2015 |
|
|
25.0 |
|
|
— |
|||||||||||||||||||||||||
|
30.0 |
|
|
— |
Ciesco LLC(8) |
|
|
0.417% |
|
|
12/16/2015 |
|
|
29.9 |
|
|
— |
|||||||||||||||||||||||||
|
23.0 |
|
|
— |
Coca-Cola Co(8) |
|
|
0.223%-0.284% |
|
|
11/17/2015 |
|
|
23.0 |
|
|
— |
|||||||||||||||||||||||||
|
5.0 |
|
|
— |
Fairway Finance LLC(8) |
|
|
0.274% |
|
|
11/5/2015 |
|
|
5.0 |
|
|
— |
|||||||||||||||||||||||||
|
15.0 |
|
|
— |
General Electric Capital Corp |
|
|
0.274% |
|
|
11/23/2015 |
|
|
15.0 |
|
|
— |
|||||||||||||||||||||||||
|
25.0 |
|
|
— |
Jupiter Securitization Co LLC(8) |
|
|
0.345% |
|
|
11/30/2015 |
|
|
25.0 |
|
|
— |
|||||||||||||||||||||||||
|
15.0 |
|
|
— |
Jupiter Securitization Co LLC(8) |
|
|
0.376% |
|
|
12/2/2015 |
|
|
15.0 |
|
|
— |
|||||||||||||||||||||||||
|
30.0 |
|
|
— |
Korea Development Bank |
|
|
0.284% |
|
|
10/16/2015 |
|
|
30.0 |
|
|
— |
|||||||||||||||||||||||||
|
19.0 |
|
|
— |
Nestle Capital Corp.(8) |
|
|
0.183% |
|
|
11/9/2015 |
|
|
19.0 |
|
|
— |
|||||||||||||||||||||||||
|
30.0 |
|
|
— |
Nestle Capital Corp.(8) |
|
|
0.152% |
|
|
10/30/2015 |
|
|
30.0 |
|
|
— |
|||||||||||||||||||||||||
|
5.0 |
|
|
— |
Novartis Finance Corp(8) |
|
|
0.213% |
|
|
11/4/2015 |
|
|
5.0 |
|
|
— |
|||||||||||||||||||||||||
|
10.1 |
|
|
— |
Old Line Funding LLC(8) |
|
|
0.264% |
|
|
10/20/2015 |
|
|
10.1 |
|
|
— |
|||||||||||||||||||||||||
|
16.2 |
|
|
— |
Province of British Columbia Canada |
|
|
0.152% |
|
|
11/6/2015 |
|
|
16.1 |
|
|
— |
|||||||||||||||||||||||||
|
10.0 |
|
|
— |
Province of British Columbia Canada |
|
|
0.183% |
|
|
12/14/2015 |
|
|
10.0 |
|
|
— |
|||||||||||||||||||||||||
|
30.0 |
|
|
— |
Royal Bank of Canada |
|
|
0.355% |
|
|
12/22/2015 |
|
|
30.0 |
|
|
— |
|||||||||||||||||||||||||
|
20.0 |
|
|
— |
Svenska Handelsbanken AB(8) |
|
|
0.254% |
|
|
10/9/2015 |
|
|
20.0 |
|
|
— |
|||||||||||||||||||||||||
|
50.0 |
|
|
— |
Toronto-Dominion Holdings USA, Inc |
|
|
0.314% |
|
|
12/1/2015 |
|
|
50.0 |
|
|
— |
|||||||||||||||||||||||||
|
25.0 |
|
|
— |
United Overseas Bank Ltd(8) |
|
|
0.254% |
|
|
10/9/2015 |
|
|
25.0 |
|
|
— |
|||||||||||||||||||||||||
|
20.0 |
|
|
— |
United Overseas Bank Ltd(8) |
|
|
0.386% |
|
|
12/7/2015 |
|
|
20.0 |
|
|
— |
|||||||||||||||||||||||||
|
20.0 |
|
|
— |
Westpac Banking Corp(8) |
|
|
0.335% |
|
|
12/28/2015 |
|
|
20.0 |
|
|
— |
|||||||||||||||||||||||||
|
|
|
|
|
|
|
||||||||||||||||||||||||||||||||||||
|
TOTAL COMMERCIAL PAPER |
|
|
$ |
|
448.1 |
|
|
$ |
|
— |
||||||||||||||||||||||||||||||||
|
|
|
|
|
|
|
||||||||||||||||||||||||||||||||||||
31
TIAA REAL ESTATE ACCOUNT
CONSOLIDATED SCHEDULES OF INVESTMENTS
(Dollar values shown in millions)
GOVERNMENT AGENCY NOTES—9.0% and 10.7%
|
|
|
|
|
|
|
|
|
|
|
|
|
||||||||||||||||||||||||||||||
Principal |
Issuer |
Yield(4) |
Maturity |
Fair Value |
||||||||||||||||||||||||||||||||||||||
September 30, |
December 31, |
|||||||||||||||||||||||||||||||||||||||||
2015 |
2014 |
|||||||||||||||||||||||||||||||||||||||||
|
|
(Unaudited) |
|
|
|||||||||||||||||||||||||||||||||||||||
|
$ |
|
— |
|
|
$ |
|
44.0 |
Fannie Mae Discount Notes |
|
|
0.094%-0.101% |
|
|
1/14/2015 |
|
|
$ |
|
— |
|
|
$ |
|
44.0 |
|||||||||||||||||
|
— |
|
|
15.0 |
Fannie Mae Discount Notes |
|
|
0.046% |
|
|
1/15/2015 |
|
|
— |
|
|
15.0 |
|||||||||||||||||||||||||
|
— |
|
|
21.9 |
Fannie Mae Discount Notes |
|
|
0.046%-0.071% |
|
|
1/20/2015 |
|
|
— |
|
|
21.8 |
|||||||||||||||||||||||||
|
— |
|
|
10.0 |
Fannie Mae Discount Notes |
|
|
0.051% |
|
|
1/28/2015 |
|
|
— |
|
|
10.0 |
|||||||||||||||||||||||||
|
— |
|
|
40.9 |
Fannie Mae Discount Notes |
|
|
0.068%-0.101% |
|
|
2/11/2015 |
|
|
— |
|
|
40.9 |
|||||||||||||||||||||||||
|
— |
|
|
46.1 |
Fannie Mae Discount Notes |
|
|
0.101% |
|
|
2/17/2015 |
|
|
— |
|
|
46.1 |
|||||||||||||||||||||||||
|
— |
|
|
35.6 |
Fannie Mae Discount Notes |
|
|
0.089% |
|
|
2/25/2015 |
|
|
— |
|
|
35.6 |
|||||||||||||||||||||||||
|
— |
|
|
12.0 |
Fannie Mae Discount Notes |
|
|
0.076% |
|
|
2/27/2015 |
|
|
— |
|
|
12.0 |
|||||||||||||||||||||||||
|
— |
|
|
39.0 |
Fannie Mae Discount Notes |
|
|
0.101% |
|
|
3/2/2015 |
|
|
— |
|
|
39.0 |
|||||||||||||||||||||||||
|
— |
|
|
37.1 |
Fannie Mae Discount Notes |
|
|
0.091% |
|
|
3/3/2015 |
|
|
— |
|
|
37.1 |
|||||||||||||||||||||||||
|
— |
|
|
44.6 |
Fannie Mae Discount Notes |
|
|
0.086% |
|
|
3/16/2015 |
|
|
— |
|
|
44.6 |
|||||||||||||||||||||||||
|
— |
|
|
38.0 |
Fannie Mae Discount Notes |
|
|
0.066% |
|
|
3/18/2015 |
|
|
— |
|
|
38.0 |
|||||||||||||||||||||||||
|
— |
|
|
35.0 |
Fannie Mae Discount Notes |
|
|
0.061% |
|
|
3/25/2015 |
|
|
— |
|
|
35.0 |
|||||||||||||||||||||||||
|
— |
|
|
40.0 |
Fannie Mae Discount Notes |
|
|
0.066% |
|
|
4/1/2015 |
|
|
— |
|
|
40.0 |
|||||||||||||||||||||||||
|
— |
|
|
26.7 |
Fannie Mae Discount Notes |
|
|
0.096% |
|
|
4/6/2015 |
|
|
— |
|
|
26.7 |
|||||||||||||||||||||||||
|
— |
|
|
44.7 |
Fannie Mae Discount Notes |
|
|
0.096%-0.112% |
|
|
4/8/2015 |
|
|
— |
|
|
44.7 |
|||||||||||||||||||||||||
|
— |
|
|
28.3 |
Fannie Mae Discount Notes |
|
|
0.096% |
|
|
4/13/2015 |
|
|
— |
|
|
28.3 |
|||||||||||||||||||||||||
|
— |
|
|
35.7 |
Fannie Mae Discount Notes |
|
|
0.101%-0.152% |
|
|
4/27/2015 |
|
|
— |
|
|
35.7 |
|||||||||||||||||||||||||
|
— |
|
|
17.5 |
Fannie Mae Discount Notes |
|
|
0.101% |
|
|
4/29/2015 |
|
|
— |
|
|
17.5 |
|||||||||||||||||||||||||
|
— |
|
|
30.0 |
Fannie Mae Discount Notes |
|
|
0.081% |
|
|
5/1/2015 |
|
|
— |
|
|
30.0 |
|||||||||||||||||||||||||
|
— |
|
|
11.5 |
Fannie Mae Discount Notes |
|
|
0.107% |
|
|
5/4/2015 |
|
|
— |
|
|
11.5 |
|||||||||||||||||||||||||
|
— |
|
|
25.0 |
Fannie Mae Discount Notes |
|
|
0.101% |
|
|
5/6/2015 |
|
|
— |
|
|
25.0 |
|||||||||||||||||||||||||
|
— |
|
|
20.0 |
Fannie Mae Discount Notes |
|
|
0.112% |
|
|
5/13/2015 |
|
|
— |
|
|
20.0 |
|||||||||||||||||||||||||
|
— |
|
|
10.9 |
Fannie Mae Discount Notes |
|
|
0.127% |
|
|
5/20/2015 |
|
|
— |
|
|
10.9 |
|||||||||||||||||||||||||
|
— |
|
|
35.0 |
Fannie Mae Discount Notes |
|
|
0.091% |
|
|
6/17/2015 |
|
|
— |
|
|
35.0 |
|||||||||||||||||||||||||
|
— |
|
|
25.0 |
Fannie Mae Discount Notes |
|
|
0.144% |
|
|
7/1/2015 |
|
|
— |
|
|
25.0 |
|||||||||||||||||||||||||
|
— |
|
|
100.0 |
Fannie Mae Discount Notes |
|
|
0.112% |
|
|
7/20/2015 |
|
|
— |
|
|
99.9 |
|||||||||||||||||||||||||
|
— |
|
|
50.0 |
Fannie Mae Discount Notes |
|
|
0.137% |
|
|
8/17/2015 |
|
|
— |
|
|
50.0 |
|||||||||||||||||||||||||
|
10.6 |
|
|
— |
Fannie Mae Discount Notes |
|
|
0.101%-0.107% |
|
|
10/7/2015 |
|
|
10.6 |
|
|
— |
|||||||||||||||||||||||||
|
36.0 |
|
|
— |
Fannie Mae Discount Notes |
|
|
0.101%-0.132% |
|
|
10/14/2015 |
|
|
36.0 |
|
|
— |
|||||||||||||||||||||||||
|
50.0 |
|
|
— |
Fannie Mae Discount Notes |
|
|
0.132% |
|
|
10/21/2015 |
|
|
50.0 |
|
|
— |
|||||||||||||||||||||||||
|
10.0 |
|
|
— |
Fannie Mae Discount Notes |
|
|
0.178% |
|
|
11/2/2015 |
|
|
10.0 |
|
|
— |
|||||||||||||||||||||||||
|
16.4 |
|
|
— |
Fannie Mae Discount Notes |
|
|
0.142% |
|
|
11/20/2015 |
|
|
16.4 |
|
|
— |
|||||||||||||||||||||||||
|
25.0 |
|
|
— |
Fannie Mae Discount Notes |
|
|
0.147% |
|
|
12/9/2015 |
|
|
25.0 |
|
|
— |
|||||||||||||||||||||||||
|
30.0 |
|
|
— |
Fannie Mae Discount Notes |
|
|
0.193% |
|
|
12/14/2015 |
|
|
30.0 |
|
|
— |
|||||||||||||||||||||||||
|
5.0 |
|
|
— |
Fannie Mae Discount Notes |
|
|
0.152% |
|
|
12/16/2015 |
|
|
5.0 |
|
|
— |
|||||||||||||||||||||||||
|
11.4 |
|
|
— |
Fannie Mae Discount Notes |
|
|
0.162% |
|
|
12/23/2015 |
|
|
11.4 |
|
|
— |
|||||||||||||||||||||||||
|
4.0 |
|
|
— |
Fannie Mae Discount Notes |
|
|
0.157% |
|
|
12/24/2015 |
|
|
4.0 |
|
|
— |
|||||||||||||||||||||||||
|
8.5 |
|
|
— |
Fannie Mae Discount Notes |
|
|
0.111% |
|
|
12/30/2015 |
|
|
8.5 |
|
|
— |
|||||||||||||||||||||||||
|
4.0 |
|
|
— |
Fannie Mae Discount Notes |
|
|
0.162% |
|
|
1/4/2016 |
|
|
4.0 |
|
|
— |
|||||||||||||||||||||||||
|
9.0 |
|
|
— |
Fannie Mae Discount Notes |
|
|
0.213% |
|
|
1/5/2016 |
|
|
9.0 |
|
|
— |
|||||||||||||||||||||||||
|
40.0 |
|
|
— |
Fannie Mae Discount Notes |
|
|
0.218% |
|
|
1/12/2016 |
|
|
40.0 |
|
|
— |
|||||||||||||||||||||||||
|
15.0 |
|
|
— |
Fannie Mae Discount Notes |
|
|
0.223% |
|
|
1/19/2016 |
|
|
15.0 |
|
|
— |
|||||||||||||||||||||||||
|
26.6 |
|
|
— |
Fannie Mae Discount Notes |
|
|
0.225% |
|
|
1/20/2016 |
|
|
26.6 |
|
|
— |
|||||||||||||||||||||||||
|
25.0 |
|
|
— |
Fannie Mae Discount Notes |
|
|
0.223% |
|
|
1/27/2016 |
|
|
25.0 |
|
|
— |
|||||||||||||||||||||||||
|
5.9 |
|
|
— |
Fannie Mae Discount Notes |
|
|
0.274% |
|
|
2/2/2016 |
|
|
5.9 |
|
|
— |
|||||||||||||||||||||||||
|
10.9 |
|
|
— |
Fannie Mae Discount Notes |
|
|
0.244% |
|
|
2/3/2016 |
|
|
10.8 |
|
|
— |
|||||||||||||||||||||||||
|
2.0 |
|
|
— |
Fannie Mae Discount Notes |
|
|
0.345% |
|
|
2/8/2016 |
|
|
2.0 |
|
|
— |
|||||||||||||||||||||||||
|
28.4 |
|
|
— |
Fannie Mae Discount Notes |
|
|
0.162%-0.172% |
|
|
2/10/2016 |
|
|
28.4 |
|
|
— |
|||||||||||||||||||||||||
|
25.0 |
|
|
— |
Fannie Mae Discount Notes |
|
|
0.300% |
|
|
3/2/2016 |
|
|
25.0 |
|
|
— |
|||||||||||||||||||||||||
|
20.0 |
|
|
— |
Fannie Mae Discount Notes |
|
|
0.305% |
|
|
3/9/2016 |
|
|
20.0 |
|
|
— |
|||||||||||||||||||||||||
|
16.0 |
|
|
— |
Fannie Mae Discount Notes |
|
|
0.213% |
|
|
3/16/2016 |
|
|
16.0 |
|
|
— |
|||||||||||||||||||||||||
32
TIAA REAL ESTATE ACCOUNT
CONSOLIDATED SCHEDULES OF INVESTMENTS
(Dollar values shown in millions)
|
|
|
|
|
|
|
|
|
|
|
|
|
||||||||||||||||||||||||||||||
Principal |
Issuer |
Yield(4) |
Maturity |
Fair Value |
||||||||||||||||||||||||||||||||||||||
September 30, |
December 31, |
|||||||||||||||||||||||||||||||||||||||||
2015 |
2014 |
|||||||||||||||||||||||||||||||||||||||||
|
|
(Unaudited) |
|
|
|||||||||||||||||||||||||||||||||||||||
|
$ |
|
— |
|
|
$ |
|
2.9 |
Federal Farm Credit Bank Discount Notes |
|
|
0.091% |
|
|
5/21/2015 |
|
|
$ |
|
— |
|
|
$ |
|
2.9 |
|||||||||||||||||
|
21.6 |
|
|
— |
Federal Farm Credit Bank Discount Notes |
|
|
0.254% |
|
|
2/9/2016 |
|
|
21.6 |
|
|
— |
|||||||||||||||||||||||||
|
— |
|
|
20.0 |
Federal Home Loan Bank Discount Notes |
|
|
0.041% |
|
|
1/5/2015 |
|
|
— |
|
|
20.0 |
|||||||||||||||||||||||||
|
— |
|
|
19.0 |
Federal Home Loan Bank Discount Notes |
|
|
0.047% |
|
|
1/7/2015 |
|
|
— |
|
|
19.0 |
|||||||||||||||||||||||||
|
— |
|
|
50.0 |
Federal Home Loan Bank Discount Notes |
|
|
0.093% |
|
|
1/9/2015 |
|
|
— |
|
|
50.0 |
|||||||||||||||||||||||||
|
— |
|
|
40.0 |
Federal Home Loan Bank Discount Notes |
|
|
0.076% |
|
|
1/13/2015 |
|
|
— |
|
|
40.0 |
|||||||||||||||||||||||||
|
— |
|
|
30.0 |
Federal Home Loan Bank Discount Notes |
|
|
0.025% |
|
|
1/16/2015 |
|
|
— |
|
|
30.0 |
|||||||||||||||||||||||||
|
— |
|
|
50.0 |
Federal Home Loan Bank Discount Notes |
|
|
0.061% |
|
|
1/21/2015 |
|
|
— |
|
|
50.0 |
|||||||||||||||||||||||||
|
— |
|
|
21.8 |
Federal Home Loan Bank Discount Notes |
|
|
0.101% |
|
|
1/23/2015 |
|
|
— |
|
|
21.7 |
|||||||||||||||||||||||||
|
— |
|
|
50.0 |
Federal Home Loan Bank Discount Notes |
|
|
0.086% |
|
|
1/27/2015 |
|
|
— |
|
|
50.0 |
|||||||||||||||||||||||||
|
— |
|
|
8.0 |
Federal Home Loan Bank Discount Notes |
|
|
0.071% |
|
|
1/28/2015 |
|
|
— |
|
|
8.0 |
|||||||||||||||||||||||||
|
— |
|
|
50.0 |
Federal Home Loan Bank Discount Notes |
|
|
0.061% |
|
|
1/30/2015 |
|
|
— |
|
|
50.0 |
|||||||||||||||||||||||||
|
— |
|
|
58.0 |
Federal Home Loan Bank Discount Notes |
|
|
0.074% |
|
|
2/4/2015 |
|
|
— |
|
|
58.0 |
|||||||||||||||||||||||||
|
— |
|
|
45.0 |
Federal Home Loan Bank Discount Notes |
|
|
0.101% |
|
|
2/6/2015 |
|
|
— |
|
|
45.0 |
|||||||||||||||||||||||||
|
— |
|
|
56.0 |
Federal Home Loan Bank Discount Notes |
|
|
0.101% |
|
|
2/13/2015 |
|
|
— |
|
|
56.0 |
|||||||||||||||||||||||||
|
— |
|
|
29.5 |
Federal Home Loan Bank Discount Notes |
|
|
0.096% |
|
|
2/20/2015 |
|
|
— |
|
|
29.5 |
|||||||||||||||||||||||||
|
— |
|
|
20.6 |
Federal Home Loan Bank Discount Notes |
|
|
0.107% |
|
|
2/23/2015 |
|
|
— |
|
|
20.6 |
|||||||||||||||||||||||||
|
— |
|
|
22.0 |
Federal Home Loan Bank Discount Notes |
|
|
0.094% |
|
|
3/4/2015 |
|
|
— |
|
|
22.0 |
|||||||||||||||||||||||||
|
— |
|
|
16.7 |
Federal Home Loan Bank Discount Notes |
|
|
0.112% |
|
|
3/6/2015 |
|
|
— |
|
|
16.7 |
|||||||||||||||||||||||||
|
— |
|
|
11.5 |
Federal Home Loan Bank Discount Notes |
|
|
0.073% |
|
|
3/9/2015 |
|
|
— |
|
|
11.5 |
|||||||||||||||||||||||||
|
— |
|
|
31.3 |
Federal Home Loan Bank Discount Notes |
|
|
0.112% |
|
|
3/11/2015 |
|
|
— |
|
|
31.3 |
|||||||||||||||||||||||||
|
— |
|
|
7.0 |
Federal Home Loan Bank Discount Notes |
|
|
0.071% |
|
|
3/17/2015 |
|
|
— |
|
|
7.0 |
|||||||||||||||||||||||||
|
— |
|
|
27.0 |
Federal Home Loan Bank Discount Notes |
|
|
0.067% |
|
|
3/27/2015 |
|
|
— |
|
|
27.0 |
|||||||||||||||||||||||||
|
— |
|
|
15.0 |
Federal Home Loan Bank Discount Notes |
|
|
0.096%-0.122% |
|
|
3/30/2015 |
|
|
— |
|
|
15.0 |
|||||||||||||||||||||||||
|
— |
|
|
29.2 |
Federal Home Loan Bank Discount Notes |
|
|
0.101% |
|
|
4/17/2015 |
|
|
— |
|
|
29.2 |
|||||||||||||||||||||||||
|
— |
|
|
7.0 |
Federal Home Loan Bank Discount Notes |
|
|
0.101% |
|
|
4/24/2015 |
|
|
— |
|
|
7.0 |
|||||||||||||||||||||||||
|
— |
|
|
30.1 |
Federal Home Loan Bank Discount Notes |
|
|
0.152% |
|
|
4/29/2015 |
|
|
— |
|
|
30.1 |
|||||||||||||||||||||||||
|
— |
|
|
20.0 |
Federal Home Loan Bank Discount Notes |
|
|
0.116% |
|
|
5/20/2015 |
|
|
— |
|
|
20.0 |
|||||||||||||||||||||||||
|
— |
|
|
20.0 |
Federal Home Loan Bank Discount Notes |
|
|
0.142% |
|
|
7/30/2015 |
|
|
— |
|
|
20.0 |
|||||||||||||||||||||||||
|
— |
|
|
20.0 |
Federal Home Loan Bank Discount Notes |
|
|
0.162% |
|
|
8/20/2015 |
|
|
— |
|
|
20.0 |
|||||||||||||||||||||||||
|
— |
|
|
8.2 |
Federal Home Loan Bank Discount Notes |
|
|
0.091%-0.162% |
|
|
8/21/2015 |
|
|
— |
|
|
8.2 |
|||||||||||||||||||||||||
|
— |
|
|
48.8 |
Federal Home Loan Bank Discount Notes |
|
|
0.152% |
|
|
8/28/2015 |
|
|
— |
|
|
48.8 |
|||||||||||||||||||||||||
|
— |
|
|
20.0 |
Federal Home Loan Bank Discount Notes |
|
|
0.168% |
|
|
9/4/2015 |
|
|
— |
|
|
20.0 |
|||||||||||||||||||||||||
|
— |
|
|
21.5 |
Federal Home Loan Bank Discount Notes |
|
|
0.162% |
|
|
9/8/2015 |
|
|
— |
|
|
21.5 |
|||||||||||||||||||||||||
|
— |
|
|
14.0 |
Federal Home Loan Bank Discount Notes |
|
|
0.142%-0.162% |
|
|
9/9/2015 |
|
|
— |
|
|
14.0 |
|||||||||||||||||||||||||
|
26.5 |
|
|
— |
Federal Home Loan Bank Discount Notes |
|
|
0.094% |
|
|
10/2/2015 |
|
|
26.5 |
|
|
— |
|||||||||||||||||||||||||
|
17.0 |
|
|
— |
Federal Home Loan Bank Discount Notes |
|
|
0.076% |
|
|
10/6/2015 |
|
|
17.0 |
|
|
— |
|||||||||||||||||||||||||
|
33.0 |
|
|
— |
Federal Home Loan Bank Discount Notes |
|
|
0.096% |
|
|
10/7/2015 |
|
|
33.0 |
|
|
— |
|||||||||||||||||||||||||
|
15.8 |
|
|
— |
Federal Home Loan Bank Discount Notes |
|
|
0.061% |
|
|
10/8/2015 |
|
|
15.8 |
|
|
— |
|||||||||||||||||||||||||
|
28.5 |
|
|
— |
Federal Home Loan Bank Discount Notes |
|
|
0.096%-0.122% |
|
|
10/9/2015 |
|
|
28.5 |
|
|
— |
|||||||||||||||||||||||||
|
25.0 |
|
|
— |
Federal Home Loan Bank Discount Notes |
|
|
0.081% |
|
|
10/13/2015 |
|
|
25.0 |
|
|
— |
|||||||||||||||||||||||||
|
20.0 |
|
|
— |
Federal Home Loan Bank Discount Notes |
|
|
0.172% |
|
|
10/14/2015 |
|
|
20.0 |
|
|
— |
|||||||||||||||||||||||||
|
8.7 |
|
|
— |
Federal Home Loan Bank Discount Notes |
|
|
0.101% |
|
|
10/19/2015 |
|
|
8.7 |
|
|
— |
|||||||||||||||||||||||||
|
28.3 |
|
|
— |
Federal Home Loan Bank Discount Notes |
|
|
0.122% |
|
|
10/26/2015 |
|
|
28.3 |
|
|
— |
|||||||||||||||||||||||||
|
50.0 |
|
|
— |
Federal Home Loan Bank Discount Notes |
|
|
0.117% |
|
|
10/28/2015 |
|
|
50.0 |
|
|
— |
|||||||||||||||||||||||||
|
8.0 |
|
|
— |
Federal Home Loan Bank Discount Notes |
|
|
0.142% |
|
|
10/30/2015 |
|
|
8.0 |
|
|
— |
|||||||||||||||||||||||||
|
7.4 |
|
|
— |
Federal Home Loan Bank Discount Notes |
|
|
0.183% |
|
|
11/2/2015 |
|
|
7.4 |
|
|
— |
|||||||||||||||||||||||||
|
26.0 |
|
|
— |
Federal Home Loan Bank Discount Notes |
|
|
0.145% |
|
|
11/6/2015 |
|
|
26.0 |
|
|
— |
|||||||||||||||||||||||||
|
10.8 |
|
|
— |
Federal Home Loan Bank Discount Notes |
|
|
0.162%-0.172% |
|
|
11/9/2015 |
|
|
10.8 |
|
|
— |
|||||||||||||||||||||||||
|
40.0 |
|
|
— |
Federal Home Loan Bank Discount Notes |
|
|
0.162%-0.172% |
|
|
11/10/2015 |
|
|
40.0 |
|
|
— |
|||||||||||||||||||||||||
|
51.3 |
|
|
— |
Federal Home Loan Bank Discount Notes |
|
|
0.142%-0.162% |
|
|
11/13/2015 |
|
|
51.3 |
|
|
— |
|||||||||||||||||||||||||
|
49.8 |
|
|
— |
Federal Home Loan Bank Discount Notes |
|
|
0.137%-0.198% |
|
|
11/18/2015 |
|
|
49.8 |
|
|
— |
|||||||||||||||||||||||||
|
4.6 |
|
|
— |
Federal Home Loan Bank Discount Notes |
|
|
0.147% |
|
|
11/19/2015 |
|
|
4.5 |
|
|
— |
|||||||||||||||||||||||||
33
TIAA REAL ESTATE ACCOUNT
CONSOLIDATED SCHEDULES OF INVESTMENTS
(Dollar values shown in millions)
|
|
|
|
|
|
|
|
|
|
|
|
|
||||||||||||||||||||||||||||||
Principal |
Issuer |
Yield(4) |
Maturity |
Fair Value |
||||||||||||||||||||||||||||||||||||||
September 30, |
December 31, |
|||||||||||||||||||||||||||||||||||||||||
2015 |
2014 |
|||||||||||||||||||||||||||||||||||||||||
|
|
(Unaudited) |
|
|
|||||||||||||||||||||||||||||||||||||||
|
$ |
|
13.0 |
|
|
$ |
|
— |
Federal Home Loan Bank Discount Notes |
|
|
0.172% |
|
|
11/20/2015 |
|
|
$ |
|
13.0 |
|
|
$ |
|
— |
|||||||||||||||||
|
10.3 |
|
|
— |
Federal Home Loan Bank Discount Notes |
|
|
0.132% |
|
|
11/23/2015 |
|
|
10.3 |
|
|
— |
|||||||||||||||||||||||||
|
25.0 |
|
|
— |
Federal Home Loan Bank Discount Notes |
|
|
0.122% |
|
|
11/24/2015 |
|
|
25.0 |
|
|
— |
|||||||||||||||||||||||||
|
12.7 |
|
|
— |
Federal Home Loan Bank Discount Notes |
|
|
0.117% |
|
|
11/25/2015 |
|
|
12.7 |
|
|
— |
|||||||||||||||||||||||||
|
20.9 |
|
|
— |
Federal Home Loan Bank Discount Notes |
|
|
0.157% |
|
|
11/27/2015 |
|
|
20.9 |
|
|
— |
|||||||||||||||||||||||||
|
8.0 |
|
|
— |
Federal Home Loan Bank Discount Notes |
|
|
0.132% |
|
|
12/2/2015 |
|
|
8.0 |
|
|
— |
|||||||||||||||||||||||||
|
37.6 |
|
|
— |
Federal Home Loan Bank Discount Notes |
|
|
0.198%-0.213% |
|
|
12/4/2015 |
|
|
37.6 |
|
|
— |
|||||||||||||||||||||||||
|
50.0 |
|
|
— |
Federal Home Loan Bank Discount Notes |
|
|
0.203% |
|
|
12/8/2015 |
|
|
50.0 |
|
|
— |
|||||||||||||||||||||||||
|
2.8 |
|
|
— |
Federal Home Loan Bank Discount Notes |
|
|
0.223% |
|
|
12/9/2015 |
|
|
2.8 |
|
|
— |
|||||||||||||||||||||||||
|
36.0 |
|
|
— |
Federal Home Loan Bank Discount Notes |
|
|
0.233% |
|
|
12/11/2015 |
|
|
36.0 |
|
|
— |
|||||||||||||||||||||||||
|
33.0 |
|
|
— |
Federal Home Loan Bank Discount Notes |
|
|
0.284% |
|
|
12/15/2015 |
|
|
33.0 |
|
|
— |
|||||||||||||||||||||||||
|
37.0 |
|
|
— |
Federal Home Loan Bank Discount Notes |
|
|
0.132% |
|
|
12/18/2015 |
|
|
37.0 |
|
|
— |
|||||||||||||||||||||||||
|
13.5 |
|
|
— |
Federal Home Loan Bank Discount Notes |
|
|
0.167% |
|
|
1/4/2016 |
|
|
13.5 |
|
|
— |
|||||||||||||||||||||||||
|
22.4 |
|
|
— |
Federal Home Loan Bank Discount Notes |
|
|
0.167%-0.183% |
|
|
1/8/2016 |
|
|
22.4 |
|
|
— |
|||||||||||||||||||||||||
|
23.0 |
|
|
— |
Federal Home Loan Bank Discount Notes |
|
|
0.162% |
|
|
1/11/2016 |
|
|
23.0 |
|
|
— |
|||||||||||||||||||||||||
|
20.0 |
|
|
— |
Federal Home Loan Bank Discount Notes |
|
|
0.162% |
|
|
1/13/2016 |
|
|
20.0 |
|
|
— |
|||||||||||||||||||||||||
|
9.0 |
|
|
— |
Federal Home Loan Bank Discount Notes |
|
|
0.203%-0.284% |
|
|
1/26/2016 |
|
|
9.0 |
|
|
— |
|||||||||||||||||||||||||
|
13.3 |
|
|
— |
Federal Home Loan Bank Discount Notes |
|
|
0.249% |
|
|
2/1/2016 |
|
|
13.3 |
|
|
— |
|||||||||||||||||||||||||
|
52.0 |
|
|
— |
Federal Home Loan Bank Discount Notes |
|
|
0.193%-0.203% |
|
|
2/8/2016 |
|
|
52.0 |
|
|
— |
|||||||||||||||||||||||||
|
15.1 |
|
|
— |
Federal Home Loan Bank Discount Notes |
|
|
0.203% |
|
|
2/16/2016 |
|
|
15.1 |
|
|
— |
|||||||||||||||||||||||||
|
12.0 |
|
|
— |
Federal Home Loan Bank Discount Notes |
|
|
0.249%-0.254% |
|
|
3/30/2016 |
|
|
12.0 |
|
|
— |
|||||||||||||||||||||||||
|
— |
|
|
10.3 |
Freddie Mac Discount Notes |
|
|
0.081%-0.096% |
|
|
1/8/2015 |
|
|
— |
|
|
10.3 |
|||||||||||||||||||||||||
|
— |
|
|
43.0 |
Freddie Mac Discount Notes |
|
|
0.038%-0.091% |
|
|
1/12/2015 |
|
|
— |
|
|
43.0 |
|||||||||||||||||||||||||
|
— |
|
|
30.8 |
Freddie Mac Discount Notes |
|
|
0.101% |
|
|
1/26/2015 |
|
|
— |
|
|
30.8 |
|||||||||||||||||||||||||
|
— |
|
|
37.0 |
Freddie Mac Discount Notes |
|
|
0.061% |
|
|
1/29/2015 |
|
|
— |
|
|
37.0 |
|||||||||||||||||||||||||
|
— |
|
|
16.5 |
Freddie Mac Discount Notes |
|
|
0.096%-0.107% |
|
|
2/10/2015 |
|
|
— |
|
|
16.5 |
|||||||||||||||||||||||||
|
— |
|
|
22.9 |
Freddie Mac Discount Notes |
|
|
0.080%-0.094% |
|
|
3/16/2015 |
|
|
— |
|
|
22.9 |
|||||||||||||||||||||||||
|
— |
|
|
11.8 |
Freddie Mac Discount Notes |
|
|
0.112% |
|
|
3/17/2015 |
|
|
— |
|
|
11.8 |
|||||||||||||||||||||||||
|
— |
|
|
17.1 |
Freddie Mac Discount Notes |
|
|
0.081%-0.107% |
|
|
3/19/2015 |
|
|
— |
|
|
17.1 |
|||||||||||||||||||||||||
|
— |
|
|
19.6 |
Freddie Mac Discount Notes |
|
|
0.061% |
|
|
3/24/2015 |
|
|
— |
|
|
19.5 |
|||||||||||||||||||||||||
|
— |
|
|
18.0 |
Freddie Mac Discount Notes |
|
|
0.132% |
|
|
3/25/2015 |
|
|
— |
|
|
18.0 |
|||||||||||||||||||||||||
|
— |
|
|
16.2 |
Freddie Mac Discount Notes |
|
|
0.122% |
|
|
4/1/2015 |
|
|
— |
|
|
16.2 |
|||||||||||||||||||||||||
|
— |
|
|
27.2 |
Freddie Mac Discount Notes |
|
|
0.127%-0.142% |
|
|
4/2/2015 |
|
|
— |
|
|
27.2 |
|||||||||||||||||||||||||
|
— |
|
|
20.9 |
Freddie Mac Discount Notes |
|
|
0.066% |
|
|
4/6/2015 |
|
|
— |
|
|
20.9 |
|||||||||||||||||||||||||
|
— |
|
|
16.2 |
Freddie Mac Discount Notes |
|
|
0.096%-0.142% |
|
|
4/7/2015 |
|
|
— |
|
|
16.2 |
|||||||||||||||||||||||||
|
— |
|
|
4.4 |
Freddie Mac Discount Notes |
|
|
0.096% |
|
|
4/9/2015 |
|
|
— |
|
|
4.4 |
|||||||||||||||||||||||||
|
— |
|
|
29.8 |
Freddie Mac Discount Notes |
|
|
0.101% |
|
|
4/14/2015 |
|
|
— |
|
|
29.8 |
|||||||||||||||||||||||||
|
— |
|
|
13.6 |
Freddie Mac Discount Notes |
|
|
0.096% |
|
|
4/16/2015 |
|
|
— |
|
|
13.6 |
|||||||||||||||||||||||||
|
— |
|
|
11.0 |
Freddie Mac Discount Notes |
|
|
0.107% |
|
|
4/21/2015 |
|
|
— |
|
|
11.0 |
|||||||||||||||||||||||||
|
— |
|
|
15.0 |
Freddie Mac Discount Notes |
|
|
0.096% |
|
|
4/22/2015 |
|
|
— |
|
|
15.0 |
|||||||||||||||||||||||||
|
— |
|
|
20.0 |
Freddie Mac Discount Notes |
|
|
0.096% |
|
|
4/23/2015 |
|
|
— |
|
|
20.0 |
|||||||||||||||||||||||||
|
— |
|
|
13.7 |
Freddie Mac Discount Notes |
|
|
0.101% |
|
|
4/24/2015 |
|
|
— |
|
|
13.7 |
|||||||||||||||||||||||||
|
— |
|
|
20.0 |
Freddie Mac Discount Notes |
|
|
0.101% |
|
|
5/11/2015 |
|
|
— |
|
|
20.0 |
|||||||||||||||||||||||||
|
— |
|
|
8.8 |
Freddie Mac Discount Notes |
|
|
0.112% |
|
|
5/27/2015 |
|
|
— |
|
|
8.8 |
|||||||||||||||||||||||||
|
— |
|
|
41.0 |
Freddie Mac Discount Notes |
|
|
0.147% |
|
|
6/15/2015 |
|
|
— |
|
|
41.0 |
|||||||||||||||||||||||||
|
— |
|
|
15.0 |
Freddie Mac Discount Notes |
|
|
0.137% |
|
|
6/16/2015 |
|
|
— |
|
|
15.0 |
|||||||||||||||||||||||||
|
— |
|
|
6.9 |
Freddie Mac Discount Notes |
|
|
0.101% |
|
|
7/21/2015 |
|
|
— |
|
|
6.9 |
|||||||||||||||||||||||||
|
— |
|
|
24.0 |
Freddie Mac Discount Notes |
|
|
0.159% |
|
|
7/22/2015 |
|
|
— |
|
|
24.0 |
|||||||||||||||||||||||||
|
50.0 |
|
|
— |
Freddie Mac Discount Notes |
|
|
0.086% |
|
|
10/5/2015 |
|
|
50.0 |
|
|
— |
|||||||||||||||||||||||||
|
56.7 |
|
|
— |
Freddie Mac Discount Notes |
|
|
0.101%-0.223% |
|
|
10/20/2015 |
|
|
56.7 |
|
|
— |
|||||||||||||||||||||||||
|
39.0 |
|
|
— |
Freddie Mac Discount Notes |
|
|
0.129% |
|
|
10/23/2015 |
|
|
39.0 |
|
|
— |
|||||||||||||||||||||||||
|
4.4 |
|
|
— |
Freddie Mac Discount Notes |
|
|
0.162% |
|
|
10/26/2015 |
|
|
4.4 |
|
|
— |
|||||||||||||||||||||||||
|
10.0 |
|
|
— |
Freddie Mac Discount Notes |
|
|
0.076% |
|
|
10/27/2015 |
|
|
10.0 |
|
|
— |
|||||||||||||||||||||||||
34
TIAA REAL ESTATE ACCOUNT
CONSOLIDATED SCHEDULES OF INVESTMENTS
(Dollar values shown in millions)
|
|
|
|
|
|
|
|
|
|
|
|
|
||||||||||||||||||||||||||||||
Principal |
Issuer |
Yield(4) |
Maturity |
Fair Value |
||||||||||||||||||||||||||||||||||||||
September 30, |
December 31, |
|||||||||||||||||||||||||||||||||||||||||
2015 |
2014 |
|||||||||||||||||||||||||||||||||||||||||
|
|
(Unaudited) |
|
|
|||||||||||||||||||||||||||||||||||||||
|
$ |
|
40.8 |
|
|
$ |
|
— |
Freddie Mac Discount Notes |
|
|
0.132%-0.142% |
|
|
11/3/2015 |
|
|
$ |
|
40.7 |
|
|
$ |
|
— |
|||||||||||||||||
|
38.9 |
|
|
— |
Freddie Mac Discount Notes |
|
|
0.213% |
|
|
11/4/2015 |
|
|
38.9 |
|
|
— |
|||||||||||||||||||||||||
|
26.0 |
|
|
— |
Freddie Mac Discount Notes |
|
|
0.183% |
|
|
11/5/2015 |
|
|
26.0 |
|
|
— |
|||||||||||||||||||||||||
|
29.5 |
|
|
— |
Freddie Mac Discount Notes |
|
|
0.101% |
|
|
11/16/2015 |
|
|
29.4 |
|
|
— |
|||||||||||||||||||||||||
|
22.0 |
|
|
— |
Freddie Mac Discount Notes |
|
|
0.213% |
|
|
11/30/2015 |
|
|
22.0 |
|
|
— |
|||||||||||||||||||||||||
|
40.2 |
|
|
— |
Freddie Mac Discount Notes |
|
|
0.183% |
|
|
12/2/2015 |
|
|
40.1 |
|
|
— |
|||||||||||||||||||||||||
|
40.0 |
|
|
— |
Freddie Mac Discount Notes |
|
|
0.101% |
|
|
12/3/2015 |
|
|
40.0 |
|
|
— |
|||||||||||||||||||||||||
|
21.0 |
|
|
— |
Freddie Mac Discount Notes |
|
|
0.142% |
|
|
12/4/2015 |
|
|
21.0 |
|
|
— |
|||||||||||||||||||||||||
|
28.5 |
|
|
— |
Freddie Mac Discount Notes |
|
|
0.142%-0.285% |
|
|
12/7/2015 |
|
|
28.5 |
|
|
— |
|||||||||||||||||||||||||
|
2.0 |
|
|
— |
Freddie Mac Discount Notes |
|
|
0.122% |
|
|
12/8/2015 |
|
|
2.0 |
|
|
— |
|||||||||||||||||||||||||
|
17.0 |
|
|
— |
Freddie Mac Discount Notes |
|
|
0.254% |
|
|
12/14/2015 |
|
|
17.0 |
|
|
— |
|||||||||||||||||||||||||
|
15.0 |
|
|
— |
Freddie Mac Discount Notes |
|
|
0.132% |
|
|
12/15/2015 |
|
|
15.0 |
|
|
— |
|||||||||||||||||||||||||
|
4.6 |
|
|
— |
Freddie Mac Discount Notes |
|
|
0.183% |
|
|
12/21/2015 |
|
|
4.6 |
|
|
— |
|||||||||||||||||||||||||
|
55.0 |
|
|
— |
Freddie Mac Discount Notes |
|
|
0.208%-0.213% |
|
|
1/5/2016 |
|
|
55.0 |
|
|
— |
|||||||||||||||||||||||||
|
10.4 |
|
|
— |
Freddie Mac Discount Notes |
|
|
0.213%-0.223% |
|
|
1/6/2016 |
|
|
10.4 |
|
|
— |
|||||||||||||||||||||||||
|
24.0 |
|
|
— |
Freddie Mac Discount Notes |
|
|
0.218%-0.233% |
|
|
1/22/2016 |
|
|
24.0 |
|
|
— |
|||||||||||||||||||||||||
|
15.5 |
|
|
— |
Freddie Mac Discount Notes |
|
|
0.244% |
|
|
1/25/2016 |
|
|
15.5 |
|
|
— |
|||||||||||||||||||||||||
|
26.6 |
|
|
— |
Freddie Mac Discount Notes |
|
|
0.244% |
|
|
1/28/2016 |
|
|
26.6 |
|
|
— |
|||||||||||||||||||||||||
|
50.0 |
|
|
— |
Freddie Mac Discount Notes |
|
|
0.233% |
|
|
1/29/2016 |
|
|
50.0 |
|
|
— |
|||||||||||||||||||||||||
|
37.0 |
|
|
— |
Freddie Mac Discount Notes |
|
|
0.183% |
|
|
2/5/2016 |
|
|
37.0 |
|
|
— |
|||||||||||||||||||||||||
|
25.0 |
|
|
— |
Freddie Mac Discount Notes |
|
|
0.183% |
|
|
3/4/2016 |
|
|
25.0 |
|
|
— |
|||||||||||||||||||||||||
|
|
|
|
|
|
|
||||||||||||||||||||||||||||||||||||
|
TOTAL GOVERNMENT AGENCY NOTES |
|
|
$ |
|
2,102.2 |
|
|
$ |
|
2,369.9 |
||||||||||||||||||||||||||||||||
|
|
|
|
|
|
|
||||||||||||||||||||||||||||||||||||
35
TIAA REAL ESTATE ACCOUNT
CONSOLIDATED SCHEDULES OF INVESTMENTS
(Dollar values shown in millions)
UNITED STATES TREASURY SECURITIES—5.7% and 6.6%
|
|
|
|
|
|
|
|
|
|
|
|
|
||||||||||||||||||||||||||||||
Principal |
Issuer |
Yield(4) |
Maturity |
Fair Value |
||||||||||||||||||||||||||||||||||||||
September 30, |
December 31, |
|||||||||||||||||||||||||||||||||||||||||
2015 |
2014 |
|||||||||||||||||||||||||||||||||||||||||
|
|
(Unaudited) |
|
|
|||||||||||||||||||||||||||||||||||||||
|
$ |
|
— |
|
|
$ |
|
24.0 |
United States Treasury Bills |
|
|
0.041% |
|
|
1/2/2015 |
|
|
$ |
|
— |
|
|
$ |
|
24.0 |
|||||||||||||||||
|
— |
|
|
4.0 |
United States Treasury Bills |
|
|
0.035% |
|
|
1/15/2015 |
|
|
— |
|
|
4.0 |
|||||||||||||||||||||||||
|
— |
|
|
45.8 |
United States Treasury Bills |
|
|
0.020%-0.040% |
|
|
1/22/2015 |
|
|
— |
|
|
45.8 |
|||||||||||||||||||||||||
|
— |
|
|
19.4 |
United States Treasury Bills |
|
|
0.038%-0.051% |
|
|
2/12/2015 |
|
|
— |
|
|
19.4 |
|||||||||||||||||||||||||
|
— |
|
|
30.0 |
United States Treasury Bills |
|
|
0.044% |
|
|
2/19/2015 |
|
|
— |
|
|
30.0 |
|||||||||||||||||||||||||
|
— |
|
|
17.2 |
United States Treasury Bills |
|
|
0.020%-0.030% |
|
|
2/26/2015 |
|
|
— |
|
|
17.2 |
|||||||||||||||||||||||||
|
— |
|
|
43.6 |
United States Treasury Bills |
|
|
0.020%-0.032% |
|
|
3/5/2015 |
|
|
— |
|
|
43.6 |
|||||||||||||||||||||||||
|
— |
|
|
30.0 |
United States Treasury Bills |
|
|
0.042% |
|
|
3/12/2015 |
|
|
— |
|
|
30.0 |
|||||||||||||||||||||||||
|
— |
|
|
16.0 |
United States Treasury Bills |
|
|
0.030% |
|
|
3/26/2015 |
|
|
— |
|
|
16.0 |
|||||||||||||||||||||||||
|
— |
|
|
7.2 |
United States Treasury Bills |
|
|
0.028%-0.044% |
|
|
4/2/2015 |
|
|
— |
|
|
7.2 |
|||||||||||||||||||||||||
|
— |
|
|
36.6 |
United States Treasury Bills |
|
|
0.037% |
|
|
4/9/2015 |
|
|
— |
|
|
36.6 |
|||||||||||||||||||||||||
|
— |
|
|
41.2 |
United States Treasury Bills |
|
|
0.056%-0.057% |
|
|
5/7/2015 |
|
|
— |
|
|
41.2 |
|||||||||||||||||||||||||
|
— |
|
|
53.9 |
United States Treasury Bills |
|
|
0.044%-0.071% |
|
|
5/28/2015 |
|
|
— |
|
|
53.9 |
|||||||||||||||||||||||||
|
— |
|
|
8.5 |
United States Treasury Bills |
|
|
0.076% |
|
|
6/4/2015 |
|
|
— |
|
|
8.4 |
|||||||||||||||||||||||||
|
— |
|
|
196.0 |
United States Treasury Bills |
|
|
0.071%-0.100% |
|
|
6/25/2015 |
|
|
— |
|
|
195.9 |
|||||||||||||||||||||||||
|
— |
|
|
121.0 |
United States Treasury Bills |
|
|
0.105%-0.112% |
|
|
7/23/2015 |
|
|
— |
|
|
120.9 |
|||||||||||||||||||||||||
|
— |
|
|
35.0 |
United States Treasury Bills |
|
|
0.092%-0.178% |
|
|
8/20/2015 |
|
|
— |
|
|
35.0 |
|||||||||||||||||||||||||
|
— |
|
|
50.0 |
United States Treasury Bills |
|
|
0.078% |
|
|
9/17/2015 |
|
|
— |
|
|
49.9 |
|||||||||||||||||||||||||
|
13.0 |
|
|
— |
United States Treasury Bills |
|
|
0.081% |
|
|
10/1/2015 |
|
|
13.0 |
|
|
— |
|||||||||||||||||||||||||
|
71.9 |
|
|
117.0 |
United States Treasury Bills |
|
|
0.099%-0.101% |
|
|
10/15/2015 |
|
|
71.9 |
|
|
116.8 |
|||||||||||||||||||||||||
|
39.0 |
|
|
— |
United States Treasury Bills |
|
|
0.051% |
|
|
10/22/2015 |
|
|
39.0 |
|
|
— |
|||||||||||||||||||||||||
|
42.3 |
|
|
— |
United States Treasury Bills |
|
|
0.035%-0.061% |
|
|
10/29/2015 |
|
|
42.2 |
|
|
— |
|||||||||||||||||||||||||
|
100.0 |
|
|
— |
United States Treasury Bills |
|
|
0.108% |
|
|
11/12/2015 |
|
|
100.0 |
|
|
— |
|||||||||||||||||||||||||
|
50.0 |
|
|
— |
United States Treasury Bills |
|
|
0.118% |
|
|
11/19/2015 |
|
|
50.0 |
|
|
— |
|||||||||||||||||||||||||
|
189.9 |
|
|
— |
United States Treasury Bills |
|
|
0.152%-0.179% |
|
|
12/10/2015 |
|
|
189.9 |
|
|
— |
|||||||||||||||||||||||||
|
100.0 |
|
|
— |
United States Treasury Bills |
|
|
0.190% |
|
|
1/7/2016 |
|
|
100.0 |
|
|
— |
|||||||||||||||||||||||||
|
50.0 |
|
|
— |
United States Treasury Bills |
|
|
0.112% |
|
|
1/14/2016 |
|
|
50.0 |
|
|
— |
|||||||||||||||||||||||||
|
65.0 |
|
|
— |
United States Treasury Bills |
|
|
0.127%-0.128% |
|
|
1/21/2016 |
|
|
65.0 |
|
|
— |
|||||||||||||||||||||||||
|
150.0 |
|
|
— |
United States Treasury Bills |
|
|
0.224%-0.226% |
|
|
2/4/2016 |
|
|
150.0 |
|
|
— |
|||||||||||||||||||||||||
|
85.0 |
|
|
— |
United States Treasury Bills |
|
|
0.178%-0.183% |
|
|
2/18/2016 |
|
|
85.0 |
|
|
— |
|||||||||||||||||||||||||
|
79.0 |
|
|
— |
United States Treasury Bills |
|
|
0.214% |
|
|
2/25/2016 |
|
|
79.0 |
|
|
— |
|||||||||||||||||||||||||
|
50.0 |
|
|
— |
United States Treasury Bills |
|
|
0.142% |
|
|
3/3/2016 |
|
|
50.0 |
|
|
— |
|||||||||||||||||||||||||
|
— |
|
|
1.0 |
United States Treasury Notes |
|
|
0.107% |
|
|
1/15/2015 |
|
|
— |
|
|
1.0 |
|||||||||||||||||||||||||
|
— |
|
|
24.0 |
United States Treasury Notes |
|
|
0.066% |
|
|
4/15/2015 |
|
|
— |
|
|
24.0 |
|||||||||||||||||||||||||
|
— |
|
|
9.2 |
United States Treasury Notes |
|
|
0.051% |
|
|
4/23/2015 |
|
|
— |
|
|
9.2 |
|||||||||||||||||||||||||
|
— |
|
|
40.0 |
United States Treasury Notes |
|
|
0.045% |
|
|
4/30/2015 |
|
|
— |
|
|
40.0 |
|||||||||||||||||||||||||
|
— |
|
|
41.3 |
United States Treasury Notes |
|
|
0.061%-0.062% |
|
|
5/14/2015 |
|
|
— |
|
|
41.3 |
|||||||||||||||||||||||||
|
— |
|
|
50.0 |
United States Treasury Notes |
|
|
0.118% |
|
|
5/15/2015 |
|
|
— |
|
|
50.0 |
|||||||||||||||||||||||||
|
— |
|
|
100.0 |
United States Treasury Notes |
|
|
0.063% |
|
|
5/21/2015 |
|
|
— |
|
|
100.0 |
|||||||||||||||||||||||||
|
— |
|
|
19.6 |
United States Treasury Notes |
|
|
0.080% |
|
|
6/15/2015 |
|
|
— |
|
|
19.6 |
|||||||||||||||||||||||||
|
— |
|
|
30.0 |
United States Treasury Notes |
|
|
0.152% |
|
|
6/30/2015 |
|
|
— |
|
|
30.0 |
|||||||||||||||||||||||||
|
— |
|
|
50.0 |
United States Treasury Notes |
|
|
0.130%-0.133% |
|
|
7/15/2015 |
|
|
— |
|
|
50.0 |
|||||||||||||||||||||||||
|
— |
|
|
24.0 |
United States Treasury Notes |
|
|
0.163% |
|
|
7/31/2015 |
|
|
— |
|
|
24.2 |
|||||||||||||||||||||||||
|
— |
|
|
26.0 |
United States Treasury Notes |
|
|
0.097% |
|
|
7/31/2015 |
|
|
— |
|
|
26.0 |
|||||||||||||||||||||||||
|
— |
|
|
50.0 |
United States Treasury Notes |
|
|
0.100%-0.107% |
|
|
8/31/2015 |
|
|
— |
|
|
50.1 |
|||||||||||||||||||||||||
|
— |
|
|
50.0 |
United States Treasury Notes |
|
|
0.118% |
|
|
9/15/2015 |
|
|
— |
|
|
50.0 |
|||||||||||||||||||||||||
|
— |
|
|
50.0 |
United States Treasury Notes |
|
|
0.181% |
|
|
9/30/2015 |
|
|
— |
|
|
50.0 |
|||||||||||||||||||||||||
|
23.9 |
|
|
— |
United States Treasury Notes |
|
|
0.241% |
|
|
11/30/2015 |
|
|
23.8 |
|
|
— |
|||||||||||||||||||||||||
|
15.0 |
|
|
— |
United States Treasury Notes |
|
|
0.250% |
|
|
12/31/2015 |
|
|
15.0 |
|
|
— |
|||||||||||||||||||||||||
36
TIAA REAL ESTATE ACCOUNT
CONSOLIDATED SCHEDULES OF INVESTMENTS
(Dollar values shown in millions)
|
|
|
|
|
|
|
|
|
|
|
|
|
||||||||||||||||||||||||||||||
Principal |
Issuer |
Yield(4) |
Maturity |
Fair Value |
||||||||||||||||||||||||||||||||||||||
September 30, |
December 31, |
|||||||||||||||||||||||||||||||||||||||||
2015 |
2014 |
|||||||||||||||||||||||||||||||||||||||||
|
(Unaudited) |
|
|
|||||||||||||||||||||||||||||||||||||||
|
$ |
|
11.0 |
|
|
$ |
|
— |
United States Treasury Notes |
|
|
0.104% |
|
|
1/15/2016 |
|
|
$ |
|
11.0 |
|
|
$ |
|
— |
|||||||||||||||||
|
47.0 |
|
|
— |
United States Treasury Notes |
|
|
0.226% |
|
|
2/11/2016 |
|
|
47.0 |
|
|
— |
|||||||||||||||||||||||||
|
19.7 |
|
|
— |
United States Treasury Notes |
|
|
0.176%-0.223% |
|
|
2/29/2016 |
|
|
19.7 |
|
|
— |
|||||||||||||||||||||||||
|
50.0 |
|
|
— |
United States Treasury Notes |
|
|
0.375% |
|
|
3/31/2016 |
|
|
50.0 |
|
|
— |
|||||||||||||||||||||||||
|
92.0 |
|
|
— |
United States Treasury Notes |
|
|
0.010%-0.250% |
|
|
4/15/2016 |
|
|
92.0 |
|
|
— |
|||||||||||||||||||||||||
|
|
|
|
|
|
|
||||||||||||||||||||||||||||||||||||
TOTAL UNITED STATES TREASURY SECURITIES |
|
|
$ |
|
1,343.5 |
|
|
$ |
|
1,461.2 |
||||||||||||||||||||||||||||||||
|
|
|
|
|
|
|
||||||||||||||||||||||||||||||||||||
TOTAL OTHER MARKETABLE SECURITIES |
|
|
$ |
|
3,893.8 |
|
|
$ |
|
3,831.1 |
||||||||||||||||||||||||||||||||
|
|
|
|
|
|
|
||||||||||||||||||||||||||||||||||||
TOTAL MARKETABLE SECURITIES |
|
|
$ |
|
5,584.3 |
|
|
$ |
|
5,649.5 |
||||||||||||||||||||||||||||||||
|
|
|
|
|
|
|
||||||||||||||||||||||||||||||||||||
Loan Receivable—0.4% and 0.0% |
||||||||||||||||||||||||||||||||||||||||||
|
|
Borrower |
||||||||||||||||||||||||||||||||||||||||
|
|
|
Charles River Plaza North |
|
|
6.080% |
(9) |
|
|
4/6/2029 |
|
|
100.1 |
|
|
— |
||||||||||||||||||||||||||
|
|
|
|
|
|
|
||||||||||||||||||||||||||||||||||||
TOTAL LOAN RECEIVABLE |
|
|
$ |
|
100.1 |
|
|
$ |
|
— |
||||||||||||||||||||||||||||||||
|
|
|
|
|
|
|
||||||||||||||||||||||||||||||||||||
TOTAL INVESTMENTS |
|
|
$ |
|
23,520.6 |
|
|
$ |
|
22,168.1 |
||||||||||||||||||||||||||||||||
|
|
|
|
|
|
|
||||||||||||||||||||||||||||||||||||
(1) |
The investment has a mortgage loan payable outstanding, as indicated in Note 5. |
|||||||||||||||||||||||||||||||||||||||||||||||||||||||||||||||||||||||||||||||||||||||||||||||||
(2) |
The fair value reflects the Account’s interest in the joint venture and is net of debt. |
|||||||||||||||||||||||||||||||||||||||||||||||||||||||||||||||||||||||||||||||||||||||||||||||||
(3) |
Properties within this investment are located throughout the United States. |
|||||||||||||||||||||||||||||||||||||||||||||||||||||||||||||||||||||||||||||||||||||||||||||||||
(4) |
Yield represents the annualized yield. |
|||||||||||||||||||||||||||||||||||||||||||||||||||||||||||||||||||||||||||||||||||||||||||||||||
(5) |
The market value reflects the final settlement due to the Account. The property investment held within the joint venture was sold during the quarter ended December 31, 2012. |
|||||||||||||||||||||||||||||||||||||||||||||||||||||||||||||||||||||||||||||||||||||||||||||||||
(6) |
The investment was sold February 12, 2015. |
|||||||||||||||||||||||||||||||||||||||||||||||||||||||||||||||||||||||||||||||||||||||||||||||||
(7) |
The investment was sold February 18, 2015. |
|||||||||||||||||||||||||||||||||||||||||||||||||||||||||||||||||||||||||||||||||||||||||||||||||
(8) |
Security exempt from registration under Section 4(2) of the Securities Act of 1933. Such securities are deemed to be liquid and may be sold in transactions exempt from registration only to dealers in that program or other “accredited investors.” At September 30, 2015, the aggregate fair value of these securities was $297.0 million or 1.3% of total investments. |
|||||||||||||||||||||||||||||||||||||||||||||||||||||||||||||||||||||||||||||||||||||||||||||||||
(9) |
Represents the fixed interest rate on this investment. |
|||||||||||||||||||||||||||||||||||||||||||||||||||||||||||||||||||||||||||||||||||||||||||||||||
37
ITEM 2. MANAGEMENT’S DISCUSSION AND ANALYSIS OF FINANCIAL CONDITION AND RESULTS OF OPERATIONS
The following discussion and analysis of the Account’s financial condition and results of operations should be read together with the consolidated financial statements and notes contained in this report and with consideration to the sub-section entitled “Forward-Looking Statements,” which begins below, and the section of the Account’s Annual Report on Form 10-K for the year ended December 31, 2014 (the “Form 10-K”) entitled “Item 1A. Risk Factors.” The past performance of the Account is not indicative of future results.
Forward-Looking Statements
Some statements in this Form 10-Q which are not historical facts may be “forward-looking statements” within the meaning of Section 27A of the Securities Act of 1933, Section 21E of the Securities Exchange Act of 1934 and the Private Securities Litigation Reform Act of 1995. Forward-looking statements include statements about management’s expectations, beliefs, intentions or strategies for the future, include the assumptions and beliefs underlying these forward-looking statements, and are based on current expectations, estimates and projections about the real estate industry, domestic and global economic conditions, including conditions in the credit and capital markets, the sectors, and markets in which the Account invests and operates, and the transactions described in this Form 10-Q. While management believes the assumptions underlying any of its forward-looking statements and information to be reasonable, such information may be subject to uncertainties and may involve certain risks which may be difficult to predict and are beyond management’s control. These risks and uncertainties could cause actual results to differ materially from those contained in any forward-looking statement. These risks and uncertainties include, but are not limited to, the following:
• |
Acquiring and Owning Real Estate: The risks associated with acquiring and owning real property, including general economic and real estate market conditions, the availability of, and economic cost associated with, financing the Account’s properties, the risk that the Account’s properties become too concentrated (whether by geography, sector or tenant mix), competition for acquiring real estate properties, leasing risk (including tenant defaults) and the risk of uninsured losses at properties (including due to terrorism, natural disasters, and acts of violence); |
|||||||||||||||||||||||||||||||||||||||||||||||||||||||||||||||||||||||||||||||||||||||||||||||||
• |
Selling Real Estate: The risk that the sales price of a property might differ, perhaps significantly, from its estimated or appraised value, leading to losses or reduced profits to the Account, the risk that the Account might not be able to sell a property at a particular time for a price which management believes represents its fair or full value, the risk of a lack of availability of financing (for potential purchasers of the Account’s properties), risks associated with disruptions in the credit and capital markets, and the risk that the Account may be required to make significant expenditures before the Account is able to market and/or sell a property; |
|||||||||||||||||||||||||||||||||||||||||||||||||||||||||||||||||||||||||||||||||||||||||||||||||
• |
Valuation: The risks associated with property valuations, including the fact that appraisals can be subjective in a number of respects and the fact that the Account’s appraisals are generally obtained on a quarterly basis and there may be periods in between appraisals of a property during which the value attributed to the property for purposes of the Account’s daily accumulation unit value may be more or less than the actual realizable value of the property; |
|||||||||||||||||||||||||||||||||||||||||||||||||||||||||||||||||||||||||||||||||||||||||||||||||
• |
Borrowing: Risks associated with financing the Account’s properties, including the risk of default on loans secured by the Account’s properties (which could lead to foreclosure), the risk associated with high loan to value ratios on the Account’s properties (including the fact that the Account may have limited, or no net value in such a property), the risk that significant sums of cash could be required to make principal and interest payments on the loans and the risk that the Account may not have the ability to obtain financing or refinancing on favorable terms (or at all), which may be aggravated by general disruptions in credit and capital markets; |
|||||||||||||||||||||||||||||||||||||||||||||||||||||||||||||||||||||||||||||||||||||||||||||||||
• |
Participant Transactions and Cash Management: Investment risk associated with participant transactions, in particular that (i) significant net participant transfers out of the Account may impair our ability to pursue or consummate new investment opportunities that are otherwise attractive to the Account and/ or may result in sales of real estate-related assets to generate liquidity, (ii) significant net participant transfers into the Account may result, on a temporary basis, in our cash holdings and/ or holdings in liquid real estate-related investments exceeding our long-term targeted holding levels |
|||||||||||||||||||||||||||||||||||||||||||||||||||||||||||||||||||||||||||||||||||||||||||||||||
38
|
and (iii) high levels of cash in the Account during times of appreciating real estate values can impair the Account’s overall return; |
|||||||||||||||||||||||||||||||||||||||||||||||||||||||||||||||||||||||||||||||||||||||||||||||||
• |
Joint Venture Investments: The risks associated with joint venture partnerships, including the risk that a co-venturer may have interests or goals inconsistent with that of the Account, that a co-venturer may have financial difficulties, and the risk that the Account may have limited rights with respect to operation of the property and transfer of the Account’s interest; |
|||||||||||||||||||||||||||||||||||||||||||||||||||||||||||||||||||||||||||||||||||||||||||||||||
• |
Regulatory Matters: Uncertainties associated with environmental liability and regulations and other governmental regulatory matters such as zoning laws, rent control laws, and property taxes; |
|||||||||||||||||||||||||||||||||||||||||||||||||||||||||||||||||||||||||||||||||||||||||||||||||
• |
Foreign Investments: The risks associated with purchasing, owning and disposing foreign investments (primarily real estate properties), including political risk, the risk associated with currency fluctuations (whether hedged or not), regulatory and taxation risks and risks of enforcing judgments; |
|||||||||||||||||||||||||||||||||||||||||||||||||||||||||||||||||||||||||||||||||||||||||||||||||
• |
Conflicts of Interest: Conflicts of interest associated with TIAA serving as investment manager of the Account and provider of the liquidity guarantee at the same time as TIAA and its affiliates are serving as an investment manager to other real estate accounts or funds, including conflicts associated with satisfying its fiduciary duties to all such accounts and funds associated with purchasing, selling and leasing of properties; |
|||||||||||||||||||||||||||||||||||||||||||||||||||||||||||||||||||||||||||||||||||||||||||||||||
• |
Required Property Sales: The risk that, if TIAA were to own too large a percentage of the Account’s accumulation units through funding the liquidity guarantee (as determined by the independent fiduciary), the independent fiduciary could require the sales of properties to reduce TIAA’s ownership interest, which sales could occur at times and at prices that depress the sale proceeds to the Account; |
|||||||||||||||||||||||||||||||||||||||||||||||||||||||||||||||||||||||||||||||||||||||||||||||||
• |
Government and Government Agency Securities: Risks associated with investment securities issued by U.S. government agencies and U.S. government-sponsored entities, including the risk that the issuer may not have their securities backed by the full faith and credit of the U.S. government, and that transaction activity may fluctuate significantly from time to time, which could negatively impact the value of the securities and the Account’s ability to dispose of a security at a favorable time; and |
|||||||||||||||||||||||||||||||||||||||||||||||||||||||||||||||||||||||||||||||||||||||||||||||||
• |
Liquid Assets and Securities: Risks associated with investments in real estate-related liquid assets (which could include, from time to time, real estate investment trust (“REIT”) securities and commercial mortgage-backed securities (“CMBS”)), and non-real estate-related liquid assets, including: |
|||||||||||||||||||||||||||||||||||||||||||||||||||||||||||||||||||||||||||||||||||||||||||||||||
• |
Financial/credit risk—Risks that the issuer will not be able to pay principal and interest when due or that the issuer’s earnings will fall; |
|||||||||||||||||||||||||||||||||||||||||||||||||||||||||||||||||||||||||||||||||||||||||||||||||
• |
Market volatility risk—Risk that the changing conditions in financial markets may cause the Account’s investments to experience price volatility; |
|||||||||||||||||||||||||||||||||||||||||||||||||||||||||||||||||||||||||||||||||||||||||||||||||
• |
Interest rate volatility risk—Risk that interest rate volatility may affect the Account’s current income from an investment; and |
|||||||||||||||||||||||||||||||||||||||||||||||||||||||||||||||||||||||||||||||||||||||||||||||||
• |
Deposit/money market risk—Risks that the Account could experience losses if banks fail. |
|||||||||||||||||||||||||||||||||||||||||||||||||||||||||||||||||||||||||||||||||||||||||||||||||
More detailed discussions of certain of these risk factors are contained in the section of the Form 10-K entitled “Item 1A. Risk Factors” and in this section below and also in the section below entitled “Quantitative and Qualitative Disclosures About Market Risk,” that could cause actual results to differ materially from historical experience or management’s present expectations.
Caution should be taken not to place undue reliance on management’s forward-looking statements, which represent management’s views only as of the date that this report is filed. Neither management nor the Account undertake any obligation to update publicly or revise any forward-looking statement, whether as a result of new information, changed assumptions, future events or otherwise.
Commercial real estate market statistics discussed in this section are obtained by the Account from sources that management considers reliable, but some of the data are preliminary for the period ended September 30, 2015 and may be subsequently revised. Prior period data may have been adjusted to reflect updated calculations.
39
Investors should not rely exclusively on the data presented below in forming a judgment regarding the current or prospective performance of the commercial real estate market generally.
ABOUT THE TIAA REAL ESTATE ACCOUNT
The TIAA Real Estate Account was established in February 1995 as an insurance separate account of TIAA and interests in the Account were first offered to eligible participants on October 2, 1995. The Account offers individual and group accumulating annuity contracts (with contributions made on a pre-tax or after-tax basis), as well as individual lifetime and term-certain variable payout annuity contracts (including the payment of death benefits to beneficiaries). Investors are entitled to transfer funds to or from the Account under certain circumstances. Funds invested in the Account for each category of contract are expressed in terms of units, and unit values will fluctuate depending on the Account’s performance.
Investment Objective and Strategy
The Real Estate Account seeks favorable long-term returns primarily through rental income and appreciation of real estate and real estate investments owned by the Account. The Account will also invest in non-real estate-related publicly traded securities and short-term higher quality liquid investments that are easily converted to cash to enable the Account to meet participant redemption requests, purchase or improve properties, or cover other expense needs.
Real Estate-Related Investments. The Account intends to have between 75% and 85% of its net assets invested directly in real estate or real estate-related investments with the goal of producing favorable long-term returns primarily through rental income and appreciation. These investments may consist of:
• |
Direct ownership interests in real estate, |
|||||||||||||||||||||||||||||||||||||||||||||||||||||||||||||||||||||||||||||||||||||||||||||||||
• |
Direct ownership of real estate through interests in joint ventures, |
|||||||||||||||||||||||||||||||||||||||||||||||||||||||||||||||||||||||||||||||||||||||||||||||||
• |
Indirect interests in real estate through real estate-related securities, such as: |
|||||||||||||||||||||||||||||||||||||||||||||||||||||||||||||||||||||||||||||||||||||||||||||||||
• |
equity investments in REITs, which investments may consist of common or preferred stock interests, |
|||||||||||||||||||||||||||||||||||||||||||||||||||||||||||||||||||||||||||||||||||||||||||||||||
• |
real estate limited partnerships, |
|||||||||||||||||||||||||||||||||||||||||||||||||||||||||||||||||||||||||||||||||||||||||||||||||
• |
investments in equity or debt securities of companies whose operations involve real estate (i.e., that primarily own or manage real estate) which may not be REITs, and |
|||||||||||||||||||||||||||||||||||||||||||||||||||||||||||||||||||||||||||||||||||||||||||||||||
• |
conventional commercial mortgage loans, participating mortgage loans, secured mezzanine loans and collateralized mortgage obligations, including CMBS and other similar investments. |
|||||||||||||||||||||||||||||||||||||||||||||||||||||||||||||||||||||||||||||||||||||||||||||||||
The Account’s principal strategy is to purchase direct ownership interests in income-producing real estate, primarily office, industrial, retail and multi-family residential properties. The Account is targeted to hold between 65% and 80% of the Account’s net assets in such direct ownership interests at any time. Historically, approximately 70% of the Account’s net assets have been comprised of such direct ownership interests in real estate.
In addition, while the Account is authorized to hold up to 25% of its net assets in liquid real estate-related securities, such as REITs and CMBS, management intends that the Account will not hold more than 10% of its net assets in such securities on a long-term basis. Traditionally, less than 10% of the Account’s net assets have been comprised of interests in these securities, although the Account has recently held approximately 10% of its net assets in equity REIT securities. In addition, under the Account’s current investment guidelines, the Account is authorized to hold up to 10% of its net assets in CMBS. As of September 30, 2015, REIT securities comprised approximately 7.8% of the Account’s net assets, and the Account held no CMBS as of such date.
Non-Real Estate-Related Investments. The Account will invest the remaining portion of its assets (targeted to be between 15% and 25% of its net assets) in publicly traded, liquid investments; namely:
• |
Short-term government related instruments, including U.S. Treasury bills, |
|||||||||||||||||||||||||||||||||||||||||||||||||||||||||||||||||||||||||||||||||||||||||||||||||
40
• |
Long-term government related instruments, such as securities issued by U.S. government agencies or U.S. government sponsored entities, |
|||||||||||||||||||||||||||||||||||||||||||||||||||||||||||||||||||||||||||||||||||||||||||||||||
• |
Short-term non-government related instruments, such as money market instruments and commercial paper, |
|||||||||||||||||||||||||||||||||||||||||||||||||||||||||||||||||||||||||||||||||||||||||||||||||
• |
Long-term non-government related instruments, such as corporate debt securities, and |
|||||||||||||||||||||||||||||||||||||||||||||||||||||||||||||||||||||||||||||||||||||||||||||||||
• |
Stock of companies that do not primarily own or manage real estate. |
|||||||||||||||||||||||||||||||||||||||||||||||||||||||||||||||||||||||||||||||||||||||||||||||||
However, from time to time, the Account’s non-real estate-related liquid investments may comprise less than 15% (and possibly less than 10%) of its assets (on a net basis and/or a gross basis), especially during and immediately following periods of significant net participant outflows, in particular due to significant participant transfer activity. In addition, the Account, from time to time and on a temporary basis, may hold in excess of 25% of its net assets in non-real estate-related liquid investments, particularly during times of significant inflows into the Account and/or a lack of attractive real estate-related investments available in the market.
Liquid Securities Generally. Primarily due to management’s need to manage fluctuations in cash flows, in particular during and immediately following periods of significant participant net transfer activity into or out of the Account, the Account may, on a temporary basis (i) exceed the upper end of its targeted holdings (currently 35% of the Account’s net assets) in liquid securities of all types, including both publicly traded non-real estate-related liquid investments and liquid real estate-related securities, such as REITs and CMBS, or (ii) be below the low end of its targeted holdings in such liquid securities (currently 15% of the Account’s net assets).
The portion of the Account’s net assets invested in liquid investments of all types may exceed the upper end of its target, for example, if (i) the Account receives a large inflow of money in a short period of time, in particular due to significant participant transfer activity into the Account, (ii) the Account receives significant proceeds from sales or financings of direct real estate assets, (iii) there is a lack of attractive direct real estate investments available on the market, and/or (iv) the Account anticipates more near-term cash needs, including to apply to acquire direct real estate investments, pay expenses or repay indebtedness.
Foreign Investments. The Account from time to time will also make foreign real estate investments. Under the Account’s investment guidelines, investments in direct foreign real estate, together with foreign real estate-related securities and foreign non-real estate-related liquid investments may not comprise more than 25% of the Account’s net assets. However, through the date of this Form 10-Q, such foreign real estate-related investments have never represented more than 7.5% of the Account’s net assets and management does not intend such foreign investments to exceed 10% of the Account’s net assets. As of September 30, 2015, the Account did not hold any foreign real estate investments.
THIRD QUARTER 2015 U.S. ECONOMIC AND COMMERCIAL REAL ESTATE OVERVIEW
The Account invests primarily in high-quality, core commercial real estate in order to meet its investment objective of obtaining favorable long-term returns through rental income and the appreciation of its real estate holdings.
Economic and Capital Markets Overview and Outlook
U.S. Gross Domestic Product (“GDP”) grew by a modest 1.5% in the third quarter of 2015 according to the advanced estimate from the U.S. Bureau of Economic Analysis, following growth of 3.9% in the second quarter. A strong U.S. dollar has slowed domestic exports and production in the U.S. manufacturing sector but was offset by stronger growth in imports, resulting in a neutral impact from global trade. Consumer spending, which accounts for more than two-thirds of U.S. economic activity, grew by 3.2% following a gain of 3.6% in the second quarter, supported by stable job growth in sectors other than manufacturing and the continued benefit of low oil and gasoline prices on U.S. household budgets. Residential fixed investment remains strong, supported by an ongoing recovery in the housing market. Economists expect economic activity to remain strong in the fourth quarter of 2015 and in 2016. Recent trends in key U.S. economic indicators and expectations for the remainder of 2015 and 2016 are summarized in the following table.
41
Economic Indicators*
|
|
|
|
|
|
|
|
|
|
|
|
|
|
|
|
|
||||||||||||||||||||||||||||||||||||||||
|
|
2014 |
4Q 2014 |
1Q 2015 |
2Q 2015 |
|
Forecast |
||||||||||||||||||||||||||||||||||||||||||||||||||
3Q 2015 |
4Q 2015 |
2015 |
2016 |
|||||||||||||||||||||||||||||||||||||||||||||||||||||
|
Economy(1) |
|
|
|
|
|
|
|
|
|
|
|
|
|
|
|
|
||||||||||||||||||||||||||||||||||||||||
|
Gross Domestic Product |
|
|
2.4 |
% |
|
|
|
2.1 |
% |
|
|
|
0.6 |
% |
|
|
|
3.9 |
% |
|
|
|
1.5 |
% |
|
|
|
2.8 |
% |
|
|
|
2.5 |
% |
|
|
|
2.7 |
% |
|
||||||||||||||||
|
Employment Growth (Thousands) |
|
|
3,116 |
|
|
973 |
|
|
586 |
|
|
692 |
|
|
501 |
|
|
635 |
|
|
2,400 |
|
|
2,340 |
||||||||||||||||||||||||||||||||
|
Unemployment Rate |
|
|
6.2 |
% |
|
|
|
5.6 |
% |
|
|
|
5.5 |
% |
|
|
|
5.3 |
% |
|
|
|
5.1 |
% |
|
|
|
5.1 |
% |
|
|
|
5.3 |
% |
|
|
|
4.8 |
% |
|
||||||||||||||||
|
Interest Rates(2) |
|
|
|
|
|
|
|
|
|
|
|
|
|
|
|
|
||||||||||||||||||||||||||||||||||||||||
|
10 Year U.S. Treasury |
|
|
2.5 |
% |
|
|
|
2.3 |
% |
|
|
|
2.0 |
% |
|
|
|
2.2 |
% |
|
|
|
2.2 |
% |
|
|
|
2.3 |
% |
|
|
|
2.2 |
% |
|
|
|
2.7 |
% |
|
||||||||||||||||
Sources: Blue Chip Economic Indicators, Blue Chip Financial Forecasts, BEA, BLS, Federal Reserve, and Moody’s Analytics
* |
Data subject to revision |
|||||||||||||||||||||||||||||||||||||||||||||||||||||||||||||||||||||||||||||||||||||||||||||||||
(1) |
GDP growth rates are annual rates. Quarterly unemployment rates are the reported value for the final month of the quarter while average annual values represent a twelve-month average. |
|||||||||||||||||||||||||||||||||||||||||||||||||||||||||||||||||||||||||||||||||||||||||||||||||
(2) |
Treasury rates are an average over the stated period. |
|||||||||||||||||||||||||||||||||||||||||||||||||||||||||||||||||||||||||||||||||||||||||||||||||
Given the underlying strength of the U.S. economy and steady decline in the unemployment rate, the Federal Reserve appears likely to raise interest rates in the near-term, with the first increase anticipated to occur after the December meeting. Many economists had expected the Federal Reserve to act after its September meeting, but in light of the heightened uncertainties abroad and a slightly softer expected path for inflation, the Federal Open Market Committee (“FOMC”) judged it appropriate to wait. Slow growth in China and other developing countries led to considerable volatility in financial markets in the third quarter of 2015. Stock prices have since recovered and risk spreads have tightened but growth prospects for the global economy remain uncertain. Inflation remains below the FOMC’s 2% target but stronger inflation is expected in the fourth quarter of 2015 and in 2016 as energy prices increase. Yields on ten year U.S. Treasuries, which started the third quarter at 2.2%, dipped below 2.0% late in the quarter when stock markets plunged.
Top economists expect GDP growth to average 2.7% during 2016, driven primarily by ongoing employment gains, steady consumer spending, and continued improvements in the housing market. Healthy employment growth is expected to push the unemployment rate below 5.0% in 2016 and set the stage for meaningful wage gains. Growth in wages should support a healthy level of consumer spending. Further improvement in home sales and housing construction should also generate ancillary economic benefits from increases in construction employment and household spending on home furnishings and home improvements.
Concerns about a global economic slowdown continue to be shared among investors. Weak demand for Chinese exports has curtailed China’s robust economic growth compared to recent years. In Europe, quantitative easing by the European Central Bank appears to have lifted the European economy out of recession. However, European growth remains weak, and Greece’s financial problems will remain a drag on future European economic growth until they are addressed. For the U.S. economy, weaker global growth does not substantially affect near term prospects, but a downturn in China or elsewhere as a result of a stock market crash, a sovereign government default, or other significant event would likely have significant repercussions to the global economy and financial markets. By comparison, U.S. GDP growth would slow only modestly during a period of weaker global growth and weaker domestic manufacturing activity and exports due to continued strength of the dollar. U.S. real estate markets are driven primarily by domestic economic forces and are largely insulated from the direct impacts of the global economy.
GDP growth of 2.8% is expected in the fourth quarter of 2015 and 2.7% in the first half of 2016. Similarly, employment is expected to grow by 2.3 million in 2016 which is consistent with healthy commercial real estate demand. GDP and employment growth of this magnitude, in turn, would provide the backdrop for further improvement in commercial real estate market conditions
Real Estate Market Conditions and Outlook
Industry sources such as CB Richard Ellis Econometric Advisors calculate vacancy based on square footage. In keeping with industry standards, the Account’s vacancy data is calculated as a percentage of net rentable space leased, weighted by square footage that is under contractual lease obligation in effect at the end of the period.
42
Commercial real estate markets and sales activity remained healthy during the third quarter of 2015. Data from CB Richard Ellis Econometric Advisors (“CBRE-EA”) indicate that tenant demand for space remained steady across all sectors. Construction has increased from the lows of recent years but remains moderate, and real estate market fundamentals improved further in all property sectors during the third quarter. Data from Real Capital Analytics indicate that sales of office, industrial, retail, multi-family, and other commercial properties totaled $109 billion in the third quarter of 2015 as compared with $107 billion in the third quarter of 2014 and $117 billion in second quarter 2015. Property sales through the third quarter of 2015 are up 26% compared with the same period of 2014.
Green Street Advisors’ Commercial Property Price Index increased 2.1% during the third quarter of 2015 following a 3.3% increase in the second quarter of 2015. According to Green Street Advisors, “Commercial real estate values continue to reach new highs, though the rate of appreciation has slowed compared to earlier in the year.”
The NAREIT All Equity REIT (“NAREIT”) index registered a 1.0% gain during the third quarter of 2015 following a decline of 9.1% in the second quarter. As with the overall stock market, REITs experienced significant volatility during the third quarter when investors became concerned about slowing global growth. While REITs have historically exhibited higher return volatility than privately owned commercial real estate, NAREIT returns have been positive over the most recent three, five, seven and ten year periods. In its October 1, 2015 Real Estate Securities Monthly report, Green Street Advisors concluded that while REIT share prices, on average, were in the upper end of its fair value range, they were still higher priced when compared to the fixed-income market and S&P 500.
Commercial property returns were positive for the 23rd consecutive quarter in the third quarter of 2015. For the quarter ending September 30, 2015, NCREIF Fund Index Open-End Diversified Core Equity (“NFI-OCDE”) Equal Weight returns, net of fees, were 3.40%. By comparison, the total return for second quarter 2015 was 3.70%. The NFI-ODCE is a leveraged fund-level return index which includes property investments at ownership share, cash balances, and other investments.
Data for the Account’s top five markets in terms of market value as of September 30, 2015 are provided below. These markets represent 52.1% of the Account’s total real estate portfolio.
|
|
|
|
|
|
|
|
|
||||||||||||||||||||
|
Top 5 Metro Areas by Fair Market Value** |
Account % Leased |
Number of |
Metro Area |
Metro Area |
||||||||||||||||||||||||
|
||||||||||||||||||||||||||||
|
New York-Jersey City-White Plains, NY-NJ |
|
|
95.6% |
|
|
12 |
|
|
14.6% |
|
|
11.0% |
||||||||||||||||
|
Washington-Arlington-Alexandria, DC-VA-MD-WV |
|
|
85.3% |
|
|
13 |
|
|
14.3% |
|
|
10.8% |
||||||||||||||||
|
Los Angeles-Long Beach-Glendale, CA |
|
|
76.8% |
|
|
13 |
|
|
11.2% |
|
|
8.4% |
||||||||||||||||
|
Boston, MA |
|
|
89.7% |
|
|
4 |
|
|
6.7% |
|
|
5.0% |
||||||||||||||||
|
Seattle-Bellevue-Everett, WA |
|
|
88.4% |
|
|
5 |
|
|
5.3% |
|
|
4.0% |
||||||||||||||||
* |
Weighted by fair market value, which differs from the calculations provided for market comparisons to CBRE-EA data and are used here to reflect the fair market value of the Account’s monetary investments in those markets. |
|||||||||||||||||||||||||||||||||||||||||||||||||||||||||||||||||||||||||||||||||||||||||||||||||
** |
Account metro area exposure as determined by the US Office of Management and Budget’s 2010 standards for delineating metropolitan areas. Exposure was previously determined based on the 2000 standards. The new standards have had no material impact on Account exposure in its top metropolitan markets. |
|||||||||||||||||||||||||||||||||||||||||||||||||||||||||||||||||||||||||||||||||||||||||||||||||
*** |
Wholly owned properties are represented at fair value and gross of any debt, while joint venture properties are represented at the net equity value. |
|||||||||||||||||||||||||||||||||||||||||||||||||||||||||||||||||||||||||||||||||||||||||||||||||
As discussed in detail below, the market value weighted occupancy of properties in the Los Angeles metropolitan area declined to 76.8% during the quarter due to increased vacancy at the Account’s largest office property. Excluding this property, the weighted average occupancy of the Account’s properties in the Los Angeles metropolitan area is 86.5%.
Office
According to CBRE-EA, the national office vacancy rate declined to 13.4% in the third quarter of 2015 as compared to 13.5% in the second quarter of 2015. The national office vacancy rate is now at its lowest level
43
since second quarter 2008. The vacancy rate for the Account’s office portfolio increased to 14.0% as of third quarter 2015 from 12.1% in the second quarter of 2015. The increase in the Account’s office vacancy rate was due primarily to increased vacancy at one of the Account’s largest properties in Los Angeles which is held in a joint venture. Excluding this property, the Account’s vacancy rate was 11.2%. Management has known for some time that two large tenants planned to move out of the property when their leases expired and has already been marketing the space to prospective tenants. A sizeable portion of the space has already been leased for the expansion of an existing tenant in the building. Los Angeles’s office market fundamentals are healthy, and re-leasing of the remaining space is expected to generate incremental income since current market rents are higher than the existing tenants’ rent. In Washington D.C., the Account’s top office market, the average vacancy rate of the Account’s properties has declined gradually in recent quarters although market leasing activity remains slow as a result of weaker demand from federal government agencies and law firms’ efforts to reduce their space requirements. The average vacancy of the Account’s properties in Boston declined to 10.9% in the quarter due to recent leasing at one of the Account’s larger properties.
|
|
|
|
|
|
|
|
|
|
|
|
|
|
|
||||||||||||||||||||||||||||||
|
|
Account Square |
Market |
|||||||||||||||||||||||||||||||||||||||||
|
|
|||||||||||||||||||||||||||||||||||||||||||
|
|
2015 Q3 |
2015 Q2 |
2015 Q3 |
2015 Q2 |
|||||||||||||||||||||||||||||||||||||||
|
|
|||||||||||||||||||||||||||||||||||||||||||
|
Office |
Metropolitan Area |
Total Sector |
% of Total |
|
|
14.0% |
|
|
12.1% |
|
|
13.4% |
|
|
13.5% |
|||||||||||||||||||||||||||||
|
||||||||||||||||||||||||||||||||||||||||||||
1 |
Washington-Arlington-Alexandria, DC-VA-MD-WV |
|
|
$ |
|
1,524.2 |
|
|
6.5% |
|
|
13.1% |
|
|
13.4% |
|
|
16.1% |
|
|
16.0% |
|||||||||||||||||||||||
2 |
Boston, MA |
|
|
1,148.9 |
|
|
4.9% |
|
|
10.9% |
|
|
13.0% |
|
|
10.3% |
|
|
10.1% |
|||||||||||||||||||||||||
3 |
Los Angeles-Long Beach-Glendale, CA |
|
|
903.4 |
|
|
3.8% |
|
|
42.2% |
|
|
18.5% |
|
|
14.8% |
|
|
14.5% |
|||||||||||||||||||||||||
4 |
New York-Jersey City-White Plains, NY-NJ |
|
|
886.9 |
|
|
3.8% |
|
|
5.5% |
|
|
8.0% |
|
|
8.9% |
|
|
9.0% |
|||||||||||||||||||||||||
5 |
San Francisco-Redwood City-South San Francisco, CA |
|
|
724.6 |
|
|
3.1% |
|
|
4.6% |
|
|
5.6% |
|
|
6.5% |
|
|
6.7% |
|||||||||||||||||||||||||
* |
Source: CBRE - EA. Vacancy is defined as the percentage of space vacant. The Account’s vacancy is defined as the value-weighted percentage of unleased space. |
|||||||||||||||||||||||||||||||||||||||||||||||||||||||||||||||||||||||||||||||||||||||||||||||||
Historically, the financial services sector has been a significant source of office space demand; however, demand collapsed during the recent period of economic decline. The financial services sector added 27,000 jobs in the third quarter and 37,000 in the second quarter, a signal that demand for office space driven by financial services will likely increase in the near-term. Professional and business services added 98,000 jobs in the third quarter and 202,000 in the second quarter, an additional signal that demand for office space will increase in the near term. One exception within the sector is legal services where employment is growing slowly and firms are economizing on space by reducing per employee space allocations and eliminating conference rooms and libraries, a law industry trend which is likely to persist in 2016. Demand from traditional office users has been supplemented by robust demand from technology, media and entertainment companies in markets such as San Francisco, Seattle, Los Angeles, and New York. Houston had benefited from growth in energy-related industries but recent declines in the price of oil have slowed demand from energy companies. On the whole, office market conditions should continue to improve during the fourth quarter of 2015 given current employment growth trends.
Industrial
Industrial market conditions are influenced to a large degree by growth in GDP, industrial production and international trade flows. U.S. industrial market conditions remained healthy in the third quarter due to the continued growth of the U.S. economy. While exports and manufacturing activity have slowed due to the appreciation of the dollar, growth in imports has been strong, and had more than offset the decline in exports. Industrial production increased 0.9% through August 2015, but a 3.2% decline in oil and gas production weighed on the overall average. Production of consumer goods was stronger and saw a 2.6% increase. During the third quarter of 2015, the national industrial availability rate fell to 9.6% as compared to 9.8% in the second quarter of 2015. The national industrial availability rate has declined steadily from a peak of 14.5% in mid-2010.
44
The vacancy rate for the Account’s industrial property portfolio declined to an average of 8.1% in the third quarter of 2015 compared with 9.5% in the second quarter of 2015. As shown in the table below, the average vacancy rate of the Account’s properties in each of its top five markets remained well below their respective market averages. The Account’s overall vacancy rate also declined during the quarter due to increased leasing in larger properties in Dallas and Washington D.C.
|
|
|
|
|
|
|
|
|
|
|
|
|
|
|
||||||||||||||||||||||||||||||
|
|
Account Square |
Market |
|||||||||||||||||||||||||||||||||||||||||
|
|
|||||||||||||||||||||||||||||||||||||||||||
|
|
2015 Q3 |
2015 Q2 |
2015 Q3 |
2015 Q2 |
|||||||||||||||||||||||||||||||||||||||
|
|
|||||||||||||||||||||||||||||||||||||||||||
|
Industrial |
Metropolitan Area |
Total Sector |
% of Total |
|
|
8.1% |
|
|
9.5% |
|
|
9.6% |
|
|
9.8% |
|||||||||||||||||||||||||||||
|
||||||||||||||||||||||||||||||||||||||||||||
1 |
Riverside-San Bernardino-Ontario, CA |
|
|
$ |
|
825.1 |
|
|
3.5% |
|
|
2.8% |
|
|
3.0% |
|
|
7.0% |
|
|
6.9% |
|||||||||||||||||||||||
2 |
Los Angeles-Long Beach-Glendale, CA |
|
|
263.2 |
|
|
1.1% |
|
|
3.0% |
|
|
4.1% |
|
|
4.5% |
|
|
4.9% |
|||||||||||||||||||||||||
3 |
Tacoma-Lakewood, WA |
|
|
233.1 |
|
|
1.0% |
|
|
5.3% |
|
|
4.9% |
|
|
6.0% |
|
|
6.5% |
|||||||||||||||||||||||||
4 |
Dallas-Plano-Irving, TX |
|
|
231.0 |
|
|
1.0% |
|
|
2.9% |
|
|
5.1% |
|
|
10.4% |
|
|
10.6% |
|||||||||||||||||||||||||
5 |
New York-Jersey City-White Plains, NY-NJ |
|
|
200.6 |
|
|
0.9% |
|
|
0.0% |
|
|
0.0% |
|
|
10.4% |
|
|
10.8% |
|||||||||||||||||||||||||
* |
Source: CBRE-EA. |
|||||||||||||||||||||||||||||||||||||||||||||||||||||||||||||||||||||||||||||||||||||||||||||||||
Market availability is the percentage of space available for rent. Account vacancy is the value-weighted percentage of unleased space.
Note—CBRE-EA considers Tacoma part of the Seattle industrial market. Market availability rates reflect the Seattle total.
Multi-Family
Apartment demand is generated from a combination of economic, demographic and socio-economic factors including job growth, household formations, and changes in the U.S. homeownership rate. U.S. apartment markets remained tight despite an increase in construction. The national vacancy rate averaged 4.2% in the third quarter of 2015 as compared with 4.3% in the second quarter of 2015. Markets have thus far readily absorbed recent construction but additional supply is slated to be delivered in the rest of 2015 and 2016. Multi-family permits, an indicator of future supply, have risen to their highest level in three decades. While recent unit demand has been robust, rent growth is expected to moderate in 2016 given anticipated construction. However, apartment market prospects remain promising due to favorable demographic trends including the growing numbers and strengthening employment growth of 25 to 34 year-olds who are largely renters.
The vacancy rate of the Account’s multi-family portfolio remained steady at an average of 8.2% in the third quarter of 2015. The Account’s vacancy rate is typically higher than both the national average and metro market averages in large part because the Account, like many other large apartment owners, utilizes revenue optimization software to maximize rental income and therefore maintains a sufficient stock of available units for anticipated demand. The Account’s vacancy rate is also higher because of the recent acquisition of two newly constructed projects that were vacant when acquired. In Washington D.C., the portfolio vacancy rate declined to 12.0% in the third quarter from 16.4% previously in large part due to leasing activity at the two recently acquired newly constructed properties. In Fort Lauderdale, the average vacancy rate of properties
45
owned by the Account declined to 8.1% from 11.0% due to strong leasing activity at two of the Account’s properties.
|
|
|
|
|
|
|
|
|
|
|
|
|
|
|
||||||||||||||||||||||||||||||
|
|
Account Square |
Market |
|||||||||||||||||||||||||||||||||||||||||
|
|
|||||||||||||||||||||||||||||||||||||||||||
|
|
2015 Q3 |
2015 Q2 |
2015 Q3 |
2015 Q2 |
|||||||||||||||||||||||||||||||||||||||
|
|
|||||||||||||||||||||||||||||||||||||||||||
|
Apartment |
Metropolitan Area |
Total Sector |
% of Total |
|
|
8.2% |
|
|
8.2% |
|
|
4.2% |
|
|
4.3% |
|||||||||||||||||||||||||||||
|
||||||||||||||||||||||||||||||||||||||||||||
1 |
New York-Jersey City-White Plains, NY-NJ |
|
|
$ |
|
1,010.8 |
|
|
4.3% |
|
|
7.0% |
|
|
3.7% |
|
|
3.0% |
|
|
2.8% |
|||||||||||||||||||||||
2 |
Washington-Arlington-Alexandria, DC-VA-MD-WV |
|
|
785.1 |
|
|
3.3% |
|
|
12.0% |
|
|
16.4% |
|
|
4.4% |
|
|
4.7% |
|||||||||||||||||||||||||
3 |
Los Angeles-Long Beach-Glendale, CA |
|
|
519.5 |
|
|
2.2% |
|
|
8.7% |
|
|
8.7% |
|
|
3.8% |
|
|
3.9% |
|||||||||||||||||||||||||
4 |
Fort Lauderdale-Pompano Beach-Deerfield Beach, FL |
|
|
296.4 |
|
|
1.3% |
|
|
8.1% |
|
|
11.0% |
|
|
4.2% |
|
|
4.1% |
|||||||||||||||||||||||||
5 |
Denver-Aurora-Lakewood, CO |
|
|
291.8 |
|
|
1.2% |
|
|
7.0% |
|
|
5.1% |
|
|
4.2% |
|
|
3.9% |
|||||||||||||||||||||||||
* |
Source: CBRE-EA. |
|||||||||||||||||||||||||||||||||||||||||||||||||||||||||||||||||||||||||||||||||||||||||||||||||
Market vacancy is the percentage of units vacant. The Account’s vacancy is the value-weighted percentage of unleased units.
Retail
Retail sales are driven by a variety of economic, demographic and socio-economic factors including job and wage growth, population growth, and household savings rates. Retail sales growth remained modest in the third quarter of 2015. Preliminary data from the U.S. Census Bureau showed that retail sales excluding motor vehicles and parts grew 1.0% in the third quarter as compared with second quarter 2015. Similarly, retail markets experienced minimal improvement in the quarter. Availability rates in neighborhood and community centers inched down to 11.3% as of the third quarter of 2015 as compared with 11.4% during the second quarter. The vacancy rate for the Account’s retail portfolio remained low, averaging 5.3% during the third quarter as compared with 5.6% in the second quarter. The vacancy rate of the Account’s retail portfolio remained below the national average due largely to the overall high quality of the retail portfolio as the vacancy rate for the large majority of the Account’s properties is less than 10%. For example, regional malls, which generally have lower vacancy rates nationwide, account for approximately one-third of the portfolio’s square footage and have an average vacancy rate of 3.7%. With minimal vacancy, Management intends to drive income growth and value in the Account’s retail portfolio by selective renovations, replacing underperforming tenants, and other management intensive activities.
Outlook
Commercial real estate fundamentals showed further improvement during the third quarter of 2015 due to ongoing employment growth, modest construction, and low interest rates. Competition for top properties remained intense, but commercial real estate continued to offer attractive returns relative to other asset classes. Market conditions remain strongest in metro areas with sizeable technology, medical and biotechnology sectors. Energy related markets experienced strong growth in 2013 and much of 2014 but are now grappling with the impacts of the sharp decline in oil prices which have caused oil companies to cut exploration budgets and begin layoffs. Conditions have also remained weak in metro areas with sizeable U.S. government and defense sectors and are likely to remain so until spending in those sectors recovers. While the regional outlook differs modestly, prospects for the U.S. economy as a whole are strong. The global economic outlook is less clear, and geopolitical risks remain. Nonetheless, the U.S. economy appears positioned for continued growth even if the global economy softens, and real estate markets are likely to experience further improvement in the remainder of 2015 and well into 2016 if U.S. economic conditions fall in-line with economists’ forecasts.
Consistent with the Account’s investment strategy, the Account entered into a commercial real estate debt investment during the third quarter, acquiring a $100 million mezzanine loan on Class A research laboratory
46
condominium located adjacent to a major hospital and medical campus in the Northeast. The investment provides an attractive return and is secured by a high quality property in an irreplaceable location. The Account also acquired two industrial and two multi-family properties during the quarter; there was no disposition activity during the third quarter of 2015. Investment activities during the quarter were consistent with the Account’s strategy of investing in high quality properties in target markets and reducing exposure to non-target markets and assets.
Management continued to maintain the Account’s income returns through diligent property management and leasing in combination with expense management. As of the third quarter of 2015, the Account’s holdings were 91.4% leased as compared with 91.2% as of the second quarter of 2015. During the third quarter of 2015, the Account generated a 2.00% total return. The Account’s real estate assets generated a leveraged 2.85% total return. As shown in the graph below, real estate asset returns for the third quarter of 2015 were the twenty-second consecutive quarter of positive income and capital returns.
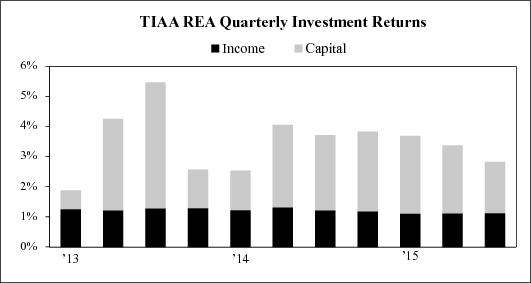
Management intends to continue to manage the Account’s cash position in a manner that maintains adequate liquidity reserves for new property acquisitions, capital expenditures for existing properties, property and Account operating expenses, the Account’s targeted cash holdings, and the potential redemption of units from participants. Management plans to balance potential property acquisitions with expected financing and disposition activities while maintaining adequate cash reserves, with the ultimate goal of generating incremental Account returns, as well as maintaining the Account’s diversification across property sectors at or close to its current sector weightings. In addition to ongoing investment activities, management will carefully evaluate opportunities to place commercial mortgage debt on recent acquisitions and refinance existing debt on assets at lower interest rates in order to further reduce the Account’s overall weighted cost of capital. Management has significantly reduced the Account’s overall weighted cost of capital in recent years and believes that the current interest rate environment can still provide opportunities to further reduce the overall weighted cost of capital and benefit Account returns by locking in low cost long-term mortgage financing. However, refinancing activities will only be undertaken provided mortgage proceeds can be reinvested in real estate properties or other investments that will benefit overall Account returns.
A portion of the Account’s liquid assets is invested in publicly traded REITs, which provides incremental exposure to U.S. commercial real estate, an attractive dividend yield, and a high degree of liquidity. The Account’s $1.7 billion portfolio consists of REIT stocks that closely replicate the NAREIT Index, thereby providing the Account with exposure to a diverse mix of property types and geographic markets. By effectively replicating the index, the Account portfolio avoids the risks associated with concentrated investments in any particular company or sector. The return profile of REITs is currently and has historically been favorable to corporate bonds and government agency debt, albeit with added short term volatility as compared to direct investments in commercial real estate property. The Account’s REIT investments, inclusive of dividends, generated a return of 0.94% during the third quarter of 2015, consistent with the 1.0% return in the NAREIT Index during the quarter.
47
Based on the economic and real estate market outlook for 2016, management will maintain its focus on selected property types in target markets with an emphasis on high quality properties in prime urban locations and dense suburban locations where there is limited available land for additional development. These may include properties that have recently completed construction and have not yet begun leasing or are in their initial lease-up phase, and on a limited basis, properties that are ground up development projects in selected markets with limited acquisition opportunities. This investment strategy will provide greater opportunity to gain access to properties in prime locations in major metropolitan areas which have exceptional long term prospects and which management expects will lease at a steady pace given local market conditions. Management is also considering select opportunities to invest internationally and in the U.S. student housing sector. Management will also evaluate additional opportunities to invest in commercial debt including conventional commercial mortgage loans, participating mortgage loans, secured mezzanine loans and commercial mortgage backed securities. Given initial cash-on-cash returns for new acquisitions, management will also evaluate prospective acquisitions based on short- and long-term growth potential, purchase price relative to replacement cost, and portfolio diversification benefits. Emphasis will be given to institutional quality properties with strong occupancy histories and favorable tenant rollover schedules. Management believes that a disciplined investment strategy coupled with further strengthening of the U.S. economy and U.S. real estate market conditions will position the Account for favorable long-term performance.
Investments as of September 30, 2015
As of September 30, 2015, the Account had total net assets of $21.7 billion, a 9.4% increase from December 31, 2014. The increase in the Account’s net assets from December 31, 2014 to September 30, 2015 was primarily driven by net realized gains and appreciation in value of the Account’s investments.
As of September 30, 2015, the Account owned a total of 117 real estate investments (102 of which were wholly owned, 15 of which were held in joint ventures). The real estate portfolio included 29 office investments (including four held in joint ventures), 32 industrial investments (including one held in a joint venture), 34 apartment investments (including one held in a joint venture), 20 retail investments (including eight held in joint ventures), one 75% owned joint venture interest in a portfolio of storage facilities, and one leasehold interest encumbered by a ground lease. Of the real estate investments, 28 are subject to debt (including 10 joint venture investments).
The outstanding principal on mortgage loans payable on the Account’s wholly owned real estate portfolio as of September 30, 2015 was $1.8 billion. The Account’s proportionate share of outstanding principal on mortgage loans payable within its joint venture investments was $1.6 billion. The Account’s proportionate share of mortgage loans payable within its joint venture investments is netted against the underlying properties when determining the joint venture investment’s fair value presented on the consolidated schedules of investments. When the mortgage loans payable within the joint venture investments are considered, total outstanding principal on the Account’s portfolio as of September 30, 2015 was $3.4 billion, which represented a loan to value ratio of 13.5%. The Account currently has no Account-level debt.
Management believes that the Account’s real estate portfolio is diversified by location and property type. The Account’s largest investment, 1001 Pennsylvania Avenue located in Washington, D.C., represented 4.6% of total real estate investments and 3.5% of total investments.
48
The following tables reflect the diversification of the Account’s real estate assets by region and property type and list its ten largest investments. All information is based on the fair values of the investments at September 30, 2015.
Diversification by Fair Value(1)
|
|
|
|
|
|
|
|
|
|
|
|||||||||||||||||||||||||
|
|
East |
West |
South |
Midwest |
Total |
||||||||||||||||||||||||||||||
|
Office |
|
|
20.9 |
% |
|
|
|
14.2 |
% |
|
|
|
6.7 |
% |
|
|
|
0.3 |
% |
|
|
|
42.1 |
% |
|
||||||||||
|
Apartment |
|
|
10.9 |
% |
|
|
|
9.1 |
% |
|
|
|
4.6 |
% |
|
|
|
— |
|
|
24.6 |
% |
|
||||||||||||
|
Retail |
|
|
3.8 |
% |
|
|
|
3.8 |
% |
|
|
|
7.7 |
% |
|
|
|
0.4 |
% |
|
|
|
15.7 |
% |
|
||||||||||
|
Industrial |
|
|
1.6 |
% |
|
|
|
7.8 |
% |
|
|
|
4.2 |
% |
|
|
|
0.9 |
% |
|
|
|
14.5 |
% |
|
||||||||||
|
Other(2) |
|
|
2.8 |
% |
|
|
|
0.2 |
% |
|
|
|
0.1 |
% |
|
|
|
— |
|
|
3.1 |
% |
|
||||||||||||
|
|
|
|
|
|
|
|
|
|
|
|
|||||||||||||||||||||||||
|
Total |
|
|
40.0 |
% |
|
|
|
35.1 |
% |
|
|
|
23.3 |
% |
|
|
|
1.6 |
% |
|
|
|
100.0 |
% |
|
||||||||||
|
|
|
|
|
|
|
|
|
|
|
|
|||||||||||||||||||||||||
(1) |
Wholly owned properties are represented at fair value and gross of any debt, while joint venture properties are represented at the net equity value. |
|||||||||||||||||||||||||||||||||||||||||||||||||||||||||||||||||||||||||||||||||||||||||||||||||
(2) |
Represents interest in Storage Portfolio investment and a fee interest encumbered by a ground lease real estate investment. |
|||||||||||||||||||||||||||||||||||||||||||||||||||||||||||||||||||||||||||||||||||||||||||||||||
Properties in the “East” region are located in: CT, DC, DE, KY, MA, MD, ME, NC, NH, NJ, NY, PA, RI, SC, VA, VT, WV
Properties in the “West” region are located in: AK, AZ, CA, CO, HI, ID, MT, NM, NV, OR, UT, WA, WY
Properties in the “South” region are located in: AL, AR, FL, GA, LA, MS, OK, TN, TX
Properties in the “Midwest” region are located in: IA, IL, IN, KS, MI, MN, MO, ND, NE, OH, SD, WI
Top Ten Largest Real Estate Investments
|
|
|
|
|
|
|
|
|
|
|
|
|
|||||||||||||||
Property Investment Name |
City |
State |
Type |
Fair Value |
Property as a |
Property as a |
|||||||||||||||||||||
1001 Pennsylvania Avenue |
Washington |
DC |
Office |
|
|
$ |
|
820.7 |
(2) |
|
|
|
4.6 |
% |
|
|
|
3.5 |
% |
|
|||||||
The Florida Mall |
Orlando |
FL |
Retail |
|
|
626.6 |
(3) |
|
|
|
3.5 |
% |
|
|
|
2.7 |
% |
|
|||||||||
Colorado Center |
Santa Monica |
CA |
Office |
|
|
549.5 |
(4) |
|
|
|
3.1 |
% |
|
|
|
2.3 |
% |
|
|||||||||
DDR Joint Venture |
Various |
USA |
Retail |
|
|
501.6 |
(5) |
|
|
|
2.8 |
% |
|
|
|
2.1 |
% |
|
|||||||||
99 High Street |
Boston |
MA |
Office |
|
|
498.3 |
|
|
2.8 |
% |
|
|
|
2.1 |
% |
|
|||||||||||
Fourth and Madison |
Seattle |
WA |
Office |
|
|
489.4 |
(6) |
|
|
|
2.8 |
% |
|
|
|
2.1 |
% |
|
|||||||||
425 Park Avenue |
New York |
NY |
Ground Lease |
|
|
440.0 |
|
|
2.5 |
% |
|
|
|
1.9 |
% |
|
|||||||||||
501 Boylston Street |
Boston |
MA |
Office |
|
|
434.6 |
|
|
2.5 |
% |
|
|
|
1.8 |
% |
|
|||||||||||
780 Third Avenue |
New York |
NY |
Office |
|
|
420.1 |
(7) |
|
|
|
2.4 |
% |
|
|
|
1.8 |
% |
|
|||||||||
Ontario Industrial Portfolio |
Ontario |
CA |
Industrial |
|
|
414.3 |
|
|
2.3 |
% |
|
|
|
1.8 |
% |
|
|||||||||||
(1) |
Fair Value as reported in the September 30, 2015 Consolidated Schedule of Investments. Wholly owned properties are represented at fair value and gross of any debt, while joint venture properties are represented at the net equity value. |
|||||||||||||||||||||||||||||||||||||||||||||||||||||||||||||||||||||||||||||||||||||||||||||||||
(2) |
This property is presented gross of debt. The value of the property less the fair value of leverage is $485.7 million. |
|||||||||||||||||||||||||||||||||||||||||||||||||||||||||||||||||||||||||||||||||||||||||||||||||
(3) |
This property is held in a joint venture with Simon Property Group, L.P., in which the Account hold a 50% interest, and is presented net of debt. As of September 30, 2015, this debt had a fair value of $187.4 million. |
|||||||||||||||||||||||||||||||||||||||||||||||||||||||||||||||||||||||||||||||||||||||||||||||||
(4) |
This property is held in a joint venture with EOP Operating LP, in which the Account holds a 50% interest. |
|||||||||||||||||||||||||||||||||||||||||||||||||||||||||||||||||||||||||||||||||||||||||||||||||
(5) |
This investment is held in a joint venture with DDR Corp., in which the Account holds an 85% interest, and consists of 26 retail properties located in 11 states and is presented net of debt. As of September 30, 2015, this debt had a fair value of $691.3 million. |
|||||||||||||||||||||||||||||||||||||||||||||||||||||||||||||||||||||||||||||||||||||||||||||||||
(6) |
This property is presented gross of debt. The value of the property less the fair value of leverage is $289.6 million. |
|||||||||||||||||||||||||||||||||||||||||||||||||||||||||||||||||||||||||||||||||||||||||||||||||
(7) |
This property is presented gross of debt. The value of the property less the fair value of leverage is $252.0 million. |
|||||||||||||||||||||||||||||||||||||||||||||||||||||||||||||||||||||||||||||||||||||||||||||||||
At September 30, 2015, the Account held 75.2% of its total investments in real estate and real estate joint ventures. The Account also held investments in government agency notes representing 9.0% of total investments, real estate-related equity securities representing 7.2% of total investments, U.S. Treasury securities representing 5.7% of total investments, commercial paper representing 1.9% of total investments, real estate limited partnerships representing 0.6% of total investments and a loan receivable representing 0.4% of total investments.
49
Results of Operations
Nine months ended September 30, 2015 compared to nine months ended September 30, 2014
Performance
The Account’s total return was 6.43% for the nine months ended September 30, 2015 as compared to 8.19% for the nine months ended September 30, 2014. The Account’s annualized total returns over the past one, three, five, and ten year periods ended September 30, 2015 were 10.40%, 10.14%, 11.47%, and 4.39%, respectively. As of September 30, 2015, the Account’s annualized total return since inception was 6.50%.
Net Investment Income
The table below shows the results of operations for the nine months ended September 30, 2015 and 2014 and the dollar and percentage changes for those periods (dollars in millions, unaudited).
|
|
|
|
|
|
|
|
|
||||||||||||||||||||
|
|
For the Nine |
Change |
||||||||||||||||||||||||||
2015 |
2014 |
$ |
% |
|||||||||||||||||||||||||
|
INVESTMENT INCOME |
|
|
|
|
|
|
|
|
||||||||||||||||||||
|
Real estate income, net: |
|
|
|
|
|
|
|
|
||||||||||||||||||||
|
Rental income |
|
|
$ |
|
676.4 |
|
|
$ |
|
669.3 |
|
|
$ |
|
7.1 |
|
|
1.1 |
% |
|
||||||||
|
|
|
|
|
|
|
|
|
|
||||||||||||||||||||
|
Real estate property level expenses: |
|
|
|
|
|
|
|
|
||||||||||||||||||||
|
Operating expenses |
|
|
154.5 |
|
|
153.8 |
|
|
0.7 |
|
|
0.5 |
% |
|
||||||||||||||
|
Real estate taxes |
|
|
107.4 |
|
|
100.6 |
|
|
6.8 |
|
|
6.8 |
% |
|
||||||||||||||
|
Interest expense |
|
|
63.6 |
|
|
73.2 |
|
|
(9.6 |
) |
|
|
|
-13.1 |
% |
|
||||||||||||
|
|
|
|
|
|
|
|
|
|
||||||||||||||||||||
|
Total real estate property level expenses |
|
|
325.5 |
|
|
327.6 |
|
|
(2.1 |
) |
|
|
|
-0.6 |
% |
|
||||||||||||
|
|
|
|
|
|
|
|
|
|
||||||||||||||||||||
|
Real estate income, net |
|
|
350.9 |
|
|
341.7 |
|
|
9.2 |
|
|
2.7 |
% |
|
||||||||||||||
|
Income from real estate joint ventures and limited partnerships |
|
|
104.4 |
|
|
106.9 |
|
|
(2.5 |
) |
|
|
|
-2.3 |
% |
|
||||||||||||
|
Interest |
|
|
6.4 |
|
|
2.1 |
|
|
4.3 |
|
|
204.8 |
% |
|
||||||||||||||
|
Dividends |
|
|
35.2 |
|
|
30.5 |
|
|
4.7 |
|
|
15.4 |
% |
|
||||||||||||||
|
|
|
|
|
|
|
|
|
|
||||||||||||||||||||
|
TOTAL INVESTMENT INCOME |
|
|
496.9 |
|
|
481.2 |
|
|
15.7 |
|
|
3.3 |
% |
|
||||||||||||||
|
|
|
|
|
|
|
|
|
|
||||||||||||||||||||
|
Expenses: |
|
|
|
|
|
|
|
|
||||||||||||||||||||
|
Investment advisory charges |
|
|
51.4 |
|
|
53.0 |
|
|
(1.6 |
) |
|
|
|
-3.0 |
% |
|
||||||||||||
|
Administrative charges |
|
|
39.7 |
|
|
32.9 |
|
|
6.8 |
|
|
20.7 |
% |
|
||||||||||||||
|
Distribution charges |
|
|
17.0 |
|
|
12.8 |
|
|
4.2 |
|
|
32.8 |
% |
|
||||||||||||||
|
Mortality and expense risk charges |
|
|
0.8 |
|
|
0.6 |
|
|
0.2 |
|
|
33.3 |
% |
|
||||||||||||||
|
Liquidity guarantee charges |
|
|
23.4 |
|
|
21.8 |
|
|
1.6 |
|
|
7.3 |
% |
|
||||||||||||||
|
|
|
|
|
|
|
|
|
|
||||||||||||||||||||
|
TOTAL EXPENSES |
|
|
132.3 |
|
|
121.1 |
|
|
11.2 |
|
|
9.2 |
% |
|
||||||||||||||
|
|
|
|
|
|
|
|
|
|
||||||||||||||||||||
|
INVESTMENT INCOME, NET |
|
|
$ |
|
364.6 |
|
|
$ |
|
360.1 |
|
|
$ |
|
4.5 |
|
|
1.2 |
% |
|
||||||||
|
|
|
|
|
|
|
|
|
|
||||||||||||||||||||
Rental Income:
Rental income increased $7.1 million, or 1.1%, primarily as a result of higher occupancy and rental rates predominately in the apartment and industrial sectors in the Eastern region. The increase was partially offset by net real estate investment dispositions.
Operating Expenses:
Operating expenses increased $0.7 million, or 0.5%, due to increases in various expenses across the wholly owned real estate portfolio.
Real Estate Taxes:
Real estate taxes increased $6.8 million, or 6.8%, as a result of higher property tax assessments resulting from property value increases, most notably in the retail sector, and net real estate investment acquisitions.
50
Interest Expense:
Interest expense decreased $9.6 million, or 13.1%, due to the overall reduction in mortgage loans payable.
Income from Real Estate Joint Ventures and Limited Partnerships:
Income from real estate joint ventures and limited partnerships decreased $2.5 million, or 2.3%, as a result of decreased distributions, primarily due to the Account’s Colorado Center joint venture investment reserving funds to pay off the debt associated with the property. The decrease was partially offset by higher distributions from other joint ventures.
Interest and Dividend Income:
Interest income increased when compared to the same period in 2014 primarily due to additional income earned in 2015 on the convertible note receivable and the loan receivable. Dividend income remained relatively consistent as a ratio of marketable securities held when compared to the same period in 2014.
Expenses:
Expense ratios, as a percentage of average net assets, for investment advisory, administrative and distribution charges decreased to 0.52% from 0.55% when compared to the same period of 2014. Costs increased period over period, however, average net assets increased at a higher velocity, reducing the overall expense ratio. These costs have fixed and variable components, the latter of which generally correspond to the level of the Account’s net assets under management and other cost drivers.
Mortality and expense risk and liquidity guarantee charges are contractual charges to the Account from TIAA for TIAA’s assumption of these risks and provision of the guarantee. The rate for these charges was established effective April 24, 2015, for the twelve month period ending April 30, 2016, and is charged based on the Account’s net assets.
Net Realized and Unrealized Gains and Losses on Investments and Mortgage Loans Payable
The table below shows the net realized and unrealized gains and losses on investments and mortgage loans payable for the nine months ended September 30, 2015 and 2014 and the dollar and percentage changes for those periods (dollars in millions, unaudited).
|
|
|
|
|
|
|
|
|
||||||||||||||||||||
|
|
For the Nine |
Change |
||||||||||||||||||||||||||
2015 |
2014 |
$ |
% |
|||||||||||||||||||||||||
|
NET REALIZED AND UNREALIZED GAIN (LOSS) ON INVESTMENTS AND MORTGAGE LOANS PAYABLE |
|
|
|
|
|
|
|
|
||||||||||||||||||||
|
Net realized gain (loss) on investments: |
|
|
|
|
|
|
|
|
||||||||||||||||||||
|
Real estate properties |
|
|
$ |
|
216.9 |
|
|
$ |
|
(19.9 |
) |
|
|
|
$ |
|
236.8 |
|
|
N/M |
||||||||
|
Real estate joint ventures and limited partnerships |
|
|
152.5 |
|
|
(40.1 |
) |
|
|
|
192.6 |
|
|
N/M |
||||||||||||||
|
Marketable securities |
|
|
46.1 |
|
|
53.9 |
|
|
(7.8 |
) |
|
|
|
-14.5 |
% |
|
||||||||||||
|
|
|
|
|
|
|
|
|
|
||||||||||||||||||||
|
Total realized gain (loss) on investments: |
|
|
415.5 |
|
|
(6.1 |
) |
|
|
|
421.6 |
|
|
N/M |
||||||||||||||
|
|
|
|
|
|
|
|
|
|
||||||||||||||||||||
|
Net change in unrealized appreciation (depreciation) on: |
|
|
|
|
|
|
|
|
||||||||||||||||||||
|
Real estate properties |
|
|
407.7 |
|
|
740.4 |
|
|
(332.7 |
) |
|
|
|
-44.9 |
% |
|
||||||||||||
|
Real estate joint ventures and limited partnerships |
|
|
262.7 |
|
|
249.6 |
|
|
13.1 |
|
|
5.2 |
% |
|
||||||||||||||
|
Marketable securities |
|
|
(162.6 |
) |
|
|
|
118.7 |
|
|
(281.3 |
) |
|
|
|
N/M |
||||||||||||
|
Loans receivable |
|
|
0.1 |
|
|
— |
|
|
0.1 |
|
|
N/M |
||||||||||||||||
|
Mortgage loans payable |
|
|
3.5 |
|
|
(52.8 |
) |
|
|
|
56.3 |
|
|
N/M |
||||||||||||||
|
|
|
|
|
|
|
|
|
|
||||||||||||||||||||
|
Net change in unrealized appreciation on investments and mortgage loans payable |
|
|
511.4 |
|
|
1,055.9 |
|
|
(544.5 |
) |
|
|
|
-51.6 |
% |
|
||||||||||||
|
|
|
|
|
|
|
|
|
|
||||||||||||||||||||
|
NET REALIZED AND UNREALIZED GAIN ON INVESTMENTS AND MORTGAGE LOANS PAYABLE |
|
|
$ |
|
926.9 |
|
|
$ |
|
1,049.8 |
|
|
$ |
|
(122.9 |
) |
|
|
|
-11.7 |
% |
|
||||||
|
|
|
|
|
|
|
|
|
|
||||||||||||||||||||
N/M—Not meaningful
51
Real Estate Properties, Joint Ventures and Limited Partnerships:
Net realized gains or losses in the Account are primarily due to the sale of wholly owned real estate property investments and real estate property investments underlying the Account’s joint venture and limited partnership investments. See the Recent Transactions section herein for additional disclosure regarding the sale of the Account’s real estate property investments.
Real Estate Properties:
The Account’s wholly owned real estate investments experienced net realized and unrealized gains of $624.6 million during the first nine months of 2015 compared to $720.5 million gains during the comparable period of 2014. While velocity of appreciation has slowed, it has continued as a result of improved occupancy and market rents primarily in the office and industrial sectors.
Real Estate Joint Ventures and Limited Partnerships:
The Account’s real estate joint ventures and limited partnerships experienced net realized and unrealized gains of $415.2 million during the first nine months of 2015 compared to $209.5 million during the comparable period of 2014. The $205.7 million net increase was primarily driven by higher valuations in the retail and apartment sectors of the joint venture investments, in the Florida and New York areas.
Marketable Securities:
The Account’s marketable securities positions experienced net realized and unrealized losses of $116.5 million during the first nine months of 2015 compared to gains of $172.6 million during the comparable period of 2014. During the first nine months of 2015, the markets for REITs in the U.S. decreased 4.5% when compared to the comparable period of 2014, which returned 13.4%, as measured by the FTSE NAREIT Index. The Account’s real estate related equity securities moved in line with these market movements.
Additionally, the Account held $3.9 billion of investments in government agency notes, U.S. Treasury Securities and commercial paper, which had nominal changes due to the short term nature of these investments.
Mortgage Loans Payable:
Mortgage loans payable experienced unrealized gains of $3.5 million during the first nine months of 2015 compared to net unrealized losses of $52.8 million during the comparable period of 2014. Valuation adjustments to mortgage loans are highly dependent upon interest rates, investment return demands, and the performance of the underlying real estate investment. The unrealized gains recognized in 2015 were nominal due to the declining duration of mortgage loans as well as small declines in treasury rates.
Three months ended September 30, 2015 compared to three months ended September 30, 2014
Performance
The Account’s total return was 2.0% for the three months ended September 30, 2015 as compared to 2.32% for the three months ended September 30, 2014.
52
Net Investment Income
The table below shows the results of operations for the three months ended September 30, 2015 and 2014 and the dollar and percentage changes for those periods (dollars in millions, unaudited).
|
|
|
|
|
|
|
|
|
||||||||||||||||||||
|
|
For the Three Months Ended September 30, |
Change |
||||||||||||||||||||||||||
2015 |
2014 |
$ |
% |
|||||||||||||||||||||||||
|
INVESTMENT INCOME |
|
|
|
|
|
|
|
|
||||||||||||||||||||
|
Real estate income, net: |
|
|
|
|
|
|
|
|
||||||||||||||||||||
|
Rental income |
|
|
$ |
|
236.1 |
|
|
$ |
|
232.1 |
|
|
$ |
|
4.0 |
|
|
1.7 |
% |
|
||||||||
|
|
|
|
|
|
|
|
|
|
||||||||||||||||||||
|
Real estate property level expenses: |
|
|
|
|
|
|
|
|
||||||||||||||||||||
|
Operating expenses |
|
|
52.5 |
|
|
52.1 |
|
|
0.4 |
|
|
0.8 |
% |
|
||||||||||||||
|
Real estate taxes |
|
|
36.7 |
|
|
34.4 |
|
|
2.3 |
|
|
6.7 |
% |
|
||||||||||||||
|
Interest expense |
|
|
18.8 |
|
|
25.0 |
|
|
(6.2 |
) |
|
|
|
-24.8 |
% |
|
||||||||||||
|
|
|
|
|
|
|
|
|
|
||||||||||||||||||||
|
Total real estate property level expenses |
|
|
108.0 |
|
|
111.5 |
|
|
(3.5 |
) |
|
|
|
-3.1 |
% |
|
||||||||||||
|
|
|
|
|
|
|
|
|
|
||||||||||||||||||||
|
Real estate income, net |
|
|
128.1 |
|
|
120.6 |
|
|
7.5 |
|
|
6.2 |
% |
|
||||||||||||||
|
Income from real estate joint ventures and limited partnerships |
|
|
36.2 |
|
|
32.5 |
|
|
3.7 |
|
|
11.4 |
% |
|
||||||||||||||
|
Interest |
|
|
3.1 |
|
|
0.6 |
|
|
2.5 |
|
|
416.7 |
% |
|
||||||||||||||
|
Dividends |
|
|
13.0 |
|
|
11.3 |
|
|
1.7 |
|
|
15.0 |
% |
|
||||||||||||||
|
|
|
|
|
|
|
|
|
|
||||||||||||||||||||
|
TOTAL INVESTMENT INCOME |
|
|
180.4 |
|
|
165.0 |
|
|
15.4 |
|
|
9.3 |
% |
|
||||||||||||||
|
|
|
|
|
|
|
|
|
|
||||||||||||||||||||
|
Expenses: |
|
|
|
|
|
|
|
|
||||||||||||||||||||
|
Investment advisory charges |
|
|
17.6 |
|
|
17.8 |
|
|
(0.2 |
) |
|
|
|
-1.1 |
% |
|
||||||||||||
|
Administrative charges |
|
|
13.1 |
|
|
10.8 |
|
|
2.3 |
|
|
21.3 |
% |
|
||||||||||||||
|
Distribution charges |
|
|
6.1 |
|
|
4.5 |
|
|
1.6 |
|
|
35.6 |
% |
|
||||||||||||||
|
Mortality and expense risk charges |
|
|
0.3 |
|
|
0.2 |
|
|
0.1 |
|
|
50.0 |
% |
|
||||||||||||||
|
Liquidity guarantee charges |
|
|
8.1 |
|
|
7.0 |
|
|
1.1 |
|
|
15.7 |
% |
|
||||||||||||||
|
|
|
|
|
|
|
|
|
|
||||||||||||||||||||
|
TOTAL EXPENSES |
|
|
45.2 |
|
|
40.3 |
|
|
4.9 |
|
|
12.2 |
% |
|
||||||||||||||
|
|
|
|
|
|
|
|
|
|
||||||||||||||||||||
|
INVESTMENT INCOME, NET |
|
|
$ |
|
135.2 |
|
|
$ |
|
124.7 |
|
|
$ |
|
10.5 |
|
|
8.4 |
% |
|
||||||||
|
|
|
|
|
|
|
|
|
|
||||||||||||||||||||
Rental Income:
Rental income increased $4.0 million, or 1.7%, primarily as a result of higher occupancy, rental rates, and recovery income in the apartment and industrial sectors. The increase was partially offset by net real estate investment dispositions.
Operating Expenses:
Operating expenses remain consistent with the prior year period with a slight increase of $0.4 million, or 0.8%. The slight increase was due to higher marketing expenses and increased utilities costs in the Northeastern region, offset by net real estate investment dispositions.
Real Estate Taxes:
Real estate taxes increased $2.3 million, or 6.7%, as a result of higher property tax assessments resulting from increases in property value, most notably in the retail and industrial sectors.
Interest Expense:
Interest expense decreased $6.2 million, or 24.8%, resulting from the payoff of $538.0 million in loans payable.
53
Income from Real Estate Joint Ventures and Limited Partnerships:
Income from real estate joint ventures and limited partnerships increased $3.7 million, or 11.4%. The increase was primarily attributable to increased cash distributions driven by earnings primarily from The Florida Mall joint venture, offset by lower distributions from the DDR joint venture investment.
Interest and Dividend Income:
Interest income increased $2.5 million, primarily due to income earned on the loan receivable. Dividend income remained relatively consistent as a ratio of marketable securities held when compared to the same period in 2014.
Expenses:
The expense ratios, as a percentage of average net assets, for investment advisory, administrative and distribution charges decreased to 0.17% from 0.18% in the prior year. Costs increased period over period, however, average net assets increased at a higher velocity, reducing the overall expense ratio. These costs have fixed and variable components, the latter of which generally correspond to the level of the Account’s net assets under management and other cost drivers.
Mortality and expense risk and liquidity guarantee charges are contractual charges to the Account from TIAA for TIAA’s assumption of these risks and provision of the guarantee. The rate for these charges was established effective April 24, 2015, for the twelve month period ending April 30, 2016, and is charged based on the Account’s net assets.
Net Realized and Unrealized Gains and Losses on Investments and Mortgage Loans Payable
The table below shows the net realized and unrealized gains and losses on investments and mortgage loans payable for the three months ended September 30, 2015 and 2014 and the dollar and percentage changes for those periods (dollars in millions, unaudited).
|
|
|
|
|
|
|
|
|
||||||||||||||||||||
|
|
For the Three |
Change |
||||||||||||||||||||||||||
2015 |
2014 |
$ |
% |
|||||||||||||||||||||||||
|
NET REALIZED AND UNREALIZED GAIN (LOSS) ON INVESTMENTS AND MORTGAGE LOANS PAYABLE |
|
|
|
|
|
|
|
|
||||||||||||||||||||
|
Net realized gain (loss) on investments: |
|
|
|
|
|
|
|
|
||||||||||||||||||||
|
Real estate properties |
|
|
$ |
|
— |
|
|
$ |
|
(17.3 |
) |
|
|
|
$ |
|
17.3 |
|
|
100.0 |
% |
|
||||||
|
Real estate joint ventures and limited partnerships |
|
|
(0.2 |
) |
|
|
|
(35.8 |
) |
|
|
|
35.6 |
|
|
99.4 |
% |
|
||||||||||
|
Marketable securities |
|
|
4.5 |
|
|
4.9 |
|
|
(0.4 |
) |
|
|
|
-8.2 |
% |
|
||||||||||||
|
|
|
|
|
|
|
|
|
|
||||||||||||||||||||
|
Total realized gain (loss) on investments: |
|
|
4.3 |
|
|
(48.2 |
) |
|
|
|
52.5 |
|
|
108.9 |
% |
|
||||||||||||
|
|
|
|
|
|
|
|
|
|
||||||||||||||||||||
|
Net change in unrealized appreciation (depreciation) on: |
|
|
|
|
|
|
|
|
||||||||||||||||||||
|
Real estate properties |
|
|
166.5 |
|
|
342.3 |
|
|
(175.8 |
) |
|
|
|
-51.4 |
% |
|
||||||||||||
|
Real estate joint ventures and limited partnerships |
|
|
105.7 |
|
|
93.1 |
|
|
12.6 |
|
|
13.5 |
% |
|
||||||||||||||
|
Marketable securities |
|
|
(0.8 |
) |
|
|
|
(57.8 |
) |
|
|
|
57.0 |
|
|
98.6 |
% |
|
||||||||||
|
Loans receivable |
|
|
0.1 |
|
|
— |
|
|
0.1 |
|
|
N/M |
||||||||||||||||
|
Mortgage loans payable |
|
|
11.4 |
|
|
(26.2 |
) |
|
|
|
37.6 |
|
|
N/M |
||||||||||||||
|
|
|
|
|
|
|
|
|
|
||||||||||||||||||||
|
Net change in unrealized appreciation on investments and mortgage loans payable |
|
|
282.9 |
|
|
351.4 |
|
|
(68.5 |
) |
|
|
|
-19.5 |
% |
|
||||||||||||
|
|
|
|
|
|
|
|
|
|
||||||||||||||||||||
|
NET REALIZED AND UNREALIZED GAIN ON INVESTMENTS AND MORTGAGE LOANS PAYABLE |
|
|
$ |
|
287.2 |
|
|
$ |
|
303.2 |
|
|
$ |
|
(16.0 |
) |
|
|
|
-5.3 |
% |
|
||||||
|
|
|
|
|
|
|
|
|
|
||||||||||||||||||||
N/M—Not meaningful
54
Real Estate Properties, Joint Ventures and Limited Partnerships:
Net realized gains or losses in the Account are primarily due to the sale of real estate property investments underlying the Account’s joint venture investments. See the Recent Transactions section herein for additional disclosure regarding the sale of the Account’s real estate property investments.
Real Estate Properties:
The Account’s wholly owned real estate investments experienced net realized and unrealized gains of $166.5 million during the third quarter of 2015, compared to $325.0 million during the comparable period of 2014. While appreciation has slowed, it continued as a result of the stabilization of markets, improved occupancy, and higher market rents, predominately in the retail and office sectors.
Real Estate Joint Ventures and Limited Partnerships:
The Account’s real estate joint ventures and limited partnerships experienced net realized and unrealized gains of $105.5 million during the third quarter of 2015, compared to $57.3 million during the comparable period of 2014. The $48.2 million net increase was primarily due to higher appreciation in the retail and apartment sectors on the joint venture investments, as well as on the Clarion Gables Multi-Family Trust limited partnership.
Marketable Securities:
The Account’s marketable securities positions experienced net realized and unrealized gains of $3.7 million during the third quarter of 2015 compared to losses of $52.9 million during the comparable period of 2014. During the third quarter of 2015, the markets for REITs in the U.S. had a 1.0% return, up from -2.5% in the comparable period of 2014 as measured by the FTSE NAREIT Index. The Account’s real estate related equity securities moved in line with these market movements.
Additionally, the Account held $3.9 billion of investments in government agency notes, U.S. Treasury Securities and Commercial Paper, which had nominal changes due to the short term nature of these investments.
Mortgage Loans Payable:
Mortgage loans payable experienced unrealized gains of $11.4 million during the third quarter of 2015 compared to unrealized losses of $26.2 million during the comparable period of 2014. The increase in unrealized gains can be attributed to rising U.S. Treasury rates during the third quarter of 2015.
Liquidity and Capital Resources
As of September 30, 2015 and December 31, 2014, the Account’s cash and cash equivalents and non-real estate-related marketable securities had a value of $3.9 billion (18.0% and 19.5% of the Account’s net assets at such dates, respectively).
Participant Flows: Nine months ended September 30, 2015 compared to nine months ended September 30, 2014
During the nine months ended September 30, 2015, the Account received $2.1 billion in premiums from participants offset by participant outflows of $1.5 billion in annuity payments and withdrawals and death benefits. During the nine months ended September 30, 2014, the Account received $1.7 billion in premiums from participants offset by participant outflows of $1.1 billion in annuity payments, withdrawals and death benefits.
Net Income and Marketable Securities
The Account’s net investment income continues to be an additional source of liquidity for the Account. Net investment income was $364.6 million for the nine months ended September 30, 2015 as compared to
55
$360.1 million for the comparable period of 2014. Total net investment income increased as described more fully in the Results of Operations section.
As of September 30, 2015, cash and cash equivalents, along with real estate-related and non-real estate related marketable securities comprised 25.8% of the Account’s net assets. The Account’s real estate-related marketable securities primarily consist of publicly traded REITs. The Account’s liquid assets continue to be available to purchase suitable real estate properties, meet the Account’s debt obligations, expense needs, and participant redemption requests (i.e., participant withdrawals or benefit payments).
Leverage
The Account may borrow money and assume or obtain a mortgage on a property to make leveraged real estate investments. Also, to meet any short-term cash needs, the Account may obtain a line of credit that may be unsecured and/or contain terms that may require the Account to secure the loan with one or more of its properties.
The Account is authorized to borrow money in accordance with its investment guidelines. Under the Account’s current investment guidelines, the Account’s loan to value ratio (as described below) is to be maintained at or below 30%. Such incurrences of debt from time to time may include:
• |
placing new debt on properties; |
|||||||||||||||||||||||||||||||||||||||||||||||||||||||||||||||||||||||||||||||||||||||||||||||||
• |
refinancing outstanding debt; |
|||||||||||||||||||||||||||||||||||||||||||||||||||||||||||||||||||||||||||||||||||||||||||||||||
• |
assuming debt on acquired properties or interests in the Account’s properties; and/or |
|||||||||||||||||||||||||||||||||||||||||||||||||||||||||||||||||||||||||||||||||||||||||||||||||
• |
long term extensions of the maturity date of outstanding debt. |
|||||||||||||||||||||||||||||||||||||||||||||||||||||||||||||||||||||||||||||||||||||||||||||||||
In calculating this limit, only the Account’s actual percentage interest in any borrowings is included, and not that percentage interest held by any joint venture partner. Further, the Account may only borrow up to 70% of the then-current value of a property, although construction loans may be for 100% of the costs incurred in developing a property. As of September 30, 2015, one construction loan was held within the Account’s joint venture investment Four Oaks Place, L.P. At the time the Account (or a joint venture in which the Account is a partner) enters into a revolving line of credit, management deems the maximum amount which may be drawn under that line of credit as fully incurred, regardless of whether the maximum amount available has been drawn from time to time.
As of September 30, 2015, the Account’s ratio of outstanding principal amount of debt (inclusive of the Account’s proportionate share of debt held within its joint venture investments) to total gross asset value (i.e., a “loan to value ratio”) was 13.5%. The Account intends to maintain its loan to value ratio at or below 30% (this ratio is measured at the time of incurrence and after giving effect thereto). The Account’s total gross asset value, for these purposes, is equal to the total fair value of the Account’s assets (including the fair value of the Account’s interest in joint ventures), with no reduction associated with any indebtedness on such assets.
As of September 30, 2015, $34.9 million in principal amount of mortgage obligations secured by real estate investments wholly owned by the Account are obligated to be paid over the next twelve months. The Account currently has sufficient liquidity in the form of cash and cash equivalents and short term securities to meet its current mortgage obligations.
In times of high net inflow activity, in particular during times of high net participant transfer inflows, management may determine to apply a portion of such cash flows to make prepayments of indebtedness prior to scheduled maturity, which would have the effect of reducing the Account’s loan to value ratio.
Recent Transactions
The following describes property transactions by the Account during the third quarter of 2015. Except as noted, the expenses for operating the properties purchased are either borne or reimbursed, in whole or in part, by the property tenants, although the terms vary under each lease. The Account is responsible for operating expenses not reimbursed under the terms of a lease.
56
Purchases
Charles River Plaza North, Mezzanine Loan Receivable—Boston, MA
On July 7, 2015, the Account entered into a $100.0 million mezzanine loan receivable position on a Class A research laboratory located on the Massachusetts General Hospital extended campus. The loan is interest only at a 6.08% interest rate and matures on April 6, 2029.
The Cordelia—Portland, OR
On July 13, 2015, the Account purchased a 90,017 square foot multi-family property, consisting of two five-story buildings, located in Portland, Oregon for $47.9 million. At the time of purchase, the property was 93% leased.
The Manor at Flagler Village—Fort Lauderdale, FL
On July 15, 2015, the Account purchased a 368,429 square foot multi-family property consisting of two seven-story buildings, along with 23,012 square feet of free standing retail space, located in Fort Lauderdale, Florida for $149.0 million. At the time of purchase, the apartments were 94% leased and the retail spaces were 74% leased.
Pinto Business Park—Houston, TX
On August 12, 2015, the Account purchased an 841,941 square foot industrial property located in Houston, Texas for $72.5 million. At the time of purchase, the property was 77% leased.
Oakmont IE West Portfolio: Jurupa Business Park—Fontana, CA
On September 25, 2015, the Account purchased a 398,471 square foot industrial property located in Fontana, California for $42.9 million. At the time of purchase, the property was 100% leased.
Financing
DDR Joint Venture—Various, USA
On July 1, 2015, the Account’s DDR joint venture investment restructured its outstanding $140.5 million term loan (the Account’s share) collateralized by six properties, effectively extending the maturity date to July 1, 2019. The loan now has an interest rate of LIBOR plus 1.75% and the option to extend maturity to July 1, 2020.
On July 1, 2015, the Account’s DDR joint venture investment also restructured its outstanding $184.5 million term loan (the Account’s share) collateralized by eleven properties, effectively extending the maturity date to July 1, 2018. The loan now has an interest rate of LIBOR plus 1.50% and two options of one year each to extend the maturity to a final maturity of July 1, 2020.
Colorado Center—Santa Monica, CA
On August 3, 2015, the Account’s Colorado Center joint venture investment, in which the Account holds a 50% interest, extinguished its outstanding mortgage debt obligation of $125.0 million (the Account’s share).
Lincoln Centre—Dallas, TX
On August 5, 2015, the Account extinguished its outstanding mortgage debt obligation of $153.0 million.
Critical Accounting Policies
The consolidated financial statements of the Account are prepared in conformity with accounting principles generally accepted in the United States of America.
In preparing the Account’s consolidated financial statements, management is required to make estimates and judgments that affect the reported amounts of assets, liabilities, revenues, and expenses. Management bases its estimates on historical experience and assumptions that are believed to be reasonable under the
57
circumstances, the results of which form the basis for making judgments about the carrying value of assets and liabilities that are not readily apparent from other sources. Actual results may differ from these estimates.
Determination of Investments at Fair Value: The Account reports all investments and investment related mortgage loans payable at fair value. The FASB has defined fair value as the price that would be received to sell an asset or paid to transfer a liability in an orderly transaction between market participants.
The following is a description of the valuation methodologies used to determine the fair value of the Account’s investments and investment related mortgage payables.
Valuation of Real Estate Properties—Investments in real estate properties are stated at fair value, as determined in accordance with policies and procedures reviewed by the Investment Committee of the Board and in accordance with the responsibilities of the Board as a whole. Accordingly, the Account does not record depreciation. Determination of fair value involves judgment because the actual fair value of real estate can be determined only by negotiation between the parties in a sales transaction. The Account’s primary objective when valuing its real estate investments will be to produce a valuation that represents a reasonable estimate of the fair value of its investments. Implicit in the Account’s definition of fair value are the consummation of a sale as of a specified date and the passing of title from seller to buyer under conditions whereby:
• |
Buyer and seller are typically motivated; |
|||||||||||||||||||||||||||||||||||||||||||||||||||||||||||||||||||||||||||||||||||||||||||||||||
• |
Both parties are well informed or well advised, and acting in what they consider their best interests; |
|||||||||||||||||||||||||||||||||||||||||||||||||||||||||||||||||||||||||||||||||||||||||||||||||
• |
A reasonable time is allowed for exposure in the open market; |
|||||||||||||||||||||||||||||||||||||||||||||||||||||||||||||||||||||||||||||||||||||||||||||||||
• |
Payment is made in terms of cash or in terms of financial arrangements comparable thereto; and |
|||||||||||||||||||||||||||||||||||||||||||||||||||||||||||||||||||||||||||||||||||||||||||||||||
• |
The price represents the normal consideration for the property sold unaffected by special or creative financing or sales concessions granted by anyone associated with the sale. |
|||||||||||||||||||||||||||||||||||||||||||||||||||||||||||||||||||||||||||||||||||||||||||||||||
Property and investment values are affected by, among other things, the availability of capital, occupancy rates, rental rates, and interest and inflation rates. As a result, determining real estate and investment values involves many assumptions. Key inputs and assumptions include rental income and expense amounts, related rental income and expense growth rates, discount rates and capitalization rates. Valuation techniques include discounted cash flow analysis, prevailing market capitalization rates or multiples applied to earnings from the property, analysis of recent comparable sales transactions, actual sale negotiations and bona fide purchase offers received from third parties. Amounts ultimately realized from each investment may vary significantly from the fair value presented.
Real estate properties owned by the Account are initially valued based on an independent third party appraisal, as reviewed by TIAA’s internal appraisal staff and as applicable the Account’s independent fiduciary at the time of the closing of the purchase, which may result in a potential unrealized gain or loss reflecting the difference between an investment’s fair value (i.e., exit price) and its cost basis (which is inclusive of transaction costs).
Subsequently, each property is appraised each quarter by an independent third party appraiser, reviewed by TIAA’s internal appraisal staff and as applicable the Account’s independent fiduciary. In general, the Account obtains appraisals of its real estate properties spread out throughout the quarter, which is intended to result in appraisal adjustments, and thus, adjustments to the valuations of its holdings (to the extent such adjustments are made) that happen regularly throughout each quarter and not on one specific day or month in each period.
Further, management reserves the right to order an appraisal and/or conduct another valuation outside of the normal quarterly process when facts or circumstances at a specific property change. For example, under certain circumstances a valuation adjustment could be made when the account receives a bona fide bid for the sale of a property held within the Account or one of the Account’s joint ventures. In addition, adjustments may be made for events or circumstances indicating an impairment of a tenant’s ability to pay amounts due to the Account under a lease (including due to a bankruptcy filing of that tenant). Alternatively, adjustments may be made to reflect the execution or renewal of a significant lease. Also, adjustments may be made to reflect factors (such as sales values for comparable properties or local employment rate) bearing
58
uniquely on a particular region in which the Account holds properties. TIAA’s internal appraisal staff oversees the entire appraisal process, in conjunction with the Account’s independent fiduciary (the independent fiduciary is more fully described in the paragraph below). Any differences in the conclusions of TIAA’s internal appraisal staff and the independent appraiser will be reviewed by the independent fiduciary, which will make a final determination on the matter (which may include ordering a subsequent independent appraisal).
The independent fiduciary, RERC, LLC, has been appointed by a special subcommittee of the Investment Committee of the Board to, among other things, oversee the appraisal process. The independent fiduciary must approve all independent appraisers used by the Account. All appraisals are performed in accordance with Uniform Standards of Professional Appraisal Practices, the real estate appraisal industry standards created by The Appraisal Foundation. Real estate appraisals are estimates of property values based on a professional’s opinion. Appraisals of properties held outside of the U.S. are performed in accordance with industry standards commonly applied in the applicable jurisdiction. These independent appraisers are always expected to be MAI-designated members of the Appraisal Institute (or its European equivalent, Royal Institute of Chartered Surveyors) and state certified appraisers from national or regional firms with relevant property type experience and market knowledge. Under the Account’s current procedures, each independent appraisal firm will be rotated off of a particular property at least every three years, although such appraisal firm may perform appraisals of other Account properties subsequent to such rotation.
Also, the independent fiduciary can require additional appraisals if factors or events have occurred that could materially change a property’s value (including those identified above) and such change is not reflected in the quarterly valuation review, or otherwise to ensure that the Account is valued appropriately. The independent fiduciary must also approve any valuation change of real estate-related assets where a property’s value changed by more than 6% from the most recent independent annual appraisal, or if the value of the Account would change by more than 4% within any calendar quarter or more than 2% since the prior calendar month. When a real estate property is subject to a mortgage, the property is valued independently of the mortgage and the property and mortgage fair values are reported separately (see Valuation of Mortgage Loans Payable below). The independent fiduciary reviews and approves all mortgage valuation adjustments before such adjustments are recorded by the Account. The Account continues to use the revised value for each real estate property and mortgage loan payable to calculate the Account’s daily net asset value until the next valuation review or appraisal.
Valuation of Real Estate Joint Ventures—Real estate joint ventures are stated at the fair value of the Account’s ownership interests of the underlying entities. The Account’s ownership interests are valued based on the fair value of the underlying real estate, any related mortgage loans payable, and other factors, such as ownership percentage, ownership rights, buy/sell agreements, distribution provisions and capital call obligations. Upon the disposition of all real estate investments by an investee entity, the Account will continue to state its equity in the remaining net assets of the investee entity during the wind down period, if any, which occurs prior to the dissolution of the investee entity.
Valuation of Real Estate Limited Partnerships—Limited partnership interests are stated at the fair value of the Account’s ownership in the partnership which are recorded based upon the changes in the net asset values of the limited partnerships as determined from the financial statements of the limited partnerships when received by the Account. Prior to the receipt of the financial statements from the limited partnerships, the Account estimates the value of its interest in good faith and will from time to time seek input from the issuer or the sponsor of the investments. Since market quotations are not readily available, the limited partnership interests are valued at fair value as determined in good faith by management under the direction of the Investment Committee of the Board and in accordance with the responsibilities of the Board as a whole.
Valuation of Marketable Securities—Equity securities listed or traded on any national market or exchange are valued at the last sale price as of the close of the principal securities market or exchange on which such securities are traded or, if there is no sale, at the mean of the last bid and asked prices on such market or exchange, exclusive of transaction costs.
Debt securities with readily available market quotations, other than money market instruments, are generally valued at the most recent bid price or the equivalent quoted yield for such securities (or those of comparable maturity, quality and type). Debt securities for which market quotations are not readily available, are valued
59
at fair value as determined in good faith by the Investment Committee of the Board and in accordance with the responsibilities of the Board as a whole.
Short-term investments are valued in the same manner as debt securities, as described above.
Money market instruments are valued at amortized cost, which approximates fair value.
Equity and fixed income securities traded on a foreign exchange or in foreign markets are valued using their closing values under the valuation methods generally accepted in the country where traded, as of the valuation date. This value is converted to U.S. dollars at the exchange rate in effect on the valuation day. Under certain circumstances (for example, if there are significant movements in the United States markets and there is an expectation the securities traded on foreign markets will adjust based on such movements when the foreign markets open the next day), the Account may adjust the value of equity or fixed income securities that trade on a foreign exchange or market after the foreign exchange or market has closed.
Valuation of Loans Receivable—Loans receivable are stated at fair value and are initially valued at the face amount of the loan funding. Subsequently, loans receivable are valued at least quarterly by TIAA’s internal valuation department based on market factors, such as market interest rates and spreads for comparable loans, the liquidity for loans of similar characteristics, the performance of the underlying collateral (such as the loan-to-value ratio and the cash flow of the underlying collateral) and the credit quality of the counterparty. The Account’s loan receivable is classified within level 3 of the valuation hierarchy.
Valuation of Mortgage Loans Payable—Mortgage loans payable are stated at fair value. The estimated fair value of mortgage loans payable are based on the amount at which the liability could be transferred to a third party exclusive of transaction costs. Mortgage loans payable are valued internally by TIAA’s internal appraisal department, as reviewed by the Account’s independent fiduciary, at least quarterly based on market factors, such as market interest rates and spreads for comparable loans, the performance of the underlying collateral (such as the loan-to-value ratio and the cash flow of the underlying collateral), the liquidity for mortgage loans of similar characteristics, the maturity date of the loan, the return demands of the market.
See Note 4—Assets and Liabilities Measured at Fair Value on a Recurring Basis for further discussion and disclosure regarding the determination of the fair value of the Account’s investments.
Foreign currency transactions and translation: Portfolio investments and other assets and liabilities denominated in foreign currencies are translated into U.S. dollars at the exchange rates prevailing at the end of the period. Purchases and sales of securities, income receipts and expense payments made in foreign currencies are translated into U.S. dollars at the exchange rates prevailing on the respective dates of the transactions. The effect of any changes in foreign currency exchange rates on portfolio investments and mortgage loans payable are included in net realized and unrealized gains and losses on real estate properties and mortgage loans payable. Net realized gains and losses on foreign currency transactions include disposition of foreign currencies, and currency gains and losses between the accrual and receipt dates of portfolio investment income and between the trade and settlement dates of portfolio investment transactions.
Accumulation and Annuity Funds: The accumulation fund represents the net assets attributable to participants in the accumulation phase of their investment (“Accumulation Fund”). The annuity fund represents the net assets attributable to the participants currently receiving annuity payments (“Annuity Fund”). The net increase or decrease in net assets from investment operations is apportioned between the accounts based upon their relative daily net asset values. Once an Account participant begins receiving lifetime annuity income benefits, payment levels cannot be reduced as a result of the Account’s adverse mortality experience. In addition, the contracts pursuant to which the Account is offered are required to stipulate the maximum expense charge for all Account level expenses that can be assessed, which is not to exceed 2.5% of average net assets per year. The Account pays a fee to TIAA to assume mortality and expense risks.
Accounting for Investments: The investments held by the Account are accounted for as follows:
Real Estate Properties—Rent from real estate properties consists of all amounts earned under tenant operating leases, including base rent, recoveries of real estate taxes and other expenses and charges for miscellaneous services provided to tenants. Rental income is recognized in accordance with the billing terms of the lease agreements. The Account bears the direct expenses of the real estate properties owned. These expenses include, but are not limited to, fees to local property management companies, property taxes,
60
utilities, maintenance, repairs, insurance, and other operating and administrative costs. An estimate of the net operating income earned from each real estate property is accrued by the Account on a daily basis and such estimates are adjusted when actual operating results are determined.
Real Estate Joint Ventures—The Account has limited ownership interests in various real estate joint ventures (collectively, the “joint ventures”). The Account records its contributions as increases to its investments in the joint ventures, and distributions from the joint ventures are treated as income within income from real estate joint ventures and limited partnerships in the Account’s consolidated statements of operations. Distributions that are identified as returns of capital are recorded as a reduction to the cost basis of the investment, whereas distributions identified as capital gains or losses are recorded as realized gains or losses. Income from the joint ventures is recorded based on the Account’s proportional interest of the income distributed by the joint ventures. Income earned by the joint ventures, but not yet distributed to the Account by the joint ventures is recorded as unrealized gains and losses.
Limited Partnerships—The Account has limited ownership interests in various private real estate funds (primarily limited partnerships) and a private real estate investment trust (collectively, the “limited partnerships”). The Account records its contributions as increases to the investments, and distributions from the investments are treated as income within income from real estate joint ventures and limited partnerships in the Account’s consolidated statements of operations. Distributions that are identified as returns of capital are recorded as a reduction to the cost basis of the investment, whereas distributions identified as capital gains or losses are recorded as realized gains or losses. Unrealized gains and losses are recorded based upon the changes in the net asset values of the limited partnerships as determined from the financial statements of the limited partnerships when received by the Account. Prior to the receipt of the financial statements from the limited partnerships, the Account estimates the value of its interest in good faith and will from time to time seek input from the issuer or the sponsor of the investment. Changes in value based on such estimates are recorded by the Account as unrealized gains and losses.
Marketable Securities—Transactions in marketable securities are accounted for as of the date the securities are purchased or sold (trade date). Interest income is recorded as earned. Dividend income is recorded on the ex-dividend date within dividend income. Dividends that are identified as returns of capital are recorded as a reduction to the cost basis of the investment, whereas dividends identified as capital gains or losses are recorded as realized gains or losses. Realized gains and losses on securities transactions are accounted for on the specific identification method.
Loan Receivable—The Account has a single ownership interest in a loan receivable. Loans receivable are stated at fair value and are initially valued at the face amount of the loan funding. Subsequently, loans receivable are valued at least quarterly by TIAA’s internal valuation department with changes in fair value flowing through unrealized gain (loss). Interest income from mortgage loans receivable is recognized using the effective interest method over the expected life of the loan.
Realized and Unrealized Gains and Losses—Realized gains and losses are recorded at the time an investment is sold or a distribution is received in relation to an investment sale from a joint venture or limited partnership. Real estate transactions are accounted for as of the date on which the purchase or sale transactions for the real estate properties close (settlement date). The Account recognizes a realized gain on the sale of a real estate property to the extent that the contract sales price exceeds the cost-to-date of the property being sold. A realized loss occurs when the cost-to-date exceeds the sales price.
Unrealized gains and losses are recorded as the fair values of the Account’s investments are adjusted, and as discussed within the Real Estate Joint Ventures and Limited Partnerships sections above.
Net Assets—The Account’s net assets as of the close of each valuation day are valued by taking the sum of:
• |
the value of the Account’s cash; cash equivalents, and short-term and other debt instruments; |
|||||||||||||||||||||||||||||||||||||||||||||||||||||||||||||||||||||||||||||||||||||||||||||||||
• |
the value of the Account’s other securities and other non-real estate assets; |
|||||||||||||||||||||||||||||||||||||||||||||||||||||||||||||||||||||||||||||||||||||||||||||||||
• |
the value of the individual real properties (based on the most recent valuation of that property) and other real estate-related investments owned by the Account; |
|||||||||||||||||||||||||||||||||||||||||||||||||||||||||||||||||||||||||||||||||||||||||||||||||
• |
an estimate of the net operating income accrued by the Account from its properties, other real estate-related investments and non-real estate-related investments (including short-term marketable securities) since the end of the prior valuation day; and |
|||||||||||||||||||||||||||||||||||||||||||||||||||||||||||||||||||||||||||||||||||||||||||||||||
61
• |
actual net operating income earned from the Account’s properties, other real estate-related investments and non-real estate-related investments (but only to the extent any such item of income differs from the estimated income accrued for on such investments), |
|||||||||||||||||||||||||||||||||||||||||||||||||||||||||||||||||||||||||||||||||||||||||||||||||
and then reducing the sum by liabilities held within the Account, including the daily investment management fee, administration and distribution fees, mortality and expense fee, and liquidity guarantee fee, and certain other expenses attributable to operating the Account.
After the end of every quarter, the Account reconciles the amount of expenses deducted from the Account (which is established in order to approximate the costs that the Account will incur) with the expenses the Account actually incurred. If there is a difference, the Account adds it to or deducts it from the Account in equal daily installments over the remaining days of the following quarter. Material differences may be repaid in the current calendar quarter. The Account’s at-cost deductions are based on projections of Account assets and overall expenses, and the size of any adjusting payments will be directly affected by the difference between management’s projections and the Account’s actual assets or expenses.
Federal Income Taxes: Based on provisions of the Internal Revenue Code, Section 817, the Account is taxed as a segregated asset account of TIAA and as such, the Account should incur no material federal income tax attributable to the net investment activity of the Account.
ITEM 3. QUANTITATIVE AND QUALITATIVE DISCLOSURES ABOUT MARKET RISK
The Account’s real estate holdings, including real estate joint venture, limited partnerships and loan receivable, which, as of September 30, 2015, represented 76.2% of the Account’s total investments, expose the Account to a variety of risks. These risks include, but are not limited to:
• |
General Real Estate Risk—The risk that the Account’s property values or rental and occupancy rates could go down due to general economic conditions, a weak market for real estate generally, disruptions in the credit and/or capital markets, or changing supply and demand for certain types of properties; |
|||||||||||||||||||||||||||||||||||||||||||||||||||||||||||||||||||||||||||||||||||||||||||||||||
• |
Appraisal Risk—The risk that the sale price of an Account property (i.e., the value that would be determined by negotiations between independent parties) might differ substantially from its estimated or appraised value, leading to losses or reduced profits to the Account upon sale; |
|||||||||||||||||||||||||||||||||||||||||||||||||||||||||||||||||||||||||||||||||||||||||||||||||
• |
Risk Relating to Property Sales—The risk that the Account might not be able to sell a property at a particular time for its full value, particularly in a poor market. This might make it difficult to raise cash quickly and also could lead to Account losses; |
|||||||||||||||||||||||||||||||||||||||||||||||||||||||||||||||||||||||||||||||||||||||||||||||||
• |
Risks of Borrowing—The risk that interest rate changes may impact Account returns if the Account takes out a mortgage on a property, buys a property subject to a mortgage or holds a property subject to a mortgage, and hedging against such interest rate changes, if undertaken by the Account, may entail additional costs and be unsuccessful; and |
|||||||||||||||||||||||||||||||||||||||||||||||||||||||||||||||||||||||||||||||||||||||||||||||||
• |
Foreign Currency Risk—The risk that the value of the Account’s foreign investments, related debt, or rental income could increase or decrease due to changes in foreign currency exchange rates or foreign currency exchange control regulations, and hedging against such currency changes, if undertaken by the Account, may entail additional costs and be unsuccessful. |
|||||||||||||||||||||||||||||||||||||||||||||||||||||||||||||||||||||||||||||||||||||||||||||||||
The Account believes the diversification of its real estate portfolio, both geographically and by sector, along with its quarterly valuation procedure, helps manage the real estate and appraisal risks described above.
As of September 30, 2015, 23.8% of the Account’s total investments were comprised of marketable securities. Marketable securities include high-quality debt instruments (i.e., government agency notes) and REIT securities. The consolidated schedule of investments for the Account sets forth the general financial terms of these instruments, along with their fair values, as determined in accordance with procedures described earlier in the Critical Accounting Policies section above and in Note 1—Organization and Significant Accounting Policies to the Account’s consolidated financial statements included herewith. As of the date of this report, the Account does not invest in derivative financial investments, nor does the Account engage in any hedging activity, although it may do so in selected circumstances in the future.
62
Risks associated with investments in real estate-related liquid assets (which could include, from time to time, REIT securities and CMBS), and non-real estate-related liquid assets, including financial/credit risk, market volatility risk, interest rate volatility risk and deposit/money market risk.
• |
Financial/Credit Risk—The risk, for debt securities, that the issuer will not be able to pay principal and interest when due (and/or declare bankruptcy or be subject to receivership) and, for equity securities such as common or preferred stock, that the issuer’s current earnings will fall or that its overall financial soundness will decline, reducing the security’s value. |
|||||||||||||||||||||||||||||||||||||||||||||||||||||||||||||||||||||||||||||||||||||||||||||||||
• |
Market Volatility Risk—The risk that the Account’s investments will experience price volatility due to changing conditions in the financial markets regardless of the credit quality or financial condition of the underlying issuer. This risk is particularly acute to the extent the Account holds equity securities, which have experienced significant short-term price volatility over the past year. Also, to the extent the Account holds debt securities, changes in overall interest rates can cause price fluctuations. |
|||||||||||||||||||||||||||||||||||||||||||||||||||||||||||||||||||||||||||||||||||||||||||||||||
• |
Interest Rate Volatility—The risk that interest rate volatility may affect the Account’s current income from an investment. |
|||||||||||||||||||||||||||||||||||||||||||||||||||||||||||||||||||||||||||||||||||||||||||||||||
• |
Deposit/Money Market Risk—The risk that, to the extent the Account’s cash held in bank deposit accounts exceeds federally insured limits as to that bank, the Account could experience losses if banks fail. The Account does not believe it has exposure to significant concentration of deposit risk. In addition, there is some risk that investments held in money market accounts can suffer losses. |
|||||||||||||||||||||||||||||||||||||||||||||||||||||||||||||||||||||||||||||||||||||||||||||||||
In addition, to the extent the Account were to hold mortgage-backed securities (including commercial mortgage-backed securities) these securities are subject to prepayment risk or extension risk (i.e., the risk that borrowers will repay the loans earlier or later than anticipated). If the underlying mortgage assets experience faster than anticipated repayments of principal, the Account could fail to recoup some or all of its initial investment in these securities, since the original price paid by the Account was based in part on assumptions regarding the receipt of interest payments. If the underlying mortgage assets are repaid later than anticipated, the Account could lose the opportunity to reinvest the anticipated cash flows at a time when interest rates might be rising. The rate of prepayment depends on a variety of geographic, social and other functions, including prevailing market interest rates and general economic factors. The fair value of these securities is also highly sensitive to changes in interest rates. Note that the potential for appreciation, which could otherwise be expected to result from a decline in interest rates, may be limited by any increased prepayments. These securities may be harder to sell than other securities.
In addition to these risks, real estate equity securities (such as REIT stocks and mortgage-backed securities) would be subject to many of the same general risks inherent in real estate investing, making mortgage loans and investing in debt securities. For more information on the risks associated with all of the Account’s investments, see the Account’s most recent prospectus.
ITEM 4. CONTROLS AND PROCEDURES
(a) The registrant maintains a system of disclosure controls and procedures that are designed to provide reasonable assurance that information required to be disclosed in the registrant’s reports under the Securities Exchange Act of 1934, as amended (the “Exchange Act”), is recorded, processed, summarized and reported within the time periods specified in the SEC’s rules and forms, and that such information is accumulated and communicated to management, including TIAA’s Executive Vice President and President, Asset Management (Principal Executive Officer (“PEO”)) and TIAA’s Executive Vice President and Chief Financial Officer (Principal Financial Officer (“PFO”)), as appropriate, to allow timely decisions regarding required disclosure.
Under the supervision and participation of the registrant’s management, including the registrant’s PEO and PFO, the registrant conducted an evaluation of the effectiveness of the registrant’s disclosure controls and procedures as defined in Rule 13a-15(e) under the Exchange Act as of September 30, 2015. Based upon management’s review, the PEO and PFO concluded that the registrant’s disclosure controls and procedures were effective as of September 30, 2015.
(b) Changes in internal control over financial reporting. There have been no changes in the registrant’s internal control over financial reporting that occurred during the registrant’s last fiscal quarter that materially affected, or are reasonably likely to materially affect, the registrant’s internal control over financial reporting.
63
PART II. OTHER INFORMATION
ITEM 1. LEGAL PROCEEDINGS.
The Account is party to various claims and routine litigation arising in the ordinary course of business. Management of the Account does not believe that the results of any such claims or litigation, individually or in the aggregate, will have a material effect on the Account’s business, financial position or results of operations.
ITEM 1A. RISK FACTORS.
There have been no material changes from the Account’s risk factors as previously reported in the Account’s Annual Report on Form 10-K for the year ended December 31, 2014.
ITEM 2. UNREGISTERED SALES OF EQUITY SECURITIES AND USE OF PROCEEDS.
Not applicable.
ITEM 3. DEFAULTS UPON SENIOR SECURITIES.
Not applicable.
ITEM 4. MINE SAFETY DISCLOSURES.
Not applicable.
ITEM 5. OTHER INFORMATION.
The Code of Ethics for TIAA’s senior financial officers, including its principal executive officer, principal financial officer, principal accounting officer, or controller, and persons performing similar functions, has been filed as an exhibit to the Account’s Annual Report on Form 10-K for the year ended December 31, 2014 and can also be found on the following two web sites, http://www.tiaa-cref.org/public/prospectuses/index.html and http://www.tiaa-cref.org/public/about/governance/corporate/annual-reports/index.html.
64
ITEM 6. EXHIBITS
|
|
|
|
|
(1) |
(A) |
Distribution Agreement for the Contracts Funded by the Registrant, dated as of January 1, 2008, by and among Teachers Insurance and Annuity Association of America, for itself and on behalf of the Registrant, and TIAA-CREF Individual & Institutional Services, LLC.4 |
||
(3) |
(A) |
Restated Charter of TIAA (as amended).8 |
||
|
(B) |
Amended Bylaws of TIAA.9 |
||
(4) |
(A) |
Forms of RA, GRA, GSRA, SRA, IRA Real Estate Account Endorsements2, Keogh Contract,3 Retirement Select and Retirement Select Plus Contracts and Endorsements1 and Retirement Choice and Retirement Choice Plus Contracts.3 |
||
|
(B) |
Forms of Income-Paying Contracts.2 |
||
|
(C) |
Form of Contract Endorsement for Internal Transfer Limitation.6 |
||
(10) |
(A) |
Amended and Restated Independent Fiduciary Letter Agreement, dated as of February 2, 2015, between TIAA, on behalf of the Registrant, and RERC, LLC.7 |
||
|
(B) |
Custodian Agreement, dated as of March 3, 2008, by and between TIAA, on behalf of the Registrant, and State Street Bank and Trust Company, N.A.5 |
||
*(31) |
|
|
Rule 13(a)-15(e)/ Rule 13a-15(e)/15d-15(e) Certifications. |
|
*(32) |
|
|
Section 1350 Certifications. |
|
**(101) |
|
|
The following financial information from the Quarterly Report on Form 10-Q for the period ended September 30, 2015, formatted in XBRL (Extensible Business Reporting Language): (i) the Consolidated Statements of Assets and Liabilities, (ii) the Consolidated Statements of Operations, (iii) the Consolidated Statements of Changes in Net Assets, (iv) the Consolidated Statements of Cash Flows, and (v) the Notes to the Consolidated Financial Statements. |
* |
Filed herewith. |
|||||||||||||||||||||||||||||||||||||||||||||||||||||||||||||||||||||||||||||||||||||||||||||||||
** |
Furnished electronically herewith. |
|||||||||||||||||||||||||||||||||||||||||||||||||||||||||||||||||||||||||||||||||||||||||||||||||
(1) |
Previously filed and incorporated herein by reference to the Registrant’s Pre-Effective Amendment No. 1 to the Registration Statement on Form S-1 filed with the Commission on April 29, 2004 (File No. 333-113602). |
|||||||||||||||||||||||||||||||||||||||||||||||||||||||||||||||||||||||||||||||||||||||||||||||||
(2) |
Previously filed and incorporated herein by reference to the Registrant’s Post-Effective Amendment No. 2 to the Registration Statement on Form S-1 filed with the Commission on April 30, 1996 (File No. 33-92990). |
|||||||||||||||||||||||||||||||||||||||||||||||||||||||||||||||||||||||||||||||||||||||||||||||||
(3) |
Previously filed and incorporated herein by reference to the Registrant’s Post-Effective Amendment No. 1 to the Registration Statement on Form S-1 filed with the Commission on May 2, 2005 (File No. 333-121493). |
|||||||||||||||||||||||||||||||||||||||||||||||||||||||||||||||||||||||||||||||||||||||||||||||||
(4) |
Previously filed and incorporated herein by reference to Exhibit 1(A) to the Registrant’s Registration Statement on Form S-1 filed with the Commission on March 15, 2013 (File No. 333-187309). |
|||||||||||||||||||||||||||||||||||||||||||||||||||||||||||||||||||||||||||||||||||||||||||||||||
(5) |
Previously filed and incorporated herein by reference to Exhibit 10.(b) to the Registrant’s Annual Report on Form 10-K for the fiscal year ended December 31, 2012 and filed with the Commission on March 14, 2013 (File No. 33-92990). |
|||||||||||||||||||||||||||||||||||||||||||||||||||||||||||||||||||||||||||||||||||||||||||||||||
(6) |
Previously filed and incorporated herein by reference to Exhibit 4(C) to the Registrant’s Quarterly Report on Form 10-Q for the quarter ended September 30, 2010 and filed with the Commission on November 12, 2010 (File No. 33-92990). |
|||||||||||||||||||||||||||||||||||||||||||||||||||||||||||||||||||||||||||||||||||||||||||||||||
(7) |
Previously filed and incorporated herein by reference to Exhibit 10.1 to the Registrant’s Current Report on Form 8-K filed with the Commission on February 6, 2015 (File No. 33-92990). |
|||||||||||||||||||||||||||||||||||||||||||||||||||||||||||||||||||||||||||||||||||||||||||||||||
(8) |
Previously filed and incorporated herein by reference to Exhibit 3(A) to the Registrant’s Pre-Effective Amendment No. 1 to the Registration Statement on Form S-1 filed with the Commission on April 22, 2015 (File No. 333-202583). |
|||||||||||||||||||||||||||||||||||||||||||||||||||||||||||||||||||||||||||||||||||||||||||||||||
(9) |
Previously filed and incorporated herein by reference to Exhibit 3(B) to the Registrant’s Pre-Effective Amendment No. 1 to the Registration Statement on Form S-1 filed with the Commission on April 22, 2015 (File No. 333-202583). |
|||||||||||||||||||||||||||||||||||||||||||||||||||||||||||||||||||||||||||||||||||||||||||||||||
65
SIGNATURES
Pursuant to the requirements of the Securities Exchange Act of 1934, as amended, the registrant, TIAA Real Estate Account, has duly caused this Report to be signed on its behalf by the undersigned, thereunto duly authorized, in New York, New York, on the 9th day of November, 2015.
|
|
|
|
|
|
TIAA REAL ESTATE ACCOUNT |
|||
|
|
|
|
|
|
By: |
TEACHERS INSURANCE AND ANNUITY ASSOCIATION OF AMERICA |
||
|
|
|
|
|
November 9, 2015 |
By: |
/s/ Robert G. Leary |
||
|
|
|
Robert G. Leary |
|
|
|
|
|
|
November 9, 2015 |
By: |
/s/ Virginia M. Wilson |
||
|
|
|
Virginia M. Wilson |
|
66