Attached files
| file | filename |
|---|---|
| EXCEL - IDEA: XBRL DOCUMENT - TIAA REAL ESTATE ACCOUNT | Financial_Report.xls |
| EX-31 - TIAA REAL ESTATE ACCOUNT | c69575_ex31.htm |
| EX-32 - TIAA REAL ESTATE ACCOUNT | c69575_ex32.htm |
UNITED STATES
SECURITIES AND EXCHANGE COMMISSION
Washington, D.C. 20549
FORM 10-Q
(Mark One)
S QUARTERLY REPORT PURSUANT TO SECTION 13 OR 15(d) OF THE SECURITIES
EXCHANGE ACT OF 1934
For the quarterly period ended March 31, 2012
OR
£ TRANSITION REPORT PURSUANT TO SECTION 13 OR 15(d) OF THE SECURITIES
EXCHANGE ACT OF 1934
For the transition period from to
Commission file number: 33-92990; 333-172900
TIAA REAL ESTATE ACCOUNT
(Exact name of registrant as specified in its charter)
NEW YORK
(State or other jurisdiction
of incorporation or organization)
NOT APPLICABLE
(I.R.S. Employer Identification No.)
C/O TEACHERS INSURANCE AND
ANNUITY ASSOCIATION OF AMERICA
730 THIRD AVENUE
NEW YORK, NEW YORK 10017-3206
(Address of principal executive offices, including zip code)
Registrant’s telephone number, including area code: (212) 490-9000
Securities registered pursuant to Section 12(b) of the Act: None
Securities registered pursuant to Section 12(g) of the Act: None
Indicate by check mark if the registrant is a well-known seasoned issuer, as defined in Rule 405 of the Securities Act.
YES £ NO S
Indicate by check mark if the registrant is not required to file reports pursuant to Section 13 or Section 15(d) of the Exchange Act:
YES £ NO S
Indicate by check mark whether the Registrant (1) has filed all reports required to be filed by Section 13 or 15(d) of the Securities Exchange Act of 1934 during the preceding 12 months (or for such shorter period that the Registrant was required to file such reports), and (2) has been subject to such filing requirements for the past 90 days.
YES S NO £
Indicate by check mark if disclosure of delinquent filers pursuant to Item 405 or regulation S-K is not contained herein, and will not be contained, to the best of registrant’s knowledge, in definitive proxy or information statements incorporated by reference in Part III of this Form 10-Q or any amendment to this Form 10-Q: Not Applicable
Indicate by check mark whether the registrant has submitted electronically and posted on its corporate Web site, if any, every Interactive Data File required to be submitted and posted pursuant to Rule 405 of Regulation S-T (§232.405 of this chapter) during the preceding 12 months (or for such shorter period that the registrant was required to submit and post such files).
YES S NO £
Indicate by check mark whether the registrant is a large accelerated filer, an accelerated filer, a non-accelerated filer, or smaller reporting company. See the definitions of “large accelerated filer,” “accelerated filer” and “smaller reporting company” in Rule 12b-2 of the Exchange Act. (Check one):
|
|
|
Large accelerated filer £ |
Accelerated filer £ |
|
Non-accelerated filer S |
Smaller Reporting Company £ |
|
(Do not check if a smaller reporting company) |
|
|
Indicate by check mark whether the registrant is a shell company (as defined in Rule 12b-2 of the Exchange Act).
YES £ NO S
Aggregate market value of voting stock held by non-affiliates: Not Applicable
Documents Incorporated by Reference: None
PART I. FINANCIAL INFORMATION ITEM 1. UNAUDITED CONSOLIDATED FINANCIAL STATEMENTS. INDEX TO UNAUDITED CONSOLIDATED FINANCIAL STATEMENTS
Page
3
4
5
6
7
23 2
TIAA REAL ESTATE ACCOUNT
MARCH 31, 2012
TIAA REAL ESTATE ACCOUNT
March 31,
December 31,
(Unaudited) ASSETS Investments, at fair value: Real estate properties
$
10,140.8
$
9,857.6 Real estate joint ventures and limited partnerships
2,023.7
1,898.9 Marketable securities: Real estate related
1,138.7
927.9 Other
2,976.5
2,802.8 Total investments (cost: $16,647.5 and $16,249.5)
16,279.7
15,487.2 Cash and cash equivalents
12.2
17.5 Due from investment advisor
12.1
6.8 Other
223.6
238.4 TOTAL ASSETS
16,527.6
15,749.9 LIABILITIES Mortgage
loans payable, at fair value—Note 8
2,137.3
2,028.2 Accrued real estate property level expenses
143.5
166.9 Other
27.6
27.6 TOTAL LIABILITIES
2,308.4
2,222.7 COMMITMENTS AND CONTINGENCIES—Note 11 NET ASSETS Accumulation Fund
13,908.3
13,227.2 Annuity Fund
310.9
300.0 TOTAL NET ASSETS
14,219.2
13,527.2 NUMBER OF ACCUMULATION UNITS
54.4
53.4 NET ASSET VALUE, PER ACCUMULATION UNIT—Note 9
$
255.728
$
247.654 See notes to the consolidated financial statements 3
CONSOLIDATED STATEMENTS OF ASSETS AND LIABILITIES
(In millions, except per accumulation unit amounts)
2012
2011
(cost: $10,421.2 and $10,358.3)
(cost: $2,236.4 and $2,193.3)
(cost: $1,013.4 and $895.3)
(cost: $2,976.5 and $2,802.6)
(principal outstanding: $2,101.9 and $2,008.6)
OUTSTANDING—Note 10
TIAA REAL ESTATE ACCOUNT
For the Three Months
2012
2011 INVESTMENT INCOME Real estate income, net: Rental income
$
214.8
$
210.1 Real estate property level expenses and taxes: Operating expenses
56.0
57.8 Real estate taxes
29.1
27.2 Interest expense
28.9
26.4 Total real estate property level expenses and taxes
114.0
111.4 Real estate income, net
100.8
98.7 Income from real estate joint ventures and limited partnerships
17.0
21.1 Interest
0.5
1.1 Dividends
7.4
2.4 TOTAL INVESTMENT INCOME
125.7
123.3 Expenses—Note 2: Investment advisory charges
15.1
14.2 Administrative charges
7.5
6.9 Distribution charges
3.3
1.9 Mortality and expense risk charges
1.7
1.4 Liquidity guarantee charges
7.2
4.2 TOTAL EXPENSES
34.8
28.6 INVESTMENT INCOME, NET
90.9
94.7 NET REALIZED AND UNREALIZED GAIN (LOSS) ON INVESTMENTS Net realized gain (loss) on investments: Real estate properties
(5.2
)
(9.3
) Real estate joint ventures and limited partnerships
(3.2
)
(1.5
) Marketable securities
8.0
1.9 Net realized loss on investments
(0.4
)
(8.9
) Net change in unrealized appreciation (depreciation) on: Real estate properties
192.4
195.5 Real estate joint ventures and limited partnerships
95.0
64.0 Marketable securities
93.8
34.5 Mortgage loans payable
(26.8
)
1.4 Net change in unrealized appreciation on investments
354.4
295.4 NET REALIZED AND UNREALIZED GAIN ON INVESTMENTS
354.0
286.5 NET INCREASE IN NET ASSETS RESULTING FROM OPERATIONS
$
444.9
$
381.2 See notes to the consolidated financial statements 4
CONSOLIDATED STATEMENTS OF OPERATIONS
(In millions)
(Unaudited)
Ended March 31,
AND MORTGAGE LOANS PAYABLE
and mortgage loans payable
AND MORTGAGE LOANS PAYABLE
TIAA REAL ESTATE ACCOUNT
For the Three Months
2012
2011 FROM OPERATIONS Investment income, net
$
90.9
$
94.7 Net realized loss on investments
(0.4
)
(8.9
) Net change in unrealized appreciation on investments
354.4
295.4 NET INCREASE IN NET ASSETS RESULTING
444.9
381.2 FROM PARTICIPANT TRANSACTIONS Premiums
499.6
819.6 Annuity payments
(7.9
)
(4.8
) Withdrawals and death benefits
(244.6
)
(218.1
) NET INCREASE IN NET ASSETS RESULTING
247.1
596.7 NET INCREASE IN NET ASSETS
692.0
977.9 NET ASSETS Beginning of period
13,527.2
10,803.1 End of period
$
14,219.2
$
11,781.0 See notes to the consolidated financial statements 5
CONSOLIDATED STATEMENTS OF CHANGES IN NET ASSETS
(In millions)
(Unaudited)
Ended March 31,
and mortgage loans payable
FROM OPERATIONS
FROM PARTICIPANT TRANSACTIONS
TIAA REAL ESTATE ACCOUNT
For the Three Months
2012
2011 CASH FLOWS FROM OPERATING ACTIVITIES Net increase in net assets resulting from operations
$
444.9
$
381.2 Adjustments to reconcile net increase (decrease) in net assets resulting from Net realized loss on investments
0.4
8.9 Net change in unrealized appreciation on investments and mortgage
(354.4
)
(295.4
) Purchase of real estate properties
(96.1
)
(40.6
) Capital improvements on real estate properties
(54.3
)
(41.6
) Proceeds from sale of real estate properties
46.2
39.0 Purchases of long term investments
(199.5
)
(124.1
) Proceeds from sale of long term investments
57.6
7.7 Increase in other investments
(173.7
)
(514.9
) Change in due from investment advisor
(5.2
)
(8.2
) Decrease
(increase) in other assets
14.6
(2.1
) Decrease
in other liabilities
(20.3
(3.9
) NET CASH USED IN OPERATING ACTIVITIES
(339.8
)
(594.0
) CASH FLOWS FROM FINANCING ACTIVITIES Mortgage loans proceeds received
90.0
— Principal payments of mortgage loans payable
(2.6
)
(2.6
) Premiums
499.6
819.6 Annuity payments
(7.9
)
(4.8
) Withdrawals and death benefits
(244.6
)
(218.1
) NET CASH PROVIDED BY FINANCING ACTIVITIES
334.5
594.1 NET (DECREASE) INCREASE IN CASH AND CASH EQUIVALENTS
(5.3
)
0.1 CASH AND CASH EQUIVALENTS Beginning of period
17.5
12.9 End of period
$
12.2
$
13.0 SUPPLEMENTAL DISCLOSURES: Cash paid for interest
$
28.9
$
26.5 See notes to the consolidated financial statements 6
CONSOLIDATED STATEMENTS OF CASH FLOWS
(In millions)
(Unaudited)
Ended March 31,
operations to net cash used in operating activities:
loans payable
)
TIAA REAL ESTATE ACCOUNT Note 1—Organization and Significant Accounting Policies Business: The TIAA Real Estate Account (“Account”) is a segregated investment account of Teachers Insurance and Annuity Association of America (“TIAA”) and was established by resolution of TIAA’s Board of Trustees (the “Board”) on February 22, 1995, under the insurance laws of the State of New York,
for the purpose of funding variable annuity contracts issued by TIAA. The Account offers individual and group accumulating annuity contracts (with contributions made on a pre-tax or after-tax basis), as well as individual lifetime and term-certain variable payout annuity contracts (including the payment of death
benefits to beneficiaries). Investors are entitled to transfer funds to or from the Account, and make withdrawals from the Account on a daily basis under certain circumstances. Funds invested in the Account for each category of contract are expressed in terms of units, and unit values will fluctuate depending on the
Account’s performance. The investment objective of the Account is to seek favorable long-term returns primarily through rental income and capital appreciation from real estate and real estate-related investments owned by the Account. The Account holds real estate properties directly and through subsidiaries wholly owned by TIAA for
the benefit of the Account. The Account also holds interests in real estate joint ventures and limited partnerships in which the Account does not hold a controlling interest; as such, such interests are not consolidated into these consolidated financial statements. Additionally, the Account invests in real estate-related
and non real estate-related publicly-traded securities, cash and other instruments to maintain adequate liquidity levels for operating expenses, capital expenditures and to fund benefit payments (withdrawals, transfers and related transactions). The consolidated financial statements were prepared in accordance with accounting principles generally accepted in the United States of America, which requires the use of estimates made by management. Actual results may vary from those estimates and such differences may be material. The following is a
summary of the significant accounting policies of the Account. Basis of Presentation: The accompanying consolidated financial statements include the Account and those subsidiaries wholly owned by TIAA for the benefit of the Account. All significant intercompany accounts and transactions between the Account and such subsidiaries have been eliminated. The Accumulation
Unit Value (“AUV”) used for financial reporting purposes may differ from the AUV used for processing transactions. The AUV used for financial reporting purposes includes security and participant transactions effective through the date of the report. Determination of Investments at Fair Value: The Account reports all investments at fair value in accordance with the Financial Accounting Standards Board (“FASB”) Accounting Standards Codification (“ASC”) 946, Financial Services—Investment Companies. Further, in accordance with the adoption of the fair
value option allowed under ASC 825, Financial Instruments, and at the election of Account management, mortgage loans payable are reported at fair value. The FASB has defined fair value as the price that would be received to sell an asset or paid to transfer a liability in an orderly transaction between market
participants. The following is a description of the valuation methodologies used to determine the fair value of the Account’s investments and investment related mortgage loans payable. Valuation of Real Estate Properties—Investments in real estate properties are stated at fair value, as determined in accordance with policies and procedures reviewed by the Investment Committee of the Board and in accordance with the responsibilities of the Board as a whole. Accordingly, the Account does not
record depreciation. Determination of fair value involves significant levels of judgment because the actual fair value of real estate can be determined only by negotiation between the parties in a sales transaction. The Account’s primary objective when valuing its real estate investments will be to produce a valuation
that represents a reasonable estimate of the fair value of its investments. Implicit in the Account’s definition of fair value are the consummation of a sale as of a specified date and the passing of title from seller to buyer under conditions whereby:
•
Buyer and seller are typically motivated;
7
NOTES TO THE CONSOLIDATED FINANCIAL STATEMENTS
• Both parties are well informed or well advised, and acting in what they consider their best interests; • A reasonable time is allowed for exposure in the open market; • Payment is made in terms of cash or in terms of financial arrangements comparable thereto; and • The price represents the normal consideration for the property sold unaffected by special or creative financing or sales concessions granted by anyone associated with the sale. Property and investment values are affected by, among other things, the availability of capital, occupancy rates, rental rates, and interest and inflation rates. As a result, determining real estate and investment values involves many assumptions. Key inputs and assumptions include rental income and expense
amounts, related rental income and expense growth rates, discount rates and capitalization rates. Valuation techniques include discounted cash flow analysis, prevailing market capitalization rates or multiples applied to earnings from the property, analysis of recent comparable sales transactions, actual sale
negotiations and bona fide purchase offers received from third parties. Amounts ultimately realized from each investment may vary significantly from the fair value presented. Real estate properties owned by the Account are initially valued based on an independent third party appraisal, as reviewed by TIAA’s internal appraisal staff and as applicable the Account’s independent fiduciary at the time of the closing of the purchase, which may result in a potential unrealized gain or loss
reflecting the difference between an investment’s fair value (i.e., exit price) and its cost basis (which is inclusive of transaction costs). Subsequently, each property is appraised each quarter by an independent third party appraiser, reviewed by TIAA’s internal appraisal staff and as applicable the Account’s independent fiduciary. In general, the Account obtains appraisals of its real estate properties spread out throughout the quarter, which is
intended to result in appraisal adjustments, and thus, adjustments to the valuations of its holdings (to the extent such adjustments are made) that happen regularly throughout each quarter and not on one specific day or month in each period. Further, management reserves the right to order an appraisal and/or conduct another valuation outside of the normal quarterly process when facts or circumstances at a specific property change. For example, under certain circumstances a valuation adjustment could be made when the account receives a bona fide
bid for the sale of a property held within the Account or one of the Account’s joint ventures. In addition, adjustments may be made for events or circumstances indicating an impairment of a tenant’s ability to pay amounts due to the Account under a lease (including due to a bankruptcy filing of that tenant).
Alternatively, adjustments may be made to reflect the execution or renewal of a significant lease. Also, adjustments may be made to reflect factors (such as sales values for comparable properties or local employment rate) bearing uniquely on a particular region in which the Account holds properties. TIAA’s
internal appraisal staff oversees the entire appraisal process, in conjunction with the Account’s independent fiduciary (the independent fiduciary is more fully described in the paragraph below). Any differences in the conclusions of TIAA’s internal appraisal staff and the independent appraiser will be reviewed by
the independent fiduciary, which will make a final determination on the matter (which may include ordering a subsequent independent appraisal). The independent fiduciary, Real Estate Research Corporation, has been appointed by a special subcommittee of the Investment Committee of the Board to, among other things, oversee the appraisal process. The independent fiduciary must approve all independent appraisers used by the Account. All appraisals are
performed in accordance with Uniform Standards of Professional Appraisal Practices, the real estate appraisal industry standards created by The Appraisal Foundation. Real estate appraisals are estimates of property values based on a professional’s opinion. Appraisals of properties held outside of the U.S. are
performed in accordance with industry standards commonly applied in the applicable jurisdiction. These independent appraisers are always expected to be MAI-designated members of the Appraisal Institute (or its European equivalent, Royal Institute of Chartered Surveyors) and state certified appraisers from
national or regional firms with relevant property type experience and market knowledge. Under the Account’s current procedures, each independent appraisal firm will be rotated off of a particular property at least every three years, although such appraisal firm may perform appraisals of other Account properties
subsequent to such rotation. 8
Also, the independent fiduciary can require additional appraisals if factors or events have occurred that could materially change a property’s value (including those identified above) and such change is not reflected in the quarterly valuation review, or otherwise to ensure that the Account is valued appropriately.
The independent fiduciary must also approve any valuation change of real estate-related assets where a property’s value changed by more than 6% from the most recent independent annual appraisal, or if the value of the Account would change by more than 4% within any calendar quarter or more than 2% since
the prior calendar month. When a real estate property is subject to a mortgage, the property is valued independently of the mortgage and the property and mortgage fair values are reported separately (see “Valuation of Mortgage Loans Payable” below). The independent fiduciary reviews and approves all
mortgage valuation adjustments before such adjustments are recorded by the Account. The Account continues to use the revised value for each real estate property and mortgage loan payable to calculate the Account’s daily net asset value until the next valuation review or appraisal. Valuation of Real Estate Joint Ventures—Real estate joint ventures are stated at the fair value of the Account’s ownership interests of the underlying entities. The Account’s ownership interests are valued based on the fair value of the underlying real estate, any related mortgage loans payable, and other factors, such
as ownership percentage, ownership rights, buy/sell agreements, distribution provisions and capital call obligations. Upon the disposition of all real estate investments by an investee entity, the Account will continue to state its equity in the remaining net assets of the investee entity during the wind down period, if
any, which occurs prior to the dissolution of the investee entity. Valuation of Real Estate Limited Partnerships—Limited partnership interests are stated at the fair value of the Account’s ownership in the partnership which are recorded based upon the changes in the net asset values of the limited partnerships as determined from the financial statements of the limited partnerships
when received by the Account. Prior to the receipt of the financial statements from the limited partnerships, the Account estimates the value of its interest in good faith and will from time to time seek input from the issuer or the sponsor of the investments. Since market quotations are not readily available, the
limited partnership interests are valued at fair value as determined in good faith by management under the direction of the Investment Committee of the Board and in accordance with the responsibilities of the Board as a whole. Valuation of Marketable Securities—Equity securities listed or traded on any national market or exchange are valued at the last sale price as of the close of the principal securities market or exchange on which such securities are traded or, if there is no sale, at the mean of the last bid and asked prices on such market
or exchange, exclusive of transaction costs. Debt securities, other than money market instruments, are generally valued at the most recent bid price or the equivalent quoted yield for such securities (or those of comparable maturity, quality and type). Money market instruments, with maturities of one year or less, are valued in the same manner as debt
securities or derived from a pricing matrix. Equity and fixed income securities traded on a foreign exchange or in foreign markets are valued using their closing values under the valuation methods generally accepted in the country where traded, as of the valuation date. This value is converted to U.S. dollars at the exchange rate in effect on the valuation day.
Under certain circumstances (for example, if there are significant movements in the United States markets and there is an expectation the securities traded on foreign markets will adjust based on such movements when the foreign markets open the next day), the Account may adjust the value of equity or fixed
income securities that trade on a foreign exchange or market after the foreign exchange or market has closed. Valuation of Mortgage Loans Payable—Mortgage loans payable are stated at fair value. The estimated fair values of mortgage loans payable are based on the amount at which the liability could be transferred to a third party exclusive of transaction costs. Mortgage loans payable are valued internally by TIAA’s
internal valuation department, as reviewed by the Account’s independent fiduciary, at least quarterly based on market factors, such as market interest rates and spreads for comparable loans, the performance of the underlying collateral (such as the loan-to-value ratio and the cash flow of the underlying collateral),
the liquidity for mortgage loans of similar characteristics, the maturity date of the loan, and the return demands of the market. Interest expense for mortgage loans payable is recorded on the accrual basis taking into account the outstanding principal contractual interest rates and financing costs at the time
mortgages payable are entered into by the Account. 9
See Note 5—Assets and Liabilities Measured at Fair Value on a Recurring Basis for further discussion and disclosure regarding the determination of the fair value of the Account’s investments. Foreign Currency Transactions and Translation: Portfolio investments and other assets and liabilities denominated in foreign currencies are translated into U.S. dollars at the exchange rates prevailing at the end of the period. Purchases and sales of securities, income receipts and expense payments made in foreign
currencies are translated into U.S. dollars at the exchange rates prevailing on the respective dates of the transactions. The effect of any changes in foreign currency exchange rates on portfolio investments and mortgage loans payable are included in net realized and unrealized gains and losses on real estate
properties and mortgage loans payable. Net realized gains and losses on foreign currency transactions include disposition of foreign currencies, and currency gains and losses between the accrual and receipt dates of portfolio investment income and between the trade and settlement dates of portfolio investment
transactions. Accumulation and Annuity Funds: The accumulation fund represents the net assets attributable to participants in the accumulation phase of their investment (“Accumulation Fund”). The annuity fund represents the net assets attributable to the participants currently receiving annuity payments (“Annuity Fund”).
The net increase or decrease in net assets from investment operations is apportioned between the accounts based upon their relative daily net asset values. Once an Account participant begins receiving lifetime annuity income benefits, payment levels cannot be reduced as a result of the Account’s actual mortality
experience. In addition, the contracts pursuant to which the Account is offered are required to stipulate the maximum expense charge for all Account level expenses that can be assessed, which is not to exceed to 2.5% of average net assets per year. The Account pays a fee to TIAA to assume mortality and expense
risks. Accounting for Investments: The investments held by the Account are accounted for as follows: Real Estate Properties—Rent from real estate properties consists of all amounts earned under tenant operating leases, including base rent, recoveries of real estate taxes and other expenses and charges for miscellaneous services provided to tenants. Rental income is recognized in accordance with the billing terms of
the lease agreements. The Account bears the direct expenses of the real estate properties owned. These expenses include, but are not limited to, fees to local property management companies, property taxes, utilities, maintenance, repairs, insurance, and other operating and administrative costs. An estimate of the
net operating income earned from each real estate property is accrued by the Account on a daily basis and such estimates are adjusted when actual operating results are determined. Real Estate Joint Ventures—The Account has limited ownership interests in various real estate joint ventures (collectively, the “joint ventures”). The Account records its contributions as increases to its investments in the joint ventures, and distributions from the joint ventures are treated as income within income from
real estate joint ventures and limited partnerships in the Account’s consolidated statements of operations. Distributions that are identified as returns of capital or capital gains or losses are recorded as unrealized gains and realized gains and losses, respectively. Income from the joint ventures is recorded based on
the Account’s proportional interest of the income distributed by the joint ventures. Income earned but not yet distributed to the Account by the joint ventures is recorded as unrealized gains and losses. Limited Partnerships—The Account has limited ownership interests in various private real estate funds (primarily limited partnerships) and a private real estate investment trust (collectively, the “limited partnerships”). The Account records its contributions as increases to the investments, and distributions from the
investments are treated as income within income from real estate joint ventures and limited partnerships in the Account’s consolidated statements of operations. Distributions that are identified as returns of capital or capital gains or losses are recorded as unrealized gains and realized gains and losses, respectively.
Unrealized gains and losses are recorded based upon the changes in the net asset values of the limited partnerships as determined from the financial statements of the limited partnerships when received by the Account. Prior to the receipt of the financial statements from the limited partnerships, the Account
estimates the value of its interest in good faith and will from time to time seek input from the issuer or the sponsor of the investments. Changes in value based on such estimates are recorded by the Account as unrealized gains and losses. Marketable Securities—Transactions in marketable securities are accounted for as of the date the securities are purchased or sold (trade date). Interest income is recorded as earned. Dividend income is recorded on the ex-dividend date within dividend income. Dividends that are identified as returns of capital or
capital 10
gains or losses are recorded as unrealized gains and realized gains and losses, respectively. Realized gains and losses on securities transactions are accounted for on the specific identification method. Realized and Unrealized Gains and Losses—Realized gains and losses are recorded at the time an investment is sold or a distribution is received in relation to an investment sale from a joint venture or limited partnership. Real estate transactions are accounted for as of the date on which the purchase or sale
transactions for the real estate properties close (settlement date). The Account recognizes a realized gain on the sale of a real estate property to the extent that the contract sales price exceeds the cost-to-date of the property being sold. A realized loss occurs when the cost-to-date exceeds the sales price. Unrealized gains and losses are recorded as the fair values of the Account’s investments are adjusted, and as discussed within the Real Estate Joint Ventures and Limited Partnership sections above. Net Assets—The Account’s net assets as of the close of each valuation day are valued by taking the sum of:
the value of the Account’s cash; cash equivalents, and short-term and other debt instruments; • the value of the Account’s other securities and other non-real estate assets; • the value of the individual real properties (based on the most recent valuation of that property) and other real estate-related investments owned by the Account; • an estimate of the net operating income accrued by the Account from its properties, other real estate-related investments and non-real estate-related investments (including short-term marketable securities) since the end of the prior valuation day; and • actual net operating income earned from the Account’s properties, other real estate-related investments and non-real estate-related investments (but only to the extent any such item of income differs from the estimated income accrued for on such investments), and then reducing the sum by liabilities held within the Account, including the daily investment management fee, administration and distribution fees, mortality and expense fee, and liquidity guarantee fee, and certain other expenses attributable to operating the Account. Daily estimates of net operating income are
adjusted to reflect actual net operating income on a monthly basis, at which time such adjustments (if any) are reflected in the Account’s unit value. After the end of every quarter, the Account reconciles the amount of expenses deducted from the Account (which is established in order to approximate the costs that the Account will incur) with the expenses the Account actually incurred. If there is a difference, the Account adds it to or deducts it from the
Account in equal daily installments over the remaining days of the following quarter. Material differences may be repaid in the current calendar quarter. The Account’s at-cost deductions are based on projections of Account assets and overall expenses, and the size of any adjusting payments will be directly affected
by the difference between management’s projections and the Account’s actual assets or expenses. Cash and Cash Equivalents: Cash and cash equivalents are balances held by the Account in bank deposit accounts which, at times, exceed federally insured limits. The Account’s management monitors these balances to mitigate the exposure of risk due to concentration and has not experienced any losses from such
concentration. Federal Income Taxes: Based on provisions of the Internal Revenue Code, Section 817, the Account is taxed as a segregated asset account of TIAA and as such, the Account should incur no material federal income tax attributable to the net investment activity of the Account. Management has analyzed the
Account’s tax positions taken for all open federal income tax years (2007-2011) and has concluded no provisions for federal income tax are required as of March 31, 2012. Restricted Cash: The Account held $43.7 million and $44.0 million as of March 31, 2012 and December 31, 2011, respectively, in escrow accounts for property taxes, insurance, and various other property related matters as required by certain creditors related to the Account’s outstanding mortgage loans payable.
These amounts are recorded within other assets on the consolidated statements of assets and liabilities. See Note 8—Mortgage Loans Payable for additional information regarding the Account’s outstanding mortgage loans payable. 11
•
Changes in Net Assets: Premiums include premiums paid by existing accumulation unit holders in the Account and transfers into the Account. Withdrawals and death benefits include withdrawals out of the Account which include transfers out of the Account and required minimum distributions. Due to/from Investment Advisor: Due to/from investment advisor represents amounts that are to be paid or received by TIAA on behalf of the Account. Amounts generally are paid or received by the Account within one or two business days and no interest is contractually charged on these amounts. Note 2—Management Agreements and Arrangements Investment advisory services for the Account are provided by TIAA employees, under the direction of the Board and its Investment Committee, pursuant to investment management procedures adopted by TIAA for the Account. TIAA’s investment management decisions for the Account are subject to review by
the Account’s independent fiduciary. TIAA also provides various portfolio accounting and related services for the Account. The Account is a party to the Distribution Agreement for the Contracts Funded by the TIAA Real Estate Account (the “Distribution Agreement”), dated January 1, 2008, by and among TIAA, for itself and on behalf of the Account, and TIAA-CREF Individual and Institutional Services, LLC (“Services”), a wholly
owned subsidiary of TIAA, a registered broker-dealer and a member of the Financial Industry Regulatory Authority. Pursuant to the Distribution Agreement, Services performs distribution services for the Account which include, among other things, (i) distribution of annuity contracts issued by TIAA and funded
by the Account, (ii) advising existing annuity contract owners in connection with their accumulations and (iii) helping employers implement and manage retirement plans. In addition, TIAA performs administrative functions for the Account, which include, among other things, (i) maintaining accounting records and
performing accounting services, (ii) receiving and allocating premiums, (iii) calculating and making annuity payments, (iv) processing withdrawal requests, (v) providing regulatory compliance and reporting services, (vi) maintaining the Account’s records of contract ownership and (vii) otherwise assisting generally
in all aspects of the Account’s operations. Both distribution services (pursuant to the Distribution Agreement) and administrative services are provided to the Account by Services and TIAA, as applicable, on an at cost basis. The Distribution Agreement is terminable by either party upon 60 days written notice and terminates automatically upon any assignment thereof. TIAA and Services provide investment management, administrative and distribution services at cost. TIAA and Services receive payments from the Account on a daily basis according to formulas established each year and adjusted periodically with the objective of keeping the payments as close as possible to the
Account’s expenses actually incurred. Any differences between actual expenses and the amounts paid by the Account are adjusted quarterly. TIAA also provides a liquidity guarantee to the Account, for a fee, to ensure that sufficient funds are available to meet participant transfer and cash withdrawal requests in the event that the Account’s cash flows and liquid investments are insufficient to fund such requests. TIAA ensures sufficient funds are
available for such transfer and withdrawal requests by purchasing accumulation units of the Account. See Note 3—Related Party Transactions below. To the extent TIAA owns accumulation units issued pursuant to the liquidity guarantee, the independent fiduciary monitors and oversees, among other things, TIAA’s ownership interest in the Account and may require TIAA to eventually redeem some of its units, particularly when the Account has uninvested
cash or liquid investments available. TIAA also receives a fee for assuming certain mortality and expense risks. The expenses for the services noted above that are provided to the Account by TIAA and Services are identified in the accompanying consolidated statements of operations and are reflected in Note 9—Financial Highlights. Note 3—Related Party Transactions Pursuant to its existing liquidity guarantee obligation, as of March 31, 2012, the TIAA General Account owned 4.7 million accumulation units (which are generally referred to as “liquidity units”) issued by the Account. Since December 2008 and through June 2009, TIAA paid an aggregate of $1.2 billion to
purchase 12
these liquidity units in multiple transactions. TIAA has not purchased additional liquidity units since June 2009. In accordance with this liquidity guarantee obligation, TIAA guarantees that all participants in the Account may redeem their accumulation units at their accumulation unit value next determined after their transfer or cash withdrawal request is received in good order. Liquidity units owned by TIAA are valued in
the same manner as accumulation units owned by the Account’s participants. Management believes that TIAA has the ability to meet its obligations under the liquidity guarantee. As discussed in the Account’s prospectus and in accordance with a prohibited transaction exemption from the U.S. Department of Labor (PTE 96-76), the Account’s independent fiduciary, Real Estate Research Corporation, has certain responsibilities with respect to the Account that it has undertaken or is
currently undertaking with respect to TIAA’s purchase of liquidity units, including among other things, reviewing the purchase and redemption of liquidity units by TIAA to ensure the Account uses the correct unit values. In addition, as set forth in PTE 96-76, the independent fiduciary’s responsibilities include:
•
establishing the percentage of total accumulation units that TIAA’s ownership should not exceed (the “trigger point”) and creating a method for changing the trigger point; • approving any adjustment of TIAA’s ownership interest in the Account and, in its discretion, requiring an adjustment if TIAA’s ownership of liquidity units reaches the trigger point; and • once the trigger point has been reached, participating in any program to reduce TIAA’s ownership in the Account by utilizing cash flow or liquid investments in the Account, or by utilizing the proceeds from asset sales. The independent fiduciary’s role in participating in any such asset sales program
would include (i) participating in the selection of properties for sale, (ii) providing sales guidelines and (iii) approving those sales if, in the independent fiduciary’s opinion, such sales are desirable to reduce TIAA’s ownership of liquidity units. The independent fiduciary, which has the right to adjust the trigger point, has established the trigger point at 45% of the outstanding accumulation units and it will continue to monitor TIAA’s ownership interest in the Account and provide further recommendations as necessary. As of March 31, 2012, TIAA owned
approximately 8.7% of the outstanding accumulation units of the Account. The independent fiduciary currently intends to cause systematic redemptions of the liquidity units as follows. The independent fiduciary intends to cause a redemption of approximately one-quarter of the liquidity units held by TIAA on a daily basis throughout the third month of each fiscal quarter, beginning June
1, 2012, so long as (i) the Account holds and is projected to hold at least 17% of its net assets in cash, cash equivalents and publicly traded, liquid non-real estate related securities, after taking into account certain projected sources and uses of cash flow into the Account and (ii) recent historical net participant flows
have been positive over the 20 business days prior to such redemption. In addition, at any time the Account holds cash, cash equivalents and publicly traded, liquid non real estate related securities in excess of 25% of its net assets, the independent fiduciary will cause redemption of liquidity units in an amount
sufficient to reduce such level to 25% of net assets. As of March 31, 2012 the Account was not required to redeem any liquidity units. As discussed in Note 2—Management Agreements and Arrangements, TIAA and Services provide certain services to the Account on an at cost basis. See Note 9—Financial Highlights for details of the expense charge and expense ratio. Note 4—Credit Risk Concentrations Concentrations of credit risk may arise when a number of properties or tenants are located in a similar geographic region such that the economic conditions of that region could impact tenants’ obligations to meet their contractual obligations or cause the values of individual properties to decline. The Account has
no significant concentrations of tenants as no single tenant has annual contract rent that makes up more than 2.1% of the rental income of the Account. The substantial majority of the Account’s wholly owned real estate investments and investments in joint ventures are located in the United States. The following table represents the diversification of the Account’s portfolio by region and property type: 13
Diversification by Fair Value(1)
East
West
South
Midwest
Foreign(2)
Total Office
21.8
%
15.8
%
9.5
%
0.3
%
2.2
%
49.6
% Apartment
6.6
%
5.4
%
4.9
%
—
—
16.9
% Industrial
1.3
%
6.8
%
4.5
%
1.2
%
—
13.8
% Retail
3.9
%
2.8
%
7.8
%
0.2
%
1.8
%
16.5
% Other(3)
2.9
%
0.2
%
0.1
%
—
—
3.2
% Total
36.5
%
31.0
%
26.8
%
1.7
%
4.0
%
100.0
%
(1)
Wholly-owned properties are represented at their fair value, gross of any debt, while joint venture investments are represented at their net equity value. (2) Represents real estate investments in the United Kingdom and France. (3) Represents interest in Storage Portfolio investment and fee interest encumbered by a ground lease real estate investment. Properties in the "East" region are located in: CT, DC, DE, KY, MA, MD, ME, NC, NH, NJ, NY, PA, RI, SC, VA, VT, WV Properties in the "West" region are located in: AK, AZ, CA, CO, HI, ID, MT, NM, NV, OR, UT, WA, WY Properties in the "South" region are located in: AL, AR, FL, GA, LA, MS, OK, TN, TX Properties in the "Midwest" region are located in: IA, IL, IN, KS, MI, MN, MO, ND, NE, OH, SD, WI Note 5—Assets and Liabilities Measured at Fair Value on a Recurring Basis Valuation Hierarchy: The Account’s fair value measurements are grouped categorically into three levels, as defined by the FASB. The levels are defined as follows: Level 1—Valuations using unadjusted quoted prices for assets traded in active markets, such as stocks listed on the New York Stock Exchange. Active markets are defined as having the following characteristics for the measured asset or liability: (i) many transactions, (ii) current prices, (iii) price quotes not varying
substantially among market makers, (iv) narrow bid/ask spreads and (v) most information regarding the issuer is publicly available. Level 1 assets held by the Account are generally marketable equity securities. Level 2—Valuations for assets and liabilities traded in less active, dealer or broker markets. Fair values are primarily obtained from third party pricing services for identical or comparable assets or liabilities. Level 2 inputs for fair value measurements are inputs, other than quoted prices included within Level 1, that
are observable for the asset or liability, either directly or indirectly. Level 2 inputs include: a. Quoted prices for similar assets or liabilities in active markets; b. Quoted prices for identical or similar assets or liabilities in markets that are not active (that is, markets in which there are few transactions for the asset (or liability), the prices are not current, price quotations vary substantially either over time or among market makers (for example, some brokered
markets), or in which little information is released publicly); c. Inputs other than quoted prices that are observable within the market for the asset (or liability) (for example, interest rates and yield curves, volatilities, prepayment speeds, loss severities, credit risks, and default rates that are observable at commonly quoted intervals); and d. Inputs that are derived principally from or corroborated by observable market data by correlation or other means (for example, market-corroborated inputs). Examples of securities which may be held by the Account and included in Level 2 include certificates of deposit, commercial paper, government agency notes, variable notes, United States Treasury securities, and debt securities. Level 3—Valuations for assets and liabilities that are derived from other valuation methodologies, including pricing models, discounted cash flow models and similar techniques, and are not based on market exchange, 14
dealer, or broker-traded transactions. Level 3 valuations incorporate certain assumptions and projections that are not observable in the market, and require significant professional judgment in determining the fair value assigned to such assets or liabilities. Examples of Level 3 assets and liabilities which may be held
by the Account from time to time include investments in real estate, investments in joint ventures and limited partnerships, and mortgage loans receivable and payable. An investment’s categorization within the valuation hierarchy described above is based upon the lowest level of input that is significant to the fair value measurement. The Account’s determination of fair value is based upon quoted market prices, where available. If listed prices or quotes are not available, fair value is based upon vendor-provided, evaluated prices or internally-developed models that primarily use market-based or independently-sourced market data, including
interest rate yield curves, market spreads, and currency rates. Valuation adjustments will be made to reflect changes in credit quality, counterparty’s creditworthiness, the Account’s creditworthiness, liquidity, and other observable and unobservable inputs that are applied consistently over time. The methods described above are considered to produce fair values that represent a good faith estimate of what an unaffiliated buyer in the marketplace would pay to purchase the asset or would receive to transfer the liability. Since fair value calculations involve significant professional judgment in the application
of both observable and unobservable attributes, actual realizable values or future fair values may differ from amounts reported. Furthermore, while the Account believes its valuation methods are appropriate and consistent with other market participants, the use of different methodologies or assumptions to
determine the fair value of certain financial instruments, while reasonable, could result in different estimates of fair value at the reporting date. As discussed in Note 1—Organization and Significant Accounting Policies in more detail, the Account generally obtains independent third party appraisals on a quarterly
basis; there may be circumstances in the interim in which the true realizable value of a property is not reflected in the Account’s daily net asset value calculation or in the Account’s periodic consolidated financial statements. This disparity may be more apparent when the commercial and/or residential real estate
markets experience an overall and possibly dramatic decline (or increase) in property values in a relatively short period of time between appraisals. 15
The following tables show the major categories of assets and liabilities measured at fair value on a recurring basis as of March 31, 2012 (unaudited) and December 31, 2011, using unadjusted quoted prices in active markets for identical assets (Level 1); significant other observable inputs (Level 2); and significant
unobservable inputs (Level 3) (in millions): Description
Level 1:
Level 2:
Level 3:
Total at Real estate properties
$
—
$
—
$
10,140.8
$
10,140.8 Real Estate joint ventures
—
—
1,705.4
1,705.4 Limited partnerships
—
—
318.3
318.3 Marketable securities: Real Estate Related
1,138.7
—
—
1,138.7 Government Agency Notes
—
1,131.0
—
1,131.0 United States Treasury securities
—
1,845.5
—
1,845.5 Total Investments at March 31, 2012
$
1,138.7
$
2,976.5
$
12,164.5
$
16,279.7 Mortgage loans payable
$
—
$
—
$
(2,137.3
)
$
(2,137.3
) Description
Level 1:
Level 2:
Level 3:
Total at Real estate properties
$
—
$
—
$
9,857.6
$
9,857.6 Real Estate joint ventures
—
—
1,591.4
1,591.4 Limited partnerships
—
—
307.5
307.5 Marketable securities: Real Estate Related
927.9
—
—
927.9 Government Agency Notes
—
1,551.6
—
1,551.6 United States Treasury securities
—
1,251.2
—
1,251.2 Total Investments at December 31, 2011
$
927.9
$
2,802.8
$
11,756.5
$
15,487.2 Mortgage loans payable
$
—
$
—
$
(2,028.2
)
$
(2,028.2
) The following tables show the reconciliation of the beginning and ending balances for assets and liabilities measured at fair value on a recurring basis using significant unobservable inputs (Level 3) during the three months ended March 31, 2012 and March 31, 2011 (in millions, unaudited):
Real Estate
Real Estate
Limited
Total
Mortgage For the three months ended Beginning balance January 1, 2012
$
9,857.6
$
1,591.4
$
307.5
$
11,756.5
$
(2,028.2
) Total realized and unrealized gains (losses) included in changes in net assets
187.2
84.6
7.2
279.0
(21.7
) Purchases(1)
142.2
29.6
4.7
176.5
(90.0
) Sales
(46.2
)
—
—
(46.2
)
— Settlements(2)
—
(0.2
)
(1.1
)
(1.3
)
2.6 Ending balance March 31, 2012
$
10,140.8
$
1,705.4
$
318.3
$
12,164.5
$
(2,137.3
) 16
Quoted
Prices in
Active Markets
for Identical
Assets
Significant
Other
Observable
Inputs
Significant
Unobservable
Inputs
March 31,
2012
Quoted
Prices in
Active Markets
for Identical
Assets
Significant
Other
Observable
Inputs
Significant
Unobservable
Inputs
December 31,
2011
Properties
Joint Ventures
Partnerships
Level 3
Investments
Loans
Payable
March 31, 2012
Real Estate
Real Estate
Limited
Total
Mortgage For the three months ended Beginning balance January 1, 2011
$
8,115.5
$
1,358.8
$
270.3
$
9,744.6
$
(1,860.2
) Total realized and unrealized gains (losses) included in changes in net assets
186.2
54.4
8.1
248.7
1.4 Purchases(1)
82.2
8.7
1.2
92.1
— Sales
(39.0
)
—
—
(39.0
)
— Settlements(2)
0.9
0.6
—
1.5
2.6 Ending balance March 31, 2011
$
8,345.8
$
1,422.5
$
279.6
$
10,047.9
$
(1,856.2
)
(1)
Includes purchases, contributions for joint ventures and limited partnerships, and capital expenditures. (2) Includes operating income for real estate joint ventures and limited partnerships, net of distributions and principal payments on mortgage loans payable. The following table shows quantitative information about unobservable inputs related to the Level 3 fair value measurements used during the three months ended March 31, 2012 (unaudited).
Type
Asset Class
Valuation
Unobservable
Range
Real Estate Properties and Real Estate Joint Ventures
Office
Income Approach—
Discount Rate
6.5% - 10.5%
Industrial
Income Approach—Discounted cash flow
Discount Rate
6.5% - 10.5%
Residential
Income Approach—Discounted cash flow
Discount Rate
6.0% - 8.0%
Retail
Income Approach—Discounted cash flow
Discount Rate
4.8% - 10.8%
Mortgage Loans Payable
Office and Industrial
Discounted cash flow
Loan to Value Ratio
38.0% - 69.0%
Residential
Discounted cash flow
Loan to Value Ratio
41.0% - 58.0%
Retail
Discounted cash flow
Loan to Value Ratio
36.0% - 153.0%
Limited Partnerships
Relative Value
Estimated Net Asset Value
(NAV)*
0% - 1.5%
*
See Determination of Investments at Fair Value, Valuation of Real Estate Limited Partnerships within Note 1—Organization of Significant Accounting Policies.
Real Estate Properties and Joint Ventures: The significant unobservable inputs used in the fair value measurement of the Account’s real estate properties and joint ventures are the selection of certain 17
Properties
Joint Ventures
Partnerships
Level 3
Investments
Loans
Payable
March 31, 2011
Technique(s)
Inputs
Discounted cash flow
Income Approach—Direct Capitalization
Terminal Capitalization Rate
Overall Capitalization Rate
5.5% - 8.8%
4.5% - 9.5%
Income Approach—Direct Capitalization
Terminal Capitalization Rate
Overall Capitalization Rate
6.0% - 9.5%
5.0% - 9.0%
Income Approach—Direct Capitalization
Terminal Capitalization Rate
Overall Capitalization Rate
4.5% - 6.5%
4.0% - 5.8%
Income Approach—Direct Capitalization
Terminal Capitalization Rate
Overall Capitalization Rate
4.8% - 10.5%
4.5% - 10.3%
Net Present Value
Credit Spreads
Loan to Value Ratio
Weighted Average Cost of
Capital Risk Premiums
2.1% - 3.0%
38.0% - 69.0%
1.0% - 3.2%
Net Present Value
Credit Spreads
Loan to Value Ratio
Weighted Average Cost of
Capital Risk Premiums
1.8% - 2.3%
41.0% - 58.0%
1.0% - 2.2%
Net Present Value
Credit Spreads
Loan to Value Ratio
Weighted Average Cost of
Capital Risk Premiums
2.2% - 7.0%
36.0% - 153.0%
1.0% - 13.9%
investment rates (Discount Rate, Terminal Capitalization Rate, and Overall Capitalization Rate). Significant increases (decreases) in any of those inputs in isolation would result in significantly lower (higher) fair value measurements, respectively. Mortgage Loans Payable: The significant unobservable inputs used in the fair value measurement of the Account’s mortgage loans payable are the loan to value ratios and the selection of certain credit spreads and weighted average cost of capital risk premiums. Significant increases (decreases) in any of those
inputs in isolation would result in a significantly lower (higher) fair value, respectively. Limited Partnerships: The significant unobservable inputs used in the fair value measurement of the Account’s limited partnerships is the financial information received by the Account from the limited partnership investments. Significant increases (decreases) in any of those inputs in isolation would result in a
significantly higher (lower) fair value, respectively. During the three months ended March 31, 2012 and 2011 there were no transfers between Levels 1, 2, or 3. The amount of total net unrealized gains (losses) included in changes in net assets attributable to the change in net unrealized gains (losses) relating to Level 3 investments and mortgage loans payable using significant unobservable inputs still held as of the reporting date is as follows (in millions, unaudited):
Real Estate
Real Estate
Limited
Total
Mortgage For the three months ended
$
188.8
$
84.7
$
7.1
$
280.6
$
(21.7
) For the three months ended
$
184.1
$
54.4
$
8.1
$
246.6
$
1.4 Note 6—Investments in Joint Ventures The Account owns interests in several real estate properties through joint ventures and receives distributions and allocations of profits and losses from the joint ventures based on the Account’s ownership interest in those investments. Several of these joint ventures have mortgage loans payable collateralized by the
properties owned by the aforementioned joint ventures. At March 31, 2012, the Account held 12 investments in joint ventures with non-controlling ownership interest percentages that ranged from 33% to 85%. Certain joint ventures are subject to adjusted distribution percentages when earnings in the investment
reach a pre-determined threshold. The Account’s equity in the joint ventures was $1.7 billion at March 31, 2012 and $1.6 billion at December 31, 2011. The Account’s most significant joint venture investment was the DDR joint venture which represented 2.5% of the Account’s net assets and 2.2% of the Account’s
invested assets at March 31, 2012. The Account’s proportionate share of the fair value of the mortgage loans payable within the joint venture investments was $1.6 billion at March 31, 2012 and December 31, 2011. The Account’s share in the outstanding principal of the mortgage loans payable within the joint ventures was $1.6 billion at March 31,
2012 and December 31, 2011. 18
Properties
Joint Ventures
Partnerships
Level 3
Investments
Loans
Payable
March 31, 2012
March 31, 2011
A condensed summary of the financial position and results of operations of the joint ventures are shown below (in millions):
March 31, 2012
December 31, 2011
(Unaudited) Assets Real estate properties, at fair value
$
5,060.9
$
4,844.3 Other assets
147.0
128.9 Total assets
5,207.9
4,973.2 Liabilities & Equity Mortgage loans payable, at fair value
$
2,258.1
$
2,259.1 Other liabilities
99.0
83.6 Total liabilities
2,357.1
2,342.7 Equity
2,850.8
2,630.5 Total liabilities and equity
$
5,207.9
$
4,973.2
For the Three Months Ended
March 31,
2012
2011
(Unaudited)
(Unaudited) Operating Revenues and Expenses Revenues
$
114.0
$
111.9 Expenses
68.4
68.4 Excess of revenues over expenses
$
45.6
$
43.5 Management of the Account monitors the financial position of the Account’s joint venture partners. To the extent that management of the Account determines that a joint venture partner has financial or liquidity concerns, management will evaluate all actions and remedies available to the Account under the
applicable joint venture agreement to minimize any potential adverse implications to the Account. Note 7—Investments in Limited Partnerships The Account invests in limited partnerships that own real estate properties and real estate-related securities and the Account receives distributions from the limited partnerships based on the Account’s ownership interest percentages. At March 31, 2012, the Account held five limited partnership investments and one
private real estate equity investment trust (all of which featured non-controlling ownership interests) with ownership interest percentages that ranged from 5.3% to 18.5%. Under the terms of the partnership agreements governing such investments, and based upon the expected term of each such partnership, the
partnerships could engage in liquidation activities beginning in 2012 through 2015. During 2012, the Account’s investment in MONY/Transwestern Mezz RP II, LLC is anticipated to liquidate. The Account’s ownership interest in limited partnerships was $318.3 million and $307.5 million at March 31, 2012 and
December 31, 2011, respectively. 19
Note 8—Mortgage Loans Payable The Account had outstanding mortgage loans payable secured by the following properties (in millions, unaudited):
Property
Interest Rate and
Principal
Maturity
March 31, 2012
December 31, 2011 1 & 7 Westferry Circus(1)(2)(5)
5.40% paid quarterly
$
208.5
$
203.9
November 15, 2012 Reserve at Sugarloaf(1)(5)
5.49% paid monthly
24.2
24.3
June 1, 2013 South Frisco Village
5.85% paid monthly
26.3
26.3
June 1, 2013 Fourth & Madison
6.40% paid monthly
145.0
145.0
August 21, 2013 1001 Pennsylvania Avenue
6.40% paid monthly
210.0
210.0
August 21, 2013 50 Fremont
6.40% paid monthly
135.0
135.0
August 21, 2013 Pacific Plaza(1)(5)
5.55% paid monthly
8.2
8.2
September 1, 2013 Wilshire Rodeo Plaza(5)
5.28% paid monthly
112.7
112.7
April 11, 2014 1401 H Street(1)(5)
5.97% paid monthly
111.9
112.3
December 7, 2014 Windsor at Lenox Park(5)
4.43% paid monthly
24.0
24.0
August 1, 2015 San Montego Apartments(5)(6)
4.47% paid monthly
21.8
21.8
August 1, 2015 Montecito Apartments(5)(6)
4.47% paid monthly
20.2
20.2
August 1, 2015 Phoenician Apartments(5)(6)
4.47% paid monthly
21.3
21.3
August 1, 2015 The Colorado(1)(5)
5.65% paid monthly
84.0
84.3
November 1, 2015 99 High Street
5.52% paid monthly
185.0
185.0
November 11, 2015 The Legacy at Westwood(1)(5)
5.95% paid monthly
40.3
40.5
December 1, 2015 Regents Court(1)(5)
5.76% paid monthly
34.4
34.5
December 1, 2015 The Caruth(1)(5)
5.71% paid monthly
40.2
40.4
December 1, 2015 Lincoln Centre
5.51% paid monthly
153.0
153.0
February 1, 2016 The Legend at Kierland(5)(7)
4.97% paid monthly
21.8
21.8
August 1, 2017 The Tradition at Kierland(5)(7)
4.97% paid monthly
25.8
25.8
August 1, 2017 Red Canyon at Palomino Park(5)(8)
5.34% paid monthly
27.1
27.1
August 1, 2020 Green River at Palomino Park(5)(8)
5.34% paid monthly
33.2
33.2
August 1, 2020 Blue Ridge at Palomino Park(5)(8)
5.34% paid monthly
33.4
33.4
August 1, 2020 Ashford Meadows(5)
5.17% paid monthly
44.6
44.6
August 1, 2020 The Corner(5)
4.66% paid monthly
105.0
105.0
June 1, 2021 The Palatine(5)
4.25% paid monthly
80.0
80.0
December 1, 2021 The Forum at Carlsbad(5)
4.25% paid monthly
90.0
—
March 1, 2022 Publix at Weston Commons(5)
5.08% paid monthly
35.0
35.0
January 1, 2036 Total Principal Outstanding
$
2,101.9
$
2,008.6 Fair Value Adjustment(4)
35.4
19.6 Total mortgage loans payable
$
2,137.3
$
2,028.2
(1)
The mortgage is adjusted monthly for principal payments. (2) The mortgage is denominated in British pounds and the principal payment had been converted to U.S. dollars using the exchange rate as of March 31, 2012. The interest rate is fixed. The cumulative foreign currency translation adjustment (since inception) was an unrealized gain of $18.1 million. (3) Interest rates are fixed, unless stated otherwise. (4) The fair value adjustment consists of the difference (positive or negative) between the principal amount of the outstanding debt and the fair value of the outstanding debt. See Note 1—Organization and Significant Accounting Policies. (5) These properties are each owned by separate wholly owned subsidiaries of TIAA for benefit of the Account. The assets and credit of each of these borrowing entities are not available to satisfy the debts and other obligations of the Account or any other entity or person other than such borrowing entity. (6) Represents mortgage loans payable on these individual properties which are held within the Houston Apartment Portfolio. (7) Represents mortgage loans payable on these individual properties which are held within the Kierland Apartment Portfolio. (8) Represents mortgage loans payable on these individual properties which are held within Palomino Park. 20
Payment Frequency(3)
Amounts as of
Note 9—Financial Highlights Selected condensed financial information for an Accumulation Unit of the Account is presented below. Per Accumulation Unit data is calculated on average units outstanding.
For the Three
Years Ended December 31,
2011
2010
2009
(Unaudited) Per Accumulation Unit data: Rental income
$
3.985
$
17.224
$
19.516
$
22.649 Real estate property level expenses and taxes
2.115
8.640
9.987
11.193 Real estate income, net
1.870
8.584
9.529
11.456 Other income
0.462
2.143
2.214
2.778 Total income
2.332
10.727
11.743
14.234 Expense charges(1)
0.646
2.390
2.167
2.280 Investment income, net
1.686
8.337
9.576
11.954 Net realized and unrealized gain (loss) on investments and mortgage loans payable
6.388
20.144
16.143
(85.848
) Net (decrease) increase in Accumulation Unit Value
8.074
28.481
25.719
(73.894
) Accumulation Unit Value: Beginning of period
247.654
219.173
193.454
267.348 End of period
$
255.728
$
247.654
$
219.173
$
193.454 Total return
3.26
%
12.99
%
13.29
%
-27.64
% Ratios to Average net Assets(2): Expenses(1)
0.25
%
0.98
%
1.09
%
1.01
% Investment income, net
0.66
%
3.42
%
4.84
%
5.29
% Portfolio turnover rate(2): Real estate properties(2,3)
0.38
%
3.01
%
1.01
%
0.75
% Marketable securities(2,4)
5.10
%
3.43
%
19.18
%
0.00
% Accumulation Units outstanding at end of period
54.4
53.4
48.1
39.5 Net assets end of period (in millions)
$
14,219.2
$
13,527.2
$
10,803.1
$
7,879.9
(1)
Expense charges per Accumulation Unit and the Ratio of Expenses to average net assets reflect the year to date Account-level expenses and exclude real estate property level expenses which are included in real estate income, net. If the real estate property level expenses were included, the expense charge per Accumulation Unit for the three months ended March 31, 2012 would be $2.761
($11.026, $12.154 and $13.473 for the years ended December 31, 2011, 2010 and 2009, respectively), and the Ratio of Expenses to average net assets for the three months ended March 31, 2012 would be 1.07% (4.52%, 6.14% and 5.96%, for the years ended December 31, 2011, 2010 and 2009, respectively). (2) Amounts for the three month period ended March 31, 2012 are not annualized. (3) Real estate investment portfolio turnover rate is calculated by dividing the lesser of purchases or sales of real estate property investments (including contributions to, or return of capital distributions received from, existing joint venture and limited partnership investments) by the average value of the portfolio of real estate investments held during the period. Amounts for the three months
ended March 31, 2012 are not annualized. (4) Marketable securities portfolio turnover rate is calculated by dividing the lesser of purchases or sales of securities, excluding securities having maturity dates at acquisition of one year or less, by the average value of the portfolio securities held during the period. 21
Months Ended
March 31,
2012
(in millions):
Note 10—Accumulation Units Changes in the number of Accumulation Units outstanding were as follows (in millions):
For the
For the Year Ended
(Unaudited) Outstanding: Beginning of period
53.4
48.1 Credited for premiums
2.0
10.0 Annuity, other periodic payments, withdrawals and death benefits
(1.0
)
(4.7
) End of period
54.4
53.4 Note 11—Commitments, Contingencies and Subsequent Events Commitments—The Account had $22.1 million and $26.1 million of outstanding immediately callable commitments to purchase additional interests in four of its limited partnership investments as of March 31, 2012 and December 31, 2011, respectively. Contingencies—The Account is party to various claims and routine litigation arising in the ordinary course of business. Management of the Account does not believe the results of any such claims or litigation, individually, or in the aggregate, will have a material effect on the Account’s business, financial position, or
results of operations. Note 12—New Accounting Pronouncements In May 2011, the FASB issued ASU No. 2011-04, “Amendments to Achieve Common Fair Value Measurements and Disclosure Requirements in U.S. GAAP and IFRSs” (“ASU 2011-04”), with the intention to converge fair value standards between U.S. GAAP and International Financial Reporting Standards.
This ASU is largely consistent with existing fair value measurement principles in U.S. GAAP, expands ASC 820’s existing disclosure requirements for fair value measurements and makes other amendments. The Account adopted ASU 2011-04 January 1, 2012. The adoption did not have an impact on the Account’s
consolidated statements of assets and liabilities or consolidated statements of operations. See Note 5—Assets and Liabilities Measured at Fair Value on a Recurring Basis for additional disclosures as a result of the adoption of ASU 2011-04. 22
Three Months
Ended
March 31, 2012
December 31, 2011
REAL ESTATE PROPERTIES—62.29% and 63.65%
Location/Description
Type
Fair Value
2012
2011
(Unaudited) Arizona: Camelback Center
Office
$
33.0
$
34.4 Kierland Apartment Portfolio
Apartments
103.4
(1)
104.2
(1) Phoenix Apartment Portfolio
Apartments
27.1
27.4 California: 3 Hutton Centre Drive
Office
38.0
37.7 50 Fremont Street
Office
365.2
(1)
332.3
(1) 88 Kearny Street
Office
80.5
81.9 275 Battery Street
Office
210.8
210.5 Centerside I
Office
46.0
40.7 Centre Pointe and Valley View
Industrial
26.6
22.6 Great West Industrial Portfolio
Industrial
104.9
99.0 Larkspur Courts
Apartments
91.4
90.2 Northpark Village Square
Retail
41.1
40.6 Northern CA RA Industrial Portfolio
Industrial
44.6
44.2 Ontario Industrial Portfolio
Industrial
279.0
(1)
273.5
(1) Pacific Plaza
Office
64.6
(1)
61.7
(1) Rancho Cucamonga Industrial Portfolio
Industrial
101.9
99.5 Regents Court
Apartments
67.8
(1)
68.0
(1) Southern CA RA Industrial Portfolio
Industrial
81.3
78.1 The Forum at Carlsbad
Retail
182.3
(1)
180.5 The Legacy at Westwood
Apartments
94.9
(1)
96.8
(1) Westcreek
Apartments
32.0
31.6 West Lake North Business Park
Office
44.9
43.6 Westwood Marketplace
Retail
105.0
97.0 Wilshire Rodeo Plaza
Office
164.7
(1)
166.1
(1) Colorado: Palomino Park
Apartments
224.5
(1)
214.7
(1) Connecticut: Ten & Twenty Westport Road
Office
136.2
130.7 Florida: 701 Brickell Avenue
Office
224.8
219.5 North 40 Office Complex
Office
29.7
29.7 Plantation Grove
Retail
10.0
9.9 Pointe on Tampa Bay
Office
—
47.3 Publix at Weston Commons
Retail
46.9
(1)
46.6
(1) Quiet Waters at Coquina Lakes
Apartments
26.0
26.5 Seneca Industrial Park
Industrial
71.8
71.3 South Florida Apartment Portfolio
Apartments
74.4
71.6 Suncrest Village Shopping Center
Retail
12.2
12.2 The Fairways of Carolina
Apartments
23.9
24.5 Urban Centre
Office
97.0
97.9 Weston Business Center
Industrial
85.6
85.3 France: Printemps de L’Homme
Retail
215.7
209.9 23
TIAA REAL ESTATE ACCOUNT
Location/Description
Type
Fair Value
2012
2011
(Unaudited) Georgia: Atlanta Industrial Portfolio
Industrial
$
43.9
$
43.7 Glenridge Walk
Apartments
34.7
35.2 Reserve at Sugarloaf
Apartments
45.9
(1)
45.9
(1) Shawnee Ridge Industrial Portfolio
Industrial
57.5
51.8 Windsor at Lenox Park
Apartments
52.5
(1)
53.2
(1) Illinois: Chicago Caleast Industrial Portfolio
Industrial
56.7
56.7 Chicago Industrial Portfolio
Industrial
66.5
66.5 Parkview Plaza
Office
39.7
39.4 Maryland: Broadlands Business Park
Industrial
28.3
27.9 GE Appliance East Coast Distribution Facility
Industrial
36.9
34.3 The Shops at Wisconsin Place
Retail
96.8
— Massachusetts: 99 High Street
Office
366.6
(1)
326.3
(1) Needham Corporate Center
Office
21.4
20.4 Northeast RA Industrial Portfolio
Industrial
27.0
27.0 Residence at Rivers Edge
Apartments
83.8
80.9 The Newbry
Office
283.1
293.8 Nevada: Fernley Distribution Facility
Industrial
7.3
7.0 New Jersey: Konica Photo Imaging Headquarters
Industrial
18.8
18.7 Marketfair
Retail
69.7
68.1 Plainsboro Plaza
Retail
25.3
25.5 South River Road Industrial
Industrial
46.5
45.9 New York: 425 Park Avenue
Ground Lease
320.0
320.0 780 Third Avenue
Office
341.0
340.2 The Colorado
Apartments
151.0
(1)
150.6
(1) The Corner
Apartments
217.0
(1)
215.0
(1) Pennsylvania: Lincoln Woods
Apartments
32.0
30.9 The Pepper Building
Apartments
53.1
53.6 Tennessee: Airways Distribution Center
Industrial
18.4
12.2 Summit Distribution Center
Industrial
15.7
15.4 Texas: Dallas Industrial Portfolio
Industrial
161.2
159.9 Four Oaks Place
Office
486.4
447.5 Houston Apartment Portfolio
Apartments
212.7
(1)
206.7
(1) Lincoln Centre
Office
226.1
(1)
213.3
(1) Pinnacle Industrial Portfolio
Industrial
40.9
41.2 South Frisco Village
Retail
29.0
(1)
29.0
(1) The Caruth
Apartments
72.7
(1)
70.6
(1) The Maroneal
Apartments
43.2
43.1 24
CONSOLIDATED STATEMENTS OF INVESTMENTS
March 31, 2012 and December 31, 2011
(Dollar values shown in millions)
TIAA REAL ESTATE ACCOUNT
Location/Description
Type
Fair Value
2012
2011
(Unaudited) United Kingdom: 1 & 7 Westferry Circus
Office
$
263.2
(1)
$
261.6
(1) Virginia: 8270 Greensboro Drive
Office
33.8
34.2 Ashford Meadows Apartments
Apartments
102.0
(1)
101.3
(1) The Ellipse at Ballston
Office
80.8
82.9 The Palatine
Apartments
138.0
(1)
135.0
(1) Washington: Creeksides at Centerpoint
Office
17.5
17.5 Fourth and Madison
Office
388.4
(1)
385.4
(1) Millennium Corporate Park
Office
131.4
127.9 Northwest RA Industrial Portfolio
Industrial
23.5
22.4 Rainier Corporate Park
Industrial
78.5
75.4 Regal Logistics Campus
Industrial
62.5
61.4 Washington DC: 1001 Pennsylvania Avenue
Office
657.3
(1)
656.1
(1) 1401 H Street, NW
Office
206.7
(1)
205.9
(1) 1900 K Street, NW
Office
249.0
244.4 Mazza Gallerie
Retail
69.2
69.1 TOTAL REAL ESTATE PROPERTIES
$
10,140.8
$
9,857.6 25
CONSOLIDATED STATEMENTS OF INVESTMENTS
March 31, 2012 and December 31, 2011
(Dollar values shown in millions)
(Cost $10,421.2 and $10,358.3)
TIAA REAL ESTATE ACCOUNT OTHER REAL ESTATE-RELATED INVESTMENTS—12.44% and 12.26%
Location/Description
Fair Value
2012
2011
(Unaudited) California: CA—Colorado Center LP Yahoo Center (50% Account Interest)
$
204.3
(2)
$
199.8
(2) CA—Treat Towers LP Treat Towers (75% Account Interest)
83.5
77.8 Florida: Florida Mall Associates, Ltd The Florida Mall (50% Account Interest)
318.1
(2)
284.3
(2) TREA Florida Retail, LLC Florida Retail Portfolio (80% Account Interest)
172.3
173.7 West Dade Associates Miami International Mall (50% Account Interest)
122.1
(2)
109.8
(2) Georgia: GA—Buckhead LLC Prominence in Buckhead (75% Account Interest)
56.1
50.9 Maryland: WP Project Developer The Shops at Wisconsin Place (33.33% Account interest)
18.5
— Massachusetts: MA—One Boston Place REIT One Boston Place (50.25% Account Interest)
203.6
195.9 Tennessee: West Town Mall, LLC West Town Mall (50% Account Interest)
56.6
(2)
54.7
(2) Various: DDR TC LLC DDR Joint Venture (85% Account Interest)
359.4
(2,3)
338.4
(2,3) Storage Portfolio I, LLC Storage Portfolio (75% Account Interest)
63.8
(2,3)
60.6
(2,3) Strategic Ind Portfolio I, LLC IDI Nationwide Industrial Portfolio (60% Account Interest)
47.1
(2,3)
45.5
(2,3) TOTAL REAL ESTATE JOINT VENTURES (Cost $1,935.2 and $1,895.8)
$
1,705.4
$
1,591.4 LIMITED PARTNERSHIPS—1.96% and 1.99% Cobalt Industrial REIT (11.00% Account Interest)
$
25.6
$
25.7 Colony Realty Partners LP (5.27% Account Interest)
21.1
20.9 Heitman Value Partners Fund (8.43% Account Interest)
17.1
16.7 Lion Gables Apartment Fund (18.46% Account Interest)
231.5
225.4 MONY/Transwestern Mezz RP II (16.67% Account Interest)
2.7
2.8 Transwestern Mezz Realty Partners III, LLC (11.71% Account Interest)
20.3
16.0 TOTAL LIMITED PARTNERSHIPS (Cost $301.2 and $297.5)
$
318.3
$
307.5 TOTAL REAL ESTATE JOINT VENTURES AND LIMITED PARTNERSHIPS (Cost $2,236.4 and $2,193.3)
$
2,023.7
$
1,898.9 26
CONSOLIDATED STATEMENTS OF INVESTMENTS
March 31, 2012 and December 31, 2011
(Dollar values shown in millions)
REAL ESTATE JOINT VENTURES—10.48% and 10.27%
TIAA REAL ESTATE ACCOUNT MARKETABLE SECURITIES—25.27% and 24.09%
Shares Issuer
Fair Value
2012
2011
2012
2011
(Unaudited)
97,662
92,462 Acadia Realty Trust
$
2.2
$
1.9
27,600
25,960 Agree Realty Corporation
0.6
0.6
4,233
3,783 Alexander’s, Inc.
1.7
1.4
141,747
133,337 Alexandria Real Estate Equities, Inc.
10.4
9.2
90,023
88,603 American Assets Trust Inc
2.1
1.8
168,519
155,209 American Campus Communities, Inc.
7.5
6.5
898,646
— American Tower Corp
56.6
—
277,943
264,043 Apartment Investment and Management Company
7.3
6.0
154,943
149,993 Ashford Hospitality Trust, Inc.
1.4
1.2
97,065
92,295 Associated Estates Realty Corporation
1.6
1.5
217,120
204,720 Avalonbay Communities, Inc.
30.7
26.7
350,447
307,597 BioMed Realty Trust, Inc.
6.7
5.6
337,084
315,964 Boston Properties, Inc.
35.4
31.5
306,209
294,369 Brandywine Realty Trust
3.5
2.8
171,248
164,258 BRE Properties, Inc.
8.7
8.3
178,302
154,216 Camden Property Trust
11.7
9.6
70,338
66,398 Campus Crest Communities, Inc.
0.8
0.7
168,759
150,899 CapLease, Inc.
0.7
0.6
337,647
320,397 CBL & Associates Properties, Inc.
6.4
5.0
169,065
152,815 Cedar Shopping Centers, Inc.
0.9
0.7
39,517
39,517 Chatham Lodging Trust
0.5
0.4
78,912
74,212 Chesapeake Lodging Trust
1.4
1.1
128,127
116,477 Cogdell Spencer Inc.
0.5
0.5
198,824
188,864 Colonial Properties Trust
4.3
3.9
51,883
48,303 CoreSite Realty Corporation
1.2
0.9
164,743
157,193 Corporate Office Properties Trust
3.8
3.3
237,666
239,606 Cousins Properties Incorporated
1.8
1.5
279,600
256,060 Cubesmart
3.3
2.7
558,910
533,880 DCT Industrial Trust Inc.
3.3
2.7
629,768
597,828 Developers Diversified Realty Corporation
9.2
7.3
380,907
367,697 DiamondRock Hospitality Company
3.9
3.5
239,172
228,152 Digital Realty Trust, Inc.
17.7
15.2
238,244
205,213 Douglas Emmett, Inc.
5.4
3.7
572,816
542,036 Duke Realty Corporation
8.2
6.5
142,216
134,746 DuPont Fabros Technology, Inc.
3.5
3.3
61,539
59,989 EastGroup Properties, Inc.
3.1
2.6
209,731
158,681 Education Realty Trust, Inc.
2.3
1.6
106,652
103,012 Entertainment Properties Trust
4.9
4.5
93,568
87,088 Equity Lifestyle Properties, Inc.
6.5
5.8
131,686
127,616 Equity One, Inc.
2.7
2.2
665,560
633,670 Equity Residential
41.7
36.1
77,609
72,619 Essex Property Trust, Inc.
11.8
10.2
69,405
65,065 Excel Trust, Inc.
0.8
0.8
213,722
207,842 Extra Space Storage Inc.
6.2
5.0
145,696
137,296 Federal Realty Investment Trust
14.1
12.5 27
CONSOLIDATED STATEMENTS OF INVESTMENTS
March 31, 2012 and December 31, 2011
(Dollar values shown in millions)
REAL ESTATE-RELATED MARKETABLE SECURITIES—6.99% and 5.99%
TIAA REAL ESTATE ACCOUNT
Shares Issuer
Fair Value
2012
2011
2012
2011
(Unaudited)
300,635
271,895 FelCor Lodging Trust Incorporated
1.1
0.8
197,563
191,213 First Industrial Realty Trust, Inc.
2.4
2.0
121,111
110,661 First Potomac Realty Trust
1.5
1.4
190,039
181,429 Franklin Street Properties Corp.
2.0
1.8
1,069,540
1,012,300 General Growth Properties, Inc.
18.2
15.2
62,058
56,458 Getty Realty Corp.
1.0
0.8
22,340
20,610 Gladstone Commercial Corporation
0.4
0.4
245,132
220,762 Glimcher Realty Trust
2.5
2.0
80,937
78,067 Government Properties Income Trust
2.0
1.8
926,466
874,526 HCP, Inc.
36.6
36.2
482,474
415,456 Health Care REIT, Inc.
26.5
22.7
178,672
160,772 Healthcare Realty Trust Incorporated
3.9
3.0
386,183
372,823 Hersha Hospitality Trust
2.1
1.8
166,259
155,319 Highwoods Properties, Inc.
5.5
4.6
110,940
103,500 Home Properties, Inc.
6.8
6.0
283,000
265,630 Hospitality Properties Trust
7.5
6.1
1,609,336
1,524,796 Host Hotels & Resorts, Inc.
26.4
22.5
192,028
180,198 HRPT Properties Trust
3.6
3.0
57,702
59,902 Hudson Pacific Properties, Inc.
0.9
0.8
213,739
198,739 Inland Real Estate Corporation
1.9
1.5
191,391
176,691 Investors Real Estate Trust
1.5
1.3
1,500,000
1,500,000 iShares Dow Jones US Real Estate Index Fund
93.4
85.2
153,243
129,963 Kilroy Realty Corporation
7.1
4.9
924,994
879,374 Kimco Realty Corporation
17.8
14.3
163,943
146,123 Kite Realty Group Trust
0.9
0.7
191,112
181,102 LaSalle Hotel Properties
5.4
4.4
352,045
345,585 Lexington Realty Trust
3.2
2.6
265,410
251,650 Liberty Property Trust
9.5
7.8
69,566
68,836 LTC Properties, Inc.
2.2
2.1
199,553
189,553 Mack-Cali Realty Corporation
5.8
5.1
136,649
114,299 Maguire Properties, Inc.
0.3
0.2
307,677
247,227 Medical Properties Trust, Inc.
2.9
2.4
86,884
81,264 Mid-America Apartment Communities, Inc.
5.8
5.1
40,374
36,864 Mission West Properties, Inc.
0.4
0.3
92,427
81,077 Monmouth Real Estate Investment Corporation
0.9
0.7
63,614
63,644 National Health Investors, Inc.
3.1
2.8
239,920
216,060 National Retail Properties, Inc.
6.5
5.7
236,603
226,273 Omega Healthcare Investors, Inc.
5.0
4.4
40,857
38,237 One Liberty Properties, Inc.
0.7
0.6
58,019
52,329 Parkway Properties, Inc.
0.6
0.5
116,687
113,497 Pebblebrook Hotel Trust
2.6
2.2
133,015
122,245 Pennsylvania Real Estate Investment Trust
2.0
1.3
395,852
379,392 Piedmont Office Realty Trust, Inc.
7.0
6.5
370,797
351,127 Plum Creek Timber Company, Inc.
15.4
12.8
119,283
106,883 Post Properties, Inc.
5.6
4.7
91,958
88,608 Potlatch Corporation
2.9
2.8
1,047,121
990,211 ProLogis
37.7
28.3
41,470
41,980 PS Business Parks, Inc.
2.7
2.3 28
CONSOLIDATED STATEMENTS OF INVESTMENTS
March 31, 2012 and December 31, 2011
(Dollar values shown in millions)
TIAA REAL ESTATE ACCOUNT
Shares Issuer
Fair Value
2012
2011
2012
2011
(Unaudited)
289,014
275,476 Public Storage, Inc.
39.9
37.0
94,870
87,600 Ramco-Gershenson Properties Trust
1.2
0.9
275,689
261,199 Rayonier Inc.
12.2
11.7
305,453
279,343 Realty Income Corporation
11.8
9.8
105,616
93,946 Retail Opportunity Investment
1.3
1.1
206,458
197,908 Regency Centers Corporation
9.2
7.4
236,090
177,170 RLJ Lodging Trust
4.4
3.0
42,493
— Rouse Properties Inc
0.6
—
33,066
33,036 Saul Centers, Inc.
1.3
1.2
373,417
330,697 Senior Housing Properties Trust
8.2
7.4
674,986
632,140 Simon Property Group, Inc.
98.3
81.6
194,749
183,739 SL Green Realty Corp.
15.1
12.3
63,879
61,829 Sovran Self Storage, Inc.
3.2
2.6
26,290
20,050 Stag Industrial Inc
0.4
0.2
423,259
385,489 Strategic Hotels & Resorts, Inc.
2.8
2.1
67,588
59,168 Summit Hotel Properties Inc
0.5
0.6
60,576
46,326 Sun Communities, Inc.
2.6
1.7
76,623
60,363 Sun Healthcare Group, Inc.
1.3
0.7
268,726
262,606 Sunstone Hotel Investors, L.L.C.
2.6
2.1
197,304
178,864 Tanger Factory Outlet Centers, Inc.
5.9
5.2
133,019
126,129 Taubman Centers, Inc.
9.7
7.8
18,214
16,174 Terreno Realty Corporation
0.3
0.2
301,022
286,812 The Macerich Company
17.4
14.5
503,011
472,751 UDR, Inc.
13.4
11.9
24,104
21,414 UMH Properties, Inc.
0.3
0.2
30,888
27,258 Universal Health Realty Income Trust
1.2
1.1
54,363
50,503 Urstadt Biddle Properties Inc.
1.1
0.9
651,224
619,340 Ventas, Inc.
37.2
34.1
420,993
396,923 Vornado Realty Trust
35.4
30.5
151,257
145,677 Washington Real Estate Investment Trust
4.5
4.0
277,400
262,970 Weingarten Realty Investors
7.3
5.8
1,221,148
1,164,958 Weyerhaeuser Company
26.8
21.8
2,910
— Whitestone REIT B
0.0
—
56,457
53,117 Winthrop Realty Trust
0.6
0.7 TOTAL REAL ESTATE EQUITY SECURITIES
$
1,138.7
$
927.9 29
CONSOLIDATED STATEMENTS OF INVESTMENTS
March 31, 2012 and December 31, 2011
(Dollar values shown in millions)
(Cost $1,013.4 and $895.3)
TIAA REAL ESTATE ACCOUNT OTHER MARKETABLE SECURITIES—18.28% and 18.10%
Principal Issuer
Yield(4)
Maturity
Fair Value
2012
2011
2012
2011
(Unaudited)
—
36.9 Fannie Mae Discount Notes
0.051%
1/3/12
$
—
$
36.9
—
4.5 Fannie Mae Discount Notes
0.030%
1/4/12
—
4.5
—
40.0 Fannie Mae Discount Notes
0.035%
1/25/12
—
40.0
—
41.3 Fannie Mae Discount Notes
0.025%-0.051%
2/8/12
—
41.3
—
18.1 Fannie Mae Discount Notes
0.030%
2/13/12
—
18.1
—
25.3 Fannie Mae Discount Notes
0.015%
3/8/12
—
25.3
12.0
12.0 Fannie Mae Discount Notes
0.061%
5/2/12
12.0
12.0
50.0
50.0 Fannie Mae Discount Notes
0.152%
5/3/12
50.0
50.0
56.2
56.2 Fannie Mae Discount Notes
0.061%-0.066%
5/21/12
56.2
56.2
48.6
48.6 Fannie Mae Discount Notes
0.071%
5/30/12
48.6
48.6
24.2
24.2 Fannie Mae Discount Notes
0.066%
6/6/12
24.2
24.2
30.2
30.2 Fannie Mae Discount Notes
0.137%-0.142%
7/16/12
30.2
30.2
16.3
— Fannie Mae Discount Notes
0.147%
8/8/12
16.3
—
25.0
— Fannie Mae Discount Notes
0.107%
10/1/12
25.0
—
—
17.0 Federal Farm Credit Bank Discount Notes
0.010%
1/3/12
—
17.0
—
38.0 Federal Home Loan Bank Discount Notes
0.020%
1/6/12
—
38.0
—
20.0 Federal Home Loan Bank Discount Notes
0.010%-0.154%
1/13/12
—
20.0
—
50.0 Federal Home Loan Bank Discount Notes
0.046%
1/13/12
—
50.0
—
48.0 Federal Home Loan Bank Discount Notes
0.051%
1/18/12
—
48.0
—
25.2 Federal Home Loan Bank Discount Notes
0.015%-0.030%
1/20/12
—
25.2
—
13.3 Federal Home Loan Bank Discount Notes
0.011%
1/27/12
—
13.3
—
50.0 Federal Home Loan Bank Discount Notes
0.035%
2/1/12
—
50.0
—
42.2 Federal Home Loan Bank Discount Notes
0.035%
2/3/12
—
42.2
—
70.1 Federal Home Loan Bank Discount Notes
0.025%-0.030%
2/10/12
—
70.1
—
19.4 Federal Home Loan Bank Discount Notes
0.025%
2/13/12
—
19.4
—
60.0 Federal Home Loan Bank Discount Notes
0.030%-0.071%
2/17/12
—
60.0
—
7.2 Federal Home Loan Bank Discount Notes
0.071%
2/24/12
—
7.2
—
16.1 Federal Home Loan Bank Discount Notes
0.112%
3/7/12
—
16.1
—
34.4 Federal Home Loan Bank Discount Notes
0.025%
3/21/12
—
34.4
—
19.2 Federal Home Loan Bank Discount Notes
0.071%
3/28/12
—
19.2
45.7
45.7 Federal Home Loan Bank Discount Notes
0.091%
4/4/12
45.7
45.7
12.9
— Federal Home Loan Bank Discount Notes
0.066%
4/18/12
12.9
—
61.5
— Federal Home Loan Bank Discount Notes
0.086%-0.132%
5/4/12
61.5
—
38.5
21.0 Federal Home Loan Bank Discount Notes
0.076%-0.081%
5/9/12
38.5
21.0
42.3
— Federal Home Loan Bank Discount Notes
0.101%-0.112%
5/11/12
42.3
—
47.6
47.6 Federal Home Loan Bank Discount Notes
0.056%-0.081%
5/18/12
47.6
47.6
50.0
50.0 Federal Home Loan Bank Discount Notes
0.081%
5/23/12
50.0
50.0
10.0
— Federal Home Loan Bank Discount Notes
0.091%
5/25/12
10.0
—
34.1
— Federal Home Loan Bank Discount Notes
0.066%-0.101%
6/6/12
34.1
—
30.0
— Federal Home Loan Bank Discount Notes
0.081%
6/22/12
30.0
—
9.0
9.0 Federal Home Loan Bank Discount Notes
0.101%
7/11/12
9.0
9.0
—
50.0 Freddie Mac Discount Notes
0.041%
1/9/12
—
50.0
—
37.0 Freddie Mac Discount Notes
0.046%
1/17/12
—
37.0
—
29.5 Freddie Mac Discount Notes
0.035%
1/30/12
—
29.5
—
20.0 Freddie Mac Discount Notes
0.051%
2/14/12
—
20.0
—
42.9 Freddie Mac Discount Notes
0.061%-0.101%
2/21/12
—
42.9 30
CONSOLIDATED STATEMENTS OF INVESTMENTS
March 31, 2012 and December 31, 2011
(Dollar values shown in millions)
GOVERNMENT AGENCY NOTES—6.95% and 10.02%
Date
TIAA REAL ESTATE ACCOUNT
Principal Issuer
Yield(4)
Maturity
Fair Value
2012
2011
2012
2011
(Unaudited)
—
27.3 Freddie Mac Discount Notes
0.020%
3/5/12
—
27.3
—
9.5 Freddie Mac Discount Notes
0.035%
3/9/12
—
9.5
—
17.5 Freddie Mac Discount Notes
0.035%
3/13/12
—
17.5
—
25.5 Freddie Mac Discount Notes
0.081%-0.091%
3/19/12
—
25.5
21.2
21.2 Freddie Mac Discount Notes
0.086%
4/3/12
21.2
21.2
35.2
35.2 Freddie Mac Discount Notes
0.096%
4/9/12
35.2
35.2
21.3
21.3 Freddie Mac Discount Notes
0.094%
4/10/12
21.3
21.3
20.2
20.2 Freddie Mac Discount Notes
0.066%
4/16/12
20.2
20.2
33.0
23.2 Freddie Mac Discount Notes
0.076%-0.091%
5/7/12
33.0
23.2
5.7
5.7 Freddie Mac Discount Notes
0.081%
5/14/12
5.7
5.7
22.8
13.5 Freddie Mac Discount Notes
0.081%
5/29/12
22.8
13.5
39.9
29.6 Freddie Mac Discount Notes
0.071%-0.101%
6/4/12
39.9
29.6
21.5
— Freddie Mac Discount Notes
0.091%
6/5/12
21.4
—
48.0
11.0 Freddie Mac Discount Notes
0.076%-0.112%
6/11/12
48.0
11.0
20.9
20.9 Freddie Mac Discount Notes
0.071%
6/18/12
20.9
20.8
32.4
— Freddie Mac Discount Notes
0.071%
6/25/12
32.4
—
10.0
— Freddie Mac Discount Notes
0.112%
7/10/12
10.0
—
17.0
— Freddie Mac Discount Notes
0.112%
7/16/12
17.0
—
25.0
— Freddie Mac Discount Notes
0.122%
8/1/12
25.0
—
26.4
— Freddie Mac Discount Notes
0.132%
8/6/12
26.3
—
5.9
— Freddie Mac Discount Notes
0.147%
8/7/12
5.9
—
15.9
— Freddie Mac Discount Notes
0.142%
8/22/12
15.9
—
34.8
— Freddie Mac Discount Notes
0.157%
8/27/12
34.8
—
30.0
— Freddie Mac Discount Notes
0.162%
9/10/12
30.0
— TOTAL GOVERNMENT AGENCY NOTES
$
1,131.0
$
1,551.6 31
CONSOLIDATED STATEMENTS OF INVESTMENTS
March 31, 2012 and December 31, 2011
(Dollar values shown in millions)
Date
(Cost $1,130.9 and $1,551.5)
TIAA REAL ESTATE ACCOUNT UNITED STATES TREASURY SECURITIES—11.33% and 8.08%
Principal Issuer
Yield(4)
Maturity
Fair Value
2012
2011
2012
2011
(Unaudited)
—
19.9 United States Treasury Bills
0.020%
3/1/12
$
—
$
19.9
—
3.1 United States Treasury Bills
0.030%
3/8/12
—
3.1
—
50.0 United States Treasury Bills
0.037%
3/22/12
—
50.0
—
40.3 United States Treasury Bills
0.020%-0.032%
3/29/12
—
40.3
26.5
— United States Treasury Bills
0.072%
4/12/12
26.5
—
79.4
60.8 United States Treasury Bills
0.020%-0.100%
4/19/12
79.4
60.8
14.0
— United States Treasury Bills
0.076%
4/26/12
14.0
—
34.0
20.0 United States Treasury Bills
0.041%-0.042%
5/3/12
34.0
20.0
58.0
50.0 United States Treasury Bills
0.02%-0.053%
5/10/12
58.0
50.0
82.0
82.0 United States Treasury Bills
0.020%-0.035%
5/17/12
82.0
82.0
89.2
23.4 United States Treasury Bills
0.025%-0.084%
5/24/12
89.2
23.4
40.0
40.0 United States Treasury Bills
0.020%
5/31/12
40.0
40.0
45.7
— United States Treasury Bills
0.030%-0.089%
6/7/12
45.6
—
100.0
— United States Treasury Bills
0.047%-0.054%
6/14/12
100.0
—
64.3
— United States Treasury Bills
0.043%-0.097%
6/21/12
64.3
—
81.6
— United States Treasury Bills
0.0482%-0.104%
6/28/12
81.6
—
45.7
— United States Treasury Bills
0.072%-0.100%
7/5/12
45.6
—
28.6
— United States Treasury Bills
0.076%-0.101%
7/12/12
28.6
—
61.0
— United States Treasury Bills
0.061%-0.101%
7/19/12
61.0
—
50.0
— United States Treasury Bills
0.069%
7/26/12
50.0
—
49.5
— United States Treasury Bills
0.112%
8/2/12
49.5
—
50.0
— United States Treasury Bills
0.122%
8/9/12
50.0
—
74.0
40.0 United States Treasury Bills
0.056%-0.114%
8/23/12
74.0
40.0
5.1
— United States Treasury Bills
0.133%
9/6/12
5.1
—
80.0
80.0 United States Treasury Bills
0.087%
11/15/12
79.9
79.9
—
50.0 United States Treasury Notes
0.259%
1/15/12
—
50.0
—
11.5 United States Treasury Notes
0.024%
1/31/12
—
11.5
—
20.0 United States Treasury Notes
0.345%
2/15/12
—
20.0
—
30.6 United States Treasury Notes
0.138%
2/29/12
—
30.6
—
15.0 United States Treasury Notes
0.078%
3/15/12
—
15.0
9.9
9.9 United States Treasury Notes
0.020%-0.264%
3/31/12
9.9
10.0
50.0
50.0 United States Treasury Notes
0.095%
4/30/12
50.0
50.2
47.5
47.5 United States Treasury Notes
0.108%
5/15/12
47.6
47.6
19.7
100.0 United States Treasury Notes
0.030%-0.119%
5/31/12
19.6
100.3
68.0
68.0 United States Treasury Notes
0.103%-0.107%
6/15/12
68.2
68.5
80.7
80.7 United States Treasury Notes
0.114%-0.127%
7/31/12
80.9
81.0
47.7
47.7 United States Treasury Notes
0.131%-0.176%
8/15/12
48.0
48.2
46.6
46.6 United States Treasury Notes
0.095%-0.145%
8/31/12
46.6
46.6
50.0
50.0 United States Treasury Notes
0.086%
10/15/12
50.3
50.5
111.5
61.5 United States Treasury Notes
0.132%-0.165%
10/31/12
111.6
61.6 32
CONSOLIDATED STATEMENTS OF INVESTMENTS
March 31, 2012 and December 31, 2011
(Dollar values shown in millions)
Date
TIAA REAL ESTATE ACCOUNT
Principal Issuer
Yield(4)
Maturity
Fair Value
2012
2011
2012
2011
(Unaudited)
64.3
50.0 United States Treasury Notes
0.149%-0.152%
11/30/12
64.5
50.2
69.5
— United States Treasury Notes
0.181%-0.188%
12/15/12
69.9
—
20.0
— United States Treasury Notes
0.209%
12/31/12
20.1
— TOTAL UNITED STATES TREASURY SECURITIES
$
1,845.5
$
1,251.2 TOTAL OTHER MARKETABLE SECURITIES
$
2,976.5
$
2,802.8 TOTAL MARKETABLE SECURITIES
$
4,115.2
$
3,730.7 TOTAL INVESTMENTS
$
16,279.7
$
15,487.2
(1)
The investment has a mortgage loan payable outstanding, as indicated in Note 8. (2) The market value reflects the Account’s interest in the joint venture and is net of debt. (3) Properties within this investment are located throughout the United States. (4) Yield represents the annualized yield at the date of purchase. 33
CONSOLIDATED STATEMENTS OF INVESTMENTS
March 31, 2012 and December 31, 2011
(Dollar values shown in millions)
Date
(Cost $1,845.6 and $1,251.1)
(Cost $2,976.5 and $2,802.6)
(Cost $3,989.9 and $3,697.9)
(Cost $16,647.5 and $16,249.5)
ITEM 2. MANAGEMENT’S DISCUSSION AND ANALYSIS OF FINANCIAL CONDITION AND RESULTS OF OPERATIONS The following discussion and analysis of our financial condition and results of operations should be read together with our consolidated financial statements and notes contained in this report and with consideration to the sub-section entitled “Forward-Looking Statements,” which begins below, and the section of the
Account’s Annual Report on Form 10-K for the year ended December 31, 2011 (the “Form 10-K”) entitled “Item 1A. Risk Factors.” The past performance of the Account is not indicative of future results. Forward-Looking Statements Some statements in this Form 10-Q which are not historical facts may be “forward-looking statements” within the meaning of Section 27A of the Securities Act of 1933, Section 21E of the Securities Exchange Act of 1934 and the Private Securities Litigation Reform Act of 1995. Forward-looking statements include
statements about management’s expectations, beliefs, intentions or strategies for the future, include the assumptions and beliefs underlying these forward-looking statements, and are based on current expectations, estimates and projections about the real estate industry, domestic and global economic conditions, including
conditions in the credit and capital markets, the sectors, and markets in which the Account invests and operates, and the transactions described in this Form 10-Q. While management believes the assumptions underlying any of its forward-looking statements and information to be reasonable, such information may be
subject to uncertainties and may involve certain risks which may be difficult to predict and are beyond management’s control. These risks and uncertainties could cause actual results to differ materially from those contained in any forward-looking statement. These risks and uncertainties include, but are not limited to, the
following:
•
Acquiring and Owning Real Estate: The risks associated with acquiring and owning real property, including general economic and real estate market conditions, the availability of, and economic cost associated with, financing the Account’s properties, the risk that the Account’s properties become too concentrated
(whether by geography, sector or by tenant mix), competition for acquiring real estate properties, leasing risk (including tenant defaults) and the risk of uninsured losses at properties (including due to terrorism and acts of violence); • Selling Real Estate: The risk that the sales price of a property might differ, perhaps significantly, from its estimated or appraised value, leading to losses or reduced profits to the Account, the risk that the Account might not be able to sell a property at a particular time for a price which management believes
represents its fair or full value, the risk of a lack of availability of financing (for potential purchasers of the Account’s properties), risks associated with disruptions in the credit and capital markets, and the risk that the Account may be required to make significant expenditures before the Account is able to market
and/or sell a property; • Valuation: The risks associated with property valuations, including the fact that appraisals can be subjective in a number of respects, the fact that the Account’s appraisals are generally obtained on a quarterly basis and there may be periods in between appraisals of a property during which the value attributed to
the property for purposes of the Account’s daily accumulation unit value may be more or less than the actual realizable value of the property; • Borrowing: Risks associated with financing the Account’s properties, including the risk of default on loans secured by the Account’s properties (which could lead to foreclosure), the risk associated with high loan to value ratios on the Account’s properties (including the fact that the Account may have limited, or no
net value in such a property), the risk that significant sums of cash could be required to make principal and interest payments on the loans and the risk that the Account may not have the ability to obtain financing or refinancing on favorable terms (or at all), which may be aggravated by general disruptions in
credit and capital markets; • Participant Transactions and Cash Management: Investment risk associated with participant transactions, in particular that (i) significant net participant transfers out of the Account may impair our ability to pursue or consummate new investment opportunities that are otherwise attractive to the Account and/or
may result in sales of real estate-related assets to generate liquidity, (ii) significant net participant transfers into the Account may result, on a temporary basis, in our cash holdings and/or holdings in liquid real estate-related investments exceeding our long-term targeted holding levels and 34
(iii) high levels of cash in the Account during times of appreciating real estate values can impair the Account’s overall return; • Joint Venture Investments: The risks associated with joint venture partnerships, including the risk that a co-venturer may have interests or goals inconsistent with that of the Account, that a co-venturer may have financial difficulties, and the risk that the Account may have limited rights with respect to operation of
the property and transfer of the Account’s interest; • Regulatory Matters: Uncertainties associated with environmental liability and regulations and other governmental regulatory matters such as zoning laws, rent control laws, and property taxes; • Foreign Investments: The risks associated with purchasing, owning and disposing foreign investments (primarily real estate properties), including political risk, the risk associated with currency fluctuations, regulatory and taxation risks and risks of enforcing judgments; • Conflicts of Interests: Conflicts of interest associated with TIAA serving as investment manager of the Account and provider of the liquidity guarantee at the same time as TIAA and its affiliates are serving as an investment manager to other real estate accounts or funds, including conflicts associated with satisfying
its fiduciary duties to all such accounts and funds associated with purchasing, selling and leasing of properties; • Required Property Sales: The risk that, if TIAA were to own too large a percentage of the Account’s accumulation units through funding the liquidity guarantee (as determined by the independent fiduciary), the independent fiduciary could require the sales of properties to reduce TIAA’s ownership interest, which
sales could occur at times and at prices that depress the sale proceeds to the Account; • Government and Government Agency Securities: Risks associated with investment securities issued by U.S. government agencies and U.S. government-sponsored entities, including the risk that the issuer may not have their securities backed by the full faith and credit of the U.S. government, and that transaction
activity may fluctuate significantly from time to time, which could negatively impact the value of the securities and the Account’s ability to dispose of a security at a favorable time; and • Liquid Assets and Securities: Risks associated with investments in real estate-related liquid assets (which could include, from time to time, REIT securities and CMBS), and non-real estate-related liquid assets, including:
•
Financial/credit risk—Risks that the issuer will not be able to pay principal and interest when due or that the issuer’s earnings will fall; • Market volatility risk—Risk that the changing conditions in financial markets may cause the Account’s investments to experience price volatility; • Interest rate volatility risk—Risk that interest rate volatility may affect the Account’s current income from an investment; and • Deposit/money market risk—Risk that the Account could experience losses if banks fail. More detailed discussions of certain of these risk factors are contained in the section of the Form 10-Q entitled “Item 1A. Risk Factors” in the section below and also in the section entitled “Quantitative and Qualitative Disclosures About Market Risk,” below that could cause actual results to differ materially from
historical experience or management’s present expectations. Caution should be taken not to place undue reliance on management’s forward-looking statements, which represent management’s views only as of the date that this report is filed. Neither management nor the Account undertake any obligation to update publicly or revise any forward-looking statement, whether as a
result of new information, changed assumptions, future events or otherwise. Commercial real estate market statistics discussed in this section are obtained by the Account from sources that management considers reliable, but some of the data are preliminary for the period ended March 31, 2012 and may be subsequently revised. Prior period data may have been adjusted to reflect updated
calculations. Investors should not rely exclusively on the data presented below in forming a judgment regarding the current or prospective performance of the commercial real estate market generally. 35
ABOUT THE TIAA REAL ESTATE ACCOUNT The TIAA Real Estate Account was established in February 1995 as a separate account of TIAA and interests in the Account were first offered to eligible participants on October 2, 1995. The Account offers individual and group accumulating annuity contracts (with contributions made on a pre-tax or after-tax
basis), as well as individual lifetime and term-certain variable payout annuity contracts (including the payment of death benefits to beneficiaries). Investors are entitled to transfer funds to or from the Account under certain circumstances. Funds invested in the Account for each category of contract are expressed in
terms of units, and unit values will fluctuate depending on the Account’s performance. Investment Objective and Strategy The Account seeks favorable long-term returns primarily through rental income and appreciation of real estate investments owned by the Account. The Account will also invest in non-real estate-related publicly traded securities and short-term higher quality liquid investments that are easily converted to cash
to enable the Account to meet participant redemption requests, purchase or improve properties or cover other expense needs. Real Estate-Related Investments. The Account intends to have between 75% and 85% of its net assets invested directly in real estate or real estate-related investments with the goal of producing favorable long-term returns primarily through rental income and appreciation. These investments may consist of:
•
Direct ownership interests in real estate, • Direct ownership of real estate through interests in joint ventures, • Indirect interests in real estate through real estate-related securities, such as:
•
real estate limited partnerships, • real estate investment trusts (“REITs”), which investments may consist of common or preferred stock interests, • investments in equity or debt securities of companies whose operations involve real estate (i.e., that primarily own or manage real estate) which may not be REITs, and • conventional mortgage loans, participating mortgage loans, and collateralized mortgage obligations, including commercial mortgage-backed securities (“CMBS”) and other similar investments. The Account’s principal strategy is to purchase direct ownership interests in income-producing real estate, primarily office, industrial, retail and multi-family residential properties. The Account is targeted to hold between 65% and 80% of the Account’s net assets in such direct ownership interests at any time.
Historically, over 70% of the Account’s net assets have been comprised of such direct ownership interests in real estate. In addition, while the Account is authorized to hold up to 25% of its net assets in liquid real estate-related securities, such as REITs and CMBS, management intends that the Account will not hold more than 10% of its net assets in such securities on a long-term basis. Historically, less than 10% of the
Account’s net assets have been comprised of interests in these securities. In particular, under the Account’s current investment guidelines, the Account is authorized to hold up to 10% of its net assets in CMBS. Non-Real Estate-Related Investments. The Account will invest the remaining portion of its assets (targeted to be between 15% and 25% of its net assets) in publicly-traded, liquid investments; namely:
•
U.S. treasury securities, • securities issued by U.S. government agencies or U.S. government sponsored entities, • corporate debt securities, • money market instruments, and • stock of companies that do not primarily own or manage real estate. 36
However, from time to time (and most recently between late 2008 and mid 2010), the Account’s non-real estate-related liquid investments may comprise less than 15% (and possibly less than 10%) of its assets (on a net basis and/or a gross basis), especially during and immediately following periods of significant
net participant outflows, in particular due to significant participant transfer activity. In addition, the Account, from time to time and on a temporary basis, may hold in excess of 25% of its net assets in non-real estate-related liquid investments, particularly during times of significant inflows into the Account and/or
when there is a lack of attractive real estate-related investments available in the market. Liquid Securities. Primarily due to management’s need to manage fluctuations in cash flows, in particular during and immediately following periods of significant participant net transfer activity into or out of the Account, the Account may, on a temporary basis (i) exceed the upper end of its targeted holdings
(currently 15% of the Account’s net assets) in liquid securities of all types, including both publicly-traded non-real estate-related liquid investments and liquid real estate-related securities, such as REITs and CMBS, or (ii) be below the low end of its targeted holdings in such liquid securities (currently 15% of the
Account’s net assets).
•
The portion of the Account’s net assets invested in liquid investments of all types may exceed the upper end of its target, for example, if (i) the Account receives a large inflow of money in a short period of time, in particular due to significant participant transfer activity into the Account, (ii) the Account
receives significant proceeds from sales of direct real estate assets, (iii) there is a lack of attractive direct real estate investments available on the market, and/or (iv) the Account anticipates more near-term cash needs, including to apply to acquire direct real estate investments, pay expenses or repay
indebtedness.
Foreign Investments. The Account from time to time will also make foreign real estate investments. Under the Account’s investment guidelines, investments in direct foreign real estate, together with foreign real estate-related securities and foreign non-real estate-related liquid investments, may not comprise
more than 25% of the Account’s net assets. However, through the date of this Form 10-Q, such foreign real estate-related investments have never represented more than 7.5% of the Account’s net assets and management does not intend such foreign investments to exceed 10% of the Account’s net assets. FIRST QUARTER 2012 U.S. ECONOMIC AND COMMERCIAL REAL ESTATE OVERVIEW The Account invests primarily in high-quality, core commercial real estate in order to meet its investment objective of obtaining favorable long-term returns through rental income and the appreciation of its real estate holdings. The Account does not directly invest in single-family residential real estate, nor
does it currently invest in residential mortgage-backed securities, although it may invest in such securities in the future. Economic and Capital Markets Overview and Outlook The recovery of the U.S. economy continued at a moderate pace during the first quarter of 2012. The Bureau of Economic Analysis’s initial estimate of Gross Domestic Product (“GDP”) in the first quarter of 2012 was a gain of 2.2%, as compared with an increase of 3.0% in the fourth quarter of 2011. The
more moderate growth during the first quarter of 2012 came despite an unusually warm and dry winter which economists believe boosted consumer spending. Consumer spending grew at a 2.9% rate, the fastest pace since the fourth quarter of 2010, due in large part to increased spending on automobiles. While
some of the growth in consumer spending was probably “borrowed” from the second quarter, the report indicated that the U.S. economy was continuing to expand at a steady pace Economists remain optimistic about prospects for the U.S. economy in 2012, with many expecting growth to strengthen in the second half of the year. Forecasters are encouraged by factors such as strengthening consumer spending, stronger employment growth, and modest improvement in residential
construction and home sales. Yet many express concern that rising gas prices, potential recessions in Eurozone economies, and U.S. budget cuts could individually or collectively weaken growth in the future. In an April 11, 2012 speech at the Money Marketeers of New York University, Federal Reserve Vice Chair
Janet Yellen noted the recent encouraging signs of improvement in the labor market but observed “substantial headwinds continue to restrain the recovery.” These include the weak housing market, U.S. fiscal policy, and the sluggish pace of economic growth abroad, which led her to believe “the U.S. economy will
continue to recover only gradually and that labor market slack will remain substantial for a number of years 37
to come.” Similarly, the minutes from the March 13, 2012 Federal Open Market Committee (“FOMC”) meeting reported that the FOMC staff revised upward its near-term forecast for GDP growth due to better than expected improvement in labor market conditions, but the staff continued to forecast “GDP
growth would pick up only gradually in 2012 and 2013, supported by accommodative monetary policy, easing credit conditions, and improvements in consumer and business sentiment.” Nonetheless, there is clear evidence the U.S. economy is now in a stronger position than it was one year ago. Most notable is the improvement in labor market conditions. Employment grew by 635,000 in the first quarter of 2012 as compared with 492,000 in the fourth quarter of 2011. While job gains in March
2012 were below expectations, private sector payrolls grew by almost 210,000 per month in the first quarter of 2012 as compared with around 150,000 per month during most of 2011. The unemployment rate remained at around 9% for much of 2011 but began to decline in the Fall of 2011 and has dropped to 8.2%
as of March 2012. Similarly, first time claims for unemployment benefits have remained below the recessionary indicator of 400,000 through April. While there is still considerable slack in the labor market, job growth has risen to a level that is sufficient to absorb new entrants to the labor force and begin reducing
the numbers of unemployed. As the U.S. economy transitions from recovery to economic expansion, a host of domestic and global factors have hampered progress. One such domestic factor has been the housing market, which remains troubled; however, its drag on economic activity is weakening. Home sales registered modest gains
during the first quarter of 2012 compared with the first quarter of 2011 aided by favorable mortgage interest rates, modest employment growth, and the unusually warm winter. While foreclosures and short sales still account for just over one-third of all sales, non-distress sales have picked up, and prices in parts of
the country appear to be stabilizing. Residential construction, which has historically provided a boost to the economy following a recession, has picked up too, though driven in large part by a surge in apartment construction. Residential fixed investment, which has added modestly to GDP growth for four
consecutive quarters, is expected to contribute modestly to economic activity in the coming quarters as well. Corporate America has been slow to increase payrolls but is positioned to ramp up hiring in the future. Corporate profits increased 7.9% in 2011 following a 32% increase in 2010. Net cash flow, a measure of the available cash for investment and hiring, totaled $1.8 trillion in 2011, up 7% from 2010. Economists
expect corporations to eventually utilize available cash to grow their businesses through increased hiring and investing in new plants and equipment as confidence about the economic outlook improves. Available credit, the lack of which was once felt to be hampering the recovery, is also flowing again, albeit mainly to the most credit worthy companies. The nation’s banks have weathered the crisis and are now well capitalized, profitable, and starting to lend in larger quantities. The Federal Reserve’s January
2012 Senior Loan Officer Opinion Survey on Bank Lending Practices reported bank lending standards had changed little in recent months but stronger demand for loans from firms of all sizes and continued easing on pricing terms for loans. Survey respondents also expected improvement in credit quality over the
course of 2012. Political forces, namely partisan negotiations over the federal debt ceiling, helped create market uncertainty which contributed to slower growth during the second half of 2011 and these influences have the potential to cause a similar result in 2012. The upcoming presidential election could dampen business
spending, hiring, and investment activity in the second half of the year and into 2013. Monetary policy has been accommodative and is likely to remain so. In the statement released subsequent to its March 13, 2012 meeting, the FOMC observed the economy had been expanding moderately since January 2012 with a decline in the unemployment rate, and increases in household and business
spending. Nonetheless, in order to support a stronger economic recovery, the FOMC announced its intention to maintain a highly accommodative monetary policy by keeping the target range for the federal funds rate at 0 to percent. Economic conditions are expected to warrant keeping the target rate at this level
until late-2014. The FOMC will also continue “Operation Twist”, a program of buying mortgage-backed securities in order to put downward pressure on long-term interest rates and thereby make broad financial conditions more supportive of economic growth. When Operation Twist is scheduled to end in June
2012, expectations are further quantitative easing will not be necessary given stronger payroll employment growth, tame inflation, and a rising stock market. Of the economists surveyed as part of the April 1, 2012 Blue Chip Financial Forecasts publication, only 34% expected the Federal Reserve to extend
“Operation Twist” beyond June 38
2012, and only 24% expected the Federal Reserve to announce a new round of mortgage-backed securities purchases prior to year-end 2012. While domestic factors have to a large degree become of less concern, global forces have moved to the forefront. Geopolitical tensions with Iran have helped push oil prices up to $100 per barrel during the first quarter of 2012 which in turn has pushed gasoline prices close to $4.00 per gallon in most of the
country. Prices are expected to rise further in the spring and summer, which are peak driving times, and times when refiners can charge more for required special additives. Economists at Moody’s Analytics estimate each one cent increase in gas prices results in a $75 billion increase in household expenditures on
gasoline. This total is equivalent to half a percentage point of GDP. Households may offset a portion of these increased costs by dipping into savings, but increased spending on gasoline will cut into spending on household and other items. The Eurozone sovereign debt crisis has begun to affect the financial markets once again. The recent intervention and financial support provided by the European Central Bank brought several months of stability to the market but did not fundamentally solve Europe’s problems. As concerns grew in the latter
part of the first quarter, interest rates for Spanish and Italian government bonds began to rise as investors fled to safe havens. Early in the second quarter of 2012, Spanish government bond yields briefly rose above the critical 6% mark but subsequently dipped lower. As a new round of negotiations between EU
members begins, the willingness of Germany and France to provide additional financial support to the EU will be tested. To date, Germany has demanded further austerity measures be enacted in exchange for its financial support, but economists are concerned that austerity measures prevent troubled countries
from generating the growth needed to restore their economies. Europe’s troubles pose potential risks to the global economy as well as the U.S. economy by virtue of the significant financial and trade linkages. Equity markets moved higher during the first quarter of 2012 as investors were encouraged by evidence of growing strength in the U.S. economy. The Dow Jones Industrial Average added 8% in the first quarter of 2012, while the S&P 500 added 12%, but both shed over 1% early in the second quarter of 2012 as
a result of growing Eurozone concerns. The bond market also was affected by Eurozone developments, with the yield on the 10-year Treasury starting the first quarter at 1.90% but rising as high as 2.40% before finishing at 2.00% at the end of the first quarter of 2012. Reflective of investor skittishness, gold prices
rose to over $1,750 per ounce before settling at $1,650 per ounce at quarter’s end. Recent trends in key economic indicators are summarized in the table below. Evidence of the increase in economic activity is demonstrated by the trends in employment growth and GDP growth. Note that growth of private sector payrolls (not shown below) was virtually identical to total employment growth
which indicates that job cuts by state and local governments have waned. Federal government employment continued to decline, albeit at a modest pace, as the result of U.S. government debt reduction efforts. Forecasts for 2012 indicate U.S. employment is expected to grow by 2.5 million, or around 850,000 per
quarter, which would represent further improvement over 2010 and 2011 totals. Economic Indicators*
2011Q1
2011Q2
2011Q3
2011Q4
2012Q1
Actual
Forecast
2010
2011 Economy(1) Gross Domestic Product (GDP)
0.4
%
1.3
%
1.8
%
3.0
%
2.2
%
3.0
%
1.7
%
2.3
% Employment Growth (Thousands)
576
389
383
492
635
1,027
1,840
2,500 Interest Rates(2) 10 Year Treasury
3.46
%
3.21
%
2.43
%
2.05
%
2.04
%
3.21
%
2.79
%
2.30
% Federal Funds Rate
0.0-0.25
%
0.0-0.25
%
0.0-0.25
%
0.0-0.25
%
0.0-0.25
%
0.0-0.25
%
0.0-0.25
%
0.0-0.25
% Sources: BEA, BLS, Federal Reserve, Blue Chip Consensus Forecasts, and Moody’s Analytics
*
Data subject to revision (1) GDP growth rates are annual rates. (2) The Treasury rates are an average over the stated time period. The Federal Funds rates are as of the end of the stated time period. N/A indicates data not available. Other indicators of U.S. economic activity, including those summarized in the table below, highlight the improving trends in the U.S. economy. Retail sales grew steadily during the first quarter of 2012, with sales in the first quarter of 2012 up 6.3% compared with the first quarter of 2011. The housing market
showed tentative signs of improvement during the first quarter of 2012. Though sales of existing single family homes 39
2012
declined 2.5% in March 2012 compared with February 2012, sales were up 5.9% on a year-over year basis (March 2012 vs. March 2011). Moreover, year-over-year sales have increased for nine consecutive months. Similarly, sales of new single family homes declined 7.1% in March 2012 compared with February, but
were up 7.5% compared to March 2011. Broad Economic Indicators*
Full Year
January
February
March
2009
2010
2011 % Change from prior month or year Inflation (Consumer Price Index)
-0.4
%
1.6
%
3.2
%
0.2
%
0.4
%
0.3
% Retail Sales (excl. auto, parts & gas)
-2.9
%
4.2
%
5.8
%
1.1
%
0.5
%
0.7
% Total Existing Home Sales
5.6
%
-3.5
%
1.7
%
5.7
%
-0.6
%
-2.6
% New Home Sales
-22.9
%
-13.9
%
-5.3
%
-3.5
%
7.3
%
-7.1
% Single-Family Housing Starts
-28.5
%
5.9
%
-8.6
%
0.8
%
-9.0
%
-0.2
% Annual or Monthly Average Unemployment Rate
9.3
%
9.6
%
9.0
%
8.3
%
8.3
%
8.2
%
*
Data subject to revision.
Full Year inflation is the year-over-year percentage change in the unadjusted annual average. Sources: Census Bureau, Bureau of Labor Statistics, National Association of Realtors, Moody’s Analytics The April 11, 2012 Beige Book, which details economic activity across the Federal Reserve Districts (“Districts”), characterized the pace of growth as having continued at a “modest” or “moderate” rate across most Districts through late March 2012. Reports on consumer spending were positive in almost all
Districts, with many citing the unseasonably warm weather as a contributing factor. Manufacturing continued to expand and the near-term outlook was generally positive, although there was some concern over rising oil prices. Multi-family housing construction increased in many Districts, but home prices continued
to decline in several. Commercial real estate activity in Districts such as New York and San Francisco was characterized as steady or unchanged since the last report. Some increase in the demand for loans was found across most Districts, with several noting an increase in commercial real estate lending. Labor
market activity held steady or modestly increased, and there were reports of some difficulties in filling high-skilled positions. Inflation was noted to be modest, with the exception of rising fuel prices which negatively impacted transportation costs in some Districts. Overall, regional reports confirmed ongoing
economic growth. The general consensus of both public and private economists is economic activity will strengthen steadily over the course of 2012. Stronger growth is expected due to increased consumer and business spending, wider availability of credit, accommodative monetary policy, and a slow recovery of the housing
market. Downside risks remain from a variety of domestic and global factors, but barring any exogenous shocks, the economy is expected to maintain its momentum. The consensus of economists surveyed as part of the April 1 Blue Chip Financial Forecast publication was for U.S. GDP to grow at a 2.3% rate
during the second quarter of 2012, 2.5% in the third quarter, and 2.7% in the fourth quarter. Similarly, the Blue Chip consensus is for employment to grow by 209,000 per month during 2012. While GDP and employment growth of this magnitude would be moderate compared with other post-recession periods, it
would provide support for continued improvement in commercial real estate market conditions during 2012. Real Estate Market Conditions and Outlook Commercial real estate market statistics discussed in this section are obtained by the Account from sources that Management considers reliable, but some of the data are preliminary for the period ended March 31, 2012 and may subsequently be revised. Prior period numbers may have been adjusted to reflect updated
data. Except where otherwise noted, the Account’s vacancy data is calculated as a percentage of net rentable space leased, weighted by square footage, in keeping with industry standards. Investors should not rely exclusively on the data presented below in forming a judgment regarding the current or prospective
performance of the real estate market generally. Commercial real estate investment activity was modest but healthy during the first quarter of 2012, as tenants moved cautiously in the new year due to lingering concerns about the global economy and sovereign debt crisis. Similarly, commercial real estate fundamentals improved modestly, though mainly in the 40
2012
2012
2012
apartment market where healthy demand and rent growth occurred in markets across the country. Improvements in office, industrial and retail market conditions were more modest. Commercial property sales activity started slowly in the first quarter of 2012 but gained momentum as the quarter progressed. According to Real Capital Analytics, sales totaled $50 billion in the first quarter of 2012, up 40% compared with the first quarter of 2011. The office sector was the most active, followed
closely by retail and apartment. Investor interest remained concentrated on major markets such as Washington DC, New York, Boston, San Francisco and Los Angeles. The moderation in economic and sales activity was reflected in Green Street Advisors’ Commercial Property Price Index (“CPPI”). The CPPI, which reflects sales transactions and is weighted by property value, such that the larger properties have a proportionally larger impact on the index, increased 1.0% in
the first quarter of 2012 as compared with a 0.8% increase in the fourth quarter of 2011. According to Green Street Advisors, “After a robust two-year rally, property values have since taken a breather and have been drifting upwards at an uneventful inflationary-type pace for the better part of a year. Historically
low return hurdles continue to support valuations, but prices have been held in check for now.” Commercial property returns moderated but remained healthy during the first quarter of 2012. For the four quarter period ending March 31, 2012, NCREIF Property Index (NPI) returns were 13.4%, consisting of a 6.0% income return and a 7.1% capital return. By comparison, returns for the year ended
December 31, 2011 were 14.3%. Returns have now been positive across the four major property types for nine consecutive quarters. Data for the Account’s top five markets in terms of market value as of March 31, 2012 are provided below. These markets represent 42.1% of the Account’s total real estate portfolio. The Account’s top five markets were unchanged compared with the fourth quarter of 2011. Metropolitan Area
Account % Leased
# of Property
Metro Areas as a
Metro Area as a Washington-Arlington-
84.3%
8
13.0%
9.4% New York-Wayne-White Plains NY-NJ
96.7%
5
8.8%
6.4% Boston-Quincy MA
87.2%
5
7.6%
5.5% Los Angeles-Long Beach-Glendale CA
89.5%
8
6.4%
4.7% San Francisco-San Mateo-Redwood City CA
96.6%
4
6.3%
4.6%
*
Weighted by market value, which differs from the calculations provided for market comparisons to CBRE-EA data and are used here to reflect the fair market value of the Account’s monetary investments in those markets.
Office According to CB Richard Ellis Economic Advisors (“CBRE-EA”), the national office vacancy rate was 16.0% in the first quarter of 2012, which was unchanged from the fourth quarter of 2011. Despite the increase in employment growth, the improvement in office market conditions stalled as tenants exercised
caution given the still uncertain outlook. By comparison, the vacancy rate for the Account’s office portfolio averaged 12.6% as of the first quarter of 2012, the same as in the fourth quarter of 2011. As shown in the table below, the vacancy rate of properties owned by the Account in three of its top five office
markets (Boston, Seattle and Houston) remained at or below their respective market averages. The vacancy rate of the Account’s properties in its top market, Washington DC, averaged 19.2% as the result of losing a large tenant. While the Washington DC market remains competitive as a result of concerns
regarding the impact of federal government budget cuts, a new lease has been signed for approximately one-third of the space and discussions are underway with a second tenant for another third of the space. The vacancy rate of the Account’s properties is San Francisco is similarly above average, but is set to
improve upon the arrival of a large tenant that will be taking occupancy later this year. 41
Market Value
Weighted*
Investments
% of Total Real
Estate Portfolio
% of Total
Investments
Alexandria DC-VA-MD-WV
Account
Metropolitan
Sector Metropolitan Area
Total Sector
% of Total
2012Q1
2011Q4
2012Q1
2011Q4
Office National
12.6%
12.6%
16.0%
16.0%
1 Washington-Arlington-
$
1,227.5
7.5%
19.2%
19.6%
14.5%
13.4%
2 Boston-Quincy MA
$
874.7
5.4%
13.0%
10.2%
13.0%
12.9%
3 San Francisco-San Mateo-Redwood City CA
$
656.5
4.0%
12.3%
12.8%
10.4%
10.7%
4 Seattle-Bellevue-Everett WA
$
537.3
3.3%
9.9%
8.7%
14.6%
15.2%
5 Houston-Bay Town-Sugar Land TX
$
486.4
3.0%
1.7%
3.3%
14.5%
15.1%
*
Source: CBRE-EA. Market vacancy is the percentage of space vacant. The Account’s vacancy is the value-weighted percentage of unleased space.
The Account’s results for the first quarter of 2012 are largely consistent with conditions at the national level. Demand for office space is driven largely by job growth in the financial and professional and business services sectors. During the first quarter of 2012, the financial sector added 25,000 jobs after a gain
of 21,000 jobs in the fourth quarter of 2011. While the gains are modest, the financial sector is growing again after shedding 650,000 jobs over the 2007-2010 periods; however, banks and financial firms are still looking to lower occupancy costs through more efficient space usage. The professional and business
services sector continued to expand in the first quarter of 2012, adding 196,000 jobs in the quarter, following a gain of 152,000 in the fourth quarter of 2011. Prospects for further improvement in office market conditions bode well given recent office employment growth. While office employment growth is a driver of aggregate demand for space, the leasing activity that occurs each quarter is a function of the expiration of leases signed in prior years, which in turn constitute a second source of demand for vacant space. In the current economic and market environment,
companies are looking for opportunities to upgrade their space and plan for the long term as leases expire, but they are often leasing less space in order to reduce overhead costs. Similarly, many companies are moving from older, less efficient buildings to newer, technologically functional buildings where they are
able to reduce their space requirements by reducing the average square feet per employee and eliminating or reducing the amount of meeting rooms and common space. Class A buildings have been the primary beneficiaries of this “flight to quality” with accompanying growth in rental rates as the amount of
available Class A space shrinks. The Account’s investments in a number of major markets are well positioned to benefit from this trend. Industrial Conditions in the industrial market are influenced to a large degree by growth in GDP, industrial production and international trade flows. After eleven consecutive quarters of GDP growth, a 5.4% increase in industrial production during the first quarter of 2012, and a rebound of global trade flows, U.S.
industrial market conditions continued to improve and particularly in coastal markets where global trade activity is centered. During the first quarter of 2012, the national industrial availability rate declined for the seventh consecutive quarter to 13.4% as compared to 13.6% in the fourth quarter of 2011. By
comparison, the vacancy rate for the Account’s industrial property portfolio was well below the national average at 5.9%, down from 6.6% as of the fourth quarter of 2011. The vacancy rate of the Account’s properties in each of its top five industrial markets remained well below their respective market averages. 42
Weighted
Average
Vacancy
Area
Vacancy*
by Metro Area
($M)
Investments
Alexandria DC-VA-MD-WV
Account
Metropolitan
Sector Metropolitan Area
Total Sector
% of Total
2012Q1
2011Q4
2012Q1
2011Q4
Industrial National
5.9%
6.6%
13.4%
13.6%
1 Riverside-San Bernardino-Ontario CA
$
485.8
3.0%
4.3%
2.9%
12.3%
12.1%
2 Dallas-Plano-Irving TX
$
202.2
1.2%
2.8%
1.3%
14.0%
14.7%
3 Seattle-Bellevue-Everett WA
$
164.6
1.0%
8.5%
6.5%
10.9%
12.0%
4 Fort Lauderdale-Pompano Beach-Deerfield Beach FL
$
157.4
1.0%
3.9%
3.9%
14.3%
14.1%
5 Chicago-Naperville-Joliet IL
$
123.2
0.8%
3.7%
3.7%
15.1%
14.9%
*
Source: CBRE-EA. Market availability is the percentage of space available for rent. Account vacancy is the value-weighted percentage of unleased space.
Multi-Family Apartment market conditions tightened further during the first quarter of 2012. The national vacancy rate declined to an average of 5.1% in the first quarter of 2012 as compared to 6.0% in the first quarter of 2011. (Year-over-year comparisons are necessary to account for seasonal leasing patterns.) The
improvement was broad-based, as vacancy rates declined in 58 of the 63 markets tracked by CBRE-EA. Effective rents, which include concessions like free rent, increased in virtually all markets. Consistent with conditions at the national level, the vacancy rate of the Account’s multi-family portfolio remained low at
an average of 3.5% in the first quarter of 2012. As shown in the table below, the average vacancy rate for the Account’s properties in four of its top five apartment markets remained below their respective market averages. The vacancy rate of the Account’s property in Denver was slightly above the market average
due to a seasonal uptick in vacancy at the property.
Account
Metropolitan
Sector Metropolitan Area
Total Sector
% of Total
2012Q1
2011Q4
2012Q1
2011Q4
Apartment National
3.5%
3.5%
5.1%
5.6%
1 New York-Wayne-White Plains NY-NJ
$
368.0
2.3%
2.2%
1.8%
5.1%
5.2%
2 Houston-Bay Town-Sugar Land TX
$
255.9
1.6%
3.9%
4.1%
7.7%
8.2%
3 Washington-Arlington-Alexandria DC-VA-MD-WV
$
240.1
1.5%
1.7%
5.0%
4.1%
4.1%
4 Denver-Aurora CO
$
224.5
1.4%
6.4%
3.2%
4.8%
4.5%
5 Atlanta-Sandy Springs-Marietta GA
$
133.1
0.8%
3.0%
2.7%
9.1%
8.5%
*
Source: CBRE-EA. Market vacancy is the percentage of units vacant. The Account’s vacancy is the value-weighted percentage of unleased units.
Retail Retail market conditions remained soft despite recent increases in consumer spending. Preliminary data from the U.S. Census Bureau indicate that retail sales excluding motor vehicles and parts increased 2.0% in the first quarter of 2012 as compared with the fourth quarter of 2011, and 6.3% compared with the
first quarter of 2011. Nonetheless, availability rates in neighborhood and community centers averaged 13.1% in the first quarter of 2012, unchanged from the fourth quarter of 2011, as retailers remained cautious about 43
Weighted
Average
Vacancy
Area
Availability*
by Metro Area
($M)
Investments
Weighted
Average
Vacancy
Area
Vacancy*
by Metro Area
($M)
Investments
opening new stores. The vacancy rate for the Account’s retail portfolio increased to 9.1% during the first quarter of 2012 as compared with 8.1% in the fourth quarter of 2011. The vacancy rate of the Account’s retail portfolio is well below-average, and the portfolio vacancy rate has remained low for four
consecutive quarters. While retail market conditions remain weak, there are signs of improvement given recent employment growth and the growth in consumer spending. For example, top tier malls and lifestyle centers are reporting solid sales growth as more affluent consumers are spending again. Fundamentals
for community and neighborhood centers are weaker but improving as net absorption, a fundamental indicator of space demand, has increased nationally in each of the last three quarters. Similarly, strip center REITs have reported stronger leasing and higher occupancies in recent quarters. Outlook Continued growth in the U.S. economy provided a solid backdrop for commercial real estate markets in the first quarter of 2012. However, gains in employment did not translate into comparable improvement in market conditions because of the typical lag between when new employees are hired and additional
space is leased. Gains in occupancy have also been tempered by companies’ desire to keep their occupancy costs low. Similarly, investors remained active but were highly selective, with aggressive pricing for top tier properties and lesser interest in secondary markets, properties and locations. Reflective of this more
cautious approach by tenants and investors, commercial property returns moderated during the first quarter of 2012 but remained healthy. The tentative approach of tenants and investors is likely to persist into 2012 given macroeconomic conditions and the healthy increase in property values over the past two years.
Concerns about the impact of federal budget cuts and potential repercussions from the European debt crisis will also give pause as companies wait for a clearer picture of their business prospects before making long-term space decisions. Leasing and investment activity may also slow leading up to and for a time
after the Presidential election. Nonetheless, there will be activity in the market due to leases expirations and companies’ desire to upgrade their facilities. If economic conditions are generally in-line with economists’ expectations, real estate market conditions are likely to remain favorable. Historically, moderate
employment growth coupled with minimal construction has provided a supportive backdrop for the commercial real estate sector. Management continued to implement its strategy to rebalance the property portfolio’s geographic and property sector concentrations. During the first quarter of 2012, the Account acquired a premier lifestyle shopping center in a major East Coast market, while one of its joint venture investments sold a large
community shopping center in the Southeast. Management also continued its efforts to maintain the Account’s income returns through aggressive property management and leasing in combination with expense management. Management believes that results for the first quarter of 2012 further demonstrate the
significant improvements that have occurred as a result of the execution of its strategy. As of the first quarter of 2012, the Account’s holdings were 91.6% leased as compared with 91.2% as of the fourth quarter of 2011. During the first quarter of 2012, the Account’s real estate assets generated a 1.37% income
return and a 2.44% capital return. As shown in the graph below, returns for the first quarter of 2012 represent the eighth consecutive quarter of positive income and capital returns. 44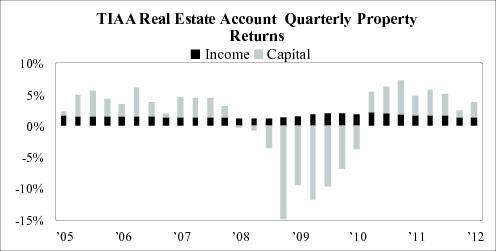
Participant inflows continued at a relatively steady pace during the first quarter of 2012, with the Account holding a sizeable cash position as of the end of the quarter. Management intends to manage the Account’s cash position in a manner that maximizes the performance of the Account in accordance with its
investment objective and strategy while maintaining adequate liquidity reserves. Potential acquisitions will be evaluated in the context of overall Account objectives, with an emphasis on retail, multi-family, and industrial properties in order to further reduce the Account’s exposure to the office sector. Management
believes repositioning activities, which started in 2010 and continued through the first quarter of 2012, have placed the Account in a position to benefit from ongoing improvement in commercial real estate market conditions and investors’ focus on major metropolitan markets. Investment activities throughout 2012
will seek to further refine the Account’s geographic and property type mix in accordance with the Account’s overall objectives. Prices for top tier properties have increased measurably from their lows in the latter half of 2009, which has driven initial cash-on-cash returns to relatively low levels. Management will
therefore carefully evaluate prospective acquisitions based on short- and long-term growth potential, purchase price relative to replacement cost, and portfolio diversification benefits as well as initial cash-on-case returns. Emphasis will continue to be given to institutional quality properties that have strong
occupancy history and favorable tenant rollover schedules. Investments as of March 31, 2012 As of March 31, 2012, the Account had total net assets of $14.2 billion, a 5.1% increase from December 31, 2011, and a 20.7% increase from March 31, 2011. The increase in the Account’s net assets from December 31, 2011 to March 31, 2012 was primarily driven by net participant inflows into the Account
coupled with the appreciation in value of the Account’s investments. As of March 31, 2012, the Account owned a total of 102 real estate property investments (90 of which were wholly owned, 12 of which were held in joint ventures). The real estate portfolio included 32 office property investments (four of which were held in joint ventures and one located in London, England),
26 industrial property investments (including one held in a joint venture), 23 apartment property investments, 19 retail property investments (including five held in joint ventures and one located in Paris, France), one 75% owned joint venture interest in a portfolio of storage facilities, and one fee interest
encumbered by a ground lease. Of the 102 real estate property investments, 36 are subject to debt (including seven joint venture investments). The outstanding principal on mortgage loans payable on the Account’s wholly owned real estate portfolio as of March 31, 2012 was $2.1 billion. The Account’s proportionate share of outstanding principal on mortgage loans payable within its joint venture investments was $1.6 billion, which is netted against the
underlying properties when determining the joint venture investments fair value presented on the consolidated statements of investments. When the mortgage loans payable within the joint venture investments are considered, total outstanding principal on the Account’s portfolio as of March 31, 2012 was $3.7
billion, which represented a loan to value ratio of 20.2%. The Account currently has no Account-level debt. Management believes the Account’s real estate portfolio is diversified by location and property type. The Account’s largest investment, 1001 Pennsylvania Avenue located in Washington, DC, represented 5.5% of total real estate investments and 4.0% of total investments. As discussed in the Account’s
prospectus, the Account does not intend to buy and sell its real estate investments simply to make short-term profits. Rather, the Account’s general strategy in selling real estate investments is to dispose of those assets that management believes (i) have maximized in value, (ii) have underperformed or face
deteriorating property-specific or market conditions, (iii) need significant capital infusions in the future, (iv) are appropriate to dispose of in order to remain consistent with the Account’s intent to diversify the Account by property type and geographic location (including reallocating the Account’s exposure to or
away from certain property types in certain geographic locations), or (v) otherwise do not satisfy the investment objectives of the Account. Management from time to time will evaluate the need to manage liquidity in the Account as part of its analysis as to whether to undertake a particular asset sale. The Account
could reinvest any sale proceeds it does not need to pay operating expenses or to meet debt service or redemption requests (e.g., cash withdrawals or transfers, and any redemption of TIAA’s liquidity units in the future). 45
The following charts reflect the diversification of the Account’s real estate assets by region and property type and list its ten largest investments. All information is based on the fair values of the investments at March 31, 2012. Diversification by Fair Value(1)
East
West
South
Midwest
Foreign(2)
Total Office
21.8
%
15.8
%
9.5
%
0.3
%
2.2
%
49.6
% Apartment
6.6
%
5.4
%
4.9
%
—
—
16.9
% Industrial
1.3
%
6.8
%
4.5
%
1.2
%
—
13.8
% Retail
3.9
%
2.8
%
7.8
%
0.2
%
1.8
%
16.5
% Other(3)
2.9
%
0.2
%
0.1
%
—
—
3.2
% Total
36.5
%
31.0
%
26.8
%
1.7
%
4.0
%
100.0
%
(1)
Wholly-owned properties are represented at their fair value, gross of any debt, while joint venture investments are represented at their net equity value. (2) Represents real estate investments in the United Kingdom and France. (3) Represents interest in Storage Portfolio investment and fee interest encumbered by a ground lease real estate investment. Properties in the “East” region are located in: CT, DC, DE, KY, MA, MD, ME, NC, NH, NJ, NY, PA, RI, SC, VA, VT, WV Properties in the “West” region are located in: AK, AZ, CA, CO, HI, ID, MT, NM, NV, OR, UT, WA, WY Properties in the “South” region are located in: AL, AR, FL, GA, LA, MS, OK, TN, TX Properties in the “Midwest” region are located in: IA, IL, IN, KS, MI, MN, MO, ND, NE, OH, SD, WI Top Ten Largest Real Estate Investments
Property Investment Name
City
State
Type
Value ($M)(a)
Property as a
Property as a
1001 Pennsylvania Avenue
Washington
DC
Office
657.3
(b)
5.55
4.04
Four Oaks Place
Houston
TX
Office
486.4
4.11
2.99
Fourth and Madison
Seattle
WA
Office
388.4
(c)
3.28
2.39
99 High Street
Boston
MA
Office
366.6
(d)
3.09
2.25
50 Fremont
San Francisco
CA
Office
365.2
(e)
3.08
2.24
DDR Joint Venture
Various
USA
Retail
359.4
(f)
3.03
2.21
780 Third Avenue
New York City
NY
Office
341.0
2.88
2.09
425 Park Avenue
New York
NY
Land
320.0
2.70
1.97
The Florida Mall
Orlando
FL
Retail
318.1
(g)
2.69
1.95
The Newbry
Boston
MA
Office
283.1
2.39
1.74
(a)
Value as reported in the March, 31, 2012 Statement of Investments. Investments owned 100% by the Account are reported based on fair value. Investments in joint ventures are reported at fair value and are presented at the Account’s ownership interest. (b) This property investment is presented gross of debt. The value of the Account’s interest less the fair value of leverage is $447.3M. (c) This property investment is presented gross of debt. The value of the Account’s interest less the fair value of leverage is $243.4M. (d) This property investment is presented gross of debt. The value of the Account’s interest less the fair value of leverage is $181.6M. (e) This property investment is presented gross of debt. The value of the Account’s interest less the fair value of leverage is $230.2M. (f) This property is held in a 85% / 15% joint venture with Developers Diversified Realty Corporation ("DDR"), and consists of 40 retail properties located in 13 states and is presented net of debt with a fair value of $965.6 million. (g) This property investment is a 50% / 50% joint venture with Simon Property Group, L.P., and is presented net of debt with a fair value of $192.3 million. At March 31, 2012, the Account held 72.8% of its total investments in real estate and real estate joint ventures. The Account also held investments in government agency notes representing 7.0% of total investments, U.S. Treasury securities representing 11.3% of total investments, real estate-related equity
securities representing 6.9% of total investments, and real estate limited partnerships, representing 2.0% of total investments. 46
% of Total
Real Estate
Portfolio
% of Total
Investments
Results of Operations Three months ended March 31, 2012 compared to three months ended March 31, 2011 Performance The Account’s total return was 3.3% for the quarter ended March 31, 2012 as compared to 3.4% for the quarter ended March 31, 2011. The Account’s performance thus far during 2012 reflects an increase in the aggregate value of the Account’s real estate property investments, including investments owned in
joint ventures and limited partnerships primarily as a result of a continuation of the improving market conditions experienced throughout 2011. The Account’s annualized total returns over the past one, three, five, and ten year periods ended March 31, 2012 were 12.8%, 1.4%, -2.1%, and 4.2%, respectively. As of March 31, 2012, the Account’s annualized total return since inception was 5.8%. Net Investment Income The table below shows the results of operations for the quarters ended March 31, 2012 and 2011 and the dollar and percentage changes for those periods (dollars in millions, unaudited).
For the Three Months
Change
2012
2011
$
% INVESTMENT INCOME Real estate income, net: Rental income
$214.8
$210.1
$4.7
2.2
% Real estate property level expenses and taxes: Operating expenses
56.0
57.8
(1.8
)
-3.1
% Real estate taxes
29.1
27.2
1.9
7.0
% Interest expense
28.9
26.4
2.5
9.5
% Total real estate property level expenses and taxes
114.0
111.4
2.6
2.3
% Real estate income, net
100.8
98.7
2.1
2.1
% Income from real estate joint ventures and limited partnerships
17.0
21.1
(4.1
)
-19.4
% Interest
0.5
1.1
(0.6
)
-54.5
% Dividends
7.4
2.4
5.0
NM TOTAL INVESTMENT INCOME
125.7
123.3
2.4
1.9
% Expenses: Investment advisory charges
15.1
14.2
0.9
6.3
% Administrative charges
7.5
6.9
0.6
8.7
% Distribution charges
3.3
1.9
1.4
73.7
% Mortality and expense risk charges
1.7
1.4
0.3
21.4
% Liquidity guarantee charges
7.2
4.2
3.0
71.4
% TOTAL EXPENSES
34.8
28.6
6.2
21.7
% INVESTMENT INCOME, NET
$
90.9
$
94.7
$
(3.8
)
-4.0
%
N/M
– Not meaningful
Rental Income: The $4.7 million or 2.2% increase in real estate rental income for the quarter as compared to the comparable period of 2011 was a direct result of real estate investment acquisitions subsequent to the first quarter of 2011 and during the first quarter of 2012. 47
Ended March 31,
Operating Expenses: Operating expenses decreased by $1.8 million or 3.1% for the quarter as compared to the comparable period of 2011. The decrease was primarily related to decreased general operating and maintenance expenses for the real estate investments. Decreases from real estate investment dispositions were offset by
increases from real estate investment acquisitions. Real Estate Taxes: Real estate taxes increased $1.9 million or 7.0% for the quarter as compared to the comparable period of 2011. The increase relates to favorable real estate tax experience during the first quarter of 2011 as a result of lower tax assessments experienced during 2010. Interest Expense: Interest expense increased $2.5 million, or 9.5% for the quarter as compared to the comparable period of 2011. The increase was a direct result of new financings throughout 2011 subsequent to the first quarter of 2011, specifically the financings of the Corner and the Palatine during 2011, and the financing of
The Forum at Carlsbad during the first quarter of 2012. Income from Real Estate Joint Ventures and Limited Partnerships: Income from real estate joint ventures and limited partnerships decreased $4.1 million or 19.4% during the quarter as compared to the comparable period of 2011. The decrease was attributable to decreased distributions from the joint ventures and limited partnerships as a result of various joint venture and
limited partnership investments retaining cash for purposes of capital and operating expenditures. Interest and Dividend Income: Interest and dividend income increased $4.4 million during the quarter as compared to the comparable period of 2011. The increase in dividend income was directly attributed to the Account’s increased investment in real estate related securities held of $1.1 billion as compared to $635.2 million for the
comparable quarter of 2011. Expenses: The Account’s expenses increased $6.2 million or 21.7% for the quarter as compared to the comparable period of 2011. The increase in the Account’s expenses was primarily due to the $2.4 billion or 20.7% increase in the Account’s net assets from March 31, 2011. Investment advisory, administrative and
distribution charges are costs charged to the Account associated with managing the Account. A portion of these costs are fixed, but generally correspond to the level of assets under management. When comparing the expenses charged to the Account as a percentage of the average net assets of the Account for each
respective period, investment advisory expenses decreased 8 basis points during the quarter when compared to the comparable period of 2011. Administrative expenses decreased 3 basis points but was directly offset by a 3 basis point increase in distribution expenses. The overall decrease of 8 basis points in
expenses during the quarter as compared to the comparable period of 2011 was primarily due to fixed costs having risen at a slower pace than the Account’s net assets. Mortality and expense risk charges increased as a result of higher net assets; however, the overall basis point charge to the Account has remained at
5 basis points of net assets. The increase in the liquidity guarantee charge was associated with the 6 basis point increase effective May 1, 2011. See Note 2—Management Agreements and Arrangements to the consolidated financial statements included herewith for further discussion related to these expenses. Net Realized and Unrealized Gains and Losses on Investments and Mortgage Loans Payable The table below shows the net realized and unrealized gains and losses on investments and mortgage loans payable for the quarters ended March 31, 2012 and 2011 and the dollar and percentage changes for those periods (dollars in millions, unaudited). 48
For the Three Months
Change
2012
2011
$
% NET REALIZED AND UNREALIZED GAIN (LOSS) Net realized gain (loss) on investments: Real estate properties
$
(5.2
)
$
(9.3
)
$
4.1
-44.1
% Real estate joint ventures and limited partnerships
(3.2
)
(1.5
)
(1.7
)
113.3
% Marketable securities
8.0
1.9
6.1
NM Total realized loss on investments:
(0.4
)
(8.9
)
8.5
-95.5
% Net change in unrealized appreciation (depreciation) on: Real estate properties
192.4
195.5
(3.1
)
-1.6
% Real estate joint ventures and limited partnerships
95.0
64.0
31.0
48.4
% Marketable securities
93.8
34.5
59.3
171.9
% Mortgage loans payable
(26.8
)
1.4
(28.2
)
NM Net change in unrealized appreciation on investments
354.4
295.4
59.0
20.0
% NET REALIZED AND UNREALIZED GAIN ON INVESTMENTS AND MORTGAGE LOANS PAYABLE
$
354.0
$
286.5
$
67.5
23.6
%
N/M
– Not meaningful
Real Estate Properties: During the quarter the Account experienced net realized and unrealized gains on real estate properties of $187.2 million compared to $186.2 million for the comparable period of 2011. Net realized losses in the Account are due to the sale of real estate property investments. See the Recent Transactions section herein for additional disclosure regarding the sale of the Account’s real estate property investments. Net unrealized gains in the Account continue to be driven by declining capitalization rates, improved market rents and stabilizing occupancy rates experienced through 2011 which continued into the first quarter of 2012. Included within net unrealized gains of the Account, are foreign exchange gains of $13.6
million and $24.1 million for each respective quarter related to the Account’s foreign investment properties. Real Estate Joint Ventures and Limited Partnerships: Real estate joint ventures and limited partnerships experienced net realized and unrealized gains of $91.8 million for the quarter compared to $62.5 million for the comparable period of 2011. Net realized losses in the Account are primarily due to the sale of real estate property underlying the Account’s investments in joint ventures. See the Recent Transactions section herein for additional discussions regarding the sale of real estate property investments underlying the Account’s investments in joint
ventures. Net unrealized gains on the Account’s joint venture and limited partnership investments continue to be driven by declining capitalization rates, improved market rents and stabilizing occupancy rates experienced through 2011 and continued into the first quarter of 2012. Marketable Securities: The Account’s marketable securities positions experienced net realized and unrealized gains of $101.8 million during the quarter as compared to $36.4 million for the comparable period of 2011. The increase is directly attributable to the Account’s increased investment in real estate related marketable securities
(primarily REITs). At March 31, 2012 the Account’s real estate related marketable securities were $1.1 billion as compared to $635.2 million as of March 31, 2011, an increase of $503.5 million or 79.3%. 49
Ended March 31,
ON INVESTMENTS AND MORTGAGE LOANS PAYABLE
and mortgage loans payable
Additionally, the Account held $3.0 billion of short term marketable securities invested in government agency notes and United States Treasury Securities, which had nominal appreciation due to the short term nature of these investments. Mortgage Loans Payable: Mortgage loans payable experienced net unrealized losses of $26.8 million for the quarter compared to net unrealized gains of $1.4 million for the comparable period of 2011. Valuation adjustments to mortgage loans payable are highly dependent upon interest rates, investment return demands, the performance
of the underlying real estate investment, and where applicable, foreign exchange rates. The net unrealized losses during the quarter as compared to the net unrealized gains for the comparable period of 2011 was due to decreased credit spreads as a result of decreased loan to value ratios on the Account’s real estate
property investments coupled with decreased Treasury rates. Included in the net unrealized losses and gains of the Account’s mortgage loans payable was $5.9 million and $5.0 million of unrealized losses in each respective quarter related to a mortgage loan payable on one of the Account’s foreign real estate
property investments. Liquidity and Capital Resources As of March 31, 2012 and December 31, 2011, the Account’s cash, cash equivalents and non-real estate-related marketable securities had a value of $3.0 billion and $2.8 billion, respectively (21.0 % and 20.8% of the Account’s net assets at such dates, respectively). When compared to December 31, 2011, the
Account’s non-real estate-related liquid assets have increased by $0.2 million. This increase is primarily the result of net participant inflows into the Account offset by real estate related investment acquisitions. Participant Flows: First Quarter 2012 Compared to First Quarter 2011 During
the first quarter of 2012, the Account received $499.6 million in premiums,
which included $301.4 million of participant transfers into the Account.
The Account had outflows of $252.5 million in annuity payments, withdrawals
and death benefits, which included $129.7 million of participant transfers
out of the Account. During the first quarter of 2011, the Account received
$819.6 million in premiums, which included $620.9 million of participant
transfers into the Account. Additionally, the Account had outflows of $222.9
million from annuity payments, withdrawals and death benefits, which included
$122.1 million of participant transfers out of the Account. See Note 1—Organization
and Significant Accounting Policies of the consolidated financial statements
as included herein. Management believes that the reduction in transfers into the Account is primarily related to the transfer limitation on the Account which was effective in the substantial majority of jurisdictions on March 31, 2011, as discussed in more detail in the paragraph below. Effective March 31, 2011 (or such later date as indicated in the contract or contract endorsement) individual participants are limited from making “internal funding vehicle transfers” into their Account accumulation if, after giving effect to such transfer, the total value of such participant’s Account accumulation
(under all contracts issued to such participant) would exceed $150,000. This limitation is subject to certain exceptions. Management believes that, compared to periods prior to the transfer limitation being in effect, participant transfer inflow activity will continue to be tempered. As of the date of this Form 10-Q, all
jurisdictions in which the Account is offered have approved this limitation, but the effective date of the limitation as applies to an individual participant will be reflected on his or her contract or endorsement form. Liquidity Guarantee Primarily as a result of significant net participant transfers out of the Account during late 2008 and mid-2009, pursuant to TIAA’s existing liquidity guarantee obligation, the TIAA general account purchased $1.2 billion of liquidity units issued by the Account in a number of separate transactions between
December 2008 and June 2009. Subsequent to June 2009, the TIAA general account did not purchase any additional liquidity units. As disclosed under “Establishing and Managing the Account–the Role of TIAA–Liquidity Guarantee” in the Account’s prospectus, in accordance with this liquidity guarantee
obligation, TIAA guarantees that all participants in the Account may redeem their accumulation units at their accumulation unit value next determined after their transfer or cash withdrawal request is received in good order. 50
Net participant transfers out of the Account significantly slowed following the first quarter of 2009, and net participant transfer activity turned to inflows in early 2010, which has continued through the date of this report. As a result, while management cannot predict whether any future TIAA liquidity unit
purchases will be required under this liquidity guarantee, it is unlikely that additional purchases will be required in the near term. However, management cannot predict for how long net inflows will continue to occur. If net outflows were to occur (even if not at the same intensity as in 2008 and early 2009), it could
have a negative impact on the Account’s operations and returns and could require TIAA to purchase additional liquidity units, perhaps to a significant degree, as was the case in late 2008 and early 2009. TIAA’s obligation to provide Account participants liquidity through purchases of liquidity units is not subject to an express regulatory or contractual limitation, although as described in the paragraph below, the independent fiduciary may (but is not obligated to) require the reduction of TIAA’s interest
through sales of assets from the Account if TIAA’s interest exceeds the trigger point. Even if the independent fiduciary so requires, TIAA’s obligation to provide liquidity under the guarantee, which is required by the New York State Insurance Department, will continue. Management believes that TIAA has the
ability to meet its obligations under this liquidity guarantee. Whenever TIAA owns liquidity units, the duties of the Account’s independent fiduciary, as part of its monitoring of the Account, include reviewing the purchase and redemption of liquidity units by TIAA to ensure the Account uses the correct accumulation unit values. In addition, the independent fiduciary’s
responsibilities include:
establishing the percentage of total accumulation units that TIAA’s ownership should not exceed (the “trigger point”) and creating a method for reviewing the trigger point; • approving any adjustment of TIAA’s ownership interest in the Account and, in its discretion, requiring an adjustment if TIAA’s ownership of liquidity units reaches the trigger point; and • once the trigger point has been reached, participating in any program to reduce TIAA’s ownership in the Account by utilizing cash flow or liquid investments in the Account, or by utilizing the proceeds from asset sales. If the independent fiduciary were to determine that TIAA’s ownership should be reduced
following the trigger point, its role in participating in any asset sales program would include (i) participating in the selection of properties for sale, (ii) providing sales guidelines and (iii) approving those sales if, in the independent fiduciary’s opinion, such sales are desirable to reduce TIAA’s ownership of
liquidity units. As of the date of this Form 10-Q, the independent fiduciary, which has the right to adjust the trigger point, has established the trigger point at 45% of the outstanding accumulation units and it will continue to monitor TIAA’s ownership interest in the Account and provide further recommendations as
necessary. As of March 31, 2012, TIAA owned approximately 8.7% of the outstanding accumulation units of the Account. In establishing the appropriate trigger point, including whether or not to require certain actions once the trigger point has been reached, the independent fiduciary will assess, among other
things and to the extent consistent with the Prohibited Transaction Exemption (PTE 96-76) issued by the U.S. Department of Labor in 1996 with respect to the liquidity guarantee and the independent fiduciary’s duties under ERISA, the risk that a conflict of interest could arise due to the level of TIAA’s ownership
interest in the Account. The independent fiduciary is vested with oversight and approval over any redemption of TIAA’s liquidity units, acting in the best interests of Real Estate Account participants. The independent fiduciary has indicated to management that, as of the date of this prospectus, it intends to initiate systematic
redemptions of the liquidity units held by the TIAA General Account at such times as it deems appropriate. The independent fiduciary currently intends to cause a redemption of approximately one-quarter of the liquidity units held by TIAA on a daily basis throughout the third month of each calendar quarter,
beginning June 1, 2012, so long as (i) the Account holds and is projected to hold at least 17% of its net assets in cash, cash equivalents and publicly traded, liquid non-real estate related securities, after taking into account certain projected sources and uses of cash flow into the Account, and (ii) recent historical net
participant flows have been positive over the 20 business days prior to such redemption. If these conditions (along with other conditions and factors which the independent fiduciary may apply) are met consistently following June 1, 2012, TIAA would be fully redeemed by the end of March 2013. In addition, at any
time the Account holds cash, cash equivalents and publicly traded, liquid non-real estate related securities in excess of 25% of its net assets, the independent fiduciary intends to cause redemption of liquidity units in an amount sufficient to 51
•
reduce such level to 25% of net assets. As of March 31, 2012, the Account held 21.0% of its net assets in such liquid non-real estate related investments (along with its cash and cash equivalents). In administering any redemptions (including those intended as described above), the independent fiduciary has indicated to management that it intends to evaluate, among other things (i) projected acquisitions and dispositions of real estate and real estate-related investments, (ii) participant inflow and outflow
trends, (iii) the Account’s net income and (iv) obligations to make debt service payments and pay principal balances of mortgages on Account properties. The independent fiduciary is vested with oversight and approval over any redemption of liquidity units owned by TIAA, acting in the best interests of Real
Estate Account participants. As a general matter, the independent fiduciary may authorize or direct the redemption of all or a portion of liquidity units at any time and TIAA will request the approval of the independent fiduciary before any liquidity units are redeemed. There is no guarantee that the independent fiduciary will cause
redemptions and even if redemptions do commence, management cannot predict the time period over which such redemptions would continue. Further, neither management nor the independent fiduciary can predict when TIAA’s liquidity units may be redeemed in full. Upon termination and liquidation of the Account (wind-up), any liquidity units held by TIAA will be the last units redeemed, unless the independent fiduciary directs otherwise. The Account pays TIAA for the risk associated with providing the liquidity guarantee through a daily deduction from the Account’s
net assets. The Account’s net investment income continues to be an additional source of liquidity for the Account. Net investment income was $90.9 million for the quarter as compared to $94.7 million for the comparable period of 2011. Total net investment income decreased primarily as a result of a slight increase in
income from the Account’s wholly owned real estate investments, interest income, and dividend income, offset by higher Account expenses as a result of higher average net assets over the period. As of March 31, 2012, cash and cash equivalents, along with real estate-related and non real estate-related marketable securities comprised 29.0% of the Account’s net assets. The Account’s liquid assets continue to be available to purchase additional suitable real estate properties, meet the Account’s debt
obligations, expense needs, and participant redemption requests (i.e., cash withdrawals, benefit payments, or transfers). As of March 31, 2012, $911.7 million in principal amount of debt obligations will mature through March 31, 2013, $208.5 million related to debt obligations secured by its wholly owned real estate investments and $703.2 million related to debt obligations secured by the Account’s joint venture investments. An
aggregate of $593.9 million in principal amount of debt obligations (which represents the Account’s share) secured by a total of 29 properties in the Account’s DDR joint venture investment matures in June 2012. As of March 31, 2012, 17 properties within the DDR Joint Venture investment secure $459.0 million in principal amount of debt obligations (which represents the Account’s share) matures June 1, 2012. As
of March 31, 2012, 12 properties within the DDR joint venture investment
secure $134.9 million in principal amount of debt obligations (which represents
the Account’s share) maturing May 29, 2012.
During May 2012, this debt obligation was refinanced with a syndicate of lenders,
maturing May 2015. Management is evaluating the full range of options available to the Account in its capacity as an investor in these joint ventures. Management believes that the Account and the joint venture entities in which the Account invests will have the ability to address these non-recourse obligations in a number of ways,
including among others, repaying the principal due at maturity, refinancing such debt, restructuring such debt, and/or electing to default on the loans secured by such properties if the joint ventures were unable to reach a satisfactory resolution with respect to such obligations. Leverage The Account may borrow money and assume or obtain a mortgage on a property to make leveraged real estate investments. Also, to meet any short-term cash needs, the Account may obtain a line of credit that 52
may be unsecured and/or contain terms that may require the Account to secure the loan with one or more of its properties. The Account is authorized to borrow money in accordance with its investment guidelines. Under the Account’s current investment guidelines, the Account’s loan to value ratio (as described below) is to be maintained at or below 30%. Such incurrences of debt from time to time may include: • placing new debt on properties; • refinancing outstanding debt; • assuming debt on acquired properties or interests in the Account’s properties; and/or • long term extensions of the maturity date of outstanding debt. In calculating this limit, only the Account’s actual percentage interest in any borrowings is included, and not that percentage interest held by any joint venture partner. Further, the Account may only borrow up to 70% of the then-current value of a property, although construction loans may be for 100% of the
costs incurred in developing a property. As of March 31, 2012 the Account did not have any construction loans. Also, at the time the Account (or a joint venture in which the Account is a partner) enters into a revolving line of credit, management deems the maximum amount which may be drawn under that line of
credit as fully incurred, regardless of whether the maximum amount available has been drawn from time to time. As of March 31, 2012, the Account’s ratio of outstanding principal amount of debt to total gross asset value (i.e., a “loan to value ratio”) was 20.2%. The Account intends to maintain its loan to value ratio at or below 30% (this ratio is measured at the time of incurrence and after giving effect thereto). The
Account’s total gross asset value, for these purposes, is equal to the total fair value of the Account’s assets (including the fair value of the Account’s interest in joint ventures), with no reduction associated with any indebtedness on such assets. In times of high net inflow activity, in particular during times of high net participant transfer inflows, management may determine to apply a portion of such cash flows to make prepayments of indebtedness prior to scheduled maturity, which would have the effect of reducing the Account’s loan to value ratio. Recent Transactions The following describes property transactions by the Account during the first quarter of 2012. Except as noted, the expenses for operating the properties purchased are either borne or reimbursed, in whole or in part, by the property tenants, although the terms vary under each lease. The Account is responsible for
operating expenses not reimbursed under the terms of a lease. All rental rates are quoted on an annual basis unless otherwise noted. Purchases The Shops at Wisconsin Place—Chevy Chase, MD On February 3, 2012, the Account purchased a retail property and a 33.3% interest in a joint venture located in Chevy Chase, Maryland for $114.3 million. The Property is an 118,000 square foot retail center. It is currently 98% leased and is anchored by Whole Foods (owned) and Bloomingdale’s (un-owned).
The remaining tenancy is a diversified mix of retailers and restaurants (i.e. Anthropologie, Capital Grille, PF Changs, Eileen Fisher, White House Black Market). The Shops at Wisconsin Place is the retail component of a mixed-use project which includes a 299,200 square foot office building owned by Boston
Properties and a 432 unit multifamily high-rise owned by Archstone Smith. The entire project resides on a ground lease. The ground lease and associated fee is held within a joint venture, owned equally (33.3%) by the Account, Archstone Smith and Boston Properties. Sales Pointe on Tampa Bay—Tampa, FL On January 11, 2012, the Account sold an office building located in Tampa, Florida for a net sale price of $46.2 million and realized a loss from sale of $5.1 million, the majority of which had been previously 53
recognized as an unrealized los in the Account’s consolidated statements of operations. The Account’s cost basis (excluding selling costs) in the property as of the date of sale was $51.3 million according to the records of the Account. DDR Joint Venture On February 23, 2012, a retail property located in Tampa, Florida was sold by the Account’s DDR Joint Venture investment. The Account holds an 85.0% interest in the DDR Joint Venture investment. The Account’s portion of the net sale price was $3.3 million. The Account realized a loss from the sale of
$3.3 million, the majority of which had been previously recognized as an unrealized los in the Account’s consolidated statements of operations. The Account’s portion of its cost basis (excluding selling costs) in the property at the date of the sale was $6.6 million (excluding debt) according to the records of the
Account. Concurrent with the sale, the DDR Joint Venture repaid a mortgage loan associated with the sold retail asset. Of the mortgage loan repaid, $3.5 million related to the Account’s interest. Financings The Forum at Carlsbad—Carlsbad, CA On February 29, 2012, the Account entered into a $90.0 million mortgage loan payable on this retail property. The debt matures March 1, 2022 and is interest only through March 1, 2017 at which time both principal and interest payments are due through maturity. The interest rate is fixed at 4.25% over the life
of the loan. Critical Accounting Policies The consolidated financial statements of the Account are prepared in conformity with accounting principles generally accepted in the United States of America. In preparing the Account’s consolidated financial statements, management is required to make estimates and judgments that affect the reported amounts of assets, liabilities, revenues, and expenses. Management bases its estimates on historical experience and assumptions that are believed to be reasonable
under the circumstances, the results of which form the basis for making judgments about the carrying value of assets and liabilities that are not readily apparent from other sources. Actual results may differ from these estimates. Determination of Investments at Fair Value: The Account reports all investments and investment related mortgage loans payable at fair value. The Financial Accounting Standards Board (“FASB”) has defined fair value as the price that would be received to sell an asset or paid to transfer a liability in an
orderly transaction between market participants. The following is a description of the valuation methodologies used to determine the fair value of the Account’s investments and investment related mortgage payables. Valuation of Real Estate Properties—Investments in real estate properties are stated at fair value, as determined in accordance with policies and procedures reviewed by the Investment Committee of the Board and in accordance with the responsibilities of the Board as a whole. Accordingly, the Account does not
record depreciation. Determination of fair value involves judgment because the actual fair value of real estate can be determined only by negotiation between the parties in a sales transaction. The Account’s primary objective when valuing its real estate investments will be to produce a valuation that represents a
reasonable estimate of the fair value of its investments. Implicit in the Account’s definition of fair value are the consummation of a sale as of a specified date and the passing of title from seller to buyer under conditions whereby:
•
Buyer and seller are typically motivated; • Both parties are well informed or well advised, and acting in what they consider their best interests; • A reasonable time is allowed for exposure in the open market; • Payment is made in terms of cash or in terms of financial arrangements comparable thereto; and 54
• The price represents the normal consideration for the property sold unaffected by special or creative financing or sales concessions granted by anyone associated with the sale. Property and investment values are affected by, among other things, the availability of capital, occupancy rates, rental rates, and interest and inflation rates. As a result, determining real estate and investment values involves many assumptions. Key inputs and assumptions include rental income and expense
amounts, related rental income and expense growth rates, discount rates and capitalization rates. Valuation techniques include discounted cash flow analysis, prevailing market capitalization rates or multiples applied to earnings from the property, analysis of recent comparable sales transactions, actual sale
negotiations and bona fide purchase offers received from third parties. Amounts ultimately realized from each investment may vary significantly from the fair value presented. Real estate properties owned by the Account are initially valued based on an independent third party appraisal, as reviewed by TIAA’s internal appraisal staff and as applicable the Account’s independent fiduciary at the time of the closing of the purchase, which may result in a potential unrealized gain or loss
reflecting the difference between an investment’s fair value (i.e., exit price) and its cost basis (which is inclusive of transaction costs). Subsequently, each property is appraised each quarter by an independent third party appraiser, reviewed by TIAA’s internal appraisal staff and as applicable the Account’s independent fiduciary. In general, the Account obtains appraisals of its real estate properties spread out throughout the quarter, which is
intended to result in appraisal adjustments, and thus, adjustments to the valuations of its holdings (to the extent such adjustments are made) that happen regularly throughout each quarter and not on one specific day or month in each period. Further, management reserves the right to order an appraisal and/or conduct another valuation outside of the normal quarterly process when facts or circumstances at a specific property change. For example, under certain circumstances a valuation adjustment could be made when the account receives a bona
fide bid for the sale of a property held within the Account or one of the Account’s joint ventures. In addition, adjustments may be made for events or circumstances indicating an impairment of a tenant’s ability to pay amounts due to the Account under a lease (including due to a bankruptcy filing of that tenant).
Alternatively, adjustments may be made to reflect the execution or renewal of a significant lease. Also, adjustments may be made to reflect factors (such as sales values for comparable properties or local employment rate) bearing uniquely on a particular region in which the Account holds properties. TIAA’s
internal appraisal staff oversees the entire appraisal process, in conjunction with the Account’s independent fiduciary (the independent fiduciary is more fully described in the paragraph below). Any differences in the conclusions of TIAA’s internal appraisal staff and the independent appraiser will be reviewed by
the independent fiduciary, which will make a final determination on the matter (which may include ordering a subsequent independent appraisal). The independent fiduciary, Real Estate Research Corporation, has been appointed by a special subcommittee of the Investment Committee of the Board to, among other things, oversee the appraisal process. The independent fiduciary must approve all independent appraisers used by the Account. All
appraisals are performed in accordance with Uniform Standards of Professional Appraisal Practices, the real estate appraisal industry standards created by The Appraisal Foundation. Real estate appraisals are estimates of property values based on a professional’s opinion. Appraisals of properties held outside of the
U.S. are performed in accordance with industry standards commonly applied in the applicable jurisdiction. These independent appraisers are always expected to be MAI-designated members of the Appraisal Institute (or its European equivalent, Royal Institute of Chartered Surveyors) and state certified appraisers
from national or regional firms with relevant property type experience and market knowledge. Under the Account’s current procedures, each independent appraisal firm will be rotated off of a particular property at least every three years, although such appraisal firm may perform appraisals of other Account
properties subsequent to such rotation. Also, the independent fiduciary can require additional appraisals if factors or events have occurred that could materially change a property’s value (including those identified above) and such change is not reflected in the quarterly valuation review, or otherwise to ensure that the Account is valued
appropriately. The independent fiduciary must also approve any valuation change of real estate-related assets where a property’s value changed by more than 6% from the most recent independent annual appraisal, or if the value of the 55
Account would change by more than 4% within any calendar quarter or more than 2% since the prior calendar month. When a real estate property is subject to a mortgage, the property is valued independently of the mortgage and the property and mortgage fair values are reported separately (see “Valuation of
Mortgage Loans Payable” below). The independent fiduciary reviews and approves all mortgage valuation adjustments before such adjustments are recorded by the Account. The Account continues to use the revised value for each real estate property and mortgage loan payable to calculate the Account’s daily net
asset value until the next valuation review or appraisal. Valuation of Real Estate Joint Ventures—Real estate joint ventures are stated at the fair value of the Account’s ownership interests of the underlying entities. The Account’s ownership interests are valued based on the fair value of the underlying real estate, any related mortgage loans payable, and other factors,
such as ownership percentage, ownership rights, buy/sell agreements, distribution provisions and capital call obligations. Upon the disposition of all real estate investments by an investee entity, the Account will continue to state its equity in the remaining net assets of the investee entity during the wind down period,
if any, which occurs prior to the dissolution of the investee entity. Valuation of Real Estate Limited Partnerships—Limited partnership interests are stated at the fair value of the Account’s ownership in the partnership which are recorded based upon the changes in the net asset values of the limited partnerships as determined from the financial statements of the limited
partnerships when received by the Account. Prior to the receipt of the financial statements from the limited partnerships, the Account estimates the value of its interest in good faith and will from time to time seek input from the issuer or the sponsor of the investments. Since market quotations are not readily
available, the limited partnership interests are valued at fair value as determined in good faith by management under the direction of the Investment Committee of the Board and in accordance with the responsibilities of the Board as a whole. Valuation of Marketable Securities—Equity securities listed or traded on any national market or exchange are valued at the last sale price as of the close of the principal securities market or exchange on which such securities are traded or, if there is no sale, at the mean of the last bid and asked prices on such
market or exchange, exclusive of transaction costs. Debt securities, other than money market instruments, are generally valued at the most recent bid price or the equivalent quoted yield for such securities (or those of comparable maturity, quality and type). Money market instruments, with maturities of one year or less, are valued in the same manner as debt
securities or derived from a pricing matrix. Equity and fixed income securities traded on a foreign exchange or in foreign markets are valued using their closing values under the valuation methods generally accepted in the country where traded, as of the valuation date. This value is converted to U.S. dollars at the exchange rate in effect on the valuation
day. Under certain circumstances (for example, if there are significant movements in the United States markets and there is an expectation the securities traded on foreign markets will adjust based on such movements when the foreign markets open the next day), the Account may adjust the value of equity or fixed
income securities that trade on a foreign exchange or market after the foreign exchange or market has closed. Valuation of Mortgage Loans Payable—Mortgage loans payable are stated at fair value. The estimated fair value of mortgage loans payable are based on the amount at which the liability could be transferred to a third party exclusive of transaction costs. Mortgage loans payable are valued internally by TIAA’s
internal appraisal department, as reviewed by the Account’s independent fiduciary, at least quarterly based on market factors, such as market interest rates and spreads for comparable loans, the performance of the underlying collateral (such as the loan-to-value ratio and the cash flow of the underlying collateral),
the liquidity for mortgage loans of similar characteristics, the maturity date of the loan, and the return demands of the market. Interest expense for mortgage loans payable is recorded on the accrual basis taking into account the outstanding principal contractual interest rates and financing costs at the time mortgage
payables are entered into by the Account. Foreign currency transactions and translation: Portfolio investments and other assets and liabilities denominated in foreign currencies are translated into U.S. dollars at the exchange rates prevailing at the end of the period. Purchases and sales of securities, income receipts and expense payments made in foreign
currencies are translated into U.S. dollars at the exchange rates prevailing on the respective dates of the transactions. The effect of any changes in foreign currency exchange rates on portfolio investments and 56
mortgage loans payable are included in net realized and unrealized gains and losses on real estate properties and mortgage loans payable. Net realized gains and losses on foreign currency transactions include disposition of foreign currencies, and currency gains and losses between the accrual and receipt dates of
portfolio investment income and between the trade and settlement dates of portfolio investment transactions. Accumulation and Annuity Funds: The accumulation fund represents the net assets attributable to participants in the accumulation phase of their investment (“Accumulation Fund”). The annuity fund represents the net assets attributable to the participants currently receiving annuity payments (“Annuity
Fund”). The net increase or decrease in net assets from investment operations is apportioned between the accounts based upon their relative daily net asset values. Once an Account participant begins receiving lifetime annuity income benefits, payment levels cannot be reduced as a result of the Account’s adverse
mortality experience. In addition, the contracts pursuant to which the Account is offered are required to stipulate the maximum expense charge for all Account level expenses that can be assessed, which is not to exceed to 2.5% of average net assets per year. The Account pays a fee to TIAA to assume mortality
and expense risks. Accounting for Investments: The investments held by the Account are accounted for as follows: Real Estate Properties—Rent from real estate properties consists of all amounts earned under tenant operating leases, including base rent, recoveries of real estate taxes and other expenses and charges for miscellaneous services provided to tenants. Rental income is recognized in accordance with the billing terms
of the lease agreements. The Account bears the direct expenses of the real estate properties owned. These expenses include, but are not limited to, fees to local property management companies, property taxes, utilities, maintenance, repairs, insurance, and other operating and administrative costs. An estimate of
the net operating income earned from each real estate property is accrued by the Account on a daily basis and such estimates are adjusted when actual operating results are determined. Real Estate Joint Ventures—The Account has limited ownership interests in various real estate joint ventures (collectively, the “Joint Ventures”). The Account records its contributions as increases to its investments in the Joint Ventures, and distributions from the Joint Ventures are treated as income within
income from real estate joint ventures and limited partnerships in the Account’s consolidated statements of operations. Distributions that are identified as returns of capital or capital gains or losses are recorded as unrealized gains and realized gains and losses, respectively. Income from the Joint Ventures is
recorded based on the Account’s proportional interest of the income distributed by the Joint Ventures. Income earned by the Joint Venture, but not yet distributed to the Account by the Joint Ventures is recorded as unrealized gains and losses. Limited Partnerships—The Account has limited ownership interests in various private real estate funds (primarily limited partnerships) and a private real estate investment trust (collectively, the “Limited Partnerships”). The Account records its contributions as increases to the investments, and distributions from
the investments are treated as income within income from real estate joint ventures and limited partnerships in the Account’s consolidated statements of operations. Distributions that are identified as returns of capital or capital gains or losses are recorded as unrealized gains and realized gains and losses,
respectively. Unrealized gains and losses are recorded based upon the changes in the net asset values of the limited partnerships as determined from the financial statements of the limited partnerships when received by the Account. Prior to the receipt of the financial statements from the limited partnerships, the
Account estimates the value of its interest in good faith and will from time to time seek input from the issuer or the sponsor of the investment. Changes in value based on such estimates are recorded by the Account as unrealized gains and losses. Marketable Securities—Transactions in marketable securities are accounted for as of the date the securities are purchased or sold (trade date). Interest income is recorded as earned. Dividend income is recorded on the ex-dividend date within dividend income. Dividends that are identified as returns of capital or
capital gains or losses are recorded as unrealized gains and realized gains or losses, respectively. Realized gains and losses on securities transactions are accounted for on the specific identification method. Realized and Unrealized Gains and Losses—Unrealized gains and losses are recorded as the fair values of the Account’s investments are adjusted, and as discussed within the Real Estate Joint Ventures and limited partnership sections above. Realized gains and losses are recorded at the time an investment is sold
or a distribution is received from the Joint Ventures or limited partnerships. Real estate transactions are 57
accounted for as of the date on which the purchase or sale transactions for the real estate properties close (settlement date). The Account recognizes a realized gain on the sale of a real estate property to the extent that the contract sales price exceeds the cost-to-date of the property being sold. A realized loss
occurs when the cost-to-date exceeds the sales price. Net Assets—The Account’s net assets as of the close of each valuation day are valued by taking the sum of:
•
the value of the Account’s cash; cash equivalents, and short-term and other debt instruments; • the value of the Account’s other securities and other non-real estate assets; • the value of the individual real properties (based on the most recent valuation of that property) and other real estate-related investments owned by the Account; • an estimate of the net operating income accrued by the Account from its properties, other real estate-related investments and non real estate-related investments (including short-term marketable securities) since the end of the prior valuation day; and • actual net operating income earned from the Account’s properties, other real estate-related investments and non real estate-related investments (but only to the extent any such item of income differs from the estimated income accrued for on such investments). and then reducing the sum by liabilities held within the Account, including the daily investment management fee, administration and distribution fees and certain other expenses attributable to operating the Account. After the end of every quarter, the Account reconciles the amount of expenses deducted from the Account (which is established in order to approximate the costs that the Account will incur) with the expenses the Account actually incurred. If there is a difference, the Account adds it to or deducts it from the
Account in equal daily installments over the remaining days of the following quarter. Material differences may be repaid in the current calendar quarter. The Account’s at-cost deductions are based on projections of Account assets and overall expenses, and the size of any adjusting payments will be directly affected
by the difference between management’s projections and the Account’s actual assets or expenses. Federal Income Taxes: Based on provisions of the Internal Revenue Code, Section 817, the Account is taxed as a segregated asset account of TIAA and as such, the Account should incur no material federal income tax attributable to the net investment activity of the Account. New Accounting Pronouncements In May 2011, the FASB issued ASU No. 2011-04, “Amendments to Achieve Common Fair Value Measurements and Disclosure Requirements in U.S. GAAP and IFRSs” (“ASU 2011-04”), with the intention to converge fair value standards between U.S. GAAP and International Financial Reporting
Standards. This ASU is largely consistent with existing fair value measurement principles in U.S. GAAP, expands ASC 820’s existing disclosure requirements for fair value measurements and makes other amendments. The Account adopted ASU 2011-04 January 1, 2012. The adoption did not have an impact on the
Account’s consolidated financial position or results of operations. See Note 5—Assets and Liabilities Measured at Fair Value on a Recurring Basis to the consolidated financial statements included herewith for additional disclosures as a result of the adoption of ASU 2011-04. ITEM 3. QUANTITATIVE AND QUALITATIVE DISCLOSURES ABOUT MARKET RISK. The Account’s real estate holdings, including real estate joint ventures and limited partnerships, which, as of March 31, 2012, represented 74.7% of the Account’s total investments, expose the Account to a variety of risks. These risks include, but are not limited to:
•
General Real Estate Risk—The risk that the Account’s property values or rental and occupancy rates could go down due to general economic conditions, a weak market for real estate generally, disruptions in the credit and/or capital markets, or changing supply and demand for certain types of properties;
58
• Appraisal Risk—The risk that the sale price of an Account property (i.e., the value that would be determined by negotiations between independent parties) might differ substantially from its estimated or appraised value, leading to losses or reduced profits to the Account upon sale; • Risk Relating to Property Sales—The risk that the Account might not be able to sell a property at a particular time for its full value, particularly in a poor market. This might make it difficult to raise cash quickly and also could lead to Account losses; • Risks of Borrowing—The risk that interest rate changes may impact Account returns if the Account takes out a mortgage on a property, buys a property subject to a mortgage or holds a property subject to a mortgage; and • Foreign Currency Risk—The risk that the value of the Account’s foreign investments, related debt, or rental income could increase or decrease due to changes in foreign currency exchange rates or foreign currency exchange control regulations, and hedging against such changes, if undertaken by the Account,
may entail additional costs and be unsuccessful. The Account believes the diversification of its real estate portfolio, both geographically and by sector, along with its quarterly valuation procedure, helps manage the real estate and appraisal risks described above. As of March 31, 2012, 25.3% of the Account’s total investments was comprised of marketable securities. As of March 31, 2012, marketable securities include high-quality debt instruments (i.e., government agency notes) and REIT securities. The Statement of Investments for the Account sets forth the general
financial terms of these instruments, along with their fair values, as determined in accordance with procedures described earlier in Critical Accounting Policies section above and in Note 1–Organization and Significant Accounting Policies to the Account’s consolidated financial statements included herewith. The
Account’s marketable securities are considered held for trading purposes. Currently, the Account does not invest in derivative financial investments, nor does the Account engage in any hedging activity. Risks associated with investments in real estate-related liquid assets (which could include, from time to time, REIT securities and CMBS), and non-real estate-related liquid assets, include financial/credit risk, market volatility risk, interest rate volatility risk and deposit/money market risk.
Financial/Credit Risk—The risk, for debt securities, that the issuer will not be able to pay principal and interest when due (and/or declare bankruptcy or be subject to receivership) and, for equity securities such as common or preferred stock, that the issuer’s current earnings will fall or that its overall financial
soundness will decline, reducing the security’s value. • Market Volatility Risk—The risk that the Account’s investments will experience price volatility due to changing conditions in the financial markets regardless of the credit quality or financial condition of the underlying issuer. This risk is particularly acute to the extent the Account holds equity securities, which
have experienced significant short-term price volatility over the past year. Also, to the extent the Account holds debt securities, changes in overall interest rates can cause price fluctuations. • Interest Rate Volatility—The risk that interest rate volatility may affect the Account’s current income from an investment. • Deposit/Money Market Risk—The risk that, to the extent the Account’s cash held in bank deposit accounts exceeds federally insured limits as to that bank, the Account could experience losses if banks fail. The Account does not believe it has exposure to significant concentration of deposit risk. In addition,
there is some risk that investments held in money market accounts can suffer losses. In addition, to the extent the Account were to hold mortgage-backed securities (including commercial mortgage-backed securities) these securities are subject to prepayment risk or extension risk (i.e., the risk that borrowers will repay the loans earlier or later than anticipated). If the underlying mortgage assets
experience faster than anticipated repayments of principal, the Account could fail to recoup some or all of its initial investment in these securities, since the original price paid by the Account was based in part on assumptions regarding the receipt of interest payments. If the underlying mortgage assets are repaid
later than anticipated, the Account could lose the opportunity to reinvest the anticipated cash flows at a time when interest rates might be rising. The rate of prepayment depends on a variety of geographic, social and other functions, including prevailing market interest rates and general economic factors. The fair
value of these 59
•
securities is also highly sensitive to changes in interest rates. Note that the potential for appreciation, which could otherwise be expected to result from a decline in interest rates, may be limited by any increased prepayments. These securities may be harder to sell than other securities. In addition to these risks, real estate equity securities (such as REIT stocks and mortgage-backed securities) would be subject to many of the same general risks inherent in real estate investing, making mortgage loans and investing in debt securities. For more information on the risks associated with all of the
Account’s investments, see the Account’s most recent prospectus. ITEM 4. CONTROLS AND PROCEDURES. (a) The registrant maintains a system of disclosure controls and procedures that are designed to provide reasonable assurance that information required to be disclosed in the registrant’s reports under the Securities Exchange Act of 1934, as amended (the “Exchange Act”), is recorded, processed, summarized
and reported within the time periods specified in the SEC’s rules and forms, and that such information is accumulated and communicated to management, including the registrant’s Chief Executive Officer (“CEO”) and the Chief Financial Officer (“CFO”), as appropriate, to allow timely decisions regarding
required disclosure. Under the supervision and participation of the registrant’s management, including the registrant’s CEO and CFO, the registrant conducted an evaluation of the effectiveness of the registrant’s disclosure controls and procedures as defined in Rule 13a-15(e) under the Exchange Act as of March 31, 2012. Based
upon management’s review, the CEO and the CFO concluded that the registrant’s disclosure controls and procedures were effective as of March 31, 2012. (b) Changes in internal control over financial reporting. There have been no changes in the registrant’s internal control over financial reporting that occurred during the registrant’s last fiscal quarter that materially affected, or are reasonably likely to materially affect, the registrant’s internal control over
financial reporting. PART II. OTHER INFORMATION ITEM 1. LEGAL PROCEEDINGS. The Account is party to various claims and routine litigation arising in the ordinary course of business. Management of the Account does not believe that the results of any such claims or litigation, individually or in the aggregate, will have a material effect on the Account’s business, financial position or results
of operations. ITEM 1A. RISK FACTORS. There have been no material changes from our risk factors as previously reported in the Account’s Annual Report on Form 10-K for the year ended December 31, 2011. ITEM 2. UNREGISTERED SALES OF EQUITY SECURITIES AND USE OF PROCEEDS. Not applicable. ITEM 3. DEFAULTS UPON SENIOR SECURITIES. Not applicable. ITEM 4. [REMOVED AND RESERVED]. ITEM 5. OTHER INFORMATION. The Code of Ethics for TIAA’s senior financial officers, including its principal executive officer, principal financial officer, principal accounting officer, or controller, and persons performing similar functions, has been filed as an exhibit to the Account’s Annual Report on Form 10-K for the year ended
December 31, 2011 and can also be found on the following two web sites, http://www.tiaa-cref.org/ public/prospectuses/index.html and http://www.tiaa-cref.org/public/about/governance/corporate/annual-reports/ index.html. 60
ITEM 6. EXHIBITS
(1)
(A)
Distribution Agreement for the Contracts Funded by the TIAA Real Estate Account, dated as of January 1, 2008, by and among Teachers Insurance and Annuity Association of America, for itself and on behalf of the Account, and TIAA-CREF Individual & Institutional Services, LLC.5
(3)
(A)
Charter of TIAA.8
(B)
Restated Bylaws of TIAA (as amended).9
(4)
(A)
Forms of RA, GRA, GSRA, SRA, IRA Real Estate Account Endorsements2, Keogh Contract,3 Retirement Select and Retirement Select Plus Contracts and Endorsements1 and Retirement Choice and Retirement Choice Plus Contracts.3
(B)
Forms of Income-Paying Contracts2
(C)
Form of Contract Endorsement for Internal Transfer Limitation10
(D)
Form of Accumulation Contract11
(10)
(A)
Independent Fiduciary Agreement, dated February 22, 2006, by and among TIAA, the Registrant, and Real Estate Research Corporation4
(B)
Amendment to Independent Fiduciary Agreement, dated December 17, 2008, between TIAA, on behalf of the Registrant, and Real Estate Research Corporation6
(C)
Amended and Restated Independent Fiduciary Letter Agreement, dated as of November 23, 2011, between TIAA, on behalf of the Registrant, and Real Estate Research Corporation.12
(D)
Custodian Agreement, dated as of March 3, 2008, by and between TIAA, on behalf of the Registrant, and State Street Bank and Trust Company, N.A.7
*(31)
Rule 13(a)-15(e)/ Rule 13a-15(e)/15d-15(e) Certifications
*(32)
Section 1350 Certifications
**(101)
The following financial information from the Quarterly Report on Form 10-Q for the period ended March 31, 2012, formatted in XBRL (Extensible Business Reporting Language): (i) the Statements of Assets and Liabilities, (ii) the Statements of Operations, (iii) the Statements of Changes in Net
Assets, (iv) the Statements of Cash Flows, and (v) the Notes to the Financial Statements
*
Filed herewith. ** Furnished electronically herewith. (1) Previously filed and incorporated herein by reference to the Account’s Pre-Effective Amendment No. 1 to the Registration Statement on Form S-1 filed April 29, 2004 (File No. 333-113602). (2) Previously filed and incorporated herein by reference to the Account’s Post-Effective Amendment No. 2 to the Registration Statement on Form S-1 filed April 30, 1996 (File No. 33-92990). (3) Previously filed and incorporated herein by reference to the Account’s Post-Effective Amendment No. 1 to the Registration Statement on Form S-1 filed May 2, 2005 (File No. 333-121493). (4) Previously filed and incorporated herein by reference to Exhibit 10.(a) to the Annual Report on Form 10-K of the Account for the period ended December 31, 2005, filed with the Commission on March 15, 2006 (File No. 33-92990). (5) Previously filed and incorporated herein by reference to the Account’s Current Report on Form 8-K, filed with the Commission on January 7, 2008 (File No. 33-92990). (6) Previously filed and incorporated herein by reference to the Account’s Current Report on Form 8-K, filed with the Commission on December 22, 2008 (File No. 33-92990). (7) Previously filed and incorporated herein by reference to Exhibit 10.(b) to the Annual Report on Form 10-K of the Account for the fiscal year ended December 31, 2007 and filed with the Commission on March 20, 2008 (File No. 33-92990). (8) Previously filed and incorporated by reference to Exhibit 3(A) to the Account’s Quarterly Report on Form 10-Q for the quarter ended June 30, 2009 and filed with the Commission on August 13, 2009 (File No. 33-92990). (9) Previously filed and incorporated by reference to Exhibit 3(B) to the Account’s Quarterly Report on Form 10-Q for the quarter ended June 30, 2009 and filed with the Commission on August 13, 2009 (File No. 33-92990). (10) Previously filed and incorporated by reference to Exhibit 4(C) to the Account’s Quarterly Report on Form 10-Q for the quarter ended September 30, 2010 and filed with the Commission on November 12, 2010 (File No. 33-92990). (11) Previously filed and incorporated by reference to Exhibit 4(D) to the Account’s Pre-Effective Amendment No. 1 to the Registration Statement on Form S-1 filed April 27, 2011 (File No. 333-172900). (12) Previously filed and incorporated by reference to Exhibit 10.1 to the Account’s Current Report on Form 8-K, filed with the Commission on November 29, 2011 (File No. 33-92990). 61
SIGNATURES Pursuant to the requirements of the Securities Exchange Act of 1934, as amended, the registrant, TIAA Real Estate Account, has duly caused this Report to be signed on its behalf by the undersigned, thereunto duly authorized, in New York, New York, on the 10th day of May, 2012.
TIAA REAL ESTATE ACCOUNT
By:
TEACHERS INSURANCE AND ANNUITY
May 10, 2012
By:
/s/ Roger W. Ferguson, Jr.
Roger W. Ferguson, Jr.
May 10, 2012
By:
/s/ Virginia M. Wilson
Virginia M. Wilson 62
ASSOCIATION OF AMERICA
President and
Chief Executive Officer
Executive Vice President and
Chief Financial Officer