Attached files
| file | filename |
|---|---|
| EX-99.1 - EXHIBIT 99.1 - TIAA REAL ESTATE ACCOUNT | ex991093018.htm |
| 8-K - 8-K - TIAA REAL ESTATE ACCOUNT | tiaarealestate8-k93018.htm |
Exhibit 99.2 | |||||||||||||||||||||
TIAA Real Estate Account | |||||||||||||||||||||
As of 09/30/18 | |||||||||||||||||||||
Portfolio Strategies | |||||||||||||||||||||
Performance | Performance | ||||||||||||||||||||
This variable annuity account seeks to generate favorable total returns primarily through the rental income and appreciation of a diversified portfolio of directly held, private real estate and real estate-related investments while offering investors guaranteed, daily liquidity. The Account will also invest in non-real estate-related publicly traded securities and short-term, higher quality liquid investments that are easily converted to cash to enable the Account to meet participant redemption requests, purchase or improve properties or cover other expense needs. The Account intends to have between 75% and 85% of its net assets invested directly in real estate or real estate-related assets with the goal of producing favorable long-term returns. The Account’s principal strategy is to purchase direct ownership interests in income-producing properties, primarily office, industrial, retail and multi-family residential properties. The Account may also make foreign real estate investments. Under the Account’s investment guidelines, investments in direct foreign real estate, together with foreign real estate-related securities and foreign non-real estate-related liquid investments, may not comprise more than 25% of the Account’s net assets. The Account will invest the remaining portion of its assets (targeted between 15% and 25% of net assets) in publicly traded, liquid investments. | Total Return | Average Annual Total Return | Ticker | QREARX | |||||||||||||||||
Account Name | QTD | YTD | 1 Yr | 3 Yr | 5 Yr | 10 Yr | SI | Annuity Account Inception Date | 10/2/1995 | ||||||||||||
TIAA Real Estate Account | 1.17% | 3.80% | 5.14% | 5.02% | 7.05% | 2.99% | 6.31% | Portfolio Net Assets | $25.6 billion | ||||||||||||
Estimated Annual Expenses | 0.79% 1 | ||||||||||||||||||||
Calendar Year Performance | 2008 - 2017 | Revenue Share | 0.24 | % | |||||||||||||||||
2008 | 2009 | 2010 | 2011 | 2012 | 2013 | 2014 | 2015 | 2016 | 2017 | Manager Name | Team Managed | ||||||||||
TIAA Real Estate Account | -14.15% | -27.64% | 13.29% | 12.99% | 10.06% | 9.65% | 12.22% | 8.16% | 5.20% | 4.37% | Manager Tenure | 2.42 years | |||||||||
Properties by Region2 | As of 09/30/18 | ||||||||||||||||||||
Portfolio Characteristics | As of 09/30/18 | West | 39.5 | % | |||||||||||||||||
Fund | East | 34.3 | % | ||||||||||||||||||
Real Estate Property Investments | 146 | South | 23.8 | % | |||||||||||||||||
Property Lease Percent | 92.0 | % | Midwest | 2.4 | % | ||||||||||||||||
Property Loan to Value Percent | 17.7 | % | |||||||||||||||||||
Property Average Value (millions) | $144.8 | Properties by Type2 3 | As of 09/30/18 | ||||||||||||||||||
Property Maximum Value (millions) | $847.0 | Office | 38.1 | % | |||||||||||||||||
Property Minimum Value (millions) | $9.3 | Apartment | 24.1 | % | |||||||||||||||||
Retail | 19.7 | % | |||||||||||||||||||
Industrial | 14.7 | % | |||||||||||||||||||
Other | 3.4 | % | |||||||||||||||||||
 | 1 The Account’s total annual expense deduction appears in the Account’s prospectus, and may be different than that shown herein due to rounding. Please refer to the prospectus for further details. 2 Wholly owned properties are represented at fair value and gross of any debt, while joint venture properties are represented at the net equity value. 3 Other properties represents interest in Storage Portfolio investments, a fee interest encumbered by a ground lease real estate investment and land. | ||||||||||||||||||||
For Institutional Investor use only. Not for use with or distribution to the public. | |||||||||||||||||||||
TIAA Real Estate Account | ||||||||||||||||||||||
As of 09/30/18 | ||||||||||||||||||||||
Top 10 Holdings | As of 09/30/18 | Growth of $10,000 | 09/30/08-09/30/18 | |||||||||||||||||||
Fashion Show | 4.0 | % | 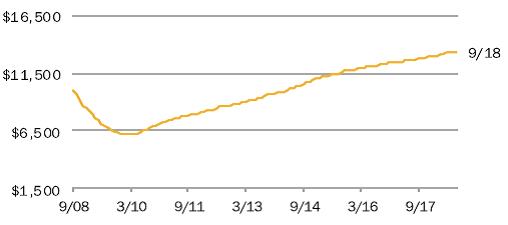 | nTIAA Real Estate Account | $13,428 | |||||||||||||||||
DDR | 3.9 | % | ||||||||||||||||||||
The Florida Mall | 3.0 | % | ||||||||||||||||||||
1001 Pennsylvania Avenue | 2.5 | % | The total returns are not adjusted to reflect sales charges, the effects of taxation or redemption fees, but are adjusted to reflect actual ongoing expenses, and assume reinvestment of dividends and capital gains, net of all recurring costs. | |||||||||||||||||||
Colorado Center | 1.9 | % | ||||||||||||||||||||
Fourth and Madison | 1.9 | % | ||||||||||||||||||||
99 High Street | 1.6 | % | ||||||||||||||||||||
425 Park Avenue | 1.5 | % | ||||||||||||||||||||
Four Oaks Place | 1.4 | % | ||||||||||||||||||||
780 Third Avenue | 1.3 | % | ||||||||||||||||||||
Total | 23.0 | % | ||||||||||||||||||||
Sector Allocation | As of 09/30/18 | |||||||||||||||||||||
Fund | ||||||||||||||||||||||
Real Estate Properties (Net Of Debt) | 49.1 | % | ||||||||||||||||||||
Real Estate Joint Venture And Limited Partnerships | 23.2 | % | ||||||||||||||||||||
Short Term Investments | 18.9 | % | ||||||||||||||||||||
Marketable Securities Real Estate Related | 5.6 | % | ||||||||||||||||||||
Loans Receivable | 3.3 | % | ||||||||||||||||||||
Other (Net Receivable/Liability) | (0.1 | %) | ||||||||||||||||||||
Real estate investment portfolio turnover rate was 2.7% for the year ended 12/31/2017. Real estate investment portfolio turnover rate is calculated by dividing the lesser of purchases or sales of real estate property investments (including contributions to, or return of capital distributions received from, existing joint venture and limited partnership investments) by the average value of the portfolio of real estate investments held during the period. Marketable securities portfolio turnover rate was 5.7% for the year ended 12/31/2017. Marketable securities portfolio turnover rate is calculated by dividing the lesser of purchases or sales of securities, excluding securities having maturity dates at acquisition of one year or less, by the average value of the portfolio securities held during the period. | ||||||||||||||||||||||
The risks associated with investing in the TIAA Real Estate Account include the risks associated with real estate ownership including among other things fluctuations in property values, higher expenses or lower income than expected, risks associated with borrowing and potential environmental problems and liability, as well as risks associated with participant flows and conflicts of interest. For a more complete discussion of these and other risks, please consult the prospectus. | ||||||||||||||||||||||
THIS MATERIAL MUST BE PRECEDED OR ACCOMPANIED BY A CURRENT PROSPECTUS FOR THE TIAA REAL ESTATE ACCOUNT. PLEASE CAREFULLY CONSIDER THE INVESTMENT OBJECTIVES, RISKS, CHARGES, AND EXPENSES BEFORE INVESTING AND CAREFULLY READ THE PROSPECTUS. ADDITIONAL COPIES OF THE PROSPECTUS CAN BE OBTAINED BY CALLING 877-518-9161. | ||||||||||||||||||||||
Teachers Insurance and Annuity Association of America (TIAA), New York, NY, issues annuity contracts and certificates. | ||||||||||||||||||||||
©2018 Teachers Insurance and Annuity Association of America-College Retirement Equities Fund, | ||||||||||||||||||||||
730 Third Avenue, New York, NY 10017 | For Institutional Investor use only. Not for use with or distribution to the public. | |||||||||||||||||||||