Attached files
| file | filename |
|---|---|
| EX-23.1 - EX-23.1 - UNIVERSAL STAINLESS & ALLOY PRODUCTS INC | usap-ex231_9.htm |
| EX-32.1 - EX-32.1 - UNIVERSAL STAINLESS & ALLOY PRODUCTS INC | usap-ex321_6.htm |
| EX-31.2 - EX-31.2 - UNIVERSAL STAINLESS & ALLOY PRODUCTS INC | usap-ex312_10.htm |
| EX-31.1 - EX-31.1 - UNIVERSAL STAINLESS & ALLOY PRODUCTS INC | usap-ex311_8.htm |
| EX-21.1 - EX-21.1 - UNIVERSAL STAINLESS & ALLOY PRODUCTS INC | usap-ex211_7.htm |
| EX-10.1 - EX-10.1 - UNIVERSAL STAINLESS & ALLOY PRODUCTS INC | usap-ex101_182.htm |
| EX-3.1 - EX-3.1 - UNIVERSAL STAINLESS & ALLOY PRODUCTS INC | usap-ex31_181.htm |
UNITED STATES
SECURITIES AND EXCHANGE COMMISSION
Washington, DC 20549
FORM 10-K
|
☒ |
ANNUAL REPORT PURSUANT TO SECTION 13 OR 15(d) OF THE SECURITIES EXCHANGE ACT OF 1934 |
For the Fiscal Year Ended December 31, 2017
OR
|
☐ |
TRANSITION REPORT PURSUANT TO SECTION 13 OR 15(d) OF THE SECURITIES EXCHANGE ACT OF 1934 |
Commission File Number 000-25032

UNIVERSAL STAINLESS & ALLOY PRODUCTS, INC.
(Exact name of Registrant as specified in its charter)
|
DELAWARE |
|
25-1724540 |
|
(State or other jurisdiction of incorporation or organization) |
|
(IRS Employer Identification No.) |
|
|
|
|
|
600 MAYER STREET, BRIDGEVILLE, PA 15017 |
|
(412) 257-7600 |
|
(Address of principal executive offices, including zip code) |
|
(Registrant’s telephone number, including area code) |
Securities registered pursuant to Section 12(b) of the Act:
|
Title of each class |
|
Name of exchange on which registered |
|
Common Stock, par value $0.001 per share |
|
The NASDAQ Stock Market, LLC |
Securities registered pursuant to Section 12(g) of the Act: [None]
Indicate by check mark if the registrant is a well-known seasoned issuer, as defined in Rule 405 of the Securities Act. Yes ☐ No ☒
Indicate by check mark if the registrant is not required to file reports pursuant to Section 13 or Section 15(d) of the Act. Yes ☐ No ☒
Indicate by check mark whether the registrant (1) has filed all reports required to be filed by Section 13 or 15(d) of the Securities Exchange Act of 1934 during the preceding 12 months (or for such shorter period that the registrant was required to file such reports), and (2) has been subject to such filing requirements for the past 90 days. Yes ☒ No ☐
Indicate by check mark whether the registrant has submitted electronically and posted on its corporate website, if any, every Interactive Data file required to be submitted and posted pursuant to Rule 405 of Regulation S-T during the preceding 12 months (or for such shorter period that the registrant was required to submit and post such files). Yes ☒ No ☐
Indicate by check mark if disclosure of delinquent filers pursuant to Item 405 of Regulation S-K (§229.405 of this chapter) is not contained herein, and will not be contained, to the best of registrant’s knowledge, in definitive proxy or information statements incorporated by reference in Part III of this Form 10-K or any amendment to this Form 10-K. ☐
Indicate by check mark whether the registrant is a large accelerated filer, an accelerated filer, a non-accelerated filer, a smaller reporting company or an emerging growth company. See the definitions of “large accelerated filer”, “accelerated filer,” “smaller reporting company” and “emerging growth company” in Rule 12b-2 of the Exchange Act. (Check One)
|
Large accelerated filer |
☐ |
Accelerated filer |
☒ |
|
|
|
|
|
|
Non-accelerated filer |
☐ (Do not check if a smaller reporting company) |
Smaller reporting company |
☐ |
Emerging growth company ☐
If an emerging growth company, indicate by check mark if the registrant has elected not to use the extended transition period for complying with any new or revised financial accounting standards provided pursuant to Section 13(a) of the Exchange Act. ☐
Indicate by check mark whether the registrant is a shell company (as defined in Rule 12b-2 of the Act). Yes ☐ No ☒
The aggregate market value of the voting stock held by non-affiliates of the registrant on June 30, 2017, based on the closing price of $19.50 per share on that date, was approximately $134,934,735. For the purposes of this disclosure only, the registrant has assumed that its directors and executive officers, are the affiliates of the registrant. The registrant has made no determination that such persons are “affiliates” within the meaning of Rule 405 under the Securities Act of 1933.
As of February 21, 2018, there were 7,259,912 shares of the registrant’s common stock outstanding.
DOCUMENTS INCORPORATED BY REFERENCE Part III of this Form 10-K incorporates by reference portions of the Company’s definitive Proxy Statement for the 2018 Annual Meeting of Stockholders.
|
|
|
|
|
|
|
|
|
|
|
Item 1. |
|
1 |
|
|
|
|
|
|
|
Item 1A. |
|
5 |
|
|
|
|
|
|
|
Item 1B. |
|
9 |
|
|
|
|
|
|
|
Item 2. |
|
9 |
|
|
|
|
|
|
|
Item 3. |
|
9 |
|
|
|
|
|
|
|
Item 4. |
|
9 |
|
|
|
|
|
|
|
|
|
|
|
|
|
|
|
|
|
Item 5. |
|
10 |
|
|
|
|
|
|
|
Item 6. |
|
12 |
|
|
|
|
|
|
|
Item 7. |
Management's Discussion and Analysis of Financial Condition and Results of Operations |
|
13 |
|
|
|
|
|
|
Item 7A. |
|
25 |
|
|
|
|
|
|
|
Item 8. |
|
26 |
|
|
|
|
|
|
|
Item 9. |
Changes in and Disagreements with Accountants on Accounting and Financial Disclosure |
|
50 |
|
|
|
|
|
|
Item 9A. |
|
50 |
|
|
|
|
|
|
|
Item 9B. |
|
50 |
|
|
|
|
|
|
|
|
|
|
|
|
|
|
|
|
|
Item 10. |
|
51 |
|
|
|
|
|
|
|
Item 11. |
|
51 |
|
|
|
|
|
|
|
Item 12. |
Security Ownership of Certain Beneficial Owners and Management and Related Stockholder Matters |
|
51 |
|
|
|
|
|
|
Item 13. |
Certain Relationships and Related Transactions, and Director Independence |
|
52 |
|
|
|
|
|
|
Item 14. |
|
52 |
|
|
|
|
|
|
|
|
|
|
|
|
|
|
|
|
|
Item 15. |
|
53 |
|
|
|
|
|
|
|
Item 16. |
|
56 |
i
CAUTIONARY STATEMENT FOR PURPOSES OF THE "SAFE HARBOR" PROVISIONS OF THE PRIVATE SECURITIES LITIGATION REFORM ACT OF 1995
The statements contained in this Annual Report on Form 10-K (“Form 10-K”) of Universal Stainless & Alloy Products, Inc. (“Universal,” the “Company,” “us,” “our,” or “we”), including, but not limited to, the statements contained in Item 1, “Business,” and Item 7, “Management's Discussion and Analysis of the Financial Condition and Results of Operations,” along with statements contained in other reports that we have filed with the Securities and Exchange Commission (the “SEC”), external documents and oral presentations, which are not historical facts are considered to be "forward-looking statements" within the meaning of Section 27A of the Securities Act of 1933, as amended, and Section 21E of the Securities Act of 1934, as amended. These statements which may be expressed in a variety of ways, including the use of forward looking terminology such as “believe,” “expect,” “seek,” “intend,” “may,” “will,” “should,” “could,” “potential,” “continue,” “estimate,” “plan,” or “anticipate,” or the negatives thereof, other variations thereon or compatible terminology, relate to, among other things, statements regarding future growth, cost savings, expanded production capacity, broader product lines, greater capacity to meet customer quality reliability, price and delivery needs, enhanced competitive posture, and the effect of new accounting pronouncements. We do not undertake any obligation to publicly update any forward-looking statements.
These forward-looking statements, and any forward looking statements contained in other public disclosures of the Company which make reference to the cautionary factors contained in this Form 10-K, are based on assumptions that involve risks and uncertainties and are subject to change based on the considerations described below. We discuss many of these risks and uncertainties in greater detail in Item 1A, “Risk Factors,” of this Form 10-K. These and other risks and uncertainties may cause our actual results, performance or achievements to differ materially from anticipated future results, performance or achievements expressed or implied by such forward-looking statements.
Universal, which was incorporated in 1994, and its wholly-owned subsidiaries, manufacture and market semi-finished and finished specialty steel products, including stainless steel, nickel alloys, tool steel and certain other premium alloyed steels. Our manufacturing process involves melting, remelting, heat treating, hot and cold rolling, forging, machining and cold drawing of semi-finished and finished specialty steels. Our products are sold to service centers, forgers, rerollers, original equipment manufacturers (“OEMs”) and wire redrawers. Our customers further process our products for use in a variety of industries, including the aerospace, power generation, oil and gas, heavy equipment and general industrial markets. We also perform conversion services on materials supplied by customers.
We operate in four locations: Bridgeville and Titusville, Pennsylvania; Dunkirk, New York; and North Jackson, Ohio. Our corporate headquarters is located at our Bridgeville location. We operate these four manufacturing locations as one reportable business segment.
We produce a wide variety of specialty steel grades using several manufacturing processes including argon oxygen decarburization (“AOD”), electro-slag remelted (“ESR”), vacuum induction melting (“VIM”) and vacuum-arc remelted (“VAR”). At our Bridgeville and North Jackson facilities, we produce specialty steel products in the form of semi-finished and finished long products (ingots, blooms, billets and bars). In addition, the Bridgeville facility produces flat rolled products (slabs and plates). Semi-finished long products are primarily used by our Dunkirk facility and certain customers to produce finished bar, rod, and wire products. Finished bar products that we manufacture are primarily used by OEMs and by service center customers for distribution to a variety of end users. We also produce customized shapes primarily for OEMs that are cold rolled from purchased coiled strip, flat bar or extruded bar at our precision rolled products department, located at our Titusville facility.
INDUSTRY OVERVIEW
The specialty steel industry is a relatively small but distinct segment of the overall steel industry. Specialty steels include stainless steels, nickel alloys, tool steels, electrical steels, high-temperature alloys, magnetic alloys and electronic alloys. Specialty steels are made with a high alloy content, suitable for use in environments that demand exceptional hardness, toughness, strength and resistance to heat, corrosion or abrasion, or combinations thereof. Specialty steels generally must conform to more demanding customer specifications for consistency, straightness and surface finish than carbon steels. For the years ended December 31, 2017, 2016 and 2015, approximately 69% or more of our net sales were derived from stainless steel products.
1
We primarily manufacture our products within the following product lines and, generally, in response to customer orders:
Stainless Steel. Stainless steel, which represents the largest part of the specialty steel market, contains elements such as nickel, chrome and molybdenum that give it the unique qualities of high strength, good wear characteristics, natural attractiveness, ease of maintenance and resistance to corrosion and heat. Stainless steel is used, among other applications, in the aerospace, oil and gas, power generation and automotive industries, as well as in the manufacturing of equipment for food handling, health and medical, chemical processing and pollution control.
High-Strength Low Alloy Steel. High-strength low alloy steel is a relative term that refers to those steels that maintain alloying elements that range in versatility. The alloy elements of nickel, chrome and molybdenum in such steels typically exceeds the alloy element of carbon steels but not that of high-temperature alloy steel. High-strength low alloy steels are manufactured for use generally in the aerospace industry.
Tool Steel. Tool steels contain elements of nickel, chrome and molybdenum to produce specific hardness characteristics that enable tool steels to form, cut, shape and shear other materials in the manufacturing process. Heating and cooling at precise rates in the heat-treating process bring out these hardness characteristics. Tool steels are utilized in the manufacturing of metals, plastics, paper and aluminum extrusions, pharmaceuticals, electronics and optics.
High-Temperature Alloy Steel. These steels are designed to meet critical requirements of heat resistance and structural integrity. They generally have very high nickel content relative to other types of specialty steels. High-temperature alloy steels are manufactured for use generally in the aerospace industry.
Our net sales by principal product line were as follows:
|
|
2017 |
|
|
2016 |
|
|
2015 |
|
|||||||
|
(dollars in thousands) |
|
|
|
|
|
|
|
|
|
|
|
|
|
|
|
|
Stainless steel |
|
$ |
|
139,603 |
|
|
$ |
|
112,118 |
|
|
$ |
|
135,945 |
|
|
High-strength low alloy steel |
|
|
|
15,693 |
|
|
|
|
13,180 |
|
|
|
|
16,045 |
|
|
Tool steel |
|
|
|
32,279 |
|
|
|
|
19,179 |
|
|
|
|
16,197 |
|
|
High-temperature alloy steel |
|
|
|
12,435 |
|
|
|
|
6,057 |
|
|
|
|
7,557 |
|
|
Conversion services and other sales |
|
|
|
2,633 |
|
|
|
|
3,900 |
|
|
|
|
4,916 |
|
|
Total net sales |
|
$ |
|
202,643 |
|
|
$ |
|
154,434 |
|
|
$ |
|
180,660 |
|
RAW MATERIALS
We depend on the delivery of key raw materials for our day-to-day operations. These key raw materials are carbon and stainless scrap metal and alloys, primarily consisting of nickel, chrome, molybdenum, and copper. Scrap metal is primarily generated by industrial sources and is purchased through a number of scrap brokers and processors. We also recycle scrap metal generated from our own production operations as a source of metal for our melt shops. Alloys are generally purchased from domestic agents and originate in the United States, Australia, Canada, China, Russia, South America and South Africa.
Our Bridgeville and North Jackson facilities currently supply semi-finished specialty steel products as starting materials to our other operating facilities. Semi-finished specialty steel starting materials, which we cannot produce at a competitive cost, are purchased from other suppliers. We generally purchase these starting materials from steel strip coil suppliers, extruders, flat rolled producers and service centers. We believe that adequate supplies of starting material will continue to be available.
The cost of raw materials represents approximately 45% of the cost of products sold in 2017, and approximately 40% and 50%, respectively, of the cost of products sold in 2016 and 2015. Raw material costs can be impacted by significant price changes. Raw material prices vary based on numerous factors, including quality, and are subject to frequent market fluctuations. Future raw material prices cannot be predicted with any degree of certainty. We do not maintain any fixed-price long-term agreements with any of our raw material suppliers.
2
We maintain a sales price surcharge mechanism on certain of our products to match sales prices to raw material price changes. For certain products, the surcharge is calculated at the time of order entry, based on current raw material prices or prices at the time of shipment. For certain finished products, the surcharge is calculated based on the monthly average raw material prices two months prior to the promised ship date.
CUSTOMERS
Our largest customer in 2017, Reliance Steel & Aluminum Co., accounted for approximately 17%, 20% and 16% of our net sales for the years ended December 31, 2017, 2016 and 2015, respectively. No other customer accounted for more than 10% of our net sales for the years ended December 31, 2017, 2016 and 2015. International sales approximated 9% of 2017, 2016 and 2015 annual net sales.
BACKLOG
Our backlog of orders (excluding surcharges) on hand as of December 31, 2017 was approximately $77.7 million compared to approximately $43.8 million at December 31, 2016. We believe that this 77.4% increase in our backlog is largely a result of increased demand for our products due to an improved market and to a lesser extent market share gains. Our backlog may not be indicative of actual sales because certain surcharges are not determinable until the order is shipped to the customer and, therefore, should not be used as a direct measure of future revenue. However, we expect that our actual sales will be higher than the backlog once the actual surcharges are determined.
COMPETITION
Competition in our markets is based upon product quality, delivery capability, customer service, customer approval and price. Maintaining high standards of product quality, while responding quickly to customer needs and keeping production costs at competitive levels, is essential to our ability to compete in these markets.
We believe that there are several companies that manufacture one or more similar specialty steel products that are significant competitors. There are a few smaller producing companies and material converters that are also considered to be competitors of ours.
High import penetration of specialty steel products, especially stainless and tool steels, also impacts the competitive nature within the United States. Unfair pricing practices by foreign producers have resulted in high import penetration into the U.S. markets in which we participate.
EMPLOYEE RELATIONS
We consider the maintenance of good relations with our employees to be important to the successful conduct of our business. We have profit-sharing plans for certain salaried and hourly employees and for all of our employees represented by United Steelworkers (the “USW”) and have equity ownership programs for all of our eligible employees, in an effort to forge an alliance between our employees’ interests and those of our stockholders. At December 31, 2017, 2016 and 2015, we had 703, 645, and 634 employees, respectively, of which 564, 508, and 449, respectively, were USW members.
Collective Bargaining Agreements
Our Bridgeville, Titusville, Dunkirk and North Jackson facilities recognize the USW as the exclusive representative for their hourly employees with respect to the terms and conditions of their employment. On March 4, 2016, the USW was certified as the exclusive bargaining representative for the hourly employees of our North Jackson facility. The Company and the USW are currently negotiating the initial collective bargaining agreement for the North Jackson hourly employees. The following collective bargaining agreements are currently in place:
|
Facility |
|
Commencement Date |
|
Expiration Date |
|
Dunkirk |
|
November 2017 |
|
October 2022 |
|
Bridgeville |
|
September 2013 |
|
August 2018 |
|
Titusville |
|
October 2015 |
|
September 2020 |
We believe a critical component of our collective bargaining agreements is the inclusion of a profit sharing plan.
3
We maintain a 401(k) retirement plan for our hourly and salaried employees. Pursuant to the 401(k) plan, participants may elect to make pre-tax and after-tax contributions, subject to certain limitations imposed under the Internal Revenue Code of 1986, as amended. In addition, we make periodic contributions to the 401(k) plan for the hourly employees employed at the Dunkirk and Titusville facilities, based on service, and at the North Jackson facility, based upon the employee’s age and wage rate. We make periodic contributions for the salaried employees at all locations, except for North Jackson, based upon their service and their individual contribution to the 401(k) retirement plan. For North Jackson salaried employees, we make periodic contributions based upon the employee’s age, annual salary, and their individual contributions.
We participate in the Steelworkers Pension Trust (the “Trust”), a multi-employer defined-benefit pension plan that is open to all hourly and salaried employees associated with the Bridgeville facility. We make periodic contributions to the Trust based on hours worked at a fixed rate for each hourly employee and a fixed monthly contribution on behalf of each salaried employee.
We also provide group life and health insurance plans for our hourly and salary employees.
Employee Stock Purchase Plan
Under the 1996 Employee Stock Purchase Plan, as amended (the “Plan”), the Company is authorized to issue up to 300,000 shares of common stock to its full-time employees, nearly all of whom are eligible to participate. Under the terms of the Plan, employees can choose as of January 1 and July 1 of each year to have up to 10% of their total earnings withheld to purchase up to 100 shares of our common stock each six-month period. The purchase price of the stock is 85% of the lower of its beginning-of-the-period or end-of-the-period market prices. At December 31, 2017, we have issued 212,089 shares of common stock since the Plan’s inception.
ENVIRONMENTAL
We are subject to federal, state and local environmental laws and regulations (collectively, “Environmental Laws”), including those governing discharges of pollutants into the air and water, and the generation, handling and disposal of hazardous and non-hazardous substances. We monitor our compliance with applicable Environmental Laws and, accordingly, believe that we are currently in compliance with all laws and regulations in all material respects. We are subject periodically to environmental compliance reviews by various regulatory offices. We may be liable for the remediation of contamination associated with generation, handling and disposal activities. Environmental costs could be incurred, which may be significant, related to environmental compliance, at any time or from time to time in the future.
EXECUTIVE OFFICERS
The following table sets forth, as of February 23, 2018, certain information with respect to the executive officers of the Company:
|
Name (Age) |
|
Executive Officer Since |
|
Position |
|
|
|
|
|
|
|
Dennis M. Oates (65) |
|
2008 |
|
Chairman, President and Chief Executive Officer |
|
|
|
|
|
|
|
Christopher M. Zimmer (44) |
|
2010 |
|
Executive Vice President and Chief Commercial Officer |
|
|
|
|
|
|
|
Paul A. McGrath (66) |
|
1996 |
|
Vice President of Administration, General Counsel and Secretary |
|
|
|
|
|
|
|
Graham McIntosh, Ph.D. (55) |
|
2015 |
|
Vice President and Chief Technology Officer |
|
|
|
|
|
|
Dennis M. Oates has been President and Chief Executive Officer of the Company since 2008. Mr. Oates was named to the Company’s Board of Directors in 2007. Mr. Oates previously served as Senior Vice President of the Specialty Alloys Operations of Carpenter Technology Corporation from 2003 to 2007. Mr. Oates also served as President and Chief Executive Officer of TW Metals, Inc. from 1998 to 2003. In May 2010, the Board of Directors elected Mr. Oates to the additional position of Chairman.
4
Christopher M. Zimmer has been Executive Vice President and Chief Commercial Officer since July 2014. Mr. Zimmer served as Vice President of Sales and Marketing from 2008 to July 2014. Mr. Zimmer previously served as Vice President of Sales and Marketing for Schmoltz+Bickenbach USA from 1995 to 2008. He held positions of increasing responsibility including inside sales, Commercial Manager—stainless bar, General Manager—nickel alloy products, and National Sales Manager.
Paul A. McGrath has been Vice President of Administration of the Company since 2007, General Counsel since 1995 and was appointed Secretary in 1996. Mr. McGrath served as Vice President of Operations from 2001 to 2006. Previously, he was employed by Westinghouse Electric Corporation for approximately 24 years in various management positions.
Graham McIntosh, Ph.D. has been Vice President and Chief Technology Officer since November 2015. Dr. McIntosh previously served as Director of Global Technology Initiatives for Carpenter Technology Corporation where he joined in 2008. Dr. McIntosh also served as Vice President of Technology and Director of Quality for Firth Rixson Viking from 2001 to 2008, and also held several management and technical positions at Wyman-Gordon Livingston from 1987-2001, where he began his career.
The Company is actively recruiting a Chief Financial Officer.
PATENTS AND TRADEMARKS
We do not consider our business to be materially dependent on patent or trademark protection, and believe we own or maintain effective licenses covering all the intellectual property used in our business. We benefit from our proprietary rights relating to designs, engineering and manufacturing processes and procedures. We seek to protect our proprietary information by use of confidentiality and non-competition agreements with certain employees.
AVAILABLE INFORMATION
Copies of our Annual Report on Form 10-K, Quarterly Reports on Form 10-Q, current reports on Form 8-K, and any amendments to those reports, as well as proxy and information statements that we file with the SEC, are available free of charge on our website at www.univstainless.com as soon as reasonably practicable after such reports are filed with the SEC. The contents of our website are not part of this Form 10-K. Copies of these documents will be available to any shareholder upon request. Requests should be directed in writing to Investor Relations at 600 Mayer Street, Bridgeville, PA 15017. You also may read and copy any materials we file with the SEC at the SEC’s Public Reference Room at 100 F Street, NE, Washington, DC 20549. You may obtain information on the operation of the Public Reference Room by calling the SEC at 1-800-SEC-0330. The SEC maintains an Internet site at www.sec.gov that contains reports, proxy and information statements and other information regarding issuers, like us, that file electronically with the SEC.
We wish to caution each reader of this Form 10-K to consider the following factors and other factors discussed herein and in other past reports, including but not limited to prior year Form 10-K and Form 10-Q reports filed with the SEC. Our business and results of operations could be materially affected by any of the following risks. The factors discussed herein are not exhaustive. Therefore, the factors contained herein should be read together with other reports that we file with the SEC from time to time, which may supplement, modify, supersede, or update the factors listed in this document.
A substantial amount of our sales are derived from a limited number of customers.
Our five largest customers in the aggregate accounted for approximately 41% of our net sales for the year ended December 31, 2017, and 42% of our net sales for the years ended December 31, 2016 and 2015. The accounts receivable balance from these five customers comprised approximately 35% of total accounts receivable at December 31, 2017. An adverse change in, or termination of, the relationship with one or more of our customers or market segments could have a material adverse effect on our results of operations.
5
Our business is very competitive, and increased competition could reduce our sales.
We compete with domestic and foreign producers of specialty steel products. In addition, many of the finished products sold by our customers are in direct competition with finished products manufactured by foreign sources, which may affect the demand for those customers’ products. Any competitive factors that adversely affect the market for finished products manufactured by us or our customers could indirectly adversely affect the demand for our semi-finished products. Additionally, our products compete with products fashioned from alternative materials such as aluminum, composites and plastics, the production of which includes domestic and foreign enterprises. Competition in our field is intense and is expected to continue to be so in the foreseeable future. A majority of our business is not covered under long term supply contracts. There can be no assurance that we will be able to compete successfully in the future.
A substantial amount of our sales are derived from the aerospace industry.
Approximately 55% of our sales and 42% of our tons shipped represented products sold to customers in the aerospace market in 2017. The aerospace market is historically cyclical due to both external and internal market factors. These factors include general economic conditions, supply chain fluctuations, diminished credit availability, airline profitability, demand for air travel, age of fleets, varying fuel and labor costs, price competition, new technology development and international and domestic political conditions such as military conflict and the threat of terrorism. The length and degree of cyclical fluctuation can be influenced by any one or a combination of these factors and therefore are difficult to predict with certainty. While the aerospace industry is currently experiencing growth, a downturn in the aerospace industry would adversely affect the demand for products and/or the prices at which we are able to sell our products, and our results of operations, business and financial condition could be materially adversely affected.
Our business may be harmed by failure to develop, commercialize, market and sell new applications and new products.
We believe that our alloys and metallurgical manufacturing expertise provide us with a competitive advantage over other high-performance alloy producers. Our ability to maintain this competitive advantage depends on our ability to continue to offer products that have equal or better performance characteristics than competing products at competitive prices. Our future growth will depend, in part, on our ability to address the increasingly demanding needs of our customers by enhancing the properties of our existing alloys, by timely developing new applications for our existing products, and by timely developing, commercializing, marketing and selling new products. If we are not successful in these efforts, or if our new products and product enhancements do not adequately meet the requirements of the marketplace and achieve market acceptance, our business could be adversely affected.
Our business requires continuing efforts to obtain new customer approvals on existing products and applications, which is a stringent, difficult process subject to each customer’s varying approval methodology and preferences. If we are not successful in these efforts, our business could be adversely affected.
We are dependent on the availability and price of raw materials and operating supplies.
We purchase carbon and stainless scrap metal and alloy additives, principally nickel, chrome, molybdenum, manganese and copper, for our melting operation. A substantial portion of the alloy additives is available only from foreign sources, some of which are located in countries that may be subject to unstable political and economic conditions. Those conditions might disrupt supplies or affect the prices of the raw materials. We maintain sales price surcharges on certain of our products to help offset the impact of raw material price fluctuations.
We do not maintain long-term fixed-price supply agreements with any of our raw material suppliers. If our supply of raw materials were interrupted, we might not be able to obtain sufficient quantities of raw materials, or obtain sufficient quantities of such materials at satisfactory prices, which, in either case, could adversely affect our results of operations. In addition, significant volatility in the price of our principal raw materials could adversely affect our financial results and there can be no assurance that the raw material surcharge mechanism employed by us will completely offset immediate changes in our raw material costs.
6
Our production processes require consumable operating supplies, such as electrodes, which have increased in price significantly compared to prior years. Significant volatility in the price of our consumable operating supplies could adversely affect our financial results.
Our business requires substantial amounts of energy.
The manufacturing of specialty steel is an energy-intensive process and requires the ready availability of substantial amounts of electricity and natural gas, for which we negotiate competitive supply agreements. While we believe that our energy agreements allow us to compete effectively within the specialty steel industry, the potential for increased costs exists during periods of high demand or supply disruptions. We have a sales price surcharge to help offset the cost fluctuations.
We are subject to risks associated with global economic and market factors.
Our results of operations are affected directly by the level of business activity of our customers, which in turn is affected by global economic and market factors impacting the industries and markets that we serve. We are susceptible to macroeconomic downturns in the United States and abroad that may affect the general economic climate, our performance and the demand of our customers. We may face significant challenges if conditions in the financial markets deteriorate. There can be no assurance that global economic and market conditions will not adversely impact our results of operations, cash flow or financial position in the future.
Our business depends largely on our ability to attract and retain key personnel.
We depend on the continued service, availability and ability to attract skilled personnel, including members of our executive management team, other management positions, and metallurgists, along with maintenance and production positions. Our inability to attract and retain such people may adversely impact our ability to fill existing roles and support growth. Attraction and retention of qualified personnel has become more challenging as the labor market tightens.
Further, the loss of key personnel could adversely affect our ability to perform until suitable replacements can be found. The Company is currently using qualified temporary resources to maintain its effectiveness and internal control environment within the Finance function while a new Chief Financial Officer is being actively recruited.
Our business may be harmed by strikes or work stoppages.
At December 31, 2017, we had 513 employees, out of a total of 703, who were covered under collective bargaining agreements expiring at various dates in 2018 to 2022. On March 4, 2016, the USW was certified as the exclusive bargaining representative for the hourly employees of our North Jackson facility. The Company and the Union are currently negotiating the initial collective bargaining agreement for the North Jackson hourly employees. There can be no assurance that we will be successful in timely concluding collective bargaining agreements with the USW to succeed the agreements that expire, in which case, we may experience strikes or work stoppages that may have a material adverse impact on our results of operations.
Our business may be harmed by failures on critical manufacturing equipment.
Our manufacturing processes are dependent upon certain critical pieces of specialty steel making equipment, such as our 50-ton electric-arc furnace and AOD vessel, our ESR, VIM and VAR furnaces, our radial hydraulic forge and our universal rolling mill. In the event a critical piece of equipment should become inoperative as a result of unexpected equipment failure, there can be no assurance that our operations would not be substantially curtailed, which may have a negative effect on our financial results.
7
Our business may be harmed if we are unable to meet our debt service requirements or the covenants in our credit agreement or if interest rates increase.
We have debt upon which we are required to make scheduled interest and principal payments, and we may incur additional debt in the future. A significant portion of our debt bears interest at variable rates that may increase in the future. Our ability to satisfy our debt obligations, and our ability to refinance any of our indebtedness in the future if we determine that doing so would be advisable, will depend upon our future operating performance, which will be affected by prevailing economic conditions in the markets that we serve and financial, business and other factors, many of which are beyond our control. If we are unable to generate sufficient cash to service our debt or if interest rates increase, our results of operations and financial condition could be adversely affected. Our credit agreement, which provides for a $65.0 million senior secured revolving credit facility and a $30.0 million senior secured term loan facility, also requires us to comply with certain covenants. A failure to comply with the covenants contained in the credit agreement could result in a default, which, if not waived by our lenders, could substantially increase our borrowing costs and result in acceleration of our debt. As of December 31, 2017, we were in compliance with the covenants in our credit agreement.
We believe that our international sales are associated with various risks.
We conduct business with suppliers and customers in foreign countries which exposes us to risks associated with international business activities. We could be significantly impacted by those risks, which include the potential for volatile economic and labor conditions, political instability, collecting accounts receivable and exchange rate fluctuations (which may affect sales revenue to international customers and the margins on international sales when converted into U.S. dollars).
If we are unable to protect our information technology infrastructure against service interruptions, data corruption, cyber-based attacks or network security beaches, our operations could be disrupted.
We rely on information technology networks and systems to manage and support a variety of business activities, including procurement and supply chain, engineering support, and manufacturing. Our information technology systems, some of which are managed by third-parties, may be susceptible to damage, disruptions or shutdown due to failures during the process of upgrading or replacing software, databases or components thereof, power outages, hardware failures, computer viruses, attacks by computer hackers, telecommunications failures, user errors or catastrophic events. In addition, security breaches could result in unauthorized disclosures of confidential information. If our information technology systems suffer severe damage, disruption or shutdown and our business continuity plans do not effectively resolve the issues in a timely manner, our manufacturing process could be disrupted resulting in late deliveries or even no deliveries if there is a total shutdown.
Changes in tax rules and regulations, or interpretations thereof, may adversely affect our effective tax rates.
We are a U.S. based company with customers and suppliers in foreign countries. We import various raw materials used in our production processes and we export goods to our foreign customers. The United States, the European Commission, countries in the EU and other countries where we do business have been implemented and may consider further changes in relevant tax, border tax, accounting and other laws, regulations and interpretations, that may unfavorably impact our effective tax rate or result in other costs to us.
Our business subjects us to risk of litigation claims, as a routine matter, and this risk increases the potential for a loss that might not be covered by insurance.
Litigation claims may relate to the conduct of our business, including claims relating to product liability, commercial disputes, employment actions, employee benefits, compliance with domestic and federal laws and personal injury. Due to the uncertainties of litigation, we might not prevail on claims made against us in the lawsuits that we currently face, and additional claims may be made against us in the future. The outcome of litigation cannot be predicted with certainty, and some of these lawsuits, claims or proceedings may be determined adversely to us. The resolution in any reporting period of one or more of these matters could have a material adverse effect on our business.
8
None.
We own our Bridgeville, Pennsylvania facility, which consists of approximately 760,000 square feet of floor space and our executive offices on approximately 74 acres. The Bridgeville facility contains melting, remelting, conditioning, rolling, annealing and various other processing equipment. Substantially all products shipped from the Bridgeville facility are processed through its melt shop and universal rolling mill operations.
We own our North Jackson, Ohio facility, which consists of approximately 257,000 square feet of floor space on approximately 110 acres. The North Jackson facility contains melting, remelting, forging, annealing and various other processing operations. Our obligations under our credit agreement, which is more fully described under Item 7, “Management’s Discussion and Analysis of Financial Condition and Results of Operations - Liquidity and Capital Resources,” are collateralized by a first lien on our real property in North Jackson, Ohio. Also, our obligations under the Notes, also more fully described under Item 7, “Management’s Discussion and Analysis of Financial Condition and Results of Operations - Liquidity and Capital Resources,” are collateralized by a second lien on our North Jackson, Ohio real property.
We own our Dunkirk, New York facility, which consists of approximately 680,000 square feet of floor space on approximately 81 acres. The Dunkirk facility processes semi-finished billet and bar stock through one or more of its five rolling mills, a high temperature annealing facility and/or a round or shape bar finishing facility.
We own our Titusville, Pennsylvania facility, which consists of seven buildings on approximately 10 acres, including two principal buildings of approximately 265,000 square feet in total area. The Titusville facility contains five VAR furnaces and various rolling and finishing equipment.
Specialty steel production is a capital-intensive industry. We believe that our facilities and equipment are suitable for our present manufacturing needs. We believe, however, that we will continue to require capital from time to time to add new equipment and to repair or replace our existing equipment to remain competitive and to enable us to manufacture quality products and provide delivery and other support service assurances to our customers.
From time to time, various lawsuits and claims have been or may be asserted against us relating to the conduct of our business, including routine litigation relating to commercial and employment matters. The ultimate cost and outcome of any litigation or claim cannot be predicted with certainty. We believe, based on information presently available, that the likelihood that the ultimate outcome of any such pending matter will have a material adverse effect on our financial condition, or liquidity or a material impact to our results of operations is remote, although the resolution of one or more of these matters may have a material adverse effect on our results of operations for the period in which the resolution occurs.
Not applicable.
9
|
ITEM 5. |
MARKET FOR THE REGISTRANT’S COMMON EQUITY, RELATED STOCKHOLDER MATTERS AND ISSUER PURCHASES OF EQUITY SECURITIES |
At December 31, 2017, a total of 7,550,642 shares of common stock, par value $0.001 per share, were issued and held by approximately 99 holders of record. There were 292,855 shares of the issued common stock held in treasury at December 31, 2017.
Certain holders of our common stock and the Company are party to a stockholder agreement. That agreement maintains in effect certain registration rights granted to certain stockholders and provides to them two demand registration rights exercisable at any time upon written request for the registration of shares of common stock having an aggregate net offering price of at least $5.0 million.
PRICE RANGE OF COMMON STOCK
Our common stock is listed on the NASDAQ Global Select Market under the symbol “USAP.” The following table sets forth the range of high and low sales prices per share of our common stock, for the periods indicated below:
|
|
2017 |
|
|
2016 |
|
|||||||||||||||
|
|
|
High |
|
|
Low |
|
|
High |
|
|
Low |
|
||||||||
|
First quarter |
|
$ |
|
17.83 |
|
|
$ |
|
11.60 |
|
|
$ |
|
11.97 |
|
|
$ |
|
6.10 |
|
|
Second quarter |
|
$ |
|
20.29 |
|
|
$ |
|
16.21 |
|
|
$ |
|
13.65 |
|
|
$ |
|
9.13 |
|
|
Third quarter |
|
$ |
|
21.30 |
|
|
$ |
|
17.30 |
|
|
$ |
|
12.00 |
|
|
$ |
|
9.47 |
|
|
Fourth quarter |
|
$ |
|
23.04 |
|
|
$ |
|
18.53 |
|
|
$ |
|
15.37 |
|
|
$ |
|
9.13 |
|
PERFORMANCE GRAPH
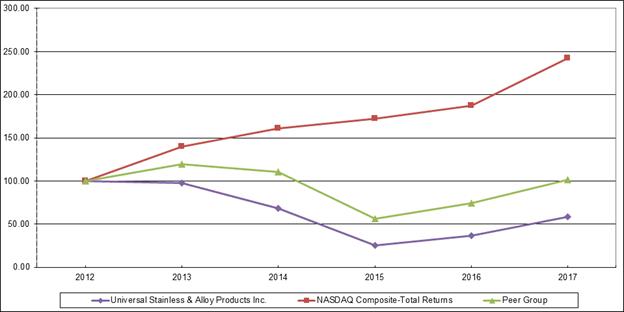
The performance graph below compares the cumulative total stockholder return on our common stock with the cumulative total return on the equity securities of the NASDAQ Composite Index and a peer group selected by us. The peer group consists of domestic specialty steel producers: Allegheny Technologies Incorporated; Materion Corporation; Carpenter Technology Corporation; and Haynes International, Inc. The graph assumes an investment of $100 on December 31, 2012 reinvestment of dividends, if any, on the date of dividend payment and the peer group is weighted by each company’s market capitalization. The performance graph represents past performance and should not be considered to be an indication of future performance.
10
Comparison of 5-Year Cumulative Total Shareholder Return among Universal Stainless & Alloy Products, Inc., the NASDAQ Composite Index and a Peer Group
|
|
For the years ended December 31, |
|
||||||||||||||||||||||||||||
|
Company/Peer/Market |
|
2012 |
|
|
2013 |
|
|
2014 |
|
|
2015 |
|
|
2016 |
|
|
2017 |
|
||||||||||||
|
Universal Stainless & Alloy Products, Inc. |
|
$ |
|
100.00 |
|
|
$ |
|
98.07 |
|
|
$ |
|
68.40 |
|
|
$ |
|
25.26 |
|
|
$ |
|
36.74 |
|
|
$ |
|
58.25 |
|
|
Peer Group |
|
$ |
|
100.00 |
|
|
$ |
|
119.95 |
|
|
$ |
|
110.72 |
|
|
$ |
|
56.52 |
|
|
$ |
|
74.73 |
|
|
$ |
|
101.31 |
|
|
NASDAQ Composite Index |
|
$ |
|
100.00 |
|
|
$ |
|
140.12 |
|
|
$ |
|
160.78 |
|
|
$ |
|
171.97 |
|
|
$ |
|
187.22 |
|
|
$ |
|
242.71 |
|
PREFERRED STOCK
Our Certificate of Incorporation provides that we may, by vote of our Board of Directors, issue up to 1,980,000 shares of preferred stock. The preferred stock may have rights, preferences, privileges and restrictions thereon, including dividend rights, dividend rates, conversion rights, voting rights, terms of redemption, redemption prices, liquidation preferences and the number of shares constituting any series or designation of such series, without further vote or action by the stockholders. The issuance of preferred stock may have the effect of delaying, deferring or preventing a change in control of the Company without further action by the stockholders and may adversely affect the voting and other rights of the holders of common stock. The issuance of preferred stock with voting and conversion rights may adversely affect the voting power of the holders of common stock, including the loss of voting control to others. We have no outstanding preferred stock and have no current plans to issue any of the authorized preferred stock.
DIVIDENDS
We have never paid a cash dividend on our common stock. Our credit agreement does not permit the payment of cash dividends on our common stock.
11
|
|
2017 |
|
|
2016 |
|
|
2015 |
|
|
2014 |
|
|
2013 |
|
|||||||||||
|
(dollars in thousands, except per share amounts) |
|
|
|
|
|
|
|
|
|
|
|
|
|
|
|
|
|
|
|
|
|
|
|
|
|
|
Summary of operations: |
|
|
|
|
|
|
|
|
|
|
|
|
|
|
|
|
|
|
|
|
|
|
|
|
|
|
Net sales |
|
$ |
|
202,643 |
|
|
$ |
|
154,434 |
|
|
$ |
|
180,660 |
|
|
$ |
|
205,560 |
|
|
$ |
|
180,768 |
|
|
Goodwill impairment |
|
$ |
|
- |
|
|
$ |
|
- |
|
|
$ |
|
20,268 |
|
|
$ |
|
- |
|
|
$ |
|
- |
|
|
Operating income (loss) |
|
$ |
|
4,237 |
|
|
$ |
|
(3,969 |
) |
|
$ |
|
(30,079 |
) |
|
$ |
|
10,900 |
|
|
$ |
|
(4,005 |
) |
|
Net income (loss) |
|
$ |
|
7,610 |
|
|
$ |
|
(5,347 |
) |
|
$ |
|
(20,672 |
) |
|
$ |
|
4,050 |
|
|
$ |
|
(4,062 |
) |
|
Financial position at year-end: |
|
|
|
|
|
|
|
|
|
|
|
|
|
|
|
|
|
|
|
|
|
|
|
|
|
|
Cash |
|
$ |
|
207 |
|
|
$ |
|
75 |
|
|
$ |
|
112 |
|
|
$ |
|
142 |
|
|
$ |
|
307 |
|
|
Working capital |
|
$ |
|
101,316 |
|
|
$ |
|
84,397 |
|
|
$ |
|
85,006 |
|
|
$ |
|
98,069 |
|
|
$ |
|
86,512 |
|
|
Property, plant and equipment, net |
|
$ |
|
174,444 |
|
|
$ |
|
182,398 |
|
|
$ |
|
193,505 |
|
|
$ |
|
199,795 |
|
|
$ |
|
203,590 |
|
|
Total assets 1 |
|
$ |
|
321,231 |
|
|
$ |
|
296,045 |
|
|
$ |
|
297,302 |
|
|
$ |
|
352,845 |
|
|
$ |
|
333,524 |
|
|
Long-term debt1 |
|
$ |
|
75,006 |
|
|
$ |
|
67,998 |
|
|
$ |
|
72,884 |
|
|
$ |
|
81,846 |
|
|
$ |
|
85,438 |
|
|
Stockholders’ equity |
|
$ |
|
191,668 |
|
|
$ |
|
181,220 |
|
|
$ |
|
184,977 |
|
|
$ |
|
203,630 |
|
|
$ |
|
196,458 |
|
|
Common share data: |
|
|
|
|
|
|
|
|
|
|
|
|
|
|
|
|
|
|
|
|
|
|
|
|
|
|
Net income (loss) per common share - Basic |
|
$ |
|
1.05 |
|
|
$ |
|
(0.74 |
) |
|
$ |
|
(2.92 |
) |
|
$ |
|
0.58 |
|
|
$ |
|
(0.58 |
) |
|
Net income (loss) per common share - Diluted |
|
$ |
|
1.03 |
|
|
$ |
|
(0.74 |
) |
|
$ |
|
(2.92 |
) |
|
$ |
|
0.57 |
|
|
$ |
|
(0.58 |
) |
|
1 |
Total assets and Long-term debt, for prior periods, have been adjusted to reflect the reclassification of deferred financing costs from Other long-term assets to a reduction of debt to be consistent with the current period presentation due to the adoption of ASC 2015-3, “Simplifying the Presentation of Debt Issuance Costs”. |
12
The following Management Discussion and Analysis (“MD&A”) is intended to help the reader understand the consolidated results of operations and financial condition of Universal Stainless & Alloy Products, Inc. and its wholly-owned subsidiaries (collectively, “we,” “us,” “our,” or the “Company”). This MD&A should be read in conjunction with our consolidated financial statements and accompanying notes included in this Form 10-K. When reviewing the discussion, you should keep in mind the substantial risks and uncertainties that characterize our business. In particular, we encourage you to review the risk and uncertainties described under Item 1A “Risk Factors,” of this Form 10-K. These risks and uncertainties could cause actual results to differ materially from those forecasted in forward-looking statements or implied by past results and trends. Forward-looking statements are statements that attempt to project or anticipate future developments in our business; we encourage you to review the discussion of forward-looking statements under “Cautionary Statement for Purposes of the “Safe Harbor” Provisions of the Private Securities Litigation Reform Act of 1995,” at the beginning of this report. These statements, like all statements in this report, speak only as of the date of this report (unless another date is indicated), and we undertake no obligation to update or revise the statements in light of future developments. Unless otherwise specified, any reference to a “year” is to the year ended December 31.
Business Overview
We manufacture and market semi-finished and finished specialty steel products, including stainless steel, nickel alloys, tool steel and certain other alloyed steels. Our manufacturing process involves melting, remelting, heat treating, hot and cold rolling, forging, machining and cold drawing of semi-finished and finished specialty steels. Our products are sold to service centers, forgers, rerollers, original equipment manufacturers and wire redrawers. Our customers further process our products for use in a variety of industries, including the aerospace, power generation, oil and gas and general industrial markets. We also perform conversion services on materials supplied by customers.
The improvements in our end markets which began in the second half of 2016 continued in 2017. For full year 2017, all of our end markets were up, compared with full year 2016. Better surcharge alignments positively impacted all of our end markets. Aerospace was up in 2017 due to strong customer demand, and heavy equipment was up due to higher manufacturing activity. Our overall net sales were $202.6 million, an increase of $48.2 million, or 31.2%, compared to 2016. Sales in each quarter of 2017 were higher than the comparable 2016 period. Backlog at the end of 2017, before surcharges, was $77.7 million, an increase of approximately 77.4% compared to a backlog of $43.8 million at the end of 2016. In 2017, we received 10 new customer approvals that are critical to our focus on the aerospace, oil & gas and power generation end markets. In addition, we added 12 new products in 2017, with an additional 15 new products in the development process at the end of 2017. New product introductions are essential to move to a higher value product mix. We continue to work on gaining other customer approvals to add more products, with a focus on high value nickel alloy products.
For 2017, our gross margin was 11.4% of net sales, improved from 8.8% of net sales in 2016. Operational productivity enhancements, combined with improved alignment of customer surcharges and melt cost over the course of 2017, drove the gross margin improvement. Gross margin in the first half of 2016 was negatively impacted by continued misalignment of customer surcharges and melt costs. In the fourth quarter of 2017, gross margin was $6.2 million, or 12.3% of sales, compared to a gross margin of $3.1 million, or 9.1% of sales, in the fourth quarter of 2016.
Selling, general and administrative (“SG&A”) expenses increased by $1.3 million in 2017, compared to 2016. The increase in SG&A was driven by higher employee costs associated with the increased business levels and higher legal costs. These increases in SG&A were partially offset by $0.6 million less variable compensation expense in 2017 compared to 2016.
Overall, our operating income in 2017 was $4.2 million, compared to an operating loss of $4.0 million in 2016, reflecting the improved operational results in 2017.
The 2017 income tax benefit of $7.6 million reflects a one-time adjustment due to the recently enacted tax rate reduction, fractionally offset by state tax items and new stock compensation accounting guidance for 2017.
13
During 2017, we generated $1.1 million cash from operating activities, and incurred $8.0 million of capital spending which was partially offset by proceeds of $0.1 million received for asset sales. Financing activities generated $7.0 million primarily from net additional borrowings. Total debt under the revolving credit facility increased $11.5 million, offset by $5.1 million of payments on the term loan and capital leases.
The overall demand environment continues to improve as we enter 2018 with service centers, forgers and re-rollers all signaling improved outlooks now that the pressure for our customers to reduce year-end inventories has passed. We remain optimistic about near and long-term aerospace end market growth given the multi-year backlog in airplane deliveries and sustained growth in passenger and air freight traffic. In addition, we are optimistic about our other end markets as we expect strong heavy equipment end market demand and see strengthening of the oil and gas end market as we enter 2018.
Our operating facilities are integrated, and therefore our chief operating decision maker (“CODM”) views the Company as one business unit. Our CODM sets performance goals, assesses performance and makes decisions about resource allocations on a consolidated basis. As a result of these factors, as well as the nature of the financial information available which is reviewed by our CODM, we maintain one reportable segment.
Results of Operations
2017 Results as Compared to 2016
|
|
2017 |
|
2016 |
|
|
|
|
|
|
|
|
|
|
|||||||||||||||||
|
(dollars in thousands, except per shipped ton information) |
|
|
|
|
|
|
|
|
|
|
|
|
|
|
|
|
|
|
|
|
|
|
|
|
|
|
|
|
|
|
|
|
|
Amount |
|
|
Percentage of net sales |
|
Amount |
|
|
Percentage of net sales |
|
Dollar / ton variance |
|
|
Percentage variance |
|||||||||||||||
|
Net sales: |
|
|
|
|
|
|
|
|
|
|
|
|
|
|
|
|
|
|
|
|
|
|
|
|
|
|
|
|
|
|
|
Stainless steel |
|
$ |
|
139,603 |
|
|
|
69.0 |
|
% |
|
$ |
|
112,118 |
|
|
|
72.7 |
|
% |
|
$ |
|
27,485 |
|
|
|
24.5 |
|
% |
|
High-strength low alloy steel |
|
|
|
15,693 |
|
|
|
7.7 |
|
|
|
|
|
13,180 |
|
|
|
8.5 |
|
|
|
|
|
2,513 |
|
|
|
19.1 |
|
|
|
Tool steel |
|
|
|
32,279 |
|
|
|
15.9 |
|
|
|
|
|
19,179 |
|
|
|
12.4 |
|
|
|
|
|
13,100 |
|
|
|
68.3 |
|
|
|
High-temperature alloy steel |
|
|
|
12,435 |
|
|
|
6.1 |
|
|
|
|
|
6,057 |
|
|
|
3.9 |
|
|
|
|
|
6,378 |
|
|
|
105.3 |
|
|
|
Conversion services and other sales |
|
|
|
2,633 |
|
|
|
1.3 |
|
|
|
|
|
3,900 |
|
|
|
2.5 |
|
|
|
|
|
(1,267 |
) |
|
|
(32.5 |
) |
|
|
Total net sales |
|
|
|
202,643 |
|
|
|
100.0 |
|
|
|
|
|
154,434 |
|
|
|
100.0 |
|
|
|
|
|
48,209 |
|
|
|
31.2 |
|
|
|
Cost of products sold |
|
|
|
179,609 |
|
|
|
88.6 |
|
|
|
|
|
140,921 |
|
|
|
91.2 |
|
|
|
|
|
38,688 |
|
|
|
27.5 |
|
|
|
Gross margin |
|
|
|
23,034 |
|
|
|
11.4 |
|
|
|
|
|
13,513 |
|
|
|
8.8 |
|
|
|
|
|
9,521 |
|
|
|
70.5 |
|
|
|
Selling, general and administrative expenses |
|
|
|
18,797 |
|
|
|
9.3 |
|
|
|
|
|
17,482 |
|
|
|
11.3 |
|
|
|
|
|
1,315 |
|
|
|
7.5 |
|
|
|
Operating income (loss) |
|
|
|
4,237 |
|
|
|
2.1 |
|
|
|
|
|
(3,969 |
) |
|
|
(2.5 |
) |
|
|
|
|
8,206 |
|
|
|
206.8 |
|
|
|
Interest expense |
|
|
|
4,022 |
|
|
|
2.0 |
|
|
|
|
|
3,659 |
|
|
|
2.4 |
|
|
|
|
|
363 |
|
|
|
9.9 |
|
|
|
Deferred financing amortization |
|
|
|
255 |
|
|
|
0.1 |
|
|
|
|
|
1,015 |
|
|
|
0.7 |
|
|
|
|
|
(760 |
) |
|
|
(74.9 |
) |
|
|
Other (income) expense |
|
|
|
(49 |
) |
|
|
- |
|
|
|
|
|
230 |
|
|
|
0.1 |
|
|
|
|
|
(279 |
) |
|
|
(121.3 |
) |
|
|
Income (loss) before income taxes |
|
|
|
9 |
|
|
|
- |
|
|
|
|
|
(8,873 |
) |
|
|
(5.7 |
) |
|
|
|
|
8,882 |
|
|
|
100.1 |
|
|
|
Benefit from income taxes |
|
|
|
(7,601 |
) |
|
|
(3.8 |
) |
|
|
|
|
(3,526 |
) |
|
|
(2.3 |
) |
|
|
|
|
4,075 |
|
|
|
115.6 |
|
|
|
Net income (loss) |
|
$ |
|
7,610 |
|
|
|
3.8 |
|
% |
|
$ |
|
(5,347 |
) |
|
|
(3.4 |
) |
% |
|
$ |
|
12,957 |
|
|
|
242.3 |
|
% |
|
Tons shipped |
|
|
|
39,246 |
|
|
|
|
|
|
|
|
|
31,372 |
|
|
|
|
|
|
|
|
|
7,874 |
|
|
|
25.1 |
|
% |
|
Sales dollars per shipped ton |
|
$ |
|
5,163 |
|
|
|
|
|
|
|
$ |
|
4,923 |
|
|
|
|
|
|
|
$ |
|
240 |
|
|
|
4.9 |
|
% |
14
|
|
2017 |
|
2016 |
|
|
|
|
|
|
|
|
|
|
|||||||||||||||||
|
(dollars in thousands) |
|
|
|
|
|
|
|
|
|
|
|
|
|
|
|
|
|
|
|
|
|
|
|
|
|
|
|
|
|
|
|
|
|
Amount |
|
|
Percentage of net sales |
|
Amount |
|
|
Percentage of net sales |
|
Dollar variance |
|
|
Percentage variance |
|||||||||||||||
|
Net sales: |
|
|
|
|
|
|
|
|
|
|
|
|
|
|
|
|
|
|
|
|
|
|
|
|
|
|
|
|
|
|
|
Service centers |
|
$ |
|
140,259 |
|
|
|
69.2 |
|
% |
|
$ |
|
108,582 |
|
|
|
70.3 |
|
% |
|
$ |
|
31,677 |
|
|
|
29.2 |
|
% |
|
Forgers |
|
|
|
18,442 |
|
|
|
9.1 |
|
|
|
|
|
13,441 |
|
|
|
8.7 |
|
|
|
|
|
5,001 |
|
|
|
37.2 |
|
|
|
Rerollers |
|
|
|
23,675 |
|
|
|
11.7 |
|
|
|
|
|
12,481 |
|
|
|
8.1 |
|
|
|
|
|
11,194 |
|
|
|
89.7 |
|
|
|
Original equipment manufacturers |
|
|
|
17,634 |
|
|
|
8.7 |
|
|
|
|
|
16,030 |
|
|
|
10.4 |
|
|
|
|
|
1,604 |
|
|
|
10.0 |
|
|
|
Conversion services and other sales |
|
|
|
2,633 |
|
|
|
1.3 |
|
|
|
|
|
3,900 |
|
|
|
2.5 |
|
|
|
|
|
(1,267 |
) |
|
|
(32.5 |
) |
|
|
Total net sales |
|
$ |
|
202,643 |
|
|
|
100.0 |
|
% |
|
$ |
|
154,434 |
|
|
|
100.0 |
|
% |
|
$ |
|
48,209 |
|
|
|
31.2 |
|
% |
Melt Type Information:
|
|
2017 |
|
2016 |
|
|
|
|
|
|
|
|
|
|
|||||||||||||||||
|
(dollars in thousands) |
|
|
|
|
|
|
|
|
|
|
|
|
|
|
|
|
|
|
|
|
|
|
|
|
|
|
|
|
|
|
|
|
|
Amount |
|
|
Percentage of net sales |
|
Amount |
|
|
Percentage of net sales |
|
Dollar variance |
|
|
Percentage variance |
|||||||||||||||
|
Net sales: |
|
|
|
|
|
|
|
|
|
|
|
|
|
|
|
|
|
|
|
|
|
|
|
|
|
|
|
|
|
|
|
Specialty alloys |
|
$ |
|
172,715 |
|
|
|
85.2 |
|
% |
|
$ |
|
136,178 |
|
|
|
88.2 |
|
% |
|
$ |
|
36,537 |
|
|
|
26.8 |
|
% |
|
Premium alloys |
|
|
|
27,295 |
|
|
|
13.5 |
|
|
|
|
|
14,356 |
|
|
|
9.3 |
|
|
|
|
|
12,939 |
|
|
|
90.1 |
|
|
|
Conversion services and other sales |
|
|
|
2,633 |
|
|
|
1.3 |
|
|
|
|
|
3,900 |
|
|
|
2.5 |
|
|
|
|
|
(1,267 |
) |
|
|
(32.5 |
) |
|
|
Total net sales |
|
$ |
|
202,643 |
|
|
|
100.0 |
|
% |
|
$ |
|
154,434 |
|
|
|
100.0 |
|
% |
|
$ |
|
48,209 |
|
|
|
31.2 |
|
% |
The majority of our products are sold to service centers rather than the ultimate end market customers. The end market information in this Annual Report is our estimate based upon our knowledge of our customers and the grade of material sold to them, that they will in-turn sell to the ultimate end market customer.
End Market Information:
|
|
2017 |
|
2016 |
|
|
|
|
|
|
|
|
|
|
|||||||||||||||||
|
(dollars in thousands) |
|
|
|
|
|
|
|
|
|
|
|
|
|
|
|
|
|
|
|
|
|
|
|
|
|
|
|
|
|
|
|
|
|
Amount |
|
|
Percentage of net sales |
|
Amount |
|
|
Percentage of net sales |
|
Dollar variance |
|
|
Percentage variance |
|||||||||||||||
|
Net sales: |
|
|
|
|
|
|
|
|
|
|
|
|
|
|
|
|
|
|
|
|
|
|
|
|
|
|
|
|
|
|
|
Aerospace |
|
$ |
|
111,795 |
|
|
|
55.2 |
|
% |
|
$ |
|
91,979 |
|
|
|
59.6 |
|
% |
|
$ |
|
19,816 |
|
|
|
21.5 |
|
% |
|
Power generation |
|
|
|
16,592 |
|
|
|
8.2 |
|
|
|
|
|
14,175 |
|
|
|
9.2 |
|
|
|
|
|
2,417 |
|
|
|
17.1 |
|
|
|
Oil and gas |
|
|
|
19,069 |
|
|
|
9.4 |
|
|
|
|
|
12,392 |
|
|
|
8.0 |
|
|
|
|
|
6,677 |
|
|
|
53.9 |
|
|
|
Heavy equipment |
|
|
|
33,876 |
|
|
|
16.7 |
|
|
|
|
|
20,109 |
|
|
|
13.0 |
|
|
|
|
|
13,767 |
|
|
|
68.5 |
|
|
|
General industrial, conversion services and other sales |
|
|
|
21,311 |
|
|
|
10.5 |
|
|
|
|
|
15,779 |
|
|
|
10.2 |
|
|
|
|
|
5,532 |
|
|
|
35.1 |
|
|
|
Total net sales |
|
$ |
|
202,643 |
|
|
|
100.0 |
|
% |
|
$ |
|
154,434 |
|
|
|
100.0 |
|
% |
|
$ |
|
48,209 |
|
|
|
31.2 |
|
% |
15
Net sales for the year ended December 31, 2017 increased $48.2 million, or 31.2%, as compared to the same period in 2016. The increase in our sales primarily reflects a 25.1% increase in consolidated tons shipped in 2017, compared to 2016, as demand for our products increased as a result of strengthening market conditions throughout 2017. In addition, a 4.9% increase in sales dollars per ton was primarily due to product mix and better surcharge alignment. Our product sales to all of our end markets increased as noted in the above table. Our premium alloy sales were $27.3 million, or 13.5% of total sales, for the year ended December 31, 2017, compared to $14.4 million, or 9.3% of total sales, for the year ended December 31, 2016. Our premium alloy sales are primarily for the aerospace end market.
Gross margin:
Our gross margin, as a percentage of net sales, increased to 11.4% in 2017 from 8.8% for 2016. The increase in gross margin is a result of better alignment of melt costs and surcharges, and the realization of manufacturing and productivity savings. Gross margin in 2017 was adversely impacted by temporarily higher and unplanned maintenance costs as well as by costly outsourcing, as the Company ramps up its business in response to continued strong levels of backlog at a time of a tightening labor market.
Selling, general and administrative expenses:
Our SG&A expenses consist primarily of employee costs, which include salaries, payroll taxes and benefit related costs, legal and accounting services, stock compensation and insurance costs. Our SG&A expenses increased by $1.3 million in the year ended December 31, 2017 as compared to the year ended December 31, 2016. Approximately $1.0 million is due to increased employee costs, $0.2 million is due to higher stock based compensation expense, and $0.6 million of the increase is due to higher legal costs, reflecting external legal expenses related to a lawsuit against a supplier for unauthorized substitution of material and defense of a claim of non-compliant material. These increases in SG&A were partially offset by $0.6 million reduction in variable compensation. As a percentage of sales, our SG&A expenses were 9.3% and 11.3%, respectively, for the years ended December 31, 2017 and 2016, respectively.
Interest expense and deferred financing amortization:
Our interest costs on our debt increased to $4.0 million for the year ended December 31, 2017 from $3.7 million for the year ended December 31, 2016. Approximately $0.2 of this increase is due to higher interest rates and approximately $0.1 is due to increased borrowings. The interest rate on our variable rate debt is determined by a LIBOR-based rate plus an applicable margin based upon achieving certain ratios. Our deferred financing costs are associated with our credit facility and the Amended and Restated Convertible Notes (collectively, the “Notes”). Our deferred financing costs decreased to $0.7 million from $1.0 million for the years ended December 31, 2017 and 2016, respectively. The decrease in deferred financing costs is due to the 2016 write off of $0.8 million of deferred financing costs associated with our prior credit agreement when we entered into our new credit agreement in January 2016.
Other (income) expense:
Other income was less than $0.1 million in 2017 compared to approximately $0.2 million of expense for the same period of 2016. This change reflects foreign currency losses in 2016 of $0.2 million.
Benefit from income taxes:
The 2017 income tax benefit of $7.6 million reflects a one-time adjustment due to the recently enacted tax rate reduction, fractionally offset by state tax items and new stock compensation accounting guidance for 2017.
Net income (loss):
We had net income of $7.6 million for the year ended December 31, 2017, reflecting the one-time tax benefit noted above, compared to a net loss of $5.3 million for the year ended December 31, 2016.
16
2016 Results as Compared to 2015
|
|
2016 |
|
2015 |
|
|
|
|
|
|
|
|
|
|
|||||||||||||||||
|
(dollars in thousands, except per shipped ton information) |
|
|
|
|
|
|
|
|
|
|
|
|
|
|
|
|
|
|
|
|
|
|
|
|
|
|
|
|
|
|
|
|
|
Amount |
|
|
Percentage of net sales |
|
Amount |
|
|
Percentage of net sales |
|
Dollar / ton variance |
|
|
Percentage variance |
|||||||||||||||
|
Net sales: |
|
|
|
|
|
|
|
|
|
|
|
|
|
|
|
|
|
|
|
|
|
|
|
|
|
|
|
|
|
|
|
Stainless steel |
|
$ |
|
112,118 |
|
|
|
72.7 |
|
% |
|
$ |
|
135,945 |
|
|
|
75.2 |
|
% |
|
$ |
|
(23,827 |
) |
|
|
(17.5 |
) |
% |
|
High-strength low alloy steel |
|
|
|
13,180 |
|
|
|
8.5 |
|
|
|
|
|
16,045 |
|
|
|
8.9 |
|
|
|
|
|
(2,865 |
) |
|
|
(17.9 |
) |
|
|
Tool steel |
|
|
|
19,179 |
|
|
|
12.4 |
|
|
|
|
|
16,197 |
|
|
|
9.0 |
|
|
|
|
|
2,982 |
|
|
|
18.4 |
|
|
|
High-temperature alloy steel |
|
|
|
6,057 |
|
|
|
3.9 |
|
|
|
|
|
7,557 |
|
|
|
4.2 |
|
|
|
|
|
(1,500 |
) |
|
|
(19.8 |
) |
|
|
Conversion services and other sales |
|
|
|
3,900 |
|
|
|
2.5 |
|
|
|
|
|
4,916 |
|
|
|
2.7 |
|
|
|
|
|
(1,016 |
) |
|
|
(20.7 |
) |
|
|
Total net sales |
|
|
|
154,434 |
|
|
|
100.0 |
|
|
|
|
|
180,660 |
|
|
|
100.0 |
|
|
|
|
|
(26,226 |
) |
|
|
(14.5 |
) |
|
|
Cost of products sold |
|
|
|
140,921 |
|
|
|
91.2 |
|
|
|
|
|
171,065 |
|
|
|
94.7 |
|
|
|
|
|
(30,144 |
) |
|
|
(17.6 |
) |
|
|
Gross margin |
|
|
|
13,513 |
|
|
|
8.8 |
|
|
|
|
|
9,595 |
|
|
|
5.3 |
|
|
|
|
|
3,918 |
|
|
|
40.8 |
|
|
|
Selling, general and administrative expenses |
|
|
|
17,482 |
|
|
|
11.3 |
|
|
|
|
|
19,406 |
|
|
|
10.7 |
|
|
|
|
|
(1,924 |
) |
|
|
(9.9 |
) |
|
|
Goodwill impairment |
|
|
|
- |
|
|
|
- |
|
|
|
|
|
20,268 |
|
|
|
11.2 |
|
|
|
|
|
(20,268 |
) |
|
|
(100.0 |
) |
|
|
|
|
|
|
|
|
|
|
|
|
|
|
|
|
|
|
|
|
|
|
|
|
|
|
|
|
|
|
|
|
|
|
Operating loss |
|
|
|
(3,969 |
) |
|
|
(2.5 |
) |
|
|
|
|
(30,079 |
) |
|
|
(16.6 |
) |
|
|
|
|
26,110 |
|
|
|
86.8 |
|
|
|
Interest expense |
|
|
|
3,659 |
|
|
|
2.4 |
|
|
|
|
|
2,324 |
|
|
|
1.3 |
|
|
|
|
|
1,335 |
|
|
|
57.4 |
|
|
|
Deferred financing amortization |
|
|
|
1,015 |
|
|
|
0.7 |
|
|
|
|
|
566 |
|
|
|
0.3 |
|
|
|
|
|
449 |
|
|
|
79.3 |
|
|
|
Other (income) expense |
|
|
|
230 |
|
|
|
0.1 |
|
|
|
|
|
(153 |
) |
|
|
(0.1 |
) |
|
|
|
|
383 |
|
|
|
250.3 |
|
|
|
Loss before income taxes |
|
|
|
(8,873 |
) |
|
|
(5.7 |
) |
|
|
|
|
(32,816 |
) |
|
|
(18.1 |
) |
|
|
|
|
23,943 |
|
|
|
73.0 |
|
|
|
Benefit from income taxes |
|
|
|
(3,526 |
) |
|
|
(2.3 |
) |
|
|
|
|
(12,144 |
) |
|
|
(6.7 |
) |
|
|
|
|
8,618 |
|
|
|
71.0 |
|
|
|
Net loss |
|
$ |
|
(5,347 |
) |
|
|
(3.4 |
) |
% |
|
$ |
|
(20,672 |
) |
|
|
(11.4 |
) |
% |
|
$ |
|
15,325 |
|
|
|
74.1 |
|
% |
|
Tons shipped |
|
|
|
31,372 |
|
|
|
|
|
|
|
|
|
32,388 |
|
|
|
|
|
|
|
|
|
(1,016 |
) |
|
|
(3.1 |
) |
% |
|
Sales dollars per shipped ton |
|
$ |
|
4,923 |
|
|
|
|
|
|
|
$ |
|
5,578 |
|
|
|
|
|
|
|
$ |
|
(655 |
) |
|
|
(11.7 |
) |
% |
Market Segment Information:
|
|
2016 |
|
2015 |
|
|
|
|
|
|
|
|
|
|
|||||||||||||||||
|
(dollars in thousands) |
|
|
|
|
|
|
|
|
|
|
|
|
|
|
|
|
|
|
|
|
|
|
|
|
|
|
|
|
|
|
|
|
|
Amount |
|
|
Percentage of net sales |
|
Amount |
|
|
Percentage of net sales |
|
Dollar variance |
|
|
Percentage variance |
|||||||||||||||
|
Net sales: |
|
|
|
|
|
|
|
|
|
|
|
|
|
|
|
|
|
|
|
|
|
|
|
|
|
|
|
|
|
|
|
Service centers |
|
$ |
|
108,582 |
|
|
|
70.3 |
|
% |
|
$ |
|
121,090 |
|
|
|
67.0 |
|
% |
|
$ |
|
(12,508 |
) |
|
|
(10.3 |
) |
% |
|
Forgers |
|
|
|
13,441 |
|
|
|
8.7 |
|
|
|
|
|
15,143 |
|
|
|
8.4 |
|
|
|
|
|
(1,702 |
) |
|
|
(11.2 |
) |
|
|
Rerollers |
|
|
|
12,481 |
|
|
|
8.1 |
|
|
|
|
|
17,848 |
|
|
|
9.9 |
|
|
|
|
|
(5,367 |
) |
|
|
(30.1 |
) |
|
|
Original equipment manufacturers |
|
|
|
16,030 |
|
|
|
10.4 |
|
|
|
|
|
21,663 |
|
|
|
12.0 |
|
|
|
|
|
(5,633 |
) |
|
|
(26.0 |
) |
|
|
Conversion services and other sales |
|
|
|
3,900 |
|
|
|
2.5 |
|
|
|
|
|
4,916 |
|
|
|
2.7 |
|
|
|
|
|
(1,016 |
) |
|
|
(20.7 |
) |
|
|
Total net sales |
|
$ |
|
154,434 |
|
|
|
100.0 |
|
% |
|
$ |
|
180,660 |
|
|
|
100.0 |
|
% |
|
$ |
|
(26,226 |
) |
|
|
(14.5 |
) |
% |
17
|
|
2016 |
|
2015 |
|
|
|
|
|
|
|
|
|
|
|||||||||||||||||
|
(dollars in thousands) |
|
|
|
|
|
|
|
|
|
|
|
|
|
|
|
|
|
|
|
|
|
|
|
|
|
|
|
|
|
|
|
|
|
Amount |
|
|
Percentage of net sales |
|
Amount |
|
|
Percentage of net sales |
|
Dollar variance |
|
|
Percentage variance |
|||||||||||||||
|
Net sales: |
|
|
|
|
|
|
|
|
|
|
|
|
|
|
|
|
|
|
|
|
|
|
|
|
|
|
|
|
|
|
|
Specialty alloys |
|
$ |
|
136,178 |
|
|
|
88.2 |
|
% |
|
$ |
|
158,145 |
|
|
|
87.6 |
|
% |
|
$ |
|
(21,967 |
) |
|
|
(13.9 |
) |
% |
|
Premium alloys |
|
|
|
14,356 |
|
|
|
9.3 |
|
|
|
|
|
17,599 |
|
|
|
9.7 |
|
|
|
|
|
(3,243 |
) |
|
|
(18.4 |
) |
|
|
Conversion services and other sales |
|
|
|
3,900 |
|
|
|
2.5 |
|
|
|
|
|
4,916 |
|
|
|
2.7 |
|
|
|
|
|
(1,016 |
) |
|
|
(20.7 |
) |
|
|
Total net sales |
|
$ |
|
154,434 |
|
|
|
100.0 |
|
% |
|
$ |
|
180,660 |
|
|
|
100.0 |
|
% |
|
$ |
|
(26,226 |
) |
|
|
(14.5 |
) |
% |
The majority of our products are sold to service centers rather than the ultimate end market customers. The end market information in this Annual Report is our estimate based upon our knowledge of our customers and the grade of material sold to them, that they will in-turn sell to the ultimate end market customer.
End Market Information:
|
|
2016 |
|
2015 |
|
|
|
|
|
|
|
|
|
|
|||||||||||||||||
|
(dollars in thousands) |
|
|
|
|
|
|
|
|
|
|
|
|
|
|
|
|
|
|
|
|
|
|
|
|
|
|
|
|
|
|
|
|
|
|
Amount |
|
|
Percentage of net sales |
|
|
Amount |
|
|
Percentage of net sales |
|
Dollar variance |
|
|
Percentage variance |
|||||||||||||
|
Net sales: |
|
|
|
|
|
|
|
|
|
|
|
|
|
|
|
|
|
|
|
|
|
|
|
|
|
|
|
|
|
|
|
Aerospace |
|
$ |
|
91,979 |
|
|
|
59.6 |
|
% |
|
$ |
|
108,791 |
|
|
|
60.2 |
|
% |
|
$ |
|
(16,812 |
) |
|
|
(15.5 |
) |
% |
|
Power generation |
|
|
|
14,175 |
|
|
|
9.2 |
|
|
|
|
|
19,212 |
|
|
|
10.6 |
|
|
|
|
|
(5,037 |
) |
|
|
(26.2 |
) |
|
|
Oil and gas |
|
|
|
12,392 |
|
|
|
8.0 |
|
|
|
|
|
17,094 |
|
|
|
9.5 |
|
|
|
|
|
(4,702 |
) |
|
|
(27.5 |
) |
|
|
Heavy equipment |
|
|
|
20,109 |
|
|
|
13.0 |
|
|
|
|
|
15,961 |
|
|
|
8.8 |
|
|
|
|
|
4,148 |
|
|
|
26.0 |
|
|
|
General industrial, conversion services and other sales |
|
|
|
15,779 |
|
|
|
10.2 |
|
|
|
|
|
19,602 |
|
|
|
10.9 |
|
|
|
|
|
(3,823 |
) |
|
|
(19.5 |
) |
|
|
Total net sales |
|
$ |
|
154,434 |
|
|
|
100.0 |
|
% |
|
$ |
|
180,660 |
|
|
|
100.0 |
|
% |
|
$ |
|
(26,226 |
) |
|
|
(14.5 |
) |
% |
Net sales:
Net sales for the year ended December 31, 2016 decreased $26.2 million, or 14.5%, as compared to the same period in 2015. The decrease in our sales primarily reflects a 3.1% decrease in consolidated tons shipped in 2016, compared to 2015, as demand for our products decreased as a result of declining market conditions in the second half of 2015 and 2016. In addition, an 11.7% decline in sales dollars per ton was primarily due to lower commodity driven surcharges and product mix. Our product sales to all of our end markets, except heavy equipment, decreased as noted in the above table. Our sales to the heavy equipment end market increased by $4.1 million, or 26%, in 2016, compared to 2015, primarily due to increased tool steel plate sales in the second half of 2016. Our premium alloy sales were $14.4 million, or 9.3% of total sales, for the year ended December 31, 2016, compared to $17.6 million, or 9.7% of total sales, for the year ended December 31, 2015.
Gross margin:
Our gross margin, as a percentage of net sales, increased to 8.8% in 2016 from 5.3% for 2015. The increase in gross margin is the result of the benefit of operational productivity enhancements, combined with significant improvement in the alignment of customer surcharges and commodity input costs. In the year ended December 31, 2015, the Company also incurred approximately $4.7 million of costs, in response to the sharp industry downturn including costs to temporarily idle plants, non-cash inventory write downs, and costs for reducing the hourly and salary workforce and approximately $0.9 million of costs associated with the unauthorized substitution by a vendor of a critical supply part for the melting process.
18
Selling, general and administrative expenses:
Our SG&A expenses consist primarily of employee costs, which include salaries, payroll taxes and benefit related costs, legal and accounting services, stock compensation and insurance costs. Our SG&A expenses decreased by $1.9 million in the year ended December 31, 2016 as compared to the year ended December 31, 2015. This decrease in SG&A was driven by spending reductions across most categories of SG&A due to lower employee costs, contract negotiations with suppliers and reduced spending levels. In addition, in 2015 we incurred $0.5 million for the exit of a non-compete contract and employee severances. These savings in SG&A were partially offset by $0.5 million additional variable compensation in 2016, compared to 2015.
Goodwill impairment:
We recorded a goodwill impairment in the third quarter of 2015. Due to a significant and sustained drop in our share price and continued weak operating results driven by slower market conditions, the Company determined that an interim goodwill impairment review was required in accordance with Accounting Standards Codification (“ASC”) 350, “Intangibles – Goodwill and Other”. This impairment eliminated all goodwill from the consolidated balance sheet as of December 31, 2015.
Interest expense and deferred financing amortization:
Our interest costs on our debt increased to $3.7 million for the year ended December 31, 2016 from $2.3 million for the year ended December 31, 2015. This increase is primarily due to higher interest rates incurred on our debt in 2016, as compared to 2015, partially offset by lower debt balances in 2016. The interest rate on our variable rate debt is determined by a LIBOR-based rate plus an applicable margin based upon achieving certain ratios. Our deferred financing costs are associated with our credit facility and the Notes. Our deferred financing costs increased to $1.0 million from $0.6 million for the years ended December 31, 2016 and 2015, respectively. The increase in deferred financing costs is due to the write off of $0.8 million of deferred financing costs associated with our prior credit agreement when we entered into our new credit agreement in January 2016, partially offset by decreased amortization of deferred financing costs from our new credit agreement.
Other (income) expense:
Other expense was approximately $0.2 million in 2016 compared to approximately $0.2 million of income for the same period of 2015. This is due to an insurance recovery of approximately $0.2 million received in 2015 and foreign currency losses in 2016.
Benefit from income taxes:
Our effective tax rates for the years ended December 31, 2016 and 2015 were 39.7% and 37.0%, respectively. Our overall effective tax rate for the year ended December 31, 2016, which reflects a pre-tax loss, also includes approximately $0.4 million of current and prior year research and development tax credits.
Net loss:
We incurred a net loss of $5.3 million for the year ended December 31, 2016 compared to a net loss of $20.7 million for the year ended December 31, 2015. Charges related to goodwill impairment, idle plant costs, supplier losses, non-cash inventory write-offs, employee severance and exit costs, and the exit of a non-compete contract negatively impacted the 2015 net income by $17.0 million.
Liquidity and Capital Resources
Historically, we have financed our operating activities through cash provided by operations and cash provided through our credit facilities.
Net cash provided by operating activities:
During 2017, we generated net cash from operating activities of $1.1 million. Our managed working capital, defined as net accounts receivable plus net inventory minus accounts payable, used $18.8 million of cash from operations. Inventories increased by $27.4 million primarily due to increased demand, accounts receivable increased by $5.6 million due to increased sales in the fourth quarter of 2017, compared to the fourth quarter of
19
2016, and accounts payable increased by $14.2 million due to increased activity levels in the fourth quarter of 2017, compared to the fourth quarter of 2016. Net income adjusted for non-cash expenses generated $20.3 million and all other operating activities used $0.4 million of cash in 2017.
During 2016, we generated net cash from operating activities of $8.4 million. Our managed working capital, defined as net accounts receivable plus net inventory minus accounts payable, used $3.8 million of cash from operations. Inventories increased by $9.2 million primarily due to increased demand, accounts receivable increased by $1.8 million due to increased sales in the fourth quarter of 2016, compared to the fourth quarter of 2015, and accounts payable increased by $7.1 million due to increased activity levels in the fourth quarter of 2016, compared to the fourth quarter of 2015. Net income adjusted for non-cash expenses generated $11.5 million and all other operating activities generated $0.7 million of cash in 2016.
Net cash used in investing activities:
During 2017, our capital spending, which is primarily discretionary in nature, was $8.0 million.
During 2016, our capital spending was $4.4 million. We received $1.6 million from the sale of assets, including the reimbursement of $1.1 million of previous capital expenditures for assets that we ultimately leased in the first quarter of 2016.
Net cash used in financing activities:
During 2017, financing activities provided $7.0 million in cash. We increased borrowings under the credit facility by $11.5 million, paid $5.1 million on the term loan and capital leases, and received $0.6 million in proceeds from the issuance of common stock.
During 2016, we used $5.6 million in cash from financing activities. We paid down $5.5 million in debt, incurred $0.8 million of deferred financing costs associated with our new credit facility, and received $0.7 million in proceeds from the issuance of common stock.
We believe that our cash flows from continuing operations, as well as available borrowings under our credit facility, are adequate to satisfy our working capital, capital expenditure requirements, and other contractual obligations for the foreseeable future, including at least the next 12 months.
The average costs per pound of nickel, chrome, molybdenum, and carbon scrap for the years ended December 31, 2017, 2016 and 2015 was as follows:
|
For the years ended December 31, |
|
2017 |
|
|
2016 |
|
|
2015 |
|
||||||
|
|
$ |
|
4.72 |
|
|
$ |
|
4.35 |
|
|
$ |
|
5.37 |
|
|
|
Chrome |
|
$ |
|
1.45 |
|
|
$ |
|
0.95 |
|
|
$ |
|
1.08 |
|
|
Molybdenum |
|
$ |
|
8.22 |
|
|
$ |
|
6.54 |
|
|
$ |
|
6.85 |
|
|
Carbon scrap |
|
$ |
|
0.17 |
|
|
$ |
|
0.10 |
|
|
$ |
|
0.10 |
|
Sources: Nickel is the monthly average LME Cash Settlement Price; Chrome is the final monthly average as published by CRU; Molybdenum is the monthly average price on Metalprices.com; Carbon is the consumer price for #1 Industrial Bundles in the Pittsburgh, PA area as reported on Metalprices.com.
We maintain sales price surcharge mechanisms on certain of our products, priced at time of order or shipment, to mitigate the risk of substantial raw material cost fluctuations. The market values for these raw materials and others continue to fluctuate based on supply and demand, market disruptions and other factors.
Capital Resources Including Off-Balance Sheet Arrangements.
We do not maintain off-balance sheet arrangements, nor do we participate in non-exchange traded contracts requiring fair value accounting treatment, or material related-party transaction arrangements.
20
On January 21, 2016, we entered into a new Revolving Credit, Term Loan and Security Agreement (the “Credit Agreement”) with PNC Bank, National Association, as administrative agent and co-collateral agent, Bank of America, N.A., as co-collateral agent, and PNC Capital Markets LLC, as sole lead arranger and sole bookrunner. The Credit Agreement provides for a senior secured revolving credit facility not to exceed $65.0 million (the “Revolving Credit Facility”) and a senior secured term loan facility (the “Term Loan”) in the amount of $30.0 million (together with the Revolving Credit Facility, the “Facilities”). The Credit Agreement also provides for a letter of credit sub-facility not to exceed $10.0 million and a swing loan sub-facility not to exceed $6.5 million. The Company may request to increase the maximum aggregate principal amount of borrowings under the Revolving Credit Facility by $25.0 million prior to January 21, 2020. The Credit Agreement replaced the previous credit agreement that was in place prior to January 21, 2016. The Company was in compliance with all applicable financial covenants set forth in the previous credit agreement as of the date of its entrance into the Credit Agreement.
The Facilities, which expire upon the earlier of (i) January 21, 2021 or (ii) the date that is 90 days prior to the scheduled maturity date of the Notes (as defined below) (in either case, the “Expiration Date”), are collateralized by a first lien in substantially all of the assets of the Company and its subsidiaries, except that no real property is collateral under the Facilities other than the Company’s real property in North Jackson, Ohio.
Availability under the Revolving Credit Facility is based on eligible accounts receivable and inventory. The Company is required to pay a commitment fee of 0.25% based on the daily unused portion of the Revolving Credit Facility.
With respect to the Term Loan, the Company makes quarterly installment payments of principal of approximately $1.1 million, plus accrued and unpaid interest, on the first day of each fiscal quarter. To the extent not previously paid, the Term Loan will become due and payable in full on the Expiration Date.
Amounts outstanding under the Facilities, at the Company’s option, will bear interest at either a base rate plus a margin, or a rate based on LIBOR plus a margin, in either case calculated in accordance with the terms of the Credit Agreement. Interest under the Credit Agreement is payable monthly. We elected to use the LIBOR based rate for the majority of the debt outstanding under the Facilities for the twelve months ended December 31, 2017, which was 3.37% on our Revolving Credit Facility and 3.87% for the Term Loan at December 31, 2017.
On October 23, 2017, the Company announced that it obtained a favorable amendment to the Credit Agreement that lowers the Company’s interest on its senior bank borrowings by 75 basis points. At current borrowing levels, this change will reduce annual interest expense by approximately $0.4 million. In addition, several terms of the Credit agreement were amended and will provide additional liquidity to the Company.
The Credit Agreement contains customary affirmative and negative covenants. As of December 31, 2016, and as of the end of each fiscal quarter ending thereafter, the Company must maintain a fixed charge coverage ratio of not less than 1.10 to 1.0, in each case measured on a rolling four-quarter basis calculated in accordance with the terms of the Credit Agreement. The October 23, 2017 amendment made no changes to the financial covenants. We were in compliance with our covenants under the Credit Agreement at December 31, 2017 and 2016.
At December 31, 2017, we had deferred financing costs of approximately $0.7 million, and amortized approximately $0.3 million of deferred financing costs for the twelve months ended December 31, 2017. For the twelve months ended December 31, 2016, we paid deferred financing costs of $0.8 million related to the Credit Agreement, wrote off $0.8 million of fees related to the previous credit agreement and amortized $0.2 million of deferred financing costs.
Pursuant to the terms of the Credit Agreement, the Company completed the issuance of 73,207 shares of the Company’s common stock to certain directors and officers of the Company on February 2, 2016. The aggregate purchase price of the stock was $0.5 million based on the average of the high and low reported trading prices for the Company’s common stock on The NASDAQ Stock Market on February 1, 2016.
21
On January 21, 2016, the Company entered into the Notes in the aggregate principal amount of $20.0 million, each in favor of Gorbert Inc. (the “Holder”). The Notes amended and restated the Convertible Notes. The Company’s obligations under the Notes are collateralized by a second lien on the same assets of the Company that collateralize the obligations of the Company under the Facilities. The Notes mature on March 17, 2019, and the maturity date may be extended, at the Company’s option, to March 17, 2020 and further to March 17, 2021. If the Company elects to extend the maturity date of the Notes to March 17, 2020, principal payments in the aggregate of $2.0 million will be required within 10 days of March 7, 2019. If the Company elects to extend the maturity date of the Notes further to March 17, 2021, principal payments in the aggregate of $2.0 million will be required within 10 days of March 7, 2020.
The Notes bore interest at a rate of 4.0% per year through and including August 17, 2016. The Notes bear interest at a rate of 5.0% per year from August 18, 2016 through and including August 17, 2017 and a rate of 6.0% per year from and after August 18, 2017. Through and including June 18, 2017, all accrued and unpaid interest is payable semi-annually in arrears on each June 18 and December 18. After June 18, 2017, all accrued and unpaid interest is payable quarterly in arrears on each September 18, December 18, March 18 and June 18.
The Holder could have elected at any time on or prior to August 17, 2017 to convert all or any portion of the outstanding principal amount of the Notes which is an integral multiple of $100,000. The Notes were convertible into shares of common stock and, in certain circumstances, cash, securities and/or other assets. The Notes were convertible based on an initial conversion rate of 21.2 shares of Common Stock per $1,000 principal amount of the Notes (equivalent to an initial conversion price of $47.1675 per share). The conversion rate and the conversion price associated with the Notes could have been adjusted in certain circumstances. The Holder did not exercise the conversion rights prior to their expiration, and the rights are now void.
In conjunction with the issuance of the Notes on January 21, 2016, we made principal prepayments on the Notes totaling $1.0 million.
Capital Leases
Throughout 2017, the company entered into four capital leases for office and manufacturing equipment, with lease terms between three and six years. The capital assets and obligations are recorded at the present value of minimum lease payments. The assets are included in Property, plant and equipment, net on the Consolidated Balance Sheet and are depreciated over the term of each lease. The long-term component of the capital lease obligations is included in Long-term debt and the current component is included in Current portion of long-term debt. These amounts have been excluded from the Consolidated Statement of Cash Flows as they are non-cash. The net present value of the minimum lease payments, at inception, was $0.5 million.
On February 1, 2016 and March 1, 2016, the Company entered into capital leases for equipment, each with a term of five years. The net present value of the minimum lease payments, at inception, was $2.0 million.
Share-Based Activity
We issued 20,363, 30,754, and 33,175 shares of our common stock during the years ended December 31, 2017, 2016 and 2015, respectively, through our two share-based compensation plans. In addition, in 2016 we issued 73,207 shares of the Company’s common stock to certain directors and officers of the Company, pursuant to the terms of the Credit Agreement. In 2017, 22,125 stock options issued under the Omnibus Incentive Plan (“OIP”) were exercised for an aggregate exercise price of $0.3 million. In 2016, there were no stock options exercised under the OIP. In 2015, 17,500 stock options issued under the OIP were exercised for an aggregate exercise price of $0.3 million. During the years ended December 31, 2017, 2016 and 2015, respectively, there were 128,325, 47,250 and 108,825 options forfeited under the two plans. The remaining shares were issued to participants in the Employee Stock Purchase Plan. Additionally, during the year ended December 31, 2017, we granted 14,280 restricted stock units to certain employees and directors, and during the year ended December 31, 2016, we granted 95,000 restricted stock units to certain employees. There were 27,000 restricted stock units forfeited in 2017.
22
At December 31, 2017, we had the following contractual principal, interest and purchase obligations:
|
|
|
Payments due by period |
|
|||||||||||||||||
|
|
|
|
|
|
|
Less than |
|
|
1-3 |
|
|
|
|
|||||||
|
(dollars in thousands) |
|
Total |
|
|
1 year |
|
|
years |
|
|
Thereafter |
|
||||||||
|
Long-term debt (A) |
|
$ |
|
87,921 |
|
|
$ |
|
8,045 |
|
|
$ |
|
32,537 |
|
|
$ |
|
47,339 |
|
|
Purchase obligations - other (B) |
|
|
|
12,070 |
|
|
|
|
8,967 |
|
|
|
|
2,604 |
|
|
|
|
499 |
|
|
Purchase obligations - capital expenditures (B) |
|
|
|
8,915 |
|
|
|
|
8,915 |
|
|
|
|
- |
|
|
|
|
- |
|
|
Total contractual obligations |
|
$ |
|
108,906 |
|
|
$ |
|
25,927 |
|
|
$ |
|
35,141 |
|
|
$ |
|
47,838 |
|
|
(A) |
Amounts include interest expense, which was estimated based upon the December 31, 2017 interest rate for our debt and assumes that debt will not be repaid until its maturity. The 1-3 years period includes the maturity of $19.0 million of the Notes in 2019 which, at the discretion of the Company, may be extended until 2020 or 2021. |
|
(B) |
Purchase obligations include the value of all open purchase orders with established quantities and purchase prices as well as minimum purchase commitments and operating leases. |
CONTINGENT ITEMS
Product Claims. We are subject to various claims and legal actions that arise in the normal course of conducting business. There were no material product claims outstanding at December 31, 2017.
Environmental Matters. We, as well as other steel companies, are subject to demanding environmental standards imposed by federal, state and local environmental laws and regulations. We are not aware of any environmental condition that currently exists at any of our facilities that are probable or reasonably possible of having a material impact on our results of operations or liquidity.
We are aware of energy usage concerns relating to climate change; however, we are not aware of any pending regulations that are expected to have a material impact on our results of operations or liquidity.
Legal Matters. From time to time, various lawsuits and claims have been or may be asserted against us relating to the conduct of our business, including routine litigation relating to commercial and employment matters. The ultimate cost and outcome of any litigation or claim cannot be predicted with certainty. Management believes, based on information presently available, that the likelihood that the ultimate outcome of any such pending matter will have a material adverse effect on its financial condition, or liquidity or a material impact to its results of operations is remote, although the resolution of one or more of these matters may have a material adverse effect on its results of operations for the period in which the resolution occurs.
CRITICAL ACCOUNTING POLICIES AND NEW ACCOUNTING PRONOUNCEMENTS
Critical Accounting Policies
Revenue from the sale of products is recognized when both risk of loss and title have transferred to the customer, which in most cases coincides with shipment of the related products, and collection is reasonably assured. We manufacture specialty steel products to customer purchase order specifications and in recognition of requirements for product acceptance. Material certification forms are executed, indicating compliance with the customer purchase orders, before the specialty steel products are packed and shipped to the customer.
Revenue from conversion services is recognized when the performance of the service is complete. Invoiced shipping and handling costs are also accounted for as revenue.
Customer claims, which are not material, are accounted for primarily as a reduction to gross sales after the matter has been researched and an acceptable resolution has been reached.
23
In addition, management regularly monitors the ability to collect its unpaid sales invoices and the valuation of its receivables. The allowance for doubtful accounts includes specific reserves for the value of outstanding invoices issued to customers that are deemed potentially not collectible.
Inventories are stated at the lower of cost or market. The cost of inventory is principally determined by the weighted average cost method for material and operation costs. An inventory reserve is provided for material on hand for which management believes cost exceeds net realizable value. We reserve for slow-moving inventory and inventory that is being evaluated under our quality control process. The reserves are based upon management’s expected method of disposition.
Property, Plant and Equipment (“PP&E”) is stated at historical cost or fair value at acquisition less accumulated depreciation. Depreciation is computed by the straight-line method over the estimated useful lives of the assets for book purposes. Depreciation for income tax purposes is computed using accelerated methods. Upon disposal, assets and related accumulated depreciation are removed from the financial statements and differences between the net book value and proceeds from disposal are generally included in cost of goods sold in the consolidated statement of operations. PP&E is evaluated for impairment whenever events or changes in circumstances indicate that the carrying amount of an asset may not be recoverable in relation to the operating performance and future undiscounted cash flows of the underlying assets. Adjustments are made if the sum of expected future cash flows is less than book value. No impairment reserve was deemed necessary as of December 31, 2017, 2016 and 2015.
Deferred income taxes are provided for temporary differences between amounts of assets and liabilities for financial reporting purposes and the basis of such assets and liabilities as measured by tax laws and regulations. Our deferred tax assets include net operating loss carry forwards that can be used to offset taxable income in future periods and reduce income taxes payable in those future periods. These deferred tax assets will expire, if unused, at various times through 2031. Deferred tax liabilities primarily relate to book / tax depreciation differences. Management assesses the need to record a valuation allowance to reduce deferred tax assets to the amount that is more likely than not to be realized.
The calculation for our share-based compensation expense involves a number of assumptions. Management believes each assumption used in the valuation is reasonable because it takes into account the experience of the plan and reasonable expectations. Management estimates volatility based on historical data, future expectations and the expected term of the share-based compensation awards. The assumptions, however, involve inherent uncertainties. As a result, if other assumptions had been used, share-based compensation expense could have varied.
New Accounting Pronouncements
See information under the heading “Note 1: Significant Accounting Policies” within “Notes to Consolidated Financial Statements” in Item 8, Financial Statements and Supplementary Data, in this Annual Report on Form 10-K for details of recently issued accounting pronouncements and their expected impact on our consolidated financial statements.
24
The majority of our customers and suppliers absorb fluctuations in foreign currency exchange rates. Prices for our raw materials and natural gas requirements are subject to frequent market fluctuations, and profit margins may decline in the event market prices increase. Selling price increases and surcharges are utilized to offset raw material and natural gas market price increases.
Raw material prices vary based on numerous factors, including quality, and are subject to frequent market fluctuations. Future raw material prices cannot be predicted with any degree of certainty. We do not maintain any fixed-price long-term agreements with any of our raw material suppliers.
We maintain a sales price surcharge mechanism on certain of our products to help offset the impact of raw material price fluctuations. For certain products, the surcharge is calculated at the time of order entry, based on current raw material prices or prices at the time of shipment. For certain finished products, the surcharge is calculated based on the monthly average raw material prices two months prior to the promised ship date. While the material surcharge mechanism is designed to offset modest fluctuations in raw material prices, it cannot immediately absorb significant spikes in raw material prices. A material change in raw material prices within a short period of time could have a material effect on our financial results and there can be no assurance that the raw material surcharge mechanism will completely offset immediate changes in our raw material costs.
At December 31, 2017, we had $59.6 million of floating rate debt outstanding with an interest rate between 3.37% and 6.0%. Since the interest rate on floating rate debt changes with the short-term market rate of interest, we are exposed to the risk that these interest rates may increase, raising our interest expense. A hypothetical 1.0% increase or decrease in our floating rate debt interest rates would unfavorably or favorably impact our pre-tax results by $0.6 million.
25
|
Index to Financial Statements |
|
|
|
Page |
|
Management’s Report on Internal Control over Financial Reporting |
27 |
|
28 |
|
|
Financial Statements |
|
|
Consolidated Statements of Operations for the years ended December 31, 2017, 2016 and 2015 |
30 |
|
31 |
|
|
32 |
|
|
Consolidated Statements of Cash Flows for the years ended December 31, 2017, 2016 and 2015 |
33 |
|
Consolidated Statements of Shareholders' Equity for the years ended December 31, 2017, 2016 and 2015 |
34 |
|
35 |
|
|
53 |
|
|
53 |
|
|
|
|
26
MANAGEMENT’S REPORT ON INTERNAL CONTROL OVER FINANCIAL REPORTING
Management is responsible for establishing and maintaining adequate internal control over financial reporting (as defined in Rules 13a-15(f) under the Securities Exchange Act of 1934). Our internal control over financial reporting is designed to provide reasonable assurance to management and the board of directors regarding the preparation and fair presentation of published financial statements. Because of its inherent limitations, internal control over financial reporting may not prevent or detect misstatements. Therefore, even those systems determined to be effective can provide only reasonable assurance with respect to financial statement preparation and presentation. We conducted an assessment of the effectiveness of our internal control over financial reporting based on the criteria established in Internal Control – Integrated Framework issued by the Committee of Sponsoring Organizations (COSO) of the Treadway Commission (2013 Framework). Based on our assessment, we believe that, as of December 31, 2017, our internal control over financial reporting is effective.
The effectiveness of internal control over financial reporting as of December 31, 2017 has been audited by Schneider Downs & Co. Inc., an independent registered public accounting firm which also audited our consolidated financial statements. Schneider Downs’ attestation report on the consolidated financial statements and management’s maintenance of effective internal control over financial reporting is included under the heading “Report of Independent Registered Public Accounting Firm.”
|
/s/ Dennis M. Oates |
|
/s/ Dennis M. Oates |
|
Dennis M. Oates |
|
|
|
Chairman, President and Chief Executive Officer |
|
Principal Financial and Accounting Officer |
27
REPORT OF INDEPENDENT REGISTERED PUBLIC ACCOUNTING FIRM
To the Board of Directors and Stockholders of Universal Stainless & Alloy Products, Inc.
Opinions on the Financial Statements and Internal Control over Financial Reporting
We have audited the accompanying consolidated balance sheets of Universal Stainless & Alloy Products, Inc. (the “Company”) as of December 31, 2017 and 2016, and the related consolidated statements of operations, comprehensive income (loss), cash flows, and shareholders’ equity for each of the three years in the period ended December 31, 2017, and the related notes and schedules (collectively referred to as the “consolidated financial statements”). We also have audited the Company’s internal control over financial reporting as of December 31, 2017, based on criteria established in Internal Control-Integrated Framework (2013) issued by the Committee of Sponsoring Organizations of the Treadway Commission (COSO).
In our opinion, the consolidated financial statements referred to above present fairly, in all material respects, the financial position of the Company as of December 31, 2017 and 2016, and the results of its operations and its cash flows for each of the years in the three-year period ended December 31, 2017, in conformity with accounting principles generally accepted in the United States of America. Also, in our opinion, the Company maintained, in all material respects, effective internal control over financial reporting as of December 31, 2017, based on criteria established in Internal Control-Integrated Framework (2013) issued by COSO.
Basis for Opinions
The Company’s management is responsible for these consolidated financial statements, for maintaining effective internal control over financial reporting, and for its assessment of the effectiveness of internal control over financial reporting, included in the accompanying Management’s Report on Internal Control Over Financial Reporting appearing under Item 8. Our responsibility is to express opinions on the Company’s consolidated financial statements and on the Company’s internal control over financial reporting based on our audits. We are a public accounting firm registered with the Public Company Accounting Oversight Board (United States) (“PCAOB”) and are required to be independent with respect to the Company in accordance with the U.S. federal securities laws and the applicable rules and regulations of the Securities and Exchange Commission and the PCAOB.
We conducted our audits in accordance with the standards of the PCAOB. Those standards require that we plan and perform the audits to obtain reasonable assurance about whether the consolidated financial statements are free of material misstatement, whether due to error or fraud, and whether effective internal control over financial reporting was maintained in all material respects.
Our audits of the consolidated financial statements included performing procedures to assess the risks of material misstatement of the consolidated financial statements, whether due to error or fraud, and performing procedures that respond to those risks. Such procedures included examining, on a test basis, evidence regarding the amounts and disclosures in the consolidated financial statements. Our audits also included evaluating the accounting principles used and significant estimates made by management, as well as evaluating the overall presentation of the consolidated financial statements. Our audit of internal control over financial reporting included obtaining an understanding of internal control over financial reporting, assessing the risk that a material weakness exists, and testing and evaluating the design and operating effectiveness of internal control based on the assessed risk. Our audits also included performing such other procedures as we considered necessary in the circumstances. We believe that our audits provide a reasonable basis for our opinions.
28
Definition and Limitations of Internal Control over Financial Reporting
A company’s internal control over financial reporting is a process designed to provide reasonable assurance regarding the reliability of financial reporting and the preparation of financial statements for external purposes in accordance with generally accepted accounting principles. A company’s internal control over financial reporting includes those policies and procedures that (1) pertain to the maintenance of records that, in reasonable detail, accurately and fairly reflect the transactions and dispositions of the assets of the company; (2) provide reasonable assurance that transactions are recorded as necessary to permit preparation of financial statements in accordance with generally accepted accounting principles, and that receipts and expenditures of the company are being made only in accordance with authorizations of management and directors of the company; and (3) provide reasonable assurance regarding prevention or timely detection of unauthorized acquisition, use, or disposition of the company’s assets that could have a material effect on the financial statements.
Because of its inherent limitations, internal control over financial reporting may not prevent or detect misstatements. Also, projections of any evaluation of effectiveness to future periods are subject to the risk that controls may become inadequate because of changes in conditions, or that the degree of compliance with the policies or procedures may deteriorate.
/s/ Schneider Downs & Co., Inc.
Schneider Downs & Co., Inc.
We have served as the Company’s auditor since 2003.
Pittsburgh, Pennsylvania
February 23, 2018
29
UNIVERSAL STAINLESS & ALLOY PRODUCTS, INC.
CONSOLIDATED STATEMENTS OF OPERATIONS
|
For the years ended December 31, |
|
2017 |
|
|
2016 |
|
|
2015 |
|
||||||
|
|
|
|
|
|
|
|
|
|
|
|
|
|
|
|
|
|
Net sales |
|
$ |
|
202,643 |
|
|
$ |
|
154,434 |
|
|
$ |
|
180,660 |
|
|
Cost of products sold |
|
|
|
179,609 |
|
|
|
|
140,921 |
|
|
|
|
171,065 |
|
|
Gross margin |
|
|
|
23,034 |
|
|
|
|
13,513 |
|
|
|
|
9,595 |
|
|
Selling, general and administrative expenses |
|
|
|
18,797 |
|
|
|
|
17,482 |
|
|
|
|
19,406 |
|
|
Goodwill impairment |
|
|
|
- |
|
|
|
|
- |
|
|
|
|
20,268 |
|
|
Operating income (loss) |
|
|
|
4,237 |
|
|
|
|
(3,969 |
) |
|
|
|
(30,079 |
) |
|
Interest expense and other financing costs |
|
|
|
4,277 |
|
|
|
|
4,674 |
|
|
|
|
2,890 |
|
|
Other (income) expense |
|
|
|
(49 |
) |
|
|
|
230 |
|
|
|
|
(153 |
) |
|
Income (loss) before income taxes |
|
|
|
9 |
|
|
|
|
(8,873 |
) |
|
|
|
(32,816 |
) |
|
Benefit from income taxes |
|
|
|
(7,601 |
) |
|
|
|
(3,526 |
) |
|
|
|
(12,144 |
) |
|
Net income (loss) |
|
$ |
|
7,610 |
|
|
$ |
|
(5,347 |
) |
|
$ |
|
(20,672 |
) |
|
Basic earnings (loss) per share |
|
$ |
|
1.05 |
|
|
$ |
|
(0.74 |
) |
|
$ |
|
(2.92 |
) |
|
Diluted earnings (loss) per share |
|
$ |
|
1.03 |
|
|
$ |
|
(0.74 |
) |
|
$ |
|
(2.92 |
) |
|
Weighted average shares of common stock outstanding: |
|
|
|
|
|
|
|
|
|
|
|
|
|
|
|
|
Basic |
|
|
|
7,225,697 |
|
|
|
|
7,193,300 |
|
|
|
|
7,069,954 |
|
|
Diluted |
|
|
|
7,374,805 |
|
|
|
|
7,193,300 |
|
|
|
|
7,069,954 |
|
The accompanying notes are an integral part of these consolidated financial statements.
30
UNIVERSAL STAINLESS & ALLOY PRODUCTS, INC.
CONSOLIDATED STATEMENTS OF COMPREHENSIVE INCOME (LOSS)
|
|
|
|
|
|
|
|
|
|
|
||||||
|
For the years ended December 31, |
|
2017 |
|
|
2016 |
|
|
2015 |
|
||||||
|
(dollars in thousands) |
|
|
|
|
|
|
|
|
|
|
|
|
|
|
|
|
Net income (loss) |
|
$ |
|
7,610 |
|
|
$ |
|
(5,347 |
) |
|
$ |
|
(20,672 |
) |
|
Other comprehensive (loss) income, net of tax: |
|
|
|
|
|
|
|
|
|
|
|
|
|
|
|
|
Unrealized gain (loss) on foreign currency contracts, net of tax |
|
|
|
(114 |
) |
|
|
|
21 |
|
|
|
|
- |
|
|
|
|
|
|
|
|
|
|
|
|
|
|
|
|
|
|
|
Comprehensive income (loss) |
|
$ |
|
7,496 |
|
|
$ |
|
(5,326 |
) |
|
$ |
|
(20,672 |
) |
The accompanying notes are an integral part of these consolidated financial statements.
31
UNIVERSAL STAINLESS & ALLOY PRODUCTS, INC.
|
|
2017 |
|
|
2016 |
|
|||||
|
(dollars in thousands) |
|
|
|
|
|
|
|
|
|
|
|
ASSETS |
|
|
|
|
|
|
|
|
|
|
|
Current assets: |
|
|
|
|
|
|
|
|
|
|
|
Cash |
|
$ |
|
207 |
|
|
$ |
|
75 |
|
|
Accounts receivable (less allowance for doubtful accounts of $456 and $309, respectively) |
|
|
|
24,990 |
|
|
|
|
19,437 |
|
|
Inventory, net |
|
|
|
116,663 |
|
|
|
|
91,342 |
|
|
Other current assets |
|
|
|
4,404 |
|
|
|
|
2,729 |
|
|
Total current assets |
|
|
|
146,264 |
|
|
|
|
113,583 |
|
|
Property, plant and equipment, net |
|
|
|
174,444 |
|
|
|
|
182,398 |
|
|
Other long-term assets |
|
|
|
523 |
|
|
|
|
64 |
|
|
Total assets |
|
$ |
|
321,231 |
|
|
$ |
|
296,045 |
|
|
LIABILITIES AND STOCKHOLDERS’ EQUITY |
|
|
|
|
|
|
|
|
|
|
|
Current liabilities: |
|
|
|
|
|
|
|
|
|
|
|
Accounts payable |
|
$ |
|
34,898 |
|
|
$ |
|
19,906 |
|
|
Accrued employment costs |
|
|
|
4,075 |
|
|
|
|
3,803 |
|
|
Current portion of long-term debt |
|
|
|
4,707 |
|
|
|
|
4,579 |
|
|
Other current liabilities |
|
|
|
1,268 |
|
|
|
|
898 |
|
|
Total current liabilities |
|
|
|
44,948 |
|
|
|
|
29,186 |
|
|
Long-term debt |
|
|
|
75,006 |
|
|
|
|
67,998 |
|
|
Deferred income taxes |
|
|
|
9,605 |
|
|
|
|
17,629 |
|
|
Other long-term liabilities |
|
|
|
4 |
|
|
|
|
12 |
|
|
Total liabilities |
|
|
|
129,563 |
|
|
|
|
114,825 |
|
|
Commitments and contingencies (Note 11) |
|
|
|
|
|
|
|
|
|
|
|
Stockholders’ equity: |
|
|
|
|
|
|
|
|
|
|
|
Senior preferred stock, par value $0.001 per share; 1,980,000 shares authorized; 0 shares issued and outstanding |
|
|
|
- |
|
|
|
|
- |
|
|
Common stock, par value $0.001 per share; 20,000,000 shares authorized; 7,550,642 and 7,508,154 shares issued, respectively |
|
|
|
8 |
|
|
|
|
8 |
|
|
Additional paid-in capital |
|
|
|
58,514 |
|
|
|
|
56,397 |
|
|
Other comprehensive income (loss) |
|
|
|
(93 |
) |
|
|
|
21 |
|
|
Retained earnings |
|
|
|
135,529 |
|
|
|
|
127,084 |
|
|
Treasury stock, at cost; 292,855 common shares held, respectively |
|
|
|
(2,290 |
) |
|
|
|
(2,290 |
) |
|
Total stockholders’ equity |
|
|
|
191,668 |
|
|
|
|
181,220 |
|
|
Total liabilities and stockholders’ equity |
|
$ |
|
321,231 |
|
|
$ |
|
296,045 |
|
The accompanying notes are an integral part of these consolidated financial statements.
32
UNIVERSAL STAINLESS & ALLOY PRODUCTS, INC.
CONSOLIDATED STATEMENTS OF CASH FLOWS
|
|
2017 |
|
|
2016 |
|
|
2015 |
|
|||||||
|
(dollars in thousands) |
|
|
|
|
|
|
|
|
|
|
|
|
|
|
|
|
Operating Activities: |
|
|
|
|
|
|
|
|
|
|
|
|
|
|
|
|
Net income (loss) |
|
$ |
|
7,610 |
|
|
$ |
|
(5,347 |
) |
|
$ |
|
(20,672 |
) |
|
Adjustments to reconcile net income (loss) to net cash provided by operating activities: |
|
|
|
|
|
|
|
|
|
|
|
|
|
|
|
|
Depreciation and amortization |
|
|
|
18,823 |
|
|
|
|
18,533 |
|
|
|
|
18,608 |
|
|
Deferred income tax |
|
|
|
(7,593 |
) |
|
|
|
(3,525 |
) |
|
|
|
(12,060 |
) |
|
Write-off of deferred financing costs |
|
|
|
- |
|
|
|
|
768 |
|
|
|
|
- |
|
|
Share-based compensation expense, net |
|
|
|
1,564 |
|
|
|
|
1,405 |
|
|
|
|
1,865 |
|
|
Net gain on asset disposals |
|
|
|
(70 |
) |
|
|
|
(340 |
) |
|
|
|
- |
|
|
Goodwill impairment |
|
|
|
- |
|
|
|
|
- |
|
|
|
|
20,268 |
|
|
Changes in assets and liabilities: |
|
|
|
|
|
|
|
|
|
|
|
|
|
|
|
|
Accounts receivable, net |
|
|
|
(5,567 |
) |
|
|
|
(1,754 |
) |
|
|
|
11,374 |
|
|
Inventory, net |
|
|
|
(27,378 |
) |
|
|
|
(9,155 |
) |
|
|
|
15,929 |
|
|
Accounts payable |
|
|
|
14,178 |
|
|
|
|
7,096 |
|
|
|
|
(13,009 |
) |
|
Accrued employment costs |
|
|
|
272 |
|
|
|
|
547 |
|
|
|
|
(2,755 |
) |
|
Income taxes |
|
|
|
77 |
|
|
|
|
200 |
|
|
|
|
(248 |
) |
|
Other, net |
|
|
|
(811 |
) |
|
|
|
(22 |
) |
|
|
|
(130 |
) |
|
Net cash provided by operating activities |
|
|
|
1,105 |
|
|
|
|
8,406 |
|
|
|
|
19,170 |
|
|
Investing Activities: |
|
|
|
|
|
|
|
|
|
|
|
|
|
|
|
|
Capital expenditures |
|
|
|
(7,996 |
) |
|
|
|
(4,376 |
) |
|
|
|
(9,551 |
) |
|
Proceeds from sale of property, plant and equipment |
|
|
|
70 |
|
|
|
|
1,571 |
|
|
|
|
- |
|
|
Proceeds from insurance recovery |
|
|
|
- |
|
|
|
|
- |
|
|
|
|
218 |
|
|
Net cash used in investing activities |
|
|
|
(7,926 |
) |
|
|
|
(2,805 |
) |
|
|
|
(9,333 |
) |
|
Financing Activities: |
|
|
|
|
|
|
|
|
|
|
|
|
|
|
|
|
Borrowings under revolving credit facility |
|
|
|
350,314 |
|
|
|
|
241,152 |
|
|
|
|
73,515 |
|
|
Payments on revolving credit facility |
|
|
|
(338,836 |
) |
|
|
|
(259,243 |
) |
|
|
|
(80,253 |
) |
|
Borrowings under term loan facility |
|
|
|
- |
|
|
|
|
30,000 |
|
|
|
|
- |
|
|
Payments on term loan facility, capital leases, and convertible notes |
|
|
|
(5,078 |
) |
|
|
|
(17,448 |
) |
|
|
|
(3,000 |
) |
|
Proceeds from the issuance of common stock |
|
|
|
553 |
|
|
|
|
651 |
|
|
|
|
455 |
|
|
Payment of deferred financing costs |
|
|
|
- |
|
|
|
|
(750 |
) |
|
|
|
(584 |
) |
|
Net cash provided by (used in) financing activities |
|
|
|
6,953 |
|
|
|
|
(5,638 |
) |
|
|
|
(9,867 |
) |
|
Net increase (decrease) in cash |
|
|
|
132 |
|
|
|
|
(37 |
) |
|
|
|
(30 |
) |
|
Cash at beginning of period |
|
|
|
75 |
|
|
|
|
112 |
|
|
|
|
142 |
|
|
Cash at end of period |
|
$ |
|
207 |
|
|
$ |
|
75 |
|
|
$ |
|
112 |
|
|
Supplemental Disclosure of Cash Flow Information: |
|
|
|
|
|
|
|
|
|
|
|
|
|
|
|
|
Interest paid |
|
$ |
|
4,027 |
|
|
$ |
|
3,451 |
|
|
$ |
|
2,384 |
|
|
Income taxes paid (refunded), net |
|
$ |
|
(85 |
) |
|
$ |
|
(201 |
) |
|
$ |
|
165 |
|
The accompanying notes are an integral part of these consolidated financial statements.
33
UNIVERSAL STAINLESS & ALLOY PRODUCTS, INC.
CONSOLIDATED STATEMENTS OF SHAREHOLDERS’ EQUITY
|
|
|
|
|
|
|
|
|
|
|
|
|
|
|
|
|
|
|
|
|
|
|
|
|
|
Accumulated |
|
|
|
|
|
|
||
|
|
|
Common |
|
|
|
|
|
|
|
Additional |
|
|
|
|
|
|
|
|
|
|
|
other |
|
|
|
|
|
|
|||||
|
|
|
shares |
|
|
Common |
|
|
paid-in |
|
|
Retained |
|
|
Treasury |
|
|
comprehensive |
|
|
|
Treasury |
|
|||||||||||
|
|
|
outstanding |
|
|
stock |
|
|
capital |
|
|
earnings |
|
|
shares |
|
|
income (loss) |
|
|
|
stock |
|
|||||||||||
|
(dollars in thousands) |
|
|
|
|
|
|
|
|
|
|
|
|
|
|
|
|
|
|
|
|
|
|
|
|
|
|
|
|
|
|
|
|
|
|
Balance at January 1, 2015 |
|
|
7,078,163 |
|
|
$ |
|
7 |
|
|
$ |
|
52,810 |
|
|
$ |
|
153,103 |
|
|
|
292,855 |
|
|
$ |
|
- |
|
|
$ |
|
(2,290 |
) |
|
Common stock issuance under |
|
|
|
|
|
|
|
|
|
|
|
|
|
|
|
|
|
|
|
|
|
|
|
|
|
|
|
|
|
|
|
|
|
|
Employee Stock Purchase Plan |
|
|
15,675 |
|
|
|
|
- |
|
|
|
|
188 |
|
|
|
|
- |
|
|
|
- |
|
|
|
|
- |
|
|
|
|
- |
|
|
Exercise of stock options |
|
|
17,500 |
|
|
|
|
- |
|
|
|
|
267 |
|
|
|
|
- |
|
|
|
- |
|
|
|
|
- |
|
|
|
|
- |
|
|
Tax impact on RSUs vested and options exercised or forfeited |
|
|
- |
|
|
|
|
- |
|
|
|
|
(301 |
) |
|
|
|
- |
|
|
|
- |
|
|
|
|
- |
|
|
|
|
- |
|
|
Share-based compensation |
|
|
- |
|
|
|
|
- |
|
|
|
|
1,865 |
|
|
|
|
- |
|
|
|
- |
|
|
|
|
- |
|
|
|
|
- |
|
|
Net loss |
|
|
- |
|
|
|
|
- |
|
|
|
|
- |
|
|
|
|
(20,672 |
) |
|
|
- |
|
|
|
|
- |
|
|
|
|
- |
|
|
Balance at December 31, 2015 |
|
|
7,111,338 |
|
|
|
|
7 |
|
|
|
|
54,829 |
|
|
|
|
132,431 |
|
|
|
292,855 |
|
|
|
|
- |
|
|
|
|
(2,290 |
) |
|
Common stock issuance under |
|
|
|
|
|
|
|
|
|
|
|
|
|
|
|
|
|
|
|
|
|
|
|
|
|
|
|
|
|
|
|
|
|
|
Employee Stock Purchase Plan |
|
|
17,268 |
|
|
|
|
- |
|
|
|
|
151 |
|
|
|
|
- |
|
|
|
- |
|
|
|
|
- |
|
|
|
|
- |
|
|
Capital investment |
|
|
73,207 |
|
|
|
|
1 |
|
|
|
|
500 |
|
|
|
|
- |
|
|
|
- |
|
|
|
|
- |
|
|
|
|
- |
|
|
Tax impact on RSUs vested and options exercised or forfeited |
|
|
- |
|
|
|
|
- |
|
|
|
|
(488 |
) |
|
|
|
- |
|
|
|
- |
|
|
|
|
- |
|
|
|
|
- |
|
|
Share-based compensation |
|
|
13,486 |
|
|
|
|
- |
|
|
|
|
1,405 |
|
|
|
|
- |
|
|
|
- |
|
|
|
|
- |
|
|
|
|
- |
|
|
Net gain on derivative instruments |
|
|
- |
|
|
|
|
- |
|
|
|
|
- |
|
|
|
|
- |
|
|
|
- |
|
|
|
|
21 |
|
|
|
|
- |
|
|
Net loss |
|
|
- |
|
|
|
|
- |
|
|
|
|
- |
|
|
|
|
(5,347 |
) |
|
|
- |
|
|
|
|
- |
|
|
|
|
- |
|
|
Balance at December 31, 2016 |
|
|
7,215,299 |
|
|
|
|
8 |
|
|
|
|
56,397 |
|
|
|
|
127,084 |
|
|
|
292,855 |
|
|
|
|
21 |
|
|
|
|
(2,290 |
) |
|
Common stock issuance under |
|
|
|
|
|
|
|
|
|
|
|
|
|
|
|
|
|
|
|
|
|
|
|
|
|
|
|
|
|
|
|
|
|
|
Employee Stock Purchase Plan |
|
|
16,185 |
|
|
|
|
- |
|
|
|
|
226 |
|
|
|
|
- |
|
|
|
- |
|
|
|
|
- |
|
|
|
|
- |
|
|
Exercise of stock options |
|
|
22,125 |
|
|
|
|
- |
|
|
|
|
327 |
|
|
|
|
- |
|
|
|
- |
|
|
|
|
- |
|
|
|
|
- |
|
|
Share-based compensation |
|
|
4,178 |
|
|
|
|
- |
|
|
|
|
1,564 |
|
|
|
|
- |
|
|
|
- |
|
|
|
|
- |
|
|
|
|
- |
|
|
Net loss on derivative instruments |
|
|
- |
|
|
|
|
- |
|
|
|
|
- |
|
|
|
|
- |
|
|
|
- |
|
|
|
|
(114 |
) |
|
|
|
- |
|
|
Retroactive adoption of ASU 2016-09 |
|
|
- |
|
|
|
|
- |
|
|
|
|
- |
|
|
|
|
835 |
|
|
|
- |
|
|
|
|
- |
|
|
|
|
- |
|
|
Net income |
|
|
- |
|
|
|
|
- |
|
|
|
|
- |
|
|
|
|
7,610 |
|
|
|
- |
|
|
|
|
- |
|
|
|
|
- |
|
|
|
|
|
|
|
|
|
|
|
|
|
|
|
|
|
|
|
|
|
|
|
|
|
|
|
|
|
|
|
|
|
|
|
|
|
Balance at December 31, 2017 |
|
|
7,257,787 |
|
|
$ |
|
8 |
|
|
$ |
|
58,514 |
|
|
$ |
|
135,529 |
|
|
|
292,855 |
|
|
$ |
|
(93 |
) |
|
$ |
|
(2,290 |
) |
The accompanying notes are an integral part of these consolidated financial statements.
34
UNIVERSAL STAINLESS & ALLOY PRODUCTS, INC.
NOTES TO CONSOLIDATED FINANCIAL STATEMENTS
Note 1: Significant Accounting Policies
Basis of Consolidation. The consolidated financial statements include the accounts of Universal Stainless & Alloy Products, Inc. and its wholly-owned subsidiaries (collectively, “we,” “us,” “our,” or the “Company”). All intercompany accounts and transactions have been eliminated in consolidation. We have no interests in any unconsolidated entity.
Use of Estimates. The preparation of financial statements in conformity with U.S. Generally Accepted Accounting Principles (“GAAP”) requires management to make estimates and assumptions that affect the amounts reported in the consolidated financial statements. The estimates and assumptions used in these consolidated financial statements are based on known information available as of the balance sheet date. Actual results could differ from those estimates.
Concentration of Credit Risk. We limit our credit risk on accounts receivable by performing ongoing credit evaluations and, when deemed necessary, require letters of credit, guarantees or cash collateral. During 2017, we had one customer which accounted for more than 17% of our total net sales and for 3% of our total accounts receivable balance. During 2016, we had one customer that accounted for more than 20% of our total net sales and for 4% of our total accounts receivable balance. During 2015, we had one customer that accounted for more than 16% of our total net sales and for 7% of our total accounts receivable balance.
Accounts Receivable and Allowance for Doubtful Accounts. Accounts receivable are presented net of the allowance for doubtful accounts on our consolidated balance sheets. We market our products to a diverse customer base, primarily throughout the United States. International sales approximated 9%, of 2017, 2016 and 2015 total net sales. The allowance for doubtful accounts includes specific reserves for the value of outstanding invoices issued to customers that are deemed potentially not collectible. Receivables are charged-off to the allowance when they are deemed to be uncollectible. Bad debt expense, net of recoveries, was $0.2 million for the years ended December 31, 2017, 2016 and 2015.
Inventories. Inventories are stated at the lower of cost or market with cost principally determined by the weighted average cost method. Such costs include the acquisition cost for raw materials and supplies, direct labor and applied manufacturing overhead within the guidelines of normal plant capacity. We reserve for slow-moving inventory and inventory that is being evaluated under our quality control process. The reserves are based upon management’s expected method of disposition. The net change in inventory reserves for the year ended December 31, 2017 was an increase of $0.7 million, primarily due to the aging of slow moving material. The net change in inventory reserves for the years ended December 31, 2016 and 2015 was a $0.5 million increase and a $0.1 million decrease, respectively.
Included in inventory are operating materials consisting of forge dies and production molds and rolls that are consumed over their useful lives. During the years ended December 31, 2017, 2016 and 2015, we amortized these operating materials in the amount of $2.1 million, $1.6 million and $1.8 million, respectively. This expense is recorded as a component of cost of products sold on the consolidated statements of operations and included as a part of our total depreciation and amortization on the consolidated statements of cash flows.
Property, Plant and Equipment. Property, plant and equipment is recorded at cost or its fair value at acquisition date. No depreciation is recognized on assets until they are placed in service. Assets which have been retired or disposed of are removed from cost and accumulated depreciation accounts, with the gain or loss generally reflected in cost of goods sold on the consolidated statements of operations.
Major equipment maintenance costs are capitalized as incurred and included in other current assets. These costs are amortized to cost of products sold within a twelve to thirty-six month period. Other maintenance costs are expensed as incurred. Costs of improvements and renewals are capitalized. Our maintenance expense for the years ended December 31, 2017, 2016 and 2015 was $18.8 million, $15.7 million and $16.9 million, respectively, which is included as a component of cost of products sold.
35
Depreciation is computed using the straight-line method based on the estimated useful lives of the related assets. The estimated useful lives of buildings and land improvements are between 10 and 39 years, and the estimated useful lives of machinery and equipment are between five and 20 years. Our total depreciation expense for the years ended December 31, 2017, 2016 and 2015 was $16.5 million, $16.7 million and $15.8 million, respectively, of which $16.2 million, $16.3 million and $15.4 million, respectively, was included as a component of cost of products sold while the remainder was included in selling, general and administrative expense.
Long-Lived Asset Impairment. Long-lived assets, including property, plant and equipment and intangible assets are evaluated for impairment whenever events or changes in circumstances indicate that the carrying amount of an asset may not be recoverable in relation to the operating performance and future undiscounted cash flows of the underlying assets. Adjustments are made if the sum of expected future cash flows is less than the book value. Based on management’s assessment of the carrying values of long-lived assets, no impairment reserve was deemed necessary as of December 31, 2017, 2016 and 2015. Our intangible assets were fully amortized at December 31, 2015.
Deferred Financing Costs. Deferred financing costs are amortized up to the maturity date of the related financial instrument using the straight-line method, which approximates the effective interest method. Deferred financing cost amortization for the years ended December 31, 2017, 2016 and 2015 was $0.3 million, $0.2 million and $0.6 million, respectively, and is included as a component of interest expense and other financing costs on the consolidated statements of operations and included as part of total depreciation and amortization on the consolidated statements of cash flows. In the first quarter of 2016, the Company wrote off $0.8 million of deferred financing costs related to the prior credit facility due to entering into the new Credit Agreement on January 21, 2016. These costs are included as a component of interest expense and other financing costs on the consolidated statements of operations and are broken out separately on the consolidated statement of cash flows. At December 31, 2017 and 2016, we had $0.7 million and $1.0 million, respectively, of unamortized deferred financing costs included on our consolidated balance sheets as a reduction of debt.
Goodwill. Goodwill, which represents the excess of cost over net tangible and identifiable intangible assets of acquired businesses, is stated at fair value. Goodwill is not amortized, but evaluated or tested annually for impairment or more frequently if any event indicates that the carrying amount of goodwill may be impaired.
We recorded a goodwill impairment in the third quarter of 2015. Due to a significant and sustained drop in our share price and continued weak operating results driven by slower market conditions, the Company determined that an interim goodwill impairment review was required in accordance with Accounting Standards Codification (“ASC”) 350, “Intangibles – Goodwill and Other”. Based on the guidance in ASC 350, the Company performed the two-step quantitative analysis. Under the first step, the Company determined that the carrying value exceeded the fair value of the Company and, therefore, the second step of the analysis was performed. The fair value was estimated using a combination of an income approach, which estimates fair value based on projected discounted cash flows and a market approach, which estimates fair value using the recent stock price of the Company. The income approach is supported by a Level 3 fair value measurement, which means that the valuation reflects the Company’s own estimates of market participant assumptions. The market approach is supported by a Level 1 fair value measurement which is the observable stock price of the Company. The income approach was weighted 30% and the market approach was weighted 70% in determining the fair value. This assessment resulted in the recognition of a non-cash goodwill impairment charge of $20.3 million, which eliminated all goodwill from the balance sheet at September 30, 2015.
Stockholders’ Equity. We have never paid a cash dividend on our common stock. Our Credit Agreement does not permit the payment of cash dividends.
Revenue Recognition. Revenue from the sale of products is recognized when both risk of loss and title have transferred to the customer, which in most cases coincides with shipment of the related products, and collection is reasonably assured. Revenue from conversion services is recognized when the performance of the service is complete. Invoiced shipping and handling costs are also accounted for as revenue. Customer claims, which are not material, are accounted for primarily as a reduction to gross sales after the matter has been researched and an acceptable resolution has been reached.
36
The following table presents net sales by product line:
|
|
2017 |
|
|
2016 |
|
|
2015 |
|
|||||||
|
(dollars in thousands) |
|
|
|
|
|
|
|
|
|
|
|
|
|
|
|
|
Stainless steel |
|
$ |
|
139,603 |
|
|
$ |
|
112,118 |
|
|
$ |
|
135,945 |
|
|
High-strength low alloy steel |
|
|
|
15,693 |
|
|
|
|
13,180 |
|
|
|
|
16,045 |
|
|
Tool steel |
|
|
|
32,279 |
|
|
|
|
19,179 |
|
|
|
|
16,197 |
|
|
High-temperature alloy steel |
|
|
|
12,435 |
|
|
|
|
6,057 |
|
|
|
|
7,557 |
|
|
Conversion services and other sales |
|
|
|
2,633 |
|
|
|
|
3,900 |
|
|
|
|
4,916 |
|
|
Total net sales |
|
$ |
|
202,643 |
|
|
$ |
|
154,434 |
|
|
$ |
|
180,660 |
|
Income Taxes. Deferred income taxes are provided for net operating losses, unused tax credits earned and the tax effect of temporary differences between the tax basis of assets and liabilities and their reported amounts in the consolidated financial statements. We use the liability method to account for income taxes, which requires deferred taxes to be recorded at the statutory rate expected to be in effect when the taxes are paid. Valuation allowances are provided for a deferred tax asset when it is more likely than not that the asset will not be realized. Income tax penalties and interest are included in the provision for income tax expense.
We evaluate the tax positions taken or expected to be taken in our tax returns. A tax position should only be recognized in the financial statements if we determine that it is more-likely-than-not that the tax position will be sustained upon examination by the tax authorities, based upon the technical merits of the position. For those tax positions that should be recognized, the measurement of a tax position is determined as being the largest amount of benefit that is greater than fifty percent likely of being realized upon ultimate settlement. We believe there are no material uncertain tax positions at December 31, 2017, 2016 and 2015.
We use the with-and-without method to account for excess tax benefits recognized as a result of the exercise of employee stock options. Under the with-and-without method, excess tax benefits related to share-based compensation are not deemed to be realized until after the utilization of all other tax benefits available to us, which are also subject to applicable limitations.
Share-based Compensation Plans. We recognize compensation expense based on the grant-date fair value of the awards. The fair value of the stock option grants is estimated on the date of grant using the Black-Scholes option-pricing model, and is recognized ratably over the service/vesting period of the award. The fair value of time-based restricted stock grants and restricted stock units is calculated using the market value of the stock on the date of issuance, and is recognized ratably over the service/vesting period of the award.
Net Income (Loss) per Common Share. Net income (loss) per common share is computed by dividing net income (loss) by the weighted-average number of common shares outstanding during the period. Diluted net income (loss) per common share is computed by dividing net income (loss), adjusted to include interest expense (tax effected) for the convertible notes by the weighted-average number of common shares outstanding plus all dilutive potential common shares outstanding during the period. All shares that were issuable under our outstanding Notes were considered outstanding for our diluted net income per common share computation, using the “if converted” method of accounting from the date of issuance.
Treasury Stock. We account for treasury stock under the cost method and include such shares as a reduction of total stockholders’ equity.
Financial Instruments. Financial instruments held by us include cash, accounts receivable, and accounts payable and current and long-term debt. The carrying value of cash, accounts receivable and accounts payable is considered to be representative of fair value because of the short maturity of these instruments. Refer to Note 5 for fair value disclosures of our financial instruments.
Segment Reporting. Our operating facilities are integrated, and therefore our chief operating decision maker (“CODM”) views the Company as one business unit. Our CODM sets performance goals, assesses performance and makes decisions about resource allocations on a consolidated basis. As a result of these factors, as well as the nature of the financial information available which is reviewed by our CODM, we maintain one reportable segment.
37
Recently Adopted Accounting Pronouncement
Effective January 1, 2017, we adopted the Financial Accounting Standards Board (“FASB”) Accounting Standard Update (“ASU”) 2016-09 “Improvements to Employee Share-Based Payment Accounting”. The ASU includes multiple provisions intended to simplify various aspects of the accounting for share-based payments. Excess tax benefits for share-based payments will be recorded as a reduction of income taxes and reflected in operating cash flows upon the adoption of this ASU, eliminating additional paid in capital (“APIC”) pools. In addition, the guidance allows for a policy election to account for forfeitures as they occur rather than on an estimated basis. This ASU also eliminates the requirement that excess tax benefits be realized before companies can recognize them. As a result of the implementation of this guidance, we recorded an adjustment to retained earnings of $0.8 million and a corresponding deferred tax asset for the cumulative effect of excess tax benefits that were not previously recognized. We recorded $0.4 million of tax expense as discrete items in the twelve months ended December 31, 2017 for the expiration of stock options. This amount would have been recorded to APIC under previous guidance. We have elected to account for forfeitures as they occur.
Effective January 1, 2017, we adopted the FASB ASU 2015-11 “Simplifying the Measurement of Inventory”. This ASU simplifies the guidance on the subsequent measurement of inventory, excluding inventory measured using last-in, first out or the retail inventory method. Under the new standard, inventory should be valued at the lower of cost or net realizable value. The implementation of this guidance did not have a material impact on our financial statements.
Recently Issued Accounting Pronouncements
The Company considers the applicability and impact of all ASUs. Recently issued ASUs not listed below were assessed and determined to be either not applicable or are expected to have minimal impact on our consolidated financial statements.
In August 2016, the FASB issued ASU 2016-15 “Classification of Certain Cash Receipts and Cash Payments”. This ASU addresses how certain cash receipts and cash payments are presented and classified in the statement of cash flows under Topic 230, “Statement of Cash Flows”, and other Topics. ASU 2016-15 is effective for annual reporting periods, and interim periods therein, beginning after December 15, 2017. We do not expect the adoption of this guidance to have a material impact on the financial statements.
In February 2016, the FASB issued ASU 2016-2 “Leases (Topic 842)”. The ASU requires lessees to recognize most leases on their balance sheet as a right-of-use asset and a lease liability. For income statement purposes, the FASB retained a dual model, requiring leases to be classified as either operating or finance. The criteria for evaluating are similar to those applied in current leases accounting. This guidance is effective for annual and interim reporting periods beginning after December 15, 2018 with early adoption permitted. We do not expect the adoption of this guidance to have a material impact on the financial statements due to having a limited number of operating leases.
In May 2014, the FASB issued ASU 2014-09 “Revenue from Contracts with Customers (Topic 606)”. This topic converges the guidance within U.S. GAAP and International Financial Reporting Standards and supersedes Accounting Standards Codification 605, Revenue Recognition. The new standard requires companies to recognize revenue to depict the transfer of goods or services to customers in amounts that reflect the consideration to which the company expects to be entitled in exchange for those goods or services. The new standard will also result in enhanced disclosures about revenue, provide guidance for transactions that were not previously addressed comprehensively, and improve guidance for multiple-element arrangements. The new guidance is effective for annual reporting periods beginning after December 15, 2017, including interim reporting periods within that reporting period. We have evaluated this guidance, and determined that the accounting treatment would change for a small, select group of the products we produce. We do not expect that implementation in the first quarter of 2018 using the modified retrospective approach will have a material effect on revenue, gross margin or operating income.
38
The major classes of inventory are as follows:
|
|
2017 |
|
|
2016 |
|
|||||
|
(dollars in thousands) |
|
|
|
|
|
|
|
|
|
|
|
Raw materials and starting stock |
|
$ |
|
8,527 |
|
|
$ |
|
5,769 |
|
|
Semi-finished and finished steel products |
|
|
|
99,820 |
|
|
|
|
77,510 |
|
|
Operating materials |
|
|
|
10,850 |
|
|
|
|
9,893 |
|
|
Gross inventory |
|
|
|
119,197 |
|
|
|
|
93,172 |
|
|
Inventory reserves |
|
|
|
(2,534 |
) |
|
|
|
(1,830 |
) |
|
Total inventory, net |
|
$ |
|
116,663 |
|
|
$ |
|
91,342 |
|
Note 3: Property, Plant and Equipment
Property, plant and equipment consists of the following:
|
|
2017 |
|
|
2016 |
|
|||||
|
(dollars in thousands) |
|
|
|
|
|
|
|
|
|
|
|
Land and land improvements |
|
$ |
|
7,377 |
|
|
$ |
|
7,377 |
|
|
Buildings |
|
|
|
50,058 |
|
|
|
|
49,445 |
|
|
Machinery and equipment |
|
|
|
252,010 |
|
|
|
|
245,694 |
|
|
Construction in progress |
|
|
|
5,239 |
|
|
|
|
3,610 |
|
|
Gross property, plant and equipment |
|
|
|
314,684 |
|
|
|
|
306,126 |
|
|
Accumulated depreciation |
|
|
|
(140,240 |
) |
|
|
|
(123,728 |
) |
|
Property, plant and equipment, net |
|
$ |
|
174,444 |
|
|
$ |
|
182,398 |
|
Note 4: Long-Term Debt
Long-term debt consists of the following:
|
December 31, |
|
2017 |
|
|
2016 |
|
||||
|
|
|
|
|
|
|
|
|
|
|
|
|
Term loan |
|
$ |
|
21,541 |
|
|
$ |
|
26,273 |
|
|
Revolving credit facility |
|
|
|
38,024 |
|
|
|
|
26,546 |
|
|
Notes |
|
|
|
19,000 |
|
|
|
|
19,000 |
|
|
Capital leases |
|
|
|
1,897 |
|
|
|
|
1,763 |
|
|
Swing loan credit facility |
|
|
|
- |
|
|
|
|
- |
|
|
|
|
|
|
80,462 |
|
|
|
|
73,582 |
|
|
Less: current portion of long-term debt |
|
|
|
(4,707 |
) |
|
|
|
(4,579 |
) |
|
Less: deferred financing costs |
|
|
|
(749 |
) |
|
|
|
(1,005 |
) |
|
|
|
|
|
|
|
|
|
|
|
|
|
Long-term debt |
|
$ |
|
75,006 |
|
|
$ |
|
67,998 |
|
Credit Facility
On January 21, 2016, we entered into a new Revolving Credit, Term Loan and Security Agreement (the “Credit Agreement”) with PNC Bank, National Association, as administrative agent and co-collateral agent, Bank of America, N.A., as co-collateral agent, and PNC Capital Markets LLC, as sole lead arranger and sole bookrunner. The Credit Agreement provides for a senior secured revolving credit facility not to exceed $65.0 million (the “Revolving Credit Facility”) and a senior secured term loan facility (the “Term Loan”) in the amount of $30.0 million (together with the Revolving Credit Facility, the “Facilities”). The Credit Agreement also provides for a letter of credit sub-facility not to exceed $10.0 million and a swing loan sub-facility not to exceed $6.5 million. The Company may request to increase the maximum aggregate principal amount of borrowings under the Revolving Credit Facility by $25.0 million prior to January 21, 2020. The Credit Agreement replaced the previous credit
39
agreement that was in place prior to January 21, 2016. The Company was in compliance with all applicable financial covenants set forth in the previous credit agreement as of the date of its entrance into the Credit Agreement.
The Facilities, which expire upon the earlier of (i) January 21, 2021 or (ii) the date that is 90 days prior to the scheduled maturity date of the Notes (as defined below) (in either case, the “Expiration Date”), are collateralized by a first lien in substantially all of the assets of the Company and its subsidiaries, except that no real property is collateral under the Facilities other than the Company’s real property in North Jackson, Ohio.
Availability under the Revolving Credit Facility is based on eligible accounts receivable and inventory. The Company is required to pay a commitment fee of 0.25% based on the daily unused portion of the Revolving Credit Facility.
With respect to the Term Loan, the Company makes quarterly installment payments of principal of approximately $1.1 million, plus accrued and unpaid interest, on the first day of each fiscal quarter. To the extent not previously paid, the Term Loan will become due and payable in full on the Expiration Date.
Amounts outstanding under the Facilities, at the Company’s option, will bear interest at either a base rate plus a margin or a rate based on LIBOR plus a margin, in either case calculated in accordance with the terms of the Credit Agreement. Interest under the Credit Agreement is payable monthly. We elected to use the LIBOR based rate for the majority of the debt outstanding under the Facilities for the twelve months ended December 31, 2017, which was 3.37% on our Revolving Credit Facility and 3.87% for the Term Loan at December 31, 2017.
On October 23, 2017, the Company announced that it obtained a favorable amendment to the Credit Agreement that lowers the Company’s interest on its senior bank borrowings by 75 basis points. At current borrowing levels, this change will reduce annual interest expense by approximately $0.4 million. In addition, several terms of the Credit agreement were amended and will provide additional liquidity to the Company.
The Credit Agreement contains customary affirmative and negative covenants. As of December 31, 2016, and as of the end of each fiscal quarter ending thereafter, the Company must maintain a fixed charge coverage ratio of not less than 1.10 to 1.0, in each case measured on a rolling four-quarter basis calculated in accordance with the terms of the Credit Agreement. The October 23, 2017 amendment made no changes to the financial covenants. We were in compliance with our covenants under the Credit Agreement at December 31, 2017and 2016.
At December 31, 2017, we had deferred financing costs of approximately $0.7 million, and amortized $0.3 million of deferred financing costs for the twelve months ended December31, 2017. For the twelve months ended December 31, 2016, we paid deferred financing costs of $0.8 million related to the Credit Agreement, wrote off $0.8 million of fees related to the previous credit agreement and amortized $0.2 million of deferred financing costs.
Pursuant to the terms of the Credit Agreement, the Company completed the issuance of 73,207 shares of the Company’s common stock to certain directors and officers of the Company on February 2, 2016. The aggregate purchase price of the stock was $0.5 million based on the average of the high and low reported trading prices for the Company’s common stock on The NASDAQ Stock Market on February 1, 2016.
The aggregate annual principal payments due under our Credit Agreement at December 31, 2017, are as follows:
40
On January 21, 2016, the Company entered into the Notes in the aggregate principal amount of $20.0 million, each in favor of Gorbert Inc. (the “Holder”). The Notes amended and restated the Convertible Notes. The Company’s obligations under the Notes are collateralized by a second lien on the same assets of the Company that collateralize the obligations of the Company under the Facilities. The Notes mature on March 17, 2019, and the maturity date may be extended, at the Company’s option, to March 17, 2020 and further to March 17, 2021. If the Company elects to extend the maturity date of the Notes to March 17, 2020, principal payments in the aggregate of $2.0 million will be required within 10 days of March 7, 2019. If the Company elects to extend the maturity date of the Notes further to March 17, 2021, principal payments in the aggregate of $2.0 million will be required within 10 days of March 7, 2020.
The Notes bore interest at a rate of 4.0% per year through and including August 17, 2016. The Notes bear interest at a rate of 5.0% per year from August 18, 2016 through and including August 17, 2017 and a rate of 6.0% per year from and after August 18, 2017. Through and including June 18, 2017, all accrued and unpaid interest is payable semi-annually in arrears on each June 18 and December 18. After June 18, 2017, all accrued and unpaid interest is payable quarterly in arrears on each September 18, December 18, March 18 and June 18.
The Holder could have elected at any time on or prior to August 17, 2017 to convert all or any portion of the outstanding principal amount of the Notes which is an integral multiple of $100,000. The Notes are convertible into shares of common stock and, in certain circumstances, cash, securities and/or other assets. The Notes were convertible based on an initial conversion rate of 21.2 shares of Common Stock per $1,000 principal amount of the Notes (equivalent to an initial conversion price of $47.1675 per share). The conversion rate and the conversion price associated with the Notes could have been adjusted in certain circumstances. The Holder did not exercise the conversion rights prior to their expiration, and the rights are now void.
In conjunction with the issuance of the Notes on January 21, 2016, we made principal prepayments on the Notes totaling $1.0 million.
Capital Leases
Throughout 2017, the company entered into four capital leases for office and manufacturing equipment, with lease terms between three and six years. The assets are included in Property, plant and equipment, net on the Consolidated Balance Sheet and are depreciated over the term of each lease. The long-term component of the capital lease obligations is included in Long-term debt and the current component is included in Current portion of long-term debt. These amounts have been excluded from the Consolidated Statement of Cash Flows as they are non-cash. The net present value of the minimum lease payments, at inception, was $0.5 million.
On February 1, 2016 and March 1, 2016, the Company entered into capital leases for equipment, each with a term of five years. The net present value of the minimum lease payments, at inception, was $2.0 million.
As of December 31, 2017, future minimum lease payments applicable to capital leases were as follows:
|
|
|
|
591 |
|
|
|
2019 |
|
|
|
591 |
|
|
2020 |
|
|
|
569 |
|
|
2021 |
|
|
|
467 |
|
|
2022 |
|
|
|
56 |
|
|
2023 |
|
|
|
15 |
|
|
Total minimum capital lease payments |
|
$ |
|
2,289 |
|
|
Less amounts representing interest |
|
|
|
(392 |
) |
|
Present value of net minimum capital lease payments |
|
$ |
|
1,897 |
|
|
Less current obligation |
|
|
|
(422 |
) |
|
Total long-term capital lease obligation |
|
$ |
|
1,475 |
|
41
There were no capital lease obligations at December 31, 2015. Accumulated amortization of capital lease assets as of December 31, 2017 was $0.7 million, of which $0.4 million and $0.3 million was amortized for the twelve months ended December 31, 2017 and 2016, respectively. Capital lease amortization is included in cost of products sold in the Consolidated Statement of Operations.
Note 5: Fair Value Measurements
The fair value hierarchy has three levels based on the inputs used to determine fair value, which are as follows:
Level 1 — Unadjusted quoted prices available in active markets for the identical assets or liabilities at the measurement date.
Level 2 — Unadjusted quoted prices in active markets for similar assets or liabilities, or unadjusted quoted prices for identical or similar assets or liabilities in markets that are not active, or inputs other than quoted prices that are observable for the asset or liability.
Level 3 — Unobservable inputs that cannot be corroborated by observable market data and reflect the use of significant management judgment. These values are generally determined using pricing models for which the assumptions utilize management’s estimates of market participant assumptions.
The fair value hierarchy requires the use of observable market data when available. In instances where the inputs used to measure fair value fall into different levels of the fair value hierarchy, the fair value measurement has been determined based on the lowest level input significant to the fair value measurement in its entirety. Our assessment of the significance of a particular item to the fair value measurement in its entirety requires judgment, including the consideration of inputs specific to the asset or liability.
The carrying amounts of our cash, accounts receivable and accounts payable approximated fair value at December 31, 2017 and 2016 due to their short-term nature (Level 1). The fair value of the Term Loan and Revolver at December 31, 2017 and 2016 approximated the carrying amount as the interest rate is based upon floating short-term interest rates (Level 2). At December 31, 2017 and 2016, the fair value of our Notes was approximately $18.8 million and $18.4 million, respectively (Level 2).
Note 6: Derivatives and Hedging
The Company invoices certain customers in foreign currencies. In order to mitigate the risks associated with fluctuations in exchange rates with the US Dollar, during 2017 and 2016, the Company entered into foreign exchange forward contracts for a portion of these sales and has designated these contracts as cash flow hedges. The notional value of these contracts at December 31, 2017 was $4.5 million and an unrealized loss of $93,000 was recorded in accumulated other comprehensive loss at December 31, 2017. The notional value of these contracts at December 31, 2016 was $2.4 million and an unrealized gain of $21,000 was recorded in accumulated other comprehensive income at December 31, 2016.
42
The income tax benefit attributable to continuing operations during the years ended December 31, 2017, 2016 and 2015 is as follows:
Components of the benefit from income taxes are as follows:
|
|
2017 |
|
|
2016 |
|
|
2015 |
|
|
|||||||
|
(dollars in thousands) |
|
|
|
|
|
|
|
|
|
|
|
|
|
|
|
|
|
Current (benefit) provision |
|
|
|
|
|
|
|
|
|
|
|
|
|
|
|
|
|
Federal |
|
$ |
|
(28 |
) |
|
$ |
|
8 |
|
|
$ |
|
(105 |
) |
|
|
State |
|
|
|
21 |
|
|
|
|
5 |
|
|
|
|
56 |
|
|
|
Deferred provision (benefit) |
|
|
|
|
|
|
|
|
|
|
|
|
|
|
|
|
|
Federal |
|
|
|
114 |
|
|
|
|
(3,501 |
) |
|
|
|
(11,843 |
) |
|
|
State |
|
|
|
568 |
|
|
|
|
(38 |
) |
|
|
|
(252 |
) |
|
|
|
|
|
|
|
|
|
|
|
|
|
|
|
|
|
|
|
|
Benefit related to a change in enacted tax law |
|
|
|
(8,276 |
) |
|
|
|
- |
|
|
|
|
- |
|
|
|
|
|
|
|
|
|
|
|
|
|
|
|
|
|
|
|
|
|
Benefit from income taxes |
|
$ |
|
(7,601 |
) |
|
$ |
|
(3,526 |
) |
|
$ |
|
(12,144 |
) |
|
A reconciliation of the federal statutory tax amount and our tax benefit is as follows:
|
|
|
2017 |
|
|
|
2016 |
|
|
|
2015 |
|
|
||||
|
Tax provision (benefit) at statutory tax rate |
|
$ |
|
3 |
|
|
$ |
|
(3,106 |
) |
|
$ |
|
(11,486 |
) |
|
|
State income taxes, net of federal impact |
|
|
|
3 |
|
|
|
|
(39 |
) |
|
|
|
(182 |
) |
|
|
Research and development tax credit |
|
|
|
(425 |
) |
|
|
|
(439 |
) |
|
|
|
(517 |
) |
|
|
Valuation allowance, net of federal impact |
|
|
|
475 |
|
|
|
|
- |
|
|
|
|
- |
|
|
|
Impact of changes in enacted tax law |
|
|
|
(8,276 |
) |
|
|
|
- |
|
|
|
|
- |
|
|
|
Adjustments to deferred taxes |
|
|
|
506 |
|
|
|
|
4 |
|
|
|
|
(61 |
) |
|
|
Other, net |
|
|
|
113 |
|
|
|
|
54 |
|
|
|
|
102 |
|
|
|
Benefit from income taxes |
|
$ |
|
(7,601 |
) |
|
$ |
|
(3,526 |
) |
|
$ |
|
(12,144 |
) |
|
The Tax Cuts and Jobs Act (the “Tax Act”) was signed into law on December 22, 2017. The Tax Act changed many aspects of U.S. corporate income taxation and included reduction of the corporate income tax rate from 35% to 21%, effective for tax years beginning in 2018. We recognized the tax effects of the Tax Act in the year ended December 31, 2017 and recorded $8.3 million in tax benefits, which relates almost entirely to the remeasurement of deferred tax liabilities to the 21% tax rate. The Company expects the Tax Act changes to result in an effective tax rate of approximately 20% in 2018 and thereafter. Upon completion of our 2017 U.S. income tax return in 2018 we may identify additional remeasurement adjustments to our recorded deferred tax liabilities. We will continue to assess our provision for income taxes as future guidance is issued but do not currently anticipate significant revisions will be necessary. Any such revisions will be treated in accordance with the measurement period guidance outlined in Staff Accounting Bulletin No. 118.
In 2017, we recorded a $0.5 million valuation allowance against our Pennsylvania deferred tax assets due to a change in Pennsylvania tax law. We continue to record a full valuation allowance against our New York deferred tax assets due to the zero percent (0%) state income tax rate for qualified manufacturers. We have determined that federal and other state deferred tax assets are expected to be realized and have not recorded any additional valuation allowances.
43
Deferred income taxes reflect the net tax effects of temporary differences between the carrying amounts of assets and liabilities for financial reporting purposes and the amounts used for income tax purposes. Significant components of our net deferred taxes related to continuing operations are as follows:
|
|
2017 |
|
|
2016 |
|
|||||
|
(dollars in thousands) |
|
|
|
|
|
|
|
|
|
|
|
Noncurrent deferred income taxes: |
|
|
|
|
|
|
|
|
|
|
|
Federal and state tax carryforwards |
|
$ |
|
12,894 |
|
|
$ |
|
22,533 |
|
|
Inventory |
|
|
|
549 |
|
|
|
|
649 |
|
|
Share-based compensation |
|
|
|
2,186 |
|
|
|
|
3,506 |
|
|
Receivables |
|
|
|
194 |
|
|
|
|
182 |
|
|
Accrued liabilities |
|
|
|
349 |
|
|
|
|
689 |
|
|
Other |
|
|
|
32 |
|
|
|
|
82 |
|
|
Total deferred tax assets |
|
$ |
|
16,204 |
|
|
$ |
|
27,641 |
|
|
Deferred tax liabilities: |
|
|
|
|
|
|
|
|
|
|
|
Property, plant and equipment |
|
$ |
|
24,970 |
|
|
$ |
|
44,498 |
|
|
Other |
|
|
|
839 |
|
|
|
|
772 |
|
|
Total deferred tax liabilities |
|
$ |
|
25,809 |
|
|
$ |
|
45,270 |
|
|
Total noncurrent deferred income taxes |
|
$ |
|
9,605 |
|
|
$ |
|
17,629 |
|
We file a U.S. federal income tax return and various state income tax returns. For federal income tax purposes, we had $45.0 million and $53.0 million of net operating loss carryforwards at December 31, 2017 and 2016, respectively. The net operating loss carryforwards begin to expire in 2031. In addition, we have credit carryforwards associated with our research and development activities of $3.1 million and $2.7 million as of December 31, 2017 and 2016, respectively. The research and development credit carryforwards being to expire in 2030.
We have state net operating loss carryforwards of $9.1 million and $9.2 million, of which $7.4 million and $0.0 million, respectively, have a valuation allowance, and state credit carryforwards of $0.2 and $0.3 million at December 31, 2017 and 2016, respectively. The valuation allowance was $2.5 million and $1.6 million at December 31, 2017 and 2016, respectively. The state net operating loss carryforwards begin to expire in 2031. The state credit carryforwards begin to expire in 2027.
We are routinely under audit by federal or state authorities. Our federal tax returns are subject to examination by the IRS for tax years after 2013. We are subject to examination by most state tax jurisdictions for tax years after 2013.
44
Note 8: Net Income (Loss) Per Common Share
The computation of basic and diluted net income (loss) per common share for the years ended December 31, 2017, 2016 and 2015 is as follows:
|
For the years ended December 31, |
|
2017 |
|
|
2016 |
|
|
2015 |
|
||||||
|
|
|
|
|
|
|
|
|
|
|
|
|
|
|
|
|
|
Numerator: |
|
|
|
|
|
|
|
|
|
|
|
|
|
|
|
|
Net income (loss) |
|
$ |
|
7,610 |
|
|
$ |
|
(5,347 |
) |
|
$ |
|
(20,672 |
) |
|
Adjustment for interest expense on convertible notes |
|
|
|
- |
|
|
|
|
- |
|
|
|
|
- |
|
|
Net income (loss), as adjusted |
|
$ |
|
7,610 |
|
|
$ |
|
(5,347 |
) |
|
$ |
|
(20,672 |
) |
|
Denominator: |
|
|
|
|
|
|
|
|
|
|
|
|
|
|
|
|
Weighted average number of shares of common stock outstanding |
|
|
|
7,225,697 |
|
|
|
|
7,193,300 |
|
|
|
|
7,069,954 |
|
|
Weighted average effect of dilutive stock options and other stock compensation |
|
|
|
149,108 |
|
|
|
|
- |
|
|
|
|
- |
|
|
Weighted average effect of assumed conversion of convertible notes |
|
|
|
- |
|
|
|
|
- |
|
|
|
|
- |
|
|
Weighted average number of shares of common stock outstanding, as adjusted |
|
|
|
7,374,805 |
|
|
|
|
7,193,300 |
|
|
|
|
7,069,954 |
|
|
Net income (loss) per common share: |
|
|
|
|
|
|
|
|
|
|
|
|
|
|
|
|
Basic earnings (loss) per share |
|
$ |
|
1.05 |
|
|
$ |
|
(0.74 |
) |
|
$ |
|
(2.92 |
) |
|
Diluted earnings (loss) per share |
|
$ |
|
1.03 |
|
|
$ |
|
(0.74 |
) |
|
$ |
|
(2.92 |
) |
An adjustment for interest expense on convertible notes was excluded from the income per share calculation for the years ended December 31, 2017, 2016 and 2015 as a result of the convertible notes being antidilutive.
There were 590,350, 844,000 and 635,200 options to purchase shares of common stock, at an average price of $30.63, $27.13 and $30.67 for the years ended December 31, 2017, 2016 and 2015, respectively, that were not included in the computation of diluted net income (loss) per common share because their respective exercise prices were greater than the average market price of our common stock. The calculation of diluted earnings per share for the year ended December 31, 2017 excludes 268,351 shares, and for the year ended December 31, 2016 excludes 408,459 shares, and for the year ended December 31, 2015 excludes 428,140 shares, for the assumed conversion of the Notes as a result of the convertible notes being antidilutive. In addition, the calculation of diluted earnings per share for the year ended December 31, 2016 and 2015 would have included 6,575 and 21,774 shares, respectively, for the assumed exercise of options and restricted stock units under our share incentive plans except that we were in a net loss position and the impact would have been antidilutive.
45
Note 9: Incentive Compensation Plans
At December 31, 2017, we had four incentive compensation plans that are described below:
Universal Stainless & Alloy Products, Inc. 2017 Equity Incentive Plan
We maintain the Universal Stainless & Alloy Products, Inc. 2017 Equity Incentive Plan (the “2017 Plan”), which was approved by our stockholders in May 2017. The 2017 Plan permits the issuance of stock options, restricted stock, restricted stock units, other stock-based awards and performance awards to officers, employees, non-employee directors, and consultants and advisors to the Company. At inception, there were 568,357 shares authorized for issuance under the 2017 Plan.
When adopted, the 2017 Plan replaced the Omnibus Incentive Plan (“OIP”). Any awards outstanding under the OIP will remain subject to and be paid under the OIP. No new awards will be granted under the OIP. Any shares subject to outstanding awards under the OIP that cease to be subject to such awards after the adoption of the 2017 Plan will increase the shares authorized under the 2017 Plan. At December 31, 2017, there were 631,624 shares available for grant under the 2017 Plan.
Omnibus Incentive Plan
We maintain the OIP which was approved by our stockholders in May 2012. The OIP permits the issuance of stock options, restricted stock, restricted stock units and other stock-based awards to non-employee directors, other than those directors owning more than 5% of our outstanding common stock, consultants, officers and other key employees who are expected to contribute to our future growth and success. With the adoption of the 2017 Plan, no shares of common stock were available for grant at December 31, 2017 under OIP.
Stock Options
The option price for options granted under the both the 2017 Plan and OIP is equal to the fair market value of the common stock at the date of grant. Options granted to non-employee directors vest over a three-year period, and options granted to employees vest over a four-year period. All options under both the 2017 Plan and OIP will expire no later than ten years after the grant date. Forfeited options may be reissued and are included in the amount available for grants.
A summary of stock option activity as of and for the year ended December 31, 2017 is presented below:
|
|
|
|
|
|
|
|
|
|
|
|
|
|
|
|
|
|
|
|
|
|
|
|
|
|
|
|
|
|
|
|
|
|
|
|
||||||||||||
|
|
|
Non-vested stock |
|
|
Stock options |
|
||||||||||||||||
|
|
|
options outstanding |
|
|
outstanding |
|
||||||||||||||||
|
|
|
|
|
|
|
Weighted- |
|
|
|
|
|
|
Weighted- |
|
|
Weighted- |
|
|||||
|
|
|
|
|
|
|
average |
|
|
|
|
|
|
average |
|
|
average |
|
|||||
|
|
|
Number |
|
|
grant-date |
|
|
Number |
|
|
exercise |
|
|
contractual |
|
|||||||
|
|
|
of shares |
|
|
fair value |
|
|
of shares |
|
|
price |
|
|
term (years) |
|
|||||||
|
|
|
|
|
|
|
|
|
|
|
|
|
|
|
|
|
|
|
|
|
|
|
|
|
Outstanding at December 31, 2016 |
|
|
327,275 |
|
|
$ |
|
8.05 |
|
|
|
934,600 |
|
|
$ |
|
23.62 |
|
|
|
|
|
|
Stock options granted |
|
|
99,900 |
|
|
|
|
9.60 |
|
|
|
99,900 |
|
|
|
|
19.84 |
|
|
|
|
|
|
Stock options exercised |
|
|
- |
|
|
|
|
- |
|
|
|
(22,125 |
) |
|
|
|
14.77 |
|
|
|
|
|
|
Stock options vested |
|
|
(127,700 |
) |
|
|
|
9.73 |
|
|
|
- |
|
|
|
|
- |
|
|
|
|
|
|
Stock options forfeited |
|
|
(52,275 |
) |
|
|
|
7.44 |
|
|
|
(128,325 |
) |
|
|
|
22.82 |
|
|
|
|
|
|
Outstanding at December 31, 2017 |
|
|
247,200 |
|
|
$ |
|
7.94 |
|
|
|
884,050 |
|
|
$ |
|
23.53 |
|
|
|
5.8 |
|
|
Exercisable at December 31, 2017 |
|
|
|
|
|
|
|
|
|
|
|
636,850 |
|
|
$ |
|
26.56 |
|
|
|
4.5 |
|
Proceeds from stock option exercises totaled $0.3 million and $0.3 million for the years ended December 31, 2017 and 2015, respectively. There were no stock option exercises in 2016. Shares issued in connection with stock option exercises are issued from available authorized shares.
46
Based upon the closing stock price of $21.42 at December 31, 2017, the aggregate intrinsic value of outstanding and exercisable stock options was $2.9 million and $1.4 million, respectively. Intrinsic value of stock options is calculated as the amount by which the market price of our common stock exceeds the exercise price of the options. The aggregate intrinsic value of stock options exercised for the years ended December 31, 2017 and 2015 was $0.1 million and $0.1 million, respectively. The total fair value of stock option awards vested during the years ended December 31, 2017, 2016 and 2015 was $1.2 million, $1.2 million and $1.0 million, respectively.
Share-based compensation to employees and directors is recognized as compensation expense in the consolidated statements of operations based on the stock options fair value on the measurement date, which is the date of the grant. The value of the portion of the award that is ultimately expected to vest is recognized as expense over the requisite service periods. The compensation expense recognized and its related tax effects are included in additional paid-in capital.
Share-based compensation expense related to stock options totaled $1.2 million, $1.3 million and $1.5 million for the years ended December 31, 2017, 2016 and 2015, respectively. Share-based compensation expense is recognized ratably over the requisite service period for all stock option awards. Unrecognized share-based compensation expense related to non-vested stock option awards totaled $1.7 million at December 31, 2017. At such date, the weighted-average period over which this unrecognized expense was expected to be recognized was 2.6 years. We recognized no tax benefit for the exercise of stock options during the years ended December 31, 2017, 2016 and 2015.
The fair value of our stock options granted is estimated on the measurement date, which is the date of grant. We use the Black-Scholes option-pricing model. Our determination of fair value of stock option awards on the date of grant is affected by our stock price as well as assumptions regarding our expected stock price volatility over the term of the awards, and actual and projected stock option exercise behaviors. The weighted-average grant-date fair value of stock options granted during the years ended December 31, 2017, 2016 and 2015 was $9.60, $5.85 and $6.99, respectively.
The assumptions used to determine the fair value of stock options granted are detailed in the table below:
|
|
2017 |
|
|
2016 |
|
|
2015 |
|
||||
|
Risk-free interest rate |
|
1.92% to 2.29% |
|
|
1.42% to 2.39% |
|
|
1.77% to 2.19% |
|
|||
|
Dividend yield |
|
|
0.0 |
% |
|
|
0.0 |
% |
|
|
0.0 |
% |
|
Expected market price volatility |
|
45% to 53% |
|
|
51% to 53% |
|
|
49% to 55% |
|
|||
|
Weighted-average expected market price volatility |
|
|
47.4 |
% |
|
|
51.0 |
% |
|
|
52.6 |
% |
|
Expected term |
|
5.6 to 7.5 years |
|
|
5.6 to 7.5 years |
|
|
5.6 to 7.5 years |
|
|||
The risk-free interest rate was developed using the U.S. Treasury yield curve for periods equal to the expected life of the stock options at the grant date. No dividend yield was assumed because we do not pay cash dividends on common stock and currently have no plans to pay a dividend. Expected volatility is based on the long-term historical volatility (estimated over a period equal to the expected term of the stock options) of our common stock. In estimating the fair value of stock options under the Black-Scholes option-pricing model, separate groups of employees that have similar historical exercise behavior are considered separately. The expected term of options granted represents the period of time that options granted are expected to be outstanding.
47
Restricted Stock and Restricted Stock Units
A summary of restricted stock activity for the years ended December 31, 2017 and 2016 is presented below:
|
|
|
|
|
|
|
|
Weighted- |
|
|
|
|
|
|
|
|
|
average |
|
||
|
|
|
Number |
|
|
|
grant-date |
|
||
|
|
|
of shares |
|
|
|
fair value |
|
||
|
Balance, December 31, 2015 |
|
|
- |
|
|
$ |
|
- |
|
|
Restricted stock granted |
|
|
95,000 |
|
|
|
|
14.75 |
|
|
Restricted stock forfeited |
|
|
- |
|
|
|
|
- |
|
|
|
|
|
|
|
|
|
|
|
|
|
Balance, December 31, 2016 |
|
|
95,000 |
|
|
|
|
14.75 |
|
|
Restricted stock granted in May |
|
|
6,780 |
|
|
|
|
18.00 |
|
|
Restricted stock granted in November |
|
|
7,500 |
|
|
|
|
20.29 |
|
|
Restricted stock forfeited |
|
|
(27,000 |
) |
|
|
|
14.96 |
|
|
|
|
|
|
|
|
|
|
|
|
|
Balance, December 31, 2017 |
|
|
82,280 |
|
|
$ |
|
15.45 |
|
As of December 31, 2015, all of the restricted shares issued in 2012 had vested. Share-based compensation expense related to restricted stock totaled $0.4 million, $0.1 million, and $0.4 for the years ended December 31, 2017, 2016 and 2015, respectively.
During the year ended December 31, 2017, we granted 14,280 time-based restricted stock units to certain employees and directors. The restricted stock units vest over four years for employees and three years for directors. The fair value of the non-vested time-based restricted common stock awards was calculated using the market value of the stock on the date of issuance. During the year ended December 31, 2016, we granted 95,000 time-based restricted stock units to certain employees, which vest over two or four years. As of December 31, 2017, total unrecognized compensation cost related to non-vested time-based restricted stock units was $0.9 million. That cost is expected to be recognized over a weighted-average period of 2.4 years.
Employee Stock Purchase Plan
Under the 1996 Employee Stock Purchase Plan, as amended (the “Plan”), the Company is authorized to issue up to 300,000 shares of common stock to its full-time employees, nearly all of whom are eligible to participate. Under the terms of the Plan, employees can choose as of January 1 and July 1 of each year to have up to 10% of their total earnings withheld to purchase up to 100 shares of our common stock each six-month period. The purchase price of the stock is 85% of the lower of its beginning-of-the-period or end-of-the-period market prices. At December 31, 2017, we have issued 212,089 shares of common stock since the Plan’s inception.
Cash Incentive Plans
We have a variable incentive compensation plan covering certain key executives and senior management and profit-sharing plans and a key performance plan that cover the remaining employees. The variable incentive compensation plan aligns the compensation of executive officers and senior management with the performance expectations of the Board of Directors in order to motivate and reward them for the achievement of Company performance metrics. The profit-sharing plans provide for the sharing of pre-tax profits in excess of specified amounts at our Bridgeville, Dunkirk and Titusville facilities. The key performance plan provides a cash incentive for achieving certain performance metrics at our North Jackson facility. For the years ended December 31, 2017, 2016 and 2015, we expensed $1.9 million, $1.5 million and $1.0 million, respectively, under these cash incentive plans of which $1.4 million $0.4 million and $0.4 million, respectively, was included as a component of cost of products sold while the remainder was included in selling and administrative expense. At December 31, 2017 and 2016, we had liabilities of $1.2 million as a component of accrued employment costs on our consolidated balance sheets related to these cash incentive plans.
48
We have a defined contribution retirement plan (“401(k) plan”) that covers substantially all employees. Pursuant to the 401(k) plan, participants may elect to make pre-tax and after-tax contributions, subject to certain limitations imposed under the Internal Revenue Code of 1986, as amended. In addition, we make periodic contributions to the 401(k) plan based on service for the Titusville and Dunkirk hourly employees and age for North Jackson hourly employees. We make periodic contributions for the salaried employees at all locations except for North Jackson based upon their service and their individual contribution to the 401(k) plan. For North Jackson salaried employees, we make periodic contributions based upon the employee’s age and their individual contributions.
We also participate in the Steelworkers Pension Trust (the “Trust”), a multi-employer defined-benefit pension plan that is open to all hourly and salary employees associated with the Bridgeville facility. We make periodic contributions to the Trust based on hours worked at a fixed rate for each hourly employee, as determined by the collective bargaining agreement, which expires in August 2018 and a fixed monthly contribution on behalf of each salary employee. The trustees of the Trust have provided us with the latest data available for the Trust year ending December 31, 2016. As of that date, the Trust is not fully funded. We could be held liable to the Trust for our own obligations, as well as those of other employers, due to our participation in the Trust. Contribution rates could increase if the Trust is required to adopt a funding improvement plan or a rehabilitation plan, if the performance of the Trust assets do not meet expectations, or as a result of future collectively-bargained wage and benefit agreements. If we choose to stop participating in the Trust, we may be required to pay the Trust an amount based on the underfunded status of the Trust, referred to as a withdrawal liability.
The Pension Protection Act (PPA) defines a zone status for each trust. Trusts in the green zone are at least 80% funded, trusts in the yellow zone are at least 65% funded, and trusts in the red zone are generally less than 65% funded. The Trust has utilized extended amortization provisions to amortize its losses from 2008. The Trust recertified its zone status after using the extended amortization provisions as allowed by law. The Trust has not implemented a funding improvement or rehabilitation plan, nor are such plans pending. Our contributions to the Trust have not exceeded more than 5% of the total contributions to the Trust.
|
|
Trusts employer |
|
|
|
|
|
|
|
|
|
|
|
|
|
|
|
|
|
|
|
|
|
|
|
|
|
|
|
identification |
|
|
|
|
|
Funding plan |
|
Company contributions to the Trust |
|
|
|
||||||||||||
|
Pension |
|
number / |
|
PPA zone status |
|
pending / |
|
(dollars in thousands) |
|
|
Surcharge |
||||||||||||||
|
fund |
|
plan number |
|
2017 |
|
2016 |
|
implemented |
|
|
2017 |
|
|
|
2016 |
|
|
|
2015 |
|
|
imposed |
|||
|
Trust |
|
23-6648508 / 499 |
|
Green |
|
Green |
|
No |
|
$ |
|
773 |
|
|
$ |
|
681 |
|
|
$ |
|
737 |
|
|
No |
The total expense of all retirement plans for the years ended December 31, 2017, 2016 and 2015 was $1.8, $1.6 and $1.6 million, respectively. No other post-retirement benefit plans exist.
Note 11: Commitments and Contingencies
From time to time, various lawsuits and claims have been or may be asserted against us relating to the conduct of our business, including routine litigation relating to commercial and employment matters. The ultimate cost and outcome of any litigation or claim cannot be predicted with certainty. Management believes, based on information presently available, that the likelihood that the ultimate outcome of any such pending matter will have a material adverse effect on its financial condition, or liquidity or a material impact to its results of operations is remote, although the resolution of one or more of these matters may have a material adverse effect on our results of operations for the period in which the resolution occurs.
We, as well as other steel companies, are subject to demanding environmental standards imposed by federal, state and local environmental laws and regulations. We are not aware of any environmental condition that currently exists at any of our facilities that would cause a material adverse effect on our financial condition, results of operations or liquidity in a particular future quarter or year.
Our purchase obligations include the value of all open purchase orders with established quantities and purchase prices, as well as minimum purchase commitments, all made in the normal course of business. At December 31, 2017, our total purchase obligations were $21.0 million, of which $17.9 million will be due in 2018.
49
Note 12: Selected Quarterly Financial Data (unaudited)
|
|
|
First quarter |
|
|
Second quarter |
|
|
Third quarter |
|
|
Fourth quarter |
|
||||||||
|
(dollars in thousands, except per share amounts) |
|
|
|
|
|
|
|
|
|
|
|
|
|
|
|
|
|
|
|
|
|
2017 Data: |
|
|
|
|
|
|
|
|
|
|
|
|
|
|
|
|
|
|
|
|
|
Net sales |
|
$ |
|
48,875 |
|
|
$ |
|
52,607 |
|
|
$ |
|
50,887 |
|
|
$ |
|
50,274 |
|
|
Gross margin |
|
$ |
|
4,245 |
|
|
$ |
|
7,166 |
|
|
$ |
|
5,464 |
|
|
$ |
|
6,159 |
|
|
Operating income (loss) |
|
$ |
|
(484 |
) |
|
$ |
|
2,667 |
|
|
$ |
|
1,016 |
|
|
$ |
|
1,038 |
|
|
(Benefit) provision for income taxes |
|
$ |
|
(262 |
) |
|
$ |
|
369 |
|
|
$ |
|
176 |
|
|
$ |
|
(7,884 |
) |
|
Net income (loss) |
|
$ |
|
(1,219 |
) |
|
$ |
|
1,228 |
|
|
$ |
|
(259 |
) |
|
$ |
|
7,860 |
|
|
Net income (loss) per common share |
|
|
|
|
|
|
|
|
|
|
|
|
|
|
|
|
|
|
|
|
|
Basic |
|
$ |
|
(0.17 |
) |
|
$ |
|
0.17 |
|
|
$ |
|
(0.04 |
) |
|
$ |
|
1.09 |
|
|
Diluted |
|
$ |
|
(0.17 |
) |
|
$ |
|
0.17 |
|
|
$ |
|
(0.04 |
) |
|
$ |
|
1.06 |
|
|
2016 Data: |
|
|
|
|
|
|
|
|
|
|
|
|
|
|
|
|
|
|
|
|
|
Net sales |
|
$ |
|
39,594 |
|
|
$ |
|
41,030 |
|
|
$ |
|
39,651 |
|
|
$ |
|
34,159 |
|
|
Gross margin |
|
$ |
|
1,341 |
|
|
$ |
|
4,339 |
|
|
$ |
|
4,734 |
|
|
$ |
|
3,099 |
|
|
Operating income (loss) |
|
$ |
|
(2,497 |
) |
|
$ |
|
(252 |
) |
|
$ |
|
230 |
|
|
$ |
|
(1,450 |
) |
|
Benefit from income taxes |
|
$ |
|
(1,920 |
) |
|
$ |
|
(437 |
) |
|
$ |
|
(292 |
) |
|
$ |
|
(877 |
) |
|
Net loss |
|
$ |
|
(2,440 |
) |
|
$ |
|
(802 |
) |
|
$ |
|
(520 |
) |
|
$ |
|
(1,585 |
) |
|
Net loss per common share: |
|
|
|
|
|
|
|
|
|
|
|
|
|
|
|
|
|
|
|
|
|
Basic |
|
$ |
|
(0.34 |
) |
|
$ |
|
(0.11 |
) |
|
$ |
|
(0.07 |
) |
|
$ |
|
(0.22 |
) |
|
Diluted |
|
$ |
|
(0.34 |
) |
|
$ |
|
(0.11 |
) |
|
$ |
|
(0.07 |
) |
|
$ |
|
(0.22 |
) |
Net income (loss) per common share amounts for each quarter is required to be computed independently. As a result, their sum may not equal the total year earnings per share amounts.
Note 13: Subsequent Events
None
None.
Our Chairman, President and Chief Executive Officer performed an evaluation of the effectiveness of our disclosure controls and procedures. Based on that evaluation, our Chairman, President and Chief Executive Officer, also in his capacity as the Principal Financial and Accounting officer, concluded that, as of the end of the fiscal year covered by this Annual Report on Form 10-K, our disclosure controls and procedures are effective. Management’s Report on our internal control over financial reporting is included in Item 8 of this Annual Report on Form 10-K under the caption “Management’s Report on Internal Control Over Financial Reporting” and is incorporated herein by reference. Our independent registered public accounting firm has issued a report on management’s maintenance of effective internal control over financial reporting and is set forth in Item 8 of this Annual Report on Form 10-K under the caption “Report of Independent Registered Public Accounting Firm” and is incorporated herein by reference.
During the last fiscal quarter of the fiscal year ended December 31, 2017, there were no changes in our internal control over financial reporting which have materially affected, or are reasonably likely to materially affect, our internal control over financial reporting. The Company is currently using qualified temporary resources to maintain its effectiveness and internal control environment within the Finance function while a new Chief Financial Officer is being recruited.
None.
50
The information concerning the directors of the Company is set forth in the Proxy Statement for the 2018 Annual Meeting of Stockholders (the “Proxy Statement”) to be sent to stockholders in connection with our 2018 Annual Meeting of Stockholders, under the heading “Proposal No. 1—Election of Directors,” which information is incorporated by reference. With the exception of the information specifically incorporated herein by reference, our Proxy Statement is not to be deemed filed as part of this report for the purposes of this Item.
In addition to the information set forth under the caption “Executive Officers” in Part I of this report, the information concerning our directors required by this item is incorporated and made part hereof by reference to the material appearing under the heading “Nominees for Election as Directors” in our Proxy Statement, which will be filed with the SEC, pursuant to Regulation 14A, not later than 120 days after the end of the 2017 fiscal year. Information concerning the Audit Committee and its “audit committee financial expert” required by this item is incorporated and made part hereof by reference to the material appearing under the heading “Committees of the Board of Directors” in the Proxy Statement. Information required by this item regarding compliance with Section 16(a) of the Exchange Act is incorporated and made a part hereof by reference to the material appearing under the heading “Security Ownership of Certain Beneficial Owners and Management” in the Proxy Statement. Information concerning the executive officers of the Company is contained in Part I of this Annual Report on Form 10-K under the caption “Executive Officers.”
We have adopted a Code of Business Conduct and Ethics that applies to all directors and employees, including its principal executive officer and principal financial officer. A copy is available, free of charge, through our website at http://www.univstainless.com. Information on our website is not part of this Annual Report on Form 10-K. We intend to timely disclose any amendment of or waiver under the Code of Business Conduct and Ethics on our website and will retain such information on our website as required by applicable SEC rules.
The information concerning executive compensation is set forth in the Proxy Statement under the heading “Executive Compensation,” which information is incorporated by reference. With the exception of the information specifically incorporated herein by reference, the Proxy Statement is not to be deemed filed as part of this report for the purposes of this Item.
|
ITEM 12. |
SECURITY OWNERSHIP OF CERTAIN BENEFICIAL OWNERS AND MANAGEMENT AND RELATED STOCKHOLDER MATTERS |
The information concerning security ownership of certain beneficial owners and management is set forth in the Proxy Statement under the heading “Security Ownership of Certain Beneficial Owners and Management,” which information is incorporated by reference. With the exception of the information specifically incorporated herein by reference, the Proxy Statement is not to be deemed filed as part of this report for the purposes of this Item.
51
Equity Compensation Plan Information:
Securities authorized for issuance under equity compensation plans at December 31, 2017 were as follows:
|
|
Number of shares to be issued upon exercise of outstanding options |
|
|
|
Weighted-average exercise price of outstanding options |
|
|
Number of shares remaining available for future issuance under equity compensation plans (A) |
|
||||
|
|
|
|
|
|
|
|
|
|
|
|
|
|
|
|
Equity compensation plans approved by security holders |
|
|
884,050 |
|
|
$ |
|
23.53 |
|
|
|
719,535 |
|
|
|
|
|
|
|
|
|
|
|
|
|
|
|
|
|
Equity compensation plans not approved by security holders |
|
|
- |
|
|
|
|
- |
|
|
|
- |
|
|
|
|
|
|
|
|
|
|
|
|
|
|
|
|
|
Total |
|
|
884,050 |
|
|
$ |
|
23.53 |
|
|
|
719,535 |
|
|
(A) |
Includes 631,624 shares of common stock not issued under the Universal Stainless & Alloy Products, Inc. 2017 Equity Incentive Plan and 87,911 available under the 1996 Employee Stock Purchase Plan, as amended. |
The information concerning certain relationships and related transactions, and director independence is set forth in the Proxy Statement under the heading “The Board of Directors,” which information is incorporated by reference. With the exception of the information specifically incorporated herein by reference, the Proxy Statement is not to be deemed filed as part of this report for the purposes of this Item.
The information concerning principal accountant fees and services is set forth in the Proxy Statement under the heading “Principal Accountant Fees and Services,” which information is incorporated by reference. With the exception of the information specifically incorporated herein by reference, the Proxy Statement is not to be deemed filed as part of this report for the purposes of this Item.
52
The following documents are filed as part of this Form 10-K:
1) Financial Statements
The list of financial statements required by this item is set forth in Item 8, “Financial Statements and Supplementary Data” and is incorporated herein by reference.
2) Consolidated Financial Statement Schedules
Schedule II – Valuation and Qualifying Accounts
|
|
Balance at |
|
|
Charged to |
|
|
Deductions/ |
|
|
|
|
|
|
|||||||
|
|
|
beginning |
|
|
costs and |
|
|
net charge- |
|
|
Balance at |
|
||||||||
|
For the Years Ended December 31, 2017, 2016 and 2015 |
|
of year |
|
|
expenses |
|
|
offs (A) |
|
|
end of year |
|
||||||||
|
(dollars in thousands) |
|
|
|
|
|
|
|
|
|
|
|
|
|
|
|
|
|
|
|
|
|
Allowance for doubtful accounts: |
|
|
|
|
|
|
|
|
|
|
|
|
|
|
|
|
|
|
|
|
|
Year ended December 31, 2017 |
|
$ |
|
309 |
|
|
$ |
|
159 |
|
|
|
|
(12 |
) |
|
$ |
|
456 |
|
|
Year ended December 31, 2016 |
|
|
|
249 |
|
|
$ |
|
163 |
|
|
$ |
|
(103 |
) |
|
$ |
|
309 |
|
|
Year ended December 31, 2015 |
|
|
|
17 |
|
|
|
|
239 |
|
|
|
|
(7 |
) |
|
|
|
249 |
|
|
Valuation allowance for deferred income taxes: |
|
|
|
|
|
|
|
|
|
|
|
|
|
|
|
|
|
|
|
|
|
Year ended December 31, 2017 |
|
$ |
|
1,553 |
|
|
$ |
|
912 |
|
|
$ |
|
|
|
|
$ |
|
2,465 |
|
|
Year ended December 31, 2016 |
|
|
|
1,582 |
|
|
|
|
- |
|
|
|
|
(29 |
) |
|
|
|
1,553 |
|
|
Year ended December 31, 2015 |
|
|
|
1,582 |
|
|
|
|
- |
|
|
|
|
- |
|
|
|
|
1,582 |
|
|
(A) |
Represents write-off of bad debts net of recoveries |
53
|
EXHIBIT NUMBER |
|
DESCRIPTION |
||
|
|
|
|
|
|
|
3.1 |
|
Amended and Restated Certificate of Incorporation, as amended |
|
Filed herewith. |
|
|
|
|
|
|
|
|
|
|
|
|
|
|
|
|
|
|
|
3.3 |
|
|
Incorporated herein by reference to Exhibit 3.1 to the Current Report on Form 8-K filed December 15, 2014. |
|
|
|
|
|
|
|
|
4.1 |
|
Specimen Copy of Stock Certificate for shares of Common Stock |
|
Incorporated herein by reference to Exhibit 4.1 to the Company’s Annual Report on Form 10-K for the year ended December 31, 1998. |
|
|
|
|
|
|
|
4.2 |
|
|
Incorporated herein by reference to Exhibit 4.1 to the Current Report on Form 8-K filed by Universal Stainless & Alloy Products, Inc. on January 25, 2016 |
|
|
|
|
|
|
|
|
10.1 |
|
|
Filed herewith. |
|
|
|
|
|
|
|
|
10.2 |
|
|
Incorporated herein by reference to Appendix B of the Company’s Definitive Proxy Statement dated April 25, 2012.* |
|
|
|
|
|
|
|
|
10.3 |
|
Employment Agreement dated December 21, 2007 between the Company and Dennis M. Oates |
|
Incorporated herein by reference to Exhibit 10.7 to the Company’s Annual Report on Form 10-K for the year ended December 31, 2007.* |
|
|
|
|
|
|
|
10.4 |
|
Employment Agreement dated February 21, 2008 between the Company and Paul A. McGrath |
|
Incorporated herein by reference to Exhibit 10.4 to the Company’s Annual Report on Form 10-K for the year ended December 31, 2007.* |
|
|
|
|
|
|
|
10.5 |
|
Employment Agreement dated April 21, 2008 between the Company and Christopher M. Zimmer |
|
Incorporated herein by reference to Exhibit 10.7 to the Company’s Annual Report on Form 10-K for the year ended December 31, 2010.* |
|
|
|
|
|
|
|
|
|
|
|
|
|
|
|
|
|
|
|
10.7 |
|
Employment Agreement dated August 5, 2015 between the Company and Graham McIntosh |
|
Incorporated herein by reference to Exhibit 10.2 to the Company’s Quarterly Report on Form 10-Q for the quarter ended June 30, 2015.* |
|
|
|
|
|
|
|
|
|
|
|
|
|
|
|
|
|
|
|
10.9 |
|
|
Incorporated herein by reference to Exhibit 10.1 to the Company’s Quarterly Report on Form 10-Q for the quarter ended September 30, 2012.* |
|
|
|
|
|
|
|
|
10.10 |
|
|
Incorporated herein by reference to Exhibit 10.12 to the Company’s Annual Report on Form 10-K for the year ended December 31, 2014.* |
|
|
|
|
|
|
|
|
10.11 |
|
|
Incorporated herein by reference to Exhibit 10.13 to the Company’s Annual Report on Form 10-K for the year ended December 31, 2014.* |
|
54
|
EXHIBIT NUMBER |
|
DESCRIPTION |
||
|
|
|
|
|
|
|
10.12 |
|
Form of non-statutory stock option agreement for eligible directors. |
|
Incorporated herein by reference to Exhibit 10.14 to the Company’s Annual Report on Form 10-K for the year ended December 31, 2014.* |
|
|
|
|
|
|
|
10.13 |
|
|
Incorporated herein by reference to Exhibit 10.1 to the Current Report on Form 8-K filed by Universal Stainless & Alloy Products, Inc. on January 25, 2016. |
|
|
|
|
|
|
|
|
10.14 |
|
|
Incorporated herein by reference to Exhibit 10.1 to the Current Report on Form 8-K filed by Universal Stainless & Alloy Products, Inc. on February 3, 2016. |
|
|
|
|
|
|
|
|
10.15 |
|
|
Incorporated by reference to Exhibit 10.1 to the Current Report on Form 8-K filed by Universal Stainless & Alloy Products, Inc. on May 13, 2016. |
|
|
|
|
|
|
|
|
10.16 |
|
Universal Stainless & Alloy Products, Inc. 2017 Equity Incentive Plan. |
|
Incorporated herein by reference to Exhibit 10.1 to the Company’s Quarterly Report on Form 10-Q for the quarter ended June 30, 2017.* |
|
|
|
|
|
|
|
10.17 |
|
|
Incorporated herein by reference to Exhibit 10.1 to the Company’s Quarterly Report on Form 10-Q for the quarter ended September 30, 2017. |
|
|
|
|
|
|
|
|
10.18 |
|
|
Incorporated herein by reference to Exhibit 10.1 to the Current Report on Form 8-K filed by Universal Stainless & Alloy Products, Inc. on October 23, 2017. |
|
|
|
|
|
|
|
|
10.19 |
|
|
Incorporated herein by reference to Exhibit 10.3 to the Company’s Quarterly Report on Form 10-Q for the quarter ended September 30, 2017. |
|
|
|
|
|
|
|
|
10.20 |
|
|
Incorporated herein by reference to Exhibit 10.4 to the Company’s Quarterly Report on Form 10-Q for the quarter ended September 30, 2017. |
|
|
|
|
|
|
|
55
|
EXHIBIT NUMBER |
|
DESCRIPTION |
||
|
|
|
Incorporated herein by reference to Exhibit 10.5 to the Company’s Quarterly Report on Form 10-Q for the quarter ended September 30, 2017. |
||
|
|
|
|
|
|
|
10.22 |
|
|
Incorporated herein by reference to Exhibit 10.6 to the Company’s Quarterly Report on Form 10-Q for the quarter ended September 30, 2017. |
|
|
|
|
|
|
|
|
21.1 |
|
|
Filed herewith. |
|
|
|
|
|
|
|
|
23.1 |
|
|
Filed herewith. |
|
|
|
|
|
|
|
|
24.1 |
|
|
Included on the signature page herein. |
|
|
|
|
|
|
|
|
31.1 |
|
|
Filed herewith. |
|
|
|
|
|
|
|
|
31.2 |
|
|
Filed herewith. |
|
|
|
|
|
|
|
|
32.1 |
|
|
Filed herewith. |
|
|
|
|
|
|
|
|
101 |
|
The following financial information from this Annual Report on Form 10-K for the fiscal year ended December 31, 2017, formatted in XBRL (Extensible Business Reporting Language) and furnished electronically herewith: (i) the Consolidated Balance Sheets as of December 31, 2017 and 2016 (ii) the Consolidated Statements of Operations for the years ended December 31, 2017, 2016 and 2015; (iii) the Consolidated Statements of Comprehensive Income; (iv) the Consolidated Statements of Cash Flows for the years ended December 31, 2017, 2016 and 2015; (v) the Consolidated Statements of Shareholders’ Equity for the years ended December 31, 2017, 2016 and 2015; and (vi) the Notes to Consolidated Financial Statements. |
|
Filed herewith. |
|
* - |
Reflects management contract or compensatory plan or arrangement to be filed as an exhibit pursuant to Item 15(b) of this Annual Report on Form 10-K. |
Not Applicable.
56
Pursuant to the requirements of Section 13 or 15(d) of the Securities Exchange Act of 1934, the Registrant has duly caused this Report on Form 10-K to be signed on its behalf by the undersigned, thereunto duly authorized, on February 23, 2018.
|
UNIVERSAL STAINLESS & ALLOY PRODUCTS, INC. |
||
|
|
|
|
|
By: |
|
/s/ Dennis M. Oates |
|
|
|
Dennis M. Oates |
|
|
|
Chairman, President and Chief Executive Officer |
Each of the officers and directors of Universal Stainless & Alloy Products, Inc., whose signature appears below in so signing also makes, constitutes and appoints Dennis M. Oates and Paul A. McGrath, and each of them acting alone, his true and lawful attorney-in-fact, with full power of substitution, for him in any and all capacities, to execute and cause to be filed with the SEC any and all amendment or amendments to this Report on Form 10-K, with exhibits thereto and other documents connected therewith and to perform any acts necessary to be done in order to file such documents, and hereby ratifies and confirms all that said attorney-in-fact, or his substitute or substitutes, may do or cause to be done by virtue hereof.
Pursuant to the requirements of the Securities Exchange Act of 1934, this Report has been signed below by the following persons on behalf of the Registrant in the capacities and on the dates indicated.
|
SIGNATURE |
|
TITLE |
|
DATE |
|
|
|
|
|
|
|
/s/ Dennis M. Oates |
|
Chairman, President, Chief Executive Officer and |
|
February 23, 2018 |
|
Dennis M. Oates |
|
Director (Principal Executive, Financial and Accounting Officer) |
|
|
|
|
|
|
|
|
|
/s/ Christopher L. Ayers |
|
Director |
|
February 23, 2018 |
|
Christopher L. Ayers |
|
|
|
|
|
|
|
|
|
|
|
/s/ Douglas M. Dunn |
|
Director |
|
February 23, 2018 |
|
Douglas M. Dunn |
|
|
|
|
|
|
|
|
|
|
|
/s/ M. David Kornblatt |
|
Director |
|
February 23, 2018 |
|
M. David Kornblatt |
|
|
|
|
|
|
|
|
|
|
|
/s/ Udi Toledano |
|
Director |
|
February 23, 2018 |
|
Udi Toledano |
|
|
|
|
57