Attached files
| file | filename |
|---|---|
| EXCEL - IDEA: XBRL DOCUMENT - UNIVERSAL STAINLESS & ALLOY PRODUCTS INC | Financial_Report.xls |
| EX-31.2 - EX-31.2 - UNIVERSAL STAINLESS & ALLOY PRODUCTS INC | usap-20141231ex312c24dc2.htm |
| EX-10.14 - EX-10.14 - UNIVERSAL STAINLESS & ALLOY PRODUCTS INC | usap-20141231ex10147215c.htm |
| EX-23.1 - EX-23.1 - UNIVERSAL STAINLESS & ALLOY PRODUCTS INC | usap-20141231ex23119b6b9.htm |
| EX-21.1 - EX-21.1 - UNIVERSAL STAINLESS & ALLOY PRODUCTS INC | usap-20141231ex2110f30a6.htm |
| EX-32.1 - EX-32.1 - UNIVERSAL STAINLESS & ALLOY PRODUCTS INC | usap-20141231ex321bfa81e.htm |
| EX-31.1 - EX-31.1 - UNIVERSAL STAINLESS & ALLOY PRODUCTS INC | usap-20141231ex31169fde2.htm |
| EX-10.13 - EX-10.13 - UNIVERSAL STAINLESS & ALLOY PRODUCTS INC | usap-20141231ex1013343af.htm |
| EX-10.12 - EX-10.12 - UNIVERSAL STAINLESS & ALLOY PRODUCTS INC | usap-20141231ex1012b2fd1.htm |
UNITED STATES
SECURITIES AND EXCHANGE COMMISSION
Washington, DC 20549
FORM 10-K
☒ANNUAL REPORT PURSUANT TO SECTION 13 OR 15(d) OF THE SECURITIES EXCHANGE ACT OF 1934
For the Fiscal Year Ended December 31, 2014
OR
◻TRANSITION REPORT PURSUANT TO SECTION 13 OR 15(d) OF THE SECURITIES EXCHANGE ACT OF 1934
Commission File Number 000-25032

UNIVERSAL STAINLESS & ALLOY PRODUCTS, INC.
(Exact name of Registrant as specified in its charter)
|
|
|
|
DELAWARE |
25-1724540 |
|
(State or other jurisdiction of incorporation or organization) |
(IRS Employer Identification No.) |
|
|
|
|
600 MAYER STREET, BRIDGEVILLE, PA 15017 |
(412) 257-7600 |
|
(Address of principal executive offices, including zip code) |
(Registrant’s telephone number, including area code) |
Securities registered pursuant to Section 12(b) of the Act:
|
Title of each class |
Name of exchange on which registered |
|
|
Common Stock, par value $0.001 per share |
The NASDAQ Stock Market, LLC |
|
|
|
Securities registered pursuant to Section 12(g) of the Act: [None]
Indicate by check mark if the registrant is a well-known seasoned issuer, as defined in Rule 405 of the Securities Act. Yes ◻ No ☒
Indicate by check mark if the registrant is not required to file reports pursuant to Section 13 or Section 15(d) of the Act. Yes ◻ No ☒
Indicate by check mark whether the registrant (1) has filed all reports required to be filed by Section 13 or 15(d) of the Securities Exchange Act of 1934 during the preceding 12 months (or for such shorter period that the registrant was required to file such reports), and (2) has been subject to such filing requirements for the past 90 days. Yes ☒ No ◻
Indicate by check mark whether the registrant has submitted electronically and posted on its corporate website, if any, every Interactive Data file required to be submitted and posted pursuant to Rule 405 of Regulation S-T during the preceding 12 months (or for such shorter period that the registrant was required to submit and post such files). Yes ☒ No ◻
Indicate by check mark if disclosure of delinquent filers pursuant to Item 405 of Regulation S-K (§229.405 of this chapter) is not contained herein, and will not be contained, to the best of registrant’s knowledge, in definitive proxy or information statements incorporated by reference in Part III of this Form 10-K or any amendment to this Form 10-K. ◻
Indicate by check mark whether the registrant is a large accelerated filer, an accelerated filer, or a non-accelerated filer. See definitions of “accelerated filer and large accelerated filer” in Rule 12b-2 of the Exchange Act. (Check One)
|
|
|
|
|
|
Large accelerated filer |
◻ |
Accelerated filer |
☒ |
|
Non-accelerated filer |
◻ (Do not check if a smaller reporting company) |
Smaller reporting company |
◻ |
Indicate by check mark whether the registrant is a shell company (as defined in Rule 12b-2 of the Act). Yes ◻ No ☒
The aggregate market value of the voting stock held by non-affiliates of the registrant on June 30, 2014, based on the closing price of $32.48 per share on that date, was approximately $105,099,000. For the purposes of this disclosure only, the registrant has assumed that its directors, executive officers, and beneficial owners of 5% or more of the registrant’s common stock are the affiliates of the registrant. The registrant has made no determination that such persons are “affiliates” within the meaning of Rule 405 under the Securities Act of 1933.
As of February 19, 2015, there were 7,090,663 shares of the registrant’s common stock outstanding.
DOCUMENTS INCORPORATED BY REFERENCE Part III of this Form 10-K incorporates by reference portions of the Company’s definitive Proxy Statement for the 2015 Annual Meeting of Stockholders.
|
INDEX |
|||
|
PART I |
|||
|
Item 1. |
1 |
||
|
Item 1A. |
5 |
||
|
Item 1B. |
7 |
||
|
Item 2. |
7 |
||
|
Item 3. |
7 |
||
|
Item 4. |
7 |
||
|
PART II |
|||
|
Item 5. |
Market for Registrant's Common Equity, Related Stockholder Matters and Issuer Purchases of Equity Securities |
8 |
|
|
Item 6. |
9 |
||
|
Item 7. |
Management's Discussion and Analysis of Financial Condition and Results of Operations |
10 |
|
|
Item 7A. |
20 |
||
|
Item 8. |
21 |
||
|
Item 9. |
Changes in and Disagreements with Accountants on Accounting and Financial Disclosure |
38 |
|
|
Item 9A. |
38 |
||
|
Item 9B. |
38 |
||
|
PART III |
|||
|
Item 10. |
39 |
||
|
Item 11. |
39 |
||
|
Item 12. |
Security Ownership of Certain Beneficial Owners and Management and Related Stockholder Matters |
39 |
|
|
Item 13. |
Certain Relationships and Related Transactions, and Director Independence |
40 |
|
|
Item 14. |
40 |
||
|
PART IV |
|||
|
Item 15. |
40 |
||
i
PART I
CAUTIONARY STATEMENT FOR PURPOSES OF THE "SAFE HARBOR" PROVISIONS OF THE PRIVATE SECURITIES LITIGATION REFORM ACT OF 1995
The statements contained in this Annual Report on Form 10-K (“Form 10-K”) of Universal Stainless and Alloys, Inc. (“Universal,” the “Company,” “us,” “our,” or “we”), including, but not limited to, the statements contained in Item 1, “Business,” and Item 7, "Management's Discussion and Analysis of the Financial Condition and Results of Operations,” along with statements contained in other reports that we have filed with the Securities and Exchange Commission (the “SEC”), external documents and oral presentations, which are not historical facts are considered to be "forward-looking statements" within the meaning of Section 27A of the Securities Act of 1933, as amended, and Section 21E of the Securities Act of 1934, as amended. These statements which may be expressed in a variety of ways, including the use of forward looking terminology such as “believe,” “expect,” “seek,” “intend,” “may,” “will,” “should,” “could,” “potential,” “continue,” “estimate,” “plan,” or “anticipate,” or the negatives thereof, other variations thereon or compatible terminology, relate to, among other things, statements regarding future growth, cost savings, expanded production capacity, broader product lines, greater capacity to meet customer quality reliability, price and delivery needs, enhanced competitive posture, and the effect of new accounting pronouncements. We do not undertake any obligation to publicly update any forward-looking statements.
These forward-looking statements, and any forward looking statements contained in other public disclosures of the Company which make reference to the cautionary factors contained in this Form 10-K, are based on assumptions that involve risks and uncertainties and are subject to change based on the considerations described below. We discuss many of these risks and uncertainties in greater detail in Item 1A, “Risk Factors,” of this Form 10-K. These and other risks and uncertainties may cause our actual results, performance or achievements to differ materially from anticipated future results, performance or achievements expressed or implied by such forward-looking statements.
Universal, which was incorporated in 1994, and its wholly-owned subsidiaries, manufacture and market semi-finished and finished specialty steel products, including stainless steel, nickel alloys, tool steel and certain other premium alloyed steels. Our manufacturing process involves melting, remelting, heat treating, hot and cold rolling, forging, machining and cold drawing of semi-finished and finished specialty steels. Our products are sold to service centers, forgers, rerollers, original equipment manufacturers (“OEMs”) and wire redrawers. Our customers further process our products for use in a variety of industries, including the aerospace, power generation, oil and gas, heavy equipment and general industrial markets. We also perform conversion services on materials supplied by customers.
We operate in four locations: Bridgeville, Pennsylvania; Dunkirk, New York; North Jackson, Ohio and Titusville, Pennsylvania. Our corporate headquarters is located at our Bridgeville location. We operate these four manufacturing locations as one reportable business segment.
Our products are manufactured in a wide variety of grades and melt qualities including argon oxygen decarburization (“AOD”), electro-slag remelted (“ESR”), vacuum induction melting (“VIM”) and vacuum-arc remelted (“VAR”). At our Bridgeville and North Jackson facilities, we produce specialty steel products in the form of semi-finished long products (ingots, blooms, billets and bars) and flat rolled products (slabs and plates). Semi-finished long products are primarily used by our Dunkirk facility and certain customers to produce finished bar, rod, wire and plate products. Finished bar products that we manufacture are primarily used by OEMs and by service center customers for distribution to a variety of end users. We also produce customized shapes primarily for OEMs that are cold rolled from purchased coiled strip, flat bar or extruded bar at our precision rolled products department, located at our Titusville facility.
INDUSTRY OVERVIEW
The specialty steel industry is a relatively small but distinct segment of the overall steel industry. Specialty steels include stainless steels, nickel alloys, tool steels, electrical steels, high-temperature alloys, magnetic alloys and electronic alloys. Specialty steels are made with a high alloy content, which enables their use in environments that demand exceptional hardness, toughness, strength and resistance to heat, corrosion or abrasion, or combinations thereof. Specialty steels generally must conform to more demanding customer specifications for consistency, straightness and surface finish than carbon steels. For the years ended December 31, 2014, 2013 and 2012, more than 75% of our net sales were derived from stainless steel products.
1
We primarily manufacture our products within the following product lines and, generally, in response to customer orders:
Stainless Steel. Stainless steel, which represents the largest part of the specialty steel market, contains elements such as nickel, chrome and molybdenum that give it the unique qualities of high strength, good wear characteristics, natural attractiveness, ease of maintenance and resistance to rust, corrosion and heat. Stainless steel is used, among other applications, in the, aerospace, oil and gas, power generation and automotive industries, as well as in the manufacturing of equipment for food handling, health and medical, chemical processing and pollution control.
High-Strength Low Alloy Steel. High-strength low alloy steel is a relative term that refers to those steels that maintain alloying elements that range in versatility. The alloy element of nickel, chrome and molybdenum in such steels typically exceeds the alloy element of carbon steels but not that of high-temperature alloy steel. High-strength low alloy steels are manufactured for use generally in the aerospace industry.
Tool Steel. Tool steels contain elements of manganese, silicon, chrome and molybdenum to produce specific hardness characteristics that enable tool steels to form, cut, shape and shear other materials in the manufacturing process. Heating and cooling at precise rates in the heat-treating process bring out these hardness characteristics. Tool steels are utilized in the manufacturing of metals, plastics, paper and aluminum extrusions, pharmaceuticals, electronics and optics.
High-Temperature Alloy Steel. These steels are designed to meet critical requirements of heat resistance and structural integrity. They generally have very high nickel content relative to other types of specialty steels. High-temperature alloy steels are manufactured for use generally in the aerospace industry.
Our net sales by principal product line were as follows:
|
For the years ended December 31, |
2014 |
2013 |
2012 |
||||||
|
(dollars in thousands) |
|||||||||
|
Stainless steel |
$ |
159,799 |
$ |
137,383 |
$ |
195,315 | |||
|
High-strength low alloy steel |
16,853 | 17,894 | 21,897 | ||||||
|
Tool steel |
16,680 | 18,112 | 20,420 | ||||||
|
High-temperature alloy steel |
6,295 | 4,277 | 7,787 | ||||||
|
Conversion services and other sales |
5,933 | 3,102 | 5,571 | ||||||
|
Total net sales |
$ |
205,560 |
$ |
180,768 |
$ |
250,990 | |||
RAW MATERIALS
We depend on the delivery of key raw materials for our day-to-day operations. These key raw materials are carbon and stainless scrap metal and alloys, primarily consisting of nickel, chrome, molybdenum, manganese and copper. Scrap metal is primarily generated by industrial sources and is purchased through a number of scrap brokers and processors. We also recycle scrap metal generated from our own production operations as a source of metal for our melt shops. Alloys are generally purchased from domestic agents and originate in the United States, Australia, Canada, China, Russia, Brazil and South Africa.
Our Bridgeville and North Jackson facilities currently supply semi-finished specialty steel products as starting materials to our other operating facilities. Semi-finished specialty steel starting materials, which are not capable of being produced by us at a competitive cost, are purchased from other suppliers. We generally purchase these starting materials from steel strip coil suppliers, extruders, flat rolled producers and service centers. We believe that adequate supplies of starting material will continue to be available.
The cost of raw materials represents over half of the total cost of our products sold in 2014, 2013 and 2012. Raw material costs can be impacted by significant price changes. Raw material prices vary based on numerous factors, including quality, and are subject to frequent market fluctuations. Future raw material prices cannot be predicted with any degree of certainty. We do not maintain any fixed-price long-term agreements with any of our raw material suppliers.
We maintain a sales price surcharge mechanism on certain of our products to help offset the impact of raw material price fluctuations. For certain products, the surcharge is calculated at the time of order entry, based on current raw material prices or prices at the time of shipment. For certain finished products, the surcharge is calculated based on the monthly average raw material prices two months prior to the promised ship date.
ENERGY AGREEMENTS
The production of specialty steel requires the ready availability of substantial amounts of electricity and natural gas for which we negotiate competitive agreements for the supply of electricity and natural gas. While we believe that our energy agreements allow us to compete effectively within the specialty steel industry, the potential of curtailments exists as a result of decreased supplies during periods of increased demand for electricity and natural gas. These interruptions not only can adversely affect our operating
2
performance, but also can lead to increased costs. We have a sales price surcharge mechanism on our products to help offset the impact of natural gas price fluctuations.
CUSTOMERS
Our five largest customers in the aggregate accounted for approximately 46% of our net sales for each of the years ended December 31, 2014, 2013 and 2012, respectively. Our largest customer in 2014, Reliance Steel & Aluminum Co., accounted for approximately 18%, 15% and 13% of our net sales for the years ended December 31, 2014, 2013 and 2012, respectively. No other customer accounted for more than 10% of our net sales for the year ended December 31, 2014. In addition, one other customer accounted for over 10% of our net sales in 2013, and two other customers accounted for over 10% of our net sales in 2012. International sales approximated 7%, 6% and 6% of 2014, 2013 and 2012 of our total net sales, respectively.
BACKLOG
Our backlog of orders (excluding surcharges) on hand as of December 31, 2014 was approximately $61.1 million, or 31% higher, compared to approximately $46.5 million at the same time in 2013. We believe that this 31% increase in our backlog is largely a result of increased demand for our products due to improved business conditions in 2014. Our backlog may not be indicative of actual sales because certain surcharges are not determinable until the order is shipped to the customer and, therefore, should not be used as a direct measure of future revenue.
COMPETITION
Competition in our markets is based upon product quality, delivery capability, customer service, customer approval and price. Maintaining high standards of product quality, while responding quickly to customer needs and keeping production costs at competitive levels, is essential to our ability to compete in these markets.
We believe that there are several companies that manufacture one or more similar specialty steel products that are significant competitors. There are a few smaller producing companies and material converters that are also considered to be competitors of ours.
High import penetration of specialty steel products, especially stainless and tool steels, also impacts the competitive nature within the United States. Unfair pricing practices by foreign producers have resulted in high import penetration into the U.S. markets in which we participate.
EMPLOYEE RELATIONS
We consider the maintenance of good relations with our employees to be important to the successful conduct of our business. We have profit-sharing plans for certain salaried and hourly employees and for all of our employees represented by United Steelworkers (the “USW”) and have equity ownership programs for all of our eligible employees, in an effort to forge an alliance between our employees’ interests and those of our stockholders. At December 31, 2014, 2013 and 2012, we had 714, 675, and 724 employees, respectively, of which 501, 475, and 518, respectively, were USW members.
Collective Bargaining Agreements
Our Bridgeville, Titusville and Dunkirk facilities recognize the USW as the exclusive representative for their hourly employees with respect to the terms and conditions of their employment. The North Jackson facility is not unionized. We have entered into the following collective bargaining agreements:
|
|
|
|
|
Facility
|
Commencement Date
|
Expiration Date
|
|
Dunkirk |
November 2012 |
October 2017 |
|
Bridgeville |
September 2013 |
August 2018 |
|
Titusville |
October 2010 |
September 2015 |
We believe a critical component of our collective bargaining agreements is the inclusion of a profit sharing plan.
Employee Benefit Plans
We maintain a 401(k) retirement plan for our hourly and salaried employees. Pursuant to the 401(k) plan, participants may elect to make pre-tax and after-tax contributions, subject to certain limitations imposed under the Internal Revenue Code of 1986, as amended. In addition, we make periodic contributions to the 401(k) plan for the hourly employees employed at the Dunkirk and Titusville facilities, based on service, and at the North Jackson facility, based upon the employee’s age. We make periodic contributions for the salaried employees at all locations, except for North Jackson, based upon their service and their individual contribution to the 401(k) retirement plan. For North Jackson salaried employees, we make periodic contributions based upon the employee’s age and their individual contributions.
3
We participate in the Steelworkers Pension Trust (the “Trust”), a multi-employer defined-benefit pension plan that is open to all hourly and salaried employees associated with the Bridgeville facility. We make periodic contributions to the Trust based on hours worked at a fixed rate for each hourly employee and a fixed monthly contribution on behalf of each salaried employee.
We also provide group life and health insurance plans for our hourly and salary employees.
Employee Stock Purchase Plan
Under the 1996 Employee Stock Purchase Plan, as amended (the “Plan”), the Company is authorized to issue up to 200,000 shares of common stock to its full-time employees, nearly all of whom are eligible to participate. Under the terms of the Plan, employees can choose as of January 1 and July 1 of each year to have up to 10% of their total earnings withheld to purchase up to 100 shares of our common stock each six-month period. The purchase price of the stock is 85% of the lower of its beginning-of-the-period or end-of-the-period market prices. At December 31, 2014, we have issued 162,961 shares of common stock since the Plan’s inception.
ENVIRONMENTAL
We are subject to federal, state and local environmental laws and regulations (collectively, “Environmental Laws”), including those governing discharges of pollutants into the air and water, and the generation, handling and disposal of hazardous and non-hazardous substances. We monitor our compliance with applicable Environmental Laws and, accordingly, believe that we are currently in compliance with all laws and regulations in all material respects. We are subject periodically to environmental compliance reviews by various regulatory offices. We may be liable for the remediation of contamination associated with generation, handling and disposal activities. Environmental costs could be incurred, which may be significant, related to environmental compliance, at any time or from time to time in the future.
EXECUTIVE OFFICERS
The following table sets forth, as of February 24, 2015, certain information with respect to the executive officers of the Company:
|
Name (Age) |
Executive Officer Since |
Position |
||
|
Dennis M. Oates (62) |
2008 |
Chairman, President and Chief Executive Officer |
||
|
Christopher M. Zimmer (41) |
2010 |
Executive Vice President and Chief Commercial Officer |
||
|
Michael D. Bornak (52) |
2013 |
Vice President of Finance, Chief Financial Officer and Treasurer |
||
|
Paul A. McGrath (63) |
1996 |
Vice President of Administration, General Counsel and Secretary |
||
Dennis M. Oates has been President and Chief Executive Officer of the Company since 2008. Mr. Oates was named to the Company’s Board of Directors in 2007. Mr. Oates previously served as Senior Vice President of the Specialty Alloys Operations of Carpenter Technology Corporation from 2003 to 2007. Mr. Oates also served as President and Chief Executive Officer of TW Metals, Inc. from 1998 to 2003. In May 2010, the Board of Directors elected Mr. Oates to the additional position of Chairman.
Christopher M. Zimmer has been Executive Vice President and Chief Commercial Officer since July 2014. Mr. Zimmer served as Vice President of Sales and Marketing from 2008 to July 2014. Mr. Zimmer previously served as Vice President of Sales and Marketing for Schmoltz+Bickenbach USA from 1995 to 2008. He held positions of increasing responsibility including inside sales, commercial manager—stainless bar, general manager—nickel alloy products, and National Sales Manager.
Michael D. Bornak has been Vice President of Finance, Chief Financial Officer and Treasurer since June 2013. Mr. Bornak previously served as Chief Financial Officer, Treasurer and Senior Vice President, Finance and Administration of SeaChange International, Inc., a global multi-screen video software provider, from January 2012 until May 2013. Mr. Bornak previously served from 2009 until January 2012 as the Chief Financial Officer of Tollgrade Communications, Inc., a test and measurement telecommunications and utility company. From 2008 to 2009, Mr. Bornak was Chief Financial Officer of Solar Power Industries, Inc., a solar energy product manufacturer, and Mr. Bornak was the Chief Financial Officer of MHF Logistical Solutions, Inc., a logistics company primarily serving the nuclear and hazardous/non-hazardous waste industries, from 2006 to 2008. Mr. Bornak is a Certified Public Accountant and began his financial career at Ernst & Young LLP.
Paul A. McGrath has been Vice President of Administration of the Company since 2007, General Counsel since 1995 and was appointed Secretary in 1996. Mr. McGrath served as Vice President of Operations from 2001 to 2006. Previously, he was employed by Westinghouse Electric Corporation for approximately 24 years in various management positions.
4
PATENTS AND TRADEMARKS
We do not consider our business to be materially dependent on patent or trademark protection, and believe we own or maintain effective licenses covering all the intellectual property used in our business. We benefit from our proprietary rights relating to designs, engineering and manufacturing processes and procedures. We seek to protect our proprietary information by use of confidentiality and non-competition agreements with certain employees.
AVAILABLE INFORMATION
Copies of our Annual Report on Form 10-K, Quarterly Reports on Form 10-Q, current reports on Form 8-K, and any amendments to those reports, as well as proxy and information statements that we file with the SEC, are available free of charge on our website at www.univstainless.com as soon as reasonably practicable after such reports are filed with the SEC. The contents of our website are not part of this Form 10-K. Copies of these documents will be available to any shareholder upon request. Requests should be directed in writing to Investor Relations at 600 Mayer Street, Bridgeville, PA 15017. You also may read and copy any materials we file with the SEC at the SEC’s Public Reference Room at 100 F Street, NE, Washington, DC 20549. You may obtain information on the operation of the Public Reference Room by calling the SEC at 1-800-SEC-0330. The SEC maintains an Internet site at www.sec.gov that contains reports, proxy and information statements and other information regarding issuers, like us, that file electronically with the SEC.
We wish to caution each reader of this Form 10-K to consider the following factors and other factors discussed herein and in other past reports, including but not limited to prior year Form 10-K and Form 10-Q reports filed with the SEC. Our business and results of operations could be materially affected by any of the following risks. The factors discussed herein are not exhaustive. Therefore, the factors contained herein should be read together with other reports that we file with the SEC from time to time, which may supplement, modify, supersede, or update the factors listed in this document.
A substantial amount of our sales are derived from a limited number of customers.
Net sales to our five largest customers accounted for 46% of our total net sales, in each of the years ended December 31, 2014, 2013 and 2012, respectively. The accounts receivable balance from these five customers comprised approximately 37% of total accounts receivable at December 31, 2014. An adverse change in, or termination of, the relationship with one or more of our customers or market segments could have a material adverse effect on our results of operations.
Our business is very competitive and increased competition could reduce our sales.
We compete with domestic and foreign producers of specialty steel products. In addition, many of the finished products sold by our customers are in direct competition with finished products manufactured by foreign sources, which may affect the demand for those customers’ products. Any competitive factors that adversely affect the market for finished products manufactured by us or our customers could indirectly adversely affect the demand for our semi-finished products. Additionally, our products compete with products fashioned from alternative materials such as aluminum, composites and plastics, the production of which includes domestic and foreign enterprises. Competition in our field is intense and is expected to continue to be so in the foreseeable future. There can be no assurance that we will be able to compete successfully in the future.
A substantial amount of ours sales are derived from the aerospace industry.
Approximately 59% of our sales and 44% of our tons shipped represented products sold to customers in the aerospace market in 2014. The aerospace market is historically cyclical due to both external and internal market factors. These factors include general economic conditions, diminished credit availability, airline profitability, demand for air travel, age of fleets, varying fuel and labor costs, price competition, new technology development and international and domestic political conditions such as military conflict and the threat of terrorism. The length and degree of cyclical fluctuation can be influenced by any one or a combination of these factors and therefore are difficult to predict with certainty. While the aerospace industry is currently experiencing good growth, a downturn in the aerospace industry would adversely affect the demand for products and/or the prices at which we are able to sell our products, and our results of operations, business and financial condition could be materially adversely affected.
We are dependent on the availability and price of raw materials.
We purchase carbon and stainless scrap metal and alloy additives, principally nickel, chrome, molybdenum, manganese and copper, for our melting operation. A substantial portion of the alloy additives is available only from foreign sources, some of which are located in countries that may be subject to unstable political and economic conditions. Those conditions might disrupt supplies or affect the prices of the raw materials used by us. We maintain sales price surcharges on certain of our products to help offset the impact of raw material price fluctuations.
We do not maintain long-term fixed-price supply agreements with any of our raw material suppliers. If our supply of raw materials were interrupted, we might not be able to obtain sufficient quantities of raw materials, or obtain sufficient quantities of such materials
5
at satisfactory prices, which, in either case, could adversely affect our results of operations. In addition, significant volatility in the price of our principal raw materials could adversely affect our financial results and there can be no assurance that the raw material surcharge mechanism employed by us will completely offset immediate changes in our raw material costs.
We are subject to risks associated with global economic and market factors.
Our results of operations are affected directly by the level of business activity of our customers, which in turn is affected by global economic and market factors impacting the industries and markets that we serve. We are susceptible to macroeconomic downturns in the United States and abroad that may affect the general economic climate, our performance and the demand of our customers. We may face significant challenges if conditions in the financial markets deteriorate. There can be no assurance that global economic and market conditions will not adversely impact our results of operations, cash flow or financial position in the future.
We may experience a shortage in the supply of energy or an increase in energy costs to operate our facilities.
The manufacturing of specialty steels is an energy-intensive industry. While we believe that our energy agreements allow us to compete effectively within the specialty steel industry, we are subject to curtailments as a result of decreased supplies and increased demand for electricity and natural gas. These interruptions not only can adversely affect our operating performance, but also can lead to increased costs for energy.
Our business depends largely on our ability to attract and retain key personnel.
We depend on the continued service, availability and ability to attract skilled personnel, including members of our executive management team, other management positions, metallurgists, along with maintenance and production positions. Our inability to attract and retain such people may adversely impact our ability to fill existing roles and support growth. Further, the loss of key personnel could adversely affect our ability to perform until suitable replacements can be found.
Our business may be harmed by strikes or work stoppages.
At December 31, 2014, we had 501 employees out of a total of 714 who were covered under collective bargaining agreements expiring at various dates in 2015 to 2018. For example, our collective bargaining agreement (“CBA”) relating to our Titusville facility currently is scheduled to expire in September 2015. At December 31, 2014, we had 30 employees covered under this CBA at our Titusville facility. There can be no assurance that we will be successful in timely concluding collective bargaining agreements with the USW to succeed the agreements that expire, in which case, we may experience strikes or work stoppages that may have a material adverse impact on our results of operations.
Our business may be harmed by failures on critical manufacturing equipment.
Our manufacturing processes are dependent upon certain critical pieces of specialty steel making equipment, such as our 50-ton electric-arc furnace and AOD vessel, our ESR, VIM and VAR furnaces, our radial hydraulic forge and our universal rolling mill. In the event a critical piece of equipment should become inoperative as a result of unexpected equipment failure, there can be no assurance that our operations would not be substantially curtailed, which may have a negative effect on our financial results.
Our business may be harmed if we are unable to meet our debt service requirements or the covenants in our Credit Agreement or if interest rates increase.
We have debt upon which we are required to make scheduled interest and principal payments, and we may incur additional debt in the future. A significant portion of our debt bears interest at variable rates that may increase in the future. Our ability to satisfy our debt obligations, and our ability to refinance any of our indebtedness in the future if we determine that doing so would be advisable, will depend upon our future operating performance, which will be affected by prevailing economic conditions in the markets that we serve and financial, business and other factors, many of which are beyond our control. If we are unable to generate sufficient cash to service our debt or if interest rates increase, our results of operations and financial condition could be adversely affected. Our Credit Agreement, which provides for a $105.0 million senior secured revolving credit facility and a $20.0 million senior secured term loan facility, also requires us to comply with certain covenants. A failure to comply with the covenants contained in the Credit Agreement could result in a default, which, if not waived by our lenders, could substantially increase our borrowing costs and result in acceleration of our debt. As of December 31, 2014, we were in compliance with the covenants in our Credit Agreement.
The carrying value of goodwill may not be recoverable.
Goodwill is recorded at fair value on the date of acquisition. We review goodwill at least annually for impairment. Impairment may result from, among other things, deterioration in performance, adverse market conditions, adverse changes in applicable laws or regulations, and a variety of other factors. Any future impairment of goodwill could have a material adverse effect on our results of operations.
6
We believe that our international sales are associated with various risks.
We conduct business with suppliers and customers in foreign countries which exposes us to risks associated with international business activities. We could be significantly impacted by those risks, which include the potential for volatile economic and labor conditions, political instability, collecting accounts receivable and exchange rate fluctuations (which may affect sales revenue to international customers and the margins on international sales when converted into U.S. dollars).
If we are unable to protect our information technology infrastructure against service interruptions, data corruption, cyber-based attacks or network security beaches, our operations could be disrupted.
We rely on information technology networks and systems to manage and support a variety of business activities, including procurement and supply chain, engineering support, and manufacturing. Our information technology systems, some of which are managed by third-parties, may be susceptible to damage, disruptions or shutdown due to failures during the process of upgrading or replacing software, databases or components thereof, power outages, hardware failures, computer viruses, attacks by computer hackers, telecommunications failures, user errors or catastrophic events. In addition, security breaches could result in unauthorized disclosures of confidential information. If our information technology systems suffer severe damage, disruption or shutdown and our business continuity plans do not effectively resolve the issues in a timely manner, our manufacturing process could be disrupted resulting in late deliveries or even no deliveries if there is a total shutdown.
ITEM 1B.UNRESOLVED STAFF COMMENTS
None.
We own our Bridgeville, Pennsylvania facility, which consists of approximately 760,000 square feet of floor space and our executive offices on approximately 74 acres. The Bridgeville facility contains melting, remelting, conditioning, rolling, annealing and various other processing equipment. Substantially all products shipped from the Bridgeville facility are processed through its melt shop and universal rolling mill operations.
We own our North Jackson, Ohio facility, which consists of approximately 257,000 square feet of floor space on approximately 110 acres. The North Jackson facility contains melting, remelting, forging, annealing and various other processing operations.
We own our Dunkirk, New York facility, which consists of approximately 680,000 square feet of floor space on approximately 81 acres. The Dunkirk facility processes semi-finished billet and bar stock through one or more of its four rolling mills, a high temperature annealing facility and/or a round bar facility.
We own our Titusville, Pennsylvania facility, which consists of seven buildings on approximately 10 acres, including two principal buildings of approximately 265,000 square feet in total area. The Titusville facility contains five VAR furnaces and various rolling and finishing equipment.
Specialty steel production is a capital-intensive industry. We believe that our facilities and equipment are suitable for our present manufacturing needs. We believe, however, that we will continue to require capital from time to time to add new equipment and to repair or replace our existing equipment to remain competitive and to enable us to manufacture quality products and provide delivery and other support service assurances to our customers.
From time to time, various lawsuits and claims have been or may be asserted against us relating to the conduct of our business, including routine litigation relating to commercial and employment matters. The ultimate cost and outcome of any litigation or claim cannot be predicted with certainty. We believe, based on information presently available, that the likelihood that the ultimate outcome of any such pending matter will have a material adverse effect on our financial condition, or liquidity or a material impact to our results of operations is remote, although the resolution of one or more of these matters may have a material adverse effect on our results of operations for the period in which the resolution occurs.
ITEM 4.MINE SAFETY DISCLOSURES
Not applicable.
7
PART II
ITEM 5.MARKET FOR THE REGISTRANT’S COMMON EQUITY, RELATED STOCKHOLDER MATTERS AND ISSUER PURCHASES OF EQUITY SECURITIES
At December 31, 2014, a total of 7,371,018 shares of common stock, par value $0.001 per share, were issued and held by approximately 113 holders of record. There were 292,855 shares of the issued common stock held in treasury at December 31, 2014.
Certain holders of our common stock and the Company are party to a stockholder agreement. That agreement maintains in effect certain registration rights granted to non-management stockholders and provides to them two demand registration rights exercisable at any time upon written request for the registration of shares of common stock having an aggregate net offering price of at least $5.0 million.
PRICE RANGE OF COMMON STOCK
Our common stock is listed on the NASDAQ Global Select Market under the symbol “USAP.” The following table sets forth the range of high and low sales prices per share of our common stock, for the periods indicated below:
|
2014 |
2013 |
|||||||||||
|
High |
Low |
High |
Low |
|||||||||
|
First quarter |
$ |
38.88 |
$ |
30.15 |
$ |
38.44 |
$ |
32.41 | ||||
|
Second quarter |
$ |
36.81 |
$ |
28.79 |
$ |
36.59 |
$ |
27.61 | ||||
|
Third quarter |
$ |
34.22 |
$ |
25.92 |
$ |
33.11 |
$ |
19.28 | ||||
|
Fourth quarter |
$ |
28.79 |
$ |
22.85 |
$ |
36.78 |
$ |
30.95 | ||||
PERFORMANCE GRAPH
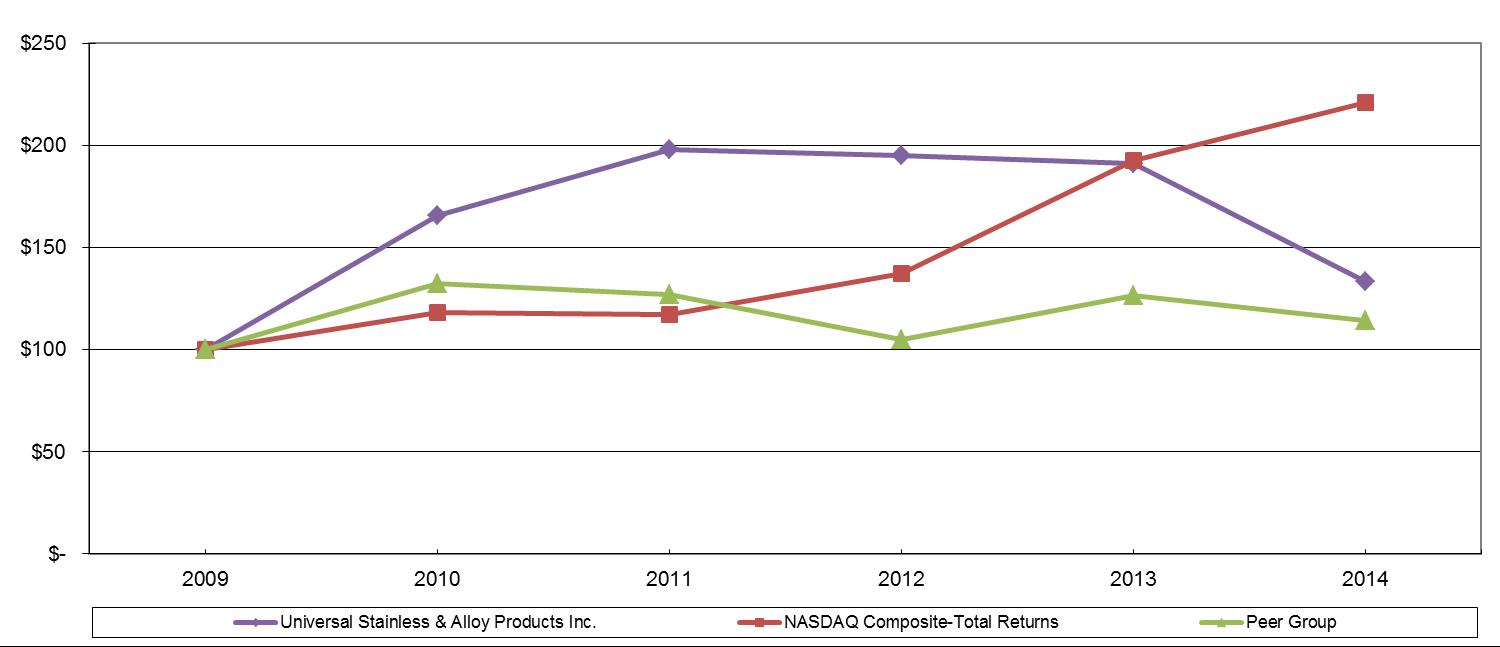
The performance graph below compares the cumulative total stockholder return on our common stock with the cumulative total return on the equity securities of the NASDAQ Composite Index and a peer group selected by us. The peer group consists of domestic specialty steel producers: Allegheny Technologies Incorporated; Materion Corporation; Carpenter Technology Corporation; Haynes International, Inc.; and RTI International Metals, Inc. The graph assumes an investment of $100 on December 31, 2009 reinvestment of dividends, if any, on the date of dividend payment and the peer group is weighted by each company’s market capitalization. The performance graph represents past performance and should not be considered to be an indication of future performance.
Comparison of 5-Year Cumulative Total Shareholder Return among Universal Stainless & Alloy Products, Inc., the NASDAQ Composite Index and a Peer Group
|
For the years ended December 31, |
||||||||||||||||||
|
Company/Peer/Market |
2009 |
2010 |
2011 |
2012 |
2013 |
2014 |
||||||||||||
|
Universal Stainless & Alloy Products, Inc. |
$ |
100.00 |
$ |
165.85 |
$ |
198.09 |
$ |
194.97 |
$ |
191.20 |
$ |
133.35 | ||||||
|
Peer Group |
$ |
100.00 |
$ |
132.39 |
$ |
127.08 |
$ |
105.00 |
$ |
126.40 |
$ |
114.21 | ||||||
|
NASDAQ Composite Index |
$ |
100.00 |
$ |
118.02 |
$ |
117.04 |
$ |
137.47 |
$ |
192.62 |
$ |
221.02 | ||||||
8
PREFERRED STOCK
Our Certificate of Incorporation provides that we may, by vote of our Board of Directors, issue up to 1,980,000 shares of preferred stock. The preferred stock may have rights, preferences, privileges and restrictions thereon, including dividend rights, dividend rates, conversion rights, voting rights, terms of redemption, redemption prices, liquidation preferences and the number of shares constituting any series or designation of such series, without further vote or action by the stockholders. The issuance of preferred stock may have the effect of delaying, deferring or preventing a change in control of the Company without further action by the stockholders and may adversely affect the voting and other rights of the holders of common stock. The issuance of preferred stock with voting and conversion rights may adversely affect the voting power of the holders of common stock, including the loss of voting control to others. We have no outstanding preferred stock and have no current plans to issue any of the authorized preferred stock.
DIVIDENDS
We have never paid a cash dividend on our common stock. Our Credit Agreement does not permit the payment of cash dividends on our common stock.
ITEM 6.SELECTED FINANCIAL DATA
|
For the years ended December 31, |
2014 |
2013 |
2012 |
2011 |
2010 |
||||||||||
|
(dollars in thousands, except per share amounts) |
|||||||||||||||
|
Summary of operations: |
|||||||||||||||
|
Net sales |
$ |
205,560 |
$ |
180,768 |
$ |
250,990 |
$ |
252,596 |
$ |
189,423 | |||||
|
Operating income (loss) |
$ |
10,900 |
$ |
(4,005) |
$ |
23,403 |
$ |
29,687 |
$ |
20,423 | |||||
|
Net income (loss) |
$ |
4,050 |
$ |
(4,062) |
$ |
14,617 |
$ |
18,122 |
$ |
13,242 | |||||
|
Financial position at year-end: |
|||||||||||||||
|
Cash |
$ |
142 |
$ |
307 |
$ |
321 |
$ |
274 |
$ |
34,400 | |||||
|
Working capital |
$ |
107,752 |
$ |
99,554 |
$ |
129,346 |
$ |
113,742 |
$ |
110,039 | |||||
|
Property, plant and equipment, net |
$ |
199,795 |
$ |
203,590 |
$ |
206,150 |
$ |
183,148 |
$ |
71,581 | |||||
|
Total assets |
$ |
364,557 |
$ |
347,924 |
$ |
375,698 |
$ |
361,439 |
$ |
210,540 | |||||
|
Long-term debt |
$ |
83,875 |
$ |
86,796 |
$ |
105,242 |
$ |
91,650 |
$ |
7,990 | |||||
|
Stockholders’ equity |
$ |
203,630 |
$ |
196,458 |
$ |
197,713 |
$ |
180,073 |
$ |
159,562 | |||||
|
Common share data: |
|||||||||||||||
|
Net income (loss) per common share - Basic |
$ |
0.58 |
$ |
(0.58) |
$ |
2.13 |
$ |
2.65 |
$ |
1.95 | |||||
|
Net income (loss) per common share - Diluted |
$ |
0.57 |
$ |
(0.58) |
$ |
2.02 |
$ |
2.56 |
$ |
1.93 | |||||
We acquired the North Jackson facility in August 2011. The results and balances related to North Jackson have been included in our consolidated results since that time.
9
ITEM 7.MANAGEMENT’S DISCUSSION AND ANALYSIS OF FINANCIAL CONDITION AND RESULTS OF OPERATIONS
|
|
The following Management Discussion and Analysis (“MD&A”) is intended to help the reader understand the consolidated results of operations and financial condition of Universal Stainless & Alloy Products, Inc. and its wholly-owned subsidiaries (collectively, “we,” “us,” “our,” or the “Company”). This MD&A should be read in conjunction with our consolidated financial statements and accompanying notes included in this Form 10-K. When reviewing the discussion, you should keep in mind the substantial risks and uncertainties that characterize our business. In particular, we encourage you to review the risk and uncertainties described under Item 1A., “Risk Factors,” of this Form 10-K. These risks and uncertainties could cause actual results to differ materially from those forecasted in forward-looking statements or implied by past results and trends. Forward-looking statements are statements that attempt to project or anticipate future developments in our business; we encourage you to review the discussion of forward-looking statements under “Cautionary Statement for Purposes of the “Safe Harbor” Provisions of the Private Securities Litigation Reform Act of 1995,” at the beginning of this report. These statements, like all statements in this report, speak only as of the date of this report (unless another date is indicated), and we undertake no obligation to update or revise the statements in light of future developments. Unless otherwise specified, any reference to a “year” is to the year ended December 31.
Business Overview
We manufacture and market semi-finished and finished specialty steel products, including stainless steel, nickel alloys, tool steel and certain other alloyed steels. Our manufacturing process involves melting, remelting, heat treating, hot and cold rolling, forging, machining and cold drawing of semi-finished and finished specialty steels. Our products are sold to service centers, forgers, rerollers, original equipment manufacturers and wire redrawers. Our customers further process our products for use in a variety of industries, including the aerospace, power generation, oil and gas and general industrial markets. We also perform conversion services on materials supplied by customers.
Throughout 2014, we saw an increased demand for our products in the majority of our targeted end markets, as our revenues increased to $205.6 million, an increase of $24.8 million, or 14%, compared to full year 2013. The growth in 2014 net sales was achieved despite the loss of one of our largest customers that announced in late 2013 that it would in-source work that we previously performed for it. In our primary market, aerospace, which approximates 59% of our total net sales, our net sales grew to $120.9 million in 2014 from $102.3 million in 2013, an increase of $18.6 million, or 18.2%. In addition, net revenues in our power generation and oil and gas markets increased by 8% and 3% in 2014, respectively. These increases were slightly offset by an 8% reduction in sales to the heavy equipment market. For the full year of 2014, our premium alloy products, which we define as all vacuum induction melt (“VIM”), sales increased by 30% over 2013 levels, and represented $13.8 million, or 6.7%, of our total net sales compared to $10.6 million, or 5.9%, of total net sales in 2013. Our premium alloy products are primarily sold to the aerospace end market. Our backlog at the end of 2014, before surcharges, was approximately $61.1 million, an increase of almost 31% compared to a backlog of $46.5 million at the end of 2013. One of our top priorities over the last 24 months has been to earn customer certifications. In 2014, we earned an additional two certifications that are critical to our focus on the aerospace business, the Pratt and Whitney LCS approval in March 2014 and the S-400 and S-1000 approvals from GE Aviation in July 2014. We added 13 more new products in 2014 on top of the 11 added in 2013, as new product introductions are also essential to move to a higher value product mix. Thus far into 2015, we have added 5 new products to our portfolio. We continue to work on gaining other customer approvals for our higher value added nickel alloy products to expand our revenue base as we move into future periods.
During 2014, our overall manufacturing activity levels increased significantly compared to 2013, and thus we were better able to absorb costs due to more consistent levels of demand and production. In addition, we continued to focus our attention on reducing scrap rates and improving yields, while controlling spending at each of plants. As a result of these efforts and improved business conditions, our gross margins for 2014 more than doubled to 15.6% as a percentage of net sales compared to 7.7% posted for the full year in 2013. As we move into 2015, with declining nickel prices and lower surcharges that began later in 2014 and have continued into 2015, we may see a negative impact to our gross margin, especially in the first quarter, as some of our older inventory at higher material prices is shipped to our customers. We intend to continue our effort to improve our gross margin throughout the year. Our selling, general and administrative expenses increased $3.2 million in 2014 compared to 2013 primarily as a result of incurring additional expense of $2.2 million under our variable incentive compensation plan due to our improved profitability in 2014 compared to 2013, as well as recording administrative related costs of $960,000 associated with switching our health care plans from a full premium based plan to a self-insurance based plan. However, our overall healthcare costs for 2014 were consistent with those incurred in 2013. We also deepened our management team in 2014 and as a result incurred higher than normal placement fees and relocation costs. Overall though, our operating income in 2014 increased to $10.9 million compared to an operating loss of $4.0 million in 2013, or almost a $15 million improvement in just one year. We continue to generate cash from operations and our capital spending program, which totaled $11.2 million in 2014, is discretionary in nature as we invest in projects with the highest return on investment.
We believe that demand in the majority of our end markets, especially aerospace where both Boeing and Airbus have production backlogs out for the next several years along with growth in the aftermarket parts markets will continue to improve as we move through 2015. However, as we begin 2015, we see signs of a downturn in the oil and gas market with the decline of oil prices and a
10
slow-down in new oil related exploration activities, as well as potential pricing pressure in other end markets as competitors with larger oil and gas exposure seek to capture other market opportunities,
Our operating facilities are integrated, and therefore our chief operating decision maker (“CODM”) views the Company as one business unit. Our CODM sets performance goals, assesses performance and makes decisions about resource allocations on a consolidated basis. As a result of these factors, as well as the nature of the financial information available which is reviewed by our CODM, we maintain one reportable segment.
Results of Operations
2014 Results as Compared to 2013
|
For the years ended December 31, |
2014 |
2013 |
||||||||||||||||
|
(dollars in thousands, except per shipped ton information) |
||||||||||||||||||
|
Amount |
Percentage of net sales |
Amount |
Percentage of net sales |
Dollar / ton variance |
Percentage variance |
|||||||||||||
|
Net sales: |
||||||||||||||||||
|
Stainless steel |
$ |
159,799 | 77.7 |
% |
$ |
137,383 | 76.0 |
% |
$ |
22,416 | 16.3 |
% |
||||||
|
High-strength low alloy steel |
16,853 | 8.2 | 17,894 | 9.9 | (1,041) | (5.8) | ||||||||||||
|
Tool steel |
16,680 | 8.1 | 18,112 | 10.0 | (1,432) | (7.9) | ||||||||||||
|
High-temperature alloy steel |
6,295 | 3.1 | 4,277 | 2.4 | 2,018 | 47.2 | ||||||||||||
|
Conversion services and other sales |
5,933 | 2.9 | 3,102 | 1.7 | 2,831 | 91.3 | ||||||||||||
|
Total net sales |
205,560 | 100.0 | 180,768 | 100.0 | 24,792 | 13.7 | ||||||||||||
|
Cost of products sold |
173,538 | 84.4 | 166,888 | 92.3 | 6,650 | 4.0 | ||||||||||||
|
Gross margin |
32,022 | 15.6 | 13,880 | 7.7 | 18,142 | 130.7 | ||||||||||||
|
Selling, general and administrative expenses |
21,122 | 10.3 | 17,885 | 9.9 | 3,237 | 18.1 | ||||||||||||
|
Operating income (loss) |
10,900 | 5.3 | (4,005) | (2.2) | 14,905 | 372.2 | ||||||||||||
|
Interest expense |
(3,035) | (1.5) | (2,598) | (1.4) | 437 | 16.8 | ||||||||||||
|
Deferred financing amortization |
(644) | (0.3) | (444) | (0.2) | 200 | 45.0 | ||||||||||||
|
Other (expense) income |
(22) |
- |
481 | 0.3 | (503) | (104.6) | ||||||||||||
|
Income (loss) before income taxes |
7,199 | 3.5 | (6,566) | (3.6) | 13,765 | 209.6 | ||||||||||||
|
Provision (benefit) for income taxes |
3,149 | 1.5 | (2,504) | (1.4) | 5,653 | 225.8 | ||||||||||||
|
Net income (loss) |
$ |
4,050 | 2.0 |
% |
$ |
(4,062) | (2.2) |
% |
$ |
8,112 | 199.7 |
% |
||||||
|
Tons shipped |
38,869 | 36,477 | 2,392 | 6.6 |
% |
|||||||||||||
|
Sales dollars per shipped ton |
$ |
5,289 |
$ |
4,956 |
$ |
333 | 6.7 |
% |
||||||||||
11
Market Segment Information:
|
For the years ended December 31, |
2014 |
2013 |
||||||||||||||||
|
(dollars in thousands) |
||||||||||||||||||
|
Amount |
Percentage of net sales |
Amount |
Percentage of net sales |
Dollar variance |
Percentage variance |
|||||||||||||
|
Net sales: |
||||||||||||||||||
|
Service centers |
$ |
137,298 | 66.8 |
% |
$ |
115,859 | 64.1 |
% |
$ |
21,439 | 18.5 |
% |
||||||
|
Forgers |
24,918 | 12.1 | 21,254 | 11.8 | 3,664 | 17.2 | ||||||||||||
|
Rerollers |
21,129 | 10.3 | 27,021 | 14.9 | (5,892) | (21.8) | ||||||||||||
|
Original equipment manufacturers |
16,282 | 7.9 | 13,532 | 7.5 | 2,750 | 20.3 | ||||||||||||
|
Conversion services and other sales |
5,933 | 2.9 | 3,102 | 1.7 | 2,831 | 91.3 | ||||||||||||
|
Total net sales |
$ |
205,560 | 100.0 |
% |
$ |
180,768 | 100.0 |
% |
$ |
24,792 | 13.7 |
% |
||||||
Melt Type Information:
|
For the years ended December 31, |
2014 |
2013 |
||||||||||||||||
|
(dollars in thousands) |
||||||||||||||||||
|
Amount |
Percentage of net sales |
Amount |
Percentage of net sales |
Dollar variance |
Percentage variance |
|||||||||||||
|
Net sales: |
||||||||||||||||||
|
Specialty alloys |
$ |
185,811 | 90.4 |
% |
$ |
167,040 | 92.4 |
% |
$ |
18,771 | 11.2 |
% |
||||||
|
Premium alloys |
13,816 | 6.7 | 10,626 | 5.9 | 3,190 | 30.0 | ||||||||||||
|
Conversion services and other sales |
5,933 | 2.9 | 3,102 | 1.7 | 2,831 | 91.3 | ||||||||||||
|
Total net sales |
$ |
205,560 | 100.0 |
% |
$ |
180,768 | 100.0 |
% |
$ |
24,792 | 13.7 |
% |
||||||
The majority of our products are sold to service centers/processors rather than the ultimate end market customers. The end market information in this Annual Report is our estimate based upon our knowledge of our customers and the grade of material sold to them, that they will in-turn sell to the ultimate end market customer.
End Market Information:
|
For the years ended December 31, |
2014 |
2013 |
||||||||||||||||
|
(dollars in thousands) |
||||||||||||||||||
|
Amount |
Percentage of net sales |
Amount |
Percentage of net sales |
Dollar variance |
Percentage variance |
|||||||||||||
|
Net sales: |
||||||||||||||||||
|
Aerospace |
$ |
120,947 | 58.8 |
% |
$ |
102,341 | 56.6 |
% |
$ |
18,606 | 18.2 |
% |
||||||
|
Power generation |
23,498 | 11.4 | 21,671 | 12.0 | 1,827 | 8.4 | ||||||||||||
|
Oil and gas |
19,470 | 9.6 | 18,880 | 10.5 | 590 | 3.1 | ||||||||||||
|
Heavy equipment |
18,147 | 8.8 | 19,788 | 10.9 | (1,641) | (8.3) | ||||||||||||
|
General industrial, conversion services and other sales |
23,498 | 11.4 | 18,088 | 10.0 | 5,410 | 29.9 | ||||||||||||
|
Total net sales |
$ |
205,560 | 100.0 |
% |
$ |
180,768 | 100.0 |
% |
$ |
24,792 | 13.7 |
% |
||||||
Net sales:
Net sales for the year ended December 31, 2014 increased $24.8 million, or 13.7%, as compared to the similar period in 2013. The increase in our sales primarily reflects a 6.6% increase in consolidated tons shipped in 2014 compared to 2013 as demand for our products increased as a result of improved market conditions in 2014. The increase in both sales and sales dollars per shipped ton is primarily a result of increased base prices as well as more favorable product mix of our higher value added products. Our product sales to all of our end markets, except heavy equipment, increased as noted in the above table. Our product sales to our targeted end markets of aerospace, power generation, and oil and gas end markets increased 18.2%, 8.4% and 3.1%, respectively in 2014 compared
12
to 2013. Sales to our heavy equipment market decreased by $1.6 million, or 8.3%, in 2014 compared to 2013, primarily due to uneven buying patterns from year to year because of the many smaller customers we have in this end market. During the year ended December 31, 2014, we recognized a $3.2 million, or a 30.0%, increase in premium alloy sales when compared to 2013. It is a primary focus of ours to ship higher value added products. Overall, our premium alloy sales, which are sold primarily to the aerospace end market increased from 5.9% of total sales for the year ended December 31, 2013 to 6.7% of total sales during the year ended December 31, 2014.
Gross margin:
Our gross margin, as a percentage of sales, more than doubled to 15.6% for the year ended 2014 compared to 7.7% for the same 2013 period. The improvement in our gross margin for the year ended December 31, 2014 as compared to the same prior year period is largely a result of a better product mix of higher value added products sold, improved yields and scrap rates, and higher plant operating levels due to improved market conditions which created a higher demand for our products compared to the same 2013 period.
Selling and administrative and expenses:
Our selling, general and administrative (“SG&A”) expenses consist primarily of employee costs, which include salaries, payroll taxes and benefit related costs, legal and accounting services, stock compensation and insurance costs. Our SG&A expenses increased by $3.2 million in the year ended December 31, 2014 as compared to the year ended December 31, 2013 primarily due to increased expenses of $2.2 million related to our variable incentive compensation plan as the result of our increased profitability in 2014 as compared to 2013 and approximately $960,000 of administrative costs associated with moving our fully insured health care plans to a self-insured plan. However, our overall healthcare costs for 2014 were consistent with those incurred in 2013. In addition, we incurred higher than normal placement and relocation costs to deepen our management team for further growth; however, these costs were somewhat offset by a reduction in severance costs. We incurred $392,000 in severance expense in the year ended December 31, 2013 from the departure of a senior executive.
Interest expense and deferred financing amortization:
Our interest costs on our debt increased to $3.0 million for the year ended December 31, 2014 compared to $2.6 million for the same period of 2013. This increase is primarily due to higher interest rates incurred on our debt in 2014 as compared to 2013. The interest rate on our variable rate debt is determined by a LIBOR-based rate plus an applicable margin based upon achieving certain covenant levels. Our deferred financing costs are associated with the issuance and subsequent amendments to our credit facility. During the years ended December 31, 2014 and 2013, we recognized $644,000 and $444,000, respectively, of deferred financing amortization. Based upon the maturity date of our current debt facility, we expect that our annual deferred financing amortization expense for 2015 and 2016 to be approximately $639,000 and $107,000 in 2017.
Other income:
During the year ended December 31, 2013, we entered into a settlement agreement with the sellers of the North Jackson facility, whereby we received $425,000 as a final settlement of certain claims under an escrow agreement that was entered into at the time of acquisition to satisfy certain claims under the purchase agreement. The settlement was recognized as a gain during the year ended December 31, 2013, which is included as a component of other income on the consolidated statement of operations.
Income tax provision:
Our effective tax rates for the years ended December 31, 2014 and 2013 were 43.7% and (38.1)%, respectively. Our overall effective tax rate for the year ended December 31, 2014, which reflects federal and state taxable income, also includes net tax expenses of $570,000 due to a change in the New York state tax rate to zero percent (0%) for qualified New York manufacturers, a settlement with Pennsylvania regarding certain expenses deducted, and prior and current year research and development (“R&D”) tax credits.
On March 31, 2014, new tax legislation was enacted in New York that reduced the New York state income tax rate to zero percent (0%) for qualified manufacturers, such as Universal, for tax years beginning on or after January 1, 2014. Prior to this legislation, our facility in Dunkirk operated in a New York State Empire Zone and qualified to benefit from investments made and employees hired, and as such, we had recorded a deferred tax asset on these investments. As a result of this new legislation, we placed a full valuation allowance on our remaining corresponding deferred tax asset in the amount of $596,000 during the first quarter of 2014. Also, the Tax Increase Prevention Act of 2014 extended the tax benefit for research and development tax credits for 2014 resulting in a benefit of approximately $342,000 which was recorded in the fourth quarter of 2014. In addition, we reached a settlement with Pennsylvania on certain expenses, which had been deducted for state income tax purposes during the 2005-2008 tax years. As a result of this matter, we incurred $179,000 of additional Pennsylvania income taxes net of the federal tax benefit.
Our effective tax rate for the year ended December 31, 2013 was negatively impacted by the tax valuation allowance of $986,000 that we placed against certain deferred tax assets for New York. Our effective tax rate for the year ended December 31, 2013 benefited from approximately $1.0 million of R&D tax credits that we generated for 2012 and 2013.
13
Net income:
Our net income increased to $4.1 million, or $0.57 per diluted share, for the year ended December 31, 2014 from a net loss of $(4.1) million, or $(0.58) per diluted share, for the year ended December 31, 2013.
2013 Results as Compared to 2012
|
For the years ended December 31, |
2013 |
2012 |
||||||||||||||||
|
(dollars in thousands, except per shipped ton information) |
||||||||||||||||||
|
Amount |
Percentage of net sales |
Amount |
Percentage of net sales |
Dollar / ton variance |
Percentage variance |
|||||||||||||
|
Net sales: |
||||||||||||||||||
|
Stainless steel |
$ |
137,383 | 76.0 |
% |
$ |
195,315 | 77.8 |
% |
$ |
(57,932) | (29.7) |
% |
||||||
|
High-strength low alloy steel |
17,894 | 9.9 | 21,897 | 8.7 | (4,003) | (18.3) | ||||||||||||
|
Tool steel |
18,112 | 10.0 | 20,420 | 8.1 | (2,308) | (11.3) | ||||||||||||
|
High-temperature alloy steel |
4,277 | 2.4 | 7,787 | 3.1 | (3,510) | (45.1) | ||||||||||||
|
Conversion services and other sales |
3,102 | 1.7 | 5,571 | 2.3 | (2,469) | (44.3) | ||||||||||||
|
Total net sales |
180,768 | 100.0 | 250,990 | 100.0 | (70,222) | (28.0) | ||||||||||||
|
Cost of products sold |
166,888 | 92.3 | 209,841 | 83.6 | (42,953) | (20.5) | ||||||||||||
|
Gross margin |
13,880 | 7.7 | 41,149 | 16.4 | (27,269) | (66.3) | ||||||||||||
|
Selling, general and administrative expenses |
17,885 | 9.9 | 17,746 | 7.1 | 139 | 0.8 | ||||||||||||
|
Operating (loss) income |
(4,005) | (2.2) | 23,403 | 9.3 | (27,408) | (117.1) | ||||||||||||
|
Interest expense |
(2,598) | (1.4) | (2,284) | (0.9) | 314 | 13.7 | ||||||||||||
|
Deferred financing amortization |
(444) | (0.2) | (308) | (0.1) | 136 | 44.2 | ||||||||||||
|
Other income, net |
481 | 0.3 | 140 |
- |
341 | 243.6 | ||||||||||||
|
(Loss) income before income taxes |
(6,566) | (3.6) | 20,951 | 8.3 | (27,517) | (131.3) | ||||||||||||
|
(Benefit) provision for income taxes |
(2,504) | (1.4) | 6,334 | 2.5 | (8,838) | (139.5) | ||||||||||||
|
Net (loss) income |
$ |
(4,062) | (2.2) |
% |
$ |
14,617 | 5.8 |
% |
$ |
(18,679) | (127.8) |
% |
||||||
|
Tons shipped |
36,477 | 47,802 | (11,325) | (23.7) |
% |
|||||||||||||
|
Sales dollars per shipped ton |
$ |
4,956 |
$ |
5,251 |
$ |
(295) | (5.6) |
% |
||||||||||
Market Segment Information:
|
For the years ended December 31, |
2013 |
2012 |
||||||||||||||||
|
(dollars in thousands) |
||||||||||||||||||
|
Amount |
Percentage of net sales |
Amount |
Percentage of net sales |
Dollar variance |
Percentage variance |
|||||||||||||
|
Net sales: |
||||||||||||||||||
|
Service centers |
$ |
115,859 | 64.1 |
% |
$ |
151,034 | 60.2 |
% |
$ |
(35,175) | (23.3) |
% |
||||||
|
Forgers |
21,254 | 11.8 | 36,678 | 14.6 | (15,424) | (42.1) | ||||||||||||
|
Rerollers |
27,021 | 14.9 | 37,343 | 14.9 | (10,322) | (27.6) | ||||||||||||
|
Original equipment manufacturers |
13,532 | 7.5 | 20,364 | 8.1 | (6,832) | (33.5) | ||||||||||||
|
Conversion services and other sales |
3,102 | 1.7 | 5,571 | 2.2 | (2,469) | (44.3) | ||||||||||||
|
Total net sales |
$ |
180,768 | 100.0 |
% |
$ |
250,990 | 100.0 |
% |
$ |
(70,222) | (28.0) |
% |
||||||
14
Melt Type Information:
|
For the years ended December 31, |
2013 |
2012 |
||||||||||||||||
|
(dollars in thousands) |
||||||||||||||||||
|
Amount |
Percentage of net sales |
Amount |
Percentage of net sales |
Dollar variance |
Percentage variance |
|||||||||||||
|
Net sales: |
||||||||||||||||||
|
Specialty alloys |
$ |
167,040 | 92.4 |
% |
$ |
234,588 | 93.5 |
% |
$ |
(67,548) | (28.8) |
% |
||||||
|
Premium alloys |
10,626 | 5.9 | 10,831 | 4.3 | (205) | (1.9) | ||||||||||||
|
Conversion services and other sales |
3,102 | 1.7 | 5,571 | 2.2 | (2,469) | (44.3) | ||||||||||||
|
Total net sales |
$ |
180,768 | 100.0 |
% |
$ |
250,990 | 100.0 |
% |
$ |
(70,222) | (28.0) |
% |
||||||
The majority of our products are sold to service centers/processors rather than the ultimate end market customers. The end market information in this Annual Report is our estimate based upon our knowledge of our customers and the grade of material sold to them, that they will in-turn sell to the ultimate end market customer.
End Market Information:
|
For the years ended December 31, |
2013 |
2012 |
||||||||||||||||
|
(dollars in thousands) |
||||||||||||||||||
|
Amount |
Percentage of net sales |
Amount |
Percentage of net sales |
Dollar variance |
Percentage variance |
|||||||||||||
|
Net sales: |
||||||||||||||||||
|
Aerospace |
$ |
102,341 | 56.6 |
% |
$ |
129,172 | 51.5 |
% |
$ |
(26,831) | (20.8) |
% |
||||||
|
Power generation |
21,671 | 12.0 | 33,532 | 13.4 | (11,861) | (35.4) | ||||||||||||
|
Oil and gas |
18,880 | 10.5 | 49,126 | 19.6 | (30,246) | (61.6) | ||||||||||||
|
Heavy equipment |
19,788 | 10.9 | 20,421 | 8.1 | (633) | (3.1) | ||||||||||||
|
General industrial, conversion services and other sales |
18,088 | 10.0 | 18,739 | 7.5 | (651) | (3.5) | ||||||||||||
|
Total net sales |
$ |
180,768 | 100.0 |
% |
$ |
250,990 | 100.1 |
% |
$ |
(70,222) | (28.0) |
% |
||||||
Net sales:
Net sales for the year ended December 31, 2013 decreased $70.2 million or 28.0%, as compared to the similar period in 2012. The decrease in our sales primarily reflected a 23.7% decrease in consolidated shipments in 2013 compared to the same period in 2012. Our product sales to all of our end markets decreased as noted in the above table. The reduction in our net sales was also the result of a lower priced product mix as well as lower overall selling prices in 2013. For the most part, our raw material costs decreased during 2013, which resulted in lower raw material surcharges in 2013 compared to 2012. These unfavorable variances were partially offset by a higher percentage of our premium alloy sales which increased from 4.3% of total net sales for the year ended December 31, 2012 to 5.9% in 2013. We believed that the decrease in our sales during 2013 was primarily a result of inventory adjustments being made by our customers as well as declining raw material prices and shorter lead times that helped encourage our customers to delay orders.
Gross margin:
Our gross margin, as a percentage of sales, was 7.7% and 16.4% for the years ended December 31, 2013 and 2012, respectively. Our gross margin decline in 2013 was primarily the result of the 28.0% decrease in net sales and an increase in our operating cost of sales and depreciation expense as compared to 2012. We flexed our production levels down as a result of the lower demand for our products; however in certain cases, we were unable to absorb all of our fixed costs. The decrease in our gross margin was also due to increased depreciation expense compared to 2012. As a percentage of sales, depreciation expense increased from 4.7% for 2012 to 7.8% in 2013. This increase was primarily a result of the significant amount of fixed assets that were placed in service during the years ended December 31, 2013 and 2012 at our North Jackson facility, coupled with the aforementioned reduction in production and sales levels.
15
Selling, general and administrative and expenses:
Our SG&A expenses for 2013 were largely consistent with those incurred in 2012. However, our SG&A expenses as a percentage of net sales increased to 9.9% for the year ended December 31, 2013 from 7.1% for 2012. This increase was primarily due to maintaining comparable SG&A expenses and headcount between periods despite the aforementioned 28.0% decrease in sales in order to achieve our strategic objectives of obtaining industry certifications for all of our plants and continuing to obtain customer approvals of our new products. Included within SG&A expenses are $392,000 and $381,000 of severance expense for 2013 and 2012, respectively.
Interest expense and deferred financing amortization:
Our interest costs on our debt increased to $2.6 million for the year ended December 31, 2013 compared to $2.3 million for the same period of 2012. This increase is primarily due to higher levels of debt incurred throughout the year due to an increase in working capital requirements compared to the same 2012 period. Our deferred financing costs are associated with the issuance and subsequent amendments to our credit facility. During the years ended December 31, 2013 and 2012, we recognized $444,000 and $308,000, respectively, of deferred financing amortization.
Other income:
In August 2011, we entered into an escrow agreement with the sellers of the North Jackson facility, pursuant to which $2.5 million of the purchase price of the North Jackson facility was placed in escrow until certain claims under the purchase agreement were resolved. During the year ended December 31, 2013, we entered into a settlement agreement with the sellers of the North Jackson facility, whereby we received $425,000 as a final settlement of certain claims under the escrow agreement. The settlement was recognized as a gain during the year ended December 31, 2013, which is included as a component of other income on the consolidated statement of operations.
Income tax (benefit) provision:
Our effective tax rate for the years ended December 31, 2013 and 2012 was (38.1)% and 30.2%, respectively. During 2013, we recorded a tax valuation allowance of $986,000 against certain New York State deferred tax assets, which negatively impacted our effective tax rate. Our 2013 effective tax rate benefited from approximately $1.0 million of research and development tax credits that we generated for 2012 and 2013. Our 2012 effective tax rate benefited from prior years’ research and development tax credits claimed on amended federal income tax returns and a change in state income tax apportionment.
Net (loss) income:
Our net (loss) income decreased to $(4.1) million, or $(0.58) per diluted share, for the year ended December 31, 2013 as compared to $14.6 million, or $2.02 per diluted share, for the year ended December 31, 2012 for the reasons stated above.
Liquidity and Capital Resources
Historically, we have financed our operating activities through cash provided by operations and cash provided through our credit facilities.
Net cash provided by operating activities:
During 2014, we generated net cash from operating activities of $12.9 million. Our net income adjusted for non-cash expenses generated approximately $26.5 million of cash in 2014, which were partially offset by increases in our managed working capital. Our managed working capital, defined as net accounts receivable plus net inventory minus accounts payable increased by $15.4 million to $105.1 million at December 31, 2014 compared to $89.8 million at December 31, 2013 primarily due to improved market conditions in most of our end markets. Our net accounts receivable balances increased $7.6 million primarily as a result of a 31.0% increase in net sales for the three-month period ended December 31, 2014 compared to the same period in 2013. Inventory levels increased by $18.5 million to $101.1 million as of December 31, 2014 from $82.6 million as of December 31, 2013 due to planned increases on certain product grades as a result of increased customer activity in 2014 and anticipated improved sales levels heading into 2015. Our accounts payable balance increased by $10.7 million from December 31, 2013 to December 31, 2014, due to increased operating activity, the timing of vendor payments and higher fourth quarter 2014 capital spending.
During 2013, we generated net cash from operating activities of $28.9 million. The decrease in our net inventory and net accounts receivable provided $11.9 million and $3.3 million of cash, respectively. The net increase in our accounts payable and other accruals provided an additional $2.6 million. In addition, during 2013, our net loss adjusted for non-cash expenses generated approximately $11.0 million of cash.
16
Net cash used in investing activity:
During 2014, our capital spending, which is primarily discretionary in nature, was $11.2 million, as compared to $11.8 million we incurred in 2013. During the first half of 2013, we incurred approximately $3.7 million of capital expenditures associated with completing the build out of our North Jackson facility. We believe that capital expenditures in 2015 will be similar to 2014 spending levels.
Net cash used in financing activities:
During 2014, we used $1.9 million in cash from our financing activities. Net cash used under our credit facility was approximately $2.9 million. Additionally, we received $1.0 million in receipts from the exercise of stock options and the issuance of stock under our Employee Stock Purchase Plan. Our borrowings increased to support higher inventory and operating levels.
During 2013, we used $17.1 million in cash from our financing activities. Of this amount, $16.9 million of our cash was utilized to reduce our bank debt. In addition, we received $1.1 million of cash from the exercise of stock options which was almost entirely offset by cash used to amend our credit facility in March and November 2013.
We believe that our cash flows from continuing operations as well as available borrowings under our credit facility are adequate to satisfy our working capital, capital expenditure requirements, and other contractual obligations for the foreseeable future, including at least the next 12 months.
The average costs per pound of nickel, chrome, molybdenum, and carbon scrap for the years ended December 31, 2014, 2013 and 2012 was as follows:
|
For the years ended December 31, |
2014 |
2013 |
2012 |
||||||
|
Nickel |
$ |
7.65 |
$ |
6.81 |
$ |
7.95 | |||
|
Chrome |
$ |
1.14 |
$ |
1.01 |
$ |
1.10 | |||
|
Molybdenum |
$ |
11.72 |
$ |
10.36 |
$ |
12.74 | |||
|
Carbon scrap |
$ |
0.18 |
$ |
0.17 |
$ |
0.18 | |||
|
Sources: Nickel is the daily average LME Cash Settlement Price; Chrome and Molybdenum is the final monthly average as published by Ryan’s Notes; Carbon is the consumer price for #1 Industrial Bundles in the Pittsburgh, PA area as reported in American Metal Market. |
|||||||||
We maintain sales price surcharge mechanisms on certain of our products, priced at time of order or shipment, to mitigate the risk of substantial raw material cost fluctuations. Over the last three months of 2014, the average cost of nickel, which has a major impact on surcharges, has dropped to $7.16 and that trend has continued into the start of 2015. This factor may have a negative impact on our gross margin as we move into 2015 to the extent that we will be selling higher cost material that was melted in the latter half of 2014 to our customers while receiving lower surcharges in the first part of 2015. This should stabilize in 2015 as we purchase lower cost material for our manufacturing process and surcharges become more aligned with costs. The market values for these raw materials and others continue to fluctuate based on supply and demand, market disruptions and other factors.
Capital Resources Including Off-Balance Sheet Arrangements. We do not maintain off-balance sheet arrangements, nor do we participate in non-exchange traded contracts requiring fair value accounting treatment, or material related-party transaction arrangements.
Credit Facility
We have a Credit Agreement (as amended to date the “Credit Agreement”) with a syndication of banks which provides for a $105.0 million senior secured revolving credit facility (the “Revolver”) and a $20.0 million senior secured term loan facility (the “Term Loan” and together with the Revolver, the “Facilities”) that expire in March 2017. Under the Credit Agreement, our loan availability under the Revolver (“Borrowing Base”) is calculated monthly based upon our accounts receivable and inventory balances. The Facilities are collateralized by substantially all of the assets of the Company and its subsidiaries, except that no real property other than the North Jackson facility is collateral under the Facilities. Universal Stainless & Alloy Products, Inc., Dunkirk Specialty Steel, LLC and North Jackson Specialty Steel, LLC are co-borrowers under the Facilities.
At any time prior to August 18, 2015, we may make up to two requests to increase the maximum aggregate principal amount of borrowings under the Revolver by at least $10.0 million, with the maximum aggregate principal amount of borrowings under the Revolver not to exceed $130.0 million. We are required to pay a commitment fee of 0.25% based on the daily unused portion of the Revolver. The Revolver also provides for up to $7.0 million of swing loans so long as the sum of the outstanding swing loans and the outstanding borrowings under the Revolver do not exceed our Borrowing Base. The Term Loan is payable in quarterly installments in the principal amount of $750,000 which began on July 1, 2013, with the balance of the Term Loan payable in full on March 19, 2017.
17
Amounts outstanding under the Facilities, at our option, will bear interest at either a base rate or a LIBOR-based rate (the “LIBOR Option”), in either case calculated in accordance with the terms of the Credit Agreement. We elected to use the LIBOR Option during the year ended December 31, 2014, which was 2.17% at December 31, 2014. Interest on the Facilities is payable monthly.
We are required to maintain a leverage ratio not exceeding a ratio decreasing from 3.75 to 1.00 for the period December 31, 2014 to March 31, 2015, 3.50 to 1.00 for the period June 30, 2015 to September 30, 2015, 3.25 to 1.00 at December 31, 2015 and 3.00 to 1.00 from March 31, 2016 through maturity. We are required to maintain a fixed charge coverage of 1.1 to 1.0 from the fourth quarter of 2014 to maturity. We were in compliance with all our covenants at December 31, 2014 and December 31, 2013.
Convertible Notes
In connection with the acquisition of the North Jackson facility, in August 2011, we issued $20.0 million in convertible notes (the “Notes”) to the sellers of the North Jackson facility as partial consideration of the acquisition. The Notes are subordinated obligations and rank junior to the Facilities. The Notes bear interest at a fixed rate of 4.0% per annum, payable in cash semi-annually in arrears on each June 18 and December 18, beginning on December 18, 2011. Unless earlier converted, the Notes mature and the unpaid principal balance is due on August 17, 2017. The Notes and any accrued and unpaid interest are convertible into shares of our common stock at the option of the holder at an initial conversion price of $47.1675 per share of common stock. The conversion price associated with the Notes may be adjusted in certain circumstances. We may prepay any outstanding Notes, in whole or in part, during a fiscal quarter if our share price is greater than 140% of the current conversion price for at least 20 of the trading days in the 30 consecutive trading day period ending on the last trading day of the immediately preceding quarter.
Share-Based Activity. We issued 60,880, 66,145 and 116,628 shares of our common stock during the years ended December 31, 2014, 2013 and 2012, respectively, through our two share-based compensation plans. In 2014, 49,500 stock options issued under the Omnibus Incentive Plan (“OIP”) were exercised for an aggregate of $764,000. In 2013, 55,625 stock options issued under the OIP were exercised for an aggregate of $848,000. In 2012, 72,050 stock options issued under the OIP were exercised for an aggregate of $1.3 million. Additionally, in 2012, we issued 35,000 shares of restricted common stock. During 2013, 3,000 shares of restricted common stock were forfeited. The remaining shares were issued to participants in the Employee Stock Purchase Plan.
At December 31, 2014, our unrecognized share-based compensation expense related to non-vested stock option and time-based restricted common stock awards totaled $3.9 million and $412,000, respectively, which is expected to be recognized over a weighted average period of 3.0 years and 1.0 year, respectively.
In October 1998, we initiated a stock repurchase program to repurchase up to 315,000 shares of our outstanding common stock in open market transactions at market prices. We have not repurchased any shares under the program since 2001. We are authorized to repurchase 45,100 remaining shares of common stock under this program as of December 31, 2014.
Contractual Obligations. At December 31, 2014, we had the following contractual principal, interest and purchase obligations:
|
Payments due by period |
|||||||||
|
Less than |
1-3 |
||||||||
|
(dollars in thousands) |
Total |
1 year |
years |
||||||
|
Long-term debt (A) |
$ |
92,007 |
$ |
5,211 |
$ |
86,796 | |||
|
Purchase obligations - other (B) |
5,490 | 5,490 |
- |
||||||
|
Purchase obligations - capital expenditures (B) |
2,090 | 2,090 |
- |
||||||
|
Total contractual obligations |
$ |
99,587 |
$ |
12,791 |
$ |
86,796 | |||
|
(A) |
Amounts include interest expense, which was estimated based upon the December 31, 2014 interest rate for our debt and assumes that debt will not be repaid until its maturity. |
(B)Purchase obligations include the value of all open purchase orders with established quantities and purchase prices as well as minimum purchase commitments.
CONTINGENT ITEMS
Product Claims. We are subject to various claims and legal actions that arise in the normal course of conducting business. There were no material product claims outstanding at December 31, 2014.
Environmental Matters. We, as well as other steel companies, are subject to demanding environmental standards imposed by federal, state and local environmental laws and regulations. We are not aware of any environmental condition that currently exists at any of our facilities that are probable or reasonably possible of having a material impact on our results of operations or liquidity.
18
We are aware of energy usage concerns relating to climate change; however, we are not aware of any pending regulations that are expected to have a material impact on our results of operations or liquidity.
Legal Matters. From time to time, various lawsuits and claims have been or may be asserted against us relating to the conduct of our business, including routine litigation relating to commercial and employment matters. The ultimate cost and outcome of any litigation or claim cannot be predicted with certainty. Management believes, based on information presently available, that the likelihood that the ultimate outcome of any such pending matter will have a material adverse effect on its financial condition, or liquidity or a material impact to its results of operations is remote, although the resolution of one or more of these matters may have a material adverse effect on its results of operations for the period in which the resolution occurs.
CRITICAL ACCOUNTING POLICIES AND NEW ACCOUNTING PRONOUNCEMENTS
Critical Accounting Policies
Revenue from the sale of products is recognized when both risk of loss and title have transferred to the customer, which in most cases coincides with shipment of the related products, and collection is reasonably assured. We manufacture specialty steel products to customer purchase order specifications and in recognition of requirements for product acceptance. Material certification forms are executed, indicating compliance with the customer purchase orders, before the specialty steel products are packed and shipped to the customer.
Revenue from conversion services is recognized when the performance of the service is complete. Invoiced shipping and handling costs are also accounted for as revenue. Customer claims, which are not material, are accounted for primarily as a reduction to gross sales after the matter has been researched and an acceptable resolution has been reached.
In addition, management constantly monitors the ability to collect its unpaid sales invoices and the valuation of its receivables. The allowance for doubtful accounts includes specific reserves for the value of outstanding invoices issued to customers that are deemed potentially not collectible.
Inventories are stated at the lower of cost or market. The cost of inventory is principally determined by the weighted average cost method for material and operation costs. An inventory reserve is provided for material on hand for which management believes cost exceeds net realizable value. We reserve for slow-moving inventory and inventory that is being evaluated under our quality control process. The reserves are based upon management’s expected method of disposition.
Long-lived assets, including property, plant and equipment and identifiable intangible assets are evaluated for impairment whenever events or changes in circumstances indicate that the carrying amount of an asset may not be recoverable in relation to the operating performance and future undiscounted cash flows of the underlying assets. Adjustments are made if the sum of expected future cash flows is less than book value. No impairment reserve was deemed necessary as of December 31, 2014, 2013 and 2012.
Deferred income taxes are provided for temporary differences between amounts of assets and liabilities for financial reporting purposes and the basis of such assets and liabilities as measured by tax laws and regulations. Our deferred tax assets include net operating loss carry forwards that can be used to offset taxable income in future periods and reduce income taxes payable in those future periods. These deferred tax assets will expire, if unused, at various times through 2031. Deferred tax liabilities primarily relate to book / tax depreciation differences. Management assesses the need to record a valuation allowance to reduce deferred tax assets to the amount that is more likely than not to be realized.
Identifiable intangible assets are recorded at fair value and are amortized over their useful lives using the straight-line method.
Goodwill, which represents the excess of cost over net tangible and identifiable intangible assets of acquired businesses, is stated at fair value at the date of acquisition. Goodwill is not amortized, but is tested or evaluated in accordance with Accounting Standards Update 2011-08, “Intangibles – Goodwill and Other (Topic 350): Testing Goodwill for Impairment,” annually for impairment or more frequently if any event indicates that the carrying amount of goodwill may be impaired. We perform our annual goodwill impairment test or evaluation as of the beginning of the fourth quarter.
We evaluate goodwill for impairment by either performing a qualitative evaluation or a two-step quantitative test, which involves comparing the estimated fair value of the associated reporting unit to its carrying value. The qualitative evaluation is an assessment of factors to determine whether it is more likely than not that fair value is less than its carrying amount. Factors considered as part of the qualitative assessment include entity-specific, industry, market and general economic conditions. We may elect to bypass this qualitative assessment and perform a two-step quantitative test. We test for goodwill impairment using a combination of valuation techniques, which include consideration of a market-based approach (guideline company method) and an income approach (discounted cash flow method), in determining fair value in the annual impairment test of goodwill. We believe that the combination of the valuation models provides a more appropriate valuation by taking into account different marketplace participant assumptions. Both methods utilize market data in the derivation of a value estimate and are forward-looking in nature. The guideline assessment of future performance and the discounted cash flow method utilize a market-derived rate of return to discount anticipated performance.
19
We did not have any impairment charges for the years ended December 2014, 2013 and 2012. As of the most recent annual impairment test, the fair value of our goodwill exceeded the carrying value by approximately 12%.
Other events and changes in circumstances may also require goodwill to be tested for impairment between annual measurement dates. While a decline in stock price and market capitalization is not specifically cited as a goodwill impairment indicator, a company’s stock price and market capitalization should be considered in determining whether it is more likely than not that the fair value of a reporting unit is less that its carrying value. Additionally, a significant decline in a company’s stock price may suggest that an adverse change in the business climate may have caused the fair value of the reporting unit to fall below its carrying value. The financial and credit market volatility directly impacts our fair value measurement through our stock price that we use to determine our market capitalization. During times of volatility, significant judgment must be applied to determine whether credit or stock price changes are a short-term swing or a longer-term trend. A sustained decline in our market capitalization below its book value could lead us to determine, in a future period, that an interim goodwill impairment review is required and may result in an impairment charge which would have a negative impact on our results of operations.
The calculation for our share-based compensation expense involves a number of assumptions. Management believes each assumption used in the valuation is reasonable because it takes into account the experience of the plan and reasonable expectations. Management estimates volatility and forfeitures based on historical data, future expectations and the expected term of the share-based compensation awards. The assumptions, however, involve inherent uncertainties. As a result, if other assumptions had been used, share-based compensation expense could have varied.
New Accounting Pronouncements
See information under the heading “Note 1: Significant Accounting Policies” within “Notes to Consolidated Financial Statements” in Item 8, Financial Statements and Supplementary Data, in this Annual Report on Form 10-K for details of recently issued accounting pronouncements and their expected impact on our financial statements.
ITEM 7A. QUANTITATIVE AND QUALITATIVE DISCLOSURES ABOUT MARKET RISK
The majority of our customers and suppliers absorb fluctuations in foreign currency exchange rates. Prices for our raw materials and natural gas requirements are subject to frequent market fluctuations, and profit margins may decline in the event market prices increase. Selling price increases and surcharges are utilized to offset raw material and natural gas market price increases.
Raw material prices vary based on numerous factors, including quality, and are subject to frequent market fluctuations. Future raw material prices cannot be predicted with any degree of certainty. We do not maintain any long-term agreements with any of our raw material suppliers.
We maintain a sales price surcharge mechanism on certain of our products to help offset the impact of raw material price fluctuations. For certain products, the surcharge is calculated at the time of order entry, based on current raw material prices or prices at the time of shipment. For certain finished products, the surcharge is calculated based on the monthly average raw material prices two months prior to the promised ship date. While the material surcharge mechanism is designed to offset modest fluctuations in raw material prices, it cannot immediately absorb significant spikes in raw material prices. A material change in raw material prices within a short period of time could have a material effect on our financial results and there can be no assurance that the raw material surcharge mechanism will completely offset immediate changes in our raw material costs.
At December 31, 2014, we had $66.9 million of floating rate debt outstanding with an interest rate of 2.17%. Since the interest rate on floating rate debt changes with the short-term market rate of interest, we are exposed to the risk that these interest rates may increase, raising our interest expense. A hypothetical 1.0% increase or decrease in our floating rate debt interest rates would unfavorably or favorably impact our pre-tax results by $669,000.
20
ITEM 8. FINANCIAL STATEMENTS AND SUPPLEMENTARY DATA
|
Index to Financial Statements |
|
|
Page |
|
|
Management’s Report on Internal Control over Financial Reporting |
21 |
|
22 |
|
|
Financial Statements |
|
|
Consolidated Statements of Operations for the years ended December 31, 2014, 2013 and 2012 |
23 |
|
24 |
|
|
Consolidated Statements of Cash Flows for the years ended December 31, 2014, 2013 and 2012 |
25 |
|
Consolidated Statements of Shareholders' Equity for the years ended December 31, 2014, 2013 and 2012 |
26 |
|
27 |
|
|
Consolidated Financial Statement Schedules |
|
|
40 |
MANAGEMENT’S REPORT ON INTERNAL CONTROL OVER FINANCIAL REPORTING
Management is responsible for establishing and maintaining adequate internal control over financial reporting (as defined in Rules 13a-15(f) under the Securities Exchange Act of 1934). Our internal control over financial reporting is designed to provide reasonable assurance to management and the board of directors regarding the preparation and fair presentation of published financial statements. Because of its inherent limitations, internal control over financial reporting may not prevent or detect misstatements. Therefore, even those systems determined to be effective can provide only reasonable assurance with respect to financial statement preparation and presentation. Based on our assessment, we believe that, as of December 31, 2014, our internal control over financial reporting is effective.
The effectiveness of internal control over financial reporting as of December 31, 2014 has been audited by Schneider Downs & Co. Inc., an independent registered public accounting firm which also audited our consolidated financial statements. Schneider Downs’ attestation report on the consolidated financial statements and management’s maintenance of effective internal control over financial reporting is included under the heading “Report of Independent Registered Public Accounting Firm.”
|
|
|
|
|
/s/ Dennis M. Oates
|
|
/s/ Michael D. Bornak
|
|
Dennis M. Oates |
|
Michael D. Bornak |
|
Chairman, President and Chief Executive Officer |
|
Vice President of Finance, Chief Financial Officer and Treasurer |
21
REPORT OF INDEPENDENT REGISTERED PUBLIC ACCOUNTING FIRM
To the Board of Directors and Stockholders of Universal Stainless & Alloy Products, Inc.
We have audited the accompanying consolidated balance sheets of Universal Stainless & Alloy Products, Inc. and subsidiaries (the Company) as of December 31, 2014 and 2013, and the related consolidated statements of operations, cash flows, and shareholders’ equity for each of the years in the three-year period ended December 31, 2014. In addition, our audit included the consolidated financial statement schedule listed in the index at Item 15 (2) (Schedule II). We also have audited the Company’s internal control over financial reporting as of December 31, 2014, based on criteria established in Internal Control - Integrated Framework (2013) issued by the Committee of Sponsoring Organizations of the Treadway Commission (COSO). The Company’s management is responsible for these consolidated financial statements and financial statement schedule, for maintaining effective internal control over financial reporting, and for its assessment of the effectiveness of internal control over financial reporting, included in the accompanying Management’s Report on Internal Control Over Financial Reporting. Our responsibility is to express an opinion on these consolidated financial statements, the consolidated financial statement Schedule II, and an opinion on the Company’s internal control over financial reporting based on our audits.
We conducted our audits in accordance with the standards of the Public Company Accounting Oversight Board (United States). Those standards require that we plan and perform the audits to obtain reasonable assurance about whether the consolidated financial statements are free of material misstatement and whether effective internal control over financial reporting was maintained in all material respects. Our audits of the consolidated financial statements included examining, on a test basis, evidence supporting the amounts and disclosures in the consolidated financial statements, assessing the accounting principles used and significant estimates made by management, and evaluating the overall financial statement presentation. Our audit of internal control over financial reporting included obtaining an understanding of internal control over financial reporting, assessing the risk that a material weakness exists, and testing and evaluating the design and operating effectiveness of internal control based on the assessed risk. Our audits also included performing such other procedures as we considered necessary in the circumstances. We believe that our audits provide a reasonable basis for our opinions.
A company’s internal control over financial reporting is a process designed to provide reasonable assurance regarding the reliability of financial reporting and the preparation of financial statements for external purposes in accordance with generally accepted accounting principles. A company’s internal control over financial reporting includes those policies and procedures that (1) pertain to the maintenance of records that, in reasonable detail, accurately and fairly reflect the transactions and dispositions of the assets of the company; (2) provide reasonable assurance that transactions are recorded as necessary to permit preparation of financial statements in accordance with generally accepted accounting principles, and that receipts and expenditures of the company are being made only in accordance with authorizations of management and directors of the company; and (3) provide reasonable assurance regarding prevention or timely detection of unauthorized acquisition, use, or disposition of the company’s assets that could have a material effect on the financial statements.
Because of its inherent limitations, internal control over financial reporting may not prevent or detect misstatements. Also, projections of any evaluation of effectiveness to future periods are subject to the risk that controls may become inadequate because of changes in conditions, or that the degree of compliance with the policies or procedures may deteriorate.
In our opinion, the consolidated financial statements referred to above present fairly, in all material respects, the financial position of the Company as of December 31, 2014 and 2013, and the results of their operations and their cash flows for each of the years in the three-year period ended December 31, 2014, in conformity with accounting principles generally accepted in the United States of America. Also, in our opinion, the related consolidated financial statement schedule, when considered in relation to the consolidated financial statements as a whole, presents fairly in all material respects, the information set forth therein. Also, in our opinion, the Company maintained, in all material respects, effective internal control over financial reporting as of December 31, 2014, based on criteria established in Internal Control - Integrated Framework (2013) issued by the Committee of Sponsoring Organizations of the Treadway Commission (COSO).
|
/s/ Schneider Downs & Co., Inc. |
||
|
Schneider Downs & Co., Inc. |
||
|
Pittsburgh, Pennsylvania |
||
|
February 24, 2015 |
22
UNIVERSAL STAINLESS & ALLOY PRODUCTS, INC.
CONSOLIDATED STATEMENTS OF OPERATIONS
|
For the years ended December 31, |
2014 |
2013 |
2012 |
||||||
|
(dollars in thousands, except per share information) |
|||||||||
|
Net sales |
$ |
205,560 |
$ |
180,768 |
$ |
250,990 | |||
|
Cost of products sold |
173,538 | 166,888 | 209,841 | ||||||
|
Gross margin |
32,022 | 13,880 | 41,149 | ||||||
|
Selling, general and administrative expenses |
21,122 | 17,885 | 17,746 | ||||||
|
Operating income (loss) |
10,900 | (4,005) | 23,403 | ||||||
|
Interest expense and other financing costs |
(3,679) | (3,042) | (2,592) | ||||||
|
Other (expense) income |
(22) | 481 | 140 | ||||||
|
Income (loss) before income taxes |
7,199 | (6,566) | 20,951 | ||||||
|
Provision (benefit) for income taxes |
3,149 | (2,504) | 6,334 | ||||||
|
Net income (loss) |
$ |
4,050 |
$ |
(4,062) |
$ |
14,617 | |||
|
Net income (loss) per common share - Basic |
$ |
0.58 |
$ |
(0.58) |
$ |
2.13 | |||
|
Net income (loss) per common share - Diluted |
$ |
0.57 |
$ |
(0.58) |
$ |
2.02 | |||
|
Weighted average shares of common stock outstanding: |
|||||||||
|
Basic |
7,031,539 | 6,950,976 | 6,874,669 | ||||||
|
Diluted |
7,116,431 | 6,950,976 | 7,454,030 | ||||||
The accompanying notes are an integral part of these consolidated financial statements.
23
UNIVERSAL STAINLESS & ALLOY PRODUCTS, INC.
|
December 31, |
2014 |
2013 |
||||
|
(dollars in thousands) |
||||||
|
ASSETS |
||||||
|
Current assets: |
||||||
|
Cash |
$ |
142 |
$ |
307 | ||
|
Accounts receivable (less allowance for doubtful accounts of $17 and $84, respectively) |
29,057 | 21,447 | ||||
|
Inventory, net |
101,070 | 82,593 | ||||
|
Deferred income taxes |
9,683 | 13,042 | ||||
|
Other current assets |
2,681 | 3,906 | ||||
|
Total current assets |
142,633 | 121,295 | ||||
|
Property, plant and equipment, net |
199,795 | 203,590 | ||||
|
Goodwill |
20,268 | 20,268 | ||||
|
Other long-term assets |
1,861 | 2,771 | ||||
|
Total assets |
$ |
364,557 |
$ |
347,924 | ||
|
LIABILITIES AND STOCKHOLDERS’ EQUITY |
||||||
|
Current liabilities: |
||||||
|
Accounts payable |
$ |
25,009 |
$ |
14,288 | ||
|
Accrued employment costs |
6,011 | 3,430 | ||||
|
Current portion of long-term debt |
3,000 | 3,000 | ||||
|
Other current liabilities |
861 | 1,023 | ||||
|
Total current liabilities |
34,881 | 21,741 | ||||
|
Long-term debt |
83,875 | 86,796 | ||||
|
Deferred income taxes |
42,108 | 42,532 | ||||
|
Other long-term liabilities |
63 | 397 | ||||
|
Total liabilities |
160,927 | 151,466 | ||||
|
Commitments and contingencies (Note 10) |
||||||
|
Stockholders’ equity: |
||||||
|
Senior preferred stock, par value $0.001 per share; 1,980,000 shares authorized; 0 shares issued and outstanding |
- |
- |
||||
|
Common stock, par value $0.001 per share; 20,000,000 shares authorized, respectively; 7,371,018 and 7,310,138 shares issued, respectively |
7 | 7 | ||||
|
Additional paid-in capital |
52,810 | 49,688 | ||||
|
Retained earnings |
153,103 | 149,053 | ||||
|
Treasury stock, at cost; 292,855 common shares held, respectively |
(2,290) | (2,290) | ||||
|
Total stockholders’ equity |
203,630 | 196,458 | ||||
|
Total liabilities and stockholders’ equity |
$ |
364,557 |
$ |
347,924 | ||
The accompanying notes are an integral part of these consolidated financial statements.
24
UNIVERSAL STAINLESS & ALLOY PRODUCTS, INC.
CONSOLIDATED STATEMENTS OF CASH FLOWS
|
For the years ended December 31, |
2014 |
2013 |
2012 |
||||||
|
(dollars in thousands) |
|||||||||
|
Operating Activities: |
|||||||||
|
Net income (loss) |
$ |
4,050 |
$ |
(4,062) |
$ |
14,617 | |||
|
Adjustments to reconcile net income (loss) to net cash provided by operating activities: |
|||||||||
|
Depreciation and amortization |
17,476 | 16,280 | 14,368 | ||||||
|
Gain on sale of property, plant and equipment |
- |
- |
(12) | ||||||
|
Deferred income tax |
2,935 | (2,998) | 12,635 | ||||||
|
Share-based compensation expense, net |
2,082 | 1,827 | 1,649 | ||||||
|
Changes in assets and liabilities: |
|||||||||
|
Accounts receivable, net |
(7,610) | 3,334 | 10,267 | ||||||
|
Inventory, net |
(20,075) | 11,934 | (12,402) | ||||||
|
Accounts payable |
10,721 | 3,678 | (19,302) | ||||||
|
Accrued employment costs |
2,581 | (1,241) | (2,876) | ||||||
|
Income taxes |
514 | 494 | 3,208 | ||||||
|
Other, net |
215 | (340) | (180) | ||||||
|
Net cash provided by operating activities |
12,889 | 28,906 | 21,972 | ||||||
|
Investing Activity: |
|||||||||
|
Capital expenditures |
(11,173) | (11,789) | (35,057) | ||||||
|
Proceeds from sale of property, plant and equipment |
- |
- |
14 | ||||||
|
Net cash used in investing activity |
(11,173) | (11,789) | (35,043) | ||||||
|
Financing Activities: |
|||||||||
|
Borrowings under revolving credit facility |
103,785 | 76,784 | 119,092 | ||||||
|
Payments on revolving credit facility |
(103,706) | (92,230) | (87,000) | ||||||
|
Payments on term loan facility |
(3,000) | (1,500) | (20,000) | ||||||
|
Proceeds from the issuance of common stock |
1,040 | 1,117 | 1,608 | ||||||
|
Payment of deferred financing costs |
- |
(1,165) | (348) | ||||||
|
Purchase of treasury stock |
- |
(137) | (234) | ||||||
|
Net cash (used in) provided by financing activities |
(1,881) | (17,131) | 13,118 | ||||||
|
Net (decrease) increase in cash |
(165) | (14) | 47 | ||||||
|
Cash at beginning of period |
307 | 321 | 274 | ||||||
|
Cash at end of period |
$ |
142 |
$ |
307 |
$ |
321 | |||
|
Supplemental Disclosure of Cash Flow Information: |
|||||||||
|
Interest paid, net of amount capitalized |
$ |
3,046 |
$ |
2,534 |
$ |
2,340 | |||
|
Income taxes refunded, net |
$ |
(318) |
$ |
- |
$ |
(9,805) | |||
The accompanying notes are an integral part of these consolidated financial statements.
25
UNIVERSAL STAINLESS & ALLOY PRODUCTS, INC.
CONSOLIDATED STATEMENTS OF SHAREHOLDERS’ EQUITY
|
Common |
Additional |
||||||||||||||
|
shares |
Common |
paid-in |
Retained |
Treasury |
Treasury |
||||||||||
|
outstanding |
stock |
capital |
earnings |
shares |
stock |
||||||||||
|
(dollars in thousands) |
|||||||||||||||
|
Balance at January 1, 2012 |
6,847,515 |
$ |
7 |
$ |
43,487 |
$ |
138,498 | 282,850 |
$ |
(1,919) | |||||
|
Common stock issuance under |
|||||||||||||||
|
Employee Stock Purchase Plan |
9,578 |
- |
307 |
- |
- |
- |
|||||||||
|
Exercise of stock options |
72,050 |
- |
1,301 |
- |
- |
- |
|||||||||
|
Issuance of restricted common stock |
35,000 |
- |
34 |
- |
- |
- |
|||||||||
|
Share-based compensation |
- |
- |
1,615 |
- |
- |
- |
|||||||||
|
Purchase of treasury stock |
(5,831) |
- |
- |
- |
5,831 | (234) | |||||||||
|
Net income |
- |
- |
- |
14,617 |
- |
- |
|||||||||
|
Balance at December 31, 2012 |
6,958,312 | 7 | 46,744 | 153,115 | 288,681 | (2,153) | |||||||||
|
Common stock issuance under |
|||||||||||||||
|
Employee Stock Purchase Plan |
10,520 |
- |
269 |
- |
- |
- |
|||||||||
|
Exercise of stock options |
55,625 |
- |
848 |
- |
- |
- |
|||||||||
|
Forfeiture of restricted common stock |
(3,000) |
- |
- |
- |
- |
- |
|||||||||
|
Share-based compensation |
- |
- |
1,827 |
- |
- |
- |
|||||||||
|
Purchase of treasury stock |
(4,174) |
- |
- |
4,174 | (137) | ||||||||||
|
Net loss |
- |
- |
- |
(4,062) |
- |
- |
|||||||||
|
Balance at December 31, 2013 |
7,017,283 | 7 | 49,688 | 149,053 | 292,855 | (2,290) | |||||||||
|
Common stock issuance under |
|||||||||||||||
|
Employee Stock Purchase Plan |
11,380 |
- |
276 |
- |
- |
- |
|||||||||
|
Exercise of stock options |
49,500 |
- |
764 |
- |
- |
- |
|||||||||
|
Share-based compensation |
- |
- |
2,082 |
- |
- |
- |
|||||||||
|
Net income |
- |
- |
- |
4,050 |
- |
- |
|||||||||
|
Balance at December 31, 2014 |
7,078,163 |
$ |
7 |
$ |
52,810 |
$ |
153,103 | 292,855 |
$ |
(2,290) | |||||
The accompanying notes are an integral part of these consolidated financial statements.
26
UNIVERSAL STAINLESS & ALLOY PRODUCTS, INC.
NOTES TO CONSOLIDATED FINANCIAL STATEMENTS
Note 1: Significant Accounting Policies
Basis of Consolidation. The consolidated financial statements include the accounts of Universal Stainless & Alloy Products, Inc. and its wholly-owned subsidiaries (collectively, “we,” “us,” “our,” or the “Company”). All intercompany accounts and transactions have been eliminated in consolidation. We have no interests in any unconsolidated entity.
Use of Estimates. The preparation of financial statements in conformity with U.S. Generally Accepted Accounting Principles (“GAAP”) requires management to make estimates and assumptions that affect the amounts reported in the consolidated financial statements. The estimates and assumptions used in these consolidated financial statements are based on known information available as of the balance sheet date. Actual results could differ from those estimates.
Concentration of Credit Risk. We limit our credit risk on accounts receivable by performing ongoing credit evaluations and, when deemed necessary, require letters of credit, guarantees or cash collateral. During 2014, we had one customer which accounted for more than 18% of our total net sales and for 11% of our total accounts receivable balance. During 2013, we had two customers which each accounted for more than 10%, and collectively accounted for 26%, respectively, of our total net sales. During 2012, we had three customers which each accounted for more than 10%, and collectively accounted for 37%, respectively, of our total net sales.
Accounts Receivable and Allowance for Doubtful Accounts. Accounts receivable are presented net of the allowance for doubtful accounts on our consolidated balance sheets. We market our products to a diverse customer base, primarily throughout the United States. During the years ended December 31, 2014, 2013 and 2012, we derived 7%, 6% and 6%, respectively, of our net sales from markets outside of the United States. The allowance for doubtful accounts includes specific reserves for the value of outstanding invoices issued to customers that are deemed potentially not collectible. Receivables are charged-off to the allowance when they are deemed to be uncollectible. Bad debt expense, net of recoveries for the years ended December 31, 2014, 2013 and 2012 was $18,000, $30,000 and $4,000, respectively.
Inventories. Inventories are stated at the lower of cost or market with cost principally determined by the weighted average cost method. Such costs include the acquisition cost for raw materials and supplies, direct labor and applied manufacturing overhead within the guidelines of normal plant capacity. We reserve for slow-moving inventory and inventory that is being evaluated under our quality control process. The reserves are based upon management’s expected method of disposition. The net change in inventory reserves for the year ended December 31, 2014 was a $603,000 decrease, primarily due to the disposition of slow moving material that was no longer considered sellable and was returned to our melt shop. Prior to this disposition, the inventory was fully reserved for at December 31, 2013. The net change in inventory reserves for the years ended December 31, 2013 and 2012 was a $617,000 and a $300,000 increase, respectively.
Included in inventory are operating materials consisting of forge dies and production molds and rolls, that are consumed over their useful lives. During the years ended December 31, 2014, 2013 and 2012, we amortized these operating materials in the amount of $1.6 million, $1.2 million and $1.7 million, respectively. This expense is recorded as a component of cost of products sold on the consolidated statements of operations and included as a part of our total depreciation and amortization on the consolidated statements of cash flows.
Property, Plant and Equipment. Property, plant and equipment is recorded at cost or its fair value at acquisition date. Costs incurred in connection with the construction or major rebuild of facilities are capitalized as construction in progress. During the years ended December 31, 2013 and 2012, we capitalized $263,000 and $476,000, respectively, of interest expense related to construction projects in progress. We did not capitalize interest during the year ended December 31, 2014. No depreciation is recognized on assets until they are placed in service. Assets which have been retired or disposed of are removed from cost and accumulated depreciation accounts, with the gain or loss reflected in operating income on the consolidated statements of operations. Major equipment maintenance costs are capitalized as incurred and included in other current assets. These costs are amortized to cost of products sold within a twelve-month period. Other maintenance costs are expensed as incurred. Costs of improvements and renewals are capitalized. Our maintenance expense for the years ended December 31, 2014, 2013 and 2012 was $17.8 million, $13.8 million and $17.7 million, respectively, which is included as a component of cost of products sold.
Depreciation is computed using the straight-line method based on the estimated useful lives of the related assets. The estimated useful lives of buildings and land improvements are between 10 and 39 years, and the estimated useful lives of machinery and equipment are between 5 and 20 years. Our total depreciation expense for the years ended December 31, 2014, 2013 and 2012 was $15.0 million, $14.3 million and $12.1 million, respectively, of which $14.6 million, $14.1 million and $11.8 million, respectively was included as a component of cost of products sold while the remainder was included in selling, general and administrative expense.
27
Intangible Assets. We have a $1.3 million non-compete agreement related to the acquisition of the North Jackson facility which is classified as an intangible asset. Identifiable intangible assets are recorded at fair value upon acquisition and are amortized over the life of the agreement using the straight-line method. We recognized $266,000 of amortization expense during the years ended December 31, 2014, 2013 and 2012, respectively, from intangible assets, which is included as a component of selling, general and administrative expenses on the consolidated statements of operations and included as part of total depreciation and amortization on the consolidated statements of cash flows. At December 31, 2014 and 2013, we had $898,000 and $632,000 of accumulated amortization, respectively. Amortization expense for intangible assets is estimated to be $266,000 for 2015 and $166,000 for 2016.
Long-Lived Asset Impairment. Long-lived assets, including property, plant and equipment and intangible assets are evaluated for impairment whenever events or changes in circumstances indicate that the carrying amount of an asset may not be recoverable in relation to the operating performance and future undiscounted cash flows of the underlying assets. Adjustments are made if the sum of expected future cash flows is less than the book value. Based on management’s assessment of the carrying values of long-lived assets, no impairment reserve was deemed necessary as of December 31, 2014, 2013 and 2012.
Deferred Financing Costs. Deferred financing costs are amortized up to the maturity date of the related financial instrument using the straight-line method, which approximates the effective interest method. Deferred financing cost amortization for the years ended December 31, 2014, 2013 and 2012 was $644,000, $444,000 and $308,000, respectively, and is included as a component of interest expense and other financing costs on the consolidated statements of operations and included as part of total depreciation and amortization on the consolidated statements of cash flows. At December 31, 2014 and 2013, we had $1.4 million and $2.0 million, respectively, of unamortized deferred financing costs included on our consolidated balance sheets as a component of other long-term assets.
Goodwill. Goodwill, which represents the excess of cost over net tangible and identifiable intangible assets of acquired businesses, is stated at fair value. Goodwill is not amortized, but will be evaluated or tested annually for impairment or more frequently if any event indicates that the carrying amount of goodwill may be impaired.
We perform our annual evaluation or test of goodwill as of the beginning of the fourth quarter. We evaluate or test goodwill for impairment by either performing a qualitative evaluation or a two-step quantitative test, which involves comparing the estimated fair value of the associated reporting unit to its carrying value. The qualitative evaluation is an assessment of factors to determine whether it is more likely than not that fair value is less than its carrying amount. Factors considered as part of the qualitative assessment include entity-specific, industry, market and general economic conditions. We may elect to bypass this qualitative assessment and perform a two-step quantitative test. We test for goodwill impairment using a combination of valuation techniques, which include consideration of a market-based approach (guideline company method) and an income approach (discounted cash flow method), in determining fair value in the annual impairment test of goodwill. We believe that the combination of the valuation models provides a more appropriate valuation by taking into account different marketplace participant assumptions. Both methods utilize market data in the derivation of a value estimate and are forward-looking in nature. The guideline assessment of future performance and the discounted cash flow method utilize a market-derived rate of return to discount anticipated performance. We did not have any impairment charges for the years ended December 2014, 2013 and 2012. As of the most recent annual impairment test, the fair value of our goodwill exceeded the carrying value by approximately 12%.
Other events and changes in circumstances may also require goodwill to be tested for impairment between annual measurement dates. While a decline in stock price and market capitalization is not specifically cited as a goodwill impairment indicator, a company’s stock price and market capitalization should be considered in determining whether it is more likely than not that the fair value of a reporting unit is less that its carrying value. Additionally, a significant decline in a company’s stock price may suggest that an adverse change in the business climate may have caused the fair value of the reporting unit to fall below its carrying value. The financial and credit market volatility directly impacts our fair value measurement through our stock price that we use to determine our market capitalization. During times of volatility, significant judgment must be applied to determine whether credit or stock price changes are a short-term swing or a longer-term trend. A sustained decline in our market capitalization below its book value could lead us to determine, in a future period, that an interim goodwill impairment review is required and may result in an impairment charge which would have a negative impact on our results of operations.
Stockholders’ Equity. We have never paid a cash dividend on our common stock. Our Credit Agreement does not permit the payment of cash dividends.
In October 1998, we initiated a stock repurchase program to repurchase up to 315,000 shares of our outstanding common stock in open market transactions at market prices. We were authorized to repurchase 45,100 remaining shares of common stock under this program as of December 31, 2014.
Revenue Recognition. Revenue from the sale of products is recognized when both risk of loss and title have transferred to the customer, which in most cases coincides with shipment of the related products, and collection is reasonably assured. Revenue from conversion services is recognized when the performance of the service is complete. Invoiced shipping and handling costs are also
28
accounted for as revenue. Customer claims, which are not material, are accounted for primarily as a reduction to gross sales after the matter has been researched and an acceptable resolution has been reached.
The following table presents net sales by product line:
|
For the years ended December 31, |
2014 |
2013 |
2012 |
||||||
|
(dollars in thousands) |
|||||||||
|
Stainless steel |
$ |
159,799 |
$ |
137,383 |
$ |
195,315 | |||
|
High-strength low alloy steel |
16,853 | 17,894 | 21,897 | ||||||
|
Tool steel |
16,680 | 18,112 | 20,420 | ||||||
|
High-temperature alloy steel |
6,295 | 4,277 | 7,787 | ||||||
|
Conversion services and other sales |
5,933 | 3,102 | 5,571 | ||||||
|
Total net sales |
$ |
205,560 |
$ |
180,768 |
$ |
250,990 | |||
Income Taxes. Deferred income taxes are provided for unused tax credits earned and the tax effect of temporary differences between the tax basis of assets and liabilities and their reported amounts in the consolidated financial statements. We use the liability method to account for income taxes, which requires deferred taxes to be recorded at the statutory rate expected to be in effect when the taxes are paid. Valuation allowances are provided for a deferred tax asset when it is more likely than not that the asset will not be realized. Income tax penalties and interest are included in the provision for income tax expense.
We evaluate the tax positions taken or expected to be taken in our tax returns. A tax position should only be recognized in the financial statements if we determine that it is more-likely-than-not that the tax position will be sustained upon examination by the tax authorities, based upon the technical merits of the position. For those tax positions that should be recognized, the measurement of a tax position is determined as being the largest amount of benefit that is greater than fifty percent likely of being realized upon ultimate settlement. We believe there are no material uncertain tax positions at December 31, 2014, 2013 and 2012.
We use the with-and-without method to account for excess tax benefits recognized as a result of the exercise of employee stock options. Under the with-and-without method, excess tax benefits related to share-based compensation are not deemed to be realized until after the utilization of all other tax benefits available to us, which are also subject to applicable limitations.
Share-based Compensation Plans. We recognize compensation expense based on the grant-date fair value of the awards. The fair value of the stock option grants is estimated on the date of grant using the Black-Scholes option-pricing model, and is recognized ratably over the service/vesting period of the award. The fair value of time-based restricted stock grants is calculated using the market value of the stock on the date of issuance, and is recognized ratably over the service/vesting period of the award.
Net Income (Loss) per Common Share. Net income (loss) per common share is computed by dividing net income (loss) by the weighted-average number of common shares outstanding during the period. Diluted net income per common share is computed by dividing net income, adjusted to include interest expense (tax effected) for the convertible notes by the weighted-average number of common shares outstanding plus all dilutive potential common shares outstanding during the period. All shares that were issuable under our outstanding convertible notes were considered outstanding for our diluted net income per common share computation, using the “if converted” method of accounting from the date of issuance.
Statement of Comprehensive Income. During the years ended December 31, 2014, 2013 and 2012 there were no comprehensive income items other than net income (loss); therefore, a separate Statement of Comprehensive Income was excluded from the consolidated financial statements.
Treasury Stock. We account for treasury stock under the cost method and include such shares as a reduction of total stockholders’ equity.
Financial Instruments. Financial instruments held by us include cash, accounts receivable, accounts payable and long-term debt. The carrying value of cash, accounts receivable and accounts payable is considered to be representative of fair value because of the short maturity of these instruments. Refer to Note 5 for fair value disclosures of our financial instruments.
Segment Reporting. Our operating facilities are integrated, and therefore our chief operating decision maker (“CODM”) views the Company as one business unit. Our CODM sets performance goals, assesses performance and makes decisions about resource allocations on a consolidated basis. As a result of these factors, as well as the nature of the financial information available which is reviewed by our CODM, we maintain one reportable segment.
Reclassifications. Certain prior year amounts have been reclassified to conform to the 2014 presentation.
29
Recently Adopted Accounting Pronouncement
In July 2013, the Financial Accounting Standards Board (“FASB”) issued Accounting Standard Update (“ASU”) 2013-11 Income Taxes (Topic 740): Presentation of an Unrecognized Tax Benefit When a Net Operating Loss Carryforward, a Similar Tax Loss, or a Tax Credit Carryforward Exists. We adopted ASU 2013-11 in 2014. The update did not have a material impact on our consolidated financial statements.
Recently Issued Accounting Pronouncement
In May 2014, the FASB issued ASU 2014-09 “Revenue from Contracts with Customers (Topic 606).” This topic converges the guidance within GAAP and International Financial Reporting Standards and supersedes Accounting Standards Codification 605, Revenue Recognition. The new standard requires companies to recognize revenue to depict the transfer of goods or services to customers in amounts that reflect the consideration to which the company expects to be entitled in exchange for those goods or services. The new standard will also result in enhanced disclosures about revenue, provide guidance for transactions that were not previously addressed comprehensively, and improve guidance for multiple-element arrangements. The new guidance is effective for annual reporting periods beginning after December 15, 2016, including interim reporting periods within that reporting period and early application is not permitted. We are currently evaluating the impact that this standard will have on our consolidated financial statements and corresponding disclosures.
Note 2: Inventory
The major classes of inventory are as follows:
|
December 31, |
2014 |
2013 |
||||
|
(dollars in thousands) |
||||||
|
Raw materials and starting stock |
$ |
8,943 |
$ |
7,116 | ||
|
Semi-finished and finished steel products |
84,816 | 69,065 | ||||
|
Operating materials |
8,759 | 8,463 | ||||
|
Gross inventory |
102,518 | 84,644 | ||||
|
Inventory reserves |
(1,448) | (2,051) | ||||
|
Total inventory, net |
$ |
101,070 |
$ |
82,593 | ||
Note 3: Property, Plant and Equipment
Property, plant and equipment consists of the following:
|
December 31, |
2014 |
2013 |
||||
|
(dollars in thousands) |
||||||
|
Land and land improvements |
$ |
7,088 |
$ |
6,934 | ||
|
Buildings |
45,434 | 45,879 | ||||
|
Machinery and equipment |
225,754 | 218,274 | ||||
|
Construction in progress |
12,833 | 8,867 | ||||
|
Gross property, plant and equipment |
291,109 | 279,954 | ||||
|
Accumulated depreciation |
(91,314) | (76,364) | ||||
|
Property, plant and equipment, net |
$ |
199,795 |
$ |
203,590 | ||
30
Note 4: Long-Term Debt
Long-term debt consists of the following:
|
December 31, |
2014 |
2013 |
||||
|
(dollars in thousands) |
||||||
|
Term loan |
$ |
15,500 |
$ |
18,500 | ||
|
Revolving credit facility |
51,350 | 49,350 | ||||
|
Convertible notes |
20,000 | 20,000 | ||||
|
Swing loan credit facility |
25 | 1,946 | ||||
| 86,875 | 89,796 | |||||
|
Less: current portion of long-term debt |
(3,000) | (3,000) | ||||
|
Long-term debt |
$ |
83,875 |
$ |
86,796 | ||
Credit Facility
We have a Credit Agreement (as amended to date the “Credit Agreement”) with a syndication of banks which provides for a $105.0 million senior secured revolving credit facility (the “Revolver”) and a $20.0 million senior secured term loan facility (the “Term Loan” and together with the Revolver, the “Facilities”) that expire in March 2017. Under the Credit Agreement, our loan availability under the Revolver (“Borrowing Base”) is calculated monthly based upon our accounts receivable and inventory balances. The Facilities are collateralized by substantially all of the assets of the Company and its subsidiaries, except that no real property other than the North Jackson facility is collateral under the Facilities. Universal Stainless & Alloy Products, Inc., Dunkirk Specialty Steel, LLC and North Jackson Specialty Steel, LLC are co-borrowers under the Facilities.
At any time prior to August 18, 2015, we may make up to two requests to increase the maximum aggregate principal amount of borrowings under the Revolver by at least $10.0 million, with the maximum aggregate principal amount of borrowings under the Revolver not to exceed $130.0 million. We are required to pay a commitment fee of 0.25% based on the daily unused portion of the Revolver. The Revolver also provides for up to $7.0 million of swing loans so long as the sum of the outstanding swing loans and the outstanding borrowings under the Revolver do not exceed our Borrowing Base. The Term Loan is payable in quarterly installments in the principal amount of $750,000 which began on July 1, 2013, with the balance of the Term Loan payable in full on March 19, 2017.
Amounts outstanding under the Facilities, at our option, will bear interest at either a base rate or a LIBOR-based rate (the “LIBOR Option”), in either case calculated in accordance with the terms of the Credit Agreement. We elected to use the LIBOR Option during the year ended December 31, 2014, which was 2.17% at December 31, 2014. Interest on the Facilities is payable monthly.
We are required to maintain a leverage ratio not exceeding a ratio decreasing from 3.75 to 1.00 for the period December 31, 2014 to March 31, 2015, 3.50 to 1.00 for the period June 30, 2015 to September 30, 2015, 3.25 to 1.00 at December 31, 2015 and 3.00 to 1.00 from March 31, 2016 through maturity. We are required to maintain a fixed charge coverage ratio of 1.1 to 1.0 from the fourth quarter of 2014 to maturity. We were in compliance with all our covenants at December 31, 2014 and December 31, 2013.
Convertible Notes
In connection with the acquisition of the North Jackson facility, in August 2011, we issued $20.0 million in convertible notes (the “Notes”) to the sellers of the North Jackson facility as partial consideration of the acquisition. The Notes are subordinated obligations and rank junior to the Facilities. The Notes bear interest at a fixed rate of 4.0% per annum, payable in cash semi-annually in arrears on each June 18 and December 18, beginning on December 18, 2011. Unless earlier converted, the Notes mature and the unpaid principal balance is due on August 17, 2017. The Notes and any accrued and unpaid interest are convertible into shares of our common stock at the option of the holder at an initial conversion price of $47.1675 per share of common stock. The conversion price associated with the Notes may be adjusted in certain circumstances. We may prepay any outstanding Notes, in whole or in part, during a fiscal quarter if our share price is greater than 140% of the current conversion price for at least 20 of the trading days in the 30 consecutive trading day period ending on the last trading day of the immediately preceding quarter.
31
The aggregate annual principal payments due under our long-term debt are as follows:
|
(dollars in thousands) |
|||
|
2015 |
$ |
3,000 | |
|
2016 |
3,000 | ||
|
2017 |
80,875 | ||
|
$ |
86,875 |
Note 5: Fair Value Measurements
The fair value hierarchy has three levels based on the inputs used to determine fair value, which are as follows:
Level 1 — Unadjusted quoted prices available in active markets for the identical assets or liabilities at the measurement date.
Level 2 — Unadjusted quoted prices in active markets for similar assets or liabilities, or unadjusted quoted prices for identical or similar assets or liabilities in markets that are not active, or inputs other than quoted prices that are observable for the asset or liability.
Level 3 — Unobservable inputs that cannot be corroborated by observable market data and reflect the use of significant management judgment. These values are generally determined using pricing models for which the assumptions utilize management’s estimates of market participant assumptions.
The fair value hierarchy requires the use of observable market data when available. In instances where the inputs used to measure fair value fall into different levels of the fair value hierarchy, the fair value measurement has been determined based on the lowest level input significant to the fair value measurement in its entirety. Our assessment of the significance of a particular item to the fair value measurement in its entirety requires judgment, including the consideration of inputs specific to the asset or liability.
The carrying amounts of our cash, accounts receivable and accounts payable approximated fair value at December 31, 2014 and 2013 due to their short-term nature (Level 1). The fair value of the Term Loan, Revolver and swing loans at December 31, 2014 and 2013 approximated the carrying amount as the interest rate is based upon floating short-term interest rates (Level 2). At December 31, 2014 and 2013, the fair value of our Notes was approximately $20.5 million and $23.3 million, respectively (Level 2).
Note 6: Income Taxes
The income tax provision (benefit) attributable to continuing operations during the years ended December 31, 2014, 2013 and 2012 is as follows:
Components of the provision (benefit) for income taxes are as follows:
|
For the years ended December 31, |
2014 |
2013 |
2012 |
|||||||
|
(dollars in thousands) |
||||||||||
|
Current provision (benefit) |
||||||||||
|
Federal |
$ |
312 |
$ |
85 |
$ |
(5,782) | ||||
|
State |
298 | (6) | (440) | |||||||
|
Deferred provision (benefit) |
||||||||||
|
Federal |
1,941 | (3,205) | 13,143 | |||||||
|
State |
598 | 622 | (587) | |||||||
|
Provision (benefit) for income taxes |
$ |
3,149 |
$ |
(2,504) |
$ |
6,334 | ||||
|
|
|
|
|
32
A reconciliation of the federal statutory tax rate and our effective tax rate is as follows:
|
For the years ended December 31, |
2014 |
2013 |
2012 |
|||||||
|
Federal statutory tax rate |
35.0 |
% |
35.0 |
% |
35.0 |
% |
||||
|
Research and development tax credit |
(2.9) | 14.6 | (3.5) | |||||||
|
State government grants, net of federal tax impact |
- |
4.2 | (0.1) | |||||||
|
Valuation allowance, state government grants, net of federal impact |
8.2 | (15.0) |
- |
|||||||
|
Domestic manufacturing deduction |
- |
- |
2.7 | |||||||
|
State income taxes, net of federal impact |
3.7 | 1.4 | (4.0) | |||||||
|
Other, net |
(0.3) | (2.1) | 0.1 | |||||||
|
Effective income tax rate |
43.7 |
% |
38.1 |
% |
30.2 |
% |
||||
|
|
|
|
|
On March 31, 2014 new tax legislation was enacted in New York that reduced the New York state income tax rate to zero percent (0%) for qualified manufacturers, such as Universal, for tax years beginning on or after January 1, 2014. Prior to this legislation, our facility in Dunkirk operated in a New York State Empire Zone and qualified to benefit from investments made and employees hired, and as such, we had recorded a deferred tax asset on these investments. As a result of this new legislation, we placed a full valuation allowance on our remaining corresponding deferred tax asset in the amount of $596,000 during 2014. Prior to this tax charge, we had placed a $986,000 valuation allowance on this deferred tax asset in 2013.
The Tax Increase Prevention Act of 2014 extended the tax benefit for research and development tax credits for 2014 resulting in a benefit of approximately $342,000, which was recorded entirely in the fourth quarter of 2014.
Deferred income taxes reflect the net tax effects of temporary differences between the carrying amounts of assets and liabilities for financial reporting purposes and the amounts used for income tax purposes. Significant components of our net deferred taxes related to continuing operations are as follows:
|
December 31, |
2014 |
2013 |
||||
|
(dollars in thousands) |
||||||
|
Current deferred tax assets: |
||||||
|
Inventory |
$ |
3,136 |
$ |
3,454 | ||
|
Federal tax carryforwards |
3,249 | 6,459 | ||||
|
Share-based compensation |
3,300 | 2,621 | ||||
|
Receivables |
29 | 98 | ||||
|
Accrued liabilities |
396 | 633 | ||||
|
Other |
65 | 65 | ||||
|
Total current deferred tax assets |
$ |
10,175 |
$ |
13,330 | ||
|
Noncurrent deferred tax assets: |
||||||
|
Federal and state tax carryforwards |
$ |
14,246 |
$ |
15,553 | ||
|
Deferred tax liabilities: |
||||||
|
Property, plant and equipment (noncurrent) |
$ |
56,354 |
$ |
58,085 | ||
|
Other (current) |
492 | 288 | ||||
|
$ |
56,846 |
$ |
58,373 | |||
We file a U.S. federal income tax return and various state income tax returns. For federal income tax purposes, we had $41.5 million and $52.5 million of net operating loss carryforwards at December 31, 2014 and 2013, respectively. The net operating loss carryforwards begin to expire in 2031. In addition we have credit carryforwards associated with our research and development activities of $1.7 million and $1.4 million as of December 31, 2014 and 2013, respectively. The research and development credit carryforwards begin to expire in 2030. We also have $597,000 and $334,000 in alternative minimum tax credit carryforwards for the years ended December 31, 2014 and 2013, respectively. The alternative minimum tax credit carryforwards can be carried forward indefinitely.
33
We have state net operating loss carryforwards of $8.1 million and $8.7 million and state credit carryforwards of $267,000 and $257,000 at December 31, 2014 and 2013, respectively. The state net operating loss carryforwards begin to expire in 2031. The state credit carryforwards begin to expire in 2027.
We are routinely under audit by federal or state authorities. During 2014, the Internal Revenue Service (“IRS”) concluded its audit of our federal income tax returns for the years ended December 31, 2008 through 2011. Our federal tax returns are subject to examination by the IRS for tax years after 2012.
In 2014, we reached a settlement with Pennsylvania on certain expenses which had been deducted for state income tax purposes during the 2005-2008 tax years. As a result of this matter, we incurred $179,000 of additional Pennsylvania income taxes net of the federal tax benefit. We are subject to examination by state tax jurisdictions for tax years after 2011.
Note 7: Net Income (Loss) Per Common Share
The computation of basic and diluted net income (loss) per common share for the years ended December 31, 2014, 2013 and 2012 is as follows:
|
For the years ended December 31, |
2014 |
2013 |
2012 |
||||||
|
(dollars in thousands, except per share amounts) |
|||||||||
|
Numerator: |
|||||||||
|
Net income (loss) |
$ |
4,050 |
$ |
(4,062) |
$ |
14,617 | |||
|
Adjustment for interest expense on convertible notes |
- |
- |
458 | ||||||
|
Net income (loss), as adjusted |
$ |
4,050 |
$ |
(4,062) |
$ |
15,075 | |||
|
Denominator: |
|||||||||
|
Weighted average number of shares of common stock outstanding |
7,031,539 | 6,950,976 | 6,874,669 | ||||||
|
Weighted average effect of dilutive stock options and other stock compensation |
84,892 |
- |
151,223 | ||||||
|
Weighted average effect of assumed conversion of convertible notes |
- |
- |
428,138 | ||||||
|
Weighted average number of shares of common stock outstanding, as adjusted |
7,116,431 | 6,950,976 | 7,454,030 | ||||||
|
Net income (loss) per common share: |
|||||||||
|
Basic |
$ |
0.58 |
$ |
(0.58) |
$ |
2.13 | |||
|
Diluted |
$ |
0.57 |
$ |
(0.58) |
$ |
2.02 | |||
The adjustment for interest expense on convertible notes is net of tax. An adjustment for interest expense on convertible notes was excluded from the income per share calculation for the years ended December 31, 2014 and 2013 as a result of the convertible notes being antidilutive.
We have granted options to purchase 440,300, 353,550 and 29,150 shares of common stock, at an average price of $35.20, $36.36 and $41.18 during the years ended December 31, 2014, 2013 and 2012, respectively. These outstanding options were not included in the computation of diluted net income (loss) per common share because their respective exercise prices were greater than the average market price of our common stock. The calculation of diluted earnings per share for the years ended December 31, 2014 and 2013 excludes 428,140 shares, for the assumed conversion of convertible notes as a result of the convertible notes being antidilutive. In addition, the calculation of diluted earnings per share for the year ended December 31, 2013 would have included 118,814 shares, for the assumed exercise of options and restricted stock under our share incentive plans except that we were in a net loss position and no anti-dilution is permitted.
34
Note 8: Incentive Compensation Plans
At December 31, 2014, we had three incentive compensation plans that are described below:
Omnibus Incentive Plan
We maintain an Omnibus Incentive Plan (“OIP”) which was approved by our stockholders in May 2012. The OIP permits the issuance of stock options, restricted stock, restricted stock units and other stock-based awards to non-employee directors, other than those directors owning more than 5% of our outstanding common stock, consultants, officers and other key employees who are expected to contribute to our future growth and success. An aggregate of 2,150,000 shares of common stock were authorized for issuance under the OIP, of which 447,568 were available for grant at December 31, 2014.
Stock Options
The option price for options granted under the OIP is equal to the fair market value of the common stock at the date of grant. Options granted to non-employee directors vest over a three-year period, and options granted to employees vest over a four-year period. All options under the OIP will expire no later than ten years after the grant date. Forfeited options may be reissued and are included in the amount available for grants.
A summary of stock option activity as of and for the year ended December 31, 2014 is presented below:
|
Non-vested stock |
Stock options |
|||||||||||
|
options outstanding |
outstanding |
|||||||||||
|
Weighted- |
Weighted- |
Weighted- |
||||||||||
|
average |
average |
average |
||||||||||
|
Number |
grant-date |
Number |
exercise |
contractual |
||||||||
|
of shares |
fair value |
of shares |
price |
term (years) |
||||||||
|
Outstanding at December 31, 2013 |
201,156 |
$ |
18.83 | 706,925 |
$ |
28.61 | ||||||
|
Stock options granted |
135,500 | 14.39 | 135,500 | 27.28 | ||||||||
|
Stock options exercised |
(49,500) | 15.43 | ||||||||||
|
Stock options vested |
(89,062) | 18.83 | ||||||||||
|
Stock options forfeited |
(11,750) | 17.60 | (17,250) | 33.11 | ||||||||
|
Outstanding at December 31, 2014 |
235,844 |
$ |
16.34 | 775,675 |
$ |
29.12 |
6.3 |
|||||
|
Exercisable at December 31, 2014 |
539,831 |
$ |
28.68 |
5.1 |
||||||||
Proceeds from stock option exercises totaled $764,000, $848,000 and $1.3 million for the years ended December 31, 2014, 2013 and 2012, respectively. Shares issued in connection with stock option exercises are issued from available authorized shares.
Based upon the closing stock price of $25.15 at December 31, 2014, the aggregate intrinsic value of outstanding and exercisable stock options was $1.4 million and $1.4 million, respectively. Intrinsic value of stock options is calculated as the amount by which the market price of our common stock exceeds the exercise price of the options. The aggregate intrinsic value of stock options exercised for the years ended December 31, 2014, 2013 and 2012 was $841,000, $929,000 and $1.6 million, respectively. The total fair value of stock option awards vested during the years ended December 31, 2014, 2013 and 2012 was $1.7 million, $1.4 million and $1.5 million, respectively.
Share-based compensation to employees and directors is recognized as compensation expense in the consolidated statements of operations based on the stock options fair value on the measurement date, which is the date of the grant. The value of the portion of the award that is ultimately expected to vest is recognized as expense over the requisite service periods. The compensation expense recognized and its related tax effects are included in additional paid-in capital.
Share-based compensation expense related to stock options totaled $1.7 million, $1.5 million and $1.6 million for the years ended December 31, 2014, 2013 and 2012, respectively. Share-based compensation expense is recognized ratably over the requisite service period for all stock option awards. Unrecognized share-based compensation expense related to non-vested stock option awards totaled $3.9 million at December 31, 2014. At such date, the weighted-average period over which this unrecognized expense was expected to be recognized was 3.0 years. We recognized no tax benefit for the exercise of stock options during the years ended December 31, 2014, 2013 and 2012.
35
The fair value of our stock options granted is estimated on the measurement date, which is the date of grant. We use the Black-Scholes option-pricing model. Our determination of fair value of stock option awards on the date of grant is affected by our stock price as well as assumptions regarding our expected stock price volatility over the term of the awards, and actual and projected stock option exercise behaviors. The weighted-average grant-date fair value of stock options granted during the years ended December 31, 2014, 2013 and 2012 was $14.39, $18.02 and $20.60, respectively.
The assumptions used to determine the fair value of stock options granted are detailed in the table below:
|
2014 |
2013 |
2012 |
||||
|
Risk-free interest rate |
1.79% to 2.13% |
1.02% to 2.14% |
0.80% to 1.10% |
|||
|
Dividend yield |
0.0% | 0.0% | 0.0% | |||
|
Expected market price volatility |
49% to 57% |
57% to 60% |
59% to 62% |
|||
|
Weighted-average expected market price volatility |
52.6% | 58.1% | 61.8% | |||
|
Expected term |
5.6 to 7.5 years |
5.4 to 7.5 years |
6.0 to 6.3 years |
The risk-free interest rate was developed using the U.S. Treasury yield curve for periods equal to the expected life of the stock options at the grant date. No dividend yield was assumed because we do not pay cash dividends on common stock and currently have no plans to pay a dividend. Expected volatility is based on the long-term historical volatility (estimated over a period equal to the expected term of the stock options) of our common stock. In estimating the fair value of stock options under the Black-Scholes option-pricing model, separate groups of employees that have similar historical exercise behavior are considered separately. The expected term of options granted represents the period of time that options granted are expected to be outstanding.
Restricted Stock
During the year ended December 31, 2012, we granted 35,000 time-based shares of restricted common stock to certain employees. The fair value of the non-vested time-based restricted common stock awards was calculated using the market value of the stock on the date of issuance, which was $35.26. During the year ended December 31, 2013, 3,000 of these restricted shares were forfeited.
Share-based compensation expense related to restricted stock totaled $342,000, $339,000, $34,000 for the years ended December 31, 2014, 2013 and 2012, respectively. As of December 31, 2014, total unrecognized compensation cost related to non-vested time-based restricted common stock awards was $412,000, which is expected to be recognized over 1.0 year.
Employee Stock Purchase Plan
Under the 1996 Employee Stock Purchase Plan, as amended (the “Plan”), the Company is authorized to issue up to 200,000 shares of common stock to its full-time employees, nearly all of whom are eligible to participate. Under the terms of the Plan, employees can choose as of January 1 and July 1 of each year to have up to 10% of their total earnings withheld to purchase up to 100 shares of our common stock each six-month period. The purchase price of the stock is 85% of the lower of its beginning-of-the-period or end-of-the-period market prices. At December 31, 2014, we have issued 162,961 shares of common stock since the Plan’s inception.
Cash Incentive Plans
We have a variable compensation plan covering certain key executives and senior management and profit-sharing plans and a key performance plan that cover the remaining employees. The variable compensation plan aligns the compensation of executive officers and senior management with the performance expectations of the Board of Directors in order to motivate and reward them for the achievement of Company performance metrics. The profit-sharing plans provide for the sharing of pre-tax profits in excess of specified amounts at our Bridgeville, Dunkirk and Titusville facilities. The key performance plan provides a cash incentive for achieving certain performance metrics at our North Jackson facility. For the years ended December 31, 2014, 2013 and 2012, we expensed $4.4 million, $1.0 million and $4.0 million, respectively, under these cash incentive plans of which $1.8 million, $576,000 and $3.9 million, respectively was included as a component of cost of products sold while the remainder was included in selling and administrative expense. At December 31, 2014 and 2013, we had liabilities of $3.3 million and $530,000, respectively, as a component of accrued employment costs on our consolidated balance sheets related to these cash incentive plans.
Note 9: Retirement Plans
We have a defined contribution retirement plan (“401(k) plan”) that covers substantially all employees. Pursuant to the 401(k) plan, participants may elect to make pre-tax and after-tax contributions, subject to certain limitations imposed under the Internal Revenue Code of 1986, as amended. In addition, we make periodic contributions to the 401(k) plan based on service for the Titusville and Dunkirk hourly employees and age for North Jackson hourly employees. We make periodic contributions for the salaried employees at all locations except for North Jackson based upon their service and their individual contribution to the 401(k) plan. For North Jackson salaried employees, we make periodic contributions based upon the employee’s age and their individual contributions.
36
We also participate in the Steelworkers Pension Trust (the “Trust”), a multi-employer defined-benefit pension plan that is open to all hourly and salary employees associated with the Bridgeville facility. We make periodic contributions to the Trust based on hours worked at a fixed rate for each hourly employee, as determined by the collective bargaining agreement, which expires in August 2018 and a fixed monthly contribution on behalf of each salary employee. The trustees of the Trust have provided us with the latest data available for the Trust year ending December 31, 2014. As of that date, the Trust is not fully funded. We could be held liable to the Trust for our own obligations, as well as those of other employers, due to our participation in the Trust. Contribution rates could increase if the Trust is required to adopt a funding improvement plan or a rehabilitation plan, if the performance of the Trust assets do not meet expectations, or as a result of future collectively-bargained wage and benefit agreements. If we choose to stop participating in the Trust, we may be required to pay the Trust an amount based on the underfunded status of the Trust, referred to as a withdrawal liability.
The Pension Protection Act (PPA) defines a zone status for each trust. Trusts in the green zone are at least 80% funded, trusts in the yellow zone are at least 65% funded, and trusts in the red zone are generally less than 65% funded. The Trust has utilized extended amortization provisions to amortize its losses from 2008. The Trust recertified its zone status after using the extended amortization provisions as allowed by law. The Trust has not implemented a funding improvement or rehabilitation plan, nor are such plans pending. Our contributions to the Trust have not exceeded more than 5% of the total contributions to the Trust.
|
Trusts employer |
|||||||||||||||||||
|
identification |
Funding plan |
Company contributions to the Trust |
|||||||||||||||||
|
Pension |
number / |
PPA zone status |
pending / |
(dollars in thousands) |
Surcharge |
||||||||||||||
|
fund |
plan number |
2014 |
2013 |
implemented |
2014 |
2013 |
2012 |
imposed |
|||||||||||
|
Trust |
23-6648508 / 499 |
Green |
Green |
No |
$ |
758 |
$ |
668 |
$ |
749 |
No |
||||||||
The total expense of all retirement plans for the years ended December 31, 2014, 2013 and 2012 was $1.6 million, $1.5 million and $1.5 million, respectively. No other post-retirement benefit plans exist.
Note 10: Commitments and Contingencies
From time to time, various lawsuits and claims have been or may be asserted against us relating to the conduct of our business, including routine litigation relating to commercial and employment matters. The ultimate cost and outcome of any litigation or claim cannot be predicted with certainty. Management believes, based on information presently available, that the likelihood that the ultimate outcome of any such pending matter will have a material adverse effect on its financial condition, or liquidity or a material impact to its results of operations is remote, although the resolution of one or more of these matters may have a material adverse effect on our results of operations for the period in which the resolution occurs.
We, as well as other steel companies, are subject to demanding environmental standards imposed by federal, state and local environmental laws and regulations. We are not aware of any environmental condition that currently exists at any of our facilities that would cause a material adverse effect on our financial condition, results of operations or liquidity in a particular future quarter or year.
Our purchase obligations include the value of all open purchase orders with established quantities and purchase prices, as well as minimum purchase commitments, all made in the normal course of business. At December 31, 2014, our total purchase obligations were $7.6 million, all of which will be due in 2014.
37
Note 11: Selected Quarterly Financial Data (unaudited)
|
First quarter |
Second quarter |
Third quarter |
Fourth quarter |
|||||||||
|
(dollars in thousands, except per share amounts) |
||||||||||||
|
2014 Data: |
||||||||||||
|
Net sales |
$ |
46,667 |
$ |
52,309 |
$ |
53,626 |
$ |
52,958 | ||||
|
Gross margin |
$ |
6,060 |
$ |
8,410 |
$ |
8,643 |
$ |
8,909 | ||||
|
Operating income |
$ |
1,432 |
$ |
3,241 |
$ |
3,123 |
$ |
3,104 | ||||
|
Provision for income taxes |
$ |
1,072 |
$ |
749 |
$ |
775 |
$ |
553 | ||||
|
Net (loss) income |
$ |
(499) |
$ |
1,449 |
$ |
1,395 |
$ |
1,705 | ||||
|
Net (loss) income per common share: |
||||||||||||
|
Basic |
$ |
(0.07) |
$ |
0.21 |
$ |
0.20 |
$ |
0.24 | ||||
|
Diluted |
$ |
(0.07) |
$ |
0.20 |
$ |
0.20 |
$ |
0.24 | ||||
|
2013 Data: |
||||||||||||
|
Net sales |
$ |
49,135 |
$ |
42,887 |
$ |
48,460 |
$ |
40,286 | ||||
|
Gross margin |
$ |
4,646 |
$ |
5,308 |
$ |
2,438 |
$ |
1,488 | ||||
|
Operating income (loss) |
$ |
167 |
$ |
439 |
$ |
(2,029) |
$ |
(2,582) | ||||
|
Benefit from income taxes |
$ |
(534) |
$ |
(841) |
$ |
(652) |
$ |
(477) | ||||
|
Net income (loss) |
$ |
40 |
$ |
478 |
$ |
(1,711) |
$ |
(2,869) | ||||
|
Net income (loss) per common share: |
||||||||||||
|
Basic |
$ |
0.01 |
$ |
0.07 |
$ |
(0.25) |
$ |
(0.41) | ||||
|
Diluted |
$ |
0.01 |
$ |
0.06 |
$ |
(0.25) |
$ |
(0.41) | ||||
|
|
|
|
|
|
During the fourth quarter of 2013 and the first quarter of 2014, we recorded tax valuation allowances of $986,000 and $596,000, respectively, in relation to deferred tax assets for the state of New York. Net (loss) income per common share amounts for each quarter is required to be computed independently. As a result, their sum may not equal the total year earnings per share amounts.
ITEM 9. CHANGES IN AND DISAGREEMENTS WITH ACCOUNTANTS ON ACCOUNTING AND FINANCIAL DISCLOSURE
None.
ITEM 9A.CONTROLS AND PROCEDURES
Our management, including our Chairman, President and Chief Executive Officer and the Vice President of Finance, Chief Financial Officer and Treasurer, performed an evaluation of the effectiveness of our disclosure controls and procedures. Based on that evaluation, our Chairman, President and Chief Executive Officer and the Vice President of Finance, Chief Financial Officer and Treasurer concluded that, as of the end of the fiscal year covered by this Annual Report on Form 10-K, our disclosure controls and procedures are effective. Management’s Report on our internal control over financial reporting is included in Item 8 of this Annual Report on Form 10-K under the caption “Management’s Report on Internal Control Over Financial Reporting” and is incorporated herein by reference. Our independent registered public accounting firm has issued a report on management’s maintenance of effective internal control over financial reporting and is set forth in Item 8 of this Annual Report on Form 10-K under the caption “Report of Independent Registered Public Accounting Firm” and is incorporated herein by reference.
During the last fiscal quarter of the fiscal year ended December 31, 2014, there were no changes in our internal control over financial reporting which have materially affected, or are reasonably likely to materially affect, our internal control over financial reporting.
None.
38
PART III
ITEM 10.DIRECTORS, EXECUTIVE OFFICERS AND CORPORATE GOVERNANCE
The information concerning the directors of the Company is set forth in the Proxy Statement for the 2015 Annual Meeting of Stockholders (the “Proxy Statement”) to be sent to stockholders in connection with our 2015 Annual Meeting of Stockholders, under the heading “Proposal No. 1—Election of Directors,” which information is incorporated by reference. With the exception of the information specifically incorporated herein by reference, our Proxy Statement is not to be deemed filed as part of this report for the purposes of this Item.
In addition to the information set forth under the caption “Executive Officers” in Part I of this report, the information concerning our directors required by this item is incorporated and made part hereof by reference to the material appearing under the heading “Nominees for Election as Directors” in our Proxy Statement, which will be filed with the SEC, pursuant to Regulation 14A, not later than 120 days after the end of the 2014 fiscal year. Information concerning the Audit Committee and its “audit committee financial expert” required by this item is incorporated and made part hereof by reference to the material appearing under the heading “Committees of the Board of Directors” in the Proxy Statement. Information required by this item regarding compliance with Section 16(a) of the Exchange Act is incorporated and made a part hereof by reference to the material appearing under the heading “Security Ownership of Certain Beneficial Owners and Management” in the Proxy Statement. Information concerning the executive officers of the Company is contained in Part I of this Annual Report on Form 10-K under the caption “Executive Officers.”
We have adopted a Code of Business Conduct and Ethics that applies to all directors and employees, including its principal executive officer and principal financial officer. A copy is available, free of charge, through our website at http://www.univstainless.com. Information on our website is not part of this Annual Report on Form 10-K. We intend to timely disclose any amendment of or waiver under the Code of Business Conduct and Ethics on our website and will retain such information on our website as required by applicable SEC rules.
ITEM 11. EXECUTIVE COMPENSATION
The information concerning executive compensation is set forth in the Proxy Statement under the heading “Executive Compensation,” which information is incorporated by reference. With the exception of the information specifically incorporated herein by reference, the Proxy Statement is not to be deemed filed as part of this report for the purposes of this Item.
ITEM 12.SECURITY OWNERSHIP OF CERTAIN BENEFICIAL OWNERS AND MANAGEMENT AND RELATED STOCKHOLDER MATTERS
The information concerning security ownership of certain beneficial owners and management is set forth in the Proxy Statement under the heading “Security Ownership of Certain Beneficial Owners and Management,” which information is incorporated by reference. With the exception of the information specifically incorporated herein by reference, the Proxy Statement is not to be deemed filed as part of this report for the purposes of this Item.
Equity Compensation Plan Information:
Securities authorized for issuance under equity compensation plans at December 31, 2014 were as follows:
|
Plan Category |
Number of shares to be issued upon exercise of outstanding options |
Weighted-average exercise price of outstanding options |
Number of shares remaining available for future issuance under equity compensation plans (A) |
||||
|
Equity compensation plans approved by security holders |
775,675 |
$ |
29.12 | 484,607 | |||
|
Equity compensation plans not approved by security holders |
- |
- |
- |
||||
|
Total |
775,675 |
$ |
29.12 | 484,607 |
|
(A) Includes 447,568 shares of common stock not issued under the Omnibus Incentive Plan and 37,039 available under the 1996 Employee Stock Purchase Plan, as amended. |
|||||||
39
ITEM 13.CERTAIN RELATIONSHIPS AND RELATED TRANSACTIONS, AND DIRECTOR INDEPENDENCE
The information concerning certain relationships and related transactions, and director independence is set forth in the Proxy Statement under the heading “The Board of Directors,” which information is incorporated by reference. With the exception of the information specifically incorporated herein by reference, the Proxy Statement is not to be deemed filed as part of this report for the purposes of this Item.
ITEM 14.PRINCIPAL ACCOUNTANT FEES AND SERVICES
The information concerning principal accountant fees and services is set forth in the Proxy Statement under the heading “Principal Accountant Fees and Services,” which information is incorporated by reference. With the exception of the information specifically incorporated herein by reference, the Proxy Statement is not to be deemed filed as part of this report for the purposes of this Item.
PART IV
ITEM 15.EXHIBITS AND FINANCIAL STATEMENT SCHEDULES
The following documents are filed as part of this Form 10-K:
1) Financial Statements
The list of financial statements required by this item is set forth in Item 8, “Financial Statements and Supplementary Data” and is incorporated herein by reference.
2) Consolidated Financial Statement Schedules
Schedule II – Valuation and Qualifying Accounts
|
Balance at |
Charged to |
Deductions/ |
||||||||||
|
beginning |
costs and |
net charge- |
Balance at |
|||||||||
|
For the Years Ended December 31, 2014, 2013 and 2012 |
of year |
expenses |
offs (A) |
end of year |
||||||||
|
(dollars in thousands) |
||||||||||||
|
Allowance for doubtful accounts: |
||||||||||||
|
Year ended December 31, 2014 |
$ |
84 |
$ |
18 |
$ |
(85) |
$ |
17 | ||||
|
Year ended December 31, 2013 |
1,837 | 30 | (1,783) | 84 | ||||||||
|
Year ended December 31, 2012 |
1,952 | 4 | (119) | 1,837 | ||||||||
|
Valuation allowance for deferred income taxes: |
||||||||||||
|
Year ended December 31, 2014 |
$ |
986 |
$ |
596 |
$ |
- |
$ |
1,582 | ||||
|
Year ended December 31, 2013 |
- |
986 |
- |
986 | ||||||||
|
(A) |
Represents write-off of bad debts net of recoveries |
|
(B) |
40 |
3) Exhibits
|
|
|
|
|
|
EXHIBIT NUMBER |
DESCRIPTION |
||
|
3.1 |
Amended and Restated Certificate of Incorporation |
Incorporated herein by reference to Exhibit 3.1 to Registration No. 33-85310. |
|
|
3.2 |
Certificate of Amendment of Restated Certificate of Incorporation |
Incorporated herein by reference to Exhibit 3.1 to the Company’s Quarterly Report on Form 10-Q for the quarter ended June 30, 2013. |
|
|
|
|
|
|
|
3.3 |
Second Amended and Restated By-laws of the Company |
Incorporated herein by reference to Exhibit 3.1 to the Current Report on Form 8-K filed December 15, 2014. |
|
|
|
|
|
|
|
4.1 |
Specimen Copy of Stock Certificate for shares of Common Stock |
Incorporated herein by reference to Exhibit 4.1 to the Company’s Annual Report on Form 10-K for the year ended December 31, 1998. |
|
|
4.2 |
Form of Convertible Note, dated August 18, 2011 |
Incorporated herein by reference to Exhibit 4.1 to the Current Report on Form 8-K filed by Universal Stainless & Alloy Products, Inc. on August 18, 2011. |
|
|
|
|
|
|
|
10.1 |
Stockholders Agreement dated as of August 1, 1994, by and among the Company and its existing stockholders |
Incorporated herein by reference to Exhibit 10.1 to Registration No. 33-85310. |
|
|
10.2 |
Omnibus Incentive Plan |
Incorporated herein by reference to Appendix B of the Company’s Definitive Proxy Statement dated April 25, 2012.* |
|
|
|
|
|
|
|
10.3 |
Credit Agreement, dated as of August 18, 2011, by and among Universal Stainless & Alloy Products, Inc., the other borrowers party thereto, the guarantors party thereto, the lenders party thereto, PNC Bank National Association, as Administrative Agent, and PNC Capital Markets LLC, as Lead Arranger and Sole Bookrunner. |
Incorporated herein by reference to Exhibit 10.1 to the Current Report on Form 8-K filed by Universal Stainless & Alloy Products, Inc. on August 18, 2011. |
|
|
10.4 |
First Amendment to Credit Agreement, dated as of March 19, 2012, by an among Universal Stainless & Alloy Products, Inc., the other borrowers party thereto, the guarantors party thereto, the lenders party thereto, PNC Bank National Association, as Administrative Agent, and PNC Capital Markets LLC, as Administrative Agent. |
Incorporated herein by reference to Exhibit 10.1 to the Current Report on Form 8-K filed by Universal Stainless & Alloy Products, Inc. on March 23, 2012. |
|
|
|
|
|
|
|
10.5 |
Second Amendment to Credit Agreement, dated as of March 29, 2013, by an among Universal Stainless & Alloy Products, Inc., the other borrowers party thereto, the guarantors party thereto, the lenders party thereto, PNC Bank National Association, as Administrative Agent, and PNC Bank National Association, as Administrative Agent. |
Incorporated herein by reference to Exhibit 10.1 to the Current Report on Form 8-K filed by Universal Stainless & Alloy Products, Inc. on April 4, 2013. |
|
|
|
|
|
|
|
10.6 |
Third Amendment to Credit Agreement and First Amendment to Guaranty and Suretyship Agreement, dated as of November 7, 2013, by an among Universal Stainless & Alloy Products, Inc., the other borrowers party thereto, the guarantors party thereto, the lenders party thereto, PNC Bank National Association, as Administrative Agent, and PNC Bank National Association, as Administrative Agent. |
Incorporated herein by reference to Exhibit 10.1 to the Current Report on Form 8-K filed by Universal Stainless & Alloy Products, Inc. on November 12, 2013. |
|
|
|
|
|
|
41
|
10.7 |
Employment Agreement dated December 21, 2007 between the Company and Dennis M. Oates |
Incorporated herein by reference to Exhibit 10.7 to the Company’s Annual Report on Form 10-K for the year ended December 31, 2007.* |
|
|
10.8 |
Employment Agreement dated February 21, 2008 between the Company and Paul A. McGrath |
Incorporated herein by reference to Exhibit 10.4 to the Company’s Annual Report on Form 10-K for the year ended December 31, 2007.* |
|
|
10.9 |
Employment Agreement dated May 6, 2013 between the Company and Michael D. Bornak |
Incorporated herein by reference to Exhibit 10.1 to the Company’s Quarterly Report on Form 10-Q for the quarter ended June 30, 2013.* |
|
|
10.10 |
Employment Agreement dated April 21, 2008 between the Company and Christopher M. Zimmer |
Incorporated herein by reference to Exhibit 10.7 to the Company’s Annual Report on Form 10-K for the year ended December 31, 2010.* |
|
|
|
|
|
|
|
10.11 |
Form of notice of grant of restricted stock award. |
Incorporated herein by reference to Exhibit 10.1 to the Company’s Quarterly Report on Form 10-Q for the quarter ended September 30, 2012.* |
|
|
|
|
|
|
|
10.12 |
Form of non-statutory stock option agreement. |
Filed herewith.* |
|
|
|
|
|
|
|
10.13 |
Form of incentive stock option agreement. |
Filed herewith.* |
|
|
|
|
|
|
|
10.14 |
Form of non-statutory stock option agreement for eligible directors. |
Filed herewith.* |
|
|
|
|
|
|
|
21.1 |
Subsidiaries of Registrant |
Filed herewith. |
|
|
23.1 |
Consent of Schneider Downs & Co., Inc. |
Filed herewith. |
|
|
24.1 |
Powers of Attorney |
Included on the signature page herein. |
|
|
31.1 |
Certification of Chief Executive Officer pursuant to Rule 13a-14(a) and 15d-14(a), as adopted pursuant to Section 302 of the Sarbanes-Oxley Act of 2002 |
Filed herewith. |
|
|
31.2 |
Certification of Chief Financial Officer pursuant to Rule 13a-14(a) and 15d-14(a), as adopted pursuant to Section 302 of the Sarbanes-Oxley Act of 2002 |
Filed herewith. |
|
|
32.1 |
Certification of Chief Executive Officer and Chief Financial Officer pursuant to Rule 18 U.S.C. Section 1350, as adopted pursuant to Section 906 of the Sarbanes-Oxley Act of 2002 |
Filed herewith. |
|
|
|
|
|
|
|
101 |
The following financial information from this Annual Report on Form 10-K for the fiscal year ended December 31, 2014, formatted in XBRL (Extensible Business Reporting Language) and furnished electronically herewith: (i) the Consolidated Balance Sheets as of December 31, 2014 and 2013; (ii) the Consolidated Statements of Operations for the years ended December 31, 2014, 2013 and 2012; (iii) the Consolidated Statements of Cash Flows for the years ended December 31, 2014, 2013 and 2012; (iv) the Consolidated Statements of Shareholders’ Equity for the years ended December 31, 2014, 2013 and 2012; and (v) the Notes to Consolidated Financial Statements. |
Filed herewith. |
|
* - Reflects management contract or compensatory plan or arrangement to be filed as an exhibit pursuant to Item 15(b) of this Annual Report on Form 10-K.
42
SIGNATURES
Pursuant to the requirements of Section 13 or 15(d) of the Securities Exchange Act of 1934, the Registrant has duly caused this Report on Form 10-K to be signed on its behalf by the undersigned, thereunto duly authorized, on February 24, 2015.
|
|
|
|
UNIVERSAL STAINLESS & ALLOY PRODUCTS, INC. |
|
|
By: |
/s/ Dennis M. Oates
|
|
|
Dennis M. Oates |
|
|
Chairman, President and Chief Executive Officer |
POWER OF ATTORNEY
Each of the officers and directors of Universal Stainless & Alloy Products, Inc., whose signature appears below in so signing also makes, constitutes and appoints Dennis M. Oates and Paul A. McGrath, and each of them acting alone, his true and lawful attorney-in-fact, with full power of substitution, for him in any and all capacities, to execute and cause to be filed with the SEC any and all amendment or amendments to this Report on Form 10-K, with exhibits thereto and other documents connected therewith and to perform any acts necessary to be done in order to file such documents, and hereby ratifies and confirms all that said attorney-in-fact, or his substitute or substitutes, may do or cause to be done by virtue hereof.
Pursuant to the requirements of the Securities Exchange Act of 1934, this Report has been signed below by the following persons on behalf of the Registrant in the capacities and on the dates indicated.
|
SIGNATURE |
TITLE |
DATE |
||
|
/s/ Dennis M. Oates |
Chairman, President, Chief Executive Officer and |
February 24, 2015 |
||
|
Dennis M. Oates |
Director (Principal Executive Officer) |
|||
|
/s/ Michael D. Bornak |
Vice President of Finance, Chief Financial Officer and |
February 24, 2015 |
||
|
Michael D. Bornak |
Treasurer (Principal Financial and Accounting Officer) |
|||
|
/s/ Christopher L. Ayers |
Director |
February 24, 2015 |
||
|
Christopher L. Ayers |
||||
|
/s/ Douglas M. Dunn |
Director |
February 24, 2015 |
||
|
Douglas M. Dunn |
||||
|
/s/ M. David Kornblatt |
Director |
February 24, 2015 |
||
|
M. David Kornblatt |
||||
|
/s/ Udi Toledano |
Director |
February 24, 2015 |
||
|
Udi Toledano |
43