Attached files
| file | filename |
|---|---|
| EX-23.1 - EXHIBIT 23.1 - MEDICAL ACTION INDUSTRIES INC | exh_231.htm |
| EX-32.1 - EXHIBIT 32.1 - MEDICAL ACTION INDUSTRIES INC | exh_321.htm |
| EX-21.1 - EXHIBIT 21.1 - MEDICAL ACTION INDUSTRIES INC | exh_211.htm |
| EX-31.2 - EXHIBIT 31.2 - MEDICAL ACTION INDUSTRIES INC | exh_312.htm |
| EX-31.1 - EXHIBIT 31.1 - MEDICAL ACTION INDUSTRIES INC | exh_311.htm |
| EX-10.18 - EXHIBIT 10.18 - MEDICAL ACTION INDUSTRIES INC | exh_1018.htm |
| EX-23.2 - EXHIBIT 23.2 - MEDICAL ACTION INDUSTRIES INC | exh_232.htm |
UNITED STATES
SECURITIES AND EXCHANGE COMMISSION
|
Washington, D.C. 20549
|
|
FORM 10-K
|
(Mark one)
[X] ANNUAL REPORT PURSUANT TO SECTION 13 OR 15(d) OF THE SECURITIES EXCHANGE ACT OF 1934
For the fiscal year ended March 31, 2014
Or
[ ] TRANSITION REPORT PURSUANT TO SECTION 13 OR 15(d) OF THE SECURITIES EXCHANGE ACT OF 1934
For the transition period from to
|
Commission file number: 000-13251
|
MEDICAL ACTION INDUSTRIES INC.
|
(Exact name of registrant as specified in its charter)
|
|
Delaware
|
11-2421849
|
|
|
(State or other jurisdiction of
incorporation or organization)
|
(I.R.S. Employer
Identification No.)
|
|
|
500 Expressway Drive South, Brentwood, New York
|
11717
|
|
|
(Address of principal executive offices)
|
(Zip Code)
|
| Registrant’s telephone number, including area code: (631) 231-4600 |
Securities registered pursuant to Section 12(b) of the Act:
|
Title of each class
|
Name of each exchange on which registered
|
|
|
Common Stock ($0.001 par value)
|
The NASDAQ Global Select Stock Market
|
Securities registered pursuant to Section 12(g) of the Act:
| None |
Indicate by check mark if the registrant is a well-known seasoned issuer, as defined in Rule 405 of the Securities Act. Yes [ ] No [X]
Indicate by check mark if the registrant is not required to file reports pursuant to Section 13 or Section 15(d) of the Act. Yes [ ] No [X]
Indicate by check mark whether the registrant (1) has filed all reports required to be filed by Section 13 or 15(d) of the Securities Exchange Act of 1934 during the preceding 12 months (or for such shorter period that the registrant was required to file such reports), and (2) has been subject to such filing requirements for the past 90 days. Yes [X] No [ ]
Indicate by check mark whether the registrant has submitted electronically and posted on its corporate Website, if any, every Interactive Data File required to be submitted and posted pursuant to Rule 405 of Regulation S-T during the preceding 12 months (or for such shorter period that the registrant was required to submit and post such files). Yes [X] No [ ]
Indicate by check mark if disclosure of delinquent filers pursuant to Item 405 of Regulation S-K is not contained herein, and will not be contained, to the best of registrant’s knowledge, in definitive proxy or information statements incorporated by reference in Part III of this Form 10-K or any amendment to this Form 10-K. [X]
Indicate by check mark whether the registrant is a large accelerated filer, an accelerated filer, a non-accelerated filer, or a smaller reporting company. See the definitions of “large accelerated filer,” “accelerated filer” and “smaller reporting company” in Rule 12b-2 of the Exchange Act.
|
Large accelerated filer [ ]
|
Accelerated filer [X]
|
Non-accelerated filer [ ]
|
Smaller reporting company [ ]
|
|
(Do not check if a smaller
reporting company)
|
Indicate by check mark whether the registrant is a shell company (as defined in Rule 12b-2 of the Exchange Act). Yes [ ] No [X]
The aggregate market value of the registrant’s Common Stock held by non-affiliates of the registrant as of September 30, 2013, the last business day of the registrant’s most recently completed second fiscal quarter, was approximately $108,834,000, based on the $6.64 closing sale price of the Common Stock on such date. Shares of Common Stock held by each officer and director of the registrant and by each person who may otherwise be deemed to be an affiliate have been excluded.
As of June 13, 2014, 16,390,628 shares of the registrant’s Common Stock were outstanding.
DOCUMENTS INCORPORATED BY REFERENCE
Portions of the registrant’s definitive proxy statement for its 2014 Annual Meeting of Stockholders to be filed pursuant to Regulation 14A within 120 days following the registrant’s fiscal year ended March 31, 2014, are incorporated by reference into Part III of this Form 10-K.
TABLE OF CONTENTS
|
PART I
|
||
|
PART II
|
||
|
PART III
|
||
|
PART IV
|
||
i
CAUTIONARY STATEMENT REGARDING FORWARD-LOOKING STATEMENTS
Certain statements and information in this Annual Report on Form 10-K (this “Form 10-K”) may constitute “forward-looking statements” within the meaning of Section 27A of the Securities Act of 1933, as amended (the “Securities Act”), and Section 21E of the Securities Exchange Act of 1934, as amended (the “Exchange Act”). The words “believe,” “expect,” “anticipate,” “plan,” “intend,” “foresee,” “should,” “would,” “could” or other similar expressions are intended to identify forward-looking statements, which are generally not historical in nature. These forward-looking statements are based on our current expectations and beliefs concerning future developments and their potential effect on us. While management believes that these forward-looking statements are reasonable as and when made, there can be no assurance that future developments affecting us will be those that we anticipate. All comments concerning our expectations for future revenues and operating results are based on our forecasts for our existing operations and do not include the potential impact of any future acquisitions. Our forward-looking statements involve significant risks and uncertainties (some of which are beyond our control) and assumptions that could cause actual results to differ materially from our historical experience and our present expectations or projections. Known material factors that could cause our actual results to differ from those in the forward-looking statements are those described in Item 1A, “Risk Factors.”
Readers are cautioned not to place undue reliance on forward-looking statements, which speak only as of the date hereof. We undertake no obligation to publicly update or revise any forward-looking statements after the date they are made, whether as a result of new information, future events or otherwise.
All amounts presented in this Form 10-K are in thousands, except per share data.
1
PART I
Company Background
Medical Action Industries Inc. (“Medical Action,” “we,” “us” or “our”) develops, manufactures, markets and supplies a variety of disposable medical products. Our products can be found in almost every hospital in the U.S. We operate as one business segment, which is the manufacture and supply of disposable medical products. Our products are marketed primarily to acute care facilities throughout the U.S and certain international markets by our direct sales personnel and an extensive network of health care distributors. We have entered into preferred vendor agreements with national and regional distributors, as well as sole and multi-source agreements with group purchasing organizations. We also offer original equipment manufacturer (“OEM”) products under private label programs to supply chain partners and medical suppliers. Our manufacturing, packaging and warehousing activities are conducted at our facilities located in Arden, North Carolina and Toano, Virginia. Our procurement of certain products and raw materials from the People’s Republic of China is administered by our office in Shanghai, China. During fiscal 2014, we also conducted manufacturing, packaging, and warehousing activities at our Clarksburg, West Virginia and Gallaway, Tennessee facilities. These facilities were part of the assets sold in the Patient Care business unit divestiture completed on June 2, 2014 as more fully described in “General” below.
Headquartered in Brentwood, New York, Medical Action was incorporated in New York in 1977, and was reincorporated in Delaware in 1987.
General
Our business strategy includes (1) increasing market share with our current customers and entering new markets with our existing product lines; (2) accelerating the internal development of new products for our existing markets; (3) pursuing acquisitions that complement our existing product lines; (4) introducing products into the international marketplace; and (5) increasing productivity by maximizing the utilization of our existing facilities.
Since 1994, we have engaged in an active acquisition program and completed 11 transactions. Our most recent significant acquisitions include:
AVID Medical, Inc. (“AVID”). We completed this acquisition in August 2010 for $62,500 in cash. AVID assembles custom procedure trays, principally for use in acute care facilities and surgi-centers in an 185,000 square foot facility located in Toano, Virginia. We believe the domestic market for custom procedure trays to be approximately $2.0 billion.
`Medegen Medical Products, LLC (“Medegen”). We completed this acquisition in October 2006 for $80,500 in cash. Medegen manufactures and supplies a line of patient bedside utensils, operating room products, laboratory products and urology products from a 265,000 square foot facility located in Gallaway, Tennessee. We believe that Medegen has a market leading position in each of its product line offerings.
On June 2, 2014 we completed the sale to Medira Inc., a Delaware corporation and an affiliate of Inteplast Group, Ltd., of (i) 100% of the membership units of Medegen, and (ii) certain assets of our Patient Care business unit, including the containment business assets, collectively, for approximately $78,628 in cash, subject to customary post –closing adjustments (the “Transaction”).
The products divested in the Transaction are essentially those associated with our Patient Care market. The majority of these products are produced in our Clarksburg, West Virginia and Gallaway, Tennessee facilities. These facilities were included in the assets sold in the Transaction. The assets and liabilities associated with the Transaction are presented as “held for sale” on our balance sheet as of March 31, 2014. In addition, all of the operational results related to the Transaction have been reflected within the “income from discontinued operations, net of income taxes” line on our statement of operations for the periods presented in our consolidated financial statements. Because the Transaction was completed subsequent to March 31, 2014, references to the Patient Care market, the respective product categories included therein and certain other information has been included for historical purposes.
2
Products and Competition
Our products are divided into two principal markets: (1) clinical care and (2) patient care. Each market is comprised of several key product categories as described in more detail below. The end users for our products are acute care hospitals and Integrated Delivery Networks (“IDNs”), free standing surgery centers, government hospitals and medical treatment centers, organ and tissue procurement agencies, physician offices, dental offices, veterinary offices, outpatient surgery centers, long-term care facilities and laboratories.
The markets for our product lines are highly competitive. In general, our products compete with the products of numerous major companies in the business of developing, manufacturing, distributing and marketing disposable medical products. The competitors differ based upon the products being sold as described in more detail below. Some of these competitors have greater financial or other resources than our company. We believe that the principal competitive factors in each of our markets are (1) product design, development and improvement; (2) customer support; (3) brand loyalty; and (4) price. We emphasize overall value through a combination of competitive pricing, product quality and customer service.
Clinical Care Market
Custom Procedure Trays. As the third largest supplier of custom procedure trays in the industry (based on number of units sold), we have the ability to manufacture an unlimited array of trays for clinical care use, such as custom anesthesia and wound care trays, cardiac, gynecologic, lap gastric, orthopedic, tissue procurement, transplant, trauma and urology trays, which are utilized in all areas of a hospital. In addition, we are an innovator in the manufacture of robotic procedure trays, which include a proprietary custom robotics patient drape. The principal competitors for these products are Cardinal Health, Inc. and Medline Industries, Inc.
Minor Procedure Kits and Trays. We offer one-time use kits and trays that are used for a wide variety of minor surgical and medical procedures. Kit components are determined by the procedural requirements and may be customized to accommodate individual hospital protocols and preferences. Our larger kit segments include: (1) I.V. start kits (comprised of a tourniquet, antiseptic ampule or swab, gauze, surgical tape, and a dressing); (2) central line dressing trays (comprised of antiseptic ampule or swabs, gloves, gauze tape and a transparent dressing) that are currently marketed under the ActaSept™ and Cepti-Seal® brands; (3) suture removal trays (comprised of Littauer scissors, alcohol prep pads, and metal or plastic forceps); (4) laceration trays (comprised of disposable instruments including needle drivers, forceps, scissors and hemostats, as well as drapes for creation of a sterile field, gauze and syringes and needles for administration of a local anesthetic; and (5) instruments and instrument trays (including disposable needle holders, hemostats, various procedural scissors, scalpels and forceps). The principal competitors for these products are Cardinal Health, Inc., Becton, Dickinson and Company, Medline Industries, Inc. and Covidien Industries, Inc.
Operating Room Disposables and Sterilization Products. These products include: (1) disposable operating room towels; (2) surgical marking pens; (3) needle counters; (4) disposable surgical light handle covers that are currently marketed under the Light Shields TM brand; and (5) convenience kits, which are kits packaged with multiple products individualized to a hospital's requirements. The principal competitors for these products are Cardinal Health, Inc., Covidien Industries, Inc., Medline Industries, Inc. and DeRoyal, Inc.
Dressings and Surgical Sponges. These products include: (1) burn dressings; (2) disposable laparotomy sponges; (3) specialty surgical sponges, which are an extension of our laparotomy sponge product line where design of these sponges is tailored to specific surgical applications; (4) gauze sponges; (5) sponge counter bags; and (6) net, padding and wound care products that include our proprietary Tubegauz® premium brand and SePro® value brand. The principal competitors for these products are Cardinal Health, Inc., Covidien Industries, Inc. and Medline Industries, Inc.
Patient Care Market
Patient Bedside Products. These products include wash basins; bedpans; pitchers and carafes; urinals; emesis basins; surgical headwear and shoe covers; isolation gowns; sterilization pouches; sterilization monitoring products; and patient aids used to assist mobility such as crutches, walkers, canes and skid resistant patient slippers. The principal competitors for these products are Medline Industries, Inc. and Betras Plastics.
Containment Systems for Medical Waste. These products include bio hazardous waste containment and autoclave bags, non-infectious medical waste containment bags, chemotherapy waste containment bags, laundry and linen containment systems and disposable bags, laboratory specimen transport bags, patient belonging bags, sharps containment systems and equipment dust covers. The principal competitors for these products are Mabis, DMI Healthcare, Minigrip, Inc., Heritage Bag Company, Pitt Plastics, Medline Industries, Inc. and Tri-State Hospital Supply.
Laboratory Products. These products include petri dishes, specimen containers, commode specimen containers, triangular graduates and tri-pour beakers. The principal competitors for these products are Cardinal Health, Inc., Covidien Industries, Inc., Becton, Dickinson and Company, Kord Products Inc. and Parter Medical Products, Inc.
3
Sales and Marketing
Our products are presently marketed and sold in the U.S. through a network of direct sales personnel. Moreover, we provide and sell products to international markets via independent in-country distribution networks, supported by our operations in the U.S., Brazil and China. As of June 13, 2014 we employed approximately 95 sales and marketing personnel throughout the U.S. These individuals are focused on providing value added products and services to our customers and presenting a comprehensive presence in the market, which we believe will drive organic growth.
In addition to the field sales personnel focused on the acute care market, we have senior sales and marketing professionals that are focused on group purchasing organizations (“GPOs”) and IDNs, as well as government sales and national and regional distributors. We contract with GPOs and IDNs and have promoted unit sales growth by offering volume discounts to acute care facilities within a specified group. Generally, we are designated as a sole source or as one of several preferred purchasing sources for specified products within these buying groups, although members of GPOs and IDNs are not obligated to purchase our products. Contracts with GPOs and IDNs typically have no minimum purchase requirements and generally have a term of one to three years with extensions as warranted and can be terminated on 90 days’ advance notice. By contracting with a GPO or IDN, we believe that we can operate our sales force more efficiently. As a result, our sales force continues to call on facilities associated with these buying groups in order to improve compliance with these group purchasing agreements and grow our market share. A majority of acute care facilities in the U.S. belong to at least one GPO. In fiscal 2014, individual acute care facility orders purchased through contractual arrangements with our three largest GPOs, Novation, Premier and MedAssets, accounted for approximately 55% of our total net sales.
We believe that we have established an efficient system for marketing our products throughout the U.S. as well as internationally, and intend to utilize these existing sales methods and channels to market new products as they are developed or acquired. During the fiscal years ended 2014, 2013 and 2012 international sales approximated 2% of our total net sales and the net book value of our long-lived assets held outside of the United States were immaterial at March 31, 2014 and 2013.
Distribution
Our distribution network is comprised of hospital, alternate care, physician, veterinary, dental and industrial safety distributors covering the entire U.S. and certain international marketplaces, namely Canada. Our products are typically purchased pursuant to purchase orders or supply agreements in which the purchaser specifies whether such products are to be supplied through a distributor or directly by us. We record sales upon the shipment of inventory to the distributor, at which time title passes to the distributor.
Sales to Owens & Minor, Inc. and Cardinal Health Inc., diversified distribution companies (collectively, the “Distributors”), accounted for approximately 45% and 19% of total net sales, respectively, for fiscal 2014, 41% and 22% of total net sales, respectively, for fiscal 2013, 44% and 22% of total net sales, respectively, for fiscal 2012. Although the Distributors may be deemed, in a technical sense, to be major purchasers of our products, they only serve as a distributor between the end user and our company, and do not make significant purchases for their own account. For purposes of evaluating customer concentration, we do not include the Distributors but rather look to the purchases by our end users. No other individual customer or affiliated group of customer accounts accounted for more than 5% of our net sales in any of the past three fiscal years.
Backlog
We do not believe that our backlog figures are necessarily indicative of our business since most hospitals and health related facilities order their products on a continuous basis and not pursuant to any contractual arrangements. Since typical shipment times range from two to five days, we must maintain sufficient inventories of all our products at all times.
Raw Materials and Manufacturing
The principal raw materials used in our products are a four-ply mesh gauze laparotomy sponge, cotton huck towel, paper, non-woven material, and various types of plastic resin. Other materials and supplies used include gauze, gauze sponges, injection molded and thermoformed plastics, medical instruments, various types of antiseptics and wound dressings, aluminum, foam, medical grade magnets and a variety of packaging material. Several of these raw materials are supplied from vendors outside the U.S.
4
We believe that the variety of suppliers for raw materials and components necessary for the manufacture of our products, as well as our long term relationships with such suppliers, helps to ensure stability in our manufacturing process. Historically, we have not been materially affected by interruptions with such suppliers. However, if a supplier of significant raw materials, component parts, finished goods or services were to terminate its relationship with us, or otherwise cease supplying raw materials, component parts, finished goods or services consistent with past practices, our ability to meet the obligations to our customers may be disrupted. A disruption with respect to numerous products, or with respect to a few significant products, could have a material adverse effect on our business and financial condition. During the past few years, the cost of resin, the principal raw material in the manufacture of our plastic products, has been volatile and has significantly impacted our financial results. For additional information, see “Risks Related to Our Business” in Item 1A, “Risk Factors”.
We purchase our principal cotton raw materials primarily from the People’s Republic of China. We are currently sourcing instruments from Pakistan and the People’s Republic of China, a portion of our thermoform plastics from Taiwan, our packaging paper material from France, our water soluble bags from the United Kingdom and our needle counters from the People’s Republic of China. From time to time, we have purchased certain of our raw materials from a number of other countries, including Mexico, Vietnam and the Dominican Republic. Some of our products are purchased as components or in final form, which are shipped to our manufacturing facilities in Arden, North Carolina, and Toano, Virginia, where they are packaged.
Our sterilization pouches and minor procedure kits and trays are predominantly manufactured and/or assembled in our Arden, North Carolina manufacturing facility. Our custom procedure trays are predominantly manufactured and/or assembled in our Toano, Virginia manufacturing facility. In our Clarksburg, West Virginia facility, we manufacture our containment systems for medical waste. Our Gallaway, Tennessee facility primarily manufactures and/or distributes disposable plastic patient utensils, as well as other collection, measuring and containment products. In addition, our Gallaway, Tennessee facility purchases contract manufactured or private labeled finished products for distribution to our customers. These products include stainless and reusable plastic containers and utensils manufactured domestically, as well as various measuring and collection products procured from the People’s Republic of China.
We utilize outside contract sterilization facilities for certain of our products.
Patents and Trademarks
We own several patents and trademarks. While we consider that, in the aggregate, the patents and trademarks are important in the operation of our business, we do not consider any of them, or any group of them, to be of such importance that the loss of any patent or trademark would materially affect our business. We actively pursue a policy of seeking patent protection, both in the U.S. and abroad, for our proprietary technology. There can be no assurance that our patents will not be violated or that any issued patents will provide protection that has commercial significance.
We also rely on trade secrets and product advancement to maintain our competitive position. There can be no assurance that we will prevent the unauthorized disclosure or use of our trade secrets and know-how or that others may not independently develop similar trade secrets or know-how.
For additional information, see “Our business is dependent on our intellectual property. If our intellectual property rights cannot be enforced or our trade secrets become known to our competitors, our ability to compete may be adversely affected” in Item 1A, “Risk Factors”.
Research and Development
We are continually conducting research and developing new products utilizing a team approach that involves our engineering, manufacturing and marketing resources. Although we have developed a number of our own products, most of our research and development efforts have historically been directed towards product improvement and enhancements of previously developed or acquired products. Product development expenses were approximately $1,171, $1,862, and $1,921 for fiscal 2014, 2013 and 2012, respectively.
Health Care Reform
In recent years, several comprehensive health care reform proposals were introduced in the U.S. Congress. The intent of the proposals was, generally, to expand health care coverage for the uninsured and reduce the growth of health care expenditures. In March 2010, Congress passed and President Obama signed into law the Patient Protection and Affordable Care Act and related Reconciliation Bill, which includes a variety of healthcare reform provisions and requirements that will become effective at varying times through 2018. This healthcare reform legislation includes, among other things, provisions for expanded Medicaid eligibility and access to healthcare insurance as well as increased taxes and fees on certain corporations and medical products. The uncertainties surrounding the components of this legislation and the impact of its implementation on the healthcare industry may have an adverse effect on both customer purchasing, supplier product prices and terms of sale.
5
Among the provisions that have had an adverse impact on our business is an excise tax that is imposed on medical device manufacturers for the sale of certain medical devices occurring after December 31, 2012. The excise tax is an amount equal to 2.3% of the price for which we sell certain medical devices. The IRS has issued guidance on the implementation of the tax that included, among many provisions, an exemption on certain domestically produced “convenience kits,” which represents the majority of our exposure to the excise tax. The medical excise tax amounted to $383 and $109 during fiscal 2014 and 2013, respectively.
Regulation
As a manufacturer of medical devices, we are subject to regulation by numerous regulatory bodies, both in the U.S. and abroad. In the U.S., the federal agencies that regulate our products and operations include: the U.S. Food and Drug Administration (“FDA”), the Environmental Protection Agency, the Occupational Health & Safety Administration and others. Additionally, because our customers are typically reimbursed under governmental health programs such as Medicare and Medicaid, we are also subject to regulation by the Department of Health and Human Services. At the state level, our operations and products are also subject to regulation by various state agencies. Outside the U.S., we are subject to regulation by agencies of foreign countries in which we sell our products. These agencies require manufacturers of medical devices to comply with applicable laws and regulations governing the introduction, development, testing, manufacturing, labeling, advertising, marketing, distribution, sale and use of medical devices. Such requirements include complaint handling and post marketing reporting, including adverse event reports and field actions due to quality concerns. Additionally, as a participant in the heavily-regulated health care industry, although our products and operations are not always directly regulated by certain health care laws and regulations, we may still be affected indirectly to the extent our customers are subject to such requirements.
All medical devices are required to be registered with the FDA. We must update our establishment and listing information on an annual basis and must comply with the FDA’s Good Manufacturing Practices under the Quality System Regulation (GMP/QSR). These regulations require that we manufacture our products and maintain records in a prescribed manner with respect to manufacturing, testing and control activities. Our manufacturing, quality control and quality assurance procedures and documents are inspected and evaluated periodically by the FDA.
Unless exempt for low risk products, new medical device products, as well as modifications to existing products, require FDA pre-market approval. The Federal Food, Drug and Cosmetic Act (“FDC Act”) provides that new “510(k)” clearances are required when, among other things, there is a major change or modification in the intended use of the device or a change or modification to a legally marketed device that could significantly affect its safety or effectiveness. A manufacturer is expected to make the initial determination as to whether a proposed change to a cleared device or to its intended use is of a kind that would necessitate the filing of a new “510(k)” notification.
The European Union has promulgated rules, under the Medical Devices Directive (“MDD”), which require medical devices to bear the “CE mark.” The CE mark is an international symbol of adherence to quality assurance standards. We received EN ISO 13485:2003 certification for our Arden, North Carolina manufacturing facility and have instituted all the systems we believe to be necessary to meet the MDD, thus acquiring the ability to affix the CE mark to the applicable products. Along with the ISO 13485, we have received the Canadian CMDCAS quality system certification. The ISO and CMDCAS quality systems are audited annually at our Arden, North Carolina manufacturing facility by a registered, approved (by the European Union and Canadian Government) notified body.
Our failure to comply with applicable laws or regulations could result in disciplinary, corrective or punitive measures imposed by regulatory bodies in the form of warnings, civil sanctions, criminal sanctions, recalls or seizures, injunctions, withdrawal of approvals, or restrictions on operations. However, we believe that any failure to comply with applicable laws or regulations will not have a material adverse effect on our financial condition.
Employees
As of June 13, 2014, we had approximately 815 full-time employees with approximately 558 in manufacturing and distribution, approximately 95 in marketing and sales, and approximately 162 in general and manufacturing administration. None of our employees are represented by a labor union. We believe that our employee relations are good.
6
Summary of New Reporting Requirements
The ITRSHRA requires a public reporting company to disclose such activities by themselves or their control affiliates (including parent companies) in their annual and quarterly SEC reports.
These new disclosures will first be required in Forms 10-K and 10-Q due after February 6, 2013 (whether or not filed on or before that date), which would cover activities during the fourth calendar quarter of 2012. The company will need to disclose each activity in which it or any of its affiliates was knowingly engaged during the period covered by the report, if such activity is sanctioned under:
|
·
|
Sections 5(a) or (b) of the Iran Sanctions Act of 1996, which impose sanctions on investments and other transactions that directly or indirectly enhance:
|
|
o
|
the development of the petroleum resources of Iran;
|
|
o
|
the production of refined petroleum products in Iran;
|
|
o
|
the exportation of refined petroleum products to Iran; or
|
|
o
|
the ability of Iran to develop weapons of mass destruction or other military capabilities; or
|
|
·
|
Sections 104(c)(2) or (d)(1) or Section 105A(b)(2) of the Comprehensive Iran Sanctions, Accountability, and Divestment Act of 2010, which prohibit activities (including by financial institutions) that:
|
|
o
|
facilitate efforts by various parties to acquire or develop weapons of mass destruction or support terrorism;
|
|
o
|
facilitate the activities of certain persons subject to sanctions by the United Nations Security Council; or
|
|
o
|
benefit Iran’s Revolutionary Guard Corps or other persons whose assets have been blocked by the United States.
|
A reporting company must also disclose any transaction or dealing that it or one of its affiliates knowingly engaged in with:
|
·
|
any person whose property is blocked under Executive Order No. 13224 — persons who commit, threaten to commit or support terrorism;
|
|
·
|
any person whose property is blocked under Executive Order No. 13382 — proliferators of mass destruction and their supporters; or
|
|
·
|
the Government of Iran or any entity owned or controlled by, or acting on behalf of, the Government, without specific authorization to do so from the U.S. government.
|
Disclosure of any of these activities must include a detailed description of (i) the nature and extent of the activity, (ii) the gross revenues and net profits, if any, attributable to the activity, and (iii) whether the reporting company or its affiliate intends to continue the activity.
We would also need to file a separate notice with the SEC regarding the reportable activity. The SEC is required to post this notice on its website and transmit the relevant report to the President and certain Congressional committees. Upon receipt of such report, the President is required to initiate an investigation into the possible imposition of sanctions against the reporting company or its affiliate.
7
Available Information
We file annual, quarterly and current reports and other information with the Securities and Exchange Commission (the “SEC”). These materials can be inspected and copied at the SEC’s Public Reference Room at 100 F Street, NE, Washington, D.C. 20549. Copies of these materials may also be obtained by mail at prescribed rates from the SEC’s Public Reference Room at the above address. Information about the Public Reference Room can be obtained by calling the SEC at 1-800-SEC-0330. The SEC also maintains an Internet site that contains reports, proxy and information statements, and other information regarding issuers that file electronically with the SEC. The address of the SEC’s Internet site is http://www.sec.gov.
We make available, free of charge, on our Internet website, located at http://www.medical-action.com, our most recent Annual Report on Form 10-K, Quarterly Reports on Form 10-Q, any Current Reports on Form 8-K filed since our most recent Annual Report on Form 10-K and any amendments to such reports filed or furnished pursuant to Section 13(a) or 15(d) of the Exchange Act as soon as reasonably practicable following the electronic filing or furnishing of such report with the SEC. The information contained on or connected to our website is not part of this Form 10-K.
Our business, operations and financial condition are subject to certain risks and uncertainties, including the risks discussed below. Should one or more of these risks or uncertainties materialize, or should any underlying assumptions prove incorrect, our actual financial results will vary, and may vary materially from those anticipated, estimated, projected or expected. These risk factors do not necessarily appear in the order of importance.
Risks Related to Our Business
Interruptions in the supply of cotton or significant price volatility of the raw materials used to make cotton may result in increased costs that we may be unable to pass on to our customers, which could reduce our profitability.
The principal fabrics used in many of our products are made from cotton and cotton-synthetic blends. The prices we pay for these fabrics are dependent on the market prices for the raw materials used to produce them, primarily cotton. These raw materials are subject to price volatility caused by weather, supply conditions, government regulations, energy costs, economic climate and other unpredictable factors. Fluctuations in the price, availability and quality of the fabrics used to manufacture our products could have a material adverse effect on our cost of sales or our ability to meet our customers’ demands. In addition, if raw materials become unavailable within a geographic area from which they are now sourced, then we may not be able to obtain suitable or cost effective substitutes. Any interruption in the supply of raw materials could increase our costs or decrease our revenues, which could reduce our cash flow.
We have not historically managed, and do not currently intend to manage, cotton and other commodity price exposures by utilizing derivative instruments. While we attempt to match cost increases with corresponding product price increases, we are not always able to raise product prices immediately or at all. Timing differences between raw material prices, which may change daily, have had (and may continue to have) a negative effect on our cash flow. Any cost increase that we are not able to pass on to our customers could have a material adverse effect on our business, results of operations, financial condition and liquidity.
Due to the international scope of our business activities, our results of operations are subject to additional risk, including higher cost structures, higher credit risk, fluctuations in currency exchange rates, legal restrictions and taxes.
For the year ended March 31, 2014, international sales accounted for approximately 2% of our total net sales. The majority of products sold internationally are exported from the U.S. and China. Our international operations are subject to a number of risks inherent to any business operating in foreign countries, and especially those with emerging markets. As we continue to increase our presence in such countries, our operations will encounter the following risks, among others: trade barriers, tariffs, exchange controls, national and regional labor strikes, social and political risks, general economic risks and required compliance with a variety of U.S. and foreign laws, including tax laws, the Foreign Corrupt Practices Act (and foreign equivalents), and export controls. In addition, although we maintain an anti-corruption compliance program throughout our company, violations of our compliance program may result in criminal or civil sanctions, including material monetary fines, penalties and other costs against us or our employees, and may have a material adverse effect on our business. Furthermore, in foreign jurisdictions where process of law may vary from country to country, we may experience difficulty in enforcing agreements. In jurisdictions where bankruptcy laws and practices may vary, we may experience difficulty collecting foreign receivables through foreign legal systems. The occurrence of these risks, among others, could disrupt our business.
Our principal competitors in international markets are a number of much larger companies as well as smaller companies already established in the countries into which we sell or intend to sell our products. Our cost structure is often higher than that of our competitors because of the relatively high cost of transporting product to the local market as well as our competitors’ lower local labor costs in some markets. There is no certainty that we will be able to open local manufacturing facilities, procure products from other suppliers or operate our international sales activities productively.
8
In addition, our international sales are subject to higher credit risks than sales in the U.S. Many of our international distributors are small and may not be well capitalized. Our prices to our international distributors for products shipped to the customers from the U.S. or China are denominated in U.S. dollars, but their resale prices are set in their local currency. A decline in the value of the local currency in relation to the U.S. dollar may adversely affect their ability to profitably sell in their market the products they buy from us, and may adversely affect their ability to make payment to us for the products they purchase. Legal recourse for non-payment of indebtedness may be uncertain. These factors all contribute to a potential for credit losses.
Our procurement of certain products and raw materials from the People’s Republic of China is subject to special risks that could have a material adverse effect on our operations.
A significant portion of our raw materials and finished goods are purchased from manufacturers in China. As a result, our international procurement operations are subject to the risks associated with such activities including, among other things: economic and labor conditions, international trade regulations (including tariffs and anti-dumping penalties), war, international terrorism, civil disobedience, natural disasters, political instability, governmental activities and deprivation of contract and property rights. In particular, since 1978, the Chinese government has been reforming its economic systems, and we expect such reforms to continue. Although we believe that these reforms have had a positive effect on the economic development of China and have improved our ability to successfully utilize facilities in China, we cannot be assured that these reforms will continue or that the Chinese government will not take actions that impair operations in China.
The Chinese government has cut the tax credits that exporters get on more than 2,200 products, including many of our products that are manufactured in China. These tax credits were adopted more than 20 years ago to provide Chinese companies with tax breaks on revenues derived from exports. The cut in tax credits, together with a tight labor market, will cause the price of many items that are sourced in China to increase, which could adversely impact our cost of goods sold and profitability, to the extent we are unable to pass along these price increases to our customers.
Beginning in fiscal 2006, the Chinese government began to re-value the Chinese Yuan against other currencies, including the U.S. dollar. This re-valuation or free floating exchange rate has caused the price of many items that are sourced from China to increase, which could adversely impact our cost of goods sold and profitability.
In addition, the U.S. government in May 2005 exercised a quota on any textile products from China in Category 632 of the Harmonized Tariff Schedule, which included our patient slippers. Beginning on January 1, 2009, the quota on textile products from Chinese category 632 expired. While we have been able to procure a similar product with a different country of origin, the procurement has been at higher costs than we were previously obtaining. An interruption in supply and higher costs could have an adverse effect on our financial results.
The high level of competition in our industry places pressure on our gross profit and we may not be able to compete successfully.
The disposable medical device segment of the health care industry in which we operate is highly competitive and is experiencing both horizontal and vertical consolidation. All of the products we sell are available from sources other than us. We believe that our ability to compete depends upon continued product innovation, the quality, convenience and reliability of our products, access to distribution channels and pricing. In addition, our ability to compete effectively depends on our ability to differentiate our products based on safety features, product quality, cost effectiveness, ease of use and convenience, as well as our ability to identify and respond to changing customer needs. We encounter significant competition in our markets both from large established medical device manufacturers and from smaller companies. Many of these firms have introduced competitive products with proprietary features not provided by the conventional products and methods they are intended to replace. Most of our current and prospective competitors have economic and other resources substantially greater than ours and are well established as suppliers to the healthcare industry. There is no assurance that our competitors will not substantially increase resources devoted to the development, manufacture and marketing of products competitive with our products. The successful implementation of such a strategy by one or more of our competitors could materially and adversely affect our profitability.
Sales to Owens & Minor, Inc. and Cardinal Health Inc. (collectively, the “Distributors”) accounted for approximately 64%, 63%, and 66% of net sales in fiscal 2014, 2013, and 2012, respectively. Although the Distributors may be deemed in a technical sense to be major purchasers of our products, they serve, however, as a distributor under a purchase order or supply agreement between the customer and our company, and do not make significant purchases for their own account. In some cases, however, the Distributors compete with us on a private label basis, and if successful, sales of certain of our products could decline which may result in a material adverse effect on our business, results of operations and financial condition.
Health care reform and the related pressure to contain costs has led to the expansion of group purchasing organizations in the U.S. These group purchasing organizations enter into preferred supplier arrangements with one or more manufacturers of medical products in return for price discounts to members of the group purchasing organizations. If we are not able to obtain new preferred supplier commitments from major group purchasing organizations or retain those commitments that we currently have, which are generally terminable by either party for any reason upon the expiration of a defined notice period, our sales and profitability could be adversely affected. Even if we are able to obtain and retain preferred supplier commitments from group purchasing organizations, they may not deliver high levels of compliance by their members, in which case, we may not be able to offset the negative impact of lower per-unit prices or lower gross profit with increases in unit sales or in market share.
9
Our products may be subject to recall or product liability claims, which could expose us to material losses.
Our products expose us to an inherent risk of product liability. Our products are used in connection with surgical procedures and in other medical contexts in which it is important that those products function with precision and accuracy. If our products do not function as designed, or are designed improperly, we may be forced by regulatory agencies to withdraw such products from the market. In addition, if medical personnel or their patients suffer injury as a result of any failure of our products to function as designed, or an inappropriate design, we may be subject to lawsuits seeking significant compensatory and punitive damages. Costs of the defense of such litigation, even if successful, could be substantial. While we maintain insurance against product liability and defense costs in amounts believed to be reasonable, there is no assurance that we will successfully defend claims, if any, arising with respect to products or that the insurance we carry will be sufficient. A successful claim against us in excess of insurance coverage could materially and adversely affect us. Further, there is no assurance that product liability insurance will continue to be available to us on acceptable terms.
Termination or interruption of relationships with our suppliers, or failure of our suppliers to perform, could disrupt our business and could have a material adverse effect on our business and financial condition.
Although most raw materials essential to our business are generally available from multiple sources, we currently obtain certain key components, including resin, from limited sources. If a supplier of significant raw materials including component parts, finished goods or services were to terminate its relationship with us, or otherwise cease supplying raw materials, component parts, finished goods or services consistent with past practices, our ability to meet our obligations to our customers may be disrupted. A disruption with respect to numerous products, or with respect to a few significant products, could have a material adverse effect on our business and financial condition.
Our success depends largely on our ability to attract and retain key personnel.
Much of the future success of our company depends on the continued service and availability of skilled personnel, including members of our executive management team and certain key employees in manufacturing, marketing, finance, and information technology. We have historically relied on our ability to grant stock options as one mechanism for recruiting and retaining this highly skilled talent. Accounting regulations requiring the expensing of stock options may impair our future ability to provide these incentives without incurring significant compensation costs. There can be no assurance that we will continue to successfully attract and retain key personnel.
Risks associated with our information technology systems could adversely affect our future operating results.
We rely on information technology systems across our operations, including for management, supply chain and financial information and various other processes and transactions. Our ability to effectively manage our business depends on the security, reliability and capacity of these systems. Information technology system failures, network disruptions or breaches of security could disrupt our operations, causing delays or cancellation of customer orders or impeding the manufacture or shipment of products, processing of transactions or reporting of financial results. An attack or other problem with our systems, or those of our third party providers, could also result in the disclosure of proprietary information about our business or confidential information concerning our customers or employees. The occurrence of some or all of these events could result in significant damage to our reputation and possible regulatory sanctions or penalties. While our management has taken steps to address these concerns by implementing internal control measures and certain system redundancy or recovery plans, there can be no assurance that a system failure or data security breach will not have a material adverse effect on our results of operations.
If a natural or man-made disaster strikes our manufacturing facilities, we may be unable to manufacture our products for a substantial amount of time, which may adversely affect our expected results of operations.
We principally rely on our manufacturing facilities in Arden, North Carolina and Toano, Virginia. These facilities may be affected by natural or man-made disasters. These facilities and the manufacturing equipment we use to produce our products would be difficult to replace and could require substantial time to repair or replace. In the event one of our facilities was affected by a disaster, we would be forced to rely on third-party manufacturers, which may not be available or may be unable to produce our products on the schedule or to the specifications that we require. While we maintain business recovery plans that are intended to allow us to recover from natural disasters or other events that could disrupt our business, we cannot provide assurances that our plans would fully protect us from all such disasters. In addition, our insurance may not adequately compensate us from any losses incurred as a result of natural or other disasters. Furthermore, in areas prone to frequent natural or other disasters, insurance may become increasingly expensive or not available at all.
10
We are dependent on manufacturing and logistic services provided by third-parties and, if these providers are unwilling or unable to provide such services, we would need to locate alternative service providers or our operations could be significantly impaired.
Many of our products are manufactured in whole or part by third-party manufacturers, which are located throughout the U.S. and other parts of the world. In addition, we depend on third-party transportation companies to deliver supplies necessary to manufacture our products from vendors to our various facilities and to move our products to customers within and outside the U.S. While outsourcing arrangements for the manufacturing and transportation of our products may lower the fixed cost of our operations, these arrangements can reduce our direct control of the production and distribution of our products. It is uncertain what affect such diminished control will have on the quality or quantity of the products manufactured, or the flexibility of our company to respond to changing market conditions. Further, our operations have been, and will continue to be, dependent upon our ability to obtain favorable terms from third-party manufacturers. A change in terms by a significant manufacturer could have a material adverse effect on our results of operations. Any significant interruption in the availability of these third-party services on commercially acceptable terms, defects in the products manufactured, quality-related matters or disruption in the transportation of our products could materially adversely affect our ability to meet customer demands or our operations generally.
If we are unable to execute our cost reduction plans successfully, our total operating costs may be greater than expected, which may adversely affect our profitability.
We have commenced a number of actions to improve our earnings profile. We are in the process of implementing these programs and have realized a portion of the anticipated benefits. While we continue to search for opportunities to reduce our costs and expenses to improve operating profitability without jeopardizing the quality of our products or the effectiveness of our operations, our success in achieving targeted cost and expense reductions depends upon a number of factors. If we do not successfully execute on our cost reduction initiatives or if we experience delays in completing the implementation of these initiatives, our results of operations or financial condition could be adversely affected.
Our business is dependent, in part, on our intellectual property. If our intellectual property rights cannot be enforced or our trade secrets become known to our competitors, our ability to compete may be adversely affected.
Proprietary protection of our processes, apparatuses and other technology is important to our business. While a presumption of validity exists with respect to patents issued to us in the U.S., there can be no assurance that any of our patents will not be challenged, invalidated, circumvented or rendered unenforceable. Furthermore, if any pending patent application filed by us does not result in an issued patent, or if patents are issued to us, but such patents do not provide meaningful protection of our intellectual property, then our ability to compete may be adversely affected. Additionally, our competitors or other third parties may obtain patents that restrict or preclude our ability to lawfully produce or sell our products in a competitive manner, which could have a material adverse effect on our business, results of operations, financial condition and liquidity.
We also rely upon unpatented proprietary know-how and continuing technological innovation and other trade secrets to develop and maintain our competitive position. While it is our policy to enter into agreements imposing confidentiality obligations upon our employees and third parties to protect our intellectual property, these confidentiality obligations may be breached, may not provide meaningful protection for our trade secrets or proprietary know-how, or adequate remedies may not be available in the event of an unauthorized access, use or disclosure of our trade secrets and know-how. In addition, others could obtain knowledge of our trade secrets through independent development or other access by legal means.
We may have to rely on judicial enforcement of our patents and other proprietary rights. We may not be able to effectively protect our intellectual property rights from misappropriation or infringement in countries where effective patent, trademark, trade secret and other intellectual property laws and judicial systems may be unavailable, or may not protect our proprietary rights to the same extent as U.S. law.
The failure of our patents or confidentiality agreements to protect our processes, apparatuses, technology, trade secrets or proprietary know-how or the failure of adequate legal remedies for related actions could have a material adverse effect on our business, results of operations, financial condition and liquidity.
Our industry is affected by global economic factors, including risks associated with volatile economic conditions.
Our financial results are substantially dependent on overall economic conditions in the U.S. and China. Declining economic conditions in any of these locations—or negative perceptions about economic conditions—could result in a substantial decrease in demand for our products and could adversely affect our business. A currency or financial crisis in the U.S. or China could precipitate a significant decline in the respective economy, which would likely result in a decrease in demand for our products in the U.S. or increase the cost of products procured from China.
Uncertain economic conditions and market instability make it particularly difficult for us to forecast demand trends. The timing and extent of any changes to currently prevailing market conditions is uncertain, and supply and demand may be unbalanced at any time. As a consequence, we may not be able to accurately predict future economic conditions or the effect of such conditions on our financial condition or results of operations. We can give no assurances as to the timing, extent or duration of the current or future economic cycles impacting our industry.
11
Risks Related to Our Acquisition Strategy
We have recorded goodwill and other intangible assets as a result of acquisitions, and our future business conditions could cause these assets to become impaired, requiring substantial write-downs that would reduce our operating income.
We are required to annually test our goodwill and intangible assets with indefinite lives to determine if impairment has occurred. If the testing performed indicates that impairment has occurred, we are required to record a non-cash impairment charge for the difference between the carrying value of the goodwill and other intangible assets and the fair value of the goodwill and other intangible assets in the period the determination is made.
Changes in these estimates and assumptions, including the impact of changes in our stock price, could materially affect the determination of fair value and/or goodwill impairment. We continue to monitor and evaluate the potential impact of changes in our estimates and assumptions and perform interim impairment testing if triggering events arise prior to our annual impairment testing. Accordingly, it is possible that we could recognize an impairment charge in the future with respect to goodwill and/or other intangible assets, which would have an adverse effect on our consolidated financial condition and results of operations.
We recorded $77,780 of a goodwill impairment charge during fiscal 2013, and as of March 31, 2014, had $19,144 of goodwill remaining on our balance sheet and $10,877 of goodwill classified as an asset held for sale. The impact of changes relating to the previously mentioned estimates and assumptions could result in further goodwill impairment.
We may be unable to successfully manage our growth, particularly if accomplished through acquisitions.
Successful implementation of our business strategy requires that we effectively manage any associated growth. To manage growth effectively, our management will need to continue to implement changes in certain aspects of our business, to enhance our information systems and operations to respond to increased demand, to attract and retain qualified personnel and to develop, train and manage an increasing number of management-level and other employees. Growth could place an increasing strain on our management, financial, marketing, distribution and other resources, and we could experience operating difficulties. Any failure to manage growth effectively could have a material adverse effect on our results of operations and financial condition.
To the extent that we grow through acquisitions, we will face the additional challenges of integrating our current operations, culture, management information systems and other characteristics with that of the acquired entity. We may incur significant expenses in connection with negotiating and consummating one or more transactions, and we may assume certain liabilities in connection with an acquisition. In addition, we may not realize competitive advantages, synergies or other intended benefits anticipated in connection with any such acquisition. If we do not adequately identify targets for, or manage issues related to our future acquisitions, such acquisitions may have a negative adverse effect on our business and financial results.
In addition to the above risks, future acquisitions may result in the dilution of earnings and the amortization or write-off of goodwill and intangible assets, any of which could have a material adverse effect on our business, financial condition or results of operations.
Risks Related to Health Care Reform and Other Regulations
The health care reform legislation enacted in 2010 may lead to substantial changes in the health care industry that may adversely affect our business.
In March 2010, Congress passed and President Obama signed into law the Patient Protection and Affordable Care Act and related Reconciliation Bill, which includes a variety of healthcare reform provisions and requirements that will become effective at varying times through 2018. Generally, this legislation requires most U.S. citizens and legal residents to carry health insurance, creates state-based health benefit exchanges and a tax credit system to help the uninsured purchase coverage, requires employers to either provide insurance or pay tax penalties for employees that receive tax credits, imposes new regulations on health plans, and expands Medicaid. Many of the provisions of the law will phase in over the course of the next several years, and may have a material adverse effect on our results of operations. Among the provisions that had an adverse impact on our business is an excise tax that is imposed on medical device manufacturers for the sale of certain medical devices occurring after December 31, 2012. The excise tax is an amount equal to 2.3% of the price for which we sell certain medical devices. The IRS has issued guidance on the implementation of the tax that included, among many provisions, an exemption on certain domestically produced “convenience kits,” which represents the majority of our exposure to the excise tax. The medical excise tax amounted to $383 and $109 during fiscal 2014 and 2013, respectively.
Continuing pressures to reduce health care costs may adversely affect our prices; and if we cannot reduce manufacturing costs of existing and new products, our sales may not grow and our profitability may decline.
Increasing awareness of health care costs, public interest in health care reform and continuing pressure from Medicare, Medicaid and other payers to reduce costs in the health care industry, as well as increasing competition from other products, could make it more difficult for us to sell our products at current prices. The reduction of health care costs has become a political priority in the U.S., as evidenced by the 2010 health care reform legislation, and abroad. Laws and regulations affecting reimbursement for our products may be altered in the near future, possibly resulting in lower reimbursement amounts to customers for our products from governmental and private payers. In the event that the market will not accept current prices for our products, our sales and profits could be adversely affected.
We believe that our ability to increase our market share and operate profitably in the long term may depend, in part, on our ability to reduce manufacturing costs on a per unit basis through cost containment and high volume production using highly automated molding and assembly systems. If we are unable to reduce unit manufacturing costs, we may be unable to increase our market share or may lose market share to alternative products, including competitors’ products. Similarly, if we cannot enter a market with new products priced competitively with adequate profit margins and then reduce unit manufacturing costs of new products as production volumes increase, we may not be able to sell new products profitably or gain any meaningful market share. Any of these outcomes would adversely affect our future results of operations.
12
We are subject to a number of existing laws and regulations, and a significant adverse change in, or failure to comply with, these requirements could adversely affect our business.
As a participant in the heavily-regulated health care industry, we are regulated by numerous government authorities in both the U.S. and abroad. The manufacturing, distribution, marketing, labeling, sale and use of our products are subject to extensive regulation by the FDA and other regulatory authorities. Our failure to comply with applicable laws or regulations could cause a regulatory body to take disciplinary, corrective or punitive measures in the form of warnings, civil sanctions, criminal sanctions, recalls or seizures, injunctions, withdrawal of approvals, or restrictions on operations, all of which could adversely affect our business.
Importantly, in addition to the laws and regulations that directly apply to us, we also are impacted by the laws and regulations that apply to our customers. Our targeted customer base consists primarily of acute care facilities, and recently has expanded to include physician offices, outpatient surgery centers, long-term care facilities, and laboratories. These customers typically rely substantially on government programs for reimbursement for the services provided to patients in which our products are utilized, and their continued participation in such programs requires compliance with extensive governmental regulatory schemes. Even though we may not be directly regulated under these requirements, our products must be capable of being utilized by customers in compliance with such requirements.
Our company and our customers are subject to numerous laws and regulations relating to health care fraud and abuse. These laws are particularly relevant with respect to the sale and marketing of our products and the interaction between us and our customers. Fraud and abuse laws can be complicated and subject to frequent change, and as a result, may be violated unintentionally. Because many of these laws and regulations have not been extensively interpreted or consistently enforced, health care industry participants often do not have the benefit of significant regulatory or judicial interpretation of these laws and regulations. Different interpretations or enforcement of these laws and regulations could subject our current or past practices to regulatory scrutiny and could necessitate changes to our operations. Violations of fraud and abuse laws may result in significant criminal, civil and administrative sanctions. A determination, or even an investigation as to whether, we have violated fraud and abuse laws could adversely affect our business.
Unanticipated changes in our tax rates could affect our future results.
Our future effective tax rates could be favorably or unfavorably affected by unanticipated changes in tax laws or their interpretation. In addition, we are subject to the continuous examination of our income tax returns by the Internal Revenue Service and other tax authorities. We regularly assess the likelihood of adverse outcomes resulting from these examinations to determine the adequacy of our provision for income taxes. While we believe that we have adequately provided for such results, there can be no assurance that the outcomes from these continuous examinations will not have an adverse effect on our operating results and financial condition.
Risks Related to Our Indebtedness and Access to Capital and Financing
Covenants in our credit agreement may restrict our financial and operating flexibility to engage in certain business activities or to obtain additional financing.
On May 17, 2013, we entered into a credit agreement (the “New Credit Agreement”), among us, as borrower and Wells Fargo Bank, National Association, as administrative agent and lender. Our New Credit Agreement, as amended, contains certain restrictive covenants. These covenants may limit or prohibit our ability to incur indebtedness, grant liens, guarantee obligations, sell assets, make loans and investments, enter into merger and acquisition transactions, and declare and make dividends.
Our failure to comply with any of these covenants, or our failure to make payments of principal or interest on our debt, could result in a default under the New Credit Agreement. An event of default could result in our debt obligations becoming immediately due and payable, cause our creditors to terminate their lending commitments, or force us or one or more of our subsidiaries into bankruptcy or liquidation. Any of the foregoing occurrences could have a material adverse effect on our business, results of operations and financial condition. For more information regarding our New Credit Agreement and related debt covenants, see Item 7 “Management’s Discussion and Analysis of Financial Condition and Results of Operations – Liquidity and Capital Resources” and Footnote 8 – Long-Term Debt to our consolidated financial statements.
We have a substantial amount of indebtedness, which may adversely affect our cash flow and our ability to operate our business, remain in compliance with debt covenants, and make payments on our indebtedness.
As of March 31, 2014, the outstanding indebtedness under our credit agreement, was approximately $40,112, which represented 35% of our total capitalization of $114,243. On June 2, 2014, we utilized a portion of the proceeds from the Transaction to repay the outstanding indebtedness under our credit agreement in its entirety. While we currently have no outstanding indebtedness under our credit agreement, substantial indebtedness could have important consequences. For example, it could:
|
·
|
make it more difficult for us to satisfy our obligations with respect to our indebtedness, and any failure to comply with the obligations of any of our debt instruments, including financial and other restrictive covenants, could result in an event of default under the agreements governing our indebtedness;
|
|
·
|
require us to dedicate a substantial portion of our cash flow in the future to pay principal and interest on our debt, which will reduce the funds available for working capital, capital expenditures, acquisitions, and other general corporate purposes;
|
|
·
|
limit our flexibility in planning for and reacting to changes in our business and in the industry in which we operate;
|
|
·
|
make us more vulnerable to adverse changes in general economic, industry and competitive conditions, and adverse changes in government regulation; and
|
|
·
|
limit our ability to borrow additional amounts for working capital, capital expenditures, acquisitions, debt service requirements, execution of our growth strategy, research and development costs, or other purposes.
|
Any of these factors could materially and adversely affect our business and results of operations. If we do not have sufficient earnings to service our debt, we may be required to refinance all or part of our existing debt, sell assets, borrow more money, or sell securities, none of which we can guarantee we will be able to do.
13
An increase in interest rates may increase the cost of servicing our indebtedness and could reduce our profitability.
Indebtedness we may incur under our New Credit Agreement bears interest at variable rates. As a result, any increase in interest rates, whether because of an increase in market interest rates or an increase in our own cost of borrowing, would increase the cost of servicing our indebtedness and could materially reduce the availability of debt financing, which may result in increases in the interest rates and borrowing spreads at which lenders are willing to make future debt financing available to us. The impact of such an increase would be more significant than it would be for some other companies because of our substantial indebtedness.
We may not be able to obtain funding in the capital markets on terms we find acceptable, or obtain funding under our New Credit Agreement because of a deterioration of the capital and credit markets and our borrowing base.
The credit crisis experienced primarily between 2008 and 2012 and related turmoil in the global financial systems had an impact on our business and our financial condition, and we may face additional challenges if economic and financial market conditions deteriorate in the future. Historically, we have used cash flow from operations and borrowings under a revolving credit facility to fund our capital expenditures.
In the future, we may not be able to access adequate funding or may be required to prepay amounts outstanding under our New Credit Agreement as a result of (1) a decrease in our borrowing base due to the outcome of a subsequent borrowing base redetermination, (2) a decrease in the value of our real estate or equipment or (3) an unwillingness or inability on the part of our lending counterparties to meet their funding obligations. Further, the credit crisis made it more difficult to obtain funding in the public and private capital markets. In particular, the cost of raising money in the debt and equity capital markets increased substantially while the availability of funds from those markets generally diminished significantly. Also, as a result of concerns about the general stability of financial markets and the solvency of specific counterparties, the cost of obtaining money from the credit markets increased as many lenders and institutional investors have increased interest rates, imposed tighter lending standards, refused to refinance existing debt at maturity or on terms similar to existing debt or at all, or, in some cases, ceased to provide any new funding. A return of these conditions could materially and adversely affect our company.
Risks Related to Our Common Stock Ownership
The market price of our common stock has been, and may continue to be subject to large fluctuations.
We have experienced significant fluctuations in our stock price and share trading volume in the past and may continue to do so. The trading price of our common stock has been and may continue to be subject to wide fluctuations in response to a variety of issues, including broad market factors that may have a material adverse impact on our stock price, regardless of actual performance. The following factors could affect our stock price:
|
·
|
claims involving potential infringement of patents and other intellectual property rights;
|
|
·
|
quarter-to-quarter variances in our financial results;
|
|
·
|
analyst and other projections or recommendations regarding our common stock or medical device stocks generally;
|
|
·
|
any restatement of our financial statements or any investigation into our company by the SEC or another regulatory authority;
|
|
·
|
a general decline, or rise, of stock prices in the capital markets generally;
|
|
·
|
investor concerns regarding the general credibility of corporate financial reporting and integrity of financial markets;
|
|
·
|
announcements by us or our competitors of new products and service offerings, significant contracts, acquisitions or strategic relationships;
|
|
·
|
additions or departures of key personnel; and
|
|
·
|
the trading volume of our common stock.
|
14
Certain provisions contained in our certificate of incorporation and bylaws could discourage a takeover attempt, which may reduce or eliminate the likelihood of a change of control transaction and, therefore, limit your ability to sell our common stock at a price higher than the current market value.
Certain provisions contained in our certificate of incorporation and bylaws, such as a classified board of directors, limitations on stockholder proposals at meetings of stockholders and the inability of stockholders to call special meetings and certain provisions of Delaware law, could make it more difficult for a third party to acquire control of our company, even if some of our stockholders considered such a change of control to be beneficial. Our certificate of incorporation also authorizes our Board of Directors to issue preferred stock without stockholder approval. Our Board of Directors could elect to issue preferred stock that has special voting or other rights that could make it even more difficult for a third party to acquire us, which may reduce or eliminate your ability to sell our common stock at a price higher than the current market value.
None.
We own a manufacturing facility in Arden, North Carolina. We conduct our operations in Toano, Virginia under a long term lease. The Company’s headquarters are located in Brentwood, New York. In addition, we lease general office space in Shanghai, China. Management believes that our facilities are adequate to meet our current needs and should continue to be adequate for the foreseeable future. On June 2, 2014, the Company completed the sale of its Patient Care business. Included in the sale were the manufacturing facilities located in Gallaway, Tennessee and Clarksburg, West Virginia, as well as the leased warehouse in Oakland, Tennessee. Additional information about our facilities is set forth in the following table:
|
Location
|
Primary Use
|
Owned/
Leased
|
Lease
Termination
Date
|
Size in
Square
Feet
|
||||
|
Arden, North Carolina
|
Manufacturing/Warehouse/ Distribution
|
Owned
|
N/A
|
205,000
|
(a)
|
|||
|
Brentwood, New York
|
Executive Offices
|
Owned
|
N/A
|
28,200
|
(b)
|
|||
|
Shanghai, China
|
General Office
|
Leased
|
January 2016
|
2,600
|
(c)
|
|||
|
Fletcher, North Carolina
|
Warehouse/Distribution
|
Leased
|
Month to Month
|
41,484
|
(d)
|
|||
|
Toano, Virginia
|
Manufacturing/Warehouse
|
Leased
|
March 2029
|
185,000
|
(e)
|
(a) The Arden, North Carolina manufacturing, distribution and warehouse facility is located on 32 acres. An Industrial Revenue Bond was used to acquire and renovate the facility and acquire certain manufacturing equipment.
(b) We relocated to the Brentwood, New York corporate headquarters from our prior Hauppauge, New York corporate office in March 2009.
(c) The office in Shanghai, China is leased at an annual rental of $108.
(d) The warehouse facility in Fletcher, North Carolina is leased at an annual rental of $100.
(e) The Toano, Virginia facility located on 12 acres is subject to a capital lease that was assumed as part of our acquisition of AVID in August 2010 and requires monthly payments of $129 with increases of 2% per annum.
None.
Not applicable.
15
PART II
Market Price for the Common Stock
Our Common Stock trades on the NASDAQ Global Select Stock Market under the symbol “MDCI.” As of June 13, 2014, there were approximately 142 stockholders of record, which does not include approximately 5,149 beneficial owners of shares held in the names of brokers or other nominees. The following table sets forth, for the periods indicated, the high and low intra-day prices per share of our Common Stock as reported by the NASDAQ Global Select Stock Market.
|
High
|
Low
|
|||||||
|
Fiscal 2014
|
||||||||
|
First Quarter
|
$
|
8.30
|
$
|
6.76
|
||||
|
Second Quarter
|
8.97
|
5.84
|
||||||
|
Third Quarter
|
9.90
|
5.11
|
||||||
|
Fourth Quarter
|
8.83
|
5.37
|
||||||
|
Fiscal 2013
|
||||||||
|
First Quarter
|
$
|
5.74
|
$
|
3.04
|
||||
|
Second Quarter
|
3.90
|
3.34
|
||||||
|
Third Quarter
|
3.63
|
2.25
|
||||||
|
Fourth Quarter
|
6.00
|
2.95
|
||||||
Dividends
We have never paid cash dividends, and do not anticipate paying dividends in the foreseeable future as the Board of Directors intends to retain future earnings for use in our business. Any future determination as to the payment of dividends will depend upon our financial condition, results of operations and such other factors as the Board of Directors deems relevant. In addition, our New Credit Agreement contains covenants limiting the declaration and distribution of a cash dividend. See Item 7, “Management’s Discussion and Analysis of Financial Condition and Results of Operations—Liquidity and Capital Resources.”
Purchases of Equity Securities by the Issuer and Affiliated Purchasers
None.
16
Performance Graph
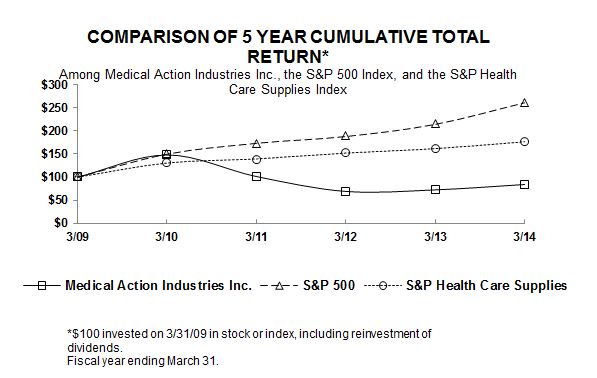
The graph above shows the cumulative total return on our Common Stock against the cumulative total return of the Standard & Poor 500 Stock Index and the Standard & Poor Healthcare (Medical Products and Supplies) Industry for the period of five years commencing March 31, 2009 and ending March 31, 2014. The comparison assumes $100 was invested on March 31, 2009 in our Common Stock and in each of the foregoing indices and assumes reinvestment of dividends. The stock performance shown on the graph above represents historical stock performance and is not necessarily indicative of future stock price performance.
The information in this Form 10-K appearing under the heading “Performance Graph” is being “furnished” pursuant to Item 201(e) of Regulation S-K under the Securities Act and shall not be deemed to be “soliciting material” or “filed” with the SEC, nor shall such information be incorporated by reference into any future filing under the Securities Act or the Exchange Act.
The following selected consolidated financial data should be read in conjunction with Item 7, “Management’s Discussion and Analysis of Financial Condition and Results of Operations” and our consolidated financial statements and the related notes appearing in Item 8, “Financial Statements and Supplementary Data” of this Form 10-K.
The consolidated financial data includes the impact of the AVID acquisition as of August 27, 2010. This data also includes the impact of the divestiture of our Patient Care business unit, which took place on June 2, 2014. The historical results are not necessarily indicative of the results to be expected in any future period.
|
Fiscal Year Ended March 31,
|
||||||||||||||||||||
|
2014
|
2013
|
2012
|
2011
|
2010
|
||||||||||||||||
|
Earnings Data
|
||||||||||||||||||||
|
Net sales
|
$ | 287,849 | $ | 284,763 | $ | 272,734 | $ | 207,616 | $ | 124,861 | ||||||||||
|
Income (loss) from continuing operations before income taxes
|
$ | 2,269 | $ | (79,805 | ) | $ | (1,462 | ) | $ | 177 | $ | 4,472 | ||||||||
|
Income from discontinued operations, net of income taxes
|
$ | 3,085 | $ | 3,198 | $ | 1,643 | $ | 4,177 | $ | 12,369 | ||||||||||
|
Net income (loss)
|
$ | 4,192 | $ | (54,856 | ) | $ | 181 | $ | 4,354 | $ | 16,841 | |||||||||
|
Basic earnings (loss) per share:
|
||||||||||||||||||||
|
Continuing operations
|
$ | 0.07 | $ | (3.54 | ) | $ | (0.09 | ) | $ | 0.01 | $ | 0.28 | ||||||||
|
Discontinued operations
|
$ | 0.19 | $ | 0.19 | $ | 0.10 | $ | 0.26 | $ | 0.76 | ||||||||||
|
Total
|
$ | 0.26 | $ | (3.35 | ) | $ | 0.01 | $ | 0.27 | $ | 1.04 | |||||||||
|
Diluted earnings (loss) per share:
|
||||||||||||||||||||
|
Continuing operations
|
$ | 0.07 | $ | (3.54 | ) | $ | (0.09 | ) | $ | 0.01 | $ | 0.27 | ||||||||
|
Discontinued operations
|
$ | 0.18 | $ | 0.19 | $ | 0.10 | $ | 0.26 | $ | 0.76 | ||||||||||
|
Total
|
$ | 0.25 | $ | (3.35 | ) | $ | 0.01 | $ | 0.27 | $ | 1.03 | |||||||||
|
Balance Sheet Data
|
||||||||||||||||||||
|
Total assets
|
$ | 203,944 | $ | 206,899 | $ | 297,144 | $ | 303,542 | $ | 200,796 | ||||||||||
|
Working capital
|
$ | 49,072 | $ | 52,163 | $ | 60,621 | $ | 41,017 | $ | 24,040 | ||||||||||
|
Long-term debt including capital leases (less current portion)
|
$ | 13,245 | $ | 64,805 | $ | 81,325 | $ | 72,566 | $ | 2,734 | ||||||||||
|
Stockholders' equity
|
$ | 100,287 | $ | 94,909 | $ | 148,807 | $ | 148,227 | $ | 142,722 | ||||||||||
17
OVERVIEW
We manufacture and market single-use medical products used principally by acute care facilities within the U.S. We divide our product lines into two markets, Clinical Care and Patient Care. Our Clinical Care market includes custom procedure trays, minor procedure kits and trays, operating room disposables and sterilization products, and dressings and surgical sponges. Our Patient Care market includes patient bedside products, containment systems for medical waste and laboratory products.
On March 12, 2014, the Company entered into a purchase agreement with an affiliate of Inteplast Group, Ltd. for the sale of the Company’s wholly owned subsidiary, Medegen Medical Products, LLC, and certain other assets which comprised the Company’s Patient Care business unit. The Company retained the cash, accounts receivable and all liabilities associated with the business unit except for an environmental liability. On June 2, 2014, the Company completed the sale of its Patient Care business unit for gross proceeds of $78,628, subject to customary post-closing adjustments (see Footnote 15 – Subsequent Events).
As of March 31, 2014, the Company has classified the assets and liabilities subject to the purchase agreement as held for sale and presented the results of operations of the Patient Care business unit for fiscal years 2014, 2013 and 2012 as discontinued operations in the accompanying consolidated statements of operations.
Our growth strategy has included both acquisitions and expansion of existing product lines. In August 2010, we acquired AVID which markets and assembles custom procedure trays. While we had previously made both custom and standard minor procedure kits and trays, the acquisition of AVID significantly expanded our product line offerings within the Clinical Care market, increased our sales team and provided opportunities to cross sell our existing product lines. We have supply agreements with substantially every major GPO and IDN in the country including Novation, Premier and MedAssets. A majority of the acute care facilities that we sell to belong to at least one GPO. The supply agreements awarded to us through these GPOs designate us as a sole-source or multi-source provider for substantially all of our product offerings. The supply agreements with GPOs and IDNs typically have no minimum purchase requirements and terms of one to three years that can be terminated on 90 days’ advance notice. While the acute care facilities associated with the GPOs and IDNs are not obligated to purchase our product offerings, many of these supply agreements have resulted in unit sales growth. Acute care facility orders purchased through our supply agreements with the three largest GPOs in the healthcare industry, Novation, Premier and MedAssets, accounted for $157,416 or 55% of our total net sales for the fiscal year ended March 31, 2014.
Although over time we have increased revenues both organically and via acquisition, at this time we are focusing our resources on increasing sales within existing product lines and continuing synergy initiatives associated with the AVID acquisition to drive organic sales growth.
We source our products from our four production facilities in the U.S. and from foreign suppliers, principally based in China. The principal raw material used in the production of our product lines is cotton. Cotton is purchased by our foreign suppliers and converted into finished products, principally operating room towels and laparotomy sponges. We purchase finished goods that contain approximately 11 million pounds of cotton per year.
The challenging economic environment of the past three years has negatively impacted hospital utilization, placed adverse economic pressure on acute care facilities and fostered volatility in commodity prices. These factors have impacted our revenues, average selling prices and gross profits. We have addressed these conditions by expanding our product lines, investing in our sales and marketing teams, managing our operating costs and differentiating ourselves in the market by emphasizing our ability to add value to our customers by improving their patient outcomes. We remain committed to being a trusted strategic partner to our customers, known for delivering innovative solutions to the healthcare community to improve the quality of care and enhancing patient experiences.
During fiscal 2014, 2013, and 2012 we reported net sales of $287,849, $284,763, and $272,734, respectively. Our net income (loss) and earnings (loss) per diluted share during fiscal 2014, 2013, and 2012 were $4,192 and $0.25 per share, ($54,856) and ($3.35) per share, $181 and $0.01 per share, respectively. Our profitability during fiscal 2013 was adversely affected by a $77,780 goodwill impairment charge and certain expenses associated with the renegotiation of our Second Amended and Restated Credit Agreement (the “Prior Credit Agreement”).
18
The following table sets forth certain operational data (in dollars and as a percentage of net sales) for fiscal years 2014, 2013 and 2012:
|
Fiscal 2014
|
Percent of
Net Sales
|
Fiscal 2013
|
Percent of
Net Sales
|
Fiscal 2012
|
Percent of
Net Sales
|
|||||||||||||||||||
|
Net sales
|
$ | 287,849 | 100.0 | % | $ | 284,763 | 100.0 | % | $ | 272,734 | 100.0 | % | ||||||||||||
|
Cost of sales
|
232,833 | 80.9 | % | 233,866 | 82.1 | % | 228,609 | 83.8 | % | |||||||||||||||
|
Gross profit
|
55,016 | 19.1 | % | 50,897 | 17.9 | % | 44,125 | 16.2 | % | |||||||||||||||
|
Goodwill impairment charge
|
- | 0.0 | % | 77,780 | 27.3 | % | - | 0.0 | % | |||||||||||||||
|
Selling, general and administrative expenses
|
48,744 | 16.9 | % | 48,155 | 16.9 | % | 41,188 | 15.1 | % | |||||||||||||||
|
Operating income (loss)
|
6,272 | 2.2 | % | (75,038 | ) | -26.4 | % | 2,937 | 1.1 | % | ||||||||||||||
|
Interest expense, net
|
4,003 | 1.4 | % | 4,767 | 1.7 | % | 4,571 | 1.7 | % | |||||||||||||||
|
Income (loss) from continuing operations before income taxes and extraordinary gain
|
2,269 | 0.8 | % | (79,805 | ) | -28.0 | % | (1,634 | ) | -0.6 | % | |||||||||||||
|
Income tax expense (benefit)
|
1,162 | 0.4 | % | (21,751 | ) | -7.6 | % | 283 | 0.1 | % | ||||||||||||||
|
Income (loss) from continuing operations before extraordinary gain
|
1,107 | 0.4 | % | (58,054 | ) | -20.4 | % | (1,917 | ) | -0.7 | % | |||||||||||||
|
Income from discontinued operations, net of income taxes
|
3,085 | 1.1 | % | 3,198 | 1.1 | % | 1,643 | 0.6 | % | |||||||||||||||
|
Extraordinary gain, net of income taxes
|
- | 0.0 | % | - | 0.0 | % | 455 | 0.2 | % | |||||||||||||||
|
Net income (loss)
|
$ | 4,192 | 1.5 | % | $ | (54,856 | ) | -19.3 | % | $ | 181 | 0.1 | % | |||||||||||
FISCAL 2014 COMPARED TO FISCAL 2013
Net sales during fiscal 2014 and fiscal 2013 amounted to $287,849 and $284,763, respectively, representing an increase of $3,086 or 1%. The increase is primarily attributable to greater domestic market share associated with our minor procedure kits and trays category and an increase in the average selling price of products sold within our custom procedure trays product category. These increases were partially offset by lower domestic market share associated with our operating room products category.
Gross profit was $55,016 during fiscal 2014 and $50,897 during fiscal 2013, representing an increase of $4,119 or 8%. Gross profit as a percentage of net sales was 19.1% during fiscal 2014 and 17.9% during fiscal 2013. The increase in gross profit compared to the prior fiscal year was due to; (i) a decrease in the cost of products sourced from China, (ii) an increase in average selling prices and the mix of products sold and (iii) an increase in overall sales volume.
During fiscal 2014, we imported approximately $50,092 of finished goods and certain raw materials from overseas vendors, principally China. Our main imports are operating room products, which include operating room towels and laparotomy sponges, minor procedure kits and trays and surgical instruments used in our minor procedure kits and trays that we do not produce domestically. The products we procure from China-based vendors include cotton as a raw material.
The costs within the global market for cotton, while still volatile, have declined from their peak in March 2011. We do not directly purchase unfinished cotton and convert the material into finished goods; however, cotton is the primary raw material utilized by our vendors in the production of our operating room towels and laparotomy sponges. The volume of cotton included in our products is estimated to be approximately 11 million pounds per annum. Our gross profit during fiscal 2014 increased by $2,530 due to lower costs of products sourced from overseas vendors.
Selling, general and administrative expenses amounted to $48,744 and $48,155 in fiscal 2014 and 2013, respectively. The increase was primarily due to higher compensation-related expenses. The increase was partially offset by declines of $2,077 in consulting services associated with our Prior Credit Agreement.
The goodwill impairment charge of $77,780 recorded during fiscal 2013 represents our impairment analysis that was performed in connection with our annual assessment of goodwill. The initial goodwill impairment charge of $78,609, reported during the three and nine months ended December 31, 2012, was reduced by $829 during the fourth quarter of fiscal 2013 to properly reflect the book value of certain inventories.
Interest expense amounted to $4,003 and $4,767 in fiscal 2014 and 2013, respectively. The decrease in interest expense was attributable to a decrease in average principal loan balances and a decline in interest rates.
Income tax expense (benefit) amounted to $1,162 and ($21,751) for fiscal 2014 and 2013, respectively. Income tax expense (benefit) as a percentage of income before income taxes was 51.2% and (27.3%) for fiscal 2014 and 2013, respectively. The tax expense for fiscal 2014 was greater than the federal statutory rate of 35.0% primarily due to incremental state and local tax expense. The tax benefit for fiscal 2013 was less than the federal statutory rate of 35.0% primarily due to a portion of the goodwill impairment that was not tax deductible for income tax purposes.
19
Income from discontinued operations, net of taxes during fiscal 2014 and 2013 amounted to $3,085 and $3,198, respectively. The decline is primarily attributable to increases of $2,785 in resin cost, which is the primary raw material utilized in the manufacture of the products associated with the Patient Care business unit. The increase in resin costs were partially offset by an increase in average selling prices and a decline in selling, general and administrative expenses. Fiscal 2013 was also negatively impacted by a write-down of $829 relating to an overstatement of inventories at the West Virginia facility.
FISCAL 2013 COMPARED TO FISCAL 2012
Net sales were $284,763 during fiscal 2013 and $272,734 during fiscal 2012, representing an increase of $12,029 or 4%. The increase is primarily attributable to greater domestic market share associated with our minor procedure kits and trays category and our custom procedure trays category and an increase in the average selling price of products sold within our custom procedure trays product category. These increases were partially offset by lower domestic market share associated with our operating room products category and a decline in the average selling price of products sold within our minor procedure kits and trays product category.
Gross profit was $50,897 during fiscal 2013 and $44,125 during fiscal 2012, representing an increase of $6,772 or 15%. Gross profit as a percentage of net sales was 17.9% during fiscal 2013 and 16.2% during fiscal 2012. The increase in gross profit compared to the prior fiscal year was due to; (i) an increase in overall sales volume, (ii) an increase in the average selling prices and the mix of products sold and (iii) a decrease in the cost of products sourced from China.
During fiscal 2013, we imported approximately $64,689 of finished goods and certain raw materials from overseas vendors, principally China. Our main imports are operating room products, which include operating room towels and laparotomy sponges, minor procedure kits and trays and surgical instruments used in our minor procedure kits and trays that we do not produce domestically. The products we procure from China-based vendors include cotton as raw material.
The costs within the global market for cotton, while still volatile, have declined from their peak in March 2011. We do not directly purchase unfinished cotton and convert the material into finished goods; however, cotton is the primary raw material utilized by our vendors in the production of our operating room towels and laparotomy sponges. The volume of cotton included in our products is estimated to be approximately 11 million pounds per annum. Our gross profit during fiscal 2013 increased by $780 due to lower costs of products sourced from overseas vendors.
Selling, general and administrative expenses amounted to $48,155 and $41,188 in fiscal 2013 and 2012, respectively. The increase is primarily attributable to higher compensation-related expenses, consulting services associated with our Prior Credit Agreement and higher GPO administration fees resulting from a change in the mix of sales and a new GPO agreement.
The goodwill impairment charge of $77,780 recorded during fiscal 2013 represents our impairment analysis that was performed in connection with our annual assessment of goodwill. The initial goodwill impairment charge of $78,609, reported during the three and nine months ended December 31, 2012, was reduced by $829 during the fourth quarter of fiscal 2013 to properly reflect the book value of certain inventories.
Interest expense amounted to $4,767 and $4,571 in fiscal 2013 and 2012, respectively. The increase in interest expense was attributable to an increase in interest rates under our Prior Credit Agreement.
During fiscal 2012, we negotiated a $700 settlement with our insurance broker for reimbursement of inventories damaged as a result of weather-related water damage. This reimbursement was categorized as an extraordinary gain in our consolidated statement of operations.
Income tax expense (benefit) amounted to ($21,751) and $528 (inclusive of the applicable taxes resulting from the extraordinary gain) for fiscal 2013 and 2012, respectively. Income tax expense (benefit) as a percentage of income before income taxes was (27.3%) and 56.5% for fiscal 2013 and 2012, respectively. The tax benefit for fiscal 2013 was less than the federal statutory rate of 35.0% primarily due to a portion of the goodwill impairment that was not deductible for income tax purposes. The tax expense for fiscal 2012 was greater than the federal statutory rate of 35.0% primarily due to the recording of a valuation allowance against certain state net operating loss carryforwards.
Income from discontinued operations, net of taxes during fiscal 2013 and 2012 amount to $3,198 and $1,643, respectively. The increase is primarily attributable to decreases of $2,999 in resin costs, which is the primary raw material utilized in the manufacture of the products associated with the Patient Care business unit. The increase was partially offset by lower domestic market share in the protective apparel with containment systems for medical waste product categories. Fiscal 2013 was also negatively impacted by a write-down of $829 relating to an overstatement of inventories at the West Virginia facility.
20
LIQUIDITY AND CAPITAL RESOURCES
Cash Flows
Cash and cash equivalents changed as follows for the fiscal years ended March 31:
|
2014
|
2013
|
2012
|
||||||||||
|
Cash provided by operating activities
|
$ | 16,681 | $ | 19,748 | $ | 4,013 | ||||||
|
Cash used in investing activities
|
$ | (3,237 | ) | $ | (1,468 | ) | $ | (779 | ) | |||
|
Cash provided by (used in) financing activities
|
$ | (13,905 | ) | $ | (23,106 | ) | $ | 459 | ||||
|
Increase (decrease) in cash and cash equivalents
|
$ | (461 | ) | $ | (4,826 | ) | $ | 3,693 | ||||
Historically, our primary sources of liquidity and capital resources have included cash provided by operations and the use of available borrowing under our credit facilities while the primary uses of liquidity and capital resources have included acquisitions, capital expenditures and payments on debt.
Cash provided by operating activities during fiscal 2014 was primarily comprised of net income from operations of $4,192, depreciation of $4,729, amortization of $4,160, an increase in accounts payable of $2,933, a decrease in other assets of $3,871 and a decrease in inventories of $1,927. This was partially offset by a decrease in accrued expenses and other of $6,843.
Cash used in investing activities during fiscal 2014 consisted primarily of $3,405 in capital expenditures. The majority of the capital expenditures related to machinery and equipment for our former injection molding facility located in Gallaway, Tennessee. During fiscal 2014, 2013, and 2012, we spent $3,405, $1,472, and $907, respectively, on capital expenditures.
On an annual basis, management expects to make capital expenditures on machinery and equipment to improve efficiencies at our manufacturing facilities.
Cash used in financing activities during fiscal 2014 consisted primarily of $12,588 in net payments under our New Credit Agreement. During the fiscal year ended March 31, 2014, our borrowings under our term loan decreased $1,370 while borrowings under our revolving credit facility decreased $11,218.
Financial Position
The following table sets forth certain liquidity and capital resources data for the periods indicated:
|
March 31, 2014
|
March 31, 2013
|
|||||||
|
Cash and Cash Equivalents
|
$ | 97 | $ | 558 | ||||
|
Accounts Receivables, net
|
$ | 32,890 | $ | 32,615 | ||||
|
Days Sales Outstanding
|
28.1 | 26.9 | ||||||
|
Inventories, net
|
$ | 32,718 | $ | 53,014 | ||||
|
Inventory Turnover
|
6.1 | 6.4 | ||||||
|
Current Assets
|
$ | 131,990 | $ | 92,338 | ||||
|
Goodwill
|
$ | 19,144 | $ | 30,021 | ||||
|
Working Capital
|
$ | 49,072 | $ | 52,163 | ||||
|
Current Ratio
|
1.6 | 2.3 | ||||||
|
Total Borrowings
|
$ | 53,583 | $ | 66,351 | ||||
|
Stockholders' Equity
|
$ | 100,287 | $ | 94,909 | ||||
|
Debt to Equity Ratio
|
0.53 | 0.70 | ||||||
21
Total borrowings outstanding were $53,583 with a debt to equity ratio of 0.53 to 1.0 at March 31, 2014 as compared to $66,351 with a debt to equity ratio of 0.70 to 1.0 at March 31, 2013. Cash and cash equivalents at March 31, 2014 were $97 and we had $21,874 available for borrowing under our credit agreement. In addition, as of March 31, 2014, we were in compliance with all covenants and financial ratios under the New Credit Agreement. Working capital at March 31, 2014 was $49,072 compared to $52,163 at March 31, 2013 and the current ratio at March 31, 2014 was 1.6 to 1.0 compared to 2.3 to 1.0 at March 31, 2013. The decrease in working capital was primarily due to our repayment in full of the outstanding balance owed on our New Credit Agreement. This repayment took place on June 2, 2014 commensurate with the completion of the divesture of the Patient Care business unit. Consequently, the entire outstanding balance has been classified as current on our balance sheet as of March 31, 2014.
On May 17, 2013, we entered into our New Credit Agreement. A portion of the proceeds of our New Credit Agreement was used to repay all amounts due under the Prior Credit Agreement. Upon such repayment, the Prior Credit Agreement was terminated. The New Credit Agreement provides for a maximum borrowing capacity of $65,000, consisting of the following loans; (1) a $11,505 secured term loan fully drawn by us on May 17, 2013, (2) $5,000 in unsecured delayed draw term loans and (3) up to $53,495 in secured revolving loans, which may be reduced by the amount of any outstanding delayed draw term loans drawn by us. The revolving loans are used to finance the working capital needs and general corporate purposes of our Company and our subsidiaries and for permitted acquisitions. If our Excess Availability (as defined in the New Credit Agreement) falls below a specified amount, we will be required to comply with specified financial covenants relating to a minimum fixed charge coverage ratio of 1.00 to 1.00, measured on a month-end basis. If we draw a delayed draw term loan, we will be required to comply with a maximum leverage ratio covenant ranging from 3:00 to 1.00 to 3.25 to 1.00, measured on a month-end basis. In addition, we had committed to certain post-closing conditions, including providing monthly financial statements, annual updates of financial projections and the filing of a mortgage on our Brentwood, New York corporate headquarters. As of March 31, 2014, we were in compliance with all applicable covenants and financial ratios under the New Credit Agreement.
Borrowings under our credit agreement are collateralized by substantially all of our assets and are fully guaranteed by us and our subsidiaries. The credit agreement contains certain restrictive covenants, including, among others, covenants limiting our ability to incur indebtedness, grant liens, guarantee obligations, sell assets, make loans and investments, enter into merger and acquisition transactions and declare or make dividends. Please see Footnote 8 – Long-Term Debt to our consolidated financial statements for additional information regarding the New Credit Agreement.
We are committed to maintaining a strong financial position through maintaining sufficient levels of available liquidity, managing working capital and generating cash flows necessary to meet operating requirements. We believe that anticipated future cash flow from operations, coupled with our cash on hand and available funds under our credit agreement will be sufficient to meet working capital requirements for the next twelve months. Although we have borrowing capacity under our credit agreement, have cash on hand and anticipate future cash flow from operations, we may be limited in our ability to allocate funds for purposes such as potential acquisitions, capital expenditures, marketing, development and other general corporate purposes. In addition, we may be limited in our flexibility in planning for or responding to changing conditions in our business and our industry, making us more vulnerable to general economic downturns and adverse developments in our business.
CONTRACTUAL OBLIGATIONS
The following table represents our future material, long-term contractual obligations as of March 31, 2014:
|
Contractual Obligations
|
Total
|
Less than 1
year
|
1- 3 years
|
3-5 years
|
After 5 years
|
|||||||||||||||
|
Principal payment of long-term debt
|
$ | 40,112 | $ | 40,112 | $ | - | $ | - | $ | - | ||||||||||
|
Capital lease obligation
|
26,781 | 1,549 | 3,191 | 3,319 | 18,722 | |||||||||||||||
|
Purchase obligations
|
6,070 | 6,070 | - | - | - | |||||||||||||||
|
Operating leases
|
1,989 | 1,030 | 866 | 93 | - | |||||||||||||||
|
Defined benefit pension payments
|
876 | 60 | 138 | 151 | 527 | |||||||||||||||
|
Total Contractual Obligations
|
$ | 75,828 | $ | 48,821 | $ | 4,195 | $ | 3,563 | $ | 19,249 | ||||||||||
There are approximately $1,012 of estimated liabilities related to unrecognized tax benefits that have been excluded from the contractual obligations table because we could not make a reasonable estimate of when those amounts would become payable.
22
RELATED PARTY TRANSACTIONS
As part of the assets and liabilities acquired from the AVID acquisition, we assumed a capital lease obligation for the AVID facility located in Toano, Virginia. The facility, which includes a 185,000 square foot manufacturing and warehouse building and approximately 12 acres of land, is owned by Micpar Realty, LLC (“Micpar”). AVID’s founder and former CEO, is a part owner of Micpar and subsequent to the acquisition of AVID, he was elected to our board of directors. As of August 2012, he no longer serves on our board of directors. As of March 31, 2014, the capital lease requires monthly payments of $129 with increases of 2% per annum. The lease contains provisions for an option to buy in January of 2016 and expires in March 2029. The effective rate on the capital lease obligation is 9.9%. Total lease payments required under the capital lease for the five-year period ending March 31, 2019 is $8,059. During the twelve months ended March 31, 2014, we recorded interest expense of $1,338 under the lease agreement.
The gross amount and net book value of the assets under the capital lease are as follows:
|
March 31,
|
||||||||
|
2014
|
2013
|
|||||||
|
Capital lease, gross
|
$ | 11,409 | $ | 11,409 | ||||
|
Less: Accumulated amortization
|
(2,200 | ) | (1,586 | ) | ||||
|
Capital lease, net
|
$ | 9,209 | $ | 9,823 | ||||
A current member of our board of directors is currently a minority shareholder of Custom Healthcare Systems (“CHS”), an assembler and packager of Class 1 medical products. CHS is a supplier to our AVID facility located in Toano, Virginia for small kits and trays. They also purchase sterile instruments from our facility located in Arden, North Carolina.
During the twelve months ended March 31, 2014 and 2013, the amounts sold to and purchased from CHS are as follows:
|
March 31,
|
||||||||
|
2014
|
2013
|
|||||||
|
Sold to CHS
|
$ | 1,074 | $ | 964 | ||||
|
Purchased from CHS
|
1,729 | 1,861 | ||||||
The following table represents the amounts due from and due to CHS:
|
March 31,
|
||||||||
|
2014
|
2013
|
|||||||
|
Due from CHS
|
$ | 330 | $ | 265 | ||||
|
Due to CHS
|
14 | 45 | ||||||
OFF-BALANCE SHEET ARRANGEMENTS
We do not maintain any off-balance sheet arrangements, transactions, obligations or other relationships with unconsolidated entities that would be expected to have a material current or future effect upon our financial condition or results of operations.
CRITICAL ACCOUNTING POLICIES
Our significant accounting policies are summarized in Note 1 of our consolidated financial statements. While all these significant accounting policies impact our financial condition and results of operations, we view certain of these policies as critical. Policies determined to be critical are those policies that have the most significant impact on our financial statements and require management to use a greater degree of judgment and/or estimates. Actual results may differ from those estimates.
The accounting policies identified as critical are as follows:
Revenue Recognition - Revenue from the sale of products is recognized when we meet all of the criteria specified in Accounting Standards Codification (“ASC”) 605, Revenue Recognition. These criteria include:
|
●
|
Persuasive evidence of an arrangement exists,
|
|
●
|
Delivery has occurred or services have been rendered,
|
|
●
|
The seller’s price to the buyer is fixed or determinable and
|
|
●
|
Collection of the resulting receivable is reasonably assured.
|
Customer purchase orders and/or sales agreements evidence our sales arrangements. These purchase orders and sales agreements specify both selling prices and quantities, which are the basis for recording sales revenue. Any deviation from this policy requires management review and approval. Trade terms are negotiated on a customer by customer basis and for the majority of our sales include that title and risk of loss pass from us to the customer when we ship products from our facilities, which is when revenue is recognized. In instances of shipments made on consignment, revenue is deferred until a customer indicates to us that it has used our products. We conduct ongoing credit evaluations of our customers and ship products only to customers that satisfy our credit evaluations. Products are shipped primarily to distributors at an agreed upon list price. Distributors then resell the products primarily to hospitals and depending on agreements between us, the distributors and the hospitals, the distributors may be entitled to a rebate. We deduct all rebates from sales and have a provision for allowances based on historical information for all rebates that have not yet been processed.
23
Income Taxes – We account for income taxes under the asset and liability method. Deferred tax assets and liabilities are recognized for the future tax consequences attributable to differences between the financial statement carrying amounts of existing assets and liabilities and their respective tax bases and operating loss and tax credit carry forwards. Deferred tax assets and liabilities are measured using enacted tax rates expected to apply to taxable income in the years in which those temporary differences are expected to be recovered or settled. The effect on deferred tax assets and liabilities from a change in tax rates is recognized in income in the period that includes the enactment date.
We must also assess the likelihood that deferred tax assets will be realized and, based on this assessment establish a valuation allowance, if required. The determination of our valuation allowance involves assumptions, judgments, and estimates, including forecasted earnings, future taxable income, and the relative proportions of revenue and income before taxes in the various state and local jurisdictions in which we operate. To the extent we establish a valuation allowance or change the valuation allowance in a period, we reflect the change with a corresponding increase or decrease to our tax provision in our consolidated statement of operations.
We are also required to compute our current income tax expense in each federal, state, and local jurisdiction in which we operate. Our judgments, assumptions, and estimates relative to the current provision for income tax take into account current tax laws, our interpretation of current tax laws, and possible outcomes of current and future audits. Changes in tax laws or our interpretation of tax laws and the resolution of current and future tax audits could significantly impact the amounts provided for income taxes in our consolidated balance sheet and consolidated statement of operations.
In accordance with the provisions of ASC 740, Income Taxes, we recognize in our financial statements only those tax positions that meet the more-likely-than-not-recognition threshold. For those tax positions where it is more-likely-than-not that a tax benefit will be sustained, we have recorded the largest amount of tax benefit with a greater than 50% likelihood of being realized upon settlement. For those tax positions where it is not more-likely-than-not that a tax benefit will be sustained, no tax benefit has been recognized in the consolidated financial statements. Interest and penalties associated with income tax matters are included in the provision for income taxes in our consolidated statements of operations. The provisions of ASC 740 did not have a material impact on our consolidated financial position.
Inventories – We value our inventory at the lower of the actual cost to purchase and/or manufacture or the current estimated market value of the inventory. On an ongoing basis, inventory quantities on hand are viewed and an analysis of the provision for excess and obsolete inventory is performed based primarily on our estimated sales forecast of product demand, which is based on sales history and anticipated future demand. A significant increase in the demand for our products could result in a short-term increase in the cost of inventory purchases while a significant decrease in demand could result in an increase in the amount of excess inventory quantities on hand. Additionally, our estimates of future product demand may prove to be inaccurate in which case we may have understated or overstated the provision required for excess and obsolete inventory. Accordingly, future adjustments to the provision may be required. Although every effort is made to ensure the accuracy of our forecasts of future product demand, any significant unanticipated changes in demand could have a significant impact on the value of our inventory and reported operating results. Historically, we have not experienced any significant inventory write-downs due to excess, slow moving and obsolete inventory.
Goodwill and Other Intangibles – Acquisition accounting requires extensive use of accounting estimates and judgments to allocate the purchase price to the fair value of the assets and liabilities purchased, with the excess value, if any, being classified as goodwill. As a result of our acquisitions, values were assigned to intangible assets principally for trademarks, trade names and customer relationships. Finite useful lives were assigned to these intangibles, if appropriate, and they will be amortized over their remaining life. As with any intangible asset, future write-downs may be required if the value of these assets becomes impaired.
Our goodwill is tested for impairment on an annual basis. Application of the goodwill impairment test requires judgment. The fair value is estimated using a discounted cash flow methodology. This requires significant judgments including estimation of future cash flows, which is dependent on internal forecasts, estimation of the long-term rate of growth for our business, the useful life over which cash flows will occur, and determination of our weighted average cost of capital. Changes in these estimates and assumptions could materially affect the determination of fair value and/or goodwill impairment.
Property, Plant and Equipment – Property, plant and equipment are depreciated over their useful lives. Useful lives are based on management’s estimates of the period that the asset will provide economic benefit. Any change in conditions that would cause management to change its estimate as to the useful lives of a group or class of assets may significantly impact our depreciation expense on a prospective basis.
Allowance for Doubtful Accounts – We perform ongoing credit evaluations on our customers and adjust credit limits based upon payment history and the customer’s current credit worthiness, as determined by a review of their current credit information. We continuously monitor collections and payments from customers and a provision for estimated credit losses is maintained based upon our historical experience and on specific customer collection issues that have been identified. While such credit losses have historically been within our expectations and the provisions established, we cannot guarantee that the same credit loss rates will be experienced in the future. Concentration risk exists relative to our accounts receivable, as 60% of our total accounts receivable balance as of March 31, 2014 is concentrated in two distributors. While the accounts receivable related to these distributors may be significant, we do not believe the credit loss risk to be significant given the consistent payment history of these distributors.
IMPACT OF RECENTLY ISSUED ACCOUNTING PRONOUNCEMENTS
Please see Footnote 1 – Organization and Summary of Significant Accounting Policies to our consolidated financial statements.
24
We are exposed to market risks, such as changes in foreign exchange rates, interest rates and commodity pricing risks. The following quantitative and qualitative information is provided about market risks to which we were exposed at March 31, 2014, and from which we may incur future gains or losses. We have not entered, nor do we intend to enter, into derivative financial instruments for speculative purposes.
Hypothetical changes in interest rates chosen for the estimated sensitivity analysis below are considered to be reasonable near-term changes generally based on consideration of past fluctuations for this risk category. However, since it is not possible to accurately predict future changes in interest rates, these hypothetical changes may not necessarily be an indicator of probable future fluctuations.
Foreign Currency Risk
A significant portion of our raw materials are purchased from China, which gives rise to risk from changes in foreign currency exchange rates between the Chinese Yuan and the U.S. Dollar. To mitigate our exposure to this risk, we attempt to denominate our transactions in foreign locations in U.S. Dollars. While all of such purchases are denominated in U.S. Dollars, to the extent that the U.S. Dollar decreases in value relative to the Chinese Yuan, our cost of sales may increase and our gross profit may decrease. We do not currently hold or issue foreign exchange contracts or other derivative instruments to hedge these exposures.
We currently do not sell a significant portion of our products outside of the U.S., and as such, we do not hedge against foreign currency fluctuations that may impact our sales in foreign countries. If we change our intent with respect to such international investment, we would expect to implement strategies designed to manage those risks in an effort to mitigate the effect of foreign currency fluctuations on our earnings and cash flows.
Interest Rate Risk
As of March 31, 2014, there was approximately $40,112 in aggregate outstanding borrowings under our New Credit Agreement. Term loans outstanding under the New Credit Agreement bear interest at a rate per annum equal to, at our election, (1) LIBOR Rate (as defined in the New Credit Agreement) plus a margin ranging from 2.50% to 3.00%, depending on the Average Excess Availability (as defined in the New Credit Agreement) at the time of calculation, or (2) Base Rate (as defined in the New Credit Agreement) plus a margin ranging from 1.50% to 2.00%, depending on the Average Excess Availability at the time of calculation. Revolving loans outstanding under the New Credit Agreement bear interest at a rate per annum equal to, at our election, (1) LIBOR Rate plus a margin ranging from 2.00% to 2.50%, depending on the Average Excess Availability at the time calculation, or (2) Base Rate plus a margin ranging from 1.00% to 1.50%, depending on the Average Excess Availability at the time of calculation. If drawn, Delayed Draw Term Loans outstanding under the New Credit Agreement will bear interest at a rate per annum equal to, at our election, (1) LIBOR Rate plus a margin ranging from 4.25% to 4.75%, depending on the Average Excess Availability at the time of calculation, or (2) Base Rate plus a margin ranging from 3.25% to 3.75%, depending on the Average Excess Availability at the time of calculation. Assuming the outstanding balance remained unchanged, a 1% change in the LIBOR Rate as of March 31, 2014 would result in an increase in annual interest expense of approximately $401 and a 1% change in the Base Rate as of March 31, 2014 would result in an increase in annual interest of approximately $401.
We have not entered into interest rate hedging arrangements in the past, and have no plans to do so. Due to fluctuating balances in the amount outstanding under our New Credit Agreement, we do not believe such arrangements to be cost effective.
Commodity Price Risk
Our exposure to changing commodity prices is somewhat limited since the majority of our raw materials are acquired at posted or market related prices, and sales prices for many of our finished products are at market related prices which are generally in line with industry practice. Although we have not hedged our commodity exposures in the past, we may do so in the future.
25
|
Consolidated Financial Statements and Schedule:
|
|
26
Report of Independent Registered Public Accounting Firm
The Board of Directors and Stockholders
Medical Action Industries Inc.:
We have audited the accompanying consolidated balance sheets of Medical Action Industries Inc. and subsidiaries as of March 31, 2014 and 2013, the related consolidated statements of operations, comprehensive income (loss), stockholders’ equity, and cash flows for the years then ended. In connection with our audits of the consolidated financial statements, we also have audited the financial statement schedule listed in Item 15(a)(2). These consolidated financial statements and financial statement schedule are the responsibility of Medical Action Industries Inc.’s management. Our responsibility is to express an opinion on these consolidated financial statements and financial statement schedule based on our audits. The accompanying consolidated financial statements of Medical Action Industries Inc. and subsidiaries for the year ended March 31, 2012, were audited by other auditors whose report thereon dated June 16, 2014 expressed an unqualified opinion on those statements, before the effects of the adjustments that were applied to the consolidated financial statements for the year ended March 31, 2012 to present Medical Action Industries Inc.’s Patient Care business unit as discontinued operations as described in note 3 to the consolidated financial statements.
We conducted our audits in accordance with the standards of the Public Company Accounting Oversight Board (United States). Those standards require that we plan and perform the audit to obtain reasonable assurance about whether the financial statements are free of material misstatement. An audit includes examining, on a test basis, evidence supporting the amounts and disclosures in the financial statements. An audit also includes assessing the accounting principles used and significant estimates made by management, as well as evaluating the overall financial statement presentation. We believe that our audits provide a reasonable basis for our opinion.
In our opinion, the 2014 and 2013 consolidated financial statements referred to above present fairly, in all material respects, the financial position of Medical Action Industries Inc. and subsidiaries as of March 31, 2014 and 2013, and the results of their operations and their cash flows for the years then ended, in conformity with U.S. generally accepted accounting principles. Also in our opinion, the financial statement schedule, when considered in relation to the basic consolidated financial statements taken as a whole, presents fairly, in all material respects, the information set forth therein.
We also have audited the adjustments described in note 3 that were applied to the consolidated financial statements for the year ended March 31, 2012 to present Medical Action Industries Inc.’s Patient Care business unit as discontinued operations. In our opinion, such adjustments are appropriate and have been properly applied. We were not engaged to audit, review, or apply any procedures to the consolidated financial statements of Medical Action Industries Inc. and subsidiaries for the year end March 31, 2012 other than with respect to the adjustments and, accordingly, we do not express an opinion or any other form of assurance on the consolidated financial statements for the year ended March 31, 2012 taken as a whole.
We also have audited, in accordance with the standards of Public Company Accounting Oversight Board (United States), Medical Action Industries Inc. and subsidiaries’ internal control over financial reporting as of March 31, 2014, based on criteria established in Internal Control – Integrated Framework (1992) issued by the Committee of Sponsoring Organizations of the Treadway Commission (COSO), and our report dated June 16, 2014 expressed an unqualified opinion on the effectiveness of Medical Action Industries Inc. and subsidiaries’ internal control over financial reporting.
/s/ KPMG LLP
Melville, New York
June 16, 2014
27
Report of Independent Registered Public Accounting Firm
Board of Directors and Stockholders
Medical Action Industries Inc.
We have audited, before the effects of the adjustments to retrospectively apply the change in accounting described in Note 3, the accompanying consolidated statements of operations, comprehensive income (loss), stockholders’ equity and cash flows of Medical Action Industries Inc. (a Delaware corporation) and subsidiaries (the “Company”) for the year ended March 31, 2012 (the 2012 consolidated financial statements before the effects of the adjustments discussed in Note 3 are not presented herein). Our audit of the consolidated financial statements included the financial statement schedule listed in the index appearing under Item 15(a)(2) for the year ended March 31, 2012. These financial statements and financial statement schedule are the responsibility of the Company’s management. Our responsibility is to express an opinion on these financial statements and financial statement schedule based on our audit.
We conducted our audit in accordance with the standards of the Public Company Accounting Oversight Board (United States). Those standards require that we plan and perform the audit to obtain reasonable assurance about whether the financial statements are free of material misstatement. An audit includes examining, on a test basis, evidence supporting the amounts and disclosures in the financial statements. An audit also includes assessing the accounting principles used and significant estimates made by management, as well as evaluating the overall financial statement presentation. We believe that our audit provides a reasonable basis for our opinion.
In our opinion, the consolidated financial statements referred to above , which are before the effects of the adjustments to retrospectively apply the change in accounting described in Note 3, of Medical Action Industries Inc. and subsidiaries present fairly, in all material respects, the results of their operations and their cash flows for the year ended March 31, 2012 in conformity with accounting principles generally accepted in the United States of America. Also in our opinion, the related financial statement schedule for the year ended March 31, 2012, when considered in relation to the consolidated financial statements taken as a whole, present fairly, in all material respects, the information set forth therein.
We were not engaged to audit, review, or apply any procedures to the adjustments to retrospectively apply the change in accounting described in Note 3, and accordingly, we do not express an opinion or any other form of assurance about whether such adjustments are appropriate and have been properly applied. Those adjustments were audited by other auditors.
/s/ Grant Thornton LLP
New York, New York
June 16, 2012
28
Medical Action Industries Inc.
(In thousands, except per share data)
|
March 31,
|
||||||||
|
2014
|
2013
|
|||||||
|
Current Assets
|
||||||||
|
Cash and cash equivalents
|
$ | 97 | $ | 558 | ||||
|
Accounts receivable, less allowance for doubtful accounts of $501 at March 31, 2014 and $793 at March 31, 2013
|
32,890 | 32,615 | ||||||
|
Inventories, net
|
32,718 | 53,014 | ||||||
|
Prepaid expenses
|
913 | 1,424 | ||||||
|
Deferred income taxes
|
1,201 | 1,410 | ||||||
|
Prepaid income taxes
|
409 | 1,022 | ||||||
|
Other current assets
|
2,649 | 2,295 | ||||||
|
Assets held for sale, current
|
61,113 | - | ||||||
|
Total Current Assets
|
$ | 131,990 | $ | 92,338 | ||||
|
Property, plant and equipment, net
|
26,161 | 44,960 | ||||||
|
Goodwill
|
19,144 | 30,021 | ||||||
|
Other intangible assets, net
|
23,737 | 36,586 | ||||||
|
Other assets, net
|
2,912 | 2,994 | ||||||
|
Total Assets
|
$ | 203,944 | $ | 206,899 | ||||
|
Current Liabilities
|
||||||||
|
Accounts payable
|
$ | 16,456 | $ | 13,523 | ||||
|
Accrued expenses
|
21,924 | 25,106 | ||||||
|
Current portion of capital lease obligations
|
226 | 176 | ||||||
|
Current portion of long-term debt
|
40,112 | 1,370 | ||||||
|
Liabilities held for sale, current
|
4,200 | - | ||||||
|
Total Current Liabilities
|
$ | 82,918 | $ | 40,175 | ||||
|
Other long-term liabilities
|
1,012 | 595 | ||||||
|
Deferred income taxes
|
6,482 | 6,415 | ||||||
|
Capital lease obligations, less current portion
|
13,245 | 13,475 | ||||||
|
Long-term debt, less current portion
|
- | 51,330 | ||||||
|
Total Liabilities
|
$ | 103,657 | $ | 111,990 | ||||
|
Stockholders’ Equity
|
||||||||
|
Common stock 40,000 shares authorized, $.001 par value; issued and outstanding 16,391 shares at March 31, 2014 and March 31, 2013
|
16 | 16 | ||||||
|
Additional paid-in capital, net
|
36,556 | 35,492 | ||||||
|
Accumulated other comprehensive loss
|
(651 | ) | (773 | ) | ||||
|
Retained earnings
|
64,366 | 60,174 | ||||||
|
Total Stockholders’ Equity
|
$ | 100,287 | $ | 94,909 | ||||
|
Total Liabilities and Stockholders’ Equity
|
$ | 203,944 | $ | 206,899 | ||||
See accompanying notes to the consolidated financial statements.
29
Medical Action Industries Inc.
(In thousands, except per share data)
|
Fiscal Year Ended March 31,
|
||||||||||||
|
2014
|
2013
|
2012
|
||||||||||
|
Net sales
|
$ | 287,849 | $ | 284,763 | $ | 272,734 | ||||||
|
Cost of sales
|
232,833 | 233,866 | 228,609 | |||||||||
|
Gross profit
|
$ | 55,016 | $ | 50,897 | $ | 44,125 | ||||||
|
Goodwill impairment charge
|
- | 77,780 | - | |||||||||
|
Selling, general and administrative expenses
|
48,744 | 48,155 | 41,188 | |||||||||
|
Operating income (loss)
|
$ | 6,272 | $ | (75,038 | ) | $ | 2,937 | |||||
|
Interest expense, net
|
4,003 | 4,767 | 4,571 | |||||||||
|
Income (loss) from continuing operations before income taxes and extraordinary gain
|
$ | 2,269 | $ | (79,805 | ) | $ | (1,634 | ) | ||||
|
Income tax expense (benefit)
|
1,162 | (21,751 | ) | 283 | ||||||||
|
Income (loss) from continuing operations before extraordinary gain
|
$ | 1,107 | $ | (58,054 | ) | $ | (1,917 | ) | ||||
|
Income from discontinued operations, net of income taxes
|
3,085 | 3,198 | 1,643 | |||||||||
|
Extraordinary gain, net of income taxes
|
- | - | 455 | |||||||||
|
Net income (loss)
|
$ | 4,192 | $ | (54,856 | ) | $ | 181 | |||||
|
Basic earnings (loss) per share :
|
||||||||||||
|
Net income (loss) from continuing operations, before extraordinary gain
|
$ | 0.07 | $ | (3.54 | ) | $ | (0.12 | ) | ||||
|
Net income from discontinued operations
|
$ | 0.19 | $ | 0.19 | $ | 0.10 | ||||||
|
Extraordinary gain, net of income taxes
|
$ | - | $ | - | $ | 0.03 | ||||||
|
Net income (loss)
|
$ | 0.26 | $ | (3.35 | ) | $ | 0.01 | |||||
|
Weighted-average common shares outstanding (basic)
|
16,391 | 16,391 | 16,391 | |||||||||
|
Diluted earnings (loss) per share :
|
||||||||||||
|
Net income (loss) from continuing operations, before extraordinary gain
|
$ | 0.07 | $ | (3.54 | ) | $ | (0.12 | ) | ||||
|
Net income from discontinued operations
|
$ | 0.18 | $ | 0.19 | 0.10 | |||||||
|
Extraordinary gain, net of income taxes
|
$ | - | $ | - | $ | 0.03 | ||||||
|
Net income (loss)
|
$ | 0.25 | $ | (3.35 | ) | $ | 0.01 | |||||
|
Weighted-average common shares outstanding (diluted)
|
16,466 | 16,391 | 16,391 | |||||||||
See accompanying notes to the consolidated financial statements.
30
Medical Action Industries Inc.
(In thousands)
|
Fiscal Year Ended March 31,
|
||||||||||||
|
2014
|
2013
|
2012
|
||||||||||
|
Net income (loss)
|
$ | 4,192 | $ | (54,856 | ) | $ | 181 | |||||
|
Other comprehensive income (loss), net of tax:
|
||||||||||||
|
Pension and postretirement plans, unrecognized gain (loss)
|
122 | (56 | ) | (280 | ) | |||||||
|
Total other comprehensive income (loss), net of tax
|
122 | (56 | ) | (280 | ) | |||||||
|
Comprehensive income (loss)
|
$ | 4,314 | $ | (54,912 | ) | $ | (99 | ) | ||||
See accompanying notes to the consolidated financial statements.
31
Medical Action Industries Inc.
(In thousands)
|
|
Common Stock
|
|||||||||||||||||||||||
|
Shares
|
Amount
|
Additional
Paid-In
Capital
|
Accumulated
Other
Comprehensive
Loss
|
Retained
Earnings
|
Total
Stockholders’
Equity
|
|||||||||||||||||||
|
Balance at March 31, 2011
|
16,383 | $ | 16 | $ | 33,799 | $ | (437 | ) | $ | 114,849 | $ | 148,227 | ||||||||||||
|
Net income
|
- | - | - | 181 | 181 | |||||||||||||||||||
|
Pension liability adjustment, net of income tax of ($125)
|
- | - | (280 | ) | - | (280 | ) | |||||||||||||||||
|
Exercise of stock options, net
|
8 | - | 20 | - | - | 20 | ||||||||||||||||||
|
Amortization of deferred compensation
|
- | 20 | - | - | 20 | |||||||||||||||||||
|
Tax effect from vesting/cancellation of stock under restricted management stock bonus plan and the exercise of options
|
|
- | 51 | - | - | 51 | ||||||||||||||||||
|
Stock-based compensation
|
- | 588 | - | - | 588 | |||||||||||||||||||
|
Balance at March 31, 2012
|
16,391 | $ | 16 | $ | 34,478 | $ | (717 | ) | $ | 115,030 | $ | 148,807 | ||||||||||||
|
Net loss
|
- | - | - | (54,856 | ) | (54,856 | ) | |||||||||||||||||
|
Pension liability adjustment, net of income tax of ($20)
|
- | - | (56 | ) | - | (56 | ) | |||||||||||||||||
|
Amortization of deferred compensation
|
- | 9 | - | - | 9 | |||||||||||||||||||
|
Stock-based compensation
|
- | 1,005 | - | - | 1,005 | |||||||||||||||||||
|
Balance at March 31, 2013
|
16,391 | $ | 16 | $ | 35,492 | $ | (773 | ) | $ | 60,174 | $ | 94,909 | ||||||||||||
|
Net income
|
- | - | - | 4,192 | 4,192 | |||||||||||||||||||
|
Pension liability adjustment, net of income tax of ($35)
|
- | - | 122 | - | 122 | |||||||||||||||||||
|
Amortization of deferred compensation
|
- | 20 | - | - | 20 | |||||||||||||||||||
|
Stock-based compensation
|
- | 1,044 | - | - | 1,044 | |||||||||||||||||||
|
Balance at March 31, 2014
|
16,391 | $ | 16 | $ | 36,556 | $ | (651 | ) | $ | 64,366 | $ | 100,287 | ||||||||||||
See accompanying notes to the consolidated financial statements.
32
Medical Action Industries Inc.
(In thousands)
|
Fiscal Year Ended March 31,
|
||||||||||||
|
2014
|
2013
|
2012
|
||||||||||
|
Cash flows from operating activities:
|
||||||||||||
|
Net income (loss)
|
$ | 4,192 | $ | (54,856 | ) | $ | 181 | |||||
|
Adjustments to reconcile net income (loss) to net cash provided by operating activities:
|
||||||||||||
|
Extraordinary gain
|
- | - | (700 | ) | ||||||||
|
Depreciation
|
4,729 | 5,048 | 5,720 | |||||||||
|
Amortization
|
4,160 | 3,942 | 4,289 | |||||||||
|
Goodwill impairment charge
|
- | 77,780 | - | |||||||||
|
Provision for allowance for doubtful accounts
|
(292 | ) | 15 | 72 | ||||||||
|
Deferred income taxes
|
276 | (21,306 | ) | 2,419 | ||||||||
|
Stock-based compensation
|
1,064 | 1,014 | 608 | |||||||||
|
Excess tax benefit from stock-based compensation
|
- | - | (300 | ) | ||||||||
|
Gain on sale of property and equipment
|
(124 | ) | - | - | ||||||||
|
Tax benefit from vesting of stock under restricted management stock bonus plan and exercise of stock options
|
- | - | 51 | |||||||||
|
Changes in operating assets and liabilities:
|
||||||||||||
|
Accounts receivable
|
16 | (1,785 | ) | 1,198 | ||||||||
|
Inventories
|
1,927 | 811 | 827 | |||||||||
|
Prepaid expenses and other current assets
|
159 | (8 | ) | 328 | ||||||||
|
Prepaid income taxes
|
613 | 257 | 659 | |||||||||
|
Other assets
|
3,871 | (902 | ) | (1,185 | ) | |||||||
|
Accounts payable
|
2,933 | 2,228 | (5,774 | ) | ||||||||
|
Accrued expenses and other
|
(6,843 | ) | 7,510 | (4,380 | ) | |||||||
|
Net cash provided by operating activities
|
16,681 | 19,748 | 4,013 | |||||||||
|
Cash flows from investing activities:
|
||||||||||||
|
Purchase price and related acquisition costs
|
- | - | 125 | |||||||||
|
Purchases of property, plant and equipment
|
(3,405 | ) | (1,472 | ) | (907 | ) | ||||||
|
Proceeds from sale of property and equipment
|
168 | 4 | 3 | |||||||||
|
Net cash used in investing activities
|
(3,237 | ) | (1,468 | ) | (779 | ) | ||||||
|
Cash flows from financing activities:
|
||||||||||||
|
Proceeds from revolving line of credit and long-term borrowings
|
232,328 | 90,150 | 105,867 | |||||||||
|
Principal payments on revolving line of credit and long-term borrowings
|
(244,916 | ) | (113,120 | ) | (105,333 | ) | ||||||
|
Principal payments on capital lease obligations
|
(180 | ) | (136 | ) | (95 | ) | ||||||
|
Proceeds from exercise of employee stock options
|
- | - | 20 | |||||||||
|
Deferred financing costs
|
(1,137 | ) | - | - | ||||||||
|
Net cash provided by (used in) financing activities
|
(13,905 | ) | (23,106 | ) | 459 | |||||||
|
Net increase (decrease) in cash and cash equivalents
|
$ | (461 | ) | $ | (4,826 | ) | $ | 3,693 | ||||
|
Cash and cash equivalents at beginning of year
|
558 | 5,384 | 1,691 | |||||||||
|
Cash and cash equivalents at end of year
|
$ | 97 | $ | 558 | $ | 5,384 | ||||||
|
Supplemental disclosures:
|
||||||||||||
|
Interest paid
|
2,951 | 4,314 | 4,505 | |||||||||
|
Income taxes paid (refunded)
|
1,559 | 855 | (1,304 | ) | ||||||||
See accompanying notes to the consolidated financial statements.
33
Medical Action Industries Inc. • March 31, 2014
1. ORGANIZATION AND SUMMARY OF SIGNIFICANT ACCOUNTING POLICIES
COMPANY BACKGROUND AND DESCRIPTION OF BUSINESS
Medical Action Industries Inc. (“Medical Action” or the “Company”) was incorporated under the laws of the State of New York on April 1, 1977, and re-incorporated under the laws of the State of Delaware on November 5, 1987. Headquartered in Brentwood, New York, Medical Action develops, manufactures, markets and supplies a variety of disposable medical products. The Company’s products are marketed primarily to acute care facilities throughout the United States and certain international markets, and in recent years the Company has expanded its end-user markets to include physician, dental and veterinary offices, outpatient surgery centers and long-term care facilities. Medical Action is a leading manufacturer and supplier of custom procedure trays, collection systems for the containment of medical waste, minor procedure kits and trays, disposable patient utensils, sterile operating room towels and sterile laparotomy sponges. The Company’s products are marketed by its direct sales personnel and an extensive network of health care distributors. Medical Action has entered into preferred vendor agreements with national and regional distributors, as well as sole and multi-source agreements with group purchasing organizations. The Company also offers original equipment manufacturer products under private label programs to supply chain partners and medical suppliers. Medical Action’s manufacturing, packaging and warehousing activities are conducted in its Arden, North Carolina and Toano, Virginia facilities. The Company’s procurement of certain products and raw materials from the People’s Republic of China is administered by its office in Shanghai, China. During fiscal 2014, we also conducted manufacturing, packaging and warehousing activities at our Clarksburg, West Virginia and Gallaway, Tennessee facilities. These facilities were part of the assets sold in the Patient Care business unit divestiture completed on June 2, 2014 (the "Transaction"), as disclosed in Footnote 3 – Discontinued Operations.
All dollar amounts presented in the notes to consolidated financial statements are presented in thousands, except share and per share data.
BUSINESS SEGMENTS AND OTHER FINANCIAL INFORMATION
We operate as one reportable segment which is the manufacture and supply of disposable medical products. During the fiscal years ended 2014, 2013 and 2012 international sales approximated 2% of our total net sales and the net book value of our long-lived assets held outside of the United States were immaterial at March 31, 2014 and 2013.
PRINCIPLES OF CONSOLIDATION
The consolidated financial statements include the accounts of the Company and its wholly-owned subsidiaries. All significant intercompany accounts and transactions have been eliminated in consolidation.
USE OF ESTIMATES
The preparation of financial statements in conformity with accounting principles generally accepted in the United States of America requires management to make estimates and assumptions that affect the reported amounts of assets and liabilities, such as valuation of inventories, allowance for doubtful accounts, valuation of deferred tax assets, goodwill and other intangible assets, provision for trade rebates, pension benefits and accrued expenses, at the date of the financial statements and the reported amounts of revenues and expenses during the reporting period. Actual results could differ from those estimates.
CASH EQUIVALENTS
The Company considers all highly liquid investments with an original maturity of 90 days or less to be cash equivalents.
34
ACCOUNTS RECEIVABLE, ALLOWANCE FOR DOUBTFUL ACCOUNTS AND CONCENTRATION OF CREDIT RISK
Accounts receivable are comprised principally of trade accounts receivable that arise primarily from the sale of goods on account and are stated at historical cost. The Company performs ongoing credit evaluations on its customers and adjusts credit limits based upon payment history and the customer’s current credit worthiness, as determined by a review of their current credit information. The Company continuously monitors collections and payments from customers and a provision for estimated credit losses is maintained based upon its historical experience and on specific customer collection issues that have been identified. While such credit losses have historically been within the Company’s expectations and the provisions established, the Company cannot guarantee that the same credit loss rates will be experienced in the future. Concentration risk exists relative to the Company’s accounts receivable, net, as Owens & Minor, Inc. and Cardinal Health Inc., (the “Distributors”) accounted for approximately 60% and 64% of accounts receivable, respectively as of March 31, 2014 and 2013. While the accounts receivable related to these Distributors may be significant, the Company does not believe the credit risk to be significant given their consistent payment history.
TRADE REBATES
The Company provides rebates to distributors that sell to end-user customers at prices determined under a contract between the Company and the end-user customer or distributor. The Company deducts all rebates from sales and has a provision for allowances based on historical information for all rebates that have not yet been processed. The provision for trade rebates (which is included in accounts receivable) amounted to $14,331 and $14,807 at March 31, 2014 and 2013, respectively.
INVENTORIES, NET
Inventories are stated at the lower of cost or market net of reserve for excess, slow moving and obsolete inventory. Cost is determined by the first-in, first-out method.
PROPERTY, PLANT AND EQUIPMENT, NET
Property, plant and equipment are stated at cost less accumulated depreciation and amortization. Leases meeting the criteria for capitalization are recorded at the present value of future minimum lease payments. Maintenance and repairs are charged to operations as incurred and expenditures for major improvements are capitalized. The carrying amount and related accumulated depreciation of assets sold or otherwise disposed of are removed from the accounts and any resulting gain or loss is reflected in operations in the year of disposal. Accelerated methods of depreciation are used for tax purposes.
A summary of property, plant and equipment, net, is as follows:
|
March 31,
|
||||||||
|
2014
|
2013
|
|||||||
|
Land and buildings
|
$ | 19,079 | $ | 29,751 | ||||
|
Property under capital lease
|
11,409 | 11,409 | ||||||
|
Machinery and equipment
|
8,520 | 36,326 | ||||||
|
Furniture and fixtures
|
3,161 | 3,351 | ||||||
|
Computer hardware and software
|
1,546 | 2,192 | ||||||
|
Total property, plant and equipment
|
43,715 | 83,029 | ||||||
|
Less accumulated depreciation and amortization
|
17,554 | 38,069 | ||||||
|
Property, plant and equipment, net
|
$ | 26,161 | $ | 44,960 | ||||
35
At March 31, 2014, the Company reclassed $17,431 ($41,629 of gross carrying amount, less accumulated depreciation of $24,198) to reflect the property, plant and equipment that are included in the assets held for sale related to the Transaction, as disclosed in Footnote 3 – Discontinued Operations.
Depreciation is calculated on the straight-line method over the estimated useful lives of the assets as follows:
|
Buildings (years)
|
40
|
|
|
||
|
Machinery and equipment (years)
|
5
|
-
|
20
|
|
|
|
Furniture and fixtures (years)
|
3
|
-
|
10
|
|
|
|
Computer hardware and software (years)
|
2
|
-
|
7
|
|
Leasehold improvements are depreciated over the shorter of the estimated useful life or the term of the lease.
Depreciation and amortization of property, plant and equipment amounted to $2,042, $2,259, and $2,890, for fiscal 2014, 2013, and 2012, respectively.
GOODWILL AND OTHER INTANGIBLE ASSETS
Goodwill and other intangible assets consist of the excess of the purchase price over the fair value of net assets acquired (goodwill) and other intangible assets (principally customer relationships, trademarks and tradenames). Values assigned to the respective assets are determined in accordance with ASC 805, Business Combinations and ASC 350, Intangibles – Goodwill and Other.
Goodwill and intangible assets with indefinite useful lives are required to be tested for impairment at least annually or more frequently if an event occurs or circumstances change that could more likely than not reduce the fair value of a reporting unit below its carrying amount. Intangible assets with estimable useful lives are required to be amortized over their respective estimated useful lives and reviewed for impairment whenever events or changes in circumstances indicate that the carrying amount may not be recoverable.
The Company conducts its goodwill and intangible assets with indefinite lives as of December 31 of each year. The Company assesses the impairment of its goodwill by determining its fair value and comparing the fair value to its carrying value. For goodwill impairment testing purposes, the Company has determined that it operates under one reporting unit.
The Company’s annual step one impairment testing as of December 31, 2012 indicated that the fair value of the Company was estimated to be less than its related carrying value. The fair value of the Company was estimated using a discounted cash flow and guideline company model. As a result of the step one testing, management determined that the goodwill balance of the Company was impaired and step two testing was necessary.
36
Step two of the goodwill test consists of performing a hypothetical purchase price allocation, under which the estimated fair value of the Company is allocated to its tangible and intangible assets based on their estimated fair values, with any residual amount being assigned to goodwill. During the step two analysis, it was determined that book value approximated fair value for the components of working capital except for finished goods and work-in-process inventory which was determined based on estimated selling prices less distribution costs and profit and costs to complete manufacture. Owned real estate and buildings were valued using recently completed real estate appraisals. Other property, plant and equipment items were valued using current market value estimates. The intangible assets related to customer relationships were valued using a present value of debt-free cash flow model and the trade names were valued using the relief-from-royalty model.
The models used to determine the fair value of the Company in step one and the intangible assets in step two relied heavily on management’s assumptions. These assumptions, which are significant to the calculated fair values, are considered Level 3 inputs under the fair value hierarchy established by ASC 820 – Fair value measurement and disclosures , as they are unobservable. The assumptions in step one included a discount rate, revenue growth rates, tax rates and operating margins. In addition, the step two assumptions included customer attrition rates and royalty rates. The discount rate represents the expected return on capital. The discount rate was determined using a target structure of 15% debt and 85% equity. The Company used the 20-year U.S. Treasury bond yield to determine the risk-free rate in its weighted average cost of capital calculation. The projected growth rates and terminal growth rates are primarily driven by management’s estimate of future performance, giving consideration to historical performance and existing and anticipated economic and market conditions. Attrition assumptions used to value customer relationships are based on historical experience and management estimates based on historical financial information. To determine the royalty rates used to value trade names, the Company used industry benchmarks from licensing transactions. The assumption for tax rates are based on management’s estimates of blended federal and state income tax rates. Operating margin assumptions are based management’s estimate of future performance, giving consideration to historical performance and projected economic and competitive conditions.
During fiscal 2013 the preliminary impairment analysis conducted at December 31, 2012 concluded that $78,609 of goodwill was impaired, which was recorded in the Company’s condensed consolidated statement of operations for the nine months ended December 31, 2012. Due to the complexity of the analysis which involved completion of fair value analyses and the resolution of certain significant assumptions, management finalized this goodwill impairment charge in the fourth quarter of fiscal 2013 by reducing the initial goodwill impairment charge by $829 to $77,780. Previous and subsequent analyses of goodwill did not indicate an impairment, therefore the amounts of impairment incurred during the fiscal year ended March 31, 2013 represent the cumulative amount of goodwill impairment charges as of March 31, 2014.
Changes in the carrying amount of goodwill were as follows:
|
Balance, March 31, 2012
|
$ | 107,801 | ||
|
Goodwill impairment charge
|
(77,780 | ) | ||
|
Balance, March 31, 2013
|
$ | 30,021 | ||
|
Amounts reclassified to assets held-for-sale
|
(10,877 | ) | ||
|
Balance, March 31, 2014
|
$ | 19,144 |
The book values, accumulated amortization and original useful life by asset class of the Company’s other intangible assets as of March 31, 2014 and 2013 are as follows:
|
March 31, 2014
|
March 31, 2013
|
|||||||||||||||||||||||||||
|
Weighted
Average
Remaining
Amortization
Period
(Years)
|
Gross
Carrying
Amount
|
Accumulated
Amortization
|
Net
Carrying
Amount
|
Gross
Carrying
Amount
|
Accumulated
Amortization
|
Net
Carrying
Amount
|
||||||||||||||||||||||
|
Trademarks/Tradenames not subject to amortization
|
na
|
$ | 569 | $ | - | $ | 569 | $ | 1,266 | $ | - | $ | 1,266 | |||||||||||||||
|
Trademarks subject to amortization (5 years)
|
1.4 | 2,100 | (1,505 | ) | 595 | 2,100 | (1,085 | ) | 1,015 | |||||||||||||||||||
|
Customer Relationships (20 years)
|
16.4 | 27,500 | (4,927 | ) | 22,573 | 43,200 | (8,927 | ) | 34,273 | |||||||||||||||||||
|
Intellectual Property (7 Years)
|
na
|
- | - | - | 400 | (368 | ) | 32 | ||||||||||||||||||||
|
Total
|
$ | 30,169 | $ | (6,432 | ) | $ | 23,737 | $ | 46,966 | $ | (10,380 | ) | $ | 36,586 | ||||||||||||||
37
At March 31, 2014, the Company reclassed $10,236 ($18,997 of gross carrying amount, less accumulated amortization of $8,761) to reflect the customer relationships and other intangible assets that are included in the assets held for sale related to the Transaction, as disclosed in Footnote 3 – Discontinued Operations.
The amortization expense for other intangible assets amounted to $1,795, $1,795, and $1,795 for fiscal 2014, 2013, and 2012, respectively. Estimated amortization expense related to these intangibles for the five succeeding fiscal years is as follows:
|
Fiscal Year
|
Amount
|
|||||
|
2015
|
$ | 1,795 | ||||
|
2016
|
1,550 | |||||
|
2017
|
1,375 | |||||
|
2018
|
1,375 | |||||
|
2019
|
1,375 | |||||
The Company evaluates trademarks with indefinite lives annually to determine whether events or circumstances continue to support the indefinite useful life. No impairments of such assets were identified in fiscal 2014, 2013, and 2012. No trademarks were determined to have finite useful lives in any of the periods presented, with the exception of the trademarks acquired in the AVID acquisition, which have a useful life of 5 years.
ACCOUNTS PAYABLE
Cash overdrafts are included in accounts payable. Such cash book overdrafts amounted to $5,690 and $5,372 at March 31, 2014 and 2013, respectively. For cash flow disclosure purposes, the Company reports the cash book overdrafts as an operating activity as opposed to a financing activity.
DEFERRED FINANCING COSTS
The Company has incurred costs in obtaining financing. These costs of approximately $1,068 as of March 31, 2014 are included in other assets and are being amortized over the life of the related financing arrangements through fiscal 2019. Total accumulated amortization was approximately $240 and $882 at March 31, 2014 and 2013, respectively. In connection with the Company’s debt refinancing in May 2013 (see Footnote 8 – Long-Term Debt), the net balance of deferred financing costs associated with the Company’s prior debt was charged to operations during the twelve months ending March 31, 2014.
INCOME TAXES
We account for income taxes under the asset and liability method. Deferred tax assets and liabilities are recognized for the future tax consequences attributable to differences between the financial statement carrying amounts of existing assets and liabilities and their respective tax bases and operating loss and tax credit carry forwards. Deferred tax assets and liabilities are measured using enacted tax rates expected to apply to taxable income in the years in which those temporary differences are expected to be recovered or settled. The effect on deferred tax assets and liabilities from a change in tax rates is recognized in income in the period that includes the enactment date.
We must also assess the likelihood that deferred tax assets will be realized and, based on this assessment establish a valuation allowance, if required. The determination of our valuation allowance involves assumptions, judgments, and estimates, including forecasted earnings, future taxable income, and the relative proportions of revenue and income before taxes in the various state and local jurisdictions in which we operate. To the extent we establish a valuation allowance or change the valuation allowance in a period, we reflect the change with a corresponding increase or decrease to our tax provision in our consolidated statement of operations.
We are also required to compute our current income tax expense in each federal, state, and local jurisdiction in which we operate. Our judgments, assumptions, and estimates relative to the current provision for income tax take into account current tax laws, our interpretation of current tax laws, and possible outcomes of current and future audits. Changes in tax laws or our interpretation of tax laws and the resolution of current and future tax audits could significantly impact the amounts provided for income taxes in our consolidated balance sheet and consolidated statement of operations.
In accordance with the provisions of ASC 740, Income Taxes, we recognize in our financial statements only those tax positions that meet the more-likely-than-not-recognition threshold. For those tax positions where it is more-likely-than-not that a tax benefit will be sustained, we have recorded the largest amount of tax benefit with a greater than 50% likelihood of being realized upon settlement. For those tax positions where it is not more-likely-than-not that a tax benefit will be sustained, no tax benefit has been recognized in the consolidated financial statements. Interest and penalties associated with income tax matters are included in the provision for income taxes in our consolidated statements of operations. The provisions of ASC 740 did not have a material impact on our consolidated financial position.
38
CURRENCY
All of the Company’s sales and purchases were transacted in U.S. dollars.
STOCK-BASED COMPENSATION
The Company recorded stock-based compensation expense for the fair value of non-qualified stock options and restricted stock granted under its stock plans in accordance with the provisions of ASC 718, Stock Compensation.
EARNINGS (LOSS) PER SHARE INFORMATION
Basic earnings (loss) per share is based on the weighted average number of common shares outstanding without consideration of potential common stock. Diluted earnings (loss) per share is based on the weighted average number of common and potential common shares outstanding. The calculation takes into account the shares that may be issued upon exercise of stock options and restricted stock, reduced by the shares that may be repurchased with the funds received from the exercise, based on average prices during the year.
REVENUE RECOGNITION
Revenue from the sale of products is recognized when the Company meets all of the criteria specified in ASC 605, Revenue Recognition. These criteria include:
• Persuasive evidence of an arrangement exists,
• Delivery has occurred or services have been rendered,
• The seller’s price to the buyer is fixed or determinable and
• Collection of the resulting receivable is reasonably assured.
Customer purchase orders and/or sales agreements evidence the Company’s sales arrangements. These purchase orders and sales agreements specify both selling prices and quantities, which are the basis for recording sales revenue. Any deviation from this policy requires management review and approval. Trade terms are negotiated on a customer by customer basis and for the majority of the Company’s sales include that title and risk of loss pass from the Company to the customer when the Company ships products from its facilities, which is when revenue is recognized. In instances of shipments made on consignment, revenue is deferred until a customer indicates to the Company that it has used the Company’s products. The Company conducts ongoing credit evaluations of its customers and ships products only to customers that satisfy its credit evaluations. Products are shipped primarily to distributors at an agreed upon list price. Distributors then resell the products primarily to hospitals and depending on agreements between the Company, the distributors and the hospitals, the distributors may be entitled to a rebate. The Company deducts all rebates from sales and has a provision for allowances based on historical information for all rebates that have not yet been processed.
BUSINESS CONCENTRATIONS AND MAJOR CUSTOMERS
The Company manufactures and distributes disposable medical products principally to medical product distributors and hospitals located throughout the United States. The Company performs credit evaluations of its customers’ financial condition and does not require collateral. Receivables are generally due within 30 – 90 days. Credit losses relating to customers have historically been minimal and within management’s expectations.
Sales to Owens & Minor, Inc. and Cardinal Health Inc., (the “Distributors”) accounted for approximately 45% and 19% of net sales, respectively for fiscal 2014, 41% and 22% of net sales, respectively for fiscal 2013 and 44% and 22% of net sales, respectively for fiscal 2012. Although the Distributors may be deemed in a technical sense to be major purchasers of the Company’s products, they typically serve as a distributor between the end user and the Company and do not make significant purchases for their own account. The Company, therefore, does not believe it is appropriate to include the Distributors when evaluating customer concentrations.
A significant portion of the Company’s raw materials are purchased from China. All such purchases are transacted in U.S. dollars. The Company’s financial results, therefore, could be impacted by factors such as foreign currency exchange rates or weak economic conditions in foreign countries in the procurement of such raw materials should our suppliers increase prices to account for changes in foreign exchange rates.
39
FREIGHT AND DISTRIBUTION COSTS
Freight costs, which consist primarily of freight costs paid to third party carriers amounted to $6,323, $6,521 and $9,324 for fiscal 2014, 2013 and 2012, respectively, and are included in cost of sales. Distribution costs, which consist primarily of the salaries, warehousing and related expenses associated with the storing, packing and shipping costs of our products amounted to $3,249, $2,931 and $2,422 for fiscal 2014, 2013, and 2012, respectively, and are included in selling, general and administrative expenses.
PRODUCT DEVELOPMENT COSTS
Product development costs which are expensed as incurred were $1,171, $1,862, and $1,921 for fiscal 2014, 2013, and 2012, respectively, and are included as a component of selling, general and administrative expenses.
ADVERTISING COSTS
Advertising costs charged to expense, as incurred, were $6, $41, and $20, for fiscal 2014, 2013 and 2012, respectively.
FAIR VALUE MEASUREMENTS
We are required to record certain assets and liabilities at fair value and to make disclosures about the fair value of certain other assets and liabilities. Fair value is the price the Company would receive to sell an asset or pay to transfer a liability in an orderly transaction with a market participant at the measurement date. In the absence of active markets for identical assets or liabilities, such measurements involve developing assumptions based on market observable data and, in the absence of such data, internal information that is consistent with what market participants would use in a hypothetical transaction that occurs at the measurement date.
Observable inputs reflect market data obtained from independent sources, while unobservable inputs reflect our market assumptions. Preference is given to observable inputs. These two types of inputs create the following fair value hierarchy:
|
·
|
Level 1 – Quoted prices for identical instruments in active markets.
|
|
·
|
Level 2 – Quoted prices for similar instruments in active markets; quoted prices for identical or similar instruments in markets that are not active; and model-derived valuations whose inputs are observable or whose significant value drivers are observable.
|
|
·
|
Level 3 – Significant inputs to the valuation model are unobservable.
|
IMPACT OF RECENTLY ISSUED ACCOUNTING PRONOUNCEMENTS
PRESENTATION OF AN UNRECOGNIZED TAX BENEFIT WHEN A NET OPERATING LOSS CARRYFORWARD, A SIMILAR TAX LOSS, OR A TAX CREDIT CARRYFORWARD EXISTS
In July 2013, Financial Accounting Standards Board (“FASB”) issued Accounting Standards Update (“ASU”) 2013-11 relating to income taxes (FASB ASC 740 – Income Taxes), which provides guidance on the presentation of unrecognized tax benefits. The intent is to better reflect the manner in which an entity would settle at the reporting date any additional income taxes that would result from the disallowance of a tax position when net operating loss carryforwards, similar tax losses, or tax credit carryforwards exist. This pronouncement is effective for fiscal years, and interim periods within those years, beginning after December 15, 2013. We are evaluating the impact that the adoption of this standard may have on our consolidated financial statements.
INDEFINITE-LIVED INTANGIBLE ASSETS IMPAIRMENT TESTING
In July 2012, the FASB issued ASU 2012-02, Testing Indefinite-Lived Intangible Assets for Impairment (“ASU 2012-02”), which amended the provisions of FASB ASC 350, Intangibles - Goodwill and Other. ASU 2012-02 permits an entity to make a qualitative assessment of whether it is more likely than not that an indefinite-lived intangible asset is less than its carrying amount before applying the second step of the impairment test. If an entity concludes that it is not more likely than not that the fair value of an indefinite-lived intangible asset is less than its carrying amount, it would not be required to perform the second step of the impairment test for that indefinite-lived intangible asset. The new standard is effective for annual and interim indefinite-lived intangible assets impairment tests performed in fiscal years beginning after December 15, 2012, which for us was April 1, 2013. We adopted this amended guidance in the third quarter of fiscal 2014. The adoption of this guidance did not impact our financial position or results of operations.
40
2. BUSINESS ACQUISITIONS
On August 27, 2010, the Company completed its acquisition of AVID, a provider of custom procedure trays to the healthcare industry, in which the Company acquired the outstanding shares of common stock of AVID for $62,550. During fiscal 2012, the Company recorded $125 in final purchase price adjustments. The purpose of this acquisition is to expand our product line offering into custom procedure trays to augment our existing product classes and expand our market presence in clinical care areas of acute care facilities and surgery centers throughout the country.
3. DISCONTINUED OPERATIONS
On March 12, 2014, the Company entered into a purchase agreement with an affiliate of Inteplast Group, Ltd. for the sale of the Company’s wholly owned subsidiary, Medegen Medical Products, LLC, and certain other assets which comprised the Company’s Patient Care business unit (the “Transaction”). The Company retained the cash, accounts receivable and all liabilities associated with the business unit except for an environmental liability. On June 2, 2014, the Company completed the sale of its Patient Care business unit for gross proceeds of $78,628, subject to customary post-closing adjustments (see Footnote 15 – Subsequent Events).
As of March 31, 2014, the Company has classified the assets and liabilities subject to the purchase agreement as held for sale and presented the results of operations of the Patient Care business unit for fiscal years 2014, 2013 and 2012 as discontinued operations in the accompanying consolidated statements of operations.
The aggregate components of the assets and liabilities classified as held for sale, are as follows;
|
March 31, 2014
|
||||
|
Asset held for sale:
|
||||
|
Inventories, net
|
$ | 18,369 | ||
|
Property, plant and equipment, net
|
17,431 | |||
|
Goodwill
|
10,877 | |||
|
Other intangible assets, net
|
10,236 | |||
|
Other assets, net
|
4,200 | |||
|
Total assets held for sale, current
|
$ | 61,113 | ||
|
Liabilities held for sale:
|
||||
|
Other liabilities
|
$ | 4,200 | ||
|
Total liabilities held for sale, current
|
$ | 4,200 | ||
The following table summarizes the results of the Company’s discontinued operations;
|
Fiscal Year-Ended March 31,
|
||||||||||||
|
2014
|
2013
|
2012 | ||||||||||
|
Net sales
|
$ | 145,882 | $ | 156,830 | $ | 164,588 | ||||||
|
Cost of sales
|
125,476 | 135,358 | 143,771 | |||||||||
|
Selling, general and administrative expenses
|
15,584 | 16,122 | 18,185 | |||||||||
|
Income from discontinued operations before income taxes
|
4,822 | 5,350 | 2,632 | |||||||||
|
Income tax
|
1,737 | 2,152 | 989 | |||||||||
|
Income from discontinued operations, net of income taxes
|
$ | 3,085 | $ | 3,198 | 1,643 | |||||||
41
4. INVENTORIES, NET
Inventories, which are stated at the lower of cost (first-in, first-out) or market, consist of the following:
|
March 31,
|
||||||||
|
2014
|
2013
|
|||||||
|
Finished goods, net
|
$ | 15,582 | $ | 30,531 | ||||
|
Raw materials, net
|
10,367 | 17,766 | ||||||
|
Work in progress, net
|
6,769 | 4,717 | ||||||
|
Total, net
|
$ | 32,718 | $ | 53,014 | ||||
At March 31, 2014, the Company reclassed $18,369 ($19,156 of inventories, less provisions for slow moving, excess and obsolete inventory of $787) to reflect the inventories that are included in the assets held for sale related to the Transaction, as disclosed in Footnote 3 – Discontinued Operations.
On a continuing basis, inventory quantities on hand are reviewed and an analysis of the provision for slow moving, excess and obsolete inventory is performed based primarily on the Company’s sales history and anticipated future demand. Such provision for slow moving, excess and obsolete inventory approximated $953 and $1,091 at March 31, 2014 and 2013, respectively.
In fiscal 2013 we identified an overstatement of inventories at our West Virginia location that arose during the five year period ended March 31, 2012 and the nine months ended December 31, 2012. After consideration of both quantitative and qualitative factors, we determined the amounts were not material to any of those prior period financial statements or the fiscal 2013 consolidated results of operations and thus corrected the inventory balance in the fiscal year 2013 and the three months ended March 31, 2013. The adjustment resulted in a reduction of inventory of $829, with a corresponding increase in cost of sales in the consolidated statement of operations for the fiscal year ended March 31, 2013.
5. INCOME TAXES
Income tax expense related to continuing operations consists of the following:
|
Fiscal Year Ended March 31,
|
||||||||||||
|
2014
|
2013
|
2012
|
||||||||||
|
Current:
|
||||||||||||
|
Federal
|
$ | 1,064 | $ | (20,627 | ) | $ | - | |||||
|
State
|
601 | (1,124 | ) | - | ||||||||
|
Deferred
|
(503 | ) | - | 283 | ||||||||
| $ | 1,162 | $ | (21,751 | ) | $ | 283 | ||||||
The following table indicates the significant elements contributing to the difference between the statutory federal tax rate and the Company’s effective tax rate on income from continuing operations for fiscal years 2014, 2013, and 2012:
|
Fiscal Year Ended March 31,
|
||||||||||||
|
2014
|
2013
|
2012
|
||||||||||
|
Tax at federal statutory rate
|
35.0 | % | 35.0 | % | 35.0 | % | ||||||
|
State taxes, net of federal benefit
|
17.7 | 1.7 | (0.9 | ) | ||||||||
|
Net non-deductible expenses
|
(0.6 | ) | - | (5.1 | ) | |||||||
|
Non-deductible goodwill impairment charge
|
- | (9.1 | ) | - | ||||||||
|
Increase in valuation allowance
|
(0.9 | ) | (0.3 | ) | (46.4 | ) | ||||||
|
Effective tax rate
|
51.2 | % | 27.3 | % | (17.4 | )% | ||||||
42
The components of deferred tax assets and deferred tax liabilities at March 31, 2014 and 2013 are as follows:
|
March 31,
|
||||||||
|
2014
|
2013
|
|||||||
|
Deferred tax assets:
|
||||||||
|
Stock-based compensation
|
$ | 2,553 | $ | 2,209 | ||||
|
Inventory reserve
|
844 | 567 | ||||||
|
Allowance for doubtful accounts
|
250 | 333 | ||||||
|
Accrued expenses
|
440 | 720 | ||||||
|
Net state operating loss carryforwards of acquired company
|
1,288 | 1,037 | ||||||
|
Capital leases
|
5,483 | 5,396 | ||||||
| 10,858 | 10,262 | |||||||
|
Valuation allowance
|
(1,017 | ) | (1,037 | ) | ||||
|
Total deferred tax assets
|
$ | 9,841 | $ | 9,225 | ||||
|
Deferred tax liabilities:
|
||||||||
|
Goodwill
|
$ | 8,127 | $ | 6,356 | ||||
|
Depreciation and amortization
|
6,995 | 7,874 | ||||||
|
Total deferred tax liabilities
|
$ | 15,122 | $ | 14,230 | ||||
|
Net deferred tax liability
|
$ | 5,281 | $ | 5,005 | ||||
In assessing whether the deferred tax asset is realizable, management considers whether it is more likely than not that some portion or all of the deferred tax assets will be realized. The ultimate realization of deferred tax assets is dependent upon the generation of future taxable income during the periods in which those temporary differences become deductible.
The Company maintains a valuation allowance against certain state net operating loss carry forwards as the Company could not conclude that it will be able to utilize the state net operating loss carry forwards on a more-likely-than-not basis. During fiscal 2014, the Company decreased its valuation allowance by $20. As of March 31, 2014, the Company’s valuation allowance amounted to $1,017.
A reconciliation of the beginning and ending amount of unrecognized tax benefits, excluding interest and penalties, is as follows:
|
Balance at March 31, 2012
|
$ | 21 | ||
|
Additions based on tax positions taken in the current and prior years
|
526 | |||
|
Balance at March 31, 2013
|
$ | 547 | ||
|
Additions based on tax positions taken in the current and prior years
|
340 | |||
|
Balance at March 31, 2014
|
$ | 887 |
The Company records accrued interest and penalties related to income tax matters in the provision for income taxes in the accompanying consolidated statement of operations. The accrued gross interest and penalties were $125 as of March 31, 2014 and $48 as of March 31, 2013. In addition, the Company believes that the uncertain tax positions will not materially change within the next twelve months.
The Company is subject to taxation by the U.S. Government and various state and local jurisdictions. The Company’s U.S. federal tax return and most state jurisdictions remain open to examination for the fiscal year ended March 31, 2011 through March 31, 2014. During fiscal 2014, the Company concluded a New York State examination for the fiscal years ended March 31, 2011, 2010 and 2009 with an immaterial assessment. The Company is currently subject to income tax audits in New Jersey and Massachusetts, however, the examinations are preliminary.
43
6. ACCRUED EXPENSES
Accrued expenses consist of the following:
|
March 31,
|
||||||||
|
2014
|
2013
|
|||||||
|
Accrued accounts payable
|
$ | 6,219 | $ | 7,488 | ||||
|
Accrued bonuses
|
4,109 | 1,825 | ||||||
|
Employee compensation and benefits
|
3,025 | 3,022 | ||||||
|
Other accrued liabilities
|
2,291 | 1,887 | ||||||
|
Accrued distributor fees
|
2,011 | 3,608 | ||||||
|
Group purchasing organization fees
|
1,977 | 1,569 | ||||||
|
Freight and duty
|
901 | 1,270 | ||||||
|
Professional fees
|
767 | 1,178 | ||||||
|
Commissions
|
624 | 768 | ||||||
|
Book cash overdraft
|
- | 2,491 | ||||||
|
Total accrued expenses
|
$ | 21,924 | $ | 25,106 | ||||
7. LEASES AND RELATED PARTY TRANSACTIONS
As part of the assets and liabilities acquired as a result of the AVID acquisition, the Company assumed a capital lease obligation for the AVID facility located in Toano, Virginia. The facility, which includes a 185,000 square foot manufacturing and warehouse building and approximately 12 acres of land, is owned by an affiliate of Micpar Realty, LLC (“Micpar”). AVID’s founder, former CEO and former principal stockholder, is a part owner of Micpar and subsequent to the acquisition of AVID was appointed to the Company’s board of directors. As of August 2012, he no longer served on the Company’s board of directors. As of March 31, 2014, the capital lease requires monthly payments of $129 with increases of 2% per annum. The lease contains provisions for an option to buy January 2015 and expires in March 2029. The effective rate on the capital lease obligation is 9.9%.
The gross and net book value of the assets under the capital lease are as follows:
|
March 31,
|
||||||||
|
2014
|
2013
|
|||||||
|
Capital lease, gross
|
$ | 11,409 | $ | 11,409 | ||||
|
Less: accumulated amortization
|
(2,200 | ) | (1,586 | ) | ||||
|
Capital lease, net
|
$ | 9,209 | $ | 9,823 | ||||
The amortization expense associated with the capital lease amounted to $614, of which $141 is included in cost of sales and the remaining $473 is recorded in selling, general and administrative expenses.
The Company also leases certain equipment, vehicles and office facilities under non-cancelable operating leases expiring in various years though fiscal 2020.
44
As of March 31, 2014, the Company was obligated under non-cancelable operating leases and capital leases for equipment, vehicles and office, warehousing and manufacturing facilities for minimum annual rental payments as follows:
|
Fiscal Year
|
Capital Lease
|
Operating
Leases
|
||||||
|
2015
|
$ | 1,549 | $ | 1,030 | ||||
|
2016
|
1,580 | 791 | ||||||
|
2017
|
1,611 | 75 | ||||||
|
2018
|
1,643 | 63 | ||||||
|
2019
|
1,676 | 30 | ||||||
|
Thereafter
|
18,722 | - | ||||||
|
Total minimum lease payments
|
$ | 26,781 | 1,989 | |||||
|
Less: Amounts representing interest
|
(13,310 | ) | ||||||
|
Present value of minimum lease payments
|
13,471 | |||||||
|
Less: Current portion of capital lease obligations
|
(226 | ) | ||||||
|
Long-term portion of capital lease obligations
|
$ | 13,245 | ||||||
Rental expense under operating leases amounted to $628, $579, and $488 during fiscal 2014, 2013, and 2012, respectively.
A current member of our board of directors is currently a minority shareholder of Custom Healthcare Systems (“CHS”), an assembler and packager of Class 1 medical products. CHS is a supplier to our AVID facility located in Toano, Virginia for small kits and trays. They also purchase sterile instruments from our facility located in Arden, North Carolina.
During the twelve months ended March 31, 2014 and 2013, the amounts sold to and purchased from CHS are as follows:
|
March 31,
|
||||||||
|
2014
|
2013
|
|||||||
|
Sold to CHS
|
$ | 1,074 | $ | 964 | ||||
|
Purchased from CHS
|
1,729 | 1,861 | ||||||
The following table represents the amounts due from and due to CHS:
|
March 31,
|
||||||||
|
2014
|
2013
|
|||||||
|
Due from CHS
|
$ | 330 | $ | 265 | ||||
|
Due to CHS
|
14 | 45 | ||||||
8. LONG-TERM DEBT
Long-term debt consists of the following:
|
March 31,
|
||||||||
|
2014
|
2013
|
|||||||
|
Revolving loans
|
$ | 29,976 | $ | 4,700 | ||||
|
Term loan
|
10,136 | 48,000 | ||||||
|
Total outstanding
|
$ | 40,112 | $ | 52,700 | ||||
|
Less: current portion
|
40,112 | 1,370 | ||||||
|
Total long-term debt
|
$ | - | $ | 51,330 | ||||
On May 17, 2013, the Company entered into a credit agreement (the “New Credit Agreement”), among the Company, as borrower and Wells Fargo Bank, National Association, as administrative agent and lender. The New Credit Agreement provides for a maximum borrowing capacity of $65,000 consisting of the following loans: (1) a $11,505 secured term loan (the “Term Loan”) fully drawn by the Company on May 17, 2013, (2) $5,000 in unsecured delayed draw term loans (collectively, the “Delayed Draw Term Loans”) and (3) up to $53,495 in revolving loans (collectively, the “Revolving Loans”), which may be reduced by the amount of any outstanding Delayed Draw Term Loans drawn by the Company. The proceeds from the New Credit Agreement were used to repay the Prior Credit Agreement (as described below). This repayment took place on June 2, 2014 commensurate with the completion of the divestiture of the Patient Care business unit. Consequently, the entire outstanding balance has been classified as current on our balance sheet as of March 31, 2014.
45
The Revolving Loans will be used to finance the working capital needs and general corporate purposes of the Company and for permitted acquisitions. The Term Loan and Revolving Loan mature on May 17, 2018. The commitments with respect to the Delayed Draw Term Loans terminate on May 17, 2015 and any Delayed Draw Term Loans drawn by the Company also mature on May 17, 2015. The Term Loan amortizes in consecutive monthly installments, each in the principal amount of $137, commencing June 1, 2013. Any Delayed Draw Term Loan drawn by the Company will amortize in consecutive monthly installments, each in the principal amount equal to the result of (1) the original principal amount of such Delayed Draw Term Loan divided by (2) the number of months remaining from the date the Delayed Draw Term Loan was drawn until May 17, 2015. Any undrawn commitments under the Delayed Draw Term Loans will be reduced by $208 on each calendar month, commencing June 1, 2013.
In the event the outstanding principal amount of the Term Loan exceeds the sum of (1) a specified percentage of the value of real property (calculated at least twice during the term of the New Credit Agreement) and (2) a specified percentage of the value of equipment (calculated at least once per calendar year), we will be required to prepay the excess. The Revolving Loans are subject to a borrowing base such that the total outstanding Revolving Loans may not exceed specified percentages of the value of eligible receivables and finished goods, raw materials, work-in-process and in-transit inventory, all calculated at least monthly. In the event the outstanding principal amount of Revolving Loans under the New Credit Agreement exceeds this borrowing base, the Company will be required to prepay the excess.
Term Loans outstanding under the New Credit Agreement bear interest at a rate per annum equal to, at the election of the Company, (1) LIBOR Rate (as defined in the New Credit Agreement) plus a margin ranging from 2.50% to 3.00%, depending on the Average Access Availability (as defined in the New Credit Agreement) at the time of calculation, or (2) Base Rate (as defined in the New Credit Agreement) plus a margin ranging from 1.50% to 2.00%, depending on the Average Access Availability at the time of calculation. Revolving Loans outstanding under the New Credit Agreement will bear interest at a rate per annum equal to, at the election of the Company, (i) LIBOR Rate plus a margin ranging from 2.00% to 2.50%, depending on the Average Access Availability at the time of calculation, or (ii) Base Rate plus a margin ranging from 1.00% to 1.50%, depending on the Average Access Availability at the time of calculation. Additionally, the Company is required to pay an unused line fee at a rate per annum ranging from 0.375% to 0.50% on the daily unused amount of the Revolving Loan commitments of the Lender during the period for which the payment is made, payable monthly in arrears. If drawn, Delayed Draw Term Loans outstanding under the New Credit Agreement will bear interest at a rate per annum equal to, at the election of the Company, (1) LIBOR Rate plus a margin ranging from 4.25% to 4.75%, depending on the Average Access Availability at the time of calculation, or (2) Base Rate plus a margin ranging from 3.25% to 3.75%, depending on the Average Access Availability at the time of calculation.
During fiscal 2014, the average interest rate on the Term Loan under the New Credit Agreement approximated 2.86% and the average interest rate on the Revolving Loans under the New Credit Agreement approximated 3.22%.
Borrowings under the New Credit Agreement are collateralized by substantially all the assets of, and are fully guaranteed by, the Company and its subsidiaries. The New Credit Agreement contains certain restrictive covenants, including, among others, covenants limiting our ability to incur indebtedness, grant liens, guarantee obligations, sell assets, make loans and investments, enter into merger and acquisition transactions, and declare or make dividends. The Company committed to certain post-closing conditions, including providing monthly financial statements, annual updates of financial projections, and the filing of a mortgage on the Company’s Brentwood, New York corporate headquarters. If the Company’s Excess Availability (as defined in the New Credit Agreement) falls below a specified amount, the Company will become subject to financial covenants relating to a minimum fixed charge coverage ratio of 1.00 to 1.00, measured on a month-end basis. If the Company draws a Delayed Draw Term Loan, the Company will be required to comply with a maximum leverage financial ratio covenant ranging from 3:00 to 1:00 to 3.25 to 1:00, measured on a month-end basis.
On June 2, 2014, the Company entered into the First Amendment to Credit Agreement and Guaranty and Security Agreement (the “Amendment”), among the Company, as borrower, and Wells Fargo Bank, National Association, as administrative agent and lender (the “Lender”).
The Amendment amended the terms of the New Credit Agreement that the Company entered into with the Lender on May 17, 2013, as follows: (a) the Lender’s maximum total loan commitments under the Credit Agreement were reduced from $65,000 to $55,000, (b) provided no Event of Default (as defined in the Credit Agreement) occurs and is continuing, the unused line fee (the “Unused Line Fee”) that the Company is required to pay the Lender, has been capped at 0.375% of the daily unused amount of the revolving loan commitments of the Lender during the period for which the payment is made, through and including December 31, 2014, and (c) solely for purposes of calculating the Unused Line Fee, the aggregate amount of the Lender’s revolving loan commitments was deemed to be the lesser of $30,000 and the actual aggregate amount of the Lender’s revolving loan commitments.
As a result of the Transaction, the Company repaid all amounts outstanding on both the Revolving and Term loans under the New Credit Agreement subsequent to year end and has recorded all amounts due related to the New Credit Agreement as current as of March 31, 2014.
The Company had unamortized financing costs of $1,068 and $879 in other assets, net as of March 31, 2014 and 2013, respectively. Of the amount at March 31, 2014, approximately $216 is related to the Term Loan and, as a result of the Transaction, will be charged to interest expense during the three months ending June 30, 2014. The remaining balance represents costs associated with the Revolving Loans and will be amortized over the remaining life of the New Credit Agreement using the straight-line interest method.
On June 7, 2012, the Company entered into the Second Amended and Restated Credit Agreement (the “Prior Credit Agreement”) with certain lenders and JPMorgan Chase Bank, N.A. acting as administrative agent for the lenders. The Prior Credit Agreement provided the Company with total borrowings of up to $76,000, consisting of (1) a secured term loan with a principal amount of $51,000 and (2) a secured revolving credit facility, which amounts may be borrowed, repaid and re-borrowed up to $25,000. Both the term loan and the revolving credit facility bore interest at LIBOR plus 4% under the terms of the Prior Credit Agreement. The average interest rate on the term loan under the Prior Credit Agreement approximated 6.25% during the fiscal year ended March 31, 2014, and the average interest rate on the revolving credit facility under the Prior Credit Agreement approximated 4.25% during the fiscal year ended March 31, 2014.
46
On May 17, 2013, a portion of the proceeds from the New Credit Agreement was used to repay all amounts owed under the Prior Credit Agreement. Upon such repayment, all obligations under the Prior Credit Agreement were satisfied and the agreement was terminated.
9. FAIR VALUE MEASUREMENTS
Due to their maturities and/or variable interest rates, certain financial instruments have fair values that approximate their carrying values. These instruments include cash and cash equivalents, accounts receivable, trade payables and our outstanding debt under the Company’s term loan and revolving credit facility. The book value and the fair value of the Company’s capital lease obligation amounted to $13,471 and $15,479, respectively as of March 31, 2014. The fair value was determined based on the Company’s current incremental borrowing rate and is considered a Level 3 input. As discussed in Note 1 – Organization and Summary of Significant Accounting Policies, Goodwill and Other Intangible Assets, Level 3 inputs were used in the fair value calculation related to the step-one impairment analysis as well as the fair value calculation of the Company’s property, plant and equipment, inventories, capital lease and other intangible assets in the step-two impairment analysis during the year ended March 31, 2013.
10. EARNINGS (LOSS) PER SHARE
The following is a reconciliation of the numerator and denominator of the basic and diluted net earnings (loss) per share computations for fiscal 2014, 2013, and 2012, respectively.
|
March 31,
|
||||||||||||
|
2014
|
2013
|
2012
|
||||||||||
|
Numerator :
|
||||||||||||
|
Income (loss) from continuing operations before extraordinary gain
|
$ | 1,107 | $ | (58,054 | ) | $ | (1,917 | ) | ||||
|
Income (loss) from discontinued operations, net of income taxes (Footnote 3)
|
3,085 | 3,198 | 1,643 | |||||||||
|
Extraordinary gain (net of tax expense) (Footnote 13)
|
- | - | 455 | |||||||||
|
Net income (loss) for basic and dilutive earnings per share
|
$ | 4,192 | $ | (54,856 | ) | $ | 181 | |||||
|
Denominator :
|
||||||||||||
|
Denominator for basic earnings per share - weighted average shares
|
16,391 | 16,391 | 16,391 | |||||||||
|
Effect of dilutive securities:
|
||||||||||||
|
Employee and director stock options
|
75 | - | - | |||||||||
|
Denominator for diluted earnings per share - adjusted weighted average shares
|
16,466 | 16,391 | 16,391 | |||||||||
|
Basic earnings (loss) per share :
|
||||||||||||
|
Net income (loss) from continuing operations, before extraordinary gain
|
$ | 0.07 | $ | (3.54 | ) | $ | (0.12 | ) | ||||
|
Net income from discontinued operations
|
$ | 0.19 | $ | 0.19 | $ | 0.10 | ||||||
|
Extraordinary gain, net of income taxes
|
$ | - | $ | - | $ | 0.03 | ||||||
|
Net income (loss)
|
$ | 0.26 | $ | (3.35 | ) | $ | 0.01 | |||||
|
Diluted earnings (loss) per share :
|
||||||||||||
|
Net income (loss) from continuing operations, before extraordinary gain
|
$ | 0.07 | $ | (3.54 | ) | $ | (0.12 | ) | ||||
|
Net income from discontinued operations
|
$ | 0.18 | $ | 0.19 | $ | 0.10 | ||||||
|
Extraordinary gain, net of income taxes
|
$ | - | $ | - | $ | 0.03 | ||||||
|
Net income (loss)
|
$ | 0.25 | $ | (3.35 | ) | $ | 0.01 | |||||
Excluded from the calculation of diluted earnings (loss) per share are options to purchase 1,429,472 shares in fiscal, 2014, 1,407,270 shares in fiscal 2013, and 1,329,240 shares in fiscal 2012, as their inclusion would have been anti-dilutive.
11. STOCKHOLDERS’ EQUITY AND STOCK PLANS
The Company accounts for its three stock-based compensation plans in accordance with the provisions of ASC 718, Stock Compensation. Under the provisions of ASC 718, stock-based compensation cost is measured at the grant date, based on the calculated fair value of the related award, and is recognized as an expense over the service period applicable to the grantee. The service period is the period of time that the grantee must provide services to the Company before the stock-based compensation is fully vested.
47
STOCK OPTIONS
The Company currently grants stock options under the 1989 Non-Qualified Stock Option Plan (the “Non-Qualified Option Plan”), the 1994 Stock Incentive Plan (the “Incentive Plan”) and the 1996 Non-Employee Director Stock Option Plan (the “Director Plan”). The Non-Qualified Option Plan was approved by the Company’s Board of Directors and stockholders and provides for the grant of stock options with an exercise price equal to the fair market price or at a value that is not less than 85% of the fair market value on the date of grant and are exercisable in three installments on the second, third and fourth anniversary of the date of grant. The Incentive Plan was adopted by the Company’s Board of Directors and stockholders and provides for the granting of incentive stock options, shares of restricted stock and non-qualified stock options to all officers and key employees of the Company and its affiliates at an exercise price that may not be less than the fair market value of a share of common stock at the time of grant. The Director Plan was approved by the stockholders in August 1996 and as amended, grants each non-employee director of the Company an option to purchase 7,500 shares of the Company’s common stock after each year of service. All options granted under the above plans expire from five to ten years from the date of grant unless the employment is terminated, in which event, subject to certain exceptions, the options terminate two months subsequent to date of termination.
RESTRICTED STOCK AWARDS
Grants of restricted stock are common stock awards granted to recipients with specified vesting provisions. The restricted stock issued vests based upon the recipients continued service over time (five-year vesting period). The Company estimates the fair value of restricted stock based on the Company’s closing stock price on the date of grant.
The following is a summary of the changes in restricted stock granted under the Incentive Plan for the fiscal years presented:
|
Fiscal Year Ended March 31,
|
||||||||||||||||||||||||
|
2014
|
2013
|
2012
|
||||||||||||||||||||||
|
Shares
|
Weighted
Average |
Shares
|
Weighted
PriceAverage
|
Shares
|
Weighted
Average |
|||||||||||||||||||
|
Beginning Balance
|
5,625 | $ | 12.58 | 7,500 | $ | 12.58 | 7,967 | $ | 12.74 | |||||||||||||||
|
Granted
|
- | - | - | - | - | - | ||||||||||||||||||
|
Vested
|
(1,875 | ) | $ | 12.58 | (1,875 | ) | $ | 12.58 | (467 | ) | $ | 15.31 | ||||||||||||
|
Cancelled
|
- | - | - | - | - | - | ||||||||||||||||||
|
Ending Balance
|
3,750 | $ | 12.58 | 5,625 | $ | 12.58 | 7,500 | $ | 12.58 | |||||||||||||||
VALUATION ASSUMPTIONS FOR STOCK OPTION GRANTS
The fair value of each option grant is estimated on the date of the grant using the Black-Scholes options pricing model. Use of a valuation model requires management to make certain assumptions with respect to selected model inputs. The expected term of the options is based on evaluations of historical and expected future employee exercise behavior. The risk-free rate is based on the U.S. Treasury rates at the date of grant with maturity dates approximately equal to the life of the grant. The expected volatility is based on the historical volatility of the Company’s stock. The following table summarizes the assumptions used to determine the fair value of options granted during the following periods:
|
Fiscal Year Ended March, 31
|
||||||||||||
|
2014
|
2013
|
2012
|
||||||||||
|
Expected dividend yield
|
0.0 | % | 0.0 | % | 0.0 | % | ||||||
|
Expected volatility
|
63.02 | % | 63.34 | % | 64.44 | % | ||||||
|
Risk-free interest rate
|
1.04 | % | 1.64 | % | 2.36 | % | ||||||
|
Expected life (years)
|
5.37 | 5.33 | 5.33 | |||||||||
| Weighted average fair value of options granted | $ | 4.37 | $ | 1.99 | $ | 2.99 | ||||||
48
STOCK-BASED COMPENSATION EXPENSE
The Company recognized stock-based compensation expense (before deferred income tax benefits) for awards granted under the Company’s stock-based compensation plans in the following line items in the consolidated statements of operations for fiscal 2014, 2013, and 2012:
|
2014
|
2013
|
2012
|
||||||||||
|
Cost of sales
|
$ | 4 | $ | 16 | $ | 11 | ||||||
|
Selling, general and administrative expenses
|
848 | 974 | 566 | |||||||||
|
Stock-based compensation expense before income tax benefits
|
$ | 852 | $ | 990 | $ | 577 | ||||||
Information regarding the Company's stock option activity for fiscal 2012, 2013 and 2014 are summarized below:
|
Number of
Options |
Weighted
AverageExercise
Price
|
Weighted
AverageContractual Life
(years) |
Aggregate
Intrinsic Value |
|||||||||||||
|
Options outstanding at March 31, 2011
|
1,328,937 | $ | 12.62 | |||||||||||||
|
Granted
|
30,000 | 5.24 | ||||||||||||||
|
Exercised
|
(7,500 | ) | 2.67 | |||||||||||||
|
Forfeited
|
(3,000 | ) | 8.87 | |||||||||||||
|
Options outstanding at March 31, 2012
|
1,348,437 | $ | 12.44 | |||||||||||||
|
Granted
|
327,500 | 3.58 | ||||||||||||||
|
Exercised
|
- | - | ||||||||||||||
|
Forfeited
|
(196,937 | ) | 10.00 | |||||||||||||
|
Options outstanding at March 31, 2013
|
1,479,000 | $ | 10.80 | |||||||||||||
|
Granted
|
511,000 | 8.00 | ||||||||||||||
|
Exercised
|
- | - | ||||||||||||||
|
Forfeited
|
(297,250 | ) | 9.85 | |||||||||||||
|
Options outstanding at March 31, 2014
|
1,692,750 | $ | 10.12 | 6.2 | $ | 982 | ||||||||||
|
Exercisable at March 31, 2014
|
945,500 | $ | 12.18 | 4.3 | $ | 346 | ||||||||||
|
Vested and expected to vest at March 31, 2014
|
1,606,829 | $ | 10.27 | 6.0 | $ | 928 | ||||||||||
The total fair value of shares vested during the fiscal year ended March 31, 2014 was $1,078. As of March 31, 2014, there was $3,083 of total unrecognized compensation cost related to non-vested share-based compensation arrangements granted under the Company’s plans, which is expected to be recognized over a weighted average period of 1.94 years.
49
Summarized information about stock options outstanding as of March 31, 2014 and 2013 is as follows:
|
2014
|
||||||||||||||||||||||
|
Outstanding
|
Exercisable
|
|||||||||||||||||||||
|
|
Weighted
Average
|
Weighted
Average
|
Weighted
Average
|
|||||||||||||||||||
|
Range of Exercise
Prices per Common |
Options
|
Remaining
|
Exercise Price
|
Options
|
Exercise Price
|
|||||||||||||||||
|
$2.62
|
- | $10.97 | 1,022,500 | 8.0 | $ | 7.38 | 357,750 | $ | 8.12 | |||||||||||||
|
$ 10.98
|
- | $ 19.36 | 573,550 | 3.4 | $ | 13.06 | 491,050 | $ | 13.26 | |||||||||||||
|
$ 19.37
|
- | $ 23.27 | 96,700 | 3.1 | $ | 21.72 | 96,700 | $ | 21.72 | |||||||||||||
|
$ 2.62
|
- | $ 23.27 | 1,692,750 | 6.2 | $ | 10.12 | 945,500 | $ | 12.18 | |||||||||||||
|
2013
|
||||||||||||||||||||||
|
Outstanding
|
Exercisable
|
|||||||||||||||||||||
|
|
Weighted
Average
|
Weighted
Average
|
Weighted
Average
|
|||||||||||||||||||
|
Range of Exercise
Prices per Common |
Options
|
Remaining
|
Exercise Price
|
Options
|
Exercise Price
|
|||||||||||||||||
|
$2.62
|
- | $10.97 | 724,250 | 6.9 | $ | 7.04 | 328,937 | $ | 8.57 | |||||||||||||
|
$ 10.98
|
- | $ 19.36 | 640,550 | 4.5 | $ | 13.11 | 495,800 | $ | 13.46 | |||||||||||||
|
$ 19.37
|
- | $ 23.27 | 114,200 | 4.2 | $ | 21.72 | 114,200 | $ | 21.72 | |||||||||||||
|
$ 2.62
|
- | $ 23.27 | 1,479,000 | 5.6 | $ | 10.80 | 938,937 | $ | 12.75 | |||||||||||||
The aggregate pre-tax intrinsic value (the difference between the Company’s closing stock price on the last trading day of fiscal 2014 and the exercise price, multiplied by the number of in-the-money options) that would have been received by the option holders had all option holders exercised their options on March 31, 2014 was $982. This amount changes based on the fair market value of the Company’s stock. The total intrinsic value of options exercised for fiscal 2014, 2013, and 2012 to amounted to $0, $0, and $47, respectively.
The following is a summary of changes in non-vested stock options for the fiscal year ended March 31, 2014:
|
Shares
|
Weighted
Average GrantDate Fair
Value
|
|||||||
|
Non-vested shares at April 1, 2013
|
540,063 | $ | 4.09 | |||||
|
Granted
|
511,000 | 4.37 | ||||||
|
Forfeited
|
(90,000 | ) | 3.11 | |||||
|
Vested
|
(213,813 | ) | 5.04 | |||||
|
Non-vested shares at March 31, 2014
|
747,250 | $ | 4.13 | |||||
The options and restricted stock available for future issuance as of March 31, 2014 are shown below:
50
|
1989 Non-
Qualified
Option
Plan |
1994 Stock
Incentive Plan |
1996 Non-
Employee
Stock
Option Plan |
Total
|
|||||||||||||
|
Authorized by Directors and Stockholders
|
3,975,000 | 3,525,000 | 750,000 | 8,250,000 | ||||||||||||
|
Options previously exercised
|
(3,214,687 | ) | (2,025,187 | ) | (100,000 | ) | (5,339,874 | ) | ||||||||
|
Restricted stock previously granted
|
- | (93,750 | ) | - | (93,750 | ) | ||||||||||
|
Options outstanding
|
(436,000 | ) | (1,051,750 | ) | (205,000 | ) | (1,692,750 | ) | ||||||||
|
Remaining for future issuance
|
324,313 | 354,313 | 445,000 | 1,123,626 | ||||||||||||
12. RETIREMENT PLANS
401(k) PLAN
Effective January 1, 2010, the Company amended its 401(k) retirement plan to be subject to the provisions of a “Safe Harbor” 401(k) plan. Under the provisions of the Safe Harbor plan, any discretionary matching company contribution becomes 100% vested upon match. The plan provides for a discretionary match of up to 4% of an eligible employee’s compensation. Under the prior plan, adopted in April 1988, any remaining unvested company discretionary matching contributions are subject to a four year vesting schedule. The Company’s contributions under both the 1988 plan and the Safe Harbor plan amounted to $771 in fiscal 2014, $789 in fiscal 2013 and $690 in fiscal 2012.
DEFINED BENEFIT PLAN
The Company assumed a defined benefit pension plan (the “Plan”) with the Medegen Medical Products, LLC (“MMP”) acquisition. The Plan covers certain employees of MMP who are members of the Service Employees International Union. The benefit accruals for the Plan were frozen as of December 31, 1999. The Company’s funding policy is to make the minimum annual contributions required by applicable regulations. Such contributions are expected to amount to $125 during fiscal 2015.
The following table sets forth the Plan’s funded status and amount recognized in the Company’s financial statements as of and for the fiscal years ended March 31, 2014 and 2013:
|
2014
|
2013
|
|||||||
|
Change in projected benefit obligation:
|
||||||||
|
Benefit obligation at beginning of year
|
$ | 1,894 | $ | 1,761 | ||||
|
Interest cost
|
76 | 78 | ||||||
|
Actuarial (gain) loss
|
(34 | ) | 111 | |||||
|
Benefits paid
|
(58 | ) | (56 | ) | ||||
|
Benefit obligation at end of year
|
1,878 | 1,894 | ||||||
|
Change in plan assets:
|
||||||||
|
Fair value of plan assets at beginning of year
|
$ | 1,143 | $ | 1,029 | ||||
|
Actual return on plan assets
|
58 | 66 | ||||||
|
Employer contributions
|
80 | 104 | ||||||
|
Benefits paid
|
(58 | ) | (56 | ) | ||||
|
Fair value of plan assets at end of year
|
$ | 1,223 | $ | 1,143 | ||||
|
Funded status at end of the year
|
$ | (655 | ) | $ | (751 | ) | ||
|
Amounts recognized on the balance sheet consist of:
|
||||||||
|
Current liabilities
|
$ | (655 | ) | $ | (751 | ) | ||
|
Accumulated other comprehensive loss
|
651 | 773 | ||||||
|
Net amount recognized
|
$ | (4 | ) | $ | 22 | |||
51
The following table presents the major categories of assets held by the plan, measured at fair value, as of March 31, 2014.
|
Fair Value Measurements at Reporting Date Using
|
||||||||||||||||
|
Level 1
|
Level 2
|
Level 3
|
Total
|
|||||||||||||
|
Cash and cash equivalents
|
$ | - | $ | 24 | $ | - | $ | 24 | ||||||||
|
Debt securities
|
- | 432 | - | 432 | ||||||||||||
|
Equity securities
|
- | 767 | - | 767 | ||||||||||||
|
Totals
|
$ | - | $ | 1,223 | $ | - | $ | 1,223 | ||||||||
The following table presents the major categories of assets held by the plan, measured at fair value, as of March 31, 2013.
|
Fair Value Measurements at Reporting Date Using
|
||||||||||||||||
|
Level 1
|
Level 2
|
Level 3
|
Total
|
|||||||||||||
|
Cash and cash equivalents
|
$ | 23 | $ | - | $ | - | $ | 23 | ||||||||
|
Debt securities
|
402 | - | - | 402 | ||||||||||||
|
Equity securities
|
- | 718 | - | 718 | ||||||||||||
|
Totals
|
$ | 425 | $ | 718 | $ | - | $ | 1,143 | ||||||||
The net periodic pension cost for the years ended March 31, 2014, 2013 and 2012 were as follows:
|
2014
|
2013
|
2012
|
||||||||||
|
Service cost - benefits earned during the period
|
$ | - | $ | - | $ | - | ||||||
|
Interest cost on projected benefit obligation
|
76 | 78 | 81 | |||||||||
|
Expected investment income
|
(70 | ) | (64 | ) | (59 | ) | ||||||
|
Net amortization and deferral
|
64 | 53 | 26 | |||||||||
|
Net periodic pension cost
|
$ | 70 | $ | 67 | $ | 48 | ||||||
The following are weighted-average assumptions used to determine benefit obligations as of March 31, 2014 and 2013:
|
2014
|
2013
|
|||||||
|
Discount rate
|
4.25 | % | 4.07 | % | ||||
|
Rate of compensation increase
|
0.00 | % | 0.00 | % | ||||
The following are weighted-average assumptions used to determine net periodic benefit costs for the years ended March 31, 2014 and 2013:
|
2014
|
2013
|
|||||||
|
Discount rate
|
4.07 | % | 4.49 | % | ||||
|
Expected long-term return on plan assets
|
6.00 | % | 6.00 | % | ||||
|
Rate of compensation increase
|
0.00 | % | 0.00 | % | ||||
The Company’s investment policy for the Plan’s assets is to balance risk and return through a diversified portfolio of marketable securities, including common and preferred stocks, convertible securities, government, municipal and corporate bonds, mutual and collective investment funds and short-term money market instruments. Maturities for fixed income securities are managed so that sufficient liquidity exists to meet near-term benefit-payment obligations. The expected rate of return on plan assets is based upon expectations of long-term average rates of return to be achieved by the underlying investment portfolios. In establishing this assumption, the Company considers historical and expected rates of return for the asset classes in which the Plan’s assets are invested, as well as current economic and capital market conditions.
52
Weighted-average asset allocation by asset category as of March 31, 2014 and 2013 were as follows:
|
Target Range
|
2014
|
2013
|
||||||||||
|
Cash
|
0% | - | 20% | 2 | % | 2 | % | |||||
|
Debt securities
|
10% | - | 70% | 63 | % | 63 | % | |||||
|
Equity securities
|
30% | - | 90% | 35 | % | 35 | % | |||||
|
Total
|
100 | % | 100 | % | ||||||||
Benefits paid were $58 and $56 for fiscal 2014 and 2013, respectively. The Company estimates the following future benefit payments under the plan for the fiscal years ending March 31:
|
Fiscal Year
|
Amount
|
|||||
| 2015 | $ | 60 | ||||
| 2016 | 67 | |||||
| 2017 | 71 | |||||
| 2018 | 74 | |||||
| 2019 | 77 | |||||
| 2020 - 2023 | 527 | |||||
| $ | 876 | |||||
13. EXTRAORDINARY ITEMS
During fiscal 2012, the Company recorded an extraordinary gain of $455 (net of tax expense of $245) as a result of an insurance settlement relating to inventories damaged in fiscal 2011 as a result of weather−related water damage.
14. OTHER MATTERS
The Company is a party to a lawsuit arising out of the conduct of its ordinary course of business. A global settlement of claims has been approved by the court and management expects a settlement agreement to be executed by the plaintiffs. While execution of the settlement agreement by the plaintiffs cannot be predicted with certainty, the ultimate liability under such lawsuit is covered by the Company’s insurance and management does not expect that the court-approved amount of the settlement or any other ultimate liability, if any, arising out of such lawsuit, will have a material adverse effect on the financial position or results of operations of the Company.
The Company has entered into agreements with seven of its executive officers and a vice president, which provide certain benefits in the event of a change in control of the Company. A “change in control” of the Company is defined as, in general, the acquisition by any person of beneficial ownership of 20% or more of the voting stock of the Company, certain business combinations involving the Company or a change in a majority of the incumbent members of the Board of Directors, except for changes in the majority of such members approved by such members. If, within two years after a change in control, the Company or, in certain circumstances, the executive, terminates his employment, the executive is entitled to a severance payment equal to 2.99 times (1) such executive’s highest annual salary within the five-year period preceding termination plus (2) a bonus increment equal to the average of the two highest of the last five bonuses paid to such executive. In addition, the executive is entitled to the continuation of all employment benefits for a three-year period, the vesting of all stock options and certain other benefits. As of March 31, 2014, the estimated potential aggregate compensation payable to these seven executive officers and vice president under the Company’s compensation and benefit plans and arrangements in the event of termination of such executive’s employment following a change in control amounted to approximately $12,556.
The Company’s Tennessee facility, which is comprised of approximately 25 acres in a light industrial park located in Gallaway, Tennessee, was acquired by Medegen Medical Products, LLC in 1999 prior to the Company’s ownership of Medegen. In connection with an environmental due diligence evaluation of the facility prior to its acquisition by Medegen, consultants detected the presence of chlorinated solvents in groundwater beneath the manufacturing plant. The identified groundwater contamination is in the process of being remediated. At the time of our acquisition of Medegen, the prior owner of the facility agreed to retain responsibility for the remediation of the contamination and to fully indemnify our company for all costs associated with the environmental remediation as well as any claims that might arise, including third party claims. Under an agreement executed at the time of the sale, Vollrath Group, Inc. and its parent Windway Capital Corp. (collectively, “Indemnitor”) are required, on a quarterly basis, to provide documentation from independent parties confirming that Indemnitor has sufficient assets, in the form of unencumbered, unrestricted cash, marketable securities or unused and available borrowing capacity, as necessary to pay the most recently estimated costs of outstanding environmental remediation obligations. Now that full-scale remediation is underway at the site, Indemnitor is also required to provide Letters of Credit (“LC”) to secure its current and future obligations, including a $2,000 LC that is currently open and future LCs in the amount of $1,000 from December 7, 2014 through December 7, 2017. As of March 31, 2014, we have recorded an estimated liability of $4,200 to remediate the groundwater contamination and corresponding amount due from the Indemnitor. As part of the divestiture of the Patient Care business unit, the related asset and liabilities are reported as held for sale at March 31, 2014 (see Footnote 3 – Discontinued Operations).
53
15. SUBSEQUENT EVENTS
Sale of Medegen Medical Products, LLC
On June 2, 2014, the Company completed the sale to Medira Inc., a Delaware corporation and an affiliate of Inteplast Group, Ltd., of (i) 100% of the membership units of Medegen Medical Products, LLC, a Delaware limited liability company and a wholly-owned indirect subsidiary of the Company, and (ii) certain assets of the Company’s Patient Care business unit, including the containment business assets, collectively, for approximately $78,628 in cash, subject to customary post-closing adjustments.
The Company used approximately $40,000 of the net proceeds from the Transaction to repay the term loan and outstanding revolving loan obligations under the New Credit Agreement. The Company plans to use the remaining balance of approximately $38,628 for working capital to support future growth in the Company’s business.
Amended Credit Agreement
On June 2, 2014, the Company entered into the First Amendment to Credit Agreement and Guaranty and Security Agreement (the “Amendment”), among the Company, as borrower, and Wells Fargo Bank, National Association, as administrative agent and lender (the “Lender”).
The Amendment amended the terms of the New Credit Agreement that the Company entered into with the Lender on May 17, 2013, as follows: (a) the Lender’s maximum total loan commitments under the Credit Agreement were reduced from $65,000 to $55,000, (b) provided no Event of Default (as defined in the Credit Agreement) occurs and is continuing, the unused line fee (the “Unused Line Fee”) that the Company is required to pay the Lender, has been capped at 0.375% of the daily unused amount of the revolving loan commitments of the Lender during the period for which the payment is made, through and including December 31, 2014, and (c) solely for purposes of calculating the Unused Line Fee, the aggregate amount of the Lender’s revolving loan commitments was deemed to be the lesser of $30,000 and the actual aggregate amount of the Lender’s revolving loan commitments.
16. SUMMARY OF UNAUDITED QUARTERLY FINANCIAL DATA
Selected unaudited, quarterly financial data of the Company for the fiscal years ended March 31, 2014 and 2013 appear below.
|
Fiscal 2014 Quarter Ended
|
||||||||||||||||
|
30-Jun
|
30-Sep
|
31-Dec
|
31-Mar
|
|||||||||||||
|
Net sales
|
$ | 71,526 | $ | 71,320 | $ | 72,521 | $ | 72,482 | ||||||||
|
Gross profit
|
13,384 | 13,271 | 13,896 | 14,465 | ||||||||||||
|
Income after income taxes
|
||||||||||||||||
|
Continuing operations
|
90 | 205 | 305 | 507 | ||||||||||||
|
Discontinued operations
|
189 | 893 | 1,606 | 397 | ||||||||||||
|
Net income
|
$ | 279 | $ | 1,098 | $ | 1,911 | $ | 904 | ||||||||
|
Basic earnings per common share:
|
||||||||||||||||
|
Net income from continuing operations
|
$ | 0.01 | $ | 0.02 | $ | 0.02 | $ | 0.03 | ||||||||
|
Net income from discontinued operations
|
$ | 0.01 | $ | 0.05 | $ | 0.10 | $ | 0.03 | ||||||||
|
Total
|
$ | 0.02 | $ | 0.07 | $ | 0.12 | $ | 0.06 | ||||||||
|
Diluted earnings per common share:
|
||||||||||||||||
|
Net income from continuing operations
|
$ | 0.01 | $ | 0.02 | $ | 0.02 | $ | 0.03 | ||||||||
|
Net income from discontinued operations
|
$ | 0.01 | $ | 0.05 | $ | 0.10 | $ | 0.02 | ||||||||
|
Total
|
$ | 0.02 | $ | 0.07 | $ | 0.12 | $ | 0.05 | ||||||||
54
|
Fiscal 2013 Quarter Ended
|
||||||||||||||||
|
30-Jun
|
30-Sep
|
31-Dec
|
31-Mar
|
|||||||||||||
|
Net sales
|
$ | 70,177 | $ | 72,393 | $ | 72,824 | $ | 69,369 | ||||||||
|
Gross profit
|
12,214 | 12,366 | 13,558 | 12,759 | ||||||||||||
|
Income (loss) after income taxes
|
||||||||||||||||
|
Continuing operations
|
(387 | ) | (507 | ) | (56,536 | ) | (624 | ) | ||||||||
|
Discontinued operations
|
250 | 572 | 1,033 | 1,343 | ||||||||||||
|
Net income (loss)
|
$ | (137 | ) | $ | 65 | $ | (55,503 | ) | $ | 719 | ||||||
|
Basic earnings per common share:
|
||||||||||||||||
|
Net income (loss) from continuing operations
|
$ | (0.03 | ) | $ | (0.03 | ) | $ | (3.45 | ) | $ | (0.04 | ) | ||||
|
Net income from discontinued operations
|
$ | 0.02 | $ | 0.03 | $ | 0.06 | $ | 0.08 | ||||||||
|
Total
|
$ | (0.01 | ) | $ | - | $ | (3.39 | ) | $ | 0.04 | ||||||
|
Diluted earnings per common share:
|
||||||||||||||||
|
Net income (loss) from continuing operations
|
$ | (0.03 | ) | $ | (0.03 | ) | $ | (3.45 | ) | $ | (0.04 | ) | ||||
|
Net income from discontinued operations
|
$ | 0.02 | $ | 0.03 | $ | 0.06 | $ | 0.08 | ||||||||
|
Total
|
$ | (0.01 | ) | $ | - | $ | (3.39 | ) | $ | 0.04 | ||||||
Net income (loss) per common share is computed separately for each quarter. Therefore, the sum of such quarterly per share amounts may differ from the total for the years.
None.
|
(a)
|
Evaluation of Disclosure Controls and Procedures
|
As required by Rule 13a-15(b) under the Exchange Act, we have evaluated, under the supervision and with the participation of our management, including our Chief Executive Officer and Chief Financial Officer, the effectiveness of the design and operation of our disclosure controls and procedures (as defined in Rules 13a-15(e) or 15d-15(e) under the Exchange Act) as of the end of the period covered by this Form 10-K. Our disclosure controls and procedures are designed to provide reasonable assurance that the information required to be disclosed by us in reports that we file or submit under the Exchange Act is accumulated and communicated to our management, including our principal executive officer and principal financial officer, as appropriate to allow timely decisions regarding required disclosure and is recorded, processed, summarized and reported, within the time periods specified in the rules and forms of the SEC. Based upon this evaluation, our Chief Executive Officer and Chief Financial Officer concluded that our disclosure controls and procedures were effective as of March 31, 2014.
|
(b)
|
Management’s Annual Report on Internal Control Over Financial Reporting
|
Our management is responsible for establishing and maintaining adequate internal control over financial reporting. Internal control over financial reporting is defined in Rules 13a-15(f) and 15d-15(f) promulgated under the Exchange Act as a process designed by, or under the supervision of, our Chief Executive Officer and Chief Financial Officer and effected by our board of directors, management and other personnel, to provide reasonable assurance regarding the reliability of financial reporting and the preparation of financial statements for external purposes in accordance with generally accepted accounting principles and includes those policies and procedures that:
1. Pertain to the maintenance of records that in reasonable detail accurately and fairly reflect the transactions and dispositions of assets of the Company;
2. Provide reasonable assurance that transactions are recorded as necessary to permit preparation of financial statements in accordance with generally accepted accounting principles, and that receipts and expenditures of the Company are being made only in accordance with authorizations of management and directors of the Company; and
3. Provide reasonable assurance regarding prevention or timely detection of unauthorized acquisition, use or disposition of the Company’s assets that could have a material effect on the Company’s financial statements.
Because of its inherent limitations, internal control over financial reporting may not prevent or detect misstatements.
55
Projections of any evaluation of effectiveness to future periods are subject to the risk that controls may become inadequate because of changes in conditions, or that the degree of compliance with the policies or procedures may deteriorate. Accordingly, even effective internal control over financial reporting can only provide reasonable assurance of achieving their control objectives.
Our management assessed the effectiveness of our internal control over financial reporting as of March 31, 2014. In making this assessment, our management used the criteria established in Internal Control – Integrated Framework (1992) issued by the Committee of Sponsoring Organizations of the Treadway Commission.
Under the supervision and with the participation of our management, including our Chief Executive Officer and Chief Financial Officer, we conducted an evaluation of our internal control over financial reporting as prescribed above for the periods covered by this report. Based on our evaluation, our Chief Executive Officer and Chief Financial Officer concluded that, as of March 31, 2014, the Company’s internal control over financial reporting is effective.
Our independent registered public accounting firm, KPMG LLP, has issued an audit report on the effectiveness of our internal controls over financial reporting as of March 31, 2014, which is included in this Annual Report on Form 10-K.
|
(c)
|
Changes in Internal Control over Financial Reporting
|
Description of the Fiscal Year 2013 Material Weakness
As described in Item 9A of our prior year Annual Report on Form 10-K, during the quarter ended March 31, 2013 we identified a material weakness in our internal control over financial reporting in which we did not have a control in place to periodically assess the appropriateness of the amounts we had estimated and accrued for as amounts payable under our agreements with distributors for distributor-related fees. We did not conduct a periodic comparison of our estimates to actual amounts subsequently paid, or expected to be paid, under the terms of our distributor agreements. Our estimates were based on the historical relationship of amounts paid to total sales and did not reflect changes in the terms of our distribution agreements.
Remediation of the Fiscal Year 2013 Material Weakness
To remediate the material weakness described above, we designed and implemented procedures and controls during the quarter ended June 30, 2013 to ensure that our accrual was based on the terms of each distributor agreement and our estimates of amounts that would be payable under such agreements. During the quarter ended September 30, 2013, we performed the testing necessary to determine that the material weakness identified in fiscal year 2013 had been remediated. This testing included the following:
|
·
|
We conducted an annual reconciliation of amounts accrued to the actual amounts paid under the distribution agreements.
|
|
·
|
We formalized policies and procedures including communication and reporting responsibilities among our contract and finance functions to ensure that the administration, payments of and accounting for distributor payments are coordinated.
|
|
·
|
Our internal audit department reviewed the accounting procedures over distributor payments during fiscal 2014.
|
Other Changes in Internal Controls over Financial Reporting
During the three months ended March 31, 2014, we have not made any changes in our internal control over financial reporting that have materially affected, or are reasonably likely to materially affect, our internal control over financial reporting.
We continue to review, document and test our internal control over financial reporting and may from time to time make changes aimed at enhancing their effectiveness and to ensure that our systems evolve with our business. These efforts may lead to various changes in our internal control over financial reporting.
56
Report of Independent Registered Public Accounting Firm
The Board of Directors and Stockholders
Medical Action Industries Inc.:
We have audited Medical Action Industries Inc. and subsidiaries (the “Company”) internal control over financial reporting as of March 31, 2014, based on criteria established in Internal Control – Integrated Framework (1992) issued by the Committee of Sponsoring Organizations of the Treadway Commission (COSO). Medical Action Industries Inc.’s management is responsible for maintaining effective internal control over financial reporting and for its assessment of the effectiveness of internal control over financial reporting, included in Item 9A(b), Management’s Report on Internal Control Over Financial Reporting. Our responsibility is to express an opinion on the Company’s internal control over financial reporting based on our audit.
We conducted our audit in accordance with the standards of the Public Company Accounting Oversight Board (United States). Those standards require that we plan and perform the audit to obtain reasonable assurance about whether effective internal control over financial reporting was maintained in all material respects. Our audit included obtaining an understanding of internal control over financial reporting, assessing the risk that a material weakness exists, and testing and evaluating the design and operating effectiveness of internal control based on the assessed risk. Our audit also included performing such other procedures as we considered necessary in the circumstances. We believe that our audit provides a reasonable basis for our opinion.
A company’s internal control over financial reporting is a process designed to provide reasonable assurance regarding the reliability of financial reporting and the preparation of financial statements for external purposes in accordance with generally accepted accounting principles. A company’s internal control over financial reporting includes those policies and procedures that (1) pertain to the maintenance of records that, in reasonable detail, accurately and fairly reflect the transactions and dispositions of the assets of the company; (2) provide reasonable assurance that transactions are recorded as necessary to permit preparation of financial statements in accordance with generally accepted accounting principles, and that receipts and expenditures of the company are being made only in accordance with authorizations of management and directors of the company; and (3) provide reasonable assurance regarding prevention or timely detection of unauthorized acquisition, use, or disposition of the company’s assets that could have a material effect on the financial statements.
Because of its inherent limitations, internal control over financial reporting may not prevent or detect misstatements. Also, projections of any evaluation of effectiveness to future periods are subject to the risk that controls may become inadequate because of changes in conditions, or that the degree of compliance with the policies or procedures may deteriorate.
In our opinion, Medical Action Industries Inc. and subsidiaries maintained, in all material respects, effective internal control over financial reporting as of March 31, 2014, based on criteria established in Internal Control – Integrated Framework (1992) issued by the Committee of Sponsoring Organizations of the Treadway Commission (COSO).
We also have audited, in accordance with the standards of the Public Company Accounting Oversight Board (United States), the consolidated balance sheets of Medical Action Industries Inc. and subsidiaries as of March 31, 2014 and 2013, and the related consolidated statements of operations, comprehensive income (loss), stockholders’ equity, and cash flows for the years then ended, and our report dated June 16, 2014 expressed an unqualified opinion on those consolidated financial statements.
/s/ KPMG LLP
Melville, New York
June 16, 2014
PART III
We have adopted a Code of Ethics (the “Code”) for our directors, officers and employees which covers a wide range of business practices and procedures. The Code is applicable to our principal executive officer, principal financial officer and principal accounting officer or controller and persons performing similar functions ("senior financial officers"). A copy of the Code is available on our website http://www.medical-action.com, and a copy will be mailed without charge, upon written request, to our Corporate Secretary at Medical Action Industries Inc., 500 Expressway Drive South, Brentwood, NY 11717. We intend to disclose any amendments to or waivers of the Code on behalf of our senior financial officers on our website, at http://www.medical-action.com, promptly following the date of the amendment or waiver.
Pursuant to General Instruction G to Form 10-K, we incorporate by reference the remaining information required by this item from the information to be disclosed in our definitive proxy statement for our 2014 Annual Meeting of Stockholders, which will be filed with the SEC within 120 days of March 31, 2014.
Pursuant to General Instruction G to Form 10-K, we incorporate by reference the information required by this item from the information to be disclosed in our definitive proxy statement for our 2014 Annual Meeting of Stockholders, which will be filed with the SEC within 120 days of March 31, 2014.
Securities Authorized for Issuance under Equity Compensation Plans
The following table shows, as of March 31, 2014, information with respect to compensation plans under which shares of Common Stock are authorized for issuance.
|
Plan Category
|
Number of
securities to be
issued upon
exercise of
outstanding
options(1)
|
Weighted-
average
exercise price
of outstanding
options ($)
|
Number of securities
remaining available for
future issuance under
equity compensation
plans(4)
|
|
Equity compensation plans approved by stockholders (2)
|
1,692,750
|
$ 10.12
|
1,123,626
|
|
Equity compensation plans not approved by stockholders (3)
|
----
|
$ -----
|
----
|
|
Total
|
1,692,750
|
$ 10.12
|
1,123,626
|
|
1)
|
All share amounts and exercise prices have been adjusted to reflect our three-for-two stock split distributed on February 9, 2007.
|
|
2)
|
Includes the 1989 Non-Qualified Stock Option Plan, 1994 Stock Incentive Plan and 1996 Non-Employee Stock Option Plan, all of which have been approved by our stockholders.
|
|
3)
|
We do not have any equity compensation plans that have not been approved by our stockholders.
|
|
4)
|
Excludes securities to be issued upon exercise of outstanding options.
|
Pursuant to General Instruction G to Form 10-K, we incorporate by reference the remaining information required by this item from the information to be disclosed in our definitive proxy statement for our 2014 Annual Meeting of Stockholders, which will be filed with the SEC within 120 days of March 31, 2014.
Pursuant to General Instruction G to Form 10-K, we incorporate by reference the information required by this item from the information to be disclosed in our definitive proxy statement for our 2014 Annual Meeting of Stockholders, which will be filed with the SEC within 120 days of March 31, 2014.
Pursuant to General Instruction G to Form 10-K, we incorporate by reference the information required by this item from the information to be disclosed in our definitive proxy statement for our 2014 Annual Meeting of Stockholders, which will be filed with the SEC within 120 days of March 31, 2014.
58
PART IV
|
(a) (1) The following financial statements are included in Item 8 of this Form 10-K:
|
||
|
Consolidated Balance Sheets at March 31, 2014 and 2013
|
29
|
|
|
Consolidated Statements of Operations for the Years Ended March 31, 2014, 2013 and 2012
|
30
|
|
|
Consolidated Statements of Comprehensive Income (Loss) for the Years Ended March 31, 2014, 2013 and 2012
|
31
|
|
|
Consolidated Statements of Stockholders' Equity for the Years Ended March 31, 2014, 2013 and 2012
|
32
|
|
|
Consolidated Statements of Cash Flows for the Years Ended March 31, 2014, 2013 and 2012
|
33
|
|
|
Notes to Consolidated Financial Statements
|
34
|
|
|
(a) (2) The following supplemental schedule is included in this Form 10-K:
|
||
|
Schedule II – Valuation and Qualifying Accounts
|
61
|
|
|
All other schedules are omitted because they are not required, not applicable or the information is included in the financial statements or notes thereto.
|
||
|
(a) (3) Exhibits:
|
||
|
Those exhibits required to be filed by Item 601 of Regulation S-K are listed in the Exhibit Index immediately preceding the exhibits filed herewith and such listing is incorporated herein by reference.
|
||
59
Pursuant to the requirements of Section 13 or 15(d) of the Securities Exchange Act of 1934, the registrant has duly caused this report to be signed on its behalf by the undersigned, thereunto duly authorized on this 16th day of June, 2014.
MEDICAL ACTION INDUSTRIES INC.
| By: | /s/ Paul D. Meringolo | |
|
Paul D. Meringolo
Chief Executive Officer
(Principal Executive Officer and Duly Authorized Officer)
|
Pursuant to the requirements of the Securities Exchange Act of 1934, this report has been signed below on June 16, 2014 by the following persons in the capacities indicated:
|
/s/ Paul D. Meringolo
|
Director and Chief Executive Officer
|
|
|
Paul D. Meringolo
|
(Principal Executive Officer)
|
|
|
/s / Paul Chapman
|
Director, President and Chief Operating Officer
|
|
|
Paul Chapman
|
||
|
/s/ Brian Baker
|
Chief Financial Officer and Corporate Secretary
|
|
|
Brian Baker
|
(Principal Financial and Accounting Officer)
|
|
|
/s/ Kenneth W. Davidson
|
Chairman of the Board
|
|
|
Kenneth W. Davidson
|
||
|
/s/ William W. Burke
|
Lead Director
|
|
|
William W. Burke
|
||
|
/s/ Kenneth R. Newsome
|
Director
|
|
|
Kenneth R. Newsome
|
||
|
/s/ Pamela R. Levy
|
Director
|
|
|
Pamela R. Levy
|
||
|
/s/ Henry A. Berling
|
Director
|
|
|
Henry A. Berling
|
60
SCHEDULE II
MEDICAL ACTION INDUSTRIES INC.
Fiscal Years Ended March 31, 2014, 2013 and 2012
|
Description
|
Balance at
Beginning
of Year
|
Gross
Amount
Charged to
Cost and
Expenses
|
Charged to
Other
Accounts
|
Other
Charges/
(Deductions)
|
Balance at
End of Year
|
|||||||||||||||
|
Year Ended March 31, 2014
|
||||||||||||||||||||
|
Allowance for doubtful accounts
|
$ | 793 | $ | (292 | ) | $ | - | $ | - | $ | 501 | |||||||||
|
Reserve for slowing moving, excess and obsolete inventory
|
1,091 | 1,011 | (786 | )(c) | (363 | )(b) | 953 | |||||||||||||
|
Valuation allowance on deferred tax assets
|
1,037 | (20 | ) | - | - | 1,017 | ||||||||||||||
| $ | 2,921 | $ | 699 | $ | (786 | ) | $ | (363 | ) | $ | 2,471 | |||||||||
|
Year Ended March 31, 2013
|
||||||||||||||||||||
|
Allowance for doubtful accounts
|
$ | 781 | $ | 12 | $ | - | $ | - | $ | 793 | ||||||||||
|
Reserve for slowing moving, excess and obsolete inventory
|
1,015 | 540 | - | (464 | )(b) | 1,091 | ||||||||||||||
|
Valuation allowance on deferred tax assets
|
758 | 279 | - | - | 1,037 | |||||||||||||||
| $ | 2,554 | $ | 831 | $ | - | $ | (464 | ) | $ | 2,921 | ||||||||||
|
Year Ended March 31, 2012
|
||||||||||||||||||||
|
Allowance for doubtful accounts
|
$ | 804 | $ | 72 | $ | - | $ | (95 | )(a) | $ | 781 | |||||||||
|
Reserve for slowing moving, excess and obsolete inventory
|
1,415 | 252 | - | (652 | )(b) | 1,015 | ||||||||||||||
|
Valuation allowance on deferred tax assets
|
- | 758 | - | - | 758 | |||||||||||||||
| $ | 2,219 | $ | 1,082 | $ | - | $ | (747 | ) | $ | 2,554 | ||||||||||
(a) Write off of uncollected accounts
(b) Disposal of slow moving and obsolete inventory
(c) Represents amounts related to assets held for sale
61
EXHIBIT INDEX
|
Exhibit No.
|
Description
|
|
|
2.1
|
Agreement and Plan of Merger, dated August 27, 2010, by and among Medical Action Industries Inc., MA Acquisition Inc., AVID Medical, Inc. and Michael Sahady as Stockholder Representative (Exhibit 2.1 to Medical Action Industries Inc.’s Current Report on Form 8-K filed on August 30, 2010, SEC File No. 000-13251)
|
|
|
2.2
|
Purchase Agreement, dated as of March 12, 2014, by and among Medical Action Industries Inc., as seller, Medira Inc., as buyer, and Inteplast Group, Ltd., solely for purposes of Sections 5.1(b) and 11.20 thereof (Exhibit 2.1 Medical Action Industries Inc.’s Current Report on Form 8-K filed on March 13, 2014, SEC File No. 000-13251)
|
|
|
3.1
|
Certificate of Incorporation (Exhibit 3.1 to Medical Action Industries Inc.’s Annual Report on Form 10-K for the year ended March 31, 2002, SEC File No. 000-13251)
|
|
|
3.2
|
Amended and Restated Bylaws (Exhibit 3.2 to Medical Action Industries Inc.’s Current Report on Form 8-K filed on November 7, 2011, SEC File No. 000-13251)
|
|
|
10.1
|
Credit Agreement, dated May 17, 2013, by and among Medical Action Industries Inc., the lenders party thereto and Wells Fargo Bank, National Association, as Administrative Agent (Exhibit 10.1 to Medical Action Industries Inc. Current Report on Form 8-K filed on May 22, 2013, SEC File No. 000-13251)
|
|
|
10.2
|
First Amendment to Credit Agreement and Guaranty and Security Agreement, dated June 2, 2014, by and among Medical Action Industries Inc., Wells Fargo Bank, National Association and the guarantors party thereto (Exhibit 10.1 to Medical Action Industries Inc. Current Report on Form 8-K filed on June 3, 2014, SEC File No. 000-13251)
|
|
|
10.3+
|
1996 Non-Employee Director Stock Option Plan, as amended (Exhibit 10.1 to Medical Action Industries Inc.’s Annual Report on Form 10-K for the year ended March 31, 2007, SEC File No. 000-13251)
|
|
|
10.4+
|
Form of Stock Option Award Agreement under the 1996 Non-Employee Director Stock Option Plan (Exhibit 10.4 to Medical Action Industries Inc.’s Annual Report on Form 10-K for the year ended March 31, 2013, SEC File No. 000-13251)
|
|
|
10.5+
|
1989 Non-Qualified Stock Option Plan, as amended (Exhibit 10.2 to Medical Action Industries Inc.’s Annual Report on Form 10-K for the year ended March 31, 2007, SEC File No. 000-13251)
|
|
|
10.6+
|
Form of Stock Option Award Agreement under the 1989 Non-Qualified Stock Option Plan (Exhibit 10.6 to Medical Action Industries Inc.’s Annual Report on Form 10-K for the year ended March 31, 2013, SEC File No. 000-13251)
|
|
|
10.7+
|
1994 Stock Incentive Plan, as amended (Exhibit 10.3 to Medical Action Industries Inc.’s Annual Report on Form 10-K for the year ended March 31, 2007, SEC File No. 000-13251)
|
|
|
10.8+
|
Form of Stock Option Award Agreement under the 1994 Stock Incentive Plan (Exhibit 10.8 to Medical Action Industries Inc.’s Annual Report on Form 10-K for the year ended March 31, 2013, SEC File No. 000-13251)
|
|
|
10.10+
|
Form of Amended and Restated Change in Control Agreement dated December 31, 2010 (Exhibit 10.1 to Medical Action Industries Inc.’s Current Report on Form 8-K filed on January 6, 2011, SEC File No. 000-13251)
|
|
|
10.11+
|
Medical Action Industries Inc. Summary of Non-Employee Director Compensation (as of June 2013) (Exhibit 10.13 to Medical Action Industries Inc.’s Annual Report on Form 10-K for the year ended March 31, 2013, SEC File No. 000-13251)
|
|
|
10.12+
|
Amendment to the Medical Action Industries Inc. Stock Option Plan for Non-Employee Directors dated August 13, 2009 (Exhibit A to Medical Action Industries, Inc.’s Definitive Proxy Statement on Schedule 14A filed June 19, 2009, SEC File No. 000-13251)
|
|
|
10.13+
|
Medical Action Industries Inc. Summary of Annual Performance Based Bonus Program (Exhibit 10.15 to Medical Action Industries Inc.’s Annual Report on Form 10-K for the year ended March 31, 2013, SEC File No. 000-13251)
|
|
|
10.14+
|
Separation Agreement, effective July 12, 2013, by and between Medical Action Industries Inc. and John Sheffield (Exhibit 10.1 to Medical Action Industries Inc.’s Current Report on 8-K filed on July 17, 2013 SEC File No. 000-13251)
|
|
|
10.15+
|
Offer Letter dated May 20, 2013 by and between Medical Action Industries Inc. and Paul Chapman (Exhibit 10.17 to Medical Action Industries Inc.’s Annual Report on Form 10-K for the year ended March 31, 2013, SEC File No. 000-13251)
|
|
|
10.16+
|
Summary of Compensation Letter dated June 14, 2012 by and between Medical Action Industries Inc. and Paul D. Meringolo (Exhibit 10.18 to Medical Action Industries Inc.’s Annual Report on Form 10-K for the year ended March 31, 2013, SEC File No. 000-13251)
|
|
|
10.17+
|
Summary of Compensation Letter dated June 14, 2012 by and between Medical Action Industries Inc. and John Sheffield (Exhibit 10.19 to Medical Action Industries Inc.’s Annual Report on Form 10-K for the year ended March 31, 2013, SEC File No. 000-13251)
|
|
|
10.18+*
|
Transaction and Performance Bonus Agreement, dated March 3, 2014 by and between Medical Action Industries Inc. and Charles L. Kelly Jr.
|
|
|
10.19+
|
Summary of Compensation Letter dated June 14, 2012 by and between Medical Action Industries Inc. and Eric Liu (Exhibit 10.21 to Medical Action Industries Inc.’s Annual Report on Form 10-K for the year ended March 31, 2013, SEC File No. 000-13251)
|
|
|
10.20+
|
Summary of Compensation Letter dated June 14, 2012 by and between Medical Action Industries Inc. and Richard Setian (Exhibit 10.22 to Medical Action Industries Inc.’s Annual Report on Form 10-K for the year ended March 31, 2013, SEC File No. 000-13251)
|
|
|
10.21+
|
Promotion Letter dated July 1, 2013 by and between Medical Action Industries Inc. and Brian Baker (Exhibit 10.1 to Medical Action Industries Inc. Current Report on Form 8-K filed on July 2, 2013, SEC File No. 000-13251)
|
|
|
21.1*
|
Subsidiaries of Medical Action Industries Inc.
|
|
|
23.1*
|
Consent of KPMG LLP, Independent Registered Public Accounting Firm
|
|
|
23.2*
|
Consent of Grant Thornton LLP, Independent Registered Public Accounting Firm
|
|
|
31.1*
|
Certification of Chief Executive Officer as required by Rule 13a – 14(a) of the Securities Exchange Act of 1934
|
|
|
31.2*
|
Certification of Chief Financial Officer as required by Rule 13a – 14(a) of the Securities Exchange Act of 1934
|
|
|
32.1**
|
Certification of Chief Executive Officer and Chief Financial Officer pursuant to 18 U.S.C. 1350
|
|
|
101.INS#
|
XBRL Instance Document
|
|
|
101.SCH#
|
XBRL Taxonomy Extension Schema Document
|
|
|
101.CAL#
|
XBRL Taxonomy Extension Calculation Linkbase Document
|
|
|
|
||
|
101.DEF#
|
XBRL Taxonomy Definition Linkbase Document
|
|
| 101.LAB# |
XBRL Taxonomy Extension Label Linkbase Document
|
|
*
|
Filed herewith
|
|
**
|
Furnished herewith
|
|
+
|
Identifies management contracts and compensatory plans and arrangements
|
|
#
|
Pursuant to Rule 406T of Regulation S-T, these interactive data files are deemed not filed or part of a registration statement or prospectus for purposes of Sections 11 and 12 of the Securities Act of 1933, are deemed not filed for purposes of Section 18 of the Securities Exchange Act of 1934 and otherwise are not subject to liability under those sections.
|