Attached files
Table of Contents
UNITED STATES
SECURITIES AND EXCHANGE COMMISSION
Washington, D.C. 20549
FORM 10-K
| x | Annual Report pursuant to Section 13 or 15(d) of the Securities Exchange Act of 1934 |
For the Fiscal Year ended March 31, 2010
| ¨ | Transition Report pursuant to Section 13 or 15(d) of the Securities Exchange Act of 1934 |
For the transition period to
Commission File No. 0-13251
MEDICAL ACTION INDUSTRIES INC.
(Exact name of registrant as specified in its charter)
| Delaware | 11-2421849 | |
| (State or other jurisdiction of incorporation or organization) |
(I.R.S. Employer Identification No.) | |
| 500 Expressway Drive South, Brentwood, New York | 11717 | |
| (Address of Principal Executive Office) | (Zip Code) | |
Registrant’s telephone number, including area code: (631) 231-4600
Securities registered pursuant to Section 12(b) of the Act: None
Securities registered pursuant to Section 12(g) of the Act: Common Stock, $.001 par value
Indicate by check mark if the registrant is a well-known seasoned issuer, as defined in Rule 405 of the Securities Act. Yes ¨ No x
Indicate by check mark if the registrant is not required to file reports pursuant to Section 13 or Section 15(d) of the Act. Yes ¨ No x
Indicate by check mark whether the registrant (1) has filed all reports required to be filed by Section 13 or 15(d) of the Securities Exchange Act of 1934 during the preceding 12 months (or for such shorter period that the registrant was required to file such reports), and (2) has been subject to such filing requirements for the past 90 days. Yes x No ¨
Indicate by check mark if disclosure of delinquent filers pursuant to Item 405 of Regulation S-K is not contained herein, and will not be contained, to the best of registrant’s knowledge, in definitive proxy or information statements incorporated by reference in Part III of this Form 10-K or any amendment to this Form 10-K ¨.
Indicate by check mark whether the registrant has submitted electronically and posted on its corporate Website, if any, every Interactive Data File required to be submitted and posted pursuant to Rule 405 of Regulation S-T during the preceding 12 months (or for such shorter period that the registrant was required to submit and post such files). Yes ¨ No ¨
Indicate by check mark whether the registrant is a large accelerated filer, an accelerated filer, or a non-accelerated filer. See definition of “accelerated filer and large accelerated filer” in Rule 12-b of the Exchange Act. (Check one):
Large accelerated filer ¨ Accelerated filer x Non-accelerated filer ¨
Indicate by check mark whether the registrant is a shell company (as defined in Rule 12b-2 of the Exchange Act). Yes ¨ No x
The aggregate market value of the registrant’s Common Stock held by nonaffiliates of the registrant as of September 30, 2009, the last business day of registrant’s most recently completed second quarter, was approximately $179,910,000. Shares of Common Stock held by each officer and director of the registrant and by each person who may be deemed to be an affiliate have been excluded.
As of June 2, 2010, 16,344,411 shares of the registrant’s Common Stock were outstanding.
DOCUMENTS INCORPORATED BY REFERENCE
Portions of the Proxy Statement for registrant’s 2010 Annual Meeting to be filed pursuant to Regulation 14A within 120 days following registrant’s fiscal year ended March 31, 2010, are incorporated by reference into Part III of this Report.
Table of Contents
Table of Contents
Unless otherwise indicated in this report, “Medical Action, the “Company,” and similar terms refer to Medical Action Industries Inc. and its subsidiaries unless context requires otherwise.
DISCLOSURE REGARDING FORWARD-LOOKING STATEMENTS
This Report includes “forward-looking statements” within the meaning of Section 27A of the Securities Act of 1933, as amended (the “Securities Act”), and Section 21E of the Securities Exchange Act of 1934, as amended (the “Exchange Act”). All statements other than statements of historical fact are “forward-looking statements” for purposes of these provisions, including any projections of earnings, revenues or other financial items, any statements of the plans and objectives for management for future operations, any statements concerning proposed new products or services, any statements regarding future economic conditions or performance, and any statements of assumptions underlying any of the foregoing. All forward-looking statements included in this report are made as of the date hereof and are based on information available to us as of such date. We assume no obligation to update any forward-looking statement. In some cases, forward-looking statements can be identified by the use of terminology such as “may,” “will,” “expects,” “plans,” “anticipates,” “intends,” “believes,” “estimates,” “potential,” or “continue,” or the negative thereof or other comparable terminology. Although we believe that the expectations reflected in the forward-looking statements contained herein are reasonable, there can be no assurance that such expectations or any of the forward-looking statements will prove to be correct, and actual results could differ materially from those projected or assumed in the forward-looking statements. Future financial condition and results of operations, as well as any forward-looking statements, are subject to inherent risks and uncertainties, including manufacturing inefficiencies, termination or interruption of relationships with our suppliers, potential delays in obtaining regulatory approvals, product recalls, product liability claims, our inability to successfully manage growth through acquisitions, our failure to comply with governing regulations, risks of international procurement of raw materials and finished goods, market acceptance of our products, market price of our Common Stock, foreign currency fluctuations, resin volatility and other factors referred to in our press releases and reports filed with the Securities and Exchange Commission (the “SEC”). All subsequent forward-looking statements attributable to us or persons acting on our behalf are expressly qualified in their entirety by these cautionary statements. Additional factors that may have a direct bearing on our operating results are described under Item 1A. “Risk Factors” beginning on page 15.
All amounts presented in Part I of this document are in thousands, except share and per share data.
Company Background
The Company was incorporated under the laws of the State of New York on April 1, 1977, and re-incorporated under the laws of the State of Delaware on November 5, 1987. Headquartered in Brentwood, New York, Medical Action develops, manufactures, markets and supplies a variety of disposable medical products. The Company’s products are marketed primarily to acute care facilities in domestic and certain international markets. In recent years the Company has expanded its end-user markets to include physician, dental and veterinary offices, outpatient surgery centers, long-term care facilities and laboratories. Medical Action is a leading manufacturer and supplier of patient bedside products, collection systems for the containment of medical waste products, minor procedure kits and trays, sterile disposable operating room towels and sterile disposable laparotomy sponges. The Company’s products are marketed nationally by its direct sales personnel and extensive network of health care distributors. Medical Action has entered into preferred vendor agreements with national and regional distributors, as well as sole and multi-source agreements with group purchasing organizations. The Company also offers original equipment manufacturer (“OEM”) products under private label programs to supply chain partners and medical suppliers. Medical Action’s manufacturing, packaging and warehousing activities are conducted in its Arden, North Carolina, Clarksburg, West Virginia, and Gallaway, Tennessee facilities. The Company’s procurement of certain products and raw materials from the People’s Republic of China is administered by its office in Shanghai, China.
1
Table of Contents
Business Strategy
The Company’s strategy is to focus its resources on increasing market share with present customers, entering new markets for its existing product lines, including alternate care, physician, veterinary and dental markets; accelerate the internal development of new products for its existing markets; pursue acquisitions that complement its existing product lines; introduce its products into the international marketplace and increase productivity by maximizing the utilization of its existing facilities.
Since 1994, the Company has engaged in an active acquisition program and completed ten transactions. These acquisitions include:
| • | In August 1994, the Company acquired the disposable surgical products business of QuanTech, Inc. The acquired products include a proprietary surgical light handle cover, uniquely designed and patented, which is used as a sterile barrier on surgical light handles in the operating room. The acquired line also produces and markets needle counters, instrument pouches, magnetic instrument drapes, and related products used primarily in the operating room environment. |
| • | In January 1996, the Company acquired certain assets relating to the sterilization packaging, monitoring and contamination control products business of Lawson Mardon Medical Products, Inc. (“Lawson Mardon”). The primary products acquired from Lawson Mardon include sterility packaging, a line of sterilization indicators and integrators and such ancillary products as infectious waste bags, laboratory specimen bags and sterility maintenance covers. These products are used in hospital central supply, operating rooms and in physicians’ offices. |
| • | In October 1997, the Company acquired substantially all of the assets relating to the specialty packaging business of Dayhill Corporation (“Dayhill”). The acquired products principally consisted of collection systems for the containment and transport of biohazardous waste, including biohazard bags, autoclave bags, laboratory transport bags, zip lock bags and sponge counting bags. |
| • | In November 1997, the Company acquired the inventory of the former ATI PyMaH sterilization pouches from 3M. |
| • | In January 1998, the Company acquired the sponge counter product lines of Sage Products, Inc., which included a uniquely designed and patented surgical sponge counting system, SAFE-T-Count™, as well as a counting system known as Pocket Count™. |
| • | In March 1999, the Company acquired the medical products division of Acme United Corporation (“Acme Healthcare”). Acme Healthcare, one of the first companies to design and sell disposable instrument kits and trays, was principally comprised of three product categories – (i) kit and tray products, including suture removal trays, I.V. start kits, and central line trays; (ii) net, padding, wound care and antiseptic products, including Acu-Dyne®, an anti-microbial solution of povidone iodine which comes in various packages and applicators, and a line of proprietary Tubegauze® elastic netting used in dressing retention; and (iii) instrument packs, which include a broad line of sterile instruments, such as hemostats, scalpels, forceps and needle holders. |
| • | In November 2001, the Company acquired the business related to sterile kits for the insertion of intravenous catheters (“I.V. Start Kits”) and sterile procedure trays containing components necessary for the maintenance of large catheters inserted into the chest cavity (“Central Line Dressing Trays”) from Medi-Flex Hospital Products, Inc. |
| • | In June 2002, the Company acquired the specialty packaging and collection systems for the containment of infectious waste and sterilization products business of MD Industries. The acquired products principally consisted of sterilization packaging, and collection systems including laundry and linen collection bags, zip lock closure bags, patient belonging bags, equipment dust covers, water soluble laundry bags, chemotherapy waste collection bags and biohazard safety and collection bags. |
| • | In October 2002, the Company acquired the BioSafety Division of Maxxim Medical, Inc., which consisted of a line of sharps containment systems primarily for the alternate care market and a line of collection |
2
Table of Contents
| systems for the containment of infectious waste including laundry and linen collection bags, zip lock closure bags, patient belonging bags, equipment dust covers, water soluble laundry bags, chemotherapy waste collection bags and biohazard safety and collection bags. |
| • | In October 2006, the Company acquired Medegen Medical Products, LLC (“Medegen” or “MMP”), which consisted of a line of patient bedside utensils, operating room products, laboratory products, and urology products. The patient bedside utensils line included wash basins, bedpans, pitchers and carafes, urinals, emesis basins, medicine cups, tumblers, denture cups, sitz baths, service trays, and soap dishes. The operating room products line included operating room basins, guide wire bowls, eye-shields, and surgical markers. The laboratory product line included petri dishes, measuring graduates, disposable beakers, lab containers and bottles, culture tubes, serum tubes, vials, and specimen containers. The urology product line consisted of commode specimen collectors, calculi strainers, 24 hour specimen collectors, mid-stream catch kits, and drainage and leg bags. |
The Company’s products are divided into six (6) categories:
| • | Patient Bedside Products |
| • | Minor Procedure Kits and Trays |
| • | Containment Systems for Medical Waste |
| • | Operating Room Disposables and Sterilization Products |
| • | Dressings and Surgical Sponges |
| • | Laboratory Products |
Within each of these categories are multiple product lines that have either been internally developed or acquired, as set forth below:
Patient Bedside Products
Minor Procedure Kits and Trays
Containment Systems for Medical Waste
3
Table of Contents
Operating Room Disposables and Sterilization Products
Dressings and Surgical Sponges
Laboratory Products
The following paragraphs contain a brief description of, and provide other information regarding, Medical Action’s key products:
Patient Bedside Products
Wash Basins – Used in both hospital in-patient setting, as well as in nursing homes and other long term convalescent care applications, polypropylene wash basins come in a range of sizes and colors. Washbasins are available in single patient/disposable, autoclavable plastic, and stainless steel designs.
Bedpans – For immobile patients bedpans come in conventional, over the commode seat, stackable and pontoon styles. Polypropylene bedpans come in a range of sizes and colors. Bedpans are available in single patient/disposable, autoclavable plastic, and stainless steel designs.
Pitchers & Carafes – Pitchers and carafes are primarily injection molded from durable polypropylene and include ice guards, cup covers, hinged lids, and graduations. Additional accessories or options include plastic and foam liners, foam jackets, assembled pitcher-liner-jacket sets which provide for additional insulation and quick replenishment. Pitchers and carafes are available in single patient/disposable, autoclavable plastic, and stainless steel designs.
4
Table of Contents
Urinals – For immobile patients urinals are made in a variety of designs. Differing versions accommodate male and female anatomy. Urinals are made from translucent polyethylene which facilitates measuring and visualizing contents. Urinals are graduated in 25 cc and 1 oz. increments up to 1,000 cc’s. Urinals are available in single patient/disposable, autoclavable plastic, and stainless steel designs.
Emesis Basins – Emesis basins are utilized in many health care settings and are used for containing fluids and tissues, measuring output, instrument passing, and routine oral care. Emesis Basins are available in single patient/disposable, autoclavable plastic, and stainless steel designs in sizes ranging from 400 cc to 1700 cc sizes.
Minor Procedure Kits and Trays
The Company offers one-time use kits and trays which are used for a wide variety of minor surgical and medical procedures. Kit components are determined by the procedural requirements and may be customized to accommodate individual hospital protocols and preferences. Procedural applications and typical components for the Company’s larger kits segments are as follows:
I.V. Start Kits – One of the most common medical procedures is intravenous administration of fluids and medications usually done through an I.V. catheter or needle which is inserted into a peripheral vein. Since infection at the site of the catheter insertion can become systemic and potentially serious, I.V. start kits are used to insure speed and efficiency of catheter insertion while promoting sound clinical protocol. Typical components include a tourniquet, antiseptic ampule or swab, gauze, surgical tape, and a dressing. For the fiscal years ended March 31, 2010, 2009, and 2008, I.V. Start Kits accounted for 13%, 13% and 12%, respectively, of the Company’s total net sales.
Central Line Dressing Trays – Central line dressing trays are used to provide cleansing and dressing placement at the site of a central venous catheter, which is typically placed in a vein in the patient’s chest area and is used for the rapid infusion of fluids and medications. Since infection at the site of catheter insertion can become systemic and represents a potentially serious medical complication, central line dressing kits facilitate fast and efficient dressing changes while allowing the clinician to maintain sterile technique. Typical components include an antiseptic ampule or swabs, gloves, gauze tape and a transparent dressing. The Company’s Central Line Dressing Trays are currently marketed under the ActaSept™ and Cepti-Seal® brands.
Suture Removal Trays – Post procedural suture removal is a medical procedure commonly performed in physicians’ offices, outpatient settings, and hospital emergency rooms amongst other acute and alternate care settings. The procedure requires precise instruments for grasping and cutting fine sutures. Typical suture removal tray components include Littauer scissors, alcohol prep pads, and metal or plastic forceps.
Laceration Trays – Laceration trays are used to facilitate closure of lacerations and other deep wounds. Use is primarily concentrated in hospital emergency rooms although they are sold in both acute and alternate care settings wherever emergency care is provided. Typical components are high quality disposable instruments including needle drivers, forceps, scissors and hemostats, as well as drapes for creation of a sterile field, gauze and syringes and needles for administration of a local anesthetic.
Instruments and Instrument Trays – The Company offers a broad array of high quality disposable needle holders, hemostats, various procedural scissors, scalpels and forceps. These instruments are available in stainless steel, bent wire, and plastic versions. They can be purchased in bulk, packaged sterile as individual instruments, or combined in custom sterile instrument trays.
Containment Systems for Medical Waste
Biohazardous Waste Containment and Autoclave Bags – Various state and federal regulations require that infectious medical waste be collected, stored, transported and disposed of in specifically designed and labeled containers. The Company’s infectious waste collection bags, known as biohazard bags or “red bags”, are
5
Table of Contents
constructed from high quality resins with reinforced seals for puncture resistance to reduce the risk of leakage. The bags come in a variety of sizes, and are red, and are clearly labeled with the international biohazard symbol. Autoclave bags are designed to survive the heat generated in a steam autoclave and are used to contain infectious waste through steam sterilization and disposal.
Non-Infectious Medical Waste Containment Bags – Non-infectious medical waste and trash must be collected, stored, transported and disposed of in a separate waste stream from potentially infectious or biohazardous waste. The Company’s non-infectious medical waste bags come in a variety of sizes, materials, mil thicknesses and seal configurations to isolate the range of non-infectious medical waste generated at health care provider sites from collection to disposal.
Chemotherapy Waste Containment Bags – Waste contaminated with chemotherapeutic agents must be disposed of in a separate waste stream from normal infectious and non-infectious medical waste due to the toxic nature of many of these agents. The Company’s chemotherapy waste containment bags and sharps containers are made of durable plastic resins for the collection and containment of chemo waste through disposal.
Laundry and Linen Containment Systems and Disposable Bags – Infectious and non-infectious reusable laundry and linen must be collected in specifically designed and clearly labeled receptacles and be segregated from the infectious and non-infectious medical waste streams. The Company offers laundry and linen containment systems consisting of hamper style receptacles and disposable laundry and linen receptacle bags for the collection, storage and transportation of infectious and non-infectious laundry and linen.
Laboratory Specimen Transport Bags – Used to collect, transport and contain tissue samples and other patient specimens obtained from examinations, diagnostic, or surgical procedures. The bags feature a specimen compartment and documentation pouch to insure that specimens and paperwork do not become separated during transport.
Patient Belonging Bags – Used to collect, contain and transport patient belongings from admission to discharge. The bags come in a variety of sizes, and thicknesses, and utilize a combination of handle, drawstring closure, and zip closure designs. These bags are often customized with hospital or healthcare facility logos and designs.
Sharps Containment Systems – Various state and federal regulations require that certain infectious medical waste, such as needles and blades, be collected, contained, transported and disposed of in rigid containers. The Company’s sharps containers come in a variety of sizes and configurations and are constructed from high quality resins protecting the public and health care workers from accidental stick injuries and potential transmission of pathogens in blood and body fluids. These containers are designed to be puncture resistant and to have torturous path means of egress once a contaminated device is placed inside.
Equipment Dust Covers – Are used for the protection of hospital equipment which is non-sterile. They provide a dust and dirt barrier for equipment that is stored between procedures.
Operating Room Disposables and Sterilization Products
Disposable Operating Room Towels – The Company’s line of absorbent cotton operating room towels are used during surgery for drying hands, rolled up for propping instruments, on back tables and mayo stands for absorbing fluids, around the incision site for absorbing blood and to allow the surgeon to clip tubing and instruments close to the surgical site during the surgical procedure. Operating room towels are sold in sterile packaging for single (disposable) use and as a non-sterile component to be used with other health care companies’ products, primarily surgical pre-packaged procedure trays. For the fiscal years ended March 31, 2010, 2009 and 2008, operating room towels accounted for, 7%, 8% and 8%, respectively, of the Company’s total net sales.
6
Table of Contents
Surgical Marking Pens – Used for marking the patient’s skin prior to making a surgical incision, as well as to address wrong site, wrong procedure surgery. Specifically designed so that the pen barrel fits comfortably in the surgeon’s hand and is made with gentian violet color ink. All pen barrels are embossed with a 5 cm. ruler and may also include a 15 cm. coated ruler and blank labels.
Needle Counters – Red plastic boxes manufactured from medical grade materials designed to resist breakage and punctures. They are produced with a variety of designs, including surgical grade magnets in order to facilitate sharps disposal. The foam blocks and foam strips allow for varying count capacity and designs.
Disposable Surgical Light Handle Covers – Light Shields™ – A patented design assures a secure fit and acts as a sterile barrier on surgical light handles in the operating room. Light Shields™ are manufactured of a heavy gauge flexible plastic for the optimum assurance of a sterile barrier.
Convenience Kits – The Company offers its customers the ability to purchase multiple products packaged with its needle counters. The Company has the flexibility to package many different kits to individualize a hospital’s requirements.
Surgical Headwear and Shoe Covers – Worn by operating room and other critical care personnel these items prevent contamination of sterile and clean environments from dust and other contaminants as well as protection of health care worker apparel. Bouffant caps made of lightweight spunbond polypropylene and surgeon’s caps made of Kaycel are comfortable and absorbent. Shoe covers are made of durable polypropylene and are available with a skid resistant coating.
Isolation Gowns – The Company’s line of disposable isolation gowns are used to prevent contamination of health care worker apparel during a variety of medical procedures. They are available in yellow fluid resistant spunbond cloth and impervious poly coated spunbond configurations.
Sterilization Pouches – Used to house instruments during the sterilization process and maintain sterility of the instrument until it is needed. The pouches are primarily used in hospital central supply, operating rooms and in physicians’ and dentists’ offices as well as in any environment where sterile instruments are needed. There are three different styles of pouches available—self seal, heat seal and rolls. The self seal is already sealed on three sides and includes a peel back adhesive strip on the bottom of the package, which when folded over will seal the package. The second type is heat seal, which is also sealed on three sides but needs a heat sealer to seal the fourth side. The Company also markets a roll product, where the user can pull as long a pouch as needed and then seal each end of the pouch.
Sterilization Monitoring Products – These are printed paper and chemical devices used to measure certain necessary parameters within a sterilization cycle. Predominate users include the hospital operating room which often houses steam sterilization units for unanticipated needs while cases are in progress, and the central sterile department which cleans, packages and sterilizes the bulk of reusable surgical supplies.
| Indicators: | measures the presence of ETO or steam and temperature | |
| Integrators: | a technology that gives a better assurance than traditional indicators that the proper parameters of sterilization were fulfilled, including time, temperature and moisture. | |
| Bowie Dick Test Pack: | tests for residual air left in an autoclave from air leaks, insufficient vacuum or poor steam quality. | |
Prior to sterilization, indicators and integrators are placed inside of the packaged products and sterilization pouches which are then distributed and used throughout the hospital, clinic or physician office environment.
7
Table of Contents
Patient Aids – These products are used to assist the mobility of patients after injury, surgery, or to increase mobility of the elderly patient population. These devices are primarily fitted and dispensed in the hospital, surgery center and physician office setting.
Crutches – Lightweight aluminum adjustable patient crutches complete with tips and pads. Push-button adjustable foot piece for fast, precise measuring and fitting. Offered in a full range of sizes – child, youth, adult, and tall adult. Used to assist mobility in the event of a leg, foot or ankle injury.
Walkers – Lightweight, high strength aluminum patient walkers. Contoured PVC handgrips for comfort and rubber tips for traction. They are available in a 1-button, 2-button, and a wheeled version that facilitates folding of the walkers for easy utilization, storage and transport. Used to assist patient mobility for both the short and long term.
Canes – Lightweight, high strength aluminum patient canes that are fully height adjustable from 30” to 39” in 1” increments. PVC handgrip for comfort and non-slip rubber tip for stability. Used to assist patient mobility for both the short and long term.
Patient Slippers – Skid resistant patient slippers available in a full range of sizes from infant, toddler, youth, to adult (from small to XXL). Color coded by size. Used to prevent slipping and to provide warmth and comfort in both acute care and long-term care market settings.
Dressings and Surgical Sponges
Burn Dressings – The Company provides many sizes and varieties of dry burn dressings. Dry burn dressings are composed of multiple layers of folded gauze that are typically customized for individual hospitals as to size, weave, folds, and stitching.
Disposable Laparotomy Sponges – Laparotomy sponges are designed primarily for use during surgical procedures in hospitals and health facilities. They are single use and made of gauze and sold in varying sizes and utilized for a multitude of purposes. Laparotomy sponges cover exposed internal organs, isolating them from the part of the body being operated upon. They also absorb blood and act as a buffer between medical instruments and the skin, thereby reducing trauma to the skin tissue caused by the medical instrument. Laparotomy sponges are sold in sterile packaging or as a non-sterile component to be used with other health care companies’ products, primarily surgical pre-packaged procedure trays. The Company’s laparotomy sponges contain an x-ray detectable element and loop handle in order to facilitate easy counting and identification in the operating room. For the fiscal years ended March 31, 2010, 2009 and 2008, laparotomy sponges accounted for 3%, 4%, and 4% respectively, of the Company’s total net sales.
Specialty Surgical Sponges – The Company’s line of specialty surgical sponges is an extension to its laparotomy sponge product line. They are single use and made of gauze and sold in varying sizes and shapes. The design of these sponges is tailored to specific surgical applications for which a standard laparotomy sponge is sub-optimal. There are two classifications of specialty surgical sponges:
a) Specialty Sponges for Open Surgical Procedures – including Peanut, Kittner, and Cherry dissecting sponges, used for blunt tissue dissection and fluid absorption, Tonsil Sponges with abdominal tape strings for easy retrieval from narrow body cavities, Stick Sponges used for surgical prepping and fluid absorption in deeper body cavities, and Eye Spears for absorption during eye surgery.
b) Endoscopic Specialty Sponges – including Kittner, Cherry, and Bullet style dissecting sponges. Endoscopic specialty sponges are small sponges affixed to long fiberglass rods and are designed for performing blunt tissue dissection, fluid absorption, and anatomical manipulation through the narrow operating cannulae used in minimally invasive endoscopic surgery.
8
Table of Contents
Gauze Sponges – Gauze sponges are used in the operating room as well as throughout the hospital. They are also used extensively throughout the alternate care market, including physicians’ offices, health clinics, and dentists’ offices and in veterinary practices. The Company also introduced gauze fluffs, which are pre-folded gauze sponges used for compression and absorption of blood and other fluids.
Sponge Counting System – The Company’s line of sponge counter bags is designed to facilitate and improve the post-procedural counting of surgical sponges. Peri-operative nursing protocol calls for a systematic count of used and unused sponges and instruments pre and post surgery to insure that foreign bodies are not left in the body cavity. The Company’s Sponge Counter Bags are clear faced opaque backed plastic bags with up to five sponge or ten gauze compartments. The compartments act as fluid receptacles while providing visualization of used sponges for fast and accurate post surgical counting. When used in conjunction with the patented Safe-T-Count™ gloves, the sponge counting procedure is even safer, as it accurately counts five sponges and reduces airborne contamination.
Net, Padding and Wound Care – Includes proprietary Tubegauz® premium brand and SePro® value brand elastic nets, which are tubular bandages used for dressing retention. This category also includes Tubegauz® brand tubular gauze, which is used to bandage fingers, toes, hands, or other areas that require wrapping to bodily contours. Padding products are used as a protective cushioning material for sensitive areas, and are sold in styles that offer unique characteristics such as being mold-resistant, water-repellant or designs for improved air circulation.
Laboratory Products
Petri Dishes – Used in the laboratory, Petri dishes are used to culture microorganisms. Economical, optically clear dishes are precision molded from polystyrene to maintain optical quality and controlled flat surfaces so cultures are clearly visible without distortion.
Specimen Containers – Used for the collection and transportation of fluid and tissue samples. Polypropylene specimen Containers are available in several sizes and styles including screw top, snap cap, and the patented ClikSeal™ for insuring sample security and leak resistance during collection and transport. A sterility seal, clear and accurate graduations, and patient identification label with mandated Patient ID information are typical features of specimen containers.
Commode Specimen Collectors – Used for the collection of and measurement of stool and urine samples. Injection molded commode collectors fit securely on standard toilets and allow for easy collection and quick visualization, measurement and disposal. Several versions are available that can be sealed for transportation to the laboratory for analysis.
Triangular Graduates – Used for measuring liquid intake or output, triangular graduates are made from either clear polystyrene or translucent polypropylene. The containers are graduated in 25cc and .5 ounce increments, up to 1000 cc’s and 32 ounces. The triangular style provides measuring ease, visualization of contents and comfortable handling.
Tri-pour Beakers – Used in hospitals, clinics, laboratories and nursing homes for accurate drip-free mixing and or pouring of liquids utilizing the beaker’s unique three pouring spouts. Tri-pour beakers are made from translucent polypropylene and are resistant to commonly used acids, alkalis, solvents and reagents and are autoclavable. Sizes of the beakers range from 50ml to 1000ml and each beaker is graduated in increments of 10, 20 or 50ml. Paper lids are available for each size of beaker.
Patents and Trademarks
The Company owns several patents and trademarks. While the Company considers that in the aggregate the patents and trademarks are important in the operation of its business, it does not consider any of them, or any group of them, to be of such importance that termination would materially affect its business.
9
Table of Contents
The Company actively pursues a policy of seeking patent protection, both in the United States and abroad, for its proprietary technology. There can be no assurance that the Company’s patents will not be violated or that any issued patents will provide protection that has commercial significance. Litigation may be necessary to protect the Company’s patent position. Such litigation may be costly and time-consuming, and there can be no assurance that the Company will be successful in such litigation. Since no single patent covers product lines that constitute 5% or more of any sales of the Company for fiscal 2010, the Company does not believe that any violation of any patents owned by the Company would have a material adverse effect on it or its business prospects.
Although there is no assurance that other companies will not be successful in developing similar products without violating the rights of the Company, management does not believe that the invalidation of any patents owned by the Company would have a material adverse effect on it or its business prospects. While the protection of patents is important to the Company’s business, management does not believe any one patent is essential to the success of the Company.
The Company also relies on trade secrets and product advancement to maintain its competitive position. There can be no assurance that the Company will prevent the unauthorized disclosure or use of its trade secrets and know-how or that others may not independently develop similar trade secrets or know-how or obtain access to the Company’s trade secrets, know-how or proprietary technology.
Group Purchasing Agreements
Hospital chains and large buying groups have played, and are expected to continue to play, an increasingly significant role in the purchase of medical devices. These group purchasing organizations (“GPOs”) continue to narrow their list of suppliers. By contracting with a GPO, the Company can operate its sales force much more efficiently. As a result, the Company’s sales force continues to call on facilities associated with these buying groups in order to improve compliance with these group purchasing agreements and improve market share.
To strengthen our position with these groups, the company has restructured its Corporate Accounts team. The new organization, called Executive Healthcare Services will be led by a Vice President with industry expertise and five Area Vice Presidents who will focus on building strategic partnerships with GPOs and Integrated Delivery Networks. Agreements with GPOs typically have no minimum purchase requirements and can be terminated on ninety (90) days advance notice. The termination or non-renewal of any of the agreements could have a material adverse effect on the Company’s business.
Competition
The markets for the Company’s product lines are highly competitive. In general, the Company’s products compete with the products of numerous major companies in the business of developing, manufacturing, distributing and marketing disposable medical products. Some of these competitors have greater financial or other resources than the Company. The Company believes that the principal competitive factors in each of its markets are (i) product design, development and improvement, (ii) customer support, (iii) brand loyalty, and (iv) price. The Company emphasizes overall value through a combination of competitive pricing, product quality and customer service.
The competitors differ based upon the products being sold. For instance, in the sale of sterile laparotomy sponges, where Medical Action’s sales represent a significant share of the domestic market, Cardinal Health, Inc., the Kendall Company, a subsidiary of Covidien Industries, Inc. and Medline Industries, Inc. are competitors. The Company’s primary competitors in the sale of sterile operating room towels, in which the Company is also a leading supplier in the domestic market, are Cardinal Health, Inc., Medline Industries, Inc. and DeRoyal, Inc. Management believes that the breadth of its line of collection systems for the containment of medical waste is the most complete in the industry, where it competes with Mabis, DMI Healthcare, Minigrip, Inc., Heritage Bag
10
Table of Contents
Company, Pitt Plastics, Medline Inc., and Tri-State Hospital Supply. In the sale of minor procedure kits and trays where the Company has a significant domestic market share, the Company’s primary competitors include Cardinal Health, Inc., Becton, Dickinson and Company, Medline Industries, Inc. and the Kendall Company, a subsidiary of Covidien Industries, Inc. In the sale of medical pouches to the hospital market, where the Company is one of the leading suppliers, the Company’s primary competitors include Cardinal Health, Inc. In the sale of operating room accessories, where the Company’s portion of the market is relatively insignificant, the Company’s primary competitor is Devon Industries, Inc., a subsidiary of Covidien Industries, Inc. In the sale of patient bedside utensils, where Medline Industries, Inc. and Betras Plastics, are competitors, Medical Action’s sales represent a significant share of the domestic market. In the sale of laboratory products, where Cardinal Health, Inc., Covidien Industries, Inc., Becton, Dickinson and Company, Kord Products Inc., and Parter Medical Products, Inc., are competitors, Medical Action’s sales represent an insignificant share of the domestic market.
Health Care Reform
In recent years, several comprehensive health care reform proposals were introduced in the U.S. Congress. The intent of the proposals was, generally, to expand health care coverage for the uninsured and reduce the growth of health care expenditures. Health care reform is an immediate and important priority of President Obama’s administration, and recent legislation has been enacted that represents a significant reform of the United States health care system. On November 7, 2009, the U.S. House of Representatives passed the Affordable Health Care for America Act and on December 24, 2009, the Senate passed the Patient Project and Affordable Care Act. To bridge the differences between the two bills, on March 21, 2010, the House of Representatives passed the Patient Project and Affordable Care Act (H.R. 3590) without amendment. H.R. 3590 was signed into law by President Obama on March 23, 2010. Also on March 21, the House also passed the Health Care and Education Reconciliation Act of 2010 (H.R. 4872), which modified certain provisions in H.R. 3590. The House and Senate both passed a modified version of the reconciliation bill on March 25, 2010, and President Obama signed the reconciliation bill on March 30, 2010. Together, H.R. 3590, which is now Public Law 111-148, and H.R. 4872, which is now Public Law 111-152, form the basis of the health care reform legislation. Under this newly-enacted health care reform legislation, Medical Action anticipates both benefits and challenges to the business which are yet to be determined.
Regulation
As a manufacturer of medical devices, the Company is subject to regulation by numerous regulatory bodies, both in the United States and abroad. In the United States, the federal agencies that regulate the Company’s operations and products include: the U.S. Food and Drug Administration (“FDA”), the Environmental Protection Agency, the Occupational Health & Safety Administration and others. Additionally, because the Company’s customers are typically reimbursed under governmental health programs such as Medicare and Medicaid, the Company is also subject to regulation by the Department of Health and Human Services. At the state level, the Company’s operations and products are also subject to regulation by various state agencies. Outside the United States, the Company is subject to regulation by agencies of foreign countries in which the Company sells its products. These agencies require manufacturers of medical devices to comply with applicable laws and regulations governing the introduction, development, testing, manufacturing, labeling, advertising, marketing, distribution, sale and use of medical devices. These requirements also include complaint handling, post marketing reporting, including adverse event reports and field actions due to quality concerns. Additionally, as a participant in the heavily-regulated health care industry, although the Company’s products and operations are not always directly regulated by certain health care laws and regulations, the Company may still be affected indirectly to the extent its customers are subject to such requirements.
All medical devices are required to be registered with the FDA. The Company must update its establishment and listing information on an annual basis and must comply with the FDA’s Good Manufacturing Practices under the Quality System Regulation (GMP/QSR). These regulations require that the Company manufacture its products and maintain records in a prescribed manner with respect to manufacturing, testing and control
11
Table of Contents
activities. The Company’s manufacturing, quality control and quality assurance procedures and documents are inspected and evaluated periodically by the FDA.
Unless exempt for low risk products, medical devices also require FDA pre-market approval. In addition to requiring clearance or approval for new products, the FDA may require clearance or approval prior to marketing products that are modifications of existing products. The Federal Food, Drug and Cosmetic Act (“FDC Act”) provides that new “510(k)” clearances are required when, among other things, there is a major change or modification in the intended use of the device or a change or modification to a legally marketed device that could significantly affect its safety or effectiveness. A manufacturer is expected to make the initial determination as to whether a proposed change to a cleared device or to its intended use is of a kind that would necessitate the filing of a new “510(k)” notification.
The European Union has promulgated rules, under the Medical Devices Directive, or MDD, which require medical devices to bear the “CE mark”. The CE mark is an international symbol of adherence to quality assurance standards. The Company received EN ISO 13485:2003 certification for its Arden, North Carolina manufacturing facility and has instituted all the systems necessary to meet the Medical Device Directive, thus acquiring the ability to affix the CE mark to certain products.
Along with the ISO 13485, the Company received the Canadian CMDCAS quality system certification. The ISO and CMDCAS quality systems are audited annually in Arden, NC by a registered, approved (by the European Union and Canadian Government) notified body.
The Company’s failure to comply with applicable laws or regulations could result in disciplinary, corrective or punitive measures imposed by regulatory bodies in the form of warnings, civil sanctions, criminal sanctions, recalls or seizures, injunctions, withdrawal of approvals, or restrictions on operations.
Sales, Marketing and Customers
The Company’s products are presently marketed and sold primarily to acute care facilities throughout the United States through a network of direct sales personnel. In addition, the Company has expanded its target markets to include physician, dental and veterinary offices, outpatient surgery centers, long-term care facilities and laboratories.
The Company’s sales representatives typically attempt to establish and maintain direct contact with medical professionals that directly utilize the Company’s products. As medical product purchases are typically made on a centralized basis by hospital purchasing departments, and increasingly by health care networks, sales representatives must also maintain relationships with purchasing department personnel. The Company has forty-one (41) direct and four (4) independent sales personnel throughout the United States engaged in the sales and marketing of the Company’s products.
In addition to the field sales personnel focused on the United States acute care market, Medical Action has senior sales and marketing professionals focused on group purchasing organizations, government sales, large integrated delivery networks and with national and regional distributors.
The Company’s distribution network is comprised of hospital distributors, alternate care distributors, physician distributors, veterinary distributors, dental distributors and industrial safety distributors covering the entire United States and certain international marketplaces. The Company’s products are typically purchased pursuant to purchase orders or supply agreements in which the purchaser specifies whether such products are to be supplied through a distributor or directly by the Company. The Company records sales upon the shipment of inventory to the distributor, at which time title passes to the distributor.
12
Table of Contents
Sales to Owens & Minor, Inc. and Cardinal Health Inc., diversified distribution companies (the “Distributors”) accounted for approximately 40% and 26%, respectively for the fiscal year ended March 31, 2010, 38% and 22%, respectively for the fiscal year ended March 31, 2009 and 37% and 21%, respectively for the fiscal year ended March 31, 2008. Although the Distributors may be deemed in a technical sense to be major purchasers of the Company’s products, the Distributors typically serve as a distributor under a purchase order or supply agreement between the customer and the Company, and do not make significant purchases for their own account. The Company, therefore, does not believe it is appropriate to categorize the Distributors as actual customers. No other individual customer or affiliated group of customer accounts accounted for more than 5% of the Company’s net sales in any of the past three fiscal years.
Management believes that the continuing pressure to utilize low-cost, disposable medical products has significantly expanded the use of custom procedure trays, which contain the necessary items designed for use in specific procedures by surgical teams. Many of the custom tray suppliers are vertically integrating the packaging process by buying bulk, non-sterile operating room towels, laparotomy sponges and other products manufactured by the Company to place in these custom trays. The trays are then sterilized, saving valuable nursing time and the costs associated with individual product packaging.
The Company believes it has established an efficient system for marketing its products throughout the United States, and intends to utilize these existing sales methods and channels to market new products as they are developed or acquired.
In addition to branded sales to the United States health care market, the Company generates revenue to OEM customers in the health care, laboratory and non-medical markets. Moreover, Medical Action provides and sells products to international markets via independent in country distribution networks, supported by operations in the United States, Brazil and China.
Research and Development
The Company is continually conducting research and developing new products utilizing a team approach that involves its engineering, manufacturing and marketing resources. Although the Company has developed a number of its own products, most of its research and development efforts have historically been directed towards product improvement and enhancements of previously developed or acquired products. Product development expenses were approximately $1,209, $960, $898 for the fiscal years ended March 31, 2010, 2009, and 2008, respectively.
Employees
As of June 2, 2010, the Company had approximately 831 full-time employees with approximately 557 in manufacturing and distribution, approximately 84 in marketing and sales, and approximately 190 in general and manufacturing administration. Except for approximately 253 employees in the Company’s Gallaway, Tennessee facility, which are represented by the Service Employees International Union (“SEIU”), none of the Company’s employees are represented by a labor union. The Company has entered into an agreement with the SEIU for the three (3) year period ending July 2012. The Company believes that its employee relations are good.
Backlog
The Company does not believe that its backlog figures are necessarily indicative of its business since most hospitals and health related facilities order their products on a continuous basis and not pursuant to any contractual arrangements. Since typical shipment times range from two to five days, the Company must maintain sufficient inventories of all products at all times.
13
Table of Contents
Raw Materials and Manufacturing
The principal raw materials used by the Company are a four-ply mesh gauze laparotomy sponge, cotton huck towel, paper, non-woven material, and various types of plastic resin. Other materials and supplies used by the Company include gauze, gauze sponges, injection molded and thermoformed plastics, medical instruments, various types of antiseptics and wound dressings, aluminum, foam, medical grade magnets and a variety of packaging material. Several of these raw materials are supplied from vendors outside the United States.
Medical Action’s variety of suppliers for raw materials and components necessary for the manufacture of its products, as well as its long term relationships with such suppliers, help to ensure the stability in its manufacturing process. Historically, we have not been materially affected by interruptions with such suppliers. However, if a supplier of significant raw materials, component parts, finished goods or services were to terminate its relationship with the Company, or otherwise cease supplying raw materials, component parts, finished goods or services consistent with past practices, the Company’s ability to meet its obligations to its customers may be disrupted. A disruption with respect to numerous products, or with respect to a few significant products, could have a material adverse effect on the Company’s business and financial condition. During the past few years, world events caused the cost of oil and natural gas prices to increase to historical new heights, causing the cost of resin, the principal raw material in the manufacture of our plastic products, to increase to unprecedented levels.
The Company presently purchases its principal cotton raw materials primarily from the Peoples Republic of China and to a lesser extent, India and is currently sourcing instruments from Pakistan and the Peoples Republic of China, a portion of its thermoform plastics from Taiwan, packaging paper material from France, water soluble bags from the United Kingdom and needle counters from the People’s Republic of China. From time to time, the Company has purchased certain of its raw materials from a number of other countries including Mexico, Vietnam, and the Dominican Republic. Some of the Company’s products are purchased as components or in final form, which are shipped to the Company’s manufacturing facility in Arden, North Carolina, where they are packaged. The Company’s sterilization pouches and minor procedure kits and trays are predominantly manufactured and/or assembled in the Company’s Arden, North Carolina manufacturing facility. The Company utilizes outside contract sterilization facilities for its products.
In the Company’s Clarksburg, West Virginia facility, where the Company manufactures its containment systems for medical waste, three (3) types of plastic resin are utilized in various production processes: (i) linear low density polyethylene, (ii) high density polyethylene and (iii) film extrusion polypropylene. In the manufacture of containment systems, resin is extruded through the die where it emerges in a gelatinous state. The extruder and die are positioned under a cooling tower where the emerging plastic is pressed closed and air is blown into it creating a cylindrical column. The column is then pulled up the tower and back down over conveying rollers, and is threaded through a printer, bag machine, triangle folder, separator and air folder into an individually folded bag.
The Company’s sharps containers are also manufactured from either polypropylene or polyethylene resin and are produced either by extrusion blow-molding or by high pressure injection molding. In extrusion blow molding, the resin is melted by friction and applied heat in a long tube with a precisely flighted revolving auger, delivering the molten plastic through an extruder die to form a hollow tube. As the tube exits the extruder, a two-part blow mold whose internal cavity is in the shape of the finished product, closes around the tube and high pressure is introduced to form the finished product. In injection molding, a similar barrel and screw auger system plasticizes the resin before injecting the molten plastic into two-part precision molds. These molds are closed under very high pressure, enabling the plastic to fill all of the voids in the mold and taking the shape of the finished part, then rapidly cooled with water running through the mold structure before being ejected for packaging.
Our Gallaway, Tennessee facility primarily manufactures and/or distributes disposable plastic patient utensils, as well as other collection, measuring and containment products. These products are manufactured with homopolymer and copolymer polypropylene, high density polyethylene and linear low density polyethylene,
14
Table of Contents
primarily utilizing either injection molded plastic process or extrusion blow molding. In addition, the Gallaway facility purchases contract manufactured or private labeled finished products for distribution to its customers. These products include stainless and reusable plastic containers and utensils manufactured domestically, as well as various measuring and collection products procured from the People’s Republic of China.
Available Information
The Company files annual, quarterly and current reports and other information with the SEC. These materials can be inspected and copied at the SEC’s Public Reference Room at 450 Fifth Street, N.W., Washington, D.C. 20549. Copies of these materials may also be obtained by mail at prescribed rates from the SEC’s Public Reference Room at the above address. Information about the Public Reference Room can be obtained by calling the SEC at 1-800-SEC-0330. The SEC also maintains an Internet site that contains reports, proxy and information statements, and other information regarding issuers that file electronically with the SEC. The address of the SEC’s Internet site is http://www.sec.gov.
The Company makes available, free of charge, on its Internet website, located at http://www.medical-action.com, its most recent Annual Report on Form 10-K, its most recent Quarterly Report on Form 10-Q, any current reports on Form 8-K filed since the Company’s most recent Annual Report on Form 10-K and any amendments to such reports as soon as reasonably practicable following the electronic filing of such report with the SEC. In addition, the Company provides electronic or paper copies of its filings free of charge upon request.
Our business, operations and financial condition are subject to certain risks and uncertainties, including the risks discussed below. Should one or more of these risks or uncertainties materialize, or should any underlying assumptions prove incorrect, our actual financial results will vary, and may vary materially from those anticipated, estimated, projected or expected. The key factors that may have a direct bearing on our business, cash flows, results of operations and financial condition are identified below:
The recently-enacted health care reform legislation may lead to substantial changes in the health care industry that may adversely affect the Company’s business.
Generally, the recently-enacted health care reform legislation requires most United States citizens and legal residents to have health insurance, creates state-based health benefit exchanges and a tax credit system to help the uninsured purchase coverage, requires employers to either provide insurance or pay tax penalties for employees that receive tax credits, imposes new regulations on health plans, and expands Medicaid. Many of the provisions of the law will phase in over the course of the next several years, and may have a material adverse effect on the Company’s results of operations. Among the provisions that may have an adverse impact on the Company is a 2.3% excise tax to be imposed on medical device manufacturers for the sale of certain medical devices occurring after December 31, 2012. At this point, it is not possible to fully predict the effect of the health care reform legislation on the Company.
Continuing pressures to reduce health care costs may adversely affect our prices. If we cannot reduce manufacturing costs of existing and new products, our sales may not grow and our profitability may decline.
Increasing awareness of health care costs, public interest in health care reform and continuing pressure from Medicare, Medicaid and other payers to reduce costs in the health care industry, as well as increasing competition from other products, could make it more difficult for us to sell our products at current prices. The reduction of health care costs has become a political priority in the United States, as evidenced by the recently-enacted health care reform legislation, and abroad. Laws and regulations affecting reimbursement for the Company’s products may be altered in the near future, possibly resulting in lower reimbursement amounts to customers for the Company’s products from governmental and private payers. In the event that the market will
15
Table of Contents
not accept current prices for our products, our sales and profits could be adversely affected. We believe that our ability to increase our market share and operate profitably in the long term may depend in part on our ability to reduce manufacturing costs on a per unit basis through cost containment and high volume production using highly automated molding and assembly systems. If we are unable to reduce unit manufacturing costs, we may be unable to increase our market share or may lose market share to alternative products, including competitors’ products. Similarly, if we cannot enter a market with new products priced competitively with adequate margins and then reduce unit manufacturing costs of new products as production volumes increase, we may not be able to sell new products profitably or gain any meaningful market share. Any of these results would adversely affect our future results of operations.
Resin prices are volatile. Increases in resin prices have adversely affected, and in the future may adversely affect, our financial condition, results of operations and cash flows.
Resin costs have fluctuated significantly in recent years and may continue to fluctuate as a result of changes in natural gas and crude oil prices. For calendar year 2009, resin costs in North America and Europe decreased 16% and 26% respectively compared to the prior year period, as measured by the Chemical Market Associates, Inc. index and PLATTS’s index, their respective market indices. However, in the fourth quarter of calendar year 2009 these costs were approximately 40% higher compared to the prior year’s quarter. The instability in the world markets for petroleum and in North America for natural gas could quickly affect the prices and general availability of raw materials, which could have a materially adverse impact to us. Due to the uncertain extent and rapid nature of cost increases, we cannot reasonably estimate our ability to successfully recover any cost increases. To the extent that cost increases cannot be passed on to our customers, or the duration of time lags associated with a pass-through becomes significant, such increases may have a material adverse effect on our profitability.
The high level of competition and group purchasing organizations place pressure on our profit margins and we may not be able to compete successfully.
The disposable medical device segment of the health care industry in which we operate is highly competitive and is experiencing both horizontal and vertical consolidation. All of the products we sell are available from sources other than us. The high level of competition in our industry places pressure on profit margins. Some of our competitors have greater resources than we have. These competitive pressures could have a material adverse affect on our business, financial condition or results of operations.
Sales to Owens & Minor, Inc. and Cardinal Health Inc. (the “Distributors”) accounted for approximately 66% of total sales in each of the last three fiscal years. Although the distributors may be deemed in a technical sense to be major purchasers of the Company’s products, they serve, however, as a distributor under a purchase order or supply agreement between the customer and the Company, and do not purchase for their own accounts. The Company, therefore, does not believe it is appropriate to categorize its distributors as actual customers. However, in some cases, distributors compete with the Company on a private label basis, and if successful, sales of certain of the Company’s products could decline which may result in a material adverse affect on the Company’s business and financial condition.
Health care reform and the related pressure to contain costs has been the advent of group purchasing organizations in the United States. These group purchasing organizations enter into preferred supplier arrangements with one or more manufacturers of medical products in return for price discounts to members of the group purchasing organizations. If we are not able to obtain new preferred supplier commitments from major group purchasing organizations or retain those commitments that we currently have, which are generally terminable by either party for any reason upon the expiration of a defined notice period, our sales and profitability could be adversely affected. However, even if we are able to obtain and retain preferred supplier commitments from group purchasing organizations, they may not deliver high levels of compliance by their members, meaning that we may not be able to offset the negative impact of lower per-unit prices or lower margins with increases in unit sales or in market share.
16
Table of Contents
Indemnification for remediation of Tennessee facility.
The Medegen Tennessee facility is comprised of approximately 25 acres in a light industrial park, located in Gallaway, TN and was acquired by Medegen in 1998. As part of its due diligence activities prior to the acquisition of the facility by Medegen, consultants found chlorinated solvents in the groundwater adjacent to the manufacturing plant. The identified groundwater contamination is in the process of being remediated.
The prior owner of the facility (“Indemnitor”) retained responsibility for the remediation of the contamination, and Medegen is fully indemnified for all costs associated with the environmental remediation as well as any claims that may arise, including third party claims. As security for the indemnification obligations, Indemnitor is required, on a quarterly basis, to provide proof of cash balances, marketable securities or available, unused lines of credit equal to the expected cost of all future remediation activities plus $500. Now that full-scale remediation has begun, Indemnitor will be required to provide Letters of Credit (“LC”) to secure their current and future obligations, including a $3,000 LC which is currently open, and future LC’s in the amounts of $2,000 in December 2011 and reducing to $1,000 from December 2014 through December 2017. The LC amounts approximate the expected remaining remediation costs at each point in time. No assurance can be given that the Indemnitor will have the financial resources to complete the environmental remediation and/or defend any claims that may arise, that recommended cleanup levels will be achieved over the long term, or that further remedial activities will not be required.
The Company may be unable to successfully manage growth, particularly if accomplished through acquisitions.
Successful implementation of the Company’s business strategy will require that the Company effectively manage any associated growth. To manage growth effectively, the Company’s management will need to continue to implement changes in certain aspects of the Company’s business, to enhance the Company’s information systems and operations to respond to increased demand, to attract and retain qualified personnel and to develop, train and manage an increasing number of management-level and other employees. Growth could place an increasing strain on the Company’s management, financial, marketing, distribution and other resources, and the Company could experience operating difficulties. Any failure to manage growth effectively could have a material adverse affect on the Company’s results of operations and financial condition.
To the extent that the Company grows through acquisitions, it will face the additional challenges of integrating its current operations, culture, management information systems and other characteristics with that of the acquired entity. The Company may incur significant expenses in connection with negotiating and consummating one or more transactions, and it may assume certain liabilities in connection with the acquisition as a result of its failure to conduct adequate due diligence or otherwise. In addition, the Company may not realize competitive advantages, synergies or other intended benefits anticipated in connection with such acquisition. If the Company does not adequately identify targets for, or manage issues related to our future acquisitions, such acquisitions may have a negative adverse affect on the Company’s business and financial results.
In addition to the above risks, future acquisitions may result in the dilution of earnings and the amortization or write-off of goodwill and intangible assets, any of which could have a material adverse affect on our business, financial condition or results of operations.
The Company’s business is subject to the risks of international procurement.
A significant portion of the Company’s raw materials and finished goods are purchased from manufacturers in the People’s Republic of China. As a result, the Company’s international procurement operations are subject to the risks associated with such activities including, economic and labor conditions, international trade regulations (including tariffs and anti-dumping penalties), war, international terrorism, civil disobedience, natural disasters, political instability, governmental activities and deprivation of contract and property rights. In particular, since 1978, the Chinese government has been reforming its economic systems, and we expect such reforms to
17
Table of Contents
continue. Although we believe that these reforms have had a positive effect on the economic development of China and have improved our ability to successfully utilize facilities in China, we cannot be assured that these reforms will continue or that the Chinese government will not take actions that impair these operations in China. In addition, periods of international unrest may impede our ability to procure goods from other countries and could have a material adverse effect on our business and results of operations.
The Chinese government has cut the tax credits that exporters get on more than 2,200 products, including many of the Company’s products that are manufactured in China. These tax credits were adopted more than twenty (20) years ago to provide Chinese companies with tax breaks on revenues derived from exports. The cut in tax credits, together with a tight labor market, will cause the price of many items that are sourced in China to increase, which could adversely impact the Company’s cost of goods sold and profitability, to the extent the Company is unable to pass along these price increases to its customers.
Although the Chinese yuan has traded virtually in a straight line for many years, beginning in fiscal 2006 the Chinese government began to re-value the Chinese yuan against other currencies, including the U.S. dollar. This re-valuation or free floating exchange rate, has caused the price of many items that are sourced from China to increase, which could adversely impact the Company’s cost of goods sold and profitability.
In addition, the U.S. Government in May 2005 exercised a quota on any textile products from China in Category 632 of the Harmonized Tariff Schedule, which included the Company’s patient slippers. Beginning on January 1, 2009, the quota on textile products from Chinese category 632 expired. While there is no assurance that such quotas will not be reinstated in the future, the Company has been able to procure a similar product with a different country of origin, although at higher costs than the Company was previously obtaining. An interruption in supply and higher costs, could have a negative adverse effect on the Company’s financial results.
International sales pose additional risks related to competition with larger international companies and established local companies, or possibly higher cost structure and higher credit risks.
For the year ended March 31, 2010, international sales accounted for approximately 3% of our total net sales. We export from the United States and China most of our products sold internationally. Our principal competitors in international markets are a number of much larger companies as well as smaller companies already established in the countries into which we sell or intend to sell our products. Our cost structure is often higher than that of our competitors because of the relatively high cost of transporting product to the local market as well as our competitors’ lower local labor costs in some markets. There is no certainty that we will be able to open local manufacturing facilities, procure products from other suppliers or operate our international sales activities productively.
Our international sales are subject to higher credit risks than sales in the United States. Many of our international distributors are small and may not be well capitalized. Our prices to our international distributors for products shipped to the customers from the United States or China are denominated in U.S. dollars, but their resale prices are set in their local currency. A decline in the value of the local currency in relation to the U.S. dollar may adversely affect their ability to profitably sell in their market the products they buy from us, and may adversely affect their ability to make payment to us for the products they purchase. Legal recourse for non-payment of indebtedness may be uncertain. These factors all contribute to a potential for credit losses.
If we are unable to compete successfully on the basis of product innovation, quality, convenience, price and rapid delivery with larger companies that have substantially greater resources and larger distribution networks, we may be unable to maintain market share, in which case our sales may not grow and our profitability may be adversely affected.
The market for our products is intensely competitive. We believe that our ability to compete depends upon continued product innovation, the quality, convenience and reliability of our products, access to distribution channels and pricing. The ability to compete effectively depends on our ability to differentiate our products based
18
Table of Contents
on safety features, product quality, cost effectiveness, ease of use and convenience, as well as our ability to identify and respond to changing customer needs. We encounter significant competition in our markets both from large established medical device manufacturers and from smaller companies. Many of these firms have introduced competitive products with proprietary features not provided by the conventional products and methods they are intended to replace. Most of our current and prospective competitors have economic and other resources substantially greater than ours and are well established as suppliers to the healthcare industry. There is no assurance that our competitors will not substantially increase resources devoted to the development, manufacture and marketing of products competitive with our products. The successful implementation of such a strategy by one or more of our competitors could materially and adversely affect us.
Covenants in our credit facilities may restrict our financial and operating flexibility.
We currently have two credit facilities;
| • | A five year $20,000 revolving credit facility expiring on December 31, 2011, of which we had $0 outstanding as of March 31, 2010 and June 2, 2010; and |
| • | A $65,000 term loan payable in quarterly installments. As of March 31, 2010 and June 2, 2010, $16,875 was outstanding on the term loan. |
Our current credit facilities require, and any future credit facilities may also require, that we comply with specified financial covenants relating to interest coverage, debt coverage, minimum consolidated net worth, and earnings before interest, taxes, depreciation and amortization. Our ability to satisfy these financial covenants can be affected by events beyond our control, and we cannot give assurance that we will meet the requirements of these covenants. These restrictive covenants could affect our financial and operational flexibility, including the following:
| • | limiting our ability to fund working capital, capital expenditures, acquisitions or other general corporate purposes; |
| • | requiring us to use a substantial portion of our cash flow from operations to pay interest and principal on our indebtedness, which will reduce the funds available to us for purposes such as potential acquisitions, capital expenditures, marketing, development and other general corporate purposes; |
| • | vulnerability to fluctuations in interest rates, as a substantial portion of our indebtedness bears variable rates of interest, including an interest rate hedging agreement; |
| • | reducing our flexibility in planning for, or responding to, changing conditions in our business and our industry; |
| • | limiting our ability to borrow additional funds; and |
| • | making us more vulnerable to general economic downturns and adverse developments in our business. |
Product liability claims could be costly to defend and could expose us to loss.
The use of our products exposes us to an inherent risk of product liability. Patients, health care workers or health care providers who claim that our products have resulted in injury could initiate product liability litigation seeking large damage awards against us. Costs of the defense of such litigation, even if successful, could be substantial. We maintain insurance against product liability and defense costs in the amount of $17,000 per occurrence. There is no assurance that we will successfully defend claims, if any, arising with respect to products or that the insurance we carry will be sufficient. A successful claim against us in excess of insurance coverage could materially and adversely affect us. Furthermore, there is no assurance that product liability insurance will continue to be available to us on acceptable terms.
19
Table of Contents
Termination or interruption of relationships with our suppliers, or failure of such suppliers to perform, could disrupt our business and could have a material adverse effect on our business and financial condition.
Although most raw materials essential to the Company’s business are generally available from multiple sources, certain key components (including resin, which is the principal raw material used in the manufacture of collection systems for the containment of medical waste, patient bedside utensils and laboratory products) are currently obtained by the Company from limited sources. If a supplier of significant raw materials including component parts, finished goods or services were to terminate its relationship with the Company, or otherwise cease supplying raw materials, component parts, finished goods or services consistent with past practices, the Company’s ability to meet its obligations to its customers may be disrupted. A disruption with respect to numerous products, or with respect to a few significant products, could have a material adverse affect on the Company’s business and financial condition.
The Company’s success depends largely on its ability to attract and retain key personnel.
Much of the future success of the Company depends on the continued service and availability of skilled personnel, including its Chief Executive Officer, members of its executive team, and those in manufacturing, marketing, finance, and information technology. The Company has relied on its ability to grant stock options as one mechanism for recruiting and retaining this highly skilled talent. Accounting regulations requiring the expensing of stock options may impair the Company’s future ability to provide these incentives without incurring significant compensation costs. There can be no assurance that the Company will continue to successfully attract and retain key personnel.
Failure of the Company’s information technology systems could adversely affect the Company’s future operating results.
Information technology system failures could disrupt the Company’s ability to function in the normal course of business by potentially causing delays or cancellation of customer orders, impeding the manufacture or shipment of products, hindering the planning and procurement of raw materials, or resulting in the unintentional disclosure of customer or Company information. Management has taken steps to address these concerns by its implementation of internal control measures and certain system redundancy or recovery plans. During fiscal 2007, the Company implemented a new software system, mySAP software suite which, during the past fiscal year, was extended to all of Medegen’s operations. However, there can be no assurance that a system failure or data security breach will not have a material adverse affect on the Company’s results of operations.
The Company’s products may be subject to recall or product liability claims.
The Company’s products are used in connection with surgical procedures and in other medical contexts in which it is important that those products function with precision and accuracy. If the Company’s products do not function as designed, or are designed improperly, the Company may be forced by regulatory agencies to withdraw such products from the market. In addition, if medical personnel or their patients suffer injury as a result of any failure of the Company’s products to function as designed, or an inappropriate design, the Company may be subject to lawsuits seeking significant compensatory and punitive damages. Any product recall or lawsuit seeking significant monetary damages may have a material adverse affect on the Company’s business and financial condition.
If a natural or man-made disaster strikes our manufacturing facilities, we may be unable to manufacture our products for a substantial amount of time, which may adversely affect our expected results of operations.
We principally rely on our manufacturing facilities in Arden, North Carolina, Gallaway, Tennessee, and Clarksburg, West Virginia. These facilities may be affected by natural or man-made disasters. These facilities and the manufacturing equipment we use to produce our products would be difficult to replace and could require
20
Table of Contents
substantial time to repair or replace. In the event one of our facilities was affected by a disaster, we would be forced to rely on third-party manufacturers. However, third-party manufacturers may not be available or they may be unable to produce our products on the schedule or to the specifications that we require. We currently carry insurance in the aggregate amount of $20,000 to protect us against many, but not all such disasters. However, such insurance may not be sufficient to cover certain losses and may become unavailable on acceptable terms, if available at all.
The Company is subject to a number of existing laws and regulations, and a significant adverse change in, or failure to comply with, these requirements could adversely affect the Company’s business.
As a participant in the heavily-regulated health care industry, the Company is regulated by numerous government authorities in both United States and abroad. The manufacturing, distribution, marketing, labeling, sale and use of the Company’s products are subject to extensive regulation by the FDA and other regulatory authorities. The Company’s failure to comply with applicable laws or regulations could cause a regulatory body to take disciplinary, corrective or punitive measures in the form of warnings, civil sanctions, criminal sanctions, recalls or seizures, injunctions, withdrawal of approvals, or restrictions on operations, all of which could adversely affect the Company’s business.
Importantly, in addition to the laws and regulations that directly apply to the Company, the Company is also impacted by the laws and regulations that apply to its customers. The Company’s targeted customer base consists primarily of acute care facilities, and recently has expanded to include physician offices, outpatient surgery centers, long-term care facilities, and laboratories. These customers typically rely substantially on government programs for reimbursement for the services provided to patients in which the Company’s products are utilized, and their continued participation in such programs requires compliance with extensive governmental regulatory schemes. Even though the Company may not be directly regulated under these requirements, its products must be capable of being utilized by customers in compliance with such requirements.
The Company and its customers are subject to numerous laws and regulations relating to health care fraud and abuse. These laws are particularly relevant with respect to the sale and marketing of the Company’s products and the interaction between the Company and its customers. Fraud and abuse laws can be complicated and subject to frequent change, and as a result, may be violated unintentionally. Because many of these laws and regulations have not been extensively interpreted or consistently enforced, health care industry participants often do not have the benefit of significant regulatory or judicial interpretation of these laws and regulations. Different interpretations or enforcement of these laws and regulations could subject the Company’s current or past practices to regulatory scrutiny and could necessitate changes to the Company’s operations. Violations of fraud and abuse laws may result in significant criminal, civil and administrative sanctions. A determination, or even an investigation as to whether, the Company has violated fraud and abuse laws could adversely affect the Company’s business.
The Company is dependent on manufacturing and logistic services provided by third-parties and related risks.
Many of the Company’s products are manufactured in whole or part by third-party manufacturers, which are located throughout the United States and other parts of the world. While outsourcing arrangements may lower the fixed cost of operations, they also reduce the Company’s direct control of production and distribution. It is uncertain what affect such diminished control will have on the quality or quantity of the products manufactured, or the flexibility of the Company to respond to changing market conditions. The Company also depends on third-party transportation companies to deliver supplies necessary to manufacture our products from vendors to the Company’s various facilities and to move the Company’s products to customers within and outside the United States. The Company’s manufacturing operations, and the operations of the transportation companies on which the Company depends, may be adversely affected by natural disasters and significant human events, such as a war, terrorist attack, riot, strike, slowdown or similar event. Any disruption in the Company’s manufacturing or transportation could materially adversely affect the Company’s ability to meet customer demands or its operations generally.
21
Table of Contents
The Company’s quarterly revenue and operating results may fluctuate for a variety of reasons.
The Company’s profit margins vary among its products and its distribution channels. As a result, the overall profitability of the Company in any given period will depend, in part, on the product, geographic, and channel mix reflected in that period’s net sales.
Changes in accounting rules could adversely affect the Company’s future operating results.
Financial statements are prepared in conformity with accounting principles generally accepted in the United States of America. These principles are subject to interpretation by various governing bodies, including the Financial Accounting Standards Board (“FASB”) and the SEC, who interpret and create appropriate accounting regulations. A change from current accounting regulations, or the interpretations thereof, can have a significant affect on the Company’s results of operations and could impact the manner in which the Company conducts business.
Unanticipated changes in the Company’s tax rates could affect its future results.
The Company’s future effective tax rates could be favorably or unfavorably affected by unanticipated changes in tax laws or their interpretation. In addition, the Company is subject to the continuous examination of our income tax returns by the Internal Revenue Service and other tax authorities. The Company regularly assesses the likelihood of adverse outcomes resulting from these examinations to determine the adequacy of our provision for income taxes. There can be no assurance that the outcomes from these continuous examinations will not have an adverse affect on its operating results and financial condition.
The market price of the Company’s common stock has been, and may continue to be volatile.
The market price of the Company’s common stock has been, and may continue to be, highly volatile for various reasons, including the following:
| • | claims involving potential infringement of patents and other intellectual property rights; |
| • | quarter-to-quarter variances in the Company’s financial results; |
| • | analyst and other projections or recommendations regarding the Company’s common stock or medical device stocks generally; |
| • | any restatement of the Company’s financial statements or any investigation into the Company by the SEC or another regulatory authority; |
| • | a general decline, or rise, of stock prices in the capital markets generally; |
| • | investors concerns regarding the credibility of corporate financial reporting and integrity of financial markets; |
| • | announcements by us or our competitors of new products and service offerings, significant contracts, acquisitions or strategic relationships; |
| • | additions or departures of key personnel; and |
| • | the trading volume of our common stock. |
Anti-Takeover provisions of our charter documents and Delaware law could prevent or delay transactions resulting in a change of control.
Provisions of our certificate of incorporation and bylaws and applicable provisions of Delaware law may make it more difficult for or prevent a third party from acquiring control of us without the approval of our board of directors. These provisions:
| • | establish a classified board of directors, so that not all members of our board may be elected at one time; |
22
Table of Contents
| • | set limitations on the removal of directors; |
| • | limit who may call a special meeting of stockholders; |
| • | establish advance notice requirements for nominations for election to our board of directors or for proposing matters that can be acted upon at stockholder meetings; |
| • | prohibit stockholder action by written consent, thereby requiring all stockholder actions to be taken at a meeting of our stockholders; |
| • | provide our board of directors the ability to designate the terms of and issue new series of preferred stock without stockholder approval; and |
| • | require a super-majority vote for mergers and certain other business combinations without approval by a majority of the board of directors. |
ITEM 1B – UNRESOLVED STAFF COMMENTS
None.
The Company owns manufacturing facilities in Gallaway, Tennessee, Arden, North Carolina and Clarksburg, West Virginia. The Company acquired in March 2007, a 28,200 square foot building in Brentwood, New York to serve as the Company’s new corporate headquarters, which has been completely renovated. During fiscal 2010, the Company sold a 12,000 square foot building located in Hauppauge, New York which was used as general offices and served as the Company’s former headquarters. Such building was sold in March 2010, and was considered held for sale and classified in Other Assets, net prior to March 31, 2010. In addition, the Company leases general office space in Shanghai, China. Management believes that the Company’s facilities are adequate to meet its current needs and should continue to be adequate for the foreseeable future. Additional information about our facilities is set forth in the following table:
| Location |
Primary Use |
Owned/ Leased |
Lease |
Size in Square Feet |
|||||
| Arden, North Carolina |
Manufacturing/Warehouse/Distribution | Owned | n/a | 205,000 | (a) | ||||
| Brentwood, New York |
Executive Offices | Owned | n/a | 28,200 | (b) | ||||
| Clarksburg, West Virginia |
Manufacturing/Warehouse/Distribution | Owned | n/a | 43,000 | (c) | ||||
| Gallaway, Tennessee |
Manufacturing/Warehouse/Distribution | Owned | n/a | 265,000 | (d) | ||||
| Shanghai, China |
General Office | Leased | January 2012 | 2,550 | (e) | ||||
| Fletcher, North Carolina |
Warehouse/Distribution | Leased | April 2011 | 17,920 | (f) | ||||
| Oakland, Tennessee |
Warehouse/Distribution | Leased | May 2011 | 40,000 | (g) |
| (a) | The principal manufacturing, distribution and warehouse facility of the Company is 32 acres. An Industrial Revenue Bond in the amount of $1,360 was outstanding as of March 31, 2010, which was used to acquire and renovate the facility and acquire certain manufacturing equipment. |
| (b) | The Company relocated to the Brentwood, New York corporate headquarters from the Hauppauge, New York corporate office in March 2009. This facility was acquired in March 2007. |
| (c) | The Clarksburg, West Virginia facility located on 15 acres, was part of our acquisition of the BioSafety Division of Maxxim Medical, Inc. in October 2002. |
| (d) | The Gallaway, Tennessee facility located on 25 acres, was part of our acquisition of Medegen Medical Products, LLC in October 2006. |
| (e) | The Offices in Shanghai, China are leased at an annual rental of $88. |
| (f) | The warehouse facility in Fletcher, North Carolina is leased at an annual rental of $36. |
| (g) | The warehouse facility in Oakland, Tennessee is leased at an annual rental of $120. |
23
Table of Contents
The Company is involved in one (1) product liability case, which is covered by insurance. While the results of the lawsuit cannot be predicted with certainty, management does not expect that the ultimate liability, if any, will have a material adverse effect on the financial position or results of operations of the Company.
24
Table of Contents
ITEM 5 – MARKET FOR REGISTRANT’S COMMON EQUITY, RELATED SHAREHOLDER MATTERS AND ISSUER PURCHASES OF EQUITY SECURITIES
Market Price for the Common Stock
Our Common Stock trades on the NASDAQ Stock Market under the symbol “MDCI”. As of June 2, 2010 there were approximately 174 stockholders of record, which does not include approximately 4,059 beneficial owners of shares held in the names of brokers or other nominees. The following table sets forth, for the periods indicated, the high and low intra-day prices per share of Medical Action Common Stock as reported by the NASDAQ Global Select Stock MarketSM .
| Fiscal 2010 |
||||||
| High | Low | |||||
| First Quarter |
$ | 12.50 | $ | 7.81 | ||
| Second Quarter |
13.77 | 10.33 | ||||
| Third Quarter |
17.74 | 10.58 | ||||
| Fourth Quarter |
16.65 | 11.03 | ||||
| Fiscal 2009 |
||||||
| High | Low | |||||
| First Quarter |
$ | 17.49 | $ | 10.36 | ||
| Second Quarter |
14.44 | 9.16 | ||||
| Third Quarter |
13.33 | 5.82 | ||||
| Fourth Quarter |
10.55 | 5.42 | ||||
Dividends
We have never paid cash dividends, and do not anticipate paying dividends in the foreseeable future as the Board of Directors intends to retain future earnings for use in our business. Any future determination as to the payment of dividends will depend upon our financial condition, results of operations and such other factors as the Board of Directors deems relevant. In addition, our credit facilities contain covenants limiting the declaration and distribution of a cash dividend.
25
Table of Contents
Performance Graph
The following graph shows the cumulative total return on our Common Stock against the cumulative total return of the Standard & Poor 500 Stock Index and the Standard & Poor Healthcare (Medical Products and Supplies) Industry for the period of five years commencing April 1, 2005 and ending March 31, 2010.
COMPARISON OF 5 YEAR CUMULATIVE TOTAL RETURN*
Among Medical Action Industries Inc., The S&P 500 Index
And The S&P Health Care Supplies Index
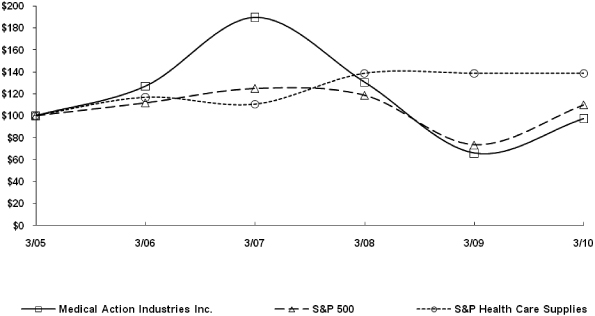
*$100 invested on 3/31/05 in stock or index, including reinvestment of dividends.
Fiscal year ending March 31.
The information in this Form 10-K appearing under the heading “Performance Graph” is being “furnished” pursuant to Item 201 (e) of Regulation S-K under the Securities Act of 1933, as amended, and shall not be deemed to be “soliciting material” or “filed” with the SEC or subject to Regulation 14A of 14C, other than as provided in Item 201 (e) of Regulation S-K, or to the liabilities of Section 18 of the Securities Exchange Act of 1934, as amended.
26
Table of Contents
Securities Authorized for Issuance under Equity Compensation Plans
The following table shows, as of March 31, 2010, information with respect to compensation plans under which shares of Common Stock are authorized for issuance.
| Plan Category |
Number of securities to be issued upon exercise of outstanding options(1) |
Weighted-average exercise price of outstanding options |
Number of securities remaining available for future issuance under equity compensation plans(4) | |||
| Equity compensation plans approved by stockholders (2) |
1,319,562 | 12.88 | 1,550,063 | |||
| Equity compensation plans not approved by stockholders (3) |
||||||
| Total |
1,319,562 | 12.88 | 1,550,063 |
| (1) | All share amounts and exercise prices have been adjusted to reflect the Company’s three-for-two stock split distributed on February 9, 2007. |
| (2) | These equity compensation plans are the 1994 Stock Incentive Plan, 1989 Non-Qualified Stock Option Plan and 1996 Non-Employee Stock Option Plan, all of which have been approved by our stockholders. |
| (3) | The Company does not have any equity compensation plans that have not been approved by our stockholders. |
| (4) | Excludes securities to be issued upon exercise of outstanding options. |
ITEM 6 – SELECTED FINANCIAL DATA
Selected Financial Data
| Year ended March 31, | |||||||||||||||
| 2010 | 2009 | 2008 | 2007 | 2006 | |||||||||||
| Earnings Data |
|||||||||||||||
| Net Sales |
$ | 290,146 | $ | 296,070 | $ | 290,528 | $ | 217,328 | $ | 150,942 | |||||
| Income before income taxes |
27,358 | 8,096 | 21,452 | 21,128 | 18,515 | ||||||||||
| Net income |
16,841 | 4,955 | 13,225 | 12,969 | 11,461 | ||||||||||
| Net income per common share: |
|||||||||||||||
| Basic (1) |
1.04 | 0.31 | 0.83 | 0.82 | 0.73 | ||||||||||
| Diluted (1) |
1.03 | 0.31 | 0.81 | 0.80 | 0.72 | ||||||||||
| Balance Sheet Data |
|||||||||||||||
| Total Assets |
$ | 200,796 | $ | 215,166 | $ | 199,036 | $ | 192,670 | $ | 100,391 | |||||
| Working Capital |
24,040 | 48,811 | 25,138 | 17,719 | 37,430 | ||||||||||
| Long-term debt including capital leases (less current portion) |
2,734 | 53,147 | 34,421 | 47,203 | 2,440 | ||||||||||
| Shareholders’ equity |
142,722 | 122,005 | 115,779 | 98,364 | 83,143 | ||||||||||
| (1) | Earnings per share have been restated to reflect a three-for-two stock split in February 2007, for the fiscal years ended March 31, 2007 and prior. |
27
Table of Contents
ITEM 7 – MANAGEMENT’S DISCUSSION AND ANALYSIS OF FINANCIAL CONDITION AND RESULTS OF OPERATIONS
OVERVIEW
All dollar amounts presented in our Management’s Discussion and Analysis of Financial Condition and Results of Operations are presented in thousands, expect share and per share data. The following table sets forth certain operational data (in dollars and as a percentage of net sales) for the fiscal years indicated:
| 2010 | 2009 | 2008 | ||||||||||||||||
| Net Sales |
$ | 290,146 | 100.00 | % | $ | 296,070 | 100.0 | % | $ | 290,528 | 100.0 | % | ||||||
| Gross Profit |
$ | 68,904 | 23.7 | % | $ | 50,935 | 17.2 | % | $ | 64,452 | 22.2 | % | ||||||
| Selling, General and |
||||||||||||||||||
| Administrative Expenses |
$ | 40,198 | 13.9 | % | $ | 40,161 | 13.6 | % | $ | 39,672 | 13.7 | % | ||||||
| Income Before Income Taxes |
$ | 27,358 | 9.2 | % | $ | 8,096 | 2.7 | % | $ | 21,452 | 7.4 | % | ||||||
| Net Income |
$ | 16,841 | 5.7 | % | $ | 4,955 | 1.7 | % | $ | 13,225 | 4.6 | % | ||||||
The Company’s revenues decreased by $5,924 or 2.0% to $290,146 for the fiscal year ended March 31, 2010 over the fiscal year ended March 31, 2009. The decrease in revenue is comprised of unit volume decreases of $4,400 and price/sales mix decreases of $1,524.
Gross profit increases in both dollars and as a percentage of net sales were primarily a result of a decline in resin prices, a change in the mix of products sold, decreased outbound freight costs and decreased costs of products sourced from foreign suppliers, principally from China.
Selling, general and administrative expenses were consistent with prior year levels in both dollars and as a percentage of net sales.
FISCAL 2010 COMPARED TO FISCAL 2009
The following table sets forth the major sales variance components for the year ended March 31, 2010 versus March 31, 2009:
| 2009 Net Sales |
$ | 296,070 | ||
| Volume of Existing Products |
(4,400 | ) | ||
| Price/Sales Mix |
(1,524 | ) | ||
| 2010 Net Sales |
$ | 290,146 | ||
28
Table of Contents
Net sales for the fiscal year ended March 31, 2010 decreased 2.0% to $290,146 from $296,070 for the fiscal year ended March 31, 2009. The following table sets forth the major components of the decrease in net sales as well as percent increases or decreases in unit sales and average selling prices by significant product classes for the fiscal year ended March 31, 2010 compared to the fiscal year ended March 31, 2009:
| Net Sales $ increase (decrease) |
Unit Sales % increase (decrease) |
Average Selling Price /Sales Mix % increase (decrease) |
||||||||
| Minor Procedure Kits and Trays |
$ | 1,318 | 1.7 | % | -2.5 | % | ||||
| Containment Systems for Medical Waste |
(556 | ) | -1.1 | % | -1.5 | % | ||||
| Dressings and Surgical Sponges |
(1,715 | ) | -11.5 | % | 1.4 | % | ||||
| Operating Room Disposables and Sterilization |
(1,987 | ) | -3.4 | % | 1.3 | % | ||||
| Laboratory Products |
(2,296 | ) | -7.1 | % | -1.8 | % | ||||
| Patient Bedside Utensils |
(2,401 | ) | -3.4 | % | 0.7 | % | ||||
| Other, net |
1,713 | not meaningful | not meaningful | |||||||
| $ | (5,924 | ) | ||||||||
The net unit volume decrease for the fiscal year ended March 31, 2010 compared to the fiscal year ended March 31, 2009 was primarily attributable to losses in the operating room disposables and sterilization (predominantly operating room towels), dressings and surgical sponges (predominantly laparotomy sponges), laboratory products (predominantly petri dishes, specimen containers and commode collectors) and patient bedside utensils (predominantly wash basins) product classes. Management believes that these declines are attributable to an increase in competitive pressures, a decline in hospital admission rates and elective surgeries and the termination or change in terms of certain supply and group purchasing organization contracts, namely on the Company’s urinals, operating room towels, laparotomy sponges and patient aids products. The net unit volume decline was partially offset by an increase in the minor procedure kits and trays product class resulting from increased domestic market penetration for the Company’s i.v. start kits and central line dressing change products.
The overall average selling price/sales mix decrease for the fiscal year ended March 31, 2010 as compared to the fiscal year ended March 31, 2009 was due to general market pricing pressures on the Company’s product classes which was partially offset by an increase in the average selling prices of the Company’s operating room towels and laparotomy sponges products. The increase in the average selling prices of these products was attributable to the termination of business that was priced at below market pricing levels.
During the fiscal year ended March 31, 2010, the containment systems for medical waste, patient bedside utensils and laboratory product categories represented approximately 52% of the Company’s revenue. The primary raw material utilized in the manufacture of these categories is plastic resin. In recent years, world events have caused the cost of plastic resin to increase and be extremely volatile. While the cost of plastic resin has declined from its peak levels reached during the month of September 2008, the volatility associated with resin costs and product acquisition costs from foreign suppliers may continue for the foreseeable future. In the past, the Company has been able, from time to time, to increase selling prices for certain of the products within these categories to recover a portion of the increased cost. However, the Company is unable to give any assurance that it will be able to pass along future cost increases to its customers, if necessary. It is anticipated that the Company will purchase approximately 50 million pounds of resin during fiscal 2011. Each $.01 fluctuation could impact cost of goods sold by $500 on an annualized basis.
The Company has entered into agreements with substantially all major group purchasing organizations. We are the sole-source vendor for several of these agreements. These agreements, which expire at various times over the next several years, can be terminated typically on ninety (90) days advance notice and do not contain minimum purchase requirements. The Company, to date, has been able to achieve significant compliance to their respective member hospitals. The termination or non-renewal of any of these agreements may result in the
29
Table of Contents
significant loss of business or lower average selling prices. In some cases, as these agreements are renewed, the average selling prices could be materially lower or additional vendors could be added to the agreements resulting in potential losses in market share.
Historically, the Company has participated in several reverse auctions and bid processes in order to achieve renewal of certain major group purchasing agreements. During the fiscal year ended March 31, 2010, the Company extended certain major group purchasing agreements. No significant new agreements were added. The Company anticipates participating in reverse auctions or similar bid processes as deemed necessary during the fiscal year ended March 31, 2011.
The following table sets forth sales and cost of sales data for the fiscal years ended March 31,
| 2010 | 2009 | 2008 | ||||||||||
| Net Sales |
$ | 290,146 | $ | 296,070 | $ | 290,528 | ||||||
| Cost of Sales |
221,242 | 245,135 | 226,076 | |||||||||
| Gross Profit |
68,904 | 50,935 | 64,452 | |||||||||
| Gross Profit Percentage |
23.7 | % | 17.2 | % | 22.2 | % | ||||||
| Selling, General and Administrative Expenses |
$ | 40,198 | $ | 40,161 | $ | 39,672 | ||||||
| As a Percentage of Net Sales |
13.9 | % | 13.6 | % | 13.7 | % | ||||||
Gross profit increases in both dollars and as a percentage of net sales for the fiscal year ended March 31, 2010 as compared to the fiscal year ended March 31, 2009 were a result of lower resin costs of $10,296, an increase of $2,559 resulting from a change in the mix of products sold, decreased outbound freight costs of $2,393 and decreased costs of products sourced from foreign suppliers, principally from China, of $2,040.
Many of the Company’s products are produced from petroleum derived raw materials such as plastic resin. The Company also bears the cost of both inbound and outbound freight shipments of raw materials and finished products, which are significantly impacted by the cost of oil. The cost of crude oil has declined significantly from its peak levels reached during the month of July 2008. Consequently, the Company has experienced the benefits from lower plastic resin costs during the fiscal year ended March 31, 2010 as much of the resin that was used in production during this period was purchased at a lower average cost than resin used during the fiscal year ended March 31, 2009.
During the third and fourth quarters of fiscal 2009, the cost of plastic resin gradually declined. During March 2009, the Company believed that market conditions reflected a low point in the cost of resin and through a combination of advance purchases and future supply agreements, the Company was able to secure a supply of approximately 50% of its fiscal 2010 resin requirements at market prices in effect at the time. Furthermore, the resin used in production during fiscal 2010 which was not acquired as part of these advance purchases was purchased at lower average costs than the purchases of similar resin during fiscal 2009. These lower average costs contributed to an increase in gross margin for the fiscal year ended March 31, 2010 when compared to the previous year.
The price of resin remains volatile and has increased during the fiscal year ended March 31, 2010. The Company has been able to avoid the financial impact of some of the increase in resin costs through managing raw material levels and through the benefit of the supply agreements entered into during March 2009. It is likely that the Company will experience an increase in the cost of resin and a corresponding decline in gross margins when the supply agreements expire in March 2010.
The volatility associated with resin costs and product acquisition costs from foreign suppliers may continue for the foreseeable future. In the past, we have been able, from time to time, to increase selling prices for certain products subject to such cost volatility as a means to recover a portion of the increases. However, we are unable to give any assurance that we will be successful in passing along future cost increases to our customers, if deemed necessary.
30
Table of Contents
Selling, general and administrative expenses for the fiscal year ended March 31, 2010 increased 0.1% to $40,198 or 13.9% of net sales from $40,161 or 13.6% of net sales for the fiscal year ended March 31, 2009. The increase in selling, general and administrative expenses as a percentage of net sales was primarily due to the decline in net sales and increases in salaries, depreciation and stock-based compensation. The increase was partially offset by declines in insurance and recruiting costs as well as a gain on the sale of the Company’s former corporate headquarters of $556.
Distribution expenses (which are included in selling, general and administrative expenses) decreased $461 to $7,477 for the fiscal year ended March 31, 2010 as compared to $7,938 for the fiscal year ended March 31, 2009. The decrease in distribution expenses was primarily due to decreased labor costs, primarily temporary labor and overtime expenses resulting from increased labor efficiencies.
Interest expense for the fiscal year ended March 31, 2010 decreased to $1,352 from $2,682 for the fiscal year ended March 31, 2009. The decrease in interest expense was attributable to a decrease in the average principal loan balances outstanding and a decrease in interest rates during the fiscal year ended March 31, 2010 versus March 31, 2009.
Income tax expense amounted to $10,517 and $3,141 for the fiscal years ended March 31, 2010 and 2009, respectively. Income tax expense as a percent of income before income taxes was 38.4% and 38.9% for the fiscal years ended March 31, 2010 and 2009, respectively. The decrease in the tax rate was the result of a change in state apportionment factors.
Net income for the fiscal year ended March 31, 2010 increased to $16,841 from $4,955 for the fiscal year ended March 31, 2009. The increase in net income is attributable to the aforementioned increase in gross profit and decrease in interest expense which was partially offset by an increase in selling, general and administrative expenses.
FISCAL 2009 COMPARED TO FISCAL 2008
The following table sets forth the major sales variance components for the year ended March 31, 2009 versus March 31, 2008:
| 2008 Net Sales |
$ | 290,528 | ||
| Volume of Existing Products |
(7,194 | ) | ||
| Price/Sales Mix |
12,736 | |||
| 2009 Net Sales |
$ | 296,070 | ||
31
Table of Contents
Net sales for the fiscal year ended March 31, 2009 increased 1.9% to $296,070 from $290,528 for the fiscal year ended March 31, 2008. The following table sets forth the major components of the increase in net sales as well as percent increases or decreases in unit sales and average selling prices by significant product classes for the fiscal year ended March 31, 2009 compared to the fiscal year ended March 31, 2008:
| Net Sales $ increase (decrease) |
Unit Sales % increase (decrease) |
Average Selling Prices / Sales Mix % increase (decrease) |
||||||||
| Minor Procedure Kits and Trays |
$ | 8,660 | 6.8 | % | 5.7 | % | ||||
| Containment Systems for Medical Waste |
2,743 | 1.3 | % | 4.1 | % | |||||
| Protective Apparel |
2,658 | 27.8 | % | 6.0 | % | |||||
| Patient Bedside Utensils |
(409 | ) | -6.6 | % | 6.4 | % | ||||
| Other Dressings and Surgical Sponges |
(432 | ) | -14.0 | % | 1.3 | % | ||||
| Laboratory Products |
(669 | ) | -7.4 | % | 4.5 | % | ||||
| Laparotomy Sponges |
(740 | ) | -8.9 | % | 2.6 | % | ||||
| Specimen Containers |
(766 | ) | -15.3 | % | 9.8 | % | ||||
| Operating Room Towels |
(1,919 | ) | -11.1 | % | 3.7 | % | ||||
| Other Operating Room Disposables and Sterilization Products |
(4,022 | ) | 13.1 | % | -26.6 | % | ||||
| Other, net |
438 | not meaningful | not meaningful | |||||||
| $ | 5,542 | |||||||||
The net unit volume decreases for the fiscal year ended March 31, 2009 as compared to the fiscal year ended March 31, 2008 were primarily from losses in specimen containers, other dressings and surgical sponges, operating room towels, laparotomy sponges and patient bedside utensils. Management believes that the decline is attributable to competitive pressures, the effect of customers’ management of inventory balances in reaction to current economic conditions, back order positions and the termination of a supply contract. A significant component of the Company’s net unit volume decreases in other operating room disposables and sterilization products relates to patient aids and resulted from the Company’s inability to negotiate acceptable price increases on crutches to a major customer and the Company’s unwillingness to continue to provide these crutches at current pricing levels. This resulted in a decline of approximately $3,239 in net sales with only a negligible impact on profitability for the fiscal year ended March 31, 2009 compared to the fiscal year ended March 31, 2008. These net unit volume declines were partially offset by volume increases primarily from greater domestic penetration of our minor procedure kits and trays product line.
The price/sales mix increases were primarily from increased average selling prices of our minor procedure kits and trays, containment systems for medical waste and specimen containers product lines. The increase in average selling prices of certain containment systems for medical waste and specimen container products was due primarily to price increases implemented to recover a portion of the increases in plastic resin (the primary raw material utilized in the manufacture of these products). The increase in average selling prices of our minor procedure kits and trays products was the result of a shift in sales mix and due to an increase in sales of kits containing enhanced components.
Containment systems for medical waste and the product lines added as a result of the acquisition of Medegen, represented approximately 50% of the Company’s revenue in fiscal year 2009. The primary raw material utilized in the manufacture of this product line is plastic resin. In recent years, world events have caused the cost of plastic resin to increase and be extremely volatile. The Company anticipates that such volatility may continue in the future. In the past, the Company has been able, from time to time, to increase selling prices for certain of these products to recover a portion of the increased cost. However, the Company is unable to give any assurance that it will be able to pass along future cost increases to its customers, if necessary. It is anticipated that the Company will purchase in excess of 50 million pounds of resin during fiscal 2010. Each $.01 fluctuation could impact cost of goods sold by $500 on an annualized basis.
32
Table of Contents
The volatility associated with resin costs and product acquisition costs from foreign suppliers may continue for the foreseeable future. In the past, we have been able, from time to time, to increase selling prices for certain products subject to such cost volatility as a means to recover a portion of the increases. However, we are unable to give any assurance that we will be successful in passing along future cost increases to our customers, if deemed necessary.
The Company has entered into agreements with nearly every major group purchasing organization. These agreements, which expire at various times over the next several years, can be terminated typically on ninety (90) day advance notice and do not contain minimum purchase requirements. The Company, to date, has been able to achieve significant compliance to their respective member hospitals. The termination or non-renewal of any of these agreements may result in the significant loss of business or lower average selling prices. In some cases, as these agreements are renewed, the average selling prices could be materially lower.
During the quarter ended June 30, 2008, the Company elected to exercise the ninety (90) day advanced notice termination provisions within one of its GPO agreements, under which the Company supplies disposable operating room towels and laparotomy sponges. The termination of the agreement with the aforementioned GPO amounted to less than 2% of the Company’s net sales and had resulted from the Company’s inability to negotiate acceptable price increases with the GPO and the Company’s unwillingness to continue to provide products to the GPO members at current pricing levels. Although net sales have not been significantly impacted by this termination, the Company cannot predict the future effects on its financial results from such termination.
During fiscal 2009, the Company participated in several reverse auctions and bid processes in order to achieve renewal of certain major group purchasing agreements. This process has resulted in the renewal or extension of fourteen existing agreements. No new agreements were added and the only existing agreement lost is noted above. Several of the renewals were renewed at lower average selling prices, but may result in the attainment of additional business. The Company anticipates continued participation in reverse auctions or similar bid processes as deemed necessary during fiscal 2010.
The following table sets forth sales and cost of sales data for the fiscal years ended March 31,
| 2009 | 2008 | 2007 | ||||||||||
| Net Sales |
$ | 296,070 | $ | 290,528 | $ | 217,328 | ||||||
| Cost of Sales |
245,135 | 226,076 | 163,956 | |||||||||
| Gross Profit |
50,935 | 64,452 | 53,372 | |||||||||
| Gross Profit Percentage |
17.2 | % | 22.2 | % | 24.6 | % | ||||||
| Selling, General and Administrative Expenses |
$ | 40,161 | $ | 39,672 | $ | 30,723 | ||||||
| As a Percentage of Net Sales |
13.6 | % | 13.7 | % | 14.1 | % | ||||||
Gross profit declines in both dollars and as a percentage of net sales for the fiscal year ended March 31, 2009 as compared to the fiscal year ended March 31, 2008 were a result of increased costs of products sourced from foreign suppliers, principally from China, of approximately $6,238, inefficiencies incurred at our Tennessee manufacturing facility of approximately $6,167, higher resin prices of approximately $3,789, increased operating expenses in our West Virginia and North Carolina manufacturing facilities and the transfer of certain administrative processes to manufacturing overhead of approximately $1,713 and increases in our provision for excess and obsolete inventory and other costs of sales of approximately $1,505. These decreases were partially offset by a net increase of approximately $5,542 resulting from higher average selling prices and changes in the mix of products sold and decreased outbound freight costs to customers of approximately $342.
Many of the Company’s products are produced from petroleum derived raw materials such as plastic resin. The Company also bears the cost of both inbound and outbound freight shipments of raw materials and finished products, which are significantly impacted by the cost of oil. The cost of crude oil has declined significantly from its peak levels reached during the month of July 2008. The cost of plastic resin has begun to decline and, to some
33
Table of Contents
extent, the Company has experienced the benefits from lower plastic resin costs during the three months ended March 31, 2009 as much of the resin that was used in production during the three months ended March 31, 2009 was purchased at a lower average cost than resin used during the first nine months of fiscal 2009.
The volatility associated with resin costs and product acquisition costs from foreign suppliers may continue for the foreseeable future. In the past, we have been able, from time to time, to increase selling prices for certain products subject to such cost volatility as a means to recover a portion of the increases. However, we are unable to give any assurance that we will be successful in passing along future cost increases to our customers, if deemed necessary.
Selling, general and administrative expenses for the fiscal year ended March 31, 2009 increased 1.2% to $40,161 or 13.6% of net sales from $39,672 or 13.7% of net sales for the fiscal year ended March 31, 2008. The increase in selling, general and administrative expenses was primarily due to severance and related expenses associated with the restructuring of certain sales related departments. The increase was partially offset by decreased salary and related expenses as a result of increased efficiencies due to the consolidation of certain administrative functions from the Tennessee facility into its Brentwood, New York corporate headquarters and transfer of certain administrative processes into cost of goods sold also as a result of the consolidation of the facilities and a decrease in bonuses as a result of the Company not meeting certain earnings targets.
Interest expense for the fiscal year ended March 31, 2009 decreased to $2,682 from $3,406 for the fiscal year ended March 31, 2008. The decrease in interest expense was primarily due to a decrease in interest rates during the fiscal year ended March 31, 2009 versus March 31, 2008 which was partially offset by a net increase in average principal loan balances outstanding during the fiscal year ended March 31, 2009 versus March 31, 2008. The increase in principal loan balances were primarily due to a decline in net cash provided by operating activities and an increase in investing activities, which were primarily comprised of equipment and renovations to our new corporate headquarters.
Income tax expense amounted to $3,141 and $8,227 for the fiscal years ended March 31, 2009 and 2008, respectively. Income tax expense as a percent of income before income taxes was 38.8% and 38.3% for the fiscal years ended March 31, 2009 and 2008, respectively. The increase in the tax rate was the result of a change in state apportionment factors which was partially offset by a decline in our federal statutory rate resulting from a decline in profitability.
Net income for the fiscal year ended March 31, 2009 decreased to $4,955 from $13,225 for the fiscal year ended March 31, 2008. The decrease in net income is attributable to the aforementioned decrease in gross profit and increase in selling, general and administrative expenses, which were partially offset by an increase in net sales and a decrease in interest expense.
LIQUIDITY AND CAPITAL RESOURCES
Cash Flows
Cash and cash equivalents increased as follows for the fiscal years ended March 31, :
| 2010 | 2009 | 2008 | ||||||||||
| Cash provided by operating activities |
$ | 43,268 | $ | 3,062 | $ | 19,213 | ||||||
| Cash used in investing activities |
(2,124 | ) | (13,934 | ) | (6,271 | ) | ||||||
| Cash (used in) provided by financing activities |
(38,962 | ) | 12,227 | (11,665 | ) | |||||||
| Increase in cash and cash equivalents |
2,182 | 1,355 | 1,277 | |||||||||
34
Table of Contents
Historically, the Company’s primary sources of liquidity and capital resources have included cash provided by operations and the use of available borrowing under our credit facilities while the primary uses of liquidity and capital resources have included acquisitions, capital expenditures and payments on debt.
Cash provided by operating activities for the fiscal year ended March 31, 2010 was $43,268 compared to $3,062 for fiscal year ended March 31, 2009. The increase is primarily attributable to higher income from operations of $11,886, declines in (i) inventories of $8,361, (ii) accounts receivable of $3,165 and (iii) prepaid income taxes of $1,799 and an increase in accounts payable of $3,501.
The Company’s income from operations increased significantly for the fiscal year ended March 31, 2010 as compared to the fiscal year ended March 31, 2009. The increase in income was precipitated by the Company’s advanced purchases of approximately 50% of its fiscal 2010 resin requirements at favorable prices when compared to fiscal 2009. These advanced purchases, together with a reduction in resin prices of the remaining resin used by the Company, an improvement in profitability from a change in the mix of products sold, as well as declines in outbound freight costs and costs of products sourced from foreign suppliers were the primary factors impacting the increase in the Company’s income from operations for the fiscal year ended March 31, 2010 when compared to the fiscal year ended March 31, 2009.
Cash used in investing activities for the fiscal year ended March 31, 2010 was $2,124 compared to $13,934 for the fiscal year ended March 31, 2009. The Company’s capital expenditures amounted to $4,202 and $12,971 during the fiscal years ended March 31, 2010 and 2009, respectively. Included in capital expenditures are $441 and $7,109 in costs relating to the renovation of a building in Brentwood, New York during the fiscal years ended March 31, 2010 and 2009, respectively. The Company expended $3,140 and $5,339 in capital expenditures at its injection molding manufacturing facility located in Gallaway, Tennessee during the fiscal years ended March 31, 2010 and 2009, respectively, predominantly for the purchase of machinery and equipment. These capital expenditures were partially offset by proceeds from the sale of the Company’s previous corporate headquarters in Hauppauge, New York. The sale took place in March 2010 and the proceeds amounted to $2,066, which includes a gain of $546. The gain is reported in the selling, general and administrative expenses line of the Company’s consolidated statements of operations for the fiscal year ended March 31, 2010. See footnote 3 of our consolidated financial statements for further details.
The Company’s credit facilities contain certain covenants and restrictions which include amounts which can be spent on capital expenditures. During the year ending March 31, 2011, the Company will be permitted under the terms of its credit facilities to spend up to $5,000 on capital expenditures. Management expects to spend substantially all monies permissible for capital expenditures on machinery and equipment to improve production efficiencies at the Company’s Gallaway, Tennessee manufacturing facility.
Financing activities used net cash of $38,962 during the year ended March 31, 2010 compared to $12,227 of net cash provided for the year ended March 31, 2009. During the year ended March 31, 2010, the Company reduced its overall outstanding debt by $41,811. This reduction was primarily comprised of payments in the amount of $23,875 and $17,537 on the Company’s term loan and revolving credit agreement, respectively.
Financial Position
The Company is committed to maintaining a strong financial position through maintaining sufficient levels of available liquidity, managing working capital and generating operating cash flows necessary to meet operating requirements. Total borrowings outstanding were $18,235 with a debt to equity ratio of 0.13 to 1 at March 31, 2010 as compared to total borrowings outstanding of $60,007 with a debt to equity ratio of 0.49 to 1 at March 31, 2009.
Cash and cash equivalents at March 31, 2010 were $5,641 and the Company had $20,000 available for borrowing under its revolving credit agreement. Approximately $1,360 of the Company’s cash and cash equivalents has been reserved for payment on the outstanding balance of the Company’s Industrial Revenue
35
Table of Contents
Bond. The remaining cash and cash equivalents on hand as of March 31, 2010 will be utilized to fund short-term working capital requirements.
Working capital at March 31, 2010 was $24,040 compared to $48,811 at March 31, 2009, and the current ratio at March 31, 2010 was 1.6 to 1 compared to 2.9 to 1 at March 31, 2009. The decline in working capital and current ratio is primarily due to the reclassification of $6,500 in long-term debt to current portion of long-term debt as a result of amendments made to the Company’s credit facilities on September 30, 2008. Additionally, inventories declined $8,361 due to the usage during the fiscal year ended March 31, 2010 of the significant plastic resin purchases made during the fiscal year ended March 31, 2009. Also, accounts payable increased $3,501 versus the prior year due to the Company’s fiscal 2009 initiative to make payments, under conditions deemed favorable by management, on certain trade accounts payable, prior to March 31, 2009 which were not due until after March 31, 2009.
Management anticipates that during fiscal 2011 working capital and the current ratio will likely be in line with fiscal 2010 levels due to the conclusion of current long-term debt reclassifications.
The Company believes that the anticipated future cash flow from operations, coupled with its cash on hand and available funds under its revolving credit facility will be sufficient to meet working capital requirements. Although we have borrowing capacity on our revolving credit agreement, cash on hand and anticipate future cash flow from operations, we may be limited in our ability to allocate funds for purposes such as potential acquisitions, capital expenditures, marketing, development and other general corporate purposes. In addition, we may be limited in our flexibility in planning for or responding to changing conditions in our business and our industry, making us more vulnerable to general economic downturns and adverse developments in our business.
Borrowing Arrangements
On October 17, 2006, the Company entered into a credit agreement with certain lenders ( the “Credit Agreement”). The Credit Agreement, as most recently amended November 30, 2009, provides for borrowings of $85,000 and is divided into two types of borrowing facilities, (i) a term loan with a principal amount of $65,000 and (ii) a revolving credit agreement, which amounts may be borrowed, repaid and reborrowed up to $20,000. As of March 31, 2010 and June 2, 2010, $16,875 is outstanding on the term loan and $0 is outstanding on the revolving credit agreement.
During the fiscal year ended March 31, 2010, the Company used the majority of its cash and credit facilities to fund; working capital requirements and the acquisition of capital equipment within its manufacturing facilities.
The Company has several covenants under its Credit Agreement, as amended, which are measured quarterly and include a minimum net worth requirement, a minimum requirement on the ratio of earnings before interest, taxes, depreciation and amortization (“EBITDA”) to the current portion of total debt, a maximum capital expenditure allowance, minimum EBITDA requirements and a limitation on net losses. As of March 31, 2010, the Company was in compliance with all such covenants and financial ratios.
CONTRACTUAL OBLIGATIONS
The following table represents the Company’s future material, long-term contractual obligations as of March 31, 2010:
| Payments Due in | |||||||||||||||
| Contractual Obligations |
Total | Less than 1 Year |
1- 3 Years |
3-5 Years |
After 5 Years | ||||||||||
| Principal payments of long-term debt |
$ | 18,235 | 15,501 | 2,454 | 280 | — | |||||||||
| Operating Leases |
2,100 | 999 | 1,058 | 43 | — | ||||||||||
| Defined Benefit Plan Payments |
525 | 42 | 84 | 89 | 310 | ||||||||||
| Total Contractual Obligations |
$ | 20,860 | $ | 16,542 | $ | 3,596 | $ | 412 | $ | 310 | |||||
36
Table of Contents
None of the Company’s Executive Officers have employment or severance agreements. Our Executive Officers serve at the will of the Board, which enables the Company to terminate their employment with discretion as to the terms of any severance arrangement. This is consistent with the Company’s performance-based employment and compensation philosophy.
The Company has entered into agreements with three of its executive officers and a vice president, which provide certain benefits in the event of a change in control of the Company. A “change in control” of the Company is defined as, in general, the acquisition by any person of beneficial ownership of 20% or more of the voting stock of the Company, certain business combinations involving the Company or a change in a majority of the incumbent members of the Board of Directors, except for changes in the majority of such members approved by such members. If, within two years after a change in control, the Company or, in certain circumstances, the executive, terminates his employment, the executive is entitled to a severance payment equal to three times (i) such executive’s highest annual salary within the five-year period preceding termination plus (ii) a bonus increment equal to the average of the two highest of the last five bonuses paid to such executive. In addition, the executive is entitled to the continuation of all employment benefits for a three-year period, the vesting of all stock options and certain other benefits, including payment of an amount sufficient to offset any “excess parachute payment” excise tax payable by the executive pursuant to the provisions of the Internal Revenue Code or any comparable provision of state law. As of March 31, 2010, the estimated potential aggregate compensation payable to these three executive officers and vice president under the Company’s compensation and benefit plans and arrangements in the event of termination of such executive’s employment following a change in control amounted to approximately $7,325.
CRITICAL ACCOUNTING POLICIES
The Company’s significant accounting policies are summarized in Note 1 of its financial statements. While all these significant accounting policies impact its financial condition and results of operations, the Company views certain of these policies as critical. Policies determined to be critical are those policies that have the most significant impact on the Company’s financial statements and require management to use a greater degree of judgment and/or estimates. Actual results may differ from those estimates. In addition, share and per share amounts for all periods presented in the consolidated financial statements and notes thereto have been retroactively adjusted to reflect the effect of the three-for-two stock split announced in January 2007.
The Company believes that given current facts and circumstances, it is unlikely that applying any other reasonable judgments or estimate methodologies would cause a material effect on the Company’s consolidated results of operations, financial position or liquidity for the periods presented in this report.
The accounting policies identified as critical are as follows:
Revenue Recognition – Revenue from the sale of products is recognized when the Company meets all of the criteria specified in Accounting Standards Codification (“ASC”) 605, Revenue Recognition. These criteria include:
| • | Persuasive evidence of an arrangement exists; |
| • | Delivery has occurred or services have been rendered; |
| • | The seller’s price to the buyer is fixed or determinable; and |
| • | Collection of the resulting receivable is reasonably assured. |
Customer purchase orders and or sales agreements evidence the Company’s sales arrangements. These purchase orders and sales agreements specify both selling prices and quantities, which are the basis for recording sales revenue. Any deviation from this policy requires management review and approval. Trade terms are negotiated on a customer by customer basis and for the majority of the Company’s sales include that title and risk of loss pass from the Company to the customer when the Company ships products from its facilities, which is when
37
Table of Contents
revenue is recognized. In instances of shipments made on consignment, revenue is deferred until a customer indicates to the Company that it has used the Company’s products. The Company conducts ongoing credit evaluations of its customers and ships products only to customers that satisfy its credit evaluations. Products are shipped primarily to distributors at an agreed upon list price. Distributors then resell the products primarily to hospitals and depending on agreements between the Company, the distributors and the hospitals, the distributors may be entitled to a rebate. The Company deducts all rebates from sales and has a provision for allowances based on historical information for all rebates that have not yet been processed.
Income Taxes – In preparing the Company’s financial statements, income tax expense is calculated for each of the jurisdictions in which the Company has nexus. This process involves estimating actual current taxes due plus assessing temporary differences arising from differing treatment for tax and accounting purposes which are recorded as deferred tax assets and liabilities. Deferred tax assets are periodically evaluated to determine their recoverability, and where their recovery is not likely, a valuation allowance is established and a corresponding additional tax expense is recorded in the Company’s statement of operations. In the event that actual results differ from the Company’s estimates given changes in assumptions, the provision for income taxes could be materially impacted. As of March 31, 2010, no valuation allowance was necessary for the $2,363 of deferred tax assets that existed on the Company’s books. The total deferred tax liability as of March 31, 2010, was $15,932.
In accordance with the provisions of ASC 740, Income Taxes, we recognize in our financial statements only those tax positions that meet the more-likely-than-not-recognition threshold. We establish tax reserves for uncertain tax positions that do not meet this threshold. Interest and penalties associated with income tax matters are included in the provision for income taxes in our consolidated statements of operations. The provisions of ASC 740 did not have a material impact on the Company’s consolidated financial position.
Inventories – The Company values its inventory at the lower of the actual cost to purchase and/or manufacture or the current estimated market value of the inventory. On an ongoing basis, inventory quantities on hand are viewed and an analysis of the provision for excess and obsolete inventory is performed based primarily on the Company’s estimated sales forecast of product demand, which is based on sales history and anticipated future demand. A significant increase in the demand for the Company’s products could result in a short-term increase in the cost of inventory purchases while a significant decrease in demand could result in an increase in the amount of excess inventory quantities on hand. Additionally, the Company’s estimates of future product demand may prove to be inaccurate in which case the Company may have understated or overstated the provision required for excess and obsolete inventory. Accordingly, future adjustments to the provision may be required. Although every effort is made to ensure the accuracy of the Company’s forecasts of future product demand, any significant unanticipated changes in demand could have a significant impact on the value of the Company’s inventory and reported operating results. Historically, the Company has not experienced any significant inventory write-downs due to excess and obsolete inventory.
Goodwill and Other Intangibles – Purchase accounting requires extensive use of accounting estimates and judgments to allocate the purchase price to the fair market value of the assets and liabilities purchased, with the excess value, if any, being classified as goodwill. As a result of the Company’s acquisitions, values were assigned to intangible assets for trademarks, customer relationships, non-compete agreements and group purchasing organization contracts. Finite useful lives were assigned to these intangibles, if appropriate, and they will be amortized over their remaining life. As with any intangible asset, future write-downs may be required if the value of these assets becomes impaired.
Our goodwill is tested for impairment on an annual basis. Application of the goodwill impairment test requires judgment. The fair value is estimated using a discounted cash flow methodology. This requires significant judgments including estimation of future cash flows, which is dependent on internal forecasts, estimation of the long-term rate of growth for our business, the useful life over which cash flows will occur, and determination of our weighted average cost of capital. Changes in these estimates and assumptions could materially affect the determination of fair value and/or goodwill impairment.
38
Table of Contents
Property, Plant and Equipment – Property, plant and equipment are depreciated over their useful lives. Useful lives are based on management’s estimates of the period that the asset will generate revenue. Any change in conditions that would cause management to change its estimate as to the useful lives of a group or class of assets may significantly impact the Company’s depreciation expense on a prospective basis.
Allowance for Doubtful Accounts – The Company performs ongoing credit evaluations on its customers and adjusts credit limits based upon payment history and the customer’s current credit worthiness, as determined by a review of their current credit information. The Company continuously monitors collections and payments from customers and a provision for estimated credit losses is maintained based upon its historical experience and on specific customer collection issues that have been identified. While such credit losses have historically been within the Company’s expectations and the provisions established, the Company cannot guarantee that the same credit loss rates will be experienced in the future. Concentration risk exists relative to the Company’s accounts receivable, as 65% of the Company’s total accounts receivable balance as of March 31, 2010 is concentrated in two distributors. While the accounts receivable related to these distributors may be significant, the Company does not believe the credit loss risk to be significant given the consistent payment history of these distributors.
IMPACT OF RECENTLY ISSUED ACCOUNTING PRONOUNCEMENTS
FAIR VALUE MEASUREMENTS
On April 1, 2009, we adopted certain provisions of ASC 820, Fair Value Measurements, which defines fair value, establishes a framework for measuring fair value in GAAP and expands disclosures about fair value measurements. On April 1, 2009, we adopted the remaining provisions of ASC 820 as it relates to nonfinancial assets and liabilities that are not recognized or disclosed at fair value on a recurring basis. The adoption of this standard as it related to certain non-financial assets and liabilities did not impact our consolidated financial statements in any material respect.
BUSINESS COMBINATIONS
On April 1, 2009, we adopted the provisions of ASC 805, Business Combinations, relating to business combinations, including assets acquired and liabilities assumed arising from contingencies. These pronouncements established principles and requirements for how the acquirer of a business recognizes and measures in its financial statements the identifiable assets acquired, the liabilities assumed, and any non-controlling interest in the acquiree as well as provides guidance for recognizing and measuring the goodwill acquired in the business combination and determines what information to disclose to enable users of the financial statements to evaluate the nature and financial effects of the business combination. In addition, these pronouncements eliminate the distinction between contractual and non-contractual contingencies, including the initial recognition and measurement criteria and require an acquirer to develop a systematic and rational basis for subsequently measuring and accounting for acquired contingencies depending on their nature. Our adoption of these pronouncements did not impact our consolidated financial statements in any material respect, but will have an impact on the manner in which we account for future acquisitions.
NON-CONTROLLING INTERESTS IN CONSOLIDATED FINANCIAL STATEMENTS
On April 1, 2009 we adopted to the provisions of ASC 810, Non-Controlling Interests in Consolidated Financial Statements. ASC 810 establishes accounting and reporting standards for the non-controlling interest in a subsidiary and for the deconsolidation of a subsidiary. It clarifies that a non-controlling interest in a subsidiary is an ownership interest in the consolidated entity that should be reported as equity in the consolidated financial statements. The adoption of ASC 810 did not have a material impact on our consolidated financial position, results of operations and cash flows.
39
Table of Contents
DERIVATIVE INSTRUMENTS AND HEDGING ACTIVITIES
On April 1, 2009 we adopted the provisions of ASC 815, Disclosures about Derivative Instruments and Hedging. ASC 815 requires enhanced disclosures about how and why an entity uses derivative instruments, how derivative instruments and related hedged items are accounted for their effect on an entity’s financial position, financial performance, and cash flows. As of March 31, 2010, the company was not engaged in any derivative or hedging activities that are required to be disclosed under the provisions of ASC 815.
REVENUE ARRANGEMENTS WITH MULTIPLE DELIVERABLES
In October 2009, the FASB issued Accounting Standards Update (“ASU”) 2009-13 which will update ASC 605, Revenue Recognition, and changes the accounting for certain revenue arrangements. The new standard sets forth requirements that must be met for an entity to recognize revenue from the sale of a delivered item that is part of a multiple-element arrangement when other items have not yet been delivered and requires the allocation of arrangement consideration to each deliverable to be based on the relative selling price. ASU 2009-13 is effective prospectively for revenue arrangements entered into or materially modified in the fiscal years beginning on or after June 15, 2010, which for us is April 1, 2011. We are currently evaluating the impact this new standard will have on our financial statements.
ITEM 7A – QUANTITATIVE AND QUALITATIVE DISCLOSURES ABOUT MARKET RISK
The Company is exposed to interest rate change market risk with respect to its credit facility with a financial institution which is priced based on the alternate base rate of interest plus a spread of up to 1%, or at LIBOR rate plus a spread of up to 1 1/2%. The spread over the alternate base rate and LIBOR rates is determined based upon the Company’s performance with regard to agreed-upon financial ratios. The Company decides at its sole discretion as to whether borrowings will be at the alternate base rate or LIBOR. At March 31, 2010, $16,875 was outstanding under the credit facility. Changes in the alternate base rates or LIBOR rates during fiscal 2010 will have a positive or negative effect on the Company’s interest expense. Each 1% fluctuation in the interest rate will increase or decrease interest expense for the Company by approximately $17 on an annualized basis.
In addition, the Company is exposed to interest rate change market risk with respect to the proceeds received from the issuance and sale by the Buncombe County Industrial and Pollution Control Financing Authority Industrial Development Revenue Bonds (the “Bonds”). At March 31, 2010, $1,360 was outstanding for these Bonds. The Bonds bear interest at a variable rate determined weekly. During fiscal 2010, the average interest rate on the Bonds approximated .58%. Each 1% fluctuation in interest rates will increase or decrease the interest expense on the Bonds by approximately $14 on an annualized basis.
A significant portion of the Company’s raw materials are purchased from China. All such purchases are transacted in U.S. dollars. The Company’s financial results, therefore, could be impacted by factors such as changes in foreign currency, exchange rates or weak economic conditions in foreign countries in the procurement of such raw materials. To date, sales of the Company’s products outside the United States have not been significant.
40
Table of Contents
ITEM 8 – FINANCIAL STATEMENTS AND SUPPLEMENTARY DATA
Consolidated Financial Statements and Schedule:
41
Table of Contents
Consolidated Balance Sheets Medical Action Industries Inc.
(In thousands, except share data)
| March 31, | ||||||||
| 2010 | 2009 | |||||||
| Current Assets |
||||||||
| Cash and cash equivalents |
5,641 | 3,459 | ||||||
| Accounts receivable, less allowance for doubtful accounts of $659 at March 31, 2010 and $663 at March 31, 2009 |
18,294 | 21,459 | ||||||
| Inventories, net |
34,860 | 43,221 | ||||||
| Prepaid expenses |
1,109 | 906 | ||||||
| Deferred income taxes |
2,363 | 2,448 | ||||||
| Prepaid income taxes |
785 | 2,584 | ||||||
| Other current assets |
396 | 466 | ||||||
| Total Current Assets |
63,448 | 74,543 | ||||||
| Property, plant and equipment, net |
39,816 | 40,313 | ||||||
| Goodwill |
80,699 | 80,699 | ||||||
| Other intangible assets, net |
14,457 | 15,886 | ||||||
| Other assets, net |
2,376 | 3,725 | ||||||
| Total Assets |
$ | 200,796 | $ | 215,166 | ||||
| Current Liabilities |
||||||||
| Accounts payable |
$ | 11,691 | $ | 8,190 | ||||
| Accrued expenses |
12,216 | 10,643 | ||||||
| Current portion of capital lease obligations |
— | 39 | ||||||
| Current portion of long-term debt |
15,501 | 6,860 | ||||||
| Total Current Liabilities |
39,408 | 25,732 | ||||||
| Deferred income taxes |
15,932 | 14,282 | ||||||
| Long-term debt, less current portion |
2,734 | 53,147 | ||||||
| Total Liabilities |
58,074 | 93,161 | ||||||
| Shareholders’ Equity |
||||||||
| Common stock 40,000,000 shares authorized, $.001 par value; issued and outstanding 16,344,411 shares at March 31, 2010 and 16,028,161 shares at March 31, 2009 |
16 | 16 | ||||||
| Additional paid-in capital |
32,585 | 28,602 | ||||||
| Accumulated other comprehensive loss |
(374 | ) | (267 | ) | ||||
| Retained earnings |
110,495 | 93,654 | ||||||
| Total Shareholders’ Equity |
142,722 | 122,005 | ||||||
| Total Liabilities and Shareholders’ Equity |
$ | 200,796 | $ | 215,166 | ||||
The accompanying notes are an integral part of these statements.
42
Table of Contents
Consolidated Statements of Operations Medical Action Industries Inc.
(In thousands, except per share data)
| Fiscal Year Ended March 31, | ||||||||||||
| 2010 | 2009 | 2008 | ||||||||||
| Net sales |
$ | 290,146 | $ | 296,070 | $ | 290,528 | ||||||
| Cost of sales |
221,242 | 245,135 | 226,076 | |||||||||
| Gross profit |
68,904 | 50,935 | 64,452 | |||||||||
| Selling, general and administrative expenses |
40,198 | 40,161 | 39,672 | |||||||||
| Interest expense |
1,352 | 2,682 | 3,406 | |||||||||
| Interest income |
(4 | ) | (4 | ) | (78 | ) | ||||||
| Income before income taxes |
27,358 | 8,096 | 21,452 | |||||||||
| Income tax expense |
10,517 | 3,141 | 8,227 | |||||||||
| Net income |
$ | 16,841 | $ | 4,955 | $ | 13,225 | ||||||
| Net income per share basic |
$ | 1.04 | $ | 0.31 | $ | 0.83 | ||||||
| Net income per share diluted |
$ | 1.03 | $ | 0.31 | $ | 0.81 | ||||||
The accompanying notes are an integral part of these statements.
43
Table of Contents
Consolidated Statements of Shareholders’ Equity Medical Action Industries Inc.
(In thousands, except share data)
| Shares | Amount | Additional Paid-In Capital |
Accumulated Other Comprehensive Income (Loss) |
Retained Earnings |
Total Shareholders’ Equity |
||||||||||||||||
| Balance at March 31, 2007 |
15,815,786 | $ | 16 | $ | 22,847 | $ | 7 | $ | 75,495 | $ | 98,365 | ||||||||||
| Exercise of stock options, net |
204,875 | — | 1,193 | — | — | 1,193 | |||||||||||||||
| Amortization of deferred compensation |
— | 102 | — | — | 102 | ||||||||||||||||
| Tax benefit from vesting of stock under restricted management stock bonus plan and exercise of options |
— | 1,383 | — | — | 1,383 | ||||||||||||||||
| Stock-based compensation |
— | 1,504 | — | — | 1,504 | ||||||||||||||||
| Adoption of uncertain tax position guidance (Note 4) |
— | — | — | (21 | ) | (21 | ) | ||||||||||||||
| Interest rate swap |
— | — | (49 | ) | — | (49 | ) | ||||||||||||||
| Pension liability adjustment |
— | — | 77 | — | 77 | ||||||||||||||||
| Net income |
— | — | — | 13,225 | 13,225 | ||||||||||||||||
| Balance at March 31, 2008 |
16,020,661 | $ | 16 | $ | 27,029 | $ | 35 | $ | 88,699 | $ | 115,779 | ||||||||||
| Exercise of stock options, net |
7,500 | — | 87 | — | — | 87 | |||||||||||||||
| Amortization of deferred compensation |
— | 173 | — | — | 173 | ||||||||||||||||
| Tax benefit from vesting of stock under restricted management stock bonus plan and exercise of options |
— | 52 | — | — | 52 | ||||||||||||||||
| Stock-based compensation |
— | 1,261 | — | — | 1,261 | ||||||||||||||||
| Interest rate swap |
— | — | 49 | — | 49 | ||||||||||||||||
| Pension liability adjustment |
— | — | (351 | ) | — | (351 | ) | ||||||||||||||
| Net income |
— | — | — | 4,955 | 4,955 | ||||||||||||||||
| Balance at March 31, 2009 |
16,028,161 | $ | 16 | $ | 28,602 | ($ | 267 | ) | $ | 93,654 | $ | 122,005 | |||||||||
| Exercise of stock options, net |
316,250 | — | 2,849 | — | — | 2,849 | |||||||||||||||
| Amortization of deferred compensation |
— | 111 | — | — | 111 | ||||||||||||||||
| Tax expense from vesting of stock under restricted management stock bonus plan and exercise of options |
— | (358 | ) | — | — | (358 | ) | ||||||||||||||
| Stock-based compensation |
— | 1,381 | — | — | 1,381 | ||||||||||||||||
| Pension liability adjustment |
— | — | (107 | ) | — | (107 | ) | ||||||||||||||
| Net income |
— | — | — | 16,841 | 16,841 | ||||||||||||||||
| Balance at March 31, 2010 |
16,344,411 | $ | 16 | $ | 32,585 | ($ | 374 | ) | $ | 110,495 | $ | 142,722 | |||||||||
The accompanying notes are an integral part of these statements.
44
Table of Contents
Consolidated Statements of Cash Flows Medical Action Industries Inc.
(In thousands)
| Fiscal Year Ended March 31, | ||||||||||||
| 2010 | 2009 | 2008 | ||||||||||
| Cash flows from operating activities : |
||||||||||||
| Net income |
$ | 16,841 | $ | 4,955 | $ | 13,225 | ||||||
| Adjustments to reconcile net income to net cash provided by operating activities: |
||||||||||||
| Depreciation |
4,563 | 4,188 | 3,906 | |||||||||
| Amortization |
2,169 | 2,351 | 2,337 | |||||||||
| Provision for doubtful accounts |
72 | 72 | 48 | |||||||||
| Deferred income taxes |
1,584 | 4,258 | 3,752 | |||||||||
| Stock-based compensation |
1,492 | 1,448 | 1,606 | |||||||||
| Excess tax liability from stock-based compensation |
151 | (481 | ) | (615 | ) | |||||||
| (Gain) loss on sale of property and equipment |
(422 | ) | 53 | 55 | ||||||||
| Tax (expense) benefit from exercise of warrants and options |
(358 | ) | 52 | 1,383 | ||||||||
| Changes in operating assets and liabilities: |
||||||||||||
| Accounts receivable |
3,093 | 2,508 | (3,433 | ) | ||||||||
| Inventories |
8,361 | (9,728 | ) | 857 | ||||||||
| Prepaid expenses and other current assets |
(133 | ) | (79 | ) | 57 | |||||||
| Prepaid income taxes |
1,799 | (922 | ) | (1,658 | ) | |||||||
| Other assets |
(911 | ) | (103 | ) | (1,086 | ) | ||||||
| Accounts payable |
3,501 | (5,922 | ) | (2,411 | ) | |||||||
| Accrued expenses, payroll, payroll taxes and other |
1,466 | 412 | 1,190 | |||||||||
| Net cash provided by operating activities |
$ | 43,268 | $ | 3,062 | $ | 19,213 | ||||||
| Cash flows from investing activities : |
||||||||||||
| Purchase price and related acquisition costs |
— | (1,043 | ) | (1,181 | ) | |||||||
| Purchases of property, plant and equipment |
(4,202 | ) | (12,971 | ) | (5,097 | ) | ||||||
| Proceeds from sale of property and equipment |
2,078 | 80 | 7 | |||||||||
| Net cash used in investing activities |
($2,124 | ) | ($13,934 | ) | ($6,271 | ) | ||||||
| Cash flows from financing activities : |
||||||||||||
| Proceeds from revolving line of credit and long-term borrowings |
12,850 | 79,334 | 36,397 | |||||||||
| Principal payments on revolving line of credit and long-term borrowings |
(54,622 | ) | (67,077 | ) | (49,146 | ) | ||||||
| Principal payments on capital lease obligations |
(39 | ) | (118 | ) | (109 | ) | ||||||
| Proceeds from exercise of employee stock options |
2,849 | 88 | 1,193 | |||||||||
| Net cash (used in) provided by financing activities |
($38,962 | ) | $ | 12,227 | ($11,665 | ) | ||||||
| Net increase in cash and cash equivalents |
2,182 | 1,355 | 1,277 | |||||||||
| Cash and cash equivalents at beginning of year |
3,459 | 2,104 | 827 | |||||||||
| Cash and cash equivalents at end of year |
$ | 5,641 | $ | 3,459 | $ | 2,104 | ||||||
| Supplemental disclosures: |
||||||||||||
| Interest paid |
1,358 | 2,693 | 3,594 | |||||||||
| Income taxes paid |
7,341 | 234 | 5,572 | |||||||||
The accompanying notes are an integral part of these statements.
45
Table of Contents
Notes to Consolidated Financial Statements
Medical Action Industries Inc. — March 31, 2010
1. ORGANIZATION AND SUMMARY OF SIGNIFICANT ACCOUNTING POLICIES
COMPANY BACKGROUND AND DESCRIPTION OF BUSINESS
Medical Action Industries Inc. (“Medical Action” or the “Company”) was incorporated under the laws of the State of New York on April 1, 1977, and re-incorporated under the laws of the State of Delaware on November 5, 1987. Headquartered in Brentwood, New York, Medical Action develops, manufactures, markets and supplies a variety of disposable medical products. The Company’s products are marketed primarily to acute care facilities in domestic and certain international markets, and in recent years has expanded its end-user markets to include physician, dental and veterinary offices, outpatient surgery centers and long-term care facilities. Medical Action is a leading manufacturer and supplier of collection systems for the containment of medical waste, minor procedure kits and trays, disposable patient utensils, sterile operating room towels and sterile laparotomy sponges. The Company’s products are marketed by its direct sales personnel and an extensive network of distributors. Medical Action has entered into preferred vendor agreements with national distributors, as well as sole source and/or committed contracts with group purchasing organizations. The Company also manufactures its products under private label programs to other distributors and medical suppliers. Medical Action’s manufacturing, packaging and warehousing activities are conducted in its Arden, North Carolina; Clarksburg, West Virginia and Gallaway, Tennessee facilities. The Company’s procurement of certain products and raw materials from the People’s Republic of China is administered by its office in Shanghai, China.
All dollar amounts presented in our notes to consolidated financial statements are presented in thousands, except share and per share data.
PRINCIPLES OF CONSOLIDATION
The consolidated financial statements include the accounts of the Company and its wholly-owned subsidiaries. All significant inter-company accounts and transactions have been eliminated in consolidation.
CASH EQUIVALENTS
The Company considers all highly liquid investments with an original maturity of 90 days or less to be cash equivalents.
ALLOWANCE FOR DOUBTFUL ACCOUNTS
The Company performs ongoing credit evaluations on its customers and adjusts credit limits based upon payment history and the customer’s current credit worthiness, as determined by a review of their current credit information. The Company continuously monitors collections and payments from customers and a provision for estimated credit losses is maintained based upon its historical experience and on specific customer collection issues that have been identified. While such credit losses have historically been within the Company’s expectations and the provisions established, the Company cannot guarantee that the same credit loss rates will be experienced in the future. Concentration risk exists relative to the Company’s accounts receivable, as Owens & Minor, Inc. and Cardinal Health Inc., (the “Distributors”) accounted for approximately 38% and 26%, respectively as of March 31, 2010 and 35% and 27%, respectively as of March 31, 2009. While the accounts receivable related to these Distributors may be significant, the Company does not believe the credit risk to be significant given their consistent payment history.
TRADE REBATES
We provide rebates to distributors that sell to end-user customers at prices determined under a contract between the Company and the end-user customer or distributor. The Company deducts all rebates from sales and
46
Table of Contents
has a provision for allowances based on historical information for all rebates that have not yet been processed. The provision for trade rebates (which is included in accounts receivable) was $14,497 and $14,110 at March 31, 2010 and 2009, respectively.
INVENTORIES
Inventories are stated at the lower of cost or market net of reserve for obsolete and slow moving inventory. Cost is determined by the first-in, first-out method.
PROPERTY, PLANT AND EQUIPMENT
Property, plant and equipment are stated at cost less accumulated depreciation and amortization. Leases meeting the criteria for capitalization are recorded at the present value of future minimum lease payments. Maintenance and repairs are charged to operations as incurred and expenditures for major improvements are capitalized. The carrying amount and related accumulated depreciation of assets sold or otherwise disposed of are removed from the accounts and any resulting gain or loss is reflected in operations in the year of disposal. Accelerated methods of depreciation are used for tax purposes. A summary of property, plant and equipment, net, are as follows:
| March 31, | ||||||
| 2010 | 2009 | |||||
| Land and buildings |
$ | 27,546 | $ | 25,163 | ||
| Machinery and equipment |
34,643 | 34,305 | ||||
| Furniture and fixtures |
2,123 | 1,563 | ||||
| 64,312 | 61,031 | |||||
| Less accumulated depreciation and amortization |
24,496 | 20,718 | ||||
| $ | 39,816 | $ | 40,313 | |||
Depreciation is calculated on the straight-line method over the estimated useful lives of the assets as follows:
| Buildings | 40 years | |
| Machinery and equipment | 5 – 20 years | |
| Furniture and fixtures | 3 – 10 years |
Depreciation and amortization of property, plant and equipment amounted to $4,563, $4,188, and $3,906 for the fiscal years ended March 31, 2010, 2009 and 2008, respectively.
GOODWILL
Goodwill is the excess of the purchase price over the fair value of identifiable net assets acquired in business combinations accounted for as purchases. Goodwill and certain other intangible assets having indefinite lives are not amortized to earnings, but instead are subject to periodic testing for impairment. Intangible assets determined to have definite lives are amortized over their remaining useful lives.
Our goodwill is tested for impairment on an annual basis at December 31st. Application of the goodwill impairment test requires judgment. The fair value is estimated using a discounted cash flow methodology. This requires significant judgments including estimation of future cash flows, which is dependent on internal forecasts, estimation of the long-term rate of growth for our business, the useful life over which cash flows will occur, and determination of our weighted average cost of capital. Changes in these estimates and assumptions could materially affect the determination of fair value and/or goodwill impairment. The implied fair value of
47
Table of Contents
goodwill is determined by allocating the fair value to all of the assets (recognized and unrecognized) and liabilities in a manner similar to a purchase price allocation. The residual fair value after this allocation is the implied fair value of the goodwill.
The Company reviews for the impairment of long-lived assets and certain identifiable intangibles (including the excess of cost over fair value of net assets acquired and property and equipment) annually or whenever events or changes in circumstances indicate that the carrying amount of an asset may not be recoverable. An impairment loss would be recognized when the carrying amount of the assets exceeds its fair value. Based upon the testing performed, the Company has not identified any such impairment losses.
OTHER INTANGIBLE ASSETS
Other intangible assets, consisting of trademarks, customer relationships, group purchasing organization (“GPO”) contracts, non-competition agreements, software, intellectual property and a supply agreement are amortized according to their useful lives. The book values, accumulated amortization and original useful life by asset class as of March 31, 2010 and 2009 are as follows:
| March 31, 2010 | |||||||||
| Gross Carrying Value |
Accumulated Amortization |
Total Net Book Value | |||||||
| Trademarks not subject to amortization |
$ | 1,266 | $ | — | $ | 1,266 | |||
| Customer Relationships (20 years) |
15,700 | 3,020 | 12,680 | ||||||
| GPO Contracts (4 Years) |
2,200 | 1,892 | 308 | ||||||
| Non-Competition Agreements (5-7 Years) |
1,043 | 1,043 | — | ||||||
| Software (1-3 Years) |
400 | 400 | — | ||||||
| Intellectual Property (7 Years) |
400 | 197 | 203 | ||||||
| Supply Agreement |
29 | 29 | — | ||||||
| $ | 21,038 | $ | 6,581 | $ | 14,457 | ||||
| March 31, 2009 | |||||||||
| Gross Carrying Value |
Accumulated Amortization |
Total Net Book Value | |||||||
| Trademarks not subject to amortization |
$ | 1,266 | $ | — | $ | 1,266 | |||
| Customer Relationships (20 years) |
15,700 | 2,236 | 13,464 | ||||||
| GPO Contracts (4 Years) |
2,200 | 1,342 | 858 | ||||||
| Non-Competition Agreements (5-7 Years) |
1,043 | 1,043 | — | ||||||
| Software (1-3 Years) |
400 | 363 | 37 | ||||||
| Intellectual Property (7 Years) |
400 | 139 | 261 | ||||||
| Supply Agreement |
29 | 29 | — | ||||||
| $ | 21,038 | $ | 5,152 | $ | 15,886 | ||||
Other intangible asset amortization expense amounted to $1,429, $1,538 and $1,668 and for the fiscal years ended March 31, 2010, 2009 and 2008, respectively. Estimated amortization expense related to these intangibles for the five succeeding fiscal years is as follows:
| Fiscal Year |
Amount | ||
| 2011 |
$ | 1,150 | |
| 2012 |
842 | ||
| 2013 |
842 | ||
| 2014 |
817 | ||
| 2015 |
785 | ||
| $ | 4,436 | ||
48
Table of Contents
The Company evaluates trademarks with indefinite lives annually to determine whether events or circumstances continue to support the indefinite useful life. No trademarks were determined to have finite useful lives in any of the periods presented.
DEFERRED FINANCING COSTS
We have incurred costs in obtaining financing. These costs of approximately $395 as of March 31, 2010 were capitalized in other assets and are being amortized over the life of the related financing arrangements through 2013. Total accumulated amortization was approximately $280 and $209 at March 31, 2010 and 2009, respectively.
INCOME TAXES
We account for income taxes in accordance with the guidance issued under Accounting Standards Codification (“ASC”) 740, “Income Taxes” with consideration for uncertain tax positions. We record a valuation allowance to reduce our deferred tax assets to the amount of future tax benefit that is more likely than not to be realized. As of March 31, 2010, no valuation allowance was necessary for the $2,363 deferred tax assets that existed on the Company’s books.
Since April 1, 2007, the Company accounted for uncertain tax positions in accordance with authoritative guidance issued under ASC 740, which addresses the determination of whether tax benefits claimed or expected to be claimed on tax returns should be recorded in the financial statements. The Company may recognize the tax benefit from an uncertain tax position only if it is more likely than not that the future tax position will be sustained on examination by the taxing authorities based on the technical merits of the position. The tax benefits recognized in the financial statements from such position should be measured based on the largest benefit that has a greater than fifty percent likelihood of being realized upon ultimate settlement. The Company may recognize the tax benefit from an uncertain tax position only if it is more likely than not that the future tax position will be sustained. The Company classifies interest and penalties associated with income taxes as a component of income tax expense (benefit) on the consolidated statements of operations.
We are subject to taxation in the U.S. and various state and local jurisdictions. The North Carolina state examination for the fiscal years ended March 31, 2008, 2007 and 2006 has been finalized with an immaterial assessment for each year. The Company is no longer subject to U.S. federal income tax examinations by the Internal Revenue Service and most state and local authorities for fiscal tax years ending prior to March 31, 2007. Certain state authorities may subject the Company to examination up to the period ending March 31, 2006. The Company does, however, have a prior year net operating loss as a result of a previous acquisition which will remain open for examination.
CURRENCY
All of the Company’s sales and purchases were transacted in U.S. dollars.
STOCK-BASED COMPENSATION
We recorded stock-based compensation expense for the cost of non-qualified stock options granted under our stock plans in accordance with the provisions of ASC 718, Stock Compensation. Stock-based compensation expense recognized under the provisions of ASC 718 was $1,381 ($850 after tax) or $.05 per basic and diluted share for the year ended March 31, 2010, $1,261 ($780 after tax) or $.05 per basic and diluted share for the year ended March 31, 2009 and $1,504 ($935 after tax) or $.06 per basic and diluted share for the year ended March 31, 2008.
49
Table of Contents
EARNINGS PER SHARE INFORMATION
Basic earnings per share is based on the weighted average number of common shares outstanding without consideration of potential common stock. Diluted earnings per share is based on the weighted average number of common and potential common shares outstanding. The calculation takes into account the shares that may be issued upon exercise of stock options and warrants, reduced by the shares that may be repurchased with the funds received from the exercise, based on average prices during the year. Excluded from the calculation of earnings per share are options to purchase 827,055 shares in fiscal 2010, 1,039,875 shares in fiscal 2009 and 248,700 shares in fiscal 2008, as their inclusion would have been anti-dilutive. Note 9 displays a table showing the computation of basic and diluted earnings per share.
ACCUMULATED OTHER COMPREHENSIVE INCOME (LOSS)
Accumulated other comprehensive income (loss) consists of two components: net income and other accumulated comprehensive income (loss). Accumulated other comprehensive income (loss) refers to revenues, expenses, gains and losses that under generally accepted accounting principles are recorded as an element of shareholders’ equity but are excluded from net income. The Company’s accumulated other comprehensive income (loss) is comprised of an accrued benefit liability relating to the Company’s defined benefit pension plan and the fair value of an interest rate swap agreement.
INTEREST RATE SWAP AGREEMENT
We do not enter into financial instruments for trading or speculative purposes. The principal financial instrument used for cash flow hedging purposes is an interest rate swap. The effective portion of changes in the fair value of the interest rate swap are recorded in “Accumulated Other Comprehensive Income (Loss)”.
In April 2007, we entered into an interest rate swap agreement to manage our exposure to interest rate changes. The swap effectively converts a portion of our variable rate debt under the credit agreement to a fixed rate, without exchanging the notional principal amounts. As of March 31, 2010, we had no outstanding amounts subject to the interest rate swap agreement.
REVENUE RECOGNITION
Revenue from the sale of products is recognized when the Company meets all of the criteria specified in ASC 605, Revenue Recognition. These criteria include:
| • | Persuasive evidence of an arrangement exists; |
| • | Delivery has occurred or services have been rendered; |
| • | The seller’s price to the buyer is fixed or determinable; and |
| • | Collection of the resulting receivable is reasonably assured. |
Customer purchase orders and or sales agreements evidence the Company’s sales arrangements. These purchase orders and sales agreements specify both selling prices and quantities, which are the basis for recording sales revenue. Any deviation from this policy requires management review and approval. Trade terms are negotiated on a customer by customer basis and for the majority of the Company’s sales include that title and risk of loss pass from the Company to the customer when the Company ships products from its facilities, which is when revenue is recognized. In instances of shipments made on consignment, revenue is deferred until a customer indicates to the Company that it has used the Company’s products. The Company conducts ongoing credit evaluations of its customers and ships products only to customers that satisfy its credit evaluations. Products are shipped primarily to distributors at an agreed upon list price. Distributors then resell the products primarily to hospitals and depending on agreements between the Company, the distributors and the hospitals, the distributors may be entitled to a rebate. The Company deducts all rebates from sales and has a provision for allowances based on historical information for all rebates that have not yet been processed.
50
Table of Contents
BUSINESS CONCENTRATIONS AND MAJOR CUSTOMERS
The Company manufactures and distributes disposable medical products principally to medical product distributors and hospitals located throughout the United States. The Company performs credit evaluations of its customers’ financial condition and does not require collateral. Receivables are generally due within 30 – 90 days. Credit losses relating to customers have historically been minimal and within management’s expectations.
Sales to Owens & Minor, Inc. and Cardinal Health Inc., (the “Distributors”) accounted for approximately 40% and 26% of net sales, respectively for the fiscal year ended March 31, 2010, 38% and 22% of net sales, respectively, for the fiscal year ended March 31, 2009, and 37% and 21% of net sales, respectively, for the fiscal year ended March 31, 2008. Although the Distributors may be deemed in a technical sense to be major purchasers of the Company’s products, the Distributors typically serve as a distributor under a purchase order or supply agreement between the customer and the Company and do not purchase for their own accounts. The Company, therefore, does not believe it is appropriate to categorize the Distributors as actual customers.
A significant portion of the Company’s raw materials are purchased from China. All such purchases are transacted in U.S. dollars. The Company’s financial results, therefore, could be impacted by factors such as foreign currency exchange rates or weak economic conditions in foreign countries in the procurement of such raw materials.
FREIGHT AND DISTRIBUTION COSTS
Freight costs, which consist primarily of freight costs paid to third party carriers amounted to $15,219, $17,613 and $17,955 for the fiscal years ended March 31, 2010, 2009 and 2008, respectively, and are included in cost of sales. Distribution costs, which consist primarily of the salaries, warehousing and related expenses associated with the storing, picking and shipping costs of our products amounted to $7,477, $7,938 and $6,480 for the fiscal years ended March 31, 2010, 2009 and 2008, respectively, and are included in selling, general and administrative expenses.
PRODUCT DEVELOPMENT COSTS
Product development costs charged to expense were $1,209, $960 and $898 for the fiscal years ended March 31, 2010, 2009 and 2008, respectively.
USE OF ESTIMATES
The preparation of financial statements in conformity with accounting principles generally accepted in the United States of America requires management to make estimates and assumptions that affect the reported amounts of assets and liabilities, such as inventories, deferred income taxes, other intangible assets, pension benefits and accrued expenses, at the date of the financial statements and the reported amounts of revenues and expenses during the reporting period. Actual results could differ from those estimates.
FAIR VALUE MEASUREMENTS
We have adopted ASC 820, Fair Value Measurements in two steps; effective April 1, 2008, we adopted it for all financial instruments and non-financial instruments accounted for at fair value on a recurring basis and effective April 1, 2009, for all non-financial instruments accounted for at fair value on a non-recurring basis.
For financial assets and liabilities fair valued on a recurring basis, fair value is the price we would receive to sell an asset or pay to transfer a liability in an orderly transaction with a market participant at the measurement date. In the absence of active markets for the identical assets or liabilities, such measurements involve developing assumptions based on market observable data and, in the absence of such data, internal information that is consistent with what market participants would use in a hypothetical transaction that occurs at the measurement date.
51
Table of Contents
Observable inputs reflect market data obtained from independent sources, while unobservable inputs reflect our market assumptions. Preference is given to observable inputs. These two types of inputs create the following fair value hierarchy:
| • | Level 1 – Quoted prices for identical instruments in active markets. |
| • | Level 2 – Quoted prices for similar instruments in active markets; quoted prices for identical or similar instruments in markets that are not active; and model-derived valuations whose inputs are observable or whose significant value drivers are observable. |
| • | Level 3 – Significant inputs to the valuation model are unobservable. |
IMPACT OF RECENTLY ISSUED ACCOUNTING PRONOUNCEMENTS
BUSINESS COMBINATIONS
On April 1, 2009, we adopted the provisions of ASC 805, Business Combinations, relating to business combinations, including assets acquired and liabilities assumed arising from contingencies. This pronouncement established principles and requirements for how the acquirer of a business recognizes and measures in its financial statements the identifiable assets acquired, the liabilities assumed, and any non-controlling interest in the acquiree as well as provides guidance for recognizing and measuring the goodwill acquired in the business combination and determines what information to disclose to enable users of the financial statements to evaluate the nature and financial effects of the business combination. In addition, this pronouncement eliminates the distinction between contractual and non-contractual contingencies, including the initial recognition and measurement criteria and require an acquirer to develop a systematic and rational basis for subsequently measuring and accounting for acquired contingencies depending on their nature. Our adoption of this pronouncement did not impact our consolidated financial statements in any material respect, but will have an impact on the manner in which we account for future acquisitions.
NON-CONTROLLING INTERESTS IN CONSOLIDATED FINANCIAL STATEMENTS
On April 1, 2009, we adopted to the provisions of ASC 810, Non-Controlling Interests in Consolidated Financial Statements. ASC 810 establishes accounting and reporting standards for the non-controlling interest in a subsidiary and for the deconsolidation of a subsidiary. It clarifies that a non-controlling interest in a subsidiary is an ownership interest in the consolidated entity that should be reported as equity in the consolidated financial statements. The adoption of ASC 810 did not have a material impact on our consolidated financial position, results of operations and cash flows.
DERIVATIVE INSTRUMENTS AND HEDGING ACTIVITIES
On April 1, 2009, we adopted the provisions of ASC 815, Disclosures about Derivative Instruments and Hedging. ASC 815 requires enhanced disclosures about how and why an entity uses derivative instruments, how derivative instruments and related hedged items are accounted for, their effect on an entity’s financial position, financial performance and cash flows. As of March 31, 2010, the Company was not engaged in any derivative or hedging activities that are required to be disclosed under the provisions of ASC 815.
FAIR VALUE MEASUREMENTS
On April 1, 2009, we adopted certain provisions of ASC 820, Fair Value Measurements, which defines fair value, establishes a framework for measuring fair value under accounting principles generally accepted in the United States of America and expands disclosures about fair value measurements. On April 1, 2009, we adopted the remaining provisions of ASC 820 as it relates to nonfinancial assets and liabilities that are not recognized or disclosed at fair value on a recurring basis. The adoption of this standard as it related to certain non-financial assets and liabilities did not impact our consolidated financial statements in any material respect.
52
Table of Contents
REVENUE ARRANGEMENTS WITH MULTIPLE DELIVERABLES
In October 2009, the Financial Accounting Standards Board (“FASB”) issued Accounting Standards Update (“ASU”) 2009-13 which will update ASC 605, Revenue Recognition, and changes the accounting for certain revenue arrangements. The new standard sets forth requirements that must be met for an entity to recognize revenue from the sale of a delivered item that is part of a multiple-element arrangement when other items have not yet been delivered and requires the allocation of arrangement consideration to each deliverable to be based on the relative selling price. ASU 2009-13 is effective prospectively for revenue arrangements entered into or materially modified in the fiscal years beginning on or after June 15, 2010, which for us is April 1, 2011. We are currently evaluating the impact this new standard will have on our financial statements.
2. INVENTORIES
Inventories, which are stated at the lower of cost (first-in, first-out) or market, consist of the following:
| March 31, | ||||||
| 2010 | 2009 | |||||
| Finished Goods, net |
$ | 20,613 | $ | 17,605 | ||
| Work in Progress, net |
1,161 | 1,004 | ||||
| Raw Materials |
13,086 | 24,612 | ||||
| Total, net |
$ | 34,860 | $ | 43,221 | ||
On a continuing basis, inventory quantities on hand are reviewed and an analysis of the provision for excess and obsolete inventory is performed based primarily on the Company’s sales history and anticipated future demand. Such provision for excess and obsolete inventory approximated $1,540 and $1,502 at March 31, 2010 and 2009, respectively.
3. ASSETS HELD FOR SALE
During fiscal 2009, the Company completed the renovation of its’ new corporate headquarters located in Brentwood, NY and relocated all corporate functions to the new facility. As a result of this relocation, the Company committed to a plan to sell its’ executive office building located in Hauppauge, NY. In accordance with ASC 360, Impairment or Disposal of Long-Lived Assets, the Company classified all land, building, building improvements and any remaining furniture and fixtures associated with the executive office building as “Assets held for sale” on its consolidated balance sheet as of March 31, 2009 as a component of “Other assets, net”. In accordance with ASC 360, the net assets held for sale were recorded at their net carrying value.
The major components of the assets held for sale were as follows:
| March 31, 2009 | |||
| Land |
$ | 263 | |
| Building |
968 | ||
| Building Improvements |
198 | ||
| Furniture and Fixtures |
27 | ||
| Total Assets Held for Sale |
$ | 1,456 | |
On March 12, 2010, the Company sold all of the remaining assets, which consisted of land, building, building improvements and furniture and fixtures, associated with the executive office building located in Hauppauge, NY. The proceeds from the sale were $2,066 and the resulting $546 gain on the sale was net of a $93 selling commission recorded as other income in the “selling, general and administrative” section of the fiscal 2010 consolidated statement of operations.
53
Table of Contents
4. INCOME TAXES
Income tax expense consists of the following:
| Fiscal Year Ended March 31, | ||||||||||
| 2010 | 2009 | 2008 | ||||||||
| Current: |
||||||||||
| Federal |
$7,673 | ($ | 507 | ) | $ | 4,662 | ||||
| State |
1,109 | 267 | 953 | |||||||
| Deferred |
1,735 | 3,381 | 2,612 | |||||||
| $ | 10,517 | $ | 3,141 | $ | 8,227 | |||||
The following table indicates the significant elements contributing to the difference between the statutory federal tax rate and the Company’s effective tax rate for fiscal years 2010, 2009 and 2008:
| Fiscal Year Ended March 31, | |||||||||
| 2010 | 2009 | 2008 | |||||||
| Statutory rate |
35.0 | % | 34.0 | % | 35.0 | % | |||
| State taxes |
3.5 | 4.8 | 3.4 | ||||||
| Net deductible expenses |
(0.1 | ) | — | (0.1 | ) | ||||
| Effective tax rate |
38.4 | % | 38.8 | % | 38.3 | % | |||
The components of deferred tax assets and deferred tax liabilities at March 31, 2010 and 2009 are as follows:
| Fiscal Year Ended March 31, | ||||||
| 2010 | 2009 | |||||
| Deferred tax assets : |
||||||
| Stock-based compensation |
$ | 1,549 | $ | 1,641 | ||
| Inventory valuation allowance |
531 | 534 | ||||
| Allowance for doubtful accounts |
249 | 256 | ||||
| Accrued vacation |
34 | 17 | ||||
| Total deferred tax assets |
$ | 2,363 | $ | 2,448 | ||
| Deferred tax liabilities : |
||||||
| Depreciation and amortization |
$ | 15,932 | $ | 14,282 | ||
We account for income taxes in accordance with the guidance issued under ASC 740, “Income Taxes” with consideration for uncertain tax positions. We record a valuation allowance to reduce our deferred tax assets to the amount of future tax benefit that is more likely than not to be realized. As of March 31, 2010, no valuation allowance was necessary for the $2,363 deferred tax assets that existed on the Company’s books. As of March 31, 2010, the total net deferred tax liability was $13,569.
Since April 1, 2007, the Company accounted for uncertain tax positions in accordance with authoritative guidance issued under ASC 740, which addresses the determination of whether tax benefits claimed or expected to be claimed on tax returns should be recorded in the financial statements. The Company may recognize the tax benefit from an uncertain tax position only if it is more likely than not that the future tax position will be sustained on examination by the taxing authorities based on the technical merits of the position. The tax benefits recognized in the financial statements from such position should be measured based on the largest benefit that has a greater than fifty percent likelihood of being realized upon ultimate settlement. The Company may
54
Table of Contents
recognize the tax benefit from an uncertain tax position only if it is more likely than not that the future tax position will be sustained. The Company classifies interest and penalties associated with income taxes as a component of income tax expense (benefit) on the consolidated statements of operations.
We are subject to taxation in the U.S. and various state and local jurisdictions. The North Carolina state examination for the fiscal years ended March 31, 2008, 2007 and 2006 has been finalized with an immaterial assessment for each year. The Company is no longer subject to U.S. federal income tax examinations by the Internal Revenue Service and most state and local authorities for fiscal tax years ending prior to March 31, 2007. Certain state authorities may subject the Company to examination up to the period ending March 31, 2006. The Company does, however, have a prior year net operating loss as a result of a previous acquisition which will remain open for examination.
5. ACCRUED EXPENSES
Accrued expenses consist of the following:
| March 31, | ||||||
| 2010 | 2009 | |||||
| Employee compensation and benefits |
$ | 5,620 | $ | 2,626 | ||
| Accrued accounts payable |
2,094 | 1,726 | ||||
| Commissions |
1,575 | 1,464 | ||||
| Other accrued liabilities |
1,552 | 3,651 | ||||
| Accrued distributor fees |
1,375 | 1,148 | ||||
| Accrued restructuring |
— | 28 | ||||
| Total accrued expenses |
$ | 12,216 | $ | 10,643 | ||
6. LEASES
The Company leases certain equipment, vehicles and office facilities under non-cancelable operating leases expiring in various years though fiscal 2015.
As of March 31, 2010, the Company was obligated under non-cancelable operating leases for equipment, vehicles and office facilities for minimum annual rental payments for the five succeeding fiscal years as follows:
| Fiscal Year |
Amount | ||
| 2011 |
$ | 999 | |
| 2012 |
711 | ||
| 2013 |
347 | ||
| 2014 |
36 | ||
| 2015 |
7 | ||
| Total minimum lease payments |
$ | 2,100 | |
Rental expense under operating leases were $379, $461 and $676, for the fiscal years ended March 31, 2010, 2009 and 2008, respectively.
55
Table of Contents
7. LONG-TERM DEBT
Long-term debt consists of the following:
| March 31, | ||||||
| 2010 | 2009 | |||||
| Revolving credit agreement (a) |
$ | — | $ | 17,537 | ||
| Term Loan (a) |
16,875 | 40,750 | ||||
| Industrial Revenue Bond (b) |
1,360 | 1,720 | ||||
| $ | 18,235 | $ | 60,007 | |||
| Less: current portion |
15,501 | 6,860 | ||||
| Total long-term debt |
$ | 2,734 | $ | 53,147 | ||
| (a) | On October 17, 2006, the Company entered into a credit agreement with certain lenders and a bank acting as administration agent for the lenders (the “Credit Agreement”). The Credit Agreement, as amended, provides for borrowing of $85,000 and is divided into two types of borrowing facilities, (i) a term loan with a principal amount of $65,000 and (ii) revolving credit loans, which amounts may be borrowed, repaid and re-borrowed up to $20,000. |
The term loan has remaining quarterly payments of: $3,250 for each installment date from June 30, 2010 through March 31, 2011, and the remaining principal amount outstanding is due on June 30, 2011. The Credit Agreement, as amended, may require the Company to make an additional term loan payment during the first quarter of fiscal 2011. The additional term loan payment of “50% of Excess Cash Flow”, as defined, requires the Company to repay the term loan in an amount equal to 50% of Excess Cash Flow, less amounts equal to any voluntary principal balance prepayments made by the Company during fiscal 2010 provided that these amounts do not exceed the differential between cash and cash equivalents as of March 31, 2010 and $3,500. Such voluntary principal balance prepayments amounted to $17,375 during the twelve months ended March 31, 2010.
Both the term loan and revolving credit loans bear interest at the “alternate base rate” plus the “applicable margin” or at the Company’s option the “LIBOR rate” plus the applicable margin. The alternate base rate shall mean a rate per annum equal to the greater of (a) the Prime rate or (b) the Base CD rate in effect on such day plus 1% and (c) the Federal Funds Effective Rate in effect on such day plus 1/2 of 1%. Applicable margin shall mean with respect to an adjusted LIBOR loan a range of 75 basis points to 150 basis points. With respect to an alternate base rate loan, the applicable margin shall range from 0 basis points to 50 basis points. Effective September 30, 2008, applicable margin shall mean with respect to an adjusted LIBOR loan a range of 200 basis points to 300 basis points. With respect to an alternate base rate loan, the applicable margin shall range from 25 basis points to 125 basis points. The rates for both LIBOR and alternate base rate loans are established quarterly based upon certain agreed upon financial ratios. During fiscal 2010, the average interest rates on the term and revolving credit loans approximated 2.65% and 3.14%, respectively. Borrowings under this agreement are collateralized by all the assets of the Company, and the agreement contains certain restrictive covenants, which, among other matters, impose limitations with respect to the incurrence of liens, guarantees, merger, acquisitions, capital expenditures, specified sales of assets and prohibits the payment of dividends. The Company is also required to maintain various financial ratios which will be measured quarterly. As of March 31, 2010, the Company was in compliance with all such covenants and financial ratios and had $20,000 available for borrowing under its revolving credit agreement.
| (b) | On July 9, 1997, the Company acquired approximately 32 acres of land located in Arden, North Carolina and an existing 205,000 square foot building located thereon (the “Arden Facility”). The purchase price for the Arden Facility was $2,900, which was paid at closing. The acquisition of the Arden Facility was financed with the proceeds from the issuance and sale by The Buncombe County Industrial Facilities and Pollution Control Financing Authority of its $5,500 Industrial Development Revenue Bonds (Medical Action Industries Inc. Project), Series 1997 (the “Bonds”). Interest on the Bonds is payable on the first |
56
Table of Contents
| business day of each January, April, July and October commencing October 1997 and ending July 2013. Principal payments are due and payable in 60 consecutive quarterly installments of $90 commencing October 1, 1998 and ending July 1, 2013 with a final maturity payment of $190. The Bonds bear interest at a variable rate, determined weekly. The interest rate on the Bonds at March 31, 2010 was .50% per annum. In connection with the issuance of the Bonds, the Company entered into a Letter of Credit and Reimbursement Agreement dated as of July 1, 1997 with a bank for approximately $5,800 (the “Reimbursement Agreement”) to support principal and interest payments of the Bonds and requires payment of an annual fee of .85% of the remaining balance. The Company also entered into a Remarketing Agreement, pursuant to which the Remarketing Agent will use its best efforts to arrange for a sale in the secondary market of such Bonds. The Remarketing Agreement provides for the payment of an annual fee of .125% of the remaining balance. As of March 31, 1998, the Company had used all of the $5,500 proceeds from the Bonds for the purchase and rehabilitation of the Arden Facility and for the acquisition of machinery and equipment. |
Maturities of long-term debt for the next five fiscal years are as follows:
| Fiscal Year |
Amount | ||
| 2011 |
$ | 15,501 | |
| 2012 |
2,094 | ||
| 2013 |
360 | ||
| 2014 |
280 | ||
| 2015 |
— | ||
| Total |
$ | 18,235 | |
The Company has unamortized deferred financing costs of $115 and $155 included in other assets, net at March 31, 2010 and 2009, respectively. These costs related to the Company’s term loan and revolving credit agreement. These costs are being amortized each year in the amount of approximately $72 in fiscal year 2011, $42 in fiscal year 2012 and $1 in fiscal year 2013.
In April 2007, we entered into an interest rate swap agreement to manage our exposure to interest rate changes. The swap effectively converts a portion of our variable rate debt under the credit agreement to a fixed rate, without exchanging the notional principal amounts. As of March 31, 2010, we had no outstanding amounts subject to the interest rate swap agreement.
8. FAIR VALUE MEASUREMENTS
We adopted ASC 820, Fair Value Measurements in two steps; effective April 1, 2008, we adopted it for all financial instruments and non-financial instruments accounted for at fair value on a recurring basis and effective April 1, 2009, for all non-financial instruments accounted for at fair value on a non-recurring basis. This guidance establishes a new framework for measuring fair value and expands related disclosures. Broadly, the framework requires fair value to be determined based on the exchange price that would be received for an asset or paid to transfer a liability (an exit price) in the principal or most advantageous market for the asset or liability in an orderly transaction between market participants. It also establishes a three-level valuation hierarchy based upon observable and non-observable inputs.
The following table provides the assets and liabilities carried at fair value measured on a recurring basis as of March 31, 2010 and 2009:
| Fair Value Measurements at March 31, 2010 | ||||||||
| Carrying
Value |
Level 1 | Level 2 | Level 3 | |||||
| Liabilities: |
||||||||
| Revolving credit agreement |
— | — | — | — | ||||
| Term loan |
1,734 | 1,734 | — | — | ||||
57
Table of Contents
| Fair Value Measurements at March 31, 2009 | ||||||||
| Carrying
Value |
Level 1 | Level 2 | Level 3 | |||||
| Liabilities: |
||||||||
| Revolving credit agreement |
17,537 | 17,537 | — | — | ||||
| Term loan |
34,250 | 34,250 | — | — | ||||
9. EARNINGS PER SHARE
The following is a reconciliation of the numerator and denominator of the basic and diluted net earnings per share computations for the fiscal years ended March 31, 2010, 2009 and 2008, respectively.
| March 31, | |||||||||
| 2010 | 2009 | 2008 | |||||||
| NUMERATOR : |
|||||||||
| Net income for basic and dilutive earnings per share |
$ | 16,841 | $ | 4,955 | $ | 13,225 | |||
| DENOMINATOR : |
|||||||||
| Denominator for basic earnings per share – weighted average shares |
16,132,161 | 16,025,369 | 15,951,924 | ||||||
| Effect of dilutive securities: |
|||||||||
| Employee and director stock options |
142,615 | 133,331 | 380,462 | ||||||
| Denominator for diluted earnings per share – adjusted weighted average shares |
16,274,775 | 16,158,700 | 16,332,386 | ||||||
| Net income per share basic |
$ | 1.04 | $ | 0.31 | $ | 0.83 | |||
| Net income per share diluted |
$ | 1.03 | $ | 0.31 | $ | 0.81 | |||
10. SHAREHOLDERS’ EQUITY AND STOCK PLANS
We account for our three stock-based compensation plans in accordance with the provisions of ASC 718, Stock Compensation. Under the provisions of ASC 718, stock-based compensation cost is measured at the grant date, based on the calculated fair value of the grant and is recognized as an expense over the service period applicable to the grantee. The service period is the period of time that the grantee must provide services to the Company before the stock-based compensation is fully vested. Stock-based compensation expense for the non-vested portion of awards granted prior to the effective date is being recognized over the remaining service period using the fair-value based compensation cost estimated under the provisions of ASC 718.
STOCK OPTIONS
The Company currently grants stock options under the 1989 Non-Qualified Stock Option Plan (the “Non-Qualified Option Plan”), the 1994 Stock Incentive Plan (the “Incentive Plan”) and the 1996 Non-Employee Director Stock Option Plan (the “Director Plan”). The Non-Qualified Option Plan was approved by the Company’s Board of Directors and shareholders and provides for the grant of stock options with an exercise price equal to the fair market price or at a value that is not less than 85% of the fair market value on the date of grant and are exercisable in three installments on the second, third and fourth anniversary of the date of grant. The Incentive Plan was adopted by the Company’s Board of Directors and shareholders and provides for the granting of incentive stock options, shares of restricted stock and non-qualified stock options to all officers and key employees of the Company and its affiliates at an exercise price that may not be less than the fair market value of a share of common stock at the time of grant. The Director Plan was approved by the shareholders in August 1996 and, as amended, grants each non-employee director of the Company an option to purchase 7,500 shares of the Company’s common stock after each year of service. All options granted under the above plans expire from five to ten years from the date of grant unless the employment is terminated, in which event, subject to certain exceptions, the options terminate two months subsequent to date of termination.
58
Table of Contents
RESTRICTED STOCK AWARDS
Grants of restricted stock are common stock awards granted to recipients with specified vesting provisions. The restricted stock issued vests based upon the recipients continued service over time (five-year vesting period). The Company estimates the fair value of restricted stock based on the Company’s closing stock price on the date of grant.
The following is a summary of the changes in restricted stock granted under the 1994 Stock Incentive Plan for the fiscal years presented:
| Fiscal Year Ended March 31, | ||||||||||||||||||
| 2010 | 2009 | 2008 | ||||||||||||||||
| Shares | Weighted Average Price |
Shares | Weighted Average Price |
Shares | Weighted Average Price | |||||||||||||
| Beginning Balance |
27,186 | $ | 14.87 | 39,374 | $ | 14.42 | 48,750 | $ | 14.86 | |||||||||
| Granted |
— | — | — | — | — | — | ||||||||||||
| Vested |
(7,031 | ) | $ | 14.90 | (12,188 | ) | $ | 14.87 | (9,376 | ) | $ | 16.72 | ||||||
| Cancelled |
(12,656 | ) | $ | 14.81 | — | — | — | — | ||||||||||
| Ending Balance |
7,499 | $ | 14.92 | 27,186 | $ | 14.87 | 39,374 | $ | 14.42 | |||||||||
VALUATION ASSUMPTIONS
The fair value of each option grant is estimated on the date of the grant using the Black-Scholes options pricing model. Use of a valuation model requires management to make certain assumptions with respect to selected model inputs. The expected term of the options is based on evaluations of historical and expected future employee exercise behavior. The risk-free rate is based on the U.S. Treasury rates at the date of grant with maturity dates approximately equal to the life of the grant. The expected volatility is based on the historical volatility of the Company’s stock. The following table summarizes the assumptions used to determine the fair value of options granted during the following periods:
| March 31, | |||||||||
| 2010 | 2009 | 2008 | |||||||
| Expected dividend yield |
0 | % | 0 | % | 0 | % | |||
| Expected volatility |
56.43 | % | 35.65 | % | 34.60 | % | |||
| Risk-free interest rate |
3.54 | % | 3.91 | % | 4.70 | % | |||
| Expected life (years) |
5.33 | 5.33 | 5.33 | ||||||
STOCK-BASED COMPENSATION EXPENSE
The Company recognized stock-based compensation expense (before deferred income tax benefits) for awards granted under the Company’s stock option plans in the following line items in the consolidated statement of operations for the fiscal years ended March 31, 2010, 2009 and 2008:
| 2010 | 2009 | 2008 | |||||||
| Cost of sales |
$ | 180 | $ | 271 | $ | 284 | |||
| Selling, general and administrative expenses |
1,312 | 1,177 | 1,322 | ||||||
| Stock-based compensation expense before income tax benefits |
$ | 1,492 | $ | 1,448 | $ | 1,606 | |||
59
Table of Contents
Net income from operations and net income was impacted by $918, $886 and $991 in stock-based compensation expense or $.06, $.05 and $.06 per diluted share for the fiscal years ended March 31, 2010, 2009 and 2008, respectively.
Information regarding the Company’s stock options activity for the fiscal years ended is summarized below:
| Number of Options |
Weighted Average Exercise Price |
Weighted Average Remaining Contractual Life (years) |
Aggregate Intrinsic Value | ||||||||
| Options outstanding at April 1, 2007 |
1,418,562 | $ | 23.05 | ||||||||
| Granted |
282,200 | 21.41 | |||||||||
| Exercised |
(204,875 | ) | 5.88 | ||||||||
| Forfeited |
(105,825 | ) | 17.95 | ||||||||
| Options outstanding at March 31, 2008 |
1,390,062 | $ | 12.52 | ||||||||
| Granted |
264,000 | 15.99 | |||||||||
| Exercised |
(7,500 | ) | 11.67 | ||||||||
| Forfeited |
(131,500 | ) | 15.88 | ||||||||
| Options outstanding at March 31, 2009 |
1,515,062 | $ | 12.85 | ||||||||
| Granted |
343,000 | 10.80 | |||||||||
| Exercised |
(316,250 | ) | 9.01 | ||||||||
| Forfeited |
(222,250 | ) | 14.93 | ||||||||
| Options outstanding at March 31, 2010 |
1,319,562 | $ | 12.88 | 6.4 | $ | 1,796 | |||||
| Exercisable at March 31, 2010 |
794,487 | $ | 12.30 | 4.9 | $ | 1,293 | |||||
The total fair value of shares vested during the fiscal year ended March 31, 2010 was $1,297. As of March 31, 2010, there was $3,291 of total unrecognized compensation cost related to non-vested share-based compensation arrangements granted under the Company’s plans and is expected to be recognized over a weighted average period of 1.54 years.
Summarized information about stock options outstanding as of March 31, 2010 and 2009 is as follows:
| 2010 | ||||||||||||
| Outstanding | Exercisable | |||||||||||
| Range of Exercise Prices per Common Share |
Options | Weighted Average Remaining Contractual Life (years) |
Weighted Average Exercise Price per Common Share |
Options | Weighted Average Exercise Price per Common Share | |||||||
| $ 1.39 – $10.39 |
258,437 | 3.0 | $ | 7.78 | 231,187 | $ | 7.48 | |||||
| $10.40 – $19.39 |
899,725 | 7.2 | 12.77 | 477,600 | 12.95 | |||||||
| $19.40 – $23.27 |
161,400 | 7.2 | 21.66 | 85,700 | 21.68 | |||||||
| $ 1.39 – $23.27 |
1,319,562 | 6.4 | $ | 12.88 | 794,487 | $ | 12.30 | |||||
| 2009 | ||||||||||||
| Outstanding | Exercisable | |||||||||||
| Range of Exercise Prices per Common Share |
Options | Weighted Average Remaining Contractual Life (years) |
Weighted Average Exercise Price per Common Share |
Options | Weighted Average Exercise Price per Common Share | |||||||
| $ 1.39 – $10.39 |
442,187 | 3.3 | $ | 7.27 | 439,187 | $ | 7.25 | |||||
| $10.40 – $19.39 |
862,175 | 7.0 | 13.55 | 561,900 | 12.19 | |||||||
| $19.40 – $23.27 |
210,700 | 8.1 | 21.69 | 60,175 | 21.74 | |||||||
| $ 1.39 – $23.27 |
1,515,062 | 6.1 | $ | 12.85 | 1,061,262 | $ | 10.69 | |||||
60
Table of Contents
The aggregate pre-tax intrinsic value (the difference between the company’s closing stock price on the last trading day of fiscal 2010 and the exercise price, multiplied by the number of in-the-money options) that would have been received by the option holders had all option holders exercised their options on March 31, 2010 was $1,293. This amount changes based on the fair market value of the Company’s stock. The total intrinsic value of options exercised for the years ended March 31, 2010, 2009 and 2008 were $1,739, $13 and $3,482, respectively.
The following is a summary of changes in non-vested stock options for the fiscal year ended March 31, 2010:
| Shares | Weighted Average Grant Date Fair Value | |||||
| Non-vested shares at April 1, 2009 |
453,800 | $ | 7.05 | |||
| Granted |
343,000 | 5.74 | ||||
| Forfeited |
(86,126 | ) | 6.63 | |||
| Vested |
(187,100 | ) | 6.93 | |||
| Non-vested shares at March 31, 2010 |
523,574 | $ | 6.27 | |||
The options and bonus shares available for future issuance as of March 31, 2010 are shown below:
| Non-Qualified Option Plan |
1994 Stock Incentive Plan |
1996 Directors Stock Option Plan |
Total | |||||||||
| Authorized by Directors and Stockholders |
3,975,000 | 3,525,000 | 750,000 | 8,250,000 | ||||||||
| Options previously exercised |
(3,169,187 | ) | (2,017,437 | ) | (100,000 | ) | (5,286,624 | ) | ||||
| Bonus shares previously granted |
— | (93,750 | ) | — | (93,750 | ) | ||||||
| Options outstanding |
(515,875 | ) | (731,188 | ) | (72,500 | ) | (1,319,563 | ) | ||||
| Remaining for future issuance |
289,938 | 682,625 | 577,500 | 1,550,063 | ||||||||
11. RETIREMENT PLANS
401(k) PLAN
Effective January 1, 2010, the Company amended its 401(k) retirement plan to be subject to the provisions of a “Safe Harbor” 401(k) plan. Under the provisions of the Safe Harbor plan, any discretionary matching company contribution becomes 100% vested upon match. The plan provides for a discretionary match of up to 4% of an eligible employee’s compensation. Under the prior plan, adopted in April 1988, any remaining unvested company discretionary matching contributions are subject to a four (4) year vesting schedule. The Company’s contributions, under both the 1988 plan and the Safe Harbor plan, amounted to $365 in fiscal 2010, $533 in fiscal 2009 and $582 in fiscal 2008.
DEFINED BENEFIT PLAN
The Company acquired a defined benefit pension plan (the “Plan”) with the Medegen Medical Products, LLC (“MMP”) acquisition. The Plan covers certain employees of MMP who are members of the Service Employees International Union. The benefit accruals for the Plan were frozen as of December 31, 1999. The Company’s funding policy is to make the minimum annual contributions required by applicable regulations.
61
Table of Contents
The following table sets forth the Plan’s funded status and amount recognized in the Company’s financial statements as of and for the fiscal year ended March 31:
| 2010 | 2009 | |||||||
| Actuarial present value of benefit obligations: |
||||||||
| Vested benefit obligation |
$ | (1,014 | ) | $ | (1,014 | ) | ||
| Accumulated benefit obligation |
(1,314 | ) | (1,031 | ) | ||||
| Projected benefit obligation |
$ | (1,314 | ) | $ | (1,031 | ) | ||
| Plan assets at fair value as of measurement date |
792 | 642 | ||||||
| Projected benefit obligation in excess of plan assets |
$ | (148 | ) | $ | (122 | ) | ||
| Unrecognized actuarial loss |
(374 | ) | (267 | ) | ||||
| Accrued pension costs |
$ | (522 | ) | $ | (389 | ) | ||
| Amount recognized in consolidated balance sheet: |
||||||||
| Accrued pension costs |
$ | (522 | ) | $ | (389 | ) | ||
| Accrued benefit liability |
(374 | ) | (267 | ) | ||||
| Minimum pension liability adjustment included in accumulated other comprehensive income (loss): |
||||||||
| Net amount recognized |
(374 | ) | (267 | ) | ||||
| $ | (522 | ) | $ | (389 | ) | |||
Weighted-average actuarial assumptions used to calculate net periodic pension cost, fiscal year-end liabilities and funding status as of March 31, 2010 (measurement date) were as follows:
| 2010 | 2009 | |||||
| Rate of future benefit increases |
none assumed | none assumed | ||||
| Discount rate |
6.14 | % | 7.48 | % | ||
| Expected rate of return on plan assets |
6.00 | % | 6.00 | % |
The net periodic pension cost was as follows:
| 2010 | 2009 | |||||||
| Service cost – benefits earned during the period |
$ | — | $ | — | ||||
| Interest cost on projected benefit obligation |
76 | 61 | ||||||
| Loss on assets |
(38 | ) | (78 | ) | ||||
| Net amortization and deferral |
12 | — | ||||||
| Net periodic pension cost |
$ | 50 | $ | (17 | ) | |||
Weighted-average asset allocation by asset category as of March 31, 2010 and 2009 were as follows:
| Target Range | 2010 | 2009 | ||||||
| Equity securities |
30%-90% | 35 | % | 81 | % | |||
| Debt securities |
10%-70% | 63 | % | 17 | % | |||
| Cash |
0%-20% | 2 | % | 2 | % | |||
| Total |
100 | % | 100 | % | ||||
62
Table of Contents
Benefits paid were approximately $38 and $34 for the fiscal years ended March 31, 2010 and 2009, respectively. The Company estimates the following future benefit payments under the plan for the fiscal years ending March 31:
| Fiscal Year |
Amount | ||
| 2011 |
$ | 42 | |
| 2012 |
41 | ||
| 2013 |
43 | ||
| 2014 |
44 | ||
| 2015 |
45 | ||
The Company’s investment policy for the Plan’s assets is to balance risk and return through a diversified portfolio of marketable securities, including common and preferred stocks, convertible securities, government, municipal and corporate bonds, mutual and collective investment funds and short-term money market instruments. Maturities for fixed income securities are managed so that sufficient liquidity exists to meet near-term benefit-payment obligations. The expected rate of return on plan assets is based upon expectations of long-term average rates of return to be achieved by the underlying investment portfolios. In establishing this assumption, the Company considers historical and expected rates of return for the asset classes in which the Plan’s assets are invested, as well as current economic and capital market conditions.
12. OTHER MATTERS
The Company is a party to a lawsuit arising out of the conduct of its ordinary course of business. While the results of such lawsuit cannot be predicted with certainty, management does not expect that the ultimate liabilities, if any, will have a material adverse effect on the financial position or results of operations of the Company.
The Company operates in one industry, disposable medical products.
The Company’s international sales were $8,319, $9,096 and $8,888 for the fiscal years ended March 31, 2010, 2009 and 2008, respectively. The majority of these sales were to customers based in North America.
The Company has entered into agreements with three of its executive officers and a vice president, which provide certain benefits in the event of a change in control of the Company. A “change in control” of the Company is defined as, in general, the acquisition by any person of beneficial ownership of 20% or more of the voting stock of the Company, certain business combinations involving the Company or a change in a majority of the incumbent members of the Board of Directors, except for changes in the majority of such members approved by such members. If, within two years after a change in control, the Company or, in certain circumstances, the executive, terminates his employment, the executive is entitled to a severance payment equal to three times (i) such executive’s highest annual salary within the five-year period preceding termination plus (ii) a bonus increment equal to the average of the two highest of the last five bonuses paid to such executive. In addition, the executive is entitled to the continuation of all employment benefits for a three-year period, the vesting of all stock options and certain other benefits, including payment of an amount sufficient to offset any “excess parachute payment” excise tax payable by the executive pursuant to the provisions of the Internal Revenue Code of any comparable provision of state law. As of March 31, 2010, the estimated potential aggregate compensation payable to these three executive officers and vice president under the Company’s compensation and benefit plans and arrangements in the event of termination of such executive’s employment following a change in control amounted to approximately $7,325.
The Medegen Tennessee facility is comprised of approximately 25 acres in a light industrial park, located in Gallaway, TN and was acquired by Medegen in 1998. As part of its due diligence activities prior to the acquisition of the facility by Medegen, consultants found chlorinated solvents in the groundwater adjacent to the manufacturing plant. The identified groundwater contamination is in the process of being remediated.
63
Table of Contents
The prior owner of the facility (“Indemnitor”) retained responsibility for the remediation of the contamination, and Medegen is fully indemnified for all costs associated with the environmental remediation as well as any claims that may arise, including third party claims. As security for the indemnification obligations, Indemnitor is required, on a quarterly basis, to provide proof of cash balances, marketable securities or available, unused lines of credit equal to the expected cost of all future remediation activities plus $500. Now that full-scale remediation has begun, Indemnitor will be required to provide Letters of Credit (“LC”) to secure their future obligations beginning with a $3,000 LC in December 2009, dropping to $2,000 in December 2011 and reducing to $1,000 from December 2014 through December 2017. The LC amounts approximate the expected remaining remediation costs at each point in time. No assurance can be given that the Indemnitor will have the financial resources to complete the environmental remediation and/or defend any claims that may arise, that recommended cleanup levels will be achieved over the long term, or that further remedial activities will not be required.
13. SUMMARY OF QUARTERLY FINANCIAL DATA
Selected unaudited, quarterly financial data of the Company for the fiscal years ended March 31, 2010 and 2009 appear below.
| Quarter Ended | ||||||||||||
| 2010 | June 30 | September 30 | December 31 | March 31 | ||||||||
| Net Sales |
$ | 70,687 | $ | 75,060 | $ | 73,176 | $ | 71,223 | ||||
| Gross Profit |
16,922 | 17,229 | 17,215 | 17,538 | ||||||||
| Net income |
3,650 | 3,987 | 4,010 | 5,194 | ||||||||
| Net income per common share |
||||||||||||
| Basic |
$ | 0.23 | $ | 0.25 | $ | 0.25 | $ | 0.32 | ||||
| Diluted |
$ | 0.23 | $ | 0.25 | $ | 0.25 | $ | 0.32 | ||||
| Quarter Ended | ||||||||||||
| 2009 | June 30 | September 30 | December 31 | March 31 | ||||||||
| Net Sales |
$ | 77,395 | $ | 73,824 | $ | 71,995 | $ | 72,856 | ||||
| Gross Profit |
15,050 | 11,272 | 10,083 | 14,530 | ||||||||
| Net income |
2,546 | 480 | 157 | 1,772 | ||||||||
| Net income per common share |
||||||||||||
| Basic |
$ | 0.16 | $ | 0.03 | $ | 0.01 | $ | 0.11 | ||||
| Diluted |
$ | 0.16 | $ | 0.03 | $ | 0.01 | $ | 0.11 | ||||
14. SUBSEQUENT EVENTS
Subsequent to March 31, 2010, inventories at the Company’s off site storage facility in Tennessee were damaged as a result of flooding. At this time the Company is assessing the damages. While no specific dollar amount can be determined at this point. it is estimated that of the approximately $2,400 in inventory located at the off site storage facility as of the date of the flood, approximately $1,000-$1,500 is damaged. However, the Company believes a portion of these damages will be recovered under its insurance policy.
ITEM 9 – CHANGES IN AND DISAGREEMENTS WITH ACCOUNTANTS ON ACCOUNTING AND FINANCIAL DISCLOSURE
None.
64
Table of Contents
ITEM 9A – CONTROLS AND PROCEDURES
The Company’s management, with the participation of the Chief Executive Officer and Chief Financial Officer, evaluated the effectiveness of the Company’s disclosure controls and procedures (as defined in Rules 13a-15(e) and 15d-15(e) under the Securities Act) as of March 31, 2010. Based on this evaluation, the Chief Executive Officer and Chief Financial Officer concluded that, as of March 31, 2010, the Company’s disclosure controls and procedures were (i) designed to ensure that material information relating to the Company, is made known to the Company’s Chief Executive Officer and Chief Financial Officer, particularly during the period in which this report was being prepared and (ii) effective, in that they provide reasonable assurance that information required to be disclosed by the Company in the reports that it files or submits under the Securities Act is recorded, processed, summarized and reported within the time periods specified in the SEC’s rules and forms.
No change in the Company’s internal control over financial reporting (as defined in Rules 13a-15(f) and 15d-15(f) under the Exchange Act) occurred during the fiscal quarter ended March 31, 2010 that has materially affected, or is reasonably likely to materially affect, the Company’s internal control over financial reporting. See Management’s Annual Report on Internal Control Over Financial Reporting on page 67.
The Company’s independent registered public accounting firm has also issued a report on the Company’s internal control over financial reporting. This report appears on page 68.
None.
65
Table of Contents
REPORT OF INDEPENDENT REGISTERED PUBLIC ACCOUNTING FIRM
Board of Directors and Shareholders
Medical Action Industries Inc.
We have audited the accompanying consolidated balance sheets of Medical Action Industries Inc. (a Delaware corporation) and subsidiaries as of March 31, 2010 and 2009, and the related consolidated statements of operations, shareholders’ equity, and cash flows for each of the three years in the period ended March 31, 2010. These financial statements are the responsibility of the Company’s management. Our responsibility is to express an opinion on these financial statements based on our audits.
We conducted our audits in accordance with the standards of the Public Company Accounting Oversight Board (United States). Those standards require that we plan and perform the audit to obtain reasonable assurance about whether the financial statements are free of material misstatement. An audit includes examining, on a test basis, evidence supporting the amounts and disclosures in the financial statements. An audit also includes assessing the accounting principles used and significant estimates made by management, as well as evaluating the overall financial statement presentation. We believe that our audits provide a reasonable basis for our opinion.
In our opinion, the consolidated financial statements referred to above present fairly, in all material respects, the financial position of Medical Action Industries Inc. and subsidiaries as of March 31, 2010 and 2009, and the results of their operations and their cash flows for each of the three years in the period ended March 31, 2010 in conformity with accounting principles generally accepted in the United States of America.
As discussed in Note 1 of the notes to the consolidated financial statements, the Company adopted new accounting guidance related to the accounting for uncertainty in income taxes effective April 1, 2007.
We also have audited, in accordance with the standards of the Public Company Accounting Oversight Board (United States), Medical Action Industries Inc. and subsidiaries’ internal control over financial reporting as of March 31, 2010, based on criteria established in Internal Control – Integrated Framework issued by the Committee of Sponsoring Organizations of the Treadway Commission (“COSO”), and our report dated June 2, 2010 expressed an unqualified opinion thereon.
New York, New York
June 2, 2010
66
Table of Contents
Management’s Annual Report on Internal Control Over Financial Reporting
The management of the Company is responsible for establishing and maintaining adequate internal control over financial reporting. Internal control over financial reporting is defined in Rule 13a-15(f) and 15(d)-15(f) promulgated under the Securities Exchange Act of 1934 as a process designed by, or under the supervision of, the Company’s Chief Executive Officer and Chief Financial Officer and effected by the Company’s board of directors, management and other personnel, to provided reasonable assurance regarding the reliability of financial reporting and the preparation of financial statements for external purposes in accordance with generally accepted accounting principles and includes those policies and procedures that:
| 1. | Pertain to the maintenance of records that in reasonable detail accurately and fairly reflect the transactions and dispositions of assets of the Company; |
| 2. | Provide reasonable assurance that transactions are recorded as necessary to permit preparation of financial statements in accordance with generally accepted accounting principles, and that receipts and expenditures of the Company are being made only in accordance with authorizations of management and directors of the Company; and |
| 3. | Provide reasonable assurance regarding prevention or timely detection of unauthorized acquisition, use or disposition of the Company’s assets that could have a material effect on the financial statements. |
The Company’s management assessed the effectiveness of the Company’s internal control over financial reporting as of March 31, 2010. In making this assessment, the Company’s management used the criteria established in Internal Control – Integrated Framework issued by the Committee of Sponsoring Organizations of the Treadway Commission.
Under the supervision and with the participation of our management, including our Chief Executive Officer and Chief Financial Officer, we conducted an evaluation of our internal control over financial reporting as prescribed above for the periods covered by this report. Based on our evaluation, our Chief Executive Officer and Chief Financial Officer concluded that the Company’s internal control over financial reporting is effective.
Because of its inherent limitations, internal control over financial reporting may not prevent or detect misstatements.
Projections of any evaluation of effectiveness to future periods are subject to the risk that controls may become inadequate because of changes in conditions, or that the degree of compliance with the policies or procedures may deteriorate.
Grant Thornton LLP, an independent registered public accounting firm, has issued their report on the Company’s internal control over financial reporting as of June 2, 2010.
67
Table of Contents
REPORT OF INDEPENDENT REGISTERED PUBLIC ACCOUNTING FIRM
Board of Directors and Shareholders
Medical Action Industries Inc.
We have audited Medical Action Industries Inc. (a Delaware Corporation) and subsidiaries’ internal control over financial reporting as of March 31, 2010, based on criteria established in Internal Control – Integrated Framework issued by the Committee of Sponsoring Organizations of the Treadway Commission (“COSO”). Medical Action Industries Inc. and subsidiaries’ management is responsible for maintaining effective internal control over financial reporting and for its assessment of the effectiveness of internal control over financial reporting, included in the accompanying Management’s Report on Internal Control over Financial Reporting. Our responsibility is to express an opinion on Medical Action Industries Inc. and subsidiaries’ internal control over financial reporting based on our audit.
We conducted our audit in accordance with the standards of the Public Company Accounting Oversight Board (United States). Those standards require that we plan and perform the audit to obtain reasonable assurance about whether effective internal control over financial reporting was maintained in all material respects. Our audit included obtaining an understanding of internal control over financial reporting, assessing the risk that a material weakness exists, testing and evaluating the design and operating effectiveness of internal control based on the assessed risk, and performing such other procedures as we considered necessary in the circumstances. We believe that our audit provides a reasonable basis for our opinion.
A company’s internal control over financial reporting is a process designed to provide reasonable assurance regarding the reliability of financial reporting and the preparation of financial statements for external purposes in accordance with generally accepted accounting principles. A company’s internal control over financial reporting includes those policies and procedures that (1) pertain to the maintenance of records that, in reasonable detail, accurately and fairly reflect the transactions and dispositions of the assets of the company; (2) provide reasonable assurance that transactions are recorded as necessary to permit preparation of financial statements in accordance with generally accepted accounting principles, and that receipts and expenditures of the company are being made only in accordance with authorizations of management and directors of the company; and (3) provide reasonable assurance regarding prevention or timely detection of unauthorized acquisition, use, or disposition of the company’s assets that could have a material effect on the financial statements.
Because of its inherent limitations, internal control over financial reporting may not prevent or detect misstatements. Also, projections of any evaluation of effectiveness to future periods are subject to the risk that controls may become inadequate because of changes in conditions, or that the degree of compliance with the policies or procedures may deteriorate. In our opinion, Medical Action Industries Inc. and subsidiaries maintained, in all material respects, effective internal control over financial reporting as of March 31, 2010, based on criteria established in Internal Control – Integrated Framework issued by COSO.
We also have audited, in accordance with the standards of the Public Company Accounting Oversight Board (United States), the consolidated balance sheets of Medical Action Industries Inc. and subsidiaries as of March 31, 2010 and 2009, and the related consolidated statements of operations, shareholders’ equity, and cash flows for each of the three years in the period ended March 31, 2010, and our report dated June 2, 2010 expressed an unqualified opinion on those consolidated financial statements and includes an explanatory paragraph relating to the Company’s adoption of new accounting guidance related to the accounting for uncertainty in income taxes effective April 1, 2007.
New York, New York
June 2, 2010
68
Table of Contents
ITEM 10 – DIRECTORS AND EXECUTIVE OFFICERS OF THE REGISTRANT
The following is a list of the names and ages of all of our directors and executive officers, including all positions and offices they hold with the Company as of June 2, 2010. The Company’s Certificate of Incorporation provides that the board of directors shall consist from between three and eleven members, as determined from time to time by the board, divided into three classes as nearly equal in number as possible. Our executive officers hold office at the pleasure of the board of directors.
| Name |
Age | Position | ||
| Paul D. Meringolo |
52 | Chairman of the Board (Chief Executive Officer and President) | ||
| Eric Liu |
50 | Vice President of Operations | ||
| Charles L. Kelly, Jr. |
50 | Chief Financial Officer | ||
| Henry A. Berling |
67 | Director | ||
| William W. Burke |
51 | Director | ||
| Kenneth W. Davidson |
63 | Director | ||
| Kenneth R. Newsome |
50 | Director | ||
Paul D. Meringolo, a director and Chairman of the Board and Chief Executive Officer of the Company since October 1997, has been employed by the Company for more than the past twenty years in various executive positions. He also serves the Company as President (since November 1992), and previously held the position of Vice President of Operations from March 1989 to October 1991 and Senior Vice President (Chief Operating Officer) from October 1991 to November 1992.
Mr. Eric Liu, has been employed by the Company for more than the past ten years in various positions relating to the international procurement of raw materials and the manufacture of certain of the Company’s products. Mr. Liu was appointed Vice President of Operations in April 2008 and from May 2005 until April 2008 he served as Vice President of International Operations and Global Development. For more than the five years prior thereto Mr. Liu was Vice President of International Operations. Mr. Liu received a Bachelor of Science degree from The National Taiwan Marine University and a Master of Science degree in Transportation Management from the State University of New York.
Mr. Charles L. Kelly, Jr. was appointed the Company’s Chief Financial Officer in April 2008 and has 25 years of finance and public accounting experience. Prior to joining Medical Action, Mr. Kelly was employed by Chem RX Corporation, an institutional pharmacy serving long-term care facilities, serving as Chief Financial Officer from August 2006 to March 2008. Prior to his position at Chem RX, Mr. Kelly was employed by Spotless Group Ltd., an international provider of industrial and governmental support services and provider of injection molded products and related services to U.S. and European based retailers, serving as Senior Vice President of U.S. Operations (Retailer Services Division) from November 2003 to June 2006 and as Global Vice President of Finance and Administration (Retailer Services Division) from April 1995 through June 2006. Mr. Kelly also worked for several years in the audit department of PriceWaterhouseCoopers. Mr. Kelly holds a B.S. degree in Accounting from State University of New York, Albany and is a member of the New York State Society of Certified Public Accountants and American Institute of Certified Public Accountants.
Henry A. Berling, a director since August 2005, retired on December 31, 2004 as Executive Vice President after 38 years with Owens & Minor, Inc., a publicly traded Fortune 500 supply-chain solutions company and a leading distributor of name-brand medical and surgical supplies. From 1995 to 2002 Mr. Berling served as Executive Vice President, Partnership Development. Prior to 1995, he served Owens & Minor, Inc. in various positions, including Executive Vice President, Sales and Customer Development and Senior Vice President, Sales and Marketing. Mr. Berling was a member of the Owens & Minor Board of Directors from 1998 to 2005. For more than the past three years, Owens & Minor, Inc. has been the Company’s largest distributor.
69
Table of Contents
Mr. William W. Burke has served as a director since 2004 and as chairman of the audit committee since 2005. He currently serves as Executive Vice President & Chief Financial Officer of IDev Technologies, an innovator and developer of next generation medical devices for use in the interventional radiology, vascular surgery and cardiology device marketplace. In 2009, he served as a consultant to and President of Emergent Technologies. From 2004 through 2007, he served as Executive Vice President & Chief Financial Officer of ReAble Therapeutics. ReAble was sold to The Blackstone Group in a going private transaction in 2006 and acquired by DJO Incorporated in late 2007. Subsequent to the completion of the transaction with DJO, Mr. Burke served as a consultant to Blackstone/DJO. From 2001 to 2004, Mr. Burke served as Chief Financial Officer of Cholestech Corporation. From 1985 to 2001, he was employed by several firms as a senior investment banker with a primary focus on medical technology companies. Mr. Burke also serves as a member of the board of directors of Aperio Technologies. He received his B.A. degree in Finance from the University of Texas at Austin and his M.B.A. from the University of Pennsylvania’s Wharton Graduate Business School.
Mr. Kenneth W. Davidson, a director of the company since August 2008 retired on December 31, 2008 as Chairman of the Board of Directors of DJO LLP. DJO is a global provider of high-quality, orthopedic devices, with a broad range of products used for rehabilitation, pain management and physical therapy with approximately $1 billion in revenues. Prior to DJO, Mr. Davidson served as a Chief Executive Officer, President of ReAble Therapeutics, Inc., a Blackstone portfolio company, and as Chairman, President and CEO of Encore Medical (ReAble’s predecessor), a publicly held orthopedic company since October 2000. Mr. Davidson served as Chairman, President and CEO of Maxxim Medical, Inc., a publicly-held medical supply company, from 1986 to July 2000. Previously, Mr. Davidson held various positions with Intermedics, Inc. a pacemaker equipment manufacturer, Baxter Laboratories, a publicly-held health care product and service company, and Merck & Co., a human and animal health care product company. He also serves as a member of the Board of Directors of Clearant, Inc., a biotechnology company that has developed a process that reduces bacteria and viruses in biological products, while maintaining the functionality of the underlying tissue implant or protein.
Mr. Kenneth Newsome, a director of the Company since August 2006, has been President and CEO of AMF Automation Technologies, Inc., a privately held manufacturer of wholesale bread and baking equipment since 1996. With approximately 300 employees worldwide, AMF has completed seven acquisitions to date. For more than the four years prior thereto, Mr. Newsome held various executive positions, including Chief Operating Officer of MedSurg Industries, which was acquired by Isolyser Healthcare, which is now known as Microtek Medical Inc., a publicly traded medical products company. Mr. Newsome holds a Bachelors of Science degree in Finance from the University of Virginia – McIntire School of Commerce and a Masters of Business Administration degree from the University of Virginia – Darden School of Graduate Business Administration.
Audit Committee
The Audit Committee assists the Board in its oversight of the integrity of the Company’s financial statements, legal and regulatory compliance, the independent auditor’s qualifications and independence, and the performance of the Company’s internal audit function and of the independent auditors. The Audit Committee recommends for approval by the Stockholders, a firm of independent certified public accountants whose duty is to examine the Company’s financial statements. The Audit Committee has the sole authority and responsibility to appoint, subject to stockholder approval, compensate and oversee the independent auditors, and to pre-approve all engagements, fees and terms for audit and other services provided by the Company’s independent auditors. The independent auditors are accountable to the Audit Committee. Mr. Burke is Chair of the Audit Committee and is the “audit committee financial expert” as defined by applicable SEC rules.
70
Table of Contents
Compensation Committee
The Compensation Committee assists the Board in discharging its responsibilities with regard to executive compensation and oversight of the general compensation philosophy of the Company and prepares a report on executive compensation to the Company’s stockholders. It is responsible for reviewing and approving the objectives, evaluating the performance, and reviewing and recommending the compensation of the Chief Executive Officer to the Board. The Compensation Committee also administers the Company’s stock option plans. Mr. Berling is Chair of the Compensation Committee.
Nominating and Governance Committee
The Nominating and Governance Committee assists the Board in identifying individuals qualified to become directors under criteria approved by the Board. The committee recommends to the Board the number and names of persons to be proposed by the Board for election as directors at the annual general meeting of stockholders and may also recommend to the Board persons to be appointed by the Board or to be elected by the stockholders to fill any vacancies which occur on the Board. The Nominating and Governance Committee is responsible for periodically reviewing director compensation and benefits, reviewing corporate governance trends, and recommending to the Board any improvements to the Company’s corporate governance guidelines as it deems appropriate. The Nominating and Governance Committee also recommends directors to serve on and to chair the Board Committees and leads the Board’s appraisal process. Mr. Wengrover is Chair of the Nominating and Governance Committee.
Director Compensation
Directors’ Fees. Non-employee Directors receive a $1,000 monthly retainer, a $1,000 fee for each board meeting they attend, and a $500 fee for each telephonic Board Meeting they attend. Non-employee Directors also receive a $500 fee for each Committee Meeting they attend that is on the same day as a regular Board meeting (with the exception of the Chairman of each Committee who receives $1,000). For such Committee meetings that non-employee Directors attend that are not on the same day as a regular Board meeting, they receive a $1,000 fee for each meeting (with the exception of the Chairman of each Committee who receives $2,000). For telephonic Committee meetings that non-employee Directors attend, they receive a $500 fee for each meeting (with the exception of the Chairman of each Committee who receives $1,000).
Stock Options. In August 1996, stockholders approved the 1996 Non-Employee Directors Stock Option Plan, under which all Directors who are not also employees of the Company will be automatically granted each year at the Annual Meeting of Stockholders options to purchase 7,500 shares at the fair market value of the Company’s Common Stock on the date of grant. All options are exercisable from the date of grant.
ITEM 11 – EXECUTIVE COMPENSATION
See information under the caption “Compensation Discussion and Analysis” in the Company’s Proxy Statement, which information is incorporated herein by reference.
ITEM 12 – SECURITY OWNERSHIP OF CERTAIN BENEFICIAL OWNERS AND MANAGEMENT
See the information under the caption “Stock Ownership Information” in the Company’s Proxy Statement, which information is incorporated herein by reference.
ITEM 13 – CERTAIN RELATIONSHIPS AND RELATED TRANSACTIONS
See the information under the caption “Certain Relationships and Related Transactions” in the Company’s Proxy Statement, which information is incorporated herein by reference.
71
Table of Contents
ITEM 14 – PRINCIPAL ACCOUNTING FEES AND SERVICES
See the information under the caption “Ratification of Independent Certified Registered Public Accounting Firm” in the Company’s Proxy Statement, which information is incorporated herein by reference.
Those items which are incorporated by reference to the Company’s definitive Proxy Statement relating to the Annual Meeting of Stockholders is scheduled to be held on August 12, 2010. The definitive Proxy Statement will be filed with the Commission not later than 120 days after March 31, 2010, pursuant to Regulation 14A of the Securities Exchange Act of 1934, as amended.
72
Table of Contents
ITEM 15 – EXHIBITS AND FINANCIAL STATEMENT SCHEDULES
(a) (1) The following financial statements are included in Item 7 of this report:
(a) (2) The following Supplemental Schedule is included in this report:
| S-1 |
All other schedules are omitted because they are not required, not applicable or the information is included in the financial statements or notes thereto.
(a) (3) Exhibits:
| Exhibit No. |
||||
| 2.1 | Agreement and Plan of Reorganization dated as of August 12, 1994 among Registrant, QuanTech Acquisition Corp. and QuanTech, Inc. (Exhibit 2.1 to the Company’s Annual Report on Form 10-K for the year ended March 31, 1995). | |||
| 2.2 | Purchase Agreement dated as of January 30, 1996 among Registrant, SBW Acquisition Corp., Lawson Mardon Medical Products, Inc. and Lawson Mardon Medical Products, a trading division of Lawson Mardon Packaging UK Ltd. (Exhibit 2 to the Company’s Current Report on Form 8-K dated February 6, 1996). | |||
| 2.3 | Asset Purchase Agreement dated as of March 9, 1999 between Acme United Corporation and Registrant (Exhibit 2 to the Company’s Current Report on Form 8-K dated April 1, 1999). | |||
| 2.4 | Asset Purchase Agreement dated as of October 3, 2001 between Medi-Flex Hospital Products, Inc. and Registrant (Exhibit 2 to the Company’s Current Report on Form 8-K dated November 30, 2001). | |||
| 2.5 | Asset Purchase Agreement dated as of May 9, 2002 between MD Industries Acquisition LLC and Registrant (Exhibit 2 to the Company’s current report on Form 8-K dated June 21, 2002). | |||
| 2.6 | Asset Purchase Agreement dated as of August 30, 2002, between Maxxim Medical, Inc. and Registrant (Exhibit 2 to the Company’s current report on Form 8-K dated October 25, 2002. | |||
| 2.7 | Membership Interest Purchase Agreement dated as of October 17, 2006 among Registrant, Medegen Holdings, LLC; Medegen Medical Products, LLC; Medegen Newco, LLC; and MAI Acquisition Corp. (Exhibit 2 to the Company’s Current Report on Form 8-K dated October 18, 2006). | |||
| 3.1 | Certificate of Incorporation, as amended. (Exhibit 3.1 to the Company’s Annual Report on Form 10-K for the year ended March 31, 2002) | |||
| 3.2 | By-Laws, as amended (Exhibit 3(b) to the Company’s Annual Report on Form 10-K for the year ended March 31, 1988). | |||
73
Table of Contents
| Exhibit No. |
||||
| 10.1+ | 1996 Non-Employee Director Stock Option Plan, as amended (Exhibit 10.1 to the Company’s Annual Report on Form 10-K for the year ended March 31, 2007) | |||
| 10.2+ | 1989 Non-Qualified Stock Option Plan, as amended (Exhibit 10.2 to the Company’s Annual Report on Form 10-K for the year ended March 31, 2007) | |||
| 10.3+ | 1994 Stock Incentive Plan, as amended (Exhibit 10.3 to the Company’s Annual Report on Form 10-K for the year ended March 31, 2007) | |||
| 10.4+ | Employment Agreement dated as of February 1, 1993 between the Registrant and Paul D. Meringolo (Exhibit 10.4 to the Company’s Annual Report on Form 10-K for the year ended March 31, 1993). | |||
| 10.5 | Modification Agreement dated as of June 3, 2003 between the Registrant and Paul D. Meringolo (Exhibit 10 to the Company’s current report on Form 8-K dated June 3, 2003). | |||
| 10.6 | Letter Agreement dated as of April 13, 2007 between Registrant and Paul D. Meringolo (Exhibit 10 to the Company’s current report on Form 8-K dated April 13, 2007). | |||
| 10.7+ | Change in Control Agreement dated as of June 1, 1995 between the Registrant and certain executive officers (Exhibit 10.8 to the Company’s Annual Report on Form 10-K for the year ended March 31, 1995). | |||
| 13.1 | Annual Report to Stockholders for the year ended March 31, 2010* | |||
| 23.1* | Consent of Registered Independent Public Accounting Firm | |||
| 31.1* | Certification of Principal Executive Officer of Medical Action Industries Inc., as required by Rule 13a – 14(a) of the Securities Exchange Act of 1934. | |||
| 31.2* | Certification of Principal Financial Officer of Medical Action Industries Inc., as required by Rule 13a – 14(a) of the Securities Exchange Act of 1934. | |||
| 32.1*# | Certification of Chief Executive Officer and Chief Financial Officer of Medical Action Industries Inc., pursuant to 18 U.S.C. §1350. | |||
| 99.1* | Additional Exhibit – Undertakings | |||
With the exception of the aforementioned information incorporated by reference in this Annual Report on Form 10-K, the Company’s Annual Report to Stockholders for the year ended March 31, 2010 is not to be deemed “filed” as part of this report.
| * | Filed herewith |
| + | Identifies management contracts and compensatory plans and arrangements |
| # | Not considered to be “filed” for the purposes of Section 18 of the Securities Exchange Act of 1934, or otherwise subject to the liabilities of that section |
74
Table of Contents
Pursuant to the requirements of Section 13 or 15(d) of the Securities Exchange Act of 1934, the Company has duly caused this report to be signed on its behalf by the undersigned, thereunto duly authorized on this 2nd day of June, 2010.
MEDICAL ACTION INDUSTRIES INC.
| By: | /s/ Paul D. Meringolo | |
| Paul D. Meringolo | ||
| Chairman of the Board | ||
| Chief Executive Officer and President | ||
Pursuant to the requirements of the Securities Exchange Act of 1934, this report has been signed below on June 2, 2010 by the following persons in the capacities indicated:
| /s/ Paul D. Meringolo Paul D. Meringolo |
Chairman of the Board Chief Executive Officer, President | |
| /s/ Charles L. Kelly Jr. Charles L. Kelly, Jr. |
Chief Financial Officer Corporate Secretary | |
| /s/ Henry A. Berling Henry A. Berling |
Director | |
| /s/ William W. Burke William W. Burke |
Director | |
| /s/ Kenneth W. Davidson Kenneth W. Davidson |
Director | |
| /s/ Kenneth R. Newsome Kenneth R. Newsome |
Director | |
75
Table of Contents
REPORT OF INDEPENDENT REGISTERED PUBLIC
ACCOUNTING FIRM ON SCHEDULE
Board of Directors and Shareholders
Medical Action Industries Inc.
We have audited in accordance with the standards of the Public Company Accounting Oversight Board (United States) the consolidated financial statements of Medical Action Industries Inc. and subsidiaries (the “Company”) referred to in our report dated June 2, 2010, which is included in the annual report to security holders and included in Item 8 of this Form 10-K. Our report on the consolidated financial statements includes an explanatory paragraph relating to the Company’s adoption of new accounting guidance related to the accounting for uncertainty in income taxes effective April 1, 2007. Our audits of the basic financial statements included the financial statement scheduled listed in the index appearing under Item 15(a)(2), which is the responsibility of the Company’s management. In our opinion, this financial statement schedule, when considered in relation to the basic financial statements taken as a whole, presents fairly, in all material respects, the information set forth therein.
New York, New York
June 2, 2010
76
Table of Contents
MEDICAL ACTION INDUSTRIES, INC
VALUATION AND QUALIFYING ACCOUNTS
Fiscal Years Ended March 31, 2010, 2009 and 2008
| Description |
Balance at Beginning of Year |
Gross Amount Charged to Costs and Expenses |
Charged to Other Accounts |
Other Charges / (Deductions) |
Balance at End of Year | ||||||||||||
| Year Ended March 31, 2010 |
|||||||||||||||||
| Allowance for doubtful accounts |
$ | 663 | $ | 72 | $ | — | $ | (76 | )(a) | $ | 659 | ||||||
| Reserve for slow moving and obsolete inventory |
1,502 | 510 | — | (472 | )(b) | 1,540 | |||||||||||
| $ | 2,165 | $ | 582 | $ | — | $ | (548 | ) | $ | 2,199 | |||||||
| Year Ended March 31, 2009 |
|||||||||||||||||
| Allowance for doubtful accounts |
$ | 585 | $ | 72 | $ | — | $ | 6 | $ | 663 | |||||||
| Reserve for slow moving and obsolete inventory |
891 | 1,069 | — | (458 | )(b) | 1,502 | |||||||||||
| $ | 1,476 | $ | 1,141 | $ | — | $ | (452 | ) | $ | 2,165 | |||||||
| Year Ended March 31, 2008 |
|||||||||||||||||
| Allowance for doubtful accounts |
$ | 537 | $ | 86 | $ | — | $ | (38 | )(a) | $ | 585 | ||||||
| Reserve for slow moving and obsolete inventory |
664 | 402 | — | (175 | )(b) | 891 | |||||||||||
| $ | 1,201 | $ | 488 | $ | — | $ | (213 | ) | $ | 1,476 | |||||||
| (a) | Write off of uncollected accounts |
| (b) | Disposal of slow moving and obsolete inventory |
S-1
Table of Contents
SECURITIES AND EXCHANGE COMMISSION
Washington, D.C. 20549
FORM 10-K
ANNUAL REPORT PURSUANT TO SECTION 13 OR 15(d)
OF THE SECURITIES EXCHANGE ACT OF 1934
FOR THE FISCAL YEAR ENDED March 31, 2010
MEDICAL ACTION INDUSTRIES INC.
(Exact name of registrant as specified in its charter)
Table of Contents
EXHIBIT INDEX
Exhibit No.
| 23.1 | Consent of Registered Independent Public Accounting Firm |
| 31.1 | Certification of Principal Executive Officer of Medical Action Industries Inc., as required by Rule 13a –14(a) of the Securities Exchange Act of 1934. |
| 31.2 | Certification of Principal Financial Officer of Medical Action Industries Inc., as required by Rule 13a –14(a) of the Securities Exchange Act of 1934. |
| 32.1 | Certification of Chief Executive Officer and Chief Financial Officer of Medical Action Industries Inc., pursuant to 18 U.S.C. §1350. |
| 99.1 | Additional Exhibit – Undertakings |
Table of Contents
Table of Contents

Table of Contents
Table of Contents
Table of Contents
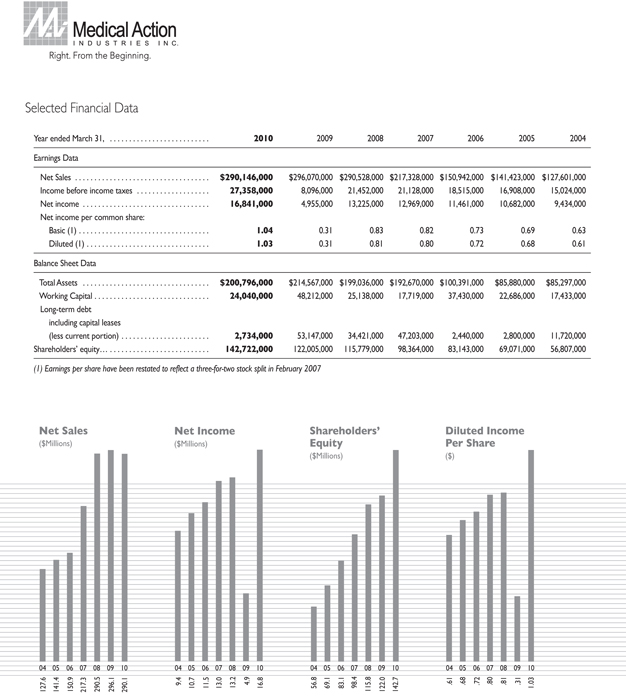
Table of Contents

Table of Contents