Attached files
Table of Contents
UNITED STATES
SECURITIES AND EXCHANGE COMMISSION
Washington, D.C. 20549
FORM 10-K
| x | Annual Report pursuant to Section 13 or 15(d) of the Securities Exchange Act of 1934 |
For the Fiscal Year ended March 31, 2012
| ¨ | Transition Report pursuant to Section 13 or 15(d) of the Securities Exchange Act of 1934 |
For the transition period to
Commission File No. 0-13251
MEDICAL ACTION INDUSTRIES INC.
(Exact name of registrant as specified in its charter)
| Delaware | 11-2421849 | |
| (State or other jurisdiction of incorporation or organization) |
(I.R.S. Employer Identification No.) | |
| 500 Expressway Drive South, Brentwood, New York | 11717 | |
| (Address of Principal Executive Office) | (Zip Code) | |
Registrant’s telephone number, including area code: (631) 231-4600
Securities registered pursuant to Section 12(b) of the Act: None
Securities registered pursuant to Section 12(g) of the Act: Common Stock, $.001 par value
Indicate by check mark if the registrant is a well-known seasoned issuer, as defined in Rule 405 of the Securities Act. Yes ¨ No x
Indicate by check mark if the registrant is not required to file reports pursuant to Section 13 or Section 15(d) of the Act. Yes ¨ No x
Indicate by check mark whether the registrant (1) has filed all reports required to be filed by Section 13 or 15(d) of the Securities Exchange Act of 1934 during the preceding 12 months (or for such shorter period that the registrant was required to file such reports), and (2) has been subject to such filing requirements for the past 90 days. Yes x No ¨
Indicate by check mark if disclosure of delinquent filers pursuant to Item 405 of Regulation S-K is not contained herein, and will not be contained, to the best of registrant’s knowledge, in definitive proxy or information statements incorporated by reference in Part III of this Form 10-K or any amendment to this Form 10-K x.
Indicate by check mark whether the registrant has submitted electronically and posted on its corporate Website, if any, every Interactive Data File required to be submitted and posted pursuant to Rule 405 of Regulation S-T during the preceding 12 months (or for such shorter period that the registrant was required to submit and post such files). Yes x No ¨
Indicate by check mark whether the registrant is a large accelerated filer, an accelerated filer, or a non-accelerated filer. See definition of “accelerated filer and large accelerated filer” in Rule 12-b of the Exchange Act. (Check one):
Large accelerated filer ¨ Accelerated filer x Non-accelerated filer ¨ Smaller reporting company ¨
Indicate by check mark whether the registrant is a shell company (as defined in Rule 12b-2 of the Exchange Act). Yes ¨ No x
The aggregate market value of the registrant’s Common Stock held by nonaffiliates of the registrant as of September 30, 2011, the last business day of registrant’s most recently completed second quarter, was approximately $76,707,000. Shares of Common Stock held by each officer and director of the registrant and by each person who may be deemed to be an affiliate have been excluded.
As of June 14, 2012, 16,390,628 shares of the registrant’s Common Stock were outstanding.
DOCUMENTS INCORPORATED BY REFERENCE
Portions of the Proxy Statement for registrant’s 2012 Annual Meeting to be filed pursuant to Regulation 14A within 120 days following registrant’s fiscal year ended March 31, 2012, are incorporated by reference into Part III of this Report.
Table of Contents
Table of Contents
Unless otherwise indicated in this report, “Medical Action”, the “Company,” and similar terms refer to Medical Action Industries Inc. and its subsidiaries unless context requires otherwise.
DISCLOSURE REGARDING FORWARD-LOOKING STATEMENTS
This Report includes “forward-looking statements” within the meaning of Section 27A of the Securities Act of 1933, as amended (the “Securities Act”), and Section 21E of the Securities Exchange Act of 1934, as amended (the “Exchange Act”). All statements other than statements of historical fact are “forward-looking statements” for purposes of these provisions, including any projections of earnings, revenues or other financial items, any statements of the plans and objectives for management for future operations, any statements concerning proposed new products or services, any statements regarding future economic conditions or performance, and any statements of assumptions underlying any of the foregoing. All forward-looking statements included in this report are made as of the date hereof and are based on information available to us as of such date. We assume no obligation to update any forward-looking statement. In some cases, forward-looking statements can be identified by the use of terminology such as “may,” “will,” “expects,” “plans,” “anticipates,” “intends,” “believes,” “estimates,” “potential,” or “continue,” or the negative thereof or other comparable terminology. Although we believe that the expectations reflected in the forward-looking statements contained herein are reasonable, there can be no assurance that such expectations or any of the forward-looking statements will prove to be correct, and actual results could differ materially from those projected or assumed in the forward-looking statements. Future financial condition and results of operations, as well as any forward-looking statements, are subject to inherent risks and uncertainties, including manufacturing inefficiencies, termination or interruption of relationships with our suppliers, potential delays in obtaining regulatory approvals, product recalls, product liability claims, our inability to successfully manage growth through acquisitions, our failure to comply with governing regulations, risks of international procurement of raw materials and finished goods, market acceptance of our products, market price of our Common Stock, foreign currency fluctuations, resin volatility and other factors referred to in our press releases and reports filed with the Securities and Exchange Commission (the “SEC”). All subsequent forward-looking statements attributable to us or persons acting on our behalf are expressly qualified in their entirety by these cautionary statements. Additional factors that may have a direct bearing on our operating results are described under Item 1A – RISK FACTORS.
All amounts presented in this document are in thousands, except share and per share data.
Company Background
Medical Action Industries Inc. (the “Company,” “Medical Action,” “we” or “us”) develops, manufactures, markets and supplies a variety of disposable medical products. Our products are found in almost every hospital in the United States. As reflected in our mission statement, we are “committed to being the trusted partner, delivering innovative solutions to the healthcare community for the purpose of improving quality care and enhancing the patient experience.” We operate in one segment, which is the manufacture and supply of disposable medical products. Our product portfolio includes custom procedure trays, minor procedure kits and trays, operating room disposables and sterilization products, patient bedside products, containment systems for medical waste and laboratory products. Our products are marketed primarily to acute care facilities throughout the United States and certain international markets by our direct sales personnel and extensive network of health care distributors. Medical Action has entered into preferred vendor agreements with national and regional distributors, as well as sole and multi-source agreements with group purchasing organizations. We also offer original equipment manufacturer (“OEM”) products under private label programs to supply chain partners and medical suppliers. Over the past years Medical Action has expanded our end user markets to include physician, dental and veterinary offices, outpatient surgery centers, long-term care facilities and laboratories. Medical
1
Table of Contents
Action’s manufacturing, packaging and warehousing activities are conducted in its Arden, North Carolina, Clarksburg, West Virginia, Gallaway, Tennessee, and Toano, Virginia facilities. The Company’s procurement of certain products and raw materials from the People’s Republic of China is administered by our office in Shanghai, China.
Headquartered in Brentwood, NY, Medical Action was incorporated in New York in 1977, and was reincorporated in Delaware in 1987.
In August 2010, Medical Action acquired AVID Medical, Inc. (“AVID”) via a merger (the “Merger”). AVID was founded in 1998. As a leading provider of custom procedure trays to the healthcare industry, AVID is recognized as a provider of high quality products and services with a core focus on customer satisfaction. AVID conducts its operations from a 185,000 square foot facility located in Toano, Virginia.
Pursuant to the Merger, the stockholders of AVID received $62,500 in cash for all the issued and outstanding common stock of AVID, subject to certain adjustments, including the payment of certain transaction costs and for any outstanding indebtedness of AVID. Medical Action financed the Merger through our Prior Credit Agreement dated as of August 27, 2010.
GENERAL
Our Company’s strategy is to allocate our resources on increasing market share with current customers, entering new markets with existing product lines, including alternate care, physician, veterinary and dental markets; accelerate the internal development of new products for existing markets; pursue acquisitions that complement existing product lines; introduce products into the international marketplace and increase productivity by maximizing the utilization of existing facilities.
Since 1994, the Company has engaged in an active acquisition program and completed eleven transactions. Our most recent acquisitions include:
| • | The acquisition of AVID in August 2010 for $62,500 in cash. AVID assembles custom procedure trays, principally for use in acute care facilities and surgi-centers in a 185,000 square foot facility located in Toano, Virginia. We believe the domestic market for custom procedure trays to be approximately $2.0 billion. |
| • | The acquisition of Medegen Medical Products, LLC (“Medegen” or “MMP”), in October 2006 for $80,500 in cash. Medegen manufactures and supplies a line of patient bedside utensils, operating room products, laboratory products and urology products from a 265,000 square foot facility located in Gallaway, Tennessee. We believe that Medegen has a market leading position in each of its product line offerings. |
The Company has funded the acquisitions through our credit facilities and through cash generated from operations.
In the near term the Company is focused on generating organic revenue growth, reducing debt and increasing gross profits. We continually monitor the market for acquisition candidates.
PRODUCTS
The Company’s products are divided into the following markets and product categories:
2
Table of Contents
The following table sets forth net sales by market for fiscal years 2012, 2011 and 2010:
| Fiscal 2012 | Increase (decrease) compared to prior year |
Fiscal 2011 | Increase (decrease) compared to prior year |
Fiscal 2010 | ||||||||||||||||
| Clinical Care Market Sales |
$ | 272,917 | $ | 67,977 | $ | 204,940 | $ | 57,588 | $ | 147,352 | ||||||||||
| Patient Care Market Sales |
178,709 | 9,898 | 168,811 | 19,180 | 149,631 | |||||||||||||||
| Sales Related Adjustments |
(14,305 | ) | (3,048 | ) | (11,257 | ) | (4,420 | ) | (6,837 | ) | ||||||||||
|
|
|
|
|
|
|
|
|
|
|
|||||||||||
| Total Net Sales |
$ | 437,321 | $ | 74,827 | $ | 362,494 | $ | 72,348 | $ | 290,146 | ||||||||||
|
|
|
|
|
|
|
|
|
|
|
|||||||||||
Within each product category are multiple product lines that have either been internally developed or acquired, as set forth below:
CLINICAL CARE MARKET
Custom Procedure Trays
Minor Procedure Kits and Trays
Operating Room Disposables and Sterilization Products
Dressings and Surgical Sponges
3
Table of Contents
PATIENT CARE MARKET
Patient Bedside Products
Containment Systems for Medical Waste
Laboratory Products
The following paragraphs contain a brief description of, and provide other information regarding, Medical Action’s key products:
Custom Procedure Trays
We assemble disposable custom procedure trays for acute care hospitals and Integrated Delivery Networks (“IDNs”), free standing surgery centers, government hospitals and medical treatment centers, and organ and tissue procurement agencies. Our custom procedure trays are utilized in all areas of the hospital including; Surgery, Labor & Delivery, Cath Labs, Radiology, Robotics and Special Procedures. As the third largest supplier of custom procedure trays in the industry, we have the ability to manufacture an unlimited array of trays including but not limited to; custom anesthesia and wound care trays, cardiac, gynecologic, lap gastric, orthopedic, tissue procurement, transplant, trauma and urology trays. In addition, we are an innovator in the manufacture of robotic procedure trays which further includes a proprietary custom robotics patient drape. We offer a complete line of standard tray configurations in addition to custom configurations.
4
Table of Contents
Patient Bedside Products
Wash Basins – Used in both hospital in-patient setting, as well as in nursing homes and other long term convalescent care applications, polypropylene wash basins come in a range of sizes and colors. Wash basins are available in single patient/disposable, autoclavable plastic, and stainless steel designs.
Bedpans – For immobile patients, bedpans come in conventional, over the commode seat, stackable and pontoon styles. Polypropylene bedpans come in a range of sizes and colors. Bedpans are available in single patient/disposable, autoclavable plastic, and stainless steel designs.
Pitchers & Carafes – Pitchers and carafes are primarily injection molded from durable polypropylene and include ice guards, cup covers, hinged lids, and graduations. Additional accessories or options include plastic and foam liners, foam jackets, assembled pitcher-liner-jacket sets which provide for additional insulation and quick replenishment. Pitchers and carafes are available in single patient/disposable, autoclavable plastic, and stainless steel designs.
Urinals – For immobile patients urinals are made in a variety of designs. Differing versions accommodate male and female anatomy. Urinals are made from translucent polyethylene which facilitates measuring and visualizing contents. Urinals are graduated in 25 cc and 1 oz. increments up to 1,000 cc's. Urinals are available in single patient/disposable, autoclavable plastic, and stainless steel designs.
Emesis Basins – Emesis basins are utilized in many health care settings and are used for containing fluids and tissues, measuring output, instrument passing, and routine oral care. Emesis Basins are available in single patient/disposable, autoclavable plastic, and stainless steel designs in sizes ranging from 400 cc to 1700 cc sizes.
Surgical Headwear and Shoe Covers – Worn by operating room and other critical care personnel these items prevent contamination of sterile and clean environments from dust and other contaminants as well as protection of health care worker apparel. Bouffant caps made of lightweight spunbond polypropylene and surgeon’s caps made of Kaycel are comfortable and absorbent. Shoe covers are made of durable polypropylene and are available with a skid resistant coating.
Isolation Gowns – The Company’s line of disposable isolation gowns are used to prevent contamination of health care worker apparel during a variety of medical procedures. They are available in yellow fluid resistant spunbond cloth and impervious poly coated spunbond configurations.
Sterilization Pouches – Used to house instruments during the sterilization process and maintain sterility of the instrument until it is needed. The pouches are primarily used in hospital central supply, operating rooms and in physicians' and dentists' offices as well as in any environment where sterile instruments are needed. There are three different styles of pouches available – self seal, heat seal and rolls. The self seal is already sealed on three sides and includes a peel back adhesive strip on the bottom of the package, which when folded over will seal the package. The second type is heat seal, which is also sealed on three sides but needs a heat sealer to seal the fourth side. The Company also markets a roll product, where the user can pull as long a pouch as needed and then seal each end of the pouch.
Sterilization Monitoring Products – These are printed paper and chemical devices used to measure certain necessary parameters within a sterilization cycle. Predominate users include the hospital operating room which often houses steam sterilization units for unanticipated needs while cases are in progress, and the central sterile department which cleans, packages and sterilizes the bulk of reusable surgical supplies.
| Indicators: | measures the presence of Ethylene Oxide (“ETO”) or steam and temperature | |
| Integrators: | a technology that gives a better assurance than traditional indicators that the proper parameters of sterilization were fulfilled, including time, temperature and moisture. | |
| Bowie Dick Test Pack: | tests for residual air left in an autoclave from air leaks, insufficient vacuum or poor steam quality. | |
5
Table of Contents
Prior to sterilization, indicators and integrators are placed inside of the packaged products and sterilization pouches which are then distributed and used throughout the hospital, clinic or physician office environment.
Patient Aids – These products are used to assist the mobility of patients after injury, surgery, or to increase mobility of the elderly patient population. These devices are primarily fitted and dispensed in the hospital, surgery center and physician office setting.
Crutches – Lightweight aluminum adjustable patient crutches complete with tips and pads. Push-button adjustable foot piece for fast, precise measuring and fitting. Offered in a full range of sizes – child, youth, adult, and tall adult. Used to assist mobility in the event of a leg, foot or ankle injury.
Walkers – Lightweight, high strength aluminum patient walkers. Contoured PVC handgrips for comfort and rubber tips for traction. They are available in a 1-button, 2-button, and a wheeled version that facilitates folding of the walkers for easy utilization, storage and transport. Used to assist patient mobility for both the short and long term.
Canes – Lightweight, high strength aluminum patient canes that are fully height adjustable from 30” to 39” in 1” increments. PVC handgrip for comfort and non-slip rubber tip for stability. Used to assist patient mobility for both the short and long term.
Patient Slippers – Skid resistant patient slippers available in a full range of sizes from infant, toddler, youth, to adult (from small to XXL). Color coded by size. Used to prevent slipping and to provide warmth and comfort in both acute care and long-term care market settings.
Minor Procedure Kits and Trays
The Company offers one-time use kits and trays which are used for a wide variety of minor surgical and medical procedures. Kit components are determined by the procedural requirements and may be customized to accommodate individual hospital protocols and preferences. Procedural applications and typical components for the Company’s larger kits segments are as follows:
I.V. Start Kits – One of the most common medical procedures is intravenous administration of fluids and medications usually done through an I.V. catheter or needle which is inserted into a peripheral vein. Since infection at the site of the catheter insertion can become systemic and potentially serious, I.V. start kits are used to insure speed and efficiency of catheter insertion while promoting sound clinical protocol. Typical components include a tourniquet, antiseptic ampule or swab, gauze, surgical tape, and a dressing. For the fiscal years ended March 31, 2012, 2011, and 2010, I.V. start kits accounted for 8%, 9% and 13%, respectively, of the Company’s total net sales.
Central Line Dressing Trays – Central line dressing trays are used to provide cleansing and dressing placement at the site of a central venous catheter, which is typically placed in a vein in the patient’s chest area and is used for the rapid infusion of fluids and medications. Since infection at the site of catheter insertion can become systemic and represents a potentially serious medical complication, central line dressing trays facilitate fast and efficient dressing changes while allowing the clinician to maintain sterile technique. Typical components include an antiseptic ampule or swabs, gloves, gauze tape and a transparent dressing. The Company’s central line dressing trays are currently marketed under the ActaSept™ and Cepti-Seal® brands. For the fiscal years ended March 31, 2012, 2011 and 2010, central line dressing trays accounted for 5%, 6% and 8%, respectively, of the Company’s total net sales.
Suture Removal Trays – Post procedural suture removal is a medical procedure commonly performed in physicians’ offices, outpatient settings, and hospital emergency rooms amongst other acute and alternate care settings. The procedure requires precise instruments for grasping and cutting fine sutures. Typical suture removal tray components include Littauer scissors, alcohol prep pads, and metal or plastic forceps.
6
Table of Contents
Laceration Trays – Laceration trays are used to facilitate closure of lacerations and other deep wounds. Use is primarily concentrated in hospital emergency rooms although they are sold in both acute and alternate care settings wherever emergency care is provided. Typical components are high quality disposable instruments including needle drivers, forceps, scissors and hemostats, as well as drapes for creation of a sterile field, gauze and syringes and needles for administration of a local anesthetic.
Instruments and Instrument Trays – The Company offers a broad array of high quality disposable needle holders, hemostats, various procedural scissors, scalpels and forceps. These instruments are available in stainless steel, bent wire, and plastic versions. They can be purchased in bulk, packaged sterile as individual instruments, or combined in custom sterile instrument trays.
Containment Systems for Medical Waste
Biohazardous Waste Containment and Autoclave Bags – Various state and federal regulations require that infectious medical waste be collected, stored, transported and disposed of in specifically designed and labeled containers. The Company’s infectious waste collection bags, known as biohazard bags or “red bags” are constructed from high quality resins with reinforced seals for puncture resistance to reduce the risk of leakage. The bags come in a variety of sizes, are red, and are clearly labeled with the international biohazard symbol. Autoclave bags are designed to survive the heat generated in a steam autoclave and are used to contain infectious waste through steam sterilization and disposal.
Non-Infectious Medical Waste Containment Bags – Non-infectious medical waste and trash must be collected, stored, transported and disposed of in a separate waste stream from potentially infectious or biohazardous waste. The Company’s non-infectious medical waste bags come in a variety of sizes, materials, mil thicknesses and seal configurations to isolate the range of non-infectious medical waste generated at health care provider sites from collection to disposal.
Chemotherapy Waste Containment Bags – Waste contaminated with chemotherapeutic agents must be disposed of in a separate waste stream from normal infectious and non-infectious medical waste due to the toxic nature of many of these agents. The Company’s chemotherapy waste containment bags and sharps containers are made of durable plastic resins for the collection and containment of chemo waste through disposal.
Laundry and Linen Containment Systems and Disposable Bags – Infectious and non-infectious reusable laundry and linen must be collected in specifically designed and clearly labeled receptacles and be segregated from the infectious and non-infectious medical waste streams. The Company offers laundry and linen containment systems consisting of hamper style receptacles and disposable laundry and linen receptacle bags for the collection, storage and transportation of infectious and non-infectious laundry and linen.
Laboratory Specimen Transport Bags – Used to collect, transport and contain tissue samples and other patient specimens obtained from examinations, diagnostic, or surgical procedures. The bags feature a specimen compartment and documentation pouch to insure that specimens and paperwork do not become separated during transport.
Patient Belonging Bags – Used to collect, contain and transport patient belongings from admission to discharge. The bags come in a variety of sizes, and thicknesses, and utilize a combination of handle, drawstring closure, and zip closure designs. These bags are often customized with hospital or healthcare facility logos and designs.
Sharps Containment Systems – Various state and federal regulations require that certain infectious medical waste, such as needles and blades, be collected, contained, transported and disposed of in rigid containers. The Company’s sharps containers come in a variety of sizes and configurations and are constructed from high quality resins protecting the public and health care workers from accidental stick injuries and potential transmission of pathogens in blood and body fluids. These containers are designed to be puncture resistant and to have torturous path means of egress once a contaminated device is placed inside.
7
Table of Contents
Equipment Dust Covers – Are used for the protection of hospital equipment which is non-sterile. They provide a dust and dirt barrier for equipment that is stored between procedures.
Operating Room Disposables and Sterilization Products
Disposable Operating Room Towels – The Company’s line of absorbent cotton operating room towels are used during surgery for drying hands, rolled up for propping instruments, on back tables and mayo stands for absorbing fluids, around the incision site for absorbing blood and to allow the surgeon to clip tubing and instruments close to the surgical site during the surgical procedure. Operating room towels are sold in sterile packaging for single (disposable) use and as a non-sterile component to be used with other health care companies' products, primarily surgical pre-packaged procedure trays. For the fiscal years ended March 31, 2012, 2011 and 2010, operating room towels accounted for 6%, 6% and 7%, respectively, of the Company's total net sales.
Surgical Marking Pens – Used for marking the patient’s skin prior to making a surgical incision, as well as to address wrong site, wrong procedure surgery. Specifically designed so that the pen barrel fits comfortably in the surgeon's hand and is made with gentian violet color ink. All pen barrels are embossed with a 5 cm. ruler and may also include a 15 cm. coated ruler and blank labels.
Needle Counters – Red plastic boxes manufactured from medical grade materials designed to resist breakage and punctures. They are produced with a variety of designs, including surgical grade magnets in order to facilitate sharps disposal. The foam blocks and foam strips allow for varying count capacity and designs.
Disposable Surgical Light Handle Covers – Light ShieldsTM – A patented design assures a secure fit and acts as a sterile barrier on surgical light handles in the operating room. Light ShieldsTM are manufactured of a heavy gauge flexible plastic for the optimum assurance of a sterile barrier.
Convenience Kits – The Company offers its customers the ability to purchase multiple products packaged with its needle counters. The Company has the flexibility to package many different kits to individualize a hospital's requirements.
Dressings and Surgical Sponges
Burn Dressings – The Company provides many sizes and varieties of dry burn dressings. Dry burn dressings are composed of multiple layers of folded gauze that are typically customized for individual hospitals as to size, weave, folds, and stitching.
Disposable Laparotomy Sponges – Laparotomy sponges are designed primarily for use during surgical procedures in hospitals and healthcare facilities. They are single use, made of gauze and sold in varying sizes and utilized for a multitude of purposes. Laparotomy sponges cover exposed internal organs, isolating them from the part of the body being operated upon. They also absorb blood and act as a buffer between medical instruments and the skin, thereby reducing trauma to the skin tissue caused by the medical instrument. Laparotomy sponges are sold in sterile packaging or as a non-sterile component to be used with other health care companies’ products, primarily surgical pre-packaged procedure trays. The Company’s laparotomy sponges contain an x-ray detectable element and loop handle in order to facilitate easy counting and identification in the operating room. For the fiscal years ended March 31, 2012, 2011 and 2010, laparotomy sponges accounted for 2%, 2%, and 3% respectively, of the Company’s total net sales.
Specialty Surgical Sponges – The Company’s line of specialty surgical sponges is an extension to its laparotomy sponge product line. They are single use and made of gauze and sold in varying sizes and shapes. The
8
Table of Contents
design of these sponges is tailored to specific surgical applications for which a standard laparotomy sponge is sub-optimal. There are two classifications of specialty surgical sponges:
a) Specialty Sponges for Open Surgical Procedures – including Peanut, Kittner, and Cherry dissecting sponges, used for blunt tissue dissection and fluid absorption, Tonsil Sponges with abdominal tape strings for easy retrieval from narrow body cavities, Stick Sponges used for surgical prepping and fluid absorption in deeper body cavities, and Eye Spears for absorption during eye surgery.
b) Endoscopic Specialty Sponges – including Kittner, Cherry, and Bullet style dissecting sponges. Endoscopic specialty sponges are small sponges affixed to long fiberglass rods and are designed for performing blunt tissue dissection, fluid absorption, and anatomical manipulation through the narrow operating cannulae used in minimally invasive endoscopic surgery.
Gauze Sponges – Gauze sponges are used in the operating room as well as throughout the hospital. They are also used extensively throughout the alternate care market, including physicians' offices, health clinics, and dentists’ offices and in veterinary practices. The Company also introduced gauze fluffs, which are pre-folded gauze sponges used for compression and absorption of blood and other fluids.
Sponge Counting System – The Company’s line of sponge counter bags is designed to facilitate and improve the post-procedural counting of surgical sponges. Peri-operative nursing protocol calls for a systematic count of used and unused sponges and instruments pre and post surgery to insure that foreign bodies are not left in the body cavity. The Company’s sponge counter bags are clear faced opaque backed plastic bags with up to five sponge or ten gauze compartments. The compartments act as fluid receptacles while providing visualization of used sponges for fast and accurate post surgical counting. When used in conjunction with the patented Safe-T-Count™ gloves, the sponge counting procedure is even safer, as it accurately counts five sponges and reduces airborne contamination.
Net, Padding and Wound Care – Includes proprietary Tubegauz® premium brand and SePro® value brand elastic nets, which are tubular bandages used for dressing retention. This category also includes Tubegauz® brand tubular gauze, which is used to bandage fingers, toes, hands, or other areas that require wrapping to bodily contours. Padding products are used as a protective cushioning material for sensitive areas, and are sold in styles that offer unique characteristics such as being mold-resistant, water-repellant or designs for improved air circulation.
Laboratory Products
Petri Dishes – Used in the laboratory, petri dishes are used to culture microorganisms. Economical, optically clear dishes are precision molded from polystyrene to maintain optical quality and controlled flat surfaces so cultures are clearly visible without distortion.
Specimen Containers – Used for the collection and transportation of fluid and tissue samples. Polypropylene specimen containers are available in several sizes and styles including screw top, snap cap, and the patented ClikSeal™ for insuring sample security and leak resistance during collection and transport. A sterility seal, clear and accurate graduations, and patient identification label with mandated Patient ID information are typical features of specimen containers.
Commode Specimen Collectors – Used for the collection of and measurement of stool and urine samples. Injection molded commode collectors fit securely on standard toilets and allow for easy collection and quick visualization, measurement and disposal. Several versions are available that can be sealed for transportation to the laboratory for analysis.
Triangular Graduates – Used for measuring liquid intake or output, triangular graduates are made from either clear polystyrene or translucent polypropylene. The containers are graduated in 25 cc and .5 ounce increments, up to 1000 cc’s and 32 ounces. The triangular style provides measuring ease, visualization of contents and comfortable handling.
9
Table of Contents
Tri-pour Beakers – Used in hospitals, clinics, laboratories and nursing homes for accurate drip-free mixing and/or pouring of liquids utilizing the beaker’s unique three pouring spouts. Tri-pour beakers are made from translucent polypropylene and are resistant to commonly used acids, alkalis, solvents and reagents and are autoclavable. Sizes of the beakers range from 50 ml to 1000 ml and each beaker is graduated in increments of 10, 20 or 50 ml. Paper lids are available for each size of beaker.
Group Purchasing Organizations and Integrated Delivery Networks
We contract with group purchasing organizations (“GPOs”) and integrated delivery networks (“IDNs”) and have promoted unit sales growth by offering volume discounts to acute care facilities within a specified group. Generally, we are designated as a sole source or as one of several preferred purchasing sources for specified products within these buying groups, although members of GPOs and IDNs are not obligated to purchase our products. Contracts with GPOs and IDNs typically have no minimum purchase requirements and generally have a term of three years with extensions as warranted and can be terminated on ninety days advance notice.
By contracting with a GPO or IDN, the Company can operate its sales force more efficiently. As a result, the Company’s sales force continues to call on facilities associated with these buying groups in order to improve compliance with these group purchasing agreements and grow market share.
A majority of acute care facilities in the United States belong to at least one group purchasing organization. In fiscal 2012, individual acute care facility orders purchased through contractual arrangements with our three largest group purchasing organizations accounted for approximately 45% of our total net sales.
Distribution
The Company's distribution network is comprised of hospital distributors, alternate care distributors, physician distributors, veterinary distributors, dental distributors and industrial safety distributors covering the entire United States and certain international marketplaces, namely Canada. The Company’s products are typically purchased pursuant to purchase orders or supply agreements in which the purchaser specifies whether such products are to be supplied through a distributor or directly by the Company. The Company records sales upon the shipment of inventory to the distributor, at which time title passes to the distributor.
Sales to Owens & Minor, Inc. and Cardinal Health Inc., diversified distribution companies (the “Distributors”) accounted for approximately 44% and 22% of total net sales, respectively for fiscal 2012, 42% and 22% of total net sales, respectively for fiscal 2011 and 40% and 26% of total net sales, respectively for fiscal 2010. Although the Distributors may be deemed in a technical sense to be major purchasers of the Company’s products, they typically serve as a distributor under a purchase order or supply agreement between the end user and the Company, and do not make significant purchases for their own account. The Company, therefore, does not believe it is appropriate to categorize the Distributors as actual customers. No other individual customer or affiliated group of customer accounts accounted for more than 5% of the Company’s net sales in any of the past three fiscal years.
Patents and Trademarks
The Company owns several patents and trademarks. While the Company considers that in the aggregate the patents and trademarks are important in the operation of its business, it does not consider any of them, or any group of them, to be of such importance that termination would materially affect its business.
The Company actively pursues a policy of seeking patent protection, both in the United States and abroad, for its proprietary technology. There can be no assurance that the Company’s patents will not be violated or that any issued patents will provide protection that has commercial significance. Litigation may be necessary to protect the Company’s patent position. Such litigation may be costly and time-consuming, and there can be no
10
Table of Contents
assurance that the Company will be successful in such litigation. Since no single patent covers product lines that constitute a material portion of the Company’s 2012 sales, we do not believe that any violation of any patents owned by the Company would have a material adverse effect on it or its business prospects.
Although there is no assurance that other companies will not be successful in developing similar products without violating the rights of the Company, management does not believe that the invalidation of any patents owned by the Company would have a material adverse effect on it or its business prospects. While the protection of patents is important to the Company’s business, management does not believe any one patent is essential to the success of the Company.
The Company also relies on trade secrets and product advancement to maintain its competitive position. There can be no assurance that the Company will prevent the unauthorized disclosure or use of its trade secrets and know-how or that others may not independently develop similar trade secrets or know-how or obtain access to the Company’s trade secrets, know-how or proprietary technology.
Competition
The markets for the Company’s product lines are highly competitive. In general, the Company’s products compete with the products of numerous major companies in the business of developing, manufacturing, distributing and marketing disposable medical products. Some of these competitors have greater financial or other resources than the Company. The Company believes that the principal competitive factors in each of its markets are (i) product design, development and improvement, (ii) customer support, (iii) brand loyalty, and (iv) price. The Company emphasizes overall value through a combination of competitive pricing, product quality and customer service.
The competitors differ based upon the products being sold. For example, in the sale of sterile laparotomy sponges, where the Company’s sales represent a significant share of the domestic market, Cardinal Health, Inc., Covidien Industries, Inc. and Medline Industries, Inc. are competitors. The Company's primary competitors in the sale of sterile operating room towels, in which the Company is also a leading supplier in the domestic market, are Cardinal Health, Inc., Medline Industries, Inc. and DeRoyal, Inc. Management believes that the breadth of the Company’s line of collection systems for the containment of medical waste is the most complete in the industry, where it competes with Mabis, DMI Healthcare, Minigrip, Inc., Heritage Bag Company, Pitt Plastics, Medline Industries, Inc., and Tri-State Hospital Supply. In the sale of minor procedure kits and trays where the Company has a significant domestic market share, the Company’s primary competitors include Cardinal Health, Inc., Becton, Dickinson and Company, Medline Industries, Inc. and Covidien Industries, Inc. In the sale of medical pouches to the hospital market, where the Company is one of the leading suppliers, the Company's primary competitor is Cardinal Health, Inc. In the sale of operating room accessories, where the Company's portion of the market is relatively insignificant, the Company's primary competitor is Covidien Industries, Inc. In the sale of patient bedside utensils, where Medline Industries, Inc. and Betras Plastics, are competitors, the Company’s sales represent a significant share of the domestic market. In the sale of laboratory products, where Cardinal Health, Inc., Covidien Industries, Inc., Becton, Dickinson and Company, Kord Products Inc., and Parter Medical Products, Inc., are competitors, the Company’s sales represent an insignificant share of the domestic market.
Health Care Reform
In recent years, several comprehensive health care reform proposals were introduced in the U.S. Congress. The intent of the proposals was, generally, to expand health care coverage for the uninsured and reduce the growth of health care expenditures. In March 2010, Congress passed and President Obama signed into law the Patient Protection and Affordable Care Act and related Reconciliation Bill, which includes a variety of healthcare reform provisions and requirements that will become effective at varying times through 2018. This healthcare reform legislation includes, among other things, provisions for expanded Medicaid eligibility and access to healthcare insurance as well as increased taxes and fees on certain corporations and medical products. The
11
Table of Contents
uncertainties surrounding the components of this legislation and the impact of its implementation on the healthcare industry may have an adverse effect on both customer purchasing, supplier product prices and terms of sale. The legislation may also require excise taxes to be paid on sales of certain medical products, all of which could adversely affect our results of operations.
Regulation
As a manufacturer of medical devices, the Company is subject to regulation by numerous regulatory bodies, both in the United States and abroad. In the United States, the federal agencies that regulate the Company’s products and operations include: the U.S. Food and Drug Administration (“FDA”), the Environmental Protection Agency, the Occupational Health & Safety Administration and others. Additionally, because the Company’s customers are typically reimbursed under governmental health programs such as Medicare and Medicaid, the Company is also subject to regulation by the Department of Health and Human Services. At the state level, the Company’s operations and products are also subject to regulation by various state agencies. Outside the United States, the Company is subject to regulation by agencies of foreign countries in which the Company sells its products. These agencies require manufacturers of medical devices to comply with applicable laws and regulations governing the introduction, development, testing, manufacturing, labeling, advertising, marketing, distribution, sale and use of medical devices. Such requirements include complaint handling, post marketing reporting, including adverse event reports and field actions due to quality concerns. Additionally, as a participant in the heavily-regulated health care industry, although the Company’s products and operations are not always directly regulated by certain health care laws and regulations, the Company may still be affected indirectly to the extent its customers are subject to such requirements.
All medical devices are required to be registered with the FDA. The Company must update its establishment and listing information on an annual basis and must comply with the FDA’s Good Manufacturing Practices under the Quality System Regulation (GMP/QSR). These regulations require that the Company manufacture its products and maintain records in a prescribed manner with respect to manufacturing, testing and control activities. The Company’s manufacturing, quality control and quality assurance procedures and documents are inspected and evaluated periodically by the FDA.
Unless exempt for low risk products, new medical device products, as well as modifications to existing products, require FDA pre-market approval. The Federal Food, Drug and Cosmetic Act (“FDC Act”) provides that new “510(k)” clearances are required when, among other things, there is a major change or modification in the intended use of the device or a change or modification to a legally marketed device that could significantly affect its safety or effectiveness. A manufacturer is expected to make the initial determination as to whether a proposed change to a cleared device or to its intended use is of a kind that would necessitate the filing of a new “510(k)” notification.
The European Union has promulgated rules, under the Medical Devices Directive (“MDD”), which require medical devices to bear the “CE mark”. The CE mark is an international symbol of adherence to quality assurance standards. The Company received EN ISO 13485:2003 certification for its Arden, North Carolina manufacturing facility and has instituted all the systems necessary to meet the Medical Device Directive, thus acquiring the ability to affix the CE mark to certain products.
Along with the ISO 13485, the Company received the Canadian CMDCAS quality system certification. The ISO and CMDCAS quality systems are audited annually in Arden, NC by a registered, approved (by the European Union and Canadian Government) notified body.
The Company’s failure to comply with applicable laws or regulations could result in disciplinary, corrective or punitive measures imposed by regulatory bodies in the form of warnings, civil sanctions, criminal sanctions, recalls or seizures, injunctions, withdrawal of approvals, or restrictions on operations.
12
Table of Contents
We believe that compliance with applicable laws or regulations will not have a material adverse effect on our financial condition.
Sales, Marketing and Customers
The Company's products are presently marketed and sold primarily to acute care facilities throughout the United States through a network of direct sales personnel. In addition, the Company has expanded its target markets to include physician, dental and veterinary offices, outpatient surgery centers, long-term care facilities and laboratories.
The Company’s sales representatives typically attempt to establish and maintain direct contact with medical professionals that directly utilize the Company’s products. As medical product purchases are typically made on a centralized basis by hospital purchasing departments, and increasingly by health care networks, sales representatives must also maintain relationships with purchasing department personnel. As of June 14, 2012, the Company employs approximately one hundred sales and marketing personnel throughout the United States. These individuals are focused on providing value added products and services to our customers and to presenting a comprehensive presence in the market, which, we believe will drive organic growth.
In addition to the field sales personnel focused on the United States acute care market, the Company has senior sales and marketing professionals that are focused on group purchasing organizations, government sales, large integrated delivery networks and with national and regional distributors.
Management believes that the continuing pressure to utilize low-cost, disposable medical products has significantly expanded the use of custom procedure trays, which contain the necessary items designed for use in specific procedures by surgical teams. Many of the custom tray suppliers are vertically integrating the packaging process by buying bulk, non-sterile operating room towels, laparotomy sponges and other products manufactured by the Company to place in these custom trays. The trays are then sterilized, saving valuable nursing time and the costs associated with individual product packaging.
The Company believes it has established an efficient system for marketing its products throughout the United States, and intends to utilize these existing sales methods and channels to market new products as they are developed or acquired.
In addition to branded sales to the United States health care market, the Company generates revenue to OEM customers in the health care, laboratory and non-medical markets. Moreover, the Company provides and sells products to international markets via independent in country distribution networks, supported by operations in the United States, Brazil and China.
Research and Development
The Company is continually conducting research and developing new products utilizing a team approach that involves its engineering, manufacturing and marketing resources. Although the Company has developed a number of its own products, most of its research and development efforts have historically been directed towards product improvement and enhancements of previously developed or acquired products. Product development expenses were approximately $1,921, $1,437 and $1,209 for fiscal 2012, 2011 and 2010, respectively.
Employees
As of June 14, 2012, the Company had approximately 1,210 full-time employees with approximately 835 in manufacturing and distribution, approximately 100 in marketing and sales, and approximately 280 in general and manufacturing administration. Except for approximately 225 employees in the Company’s Gallaway, Tennessee facility, which are represented by the Service Employees International Union (“SEIU”), none of the Company’s employees are represented by a labor union. The Company’s agreement with the SEIU expires in July 2012. The Company believes that its employee relations are good.
13
Table of Contents
Backlog
The Company does not believe that its backlog figures are necessarily indicative of its business since most hospitals and health related facilities order their products on a continuous basis and not pursuant to any contractual arrangements. Since typical shipment times range from two to five days, the Company must maintain sufficient inventories of all products at all times.
Raw Materials and Manufacturing
The principal raw materials used by the Company are a four-ply mesh gauze laparotomy sponge, cotton huck towel, paper, non-woven material, and various types of plastic resin. Other materials and supplies used by the Company include gauze, gauze sponges, injection molded and thermoformed plastics, medical instruments, various types of antiseptics and wound dressings, aluminum, foam, medical grade magnets and a variety of packaging material. Several of these raw materials are supplied from vendors outside the United States.
Medical Action’s variety of suppliers for raw materials and components necessary for the manufacture of its products, as well as its long term relationships with such suppliers, help to ensure the stability in its manufacturing process. Historically, we have not been materially affected by interruptions with such suppliers. However, if a supplier of significant raw materials, component parts, finished goods or services were to terminate its relationship with the Company, or otherwise cease supplying raw materials, component parts, finished goods or services consistent with past practices, the Company’s ability to meet its obligations to its customers may be disrupted. A disruption with respect to numerous products, or with respect to a few significant products, could have a material adverse effect on the Company’s business and financial condition. During the past few years, world events caused the cost of oil and natural gas prices to increase to historical new heights, causing the cost of resin, the principal raw material in the manufacture of our plastic products, to increase to unprecedented levels.
The Company purchases its principal cotton raw materials primarily from the Peoples Republic of China and is currently sourcing instruments from Pakistan and the Peoples Republic of China, a portion of its thermoform plastics from Taiwan, packaging paper material from France, water soluble bags from the United Kingdom and needle counters from the People’s Republic of China. From time to time, the Company has purchased certain of its raw materials from a number of other countries including Mexico, Vietnam, and the Dominican Republic. Some of the Company’s products are purchased as components or in final form, which are shipped to the Company’s manufacturing facilities in Arden, North Carolina, and Toano, Virginia where they are packaged. The Company’s sterilization pouches and minor procedure kits and trays are predominantly manufactured and/or assembled in the Company’s Arden, North Carolina manufacturing facility. The Company’s custom procedure trays are predominantly manufactured and/or assembled in the Company’s Toano, Virginia manufacturing facility. The Company utilizes outside contract sterilization facilities for its products.
In the Company’s Clarksburg, West Virginia facility, where the Company manufactures its containment systems for medical waste, three types of plastic resin are utilized in various production processes: (i) linear low density polyethylene, (ii) high density polyethylene and (iii) film extrusion polypropylene. In the manufacture of containment systems, resin is extruded through the die where it emerges in a gelatinous state. The extruder and die are positioned under a cooling tower where the emerging plastic is pressed closed and air is blown into it creating a cylindrical column. The column is then pulled up the tower and back down over conveying rollers, and is threaded through a printer, bag machine, triangle folder, separator and air folder into an individually folded bag.
The Company’s sharps containers are also manufactured from either polypropylene or polyethylene resin and are produced either by extrusion blow-molding or by high pressure injection molding. In extrusion blow molding, the resin is melted by friction and applied heat in a long tube with a precisely flighted revolving auger, delivering the molten plastic through an extruder die to form a hollow tube. As the tube exits the extruder, a two-part blow mold whose internal cavity is in the shape of the finished product, closes around the tube and high
14
Table of Contents
pressure is introduced to form the finished product. In injection molding, a similar barrel and screw auger system plasticizes the resin before injecting the molten plastic into two-part precision molds. These molds are closed under very high pressure, enabling the plastic to fill all of the voids in the mold and taking the shape of the finished part, then rapidly cooled with water running through the mold structure before being ejected for packaging.
Our Gallaway, Tennessee facility primarily manufactures and/or distributes disposable plastic patient utensils, as well as other collection, measuring and containment products. These products are manufactured with homopolymer and copolymer polypropylene, high density polyethylene and linear low density polyethylene, primarily utilizing either injection molded plastic process or extrusion blow molding. In addition, the Gallaway, Tennessee facility purchases contract manufactured or private labeled finished products for distribution to its customers. These products include stainless and reusable plastic containers and utensils manufactured domestically, as well as various measuring and collection products procured from the People’s Republic of China.
Available Information
The Company files annual, quarterly and current reports and other information with the SEC. These materials can be inspected and copied at the SEC’s Public Reference Room at 450 Fifth Street, N.W., Washington, D.C. 20549. Copies of these materials may also be obtained by mail at prescribed rates from the SEC’s Public Reference Room at the above address. Information about the Public Reference Room can be obtained by calling the SEC at 1-800-SEC-0330. The SEC also maintains an Internet site that contains reports, proxy and information statements, and other information regarding issuers that file electronically with the SEC. The address of the SEC’s Internet site is http://www.sec.gov.
The Company makes available, free of charge, on its Internet website, located at http://www.medical-action.com, its most recent Annual Report on Form 10-K, its most recent Quarterly Report on Form 10-Q, any current reports on Form 8-K filed since the Company’s most recent Annual Report on Form 10-K and any amendments to such reports as soon as reasonably practicable following the electronic filing of such report with the SEC. In addition, the Company provides electronic or paper copies of its filings free of charge upon request.
Our business, operations and financial condition are subject to certain risks and uncertainties, including the risks discussed below. Should one or more of these risks or uncertainties materialize, or should any underlying assumptions prove incorrect, our actual financial results will vary, and may vary materially from those anticipated, estimated, projected or expected. The following is a summary of risk factors relevant to our operations which should be carefully reviewed. These risk factors do not necessarily appear in the order of importance.
Resin prices are volatile. Increases in resin prices have adversely affected, and in the future may adversely affect, our financial condition, results of operations and cash flows.
Resin costs have fluctuated significantly in recent years and may continue to fluctuate as a result of changes in natural gas and crude oil prices. For calendar year 2011, resin costs in North America increased 9% compared to the prior year period, as measured by the Chemical Market Associates, Inc. market index. The instability in the world markets for petroleum and in North America for natural gas could quickly affect the prices and general availability of raw materials, which could have a materially adverse impact to us. Due to the uncertain extent and rapid nature of cost increases, we cannot reasonably estimate our ability to successfully recover any cost increases. To the extent that cost increases cannot be passed on to our customers, or the duration of time lags associated with a pass-through becomes significant, such increases may have a material adverse effect on our financial condition, results of operations and cash flows.
15
Table of Contents
Increases in the prices of cotton used to manufacture our products could materially increase our costs and decrease our results of operations or financial condition.
The principal fabrics used in many of our products are made from cotton and cotton-synthetic blends. The prices we pay for these fabrics are dependent on the market prices for the raw materials used to produce them, primarily cotton. These raw materials are subject to price volatility caused by weather, supply conditions, government regulations, energy costs, economic climate and other unpredictable factors. Fluctuations in the price, availability and quality of the fabrics used to manufacture our products, could have a material adverse effect on our cost of sales or our ability to meet our customers’ demands. We have not historically managed, and do not currently intend to manage, cotton and other commodity price exposures by utilizing derivative instruments.
In the future, we may be able to adjust our price points of such products, to the extent market conditions allow; however, we may not be able to pass all or a portion of such higher prices on to our customers. In addition, if one or more of our competitors is able to reduce its production costs by taking greater advantage of any reductions in raw material prices or favorable sourcing agreements, we may face pricing pressures in our marketplace from those competitors and may be forced to reduce our prices or face a decline in net sales, either of which could have an adverse effect on our business, results of operations or financial condition.
Covenants in our credit facilities may restrict our financial and operating flexibility.
We currently have two credit facilities, as amended and restated on June 7, 2012:
| • | A $25,000 revolving credit facility expiring on June 30, 2014. As of March 31, 2012, $19,670 was outstanding under the Prior Credit Agreement and as of June 14, 2012, $19,670 was outstanding under the Second Amended and Restated Credit Agreement and |
| • | A $51,000 term loan facility payable in varying quarterly installments and expiring on June 30, 2014. As of March 31, 2012, $56,000 was outstanding under the Prior Credit Agreement and as of June 14, 2012, $51,000 was outstanding under the Second Amended and Restated Credit Agreement. |
Our current credit facilities require, and any future credit facilities may also require, that we comply with specified financial covenants relating to (i) maximum annual capital expenditures of $4,000, (ii) a minimum fixed charge coverage ratio of 1.00 to 1.00 on a rolling four fiscal quarter basis and (iii) minimum earnings before interest, taxes, depreciation and amortization for certain specified quarterly periods through the expiration of the loans, including $3,000 for the fiscal quarter ending on June 30, 2012, $7,500 for the two consecutive fiscal quarter period ending September 30, 2012, $13,750 for the three consecutive quarter period ending December 31, 2012, $18,000 for the four consecutive fiscal quarter period ending March 31, 2013 and $21,000 for the four consecutive fiscal quarter period ending June 30, 2013. Our ability to satisfy these financial covenants can be affected by events beyond our control. These restrictive covenants could affect our financial and operational flexibility, including the following:
| • | limiting our ability to fund working capital, capital expenditures, acquisitions or other general corporate purposes; |
| • | requiring us to use a substantial portion of our cash flow from operations to pay interest and principal on our indebtedness, which will reduce the funds available to us for purposes such as potential acquisitions, capital expenditures, marketing, development and other general corporate purposes; |
| • | vulnerability to fluctuations in interest rates, as a substantial portion of our indebtedness bears variable rates of interest; |
| • | reducing our flexibility in planning for, or responding to, changing conditions in our business and our industry; |
| • | limiting our ability to borrow additional funds; and |
| • | making us more vulnerable to general economic downturns and adverse developments in our business. |
16
Table of Contents
In addition, a borrowing base has been added to the Second Amended and Restated Credit Agreement such that the total outstanding loans plus available commitments thereunder may not exceed the specified percentages of the value of eligible receivables, inventory, equipment, real property plus a permitted overadvance amount, all calculated monthly. In the event outstanding amounts of loans under the Second Amended and Restated Credit Agreement exceed this borrowing base, the Company would be required to prepay the excess. Our ability to satisfy borrowing base requirements can be affected by events beyond our control.
The Company’s business is subject to the risks of international procurement which could have an adverse effect on the Company’s financial results.
A significant portion of the Company’s raw materials and finished goods are purchased from manufacturers in the People’s Republic of China. As a result, the Company’s international procurement operations are subject to the risks associated with such activities including, economic and labor conditions, international trade regulations (including tariffs and anti-dumping penalties), war, international terrorism, civil disobedience, natural disasters, political instability, governmental activities and deprivation of contract and property rights. In particular, since 1978, the Chinese government has been reforming its economic systems, and we expect such reforms to continue. Although we believe that these reforms have had a positive effect on the economic development of China and have improved our ability to successfully utilize facilities in China, we cannot be assured that these reforms will continue or that the Chinese government will not take actions that impair these operations in China. In addition, periods of international unrest may impede our ability to procure goods from other countries and could have a material adverse effect on our business and results of operations.
The Chinese government has cut the tax credits that exporters get on more than 2,200 products, including many of the Company’s products that are manufactured in China. These tax credits were adopted more than twenty years ago to provide Chinese companies with tax breaks on revenues derived from exports. The cut in tax credits, together with a tight labor market, will cause the price of many items that are sourced in China to increase, which could adversely impact the Company’s cost of goods sold and profitability, to the extent the Company is unable to pass along these price increases to its customers.
Although the Chinese yuan had traded virtually in a straight line for many years, beginning in fiscal 2006 the Chinese government began to re-value the Chinese yuan against other currencies, including the U.S. dollar. This re-valuation or free floating exchange rate, has caused the price of many items that are sourced from China to increase, which could adversely impact the Company’s cost of goods sold and profitability.
In addition, the U.S. Government in May 2005 exercised a quota on any textile products from China in Category 632 of the Harmonized Tariff Schedule, which included the Company’s patient slippers. Beginning on January 1, 2009, the quota on textile products from Chinese category 632 expired. While there is no assurance that such quotas will not be reinstated in the future, the Company has been able to procure a similar product with a different country of origin, although at higher costs than the Company was previously obtaining. An interruption in supply and higher costs, could have an adverse effect on the Company’s financial results.
We have recorded goodwill and other intangible assets as a result of acquisitions, and future business conditions could cause these assets to become impaired, requiring substantial write-downs that would reduce our operating income.
We are required to annually test our goodwill and intangible assets with indefinite lives to determine if impairment has occurred. If the testing performed indicates that impairment has occurred, we are required to record a non-cash impairment charge for the difference between the carrying value of the goodwill and other intangible assets and the fair value of the goodwill and other intangible assets in the period the determination is made. As of March 31, 2012, we assessed that the fair value of the Company was in excess of its carrying value by approximately 5% and concluded that there was no impairment.
Our testing is comprised of several methodologies, including a discounted cash flow method, a guideline company method and a market capitalization method. This requires significant assumptions including estimation
17
Table of Contents
of future cash flows, which is dependent on internal forecasts, estimation of the long-term rate of growth for our business, the useful life over which cash flows will occur, determination of our weighted average cost of capital and the effect that changes in our stock price have on our market capitalization.
Changes in these estimates and assumptions, including the impact of changes in our stock price, could materially affect the determination of fair value and/or goodwill impairment. We will continue to monitor and evaluate the potential impact of changes in our estimates and assumptions and perform interim impairment testing if triggering events arise prior to our annual impairment testing.
Accordingly, it is possible that we could recognize an impairment charge in the future with respect to goodwill and/or other intangible assets, which would have an adverse effect on our consolidated financial condition and results of operations.
The Company may be unable to successfully manage growth, particularly if accomplished through acquisitions which could have a material adverse effect on our business, financial condition or results of operations.
Successful implementation of the Company’s business strategy will require that the Company effectively manage any associated growth. To manage growth effectively, the Company’s management will need to continue to implement changes in certain aspects of the Company’s business, to enhance the Company’s information systems and operations to respond to increased demand, to attract and retain qualified personnel and to develop, train and manage an increasing number of management-level and other employees. Growth could place an increasing strain on the Company’s management, financial, marketing, distribution and other resources, and the Company could experience operating difficulties. Any failure to manage growth effectively could have a material adverse affect on the Company’s results of operations and financial condition.
To the extent that the Company grows through acquisitions, it will face the additional challenges of integrating its current operations, culture, management information systems and other characteristics with that of the acquired entity. The Company may incur significant expenses in connection with negotiating and consummating one or more transactions, and it may assume certain liabilities in connection with an acquisition. In addition, the Company may not realize competitive advantages, synergies or other intended benefits anticipated in connection with any such acquisition. If the Company does not adequately identify targets for, or manage issues related to our future acquisitions, such acquisitions may have a negative adverse affect on the Company’s business and financial results.
In addition to the above risks, future acquisitions may result in the dilution of earnings and the amortization or write-off of goodwill and intangible assets, any of which could have a material adverse affect on our business, financial condition or results of operations.
The recently-enacted health care reform legislation may lead to substantial changes in the health care industry that may adversely affect the Company’s business.
In March 2010, Congress passed and President Obama signed into law the Patient Protection and Affordable Care Act and related Reconciliation Bill, which includes a variety of healthcare reform provisions and requirements that will become effective at varying times through 2018. Generally, the recently-enacted health care reform legislation requires most United States citizens and legal residents to carry health insurance, creates state-based health benefit exchanges and a tax credit system to help the uninsured purchase coverage, requires employers to either provide insurance or pay tax penalties for employees that receive tax credits, imposes new regulations on health plans, and expands Medicaid. Many of the provisions of the law will phase in over the course of the next several years, and may have a material adverse effect on the Company’s results of operations. Among the provisions that may have an adverse impact on the Company is an excise tax to be imposed on medical device manufacturers for the sale of certain medical devices occurring after December 31, 2012. The excise tax will be in an amount equal to 2.3% of the price for which we sell certain medical devices. At this point, it is not possible to fully predict the effect of the health care reform legislation on the Company.
18
Table of Contents
Continuing pressures to reduce health care costs may adversely affect our prices. If we cannot reduce manufacturing costs of existing and new products, our sales may not grow and our profitability may decline.
Increasing awareness of health care costs, public interest in health care reform and continuing pressure from Medicare, Medicaid and other payers to reduce costs in the health care industry, as well as increasing competition from other products, could make it more difficult for us to sell our products at current prices. The reduction of health care costs has become a political priority in the United States, as evidenced by the recently-enacted health care reform legislation, and abroad. Laws and regulations affecting reimbursement for the Company’s products may be altered in the near future, possibly resulting in lower reimbursement amounts to customers for the Company’s products from governmental and private payers. In the event that the market will not accept current prices for our products, our sales and profits could be adversely affected. We believe that our ability to increase our market share and operate profitably in the long term may depend in part on our ability to reduce manufacturing costs on a per unit basis through cost containment and high volume production using highly automated molding and assembly systems. If we are unable to reduce unit manufacturing costs, we may be unable to increase our market share or may lose market share to alternative products, including competitors’ products. Similarly, if we cannot enter a market with new products priced competitively with adequate profit margins and then reduce unit manufacturing costs of new products as production volumes increase, we may not be able to sell new products profitably or gain any meaningful market share. Any of these outcomes would adversely affect our future results of operations.
The high level of competition and group purchasing organizations place pressure on our gross profit and we may not be able to compete successfully.
The disposable medical device segment of the health care industry in which we operate is highly competitive and is experiencing both horizontal and vertical consolidation. All of the products we sell are available from sources other than us. The high level of competition in our industry places pressure on gross profit. Some of our competitors have greater resources than we have. These competitive pressures could have a material adverse affect on our business, financial condition or results of operations.
Sales to Owens & Minor, Inc. and Cardinal Health Inc. (the “Distributors”) collectively accounted for approximately 66%, 64% and 66% of net sales in fiscal 2012, 2011 and 2010, respectively. Although the distributors may be deemed in a technical sense to be major purchasers of the Company’s products, they serve, however, as a distributor under a purchase order or supply agreement between the customer and the Company, and do not make significant purchases for their own account. The Company, therefore, does not believe it is appropriate to categorize its distributors as actual customers. In some cases, distributors compete with the Company on a private label basis, and if successful, sales of certain of the Company’s products could decline which may result in a material adverse affect on the Company’s business, results of operations and financial condition.
Health care reform and the related pressure to contain costs has been the advent of group purchasing organizations in the United States. These group purchasing organizations enter into preferred supplier arrangements with one or more manufacturers of medical products in return for price discounts to members of the group purchasing organizations. If we are not able to obtain new preferred supplier commitments from major group purchasing organizations or retain those commitments that we currently have, which are generally terminable by either party for any reason upon the expiration of a defined notice period, our sales and profitability could be adversely affected. Even if we are able to obtain and retain preferred supplier commitments from group purchasing organizations, they may not deliver high levels of compliance by their members, meaning that we may not be able to offset the negative impact of lower per-unit prices or lower gross profit with increases in unit sales or in market share.
Indemnification for remediation of Tennessee facility.
The Medegen Tennessee facility is comprised of approximately 25 acres in a light industrial park, located in Gallaway, Tennessee and was acquired by Medegen in 1998. As part of its due diligence activities prior to the
19
Table of Contents
acquisition of the facility by Medegen, consultants found chlorinated solvents in the groundwater adjacent to the manufacturing plant. The identified groundwater contamination is in the process of being remediated.
The prior owner of the facility (“Indemnitor”) retained responsibility for the remediation of the contamination, and Medegen is fully indemnified for all costs associated with the environmental remediation as well as any claims that may arise, including third party claims. As security for the indemnification obligations, Indemnitor is required, on a quarterly basis, to provide proof of cash balances, marketable securities or available, unused lines of credit equal to the expected cost of all future remediation activities plus $500. Now that full-scale remediation has begun, Indemnitor will be required to provide Letters of Credit (“LC”) to secure their current and future obligations, including a $3,000 LC which is currently open, and future LC’s in the amounts of $2,000 in December 2012 and reducing to $1,000 from December 2014 through December 2017. The LC amounts approximate the expected remaining remediation costs at each point in time. No assurance can be given that the Indemnitor will have the financial resources to complete the environmental remediation and/or defend any claims that may arise, that recommended cleanup levels will be achieved over the long term, or that further remedial activities will not be required.
International sales pose additional risks related to competition with larger international companies and established local companies, or possibly higher cost structure and higher credit risks.
For the year ended March 31, 2012, international sales accounted for approximately 2% of our total net sales. We export from the United States and China most of our products sold internationally. Our principal competitors in international markets are a number of much larger companies as well as smaller companies already established in the countries into which we sell or intend to sell our products. Our cost structure is often higher than that of our competitors because of the relatively high cost of transporting product to the local market as well as our competitors’ lower local labor costs in some markets. There is no certainty that we will be able to open local manufacturing facilities, procure products from other suppliers or operate our international sales activities productively.
Our international sales are subject to higher credit risks than sales in the United States. Many of our international distributors are small and may not be well capitalized. Our prices to our international distributors for products shipped to the customers from the United States or China are denominated in U.S. dollars, but their resale prices are set in their local currency. A decline in the value of the local currency in relation to the U.S. dollar may adversely affect their ability to profitably sell in their market the products they buy from us, and may adversely affect their ability to make payment to us for the products they purchase. Legal recourse for non-payment of indebtedness may be uncertain. These factors all contribute to a potential for credit losses.
If we are unable to compete successfully on the basis of product innovation, quality, convenience, price and rapid delivery with larger companies that have substantially greater resources and larger distribution networks, we may be unable to maintain market share, in which case our sales may not grow and our profitability may be adversely affected.
The market for our products is intensely competitive. We believe that our ability to compete depends upon continued product innovation, the quality, convenience and reliability of our products, access to distribution channels and pricing. The ability to compete effectively depends on our ability to differentiate our products based on safety features, product quality, cost effectiveness, ease of use and convenience, as well as our ability to identify and respond to changing customer needs. We encounter significant competition in our markets both from large established medical device manufacturers and from smaller companies. Many of these firms have introduced competitive products with proprietary features not provided by the conventional products and methods they are intended to replace. Most of our current and prospective competitors have economic and other resources substantially greater than ours and are well established as suppliers to the healthcare industry. There is no assurance that our competitors will not substantially increase resources devoted to the development, manufacture and marketing of products competitive with our products. The successful implementation of such a strategy by one or more of our competitors could materially and adversely affect our profitability.
20
Table of Contents
Product liability claims could be costly to defend and could expose us to a loss or losses.
The use of our products exposes us to an inherent risk of product liability. Patients, health care workers or health care providers who claim that our products have resulted in injury could initiate product liability litigation seeking large damage awards against us. Costs of the defense of such litigation, even if successful, could be substantial. We maintain insurance against product liability and defense costs in the amount of $17,000 per occurrence. There is no assurance that we will successfully defend claims, if any, arising with respect to products or that the insurance we carry will be sufficient. A successful claim against us in excess of insurance coverage could materially and adversely affect us. There is no assurance that product liability insurance will continue to be available to us on acceptable terms.
Termination or interruption of relationships with our suppliers, or failure of such suppliers to perform, could disrupt our business and could have a material adverse effect on our business and financial condition.
Although most raw materials essential to the Company’s business are generally available from multiple sources, certain key components (including resin, which is the principal raw material used in the manufacture of collection systems for the containment of medical waste, patient bedside utensils and laboratory products) are currently obtained by the Company from limited sources. If a supplier of significant raw materials including component parts, finished goods or services were to terminate its relationship with the Company, or otherwise cease supplying raw materials, component parts, finished goods or services consistent with past practices, the Company’s ability to meet its obligations to its customers may be disrupted. A disruption with respect to numerous products, or with respect to a few significant products, could have a material adverse affect on the Company’s business and financial condition.
The Company’s success depends largely on its ability to attract and retain key personnel.
Much of the future success of the Company depends on the continued service and availability of skilled personnel, including its Chief Executive Officer, members of its executive team, and those in manufacturing, marketing, finance, and information technology. The Company has relied on its ability to grant stock options as one mechanism for recruiting and retaining this highly skilled talent. Accounting regulations requiring the expensing of stock options may impair the Company’s future ability to provide these incentives without incurring significant compensation costs. There can be no assurance that the Company will continue to successfully attract and retain key personnel.
Risks associated with the Company’s information technology systems could adversely affect the Company’s future operating results.
Information technology risks have generally risen in recent years due to increased reliance on technology and the increased sophistication of perpetrators of cyber attacks. A failure to maintain or protect our information technology systems, or those of our third party providers, could disrupt the Company’s ability to function in the normal course of business by potentially causing delays or cancellation of customer orders, impeding the manufacture or shipment of products, hindering the planning and procurement of raw materials, or resulting in the unintentional disclosure of customer or proprietary Company information. The occurrence of some or all of these events may result in damage to our reputation and possible regulatory sanctions or penalties. Management has taken steps to address these concerns by its implementation of internal control measures and certain system redundancy or recovery plans. However, there can be no assurance that a system failure or data security breach will not have a material adverse affect on the Company’s results of operations.
The Company’s products may be subject to recall or product liability claims.
The Company’s products are used in connection with surgical procedures and in other medical contexts in which it is important that those products function with precision and accuracy. If the Company’s products do not function as designed, or are designed improperly, the Company may be forced by regulatory agencies to
21
Table of Contents
withdraw such products from the market. In addition, if medical personnel or their patients suffer injury as a result of any failure of the Company’s products to function as designed, or an inappropriate design, the Company may be subject to lawsuits seeking significant compensatory and punitive damages. Any product recall or lawsuit seeking significant monetary damages may have a material adverse affect on the Company’s business and financial condition.
If a natural or man-made disaster strikes our manufacturing facilities, we may be unable to manufacture our products for a substantial amount of time, which may adversely affect our expected results of operations.
We principally rely on our manufacturing facilities in Arden, North Carolina, Gallaway, Tennessee, Clarksburg, West Virginia and Toano, Virginia. These facilities may be affected by natural or man-made disasters. These facilities and the manufacturing equipment we use to produce our products would be difficult to replace and could require substantial time to repair or replace. In the event one of our facilities was affected by a disaster, we would be forced to rely on third-party manufacturers; however, third-party manufacturers may not be available or they may be unable to produce our products on the schedule or to the specifications that we require. We currently carry insurance in the aggregate amount of $20,000 to protect us against many, but not all such disasters; however, such insurance may not be sufficient to cover certain losses and may become unavailable on acceptable terms, if available at all.
The Company is subject to a number of existing laws and regulations, and a significant adverse change in, or failure to comply with, these requirements could adversely affect the Company’s business.
As a participant in the heavily-regulated health care industry, the Company is regulated by numerous government authorities in both United States and abroad. The manufacturing, distribution, marketing, labeling, sale and use of the Company’s products are subject to extensive regulation by the FDA and other regulatory authorities. The Company’s failure to comply with applicable laws or regulations could cause a regulatory body to take disciplinary, corrective or punitive measures in the form of warnings, civil sanctions, criminal sanctions, recalls or seizures, injunctions, withdrawal of approvals, or restrictions on operations, all of which could adversely affect the Company’s business.
Importantly, in addition to the laws and regulations that directly apply to the Company, the Company is also impacted by the laws and regulations that apply to its customers. The Company’s targeted customer base consists primarily of acute care facilities, and recently has expanded to include physician offices, outpatient surgery centers, long-term care facilities, and laboratories. These customers typically rely substantially on government programs for reimbursement for the services provided to patients in which the Company’s products are utilized, and their continued participation in such programs requires compliance with extensive governmental regulatory schemes. Even though the Company may not be directly regulated under these requirements, its products must be capable of being utilized by customers in compliance with such requirements.
The Company and its customers are subject to numerous laws and regulations relating to health care fraud and abuse. These laws are particularly relevant with respect to the sale and marketing of the Company’s products and the interaction between the Company and its customers. Fraud and abuse laws can be complicated and subject to frequent change, and as a result, may be violated unintentionally. Because many of these laws and regulations have not been extensively interpreted or consistently enforced, health care industry participants often do not have the benefit of significant regulatory or judicial interpretation of these laws and regulations. Different interpretations or enforcement of these laws and regulations could subject the Company’s current or past practices to regulatory scrutiny and could necessitate changes to the Company’s operations. Violations of fraud and abuse laws may result in significant criminal, civil and administrative sanctions. A determination, or even an investigation as to whether, the Company has violated fraud and abuse laws could adversely affect the Company’s business.
22
Table of Contents
The Company is dependent on manufacturing and logistic services provided by third-parties and related risks.
Many of the Company’s products are manufactured in whole or part by third-party manufacturers, which are located throughout the United States and other parts of the world. While outsourcing arrangements may lower the fixed cost of operations, they also reduce the Company’s direct control of production and distribution. It is uncertain what affect such diminished control will have on the quality or quantity of the products manufactured, or the flexibility of the Company to respond to changing market conditions. The Company also depends on third-party transportation companies to deliver supplies necessary to manufacture our products from vendors to the Company’s various facilities and to move the Company’s products to customers within and outside the United States. The Company’s manufacturing operations, and the operations of the transportation companies on which the Company depends, may be adversely affected by natural disasters and significant human events, such as a war, terrorist attack, riot, strike, slowdown or similar event. Any disruption in the Company’s manufacturing or transportation could materially adversely affect the Company’s ability to meet customer demands or its operations generally.
The Company’s quarterly net sales and gross profit may fluctuate for a variety of reasons.
The Company’s gross profit varies among its products and its distribution channels. As a result, the overall profitability of the Company in any given period will depend, in part, on the product, geographic, and channel mix reflected in that period’s net sales.
Changes in accounting rules could adversely affect the Company’s future operating results.
Financial statements are prepared in conformity with accounting principles generally accepted in the United States of America. These principles are subject to interpretation by various governing bodies, including the Financial Accounting Standards Board (“FASB”) and the SEC, who interpret and create appropriate accounting regulations. A change from current accounting regulations, or the interpretations thereof, can have a significant effect on the Company’s results of operations and could impact the manner in which the Company conducts business.
Unanticipated changes in the Company’s tax rates could affect its future results.
The Company’s future effective tax rates could be favorably or unfavorably affected by unanticipated changes in tax laws or their interpretation. In addition, the Company is subject to the continuous examination of our income tax returns by the Internal Revenue Service and other tax authorities. The Company regularly assesses the likelihood of adverse outcomes resulting from these examinations to determine the adequacy of our provision for income taxes. There can be no assurance that the outcomes from these continuous examinations will not have an adverse affect on its operating results and financial condition.
The market price of the Company’s common stock has been, and may continue to be volatile.
The market price of the Company’s common stock has been, and may continue to be, highly volatile for various reasons, including the following:
| • | claims involving potential infringement of patents and other intellectual property rights; |
| • | quarter-to-quarter variances in the Company’s financial results; |
| • | analyst and other projections or recommendations regarding the Company’s common stock or medical device stocks generally; |
| • | any restatement of the Company’s financial statements or any investigation into the Company by the SEC or another regulatory authority; |
| • | a general decline, or rise, of stock prices in the capital markets generally; |
| • | investors concerns regarding the general credibility of corporate financial reporting and integrity of financial markets; |
23
Table of Contents
| • | announcements by us or our competitors of new products and service offerings, significant contracts, acquisitions or strategic relationships; |
| • | additions or departures of key personnel; and |
| • | the trading volume of our common stock. |
Anti-takeover provisions of our charter documents and Delaware law could prevent or delay transactions resulting in a change of control.
Provisions of our certificate of incorporation and bylaws and applicable provisions of Delaware law may make it more difficult for or prevent a third party from acquiring control of us without the approval of our board of directors. These provisions:
| • | establish a classified board of directors, so that not all members of our board may be elected at one time; |
| • | set limitations on the removal of directors; |
| • | limit who may call a special meeting of stockholders; |
| • | establish advance notice requirements for nominations for election to our board of directors or for proposing matters that can be acted upon at stockholder meetings; |
| • | prohibit stockholder action by written consent, thereby requiring all stockholder actions to be taken at a meeting of our stockholders; |
| • | provide our board of directors the ability to designate the terms of and issue new series of preferred stock without stockholder approval; and |
| • | require a super-majority vote for mergers and certain other business combinations without approval by a majority of the board of directors. |
ITEM 1B – UNRESOLVED STAFF COMMENTS
None.
The Company owns manufacturing facilities in Arden, North Carolina, Clarksburg, West Virginia and Gallaway, Tennessee. The Company conducts its operations in Toano, Virginia under a long term lease. The Company acquired in March 2007, a 28,200 square foot building in Brentwood, New York to serve as the Company’s corporate headquarters, which has been completely renovated. During March 2010, the Company sold a 12,000 square foot building located in Hauppauge, New York which was previously used as general offices and served as the Company’s former headquarters. In addition, the Company leases general office space in Shanghai, China. Management believes that the Company's facilities are adequate to meet its current needs and should continue to be adequate for the foreseeable future. Additional information about our facilities is set forth in the following table:
| Location |
Primary Use |
Owned/ Leased |
Lease Termination Date |
Size in Square Feet |
||||||||
| Arden, North Carolina |
Manufacturing/Warehouse/Distribution | Owned | n/a | 205,000 | (a) | |||||||
| Brentwood, New York |
Executive Offices | Owned | n/a | 28,200 | (b) | |||||||
| Clarksburg, West Virginia |
Manufacturing/Warehouse/Distribution | Owned | n/a | 43,000 | (c) | |||||||
| Gallaway, Tennessee |
Manufacturing/Warehouse/Distribution | Owned | n/a | 265,000 | (d) | |||||||
| Shanghai, China |
General Office | Leased | January 2014 | 2,550 | (e) | |||||||
| Fletcher, North Carolina |
Warehouse/Distribution | Leased | Month to Month | 53,760 | (f) | |||||||
| Oakland, Tennessee |
Warehouse/Distribution | Leased | Month to Month | 75,000 | (g) | |||||||
| Toano, Virginia |
Manufacturing/Warehouse | Leased | March 2029 | 185,000 | (h) | |||||||
24
Table of Contents
| (a) | The Arden, North Carolina manufacturing, distribution and warehouse facility is located on 32 acres. An Industrial Revenue Bond was used to acquire and renovate the facility and acquire certain manufacturing equipment. |
| (b) | The Company relocated to the Brentwood, New York corporate headquarters from the Hauppauge, New York corporate office in March 2009. This facility was acquired in March 2007. |
| (c) | The Clarksburg, West Virginia facility, which is located on 15 acres, was part of our acquisition of the BioSafety Division of Maxxim Medical, Inc. in October 2002. |
| (d) | The Gallaway, Tennessee facility, which is located on 25 acres, was part of our acquisition of Medegen Medical Products, LLC in October 2006. |
| (e) | The office in Shanghai, China is leased at an annual rental of $100. |
| (f) | The warehouse facility in Fletcher, North Carolina is leased at an annual rental of $107. |
| (g) | The warehouse facility in Oakland, Tennessee is leased at an annual rental of $225. |
| (h) | The Toano, Virginia facility located on 12 acres is subject to a capital lease that was assumed as part of our acquisition of AVID Medical, Inc. in August 2010 and requires monthly payments of $122 with increases of 2% per annum. |
As of June 14, 2012, the Company is involved in two product liability cases, which are covered by insurance. While the results of the lawsuits cannot be predicted with certainty, management does not expect that the ultimate liabilities, if any, will have a material adverse effect on the financial position or results of operations of the Company.
ITEM 4 – MINE SAFETY DISCLOSURES
None.
25
Table of Contents
ITEM 5 – MARKET FOR REGISTRANT'S COMMON EQUITY, RELATED STOCKHOLDER MATTERS AND ISSUER PURCHASES OF EQUITY SECURITIES
Market Price for the Common Stock
Our Common Stock trades on the NASDAQ Stock Market under the symbol “MDCI”. As of June 14, 2012 there were approximately 155 stockholders of record, which does not include approximately 3,843 beneficial owners of shares held in the names of brokers or other nominees. The following table sets forth, for the periods indicated, the high and low intra-day prices per share of Medical Action Common Stock as reported by the NASDAQ Global Select Stock MarketSM.
| Fiscal 2012 |
||||||||
| High | Low | |||||||
| First Quarter |
$ | 9.74 | $ | 8.06 | ||||
| Second Quarter |
8.66 | 5.00 | ||||||
| Third Quarter |
5.73 | 4.41 | ||||||
| Fourth Quarter |
6.00 | 4.98 | ||||||
| Fiscal 2011 |
||||||||
| High | Low | |||||||
| First Quarter |
$ | 13.47 | $ | 10.58 | ||||
| Second Quarter |
14.03 | 7.61 | ||||||
| Third Quarter |
10.19 | 7.57 | ||||||
| Fourth Quarter |
9.92 | 7.92 | ||||||
Dividends
We have never paid cash dividends, and do not anticipate paying dividends in the foreseeable future as the Board of Directors intends to retain future earnings for use in our business. Any future determination as to the payment of dividends will depend upon our financial condition, results of operations and such other factors as the Board of Directors deems relevant. In addition, our credit facilities contain covenants limiting the declaration and distribution of a cash dividend.
Purchasers of Equity Securities by the Issuer and Affiliated Purchasers
None.
26
Table of Contents
Performance Graph
The following graph shows the cumulative total return on our Common Stock against the cumulative total return of the Standard & Poor 500 Stock Index and the Standard & Poor Healthcare (Medical Products and Supplies) Industry for the period of five years commencing April 1, 2007 and ending March 31, 2012.
COMPARISON OF 5 YEAR CUMULATIVE TOTAL RETURN*
Among Medical Action Industries Inc., The S&P 500 Index,
And S&P Health Care Supplies
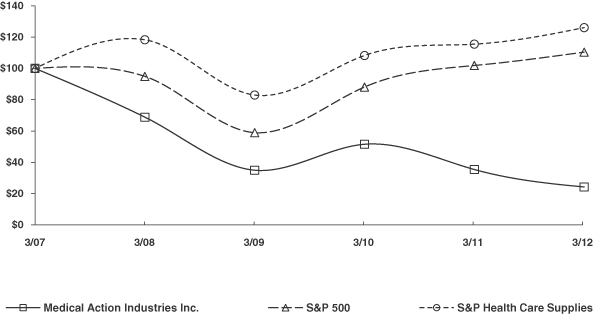
*$100 invested on 3/31/07 in stock or index, including reinvestment of dividends.
Fiscal year ending March 31.
Copyright© 2012 S&P, a division of The McGraw-Hill Companies Inc. All rights reserved.
The information in this Form 10-K appearing under the heading “Performance Graph” is being “furnished” pursuant to Item 201 (e) of Regulation S-K under the Securities Act of 1933, as amended, and shall not be deemed to be “soliciting material” or “filed” with the SEC or subject to Regulation 14A of 14C, other than as provided in Item 201 (e) of Regulation S-K, or to the liabilities of Section 18 of the Securities Exchange Act of 1934, as amended.
27
Table of Contents
Securities Authorized for Issuance under Equity Compensation Plans
The following table shows, as of March 31, 2012, information with respect to compensation plans under which shares of Common Stock are authorized for issuance.
| Plan Category |
Number of securities to be issued upon exercise of outstanding options(1) |
Weighted-average exercise price of outstanding options ($) |
Number of securities remaining available for future issuance under equity compensation plans(4) |
|||||||||
| Equity compensation plans approved by stockholders (2) |
1,348,437 | $ | 12.44 | 1,467,939 | ||||||||
| Equity compensation plans not approved by stockholders (3) |
— | $ | — | — | ||||||||
| Total |
1,348,437 | $ | 12.44 | 1,467,939 | ||||||||
| (1) | All share amounts and exercise prices have been adjusted to reflect the Company’s three-for-two stock split distributed on February 9, 2007. |
| (2) | Includes the 1994 Stock Incentive Plan, 1989 Non-Qualified Stock Option Plan and 1996 Non-Employee Stock Option Plan, all of which have been approved by our stockholders. |
| (3) | We do not have any equity compensation plans that have not been approved by our stockholders. |
| (4) | Excludes securities to be issued upon exercise of outstanding options. |
ITEM 6 – SELECTED FINANCIAL DATA
The following selected consolidated financial data should be read in conjunction with Item 7 “Management’s Discussion and Analysis of Financial Condition and Results of Operations” and our consolidated financial statements and the related notes appearing in Item 8 “Financial Statements and Supplementary Data” of this Annual Report on Form 10-K.
The consolidated financial data includes the impact of the AVID acquisition as of August 27, 2010. The historical results are not necessarily indicative of the results to be expected in any future period.
| Fiscal Year Ended March 31, | ||||||||||||||||||||
| 2012 | 2011 | 2010 | 2009 | 2008 | ||||||||||||||||
| Earnings Data |
||||||||||||||||||||
| Net Sales |
$ | 437,321 | $ | 362,494 | $ | 290,146 | $ | 296,070 | $ | 290,528 | ||||||||||
| Income before income taxes and extraordinary item |
998 | 9,013 | 27,358 | 8,096 | 21,452 | |||||||||||||||
| Net income |
181 | 4,354 | 16,841 | 4,955 | 13,225 | |||||||||||||||
| Net income per common share: |
||||||||||||||||||||
| Basic |
$ | 0.01 | $ | 0.27 | $ | 1.04 | $ | 0.31 | $ | 0.83 | ||||||||||
| Diluted |
$ | 0.01 | $ | 0.27 | $ | 1.03 | $ | 0.31 | $ | 0.81 | ||||||||||
|
|
|
|
|
|
|
|
|
|
|
|||||||||||
| Balance Sheet Data |
||||||||||||||||||||
| Total Assets |
$ | 297,144 | $ | 303,542 | $ | 200,796 | $ | 215,166 | $ | 199,036 | ||||||||||
| Working Capital |
60,621 | 41,017 | 24,040 | 48,811 | 25,138 | |||||||||||||||
| Long-term debt including capital leases (less current portion) |
81,325 | 72,566 | 2,734 | 53,147 | 34,421 | |||||||||||||||
| Stockholders’ equity |
148,807 | 148,227 | 142,722 | 122,005 | 115,779 | |||||||||||||||
|
|
|
|
|
|
|
|
|
|
|
|||||||||||
28
Table of Contents
ITEM 7 – MANAGEMENT'S DISCUSSION AND ANALYSIS OF FINANCIAL CONDITION AND RESULTS OF OPERATIONS
OVERVIEW
We manufacture and market single-use medical products used principally by acute care facilities within the United States. We divide our product lines into two markets, Clinical Care and Patient Care. Our Clinical Care market includes custom procedure trays, minor procedure kits and trays, operating room disposables and sterilization products. Our Patient Care market includes patient bedside products, containment systems for medical waste and laboratory products.
Our market approach encompasses ongoing strategic relationships with group purchasing organizations (“GPOs”), integrated delivery networks (“IDNs”), acute care facilities, surgery centers, clinical decision makers and procurement managers within acute care facilities, national and regional distributors and other end users of our products. Over the previous two years we have implemented an internal structure to support a market presence which encompasses: i) a marketing team comprised of product line managers for each of our key product categories, ii) an Executive Health Services team, that directly maintains our relationship with GPOs and IDNs, iii) eight regional managers who supervise both Clinical Care and Patient Care sales representatives and maintain relationships with larger acute care facilities and iv) seventy sales representatives which maintain a direct presence with the end users of our products and manage compliance levels on GPO and IDN contracts. While we view the end users of our products as the critical decision point driving our market penetration, approximately 66% of our products are sold through two national distributors, Owens & Minor, Inc. and Cardinal Health Inc., who deliver our products to end users.
Our growth strategy has included both acquisitions and expansion of existing product lines. In August 2010, we acquired AVID which markets and assembles custom procedure trays. AVID’s net sales were $138,466 for fiscal 2012 and $137,207 for the twelve months ended March 31, 2011, of which, $81,468 were recognized subsequent to the acquisition and are reflected in our consolidated statement of operations for fiscal 2011. While we had previously made both custom and standard minor procedure kits and trays, the acquisition of AVID significantly expanded our product line offerings within the Clinical Care market, increased our sales team and provided opportunities to cross sell our existing product lines. We have supply agreements with substantially every major GPO and IDN in the country including Novation, Premier and MedAssets. A majority of the acute care facilities that we sell to belong to at least one GPO. The supply agreements awarded to us through these GPOs designate the Company as a sole-source or multi-source provider for substantially all of our product offerings. We consider our GPO and IDN relationships to be valuable intangible assets. The supply agreements with GPOs and IDNs typically have no minimum purchase requirements and terms of one to three years that can be terminated on ninety days’ advance notice. While the acute care facilities associated with the GPOs and IDNs are not obligated to purchase our product offerings, many of these supply agreements have resulted in unit sales growth for the Company. Acute care facility orders purchased through our supply agreements with the three largest GPOs in the healthcare industry, Novation, Premier and MedAssets, accounted for $198,387 or 45% of our total net sales for the fiscal year ended March 31, 2012.
Over time we have increased revenues both organically and via acquisition. At this time we have focused our resources on increasing sales within existing product lines and continuing synergy initiatives associated with the AVID acquisition to drive organic sales growth.
We source our products from our four production facilities in the United States and from foreign suppliers, principally based in China. Our domestic production facilities and foreign suppliers have sufficient capacity to meet current product demand.
We conduct injection molding production and blown film production in our Gallaway, Tennessee and Clarksburg, West Virginia facilities, respectively. During the fiscal year ended March 31, 2009 we experienced operating inefficiencies and capacity limitations at our Tennessee injection molding facility as a result of closing
29
Table of Contents
another injection molding facility in Colorado and consolidating manufacturing operations into our Tennessee facility. These production issues have been resolved during the fiscal year ended March 31, 2010 and the facility is no longer encumbered by capacity limitations. We conduct minor procedure kit and tray assembly operations and custom procedure tray assembly operations in our Arden, North Carolina and Toano, Virginia facilities, respectively. As of March 31, 2012 we have completed the integration of AVID operations. The principal raw materials used in the production of our product lines include resin and cotton. Our production facilities consume approximately 52 million pounds of resin, namely polypropylene and polyethylene, per annum. Cotton is purchased by our foreign suppliers and converted into finished products, principally operating room towels and laparotomy sponges. We purchase finished goods that contain approximately 11 million pounds of cotton per annum.
The challenging economic environment of the past three years has negatively impacted hospital utilization, placed adverse economic pressure on acute care facilities and fostered volatility in commodity prices. These factors have impacted our revenues, average selling prices and gross profits. We have addressed these conditions by expanding our product lines, investing in our sales and marketing teams, managing our operating costs and differentiating ourselves in the market by emphasizing our ability to add value to our customers by improving their patient outcomes. We remain committed to being a trusted strategic partner to our customers, known for delivering innovative solutions to the healthcare community to improve the quality of care and enhancing patient experiences.
During fiscal 2012, 2011 and 2010 we reported revenues of $437,321, $362,494 and $290,146, respectively. Our net income and earnings per diluted share during fiscal 2012, 2011 and 2010 were $181 or $0.01 per share, $4,354 or $0.27 per share and $16,841 or $1.03 per share, respectively. Net income during fiscal 2012 was adversely affected by rising commodity costs, a change in the mix of products sold and the recording of a valuation allowance against certain state net operating loss carryforwards.
We assess goodwill, long-lived assets and certain identifiable intangibles at least annually for impairment as of the end of the fiscal third quarter, or more frequently if certain events or circumstances warrant. Impairment testing is performed in two steps; (i) we determine impairment by comparing the fair value of the Company with its carrying value, and (ii) if there is an impairment, we measure the amount of the impairment loss by comparing the implied fair value of goodwill with the carrying amount of that goodwill. The impairment test for long-lived assets and other intangible assets encompasses calculating an aggregate fair value of such assets and comparing the fair value to the carrying value. If the carrying value exceeds the fair value, impairment is recorded.
In light of the decline in our stock price, we reviewed the impact of the change in our market capitalization on the fair value of the Company in conjunction with our annual impairment assessment. We assessed that the fair value of the Company was in excess of its carrying value by approximately 5% and concluded that there was no impairment.
Application of the goodwill impairment test requires judgment. Fair value is estimated using a discounted cash flow methodology. This requires significant judgments including estimation of future cash flows, which is dependent on internal forecasts, estimation of the long-term rate of growth for our business, the useful life over which cash flows will occur, and determination of our weighted average cost of capital. Changes in these estimates and assumptions could materially affect the determination of fair value and/or goodwill impairment.
We will continue to monitor and evaluate the potential impact on our business and perform interim impairment testing if triggering events arise prior to future annual impairment testing; accordingly, it is possible that we could recognize an impairment charge in the future with respect to goodwill and/or other intangible assets.
30
Table of Contents
The following table sets forth certain operational data (in dollars and as a percentage of net sales) for fiscal years 2012, 2011 and 2010:
| Fiscal 2012 | Percent of Net Sales |
Fiscal 2011 | Percent of Net Sales |
Fiscal 2010 |
Percent of Net Sales |
|||||||||||||||||||
| Net Sales |
$ | 437,321 | 100.0 | % | $ | 362,494 | 100.0 | % | $ | 290,146 | 100.0 | % | ||||||||||||
| Cost of Sales |
372,380 | 85.2 | % | 298,615 | 82.4 | % | 221,242 | 76.3 | % | |||||||||||||||
|
|
|
|
|
|
|
|||||||||||||||||||
| Gross Profit |
64,941 | 14.8 | % | 63,879 | 17.6 | % | 68,904 | 23.7 | % | |||||||||||||||
| Selling, General and Administrative Expenses |
59,372 | 13.6 | % | 51,978 | 14.3 | % | 40,198 | 13.9 | % | |||||||||||||||
|
|
|
|
|
|
|
|||||||||||||||||||
| Operating Income |
5,569 | 1.3 | % | 11,901 | 3.2 | % | 28,706 | 9.9 | % | |||||||||||||||
| Interest Expense, net |
4,571 | 1.0 | % | 2,888 | 0.8 | % | 1,348 | 0.5 | % | |||||||||||||||
|
|
|
|
|
|
|
|||||||||||||||||||
| Income Before Income Taxes and Extraordinary Item |
998 | 0.2 | % | 9,013 | 2.5 | % | 27,358 | 9.4 | % | |||||||||||||||
| Income Tax Expense |
1,272 | 0.3 | % | 3,821 | 1.2 | % | 10,517 | 3.6 | % | |||||||||||||||
|
|
|
|
|
|
|
|||||||||||||||||||
| Income (Loss) Before Extraordinary Item |
(274 | ) | (0.0 | %) | 5,192 | 1.4 | % | 16,841 | 5.8 | % | ||||||||||||||
| Extraordinary Gain (Loss), Net of Applicable Taxes |
455 | 0.1 | % | (838 | ) | (0.2 | %) | — | 0.0 | % | ||||||||||||||
|
|
|
|
|
|
|
|||||||||||||||||||
| Net Income |
$ | 181 | 0.0 | % | $ | 4,354 | 1.1 | % | $ | 16,841 | 5.8 | % | ||||||||||||
|
|
|
|
|
|
|
|||||||||||||||||||
The following table sets forth net sales by market for fiscal years 2012, 2011 and 2010:
| Fiscal 2012 | Increase (decrease) compared to prior year |
Fiscal 2011 | Increase (decrease) compared to prior year |
Fiscal 2010 | ||||||||||||||||
| Clinical Care Market Sales |
$ | 272,917 | $ | 67,977 | $ | 204,940 | $ | 57,588 | $ | 147,352 | ||||||||||
| Patient Care Market Sales |
178,709 | 9,898 | 168,811 | 19,180 | 149,631 | |||||||||||||||
| Sales Related Adjustments |
(14,305 | ) | (3,048 | ) | (11,257 | ) | (4,420 | ) | (6,837 | ) | ||||||||||
|
|
|
|
|
|
|
|
|
|
|
|||||||||||
| Total Net Sales |
$ | 437,321 | $ | 74,827 | $ | 362,494 | $ | 72,348 | $ | 290,146 | ||||||||||
|
|
|
|
|
|
|
|
|
|
|
|||||||||||
FISCAL 2012 COMPARED TO FISCAL 2011
The following table sets forth net sales by market for fiscal years 2012 and 2011:
| Fiscal 2012 | Fiscal 2011 | Increase (decrease) due to price / mix |
Increase (decrease) due to volume /mix |
|||||||||||||
| Clinical Care Market Sales |
$ | 272,917 | $ | 204,940 | $ | (5,011 | ) | $ | 72,988 | |||||||
| Patient Care Market Sales |
178,709 | 168,811 | (718 | ) | 10,617 | |||||||||||
| Sales Related Adjustments |
(14,305 | ) | (11,257 | ) | (2,377 | ) | (672 | ) | ||||||||
|
|
|
|
|
|
|
|
|
|||||||||
| Total Net Sales |
$ | 437,321 | $ | 362,494 | $ | (8,106 | ) | $ | 82,933 | |||||||
|
|
|
|
|
|
|
|
|
|||||||||
Net sales were $437,321 during fiscal 2012 and $362,494 during fiscal 2011, representing an increase of $74,827 or 20.6%. Approximately $56,998 of the increase is attributable to the impact of a full year of custom procedure trays added as a result of the AVID acquisition. Our remaining products generated $17,829 in additional sales compared to fiscal 2011. The increase in net sales, excluding custom procedure trays, was comprised of $16,993 in higher volumes and $835 in higher average selling prices. The increase in volumes was predominantly attributable to higher domestic market penetration of our patient bedside products, operating room
31
Table of Contents
disposables and sterilization products and minor procedure kits and trays. The increase in average selling prices resulted principally from net price increases of $1,426 on operating room disposables and sterilization products. These were partially offset by $591 in lower pricing on patient bedside products and containment systems for medical waste.
Gross profit was $64,941 during fiscal 2012 and $63,879 during fiscal 2011, representing an increase of $1,062 or 1.7%. Gross profit as a percentage of net sales was 14.8% during fiscal 2012 and 17.6% during fiscal 2011. Approximately $8,836 is attributable to the impact of a full year of custom procedure trays added as a result of the AVID acquisition. Our remaining products generated $7,774 less in gross profit compared to the prior fiscal year due to a decline in average selling prices, the mix of products sold, an increase in costs of raw materials resulting from rising global commodity prices and production inefficiencies.
Resin-related product lines which include containment systems for medical waste, patient bedside disposable products and laboratory products product lines, represent approximately 36% of the Company’s fiscal 2012 revenues. The primary raw material utilized in the manufacture of these products is plastic resin. In recent years, we have consistently increased the amount of resin used in production due to higher market penetration, a reduction in outsourcing and a change in the mix of products produced. During fiscal 2012, we used over 52 million pounds of resin in production. The average purchase price of the resins used in production has increased significantly since fiscal 2010. Our gross profit during fiscal 2012 as compared to fiscal 2011 was unfavorably impacted by $4,954 due to higher resin prices.
During fiscal 2012, we imported approximately $74,806 of finished goods and certain raw materials from overseas vendors, principally China. Our main imports are operating room products, which include operating room towels and laparotomy sponges, minor procedure kits and trays and surgical instruments used in our minor procedure kits and trays and certain containment products and patient bedside disposable products that we do not produce domestically. The products we have produced in China include plastic resin and cotton as raw materials. During the latter part of fiscal 2011, we incurred significant increases in the cost of products purchased due to currency fluctuations and rising commodity costs.
The costs within the global market for cotton, while still volatile, have declined from their peak in March 2011. The Company does not directly purchase unfinished cotton and convert the material into finished goods; however, cotton is the primary raw material utilized by our vendors in the production of our operating room towels and laparotomy sponges. Notwithstanding the decline in cotton prices, we have not seen a corresponding decline in the cost of our finished goods cotton products, which are primarily sourced from China-based vendors. The volume of cotton included in our products is estimated to be approximately 11 million pounds per annum. Our gross profit during fiscal 2012 was unfavorably impacted by $4,964 due to higher costs of products sourced from overseas vendors.
In response to the increase in material costs during fiscal 2011 we implemented price increases on certain cotton and resin based products. We have been limited in our ability to pass all raw material price increases on to our customers. Due to competitive market conditions, we passed on price increases that we believe will be sustainable. Net sales during fiscal 2012 include approximately $4,322 of price increases to our customers.
Selling, general and administrative expenses amounted to $59,372 and $51,978 in fiscal 2012 and 2011, respectively. The increase of $7,394 or 14.2% is primarily attributable to the impact of a full year of certain selling and administrative expenses added as a result of the AVID acquisition. These expenses were partially offset by declines in legal and consulting fees which were higher in fiscal 2011 due to the professional services incurred during the due diligence and integration of the AVID acquisition. A decline in bonuses which was precipitated by the failure to meet certain operational performance objectives also partially offset the increase in selling, general and administrative expenses.
32
Table of Contents
Distribution expenses, which are included in selling, general and administrative expenses, amounted to $7,474 and $7,276 in fiscal 2012 and 2011, respectively. The increase is primarily due to higher labor costs, principally medical and overtime expenses. The Company does not classify any expenses as distribution related in our Toano, VA facility added in the AVID acquisition as we utilize a third-party logistics provider for that facility’s supply chain management functions. Such expenses are deemed to be freight-out and are included in cost of sales.
Interest expense amounted to $4,571 and $2,889 in fiscal 2012 and 2011, respectively. The increase in interest expense was attributable to a net increase in average principal loan balances outstanding and an increase in interest rates.
During fiscal 2011, the Company incurred an extraordinary pre-tax loss of $1,455 relating to inventories damaged as a result of weather-related water damage. The inventories damaged were predominantly patient bedside disposables and did not negatively impact the Company’s service levels with respect to this product line. During fiscal 2012, the Company negotiated a settlement with our insurance broker for reimbursement of these damaged inventories in the amount of $700. This reimbursement has been categorized as an extraordinary gain on our financial statements.
Income tax expense amounted to $1,517 and $3,204 (inclusive of the applicable taxes resulting from the aforementioned extraordinary items) for fiscal 2012 and 2011, respectively. Income tax expense as a percent of income before income taxes was 127.5% and 42.4% for fiscal 2012 and 2011, respectively. The change in the Company’s effective tax rate in fiscal 2012 was primarily due to the recording of a valuation allowance against certain state net operating loss carryforwards.
FISCAL 2011 COMPARED TO FISCAL 2010
The following table sets forth net sales by market for fiscal years 2011 and 2010:
| Fiscal 2011 | Fiscal 2010 | Increase (decrease) due to price / mix |
Increase (decrease) due to volume / mix |
|||||||||||||
| Clinical Care Market Sales |
$ | 232,158 | $ | 147,352 | $ | (3,928 | ) | $ | 88,734 | |||||||
| Patient Care Market Sales |
142,135 | 149,631 | (4,748 | ) | (2,748 | ) | ||||||||||
| Sales Related Adjustments |
(11,799 | ) | (6,837 | ) | (1,950 | ) | (3,012 | ) | ||||||||
|
|
|
|
|
|
|
|
|
|||||||||
| Total Net Sales |
$ | 362,494 | $ | 290,146 | $ | (10,626 | ) | $ | 82,974 | |||||||
|
|
|
|
|
|
|
|
|
|||||||||
Net sales were $362,494 during fiscal 2011 and $290,146 during fiscal 2010, representing an increase of 25.0%. The increase in net sales includes $81,468 in sales of custom procedure trays subsequent to August 27, 2010 when we acquired AVID. Excluding the custom procedure tray products acquired through the AVID acquisition, we experienced an overall decline in net sales during fiscal 2011 of $9,120. The decline in net sales, excluding custom procedure tray products, was comprised of a decline in the average selling prices of our products in the amount of $10,626, which was partially offset by an increase in unit sales in the amount of $1,506. The decline in average selling prices resulted principally from competitive pressures, the renewal of certain GPO supply agreements at lower prices, a change in the mix of products purchased by our customers and a reduction in demand for products associated with the H1N1 flu epidemic during fiscal 2010. The increase in unit sales was predominantly attributable to higher domestic market penetration of our operating room disposables and sterilization products.
During the first quarter of fiscal 2011 our net sales were $66,796 which compares unfavorably to net sales reported during the quarters ended September 30, 2010, December 31, 2010 and March 31, 2011, excluding custom procedure trays, of $71,810, $71,373 and $71,048, respectively. The lower sales volume during the first quarter was the result of ordering patterns by distributors during the fourth quarter of fiscal 2010, competitive pressures and the renewal of a GPO contract for patient bedside disposable products from a sole source to a dual source which resulted in lower sales prices and a reduction in units sold.
33
Table of Contents
Gross profits were $63,879 during fiscal 2011 and $68,904 during fiscal 2010, representing a decline of $5,025 or 7.3%. Gross profit as a percentage of net sales were 17.6% during fiscal 2011 and 23.7% during fiscal 2010. Increased sales volume of $81,468 in sales of custom procedure trays subsequent to the AVID acquisition increased gross profit by $14,658. We experienced a decline in gross profit on our remaining product lines within our Clinical Care market as well as product lines within our Patient Care market of $19,683 during fiscal 2011 when compared to fiscal 2010. The decline in gross profit is attributable to a decrease in average selling prices and the mix of products sold and an increase in costs of raw materials resulting from rising global commodity prices. These increased costs were partially offset by increases in productivity in our manufacturing facilities.
Resin-related product lines which include containment systems for medical waste, patient bedside disposable products and laboratory products product lines, represent approximately 50% of the Company’s fiscal 2011 revenues. These product lines would represent 34% of the Company’s revenues if a full year of sales of custom procedure trays were included in revenue rather than from the date of the AVID acquisition. The primary raw material utilized in the manufacture of these products is plastic resin. We have experienced volatility in resin costs consistent with global market prices of oil during the past several years. In any given year we may purchase approximately 45 million pounds of resin. During fiscal 2010 we used in production approximately 20 million pounds of polypropylene resin purchased during March 2009 when resin prices were approximately $0.48 per pound. Our remaining production requirements of resin which consisted principally of polyethylene, was purchased throughout the year at market prices. During fiscal 2010 and through fiscal 2011 the market price of both polyethylene and polypropylene continued to increase as the cost of underlying feedstock, oil and natural gas, increased. Our gross profit during fiscal 2011 as compared to fiscal 2010 was unfavorably impacted by $8,301 due to higher resin prices.
During fiscal 2011, we imported approximately $74,379 of finished goods and certain raw materials from overseas vendors, principally China. Our main imports are operating room products, which include operating room towels and laparotomy sponges, minor procedure kits and trays and surgical instruments used in our minor procedure kits and trays and certain containment products and patient bedside disposable products that we do not produce domestically. The products we have produced in China include plastic resin and cotton as raw materials. We have incurred increases in the cost of products purchased during the year due to currency fluctuations and rising commodity costs.
The cost of cotton increased to record levels over the past year. In broad terms the cost of cotton on the international market has more than doubled over the past twelve months. While the Company does not directly purchase unfinished cotton and convert the material into finished goods, it is the primary raw material utilized by our vendors in the production of our operating room towels and laparotomy sponges. The volume of cotton included in these products is estimated to be approximately 11 million pounds per annum. Our gross profit during fiscal 2011 as compared to fiscal 2010 was unfavorably impacted by $5,225 due to higher costs of products sourced from overseas vendors.
In response to the increase in material costs during fiscal 2011 we have implemented price increases on certain cotton and resin based products. We were limited in our ability to pass all raw material price increases on to our customers. Due to competitive market conditions and indications that cotton prices will start to decline during the latter part of fiscal 2012, we have passed on price increases that we believe will be sustainable. We cannot be assured that our initiatives to implement price increases will be successful.
Selling, general and administrative expenses amounted to $51,978 and $40,198 in fiscal 2011 and 2010, respectively. The increase of $11,780 or 29.3% was primarily attributable to $9,664 in selling, general and administrative expenses added as a result of the AVID acquisition. The Company also incurred approximately $1,335 in one time charges associated with the AVID acquisition. These increases were partially offset by a decrease of $2,385 in bonuses which was precipitated by the failure to meet certain fiscal 2011 operational performance objectives.
34
Table of Contents
Distribution expenses, which are included in selling, general and administrative expenses, amounted to $7,276 and $7,477 in fiscal 2011 and 2010, respectively. The decrease is primarily due to decreased labor costs, principally overtime expenses. The Company does not classify any expenses as distribution-related in our Toano, VA facility added in the AVID acquisition as we utilize a third-party logistics provider for that facility’s supply chain management functions. Such expenses are deemed to be freight-out and are included in cost of sales.
Interest expense amounted to $2,889 and $1,352 in fiscal 2011 and 2010, respectively. The increase in interest expense was attributable to a net increase in average principal loan balances outstanding and an increase in interest rates.
During fiscal 2011, the Company incurred an extraordinary pre-tax loss of $1,455 relating to inventories damaged as a result of weather-related water damage. The inventories damaged were predominantly patient bedside utensils and did not negatively impact the Company’s service levels with respect to this product line.
Income tax expense amounted to $3,204 (inclusive of the tax benefit resulting from the aforementioned extraordinary loss) and $10,517 for fiscal 2011 and 2010, respectively. Income tax expense as a percent of income before income taxes was 42.4% and 38.4% for fiscal 2011 and 2010, respectively. The increase in the Company’s effective tax rate was primarily due to the one time charges and expenses associated with the acquisition of AVID.
LIQUIDITY AND CAPITAL RESOURCES
Cash Flows
Cash and cash equivalents changed as follows for the fiscal years ended March 31:
| 2012 | 2011 | 2010 | ||||||||||
| Cash provided by operating activities |
$ | 4,013 | $ | 5,174 | $ | 43,268 | ||||||
| Cash used in investing activities |
(779 | ) | (66,163 | ) | (2,124 | ) | ||||||
| Cash provided by (used in) financing activities |
459 | 57,039 | (38,962 | ) | ||||||||
| Increase (decrease) in cash and cash equivalents |
$ | 3,693 | ($ | 3,950 | ) | $ | 2,182 | |||||
Historically, the Company’s primary sources of liquidity and capital resources have included cash provided by operations and the use of available borrowing under our credit facilities while the primary uses of liquidity and capital resources have included acquisitions, capital expenditures and payments on debt.
Cash provided by operating activities during fiscal 2012 is primarily comprised of income from operations of $181, depreciation of $5,720, amortization of $4,289 and decreases in (i) deferred income taxes of $2,419, (ii) accounts receivable of $1,198 and (iii) inventories of $827. These were partially offset by decreases in (i) accounts payable of $5,774, (ii) accrued expenses of $4,380 and an increase in other assets of $1,185.
Cash used in investing activities during fiscal 2012 consisted primarily of $907 in capital expenditures. The majority of the capital expenditures related to machinery and equipment for our injection molding facility located in Gallaway, Tennessee. The Company’s Second Amended and Restated Credit Agreement contains certain covenants and restrictions, which include limitations on capital expenditures. During the fiscal year ended March 31, 2012, the Company was permitted under the terms of the Prior Credit Agreement, to spend up to $10,000 on capital expenditures per annum. Under the terms of the Seconded Amended and Restated Credit Agreement, the Company’s permitted annual capital expenditures have been reduced to $4,000. During fiscal 2012, 2011 and 2010, the Company spent $907, $3,642 and $4,202, respectively, on capital expenditures. On an annual basis, management expects to spend a significant portion of monies permissible for capital expenditures on machinery and equipment to improve efficiencies at the Company’s manufacturing facilities.
35
Table of Contents
Cash provided by financing activities during the fiscal year ended March 31, 2012 consisted primarily of $534 in net borrowings under the Prior Credit Agreement. These borrowings were utilized to fund the Company’s operating requirements and to pay off the $910 in remaining principal outstanding on our Industrial Revenue Bonds. During the fiscal year ended March 31, 2012, the Company’s borrowings under our term loan decreased $16,000 while borrowings under our revolving credit facility increased $17,534. Upon entry into the Second Amended and Restated Credit Agreement on June 7, 2012, the Company prepaid our term loan facility by $5,000.
Financial Position
The following table sets forth certain liquidity and capital resources data for the periods indicated:
| March 31, 2012 |
March 31, 2011 |
|||||||
| Cash and Cash Equivalents |
$ | 5,384 | $ | 1,691 | ||||
| Accounts Receivable, net |
$ | 30,845 | $ | 32,330 | ||||
| Days Sales Outstanding |
26.0 | 21.7 | ||||||
| Inventories, net |
$ | 53,825 | $ | 54,674 | ||||
| Inventory Turnover |
6.3 | 6.0 | ||||||
| Current Assets |
$ | 98,183 | $ | 96,773 | ||||
| Goodwill |
$ | 107,801 | $ | 107,689 | ||||
| Working Capital |
$ | 60,621 | $ | 41,017 | ||||
| Current Ratio |
2.6 | 1.7 | ||||||
| Total Borrowings |
$ | 89,457 | $ | 89,018 | ||||
| Stockholders’ Equity |
$ | 148,807 | $ | 148,227 | ||||
| Debt to Equity Ratio |
0.60 | 0.60 | ||||||
The Company is committed to maintaining a strong financial position through maintaining sufficient levels of available liquidity, managing working capital and generating cash flows necessary to meet operating requirements. Total borrowings outstanding were $89,457 with a debt to equity ratio of 0.60 to 1.0 at March 31, 2012 as compared to $89,018 with a debt to equity ratio of 0.60 to 1.0 at March 31, 2011. Cash and cash equivalents at March 31, 2012 were $5,384 and the Company had $5,330 available for borrowing under its revolving credit facility. As of June 7, 2012, the Company prepaid $5,000 of its term loan facility, reducing its total outstanding borrowings to $84,457.
Working capital at March 31, 2012 was $60,621 compared to $41,017 at March 31, 2011 and the current ratio at March 31, 2012 was 2.6 to 1.0 compared to 1.7 to 1.0 at March 31, 2011. The increase in working capital is primarily due to the increase in cash and decreases in the current portion of long-term debt, accounts payable and accrued expenses.
On June 7, 2012, the Company entered into our Second Amended and Restated Credit Agreement. The Second Amended and Restated Credit Agreement requires us to comply with specified financial covenants relating to (i) maximum annual capital expenditures of $4,000, (ii) a minimum fixed charge coverage ratio of 1.00 to 1.00 on a rolling four fiscal quarter basis and (iii) minimum earnings before interest, taxes, depreciation and amortization for certain specified quarterly periods through the expiration of the loans, including $3,000 for the fiscal quarter ending on June 30, 2012, $7,500 for the two consecutive fiscal quarter period ending September 30, 2012, $13,750 for the three consecutive quarter period ending December 31, 2012, $18,000 for the four consecutive fiscal quarter period ending March 31, 2013 and $21,000 for the four consecutive fiscal quarter period ending June 30, 2013. In addition, the Company has committed to certain post-closing conditions, including providing monthly financial statements, quarterly updates of financial projections and filed mortgages on our North Carolina, West Virginia and Tennessee facilities. As of June 14, 2012, the Company is in compliance with all covenants and financial ratios under the Second Amended and Restated Credit Agreement.
36
Table of Contents
Borrowings under the Second Amended and Restated Credit Agreement are collateralized by substantially all of the assets of the Company and its subsidiaries, and the agreement contains certain restrictive covenants, which, among other matters, impose limitations with respect to the incurrence of indebtedness, granting of liens, guarantees of obligations, mergers, acquisitions, capital expenditures, making loans or investments, specified sales of assets and prohibits the declaration and payment of dividends.
The Company believes that the anticipated future cash flow from operations, coupled with its cash on hand and available funds under its revolving credit facility will be sufficient to meet working capital requirements. Although we have borrowing capacity on our revolving credit agreement, have cash on hand and anticipate future cash flow from operations, we may be limited in our ability to allocate funds for purposes such as potential acquisitions, capital expenditures, marketing, development and other general corporate purposes. In addition, we may be limited in our flexibility in planning for or responding to changing conditions in our business and our industry, making us more vulnerable to general economic down turns and adverse developments in our business.
Borrowing Arrangements
On August 27, 2010, Medical Action entered into our Prior Credit Agreement, among the Company, as borrower, JPMorgan Chase Bank, N.A., as administrative agent and the lenders party thereto pursuant to which such lenders agreed to make certain extensions of credit to the Company. On June 7, 2012, the Company agreed to amend and restate the Prior Credit Agreement in its entirety and entered into a New Credit Agreement, among the Company, as borrower, JPMorgan Chase, N.A., as administrative agent, Citibank, N.A., as syndication agent and HSBC Bank USA, N.A., Sovereign Bank and Wells Fargo Bank, N.A. as co-documentation agents and the other lenders party thereto (the “Lenders”).
The New Credit Agreement provides for a $51,000 secured term loan and a $25,000 secured revolving credit facility. The revolving credit facility is used to finance the working capital needs and general corporate purposes of the Company and its subsidiaries and for permitted acquisitions. As of March 31, 2012, $19,670 in revolving loans and $56,000 in term loans was outstanding under the Prior Credit Agreement and as of June 14, 2012, $19,670 in revolving loans and $51,000 in term loans was outstanding under the New Credit Agreement, respectively.
CONTRACTUAL OBLIGATIONS
The following table represents the Company’s future material, long-term contractual obligations as of March 31, 2012:
| Payments Due in | ||||||||||||||||||||
| Contractual Obligations |
Total | Less than 1 Year |
1-3 Years |
3-5 Years |
After 5 Years |
|||||||||||||||
| Principal payments of long-term debt |
$ | 75,670 | $ | 8,000 | $ | 67,670 | $ | — | $ | — | ||||||||||
| Capital lease obligation |
29,789 | 1,489 | 3,067 | 3,191 | 22,042 | |||||||||||||||
| Purchase obligations |
11,669 | 11,669 | — | — | — | |||||||||||||||
| Operating leases |
1,303 | 832 | 442 | 29 | — | |||||||||||||||
| Defined benefit plan payments |
689 | 54 | 107 | 126 | 402 | |||||||||||||||
|
|
|
|
|
|
|
|
|
|
|
|||||||||||
| Total Contractual Obligations |
$ | 119,120 | $ | 22,044 | $ | 71,286 | $ | 3,346 | $ | 22,444 | ||||||||||
|
|
|
|
|
|
|
|
|
|
|
|||||||||||
Excluding change in control agreements, none of the Company’s executive officers have severance agreements. Our executive officers serve at the will of the Board, which enables the Company to terminate their employment with discretion as to the terms of any severance arrangement. This is consistent with the Company’s performance-based employment and compensation philosophy.
37
Table of Contents
As of March 31, 2012, the Company has entered into agreements with five of its executive officers and a vice president, which provide certain benefits in the event of a change in control of the Company. A “change in control” of the Company is defined as, in general, the acquisition by any person of beneficial ownership of 20% or more of the voting stock of the Company, certain business combinations involving the Company or a change in a majority of the incumbent members of the Board of Directors, except for changes in the majority of such members approved by such members. If, within two years after a change in control, the Company or, in certain circumstances, the executive, terminates his employment, the executive is entitled to a severance payment equal to 2.99 times the sum of (i) such executive’s highest annual salary rate within the five-year period preceding termination and (ii) a bonus increment equal to the average of the two highest of the last five bonuses paid to such executive. In addition, the executive is entitled to the continuation of all employment benefits for a three-year period, the vesting of all stock options and certain other benefits. As of March 31, 2012, the estimated potential aggregate compensation payable to these five executive officers and vice president under the Company’s compensation and benefit plans and arrangements in the event of termination of such executive’s employment following a change in control amounted to approximately $8,918.
Related Party Transactions
As part of the assets and liabilities acquired from the AVID acquisition, the Company assumed a capital lease obligation for the AVID facility located in Toano, VA. The facility, which includes a 185,000 square foot manufacturing and warehouse building and approximately 12 acres of land, is owned by Micpar Realty, LLC (“Micpar”). AVID’s founder and former CEO, is a part owner of Micpar and subsequent to the acquisition of AVID, was elected to the Company’s board of directors and entered into an employment agreement with the Company on August 27, 2010.
The gross and net book value of the capital lease for the periods presented is as follows:
| March 31, 2012 |
March 31, 2011 |
|||||||
| Capital lease, gross |
$ | 11,409 | $ | 11,409 | ||||
| Less: Accumulated amortization |
(972 | ) | (358 | ) | ||||
|
|
|
|
|
|||||
| Capital lease, net |
$ | 10,437 | $ | 11,051 | ||||
|
|
|
|
|
|||||
The amortization expense associated with the capital lease amounted to $614, of which, $473 is included in our cost of sales and the remaining $141 is recorded in our selling, general and administrative expenses.
As of March 31, 2012, the capital lease requires monthly payments of $122 with increases of 2% per annum. The lease contains provisions for an option to buy in 2014 and in 2016 and expires in March 2029. The effective rate on the capital lease obligation is 9.9%. Total lease payments required under the capital lease for the five-year period ending March 31, 2017 is $7,747.
Another member of the Company’s board of directors, is currently an owner of Custom Healthcare, an assembler and packager of Class 1 medical products. Custom Healthcare is a supplier to our AVID facility located in Toano, VA for small kits and trays. Custom Healthcare is also a customer of the Company and purchases sterile instruments from our facility located in Arden, NC.
In fiscal 2012 Custom Healthcare sold approximately $1,500 in small kits and trays to the Company and purchased approximately $900 in sterile instruments from the Company.
38
Table of Contents
Off-Balance Sheet Arrangements
We do not maintain any off-balance sheet arrangements, transactions, obligations or other relationships with unconsolidated entities that would be expected to have a material current or future effect upon our financial condition or results of operations.
CRITICAL ACCOUNTING POLICIES
The Company’s significant accounting policies are summarized in Note 1 of its financial statements. While all these significant accounting policies impact its financial condition and results of operations, the Company views certain of these policies as critical. Policies determined to be critical are those policies that have the most significant impact on the Company’s financial statements and require management to use a greater degree of judgment and/or estimates. Actual results may differ from those estimates.
The Company believes that given current facts and circumstances, it is unlikely that applying any other reasonable judgments or estimate methodologies would cause a material effect on the Company’s consolidated results of operations, financial position or liquidity for the periods presented in this report.
The accounting policies identified as critical are as follows:
Revenue Recognition – Revenue from the sale of products is recognized when the Company meets all of the criteria specified in Accounting Standards Codification (“ASC”) 605, Revenue Recognition. These criteria include:
| • | Persuasive evidence of an arrangement exists; |
| • | Delivery has occurred or services have been rendered; |
| • | The seller’s price to the buyer is fixed or determinable; and |
| • | Collection of the resulting receivable is reasonably assured. |
Customer purchase orders and or sales agreements evidence the Company’s sales arrangements. These purchase orders and sales agreements specify both selling prices and quantities, which are the basis for recording sales revenue. Any deviation from this policy requires management review and approval. Trade terms are negotiated on a customer by customer basis and for the majority of the Company’s sales include that title and risk of loss pass from the Company to the customer when the Company ships products from its facilities, which is when revenue is recognized. In instances of shipments made on consignment, revenue is deferred until a customer indicates to the Company that it has used the Company’s products. The Company conducts ongoing credit evaluations of its customers and ships products only to customers that satisfy its credit evaluations. Products are shipped primarily to distributors at an agreed upon list price. Distributors then resell the products primarily to hospitals and depending on agreements between the Company, the distributors and the hospitals, the distributors may be entitled to a rebate. The Company deducts all rebates from sales and has a provision for allowances based on historical information for all rebates that have not yet been processed.
Income Taxes – We are required to compute our income taxes in each federal, state, and local jurisdiction in which we operate. This process requires that we estimate the current tax exposure as well as assess temporary differences between the accounting and tax treatment of assets and liabilities, including items such as accruals and allowances not currently deductible for tax purposes. The income tax effects of the differences we identify are classified as current or long-term deferred tax assets and liabilities in our Consolidated Balance Sheet. Our judgments, assumptions, and estimates relative to the current provision for income tax take into account current tax laws, our interpretation of current tax laws, and possible outcomes of current and future audits. Changes in tax laws or our interpretation of tax laws and the resolution of current and future tax audits could significantly impact the amounts provided for income taxes in our Consolidated Balance Sheet and Consolidated Statement of Income.
39
Table of Contents
In accordance with the provisions of ASC 740, Income Taxes, we recognize in our financial statements only those tax positions that meet the more-likely-than-not-recognition threshold. We establish tax reserves for uncertain tax positions that do not meet this threshold. Interest and penalties associated with income tax matters are included in the provision for income taxes in our consolidated statements of operations. The provisions of ASC 740 did not have a material impact on the Company’s consolidated financial position.
We must also assess the likelihood that deferred tax assets will be realized from future taxable income and, based on this assessment establish a valuation allowance, if required. The determination of our valuation allowance involves assumptions, judgments, and estimates, including forecasted earnings, future taxable income, and the relative proportions of revenue and income before taxes in the various state and local jurisdictions in which we operate. To the extent we establish a valuation allowance or change the valuation allowance in a period, we reflect the change with a corresponding increase or decrease to our tax provision in our Consolidated Statement of Income. During fiscal 2012, the Company recorded a valuation allowance of $758 against certain state net operating loss carry forwards. No other valuation allowances were required for the $3,139 of deferred tax assets that existed on the Company’s books at March 31, 2012. The total net deferred tax liability as of March 31, 2012 was $26,311.
Inventories – The Company values its inventory at the lower of the actual cost to purchase and/or manufacture or the current estimated market value of the inventory. On an ongoing basis, inventory quantities on hand are viewed and an analysis of the provision for excess and obsolete inventory is performed based primarily on the Company’s estimated sales forecast of product demand, which is based on sales history and anticipated future demand. A significant increase in the demand for the Company’s products could result in a short-term increase in the cost of inventory purchases while a significant decrease in demand could result in an increase in the amount of excess inventory quantities on hand. Additionally, the Company’s estimates of future product demand may prove to be inaccurate in which case the Company may have understated or overstated the provision required for excess and obsolete inventory. Accordingly, future adjustments to the provision may be required. Although every effort is made to ensure the accuracy of the Company’s forecasts of future product demand, any significant unanticipated changes in demand could have a significant impact on the value of the Company’s inventory and reported operating results. Historically, the Company has not experienced any significant inventory write-downs due to excess and obsolete inventory.
Goodwill and Other Intangibles – Purchase accounting requires extensive use of accounting estimates and judgments to allocate the purchase price to the fair market value of the assets and liabilities purchased, with the excess value, if any, being classified as goodwill. As a result of the Company’s acquisitions, values were assigned to intangible assets for trademarks, customer relationships, non-compete agreements and group purchasing organization contracts. Finite useful lives were assigned to these intangibles, if appropriate, and they will be amortized over their remaining life. As with any intangible asset, future write-downs may be required if the value of these assets becomes impaired.
Our goodwill is tested for impairment on an annual basis. Application of the goodwill impairment test requires judgment. The fair value is estimated using a discounted cash flow methodology. This requires significant judgments including estimation of future cash flows, which is dependent on internal forecasts, estimation of the long-term rate of growth for our business, the useful life over which cash flows will occur, and determination of our weighted average cost of capital. Changes in these estimates and assumptions could materially affect the determination of fair value and/or goodwill impairment.
Property, Plant and Equipment – Property, plant and equipment are depreciated over their useful lives. Useful lives are based on management’s estimates of the period that the asset will generate revenue. Any change in conditions that would cause management to change its estimate as to the useful lives of a group or class of assets may significantly impact the Company’s depreciation expense on a prospective basis.
40
Table of Contents
Allowance for Doubtful Accounts – The Company performs ongoing credit evaluations on its customers and adjusts credit limits based upon payment history and the customer’s current credit worthiness, as determined by a review of their current credit information. The Company continuously monitors collections and payments from customers and a provision for estimated credit losses is maintained based upon its historical experience and on specific customer collection issues that have been identified. While such credit losses have historically been within the Company’s expectations and the provisions established, the Company cannot guarantee that the same credit loss rates will be experienced in the future. Concentration risk exists relative to the Company’s accounts receivable, as 63% of the Company’s total accounts receivable balance as of March 31, 2012 is concentrated in two distributors. While the accounts receivable related to these distributors may be significant, the Company does not believe the credit loss risk to be significant given the consistent payment history of these distributors.
IMPACT OF RECENTLY ISSUED ACCOUNTING PRONOUNCEMENTS
FAIR VALUE MEASUREMENTS
In January 2010, the FASB issued authoritative guidance under ASC 820 that improves disclosures around fair value measurements. This pronouncement requires additional disclosures regarding transfers between Levels 1, 2 and 3 of the fair value hierarchy of this pronouncement as well as a more detailed reconciliation of recurring Level 3 measurements. Certain disclosure requirements of this pronouncement were effective and adopted by the Company on April 1, 2010 and did not have a material impact on the Company's financial statements. The remaining disclosure requirements of this pronouncement were effective for the Company's first quarter in fiscal 2012. The adoption of the remaining disclosure requirements did not have a material impact on the Company's financial statements. In May 2011, ASC 820 was further amended to clarify certain disclosure requirements and improve consistency with international reporting standards. This amendment is to be applied prospectively and is effective for the Company's first quarter in fiscal 2013. The Company does not expect its adoption to have a material effect on its financial statements.
PRESENTATION OF COMPREHENSIVE INCOME
In June 2011, the FASB issued authoritative guidance included in ASC 220 "Comprehensive Income" related to the presentation of comprehensive income. Specifically, the new guidance allows an entity to present components of net income and other comprehensive income in one continuous statement, referred to as the statement of comprehensive income, or in two separate, but consecutive statements. The new guidance eliminates the current option to report other comprehensive income and its components in the statement of changes in equity. While the new guidance changes the presentation of comprehensive income, there are no changes to the components that are recognized in net income or other comprehensive income under current accounting guidance. The adoption of this disclosure-only guidance will not have an impact on the Company's consolidated financial results and is effective for the Company on April 1, 2012.
GOODWILL IMPAIRMENT TESTING
In September 2011, the FASB issued authoritative guidance in ASC 350, Intangibles – Goodwill and Other, intended to simplify goodwill impairment testing. Entities will be allowed to perform a qualitative assessment on goodwill impairment to determine whether it is more likely than not (defined as having a likelihood of more than 50 percent) that the fair value of a reporting unit is less than its carrying amount as a basis for determining whether it is necessary to perform the two-step goodwill impairment test. This guidance is effective for goodwill impairment tests performed in interim and annual periods for fiscal years beginning after December 15, 2011, or the Company's third quarter of fiscal 2012. The adoption of this authoritative guidance did not have a material effect on the Company’s consolidated financial statements.
41
Table of Contents
ITEM 7A – QUANTITATIVE AND QUALITATIVE DISCLOSURES ABOUT MARKET RISK
The Company is exposed to interest rate change market risk with respect to its credit facility with a financial institution which is priced based on the alternate base rate of interest plus a spread of 3%, or at LIBOR rate plus a spread of 4%. The Company decides at its sole discretion as to whether borrowings will be at the alternate base rate or LIBOR. At March 31, 2012, $75,670 was outstanding under the Prior Credit Agreement. At June 14, 2012, $70,670 was outstanding under the Second Amended and Restated Credit Agreement. Changes in the alternate base rates or LIBOR rates during fiscal year ending March 31, 2013 will have a positive or negative effect on the Company’s interest expense. Each 1% fluctuation in the interest rate will increase or decrease interest expense for the Company by approximately $757 on an annualized basis.
A significant portion of the Company’s raw materials are purchased from China. All such purchases are transacted in U.S. dollars. The Company’s financial results, therefore, could be impacted by factors such as changes in foreign currency, exchange rates or weak economic conditions in foreign countries in the procurement of such raw materials. To date, sales of the Company’s products outside the United States have not been significant.
42
Table of Contents
ITEM 8 – FINANCIAL STATEMENTS AND SUPPLEMENTARY DATA
Consolidated Financial Statements and Schedule:
43
Table of Contents
REPORT OF INDEPENDENT REGISTERED PUBLIC ACCOUNTING FIRM
Board of Directors and Stockholders
Medical Action Industries Inc.
We have audited the accompanying consolidated balance sheets of Medical Action Industries Inc. (a Delaware corporation) and subsidiaries (the “Company”) as of March 31, 2012 and 2011, and the related consolidated statements of operations, stockholders’ equity and cash flows for each of the three years in the period ended March 31, 2012. These financial statements are the responsibility of the Company’s management. Our responsibility is to express an opinion on these financial statements based on our audits.
We conducted our audits in accordance with the standards of the Public Company Accounting Oversight Board (United States). Those standards require that we plan and perform the audit to obtain reasonable assurance about whether the financial statements are free of material misstatement. An audit includes examining, on a test basis, evidence supporting the amounts and disclosures in the financial statements. An audit also includes assessing the accounting principles used and significant estimates made by management, as well as evaluating the overall financial statement presentation. We believe that our audits provide a reasonable basis for our opinion.
In our opinion, the consolidated financial statements referred to above present fairly, in all material respects, the financial position of Medical Action Industries Inc. and subsidiaries as of March 31, 2012 and 2011, and the results of their operations and their cash flows for each of the three years in the period ended March 31, 2012 in conformity with accounting principles generally accepted in the United States of America.
We also have audited, in accordance with the standards of the Public Company Accounting Oversight Board (United States), Medical Action Industries Inc. and subsidiaries’ internal control over financial reporting as of March 31, 2012, based on criteria established in Internal Control – Integrated Framework issued by the Committee of Sponsoring Organizations of the Treadway Commission (“COSO”), and our report dated June 14, 2012 expressed an unqualified opinion thereon.
/s/ GRANT THORNTON LLP
New York, New York
June 14, 2012
44
Table of Contents
Medical Action Industries Inc.
Consolidated Balance Sheets
(In thousands, except share and per share data)
| March 31, 2012 |
March 31, 2011 |
|||||||
| Current Assets |
||||||||
| Cash and cash equivalents |
$ | 5,384 | $ | 1,691 | ||||
| Accounts receivable, less allowance for doubtful accounts of $781 at March 31, 2012 and $804 at March 31, 2011 |
30,845 | 32,330 | ||||||
| Inventories, net |
53,825 | 54,674 | ||||||
| Prepaid expenses |
1,831 | 1,702 | ||||||
| Deferred income taxes |
3,139 | 2,801 | ||||||
| Prepaid income taxes |
1,279 | 1,938 | ||||||
| Other current assets |
1,880 | 1,637 | ||||||
|
|
|
|
|
|||||
| Total Current Assets |
98,183 | 96,773 | ||||||
| Property, plant and equipment, net |
49,085 | 53,901 | ||||||
| Goodwill |
107,801 | 107,689 | ||||||
| Other intangible assets, net |
39,223 | 41,860 | ||||||
| Other assets, net |
2,852 | 3,319 | ||||||
|
|
|
|
|
|||||
| Total Assets |
$ | 297,144 | $ | 303,542 | ||||
|
|
|
|
|
|||||
| Current Liabilities |
||||||||
| Accounts payable |
$ | 11,295 | $ | 17,069 | ||||
| Accrued expenses |
18,135 | 22,235 | ||||||
| Current portion of capital lease obligation |
132 | 92 | ||||||
| Current portion of long-term debt |
8,000 | 16,360 | ||||||
|
|
|
|
|
|||||
| Total Current Liabilities |
37,562 | 55,756 | ||||||
| Deferred income taxes |
29,450 | 26,993 | ||||||
| Capital lease obligation, less current portion |
13,655 | 13,790 | ||||||
| Long-term debt, less current portion |
67,670 | 58,776 | ||||||
|
|
|
|
|
|||||
| Total Liabilities |
148,337 | 155,315 | ||||||
| Stockholders’ Equity |
||||||||
| Common stock 40,000,000 shares authorized, $.001 par value; issued and outstanding 16,390,628 shares at March 31, 2012 and 16,383,128 shares at March 31, 2011 |
16 | 16 | ||||||
| Additional paid-in capital |
34,478 | 33,799 | ||||||
| Accumulated other comprehensive loss |
(717 | ) | (437 | ) | ||||
| Retained earnings |
115,030 | 114,849 | ||||||
|
|
|
|
|
|||||
| Total Stockholders’ Equity |
148,807 | 148,227 | ||||||
|
|
|
|
|
|||||
| Total Liabilities and Stockholders’ Equity |
$ | 297,144 | $ | 303,542 | ||||
|
|
|
|
|
|||||
The accompanying notes are an integral part of these financial statements.
45
Table of Contents
Medical Action Industries Inc.
Consolidated Statements of Operations
(In thousands, except per share data)
| Fiscal Year Ended March 31, | ||||||||||||
| 2012 | 2011 | 2010 | ||||||||||
| Net sales |
$ | 437,321 | $ | 362,494 | $ | 290,146 | ||||||
| Cost of sales |
372,380 | 298,615 | 221,242 | |||||||||
|
|
|
|
|
|
|
|||||||
| Gross profit |
64,941 | 63,879 | 68,904 | |||||||||
| Selling, general and administrative expenses |
59,372 | 51,978 | 40,198 | |||||||||
|
|
|
|
|
|
|
|||||||
| Operating income |
5,569 | 11,901 | 28,706 | |||||||||
| Interest expense |
4,571 | 2,889 | 1,352 | |||||||||
| Interest income |
— | (1 | ) | (4 | ) | |||||||
|
|
|
|
|
|
|
|||||||
| Income before income taxes and extraordinary item |
998 | 9,013 | 27,358 | |||||||||
| Income tax expense |
1,272 | 3,821 | 10,517 | |||||||||
|
|
|
|
|
|
|
|||||||
| Income (loss) before extraordinary item |
(274 | ) | 5,192 | 16,841 | ||||||||
| Extraordinary gain (loss), net of applicable taxes (note 13) |
455 | (838 | ) | — | ||||||||
|
|
|
|
|
|
|
|||||||
| Net income |
$ | 181 | $ | 4,354 | $ | 16,841 | ||||||
|
|
|
|
|
|
|
|||||||
| Per share basis: |
||||||||||||
| Basic |
||||||||||||
| Income (loss) before extraordinary item |
$ | (0.02 | ) | $ | 0.32 | $ | 1.04 | |||||
| Extraordinary gain (loss), net of applicable taxes |
0.03 | (0.05 | ) | — | ||||||||
|
|
|
|
|
|
|
|||||||
| Net income |
$ | 0.01 | $ | 0.27 | $ | 1.04 | ||||||
|
|
|
|
|
|
|
|||||||
| Diluted |
||||||||||||
| Income (loss) before extraordinary item |
$ | (0.02 | ) | $ | 0.32 | $ | 1.03 | |||||
| Extraordinary gain (loss), net of applicable taxes |
0.03 | (0.05 | ) | — | ||||||||
|
|
|
|
|
|
|
|||||||
| Net income |
$ | 0.01 | $ | 0.27 | $ | 1.03 | ||||||
|
|
|
|
|
|
|
|||||||
The accompanying notes are an integral part of these financial statements.
46
Table of Contents
Medical Action Industries Inc.
Consolidated Statements of Stockholders’ Equity
(In thousands, except share data)
| Shares | Amount | Additional Paid-In Capital |
Accumulated Other Comprehensive Loss |
Retained Earnings |
Total Stockholders’ Equity |
|||||||||||||||||||
| Balance at March 31, 2009 |
16,028,161 | $ | 16 | $ | 28,602 | ($ | 267 | ) | $ | 93,654 | $ | 122,005 | ||||||||||||
|
|
|
|
|
|
|
|
|
|
|
|
|
|||||||||||||
| Net income |
— | — | — | 16,841 | 16,841 | |||||||||||||||||||
| Other comprehensive loss: |
||||||||||||||||||||||||
| Pension liability adjustment, net of tax effect of ($67) |
— | — | (107 | ) | — | (107 | ) | |||||||||||||||||
|
|
|
|||||||||||||||||||||||
| Comprehensive income |
16,734 | |||||||||||||||||||||||
|
|
|
|||||||||||||||||||||||
| Exercise of stock options, net |
316,250 | — | 2,849 | — | — | 2,849 | ||||||||||||||||||
| Amortization of deferred compensation |
— | 111 | — | — | 111 | |||||||||||||||||||
| Tax effect from vesting/cancellation of stock under restricted management stock bonus plan and the exercise of options |
— | (358 | ) | — | — | (358 | ) | |||||||||||||||||
| Stock-based compensation |
— | 1,381 | — | — | 1,381 | |||||||||||||||||||
|
|
|
|
|
|
|
|
|
|
|
|
|
|||||||||||||
| Balance at March 31, 2010 |
16,344,411 | $ | 16 | $ | 32,585 | ($ | 374 | ) | $ | 110,495 | $ | 142,722 | ||||||||||||
|
|
|
|
|
|
|
|
|
|
|
|
|
|||||||||||||
| Net income |
— | — | — | 4,354 | 4,354 | |||||||||||||||||||
| Other comprehensive loss: |
||||||||||||||||||||||||
| Pension liability adjustment, net of tax effect of ($46) |
— | — | (63 | ) | — | (63 | ) | |||||||||||||||||
|
|
|
|||||||||||||||||||||||
| Comprehensive income |
4,291 | |||||||||||||||||||||||
|
|
|
|||||||||||||||||||||||
| Exercise of stock options, net |
45,750 | — | 173 | — | — | 173 | ||||||||||||||||||
| Issuance of common stock pursuant to restricted management stock bonus plan |
7,500 | — | ||||||||||||||||||||||
| Retirement of unvested restricted stock awards |
(14,533 | ) | — | |||||||||||||||||||||
| Amortization of deferred compensation |
— | 43 | — | — | 43 | |||||||||||||||||||
| Tax effect from vesting/cancellation of stock under restricted management stock bonus plan and the exercise of options |
— | 279 | — | — | 279 | |||||||||||||||||||
| Stock-based compensation |
— | 719 | — | — | 719 | |||||||||||||||||||
|
|
|
|
|
|
|
|
|
|
|
|
|
|||||||||||||
| Balance at March 31, 2011 |
16,383,128 | $ | 16 | $ | 33,799 | ($ | 437 | ) | $ | 114,849 | $ | 148,227 | ||||||||||||
|
|
|
|
|
|
|
|
|
|
|
|
|
|||||||||||||
| Net income |
181 | 181 | ||||||||||||||||||||||
| Other comprehensive loss: |
||||||||||||||||||||||||
| Pension liability adjustment, net of tax effect of ($125) |
(280 | ) | (280 | ) | ||||||||||||||||||||
|
|
|
|||||||||||||||||||||||
| Comprehensive loss |
(99 | ) | ||||||||||||||||||||||
|
|
|
|||||||||||||||||||||||
| Exercise of stock options, net |
7,500 | — | 20 | 20 | ||||||||||||||||||||
| Amortization of deferred compensation |
20 | 20 | ||||||||||||||||||||||
| Tax effect from vesting/cancellation of stock under restricted management stock bonus plan and the exercise of options |
51 | 51 | ||||||||||||||||||||||
| Stock-based compensation |
588 | 588 | ||||||||||||||||||||||
|
|
|
|
|
|
|
|
|
|
|
|
|
|||||||||||||
| Balance at March 31, 2012 |
16,390,628 | $ | 16 | $ | 34,478 | ($ | 717 | ) | $ | 115,030 | $ | 148,807 | ||||||||||||
|
|
|
|
|
|
|
|
|
|
|
|
|
|||||||||||||
The accompanying notes are an integral part of these financial statements.
47
Table of Contents
Medical Action Industries Inc.
Consolidated Statements of Cash Flows
(In thousands)
| Fiscal Year Ended March 31, | ||||||||||||
| 2012 | 2011 | 2010 | ||||||||||
| Cash flows from operating activities: |
||||||||||||
| Net income |
$ | 181 | $ | 4,354 | $ | 16,841 | ||||||
| Adjustments to reconcile net income to net cash provided by operating activities: |
||||||||||||
| Extraordinary loss (gain) |
(700 | ) | 1,455 | — | ||||||||
| Depreciation |
5,720 | 5,553 | 4,563 | |||||||||
| Amortization |
4,289 | 3,328 | 2,169 | |||||||||
| Provision for doubtful accounts |
72 | 12 | 72 | |||||||||
| Deferred income taxes |
2,419 | 746 | 1,584 | |||||||||
| Stock-based compensation |
608 | 762 | 1,492 | |||||||||
| Excess tax (benefit) liability from stock-based compensation |
(300 | ) | 140 | 151 | ||||||||
| Loss (gain) on sale of property and equipment |
— | 19 | (422 | ) | ||||||||
| Tax benefit (expense) from exercise of warrants and options |
51 | 279 | (358 | ) | ||||||||
| Changes in operating assets and liabilities: |
||||||||||||
| Accounts receivable |
1,198 | (3,632 | ) | 3,093 | ||||||||
| Inventories |
827 | (11,787 | ) | 8,361 | ||||||||
| Prepaid expenses and other current assets |
328 | 462 | (133 | ) | ||||||||
| Prepaid income taxes |
659 | 158 | 1,799 | |||||||||
| Other assets |
(1,185 | ) | (2,098 | ) | (911 | ) | ||||||
| Accounts payable |
(5,774 | ) | 2,004 | 3,501 | ||||||||
| Accrued expenses, payroll, payroll taxes and other |
(4,380 | ) | 3,419 | 1,466 | ||||||||
|
|
|
|
|
|
|
|||||||
| Net cash provided by operating activities |
4,013 | 5,174 | 43,268 | |||||||||
|
|
|
|
|
|
|
|||||||
| Cash flows from investing activities: |
||||||||||||
| Purchase price and related acquisition costs |
125 | (62,525 | ) | — | ||||||||
| Purchases of property, plant and equipment |
(907 | ) | (3,642 | ) | (4,202 | ) | ||||||
| Proceeds from sale of property and equipment |
3 | 4 | 2,078 | |||||||||
|
|
|
|
|
|
|
|||||||
| Net cash used in investing activities |
(779 | ) | (66,163 | ) | (2,124 | ) | ||||||
|
|
|
|
|
|
|
|||||||
| Cash flows from financing activities: |
||||||||||||
| Proceeds from revolving line of credit and long-term borrowings |
105,867 | 184,823 | 12,850 | |||||||||
| Principal payments on revolving line of credit and long-term borrowings |
(105,333 | ) | (127,922 | ) | (54,622 | ) | ||||||
| Principal payments on capital lease obligations |
(95 | ) | (35 | ) | (39 | ) | ||||||
| Proceeds from exercise of employee stock options |
20 | 173 | 2,849 | |||||||||
|
|
|
|
|
|
|
|||||||
| Net cash provided by (used in) financing activities |
459 | 57,039 | (38,962 | ) | ||||||||
|
|
|
|
|
|
|
|||||||
| Net increase (decrease) in cash and cash equivalents |
3,693 | (3,950 | ) | 2,182 | ||||||||
| Cash and cash equivalents at beginning of year |
1,691 | 5,641 | 3,459 | |||||||||
|
|
|
|
|
|
|
|||||||
| Cash and cash equivalents at end of year |
$ | 5,384 | $ | 1,691 | $ | 5,641 | ||||||
|
|
|
|
|
|
|
|||||||
| Supplemental disclosures: |
||||||||||||
| Interest paid |
4,505 | 1,989 | 1,358 | |||||||||
| Income taxes paid (refunded) |
(1,304 | ) | 2,063 | 7,341 | ||||||||
The accompanying notes are an integral part of these financial statements.
48
Table of Contents
Notes to Consolidated Financial Statements
Medical Action Industries Inc. • March 31, 2012
1. ORGANIZATION AND SUMMARY OF SIGNIFICANT ACCOUNTING POLICIES
COMPANY BACKGROUND AND DESCRIPTION OF BUSINESS
Medical Action Industries Inc. (“Medical Action” or the “Company”) was incorporated under the laws of the State of New York on April 1, 1977, and re-incorporated under the laws of the State of Delaware on November 5, 1987. Headquartered in Brentwood, New York, Medical Action develops, manufactures, markets and supplies a variety of disposable medical products. The Company’s products are marketed primarily to acute care facilities in domestic and certain international markets, and in recent years has expanded its end-user markets to include physician, dental and veterinary offices, outpatient surgery centers and long-term care facilities. Medical Action is a leading manufacturer and supplier of custom procedure trays, collection systems for the containment of medical waste, minor procedure kits and trays, disposable patient utensils, sterile operating room towels and sterile laparotomy sponges. The Company’s products are marketed by its direct sales personnel and an extensive network of distributors. Medical Action has entered into preferred vendor agreements with national distributors, as well as sole source and/or committed contracts with group purchasing organizations. The Company also manufactures its products under private label programs to other distributors and medical suppliers. Medical Action’s manufacturing, packaging and warehousing activities are conducted in its Arden, North Carolina, Clarksburg, West Virginia, Gallaway, Tennessee, and Toano, Virginia facilities. The Company’s procurement of certain products and raw materials from the People’s Republic of China is administered by its office in Shanghai, China.
All dollar amounts presented in our notes to consolidated financial statements are presented in thousands, except share and per share data.
PRINCIPLES OF CONSOLIDATION
The consolidated financial statements include the accounts of the Company and its wholly-owned subsidiaries. All significant inter-company accounts and transactions have been eliminated in consolidation.
CASH EQUIVALENTS
The Company considers all highly liquid investments with an original maturity of 90 days or less to be cash equivalents. Substantially all of the Company’s cash and cash equivalents are in excess of government insurance limitations.
ACCOUNTS RECEIVABLE, ALLOWANCE FOR DOUBTFUL ACCOUNTS AND CONCENTRATION OF CREDIT RISK
Accounts receivable are comprised principally of trade accounts receivable that arise primarily from the sale of goods on account and is stated at historical cost. The Company performs ongoing credit evaluations on its customers and adjusts credit limits based upon payment history and the customer’s current credit worthiness, as determined by a review of their current credit information. The Company continuously monitors collections and payments from customers and a provision for estimated credit losses is maintained based upon its historical experience and on specific customer collection issues that have been identified. While such credit losses have historically been within the Company’s expectations and the provisions established, the Company cannot guarantee that the same credit loss rates will be experienced in the future. Concentration risk exists relative to the Company’s accounts receivable, as Owens & Minor, Inc. and Cardinal Health Inc., (the “Distributors”) accounted for approximately 37% and 26% of accounts receivable, respectively as of March 31, 2012 and 2011. While the accounts receivable related to these Distributors may be significant, the Company does not believe the credit risk to be significant given their consistent payment history.
49
Table of Contents
TRADE REBATES
We provide rebates to distributors that sell to end-user customers at prices determined under a contract between the Company and the end-user customer or distributor. The Company deducts all rebates from sales and has a provision for allowances based on historical information for all rebates that have not yet been processed. The provision for trade rebates (which is included in accounts receivable) amounted to $15,349 and $15,206 at March 31, 2012 and 2011, respectively.
INVENTORIES
Inventories are stated at the lower of cost or market net of reserve for obsolete and slow moving inventory. Cost is determined by the first-in, first-out method.
PROPERTY, PLANT AND EQUIPMENT
Property, plant and equipment are stated at cost less accumulated depreciation and amortization. Leases meeting the criteria for capitalization are recorded at the present value of future minimum lease payments. Maintenance and repairs are charged to operations as incurred and expenditures for major improvements are capitalized. The carrying amount and related accumulated depreciation of assets sold or otherwise disposed of are removed from the accounts and any resulting gain or loss is reflected in operations in the year of disposal. Accelerated methods of depreciation are used for tax purposes.
A summary of property, plant and equipment, net, is as follows:
| March 31, | ||||||||
| 2012 | 2011 | |||||||
| Land and buildings |
$ | 29,733 | $ | 29,710 | ||||
| Property under capital lease |
11,409 | 11,409 | ||||||
| Machinery and equipment |
39,386 | 38,651 | ||||||
| Furniture and fixtures |
3,866 | 3,813 | ||||||
|
|
|
|
|
|||||
| 84,394 | 83,583 | |||||||
| Less accumulated depreciation and amortization |
35,309 | 29,682 | ||||||
|
|
|
|
|
|||||
| $ | 49,085 | $ | 53,901 | |||||
|
|
|
|
|
|||||
Depreciation is calculated on the straight-line method over the estimated useful lives of the assets as follows:
| Buildings |
40 years | |
| Machinery and equipment |
5 – 20 years | |
| Furniture and fixtures |
3 – 10 years |
Depreciation and amortization of property, plant and equipment amounted to $5,720, $5,553, and $4,563 for fiscal 2012, 2011 and 2010, respectively.
GOODWILL
Goodwill is the excess of the purchase price over the fair value of identifiable net assets acquired in business combinations accounted for as purchases. Goodwill and certain other intangible assets having indefinite lives are not amortized to earnings, but instead are subject to periodic testing for impairment. Intangible assets determined to have definite lives are amortized over their remaining useful lives.
50
Table of Contents
Our goodwill is tested for impairment on an annual basis at December 31st. Application of the goodwill impairment test requires judgment. The fair value is estimated using a discounted cash flow methodology. This requires significant judgments including estimation of future cash flows, which is dependent on internal forecasts, estimation of the long-term rate of growth for our business, the useful life over which cash flows will occur, and determination of our weighted average cost of capital. Changes in these estimates and assumptions could materially affect the determination of fair value and/or goodwill impairment. The implied fair value of goodwill is determined by allocating the fair value to all of the assets (recognized and unrecognized) and liabilities in a manner similar to a purchase price allocation. The residual fair value after this allocation is the implied fair value of the goodwill.
The Company reviews for the impairment of long-lived assets and certain identifiable intangibles (including the excess of cost over fair value of net assets acquired and property and equipment) annually or whenever events or changes in circumstances indicate that the carrying amount of an asset may not be recoverable. An impairment loss would be recognized when the carrying amount of the assets exceeds its fair value. Based upon the testing performed, the Company has not identified any such impairment losses.
The change in goodwill is as follows:
| March 31, | ||||||||
| 2012 | 2011 | |||||||
| Goodwill, beginning balance |
$ | 107,689 | $ | 80,699 | ||||
| AVID purchase price allocation (note 2) |
112 | 26,990 | ||||||
|
|
|
|
|
|||||
| Goodwill, ending balance |
$ | 107,801 | $ | 107,689 | ||||
|
|
|
|
|
|||||
OTHER INTANGIBLE ASSETS
Other intangible assets, consisting of trademarks, customer relationships, group purchasing organization (“GPO”) contracts, non-competition agreements, software, intellectual property and a supply agreement are amortized according to their useful lives. The book values, accumulated amortization and original useful life by asset class as of March 31, 2012 and 2011 are as follows:
| March 31, 2012 | ||||||||||||
| Gross Carying Value |
Accumulated Amortization |
Total Net Book Value |
||||||||||
| Trademarks/Tradenames not subject to amortization |
$ | 1,266 | $ | — | $ | 1,266 | ||||||
| Trademarks subject to amortization (5 years) |
2,100 | 665 | 1,435 | |||||||||
| Customer Relationships (20 years) |
43,200 | 6,767 | 36,433 | |||||||||
| Intellectual Property (7 Years) |
400 | 311 | 89 | |||||||||
|
|
|
|
|
|
|
|||||||
| $ | 46,966 | $ | 7,743 | $ | 39,223 | |||||||
|
|
|
|
|
|
|
|||||||
| March 31, 2011 | ||||||||||||
| Gross Carying Value |
Accumulated Amortization |
Total Net Book Value |
||||||||||
| Trademarks not subject to amortization |
$ | 1,266 | $ | — | $ | 1,266 | ||||||
| Trademarks subject to amortization (5 years) |
2,100 | 245 | 1,855 | |||||||||
| Customer Relationships (20 years) |
43,200 | 4,607 | 38,593 | |||||||||
| Intellectual Property (7 Years) |
400 | 254 | 146 | |||||||||
|
|
|
|
|
|
|
|||||||
| $ | 46,966 | $ | 5,106 | $ | 41,860 | |||||||
|
|
|
|
|
|
|
|||||||
During the year ended March 31, 2011, the Company recorded $2,100 of trademarks subject to amortization and $27,500 of customer relationships in connection with the AVID Medical Inc. (“AVID”) acquisition. The
51
Table of Contents
weighted-average remaining amortization period for customer relationships as of March 31, 2012 is approximately 16.6 years.
Other intangible asset amortization expense amounted to $2,637, $2,197 and $1,429 for fiscal 2012, 2011 and 2010, respectively. Estimated amortization expense related to these intangibles for the five succeeding fiscal years is as follows:
| Fiscal Year |
Amount | |||
| 2013 |
$ | 2,637 | ||
| 2014 |
2,612 | |||
| 2015 |
2,580 | |||
| 2016 |
2,335 | |||
| 2017 |
2,160 | |||
The Company evaluates trademarks with indefinite lives annually to determine whether events or circumstances continue to support the indefinite useful life. No trademarks were determined to have finite useful lives in any of the periods presented, with the exception of the trademarks acquired in the AVID acquisition, which have a useful life of 5 years.
DEFERRED FINANCING COSTS
We have incurred costs in obtaining financing. These costs of approximately $1,084 as of March 31, 2012 were capitalized in other assets and are being amortized over the life of the related financing arrangements through fiscal 2015. Total accumulated amortization was approximately $329 and $244 at March 31, 2012 and 2011, respectively.
INCOME TAXES
We account for income taxes in accordance with the guidance issued under Accounting Standards Codification (“ASC”) 740, Income Taxes with consideration for uncertain tax positions.
The Company accounts for uncertain tax positions in accordance with authoritative guidance issued under ASC 740, which addresses the determination of whether tax benefits claimed or expected to be claimed on tax returns should be recorded in the financial statements. The Company may recognize the tax benefit from an uncertain tax position only if it is more likely than not that the future tax position will be sustained on examination by the taxing authorities based on the technical merits of the position. The tax benefits recognized in the financial statements from such position should be measured based on the largest benefit that has a greater than fifty percent likelihood of being realized upon ultimate settlement. The Company may recognize the tax benefit from an uncertain tax position only if it is more likely than not that the future tax position will be sustained. The Company classifies interest and penalties associated with income taxes as a component of income tax expense on the consolidated statements of operations.
CURRENCY
All of the Company’s sales and purchases were transacted in U.S. dollars.
STOCK-BASED COMPENSATION
We recorded stock-based compensation expense for the cost of non-qualified stock options granted under our stock plans in accordance with the provisions of ASC 718, Stock Compensation.
EARNINGS PER SHARE INFORMATION
Basic earnings per share is based on the weighted average number of common shares outstanding without consideration of potential common stock. Diluted earnings per share is based on the weighted average number of
52
Table of Contents
common and potential common shares outstanding. The calculation takes into account the shares that may be issued upon exercise of stock options and warrants, reduced by the shares that may be repurchased with the funds received from the exercise, based on average prices during the year. Excluded from the calculation of earnings per share are options to purchase 1,321,740 shares in fiscal 2012, 1,094,580 shares in fiscal 2011 and 827,055 shares in fiscal 2010, as their inclusion would have been anti-dilutive. Note 10 displays a table showing the computation of basic and diluted earnings per share.
ACCUMULATED OTHER COMPREHENSIVE LOSS
Accumulated other comprehensive loss consists of two components: net income and other accumulated comprehensive loss. Accumulated other comprehensive loss refers to revenues, expenses, gains and losses that under generally accepted accounting principles are recorded as an element of stockholders’ equity but are excluded from net income. The Company’s accumulated other comprehensive loss is comprised of an accrued benefit liability relating to the Company’s defined benefit pension plan.
The following table shows the changes in the components of other comprehensive loss (net of applicable taxes) for the fiscal years ended March 31, 2012 and 2011:
| March 31, 2012 | ||||||||
| Defined benefit pension plan |
Accumulated other comprehensive loss |
|||||||
| Beginning balance |
$ | (437 | ) | $ | (437 | ) | ||
| Current period change |
(280 | ) | (280 | ) | ||||
|
|
|
|
|
|||||
| Ending balance |
$ | (717 | ) | $ | (717 | ) | ||
|
|
|
|
|
|||||
| March 31, 2011 | ||||||||
| Defined benefit pension plan |
Accumulated other comprehensive loss |
|||||||
| Beginning balance |
$ | (374 | ) | $ | (374 | ) | ||
| Current period change |
(63 | ) | (63 | ) | ||||
|
|
|
|
|
|||||
| Ending balance |
$ | (437 | ) | $ | (437 | ) | ||
|
|
|
|
|
|||||
REVENUE RECOGNITION
Revenue from the sale of products is recognized when the Company meets all of the criteria specified in ASC 605, Revenue Recognition. These criteria include:
| • | Persuasive evidence of an arrangement exists; |
| • | Delivery has occurred or services have been rendered; |
| • | The seller’s price to the buyer is fixed or determinable; and |
| • | Collection of the resulting receivable is reasonably assured. |
Customer purchase orders and or sales agreements evidence the Company’s sales arrangements. These purchase orders and sales agreements specify both selling prices and quantities, which are the basis for recording sales revenue. Any deviation from this policy requires management review and approval. Trade terms are negotiated on a customer by customer basis and for the majority of the Company’s sales include that title and risk of loss pass from the Company to the customer when the Company ships products from its facilities, which is when revenue is recognized. In instances of shipments made on consignment, revenue is deferred until a
53
Table of Contents
customer indicates to the Company that it has used the Company’s products. The Company conducts ongoing credit evaluations of its customers and ships products only to customers that satisfy its credit evaluations. Products are shipped primarily to distributors at an agreed upon list price. Distributors then resell the products primarily to hospitals and depending on agreements between the Company, the distributors and the hospitals, the distributors may be entitled to a rebate. The Company deducts all rebates from sales and has a provision for allowances based on historical information for all rebates that have not yet been processed.
BUSINESS CONCENTRATIONS AND MAJOR CUSTOMERS
The Company manufactures and distributes disposable medical products principally to medical product distributors and hospitals located throughout the United States. The Company performs credit evaluations of its customers’ financial condition and does not require collateral. Receivables are generally due within 30 – 90 days. Credit losses relating to customers have historically been minimal and within management’s expectations.
Sales to Owens & Minor, Inc. and Cardinal Health Inc., (the “Distributors”) accounted for approximately 44% and 22% of net sales, respectively for fiscal 2012, 42% and 22% of net sales, respectively for fiscal 2011 and 40% and 26% of net sales, respectively for fiscal 2010. Although the Distributors may be deemed in a technical sense to be major purchasers of the Company’s products, they typically serve as a distributor under a purchase order or supply agreement between the end user and the Company and do not make significant purchases for their own account. The Company, therefore, does not believe it is appropriate to categorize the Distributors as actual customers.
A significant portion of the Company’s raw materials are purchased from China. All such purchases are transacted in U.S. dollars. The Company’s financial results, therefore, could be impacted by factors such as foreign currency exchange rates or weak economic conditions in foreign countries in the procurement of such raw materials.
FREIGHT AND DISTRIBUTION COSTS
Freight costs, which consist primarily of freight costs paid to third party carriers amounted to $22,838, $18,477 and $15,219 for fiscal 2012, 2011 and 2010, respectively, and are included in cost of sales. Distribution costs, which consist primarily of the salaries, warehousing and related expenses associated with the storing, picking and shipping costs of our products amounted to $7,474, $7,276 and $7,477 for fiscal 2012, 2011 and 2010, respectively, and are included in selling, general and administrative expenses.
PRODUCT DEVELOPMENT COSTS
Product development costs charged to expense were $1,921, $1,437 and $1,209 for fiscal 2012, 2011 and 2010, respectively.
ADVERTISING COSTS
Advertising costs charged to expense, as incurred, were $20, $14, and $40 for fiscal 2012, 2011 and 2010, respectively.
USE OF ESTIMATES
The preparation of financial statements in conformity with accounting principles generally accepted in the United States of America requires management to make estimates and assumptions that affect the reported amounts of assets and liabilities, such as inventories, deferred income taxes, other intangible assets, pension benefits and accrued expenses, at the date of the financial statements and the reported amounts of revenues and expenses during the reporting period. Actual results could differ from those estimates.
54
Table of Contents
FAIR VALUE MEASUREMENTS
We have adopted ASC 820, Fair Value Measurements in two steps; effective April 1, 2008, we adopted it for all financial instruments and non-financial instruments accounted for at fair value on a recurring basis and effective April 1, 2009, for all non-financial instruments accounted for at fair value on a non-recurring basis.
For financial assets and liabilities fair valued on a recurring basis, fair value is the price we would receive to sell an asset or pay to transfer a liability in an orderly transaction with a market participant at the measurement date. In the absence of active markets for the identical assets or liabilities, such measurements involve developing assumptions based on market observable data and, in the absence of such data, internal information that is consistent with what market participants would use in a hypothetical transaction that occurs at the measurement date.
Observable inputs reflect market data obtained from independent sources, while unobservable inputs reflect our market assumptions. Preference is given to observable inputs. These two types of inputs create the following fair value hierarchy:
| • | Level 1 – Quoted prices for identical instruments in active markets. |
| • | Level 2 – Quoted prices for similar instruments in active markets; quoted prices for identical or similar instruments in markets that are not active; and model-derived valuations whose inputs are observable or whose significant value drivers are observable. |
| • | Level 3 – Significant inputs to the valuation model are unobservable. |
IMPACT OF RECENTLY ISSUED ACCOUNTING PRONOUNCEMENTS
FAIR VALUE MEASUREMENTS
In January 2010, the FASB issued authoritative guidance under ASC 820 that improves disclosures around fair value measurements. This pronouncement requires additional disclosures regarding transfers between Levels 1, 2 and 3 of the fair value hierarchy of this pronouncement as well as a more detailed reconciliation of recurring Level 3 measurements. Certain disclosure requirements of this pronouncement were effective and adopted by the Company on April 1, 2010 and did not have a material impact on the Company’s financial statements. The remaining disclosure requirements of this pronouncement were effective for the Company’s first quarter in fiscal 2012. The adoption of the remaining disclosure requirements did not have a material impact on the Company’s financial statements. In May 2011, ASC 820 was further amended to clarify certain disclosure requirements and improve consistency with international reporting standards. This amendment is to be applied prospectively and is effective for the Company’s first quarter in fiscal 2013. The Company does not expect its adoption to have a material effect on its consolidated financial statements.
PRESENTATION OF COMPREHENSIVE INCOME
In June 2011, the FASB issued authoritative guidance included in ASC 220 “Comprehensive Income” related to the presentation of comprehensive income. Specifically, the new guidance allows an entity to present components of net income and other comprehensive income in one continuous statement, referred to as the statement of comprehensive income, or in two separate, but consecutive statements. The new guidance eliminates the current option to report other comprehensive income and its components in the statement of changes in equity. While the new guidance changes the presentation of comprehensive income, there are no changes to the components that are recognized in net income or other comprehensive income under current accounting guidance. The adoption of this disclosure-only guidance will not have an impact on the Company’s consolidated financial results and is effective for the Company on April 1, 2012.
GOODWILL IMPAIRMENT TESTING
In September 2011, the FASB issued authoritative guidance in ASC 350, Intangibles – Goodwill and Other, intended to simplify goodwill impairment testing. Entities will be allowed to perform a qualitative assessment on
55
Table of Contents
goodwill impairment to determine whether it is more likely than not (defined as having a likelihood of more than 50 percent) that the fair value of a reporting unit is less than its carrying amount as a basis for determining whether it is necessary to perform the two-step goodwill impairment test. This guidance is effective for goodwill impairment tests performed in interim and annual periods for fiscal years beginning after December 15, 2011, or the Company’s third quarter of fiscal 2012. The adoption of this authoritative guidance did not have a material effect on the Company’s consolidated financial statements.
2. BUSINESS ACQUISITIONS
On August 27, 2010, the Company completed its acquisition of AVID Medical Inc. (“AVID”), a provider of custom procedure trays to the healthcare industry, in which the Company acquired the outstanding shares of common stock of AVID for $62,550. One-time acquisition costs of approximately $1,335 have been expensed in accordance ASC 805, Business Combinations and are included in selling, general and administrative costs for the fiscal year ended March 31, 2011. The results of the AVID acquisition have been included in the consolidated financial statements from the date of acquisition. Net sales attributed to AVID in the Company’s consolidated statements of operations for fiscal 2012 and 2011 amounted to $138,466 and $81,468, respectively. The purpose of this acquisition is to expand our product line offering into custom procedure trays to augment our existing product classes and expand our market presence in clinical care areas of acute care facilities and surgery centers throughout the country.
Under the acquisition method of accounting, the total purchase price was allocated to AVID’s net tangible and intangible assets based on their estimated fair values as of August 27, 2010. The Company recorded the excess of the purchase price over the net tangible and intangible assets as goodwill. The initial purchase price allocation of goodwill has been adjusted in fiscal 2012 for an immaterial error related to deferred tax liabilities.
The following table summarizes the allocation of the final purchase price to the fair value of the assets acquired and liabilities assumed at the date of acquisition:
| Initial Purchase Price Allocation at August 27, 2010 |
Fiscal Year 2011 Adjustments |
Preliminary Purchase Price Allocation at March 31, 2011 |
Fiscal Year 2012 Adjustments |
Final Purchase Price Allocation at March 31, 2012 |
||||||||||||||||
| Cash |
$ | 25 | $ | — | $ | 25 | $ | — | $ | 25 | ||||||||||
| Accounts receivable, net |
11,247 | — | 11,247 | (215 | ) | 11,032 | ||||||||||||||
| Inventories |
9,482 | — | 9,482 | (22 | ) | 9,460 | ||||||||||||||
| Deferred tax assets |
881 | 321 | 1,202 | — | 1,202 | |||||||||||||||
| Other current assets |
1,392 | — | 1,392 | — | 1,392 | |||||||||||||||
| Property and equipment, net |
16,071 | — | 16,071 | — | 16,071 | |||||||||||||||
| Identifiable intangible assets: |
||||||||||||||||||||
| Customer relationships |
27,500 | — | 27,500 | — | 27,500 | |||||||||||||||
| Trademarks |
2,100 | — | 2,100 | — | 2,100 | |||||||||||||||
| Goodwill |
29,071 | (2,081 | ) | 26,990 | 112 | 27,102 | ||||||||||||||
|
|
|
|
|
|
|
|
|
|
|
|||||||||||
| Total assets acquired |
97,769 | (1,760 | ) | 96,009 | (125 | ) | 95,884 | |||||||||||||
| Less : |
||||||||||||||||||||
| Accounts payable and accrued expenses |
10,624 | (1,366 | ) | 9,258 | — | 9,258 | ||||||||||||||
| Deferred tax liabilities |
10,729 | (444 | ) | 10,285 | — | 10,285 | ||||||||||||||
| Debt, short and long term |
13,916 | — | 13,916 | — | 13,916 | |||||||||||||||
|
|
|
|
|
|
|
|
|
|
|
|||||||||||
| Total liabilities assumed |
35,269 | (1,810 | ) | 33,459 | — | 33,459 | ||||||||||||||
|
|
|
|
|
|
|
|
|
|
|
|||||||||||
| Total purchase price |
$ | 62,500 | $ | 50 | $ | 62,550 | $ | (125 | ) | $ | 62,425 | |||||||||
|
|
|
|
|
|
|
|
|
|
|
|||||||||||
The following unaudited pro forma financial information for fiscal 2011 and 2010 represent the combined results of the Company’s operations as if the acquisition of AVID had occurred on April 1, 2009. Excluded from
56
Table of Contents
the pro forma net income and net income per share amounts for the fiscal year ended March 31, 2011 are one-time acquisition costs of $1,335 attributable to the AVID acquisition. The unaudited pro forma financial information does not necessarily reflect the results of operations that would have occurred had the Company constituted a single entity during such periods presented.
| March 31, | ||||||||
| 2011 | 2010 | |||||||
| Net sales |
$ | 418,233 | $ | 415,985 | ||||
| Net income |
$ | 6,252 | $ | 19,546 | ||||
| Net income per share-basic |
$ | 0.38 | $ | 1.21 | ||||
|
|
|
|
|
|||||
| Net income per share-diluted |
$ | 0.38 | $ | 1.20 | ||||
|
|
|
|
|
|||||
3. INVENTORIES
Inventories, which are stated at the lower of cost (first-in, first-out) or market, consist of the following:
| March 31, | ||||||||
| 2012 | 2011 | |||||||
| Finished Goods, net |
$ | 29,051 | $ | 28,922 | ||||
| Raw Materials |
20,434 | 21,519 | ||||||
| Work in Progress, net |
4,340 | 4,233 | ||||||
|
|
|
|
|
|||||
| Total, net |
$ | 53,825 | $ | 54,674 | ||||
|
|
|
|
|
|||||
On a continuing basis, inventory quantities on hand are reviewed and an analysis of the provision for excess and obsolete inventory is performed based primarily on the Company’s sales history and anticipated future demand. Such provision for excess and obsolete inventory approximated $1,015 and $1,415 at March 31, 2012 and 2011, respectively.
4. ASSETS SOLD
During fiscal 2009, the Company completed the renovation of its’ new corporate headquarters located in Brentwood, NY and relocated all corporate functions to the facility, and on March 12, 2010, the Company sold all of the remaining assets, which consisted of land, building, building improvements and furniture and fixtures, associated with the executive office building located in Hauppauge, NY. The proceeds from the sale were $2,066 and the resulting $546 gain on the sale was net of a $93 selling commission recorded as other income in the “selling, general and administrative” section of the fiscal 2010 consolidated statement of operations.
5. INCOME TAXES
Income tax expense consists of the following:
| Fiscal Year Ended March 31, | ||||||||||||
| 2012 | 2011 | 2010 | ||||||||||
| Current: |
||||||||||||
| Federal |
$ | (1,185 | ) | $ | 1,826 | $ | 7,673 | |||||
| State |
338 | 672 | 1,109 | |||||||||
| Deferred |
2,119 | 1,323 | 1,735 | |||||||||
|
|
|
|
|
|
|
|||||||
| $ | 1,272 | $ | 3,821 | $ | 10,517 | |||||||
|
|
|
|
|
|
|
|||||||
57
Table of Contents
The following table indicates the significant elements contributing to the difference between the statutory federal tax rate and the Company’s effective tax rate for fiscal years 2012, 2011 and 2010:
| Fiscal Year Ended March 31, | ||||||||||||
| 2012 | 2011 | 2010 | ||||||||||
| Statutory rate |
35.0 | % | 35.0 | % | 35.0 | % | ||||||
| State taxes |
9.3 | 1.9 | 3.5 | |||||||||
| Net non-deductible (deductible) |
7.3 | 5.5 | (0.1 | ) | ||||||||
| Valuation allowance |
75.9 | — | — | |||||||||
|
|
|
|
|
|
|
|||||||
| Effective tax rate |
127.5 | % | 42.4 | % | 38.4 | % | ||||||
|
|
|
|
|
|
|
|||||||
The components of deferred tax assets and deferred tax liabilities at March 31, 2012 and 2011 are as follows:
| Fiscal Year Ended March 31, |
||||||||
| 2012 | 2011 | |||||||
| Deferred tax assets: |
||||||||
| Stock-based compensation |
$ | 1,815 | $ | 1,584 | ||||
| Inventory valuation allowance |
555 | 735 | ||||||
| Allowance for doubtful accounts |
335 | 305 | ||||||
| Accrued Expenses |
386 | — | ||||||
| Net operating loss carryforwards of acquired company |
758 | — | ||||||
| Other |
48 | 177 | ||||||
|
|
|
|
|
|||||
| 3,897 | 2,801 | |||||||
| Valuation allowance |
(758 | ) | — | |||||
|
|
|
|
|
|||||
| Total deferred tax assets |
$ | 3,139 | $ | 2,801 | ||||
|
|
|
|
|
|||||
| Deferred tax liabilities: |
||||||||
| Intangibles |
$ | 21,138 | $ | 19,338 | ||||
| Depreciation and amortization |
8,312 | 7,655 | ||||||
|
|
|
|
|
|||||
| Total deferred tax liabilities |
$ | 29,450 | $ | 26,993 | ||||
|
|
|
|
|
|||||
| Net deferred tax liability |
$ | 26,311 | $ | 24,192 | ||||
|
|
|
|
|
|||||
During fiscal 2012, the Company recorded a valuation allowance of $758 against certain state net operating loss carry forwards. In assessing whether the deferred tax asset is realizable, management considers whether it is more likely than not that some portion or all of the deferred tax assets will be realized. The ultimate realization of deferred tax assets is dependent upon the generation of future taxable income during the periods in which those temporary differences become deductible. The valuation allowance against the state net operating loss reflects management’s fourth quarter 2012 assessment that is more likely than not that the Company will not be able to utilize the state net operating loss. This net operating loss remains open for examination. The net operating loss carryover of $1,600 that was acquired upon the AVID acquisition was fully utilized during the fiscal year ended March 31, 2011.
We are subject to taxation by the United States government and various state and local jurisdictions. The IRS examination for the fiscal year ended March 31, 2010 has been finalized with no assessment. The Massachusetts examination for the fiscal years ended March 31, 2010, 2009 and 2008 commenced during the fiscal year, however, no outcome can be projected at this time. The Alabama examination for the fiscal year ended March 31, 2008 has been finalized with no material assessment. The Company has been notified by New York State that the fiscal years ended March 31, 2010 and 2009 will be reviewed. The Indiana examination for
58
Table of Contents
AVID’s fiscal years ended March 31, 2010, 2009 and 2008 has concluded with no material assessment. The Company is no longer subject to U.S. federal income tax examinations by the Internal Revenue Service and most state and local authorities for fiscal tax years ended prior to March 31, 2009 (AVID, prior to acquisition, is no longer subject to U.S. federal income tax examinations by the Internal Revenue Service and most state and local authorities for fiscal tax years ended prior to March 31, 2008).
6. ACCRUED EXPENSES
Accrued expenses consist of the following:
| March 31, | ||||||||
| 2012 | 2011 | |||||||
| Accrued payables |
$ | 4,597 | $ | 10,674 | ||||
| Employee compensation and benefits |
3,865 | 3,615 | ||||||
| Accrued distributor fees |
3,268 | 3,186 | ||||||
| Commissions |
2,278 | 1,783 | ||||||
| Other accrued liabilities |
2,304 | 1,667 | ||||||
| Freight and duty |
878 | 721 | ||||||
| Professional fees |
945 | 589 | ||||||
|
|
|
|
|
|||||
| Total accrued expenses |
$ | 18,135 | $ | 22,235 | ||||
|
|
|
|
|
|||||
7. LEASES
As part of the assets and liabilities acquired as a result of the AVID acquisition, the Company assumed a capital lease obligation for the AVID facility located in Toano, VA. The facility, which includes a 185,000 square foot manufacturing and warehouse building and approximately 12 acres of land, is owned by Micpar Realty, LLC (“Micpar”). AVID’s founder, former CEO and principal stockholder, is a part owner of Micpar and subsequent to the acquisition of AVID was appointed to the Company’s board of directors and entered into an employment agreement with the Company on August 27, 2010. As of March 31, 2012, the capital lease requires monthly payments of $122 with increases of 2% per annum. The lease contains provisions for an option to buy after three and five years and expires in March 2029. The effective rate on the capital lease obligation is 9.9%.
The gross and net book value of the capital lease is as follows:
| March 31, | ||||||||
| 2012 | 2011 | |||||||
| Capital lease, gross |
$ | 11,409 | $ | 11,409 | ||||
| Less: Accumulated amortization |
(972 | ) | (358 | ) | ||||
|
|
|
|
|
|||||
| Capital lease, net |
$ | 10,437 | $ | 11,051 | ||||
|
|
|
|
|
|||||
The amortization expense associated with the capital lease amounted to $614, of which, $473 is included in our cost of sales and the remaining $141 is recorded in our selling, general and administrative expenses.
The Company also leases certain equipment, vehicles and office facilities under non-cancelable operating leases expiring in various years though fiscal 2016.
59
Table of Contents
As of March 31, 2012, the Company was obligated under non-cancelable operating leases and capital leases for equipment, vehicles and office, warehousing and manufacturing facilities for minimum annual rental payments as follows:
| Fiscal Year |
Capital Lease |
Operating Leases |
||||||
| 2013 |
$ | 1,489 | $ | 832 | ||||
| 2014 |
1,518 | 329 | ||||||
| 2015 |
1,549 | 113 | ||||||
| 2016 |
1,580 | 21 | ||||||
| 2017 |
1,611 | 8 | ||||||
| Thereafter |
22,042 | — | ||||||
|
|
|
|
|
|||||
| Total minimum lease payments |
$ | 29,789 | $ | 1,303 | ||||
|
|
|
|||||||
| Less: Amounts representing interest |
(16,002 | ) | ||||||
|
|
|
|||||||
| Present value of minimum lease payments |
$ | 13,787 | ||||||
| Less: Current portion of capital lease obligation |
(132 | ) | ||||||
|
|
|
|||||||
| Long-term portion of capital lease obligation |
$ | 13,655 | ||||||
|
|
|
|||||||
Rental expense under operating leases amounted to $789, $482 and $379 during fiscal 2012, 2011 and 2010, respectively.
8. LONG-TERM DEBT
Long-term debt consists of the following:
| March 31, | ||||||||
| 2012 | 2011 | |||||||
| Revolving Credit Facility (a) |
$ | 19,670 | $ | 2,136 | ||||
| Term Loan (a) |
56,000 | 72,000 | ||||||
| Industrial Revenue Bond (b) |
— | 1,000 | ||||||
|
|
|
|
|
|||||
| $ | 75,670 | $ | 75,136 | |||||
| Less: current portion |
8,000 | 16,360 | ||||||
|
|
|
|
|
|||||
| Total long-term debt |
$ | 67,670 | $ | 58,776 | ||||
|
|
|
|
|
|||||
| (a) | On June 7, 2012, the Company entered into the Second Amended and Restated Credit Agreement (the “New Credit Agreement”) with certain lenders and a bank acting as administrative agent for the lenders. The New Credit Agreement modified certain terms and conditions of the First Amended and Restated Credit Agreement (the “Prior Credit Agreement”) dated August 27, 2010 with such lenders. The Prior Credit Agreement provided the Company with total borrowings of up to $110,000, consisting of (i) a secured term loan with a principal amount of $80,000 and (ii) a revolving credit facility up to $30,000. The Prior Credit Agreement was used to repay a previous term loan and to fund the acquisition of AVID. The New Credit Agreement provides the Company with total borrowings of up to $76,000, consisting of (i) a secured term loan with a principal amount of $51,000 and (ii) a secured revolving credit facility, which amounts may be borrowed, repaid and re-borrowed up to $25,000. |
The New Credit Agreement, which expires June 30, 2014, shall be used to finance the working capital needs and general corporate purposes of the Company and for permitted acquisitions. Under the Prior Credit Agreement, the term loan required consecutive quarterly installments of $4,000 on the last day of each March, June, September and December thereafter, with the final payment due August 27, 2015. Upon termination of the Prior Credit Agreement, the Company paid $5,000 against the principal of the term loan
60
Table of Contents
on June 7, 2012. Under the New Credit Agreement, the term loan matures as follows; (i) $1,000 on September 30, 2012, December 31, 2012 and March 31, 2013, (ii) $2,000 on June 30, 2013 and September 30, 2013, (iii) $2,250 on December 31, 2013 and March 31, 2014 and (iv) $39,500 on June 30, 2014. The balance sheet classification of the Company’s debt at March 31, 2012 is based on the payment made on June 7, 2012 and the maturity terms of the New Credit Agreement entered into on June 7, 2012.
Both the term loan and the revolving credit facility bear interest at LIBOR plus up to 3.5% and LIBOR plus 4% under the terms of the Prior and New Credit Agreements, respectively. The average interest rate on the term loan under the Prior Credit Agreement approximated 3.57% and 3.10%, during the fiscal years ended March 31, 2012 and 2011, respectively, and the average interest rate on the revolving credit facility under the Prior Credit Agreement approximated 5.65% and 4.79%, during the fiscal years ended March 31, 2012 and 2011, respectively. The Company’s availability under the revolving credit facility under the Prior Credit Agreement amounted to $5,330 as of March 31, 2012.
Borrowings under the Previous and New Credit Agreement are collateralized by substantially all the assets of the Company and its subsidiaries, and the agreement contains certain restrictive covenants, which, among other matters, impose limitations with respect to the incurrence of indebtedness, granting of liens, guarantees of obligations, mergers, acquisitions, capital expenditures, making loans or investments, specified sales of assets and prohibits the declaration and payment of dividends. The Company is also required to comply with specified financial covenants relating to (i) maximum annual capital expenditures of $4,000, (ii) a minimum fixed charge coverage ratio of 1.00 to 1.00 on a rolling four fiscal quarter basis and (iii) minimum earnings before interest, taxes, depreciation and amortization for certain specified quarterly periods through the expiration of the loans, including $3,000 for the fiscal quarter ending on June 30, 2012, $7,500 for the two consecutive fiscal quarter period ending September 30, 2012, $13,750 for the three consecutive quarter period ending December 31, 2012, $18,000 for the four consecutive fiscal quarter period ending March 31, 2013 and $21,000 for the four consecutive fiscal quarter period ending June 30, 2013. In addition, the Company has committed to certain post-closing conditions, including providing monthly financial statements, quarterly updates of financial projections and filed mortgages on our North Carolina, West Virginia and Tennessee facilities. As of June 14, 2012, the Company is in compliance with all covenants and financial ratios under the New Credit Agreement.
In addition, a borrowing base has been added to the New Credit Agreement such that the total outstanding loans plus available commitments thereunder may not exceed the specified percentages of the value of eligible receivables, inventory, equipment, real property plus a permitted overadvance amount, all calculated monthly. In the event outstanding amounts of loans under the New Credit Agreement exceed this borrowing base, the Company would be required to prepay the excess.
| (b) | Amounts payable represent principal payments due in connection with the issuance and sale by The Buncombe County Industrial Facilities and Pollution Control Financing Authority of its $5,500 Industrial Development Revenue Bonds (Medical Action Industries Inc. Project), Series 1997 (the “Bonds”). In July 2011, the company elected to pay off the remaining principal of $910 and $1 in interest. |
Maturities of long-term debt are as follows;
| Fiscal Year |
Amount | |||
| 2013 |
$ | 8,000 | ||
| 2014 |
8,500 | |||
| 2015 |
59,170 | |||
|
|
|
|||
| Total |
$ | 75,670 | ||
|
|
|
|||
61
Table of Contents
The Company has unamortized deferred financing costs of $755 and $881 included in other assets, net at March 31, 2012 and 2011, respectively. These costs relate to the Company’s term loan and revolving credit agreement. These costs are being amortized as follows:
| Fiscal Year |
Amount | |||
| 2013 |
$ | 336 | ||
| 2014 |
336 | |||
| 2015 |
83 | |||
|
|
|
|||
| Total |
$ | 755 | ||
|
|
|
|||
9. FAIR VALUE MEASURMENTS
We adopted ASC 820, Fair Value Measurements in two steps; effective April 1, 2008, we adopted it for all financial instruments and non-financial instruments accounted for at fair value on a recurring basis and effective April 1, 2009, for all non-financial instruments accounted for at fair value on a non-recurring basis. This guidance establishes a new framework for measuring fair value and expands related disclosures. Broadly, the framework requires fair value to be determined based on the exchange price that would be received for an asset or paid to transfer a liability (an exit price) in the principal or most advantageous market for the asset or liability in an orderly transaction between market participants. It also establishes a three-level valuation hierarchy based upon observable and non-observable inputs.
The following table provides the assets and liabilities carried at fair value measured on a recurring basis as of March 31, 2012 and 2011:
| Fair Value Measurements at March 31, 2012 | ||||||||||||||||
| Carrying Value |
Level 1 | Level 2 | Level 3 | |||||||||||||
| Cash and cash equivalents |
$ | 5,384 | $ | 5,384 | $ | — | $ | — | ||||||||
| Accounts receivable, net |
$ | 30,845 | $ | 30,845 | $ | — | $ | — | ||||||||
| Accounts payable |
$ | 11,295 | $ | 11,295 | $ | — | $ | — | ||||||||
| Current portion of long-term debt |
$ | 8,000 | $ | 8,000 | $ | — | $ | — | ||||||||
| Long-term debt |
$ | 67,670 | $ | 67,670 | $ | — | $ | — | ||||||||
| Fair Value Measurements at March 31, 2011 | ||||||||||||||||
| Carrying Value |
Level 1 | Level 2 | Level 3 | |||||||||||||
| Cash and cash equivalents |
$ | 1,691 | $ | 1,691 | $ | — | $ | — | ||||||||
| Accounts receivable, net |
$ | 32,330 | $ | 32,330 | $ | — | $ | — | ||||||||
| Accounts payable |
$ | 17,069 | $ | 17,069 | $ | — | $ | — | ||||||||
| Current portion of long-term debt |
$ | 16,360 | $ | 16,360 | $ | — | $ | — | ||||||||
| Long-term debt |
$ | 58,776 | $ | 58,776 | $ | — | $ | — | ||||||||
62
Table of Contents
10. EARNINGS PER SHARE
The following is a reconciliation of the numerator and denominator of the basic and diluted net earnings per share computations for fiscal 2012, 2011 and 2010, respectively.
| March 31, | ||||||||||||
| 2012 | 2011 | 2010 | ||||||||||
| Numerator: |
||||||||||||
| Income (loss) before extraordinary item |
$ | (274 | ) | $ | 5,192 | $ | 16,841 | |||||
| Extraordinary gain (loss), net of applicable taxes (note 13) |
455 | (838 | ) | — | ||||||||
|
|
|
|
|
|
|
|||||||
| Net income for basic and diluted earnings per share |
$ | 181 | $ | 4,354 | $ | 16,841 | ||||||
|
|
|
|
|
|
|
|||||||
| Denominator: |
||||||||||||
| Denominator for basic earnings per share – weighted average shares |
16,390,587 | 16,353,778 | 16,132,161 | |||||||||
|
|
|
|
|
|
|
|||||||
| Effect of dilutive securities: |
||||||||||||
| Employee and director stock options |
22 | 36,081 | 142,615 | |||||||||
|
|
|
|
|
|
|
|||||||
| Denominator for diluted earnings per share – adjusted weighted average shares |
16,390,609 | 16,389,859 | 16,274,776 | |||||||||
|
|
|
|
|
|
|
|||||||
| Per share basis: |
||||||||||||
| Basic |
||||||||||||
| Income (loss) before extraordinary item |
$ | (0.02 | ) | $ | 0.32 | $ | 1.04 | |||||
| Extraordinary gain (loss) (net of applicable taxes) |
0.03 | (0.05 | ) | — | ||||||||
|
|
|
|
|
|
|
|||||||
| Net income |
$ | 0.01 | $ | 0.27 | $ | 1.04 | ||||||
|
|
|
|
|
|
|
|||||||
| Diluted |
||||||||||||
| Income (loss) before extraordinary item |
$ | (0.02 | ) | $ | 0.32 | $ | 1.03 | |||||
| Extraordinary (gain) loss (net of applicable taxes) |
0.03 | (0.05 | ) | — | ||||||||
|
|
|
|
|
|
|
|||||||
| Net income |
$ | 0.01 | $ | 0.27 | $ | 1.03 | ||||||
|
|
|
|
|
|
|
|||||||
11. STOCKHOLDERS’ EQUITY AND STOCK PLANS
We account for our three stock-based compensation plans in accordance with the provisions of ASC 718, Stock Compensation. Under the provisions of ASC 718, stock-based compensation cost is measured at the grant date, based on the calculated fair value of the grants, and is recognized as an expense over the service period applicable to the grantee. The service period is the period of time that the grantee must provide services to the Company before the stock-based compensation is fully vested. Stock-based compensation expense for the non-vested portion of awards granted prior to the effective date is being recognized over the remaining service period using the fair-value based compensation cost estimated under the provisions of ASC 718.
STOCK OPTIONS
The Company currently grants stock options under the 1989 Non-Qualified Stock Option Plan (the “Non-Qualified Option Plan”), the 1994 Stock Incentive Plan (the “Incentive Plan”) and the 1996 Non-Employee Director Stock Option Plan (the “Director Plan”). The Non-Qualified Option Plan was approved by the Company’s Board of Directors and stockholders and provides for the grant of stock options with an exercise price equal to the fair market price or at a value that is not less than 85% of the fair market value on the date of grant and are exercisable in three installments on the second, third and fourth anniversary of the date of grant. The Incentive Plan was adopted by the Company’s Board of Directors and stockholders and provides for the granting of incentive stock options, shares of restricted stock and non-qualified stock options to all officers and key employees of the Company and its affiliates at an exercise price that may not be less than the fair market
63
Table of Contents
value of a share of common stock at the time of grant. The Director Plan was approved by the stockholders in August 1996 and as amended, grants each non-employee director of the Company an option to purchase 7,500 shares of the Company’s common stock after each year of service. All options granted under the above plans expire from five to ten years from the date of grant unless the employment is terminated, in which event, subject to certain exceptions, the options terminate two months subsequent to date of termination.
RESTRICTED STOCK AWARDS
Grants of restricted stock are common stock awards granted to recipients with specified vesting provisions. The restricted stock issued vests based upon the recipients continued service over time (five-year vesting period). The Company estimates the fair value of restricted stock based on the Company’s closing stock price on the date of grant.
The following is a summary of the changes in restricted stock granted under the 1994 Stock Incentive Plan for the fiscal years presented:
| Fiscal Year Ended March 31, | ||||||||||||||||||||||||
| 2012 | 2011 | 2010 | ||||||||||||||||||||||
| Shares | Weighted Average Price |
Shares | Weighted Average Price |
Shares | Weighted Average Price |
|||||||||||||||||||
| Beginning Balance |
7,967 | $ | 12.74 | 7,499 | $ | 14.92 | 27,186 | $ | 14.87 | |||||||||||||||
| Granted |
— | $ | — | 7,500 | $ | 12.58 | — | $ | — | |||||||||||||||
| Vested |
(467 | ) | $ | 15.31 | (5,157 | ) | $ | 14.91 | (7,031 | ) | $ | 14.90 | ||||||||||||
| Cancelled |
— | $ | — | (1,875 | ) | $ | 14.87 | (12,656 | ) | $ | 14.81 | |||||||||||||
|
|
|
|
|
|
|
|
|
|
|
|
|
|||||||||||||
| Ending Balance |
7,500 | $ | 12.74 | 7,967 | $ | 12.74 | 7,499 | $ | 14.92 | |||||||||||||||
|
|
|
|
|
|
|
|
|
|
|
|
|
|||||||||||||
VALUATION ASSUMPTIONS
The fair value of each option grant is estimated on the date of the grant using the Black-Scholes options pricing model. Use of a valuation model requires management to make certain assumptions with respect to selected model inputs. The expected term of the options is based on evaluations of historical and expected future employee exercise behavior. The risk-free rate is based on the U.S. Treasury rates at the date of grant with maturity dates approximately equal to the life of the grant. The expected volatility is based on the historical volatility of the Company’s stock. The following table summarizes the assumptions used to determine the fair value of options granted during the following periods:
| March 31, | ||||||||||||
| 2012 | 2011 | 2010 | ||||||||||
| Expected dividend yield |
0 | % | 0 | % | 0 | % | ||||||
| Expected volatility |
64.44 | % | 60.06 | % | 56.43 | % | ||||||
| Risk-free interest rate |
2.36 | % | 3.31 | % | 3.54 | % | ||||||
| Expected life (years) |
5.33 | 5.33 | 5.33 | |||||||||
STOCK-BASED COMPENSATION EXPENSE
The Company recognized stock-based compensation expense (before deferred income tax benefits) for awards granted under the Company’s stock option plans in the following line items in the consolidated statements of operations for fiscal 2012, 2011 and 2010:
| 2012 | 2011 | 2010 | ||||||||||
| Cost of sales |
$ | 41 | $ | 126 | $ | 180 | ||||||
| Selling, general and administrative expenses |
567 | 636 | 1,312 | |||||||||
|
|
|
|
|
|
|
|||||||
| Stock-based compensation expense before income tax benefits |
$ | 608 | $ | 762 | $ | 1,492 | ||||||
|
|
|
|
|
|
|
|||||||
Net income was impacted by $395, $439 and $918 in stock-based compensation expense or $.02, $.03 and $.06 per diluted share for fiscal 2012, 2011 and 2010, respectively.
64
Table of Contents
Information regarding the Company’s stock options activity for fiscal 2010, 2011 and 2012 are summarized below:
| Number of Options |
Weighted Average Exercise Price |
Weighted Average Remaining Contractual Life (years) |
Aggregate Intrinsic Value |
|||||||||||||
| Options outstanding at March 31, 2009 |
1,515,062 | $ | 12.85 | |||||||||||||
|
|
|
|
|
|||||||||||||
| Granted |
343,000 | 10.80 | ||||||||||||||
| Exercised |
(316,250 | ) | 9.01 | |||||||||||||
| Forfeited |
(222,250 | ) | 14.93 | |||||||||||||
|
|
|
|
|
|||||||||||||
| Options outstanding at March 31, 2010 |
1,319,562 | $ | 12.88 | |||||||||||||
|
|
|
|
|
|||||||||||||
| Granted |
285,750 | 11.33 | ||||||||||||||
| Exercised |
(45,750 | ) | 3.78 | |||||||||||||
| Forfeited |
(230,625 | ) | 14.74 | |||||||||||||
|
|
|
|
|
|||||||||||||
| Options outstanding at March 31, 2011 |
1,328,937 | $ | 12.62 | |||||||||||||
|
|
|
|
|
|||||||||||||
| Granted |
30,000 | 5.24 | ||||||||||||||
| Exercised |
(7,500 | ) | 2.67 | |||||||||||||
| Forfeited |
(3,000 | ) | 8.87 | |||||||||||||
|
|
|
|
|
|||||||||||||
| Options outstanding at March 31, 2012 |
1,348,437 | $ | 12.44 | 5.2 | $ | 14 | ||||||||||
|
|
|
|
|
|
|
|
|
|||||||||
| Exercisable at March 31, 2012 |
934,904 | $ | 13.16 | 4.1 | $ | — | ||||||||||
|
|
|
|
|
|
|
|
|
|||||||||
The total fair value of shares vested during the fiscal year ended March 31, 2012 was $727. As of March 31, 2012, there was $2,436 of total unrecognized compensation cost related to non-vested share-based compensation arrangements granted under the Company’s plans and is expected to be recognized over a weighted average period of 2.1 years.
Summarized information about stock options outstanding as of March 31, 2012 and 2011 is as follows:
| 2012 | ||||||||||||||||||||||
| Outstanding | Exercisable | |||||||||||||||||||||
| Range of Exercise Prices per Common Share |
Options | Weighted Average Remaining Contractual Life (Years) |
Weighted Average Exercise Price per Common Share |
Options | Weighted Average Exercise Price per Common Share |
|||||||||||||||||
| $ 2.67 – $10.97 |
542,187 | 4.9 | $ | 9.54 | 325,154 | $ | 9.39 | |||||||||||||||
| $10.98 – $ 19.36 |
686,050 | 5.5 | 13.11 | 489,550 | 13.56 | |||||||||||||||||
| $19.37 – $ 23.27 |
120,200 | 5.2 | 21.72 | 120,200 | 21.72 | |||||||||||||||||
|
|
|
|
|
|
|
|
|
|
|
|
||||||||||||
| $ 2.67 – $ 23.27 |
1,348,437 | 5.2 | $ | 12.44 | 934,904 | $ | 13.16 | |||||||||||||||
|
|
|
|
|
|
|
|
|
|
|
|
||||||||||||
| 2011 | ||||||||||||||||||||||
| Outstanding | Exercisable | |||||||||||||||||||||
| Range of Exercise Prices per Common Share |
Options | Weighted Average Remaining Contractual Life (Years) |
Weighted Average Exercise Price per Common Share |
Options |
|
Weighted Average Exercise Price per Common Share |
||||||||||||||||
| $ 2.67 – $10.97 |
481,937 | 5.1 | $ | 9.64 | 299,000 | $ | 9.09 | |||||||||||||||
| $10.98 – $ 19.36 |
686,050 | 6.5 | 13.11 | 408,113 | 13.30 | |||||||||||||||||
| $19.37 – $ 23.27 |
120,200 | 6.2 | 21.72 | 120,200 | 21.72 | |||||||||||||||||
|
|
|
|
|
|
|
|
|
|
|
|
||||||||||||
| $ 2.67 – $ 23.27 |
1,288,187 | 6.0 | $ | 12.62 | 827,312 | $ | 13.00 | |||||||||||||||
|
|
|
|
|
|
|
|
|
|
|
|
||||||||||||
65
Table of Contents
The aggregate pre-tax intrinsic value (the difference between the Company’s closing stock price on the last trading day of fiscal 2012 and the exercise price, multiplied by the number of in-the-money options) that would have been received by the option holders had all option holders exercised their options on March 31, 2012 was $14. This amount changes based on the fair market value of the Company’s stock. The total intrinsic value of options exercised for fiscal 2012, 2011 and 2010 amounted to $47, $243 and $1,739, respectively.
The following is a summary of changes in non-vested stock options for the fiscal year ended March 31, 2012:
| Shares | Weighted Average Grant Date Fair Value |
|||||||
| Non-vested shares at April 1, 2011 |
501,625 | $ | 6.13 | |||||
| Granted |
30,000 | 2.99 | ||||||
| Forfeited |
— | — | ||||||
| Vested |
(118,092 | ) | 6.16 | |||||
|
|
|
|
|
|||||
| Non-vested shares at March 31, 2012 |
413,533 | $ | 5.89 | |||||
|
|
|
|
|
|||||
The options and bonus shares available for future issuance as of March 31, 2012 are shown below:
| 1989 Non-Qualified Option Plan |
1994 Stock Incentive Plan |
1996 Directors Stock Option Plan |
Total | |||||||||||||
| Authorized by Directors and Stockholders |
3,975,000 | 3,525,000 | 750,000 | 8,250,000 | ||||||||||||
| Options previously exercised |
(3,214,687 | ) | (2,025,187 | ) | (100,000 | ) | (5,339,874 | ) | ||||||||
| Bonus shares previously granted |
— | (93,750 | ) | — | (93,750 | ) | ||||||||||
| Options outstanding |
(438,000 | ) | (807,937 | ) | (102,500 | ) | (1,348,437 | ) | ||||||||
|
|
|
|
|
|
|
|
|
|||||||||
| Remaining for future issuance |
322,313 | 598,126 | 547,500 | 1,467,939 | ||||||||||||
|
|
|
|
|
|
|
|
|
|||||||||
12. RETIREMENT PLANS
401(k) PLAN
Effective January 1, 2010, the Company amended its 401(k) retirement plan to be subject to the provisions of a “Safe Harbor” 401(k) plan. Under the provisions of the Safe Harbor plan, any discretionary matching company contribution becomes 100% vested upon match. The plan provides for a discretionary match of up to 4% of an eligible employee’s compensation. Under the prior plan, adopted in April 1988, any remaining unvested company discretionary matching contributions are subject to a four (4) year vesting schedule. The Company’s contributions, under both the 1988 plan and the Safe Harbor plan, amounted to $745 in fiscal 2012, $564 in fiscal 2011 and $365 in fiscal 2010.
DEFINED BENEFIT PLAN
The Company assumed a defined benefit pension plan (the “Plan”) with the Medegen Medical Products, LLC (“MMP”) acquisition. The Plan covers certain employees of MMP who are members of the Service Employees International Union. The benefit accruals for the Plan were frozen as of December 31, 1999. The Company’s funding policy is to make the minimum annual contributions required by applicable regulations. Such contributions are expected to amount to $116 during fiscal 2013.
66
Table of Contents
The following table sets forth the Plan’s funded status and amount recognized in the Company’s financial statements as of and for the fiscal years ended March 31, 2012 and 2011:
| 2012 | 2011 | |||||||
| Change in projected benefit obligation: |
||||||||
| Benefit obligation at beginning of year |
$ | 1,457 | $ | 1,314 | ||||
| Service cost |
— | — | ||||||
| Interest cost |
81 | 79 | ||||||
| Actuarial loss |
273 | 106 | ||||||
| Benefits paid |
(50 | ) | (42 | ) | ||||
|
|
|
|
|
|||||
| Benefit obligation at end of year |
$ | 1,761 | $ | 1,457 | ||||
|
|
|
|
|
|||||
| Change in plan assets: |
||||||||
| Fair value of plan assets at beginning of year |
$ | 954 | $ | 792 | ||||
| Actual return on plan assets |
26 | 74 | ||||||
| Employer contributions |
99 | 130 | ||||||
| Benefits paid |
(50 | ) | (42 | ) | ||||
|
|
|
|
|
|||||
| Fair value of plan assets at end of year |
$ | 1,029 | $ | 954 | ||||
|
|
|
|
|
|||||
| Funded status at end of the year |
$ | (732 | ) | $ | (503 | ) | ||
|
|
|
|
|
|||||
| Amounts recognized on the balance sheet consist of: |
||||||||
| Current liabilities |
$ | (732 | ) | $ | (503 | ) | ||
| Accumulated other comprehensive loss |
717 | 437 | ||||||
| Net amount recognized |
$ | (15 | ) | $ | (66 | ) | ||
|
|
|
|
|
|||||
The major categories of assets held by the Plan, measured at Level 1 fair value, as of March 31, 2012 and 2011, were as follows:
| 2012 | 2011 | |||||||
| Cash and cash equivalents |
$ | 21 | $ | 19 | ||||
| Debt securities |
358 | 595 | ||||||
| Equity securities |
650 | 340 | ||||||
|
|
|
|
|
|||||
| Total investments |
$ | 1,029 | $ | 954 | ||||
|
|
|
|
|
|||||
The net periodic pension cost for the years ended March 31, 2012 and 2011 were as follows:
| 2012 | 2011 | |||||||
| Service cost – benefits earned during the period |
$ | — | $ | — | ||||
| Interest cost on projected benefit obligation |
81 | 79 | ||||||
| Loss on assets |
(59 | ) | (51 | ) | ||||
| Net amortization and deferral |
26 | 20 | ||||||
|
|
|
|
|
|||||
| Net periodic pension cost |
$ | 48 | $ | 48 | ||||
|
|
|
|
|
|||||
The following are weighted-average assumptions used to determine benefit obligations as of March 31, 2012 and 2011:
| 2012 | 2011 | |||||||
| Discount rate |
4.49 | % | 5.66 | % | ||||
| Rate of compensation increase |
none assumed | none assumed | ||||||
67
Table of Contents
The following are weighted-average assumptions used to determine net periodic benefit cost for the years ended March 31, 2012 and 2011:
| 2012 | 2011 | |||||||
| Discount rate |
5.66 | % | 6.14 | % | ||||
| Expected long-term return on plan assets |
6.00 | % | 6.00 | % | ||||
| Rate of compensation increase |
none assumed | none assumed | ||||||
The Company’s investment policy for the Plan’s assets is to balance risk and return through a diversified portfolio of marketable securities, including common and preferred stocks, convertible securities, government, municipal and corporate bonds, mutual and collective investment funds and short-term money market instruments. Maturities for fixed income securities are managed so that sufficient liquidity exists to meet near-term benefit-payment obligations. The expected rate of return on plan assets is based upon expectations of long-term average rates of return to be achieved by the underlying investment portfolios. In establishing this assumption, the Company considers historical and expected rates of return for the asset classes in which the Plan’s assets are invested, as well as current economic and capital market conditions.
Weighted-average asset allocation by asset category as of March 31, 2012 and 2011 were as follows:
| Target Range | 2012 | 2011 | ||||||||
| Cash |
0%-20% | 2 | % | 2 | % | |||||
| Debt securities |
10%-70% | 63 | % | 62 | % | |||||
| Equity securities |
30%-90% | 35 | % | 36 | % | |||||
|
|
|
|
|
|||||||
| Total |
100 | % | 100 | % | ||||||
|
|
|
|
|
|||||||
Benefits paid were $50 and $42 for fiscal 2012 and 2011, respectively. The Company estimates the following future benefit payments under the plan for the fiscal years ending March 31:
| Fiscal Year |
Amount | |||
| 2013 |
$ | 54 | ||
| 2014 |
53 | |||
| 2015 |
54 | |||
| 2016 |
61 | |||
| 2017 |
65 | |||
| 2017-2022 |
402 | |||
|
|
|
|||
| $ | 689 | |||
|
|
|
|||
13. EXTRAORDINARY ITEMS
During fiscal 2012, the Company recorded an extraordinary gain of $455 (net of tax expense of $245) as a result of an insurance settlement relating to inventories damaged in fiscal 2011 as a result of weather-related water damage.
During fiscal 2011, the Company incurred an extraordinary loss of $838 (net of tax benefit of $617) relating to inventories damaged as a result of weather-related water damage. The inventories damaged were predominantly patient bedside disposables and did not negatively impact the Company’s service levels with respect to this product class.
14. OTHER MATTERS
The Company is a party to two lawsuits arising out of the conduct of its ordinary course of business. Both lawsuits are covered by insurance and while the results of such lawsuits cannot be predicted with certainty,
68
Table of Contents
management does not expect that the ultimate liabilities, if any, will have a material adverse effect on the financial position or results of operations of the Company.
The Company operates in one industry, disposable medical products.
The Company’s international sales were $8,180, $8,140 and $8,319 for fiscal 2012, 2011 and 2010, respectively. The majority of these sales were to customers based in North America.
The Company has entered into agreements with five of its executive officers and a vice president, which provide certain benefits in the event of a change in control of the Company. A “change in control” of the Company is defined as, in general, the acquisition by any person of beneficial ownership of 20% or more of the voting stock of the Company, certain business combinations involving the Company or a change in a majority of the incumbent members of the Board of Directors, except for changes in the majority of such members approved by such members. If, within two years after a change in control, the Company or, in certain circumstances, the executive, terminates his employment, the executive is entitled to a severance payment equal to three times (i) such executive’s highest annual salary within the five-year period preceding termination plus (ii) a bonus increment equal to the average of the two highest of the last five bonuses paid to such executive. In addition, the executive is entitled to the continuation of all employment benefits for a three-year period, the vesting of all stock options and certain other benefits. As of March 31, 2012, the estimated potential aggregate compensation payable to these five executive officers and vice president under the Company’s compensation and benefit plans and arrangements in the event of termination of such executive’s employment following a change in control amounted to approximately $8,918.
The Medegen Tennessee facility is comprised of approximately 25 acres in a light industrial park, located in Gallaway, TN and was acquired by Medegen in 1998. As part of its due diligence activities prior to the acquisition of the facility by Medegen, consultants found chlorinated solvents in the groundwater adjacent to the manufacturing plant. The identified groundwater contamination is in the process of being remediated.
The prior owner of the facility (“Indemnitor”) retained responsibility for the remediation of the contamination, and Medegen is fully indemnified for all costs associated with the environmental remediation as well as any claims that may arise, including third party claims. As security for the indemnification obligations, Indemnitor is required, on a quarterly basis, to provide proof of cash balances, marketable securities or available, unused lines of credit equal to the expected cost of all future remediation activities plus $500. Now that full-scale remediation has begun, Indemnitor will be required to provide Letters of Credit (“LC”) to secure their future obligations beginning with a $3,000 LC in December 2009, dropping to $2,000 in December 2011 and reducing to $1,000 from December 2014 through December 2017. The LC amounts approximate the expected remaining remediation costs at each point in time. No assurance can be given that the Indemnitor will have the financial resources to complete the environmental remediation and/or defend any claims that may arise, that recommended cleanup levels will be achieved over the long term, or that further remedial activities will not be required.
69
Table of Contents
15. SUMMARY OF QUARTERLY FINANCIAL DATA
Selected unaudited, quarterly financial data of the Company for the fiscal years ended March 31, 2012 and 2011 appear below.
| Fiscal 2012 Quarter Ended | ||||||||||||||||
| June 30 | September 30 | December 31 | March 31 | |||||||||||||
| Net Sales |
$ | 106,473 | $ | 109,655 | $ | 112,969 | $ | 108,224 | ||||||||
| Gross Profit |
16,972 | 16,686 | 17,145 | 14,138 | ||||||||||||
| Net income (loss) |
263 | 554 | 1,825 | (2,461 | ) | |||||||||||
| Net income (loss) per common share |
||||||||||||||||
| Basic |
$ | 0.02 | $ | 0.04 | $ | 0.11 | $ | (.15 | ) | |||||||
|
|
|
|
|
|
|
|
|
|||||||||
| Diluted |
$ | 0.02 | $ | 0.04 | $ | 0.11 | $ | (.15 | ) | |||||||
|
|
|
|
|
|
|
|
|
|||||||||
| Fiscal 2011 Quarter Ended | ||||||||||||||||
| June 30 | September 30 | December 31 | March 31 | |||||||||||||
| Net Sales |
$ | 66,796 | $ | 85,948 | $ | 104,477 | $ | 105,273 | ||||||||
| Gross Profit |
12,538 | 14,846 | 18,422 | 18,073 | ||||||||||||
| Net income |
496 | 469 | 2,304 | 1,085 | ||||||||||||
| Net income per common share |
||||||||||||||||
| Basic |
$ | 0.03 | $ | 0.03 | $ | 0.14 | $ | 0.07 | ||||||||
|
|
|
|
|
|
|
|
|
|||||||||
| Diluted |
$ | 0.03 | $ | 0.03 | $ | 0.14 | $ | 0.07 | ||||||||
|
|
|
|
|
|
|
|
|
|||||||||
ITEM 9 – CHANGES IN AND DISAGREEMENTS WITH ACCOUNTANTS ON ACCOUNTING AND FINANCIAL DISCLOSURE
None.
ITEM 9A – CONTROLS AND PROCEDURES
The Company’s management, with the participation of the Chief Executive Officer and Chief Financial Officer, evaluated the effectiveness of the Company’s disclosure controls and procedures (as defined in Rules 13a-15(e) and 15d-15(e) under the Securities Act) as of March 31, 2012. Based on this evaluation, the Chief Executive Officer and Chief Financial Officer concluded that, as of March 31, 2012, the Company’s disclosure controls and procedures were (i) designed to ensure that material information relating to the Company, is made known to the Company’s Chief Executive Officer and Chief Financial Officer, particularly during the period in which this report was being prepared and (ii) effective, in that they provide reasonable assurance that information required to be disclosed by the Company in the reports that it files or submits under the Securities Act is recorded, processed, summarized and reported within the time periods specified in the SEC’s rules and forms.
No change in the Company’s internal control over financial reporting (as defined in Rules 13a-15(f) and 15d-15(f) under the Exchange Act) occurred during the fiscal quarter ended March 31, 2012 that has materially affected, or is reasonably likely to materially affect, the Company’s internal control over financial reporting. See Management’s Annual Report on Internal Control Over Financial Reporting on page 71.
The Company’s independent registered public accounting firm has also issued a report on the Company’s internal control over financial reporting. This report appears on page 72.
None.
70
Table of Contents
Management’s Annual Report on Internal Control Over Financial Reporting
The management of the Company is responsible for establishing and maintaining adequate internal control over financial reporting. Internal control over financial reporting is defined in Rule 13a-15(f) and 15(d)-15(f) promulgated under the Securities Exchange Act of 1934 as a process designed by, or under the supervision of, the Company’s Chief Executive Officer and Chief Financial Officer and effected by the Company’s board of directors, management and other personnel, to provide reasonable assurance regarding the reliability of financial reporting and the preparation of financial statements for external purposes in accordance with generally accepted accounting principles and includes those policies and procedures that:
| 1. | Pertain to the maintenance of records that in reasonable detail accurately and fairly reflect the transactions and dispositions of assets of the Company; |
| 2. | Provide reasonable assurance that transactions are recorded as necessary to permit preparation of financial statements in accordance with generally accepted accounting principles, and that receipts and expenditures of the Company are being made only in accordance with authorizations of management and directors of the Company; and |
| 3. | Provide reasonable assurance regarding prevention or timely detection of unauthorized acquisition, use or disposition of the Company’s assets that could have a material effect on the financial statements. |
Because of its inherent limitations, internal control over financial reporting may not prevent or detect misstatements.
Projections of any evaluation of effectiveness to future periods are subject to the risk that controls may become inadequate because of changes in conditions, or that the degree of compliance with the policies or procedures may deteriorate.
The Company’s management assessed the effectiveness of the Company’s internal control over financial reporting as of March 31, 2012. In making this assessment, the Company’s management used the criteria established in Internal Control – Integrated Framework issued by the Committee of Sponsoring Organizations of the Treadway Commission.
Under the supervision and with the participation of our management, including our Chief Executive Officer and Chief Financial Officer, we conducted an evaluation of our internal control over financial reporting as prescribed above for the periods covered by this report. Based on our evaluation, our Chief Executive Officer and Chief Financial Officer concluded that, as of March 31, 2012, the Company’s internal control over financial reporting is effective.
Grant Thornton LLP, an independent registered public accounting firm, has issued their report on the Company’s internal control over financial reporting as of March 31, 2012.
71
Table of Contents
REPORT OF INDEPENDENT REGISTERED PUBLIC ACCOUNTING FIRM
Board of Directors and Stockholders
Medical Action Industries Inc.
We have audited Medical Action Industries Inc. (a Delaware corporation) and subsidiaries’ (the “Company”) internal control over financial reporting as of March 31, 2012, based on criteria established in Internal Control – Integrated Framework issued by the Committee of Sponsoring Organizations of the Treadway Commission (“COSO”). The Company’s management is responsible for maintaining effective internal control over financial reporting and for its assessment of the effectiveness of internal control over financial reporting, included in the accompanying Management’s Report on Internal Control over Financial Reporting. Our responsibility is to express an opinion on the Company’s internal control over financial reporting based on our audit.
We conducted our audit in accordance with the standards of the Public Company Accounting Oversight Board (United States). Those standards require that we plan and perform the audit to obtain reasonable assurance about whether effective internal control over financial reporting was maintained in all material respects. Our audit included obtaining an understanding of internal control over financial reporting, assessing the risk that a material weakness exists, testing and evaluating the design and operating effectiveness of internal control based on the assessed risk, and performing such other procedures as we considered necessary in the circumstances. We believe that our audit provides a reasonable basis for our opinion.
A company’s internal control over financial reporting is a process designed to provide reasonable assurance regarding the reliability of financial reporting and the preparation of financial statements for external purposes in accordance with generally accepted accounting principles. A company’s internal control over financial reporting includes those policies and procedures that (1) pertain to the maintenance of records that, in reasonable detail, accurately and fairly reflect the transactions and dispositions of the assets of the company; (2) provide reasonable assurance that transactions are recorded as necessary to permit preparation of financial statements in accordance with generally accepted accounting principles, and that receipts and expenditures of the company are being made only in accordance with authorizations of management and directors of the company; and (3) provide reasonable assurance regarding prevention or timely detection of unauthorized acquisition, use, or disposition of the company’s assets that could have a material effect on the financial statements.
Because of its inherent limitations, internal control over financial reporting may not prevent or detect misstatements. Also, projections of any evaluation of effectiveness to future periods are subject to the risk that controls may become inadequate because of changes in conditions, or that the degree of compliance with the policies or procedures may deteriorate.
In our opinion, the Company maintained, in all material respects, effective internal control over financial reporting as of March 31, 2012, based on criteria established in Internal Control – Integrated Framework issued by COSO.
We also have audited, in accordance with the standards of the Public Company Accounting Oversight Board (United States), the consolidated balance sheets of Medical Action Industries Inc. and subsidiaries as of March 31, 2012 and 2011, and the related consolidated statements of operations, stockholders’ equity and cash flows for each of the three years in the period ended March 31, 2012, and our report dated June 14, 2012 expressed an unqualified opinion thereon.
/s/ GRANT THORNTON LLP
New York, New York
June 14, 2012
72
Table of Contents
ITEM 10 – DIRECTORS, EXECUTIVE OFFICERS AND CORPORATE GOVERNANCE
Pursuant to General Instruction G to Form 10-K, we incorporate by reference the information required by this item from the information to be disclosed in our definitive proxy statement for our 2012 Annual Meeting of Stockholders, which will be filed with the SEC within 120 business days of March 31, 2012.
We have adopted a Code of Ethics (the “Code”) for directors, officers and employees of the Company which covers a wide range of business practices and procedures. The Code is applicable to our principal executive officer, principal financial officer and principal accounting officer or controller and persons performing similar functions (“senior financial officers”). A copy of the Code is available on our website http://www.medical-action.com, and a copy will be mailed without charge, upon written request, to our Corporate Secretary at Medical Action Industries Inc., 500 Expressway Drive South, Brentwood, NY 11717. We intend to disclose any amendments to or waivers of the Code on behalf of our senior financial officers on our website, at http://www.medical-action.com, promptly following the date of the amendment or waiver.
ITEM 11 – EXECUTIVE COMPENSATION
See information under the captions “Compensation Discussion and Analysis” and “Executive Compensation” in the Company’s Proxy Statement, which information is incorporated herein by reference.
ITEM 12 – SECURITY OWNERSHIP OF CERTAIN BENEFICIAL OWNERS AND MANAGEMENT AND RELATED STOCKHOLDER MATTERS
See the information under the captions “Stock Ownership Information” and “Executive Compensation” in the Company’s Proxy Statement, which information is incorporated herein by reference.
ITEM 13 – CERTAIN RELATIONSHIPS AND RELATED TRANSACTIONS AND DIRECTOR INDEPENDENCE
See the information under the caption “Certain Relationships and Related Transactions” in the Company’s Proxy Statement, which information is incorporated herein by reference.
ITEM 14 – PRINCIPAL ACCOUNTING FEES AND SERVICES
See the information under the caption “Ratification of Independent Certified Registered Public Accounting Firm” in the Company’s Proxy Statement, which information is incorporated herein by reference.
Those items which are incorporated by reference to the Company’s definitive Proxy Statement relating to the Annual Meeting of Stockholders is scheduled to be held on August 9, 2012. The definitive Proxy Statement will be filed with the Commission not later than 120 days after March 31, 2012, pursuant to Regulation 14A of the Securities Exchange Act of 1934, as amended.
73
Table of Contents
ITEM 15 – EXHIBITS AND FINANCIAL STATEMENT SCHEDULES
(a) (1) The following financial statements are included in Item 8 of this report:
| Consolidated Balance Sheets at March 31, 2012 and 2011 |
45 | |||
| Consolidated Statements of Operations for the Years Ended March 31, 2012, 2011 and 2010 |
46 | |||
| Consolidated Statements of Stockholders’ Equity for the Years Ended March 31, 2012, 2011 and 2010 |
47 | |||
| Consolidated Statements of Cash Flows for the Years Ended March 31, 2012, 2011 and 2010 |
48 | |||
| Notes to Consolidated Financial Statements |
49 | |||
(a) (2) The following Supplemental Schedule is included in this report:
| Schedule II – Valuation and Qualifying Accounts. |
S-1 |
All other schedules are omitted because they are not required, not applicable or the information is included in the financial statements or notes thereto.
(a) (3) Exhibits:
| Exhibit No. |
||||
| 2.1 | Agreement and Plan of Reorganization dated as of August 12, 1994 among Registrant, QuanTech Acquisition Corp. and QuanTech, Inc. (Exhibit 2.1 to the Company’s Annual Report on Form 10-K for the year ended March 31, 1995). | |||
| 2.2 | Purchase Agreement dated as of January 30, 1996 among Registrant, SBW Acquisition Corp., Lawson Mardon Medical Products, Inc. and Lawson Mardon Medical Products, a trading division of Lawson Mardon Packaging UK Ltd. (Exhibit 2 to the Company’s Current Report on Form 8-K dated February 6, 1996). | |||
| 2.3 | Asset Purchase Agreement dated as of March 9, 1999 between Acme United Corporation and Registrant (Exhibit 2 to the Company’s Current Report on Form 8-K dated April 1, 1999). | |||
| 2.4 | Asset Purchase Agreement dated as of October 3, 2001 between Medi-Flex Hospital Products, Inc. and Registrant (Exhibit 2 to the Company’s Current Report on Form 8-K dated November 30, 2001). | |||
| 2.5 | Asset Purchase Agreement dated as of May 9, 2002 between MD Industries Acquisition LLC and Registrant (Exhibit 2 to the Company’s Current Report on Form 8-K dated June 21, 2002). | |||
| 2.6 | Asset Purchase Agreement dated as of August 30, 2002, between Maxxim Medical, Inc. and Registrant (Exhibit 2 to the Company’s Current Report on Form 8-K dated October 25, 2002. | |||
| 2.7 | Membership Interest Purchase Agreement dated as of October 17, 2006 among Registrant, Medegen Holdings, LLC; Medegen Medical Products, LLC; Medegen Newco, LLC; and MAI Acquisition Corp. (Exhibit 2 to the Company’s Current Report on Form 8-K dated October 18, 2006). | |||
| 2.8 | Agreement and Plan of Merger dated August 27, 2010, by and among Registrant, MA Acquisition Inc., AVID Medical, Inc. and Michael Sahady as Stockholder Representative. (Exhibit 2.1 to the Company’s Current Report on Form 8-K dated August 30, 2010). | |||
74
Table of Contents
| Exhibit No. |
||||
| 3.1 | Certificate of Incorporation, as amended. (Exhibit 3.1 to the Company’s Annual Report on Form 10-K for the year ended March 31, 2002). | |||
| 3.2 | By-Laws, as amended (Exhibit 3.2 to the Company’s Annual Report on Form 8-K dated November 7, 2011). | |||
| 10.1+ | 1996 Non-Employee Director Stock Option Plan, as amended (Exhibit 10.1 to the Company’s Annual Report on Form 10-K for the year ended March 31, 2007). | |||
| 10.2+ | 1989 Non-Qualified Stock Option Plan, as amended (Exhibit 10.2 to the Company’s Annual Report on Form 10-K for the year ended March 31, 2007). | |||
| 10.3+ | 1994 Stock Incentive Plan, as amended (Exhibit 10.3 to the Company’s Annual Report on Form 10-K for the year ended March 31, 2007). | |||
| 10.4+ | Employment Agreement dated as of February 1, 1993 between the Registrant and Paul D. Meringolo (Exhibit 10.4 to the Company’s Annual Report on Form 10-K for the year ended March 31, 1993). | |||
| 10.5 | Modification Agreement dated as of June 3, 2003 between the Registrant and Paul D. Meringolo (Exhibit 10 to the Company’s Current Report on Form 8-K dated June 3, 2003). | |||
| 10.6 | Letter Agreement dated as of April 13, 2007 between Registrant and Paul D. Meringolo (Exhibit 10 to the Company’s Current Report on Form 8-K dated April 13, 2007). | |||
| 10.7+ | Change in Control Agreement dated as of June 1, 1995 between the Registrant and certain executive officers (Exhibit 10.8 to the Company’s Annual Report on Form 10-K for the year ended March 31, 1995). | |||
| 10.8 | Credit Agreement dated as of October 17, 2006 by the Registrant and JPMorgan Chase Bank, as Administrative Agent. (Exhibit 10 to the Company’s Current Report on Form 8-K dated October 18, 2006). | |||
| 10.9 | Amended and Restated Credit Agreement dated August 27, 2010 by and among Medical Action Industries, Inc., JPMorgan Chase Bank, N.A., Citibank, N.A., HSBC Bank USA, N.A., Sovereign Bank, Wells Fargo Bank, N.A. and the other lenders party thereto. (Exhibit 10.1 to the Company’s Current Report on Form 8-K dated August 30, 2010). | |||
| 10.10+ | Employment Agreement dated August 27, 2010 by and between AVID Medical, Inc. and Michael Sahady. (Exhibit 10.2 to the Company’s Current Report on Form 8-K dated August 30, 2010). | |||
| 10.11+ | Form of Amended and Restated Change in Control Agreement by and between Medical Action Industries Inc. and each of Messrs. Meringolo, Kelly and Liu (effective December 31, 2010). (Exhibit 10.1 to the Company’s Current Report on Form 8-K dated January 6, 2011). | |||
| 10.12+ | Change in Control Agreement by and between Medical Action Industries Inc. and Richard Setian (effective December 31, 2010). (Exhibit 10.2 to the Company Current Report on Form 8-K dated January 6, 2011). | |||
| 10.13 | Second Amended and Restated Credit Agreement dated June 7, 2012 by and among Medical Action Industries Inc., JPMorgan Chase Bank, N.A., Citibank, N.A., HSBC Bank USA, N.A., Sovereign Bank, Wells Fargo Bank, N.A. and the other lenders party thereto. (Exhibit 10.1 to the Company’s Current Report on Form 8-K dated June 13, 2012. | |||
| 23.1* | Consent of Registered Independent Public Accounting Firm. | |||
| 31.1* | Certification of Chief Executive Officer of Medical Action Industries Inc., as required by Rule 13a – 14(a) of the Securities Exchange Act of 1934. | |||
| 31.2* | Certification of Chief Financial Officer of Medical Action Industries Inc., as required by Rule 13a – 14(a) of the Securities Exchange Act of 1934. | |||
75
Table of Contents
| Exhibit No. |
||||
| 32.1*# | Certification of Chief Executive Officer and Chief Financial Officer of Medical Action Industries Inc., pursuant to 18 U.S.C. §1350. | |||
| 99.1* | Additional Exhibit – Undertakings | |||
| 101.INS# | XBRL Instance Document | |||
| 101.SCH# | XBRL Taxonomy Extension Schema Document | |||
| 101.CAL# | XBRL Taxonomy Extension Calculation Linkbase Document | |||
| 101.DEF# | XBRL Taxonomy Definition Linkbase Document | |||
| 101.LAB# | XBRL Taxonomy Extension Label Linkbase Document | |||
| 101.PRE# | XBRL Taxonomy Extension Presentation Linkbase Document | |||
| * | Filed herewith |
| + | Identifies management contracts and compensatory plans and arrangements |
| # | Not considered to be “filed” for the purposes of Section 18 of the Securities Exchange Act of 1934, or otherwise subject to the liabilities of that section |
76
Table of Contents
Pursuant to the requirements of Section 13 or 15(d) of the Securities Exchange Act of 1934, the Company has duly caused this report to be signed on its behalf by the undersigned, thereunto duly authorized on this 14th day of June, 2012.
MEDICAL ACTION INDUSTRIES INC.
| By: | /s/ Paul D. Meringolo | |
| Paul D. Meringolo | ||
| Chief Executive Officer and President | ||
Pursuant to the requirements of the Securities Exchange Act of 1934, this report has been signed below on June 14, 2012 by the following persons in the capacities indicated:
| /s/ Paul D. Meringolo Paul D. Meringolo |
Chief Executive Officer, President | |
| /s/ John Sheffield John Sheffield |
Chief Financial Officer Corporate Secretary, Principal Accounting Officer | |
| /s/ Kenneth W. Davidson Kenneth W. Davidson |
Chairman of the Board | |
| /s/ William W. Burke William W. Burke |
Lead Director | |
| /s/ Kenneth R. Newsome Kenneth R. Newsome |
Director | |
| /s/ Henry A. Berling Henry A. Berling |
Director | |
| /s/ Michael Sahady Michael Sahady |
Director | |
77
Table of Contents
REPORT OF INDEPENDENT REGISTERED PUBLIC
ACCOUNTING FIRM ON SCHEDULE
Board of Directors and Stockholders
Medical Action Industries Inc.
We have audited in accordance with the standards of the Public Company Accounting Oversight Board (United States) the consolidated financial statements of Medical Action Industries Inc. and subsidiaries (the “Company”) referred to in our report dated June 14, 2012, which is included in the annual report to security holders and included in Item 8 of this Form 10-K. Our audits of the basic financial statements included the financial statement schedule listed in the index appearing under Item 15(a)(2), which is the responsibility of the Company’s management. In our opinion, this financial statement schedule, when considered in relation to the basic financial statements taken as a whole, presents fairly, in all material respects, the information set forth therein.
/s/ GRANT THORNTON LLP
New York, New York
June 14, 2012
78
Table of Contents
MEDICAL ACTION INDUSTRIES INC.
Valuation and Qualifying Accounts
Fiscal Years Ended March 31, 2012, 2011 and 2010
| Description |
Balance at Beginning of Year |
Gross Amount Charged to Costs and Expenses |
Charged to Other Accounts |
Other Charges / (Deductions) |
Balance at End of Year |
|||||||||||||||
| Year Ended March 31, 2012 |
||||||||||||||||||||
| Allowance for doubtful accounts |
$ | 804 | $ | 72 | $ | — | $ | (95 | )(a) | $ | 781 | |||||||||
| Reserve for slow moving and obsolete inventory |
1,415 | 252 | — | (652 | )(b) | 1,015 | ||||||||||||||
| Valuation allowance on deferred tax assets |
— | 758 | — | — | 758 | |||||||||||||||
|
|
|
|
|
|
|
|
|
|
|
|||||||||||
| $ | 2,219 | $ | 1,082 | $ | — | $ | (747 | ) | $ | 2,554 | ||||||||||
|
|
|
|
|
|
|
|
|
|
|
|||||||||||
| Year Ended March 31, 2011 |
||||||||||||||||||||
| Allowance for doubtful accounts |
$ | 659 | $ | 145 | $ | — | $ | — | $ | 804 | ||||||||||
| Reserve for slow moving and obsolete inventory |
1,540 | 428 | — | (553 | )(b) | 1,415 | ||||||||||||||
| Valuation allowance on deferred tax assets |
— | — | — | — | — | |||||||||||||||
|
|
|
|
|
|
|
|
|
|
|
|||||||||||
| $ | 2,199 | $ | 573 | $ | — | $ | (553 | ) | $ | 2,219 | ||||||||||
|
|
|
|
|
|
|
|
|
|
|
|||||||||||
| Year Ended March 31, 2010 |
||||||||||||||||||||
| Allowance for doubtful accounts |
$ | 663 | $ | 72 | $ | — | $ | (76 | )(a) | $ | 659 | |||||||||
| Reserve for slow moving and obsolete inventory |
1,502 | 510 | — | (472 | )(b) | 1,540 | ||||||||||||||
| Valuation allowance on deferred tax assets |
— | — | — | — | — | |||||||||||||||
|
|
|
|
|
|
|
|
|
|
|
|||||||||||
| $ | 2,165 | $ | 582 | $ | — | $ | (548 | ) | $ | 2,199 | ||||||||||
|
|
|
|
|
|
|
|
|
|
|
|||||||||||
| (a) | Write off of uncollected accounts |
| (b) | Disposal of slow moving and obsolete inventory |
S-1