Attached files
Table of Contents
UNITED STATES
SECURITIES AND EXCHANGE COMMISSION
Washington D.C. 20549
FORM 10-K
| x | ANNUAL REPORT PURSUANT TO SECTION 13 OR 15(D) OF THE SECURITIES EXCHANGE ACT OF 1934 |
For the fiscal year ended December 31, 2011
| ¨ | TRANSITION REPORT PURSUANT TO SECTION 13 OR 15(D) OF THE SECURITIES EXCHANGE ACT OF 1934 |
For the transition period from to
Commission File Number 001-35355
MANNING & NAPIER, INC.
(Exact name of registrant as specified in its charter)
| Delaware (State or other jurisdiction of incorporation or organization) |
45-2609100 (I.R.S. Employer Identification No.) | |
| 290 Woodcliff Drive Fairport, New York |
14450 | |
| (Address of principal executive offices) | (Zip code) | |
(585) 325-6880
(Registrant’s telephone number, including area code)
Securities registered pursuant to Section 12(b) of the Act:
| Title of each class |
Name of each exchange in which registered | |
| Class A common stock, $0.01 par value per share | The New York Stock Exchange |
Securities registered pursuant to Section 12(g) of the Act:
None
Indicate by check mark if the registrant is a well-known seasoned issuer, as defined in Rule 405 of the Securities Act. Yes ¨ No x
Indicate by check mark if the registrant is not required to file reports pursuant to Section 13 or 15(d) of the Act. Yes ¨ No x
Indicate by check mark whether the registrant (1) has filed all reports required to be filed by Section 13 or 15(d) of the Securities Exchange Act of 1934 during the preceding 12 months (or for such shorter period that the registrant was required to file such reports), and (2) has been subject to such filing requirements for the past 90 days. Yes x No ¨
Indicate by check mark whether the registrant has submitted electronically and posted on its corporate Website, if any, every Interactive Data File required to be submitted and posted pursuant to Rule 405 of Regulation S-T (§232.405 of this chapter) during the preceding 12 months (or for such shorter period that the registrant was required to submit and post such files). Yes ¨ No ¨
Indicate by check mark if disclosure of delinquent filers pursuant to Item 405 of Regulation S-K (§ 229.405 of this chapter) is not contained herein, and will not be contained, to the best of registrant’s knowledge, in definitive proxy or information statements incorporated by reference in Part III of this Form 10-K or any amendment to this Form 10-K. ¨
Indicate by check mark whether the registrant is a large accelerated filer, an accelerated filer, a non-accelerated filer, or a smaller reporting company. See the definitions of “large accelerated filer,” “accelerated filer” and “smaller reporting company” in Rule 12b-2 of the Exchange Act.
| Large accelerated filer | ¨ | Accelerated filer | ¨ | |||
| Non-accelerated filer | x (Do not check if a smaller reporting company) | Smaller reporting company | ¨ |
Indicate by check whether the registrant is a shell company (as defined in Rule 12b-2 of the Exchange Act). Yes ¨ No x
As of June 30, 2011 (the last business day of the registrant’s most recently completed second fiscal quarter), no shares of the registrant were held by non-affiliates. Accordingly, the market value of the shares of our voting and non-voting common equity held by non-affiliates was $0.
Indicate the number of shares outstanding of each of the registrant’s classes of common stock, as of the latest practicable date.
| Class |
Outstanding at March 22, 2012 | |
| Class A common stock, $0.01 par value per share |
13,583,873 | |
| Class B common stock, $0.01 par value per share |
1,000 |
DOCUMENTS INCORPORATED BY REFERENCE
Portions of the registrant’s definitive Proxy Statement for its 2012 Annual Meeting of Stockholders to be held June 20, 2012 are incorporated by reference into Part III of this Form 10-K.
Table of Contents
| Page | ||||||
| Item 1. |
1 | |||||
| Item 1A. |
Risk Factors | 11 | ||||
| Item 1B. |
28 | |||||
| Item 2. |
28 | |||||
| Item 3. |
28 | |||||
| Item 4. |
28 | |||||
| Item 5. |
Market for Registrant’s Common Equity, Related Stockholder Matters and Issuer Purchases of Equity Securities | 29 | ||||
| Item 6. |
32 | |||||
| Item 7. |
Management’s Discussion and Analysis of Financial Condition and Results of Operations |
36 | ||||
| Item 7A. |
59 | |||||
| Item 8. |
61 | |||||
| Item 9. |
Changes in and Disagreements with Accountants on Accounting and Financial Disclosure |
61 | ||||
| Item 9A. |
61 | |||||
| Item 9B. |
61 | |||||
| Item 10. |
62 | |||||
| Item 11. |
62 | |||||
| Item 12. |
Security Ownership of Certain Beneficial Owners and Management and Related Stockholder Matters | 62 | ||||
| Item 13. |
Certain Relationships and Related Transactions, and Director Independence |
62 | ||||
| Item 14. |
62 | |||||
| Item 15. |
Exhibits, Financial Statement Schedules | 63 | ||||
In this Annual Report on Form 10-K, “we”, “our”, “us”, the “Company”, “Manning & Napier” and the “Registrant” refers to Manning & Napier, Inc. and, unless the context otherwise requires, its consolidated direct and indirect subsidiaries and predecessors.
i
Table of Contents
CAUTIONARY NOTE REGARDING FORWARD-LOOKING STATEMENTS
This report contains forward-looking statements within the meaning of section 27A of the Securities Act of 1933 and Section 21E of the Securities Exchange Act of 1934, which reflect our views with respect to, among other things, our operations and financial performance. Words like “believes,” “expects,” “may,” “estimates,” “will,” “should,” “intends,” “plans,” or “anticipates” or the negative thereof or other variations thereon or comparable terminology, are used to identify forward-looking statements, although not all forward-looking statements contain these words. Although we believe that we are basing our expectations and beliefs on reasonable assumptions within the bounds of what we currently know about our business and operations, there can be no assurance that our actual results will not differ materially from what we expect or believe. Some of the factors that could cause our actual results to differ materially from our expectations or beliefs are disclosed in the “Risk Factors” section of this report which include, without limitation: changes in securities or financial markets or general economic conditions; a decline in the performance of the Company’s products; client sales and redemption activity; and changes of government policy or regulations. All forward-looking statements speak only as of the date on which they are made and we undertake no duty to update or revise any forward-looking statements, whether as a result of new information, future events or otherwise.
ii
Table of Contents
| Item 1. | Business. |
Overview
Manning & Napier, Inc. provides a broad range of investment solutions through separately managed accounts, mutual funds, and collective investment trust funds, as well as a variety of consultative services that complement our investment process. Founded in 1970, we offer equity and fixed income portfolios as well as a range of blended asset portfolios, such as life cycle funds, that use a mix of stocks and bonds. Headquartered in Fairport, New York, we serve a diversified client base of high net worth individuals and institutions, including 401(k) plans, pension plans, Taft-Hartley plans, endowments and foundations.
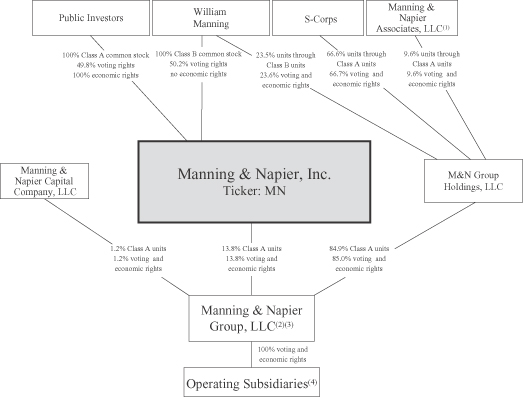
The Company was incorporated on June 22, 2011 for the purpose of facilitating an initial public offering of 13,583,873 shares of its Class A common stock and to become the sole managing member of Manning & Napier Group, LLC and its subsidiaries (“Manning & Napier Group”), a holding company for the investment management businesses conducted by its operating subsidiaries. Prior to the series of transactions to reorganize our capital structure prior to our initial public offering, which we refer to as the reorganization transactions, and the consummation of our initial public offering, we were a group of privately-held, affiliated companies, which we refer to as the “Manning & Napier Companies” which collectively consisted of (i) MNA Advisors, Inc. (f/k/a Manning & Napier Advisors, Inc.), or MNA, (ii) M&N Advisory Advantage Corporation (f/k/a Manning & Napier Advisory Advantage Corporation), or AAC, (iii) M&N Alternative Opportunities, Inc. (f/k/a Manning & Napier Alternative Opportunities, Inc.), or MNAO, (iv) Manning & Napier Capital Company, LLC, or MNCC, (v) Manning & Napier Investor Services, Inc., or MNBD, (vi) Manning & Napier Information Services, LLC, or MNIS, (vii) EXA Advisors, Inc. (f/k/a Exeter Advisors, Inc.), or EAI, and (viii) Perspective Partners LLC, or PPI, each as in effect prior to our initial public offering. The diagram below depicts our organization structure after the reorganization transactions and the consummation of our initial public offering. See Note 3 of our financial statements for a more detailed description of the reorganization transactions.
1
Table of Contents
| (1) | Manning & Napier Associates, LLC is majority owned by William Manning, directly and indirectly through Manning Ventures, Inc., with a minority interest held by B. Reuben Auspitz. |
| (2) | Prior to our initial public offering, Manning & Napier Group granted Class B units to each of Patrick Cunningham and James Mikolaichik. As of December 31, 2011, the Class B units of Manning & Napier Group granted to Patrick Cunningham and James Mikolaichik collectively represent less than 0.1% of the outstanding voting and economic rights of Manning & Napier Group. |
| (3) | Manning & Napier, Inc. is the sole managing member of Manning & Napier Group, LLC. |
| (4) | Represents Manning & Napier Advisors, LLC, Manning & Napier Advisory Advantage Company, LLC, Exeter Advisors I, LLC, Manning & Napier Alternative Opportunities, LLC, Perspective Partners LLC, Manning & Napier Information Services, LLC, Manning & Napier Investor Services, Inc. and Exeter Trust Company. As a result of the reorganization transactions, Manning & Napier Investor Services, Inc., which until such time was a sub-chapter “S” corporation for tax purposes, became a sub-chapter “C” corporation for tax purposes and is accordingly subject to corporate-level taxation on its earnings. |
As illustrated in the chart below, since 1999, we have achieved strong growth in discretionary assets under management, or AUM. From December 31, 1999 through December 31, 2011, our AUM has increased from $6.9 billion to $40.2 billion, representing a compound annual growth rate of 15.8% during a period that included two significant bear markets. Our growth in AUM resulted in an increase in our revenues from $50.2 million for the year ended December 31, 1999 to $330.0 million for the year ended December 31, 2011. Our revenues for the year ended December 31, 2011 were $330.0 million, an increase from $255.5 million for the year ending December 31, 2010. We believe this growth is the result of our consultative, total-solutions approach to working with clients and our investment process that has yielded strong long-term investment results.
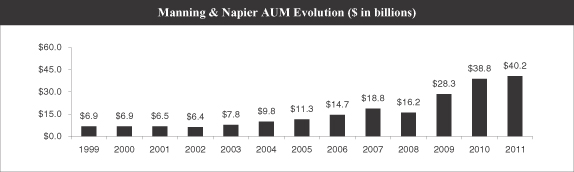
Note: Reflects our AUM over the periods indicated. Data as of December 31 of each respective year.
Since our inception, we have taken the view that an active approach to portfolio management is the best way to manage risk for clients as market conditions change. Across our variety of equity, fixed income and blended asset portfolios, the goal of our investment process is to provide competitive absolute returns over full market cycles. We employ a disciplined process that seeks to avoid areas of speculation and invest in what we view as under-valued market segments, under the principle that today’s market prices drive future potential investment returns. Our active, unconstrained approach provides us with a dedicated mechanism to maintain pricing discipline in our investment decisions.
Initially, this approach helped us build a strong client base of high net worth individuals, small business owners and middle market institutions, and we maintain these relationships in many targeted geographic regions. This foundation allowed us to expand our business to serve the needs of larger institutions, investment consultants and other intermediaries, which has been a strong driver of recent growth.
We have focused on developing an internal organization of specialists to provide additional consultative services beyond investment management, which we believe helps us build close relationships with our clients through multiple service touch points and a solutions-oriented approach. We have designed solutions that are specific to our clients’ needs, including: 401(k) menu design, investment option and manager selection; family wealth management and trust services; and group health and ancillary benefits advisory services. Taken together
2
Table of Contents
with strong long-term investment performance across portfolios, our consultative, total-solutions approach has allowed us to achieve a low average annual separate account cancellation rate. For the five and ten-year periods ending December 31, 2011, our average annual separate account cancellation rate was 3.9%. In addition, we have experienced net positive cash flows in both our separate accounts and our mutual funds for each of the last five years.
Our investment processes and pricing disciplines have been central to our success and we believe are distinctive within the industry. Our research process is analyst- and team-driven. Our investment process follows a set of disciplines that emphasize fit with our time-tested security selection strategies, absolute pricing discipline, active asset allocation management and incentive compensation that emphasizes absolute dollar returns over returns relative to benchmarks. Our mutual funds have earned a number of industry accolades, including a finalist ranking for Morningstar’s international manager of the decade, multiple Lipper awards, and two S&P Capital Silver Awards for the twelve months ended August 31, 2011. As of December 31, 2011, 11 of the 21 funds eligible for Morningstar ratings, representing approximately 78% of our total mutual fund AUM, are rated at least four stars by Morningstar. From January 1, 2000 through December 31, 2011, a period of time that included two significant bear markets, many of our mutual funds and similarly managed separate account portfolios experienced strong cumulative returns well in excess of the returns earned by broad equity market indexes.
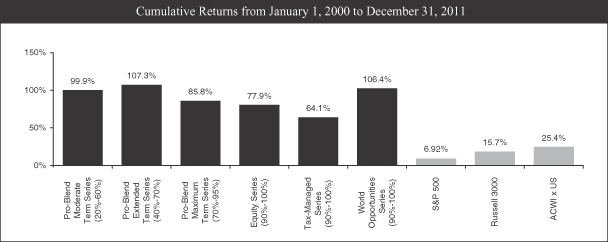
Note: Represents cumulative returns, net of fees, for the mutual funds set forth above from January 1, 2000 to December 31, 2011. Percentages in parentheses represent allowable equity range for each mutual fund.
We have separate account portfolios that are managed under similar investment objectives as the mutual funds illustrated above. The above listed blended asset and equity mutual funds and their similarly managed separate account portfolios represent approximately 71% of our total AUM.
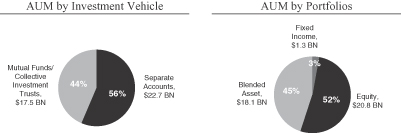
We offer our investment management capabilities primarily through direct sales to high net worth individuals and institutions, as well as through third-party intermediaries, including national brokerage firm advisors, independent financial advisors, and institutional investment consultants. Our AUM as of December 31, 2011 by investment vehicle and portfolios were as follows:
3
Table of Contents
As of December 31, 2011, we had 471 employees, including William Manning, our Chairman and controlling stockholder, and other employee-owners, most of whom are based in Fairport, New York. Collectively, these employee-owners directly and indirectly own approximately 86.2% of our operating subsidiary, Manning & Napier Group, through which we conduct all of our business. Our culture of employee ownership strongly aligns our interests with those of our clients by delivering strong long-term investment performance and solutions.
Our Strategy
Our approach for continued success is focused on the strategies described below.
Expand our Direct Channel
We believe our high-touch direct distribution has allowed us to build strong relationships with our clients over time. Historically, our Direct Channel has been concentrated around New York, Pennsylvania and Ohio. While we have sales representatives as far west as Chicago and as far south as Florida, we are expanding our Direct Channel presence geographically, filling in new regions along the east coast and expanding farther west. Our Direct Channel will remain focused on the tenets that have resulted in our past success, which includes identifying geographic regions within which our representatives form key relationships with centers of influence, business owners and other referral networks to build a client base of high net worth individuals and middle market institutions. Our model requires our sales representatives to maintain responsibility for servicing new business they bring to our firm and compensates representatives for both new business generation and strong service records, which has been a contributing factor to our strong client retention over time.
Broaden our Intermediary Channel
We are focused on the attractive 401(k) marketplace, which we believe is a growing segment of the retirement market with consistent cash inflows and historically low cancellation rates. In addition to building relationships directly with plan sponsors, our wholesale staff seeks what we refer to as Ultimate Defined Contribution Advisors, which are advisors that work primarily with defined contribution plans. According to Brightwork Partners, LLC, 59% of all 401(k) plans between $10 million and $299 million work with a third-party advisor, which makes this an important area of focus for our wholesale staff. We expect significant future growth opportunities within our Intermediary Channel as we begin to target national brokerage firm advisors, retirement plan advisors and other intermediaries that work with small- to- mid-sized 401(k) plans.
Focus on the Convergence of Health and Wealth Benefits
We have extensive experience working with employers to design retirement plan menus and provide high quality life cycle portfolios to improve participant retirement outcomes. Our strong relationships with employers have led us to better understand the full scope of benefit plan issues that employers are facing in the current environment. Specifically, we see a convergence of health and wealth in terms of both providing benefit plans to employees, and employers’ need for help in taking a holistic approach to benefit planning to both lower the costs of providing healthcare benefits and to help educate employees about the benefits of saving for retirement. We are focused on providing consultative services to employers to address these key concerns through unique plan design alternatives and technology-based tools to help employers and advisors effectively reach large numbers of employees with tailored retirement and health plan guidance. We expect to continue to develop and potentially acquire products and services to help employers best address these key issues regarding retirement and health benefit plans.
Develop New Products in Response to Market Opportunities
Our on-going development of products and consultative services in response to current and prospective client needs historically has been a source of significant growth. We remain committed to understanding the key areas of concern for various client types and developing solutions to meet these needs. For example, we recently launched a global inflation-focused equity portfolio to respond to investor concerns of inflation in light of rising commodity prices and generally easy monetary policies in many developed markets. Furthermore, in response to
4
Table of Contents
demand for and market opportunities within non-U.S. equity markets, we have launched portfolios that focus exclusively on emerging market equities and, separately, developed market equities. To address continued growth in life cycle investment portfolios, we plan to introduce a family of active asset allocation, ETF-based, target date funds that combine lower management costs with an active management approach to meet key needs of 401(k) plan sponsors. Likewise, to address the large number of baby boomers that will begin to retire and draw on their retirement portfolios, we plan to launch a series of income-oriented strategies. Continued product and service development will likely require building additional resources and areas of expertise, and we are continuing to add resources where solving key problems can strengthen our relationships with clients.
Products and Services
We manage a variety of equity, fixed income and blended asset portfolios, using primarily traditional asset classes such as stocks and bonds. The majority of our portfolios are actively managed and based on fundamental, company-specific research, though we do manage a small number of quantitatively driven or active, top-down products. Our goal is to help our clients meet their investment objectives by providing competitive positive returns over full stock market cycles, including both bull and bear market environments. Four key elements of our investment process keep us focused on that goal:
| • | Variety of Security Selection Strategies. Our approach to security selection is active, and we perform fundamental analysis on a company-by-company basis to determine appropriate investments for our clients’ portfolios. We employ three distinct security selection strategies within our active, fundamental-based portfolios—one each for growth, cyclical and mature companies. Every stock in these portfolios must be approved by our Senior Research Group as a fit to one of these strategies. Having three distinct selection strategies that have been refined over four decades allows us to invest in a disciplined manner across a variety of market and economic environments. |
| • | Absolute Pricing Discipline. The primary focus of our investment process is an absolute, rather than relative, pricing discipline. With respect to stocks, a key aspect of our investment process is to identify what we view to be the “fair market value” before we purchase a stock for our clients’ portfolios. The fair market value is determined through a variety of valuation techniques relevant to the nature of the investment and ultimately represents a price at which we believe we could sell the stock in question to a rational investor who could then earn a reasonable return going forward. Our emphasis on price also means we are likely to be buying more aggressively into market declines, and selling out of such investments in market rallies. We believe this focus on price has provided strong capital preservation in many valuation-based bear markets during our history, and reduces the risk of permanent, downside price fluctuation from our buy price. |
| • | Active Asset Allocation Management Approach. A portfolio’s overall exposure to market sectors, countries, and broad asset classes is driven by our bottom-up security selection. The flexibility to invest across sectors, countries and asset classes based on individual company opportunities allows us to focus on companies we view as having greater upside potential than downside risk, and allows us to have a broad enough opportunity set to freely navigate away from areas of excess or speculation without limiting the number of investment opportunities. While this approach may often result in our portfolios having meaningfully different allocations and exposures when compared to market benchmarks, we believe this type of differentiation is necessary to manage risk in many environments. |
| • | Analyst Compensation Structure. Each security in our clients’ fundamental-based equity and blended asset portfolios is recommended by one of our research analysts and reviewed and approved by our Senior Research Group before being purchased for clients. Each analyst recommending a stock subjects a portion of his or her total compensation to the returns generated by that recommendation. We have aligned the incentives of our analysts with the goals of our clients by structuring our analyst compensation system such that returns that are both negative and below benchmarks produce a negative bonus the analyst has to offset before earning a positive bonus. The analysts earn their largest bonus, which could be multiples of their salary and the largest part of their total compensation, when their stock recommendations earn returns that are both positive and above benchmarks for our clients. |
5
Table of Contents
| This compensation system has kept our analysts focused on absolute return potential of their stock recommendations, which has ultimately enhanced our long-term track record, particularly in valuation-driven bear markets such as those in 1987 and 2000 to 2002. |
Our fundamental-based portfolios are all managed by our Senior Research Group, which consists of twelve of our senior analysts with an average tenure of approximately 17 years with our firm. Each analyst is the Managing Director of one of our sector or overview groups. In total, we have 83 full-time employees in our research department, including 30 equity analysts/economists and four fixed income analysts/economists.
Our fundamental investment process is based on disciplined strategies that have been applied consistently throughout the firm’s history. We examine fundamental risk and reward characteristics of each investment, not based on broad, backward-looking assumptions, but instead based on prevailing valuations and conditions. We then weigh a given investment against the risk/reward characteristics of alternatives and within the context of a client’s investment objectives. Allocations to asset classes or market sectors are a function of both top-down and bottom-up analysis. The top-down, or macro, view considers prevailing economic and market conditions as well as historical relationships. The bottom-up view builds positions security-by-security, according to individual strategy fits and valuations. In this way, allocation changes become a function of fundamentals rather than timing. This total return management style recognizes an active asset allocation approach as a key tool for managing risk.
In our blended asset portfolios, the allocation of assets between stocks and bonds is driven primarily by company-specific analysis of equity opportunities. When our analysts are able to find a greater number of equity opportunities that meet the standards for our pricing disciplines, equity exposure increases in our blended asset class accounts. Likewise, equity exposure in these portfolios decreases when our analysts find fewer individual equity opportunities, which is typically the case when markets become expensive.
| Key Portfolio |
AUM as of December 31, 2011 (in thousands) |
Inception Date | Cumulative Portfolio Return Since Inception |
Benchmark Return Since Inception of Portfolio (1) |
Cumulative Excess Return Since Inception |
|||||||||||||||
| Long-Term Growth 30%-80% Equity Exposure |
$ | 7,410,017 | 1/1/1973 | 3,695.2 | % | 3,033.2 | % (2) | 662.0 | % | |||||||||||
| Growth with Reduced Volatility 20%-60% Equity Exposure |
$ | 3,137,306 | 1/1/1973 | 2,939.9 | % | 2,743.3 | % (3) | 196.6 | % | |||||||||||
| Aggregate Fixed Income |
$ | 476,675 | 1/1/1984 | 834.4 | % | 816.8 | % (4) | 17.6 | % | |||||||||||
| Equity-Oriented |
$ | 1,319,304 | 1/1/1993 | 480.1 | % | 304.0 | % (5) | 176.1 | % | |||||||||||
| Core Equity (Unrestricted) 90%-100% Equity Exposure |
$ | 1,726,001 | 1/1/1995 | 457.0 | % | 247.2 | % (6) | 209.8 | % | |||||||||||
| Core Non U.S. Equity |
$ | 12,109,452 | 10/1/1996 | 217.3 | % | 94.3 | % (7) | 123.0 | % | |||||||||||
| Core U.S. Equity |
$ | 4,927,469 | 7/1/2000 | 71.7 | % | 14.7 | % (8) | 57.0 | % | |||||||||||
| (1) | These benchmarks are based on the average equity exposure of the portfolio as well as the market for the underlying securities. |
| (2) | Represents 55% from the S&P 500 Index and 45% from the Barclays Capital U.S. Government/Credit Bond Index, or BCGC Index. |
| (3) | Represents 40% from the S&P 500 Index and 60% from the BCGC Index. |
| (4) | Represents the Barclays Capital U.S. Aggregate Bond Index, or BCA Index. |
| (5) | Represents 65% from the Russell 3000 Index, 20% from the Morgan Stanley Capital International All Country World Index (excluding the United States), or the ACWIxUS Index, and 15% from the BCA Index. |
| (6) | Represents 80% from the Russell 3000 Index and 20% from the ACWIxUS Index. |
| (7) | Represents the ACWIxUS Index. |
| (8) | Represents the Russell 3000 Index. |
6
Table of Contents
Ancillary Consultative Services
To maintain a focus on problem solving and to diversify our product set beyond investment products, our field representatives utilize the services of our Client Analytics Group. The Client Analytics Group consists of 20 internal consultants whose primary responsibilities include working with prospective and current clients to solve investment and planning-related problems. The group includes several chartered financial analysts, certified financial planners, an accredited investment fiduciary and professionals with law and masters degrees. Services provided by the group include objective-setting analyses such as wealth modeling, cash flow analysis and asset/liability reporting, estate and tax planning, risk analysis based on overall investment objectives, and manager search and selection for 401(k) plans or individual and institutional clients seeking manager diversification.
We have also developed several technology-driven products and services aimed at the middle-market employer marketplace to assist both employers and employees with their health and wealth planning. Specifically, we have developed technology that assists employers in offering and administering health benefit plans, including a web-based platform to educate employees about high deductible health benefit plans. We have also developed technology that will help employers provide financial guidance to employees in a one-on-one setting to assist in both health and wealth planning.
Sales and Distribution
We distribute our products and services through direct sales to prospective high net worth individuals and middle market institutional clients, as well as through dedicated efforts to sell to financial intermediaries and investment consultants. In identifying prospective new business, we are focused on individuals and institutions that have long-term objectives and needs, and that are looking for a partner in addressing these needs. We believe our problem-solving approach fosters strong relationships, and our focus on communicating our investment process helps to manage long-term expectations and minimize turnover.
We currently have 44 sales and distribution professionals, with an average of nearly 18 years of industry experience. Our sales staff includes 23 direct sales representatives, 14 internal and external wholesale professionals that report to our Managing Director of Intermediary Distribution, and five consultant relations specialists, each of whom report to our Managing Director of Sales, who has been with MNA since 1993. Sales representatives have different areas of focus in terms of client type, product and vehicle, but are highly knowledgeable about the markets, our investment process and our product and service offerings, so as to lessen the need for our research department personnel to assist in bringing new relationships on board. Our sales representatives are responsible for generating new business as well as maintaining existing business. Referrals are a strong source of new business in both our direct and intermediary marketing efforts. To assist in the service responsibilities of the field representatives, we have 50 internal service professionals that are responsible for responding to client requests and questions.
Our separate accounts are primarily distributed by direct sales representatives that market to individuals and institutions in defined territories within the U.S. These individuals form separate account relationships with high net worth individuals that own businesses, sit on boards of endowments or foundations, or are generally well-connected in their communities, and leverage those relationships to obtain middle market, institutional separate account business. Our high net worth and middle market separate account clients also often utilize the consultative services of our Client Analytics Group, which generally includes a variety of planning services. We obtain a smaller portion of our separate account business through intermediaries, including national brokerage firm advisors and independent financial advisors working with high net worth individuals, and unaffiliated registered investment advisor platforms that select our strategies for inclusion in their investment programs.
Our mutual funds and collective investment trusts are primarily distributed through intermediaries via the approval of our fund strategies on various broker, advisor, retail and recordkeeping platforms. Our wholesalers are focused on distributing through retirement plan advisors that work with 401(k) plans, as well as through brokers and advisors that work with retail clients. We have five investment professionals dedicated to building
7
Table of Contents
relationships with investment consultants and other unaffiliated registered investment advisors and their research teams. The primary responsibilities of these individuals are to educate consultants and advisors on our investment products and process and to ensure our products are among those considered for placement within mutual fund advisory programs, on platforms’ approved lists and in active searches conducted by consultants. Our direct sales representatives also contribute to mutual fund and collective investment trust distribution through sales and servicing of fund vehicles to 401(k) plan sponsors and middle market and large market institutions.
Competition
Historically, we have competed to attract assets to our management principally on the basis of:
| • | a broad portfolio and service offering that provides solutions for our clients; |
| • | the disciplined and repeatable nature of our investment process; |
| • | the quality of the service we provide to our clients and the duration of our relationships with them; |
| • | the tenure and continuity of our management and investment professionals; and |
| • | our track record of long-term investment excellence. |
Our ability to continue to compete effectively will also depend upon our ability to retain our current investment professionals and employees and to attract highly qualified new investment professionals and employees. We compete in all aspects of our business with a large number of investment management firms, commercial banks, broker-dealers, insurance companies and other financial institutions.
Regulation
Our business is subject to extensive regulation in the United States at the federal level and, to a lesser extent, the state level, as well as by self-regulatory organizations, and outside the United States. Under certain of these laws and regulations, agencies that regulate investment advisers have broad administrative powers, including the power to limit, restrict or prohibit an investment adviser from carrying on its business in the event that it fails to comply with such laws and regulations. Possible sanctions that may be imposed include the suspension of individual employees, limitations on engaging in certain lines of business for specified periods of time, revocation of investment adviser and other registrations, censures and fines.
SEC Regulation
MNA, AAC and EAI are registered with the U.S. Securities and Exchange Commission, or SEC, as investment advisers under the U.S. Investment Advisers Act of 1940, as amended, or the Advisers Act. Additionally, the Manning & Napier Fund, Inc., or the Fund, and several of the third-party investment companies we sub-advise are registered under the U.S. Investment Company Act of 1940, or the1940 Act. The Advisers Act and the 1940 Act, together with the SEC’s regulations and interpretations thereunder, impose substantive and material restrictions and requirements on the operations of advisers and mutual funds. The SEC is authorized to institute proceedings and impose sanctions for violations of the Advisers Act and the 1940 Act, ranging from fines and censures to termination of an adviser’s registration.
As an investment adviser, we have a fiduciary duty to our clients. The SEC has interpreted these duties to impose standards, requirements and limitations on, among other things:
| • | trading for proprietary, personal and client accounts; |
| • | allocations of investment opportunities among clients; |
| • | use of soft dollars; |
| • | execution of transactions; and |
| • | recommendations to clients. |
8
Table of Contents
We manage accounts for all of our clients on a discretionary basis, with authority to buy and sell securities for each portfolio, select broker-dealers to execute trades and negotiate brokerage commission rates. In connection with these transactions, we receive soft dollar credits from broker-dealers that have the effect of reducing certain of our expenses. All of our soft dollar arrangements are intended to be within the safe harbor provided by Section 28(e) of the U.S. Securities Exchange Act of 1934, as amended, or the Exchange Act. If our ability to use soft dollars were reduced or eliminated as a result of the implementation of statutory amendments or new regulations, our operating expenses would increase.
As a registered adviser, we are subject to many additional requirements that cover, among other things:
| • | disclosure of information about our business to clients; |
| • | maintenance of formal policies and procedures; |
| • | maintenance of extensive books and records; |
| • | restrictions on the types of fees we may charge; |
| • | custody of client assets; |
| • | client privacy; |
| • | advertising; and |
| • | solicitation of clients. |
The SEC has authority to inspect any investment adviser and typically inspects a registered adviser periodically to determine whether the adviser is conducting its activities (i) in accordance with applicable laws, (ii) consistent with disclosures made to clients and (iii) with adequate policies, procedures and systems to ensure compliance.
For the year ended December 31, 2011, 42% of our revenues were derived from our advisory services to investment companies registered under the 1940 Act, including 42% derived from our advisory services to the Fund. The 1940 Act imposes significant requirements and limitations on a registered fund, including with respect to its capital structure, investments and transactions. While we exercise broad discretion over the day-to-day management of the business and affairs of the Fund and the investment portfolios of the Fund and the funds we sub-advise, our own operations are subject to oversight and management by each fund’s board of directors. Under the 1940 Act, a majority of the directors must not be “interested persons” with respect to us (sometimes referred to as the “independent director” requirement). The responsibilities of the board include, among other things, approving our investment management agreement with the fund; approving other service providers; determining the method of valuing assets; and monitoring transactions involving affiliates. Our investment management agreements with these funds may be terminated by the funds on not more than 60 days’ notice, and are subject to annual renewal by the fund’s board after the initial term of one to two years.
The 1940 Act also imposes on the investment adviser to a mutual fund a fiduciary duty with respect to the receipt of the adviser’s investment management fees. That fiduciary duty may be enforced by the SEC, administrative action or litigation by investors in the fund pursuant to a private right of action.
Under the Advisers Act, our investment management agreements may not be assigned without the client’s consent. Under the 1940 Act, investment management agreements with registered funds (such as the mutual funds we manage) terminate automatically upon assignment. The term “assignment” is broadly defined and includes direct assignments as well as assignments that may be deemed to occur upon the transfer, directly or indirectly, of a controlling interest in us.
MNBD, our SEC-registered broker-dealer subsidiary, is subject to the SEC’s Uniform Net Capital Rule, which requires that at least a minimum part of a registered broker-dealer’s assets be kept in relatively liquid
9
Table of Contents
form. As of December 31, 2011, MNBD was in compliance with its net capital requirements. As a result of the reorganization transactions, the stockholders of MNBD contributed 100% of the outstanding common stock of MNBD to MNCC, and MNCC in turn contributed 100% of the stock of MNBD to M&N Group Holdings. MNBD submitted an application to FINRA for approval of the change of ownership of MNBD as a result of the reorganization transactions. Pursuant to FINRA rules, MNBD was permitted to effect the change of ownership and continue its broker-dealer activities pending final approval by FINRA of MNBD’s change of ownership application. FINRA subsequently approved the change of ownership application of MNBD.
ERISA-Related Regulation
We are a fiduciary under the Employee Retirement Income Security Act of 1974, as amended, or ERISA, with respect to assets that we manage for benefit plan clients subject to ERISA. ERISA, regulations promulgated thereunder and applicable provisions of the Internal Revenue Code of 1986, as amended, impose certain duties on persons who are fiduciaries under ERISA, prohibit certain transactions involving ERISA plan clients and provide monetary penalties for violations of these prohibitions.
The fiduciary duties under ERISA may be enforced by the U.S. Department of Labor by administrative action or litigation and by our benefit plan clients pursuant to a private right of action. In addition, the IRS may assess excise taxes against us if we engage in prohibited transactions on behalf of or with our benefit plan clients.
New Hampshire Banking Department
Exeter Trust Company is a state-chartered non-depository trust company subject to the laws of the State of New Hampshire and the regulations promulgated thereunder by the New Hampshire Bank Commissioner.
Insurance-Related Regulation
Manning & Napier Benefits, LLC is a registered insurance broker in multiple states including the District of Columbia and, as such, is subject to various insurance and health-related rules and regulations.
Non-U.S. Regulation
In addition to the extensive regulation our investment management industry is subject to in the United States, we are also subject to regulation internationally by various Canadian regulatory authorities in the Canadian provinces where we operate pursuant to exemptions from registration. We are authorized to act as a non-resident sub-advisory investment manager to collective investment vehicles in Ireland. Our business is also subject to the rules and regulations of the more than 33 countries in which we currently buy and sell current portfolio investments.
Employees
As of December 31, 2011, we had 471 employees, most of whom are based in Fairport, New York. None of our employees are subject to a collective bargaining agreement. We believe that relations with our employees are good. We strive to attract and retain the best talent in the industry.
Available Information
All annual, quarterly and current reports, and amendments to those reports, proxy statements and other filings we file or furnish with the SEC are available free of charge from the SEC’s website at http://www.sec.gov/ or from the Public Reference Room at 100 F Street N.E., Washington, D.C. 20549; 1-800-SEC-0330. Such documents are available as soon as reasonably practicable after electronic filing of the material with the SEC.
We also make the documents listed above available without charge through the Investor Relations section of our website at http://ir.manning-napier.com/.
10
Table of Contents
Risks Related to our Business
Our revenues are dependent on the market value and composition of our AUM, all of which are subject to fluctuation due to factors outside of our control.
We derive the majority of our revenue from investment management fees, typically calculated as a percentage of the market value of our AUM. As a result, our revenues are dependent on the value and composition of our AUM, all of which are subject to fluctuation due to many factors, including:
| • | Declines in prices of securities in our portfolios. The prices of the securities held in the portfolios we manage may decline due to any number of factors beyond our control, including, among others, declining stock or commodities markets, changes in interest rates, a general economic downturn, Europe’s sovereign debt crisis, political uncertainty or acts of terrorism. The U.S. and global financial markets continue to be subject to an unusual amount of uncertainty and instability. Such factors could cause an unusual degree of volatility and price declines for securities in the portfolios we manage. |
| • | Redemptions and other withdrawals. Our investors generally may withdraw their funds at any time, on very short notice and without any significant penalty. A substantial portion of our revenue is derived from investment advisory agreements that are terminable by clients upon short notice or no notice and investors in the mutual funds we advise can redeem their investments in those funds at any time without prior notice. Our growth in AUM in recent years has included new clients and portfolios that may not have the same client retention characteristics as we have experienced in the past. In addition, in a declining stock market, the pace of redemptions could accelerate. |
| • | Investment performance. If our portfolios perform poorly, even over the short-term, as compared with our competitors or applicable third-party benchmarks, or the rankings of mutual funds we manage decline, we may lose existing AUM and have difficulty attracting new assets. |
If any of these factors cause a decline in our AUM, it would result in lower investment management revenues. If our revenues decline without a commensurate reduction in our expenses, our net income will be reduced and our business will be adversely affected.
The loss of key investment professionals or members of our senior management team could have an adverse effect on our business.
We depend on the skills and expertise of qualified investment professionals and our success depends on our ability to retain key employees, including members of our senior management team. Our investment professionals possess substantial experience in investing and have been primarily responsible for the historically strong investment performance we have achieved. We particularly depend on our executive officers as well as our Senior Research Group, which is a team of twelve senior analysts who manage our portfolios. The loss of any of these key individuals could limit our ability to successfully execute our business strategy and could have an adverse effect on our business.
Any of our investment or management professionals may resign at any time, subject to various covenants not to compete with us. In addition, employee-owners are subject to additional covenants not to compete. We do not carry any key man insurance on any employees at this time.
Competition for qualified investment, management, marketing and client service professionals is intense and we may fail to successfully attract and retain qualified personnel in the future. Our ability to attract and retain these personnel will depend heavily on the amount and structure of compensation and opportunities for equity ownership we offer. In connection with our transition to a public company, we intend to implement a compensation structure that uses a combination of cash and equity-based incentives as appropriate. We intend for overall compensation levels to remain commensurate with amounts paid to our named executive officers and
11
Table of Contents
other key employees in the past. However, our compensation may not be effective to recruit and retain the personnel we need, especially if our equity-based compensation does not return significant value to employees. Any cost-reduction initiative or adjustments or reductions to compensation could negatively impact our ability to retain key personnel. In addition, changes to our management structure, corporate culture and corporate governance arrangements, including the changes associated with, and resulting from, our reorganization and our initial public offering, could negatively impact our ability to retain key personnel.
We derive substantially all of our revenues from contracts and relationships that may be terminated upon short or no notice.
We derive substantially all of our revenues from investment advisory and sub-advisor agreements, all of which are terminable by clients upon short notice or no notice and without any significant penalty. Our investment management agreements with mutual funds, as required by law, are generally terminable by the funds’ board of directors or a vote of the majority of the funds’ outstanding voting securities on not more than 60 days’ written notice. After an initial term, each fund’s investment management agreement must be approved and renewed annually by such fund’s board, including by its independent members. In addition, all of our separate account clients and some of the pooled investment vehicles, including mutual funds, that we sub-advise have the ability to re-allocate all or any portion of the assets that we manage away from us at any time with little or no notice. These investment management agreements and mutual fund and collective investment trust client relationships may be terminated or not renewed for any number of reasons. The decrease in revenues that could result from the termination of a material client relationship or group of client relationships could have an adverse effect on our business.
We may be required to reduce the fees we charge, or our fees may decline due to changes in our AUM composition, which could have an adverse effect on our profit margins and results of operations.
Our current fee structure may be subject to downward pressure due to a variety of factors, including a trend in recent years toward lower fees in the investment management industry. We may be required to reduce fees with respect to both the separate accounts we manage and the mutual funds we advise. In addition, we may charge lower fees to attract future new business as compared to our existing business, which may result in us having to reduce our fees with respect to our existing business accordingly. The investment management agreements pursuant to which we advise mutual funds are terminable on short notice and, after an initial term, are subject to an annual process of review and renewal by the funds’ boards. As part of that annual review process, the fund board considers, among other things, the level of compensation that the fund has been paying us for our services, and that process may result in the renegotiation of our fee structure or increase our obligations, thus increasing the cost of our performance. Further, in recent periods our average fee rate has been declining due to higher average separately managed account sizes triggered by market appreciation and new separately managed account clients. Any fee reductions on existing or future new business could have an adverse effect on our profit margins and results of operations.
Several of our portfolios involve investing principally in the securities of non-U.S. companies, which involve foreign currency exchange risk, and tax, political, social and economic uncertainties and risks.
As of December 31, 2011, approximately 37% of our AUM across all of our portfolios was invested in securities of non-U.S. companies. Fluctuations in foreign currency exchange rates could negatively affect the returns of our clients who are invested in these strategies. In addition, an increase in the value of the U.S. dollar relative to non-U.S. currencies is likely to result in a decrease in the U.S. dollar value of our AUM, which, in turn, could result in lower revenue since we report our financial results in U.S. dollars.
Investments in non-U.S. issuers may also be affected by tax positions taken in countries or regions in which we are invested as well as political, social and economic uncertainty, particularly as a result of the recent decline in global economic conditions. Declining tax revenues may cause governments to assert their ability to tax the local gains and/or income of foreign investors (including our clients), which could adversely affect clients’ interests in investing outside their home markets. Many financial markets are not as developed, or as efficient, as
12
Table of Contents
the U.S. financial markets and, as a result, those markets may have limited liquidity and higher price volatility and may lack established regulations. Liquidity may also be adversely affected by political or economic events, government policies, social or civil unrest within a particular country, and our ability to dispose of an investment may also be adversely affected if we increase the size of our investments in smaller non-U.S. issuers. Non-U.S. legal and regulatory environments, including financial accounting standards and practices, may also be different, and there may be less publicly available information about such companies. These risks could adversely affect the performance of our strategies that are invested in securities of non-U.S. issuers and may be particularly acute in the emerging or less developed markets in which we invest.
We derive a substantial portion of our revenues from our Core Non-U.S. Equity portfolios.
As of December 31, 2011, approximately 30% of our AUM were invested in our Core Non-U.S. Equity portfolios. The World Opportunities Series alone represented approximately 15% of our total AUM as of December 31, 2011. As a result, a substantial portion of our operating results depends upon the performance of our Core Non-U.S. Equity portfolios, and our ability to retain client assets in such portfolios. If a significant portion of the investors in our Core Non-U.S. Equity portfolios decide to withdraw their investments or terminate their investment management agreements for any reason, including poor investment performance or adverse market conditions, our revenues from these portfolios would decline, which could have an adverse effect on our earnings and financial condition.
The investment performance and/or the growth of our AUM may be constrained if appropriate investment opportunities are not available or if we close certain of our portfolios.
Our ability to deliver strong investment performance depends in large part on our ability to identify appropriate investment opportunities in which to invest client assets. If we are unable to identify sufficient appropriate investment opportunities for existing and new client assets on a timely basis, our investment performance could be adversely affected. The risk that sufficient appropriate investment opportunities may be unavailable is influenced by a number of factors, including general market conditions, and is likely to increase as and if our AUM increases, particularly if these increases occur very rapidly.
If we determine that sufficient investment opportunities are not available for some or all of our portfolios, or we believe that in order to remain competitive or continue to produce attractive returns from some or all of our portfolios we should limit the growth of those strategies, as we have done in the past, we may choose to limit the growth of the portfolio by limiting the rate at which we accept additional client assets for management under the portfolio, closing the portfolio to all or substantially all new investors or otherwise taking action to limit the flow of assets into the portfolio. If we misjudge the point at which it would be optimal to limit access to or close a portfolio, the investment performance of the portfolio could be negatively impacted. In addition, if we close access to a portfolio, we may offer a new portfolio to our clients, but we cannot guarantee that such new portfolio will attract clients or perform in a manner consistent with the closed portfolio. Limiting access to or closing a portfolio, while designed to enable us to remain competitive or continue to produce attractive returns, may be seen by some investors in our Class A common stock solely as a loss of revenue growth opportunities in the short-term, which could lead to a decrease in the value of our Class A common stock and a loss on your investment.
The significant growth we have experienced historically has been and may continue to be difficult to sustain, and we may have difficulty managing our growth effectively.
The rapid growth in our AUM represents a significant rate of growth that has been and may continue to be difficult to sustain. In particular, as the absolute amount of our AUM increases, it will be more difficult to maintain levels of growth similar to those we have experienced in the past. The future growth of our business will depend on, among other things:
| • | our ability to retain key investment professionals; |
| • | our ability to attract investment professionals as necessary; |
13
Table of Contents
| • | our ability to devote sufficient resources to maintaining existing portfolios and to selectively develop new portfolios; |
| • | our success in achieving superior investment performance from our portfolios; |
| • | our ability to maintain and extend our distribution capabilities; |
| • | our ability to deal with changing market conditions; |
| • | our ability to maintain adequate financial and business controls; and |
| • | our ability to comply with new legal and regulatory requirements arising in response to both the increased sophistication of the investment management industry and the significant market and economic events of the last few years. |
Unless our growth results in an increase in our revenues that is proportionate to the increase in our costs associated with this growth, our future profitability will be adversely affected. In addition, failure to successfully diversify into new asset classes may adversely affect our growth strategy and our future profitability.
Our portfolios may not obtain attractive returns under certain market conditions or at all.
The goal of our investment process is to provide competitive absolute returns over full market cycles. Accordingly, our portfolios may not perform well as compared to benchmarks or other investment managers’ strategies during certain periods of time or under certain market conditions, including periods of market uncertainty and volatility similar to what we have experienced in recent months. Short-term underperformance may negatively affect our ability to retain clients and attract new clients. We are likely to be most out of favor when the markets are running on positive or negative price momentum and market prices become disconnected from underlying investment fundamentals, as was the case during the late 1990s as the technology market and mega cap stocks fueled the broad market upward. During and shortly following such periods of relative under performance, we are likely to see our highest levels of client turnover, even if our absolute returns are positive. Loss of client assets and the failure to attract new clients could adversely affect our revenues and growth.
The historical returns of our existing portfolios may not be indicative of their future results or of the portfolios we may develop in the future.
The historical returns of our portfolios and the ratings and rankings we or the mutual funds that we advise have received in the past should not be considered indicative of the future results of these portfolios or of any other portfolios that we may develop in the future. The investment performance we achieve for our clients varies over time and the variance can be wide. The ratings and rankings we or the mutual funds we advise have received are typically revised monthly. The historical performance and ratings and rankings included in this report are as of December 31, 2011 and for periods then ended except where otherwise stated. The performance we have achieved and the ratings and rankings received at subsequent dates and for subsequent periods may be higher or lower and the difference could be material. Our portfolios’ returns have benefited during some periods from investment opportunities and positive economic and market conditions. In other periods, such as in 2008 and the third quarter of 2011, general economic and market conditions have negatively affected our portfolios’ returns. These negative conditions may occur again, and in the future we may not be able to identify and invest in profitable investment opportunities within our current or future portfolios.
We depend on third-party distribution sources to market our portfolios and access our client base.
Our ability to attract additional assets to manage is dependent on our access to third-party intermediaries. We gain access to mutual fund investors and some retail and institutional clients through third parties, including mutual fund platforms and financial intermediaries. As of December 31, 2011, the largest relationship we have with a third party represents 5.1% of our total AUM and the mutual fund platform representing the largest portion of our fund assets represents an additional 4.4% of our total AUM. We
14
Table of Contents
compensate most of the intermediaries through which we gain access to investors in our mutual funds by paying fees, most of which are based on a percentage of assets invested in our mutual funds through that intermediary and with respect to which that intermediary provides services. These distribution sources and client bases may not continue to be accessible to us on terms we consider commercially reasonable, or at all. Limiting or the total absence of such access could have an adverse effect on our results of operations. Many of these consultants review and evaluate our products and our firm from time to time. Poor reviews or evaluations of a particular product, portfolio or us as an investment management firm may result in client withdrawals or may impair our ability to attract new assets through these intermediaries. In addition, the recent economic downturn and consolidation in the broker-dealer industry may lead to reduced distribution access and increases in fees we are required to pay to intermediaries. If such increased fees should be required, refusal to pay them could restrict our access to those client bases while paying them could adversely affect our profitability.
Our efforts to establish new portfolios or new products or services may be unsuccessful and could negatively impact our results of operations and our reputation.
As part of our growth strategy, we may seek to take advantage of opportunities to develop new portfolios consistent with our philosophy of managing portfolios to meet our clients’ objectives and using a team investment approach. The costs associated with establishing a new portfolio initially likely will exceed the revenues that the portfolio generates. If any such new portfolio performs poorly or fails to attract sufficient assets to manage, our results of operations could be negatively impacted. Further, a new portfolio’s poor performance may negatively impact our reputation and the reputation of our other portfolios within the investment community. In addition, we have developed and may seek from time to time to develop new products and services to take advantage of opportunities involving technology, insurance, participant and plan sponsor education and other products beyond investment management. The development of these products and services could involve investment of financial and management resources and may not be successful in developing client relationships, which could have an adverse effect on our business. The cost to develop these products initially will likely exceed the revenue they generate. If establishing new portfolios or offering new products or services requires hiring new personnel, to the extent we are unable to recruit and retain sufficient personnel, we may not be successful in further diversifying our portfolios, client assets and business, which could have an adverse effect on our business and future prospects.
Our failure to comply with investment guidelines set by our clients, including the boards of mutual funds, and limitations imposed by applicable law, could result in damage awards against us and a loss of our AUM, either of which could adversely affect our reputation, results of operations or financial condition.
When clients retain us to manage assets on their behalf, they generally specify certain guidelines regarding investment allocation that we are required to follow in managing their portfolios. In addition, the boards of mutual funds we manage generally establish similar guidelines regarding the investment of assets in those funds. We are also required to invest the mutual funds’ assets in accordance with limitations under the 1940 Act, and applicable provisions of the Internal Revenue Code of 1986, as amended. Other clients, such as plans subject to ERISA, or non-U.S. funds, require us to invest their assets in accordance with applicable law. Our failure to comply with any of these guidelines and other limitations could result in losses to clients or investors in our products which, depending on the circumstances, could result in our obligation to make clients whole for such losses. If we believed that the circumstances did not justify a reimbursement, or clients believed the reimbursement we offered was insufficient, clients could seek to recover damages from us, withdraw assets from our products or terminate their investment management agreement with us. Any of these events could harm our reputation and adversely affect our business.
A change of control of our company could result in termination of our investment advisory agreements.
Under the 1940 Act, each of the investment advisory agreements for SEC registered mutual funds that our affiliate, MNA, advises automatically terminates in the event of its assignment, as defined under the 1940 Act. If such an assignment were to occur, MNA could continue to act as adviser to any such fund only if that fund’s
15
Table of Contents
board of directors and stockholders approved a new investment advisory agreement, except in the case of certain of the funds that we sub-advise for which only board approval would be necessary. In addition, under the Advisers Act each of the investment advisory agreements for the separate accounts we manage may not be assigned without the consent of the client. An assignment may occur under the 1940 Act and the Advisers Act if, among other things, MNA undergoes a change of control. In certain other cases, the investment advisory agreements for the separate accounts we manage require the consent of the client for any assignment. If such an assignment occurs, we cannot be certain that MNA will be able to obtain the necessary approvals from the boards and stockholders of the mutual funds that it advises or the necessary consents from separate account clients.
Operational risks may disrupt our business, result in losses or limit our growth.
We are heavily dependent on the capacity and reliability of the communications, information and technology systems supporting our operations, whether developed, owned and operated by us or by third parties. Operational risks such as trading or operational errors or interruption of our financial, accounting, trading, compliance and other data processing systems, whether caused by fire, natural disaster or pandemic, power or telecommunications failure, act of terrorism or war or otherwise, could result in a disruption of our business, liability to clients, regulatory intervention or reputational damage, and thus adversely affect our business. Some types of operational risks, including, for example, trading errors, may be increased in periods of increased volatility, which can magnify the cost of an error. Although we have back-up systems in place, our back-up procedures and capabilities in the event of a failure or interruption may not be adequate, and the fact that we operate our business out of multiple physical locations may make such failures and interruptions difficult to address on a timely and adequate basis. As and if our client base, number of portfolios and/or physical locations increase, developing and maintaining our operational systems and infrastructure may become increasingly challenging, which could constrain our ability to expand our business. Any upgrades or expansions to our operations or technology to accommodate increased volumes of transactions or otherwise may require significant expenditures and may increase the probability that we will suffer system degradations and failures. In addition, if we are unsuccessful in executing any such upgrades or expansions, we may instead have to hire additional employees, which could increase operational risk due to human error. We also depend on our headquarters in Fairport, New York, where a majority of our employees, administration and technology resources are located, for the continued operation of our business. Any significant disruption to our headquarters could have an adverse effect on our business.
We depend on third-party service providers for services that are important to our business, and an interruption or cessation of such services by any such service providers could have an adverse effect on our business.
We depend on a number of service providers, including custodial and clearing firms, and vendors of communications and networking products and services. We cannot assure you that any of these providers will be able to continue to provide these services in an efficient manner or that they will be able to adequately expand their services to meet our needs. An interruption or malfunction in or the cessation of an important service by any third-party and our inability to make alternative arrangements in a timely manner, or at all, could have an adverse impact on our business, financial condition and operating results.
Employee misconduct could expose us to significant legal liability and reputational harm.
We operate in an industry in which integrity and the confidence of our clients are of critical importance. Accordingly, if any of our employees engage in illegal or suspicious activities or other misconduct, we could be subject to regulatory sanctions and suffer serious harm to our reputation, financial condition, client relationships and ability to attract new clients. For example, our business often requires that we deal with confidential information. If our employees were to improperly use or disclose this information, even if inadvertently, we could suffer serious harm to our reputation, financial condition and current and future business relationships. It is not always possible to deter employee misconduct, and the precautions we take to detect and prevent this activity may not always be effective. In addition, the SEC recently has increased its scrutiny of the use of non-public
16
Table of Contents
information obtained from corporate insiders by professional investors. Misconduct by our employees, or even unsubstantiated allegations of misconduct, could result in an adverse effect on our reputation and our business.
Improper disclosure of personal data could result in liability and harm our reputation.
We and our service providers store and process personal client information. It is possible that the security controls, training and other processes over personal data may not prevent the improper disclosure of client information. Such disclosure could harm our reputation as well and subject us to liability, resulting in increased costs or loss of revenue.
Failure to properly address conflicts of interest could harm our reputation, business and results of operations.
As we expand the scope of our business and our client base, we must continue to monitor and address any conflicts between our interests and those of our clients. The SEC and other regulators have increased their scrutiny of potential conflicts of interest, and we have implemented procedures and controls that we believe are reasonably designed to address these issues. However, appropriately dealing with conflicts of interest is complex and if we fail, or appear to fail, to deal appropriately with conflicts of interest, we could face reputational damage, litigation or regulatory proceedings or penalties, any of which could adversely affect our reputation, business and results of operations.
If our techniques for managing risk are ineffective, we may be exposed to material unanticipated losses.
In order to manage the significant risks inherent in our business, we must maintain effective policies, procedures and systems that enable us to identify, monitor and control our exposure to operational, legal and reputational risks. Our risk management methods may prove to be ineffective due to their design or implementation, or as a result of the lack of adequate, accurate or timely information or otherwise. If our risk management efforts are ineffective, we could suffer losses that could have an adverse effect on our financial condition or operating results. Additionally, we could be subject to litigation, particularly from our clients, and sanctions or fines from regulators. Our techniques for managing risks in client portfolios may not fully mitigate the risk exposure in all economic or market environments, or against all types of risk, including risks that we might fail to identify or anticipate.
The cost of insuring our business is substantial and may increase.
Our insurance costs are substantial and can fluctuate significantly from year to year. In addition, certain insurance coverage may not be available or may only be available at prohibitive costs. As we renew our insurance policies, we may be subject to additional costs resulting from rising premiums, the assumption of higher deductibles or co-insurance liability and, to the extent certain of our mutual funds purchase separate director and officer or errors and omissions liability coverage, an increased risk of insurance companies disputing responsibility for joint claims. Higher insurance costs and incurred deductibles, as with any expense, would reduce our net income.
We may elect to pursue growth in the United States and abroad through acquisitions or joint ventures, which would expose us to risks inherent in assimilating new operations, expanding into new jurisdictions, and making non-controlling minority investments in other entities.
In order to maintain and enhance our competitive position, we may review and pursue acquisition and joint venture opportunities. We cannot assure we will identify and consummate any such transactions on acceptable terms or have sufficient resources to accomplish such a strategy. In addition, any strategic transaction can involve a number of risks, including:
| • | additional demands on our staff; |
| • | unanticipated problems regarding integration of investor account and investment security recordkeeping, operating facilities and technologies, and new employees; |
17
Table of Contents
| • | adverse effects in the event acquired intangible assets or goodwill become impaired; |
| • | the existence of liabilities or contingencies not disclosed to or otherwise known by us prior to closing such a transaction; and |
| • | dilution to our public stockholders if we issue shares of our Class A common stock, or units of Manning & Napier Group with exchange rights, in connection with future acquisitions. |
Risks Related to our Industry
We are subject to extensive regulation.
We are subject to extensive regulation for our investment management business and operations, including regulation by the SEC under the 1940 Act and the Advisers Act, by the U.S. Department of Labor under ERISA, and by the Financial Industry Regulatory Authority, Inc., or FINRA. The U.S. mutual funds we advise are registered with and regulated by the SEC as investment companies under the 1940 Act. The Advisers Act imposes numerous obligations on investment advisers including record keeping, advertising and operating requirements, disclosure obligations and prohibitions on fraudulent activities. The 1940 Act imposes similar obligations, as well as additional detailed operational requirements, on registered investment companies, which must be adhered to by their investment advisers. The U.S. mutual funds that we advise and our broker-dealer subsidiary are each subject to the USA PATRIOT Act of 2001, which requires them to know certain information about their clients and to monitor their transactions for suspicious financial activities, including money laundering. The U.S. Office of Foreign Assets Control, or OFAC, has issued regulations requiring that we refrain from doing business, or allow our clients to do business through us, in certain countries or with certain organizations or individuals on a list maintained by the U.S. government. In addition, Manning & Napier Benefits, LLC is a registered insurance broker with the New York State Insurance Department and, as such, is subject to various insurance and health-related rules and regulations.
Our failure to comply with applicable laws or regulations could result in fines, censure, suspensions of personnel or other sanctions, including revocation of our registration as an investment adviser. Even if a sanction imposed against us or our personnel is small in monetary amount, the adverse publicity arising from the imposition of sanctions against us by regulators could harm our reputation, result in withdrawal by our clients from our products and impede our ability to retain clients and develop new client relationships, which may reduce our revenues.
We face the risk of significant intervention by regulatory authorities, including extended investigation and surveillance activity, adoption of costly or restrictive new regulations and judicial or administrative proceedings that may result in substantial penalties. Among other things, we could be fined or be prohibited from engaging in some of our business activities. The requirements imposed by our regulators are designed to ensure the integrity of the financial markets and to protect customers and other third parties who deal with us, and are not designed to protect our stockholders. Accordingly, these regulations often serve to limit our activities, including through net capital, customer protection and market conduct requirements.
The regulatory environment in which we operate is subject to continual change, and regulatory developments designed to increase oversight could adversely affect our business.
The legislative and regulatory environment in which we operate has undergone significant changes in the recent past. We believe that significant regulatory changes in our industry are likely to continue on a scale that exceeds the historical pace of regulatory change, which is likely to subject industry participants to additional, more costly and generally more punitive regulation. For example, on July 21, 2010, the Dodd-Frank Wall Street Reform and Consumer Protection Act, or Dodd-Frank, was enacted. Dodd-Frank introduces considerable changes to financial industry regulation, which could impact our business in significant ways. These new laws and regulations can be expected to place greater compliance and administrative burdens on us, which likely will increase our expenses without increasing our revenues. However, many of Dodd-Frank’s provisions require the adoption of regulations by various federal agencies and departments and it is difficult to predict all of the effects Dodd-Frank may have on us until final rules have been adopted.
18
Table of Contents
New laws or regulations, or changes in the enforcement of existing laws or regulations, applicable to us and our clients could adversely affect our business. Our ability to function in this environment will depend on our ability to constantly monitor and promptly react to legislative and regulatory changes. There have been a number of highly publicized regulatory inquiries that have focused on the investment management industry. These inquiries already have resulted in increased scrutiny of the industry and new rules and regulations for mutual funds and investment managers. This regulatory scrutiny may limit our ability to engage in certain activities that might be beneficial to our shareholders. Further, adverse results of regulatory investigations of mutual fund, investment advisory and financial services firms could tarnish the reputation of the financial services industry generally and mutual funds and investment advisers more specifically, causing investors to avoid further fund investments or redeem their account balances. Redemptions would decrease our AUM, which would reduce our advisory revenues and net income.
In addition, recently there has been intense public and regulatory interest in 401(k) plan fees and expenses. Lawsuits have been brought against plan sponsors and service providers charging that they breached their fiduciary duties related to such fees and expenses, and the U.S. Department of Labor has imposed substantial additional fee disclosure requirements. These developments may adversely affect our business.
Further, as a result of the recent economic downturn, acts of serious fraud in the investment management industry and perceived lapses in regulatory oversight, U.S. and non-U.S. governmental and regulatory authorities may increase regulatory oversight of our business. We may be adversely affected as a result of new or revised legislation or regulations imposed by the SEC, other U.S. governmental regulatory authorities or self-regulatory organizations that supervise the financial markets. We also may be adversely affected by changes in the interpretation or enforcement of existing laws and rules by these governmental authorities and self-regulatory organizations, as well as by U.S. courts. It is impossible to determine the extent of the impact of any new laws, regulations or initiatives that may be proposed, or whether any of the proposals will become law. Compliance with any new laws or regulations could make compliance more difficult and expensive and affect the manner in which we conduct business.
The investment management industry is intensely competitive.
The investment management industry is intensely competitive, with competition based on a variety of factors, including investment performance, investment management fee rates, continuity of investment professionals and client relationships, the quality of services provided to clients, corporate positioning and business reputation, continuity of selling arrangements with intermediaries and differentiated products. A number of factors, including the following, serve to increase our competitive risks:
| • | a number of our competitors have greater financial, technical, marketing and other resources, more comprehensive name recognition and more personnel than we do; |
| • | potential competitors have a relatively low cost of entering the investment management industry; |
| • | the recent trend toward consolidation in the investment management industry, and the securities business in general, has served to increase the size and strength of a number of our competitors; |
| • | some investors may prefer to invest with an investment manager that is not publicly traded based on the perception that a publicly traded asset manager may focus on the manager’s own growth to the detriment of investment performance for clients; |
| • | some competitors may invest according to different investment styles or in alternative asset classes that the markets may perceive as more attractive than the portfolios we offer; |
| • | some competitors may have more attractive investment returns due to current market conditions; |
| • | some competitors may operate in a different regulatory environment than we do, which may give them certain competitive advantages in the investment products and portfolio structures that they offer; |
19
Table of Contents
| • | other industry participants, hedge funds and alternative asset managers may seek to recruit our investment professionals; and |
| • | some competitors charge lower fees for their investment services than we do. |
If we are unable to compete effectively, our revenues could be reduced and our business could be adversely affected.
The investment management industry faces substantial litigation risks, which could adversely affect our business, financial condition or results of operations or cause significant reputational harm to us.
We depend to a large extent on our network of relationships and on our reputation to attract and retain client assets. If a client is not satisfied with our services, its dissatisfaction may be more damaging to our business than client dissatisfaction would be to other types of businesses. We make investment decisions on behalf of our clients that could result in substantial losses to them. If our clients suffer significant losses, or are otherwise dissatisfied with our services, we could be subject to the risk of legal liabilities or actions alleging negligent misconduct, breach of fiduciary duty, breach of contract, unjust enrichment and/or fraud. These risks are often difficult to assess or quantify and their existence and magnitude often remain unknown for substantial periods of time, even after an action has been commenced. We may incur significant legal expenses in defending against litigation whether or not we engaged in conduct as a result of which we might be subject to legal liability. Substantial legal liability or significant regulatory action against us could adversely affect our business, financial condition or results of operations or cause significant reputational harm to us.
Catastrophic and unpredictable events could have an adverse effect on our business.
A terrorist attack, war, power failure, cyber-attack, natural disaster or other catastrophic or unpredictable event could adversely affect our future revenues, expenses and earnings by:
| • | decreasing investment valuations in, and returns on, the assets that we manage; |
| • | causing disruptions in national or global economies that decrease investor confidence and make investment products generally less attractive; |
| • | interrupting our normal business operations; |
| • | sustaining employee casualties, including loss of our key members of our senior management team or our investment team; |
| • | requiring substantial expenditures and expenses to repair, replace and restore normal business operations; and |
| • | reducing investor confidence. |
We have a disaster recovery plan to address certain contingencies, but we cannot be assured that this plan will be sufficient in responding or ameliorating the effects of all disaster scenarios. If our employees or vendors we rely upon for support in a catastrophic event are unable to respond adequately or in a timely manner, we may lose clients resulting in a decrease in AUM which may have an adverse effect on revenues and net income.
Risks Related to Our Structure
Control of a majority of the combined voting power of our capital stock by William Manning, and ownership of approximately 86.2% of Manning & Napier Group’s ownership interests by our employee owners, including William Manning, may give rise to conflicts of interest; failure to properly address these or other conflicts of interests could harm our reputation, business and results of operations.
William Manning holds a majority of the combined voting power of our capital stock through his ownership of 100% of our outstanding Class B common stock. Accordingly, William Manning, acting alone, has the ability to approve or disapprove substantially all transactions and other matters submitted to a vote of shareholders,
20
Table of Contents
including those relating to the tax receivable agreement, the exchange agreement and other material corporate transactions, such as a merger, consolidation, dissolution or sale of all or substantially all of our assets, the issuance or redemption of certain additional equity interests, and the election of directors. These voting and class approval rights could enable William Manning to consummate transactions that may not be in the best interests of holders of our Class A common stock or, conversely, prevent the consummation of transactions that may be in the best interests of holders of our Class A common stock. In addition, although he has voting control of Manning & Napier, all of William Manning’s economic interests in us is in the form of his indirect interests in Manning & Napier Group, the payments he may receive from Manning & Napier under the tax receivable agreement we entered into with him at the time of the reorganization transactions and the proceeds he may receive as a result of M&N Group Holdings and MNCC exchanging the interests attributable to him in Manning & Napier Group for cash or, at our election, shares of our Class A common stock and, in the case of exchanges for shares of our Class A common stock, from selling such Class A common stock. As a result, William Manning’s economic interests may conflict with the interests of Manning & Napier and its public stockholders.
Our employee owners, including William Manning, directly and through their ownership of M&N Group Holdings and MNCC, indirectly hold approximately 86.2% of the ownership interests in Manning & Napier Group which, as discussed elsewhere, is our sole source of revenue. M&N Group Holdings and MNCC are entities controlled by William Manning, who, through his ownership of M&N Group Holdings and MNCC indirectly owns a total of 67.6% of the ownership interests in Manning & Napier Group. All of the other owners of interests in M&N Group Holdings and MNCC are current employees of ours, including our executive officers. Further, such employees have the right to cause M&N Group Holdings and MNCC to exchange their indirect interests in Manning & Napier Group for cash or shares of our Class A common stock. If they exercise this right in sufficient amounts, receive shares of our Class A common stock and do not resell such shares, it is possible that after the cancellation of our Class B common stock, these employees may control us. The interests of these employee owners may conflict with our interests and the interests of the holders of our Class A common stock. Decisions of our employee owners with respect to Manning & Napier Group, including those relating to the tax receivable agreement, the exchange agreement and the structuring of future transactions, may take into consideration these employee owners’ tax or other considerations even where no similar benefit would accrue to us or the holders of our Class A common stock.
In addition, as we expand the scope of our business and our client base, we may have conflicts between our interests, those of the holders of our Class A common stock and those of our clients and fund investors. The SEC and other regulators have increased their scrutiny of potential conflicts of interest, and we have implemented procedures and controls that we believe are reasonably designed to address these issues. However, appropriately dealing with conflicts of interest is complex and if we fail, or appear to fail, to deal appropriately with conflicts of interest, we could face reputational damage, litigation or regulatory proceedings or penalties, any of which may adversely affect our results of operations.
We will recognize substantial non-cash compensation expense through 2014
Certain Manning & Napier Companies adopted new vesting terms related to the current ownership interests of our employees, including our named executive officers, other than William Manning. As a result, we will be required to recognize substantial non-cash compensation expense in each year through 2014. In addition each of Patrick Cunningham and James Mikolaichik were granted Class B units of Manning & Napier Group. As a result, we will recognize non-cash compensation charges through 2012 and 2014, respectively. Further, additional ownership interests in M&N Group Holdings were granted to William Manning in connection with the reorganization transactions pursuant to the amended and restated limited liability company agreement of M&N Group Holdings, as part of the overall agreement among William Manning and the other owners of the Manning & Napier Companies to consummate the reorganization and are fully vested. These expenses have significantly reduced our reported GAAP net income for 2011 and will significantly reduce our reported GAAP net income over the remaining vesting periods.
21
Table of Contents
Because we are a “controlled company” within the meaning of the New York Stock Exchange listing rules, our board of directors is not required to consist of a majority of independent directors, and our stockholders may not have the same protections afforded to stockholders of companies that are subject to all of the corporate governance requirements of the New York Stock Exchange. William Manning has a controlling influence over our board, and the interests of William Manning may conflict with the interests of our other stockholders.
Because William Manning holds a majority of the combined voting power of our capital stock through his ownership of 100% of our outstanding Class B common stock, we are considered a “controlled company” for the purposes of the New York Stock Exchange listing requirements. As such, we are permitted to, and may, opt out of the corporate governance requirements that our board of directors, our compensation committee and our nominating and corporate governance committee meet the standard of independence established by the NYSE. As a result, our board of directors and compensation committee may have more directors who do not meet the independence standards than they would if those standards were to apply. In particular, so long as we are a “controlled company,” we are exempt from the NYSE rule that requires that a board be comprised of a majority of “independent directors.” Further, William Manning has a controlling influence over our board, as William Manning has sufficient voting power to elect the entire board, and our certificate of incorporation permits stockholders to remove directors at any time with or without cause. In addition, although we have established a nominating and corporate governance committee, we may opt out of the NYSE’s requirement that such committee contain independent directors. Our stockholders may not have the same protections afforded to stockholders of companies that are subject to all of the corporate governance requirements of the NYSE, and circumstances may occur in which the interests of William Manning could conflict with the interests of our other stockholders.
Our ability to pay regular dividends to our stockholders is subject to the discretion of our board of directors and may be limited by our structure and applicable provisions of Delaware law.
We intend to declare cash dividends on our Class A common stock, however, our board of directors may, in its sole discretion, change the amount or frequency of dividends or discontinue the payment of dividends entirely. In addition, because of our structure, we will be dependent upon the ability of our subsidiaries to generate earnings and cash flows and distribute them to us so that we may pay dividends to our stockholders. We expect to cause Manning & Napier Group to make distributions to its members, including us, in an amount sufficient for us to pay dividends. However, its ability to make such distributions will be subject to its and its subsidiaries’ operating results, cash requirements and financial condition, the applicable laws of the State of Delaware, which may limit the amount of funds available for distribution, and its compliance with covenants and financial ratios related to any indebtedness it has or may incur in the future. As a consequence of these various limitations and restrictions, we may not be able to make, or may have to reduce or eliminate, the payment of dividends on our Class A common stock. Any change in the level of our dividends or the suspension of the payment thereof could adversely affect the market price of our Class A common stock.
We depend on distributions from Manning & Napier Group to pay taxes and expenses, including payments under the tax receivable agreement, but Manning & Napier Group’s ability to make such distributions will be subject to various limitations and restrictions.
We have no material assets other than our ownership of Class A units of Manning & Napier Group and have no independent means of generating revenue. Manning & Napier Group is treated as a partnership for U.S. federal income tax purposes and, as such, is not subject to U.S. federal income tax. Instead, taxable income is allocated to holders of its units, including us. Accordingly, we incur income taxes on our allocable share of any net taxable income of Manning & Napier Group. Under the terms of its amended and restated limited liability company operating agreement, Manning & Napier Group is obligated to make tax distributions to holders of its units, including us. In addition to tax expenses, we also incur expenses related to our operations, including expenses under the tax receivable agreement, which we expect to be significant. We intend, as its managing member, to cause Manning & Napier Group to make distributions in an amount sufficient to allow us to pay our
22
Table of Contents
taxes and operating expenses, including any payments due under the tax receivable agreement. However, Manning & Napier Group’s ability to make such distributions is subject to various limitations and restrictions including, but not limited to, restrictions on distributions that would violate any contract or agreement to which Manning & Napier Group is then a party or any applicable law or that would have the effect of rendering Manning & Napier Group insolvent. If we do not have sufficient funds to pay tax or other liabilities to fund our operations, we may have to borrow funds, which could adversely affect our liquidity and financial condition and subject us to various restrictions imposed by any such lenders. To the extent that we are unable to make payments under the tax receivable agreement for any reason, such payments will be deferred and will accrue interest until paid.
We are required to pay holders of units of Manning & Napier Group for certain tax benefits we may claim as a result of the tax basis step up we realize in connection with the future purchases or exchanges of those units for shares of our Class A common stock, and the amounts we may pay could be significant.
Our employee owners indirectly hold a substantial majority of the ownership interests in Manning & Napier Group. Any future purchases or exchanges of their units of Manning & Napier Group for cash or, at our election, shares of our Class A common stock are expected to produce favorable tax attributes for us. When we acquire such units from employee owners, both the existing basis and the anticipated basis adjustments are likely to increase, for tax purposes, depreciation and amortization deductions allocable to us from Manning & Napier Group and therefore reduce the amount of income tax we would otherwise be required to pay in the future. This increase in tax basis may also decrease gain, or increase loss, on future dispositions of certain capital assets to the extent the increased tax basis is allocated to those capital assets.
We entered into a tax receivable agreement with M&N Group Holdings, MNCC and the other holders of Class A units of Manning & Napier Group, pursuant to which we are required to pay to such holder of such Class A units 85% of the applicable cash savings, if any, in U.S. federal, state, local and foreign income tax that we actually realize, or are deemed to realize in certain circumstances, as a result of any step-up in tax basis in Manning & Napier Group’s assets resulting from (i) our purchase of such Class A units from M&N Group Holdings with a portion of the net proceeds of our initial public offering, (ii) our purchases or exchanges of such Class A units from M&N Group Holdings and MNCC, respectively, for cash or, at our election, shares of our Class A common stock and (iii) payments under the tax receivable agreement, including any tax benefits related to imputed interest deemed to be paid by us as a result of such agreement.
We expect that the payments we will be required to make under the tax receivable agreement will be substantial. Assuming no material changes in the relevant tax law, that the purchase or exchange of Class A units would result in depreciable or amortizable basis and that we earn sufficient taxable income to realize all tax benefits that are subject to the tax receivable agreement, we expect that the reduction in tax payments for us associated with the purchase or exchange of all of the Class A units held by M&N Group Holdings and MNCC would aggregate approximately $54.4 million over a 15-year period. Under such scenario, we would be required to pay the holders of such Class A units 85% of such amount, or approximately $46.2 million over the same 15-year period. The actual amounts may materially differ from these estimated amounts, as potential future reductions in tax payments for us and tax receivable agreement payments by us will be calculated using the market value of our Class A common stock and the prevailing tax rates at the time of purchase or exchange and will be dependent on us generating sufficient future taxable income to realize the benefit. In general, increases in the market value of our shares or in prevailing tax rates will increase the amounts we pay under the tax receivable agreement.
The actual increase in tax basis, as well as the amount and timing of any payments under the tax receivable agreement, will vary depending upon a number of factors, including:
| • | the timing of exchanges by the holders of units of Manning & Napier Group, the number of units purchased or exchanged, or the price of our Class A common stock, as the case may be, at the time of the purchase or exchange; |
23
Table of Contents
| • | the amount and timing of the taxable income we generate in the future and the tax rate then applicable; and |
| • | the portion of our payments under the tax receivable agreement constituting imputed interest and whether the purchases or exchanges result in depreciable or amortizable basis. |
There is a possibility that not all of the 85% of the applicable cash savings will be paid to the selling or exchanging holder of Class A units at the time described above. If we determine that all or a portion of such applicable tax savings is in doubt, we will pay to the holders of such Class A units the amount attributable to the portion of the applicable tax savings that we determine is not in doubt and pay the remainder at such time as we determine the actual tax savings or that the amount is no longer in doubt.
Payments under the tax receivable agreement, if any, will be made pro rata among all tax receivable agreement holders entitled to payments on an annual basis to the extent we have sufficient taxable income to utilize the increased depreciation and amortization charges. The availability of sufficient taxable income to utilize the increased depreciation and amortization expense will not be determined until such time as the financial results for the year in question are known and tax estimates prepared.
In certain cases, payments under the tax receivable agreement to holders of Manning & Napier Group units may be accelerated and/or significantly exceed the actual benefits we realize in respect of the tax attributes subject to the tax receivable agreement.
The tax receivable agreement provides that upon certain mergers, asset sales, other forms of business combinations or other changes of control, or if, at any time, we elect an early termination of the tax receivable agreement, our, or our successor’s, obligations under the tax receivable agreement with respect to all Class A units of Manning & Napier Group, whether or not such units have been purchased or exchanged before or after such transaction, would be based on certain assumptions, including that we would have sufficient taxable income to fully utilize the deductions arising from the increased tax deductions and tax basis and other benefits related to entering into the tax receivable agreement. As a result, (i) we could be required to make payments under the tax receivable agreement that are greater than or less than the specified percentage of the actual benefits we realize in respect of the tax attributes subject to the tax receivable agreement and (ii) if we elect to terminate the tax receivable agreement early, we would be required to make an immediate payment equal to the present value of the anticipated future tax benefits, which payment may be made significantly in advance of the actual realization of such future benefits. In these situations, our obligations under the tax receivable agreement could have a substantial negative impact on our liquidity and could have the effect of delaying, deferring or preventing certain mergers, asset sales, other forms of business combinations or other changes of control. There can be no assurance that we will be able to finance our obligations under the tax receivable agreement. If we were to elect to terminate the tax receivable agreement immediately as of December 31, 2011, we estimate that we would be required to pay $42.8 million in the aggregate under the tax receivable agreement.
If we were deemed an investment company under the 1940 Act as a result of our ownership of Manning & Napier Group, applicable restrictions could make it impractical for us to continue our business as contemplated and could have an adverse effect on our business.
We do not believe that we are an “investment company” under the 1940 Act. Because we, as the sole managing member of Manning & Napier Group, control the management of and operate Manning & Napier Group, we believe that our interest in Manning & Napier Group is not an “investment security” as such term is used in the 1940 Act. If we were to cease participation in the management of Manning & Napier Group or not be deemed to control Manning & Napier Group, our interest in Manning & Napier Group could be deemed an “investment security” for purposes of the 1940 Act. A person may be an “investment company” if it owns investment securities having a value exceeding 40% of the value of its total assets (exclusive of U.S. government securities and cash items). Our sole asset is our equity investment in Manning & Napier Group. A determination that such investment is an investment security could cause us to be deemed an investment company under the
24
Table of Contents
1940 Act and to become subject to the registration and other requirements of the 1940 Act. In addition, we do not believe that we are an investment company under Section 3(b)(1) of the 1940 Act because we are not primarily engaged in a business that causes us to fall within the definition of “investment company.” The 1940 Act and the rules thereunder contain detailed prescriptions for the organization and operations of investment companies. Among other things, the 1940 Act and the rules thereunder limit or prohibit transactions with affiliates, impose limitations on the issuance of debt and equity securities, prohibit the issuance of stock options, and impose certain governance requirements. We and Manning & Napier Group intend to conduct our operations so that we will not be deemed an investment company. However, if we nevertheless were to be deemed an investment company, restrictions imposed by the 1940 Act, including limitations on our capital structure and our ability to transact with affiliates, could make it impractical for us to continue our business as contemplated and could have an adverse effect on our business, financial condition and results of operations.
Risks Related to Our Class A Common Stock
The market price and trading volume of our Class A common stock may be volatile, and your investment in our Class A common stock could suffer a decline in value.
The stock markets have experienced extreme price and volume fluctuations that have affected and continue to affect the market prices of equity securities of many companies. These fluctuations have often been unrelated or disproportionate to the operating performance of those companies. These broad market and industry fluctuations, as well as general economic, political and market conditions such as recessions, interest rate changes or international currency fluctuations, may negatively affect the market price of our Class A common stock. The market price of our Class A common stock may fluctuate or decline significantly in the future. As such, you may not realize any return on your investment in us and may lose some or all of your investment.
Some of the factors that could negatively affect the price of our Class A common stock, or result in fluctuations in the price or trading volume of our Class A common stock, include:
| • | actual or anticipated variations in our quarterly operating results; |
| • | failure to meet the market’s earnings expectations; |
| • | publication of research reports about us or the investment management industry, or the failure of securities analysts to cover our Class A common stock; |
| • | departures of any members of our senior management team or additions or departures of other key personnel; |
| • | adverse market reaction to any indebtedness we may incur or securities we may issue in the future; |
| • | changes in market valuations of similar companies; |
| • | actual or anticipated poor performance in one or more of the portfolios we offer; |
| • | changes or proposed changes in laws or regulations, or differing interpretations thereof, affecting our business, or enforcement of these laws and regulations, or announcements relating to these matters; |
| • | adverse publicity about the investment management industry generally, or particular scandals, specifically; |
| • | litigation and governmental investigations; |
| • | consummation by us or our competitors of significant acquisitions, strategic partnerships or divestitures; |
| • | actions by stockholders; |
| • | exchange of units of Manning & Napier Group for shares of our Class A common stock or the expectation that such conversions or exchanges may occur; and |
| • | general market and economic conditions. |
25
Table of Contents
William Manning and our other employee-owners directly and indirectly own interests in M&N Group Holdings and directly own interests in MNCC, and they will have the right to exchange and cause M&N Group Holdings and MNCC to exchange, as applicable, such interests for cash or an aggregate of 76,400,000 shares of our Class A common stock pursuant to the terms of an exchange agreement; future sales of such shares in the public market, or the perception that such sales may occur, could lower our stock price.
The market price of our Class A common stock could decline as a result of sales of a large number of shares of our Class A common stock available for sale, or the perception that such sales could occur. These sales, or the possibility that these sales may occur, also may make it more difficult for us to raise additional capital by selling equity securities in the future, at a time and price that we deem appropriate.
We have 13,583,873 shares of Class A common stock outstanding. We have entered into an exchange agreement with M&N Group Holdings, MNCC, and the other direct holders of the units of Manning & Napier Group that are not owned by us, and subject to certain restrictions set forth therein and as described elsewhere in this report, certain of our employee-owners and M&N Group Holdings and MNCC, on behalf of William Manning and our other employee-members that are direct or indirect members of M&N Group Holdings and MNCC, are entitled to exchange such units for an aggregate of up to 76,400,000 shares of our Class A common stock, subject to customary adjustments. In addition, the holders of any units of Manning & Napier Group will also become parties to the exchange agreement and, pursuant to the terms of the exchange agreement, we may also purchase or exchange such units for shares of our Class A common stock. We are party to a registration rights agreement pursuant to which the shares of Class A common stock issued upon such exchanges are eligible for resale, subject to certain limitations set forth therein.
We cannot predict the size of future issuances of our Class A common stock or the effect, if any, that future issuances and sales of shares of our Class A common stock may have on the market price of our Class A common stock. Sales or distributions of substantial amounts of our Class A common stock, including shares issued in connection with an acquisition, or the perception that such sales or distributions could occur, may cause the market price of our Class A common stock to decline.
The disparity in the voting rights among the classes of our capital stock may have a potential adverse effect on the price of our Class A common stock.
Each share of our Class A common stock entitles its holder to one vote on all matters to be voted on by stockholders generally, while the holder of our Class B common stock controls a majority of the vote on all matters submitted to a vote of all stockholders. The difference in voting rights could adversely affect the value of our Class A common stock if, for example, investors view, or any potential future purchaser of our company views, the superior voting rights of the Class B common stock to have value or to delay or deter a change of control.
You may experience dilution in the future as a result of the issuance of Class A units of Manning & Napier Group in connection with future acquisitions.
We may issue shares of our Class A common stock or units of Manning & Napier Group in connection with future acquisitions or grants under the 2011 Plan. If we grant exchange rights with respect to the issuance of the units of Manning & Napier Group that allow its holder to exchange such units for shares of our Class A common stock, stockholders will incur dilution in the percentage of the issued and outstanding shares of Class A common stock that are owned at such time.
Fulfilling our public company financial reporting and other regulatory obligations will be expensive and time consuming, may strain our resources and if we fail to comply with such obligations, our business, operating results and stock price could be adversely affected.
As a public company, we are subject to the reporting requirements of the Exchange Act, and will be required to implement specific corporate governance practices and adhere to a variety of reporting requirements under the Sarbanes-Oxley Act of 2002, or Sarbanes-Oxley, and the related rules and regulations of the SEC, as well as the rules of the New York Stock Exchange.
26
Table of Contents
In accordance with Section 404 of Sarbanes-Oxley, our management will be required to conduct an annual assessment of the effectiveness of our internal control over financial reporting and include a report on these internal controls in the annual reports on Form 10-K we will file with the SEC. In addition, we will be required to have our independent registered public accounting firm provide an opinion regarding the effectiveness of our internal controls. We expect that in the future we will become an accelerated or large accelerated filer, and accordingly our annual reports, beginning with our annual report for the fiscal year ending December 31, 2012, must also contain a statement that our independent registered public accounting firm has issued an attestation report on the effectiveness of our internal control over financial reporting.
In order to achieve timely compliance with Section 404 of Sarbanes-Oxley, we have begun a process to evaluate our internal control over financial reporting. Our efforts to comply with Section 404 have resulted in, and are likely to continue to result in, significant costs, the commitment of time and operational resources and the diversion of management’s attention. If our management identifies one or more material weaknesses in our internal control over financial reporting, we will be unable to assert that our internal control over financial reporting is effective. If we are unable to assert that our internal control over financial reporting is effective, or if our independent registered public accounting firm is unable to express an opinion on the effectiveness of our internal control over financial reporting, market perception of our financial condition and the trading price of our stock may be adversely affected and customer perception of our business may suffer.
Further, the Exchange Act requires us to file annual, quarterly and current reports with respect to our business and financial condition. Compliance with these requirements places significant additional demands on our legal, accounting and finance staff and on our accounting, financial and information systems and increases our legal and accounting compliance costs as well as our compensation expense as we will be required to hire additional accounting, tax, finance and legal staff with the requisite technical knowledge.
As a public company we have enhanced our investor relations, legal and corporate communications functions. These additional efforts may strain our resources and divert management’s attention from other business concerns, which could have an adverse effect on our business, financial condition and results of operations.
Our corporate documents and Delaware law contain provisions that could discourage, delay or prevent a change in control of the Company.
Our amended and restated certificate of incorporation and amended and restated bylaws contain provisions that may make the acquisition of our company more difficult. These provisions:
| • | authorize the issuance of undesignated preferred stock, the terms of which may be established and the shares of which may be issued without stockholder approval, and which may include super voting, special approval, dividend, or other rights or preferences superior to the rights of the holders of our Class A common stock; |
| • | prohibit stockholder action by written consent and instead require all stockholder actions to be taken at a meeting of our stockholders; |
| • | provide that the board of directors is expressly authorized to make, alter, or repeal our amended and restated bylaws; |
| • | establish advance notice requirements for nominations for elections to our board of directors or for proposing matters that can be acted upon by stockholders at stockholder meetings; and |
| • | establish a dual class structure of our voting stock, granting the holder of our Class B common stock majority voting rights. |
These anti-takeover provisions and other provisions under Delaware law could discourage, delay or prevent a transaction involving a change in control of our company, even if doing so would benefit the holders of our Class A common stock.
27
Table of Contents
Any issuance of preferred stock could make it difficult for another company to acquire us or could otherwise adversely affect holders of our Class A common stock, which could depress the price of our Class A common stock.
Our board of directors has the authority to issue preferred stock and to determine the preferences, limitations and relative rights of shares of preferred stock and to fix the number of shares constituting any series and the designation of such series, without any further vote or action by our stockholders. Our preferred stock could be issued with voting, liquidation, dividend and other rights superior to the rights of our Class A common stock. The potential issuance of preferred stock may delay or prevent a change in control of us, discouraging bids for our Class A common stock at a premium over the market price, and adversely affect the market price and the voting and other rights of the holders of our Class A common stock.
If securities or industry analysts do not publish research or publish inaccurate or unfavorable research about our business, our stock price and trading volume could decline.
The trading market for our Class A common stock depends in part on the research and reports that securities or industry analysts publish about us or our business. If one or more of the analysts who covers us downgrades our stock or publishes inaccurate or unfavorable research about our business, our stock price would likely decline. If one or more of these analysts ceases coverage of us or fails to publish reports on us regularly, demand for our stock could decrease, which could cause our stock price and trading volume to decline.
| Item 1B. | Unresolved Staff Comments. |
The Company has no unresolved SEC comments.
| Item 2. | Properties. |
Our corporate headquarters is located in Fairport, New York, and we have regional offices in St. Petersburg, Florida and Dublin, Ohio. We also lease office space in Northfield, Illinois, Wexford, Pennsylvania, Richmond, Virginia and Portsmouth, New Hampshire. MNIS leases office space in Amherst, New York and Tampa, Florida. Manning & Napier Benefits LLC, a subsidiary of MNIS, leases office space in Ellicottville, New York. We do not own any facilities. The table below lists our current leased facilities.
| Location |
Lease Expiration | Approximate Square Footage | ||||
| Fairport, New York |
June 30, 2015 | 126,254 | ||||
| St. Petersburg, Florida |
October 31, 2016 | 10,438 | ||||
| Dublin, Ohio |
September 30, 2015 | 8,309 | ||||
| Northfield, Illinois |
June 30, 2012 | 765 | ||||
| Wexford, Pennsylvania |
October 31, 2012 | 170 | ||||
| Richmond, Virginia |
November 30, 2012 | 150 | ||||
| Portsmouth, New Hampshire |
March 31, 2012 | 600 | ||||
| Amherst, New York |
July 31, 2013 | 4,123 | ||||
| Tampa, Florida |
October 31, 2012 | 3,431 | ||||
| Ellicottville, New York |
March 31, 2012 | 564 | ||||
We believe our properties are in good operating condition and adequately serve our current business operations. We also anticipate suitable additional or alternative space will be available at commercially reasonable terms for future expansion to the extent necessary.
| Item 3. | Legal Proceedings. |
As an investment adviser to a variety of investment products, we are subject to routine reviews and inspections by the SEC and FINRA. From time to time we may also be involved in various legal proceedings arising in the ordinary course of our business. We do not believe that the outcome of any of these reviews, inspections or other legal proceedings will have a material impact on our combined consolidated financial statements; however, litigation is subject to many uncertainties, and the outcome of individual litigated matters is not predictable with assurance. Currently, there are no legal proceedings pending or to our knowledge threatened against us.
| Item 4. | Mine Safety Disclosures. |
Not applicable.
28
Table of Contents
Item 5.Market for Registrant’s Common Equity, Related Stockholder Matters and Issuer Purchases and Equity Securities.
Market for the Registrant’s Common Equity
Our Class A common stock is listed and trading on the New York Stock Exchange under the symbol “MN” since November 18, 2011. Prior to November 18, 2011, there was no established public trading market for our Class A common stock. Our Class B common stock is not listed on the New York Stock Exchange and there is no established trading market for such shares.
The following table presents information on the high and low sales prices per share as reported on the New York Stock Exchange for our Class A common stock for the periods indicated and dividends declared during such periods:
| High | Low | Dividends Declared Per Share | ||||||||
| Fourth quarter (commencing November 18, 2011) |
$ | 13.24 | $ | 11.76 | $ — | |||||
Holders
As of March 22, 2012 there were 3 holders of record of our Class A common stock and one holder of record of our Class B common stock. A substantially greater number of holders of our Class A common stock are held in “street name” and held of record by banks, brokers, and other financial institutions.
Use of Proceeds
On November 18, 2011, we completed an initial public offering of 12,500,000 shares of our Class A common stock at a price of $12.00 per share, less the underwriting discount. On December 16, 2011, the underwriters exercised their overallotment option and purchased an additional 1,083,873 shares at $12.00 per share, less the underwriting discount. The shares of Class A common stock sold in the IPO were registered under the Securities Act on a registration statement on Form S-1 (File No. 333-175309) that was declared effective by the SEC on November 17, 2011. Merrill Lynch, Pierce, Fenner & Smith Incorporated served as global coordinator of the IPO. J.P. Morgan, Wells Fargo, Stifel, Nicolaus & Co, Keffe, Bruyette & Woods, Inc., Sandler O’Neill & Partners and Needham & Co served as bookrunners. The following table summarizes the net proceeds from the initial public offering.
| Per Share | Total (in thousands) |
|||||||
| Gross Proceeds |
$ | 12.00 | $ | 163,007 | ||||
| Underwriting discount |
.63 | 8,558 | ||||||
|
|
|
|
|
|||||
| Net Proceeds, before expenses, to the Company |
$ | 11.37 | $ | 154,449 | ||||
|
|
|
|
|
|||||
We used approximately $41.2 million of the net proceeds from the initial public offering to purchase Class A units of Manning & Napier Group from Manning & Napier Group, which in turn expects to use such net proceeds for general corporate purposes and strategic growth opportunities, including potential acquisitions and product seeding, approximately $105.7 million of the net proceeds from the initial public offering to purchase Class A units of Manning & Napier Group held by M&N Group Holdings, which in turn distributed such proceeds to its members, and approximately $2.7 million, for expenses relating to the initial public offering, not including the underwriting discount.
29
Table of Contents
Dividends
We currently intend to pay quarterly cash dividends of our Class A common stock. We intend to fund such dividends from our portion of distributions made by Manning & Napier Group, from its available cash generated from operations. William Manning, as the holder of our Class B common stock, will not be entitled to any cash dividends in his capacity as a Class B stockholder, but will, in his capacity as an indirect holder of Class A units of Manning & Napier Group, generally participate on a pro rata basis in distributions by Manning & Napier Group. Distributions to members upon a liquidation of Manning & Napier Group or a capital transaction, such as a sale of all or substantially all of its assets or any financing or refinancing of all or substantially all of its assets or debt, generally will be made to its members pro rata in proportion to their capital account balances, subject to the claims of creditors.
The declaration and payment of all future dividends, if any, will be at the sole discretion of our board of directors. In determining the amount of any future dividends, our board of directors will take into account:
| • | the financial results of Manning & Napier Group; |
| • | our available cash, as well as anticipated cash requirements, including any debt servicing; |
| • | our capital requirements and the capital requirements of our subsidiaries, including Manning & Napier Group; |
| • | contractual, legal, tax and regulatory restrictions on, and implications of, the payment of dividends by us to our stockholders or by Manning & Napier Group to us, including the obligation of Manning & Napier Group to make tax distributions to its unitholders, including us; |
| • | general economic and business conditions; and |
| • | any other factors that our board of directors may deem relevant. |
We have no material assets other than our ownership of Class A units of Manning & Napier Group and, accordingly, will depend on distributions from Manning & Napier Group to fund any dividends we may pay. As managing member of Manning & Napier Group, we will determine the timing and amount of any distributions to be paid to its members. We intend to cause Manning & Napier Group to distribute cash to its members, including us, in an amount sufficient to cover dividends, if any, declared by us. If we do cause Manning & Napier Group to make such distributions, M&N Group Holdings, MNCC and any other holders of units of Manning & Napier Group will be entitled to receive equivalent distributions on a pari passu basis.
Our dividend policy has certain risks and limitations, particularly with respect to liquidity. Although we expect to pay dividends according to our dividend policy, we may not pay dividends according to our policy, or at all, if, among other things, Manning & Napier Group is unable to make distributions to us as a result of its operating results, cash requirements and financial condition, its making certain mandatory distributions to its members relating to their income tax liability, the applicable laws of the State of Delaware, which may limit the amount of funds available for distribution, and its compliance with covenants and financial ratios related to any indebtedness it may incur in the future. See “Management’s Discussion and Analysis of Financial Condition and Results of Operations—Liquidity and Capital Resources.”
We are taxable as a corporation for U.S. federal income tax purposes and therefore holders of our Class A common stock will not be taxed directly on our earnings. Distributions of cash or other property that we pay to our stockholders will constitute dividends for U.S. federal income tax purposes to the extent paid from our current or accumulated earnings and profits, as determined under U.S. federal income tax rules. If the amount of a distribution by us to our stockholders exceeds our current and accumulated earnings and profits, such excess will be treated first as a tax-free return of capital to the extent of a holder’s adjusted tax basis in the Class A common stock and thereafter as capital gain.
30
Table of Contents
Recent Sales of Unregistered Securities
On November 17, 2011, we issued to William Manning, our Chairman of the Board, 1,000 shares of our Class B common stock, as part of the reorganization transactions and our initial public offering. Such shares were issued pursuant to the exemption from registration contained in Section 4(2) of the Securities Act, as an offering and sale of securities by an issuer not involving a public offering.
Equity Compensation Plan Information
| Plan Category |
Number of Securities to be issued upon exercise of outstanding options, warrants and rights |
Weighted- average exercise price of outstanding options, warrants and rights |
Number of securities remaining available for future issuance under equity compensation plans (excluding securities reflected in column (a)) |
|||||||||
| (a) | (b) | (c) | ||||||||||
| Equity compensation plans approved by security holders |
— | — | 13,142,813 | (1) | ||||||||
| Equity compensation plans not approved by security holders |
62,822,825 | (2) | $ | 0.00 | (3) | 13,577,175 | (4) | |||||
|
|
|
|
|
|
|
|||||||
| Total |
62,822,825 | $ | 0.00 | 26,719,988 | ||||||||
|
|
|
|
|
|
|
|||||||
| (1) | The 2011 Equity Compensation Plan was adopted by our board of directors and approved by the Company’s stockholders prior to the consummation of our initial public offering. A total of 13,142,813 equity interests are available for issuance under the 2011 Equity Compensation Plan. |
| (2) | Represents units of Manning & Napier Group which will be exchangeable for shares of our Class A common stock. Pursuant to the adoption of new vesting terms related to the pre-IPO ownership interests of certain employees, some of these units are subject to service-based vesting. Such individuals were entitled to 15% of their pre-Reorganization ownership interests upon the consummation of our initial public offering, and an additional 5% of such ownership interests will vest annually through 2014, provided such individuals are employees of the Company as of such date. |
| (3) | Reflects an exercise price of $0 with respect to each unit outstanding as of December 31, 2011. |
| (4) | Represents units of Manning & Napier Group which will be exchangeable for shares of our Class A common stock. Pursuant to the adoption of new vesting terms related to the pre-IPO ownership interests of certain employees, these units are subject to performance-based vesting. As of December 31, 2011, performance conditions were not yet defined for these performance-based awards and therefore the grant date had not been established as of December 31, 2011. As such, these awards are not considered granted as of December 31, 2011. |
31
Table of Contents
Performance Graph
The following graph compares the cumulative total stockholder return on our common stock from November 18, 2011 (the date our Class A common stock first began trading on the New York Stock Exchange) through December 31, 2011, with the cumulative total return of the Standard & Poor’s 500 Stock Index and the SNL Asset Manager Index. The SNL Manager Index is a composite of 33 publicly traded asset management companies prepared by SNL Financial, Charlottesville, Virginia. The graph assumes the investment of $100 in our Class A common stock and in each of the two indices on November 18, 2011 and the reinvestment of all dividends, if any. The initial public offering price of our Class A common stock was $12.00 per share.
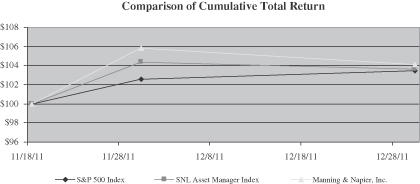
| Company/Index | 11/18/2011 | 11/30/2011 | 12/30/2011 | |||||||||
| Manning & Napier, Inc. |
100.00 | 105.83 | 104.08 | |||||||||
| S&P 500 Index |
100.00 | 102.58 | 103.45 | |||||||||
| SNL Asset Manager Index |
100.00 | 104.38 | 103.65 | |||||||||
In accordance with the rules of the SEC, this section entitled “Performance Graph” shall not be incorporated by reference into any future filings by us under the Securities Act or Exchange Act, and shall not be deemed to be soliciting material or to be filed under the Securities Act or the Exchange Act.
| Item 6. | Selected Financial Data. |
The following tables set forth selected historical combined consolidated financial and other data of the Manning & Napier Companies as of the dates and for the periods indicated. The selected combined consolidated statements of operations data for the years ended December 31, 2011, 2010 and 2009, and the combined consolidated statements of financial condition data as of December 31, 2011 and 2010 have been derived from the Manning & Napier Companies’ audited combined consolidated financial statements included elsewhere in this report.
The selected combined consolidated statements of operations data for the year ended December 31, 2008 has been derived from the Manning & Napier Companies’ audited combined consolidated financial statements not included in this report. The selected combined consolidated statements of operations data for the year ended December 31, 2007 and the combined consolidated statements of financial condition data as of December 31, 2008 and 2007 have been derived from the Manning & Napier Companies’ unaudited combined consolidated financial statements not included in this report.
32
Table of Contents
You should read the following selected historical combined consolidated financial data together with “Management’s Discussion and Analysis of Financial Condition and Results of Operations” and the historical combined consolidated financial statements and related notes included elsewhere in this report.
| Year Ended December 31, |
||||||||||||||||||||
| 2011 | 2010 | 2009 | 2008 | 2007 | ||||||||||||||||
| (in millions, except share and per share data) | ||||||||||||||||||||
| (unaudited) | ||||||||||||||||||||
| Statements of operations data: |
||||||||||||||||||||
| Revenues |
||||||||||||||||||||
| Investment management services revenue |
$ | 330.0 | $ | 255.5 | $ | 162.7 | $ | 145.6 | $ | 133.3 | ||||||||||
| Expenses |
||||||||||||||||||||
| Compensation and related costs |
306.0 | 78.4 | 55.6 | 46.3 | 46.8 | |||||||||||||||
| Sub-transfer agent and shareholder service costs |
49.1 | 36.8 | 19.9 | 13.1 | 9.9 | |||||||||||||||
| Other operating costs |
33.7 | 25.3 | 22.3 | 20.7 | 17.3 | |||||||||||||||
|
|
|
|
|
|
|
|
|
|
|
|||||||||||
| Total operating expenses |
388.8 | 140.5 | 97.8 | 80.1 | 74.0 | |||||||||||||||
|
|
|
|
|
|
|
|
|
|
|
|||||||||||
| Operating (loss) income |
(58.8 | ) | 115.0 | 64.9 | 65.5 | 59.3 | ||||||||||||||
|
|
|
|
|
|
|
|
|
|
|
|||||||||||
| Non-operating loss |
||||||||||||||||||||
| Interest expense on shares subject to mandatory redemption |
(45.8 | ) | (61.2 | ) | (10.0 | ) | (6.7 | ) | (25.0 | ) | ||||||||||
| Other non-operating gain (loss) |
0.2 | — | (0.1 | ) | 0.6 | 1.2 | ||||||||||||||
|
|
|
|
|
|
|
|
|
|
|
|||||||||||
| Total non-operating loss |
(45.6 | ) | (61.2 | ) | (10.1 | ) | (6.1 | ) | (23.8 | ) | ||||||||||
|
|
|
|
|
|
|
|
|
|
|
|||||||||||
| (Loss) income before provision for income taxes |
(104.4 | ) | 53.8 | 54.8 | 59.4 | 35.5 | ||||||||||||||
| Provision for income taxes |
2.0 | 0.7 | 0.4 | 0.4 | 0.6 | |||||||||||||||
|
|
|
|
|
|
|
|
|
|
|
|||||||||||
| Net (loss) income attributable to controlling and noncontrolling interests |
$ | (106.4 | ) | $ | 53.1 | $ | 54.4 | $ | 59.0 | $ | 34.9 | |||||||||
|
|
|
|
|
|
|
|
|
|
|
|||||||||||
| Less: net (loss) income attributable to noncontrolling interests |
(79.2 | ) | 53.1 | 54.4 | 59.0 | 34.9 | ||||||||||||||
|
|
|
|
|
|
|
|
|
|
|
|||||||||||
| Net loss attributable to Manning & Napier, Inc. |
$ | (27.2 | ) | — | — | — | — | |||||||||||||
|
|
|
|||||||||||||||||||
| Net (loss) available to Class A common stock per basic and diluted share(1) |
$ | (2.11 | ) | |||||||||||||||||
|
|
|
|||||||||||||||||||
| Weighted average basic and diluted shares of Class A common stock outstanding (2) |
12,894,136 | |||||||||||||||||||
|
|
|
|||||||||||||||||||
| (1) | We consummated our initial public offering on November 18, 2011. Since that date, we have consolidated the results of Manning & Napier Group, LLC due to our role as its managing member. Therefore, all income for the period prior to November 18, 2011 is entirely attributable to the noncontrolling interest which existed prior to the initial public offering. As a result, in the computation of GAAP earnings per share, only the net income attributable to our controlling interest from the period subsequent to the initial public offering is considered. |
33
Table of Contents
| (2) | The computation of weighted average basic and diluted shares of Class A common stock outstanding considers the outstanding shares from the date of the initial public offering, November 18, 2011 through December 31, 2011. |
| As of December 31, |
||||||||||||||||||||
| 2011 | 2010 | 2009 | 2008 | 2007 | ||||||||||||||||
| (unaudited) | (unaudited) | |||||||||||||||||||
| (in millions) | ||||||||||||||||||||
| Statements of financial condition data: |
||||||||||||||||||||
| Total assets |
$ | 178.8 | $ | 68.3 | $ | 53.4 | $ | 41.1 | $ | 49.3 | ||||||||||
| Shares liability subject to mandatory redemption (1) |
— | 170.3 | 109.1 | 99.1 | 92.4 | |||||||||||||||
| Total liabilities |
87.0 | 212.1 | 136.7 | 120.8 | 120.3 | |||||||||||||||
| (1) | Prior to our initial public offering, we had a mandatory redemption obligation upon the death of William Manning to pay his estate his pro rata share of net revenue for the four quarters immediately preceding his death. Our liability related to this mandatory redemption obligation was calculated each fiscal quarter, and the change in the liability was reflected as non-cash interest expense. As part of the overall agreement among William Manning and the other owners of the Manning & Napier Companies prior to consummating our initial public offering, such mandatory redemption obligation terminated upon the consummation of the initial public offering and we no longer reflect in our financial statements non-cash interest expense or the liability related to such obligation. |
| Year Ended December 31, |
||||||||||||||||||||
| 2011 | 2010 | 2009 | 2008 | 2007 | ||||||||||||||||
| (in millions) | ||||||||||||||||||||
| Selected unaudited financial and operating data: |
|
|||||||||||||||||||
| Assets under management (1) |
$ | 40,200.1 | $ | 38,841.7 | $ | 28,271.3 | $ | 16,231.4 | $ | 18,795.7 | ||||||||||
| Economic income (2) |
156.7 | 115.1 | 64.8 | 66.1 | 60.5 | |||||||||||||||
| Economic net income (2) |
96.8 | 71.0 | 40.0 | 40.8 | 37.3 | |||||||||||||||
| Economic net income per adjusted share (2) |
$ | 1.08 | ||||||||||||||||||
| (1) | Reflects the amount of money we managed for our clients as of the last day of the period. |
| (2) | Economic income, economic net income and economic net income per adjusted share are not financial measures prepared in accordance with GAAP. Our management uses the non-GAAP financial measures of economic income, economic net income and economic net income per adjusted share to evaluate the profitability and efficiency of our business model. See “Management’s Discussion and Analysis of Financial Condition and Results of Operations—Supplemental Non-GAAP Financial Information” for our reasons for including these non-GAAP measures in this report. Our non-GAAP financial measures may differ from similar measures used by other companies, even if similar terms are used to identify such measures. The following table sets forth, for the periods indicated, a reconciliation of non-GAAP financial measures to GAAP measures: |
34
Table of Contents
| Year Ended December 31, |
||||||||||||||||||||
| 2011 | 2010 | 2009 | 2008 | 2007 | ||||||||||||||||
| (unaudited) | ||||||||||||||||||||
| (dollars in thousands) | ||||||||||||||||||||
| Reconciliation of non-GAAP financial measures: |
||||||||||||||||||||
| Net (loss) income attributable to Manning & Napier, Inc. |
$ | (27,167 | ) | $ | — | $ | — | $ | — | $ | — | |||||||||
| Plus: net (loss) income attributable to the noncontrollling interests |
(79,249 | ) | 53,098 | 54,425 | 58,992 | 34,900 | ||||||||||||||
|
|
|
|
|
|
|
|
|
|
|
|||||||||||
| Net (loss) income attributable to the controlling and the noncontrolling interests |
(106,416 | ) | 53,098 | 54,425 | 58,992 | 34,900 | ||||||||||||||
| Provision for income taxes |
1,982 | 712 | 360 | 374 | 555 | |||||||||||||||
|
|
|
|
|
|
|
|
|
|
|
|||||||||||
| (Loss) income before provision for income taxes |
(104,434 | ) | 53,810 | 54,785 | 59,366 | 35,455 | ||||||||||||||
| Interest expense on shares subject to mandatory redemption |
45,833 | 61,243 | 9,991 | 6,707 | 25,001 | |||||||||||||||
| Reorganization-related share-based compensation |
215,324 | — | — | — | — | |||||||||||||||
|
|
|
|
|
|
|
|
|
|
|
|||||||||||
| Economic income |
156,723 | 115,053 | 64,776 | 66,073 | 60,456 | |||||||||||||||
| Adjusted income taxes |
59,947 | 44,008 | 24,777 | 25,273 | 23,124 | |||||||||||||||
|
|
|
|
|
|
|
|
|
|
|
|||||||||||
| Economic net income |
$ | 96,776 | $ | 71,045 | $ | 39,999 | $ | 40,800 | $ | 37,332 | ||||||||||
|
|
|
|
|
|
|
|
|
|
|
|||||||||||
| Net loss available to Class A common stock per basic and diluted share |
(2.11 | ) | ||||||||||||||||||
| Plus: net (loss) income attributable to noncontrolling interests per basic and diluted share |
(6.14 | ) | ||||||||||||||||||
|
|
|
|||||||||||||||||||
| Net (loss) income attributable to controlling and noncontrolling interests per basic and diluted share |
(8.25 | ) | ||||||||||||||||||
| Provision for income taxes per basic and diluted share |
0.15 | |||||||||||||||||||
|
|
|
|||||||||||||||||||
| Loss (income) before provision for income taxes per basic and diluted share |
(8.10 | ) | ||||||||||||||||||
| Interest expense on shares subject to mandatory redemption per basic and diluted share |
3.55 | |||||||||||||||||||
| Reorganization-related share-based compensation per basic and diluted share |
16.70 | |||||||||||||||||||
|
|
|
|||||||||||||||||||
| Economic income per basic and diluted share |
12.15 | |||||||||||||||||||
| Adjusted income taxes per basic and diluted share |
4.65 | |||||||||||||||||||
|
|
|
|||||||||||||||||||
| Economic net income per basic and diluted share |
7.50 | |||||||||||||||||||
| Less: Impact of Manning & Napier Group, LLC units converted to publicly traded shares |
(6.42 | ) | ||||||||||||||||||
|
|
|
|||||||||||||||||||
| Economic net income per adjusted share |
$ | 1.08 | ||||||||||||||||||
|
|
|
|||||||||||||||||||
| Total basic and diluted shares of Class A common stock outstanding |
13,583,873 | |||||||||||||||||||
| Total units of Manning & Napier Group, LLC |
76,400,000 | |||||||||||||||||||
|
|
|
|||||||||||||||||||
| Total adjusted Class A common stock outstanding |
89,983,873 | |||||||||||||||||||
|
|
|
|||||||||||||||||||
35
Table of Contents
| Item 7. | Management’s Discussion and Analysis of Financial Condition and Results of Operations. |
Overview
Business
We are an independent investment management firm that provides a broad range of investment solutions through separately managed accounts, mutual funds and collective investment trust funds. Founded in 1970, we offer equity and fixed income portfolios as well as a range of blended asset portfolios, such as life cycle portfolios, that use a mix of stocks and bonds. We serve a diversified client base of high net worth individuals and institutions, including 401(k) plans, pension plans, Taft-Hartley plans, and endowments and foundations. Our operations are based principally in the United States, with our headquarters located in Fairport, New York.
Our Products
We derive substantially all of our revenues from investment management fees earned from providing advisory services to separately managed accounts and mutual funds and collective investment trusts—including those offered by the Manning & Napier Fund, Inc., or the Fund, and Exeter Trust Company.
| • | Our separate accounts are primarily distributed through our Direct Channel, where our representatives form relationships with high net worth individuals, middle market institutions or large institutions that are working with a consultant. To a lesser extent, we also obtain a portion of our separate account distribution via third parties, either through our Intermediary Channel where national brokerage firm representatives or independent financial advisors select our separate account strategies for their clients, or through our Platform/Sub-Advisory Channel, where unaffiliated registered investment advisors approve our strategies for their product platforms. Our separate account products are a primary driver of our blended asset portfolios for high net worth and middle market institutional clients and financial intermediaries. In contrast, larger institutions and unaffiliated registered investment advisor platforms are a driver of our separate account equity portfolios. |
| • | Our mutual funds and collective investment trusts are primarily distributed through financial intermediaries, including brokers, financial advisors, retirement plan advisors and platform relationships. We also obtain a portion of our mutual fund and collective investment trust distribution through our direct sales representatives, in particular within the defined contribution and institutional marketplace. Our mutual fund and collective investment trust products are an important driver of our blended asset class portfolios, in particular with 401(k) plan sponsors, advisors and recordkeepers that select our funds as default options for participants. In addition, financial intermediaries, mutual fund advisory programs and retail platforms are a driver of equity strategies within our mutual fund and collective investment trust fund offerings. |
Our AUM was $40.2 billion as of December 31, 2011, as illustrated in the table below.
| Blended Asset |
Equity | Fixed Income | Total | |||||||||||||
| (dollar amounts in millions) | ||||||||||||||||
| Assets under management – By investment vehicle and portfolio |
||||||||||||||||
| As of December 31, 2011 |
||||||||||||||||
| Separately managed accounts |
$ | 10,602.4 | $ | 10,809.0 | $ | 1,246.7 | $ | 22,658.1 | ||||||||
| Mutual funds and collective investment trusts |
7,520.1 | 10,003.0 | 18.9 | 17,542.0 | ||||||||||||
|
|
|
|
|
|
|
|
|
|||||||||
| Total |
$ | 18,122.5 | $ | 20,812.0 | $ | 1,265.6 | $ | 40,200.1 | ||||||||
|
|
|
|
|
|
|
|
|
|||||||||
36
Table of Contents
The composition of our separately managed accounts as of December 31, 2011, by channel and portfolio, is set forth in the table below.
| As of December 31, 2011 | ||||||||||||||||
| Blended Asset |
Equity | Fixed Income | Total | |||||||||||||
| (dollar amounts in millions) | ||||||||||||||||
| Separate account AUM |
||||||||||||||||
| Direct Channel |
$ | 7,485.6 | $ | 7,268.8 | $ | 1,042.1 | $ | 15,796.5 | ||||||||
| Intermediary Channel |
3,116.8 | 792.1 | 204.6 | 4,113.5 | ||||||||||||
| Platform/Sub-advisor Channel |
— | 2,748.1 | — | 2,748.1 | ||||||||||||
|
|
|
|
|
|
|
|
|
|||||||||
| Total |
$ | 10,602.4 | $ | 10,809.0 | $ | 1,246.7 | $ | 22,658.1 | ||||||||
|
|
|
|
|
|
|
|
|
|||||||||
| Percentage of separate account AUM |
||||||||||||||||
| Direct Channel |
33 | % | 32 | % | 5 | % | 70 | % | ||||||||
| Intermediary Channel |
14 | % | 3 | % | 1 | % | 18 | % | ||||||||
| Platform/Sub-advisor Channel |
0 | % | 12 | % | 0 | % | 12 | % | ||||||||
|
|
|
|
|
|
|
|
|
|||||||||
| Total |
47 | % | 47 | % | 6 | % | 100 | % | ||||||||
|
|
|
|
|
|
|
|
|
|||||||||
| Percentage of portfolio by channel |
||||||||||||||||
| Direct Channel |
71 | % | 67 | % | 84 | % | 70 | % | ||||||||
| Intermediary Channel |
29 | % | 7 | % | 16 | % | 18 | % | ||||||||
| Platform/Sub-advisor Channel |
— | 26 | % | — | 12 | % | ||||||||||
|
|
|
|
|
|
|
|
|
|||||||||
| Total |
100 | % | 100 | % | 100 | % | 100 | % | ||||||||
|
|
|
|
|
|
|
|
|
|||||||||
| Percentage of channel by portfolio |
||||||||||||||||
| Direct Channel |
47 | % | 46 | % | 7 | % | 100 | % | ||||||||
| Intermediary Channel |
76 | % | 19 | % | 5 | % | 100 | % | ||||||||
| Platform/Sub-advisor Channel |
— | 100 | % | — | 100 | % | ||||||||||
Our separate accounts contributed 32% of our total gross client inflows for the year ended December 31, 2011 and represented 56% of our total AUM as of December 31, 2011.
Our separate account business has historically been driven primarily by our Direct Channel, where sales representatives form a relationship with high net worth investors, middle market institutions, and large institutional clients working in conjunction with a consultant. The Direct Channel contributed 53% of the total gross client inflows for our separate account business for the year ended December 31, 2011 and represented 70% of our total separate account AUM as of December 31, 2011. We anticipate the Direct Channel to continue to be the largest driver of new separate account business going forward, given the Channel’s high net worth and middle market institutional client-type focus.
During 2011, equity and blended asset portfolios represented 63% and 32% of the separate account gross client inflows from the Direct Channel, respectively, while fixed income portfolios accounted for 5%. As of December 31, 2011, equity and blended asset portfolios represented 46% and 47% of total Direct Channel separate account AUM, while our fixed income portfolios were 7%. We expect our focus on individuals and middle market institutions to continue to drive interest in our blended asset class portfolios, where we provide a comprehensive portfolio of stocks and bonds managed to a client’s specific investment objectives. However, relationships with larger institutions have resulted in strong growth in equity portfolios as a percentage of total AUM, which will likely continue given the breadth of our offerings, including domestic, international and global equity portfolios.
To a lesser extent, we also obtain separate account business from third parties, including financial advisors or unaffiliated registered investment advisor programs or platforms. During 2011, 35% of the total gross client inflows for separate accounts came from unaffiliated registered investment advisor platforms (Platform/Sub-advisor Channel), and an additional 12% came from financial advisor representatives (Intermediary Channel). The Platform/Sub-advisor and Intermediary Channels represented 30% of our total separate account AUM as of December 31, 2011.
37
Table of Contents
New separate account business through the Platform/Sub-advisor Channel is primarily directed to our equity strategies, where we are filling a specific mandate within the investment program or platform product. During 2011, 100% of our separate account gross client inflows from the Platform/Sub-advisory Channel were from equity portfolios, and we expect this will continue going forward. As of December 31, 2011, equity portfolios represented 100% of total Platform/Sub-Advisory Channel separate account AUM.
In contrast, gross client inflows through the Intermediary Channel were from both our blended asset portfolios and our equity portfolios, driven by advisors’ needs to identify either a one-stop solution (blended asset portfolio) or to fill a mandate within a multi-strategy portfolio. During 2011, blended asset and equity portfolios represented 63% and 34% of the separate account gross client inflows from the Intermediary Channel, respectively, while fixed income portfolios represented 3%. As of December 31, 2011, 76% of our separate account AUM derived from financial advisors was allocated to blended asset portfolios, with 19% allocated to equity and 5% allocated to fixed income. We expect that equity and fixed income portfolios may see additional interest from financial advisors over time as more and more advisors structure a multi-strategy portfolio.
Despite a difficult market environment, our separate account cancellation rate across all channels was 4.3% during the calendar year 2011, representing the strong relationship focus that is inherent in our direct sales model, which is the primary driver of our separate account business.
The composition of our mutual funds and collective investment trusts as of December 31, 2011, by portfolio, is set forth in the table below.
| As of December 31, 2011 | ||||||||||||||||
| Blended Asset |
Equity | Fixed Income | Total | |||||||||||||
| (dollar amounts in millions) | ||||||||||||||||
| Mutual funds and collective investment |
$ | 7,520.1 | $ | 10,003.0 | $ |
18.9 |
|
$ | 17,542.0 | |||||||
Our mutual fund and collective investment trusts contributed 68% of our total gross client inflows for the year ended December 31, 2011 and represented 44% of our total AUM as of December 31, 2011. As of December 31, 2011, our mutual fund and collective investment trust AUM consisted of 43% from blended asset portfolios and 57% from equity portfolios, compared to 42% and 58% for blended asset and equity portfolios as of December 31, 2010. During the year ended December 31, 2011, 34% of the gross client inflows were attributable to blended assets and the remaining 66% came in equity portfolios. For the year ended December 31, 2011, market depreciation for our mutual fund and collective investment trust AUM was 13.3%, including 2.4% in our blended assets and 21.3% in equity portfolios.
Mutual fund and collective investment trust business is driven by financial intermediaries and to a lesser extent, our direct sales representatives. Intermediary distribution of our mutual fund and collective investment trust vehicles is achieved via financial advisors, brokers, retirement plan advisors and approval of our funds on platforms and within mutual fund advisory programs. Through our Intermediary Channel, we are increasingly focused on our life cycle fund vehicles given our emphasis on advisors that work with retirement plans. Specifically, we anticipate greater use of our life cycle mutual funds and collective investment trusts by advisors that utilize our blended asset portfolios for retail clients. In addition, our allocation to equity portfolios within the Intermediary channel may also increase due to interest from national brokerage firm advisors.
Through our Platform/Sub-advisor channel, we have relationships with consultants and advisors at platforms. We derive equity portfolio assets in this channel through the selection of our funds within advisory programs, such as mutual fund wrap programs, or placement on platforms’ approved lists of funds. To facilitate our relationships with intermediaries, we currently have more than 270 dealer relationships. The continued increase in financial intermediaries offering our mutual funds and collective investment trusts to clients will afford us the opportunity for continued growth in our Intermediary Channel, as well as our Platform/Sub-Advisory channel. These relationships are an important component in expanding our retail business as well as our 401(k) life cycle and institutional business.
38
Table of Contents
Our Direct Sales Representatives distribute our equity portfolios, in particular our non-US portfolios, to large institutional clients for which we have direct relationships with the client and often, the client’s consultant. Through the Direct channel, we also form relationships with middle market and large market defined contribution plan sponsors seeking to use our life cycle mutual funds and collective investment trusts as default options on their investment menu. We expect this channel to be focused on distributing blended asset and equity fund vehicles, particularly as the breadth of our mutual fund and collective investment trust offerings expands.
Results of Operations
Below is a discussion of our consolidated results of operations for the years ended December 31, 2011, 2010, and 2009.
Key Components of Results of Operations
Overview. Changes to our operating results over time are largely driven by net new client asset flows and changes to the market value of our AUM.
An important factor influencing inflows and outflows of our AUM is the investment performance of our various investment approaches. Our variety of stock selection strategies, absolute pricing discipline and active asset allocation management approach generally results in specific absolute and relative return characteristics in different market environments. For example, during a fundamental-driven bull market when prices are rising alongside improving fundamentals, we are likely to experience positive absolute returns and competitive relative returns. However, in a more momentum-driven bull market, when prices become disconnected from underlying fundamentals, we are likely to experience positive absolute returns but lagging relative returns. Similarly, during a valuation-driven bear market, when markets experience a period of price correction following a momentum-driven bull market, we are likely to experience negative absolute returns but strong relative returns. However, in a momentum-driven bear market, which is typically characterized by broad price declines in a highly correlated market, we are likely to experience negative absolute returns and lagging relative returns. Essentially, our approach is likely to do well when markets are driven by fundamentals, but lag when markets are driven primarily by momentum.
Other components of our operating results include:
| • | asset-based fee rates and changes in those rates; |
| • | the composition of our AUM among various portfolios, vehicles and client types; and |
| • | the rate of increase in our variable and fixed costs, which is affected by the rate of revenue increases, compensation and year-to-year changes in incentive bonuses, changes to base compensation, vendor-related costs and investment spending on new products, consultative staffing and proprietary and third-party technology development. |
Assets Under Management. The following two tables reflect the components of our AUM for our investment vehicles and our portfolios for the periods indicated.
The first table presents AUM for our separately managed accounts and our mutual funds and collective investment trusts for the periods indicated. This table reflects the shift in the periods indicated from AUM comprised primarily of our separately managed accounts to a more balanced AUM comprised of both our separately managed accounts and our mutual funds and collective investment trusts. The table reflects that the shift in the periods indicated has occurred due to the strong growth of our mutual funds and collective investment trusts.
The second table presents AUM for our blended asset, equity and fixed income portfolios. This table reflects the shift in the periods indicated from AUM comprised primarily of blended portfolios to a more balanced AUM comprised primarily of blended and equity portfolios. The table reflects that the shift in the periods indicated has occurred due to the growth of the mutual funds and collective investment trusts within our equity portfolio.
39
Table of Contents
For each of the applicable periods, we computed average AUM by averaging 13 data points including beginning of the year AUM and AUM for the end of each of the 12 months during such period.
| Separately managed accounts |
Mutual funds and collective investment trusts |
Total | Separately managed accounts |
Mutual funds and collective investment trusts |
Total | |||||||||||||||||||
| (in millions) | ||||||||||||||||||||||||
| Assets under management—By investment vehicle |
||||||||||||||||||||||||
| As of December 31, 2008 |
11,718.8 | 4,512.6 | 16,231.4 | 72.2 | % | 27.8 | % | 100.0 | % | |||||||||||||||
| Separately managed accounts gross client inflows |
4,093.7 | — | 4,093.7 | |||||||||||||||||||||
| Separately managed accounts gross client outflows |
(1,935.1 | ) | — | (1,935.1 | ) | |||||||||||||||||||
| Mutual funds and collective investment trusts net client flows |
— | 4,540.3 | 4,540.3 | |||||||||||||||||||||
| Market appreciation |
3,356.8 | 1,984.2 | 5,341.0 | |||||||||||||||||||||
|
|
|
|
|
|
|
|||||||||||||||||||
| As of December 31, 2009 |
17,234.2 | 11,037.1 | 28,271.3 | 61.0 | % | 39.0 | % | 100.0 | % | |||||||||||||||
| Gross client inflows |
5,237.7 | 7,310.7 | 12,548.4 | |||||||||||||||||||||
| Gross client outflows |
(2,213.5 | ) | (3,870.4 | ) | (6,083.9 | ) | ||||||||||||||||||
| Market appreciation |
2,676.7 | 1,429.2 | 4,105.9 | |||||||||||||||||||||
|
|
|
|
|
|
|
|||||||||||||||||||
| As of December 31, 2010 |
22,935.1 | 15,906.6 | 38,841.7 | 59.0 | % | 41.0 | % | 100.0 | % | |||||||||||||||
| Gross client inflows |
4,456.3 | 9,328.4 | 13,784.7 | |||||||||||||||||||||
| Gross client outflows |
(3,496.2 | ) | (5,578.3 | ) | (9,074.5 | ) | ||||||||||||||||||
| Market depreciation |
(1,237.1 | ) | (2,114.7 | ) | (3,351.8 | ) | ||||||||||||||||||
|
|
|
|
|
|
|
|||||||||||||||||||
| As of December 31, 2011 |
22,658.1 | 17,542.0 | 40,200.1 | 56.4 | % | 43.6 | % | 100.0 | % | |||||||||||||||
| Separately managed accounts |
Mutual funds and collective investment trusts |
Total | ||||||||||
| Annual growth rates |
||||||||||||
| December 31, 2009 vs. December 31, 2008 |
47.1 | % | 144.6 | % | 74.2 | % | ||||||
| December 31, 2010 vs. December 31, 2009 |
33.1 | % | 44.1 | % | 37.4 | % | ||||||
| December 31, 2011 vs. December 31, 2010 |
(1.2 | %) | 10.3 | % | 3.5 | % | ||||||
| Compound annual growth rate—December 31, 2008 through December 31, 2011 |
24.6 | % | 57.2 | % | 35.3 | % | ||||||
| Separately managed accounts |
Mutual funds and collective investment trusts |
Total | ||||||||||
| (in millions) | ||||||||||||
| Average assets under management |
||||||||||||
| For the year ended December 31, 2009 |
13,614.5 | 6,970.2 | 20,584.7 | |||||||||
| For the year ended December 31, 2010 |
19,268.2 | 13,070.5 | 32,338.7 | |||||||||
| For the year ended December 31, 2011 |
23,850.1 | 18,331.5 | 42,181.6 | |||||||||
40
Table of Contents
| Blended Asset |
Equity | Fixed Income |
Total | Blended Asset |
Equity | Fixed Income |
Total | |||||||||||||||||||||||||
| (in millions) | ||||||||||||||||||||||||||||||||
| Assets under management—By portfolio |
||||||||||||||||||||||||||||||||
| As of December 31, 2008 |
10,142.9 | 4,812.6 | 1,275.9 | 16,231.4 | 62.5 | % | 29.6 | % | 7.9 | % | 100.0 | % | ||||||||||||||||||||
|
|
|
|
|
|
|
|
|
|||||||||||||||||||||||||
| Separately managed accounts gross client inflows |
1,003.2 | 2,801.2 | 289.3 | 4,093.7 | ||||||||||||||||||||||||||||
| Separately managed accounts gross client outflows |
(955.8 | ) | (618.0 | ) | (361.3 | ) | (1,935.1 | ) | ||||||||||||||||||||||||
| Mutual funds and collective investment trusts net client flows |
1,267.0 | 3,273.3 | — | 4,540.3 | ||||||||||||||||||||||||||||
| Market appreciation |
2,492.1 | 2,745.5 | 103.4 | 5,341.0 | ||||||||||||||||||||||||||||
|
|
|
|
|
|
|
|
|
|||||||||||||||||||||||||
| As of December 31, 2009 |
13,949.4 | 13,014.6 | 1,307.3 | 28,271.3 | 49.4 | % | 46.0 | % | 4.6 | % | 100.0 | % | ||||||||||||||||||||
|
|
|
|
|
|
|
|
|
|||||||||||||||||||||||||
| Gross client inflows |
4,131.2 | 8,270.5 | 146.7 | 12,548.4 | ||||||||||||||||||||||||||||
| Gross client outflows |
(2,517.5 | ) | (3,370.2 | ) | (196.2 | ) | (6,083.9 | ) | ||||||||||||||||||||||||
| Market appreciation |
1,717.4 | 2,342.0 | 46.5 | 4,105.9 | ||||||||||||||||||||||||||||
|
|
|
|
|
|
|
|
|
|||||||||||||||||||||||||
| As of December 31, 2010 |
17,280.5 | 20,256.9 | 1,304.3 | 38,841.7 | 44.5 | % | 52.1 | % | 3.4 | % | 100.0 | % | ||||||||||||||||||||
|
|
|
|
|
|
|
|
|
|||||||||||||||||||||||||
| Gross client inflows |
4,263.4 | 9,361.6 | 159.7 | 13,784.7 | ||||||||||||||||||||||||||||
| Gross client outflows |
(3,231.0 | ) | (5,608.0 | ) | (235.5 | ) | (9,074.5 | ) | ||||||||||||||||||||||||
| Market appreciation/(depreciation) |
(190.4 | ) | (3,198.5 | ) | 37.1 | (3,351.8 | ) | |||||||||||||||||||||||||
|
|
|
|
|
|
|
|
|
|||||||||||||||||||||||||
| As of December 31, 2011 |
18,122.5 | 20,812.0 | 1,265.6 | 40,200.1 | 45.1 | % | 51.8 | % | 3.1 | % | 100.0 | % | ||||||||||||||||||||
|
|
|
|
|
|
|
|
|
|||||||||||||||||||||||||
| Blended Asset |
Equity | Fixed Income | Total | |||||||||||||
| Annual growth rates |
||||||||||||||||
| December 31, 2009 vs. December 31, 2008 |
37.5 | % | 170.4 | % | 2.5 | % | 74.2 | % | ||||||||
| December 31, 2010 vs. December 31, 2009 |
23.9 | % | 55.6 | % | (0.2 | %) | 37.4 | % | ||||||||
| December 31, 2011 vs. December 31, 2010 |
4.9 | % | 2.7 | % | (3.0 | %) | 3.5 | % | ||||||||
| Compound annual growth rate—December 31, 2008 through December 31, 2011 |
21.3 | % | 62.9 | % | (0.3 | %) | 35.3 | % | ||||||||
| Blended Asset |
Equity | Fixed Income | Total | |||||||||||||
| (in millions) | ||||||||||||||||
| Average assets under management |
||||||||||||||||
| For the year ended December 31, 2009 |
11,358.4 | 7,969.9 | 1,256.4 | 20,584.7 | ||||||||||||
| For the year ended December 31, 2010 |
15,193.7 | 15,805.3 | 1,339.7 | 32,338.7 | ||||||||||||
| For the year ended December 31, 2011 |
18,276.2 | 22,649.9 | 1,255.5 | 42,181.6 | ||||||||||||
Revenue. Our revenues primarily consist of investment management fees earned from managing our clients’ AUM. We earn our investment management fees as a percentage of our clients’ AUM either as of a specified date or on a daily basis. Our investment management fees fluctuate based on the average fee rate for our investment management products, which are affected by the composition of our AUM among various portfolios and investment vehicles. We currently do not have revenues from performance fee based products.
MNA, our affiliate, serves as the investment advisor to the Fund and Exeter Trust Company. The Fund is currently a family of 29 open-end mutual funds that offer no-load share classes designed to meet the needs of a range of institutional and other investors. Exeter Trust Company is an affiliated New Hampshire-chartered trust
41
Table of Contents
company that sponsors a family of collective investment trusts for qualified retirement plans, including 401(k) plans. These mutual funds and collective investment trusts comprised $17.5 billion, or 44%, of our AUM as of December 31, 2011, and investment management fees from these mutual funds and collective investment trusts were $167.8 million, or 51%, of our revenues for the year ended December 31, 2011.
MNA also serves as the investment advisor to all of our separately managed accounts, managing $22.7 billion, or 56%, of our AUM as of December 31, 2011, including assets managed as a sub-advisor to pooled investment vehicles and assets in client accounts invested in the Fund. Investment management fees from separately managed accounts represented $147.4 million, or 45%, of our revenues for the year ended December 31, 2011.
Operating Expenses. Our largest operating expenses are employee compensation and sub-transfer agent/shareholder service fees, discussed further below, with a significant portion of these expenses varying in a direct relationship to our AUM and revenues. We review our operating expenses in relation to the investment market environment and changes in our revenues. However, we are generally willing to make expenditures as necessary even in the face of declining rates of growth in revenues in order to support our investment products, our client service levels, strategic initiatives and our long-term value.
| • | Compensation and related costs. Employee compensation and related costs represent our largest expense, including employee salaries and benefits, incentive compensation to investment and sales professionals and reorganization-related stock-based compensation. These costs are affected by changes in the employee headcount and mix of existing job descriptions, competitive factors and new product and service initiatives requiring the addition of new skill sets and/or expanded or upgraded staffing. |
| • | Sub-transfer agent/shareholder service fees. Sub-transfer agent/shareholder service fees represent amounts paid to various platforms that distribute our mutual fund and collective investment trust products. These expenses increase as the AUM in our mutual fund and collective investment trust products increase. |
| • | Other operating expenses. Other operating expenses include costs for custodial services, professional fees, including accounting and legal fees, occupancy and facility costs, as well as other costs related to travel and entertainment expenses, insurance, market data service expenses and all other miscellaneous costs associated with managing the day-to-day operations of our business. |
Non-Operating Income (Loss). Non-operating income (loss) includes interest expense, interest and dividend income, and gains (losses) related to investment securities sales and changes in values of those designated as trading. Within interest expense, we have recognized expenses related to the agreement with William Manning, our Chairman and controlling stockholder. Prior to the Company being publicly traded, we had a mandatory redemption obligation upon the death of William Manning to pay his estate his pro rata share of net revenue for the four quarters immediately preceding his death. Our liability related to this mandatory redemption obligation was calculated each fiscal quarter, and the change in the liability was reflected as non-cash interest expense. Upon the consummation of our initial public offering, such mandatory redemption obligation terminated and we no longer reflect non-cash interest expense or the liability related to such agreement.
Provision for Income Taxes. Historically, we have not had a significant provision for income taxes due to the fact that the combined entity is generally made up of S-corporations and limited liability companies. However, following the public offering, we reported an increase in the provision for income taxes due to the requirement to include provisions for federal and state income taxes as a result of Manning & Napier’s C-corporation status.
42
Table of Contents
Critical Accounting Policies and Estimates
The combined consolidated financial statements are prepared in accordance with GAAP and related rules and regulations of the SEC. The preparation of combined consolidated financial statements in conformity with GAAP requires management to make estimates or assumptions that affect the reported amounts of assets and liabilities at the date of the financial statements and the reported amounts of revenues and expenses during the periods presented. Accordingly, actual results could differ from these estimates or assumptions and may have a material effect on the combined consolidated financial statements.
Accounting policies are an integral part of our financial statements. A thorough understanding of these accounting policies is essential when reviewing our reported results of operations and our financial condition. Our management has identified the following significant accounting policies that are critical to understanding our business and prospects for future performance, as these policies affect the reported amounts of revenue and other significant areas that involve management’s judgment and estimates:
| • | Shares subject to redemption; |
| • | Revenue recognition; |
| • | Equity-based compensation; |
| • | Income tax provision; and |
| • | Payments pursuant to the Tax Receivable Agreement |
These policies and our procedures related to these policies are described in detail below. In addition, please refer to the notes to our combined consolidated financial statements included elsewhere in this report for further discussion of our accounting policies.
Shares Subject to Redemption
The Company entered into an agreement with William Manning, pursuant to which we had a mandatory redemption obligation upon his death to pay his pro rata share of net revenue for the four quarters immediately preceding Mr. Manning’s death. In accordance with the requirements of accounting for certain financial instruments with characteristics of both liabilities and equity, we recognized a liability for these shares subject to mandatory redemption in our financial statements.
For one of our entities, MNBD, our redemption obligation upon his death to pay his pro rata share of net revenue had an element of conditionality. In accordance with the requirements of accounting for contracts in our own equity, we had recognized the shares subject to conditional redemption related to MNBD as temporary equity.
Upon consummation of our initial public offering, the shares subject to redemption terminated, and as a result the instruments were reclassified to permanent equity. The liability and temporary equity for all periods prior to the termination had been measured at the redemption amount.
Revenue Recognition
The majority of our revenues are based on fees charged to manage customers’ portfolios. Investment management fees are generally computed as a percentage of AUM and recognized as earned. Fees for providing investment advisory services are computed and billed in accordance with the provisions of the applicable investment management agreements. For our separately managed accounts, clients either pay investment management fees in advance, typically for a semi-annual or quarterly period, or in arrears, typically for a monthly or quarterly period. When investment management fees are paid in advance, we defer the revenue and recognize it over the applicable period. When investment management fees are paid in arrears, we estimate
43
Table of Contents
revenues based on AUM market values as of the most recent month end date, and adjust to actual when billed. Revenue is also earned for providing custodial services, sub-advisor services to mutual funds and collective investment trusts and other services. For mutual funds and collective investment trust vehicles, our fees are calculated and earned daily based on AUM.
Because the majority of our revenues are earned based on AUM that has been determined using fair value methods and since market appreciation/depreciation has a significant impact on our revenue, we have presented our AUM using the GAAP framework for measuring fair value. That framework provides a three-level fair value hierarchy that prioritizes the inputs to valuation techniques used to measure fair value. The hierarchy gives the highest priority to unadjusted quoted prices in active markets for identical assets or liabilities (Level 1) and the lowest priority to unobservable inputs based on company assumptions (Level 3). A financial instrument’s categorization within the fair value hierarchy is based upon the lowest level of input that is significant to the instrument’s fair value measurement. The three levels within the fair value hierarchy are described as follows:
Level 1—includes quoted prices (unadjusted) in active markets for identical assets or liabilities that the Plan has the ability to access at the measurement date.
Level 2—includes inputs other than quoted prices that are observable for the asset or liability, including quoted prices for similar assets or liabilities in active markets, quoted prices for identical or similar assets or liabilities in markets that are not active, or inputs other than quoted prices that are observable for the asset or liability.
Level 3—includes one or more significant unobservable inputs.
The table below summarizes the approximate amount of AUM for the periods indicated for which fair value is measured based on Level 1, Level 2 and Level 3.
| Level 1 | Level 2 | Level 3 | Total | |||||||||||||
| (in millions) | ||||||||||||||||
| December 31, 2010 AUM |
$ | 20,496 | $ | 18,346 | $ | — | $ | 38,842 | ||||||||
| December 31, 2011 AUM |
21,732 | 18,462 | 6 | 40,200 | ||||||||||||
As substantially all our AUM is valued by independent pricing services based upon observable market prices or inputs, we believe market risk is the most significant risk underlying valuation of our AUM, as discussed under the heading “Item 1A. Risk Factors” and “Item 7A. Quantitative and Qualitative Disclosure About Market Risk.”
All other revenue earned by us is recognized on a GAAP accounting basis as earned per the terms of the specific contract.
Equity-Based Compensation
The Company measures the cost of employee services received in exchange for an award of equity instruments based on the grant-date fair value of the award. The cost is recognized over the period during which an employee is required to provide service in exchange for the award for the portion of the shares that are expected to vest. Therefore, we apply estimated forfeiture rates. If the actual number of forfeitures differs from those estimated by management, additional adjustments to compensation expense may be required in future periods.
Income Tax Provision
Management judgment is required in developing our provision for income taxes, including the determination of deferred tax assets and liabilities and any valuation allowance that might be required against deferred tax assets. As of December 31, 2011, we have not recorded a valuation allowance on deferred tax assets,
44
Table of Contents
which were primarily attributable to an increase in the tax basis of the tangible and intangible assets of Manning & Napier Group’s election under Section 754 of the Internal Revenue Code. In the event that sufficient taxable income of the same character does not result in future years, among other things, a valuation allowance for certain of our deferred tax assets may be required. Because the determination of our annual income tax provision is subject to judgments and estimates, it is likely that the actual results will vary from those recorded in our financial statements. Hence, we recognize additions to and reductions in income tax expense during a reporting period that pertains to prior period provisions as our estimated liabilities are revised and our actual tax returns and tax audits are completed.
The Company recognizes tax benefits from uncertain tax positions only if it is more likely than not that the tax position will be sustained upon examination by the taxing authorities, based on the technical merits of the position. The tax benefits recognized in the financial statements from such positions are then measured based on the largest benefit that has a greater than 50% likelihood of being realized.
Payments pursuant to the Tax Receivable Agreement
As a result of the Company’s purchase of Class A units of Manning & Napier Group from M&N Group Holdings and Manning & Napier Group’s election under Section 754 of the Internal Revenue Code, the Company expects to benefit from depreciation and amortization deductions from an increase in tax basis of tangible and intangible assets of Manning & Napier Group. Those deductions allocated to the Company will be taken into account in reporting the Company’s taxable income.
Upon consummation of the offering, the company entered into a tax receivable agreement (“TRA”) with M&N Group Holdings, MNCC and the other holders of Class A units of Manning & Napier Group, under which we are required to pay to the holders of such Class A units 85% of the applicable cash savings, if any, in U.S. federal, state, local and foreign income tax that we actually realize, or are deemed to realize in certain circumstances as a result of any step-up in tax basis in Manning & Napier Group’s assets resulting from (i) the Company’s purchase of such Class A units from M&N Group Holdings with a portion of the net proceeds of the initial public offering, (ii) the Company’s purchases or exchanges of such Class A units from M&N Group Holdings and MNCC, respectively, for cash or shares of our Class A common stock and (iii) payments under the tax receivable agreement, including any tax benefits related to imputed interest deemed to be paid by us as a result of such agreement.
As of December 31, 2011, the Company recorded a liability of $46.2 million, representing the payments due to the selling unitholders. The amount and timing of any payments vary based on a number of factors, including no material change in the relevant tax law, the Company continues to earn sufficient taxable income to realize all tax benefits, and assuming no additional uncertain tax positions that are subject to the tax receivable agreement; depending upon the outcome of these factors, we may be obligated to make substantial payments pursuant to the TRA. The actual payment amounts may differ from these estimated amounts, as the liability will reflect changes in prevailing tax rates as well as the actual benefit it realized on the tax return.
Within the next 12 month period, the Company expects to pay approximately $0.3 million of the total amount. The basis for determining the current portion of the payments under the TRA is the expected amount of payments to be made within the next 12 months. The long-term portion of the payments is the remainder. To determine the current amount of the payments due, the Company estimated the amount of taxable income that Manning & Napier has generated since consummation of the initial public offering. Next, the Company estimated the amount of the specified TRA deductions for the respective period. This was used as a basis for determining the amount of tax deduction that generates a TRA obligation which was used to calculate the estimated payments due under the TRA that the Company expects to pay in the next 12 months. These calculations are performed in accordance with the terms of the TRA.
45
Table of Contents
Recent Accounting Pronouncements
In June 2011, the Financial Accounting Standards Board (“FASB”) issued Accounting Standards Update (“ASU”) 2011-05, Comprehensive Income (Topic 220): Presentation of Comprehensive Income. This standard eliminates the current option to report other comprehensive income and its components in the statement of changes in equity. In December 2011, the FASB issued an amendment to this standard which defers the requirement to present components of reclassifications of other comprehensive income on the face of the income statement. These amendments are effective for annual periods beginning after December 15, 2011. We do not expect the amendments to have a material impact on our combined consolidated financial statements and related disclosures.
In May 2011, FASB issued ASU 2011-04, Fair Value Measurement (Topic 820): Amendments to Achieve Common Fair Value Measurement and Disclosure Requirements in U.S. GAAP and International Financial Reporting Standards. The amendments in this update change the wording used to describe the requirements in U.S. GAAP for measuring fair value and for disclosing information about fair value measurements. These amendments are effective for annual periods beginning after December 15, 2011. We do not expect the amendments to have a material impact on our combined consolidated financial statements and related disclosures.
In February 2010, the FASB issued ASU 2010-10, Consolidation (Topic 810): Amendments for Certain Investment Funds. The amendments to the consolidation requirements of Topic 810 are deferred for a reporting entity’s interest in an entity (1) that has all the attributes of an investment company or (2) for which it is industry practice to apply measurement principles for financial reporting purposes that are consistent with those followed by investment companies. ASU 2010-10 became effective for us on January 1, 2010 and there was no impact on our combined consolidated financial statements and related disclosures.
In January 2010, the FASB issued ASU 2010-06, Fair Value Measurements and Disclosures (Topic 820): Improving Disclosures about Fair Value Measurements, which requires entities to make new disclosures about recurring or nonrecurring fair-value measurements and provides clarification of existing disclosure requirements. This amendment requires separate disclosures about purchases, sales, issuances, and settlements relating to Level 3 measurements. This amendment is effective for fiscal years beginning after December 15, 2010. The adoption did not have a material impact on the our combined consolidated financial statements and related disclosures.
46
Table of Contents
Year Ended December 31, 2011 Compared to Year Ended December 31, 2010
Assets Under Management
The following table reflects changes in our AUM for the years ended December 31, 2011 and 2010:
| Year Ended December 31, | Period-to-Period | |||||||||||||||
| 2011 | 2010 | $ | % | |||||||||||||
| (dollars in millions) | ||||||||||||||||
| Separately managed accounts |
||||||||||||||||
| Beginning assets under management |
$ | 22,935.1 | $ | 17,234.2 | $ | 5,700.9 | 33 | % | ||||||||
| Gross client inflows |
4,456.3 | 5,237.7 | (781.4 | ) | (15 | %) | ||||||||||
| Gross client outflows |
(3,496.2 | ) | (2,213.5 | ) | (1,282.7 | ) | 58 | % | ||||||||
| Market appreciation (depreciation) |
(1,237.1 | ) | 2,676.7 | (3,913.8 | ) | (146 | %) | |||||||||
|
|
|
|
|
|
|
|||||||||||
| Ending assets under management |
$ | 22,658.1 | $ | 22,935.1 | $ | (277.0 | ) | (1 | %) | |||||||
|
|
|
|
|
|
|
|||||||||||
| Mutual funds and collective investment trusts |
||||||||||||||||
| Beginning assets under management |
$ | 15,906.6 | $ | 11,037.1 | 4,869.5 | 44 | % | |||||||||
| Gross client inflows |
9,328.4 | 7,310.7 | 2,017.7 | 28 | % | |||||||||||
| Gross client outflows |
(5,578.3 | ) | (3,870.4 | ) | (1,707.9 | ) | 44 | % | ||||||||
| Market appreciation (depreciation) |
(2,114.7 | ) | 1,429.2 | (3,543.9 | ) | (248 | %) | |||||||||
|
|
|
|
|
|
|
|||||||||||
| Ending assets under management |
$ | 17,542.0 | $ | 15,906.6 | $ | 1,635.4 | 10 | % | ||||||||
|
|
|
|
|
|
|
|||||||||||
| Total assets under management |
||||||||||||||||
| Beginning assets under management |
$ | 38,841.7 | $ | 28,271.3 | 10,570.4 | 37 | % | |||||||||
| Gross client inflows |
13,784.7 | 12,548.4 | 1,236.3 | 10 | % | |||||||||||
| Gross client outflows |
(9,074.5 | ) | (6,083.9 | ) | (2,990.6 | ) | 49 | % | ||||||||
| Market appreciation (depreciation) |
(3,351.8 | ) | 4,105.9 | (7,457.7 | ) | (182 | %) | |||||||||
|
|
|
|
|
|
|
|||||||||||
| Ending assets under management |
$ | 40,200.1 | $ | 38,841.7 | $ | 1,358.4 | 4 | % | ||||||||
|
|
|
|
|
|
|
|||||||||||
Our total AUM increased by $1.4 billion, or 4%, to $40.2 billion as of December 31, 2011 from $38.8 billion as of December 31, 2010. As of December 31, 2011, the composition of our AUM was 44% in mutual funds and collective investment trusts and 56% in separate accounts as compared to 41% in mutual funds and collective investment trusts and 59% in separate accounts as of December 31, 2010. Mutual funds and collective investment trusts AUM increased by 10% as of December 31, 2011 compared to December 31, 2010, while separate account AUM decreased by 1% over the same period. The $1.4 billion increase in total AUM was driven by net client inflows of $4.7 billion, partially offset by market depreciation of $3.4 billion. Of the $4.7 billion net client inflows, $3.8 billion, or 80%, was derived from mutual fund and collective investment trusts and $1.0 billion, or 20%, was derived from separately managed accounts.
Our market depreciation during the year ended December 31, 2011 constituted an 8.6% rate of decrease in our total AUM. The investment loss was 5.4% in separately managed accounts and 13.3% in mutual funds and collective investment trusts, reflecting primarily a difference in the mix of portfolios in the two investment vehicles.
The rates of change in AUM during the year ended December 31, 2011 were generally modest across all of our portfolios. While our blended asset and equity portfolios experienced growth of 5% and 3%, respectively, our fixed income portfolio decreased by 3%.
47
Table of Contents
The following table sets forth our results of operations for the years ended December 31, 2011 and 2010:
| Year Ended December 31, | Period-to-Period | |||||||||||||||
| 2011 | 2010 | $ | % | |||||||||||||
| (dollars in thousands, except share and per share data) | ||||||||||||||||
| Statements of operations data: |
||||||||||||||||
| Revenues |
||||||||||||||||
| Investment management services revenue |
$ | 329,992 | $ | 255,472 | $ | 74,520 | 29 | % | ||||||||
| Expenses |
||||||||||||||||
| Compensation and related costs |
305,957 | 78,416 | 227,541 | 290 | % | |||||||||||
| Sub-transfer agent and shareholder service costs |
49,115 | 36,830 | 12,285 | 33 | % | |||||||||||
| Other operating costs |
33,704 | 25,284 | 8,420 | 33 | % | |||||||||||
|
|
|
|
|
|
|
|||||||||||
| Total operating expenses |
388,776 | 140,530 | 248,246 | 177 | % | |||||||||||
|
|
|
|
|
|
|
|||||||||||
| Operating (loss) income |
(58,784 | ) | 114,942 | (173,726 | ) | (151 | %) | |||||||||
|
|
|
|
|
|
|
|||||||||||
| Non-operating loss |
||||||||||||||||
| Interest expense on shares subject to mandatory redemption |
(45,833 | ) | (61,243 | ) | 15,410 | (25 | %) | |||||||||
| Other non-operating gain |
183 | 111 | 72 | 65 | % | |||||||||||
|
|
|
|
|
|
|
|||||||||||
| Total non-operating loss |
(45,650 | ) | (61,132 | ) | 15,482 | (25 | %) | |||||||||
|
|
|
|
|
|
|
|||||||||||
| (Loss) income before provision for income taxes |
(104,434 | ) | 53,810 | (158,244 | ) | (294 | %) | |||||||||
| Provision for income taxes |
1,982 | 712 | 1,270 | 178 | % | |||||||||||
|
|
|
|
|
|
|
|||||||||||
| Net (loss) income attributable to controlling and noncontrolling interests |
(106,416 | ) | 53,098 | (159,514 | ) | (300 | %) | |||||||||
| Less: net (loss) income attributable to noncontrolling interests |
(79,249 | ) | 53,098 | (132,347 | ) | (249 | %) | |||||||||
|
|
|
|
|
|
|
|||||||||||
| Net loss attributable to Manning & Napier, Inc. |
$ | (27,167 | ) | |||||||||||||
|
|
|
|||||||||||||||
| Per Share Data |
||||||||||||||||
| Net loss available to Class A common stock per basic and diluted share |
$ | (2.11 | ) | |||||||||||||
|
|
|
|||||||||||||||
| Weighted average basic and dilute shares of Class A common stock outstanding. |
12,894,136 | |||||||||||||||
|
|
|
|||||||||||||||
Revenues
Our investment management services revenue increased by $74.5 million, or 29%, to $330.0 million for the year ended December 31, 2011 from $255.5 million for the year ended December 31, 2010. This increase was driven primarily by a $9.8 billion, or 30%, increase in our average AUM to $42.2 billion for the year ended December 31, 2011 from $32.3 billion for the year ended December 31, 2010.
Our average separately managed account fee decreased slightly to 62 basis points for the year ended December 31, 2011 from 63 basis points for the year ended December 31, 2010. This is a result of higher average account sizes in our separately managed accounts. For the year ended December 31, 2011 and 2010, separately managed account standard fees ranged from 15 basis points to 125 basis points, which was consistent with prior periods. As of December 31, 2011, the concentration of investments in our separately managed account assets
48
Table of Contents
was 47% blended assets, 47% equity and 6% fixed income, compared to 46% blended assets, 48% equity and 6% fixed income as of December 31, 2010.
Our average fee on mutual fund and collective investment trust products decreased slightly to 92 basis points for the year ended December 31, 2011 from 93 basis points for the year ended December 31, 2010. The management fees earned on our mutual funds and collective investment trusts ranged from 45 basis points to 100 basis points for both the year ended December 31, 2011 and 2010, consistent with prior periods.
Operating Expenses
Our operating expenses increased by $248.2 million, or 177%, to $388.8 million for the year ended December 31, 2011 from $140.5 million for the year ended December 31, 2010.
Compensation and related costs increased by $227.5 million, or 290%, to $306.0 million for the year ended December 31, 2011 from $78.4 million for the year ended December 31, 2010. This increase was primarily attributable to a non-cash reorganization-related share-based compensation charge of $215.3 million, of which $213.0 million was a one-time non-cash compensation charge related to the Class B Units of M&N Group Holdings granted to William Manning. Further, we experienced a 17% increase in headcount to 471 employees as of December 31, 2011 from 404 as of December 31, 2010. When considered as a percentage of revenue, compensation and related costs excluding non-cash reorganization-related share-based compensation charges decreased to 27% for the year ended December 31, 2011 from 31% for the year ended December 31, 2010. This decrease in compensation as a percentage of revenue resulted from incentive compensation growing at a slower rate in 2011 compared to 2010 because of a reduction in net client inflows and market depreciation during the second half of 2011.
Sub-transfer agent and shareholder service costs increased by $12.3 million, or 33%, to $49.1 million for the year ended December 31, 2011 from $36.8 million for the year ended December 31, 2010. The increase was generally attributable to a 40% increase in mutual funds and collective investment trusts average AUM for the year ended December 31, 2011 compared to December 31, 2010. As a percentage of mutual fund and collective investment trust revenue, sub-transfer agent and shareholder service fees decreased slightly to 29% for the year ended December 31, 2011 from 30% for the year ended December 31, 2010.
Other operating costs increased by $8.4 million, or 33%, to $33.7 million for the year ended December 31, 2011 from $25.3 million for the year ended December 31, 2010. The increase was primarily attributable to professional services fees associated with our initial public offering consummated during the year ended December 31, 2011, as well as higher 12b-1 fees resulting from an increase in mutual fund AUM.
Non-Operating Income (Loss)
Non-operating loss decreased by $15.5 million, or 25%, to $45.7 million for the year ended December 31, 2011 from $61.1 million for the year ended December 31, 2010. The decrease was due to the decrease in non-cash interest expense on shares subject to mandatory redemption. Non-cash interest expense on shares subject to mandatory redemption decreased because the mandatory redemption obligation terminated upon the consummation of our initial public offering and we no longer reflect non-cash interest expense or the related liability as of December 31, 2011.
Provision for Income Taxes
The Company’s tax provision increased by $1.3 million, or 178%, to $2.0 million for the year ended December 31, 2011 from $0.7 million for the year ended December 31, 2010. The increase is primarily driven by the Company’s reorganization and the C-Corporation taxes resulting from the incorporation of the Company during 2011. For the year ended December 31, 2010, the Company operated primarily as a series of flow-through entities which are generally not subject to U.S federal or most state and local income tax.
49
Table of Contents
Year Ended December 31, 2010 Compared to Year Ended December 31, 2009
Assets Under Management
The following table reflects changes in our AUM for the years ended December 31, 2010 and 2009:
| Year Ended December 31, | Period-to-Period | |||||||||||||||
| 2010 | 2009 | $ | % | |||||||||||||
| (dollars in millions) | ||||||||||||||||
| Separately managed accounts |
||||||||||||||||
| Beginning assets under management |
$ | 17,234.2 | $ | 11,718.8 | $ | 5,515.4 | 47 | % | ||||||||
| Gross client inflows |
5,237.7 | 4,093.7 | 1,144.0 | 28 | % | |||||||||||
| Gross client outflows |
(2,213.5 | ) | (1,935.1 | ) | (278.4 | ) | 14 | % | ||||||||
| Market appreciation |
2,676.7 | 3,356.8 | (680.1 | ) | (20 | %) | ||||||||||
|
|
|
|
|
|
|
|||||||||||
| Ending assets under management |
$ | 22,935.1 | $ | 17,234.2 | $ | 5,700.9 | 33 | % | ||||||||
|
|
|
|
|
|
|
|||||||||||
| Mutual funds and collective investment trusts |
||||||||||||||||
| Beginning assets under management |
$ | 11,037.1 | $ | 4,512.6 | $ | 6,524.5 | 145 | % | ||||||||
| Net client flows |
3,440.3 | 4,540.3 | (1,100.0 | ) | (24 | %) | ||||||||||
| Market appreciation |
1,429.2 | 1,984.2 | (555.0 | ) | (28 | %) | ||||||||||
|
|
|
|
|
|
|
|||||||||||
| Ending assets under management |
$ | 15,906.6 | $ | 11,037.1 | $ | 4,869.5 | 44 | % | ||||||||
|
|
|
|
|
|
|
|||||||||||
| Total assets under management |
||||||||||||||||
| Beginning assets under management |
$ | 28,271.3 | $ | 16,231.4 | $ | 12,039.9 | 74 | % | ||||||||
| Gross separately managed accounts client inflows |
5,237.7 | 4,093.7 | 1,144.0 | 28 | % | |||||||||||
| Gross separately managed accounts client outflows |
(2,213.5 | ) | (1,935.1 | ) | (278.4 | ) | 14 | % | ||||||||
| Net mutual funds and collective investment trusts client flows |
3,440.3 | 4,540.3 | (1,100.0 | ) | (24 | %) | ||||||||||
| Market appreciation |
4,105.9 | 5,341.0 | (1,235.1 | ) | (23 | %) | ||||||||||
|
|
|
|
|
|
|
|||||||||||
| Ending assets under management |
$ | 38,841.7 | $ | 28,271.3 | $ | 10,570.4 | 37 | % | ||||||||
|
|
|
|
|
|
|
|||||||||||
Our total AUM increased by $10.6 billion, or 37%, to $38.8 billion as of December 31, 2010 from $28.3 billion as of December 31, 2009. As of December 31, 2010, the composition of our AUM was 41% in mutual funds and collective investment trusts and 59% in separate accounts as compared to 39% in mutual funds and collective investment trusts and 61% in separate accounts as of December 31, 2009. Of the total $10.6 billion increase in AUM, 61% was driven by net new client flows of $6.5 billion, primarily due to inflows from new and existing financial intermediary relationships. Of the $6.5 billion net new client flows, $3.4 billion, or 54%, was derived from mutual funds and collective investment trusts and 46% from separately managed accounts; 39% of the increase in our total AUM in 2010 came from investment gains.
Our market appreciation during the year ended December 31, 2010 constituted a 14.5% rate of increase in our total AUM compared to the year ended December 31, 2009. The investment gain was 15.5% in separately managed accounts and 12.9% in mutual funds and collective investment trusts, reflecting primarily a difference in the mix of portfolios in the two investment vehicles.
The rates of increase in AUM during the year ended December 31, 2010 were most rapid, in excess of 50%, for our equity portfolios. The blended asset portfolios also experienced strong growth of 24%. Equity portfolios contributed 68% of our total increase in AUM as of December 31, 2010 compared to December 31, 2009, while blended asset portfolios contributed 32% of our total increase in AUM as of December 31, 2010 compared to December 31, 2009.
50
Table of Contents
The following table sets forth our results of operations for the years ended December 31, 2010 and 2009:
| Year Ended December 31, |
Period-to-Period | |||||||||||||||
| 2010 | 2009 | Amount | % | |||||||||||||
| (dollars in thousands) | ||||||||||||||||
| Statements of operations data: |
||||||||||||||||
| Revenues |
||||||||||||||||
| Investment management services revenue |
$ | 255,472 | $ | 162,660 | $ | 92,812 | 57 | % | ||||||||
| Expenses |
||||||||||||||||
| Compensation and related costs |
78,416 | 55,643 | 22,773 | 41 | % | |||||||||||
| Sub-transfer agent and shareholder service costs |
36,830 | 19,853 | 16,977 | 86 | % | |||||||||||
| Other operating costs |
25,284 | 22,252 | 3,032 | 14 | % | |||||||||||
|
|
|
|
|
|
|
|||||||||||
| Total operating expenses |
140,530 | 97,748 | 42,782 | 44 | % | |||||||||||
|
|
|
|
|
|
|
|||||||||||
| Operating income |
114,942 | 64,912 | 50,030 | 77 | % | |||||||||||
|
|
|
|
|
|
|
|||||||||||
| Non-operating loss |
||||||||||||||||
| Interest expense on shares subject to mandatory redemption (1) |
(61,243 | ) | (9,991 | ) | (51,252 | ) | 513 | % | ||||||||
| Other non-operating gain (loss) |
111 | (136 | ) | 247 | (182 | %) | ||||||||||
|
|
|
|
|
|
|
|||||||||||
| Total non-operating loss |
(61,132 | ) | (10,127 | ) | (51,005 | ) | 504 | % | ||||||||
|
|
|
|
|
|
|
|||||||||||
| Income before provision for income taxes |
53,810 | 54,785 | (975 | ) | (2 | %) | ||||||||||
| Provision for income taxes |
712 | 360 | 352 | 98 | % | |||||||||||
|
|
|
|
|
|
|
|||||||||||
| Net income attributable to controlling and noncontrolling interests |
53,098 | $ | 54,425 | $ | (1,327 | ) | (2 | %) | ||||||||
| Less: net income attributable to noncontrolling interests |
53,098 | $ | 54,425 | $ | (1,327 | ) | (2 | %) | ||||||||
|
|
|
|
|
|
|
|||||||||||
| Net income attributable to Manning & Napier, |
$ | — | $ | — | $ | — | — | |||||||||
|
|
|
|
|
|
|
|||||||||||
Revenues
Our investment management services revenue increased by $92.8 million, or 57%, to $255.5 million as of December 31, 2010 from $162.7 million as of December 31, 2009. This increase was attributable to an $11.7 billion, or 57%, increase in our average AUM to $32.3 billion for the year ended December 31, 2010 from $20.6 billion for the year ended December 31, 2009.
Our average separately managed account fee decreased to 63 basis points for the year ended December 31, 2010 from 65 basis points for the year ended December 31, 2009. This is a result of lower fee tiers in our separately managed accounts resulting from higher average separately managed account sizes triggered by market appreciation and new separately managed account clients. For the years ended December 31, 2010 and 2009, separately managed account standard fees ranged from 15 basis points to 125 basis points, which was consistent with prior periods. For the year ended December 31, 2010, the concentration of investments in our assets was 46% blended assets, 48% equity and 6% fixed income, compared to 55% blended assets, 38% equity and 7% fixed income for the year ended December 31, 2009.
Our average fee on mutual fund and collective investment trust products remained consistent at approximately 93 basis points for the years ended December 31, 2010 and 2009. The management fees earned on our mutual funds and collective investment trusts ranged from 45 basis points to 100 basis points for both the years ended December 31, 2010 and 2009, consistent with prior periods.
51
Table of Contents
Operating Expenses
Total operating expenses increased by $42.8 million, or 44%, to $140.5 million for the year ended December 31, 2010 from $97.7 million for the year ended December 31, 2009. This increase was driven primarily by increases in compensation and sub-transfer agent and shareholder service fees.
Compensation and related costs increased by $22.8 million, or 41%, to $78.4 million for the year ended December 31, 2010 from $55.6 million for the year ended December 31, 2009. The 41% increase was driven in large part by higher incentive compensation due to analyst bonuses and sales representative commissions, as well as from increases in overall firm-wide headcount of 7.2%, to 404 as of December 31, 2010 from 377 as of December 31, 2009. As a percentage of revenue, however, compensation and related costs decreased to 31% for the year ended December 31, 2010 from 34% for the year ended December 31, 2009 because we continued to increase headcount during 2009 despite the fact that the pace of revenue growth slowed as a result of the economic downturn at the end of 2008.
Sub-transfer agent and shareholder service fees increased by $16.9 million, or 86%, to $36.8 million for the year ended December 31, 2010 from $19.9 million for the year ended December 31, 2009. The increase was generally attributable to an 88% increase in mutual funds and collective investment trusts average AUM for the year ended December 31, 2010 compared to December 31, 2009. As a percentage of mutual fund and collective investment trust revenue, sub-transfer agent and shareholder service fees remained stable at 30% for the years ended December 31, 2010 and 2009.
Non-Operating Income (Loss)
Non-operating loss increased by $51.0 million, or 504%, to $61.1 million for the year ended December 31, 2010 from $10.1 million for the year ended December 31, 2009. The increase was primarily due to the increase in non-cash interest expense on the shares subject to mandatory redemption. Non-cash interest expense on shares subject to mandatory redemption increased because the period-to-period change in the liability from December 31, 2009 to December 31, 2010 was greater than the period-to-period change in the liability from December 31, 2008 to December 31, 2009. This liability is calculated based on the last four quarters of net revenue pursuant to the terms of an agreement with William Manning described elsewhere in this report, and we have recognized non-cash interest expense related to the period-to-period change in the amount of the liability for shares subject to mandatory redemption.
Provision for Income Taxes
Provision for income taxes increased by $0.3 million, or 98%, to $0.7 million for the year ended December 31, 2010 from $0.4 million for the year ended December 31, 2009. The increase was primarily due to a 77% increase in operating income for the year ended December 31, 2010 compared to the year ended December 31, 2009.
Supplemental Non-GAAP Financial Information
To provide investors with greater insight, promote transparency and allow for a more comprehensive understanding of the information used by management in its financial and operational decision-making, the Company supplements its combined consolidated statements of operations presented on a GAAP basis with non-GAAP financial measures of earnings.
Management uses economic income, economic net income, and economic net income per adjusted share as financial measures to evaluate the profitability and efficiency of its business model. Economic income and economic net income are not presented in accordance with GAAP. Economic income excludes from income before provision for income taxes:
| • | the non-cash interest expense associated with the liability for shares subject to mandatory redemption. Upon consummation of the initial public offering, such mandatory redemption obligation terminated |
52
Table of Contents
| and the Company no longer reflects in its financial statements non-cash interest expense or the liability related to such obligation; and |
| • | the reorganization-related share-based compensation, which results in non-cash compensation expense reported over the vesting period. In addition, upon the consummation of our initial public offering, the vesting terms related to the ownership of our employees were modified, including our named executive officers, other than William Manning. Such individuals were entitled to 15% of their ownership interests upon the consummation of our initial public offering, and 15% of their ownership interests over the subsequent three years. The remaining ownership interests are subject to performance-based vesting over such three-year period. Such new vesting terms will not result in dilution to the number of outstanding shares of the Company’s Class A common stock. As a result of such vesting requirements, the Company will recognize non-cash compensation charges through 2014. |
Economic net income is a non-GAAP measure of after-tax operating performance and equals the Company’s economic income less adjusted income taxes. Adjusted income taxes are estimated assuming the exchange of all outstanding units of Manning & Napier Group into Class A common stock on a one-to-one basis. Therefore, all income of Manning & Napier Group allocated to the units of Manning & Napier Group is treated as if it were allocated to the Company and represents an estimate of income tax expense at an effective rate of 38.25% on economic income for each respective period, reflecting assumed federal, state and local income taxes. Economic net income per adjusted share is equal to economic net income divided by the total number of adjusted Class A common shares outstanding. The number of adjusted Class A common shares outstanding for all periods presented is determined by assuming that all outstanding units of Manning & Napier Group are converted into our outstanding Class A common stock as of December 31, 2011, on a one-to-one basis. The Company’s management uses economic net income, among other financial data, to determine the earnings available to distribute as dividends to holders of its Class A common stock and to the holders of the units of Manning & Napier Group.
Non-GAAP measures are not a substitute for financial measures prepared in accordance with GAAP. Additionally, the Company’s non-GAAP measures may differ from similar measures by other companies, even if similar terms are used to identify such measures.
The following table sets forth our other financial and operating data for the years ended December 31, 2011 and 2010:
| Year Ended December 31, | Period-to-Period | |||||||||||||||
| 2011 | 2010 | $ | % | |||||||||||||
| (dollars in thousands, except share and per share data) | ||||||||||||||||
| Other financial and operating data |
||||||||||||||||
| Economic income (1). |
$ | 156,723 | $ | 115,053 | $ | 41,670 | 36 | % | ||||||||
|
|
|
|
|
|
|
|||||||||||
| Economic net income (1). |
$ | 96,776 | $ | 71,045 | $ | 25,731 | 36 | % | ||||||||
|
|
|
|
|
|
|
|||||||||||
| Economic net income per adjusted share (1) |
$ | 1.08 | ||||||||||||||
|
|
|
|||||||||||||||
| (1) | See “Management’s Discussion and Analysis of Financial Condition and Results of Operations – Supplemental Non-GAAP Financial Information” for Manning & Napier’s reasons for including these non-GAAP measures in this report. The following table sets forth, for the periods indicated, a reconciliation of non-GAAP financial measures to GAAP measures: |
53
Table of Contents
| Year Ended December 31, | Period-to-Period | |||||||||||||||
| 2011 | 2010 | $ | % | |||||||||||||
| (dollars in thousands, except share and per share data) | ||||||||||||||||
| Reconciliation of non-GAAP financial measures: |
||||||||||||||||
| Net loss attributable to Manning & Napier, Inc. |
$ | (27,167 | ) | $ | — | $ | (27,167 | ) | — | |||||||
| Plus: net (loss) income attributable to noncontrolling interests |
(79,249 | ) | 53,098 | (132,347 | ) | (249 | )% | |||||||||
|
|
|
|
|
|
|
|||||||||||
| Net (loss) income attributable to controlling and noncontrolling interests |
(106,416 | ) | 53,098 | (159,514 | ) | (300 | )% | |||||||||
| Provision for income taxes |
1,982 | 712 | 1,270 | 178 | % | |||||||||||
|
|
|
|
|
|
|
|||||||||||
| (Loss) income before provision for income taxes |
(104,434 | ) | 53,810 | (158,244 | ) | (294 | )% | |||||||||
| Interest expense on shares subject to mandatory redemption |
45,833 | 61,243 | (15,410 | ) | (25 | )% | ||||||||||
| Reorganization-related share-based compensation |
215,324 | — | 215,324 | — | ||||||||||||
|
|
|
|
|
|
|
|||||||||||
| Economic income |
156,723 | 115,053 | 41,670 | 36 | % | |||||||||||
| Adjusted income taxes |
59,947 | 44,008 | 15,939 | 36 | % | |||||||||||
|
|
|
|
|
|
|
|||||||||||
| Economic net income |
$ | 96,776 | $ | 71,045 | $ | 25,731 | 36 | % | ||||||||
|
|
|
|
|
|
|
|||||||||||
| Net loss available to Class A common stock per basic and diluted share |
(2.11 | ) | ||||||||||||||
| Plus: net (loss) income attributable to noncontrolling interests per basic and diluted share |
(6.14 | ) | ||||||||||||||
|
|
|
|||||||||||||||
| Net (loss) income attributable to controlling and noncontrolling interests per basic and diluted share |
(8.25 | ) | ||||||||||||||
| Provision for income taxes per basic and diluted share |
0.15 | |||||||||||||||
|
|
|
|||||||||||||||
| Loss (income) before provision for income taxes per basic and diluted share |
(8.10 | ) | ||||||||||||||
| Interest expense on shares subject to mandatory redemption per basic and diluted share |
3.55 | |||||||||||||||
| Reorganization-related share-based compensation per basic and diluted share |
16.70 | |||||||||||||||
|
|
|
|||||||||||||||
| Economic income per basic and diluted share |
12.15 | |||||||||||||||
| Adjusted income taxes per basic and diluted share |
4.65 | |||||||||||||||
|
|
|
|||||||||||||||
| Economic net income per basic and diluted share |
7.50 | |||||||||||||||
| Less: Impact of Manning & Napier Group, LLC units converted to publicly traded shares |
(6.42 | ) | ||||||||||||||
|
|
|
|||||||||||||||
| Economic net income per adjusted share |
$ | 1.08 | ||||||||||||||
|
|
|
|||||||||||||||
| Total basic and diluted shares of Class A common stock outstanding |
13,583,873 | |||||||||||||||
| Total units of Manning & Napier Group, LLC |
76,400,000 | |||||||||||||||
|
|
|
|||||||||||||||
| Total adjusted Class A common stock outstanding |
89,983,873 | |||||||||||||||
|
|
|
|||||||||||||||
54
Table of Contents
The following table sets forth our results of our other financial and operating data for the years ended December 31, 2010 and 2009:
| Year Ended December 31, |
Period-to-Period | |||||||||||||||
| 2010 | 2009 | Amount | % | |||||||||||||
| (dollars in thousands) | ||||||||||||||||
| Other financial and operating data |
||||||||||||||||
| Economic income (1) |
$ | 115,053 | $ | 64,776 | $ | 50,277 | 78 | % | ||||||||
|
|
|
|
|
|
|
|||||||||||
| Economic net income (1) |
$ | 71,045 | $ | 39,999 | $ | 31,046 | 78 | % | ||||||||
|
|
|
|
|
|
|
|||||||||||
| (1) | See “Management’s Discussion and Analysis of Financial Condition and Results of Operations – Supplemental Non-GAAP Financial Information” for Manning & Napier’s reasons for including these non-GAAP measures in this report. The following table sets forth, for the periods indicated, a reconciliation of non-GAAP financial measures to GAAP measures: |
| Year Ended December 31, |
Period-to-Period | |||||||||||||||
| 2010 | 2009 | Amount | % | |||||||||||||
| (dollars in thousands) | ||||||||||||||||
| Reconciliation of non-GAAP financial measures: |
||||||||||||||||
| Net (loss) income attributable to Manning & Napier, Inc. |
— | — | — | |||||||||||||
| Plus: net income attributable to noncontrolling interests |
53,098 | 54,425 | (1,327 | ) | (2 | )% | ||||||||||
|
|
|
|
|
|
|
|
|
|||||||||
| Net income attributable to controlling and noncontrolling interests |
53,098 | 54,425 | (1,327 | ) | (2 | )% | ||||||||||
| Provision for income taxes |
712 | 360 | 352 | 98 | % | |||||||||||
|
|
|
|
|
|
|
|||||||||||
| Income before provision for income taxes |
53,810 | 54,785 | (975 | ) | (2 | )% | ||||||||||
| Interest expense on shares subject to mandatory redemption |
61,243 | 9,991 | 51,252 | 513 | % | |||||||||||
| Reorganization-related share-based compensation |
— | — | — | |||||||||||||
|
|
|
|
|
|
|
|||||||||||
| Economic income |
115,053 | 64,776 | 50,277 | 78 | % | |||||||||||
| Adjusted income taxes |
44,008 | 24,777 | 19,231 | 78 | % | |||||||||||
|
|
|
|
|
|
|
|||||||||||
| Economic net income |
$ | 71,045 | $ | 39,999 | $ | 31,046 | 78 | % | ||||||||
|
|
|
|
|
|
|
|||||||||||
55
Table of Contents
Quarterly Results
The following tables set forth selected unaudited combined consolidated quarterly results of operations data and selected consolidated operating data for the eight quarters ended December 31, 2011. This unaudited information has been prepared on substantially the same basis as our audited combined consolidated financial statements and includes all adjustments consisting only of normal recurring adjustments, necessary to a fair statement of the consolidated results of operations and selected combined consolidated operating data for the periods presented therein. The unaudited combined consolidated quarterly data should be read together with the combined consolidated financial statements and related notes included elsewhere in this report. The results for any quarter are not necessarily indicative of results for any future period and you should not rely on them as such. Changes to our operating results from one period to another are primarily caused by changes in the value of our AUM, which increase or decrease with the net inflows or outflows of cash into our various investment strategies and with the investment performance of these strategies.
| Three Months Ended | ||||||||||||||||||||||||||||||||
| December 31, 2011 |
September 30, 2011 |
June 30, 2011 |
March 31, 2011 |
December 31, 2010 |
September 30, 2010 |
June 30, 2010 |
March 31, 2010 |
|||||||||||||||||||||||||
| (unaudited) (dollars in thousands) |
||||||||||||||||||||||||||||||||
| Statements of operations data: |
||||||||||||||||||||||||||||||||
| Investment management services revenue |
$ | 80,358 | $ | 85,789 | $ | 85,805 | $ | 78,040 | $ | 73,463 | $ | 63,249 | $ | 61,550 | $ | 57,210 | ||||||||||||||||
| Expenses |
||||||||||||||||||||||||||||||||
| Compensation and related costs |
235,113 | 20,890 | 27,061 | 22,894 | 23,298 | 19,740 | 18,603 | 16,775 | ||||||||||||||||||||||||
| Sub-transfer agent and shareholder service costs |
12,255 | 12,496 | 12,668 | 11,695 | 10,537 | 9,212 | 8,583 | 8,498 | ||||||||||||||||||||||||
| Other operating costs |
8,479 | 9,300 | 9,700 | 6,225 | 7,078 | 6,205 | 6,212 | 5,789 | ||||||||||||||||||||||||
|
|
|
|
|
|
|
|
|
|
|
|
|
|
|
|
|
|||||||||||||||||
| Total operating expenses |
255,847 | 42,686 | 49,429 | 40,814 | 40,913 | 35,157 | 33,398 | 31,062 | ||||||||||||||||||||||||
|
|
|
|
|
|
|
|
|
|
|
|
|
|
|
|
|
|||||||||||||||||
| Operating (loss) income |
(175,489 | ) | 43,103 | 36,376 | 37,226 | 32,550 | 28,092 | 28,152 | 26,148 | |||||||||||||||||||||||
| Non-operating loss |
||||||||||||||||||||||||||||||||
| Interest expense on shares subject to mandatory redemption |
(3,111 | ) | (13,339 | ) | (16,095 | ) | (13,288 | ) | (13,590 | ) | (13,534 | ) | (17,900 | ) | (16,219 | ) | ||||||||||||||||
| Other non-operating gains (losses) |
138 | 192 | (155 | ) | 8 | 89 | 15 | (3 | ) | 10 | ||||||||||||||||||||||
|
|
|
|
|
|
|
|
|
|
|
|
|
|
|
|
|
|||||||||||||||||
| Total non-operating loss |
(2,973 | ) | (13,147 | ) | (16,250 | ) | (13,280 | ) | (13,501 | ) | (13,519 | ) | (17,903 | ) | (16,209 | ) | ||||||||||||||||
| (Loss) income before provision for income taxes |
(178,462 | ) | 29,956 | 20,126 | 23,946 | 19,049 | 14,573 | 10,249 | 9,939 | |||||||||||||||||||||||
| Provision for income taxes |
1,191 | 253 | 253 | 286 | 64 | 229 | 208 | 211 | ||||||||||||||||||||||||
|
|
|
|
|
|
|
|
|
|
|
|
|
|
|
|
|
|||||||||||||||||
| Net (loss) income attributable to controlling and noncontrolling interests |
$ | (179,653 | ) | $ | 29,703 | $ | 19,873 | $ | 23,660 | $ | 18,985 | $ | 14,344 | $ | 10,041 | $ | 9,728 | |||||||||||||||
| Less: net (loss) income attributable to noncontrolling interest |
$ | (152,486 | ) | $ | 29,703 | $ | 19,873 | $ | 23,660 | $ | 18,985 | $ | 14,344 | $ | 10,041 | $ | 9,728 | |||||||||||||||
|
|
|
|
|
|
|
|
|
|
|
|
|
|
|
|
|
|||||||||||||||||
| Net loss attributable to Manning & Napier, Inc. |
$ | (27,167 | ) | $ | — | $ | — | $ | — | $ | — | $ | — | $ | — | $ | — | |||||||||||||||
|
|
|
|||||||||||||||||||||||||||||||
| Other financial and operating data |
||||||||||||||||||||||||||||||||
| Economic income (1) |
$ | 39,973 | $ | 43,295 | $ | 36,221 | $ | 37,234 | $ | 32,639 | $ | 28,107 | $ | 28,149 | $ | 26,158 | ||||||||||||||||
|
|
|
|
|
|
|
|
|
|
|
|
|
|
|
|
|
|||||||||||||||||
| Economic net income (1) |
$ | 24,684 | $ | 26,735 | $ | 22,366 | $ | 22,992 | $ | 20,155 | $ | 17,356 | $ | 17,382 | $ | 16,153 | ||||||||||||||||
|
|
|
|
|
|
|
|
|
|
|
|
|
|
|
|
|
|||||||||||||||||
| (1) | Economic income and economic net income are not financial measures prepared in accordance with GAAP. See “Management’s Discussion and Analysis of Financial Condition and Results of Operations—Supplemental Non-GAAP Financial Information” for Manning & Napier’s reasons for included these non-GAAP measures in this report. The following table sets forth, for the periods indicated, a reconciliation of non-GAAP financial measures to GAAP measures: |
56
Table of Contents
| Three Months Ended | ||||||||||||||||||||||||||||||||
| December 31, 2011 |
September 30, 2011 |
June 30, 2011 |
March 31, 2011 |
December 31, 2010 |
September 30, 2010 |
June 30, 2010 |
March 31, 2010 |
|||||||||||||||||||||||||
| (unaudited) (dollars in thousands) |
||||||||||||||||||||||||||||||||
| Reconciliation of non-GAAP financial measures: |
||||||||||||||||||||||||||||||||
| Net (loss) income attributable to Manning & Napier, Inc. |
$ | (27,167 | ) | $ | — | $ | — | $ | — | $ | — | $ | — | $ | — | $ | — | |||||||||||||||
| Plus: net (loss) income attributable to noncontrolling interests |
(152,486 | ) | 29,703 | 19,873 | 23,660 | 18,985 | 14,344 | 10,041 | 9,728 | |||||||||||||||||||||||
|
|
|
|
|
|
|
|
|
|
|
|
|
|
|
|
|
|||||||||||||||||
| Net (loss) income attributable to controlling and noncontrolling interests |
(179,653 | ) | 29,703 | 19,873 | 23,660 | 18,985 | 14,344 | 10,041 | 9,728 | |||||||||||||||||||||||
| Provision for income taxes |
1,191 | 253 | 253 | 286 | 64 | 229 | 208 | 211 | ||||||||||||||||||||||||
|
|
|
|
|
|
|
|
|
|
|
|
|
|
|
|
|
|||||||||||||||||
| (Loss) income before provision for income taxes |
(178,462 | ) | 29,956 | 20,126 | 23,946 | 19,049 | 14,573 | 10,249 | 9,939 | |||||||||||||||||||||||
| Interest expense on shares subject to mandatory redemption |
3,111 | 13,339 | 16,095 | 13,288 | 13,590 | 13,534 | 17,900 | 16,219 | ||||||||||||||||||||||||
| Reorganization-related share-based compensation |
215,324 | — | — | — | — | — | — | — | ||||||||||||||||||||||||
|
|
|
|
|
|
|
|
|
|
|
|
|
|
|
|
|
|||||||||||||||||
| Economic income |
39,973 | 43,295 | 36,221 | 37,234 | 32,639 | 28,107 | 28,149 | 26,158 | ||||||||||||||||||||||||
| Adjusted income taxes |
15,289 | 16,560 | 13,855 | 14,242 | 12,484 | 10,751 | 10,767 | 10,005 | ||||||||||||||||||||||||
|
|
|
|
|
|
|
|
|
|
|
|
|
|
|
|
|
|||||||||||||||||
| Economic net income |
$ | 24,684 | $ | 26,735 | $ | 22,366 | $ | 22,992 | $ | 20,155 | $ | 17,356 | $ | 17,382 | $ | 16,153 | ||||||||||||||||
|
|
|
|
|
|
|
|
|
|
|
|
|
|
|
|
|
|||||||||||||||||
| Total Operating Revenue |
80,358 | 85,789 | 85,805 | 78,040 | 73,463 | 63,249 | 61,550 | 57,210 | ||||||||||||||||||||||||
| Net (loss) income attributable to controlling and noncontrolling interests margin percentage |
(223.6 | %) | 34.6 | % | 23.2 | % | 30.3 | % | 25.8 | % | 22.7 | % | 16.3 | % | 17.0 | % | ||||||||||||||||
| Economic income margin percentage |
49.7 | % | 50.5 | % | 42.2 | % | 47.7 | % | 44.4 | % | 44.4 | % | 45.7 | % | 45.7 | % | ||||||||||||||||
| Economic net income margin percentage |
30.7 | % | 31.2 | % | 26.1 | % | 29.5 | % | 27.4 | % | 27.4 | % | 28.2 | % | 28.2 | % | ||||||||||||||||
Liquidity and Capital Resources
Historically, our cash and liquidity needs have been met primarily through cash generated by our operations. Our current financial condition is highly liquid, with a significant amount of our assets comprised of cash and cash equivalents and accounts receivable. The following table sets forth certain key financial data relating to our liquidity and capital resources as of December 31, 2011, 2010 and 2009:
| Year Ended December 31, | ||||||||||||
| 2011 | 2010 | 2009 | ||||||||||
| (dollars in thousands) | ||||||||||||
| Cash and cash equivalents |
$ | 81,208 | $ | 27,543 | $ | 24,802 | ||||||
| Accounts receivable |
$ | 31,259 | $ | 30,799 | $ | 21,374 | ||||||
| Amounts payable under tax receivable agreement (1) |
$ | 46,205 | $ | — | $ | — | ||||||
| (1) | In light of numerous factors affecting our obligation to make such payments, the timing and amounts of any such actual payments are based on the Company’s best estimate as of December 31, 2011, including the Company’s ability to realize the expected tax benefits. Actual payments may significantly differ from estimated payments. See “Critical Accounting Policies – Payments under the Tax Receivable Agreement” for more information. |
In determining the sufficiency of liquidity and capital resources to fund our business, we regularly monitor our liquidity position, including among other things, cash, working capital, long-term liabilities, lease commitments and operating company distributions. We believe cash generated from operations will be sufficient over the foreseeable future, or twelve months, to meet our working capital requirements. Further, we expect that cash on hand and cash generated by operations will be sufficient to meet our liquidity needs.
57
Table of Contents
Cash Flows
The following table sets forth our cash flows for the years ended December 31, 2011, 2010 and 2009. Operating activities consist primarily of net income subject to adjustments for changes in operating assets and liabilities, change in shares liability subject to mandatory redemption, depreciation, and equity-based compensation expense. Investing activities consist primarily of the purchase and sales of property and equipment, as well as the purchase and sale of investments. Financing activities consist primarily of distributions, contributions, and net proceeds from our initial public offering.
| Years Ended December 31, | ||||||||||||
| 2011 | 2010 | 2009 | ||||||||||
| (in thousands) | ||||||||||||
| Net cash provided by operating activities |
$ | 153,862 | $ | 119,972 | $ | 62,779 | ||||||
| Net cash used in investing activities |
(2,028 | ) | (2,489 | ) | (975 | ) | ||||||
| Net cash used in financing activities |
(98,169 | ) | (114,742 | ) | (60,311 | ) | ||||||
|
|
|
|
|
|
|
|||||||
| Net change in cash flows |
$ | 53,665 | $ | 2,741 | $ | 1,493 | ||||||
|
|
|
|
|
|
|
|||||||
Year Ended December 31, 2011 Compared to Year Ended December 31, 2010
Operating Activities
Operating activities provided $153.9 million and $120.0 million of net cash for the years ended December 31, 2011 and 2010, respectively. This increase in net cash provided by operating activities was driven primarily by an increase in net (loss) income after adjustment for non-cash items of approximately $40.2 million, which was offset by a $6.3 million decrease in working capital.
The increase in net income after adjustment for non-cash items was mainly attributable to higher investment management fee revenues resulting from an increase in our average AUM to $42.2 billion for the year ended December 31, 2011 compared to $32.3 billion for the year ended December 31, 2010.
Investing Activities
Investing activities used $2.0 million and $2.5 million of net cash for the years ended December 31, 2011 and 2010, respectively. The decrease in net cash used in investing activities was primarily due to the increase in sales of investments of $1.9 million, partially offset by increases in property and equipment purchases of $0.6 million and purchases of investments of $0.3 million for the year ended December 31, 2011 compared to the year ended December 31, 2010.
Financing Activities
Financing activities used $98.2 million and $114.7 million of net cash for the years ended December 31, 2011 and 2010, respectively. The decrease in net cash used in financing activities was primarily the result of $46.6 million of cash inflows resulting from our initial public offering, which represents net proceeds from the issuance of Class A common stock of $154.4 million less payments of costs directly associated with the issuance of Class A common stock of $2.1 million and the purchase of Class A Units of Manning & Napier Group of $105.7 million. This was partially offset by an increase in distributions of $29.0 million for the year ended December 31, 2011 compared to the year ended December 31, 2010.
Year Ended December 31, 2010 Compared to Year Ended December 31, 2009
Operating Activities
Operating activities provided $120.0 million and $62.8 million of net cash for the years ended December 31, 2010 and 2009, respectively. This increase in net cash flows from operating activities was driven primarily by an
58
Table of Contents
increase in the non-cash interest expense associated with the mandatory redemption liability of $51.3 million for the year ended December 31, 2010 compared to the year ended December 31, 2009, offset by a decrease in net income of $1.3 million for the year ended December 31, 2010 compared to the year ended December 31, 2009. In addition, an increase in accrued expenses and other liabilities of $7.4 million further contributed to the increase in net cash flows from operating activities for the year ended December 31, 2010 compared to the year ended December 31, 2009. Our average AUM increased to $32.3 billion for year ended December 31, 2010 from $20.6 billion for the year ended December 31, 2009, which had a corresponding positive impact on our investment management fee revenue.
Investing Activities
Investing activities used $2.5 million and $1.0 million of net cash for the years ended December 31, 2010 and 2009, respectively. This increase in net cash used in investing activities was primarily due to the increase in the purchase of investment securities of $1.4 million for the year ended December 31, 2010 compared to the year ended December 31, 2009, offset by an increase in proceeds from the maturity of investments of $0.5 million for the year ended December 31, 2010 compared to the year ended December 31, 2009.
Financing Activities
Financing activities used $114.7 million and $60.3 million of net cash for the years ended December 31, 2010 and 2009, respectively. This increase in net cash used in financing activities was primarily the result of an increase in distributions of $55.6 million for the year ended December 31, 2010 compared to the year ended December 31, 2009.
Certain Contractual Obligations
The following table sets forth our contractual obligations as of December 31, 2011:
| Payment Due By Period | ||||||||||||||||||||
| Contractual Obligations |
Less than 1 year |
1-3 years | 4-5 years | More than 5 years |
Total | |||||||||||||||
| (in thousands) | ||||||||||||||||||||
| Operating lease obligations |
$ | 3,383 | $ | 6,395 | $ | 1,944 | $ | — | $ | 11,722 | ||||||||||
| Capital lease obligations |
125 | 107 | 6 | — | 238 | |||||||||||||||
| Amounts payable under tax receivable agreement (1) |
321 | 3,880 | 4,401 | 37,603 | 46,205 | |||||||||||||||
|
|
|
|
|
|
|
|
|
|
|
|||||||||||
| Total |
$ | 3,829 | $ | 10,382 | $ | 6,351 | $ | 37,603 | $ | 58,165 | ||||||||||
|
|
|
|
|
|
|
|
|
|
|
|||||||||||
| (1) | In light of numerous factors affecting our obligation to make such payments, the timing and amounts of any such actual payments are based on the Company’s best estimate as of December 31, 2011, including the Company’s ability to realize the expected tax benefits. Actual payments may significantly differ from estimated payments. See “Critical Accounting Policies – Payments under the Tax Receivable Agreement” for more information. |
Off Balance Sheet Arrangements
We did not have any off-balance sheet arrangements as of December 31, 2011.
| Item 7A. | Quantitative and Qualitative Disclosures About Market Risk. |
Quantitative and Qualitative Disclosures About Market Risk
Market Risk
Our exposure to market risk is directly related to the role of our operating company as an investment adviser for the mutual funds and separate accounts it manages. Substantially all of our revenues are derived from
59
Table of Contents
investment management agreements with these funds and accounts. Under these agreements, the investment management fees we receive are based on the value of our AUM and our fee rates. Accordingly, our revenues and net income may decline as a result of our AUM decreasing due to depreciation of our investment portfolios. In addition, such a decline could cause our clients to withdraw their funds in favor of investments offering higher returns or lower risk, which would cause our revenues to decline further.
The value of our AUM was $40.2 billion as of December 31, 2011. Assuming a 10% increase or decrease in the value of our AUM and the change being proportionally distributed over all our products, the value would increase or decrease by $4.0 billion, which would cause an annualized increase or decrease in revenues of approximately $31.5 million at our current weighted average fee rate of 0.78%.
We have not adopted a corporate-level risk management policy regarding client assets, nor have we attempted to hedge at the corporate level the market risks that would affect the value of our overall AUM and related revenues. Some of these risks (e.g., sector risks and currency risks) are inherent in certain strategies, and clients may invest in particular strategies to gain exposure to these risks.
We also are subject to market risk from a decline in the prices of investment securities that we own. These securities consist primarily of short-term investments, equity securities and investment in mutual funds, including the Fund for which MNA provides advisory services. The value of these investment securities was $4.6 million as of December 31, 2011 of which $4.0 million is classified as trading, and $0.6 million is classified as available-for-sale. Management regularly monitors the value of these investments; however, given their nature and relative size, we have not adopted a specific risk management policy to manage the associated market risk. Assuming a 10% increase or decrease in the values of these investment securities, the fair value would increase or decrease by $0.5 million at December 31, 2011. Due to the nature of our business, we believe that we do not face any material risk from inflation.
Exchange Rate Risk
A substantial portion of the accounts that we advise, or sub-advise, hold investments that are denominated in currencies other than the U.S. dollar. Movements in the rate of exchange between the U.S. dollar and the underlying foreign currency affect the values of assets held in accounts we manage, thereby affecting the amount of revenues we earn. The value of the assets we manage was $40.2 billion as of December 31, 2011. As of December 31, 2011, approximately 27% of our AUM across our investment strategies was invested in securities denominated in currencies other than the U.S. dollar. To the extent our AUM are denominated in currencies other than the U.S. dollar, the value of those AUM would decrease, with an increase in the value of the U.S. dollar, or increase, with a decrease in the value of the U.S. dollar.
We monitor our exposure to exchange rate risk and make decisions on how to manage such risk accordingly; however, we have not adopted a corporate-level risk management policy to manage exchange rate risk. Assuming that 27% of our AUM is invested in securities denominated in currencies other than the U.S. dollar and excluding the impact of any hedging arrangements, a 10% increase or decrease in the value of the U.S. dollar would decrease or increase the fair value of our AUM by $1.1 billion, which would cause an annualized increase or decrease in revenues of approximately $8.6 million at our current weighted average fee rate of 0.78%.
Interest Rate Risk
We typically invest our excess cash balances in money market mutual funds that invest primarily in U.S. Treasury or agency-backed money market instruments. These funds attempt to maintain a stable net asset value but interest rate changes may affect the fair value of such investments and, if significant, could result in a loss of investment principal. Interest rate changes affect the income we earn from our excess cash balances.
60
Table of Contents
Item 8. Financial Statements and Supplementary Data.
Our consolidated financial statements listed in Item 15 are filed as part of this report on pages F-2 through F-31 and are incorporated by reference in this Item 8.
Item 9. Changes in and Disagreements with Accountants on Accounting and Financial Disclosure.
None
Item 9A. Controls and Procedures.
We maintain disclosure controls and procedures, as defined in Rule 13a-15(e) of the Exchange Act, that are designed to ensure that information required to be disclosed in our reports filed or submitted under the Securities Exchange Act of 1934 is recorded, processed, summarized and reported within the time periods specified in the SEC’s rules and forms, and that such information is accumulated and communicated to our management, including chief executive officer and chief financial officer, as appropriate, to allow for timely decisions regarding required disclosure. As of December 31, 2011, we carried out an evaluation, under the supervision and with the participation of management, including the chief executive officer and our chief financial officer, of the effectiveness of the design and operation of our disclosure controls and procedures were effective and were operating at the reasonable assurance level.
This annual report does not include a report of management’s assessment regarding internal control over financial reporting or an attestation report of the company’s registered public accounting firm due to a transition period established by rules of the Securities and Exchange Commission for newly public companies.
In addition, there were no changes in the Company’s internal control over financial reporting during the quarter ended December 31, 2011 that materially affected, or are reasonably likely to materially affect, the Company’s internal control over financial reporting.
None
61
Table of Contents
Item 10. Directors, Executive Officers and Corporate Governance
Information required by this item will be in our definitive Proxy Statement for our 2012 Annual Meeting of Stockholders to be held on June 20, 2012, which will be filed within 120 days of the end of our fiscal year ended December 31, 2011 (“2012 Proxy Statement”) and is incorporated herein by reference.
Item 11. Executive Compensation
Information required by this item will be in the 2012 Proxy Statement and is incorporated herein by reference.
Item 12. Security Ownership of Certain Beneficial Owners and Management and Related Stockholder Matters
Information required by this item will be in the 2012 Proxy Statement and is incorporated herein by reference.
Item 13. Certain Relationships and Related Transactions, and Director Independence
Information required by this item will be in the 2012 Proxy Statement and is incorporated herein by reference.
Item 14. Principal Accounting Fees and Services
Information required by this item will be in the 2012 Proxy Statement and is incorporated herein by reference.
62
Table of Contents
Item 15. Exhibits, Financial Statement Schedules.
| (a) | The following documents are filed as part of this Annual Report on Form 10-K: |
| (1) | Financial Statements |
| (i) | Combined Consolidated Statements of Financial Condition as of December 31, 2011 and 2010 |
| (ii) | Combined Consolidated Statements of Operations for the years ended December 31, 2011, 2010 and 2009 |
| (iii) | Combined Consolidated Statements of Shareholders’ Equity (Deficit) and Partners’ Capital for the years ended December 31, 2011, 2010 and 2009 |
| (iv) | Combined Consolidated Statements of Cash Flows for the years ended December 31, 2011, 2010 and 2009 |
| (v) | Notes to Combined Consolidated Financial Statements |
| (2) | Financial Statement Schedules |
There are no Financial Statement Schedules filed as part of this Annual Report on 10-K, as the required information is included in our combined consolidated financial statements and in the notes thereto.
| (b) | Exhibit Index: |
| Exhibit No. |
Description | |
| 3.1 | Amended and Restated Certificate of Incorporation of Manning & Napier, Inc. | |
| 3.2 | Amended and Restated Bylaws of Manning & Napier, Inc. | |
| 4.1 | Form of specimen certificate representing Manning & Napier, Inc.’s Class A common stock(1) | |
| 10.1 | Amended and Restated Limited Liability Company Agreement of Manning & Napier Group, LLC | |
| 10.2 | Amended and Restated Limited Liability Company Agreement of M&N Group Holdings, LLC | |
| 10.3 | Exchange Agreement, dated as of November 23, 2011, by and among Manning & Napier, Inc. and the other parties thereto. | |
| 10.4 | Tax Receivable Agreement, dated as of November 23, 2011, by and among Manning & Napier, Inc. and the other parties thereto. | |
| 10.5 | Registration Rights Agreement, dated as of November 23, 2011, by and among Manning & Napier, Inc. and the other parties thereto. | |
| 10.6* | Manning & Napier, Inc. 2011 Equity Compensation Plan | |
| 10.7* | Form of Award Agreement under the Manning & Napier, Inc. 2011 Equity Compensation Plan(2) | |
| 10.8* | Form of Stock Option Agreement under the Manning & Napier, Inc. 2011 Equity Compensation Plan(2) | |
| 10.9 | Amended and Restated Shareholders Agreement of MNA Advisors, Inc. | |
| 10.10 | Amended and Restated Shareholders Agreement of M&N Advisory Advantage Corporation | |
| 10.11 | Amended and Restated Shareholders Agreement of M&N Alternative Opportunities, Inc. | |
63
Table of Contents
| Exhibit No. |
Description | |
| 10.12 | Amended and Restated Operating Agreement of Manning & Napier Capital Company, L.L.C. | |
| 10.13* | Form of Indemnification Agreement(2) | |
| 10.14* | Employment Agreement, dated September 8, 1992, of Patrick Cunningham(2) | |
| 10.15* | Employment Agreement, dated August 1, 1993, of Jeff Coons(2) | |
| 10.16* | Employment Agreement, dated June 28, 1993, of Charles Stamey(2) | |
| 10.17* | Employment Agreement, effective September 12, 2011, by and between Manning & Napier Advisors, Inc. and James Mikolaichik(2) | |
| 10.18 | Purchase Agreement, by and between Manning & Napier, Inc. and Manning & Napier Group, LLC | |
| 10.19 | Purchase Agreement, by and between Manning & Napier, Inc. and M&N Group Holdings, LLC | |
| 10.20* | Letter, dated October 31, 2011, by and between Manning & Napier Group, LLC and James Mikolaichik | |
| 10.21* | Letter, dated October 27, 2011, by and between Manning & Napier Group, LLC and Patrick Cunningham | |
| 21.1 | Subsidiaries of Manning & Napier, Inc.(3) | |
| 31.1 | Certification of the Company’s Chief Executive Officer pursuant to Exchange Act Rules 13a-14(a)/15d-14(a), as adopted pursuant to Section 302 of the Sarbanes-Oxley Act of 2002 | |
| 31.2 | Certification of the Company’s Chief Financial Officer pursuant to Exchange Act Rules 13a-14(a)/15d-14(a), as adopted pursuant to Section 302 of the Sarbanes-Oxley Act of 2002 | |
| 32.1 | Certification of the Company’s Chief Executive Officer pursuant to 18 U.S.C. Section 1350, as adopted pursuant to Section 906 of the Sarbanes-Oxley Act of 2002 | |
| 32.2 | Certification of the Company’s Chief Financial Officer pursuant to 18 U.S.C. Section 1350, as adopted pursuant to Section 906 of the Sarbanes-Oxley Act of 2002 | |
| * | Management contract or compensatory plan or arrangement |
| (1) | Incorporated by reference to Amendment No. 4 of the Registration Statement on Form S-1 (File No. 333-175309) of Manning & Napier, Inc., which was filed with the Securities and Exchange Commission on November 7, 2011. |
| (2) | Incorporated by reference to Amendment No. 2 of the Registration Statement on Form S-1 (File No. 333-175309) of Manning & Napier, Inc., which was filed with the Securities and Exchange Commission on September 23, 2011. |
| (3) | Incorporated by reference to Amendment No. 3 of the Registration Statement on Form S-1 (File No. 333-175309) of Manning & Napier, Inc., which was filed with the Securities and Exchange Commission on October 31, 2011. |
64
Table of Contents
SIGNATURES
Pursuant to the requirements of Section 13 or 15(d) of the Securities Exchange Act of 1934, the Registrant has duly caused this report to be signed on its behalf by the undersigned, thereunto duly authorized, in the City of Fairport, State of New York, on March 27, 2012.
| MANNING & NAPIER, INC. | ||||
| By: |
/s/ Patrick Cunningham | |||
| Name: | Patrick Cunningham | |||
| Title: | Chief Executive Officer (principal executive officer) | |||
Pursuant to the requirements of the Securities Exchange Act of 1934, this report has been signed below by the following persons on behalf of the Registrant and in the capacities and on the dates indicated below.
| Signature | Capacity | Date | ||
| /s/ Patrick Cunningham Patrick Cunningham |
Chief Executive Officer and Director (principal executive officer) |
March 27, 2012 | ||
|
/s/ James Mikolaichik James Mikolaichik |
Chief Financial Officer (principal financial and accounting officer) |
March 27, 2012 | ||
|
/s/ William Manning William Manning |
Chairman of the Board of Directors |
March 27, 2012 | ||
|
/s/ B. Reuben Auspitz B. Reuben Auspitz |
Vice-Chairman of the Board of Directors |
March 27, 2012 | ||
|
/s/ Richard Hurwitz Richard Hurwitz |
Director |
March 27, 2012 | ||
|
/s/ Edward J. Pettinella Edward J. Pettinella |
Director |
March 27, 2012 | ||
|
/s/ Michael Serventi Michael Serventi |
Director |
March 27, 2012 | ||
65
Table of Contents
INDEX TO COMBINED CONSOLIDATED FINANCIAL STATEMENTS
F-1
Table of Contents

Report of Independent Registered Public Accounting Firm
To the Board of Directors and Shareholders of Manning & Napier, Inc.:
In our opinion, the accompanying combined consolidated statements of financial condition and the related combined consolidated statements of operations, combined consolidated statements of shareholders’ equity (deficit) and partners’ capital, and combined consolidated statements of cash flows present fairly, in all material respects, the financial position of Manning & Napier, Inc. and its subsidiaries at December 31, 2011 and 2010, and the results of their operations and their cash flows for each of the three years in the period ended December 31, 2011 in conformity with accounting principles generally accepted in the United States of America. These financial statements are the responsibility of the Company’s management. Our responsibility is to express an opinion on these financial statements based on our audits. We conducted our audits in accordance with the standards of the Public Company Accounting Oversight Board (United States). Those standards require that we plan and perform the audit to obtain reasonable assurance about whether the financial statements are free of material misstatement. An audit includes examining, on a test basis, evidence supporting the amounts and disclosures in the financial statements. An audit also includes assessing the accounting principles used and significant estimates made by management, as well as evaluating the overall financial statement presentation. We believe that our audits provide a reasonable basis for our opinion.
/s/PricewaterhouseCoopers LLP
Rochester, NY
March 27, 2012
F-2
Table of Contents
Manning & Napier, Inc.
Combined Consolidated Statements of Financial Condition
As of December 31, 2011 and 2010
| (in thousands, except share and per share data) | December 31, 2011 |
December 31, 2010 |
||||||
| Assets |
||||||||
| Cash and cash equivalents |
$ | 81,208 | $27,543 | |||||
| Accounts receivable |
18,409 | 18,851 | ||||||
| Accounts receivable—Manning & Napier Funds, Inc. |
12,850 | 11,948 | ||||||
| Investment securities, at fair value |
4,642 | 4,381 | ||||||
| Prepaid expenses and other assets |
4,126 | 2,508 | ||||||
|
|
|
|
|
|||||
| Total current assets |
121,235 | 65,231 | ||||||
| Property and equipment, net |
3,812 | 3,111 | ||||||
| Net deferred tax assets, non-current |
53,786 | — | ||||||
|
|
|
|
|
|||||
| Total non-current assets |
57,598 | 3,111 | ||||||
| Total assets |
$ | 178,833 | $ | 68,342 | ||||
|
|
|
|
|
|||||
| Liabilities |
||||||||
| Accounts payable |
$ | 1,139 | $ | 1,153 | ||||
| Accrued expenses and other liabilities |
30,099 | 30,464 | ||||||
| Deferred revenue |
9,902 | 9,974 | ||||||
| Stock purchase note payable |
— | 201 | ||||||
|
|
|
|
|
|||||
| Total current liabilities |
41,140 | 41,792 | ||||||
| Shares liability subject to mandatory redemption |
— | 170,319 | ||||||
| Amounts payable under tax receivable agreement |
45,885 | — | ||||||
|
|
|
|
|
|||||
| Total non-current liabilities |
45,885 | 170,319 | ||||||
| Total liabilities |
87,025 | 212,111 | ||||||
| Commitments and contingencies (Note 10) |
||||||||
| Shareholders’ equity (deficit) and partners’ capital |
||||||||
| Class A common stock, $0.01 par value; 300,000,000 shares authorized, 13,583,783 issued and outstanding at December 31, 2011 |
$ | 136 | $ | — | ||||
| Class B common stock, $0.01 par value; 2,000 shares authorized, 1,000 shares issued and outstanding at December 31, 2011 |
0 | — | ||||||
| Common stock, $.01 par value; 10,000,000 shares authorized, 2,533,110 shares issued and outstanding and 5,224,050 shares issued and outstanding subject to redemption as of December 31, 2010 |
— | 101 | ||||||
| Additional paid-in capital |
188,133 | 1,628 | ||||||
| Retained deficit |
(27,167 | ) | (147,035 | ) | ||||
| Accumulated other comprehensive income |
2 | 193 | ||||||
| Partners’ capital |
— | 1,307 | ||||||
|
|
|
|
|
|||||
| Total shareholders’ equity (deficit) and partners’ capital attributable to Manning & Napier Group |
161,104 | (143,806 | ) | |||||
| Noncontrolling (deficit) interest |
(69,296 | ) | 37 | |||||
|
|
|
|
|
|||||
| Total shareholders’ equity (deficit), partners’ capital and noncontrolling (deficit) interest |
91,808 | (143,769 | ) | |||||
|
|
|
|
|
|||||
| Total liabilities, shareholders’ equity (deficit), partners’ capital and noncontrolling (deficit) interest |
$ | 178,833 | $ | 68,342 | ||||
|
|
|
|
|
|||||
The accompanying notes are an integral part of these combined consolidated financial statements.
F-3
Table of Contents
Manning & Napier, Inc.
Combined Consolidated Statements of Operations
Years Ended December 31, 2011, 2010 and 2009
| (in thousands, except per share data) | 2011 | 2010 | 2009 | |||||||||
| Revenues |
||||||||||||
| Investment management service revenue |
$ | 329,992 | $ | 255,472 | $ | 162,660 | ||||||
| Expenses |
||||||||||||
| Compensation and related costs |
305,957 | 78,416 | 55,643 | |||||||||
| Sub-transfer agent and shareholder service costs |
49,115 | 36,830 | 19,853 | |||||||||
| Other operating costs |
33,704 | 25,284 | 22,252 | |||||||||
|
|
|
|
|
|
|
|||||||
| Total operating expenses |
388,776 | 140,530 | 97,748 | |||||||||
|
|
|
|
|
|
|
|||||||
| Operating (loss) income |
(58,784 | ) | 114,942 | 64,912 | ||||||||
| Non-operating loss: |
||||||||||||
| Interest expense on shares subject to mandatory redemption |
(45,833 | ) | (61,243 | ) | (9,991 | ) | ||||||
| Interest expense |
(31 | ) | (16 | ) | (125 | ) | ||||||
| Interest and dividend income |
67 | 126 | 140 | |||||||||
| Net capital gains (losses) on investments |
147 | 1 | (151 | ) | ||||||||
|
|
|
|
|
|
|
|||||||
| Total non-operating loss |
(45,650 | ) | (61,132 | ) | (10,127 | ) | ||||||
|
|
|
|
|
|
|
|||||||
| (Loss) income before provision for income taxes |
(104,434 | ) | 53,810 | 54,785 | ||||||||
| Provision for income taxes |
1,982 | 712 | 360 | |||||||||
|
|
|
|
|
|
|
|||||||
| Net (loss) income attributable to controlling and noncontrolling interests |
(106,416 | ) | 53,098 | 54,425 | ||||||||
| Less: net (loss) income attributable to noncontrolling interests |
(79,249 | ) | 53,098 | 54,425 | ||||||||
|
|
|
|
|
|
|
|||||||
| Net loss attributable to Manning & Napier, Inc. |
$ | (27,167 | ) | $ | — | $ | — | |||||
|
|
|
|
|
|
|
|||||||
| November 18, 2011 through December 31, 2011 |
||||||||||||
| (in thousands) | ||||||||||||
| Net loss attributable to controlling and noncontrolling interests |
$ | (197,874 | ) | |||||||||
| Less: net loss attributable to noncontrolling interests |
(170,707 | ) | ||||||||||
|
|
|
|||||||||||
| Net loss attributable to Manning & Napier, Inc. |
$ | (27,167 | ) | |||||||||
|
|
|
|||||||||||
| Net loss available to Class A common stock per basic and diluted share |
$ | (2.11 | ) | |||||||||
|
|
|
|||||||||||
| Weighted average basic and diluted shares of Class A common stock outstanding |
12,894,136 | |||||||||||
|
|
|
|||||||||||
The accompanying notes are an integral part of these combined consolidated financial statements.
F-4
Table of Contents
Manning & Napier, Inc.
Combined Consolidated Statements of Shareholders’ Equity (Deficit) and Partners’ Capital
Years Ended December 31, 2011, 2010 and 2009
| Common Stock | Additional Paid-In |
Treasury Stock | Retained | Accumulated Comprehensive |
Partners’ Capital |
Non controlling |
||||||||||||||||||||||||||||||||||
| (in thousands, except share data) |
Shares | Amount | Capital | Shares | Amount | Deficit | Income (Loss) | (Deficit) | Interest | Total | ||||||||||||||||||||||||||||||
| Balance—January 1, 2009 |
2,454,428 | $ | 98 | $ | 1,622 | 20,440 | $ | (274 | ) | $ | (81,008 | ) | $ | (891 | ) | $ | 773 | — | $ | (79,680 | ) | |||||||||||||||||||
| Net income |
58,819 | (4,394 | ) | 54,425 | ||||||||||||||||||||||||||||||||||||
| S-Corporation distributions |
(64,019 | ) | (64,019 | ) | ||||||||||||||||||||||||||||||||||||
| Net changes in unrealized investment securities gains or losses |
781 | 781 | ||||||||||||||||||||||||||||||||||||||
| Common stock and treasury stock Transactions |
37,260 | 2 | 4 | (27,850 | ) | 16 | 22 | |||||||||||||||||||||||||||||||||
| Equity-based compensation |
411 | 320 | 731 | |||||||||||||||||||||||||||||||||||||
| Partners’ contributions |
4,649 | 4,649 | ||||||||||||||||||||||||||||||||||||||
| Treasury stock purchase |
16,673 | (255 | ) | (255 | ) | |||||||||||||||||||||||||||||||||||
|
|
|
|
|
|
|
|
|
|
|
|
|
|
|
|
|
|
|
|
|
|||||||||||||||||||||
| Balance—December 31, 2009 |
2,491,688 | $ | 100 | $ | 1,626 | 9,263 | $ | (102 | ) | $ | (85,888 | ) | $ | (110 | ) | $ | 1,028 | — | $ | (83,346 | ) | |||||||||||||||||||
| Net income |
57,957 | (4,859 | ) | 53,098 | ||||||||||||||||||||||||||||||||||||
| S-Corporation distributions |
(119,619 | ) | (119,619 | ) | ||||||||||||||||||||||||||||||||||||
| Net changes in unrealized investment securities gains or losses |
303 | 303 | ||||||||||||||||||||||||||||||||||||||
| Common stock and treasury stock Transactions |
41,422 | 1 | 2 | (9,263 | ) | 5 | (70 | ) | (3 | ) | (65 | ) | ||||||||||||||||||||||||||||
| Equity-based compensation |
97 | 585 | 682 | |||||||||||||||||||||||||||||||||||||
| Partners’ contributions |
5,141 | 5,141 | ||||||||||||||||||||||||||||||||||||||
|
|
|
|
|
|
|
|
|
|
|
|
|
|
|
|
|
|
|
|
|
|||||||||||||||||||||
| Balance—December 31, 2010 |
2,533,110 | $ | 101 | $ | 1,628 | — | — | $ | (147,035 | ) | $ | 193 | $ | 1,307 | — | $ | (143,806 | ) | ||||||||||||||||||||||
| Net income |
75,169 | 16,289 | 91,458 | |||||||||||||||||||||||||||||||||||||
| Distributions |
(148,628 | ) | (148,628 | ) | ||||||||||||||||||||||||||||||||||||
| Net changes in unrealized investment securities gains or losses |
(305 | ) | (305 | ) | ||||||||||||||||||||||||||||||||||||
| Common stock transactions |
32,212 | 1 | 52 | 1 | 54 | |||||||||||||||||||||||||||||||||||
| Equity-based compensation |
929 | 929 | ||||||||||||||||||||||||||||||||||||||
| Partners’ contributions |
4,007 | 4,007 | ||||||||||||||||||||||||||||||||||||||
| Conditional redemption |
(348 | ) | (348 | ) | ||||||||||||||||||||||||||||||||||||
| Elimination of shares subject to redemption |
5,224,050 | 52 | 5,291 | 211,154 | 91 | 216,588 | ||||||||||||||||||||||||||||||||||
| Reorganization and attribution of historical equity to partners’ capital |
(7,789,372 | ) | (154 | ) | (7,900 | ) | 9,687 | (1,633 | ) | — | ||||||||||||||||||||||||||||||
|
|
|
|
|
|
|
|
|
|
|
|
|
|
|
|
|
|
|
|
|
|||||||||||||||||||||
| Balance—November 18, 2011 |
— | — | — | — | — | — | (112 | ) | 20,061 | — | 19,949 | |||||||||||||||||||||||||||||
| Issuance of Class A shares, net of offering costs (Note 3) |
13,583,783 | 136 | 159,763 | 159,899 | ||||||||||||||||||||||||||||||||||||
| Issuance of Class B shares |
1,000 | 0 | 0 | 0 | ||||||||||||||||||||||||||||||||||||
| Attribution of partners’ capital to noncontrolling interest |
(20,061 | ) | 20,061 | — | ||||||||||||||||||||||||||||||||||||
| Purchase of Class A units of Manning & Napier Group, LLC held by Manning & Napier Group Holdings, LLC |
(105,663 | ) | (105,663 | ) | ||||||||||||||||||||||||||||||||||||
| Equity-based compensation |
28,311 | 187,013 | 215,324 | |||||||||||||||||||||||||||||||||||||
| Net changes in unrealized investment securities gains or losses |
114 | 114 | ||||||||||||||||||||||||||||||||||||||
| Initial establishment of deferred tax balances |
59 | 59 | ||||||||||||||||||||||||||||||||||||||
| Net loss |
(27,167 | ) | (170,707 | ) | (197,874 | ) | ||||||||||||||||||||||||||||||||||
|
|
|
|
|
|
|
|
|
|
|
|
|
|
|
|
|
|
|
|
|
|||||||||||||||||||||
| Balance—December 31, 2011 |
13,584,783 | $ | 136 | $ | 188,133 | — | $ | — | $ | (27,167 | ) | $ | 2 | $ | — | $ | (69.296 | ) | $ | 91,808 | ||||||||||||||||||||
|
|
|
|
|
|
|
|
|
|
|
|
|
|
|
|
|
|
|
|
|
|||||||||||||||||||||
The accompanying notes are an integral part of these combined consolidated financial statements.
F-5
Table of Contents
Manning & Napier, Inc.
Combined Consolidated Statements of Cash Flows
Years Ended December 31, 2011, 2010 and 2009
| (in thousands) | 2011 | 2010 | 2009 | |||||||||
| Cash flows from operating activities: |
||||||||||||
| Net (loss) income |
$ | (106,416 | ) | $ | 53,098 | $ | 54,425 | |||||
| Adjustment to reconcile net (loss) income to net cash provided by operating activities: |
||||||||||||
| Interest expense related to change in mandatory redemption liability |
45,833 | 61,243 | 9,991 | |||||||||
| Equity-based compensation |
216,253 | 682 | 731 | |||||||||
| Depreciation |
1,139 | 1,422 | 1,099 | |||||||||
| Net (gain) loss on investment securities |
(147 | ) | (1 | ) | 151 | |||||||
| Deferred income taxes |
20 | — | — | |||||||||
| Accrued interest on debt securities |
— | — | (1 | ) | ||||||||
| (Increase) decrease in operating assets and increase (decrease) in operating liabilities: |
||||||||||||
| Accounts receivable |
442 | (6,454 | ) | (4,786 | ) | |||||||
| Accounts receivable—Manning & Napier Fund, Inc. |
(902 | ) | (2,971 | ) | (5,125 | ) | ||||||
| Prepaid expenses and other assets |
(833 | ) | (1,070 | ) | (70 | ) | ||||||
| Accounts payable |
(694 | ) | 252 | (333 | ) | |||||||
| Accrued expenses and other liabilities |
(761 | ) | 13,025 | 5,642 | ||||||||
| Deferred revenue |
(72 | ) | 746 | 1,055 | ||||||||
|
|
|
|
|
|
|
|||||||
| Net cash provided by operating activities |
153,862 | 119,972 | 62,779 | |||||||||
|
|
|
|
|
|
|
|||||||
| Cash flows from investing activities: |
||||||||||||
| Purchase of property and equipment |
(1,720 | ) | (1,137 | ) | (1,003 | ) | ||||||
| Cash payments for options |
— | — | (222 | ) | ||||||||
| Cash received from option exercises |
— | 48 | 305 | |||||||||
| Sale of investments |
1,987 | 120 | 576 | |||||||||
| Purchase of investments |
(2,295 | ) | (2,025 | ) | (631 | ) | ||||||
| Proceeds from maturity of investments |
— | 505 | — | |||||||||
|
|
|
|
|
|
|
|||||||
| Net cash used in investing activities |
(2,028 | ) | (2,489 | ) | (975 | ) | ||||||
|
|
|
|
|
|
|
|||||||
| Cash flows from financing activities: |
||||||||||||
| Distributions |
(148,628 | ) | (119,619 | ) | (64,019 | ) | ||||||
| Payment of stock purchase note payable |
(201 | ) | (120 | ) | (583 | ) | ||||||
| Payment of capital lease obligations |
(81 | ) | (146 | ) | (124 | ) | ||||||
| Issuance of promissory note receivable |
— | — | (8,000 | ) | ||||||||
| Proceeds from repayment of promissory note receivable |
— | — | 8,000 | |||||||||
| Proceeds on issuance of stock |
54 | 2 | 21 | |||||||||
| Repurchase of treasury stock |
— | — | (255 | ) | ||||||||
| Capital contributions |
4,007 | 5,141 | 4,649 | |||||||||
| Net proceeds from issuance of Class A common stock in initial public offering |
154,449 | — | — | |||||||||
| Payments of costs directly associated with issuance of Class A common stock |
(2,106 | ) | — | — | ||||||||
| Purchase of Class A Units of Manning & Napier Group, LLC |
(105,663 | ) | — | — | ||||||||
|
|
|
|
|
|
|
|||||||
| Net cash used in financing activities |
(98,169 | ) | (114,742 | ) | (60,311 | ) | ||||||
|
|
|
|
|
|
|
|||||||
| Net increase in cash and cash equivalents |
53,665 | 2,741 | 1,493 | |||||||||
| Cash and cash equivalents: |
||||||||||||
| Beginning of period |
27,543 | 24,802 | 23,309 | |||||||||
|
|
|
|
|
|
|
|||||||
| End of period |
$ | 81,208 | $ | 27,543 | $ | 24,802 | ||||||
|
|
|
|
|
|
|
|||||||
| Supplemental disclosures: |
||||||||||||
| Cash paid during the period for interest |
$ | 4 | $ | 16 | $ | 115 | ||||||
|
|
|
|
|
|
|
|||||||
| Cash paid during the period for taxes |
$ | 1,101 | $ | 661 | $ | 421 | ||||||
|
|
|
|
|
|
|
|||||||
| Non-cash transactions: |
||||||||||||
| Accrued costs directly associated with issuance of Class A common stock |
$ | 598 | $ | — | $ | — | ||||||
|
|
|
|
|
|
|
|||||||
| Capital expenditures in accounts payable and accruals |
$ | 125 | $ | 240 | $ | 115 | ||||||
|
|
|
|
|
|
|
|||||||
| Equipment acquired through capital lease obligation |
$ | 120 | $ | 123 | $ | 135 | ||||||
|
|
|
|
|
|
|
|||||||
The accompanying notes are an integral part of these combined consolidated financial statements.
F-6
Table of Contents
NOTES TO COMBINED CONSOLIDATED FINANCIAL STATEMENTS
AS OF DECEMBER 31, 2011 AND 2010 AND FOR THE YEARS ENDED DECEMBER 31, 2011, 2010 AND 2009
(Dollars in thousands except per unit or per share amounts)
Note 1—Organization and Nature of the Business
Manning & Napier, Inc. (“Manning & Napier”, the “Company” or the “Registrant”) provides a broad range of investment solutions through separately managed accounts, mutual funds, and collective investment trust funds, as well as a variety of consultative services that complement its investment process. Founded in 1970, the Company offers equity and fixed income portfolios as well as a range of blended asset portfolios, such as life cycle funds, that use a mix of stocks and bonds. Headquartered in Fairport, New York, the Company serves a diversified client base of high-net-worth individuals and institutions, including 401(k) plans, pension plans, Taft-Hartley plans, endowments and foundations. For many of these clients, the Company’s relationship goes beyond investment management and includes customized solutions that address key issues and solve client-specific problems.
The Company was incorporated on June 22, 2011 for the purpose of facilitating an initial public offering of 13,583,873 of its Class A shares (“IPO” or “the Offering”) and to become the sole managing member of Manning & Napier Group, LLC and its subsidiaries (“Manning & Napier Group”), a holding company for the investment management businesses conducted by its operating subsidiaries. Prior to the reorganization transactions and the Offering (Note 3), the Company was a group of privately-held, affiliated companies “Manning & Napier Companies” which collectively consisted of (i) MNA Advisors, Inc. (f/k/a Manning & Napier Advisors, Inc.), or MNA, (ii) M&N Advisory Advantage Corporation (f/k/a Manning & Napier Advisory Advantage Corporation), or AAC, (iii) M&N Alternative Opportunities, Inc. (f/k/a Manning & Napier Alternative Opportunities, Inc.), or MNAO, (iv) Manning & Napier Capital Company, LLC, or MNCC, (v) Manning & Napier Investor Services, Inc., or MNBD, (vi) Manning & Napier Information Services, LLC, or MNIS, (vii) EXA Advisors, Inc. (f/k/a Exeter Advisors, Inc.), or EAI, and (viii) Perspective Partners LLC, or PPI, each as in effect prior to the Offering.
Manning & Napier has sole voting power in and controls all of the business and affairs of Manning & Napier Group and its subsidiaries. As a result, the Company consolidates the financial results of Manning & Napier Group and records noncontrolling interest for the economic interest in Manning & Napier Group held by Manning & Napier Group Holdings, LLC (“M&N Group Holdings”), MNCC and the other members of Manning & Napier Group. The Company’s economic interest in Manning & Napier Group totaled approximately 13.8% at December 31, 2011. Net income attributable to noncontrolling interest on the statements of operations represents the portion of earnings or loss attributable to the economic interest in Manning & Napier Group held by the noncontrolling members. Noncontrolling interest on the statement of financial condition represents the portion of net assets of Manning & Napier Group held by the noncontrolling members.
Note 2—Summary of Significant Accounting Policies
Basis of Presentation
The accompanying combined consolidated financial statements were prepared in accordance with accounting principles generally accepted in the United States of America (“U.S. GAAP”) and related rules and regulations of the SEC. All material intercompany transactions have been eliminated in consolidation.
Use of Estimates
The preparation of financial statements in conformity with accounting principles generally accepted in the United States of America requires management to make estimates and judgments which affect the reported
F-7
Table of Contents
amounts of assets, liabilities, related disclosure of contingent assets and liabilities at the date of the financial statements, and the reported amount of revenues and expenses during the reporting period. Estimates are used in accounting for, among other things, allowances for doubtful accounts, valuing investment securities, contingencies and other accruals. Estimates are based on historical experience and on various other assumptions which are believed to be reasonable under the circumstances. Due to the inherent uncertainty involved in making estimates, actual results reported in future periods may differ from those estimates. Estimates and assumptions are reviewed periodically, and the effect of revisions is reflected in the combined consolidated financial statements in the period they are determined to be necessary.
Principles of Consolidation
On November 18, 2011, the Company completed its initial public offering. Prior to the Offering, the Company completed a reorganization of entities under common control of William Manning (the “Reorganization”). Manning & Napier is the sole managing member of Manning & Napier Group. Following the Reorganization and Offering, Manning & Napier has held approximately 13.8% economic interest in Manning & Napier Group, but as managing member will control the management of Manning & Napier Group. As a result, the Company consolidates the financial results of Manning & Napier Group and records a noncontrolling interest on its balance sheet with respect to the remaining economic interest in Manning & Napier Group held by M&N Group Holdings, MNCC and the other members of Manning & Napier Group. See Note 3 for additional information regarding the Reorganization and the Offering and their effects on the consolidated financial statements and capital structure of the Company.
For periods prior to the Reorganization, the financial statements include the combined accounts of operating entities under common control, which consisted of MNA, AAC, MNCC, ETC, MNAO, MNBD, MNIS and PPI. As further discussed in Note 3, all of the entities included in the combined financial statements in periods at the time of the Reorganization are included in the combined consolidated financial statements subsequent to the Reorganization.
Operating Segments
The Company operates in one segment, the investment management industry. The Company primarily provides investment management services to separately managed accounts, mutual funds and collective investment trust funds. Management assesses the financial performance of these vehicles on a combined basis.
Cash and Cash Equivalents
The Company defines cash and cash equivalents as money market funds and other highly liquid investments with original maturities of 90 days or less. Cash and cash equivalents are stated at cost, which approximates fair value. Cash and cash equivalents are subject to credit risk and are primarily maintained in a U.S. Treasury money market fund.
Investment Securities
Investment securities are classified as either trading or available-for-sale and are carried at fair value. Fair value is determined based on quoted market prices in active markets for identical or similar instruments.
Investment securities classified as trading consist of short-term securities, equity securities, and investments in mutual funds for which the Company provides advisory services. Realized and unrealized gains and losses on trading securities are recorded in net capital gains (losses) on investments in the combined consolidated statements of operations. Realized gains and losses on sales of trading securities are computed on a specific identification basis. At December 31, 2011, trading securities consist solely of investments held by the Company for the purpose of providing initial cash seeding for product development purposes. Prior to December 31, 2011, the Company classified these investments as available-for-sale. The reclassification of these investments from available-for-sale to trading on December 31, 2011 resulted in the recording of less than $0.1 million of unrealized gains in net capital gains (losses) on investments in the combined consolidated statements of operations.
F-8
Table of Contents
Investment securities classified as available-for-sale consist of U.S. Treasury Notes. Unrealized gains and losses on available-for-sale securities are excluded from earnings and are reported, net of deferred income tax, as a separate component of accumulated other comprehensive income in stockholders’ equity until realized. The Company periodically reviews each individual security position that has an unrealized loss, or impairment, to determine if that impairment is other-than-temporary. If impairment is determined to be other-than-temporary, the carrying value of the security will be written down to fair value and the loss will be recognized in earnings. Realized gains and losses on sales of available-for-sale securities are computed on a specific identification basis and are recorded in net capital gains (losses) on investments in the combined consolidated statements of operations.
Accounts Receivable
Accounts receivable includes investment management and custodial fees receivable from clients. The Company’s accounts receivable balances do not include any significant allowance for doubtful accounts nor has any significant bad debt expense attributable to accounts receivable been recorded for the years ended December 31, 2011, 2010 or 2009.
Property and Equipment
Property and equipment are carried at cost less accumulated depreciation. Depreciation is computed on a straight-line basis over the applicable life of the asset class. Depreciation is calculated for computer software, office equipment, and furniture and fixtures using useful lives of 3, 5, and 7 years, respectively. Depreciation is calculated for leasehold improvements using a useful life equivalent to the lease term. Upon sale or other disposition of fixed assets, the resulting gain or loss is included in the statement of operations.
Leases
Rent under non-cancelable operating leases with scheduled rent increases is accounted for on a straight-line basis over the lease term, beginning on the date of initial possession or the effective date of the lease agreement. Allowances and other lease incentives provided by the Company’s landlords are amortized on a straight-line basis as a reduction of rent expense. The difference between straight-line rent expense and rent paid and the unamortized deferred lease costs and build-out allowances are recorded as deferred rent liability in the combined consolidated statements of financial condition.
Shares Subject to Redemption
The Company entered into an agreement with William Manning, pursuant to which the Company had a mandatory redemption obligation upon his death to pay his pro rata share of net revenue for the four quarters immediately preceding Mr. Manning’s death. In accordance with the requirements of accounting for certain financial instruments with characteristics of both liabilities and equity, the Company recognized a liability for these shares subject to mandatory redemption in its financial statements.
For one of the Company’s entities, MNBD, the Company’s redemption obligation upon his death to pay his pro rata share of net revenue had an element of conditionality. In accordance with the requirements of accounting for contracts in the Company’s own equity, the Company had recognized the shares subject to conditional redemption related to MNBD as temporary equity.
As further described in Note 9, the shares subject to redemption terminated during the period and as a result, the instruments were reclassified to permanent equity. The liability and temporary equity for all periods prior to the termination had been measured at the redemption amount.
Revenue Recognition
The majority of the Company’s revenues are based on fees charged to manage customers’ portfolios. Investment management fees are generally computed as a percentage of AUM and recognized as earned. Fees for providing investment advisory services are computed and billed in accordance with the provisions of the
F-9
Table of Contents
applicable investment management agreements. For the Company’s separately managed accounts, clients either pay investment management fees in advance, typically for a semi-annual or quarterly period, or in arrears, typically for a monthly or quarterly period. When investment management fees are paid in advance, the Company defers the revenue and recognizes it over the applicable period. When investment management fees are paid in arrears, the Company estimates revenues based on AUM market values as of the most recent month end date, and adjusts to actual when billed. Revenue is also earned for providing custodial services, sub-advisor services to mutual funds and collective investment trusts and other services. For mutual funds and collective investment trust vehicles, the Company‘s fees are calculated and earned daily based on AUM.
All other revenue earned by us is recognized on a GAAP accounting basis as earned per the terms of the specific contract.
Equity-Based Compensation
The Company measures the cost of employee services received in exchange for an award of equity instruments based on the grant-date fair value of the award. The cost is recognized over the period during which an employee is required to provide service in exchange for the award. The guidance also requires that the Company estimate forfeitures when recognizing equity-based compensation expense and that this estimate of forfeitures be adjusted over the requisite service period based on the extent to which actual forfeitures differ, or are expected to differ, from such estimates. See Note 13 for additional information on equity-based compensation.
Income Taxes
The Company records a tax provision for the anticipated tax consequences of the reported results of operations. The provision for income taxes is computed using the asset and liability method, under which deferred tax assets and liabilities are recognized for the expected future tax consequences of temporary differences between the financial reporting and tax basis of assets and liabilities, and for operating losses and tax credit carryforwards. Deferred tax assets and liabilities are measured using the currently enacted tax rates that apply to taxable income in effect for the years in which those tax assets are expected to be realized or settled. The Company records a valuation allowance to reduce deferred tax assets to the amount that is believed more likely than not to be realized.
The Company recognizes tax benefits from uncertain tax positions only if it is more likely than not that the tax position will be sustained upon examination by the taxing authorities, based on the technical merits of the position. The tax benefits recognized in the financial statements from such positions are then measured based on the largest benefit that has a greater than 50% likelihood of being realized upon ultimate settlement.
Comprehensive (Loss) Income
Comprehensive income includes net (loss) income and other comprehensive (loss) income. Other comprehensive (loss) income consists of the change in unrealized (losses) gains on available-for-sale investments. The changes in the balances of components comprising other comprehensive (loss) income are presented in the following table:
| December, 31 | ||||||||||||
| (dollars in thousands) | ||||||||||||
| 2011 | 2010 | 2009 | ||||||||||
| Net (loss) income |
$ | (106,416 | ) | $ | 53,098 | $ | 54,425 | |||||
| Net unrealized holding (loss) gain on investment securities arising during the year |
(338 | ) | 302 | 932 | ||||||||
| Reclassification adjustment for realized gains (losses) on investment securities included in net income |
147 | 1 | (151 | ) | ||||||||
|
|
|
|
|
|
|
|||||||
| Comprehensive (loss) income |
$ | (106,607 | ) | $ | 53,401 | $ | 55,206 | |||||
|
|
|
|
|
|
|
|||||||
F-10
Table of Contents
Loss Contingencies
The Company accrues for estimated costs, including legal costs related to existing lawsuits, claims and proceedings when it is probable that a liability has been incurred and the costs can be reasonably estimated. Potential loss contingencies and related accruals are reviewed at least quarterly and are adjusted to reflect the impact and status of settlements, rulings, advice of counsel and other information pertinent to a particular matter. Significant differences could exist between the actual cost required to investigate, litigate and/or settle a claim or the ultimate outcome of a suit and management’s estimate. These differences could have a material impact on the Company’s combined consolidated financial statements. No loss accruals were recorded as of December 31, 2011, 2010 and 2009.
Loss per Common Share
Basic loss per share (“basic EPS”) is computed by dividing net income by the weighted average number of shares outstanding for the reporting period. Diluted earnings per share (“diluted EPS”) gives effect during the reporting period to all dilutive potential shares outstanding resulting from employee share-based awards. The following table sets forth the calculation of basic and diluted earnings per share for the period from November 18, 2011 through December 31, 2011:
| November 18, 2011 through December 31, 2011 |
||||
| (dollars in thousands) | ||||
| Net loss attributable to controlling and noncontrolling interests |
$ | (197,874 | ) | |
| Less: net loss attributable to noncontrolling interests |
(170,707 | ) | ||
|
|
|
|||
| Net loss attributable to Manning & Napier, Inc |
$ | (27,167 | ) | |
|
|
|
|||
| Net loss available to Class A common stock per basic and diluted share |
$ | (2.11 | ) | |
|
|
|
|||
| Weighted average basic and diluted shares of Class A common stock outstanding |
12,894,136 | |||
|
|
|
|||
The Company consummated its initial public offering on November 18, 2011 (Note 3). Since that date, the Company has consolidated the results of Manning & Napier Group due to the Company’s role as its managing member. Therefore, all income for the period prior to November 18, 2011 is entirely attributable to noncontrolling interest (Note 4) which existed prior to the initial public offering. As a result, only the net income attributable to the Company’s controlling interest from the period subsequent to the initial public offering is considered.
The Company’s Class B common stock represent voting interests and do not participate in the earnings of the Company. Accordingly, there is no EPS related to the Company’s Class B common stock. Additionally, the computation of weighted average basic and diluted shares of Class A common stock outstanding considers the outstanding shares from the date of the initial public offering, November 18, 2011, through December 31, 2011.
At December 31, 2011 there were outstanding 76,400,000 Class A Units of Manning & Napier Group which, subject to certain restrictions, will be exchangeable for up to 76,400,000 shares of the Company’s Class A common stock, subject to customary adjustments (Note 12). Such units were not included in the calculation of diluted loss per common share because the effect would have been anti-dilutive.
Recent Accounting Pronouncements
In June 2011, the Financial Accounting Standards Board (“FASB”) issued Accounting Standards Update (“ASU”) 2011-05, Comprehensive Income (Topic 220): Presentation of Comprehensive Income. This standard
F-11
Table of Contents
eliminates the current option to report other comprehensive income and its components in the statement of changes in equity. In December 2011, the FASB issued an amendment to this standard which defers the requirement to present components of reclassifications of other comprehensive income on the face of the income statement. These amendments are effective for annual periods beginning after December 15, 2011. The Company does not expect the amendments to have a material impact on its combined consolidated financial statements and related disclosures.
In May 2011, FASB issued ASU 2011-04, Fair Value Measurement (Topic 820): Amendments to Achieve Common Fair Value Measurement and Disclosure Requirements in U.S. GAAP and International Financial Reporting Standards. The amendments in this update change the wording used to describe the requirements in U.S. GAAP for measuring fair value and for disclosing information about fair value measurements. These amendments are effective for annual periods beginning after December 15, 2011. The Company does not expect the amendments to have a material impact on its combined consolidated financial statements and related disclosures.
In February 2010, the FASB issued ASU 2010-10, Consolidation (Topic 810): Amendments for Certain Investment Funds. The amendments to the consolidation requirements of Topic 810 are deferred for a reporting entity’s interest in an entity (1) that has all the attributes of an investment company or (2) for which it is industry practice to apply measurement principles for financial reporting purposes that are consistent with those followed by investment companies. ASU 2010-10 became effective for the Company on January 1, 2010 and there was no impact on the Company’s combined consolidated financial statements and related disclosures.
In January 2010, the FASB issued ASU 2010-06, Fair Value Measurements and Disclosures (Topic 820): Improving Disclosures about Fair Value Measurements, which requires entities to make new disclosures about recurring or nonrecurring fair-value measurements and provides clarification of existing disclosure requirements. This amendment requires separate disclosures about purchases, sales, issuances, and settlements relating to Level 3 measurements. This amendment is effective for fiscal years beginning after December 15, 2010. The adoption did not have a material impact on the Company’s combined consolidated financial statements and related disclosures.
Note 3—Reorganization and Offering
Reorganization
Prior to the Offering, the Company entered into a series of transactions to reorganize its capital structure, as described and depicted below.
Step One: Each of MNA, AAC and MNAO contributed all of its assets and liabilities to a corresponding newly formed limited liability company subsidiary in exchange for 100% of the equity interests of such new subsidiary.
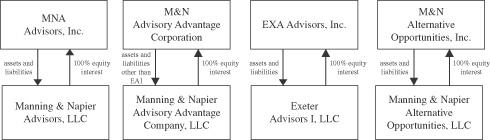
Step Two: EAI distributed 100% of its new subsidiary’s equity interests to AAC, its parent. Each of MNA, AAC and MNAO then contributed 100% of its new subsidiary’s equity interests and, in the case of AAC, 100% of the equity interests distributed from EAI, to M&N Group Holdings, in exchange for Class A units of M&N Group Holdings representing approximately 99.93% of the outstanding membership interests in M&N Group Holdings. In addition, William Manning was granted Class B units of M&N Group Holdings. The Class B units of M&N Group Holdings vested upon consummation of the Offering.
F-12
Table of Contents
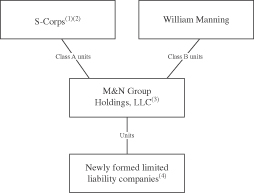
| (1) | Represents MNA, AAC and MNAO. EAI is a wholly-owned subsidiary of M&N Advisory Advantage Corporation. |
| (2) | Each S-Corp is majority owned by William Manning, with a minority interest held by 47 of the Company’s employees. |
| (3) | In connection with the reorganization transactions, in addition to the Class B units granted to William Manning, M&N Group Holdings granted Class B units to Richard Goldberg for strategic consulting services Mr. Goldberg has and will perform for the Manning & Napier Companies, representing less than 0.1% of the outstanding membership interests in M&N Group Holdings. |
| (4) | Represents Manning & Napier Advisors, LLC, Manning & Napier Advisory Advantage Company, LLC, Exeter Advisors I, LLC and Manning & Napier Alternative Opportunities, LLC. |
Step Three: Immediately following such contributions, (i) M&N Group Holdings contributed 100% of its equity interests in each of Manning & Napier Advisors, LLC, Manning & Napier Advisory Advantage Company, LLC, Exeter Advisors I, LLC and Manning & Napier Alternative Opportunities, LLC to Manning & Napier Group in exchange for Class A units of Manning & Napier Group representing approximately 99.2% of the outstanding membership interests of Manning & Napier Group, (ii) MNCC contributed all of its assets and liabilities, including 100% of its equity interests in Exeter Trust Company, to Manning & Napier Group in exchange for Class A units of Manning & Napier Group representing approximately 0.8% of the outstanding membership interests of Manning & Napier Group, and (iii) Manning & Napier, Inc. contributed cash to Manning & Napier Group in exchange for Class A units of Manning & Napier Group representing less than 0.1% of the outstanding membership interests of Manning & Napier Group.
F-13
Table of Contents
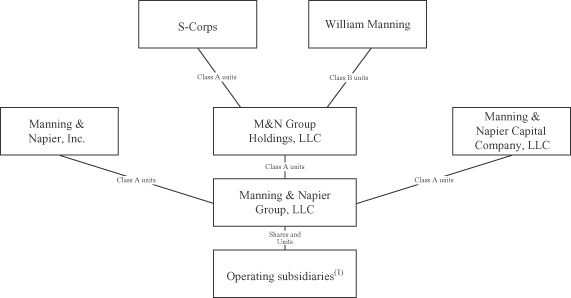
| (1) | Represents Manning & Napier Advisors, LLC, Manning & Napier Advisory Advantage Company, LLC, Exeter Advisors I, LLC, Manning & Napier Alternative Opportunities, LLC and Exeter Trust Company (“ETC”). |
Following the reorganization transactions and prior to the Offering, (i) the shareholders of MNBD contributed 100% of the outstanding common stock of MNBD to MNCC, and immediately following such contribution, MNCC contributed 100% of its equity interests in MNBD to Manning & Napier Group in exchange for Class A units of Manning & Napier Group and (ii) Manning & Napier Associates contributed 100% of its equity interests in MNIS and PPI to M&N Group Holdings in exchange for Class A units of M&N Group Holdings, and immediately following such contribution M&N Group Holdings contributed 100% of its equity interests in MNIS and PPI to Manning & Napier Group in exchange for Class A units of Manning & Napier Group.
Manning & Napier Group, LLC
As a result of the Reorganization, the Company conducts all of its business activities through its principal operating subsidiary, Manning & Napier Group. Net profits and net losses and distributions of profits of Manning & Napier Group generally will be allocated and made to its members pro rata in accordance with the number of units of Manning & Napier Group they hold.
Manning & Napier, Inc.
The Registrant serves as managing member of Manning & Napier Group. As managing member, the Company operates and controls all of the business and affairs of Manning & Napier Group and its subsidiaries and, as a result of this control, consolidates the financial results of Manning & Napier Group with its own financial results. The capital structure of the Company is made-up of the following:
| • | Class A common stock—Class A common stock represents all of the economic interests in the Registrant and entitles holders to one vote per share on matters submitted to shareholders for approval. |
| • | Class B common stock—Prior to the Offering, the Company issued 1,000 shares of its Class B common stock to William Manning. The holder of the Company’s Class B common stock controls a majority of the vote on all matters submitted to shareholders for approval, but William Manning does not have any economic rights in the Company by virtue of his ownership of Class B common stock, whether rights to dividends, distributions or otherwise upon liquidation. |
F-14
Table of Contents
As the Registrant and the Manning & Napier Companies were under the common control of William Manning at the time of the Reorganization, the transfer of control to the Registrant was accounted for as a transaction among entities under common control, which resulted in the following impacts to the consolidated and combined financial statements:
| • | Statement of Financial Condition—The assets, liabilities and equity of the Manning & Napier Companies and of the Registrant have been combined and carried forward at their historical carrying values. An attribution of historical common stock, additional paid-in capital and retained earnings (deficit) was to partners’ equity (deficit). |
| • | Statements of Operations—The statements of operation include the historical combined consolidated statements of operations of the Manning & Napier Companies consolidated with the statement of operation of the Registrant. |
| • | Statements of Shareholders’ Equity (Deficit) and Partners’ Capital—Prior to the Reorganization and Offering, the Company was a group of affiliated companies comprising S-Corps and Limited Liabilities Companies. As a result of the Reorganization, the partners retained their interests in the Manning & Napier Companies directly through Manning & Napier Group units and this historical equity is reflected as partners’ equity prior to the Offering. As a result of the Offering, these interests are included within noncontrolling interests. |
| • | Statements of Cash Flows—The statements of cash flows include the historical combined statements of cash flows of the Manning & Napier Companies combined with the statement of cash flows of the Registrant |
Offering
On November 18, 2011, the Company completed the Offering. The following table summarizes the net proceeds from the Offering.
| Per Share | Total | |||||||
| (dollars in thousands except per share amount) |
||||||||
| Gross Proceeds |
$ | 12.00 | $ | 163,007 | ||||
| Underwriting discount |
.63 | 8,558 | ||||||
|
|
|
|
|
|||||
| Net Proceeds, before expenses, to Manning & Napier, Inc. |
$ | 11.37 | $ | 154,449 | ||||
|
|
|
|
|
|||||
The Company used approximately $41.2 million of the net proceeds from the IPO to purchase Class A units of Manning & Napier Group from Manning & Napier Group, which in turn will use such net proceeds for general corporate purposes and strategic growth opportunities, including potential acquisitions and product seeding, approximately $105.7 million of the net proceeds from the IPO to purchase Class A units of Manning & Napier Group held by M&N Group Holdings, which in turn distributed such proceeds to its members, and approximately $2.7 million for expenses relating to the IPO, not including the underwriting discount. Additionally, the purchase of Class A units of Manning & Napier Group held by M&N Group Holdings gave rise to a deferred tax asset and a corresponding liability under a tax receivable agreement entered into by the Company, M&N Group Holdings, MNCC and the other holders of Class A units of Manning & Napier Group. See Note 4 for additional information on the tax receivable agreement. The initial estimate for the deferred tax asset, net of the liability under the tax receivable agreement is recorded within paid-in capital as additional consideration on behalf of the Class A shareholders.
F-15
Table of Contents
The following table summarizes the net increase to paid-in capital as a result of the Offering, the deferred tax asset and the corresponding liability related to the tax receivable agreement described above, and expenses incurred that were directly attributable to the Offering:
| Increase (Decrease) To Paid-in Capital |
||||
| (dollars in thousands) | ||||
| Net Proceeds, before expenses, to Manning & Napier |
$ | 154,449 | ||
| Net deferred tax asset upon acquiring interests in Manning & Napier Group |
54,359 | |||
| Amounts payable under the tax receivable agreement |
(46,205 | ) | ||
| Expenses directly attributable to the Offering |
(2,704 | ) | ||
|
|
|
|||
| Net Increase to Paid-in Capital, including Common Stock |
$ | 159,899 | ||
|
|
|
|||
As a result of the Offering, the Company holds approximately 13.8% interest in Manning & Napier Group. The diagram below depicts the Company’s organizational structure after the Reorganization and the Offering.
| (1) | Manning & Napier Associates, LLC is majority owned by William Manning, directly and indirectly through Manning Ventures, Inc., with a minority interest held by B. Reuben Auspitz. |
| (2) | Prior to the Offering, Manning & Napier Group granted Class B units to each of Patrick Cunningham and James Mikolaichik. As of December 31, 2011, the Class B units of Manning & Napier Group granted to Patrick Cunningham and James Mikolaichik collectively represent less than 0.1% of the outstanding voting and economic rights of Manning & Napier Group. |
F-16
Table of Contents
| (3) | Manning & Napier, Inc. is the sole managing member of Manning & Napier Group, LLC. |
| (4) | Represents Manning & Napier Advisors, LLC, Manning & Napier Advisory Advantage Company, LLC, Exeter Advisors I, LLC, Manning & Napier Alternative Opportunities, LLC, Perspective Partners LLC, Manning & Napier Information Services, LLC, Manning & Napier Investor Services, Inc. and ETC. As a result of the reorganization transactions, Manning & Napier Investor Services, Inc., which until such time was a sub-chapter “S” corporation for tax purposes, became a sub-chapter “C” corporation for tax purposes and is accordingly subject to corporate-level taxation on its earnings. |
Note 4—Noncontrolling Interests
Manning & Napier is the sole managing member of Manning & Napier Group. Following the Reorganization and Offering, Manning & Napier holds approximately 13.8% economic interest in Manning & Napier Group, but as managing member controls the management of Manning & Napier Group. As a result, the Company consolidates the financial results of Manning & Napier Group and records a noncontrolling interest on its balance sheet with respect to the remaining approximately 86.2% economic interest in Manning & Napier Group held by M&N Group Holdings, MNCC and the other members of Manning & Napier Group. Net income attributable to noncontrolling interest on the statements of operations represents the portion of earnings or loss attributable to the economic interest in Manning & Napier Group held by the noncontrolling members. Subsequent to the Offering, the Company has consolidated the results of Manning & Napier Group; therefore, all income for the period prior to the Offering is entirely attributable to noncontrolling interest. A reconciliation from “(Loss) income before provision for income taxes” to “Net loss attributable to Manning & Napier, Inc.” is detailed as follows:
| Year Ended December 31, |
||||
| 2011 | ||||
| (dollars in thousands) | ||||
| (Loss) income before provision for income taxes |
$ | (104,434 | ) | |
| Less: income before provision for income taxes prior to the Offering (a) |
92,366 | |||
| Less: loss before provision for income taxes of Registrant (b) |
(298 | ) | ||
|
|
|
|||
| (Loss) income before provision for income taxes, as adjusted |
(196,502 | ) | ||
| Controlling interest percentage (c) |
13.148 | % | ||
|
|
|
|||
| Net loss attributable to controlling interest |
(25,836 | ) | ||
| Plus: loss before provision of Registrant (b) |
(298 | ) | ||
|
|
|
|||
| (Loss) income before income taxes, as adjusted, attributable to Manning & Napier |
(26,134 | ) | ||
| Less: provision for income taxes of Manning & Napier (d) |
(1,033 | ) | ||
|
|
|
|||
| Net (loss) income attributable to Manning & Napier, Inc. |
$ | (27,167 | ) | |
|
|
|
|||
| a) | All income for the period prior to the Offering is entirely attributable to the noncontrolling interest which existed prior to the IPO. |
| b) | Manning & Napier incurs certain expenses that are only attributable to the Registrant and are included within the net loss attributable to Manning & Napier. |
| c) | (Loss) income before provision for income taxes, as adjusted, is allocated to the controlling interest based on the percentage of units of Manning & Napier Group held by the Company. On December 16, 2011, the underwriters in the Offering exercised their overallotment option and purchased an additional 1,083,873 |
F-17
Table of Contents
| shares at the public offering price, less the underwriting discount. As a result, the amount of (loss) income attributable to Manning & Napier from the date of the Offering through December 31, 2011 represents the Company’s weighted ownership of Manning & Napier Group during that period. |
| d) | The consolidated provision for income taxes is equal to the sum of (i) the provision for income taxes for entities other than Manning & Napier and (ii) the provision for income taxes of Manning & Napier which includes all U.S. federal and state income taxes. The consolidated provision for income taxes totaled approximately $2.0 million for the year ended December 31, 2011. |
As of December 31, 2011, the Company has not made any distributions or other payments to noncontrolling members, including any payments pursuant to the tax receivable agreement (“TRA”).
Pursuant to the exchange agreement (Note 12) and following the consummation of the Offering, Class A units of Manning & Napier Group were acquired from their holders in exchange for cash or shares of the Company’s Class A common stock. In addition, approximately $105.7 million of the net proceeds of the Offering were used to purchase Class A units of Manning & Napier Group held by M&N Group Holdings. Manning & Napier Group has elected Section 754 of the Internal Revenue Code, as amended, to be in effect for taxable years in which purchases or exchanges of the Class A units of Manning & Napier Group will occur. Pursuant to the Section 754 election, each future purchase or exchange of such Class A units is expected to result in the purchaser of such units receiving an increase in the tax basis of tangible and intangible assets of Manning & Napier Group. The basis adjustments will increase, for tax purposes, the tax basis in the Manning & Napier Group’s assets attributable to the Class A units acquired. The higher tax basis will increase depreciation and amortization deductions allocable to the Company from Manning & Napier Group and therefore reduce the amount of income tax that would otherwise be required to pay in the future.
Upon the consummation of the Offering, a tax receivable agreement was entered into with M&N Group Holdings, MNCC and the other holders of Class A units of Manning & Napier Group, pursuant to which the Company is required to pay M&N Group Holdings and any other future holders of units of Manning & Napier Group 85% of the applicable cash savings, if any, in U.S. federal, state, local and foreign income tax that the Company actually realizes, or is deemed to realize in certain circumstances, in periods after the Offering as a result of any step-up in tax basis in Manning & Napier Group’s assets resulting from (i) the Company’s purchase of such Class A units from M&N Group Holdings with a portion of the net proceeds of the Offering, (ii) the Company’s purchases or exchanges of such Class A units from M&N Group Holdings and MNCC respectively, for cash or, at the Company’s election, shares of its Class A common stock and (iii) payments under the tax receivable agreement, including any tax benefits related to imputed interest deemed to be paid by the Company as a result of such agreement.
There is a possibility that not all of the 85% of the applicable cash savings will be paid to the selling or exchanging holder of Class A units at the time described above. If it is determined that all or a portion of such applicable tax savings is in doubt, payment to the holders of such Class A units will be the amount attributable to the portion of the applicable tax savings that are determined not to be in doubt and the payment of the remainder at such time as it is reasonably determined that the actual tax savings or that the amount is no longer in doubt.
As of December 31, 2011, the Company recorded a liability of $46.2 million, representing the payments due to the selling unit holders under the TRA. Within the next 12 month period, the Company expects to pay approximately $0.3 million of the total amount. The basis for determining the current portion of the payments under the TRA is the expected amount of payments to be made within the next 12 months. The long-term portion of the payments under the tax receivable agreement is the remainder. Payments are anticipated to be made annually over 15 years, commencing from the date of each event that gives rise to the TRA benefits, beginning with the date of the Offering. The payments are made in accordance with the terms of the TRA. The timing of the payments is subject to certain contingencies including Manning & Napier having sufficient taxable income to utilize all of the tax benefits defined in the TRA.
F-18
Table of Contents
Obligations pursuant to the TRA are obligations of Manning & Napier. They do not impact the noncontrolling interest. These obligations are not income tax obligations and have no impact on the tax provision or the allocation of taxes. Furthermore, the TRA has no impact on the allocation of the provision for income taxes to the Company’s net (loss) income.
ETC was a 98% owned subsidiary of MNCC until June 2011, at which time it became a wholly owned subsidiary of MNCC. As such, a noncontrolling interest of less than $0.1 million was recorded in the period ended December 31, 2010.
Note 5—Investment Securities
The following table represents the Company’s investment securities holdings at December 31, 2011 and December 31, 2010:
| At December 31, 2011 | ||||||||||||||||
| Cost | Unrealized Gains |
Unrealized Losses |
Fair Value |
|||||||||||||
| Available-for-sale securities | (dollars in thousands) | |||||||||||||||
| US treasury note (0.375%, 9/30/2012) |
$ | 504 | $ | 2 | $ | — | $ | 506 | ||||||||
| US treasury note (1.75%, 1/31/2014) |
102 | 2 | — | 104 | ||||||||||||
|
|
|
|
|
|
|
|
|
|||||||||
| 606 | 4 | — | 610 | |||||||||||||
|
|
|
|
|
|
|
|
|
|||||||||
| Trading Securities |
||||||||||||||||
| Short-term securities |
|
636 | ||||||||||||||
| Equity securities |
|
2,656 | ||||||||||||||
| Managed mutual funds |
|
740 | ||||||||||||||
|
|
|
|||||||||||||||
| $ | 4,032 | |||||||||||||||
|
|
|
|||||||||||||||
| Total investment securities |
|
$ | 4,642 | |||||||||||||
|
|
|
|||||||||||||||
| At December 31, 2010 | ||||||||||||||||
| Cost | Unrealized Gains |
Unrealized Losses |
Fair Value |
|||||||||||||
| Available-for-sale securities | (dollars in thousands) | |||||||||||||||
| Short-term securities |
$ | 654 | $ | — | $ | — | $ | 654 | ||||||||
| Equity securities |
2,317 | 624 | (497 | ) | 2,444 | |||||||||||
| Managed mutual funds |
611 | 65 | — | 676 | ||||||||||||
| US treasury note (0.375%, 9/30/2012) |
504 | — | — | 504 | ||||||||||||
| US treasury note (1.75%, 1/31/2014) |
102 | 1 | — | 103 | ||||||||||||
|
|
|
|
|
|
|
|
|
|||||||||
| Total investment securities |
$ | 4,188 | $ | 690 | $ | (497 | ) | $ | 4,381 | |||||||
|
|
|
|
|
|
|
|
|
|||||||||
Investment securities are classified as either trading or available-for-sale and are carried at fair value. Fair value is determined based on quoted market prices in active markets for identical or similar instruments.
F-19
Table of Contents
Investment securities classified as trading consist of short-term securities, equity securities, and investments in mutual funds for which the Company provides advisory services. At December 31, 2011, trading securities consist solely of investments held by the Company for the purpose of providing initial cash seeding for product development purposes. Prior to December 31, 2011, the Company classified these investments as available-for-sale. The reclassification of these investments from available-for-sale to trading on December 31, 2011 resulted in the recording of less than $0.1 million of unrealized gains in net capital gains (losses) on investments in the combined consolidated statements of operations.
Investment securities classified as available-for-sale consist of U.S. Treasury Notes, which are held by ETC in order to comply with New Hampshire state regulations requiring ETC to maintain a restricted surplus fund equal to 100% of its common stock. As of December 31, 2011 and December 31, 2010, $0.6 million of investment securities is considered restricted. The Company periodically reviews each individual security position that has an unrealized loss, or impairment, to determine if that impairment is other-than-temporary. No other-than-temporary impairment charges have been recognized by the Company during the years ended December 31, 2011, 2010, or 2009. Unrealized losses on available-for-sale securities that had been in a continuous loss position for twelve months or longer were immaterial as of the end of each reporting period.
The table below presents realized gains and losses on the sale of all securities for the twelve months ended December 31, 2011, December 31, 2010, and December 31, 2009:
| December 31, | ||||||||||||
| 2011 | 2010 | 2009 | ||||||||||
| (dollars in thousands) | ||||||||||||
| Gross realized investment gains |
$ | 384 | $ | 5 | $ | 28 | ||||||
| Gross realized investment losses |
(247 | ) | (4 | ) | (179 | ) | ||||||
|
|
|
|
|
|
|
|||||||
| Net realized gains (losses) |
$ | 137 | $ | 1 | $ | (151 | ) | |||||
|
|
|
|
|
|
|
|||||||
Note 6—Fair Value Measurements
In accordance with current accounting standards, fair value is defined as the price that the Company would receive upon selling an investment in an orderly transaction to an independent buyer in the principal or most advantageous market of the investment. A fair value hierarchy is provided that gives the highest priority to unadjusted quoted prices in active markets for identical assets and liabilities (Level 1) and the lowest priority to unobservable inputs (Level 3).
The following three-tier fair value hierarchy prioritizes the inputs used in measuring fair value:
Level 1—observable inputs such as quoted prices in active markets for identical securities;
Level 2—other significant observable inputs (including but not limited to quoted prices for similar securities, interest rates, prepayment speeds, credit risk, etc.); and
Level 3—significant unobservable inputs (including the Company’s own assumptions in determining the fair value of investments).
F-20
Table of Contents
The following provides the hierarchy of inputs used to derive the fair value of the Company’s assets as of December 31, 2011 and 2010:
| Level 1 | Level 2 | Level 3 | Totals | |||||||||||||
| (dollars in thousands) | ||||||||||||||||
| At December 31, 2011 |
||||||||||||||||
| Short-term securities |
$ | 636 | $ | — | $ | — | $ | 636 | ||||||||
| Equity securities |
2,656 | — | — | 2,656 | ||||||||||||
| Managed mutual funds |
740 | — | — | 740 | ||||||||||||
| US treasury note (0.375%, 9/30/2012) |
— | 506 | — | 506 | ||||||||||||
| US treasury note (1.75%, 1/31/2014) |
— | 104 | — | 104 | ||||||||||||
|
|
|
|
|
|
|
|
|
|||||||||
| $ | 4,032 | $ | 610 | $ | — | $ | 4,642 | |||||||||
|
|
|
|
|
|
|
|
|
|||||||||
| At December 31, 2010 |
||||||||||||||||
| Short-term securities |
$ | 654 | $ | — | $ | — | $ | 654 | ||||||||
| Equity securities |
2,444 | — | — | 2,444 | ||||||||||||
| Managed mutual funds |
676 | — | — | 676 | ||||||||||||
| US treasury note (0.375%, 9/30/2012) |
— | 504 | — | 504 | ||||||||||||
| US treasury note (1.75%, 1/31/2014) |
— | 103 | — | 103 | ||||||||||||
|
|
|
|
|
|
|
|
|
|||||||||
| $ | 3,774 | $ | 607 | $ | — | $ | 4,381 | |||||||||
|
|
|
|
|
|
|
|
|
|||||||||
There were no Level 3 securities held by the Company as of December 31, 2011 or 2010.
The Company’s policy is to recognize transfers in and transfers out of the valuation levels as of the beginning of the reporting period. There were no significant transfers between Level 1 and Level 2 during the years ended December 31, 2011 and 2010.
Note 7—Property and Equipment
Property and equipment as of December 31, 2011 and 2010 consisted of the following:
| December 31, | December 31, | |||||||
| 2011 | 2010 | |||||||
| (dollars in thousands) | ||||||||
| Furniture and fixtures |
$ | 1,607 | $ | 1,414 | ||||
| Office equipment |
3,617 | 3,185 | ||||||
| Computer software |
1,356 | 2,490 | ||||||
| Leasehold improvements |
1,702 | 1,116 | ||||||
|
|
|
|
|
|||||
| 8,282 | 8,205 | |||||||
| Less: Accumulated depreciation |
(4,470 | ) | (5,094 | ) | ||||
|
|
|
|
|
|||||
| $ | 3,812 | $ | 3,111 | |||||
|
|
|
|
|
|||||
Depreciation expense was $1.1 million, $1.4 million and $1.1 million for the years ended December 31, 2011, 2010 and 2009, respectively.
The Company has evaluated its long-lived assets for impairment under the current accounting standards and has concluded that no impairment loss has occurred as of December 31, 2011 and 2010.
F-21
Table of Contents
Note 8—Accrued Expenses and Other Liabilities
Accrued expenses and other liabilities as of December 31, 2011 and 2010 consisted of the following:
| December 31, |
December 31, |
|||||||
| 2011 | 2010 | |||||||
| (dollars in thousands) | ||||||||
| Accrued sales commissions |
$ | 5,715 | $ | 5,518 | ||||
| Accrued bonuses |
9,991 | 15,077 | ||||||
| Accrued sub-transfer agent fees |
6,492 | 5,916 | ||||||
| Accrued professional service fees |
3,055 | 654 | ||||||
| Other accruals and liabilities |
4,846 | 3,299 | ||||||
|
|
|
|
|
|||||
| $ | 30,099 | $ | 30,464 | |||||
|
|
|
|
|
|||||
Note 9—Shares Subject to Redemption
The Company entered into an agreement that upon the death of the majority shareholder, the Company has a mandatory obligation to pay the majority shareholder his pro rata share of net revenue for the four quarters immediately preceding the holder’s death. The Company recognized a liability for shares subject to mandatory redemption of approximately $170.3 million as of December 31, 2010, which represents the amount that would have been paid if settlement had occurred on the respective reporting date. As discussed further below, the Company has no obligation as of December 31, 2011. Changes in the liability associated with this obligation have been recorded as interest expense on shares subject to mandatory redemption in the combined consolidated statements of operations of $45.8 million and $61.2 million for the years ended December 31, 2011 and 2010, respectively.
On June 29, 2011, the Company entered into an Amended and Restated Shareholders Agreement relative to MNBD that made the obligation to purchase the shares of the majority shareholder contingent. As a result of the conditionality established by this amendment, the obligation to purchase the shares of the majority shareholder no longer meet the criteria to be classified as a liability and $1.5 million was reclassified to temporary equity in accordance with the requirements of accounting for contracts in entity’s own equity. The Company did not recognize any gains or losses as a result of the aforementioned reclassification. Subsequent changes to the contingent obligation were recorded to equity.
As part of the overall agreement among the majority shareholder and the legacy owners of the Manning & Napier Companies to consummate the Offering, such mandatory and conditional obligations terminated upon the consummation of the Offering and the Company no longer reflects interest expense, or the liability and temporary equity related to such obligation. As a result, the carrying amounts of the instruments were reclassified to permanent equity at the date of the Offering. Refer to the combined consolidated statements of shareholders’ equity (deficit) and partners’ capital for the impacts of the reclassification.
At December 31, 2011 and 2010, the shares subject to redemption upon the death of the majority holder consisted of:
| December 31, | December 31, | |||||||
| 2011 | 2010 | |||||||
| (dollars in thousands) | ||||||||
| Common stock, $.01 par value—5,224,500 shares subject to redemption |
$ | — | $ | 52 | ||||
| Additional paid-in capital |
— | 5,291 | ||||||
| Accumulated deficit attributable to those shares |
— | 121,974 | ||||||
| Excess of common stock—additional paid-in capital and accumulated deficit attributable to those shares over redemption amount |
— | 43,002 | ||||||
|
|
|
|
|
|||||
| Shares subject to mandatory redemption |
$ | — | $ | 170,319 | ||||
|
|
|
|
|
|||||
F-22
Table of Contents
Note 10—Commitments and Contingencies
The Company may enter into agreements that contain certain representations and warranties and which provide general indemnifications. The Company may also serve as a guarantor of such obligations. The Company’s maximum exposure under these arrangements is unknown, as this would involve future claims that may be made against the Company that have not yet occurred. The Company expects any risk of liability associated with such guarantees to be remote.
As an investment adviser to a variety of investment products, the Company is subject to routine reviews and inspections by the SEC and FINRA. From time to time the Company may also be subject to claims, be involved in various legal proceedings arising in the ordinary course of its business and other contingencies. The Company does not believe that the outcome of any of these reviews, inspections or other legal proceedings will have a material impact on its combined consolidated financial statements; however, litigation is subject to many uncertainties, and the outcome of individual litigated matters is difficult to predict. The Company will establish accruals for matters that are probable, can be reasonably estimated, and may take into account any related insurance recoveries to the extent of such recoveries. Currently, there are no legal proceedings pending or to the Company’s knowledge threatened against it. As of December 31, 2011 and 2010, the Company has not accrued for any such claims, legal proceedings, or other contingencies.
Lease Commitments
The Company has several operating leases for office space, and leases its primary office facilities in Fairport, New York under an operating lease expiring June 30, 2015. The Company also rents additional office space in Buffalo, New York, St. Petersburg, Florida, and Dublin, Ohio. Total rental expense for all leases amounted to $3.1 million, $2.6 million and $2.6 million for the years ended December 31, 2011, 2010 and 2009, respectively. Minimum rent payments relating to the office leases for years subsequent to 2011, are as follows:
| (dollars in thousands) |
||||
| Year Ending December 31, |
||||
| 2012 |
$ | 3,383 | ||
| 2013 |
3,226 | |||
| 2014 |
3,169 | |||
| 2015 |
1,732 | |||
| 2016 |
212 | |||
| Thereafter |
0 | |||
|
|
|
|||
| $ | 11,722 | |||
|
|
|
|||
Under the agreement for its primary office facilities, the Company is required to pay a minimum of $2.8 million annually for the use of the facility as defined in the agreement.
As of December 31, 2011 and 2010, the Company had approximately $0.2 million of total capital lease obligations.
As detailed in Note 4, the Company is committed to obligations pursuant to the TRA. The timing of payments is subject to certain contingencies including Manning & Napier having sufficient taxable income to utilize all of the tax benefits defined in the TRA.
Note 11—Advisory Agreements
The Company derives significant revenue from its role as advisor to the Manning & Napier Fund series of mutual funds (“Fund”) and the Exeter Collective Investment Trust (“CIT”) investment vehicles.
F-23
Table of Contents
Investments in the Fund amounted to approximately $0.7 million and $0.7 million at December 31, 2011 and 2010, respectively.
Fees earned for advisory related services provided to the Fund and CIT investment vehicles were approximately $167.8 million, $120.0 million and $63.5 million for the years ended December 31, 2011, 2010 and 2009, respectively, which represents greater than 10% of revenue in each period.
Note 12—Shareholders’ Equity and Capital Structure
The authorized capital stock of Manning & Napier consists of 300,000,000 shares of Class A common stock, par value $0.01 per share and 2,000 shares of Class B common stock, par value $0.01 per share and are further described below. In addition to the Class A and Class B common stock, the Company has the authority to issue 100,000 shares of preferred stock, par value $0.01 per share.
Class A Common Stock
The holders of the Company’s Class A common stock are entitled to one vote for each share held of record on all matters submitted to a vote of stockholders.
The holders of the Company’s Class A common stock are entitled to receive dividends, if declared by the Company’s board of directors, out of funds legally available therefore, subject to any statutory or contractual restrictions on the payment of dividends.
The holders of the Company’s Class A common stock do not have preemptive, subscription, redemption or conversion rights.
Class B Common Stock
The holder of the Company’s Class B common stock controls a majority of the vote on all matters submitted to a vote of stockholders. The number of votes for each share of Class B common stock is equal to the quotient derived by dividing the total number of issued and outstanding shares of Class B common stock into a number equal to 101% of the aggregate number of votes entitled to be cast by the holders of the Class A common stock and any other of the Company’s equity securities entitled to vote other than the holders of Class B common stock, as calculated on the record date of such vote.
The holder of the Company’s Class B common stock does not have any right to receive dividends or to receive a distribution upon the dissolution, liquidation or sale of all or substantially all of the Company’s assets.
In the event the holder of the Company’s Class B common stock transfers any shares of Class B common stock to any person or entity, such shares will be deemed automatically to convert into the same number of shares of Class A common stock.
Upon the earlier to occur of: (i) the death of William Manning, the holder of the Company’s Class B common stock, (ii) the date that the aggregate direct and indirect ownership of William Manning of Class A units and Class B units of Manning & Napier Group constitutes less than 25% of the total number of Class A units and Class B units of Manning & Napier Group and (iii) the sixth anniversary of the original date of issuance of the Class B common stock, all outstanding shares of the Company’s Class B common stock will be automatically, without any further action on the Company’s part or the holder of the shares of the Company’s Class B common stock, cancelled and will revert to the status of authorized but unissued shares of Class B common stock.
The holder of the Company’s Class B common stock does not have any preemptive, subscription or conversion rights.
F-24
Table of Contents
Voting
Generally, all matters to be voted on by stockholders must be approved by a majority of the votes entitled to be cast by all shares of Class A common stock and Class B common stock, voting together as a single class.
Shares Eligible for Future Sale
Upon the Offering, the Company entered into an exchange agreement with M&N Group Holding, MNCC and the other direct holders of all of the units of Manning & Napier Group that are not held by the Company.
Pursuant to the terms of an exchange agreement, subject to certain restrictions, such units will be exchangeable for an aggregate of up to 76,400,000 shares of the Company’s Class A common stock, subject to customary adjustments. In addition, the holders of any subsequent units issued of Manning & Napier Group will also become parties to the exchange agreement and such units, pursuant to the terms of the exchange agreement, will also be exchangeable for shares of the Company’s Class A common stock.
Subject to certain restrictions set forth in the exchange agreement:
| • | with respect to the 59,160,487 Class A units of Manning & Napier Group held by M&N Group Holdings that are attributable to the interests of William Manning in M&N Group Holdings, commencing on the first anniversary of Offering, M&N Group Holdings may exchange up to 15% of such units per year on behalf of William Manning; and |
| • | with respect to the 16,110,311 Class A units of Manning & Napier Group held by M&N Group Holdings that are attributable to the interests of the other holders of M&N Group Holdings, |
| • | commencing on the first anniversary of the consummation of the Offering, M&N Group Holdings may exchange up to 5% of such Class A units on behalf of such holders; and |
| • | commencing on the second anniversary of the consummation of the Offering, M&N Group Holdings may exchange the remaining Class A units, subject to the vesting requirements and selling restrictions; |
| • | with respect to the 749,964 Class A units of Manning & Napier Group held by MNCC attributable to the interests of William Manning in MNCC, commencing on the second anniversary of the Offering, MNCC may exchange up to 15% of such units per year on behalf of William Manning; and |
| • | with respect to the 338,758 Class A units of Manning & Napier Group held by MNCC attributable to the interests of the other members of MNCC, other than William Manning, commencing on the second anniversary of the consummation of the Offering, MNCC may exchange such Class A units, subject to the vesting requirements and selling restrictions, on behalf of such holders. |
For any units of Manning & Napier Group exchanged subsequent to the Offering, the Company will (i) pay an amount of cash equal to the number of units exchanged multiplied by the value of one share of the Company’s Class A common stock, or, at the Company’s election, (ii) issue shares of the Company’s Class A common stock on a one-for-one basis, subject, in each case, to customary adjustments for stock splits, stock dividends and reclassifications and other similar transactions. As the Company receives units of Manning & Napier Group that are exchanged, the Company’s ownership of Manning & Napier Group will increase. The decision whether to pay cash or issue shares will be made by the independent members of the Company’s board of directors.
Note 13—Equity Based Compensation
2011 Equity Compensation Plan
The 2011 Equity Compensation Plan (the “2011 Plan”) was adopted by the Company’s board of directors and approved by the Company’s stockholders prior to the consummation of the IPO. A total of 13,142,813 equity
F-25
Table of Contents
interests are available for issuance under the 2011 Plan. The equity interests may be issued in the form of the Company’s Class A common stock, units of Manning & Napier Group, or LTIP units. As of December 31, 2011, no such interests had been awarded under the 2011 Plan.
Reorganization-Related Transactions
Prior to the IPO, the Company and certain affiliates had awarded certain employees equity shares in the Company and those affiliates. Equity-based compensation for these shares was determined based on the grant-date fair value less the cash consideration for such shares paid by the employee. Shares granted on January 1, 2011 and 2010 had a weighted average grant-date fair value per share of $117.85 and $27.01, respectively, with the total estimated compensation cost associated with such shares being recognized over the required service term of 3 years.
In connection with the Reorganization (Note 3), Class B units of M&N Group Holdings were granted to William Manning as part of the overall agreement among William Manning and the other owners of the Manning & Napier Companies to consummate the Reorganization. These Class B units were vested immediately upon the consummation of the IPO (Note 3). As such, a one-time compensation charge of $213.0 million was recognized by the Company, based on the value of the Class B units, which represent approximately 23.6% of the outstanding voting and economic rights in M&N Group Holdings following the reorganization transactions and the consummation of the IPO.
Also upon the consummation of the IPO, the Company adopted new vesting terms related to the pre-IPO ownership interests of certain employees of the Company other than William Manning. Such individuals were entitled to 15% of their pre-Reorganization ownership interests upon the consummation of the IPO, and an additional 5% of such ownership interests will vest annually through 2014, provided such individuals are employees of the Company as of such date (service-based vesting). The remaining ownership interests will be subject to performance-based vesting annually through 2014, to be determined by a vesting committee, and subject to an initial two-year lockup period as well as other selling restrictions (performance-based vesting). Notwithstanding these vesting requirements, in the event William Manning sells any portion of his interests in the Manning & Napier Companies following the consummation of the Offering, our other pre-IPO employee-owners will have the right to sell a pro rata amount of such individuals’ indirect ownership interest in Manning & Napier Group, and if any individual does not at such time have fully vested ownership interests sufficient to allow such participation, an amount of their ownership interests will vest to the extent necessary to allow them to participate in the pro rata sale. In connection with the Reorganization and the related amendment to the limited liability company agreement of Manning & Napier Group, these pre-IPO ownership interests were reclassified as Class A Units of Manning & Napier Group. As such, fully vested ownership interests will be exchangeable for shares of the Company’s Class A common stock (Note 12).
As of December 31, 2011, performance conditions were not yet defined for the performance-based awards and therefore the grant date had not been established as of December 31, 2011. These awards are not considered granted as of December 31, 2011 and as such, no expense for the approximately 13.5 million performance-based units was recognized during 2011.
F-26
Table of Contents
The following table summarizes stock unit activity for the year ended December 31, 2011:
| Stock Units | Weighted Average Grant Date Fair Value |
|||||||
| Legacy S-Corp awards outstanding at January 1, 2011 |
55,493 | $ | 26.08 | |||||
| Legacy S-Corp shares granted |
32,212 | $ | 117.85 | |||||
| Legacy S-Corp shares vested |
— | — | ||||||
| Legacy S-Corp shares forfeited |
— | — | ||||||
| Effect of reorganization (1) |
(87,705 | ) | $ | 59.78 | ||||
|
|
|
|||||||
| Outstanding at November 18, 2011 |
— | — | ||||||
|
|
|
|||||||
| Granted |
20,765,512 | $ | 12.00 | |||||
| Vested |
(17,825,115 | ) | $ | 12.00 | ||||
| Forfeited |
— | |||||||
|
|
|
|||||||
| Outstanding at December 31, 2011 |
2,940,397 | $ | 12.00 | |||||
|
|
|
|||||||
| (1) | Effect of new vesting terms on legacy S-Corp share awards outstanding prior to the IPO |
For awards granted during the year ended December 31, 2011, the weighted average fair value of the awards granted was $12.00, as determined by the closing sale price of Manning & Napier, Inc.’s Class A common stock as reported on the New York Stock Exchange on the dates of grant.
For the year ended December 31, 2011, the Company recorded approximately $0.9 million of compensation expense related to shares granted prior to the IPO as well as $215.3 million of compensation expense related to the amended vesting terms of ownership interests described above. Of this amount, $213.0 million was a one-time compensation charge related to the fully vested Class B Units of M&N Group Holdings granted to William Manning. For the years ended December 31, 2010 and 2009 the Company recorded compensation expense related to shares granted of approximately $0.7 in each respective year.
The aggregate intrinsic value of stock units that vested during the year ended December 31, 2011 was approximately $213.9 million. The aggregate intrinsic value of legacy S-Corp share awards that vested during each of the years ended December 31, 2010 and 2009 was approximately $0.7 million.
As of December 31, 2011, there was unrecognized compensation expense related to unvested awards of approximately $33.9 million. The Company expects to recognize the expense over a weighted average period of 2.0 years.
Note 14—Income Taxes
The Company is comprised of entities that have elected to be treated as either an “S-Corporation”, a limited liability company (LLC), or a “C-Corporation”. As such, the entities functioning as S-Corporations or LLC’s are not liable for or able to benefit from U.S. federal or most state and local income taxes on their earnings; as such (losses) earnings will be included in the personal income tax returns of each entity’s shareholders or unit holders. The entities functioning as C-Corporations are liable for or able to benefit from U.S. federal or state and local taxes on their earnings and (losses), respectively.
F-27
Table of Contents
Components of the provision for income taxes consist of the following:
| December 31, | ||||||||||||
| 2011 | 2010 | 2009 | ||||||||||
| (dollars in thousands) | ||||||||||||
| Current |
||||||||||||
| Federal |
$ | 1,050 | $ | 159 | $ | 133 | ||||||
| State and Local |
912 | 549 | 227 | |||||||||
|
|
|
|
|
|
|
|||||||
| Current tax expense |
1,962 | 708 | 360 | |||||||||
| Deferred |
||||||||||||
| Federal |
18 | 3 | — | |||||||||
| State and Local |
2 | 1 | — | |||||||||
|
|
|
|
|
|
|
|||||||
| Deferred tax expense |
20 | 4 | — | |||||||||
|
|
|
|
|
|
|
|||||||
| Provision for income tax expense |
$ | 1,982 | $ | 712 | $ | 360 | ||||||
|
|
|
|
|
|
|
|||||||
The differences between income taxes computed using the U.S. federal income tax rate and the provision for income taxes for continuing operations were as follows:
| 2011 | 2010 | 2009 | ||||||||||
| (dollars in thousands) | ||||||||||||
| Amount computed using the statutory rate |
$ | (36,552 | ) | $ | 18,834 | $ | 19,175 | |||||
| Increase (reduction) in taxes resulting from: |
||||||||||||
| State and local taxes, including settlements and adjustments, net of federal benefit |
852 | 534 | 206 | |||||||||
| Equity-based compensation |
9,909 | — | — | |||||||||
| Other, net |
(28 | ) | 2 | 22 | ||||||||
| Rate benefit from the flow-through entities |
27,801 | (18,658 | ) | (19,043 | ) | |||||||
|
|
|
|
|
|
|
|||||||
| Provision for income taxes |
$ | 1,982 | $ | 712 | $ | 360 | ||||||
|
|
|
|
|
|
|
|||||||
The effective tax rate includes a benefit attributable to the fact that the Company’s operations include a series of flow-through entities which are generally not subject to federal and most state income taxes. Accordingly, a portion of the Company’s earnings are not subject to corporate level taxes. This favorable impact is partially offset by the impact of certain permanent items, primarily attributable to certain compensation related expenses that are not deductible for tax purposes.
Deferred Tax Assets and Liabilities
| December 31, | ||||||||
| 2011 | 2010 | |||||||
| (dollars in thousands | ||||||||
| Deferred Tax Assets |
||||||||
| Tax receivable agreement |
$ | 53,925 | $ | — | ||||
| Bonus and commissions |
490 | — | ||||||
| Consulting and professional |
59 | 4 | ||||||
| Tax loss carryforwards |
29 | — | ||||||
| Other |
44 | 9 | ||||||
|
|
|
|
|
|||||
| $ | 54,547 | $ | 13 | |||||
| Deferred Tax Liabilities |
||||||||
| Depreciation and amortization |
139 | — | ||||||
|
|
|
|
|
|||||
| Total Deferred Tax Assets and Liabilities, net |
$ | 54,408 | $ | 13 | ||||
|
|
|
|
|
|||||
F-28
Table of Contents
The increase in net deferred tax assets from December 31, 2010 to December 31, 2011 was primarily attributable to an increase in the tax basis of the tangible and intangible assets of Manning & Napier Group in accordance with the Company’s election to be made under Section 754 of the Internal Revenue Code. Upon consummation of the Offering the Companies entered into an exchange agreement whereby interests of Manning & Napier Group were exchanged for Class A shares. This transaction resulted in an increase in the tax basis of the tangible and intangible assets of Manning & Napier Group, which triggered a liability under the tax receivable agreement that was entered into between the Company and the Manning & Napier Group selling unit holders. The agreement provides for a payment to the Manning & Napier Group Unit holders of 85% of the cash tax savings (if any), resulting from the increased tax benefits from the exchange and for the Company to retain 15% of such benefits. Accordingly, deferred tax assets, amounts payable under the tax receivable agreement and additional paid-in capital increased by $54.4 million, $46.2 million and $8.2 million respectively, on the Company’s combined consolidated statement of financial condition as of December 31, 2011. See Note 4 for further discussion.
As of December 31, 2011, the Company had available net operating loss carryforwards for income tax purposes of less than $0.1 million, which will expire in 2031. As of December 31, 2010, the Company had no available net operating loss carryforwards for income tax purposes.
The Company has assessed the recoverability of the deferred tax assets and believes it is more likely than not that the assets will be realized. The Company has not recorded a valuation allowance as of December 31, 2011 and 2010.
Accounting for Uncertainty in Income Taxes
A reconciliation of the beginning and ending amount of the Company’s liability for income taxes associated with unrecognized tax benefits is as follows:
| December 31, | ||||||||
| 2011 | 2010 | |||||||
| (dollars in thousands) | ||||||||
| Balance as of January 1 |
$ | — | $ | — | ||||
| Tax positions related to the current year: |
||||||||
| Additions |
3,144 | — | ||||||
| Tax positions related to prior years |
— | — | ||||||
|
|
|
|
|
|||||
| Balance as of December 31 |
$ | 3,144 | $ | — | ||||
|
|
|
|
|
|||||
The Company’s policy regarding interest and penalties related to uncertain tax positions is to recognize such items as a component of the provision (benefit) for income taxes. The Company recorded no interest or penalties in the combined consolidated statements of operations for the years ended December 31, 2011, 2010 and 2009.
The Company does not expect that changes in the liability for unrecognized tax benefits during the next twelve months will have a significant impact on the Company's financial position or results of operations. If the unrecognized tax benefits of $3.1 million were subsequently recognized, it would favorably affect the effective income tax rate in the period recognized.
The Company files income tax returns with Federal, state and local jurisdictions. The Company’s U.S. Federal and state tax matters for the years 2008 through 2010 remain subject to examination by the respective tax authorities.
F-29
Table of Contents
Note 15—Related Party Transactions
Aircraft
From time to time, the Company reimburses William Manning for business travel in connection with the use of a private plane owned by William Manning. The Company owns no direct or indirect interest in such private plane, and no such entity has provided any financing to William Manning for such plane. In the event William Manning, or other executives, use such plane in connection with the business of the Company, the Company reimburses William Manning based upon the amount of flight time per trip, which is a fraction of the total cost of the ownership and maintenance of such plane. Reimbursements with respect to each particular use of the plane for the years ended December 31, 2011, 2010 and 2009 have been less than $0.1million annually, and in the aggregate have equaled approximately $0.2 million.
Services Arrangement
Pursuant to an arrangement between MNIS and IP.com I, LLC, an entity that is indirectly majority-owned by William Manning, MNIS provides to IP.com, and IP.com reimburses MNIS for, central administrative services, including accounting, group health and other benefits, benefits management, payroll, occupancy of shared space and other office expenses. IP.com paid MNIS approximately $0.2 million, $0.3 million and $0.3 million for such services for the years ended December 31, 2011, 2010 and 2009, respectively.
From time to time, the Company may be asked to provide certain services, including accounting, legal and other administrative functions for the noncontrolling members of Manning & Napier Group. While immaterial, the Company has not received any reimbursement for such services subsequent to the Offering.
M&N Group Holdings
The Company used approximately $105.7 million of the net proceeds from the sale of the Company’s Class A common stock in the Offering to purchase Class A units of Manning & Napier Group from M&N Group Holdings, which in turn transferred such net proceeds to its members. William Manning, the Company’s current employees, including certain of the Company’s executive officers, and Richard Goldberg, directly and indirectly, collectively own 100% of the outstanding membership interests of M&N Group Holdings. The purchase price for each Class A unit was equal to the price per share of the Company’s Class A common stock in the Offering. M&N Group Holdings transferred such net proceeds to its members.
Promissory Note
MNA was issued a promissory note from William Manning in the principal amount of $8.0 million during 2009. William Manning repaid the note in full, including all interest accrued thereon, with payments to MNA on April 16, 2009 and June 17, 2009.
Note 16—Employee Benefit Plan
The Company offers two benefit plans across the combined consolidated companies. The Manning & Napier Advisors, Inc. 401(k) and Profit Sharing Plan (the “MNA Plan”) covers employees of MNA, AAC and ETC who meet the plan criteria. The Manning & Napier Information Services, Inc. 401(k) Plan (the “MNIS Plan”) covers employees of MNIS and PPI who meet the plan criteria.
With respect to the 401(k) portion of the MNA Plan and the MNIS Plan, participants may voluntarily contribute up to 50% of their regular salary subject to annual limitations determined by the IRS. The Company matches an amount equivalent to 50% of a participant’s contribution, not to exceed 2% of salaries paid. Matching contributions vest to the participants after three years of service. These contributions by the Company amounted to approximately $0.7 million, $0.6 million and $0.5 million for the years ended December 31, 2011, 2010 and 2009, respectively.
F-30
Table of Contents
With respect to the Profit Sharing portion of the MNA Plan, the Company may make annual profit sharing contributions, subject to certain limitations, which vest immediately to individuals who participate. These contributions by the Company amounted to $1.1 million, $1.0 million and $0.9 million for the years ended December 31, 2011, 2010 and 2009, respectively. The MNIS Plan does not participate in profit sharing.
Note 17—Subsequent Events
On March 20, 2012, the Board of Directors approved a distribution from Manning & Napier Group to Manning & Napier and the noncontrolling members of Manning & Napier Group. The amount of the distribution to the members of Manning & Napier Group is approximately $31.3 million. Concurrently, the Board of Directors declared a $0.16 per share dividend to the holders of Class A common stock. The dividend is payable on May 1, 2012 to shareholders of record as of April 13, 2012.
F-31