Attached files
| file | filename |
|---|---|
| EX-32.2 - EXHIBIT 32.2 - Manning & Napier, Inc. | exhibit322_q12016form10-q.htm |
| EX-32.1 - EXHIBIT 32.1 - Manning & Napier, Inc. | exhibit321_q12016form10-q.htm |
| EX-31.1 - EXHIBIT 31.1 - Manning & Napier, Inc. | exhibit311_q12016form10-q.htm |
| EX-31.2 - EXHIBIT 31.2 - Manning & Napier, Inc. | exhibit312_q12016form10-q.htm |
| EX-10.3 - EXHIBIT 10.3 - Manning & Napier, Inc. | exhibit103_q12016form10-q.htm |
UNITED STATES
SECURITIES AND EXCHANGE COMMISSION
Washington, D.C. 20549
_____________________________________________________________
FORM 10-Q
_____________________________________________________________
(Mark One)
x | QUARTERLY REPORT PURSUANT TO SECTION 13 OR 15(d) OF THE SECURITIES EXCHANGE ACT OF 1934 |
For the quarterly period ended March 31, 2016
OR
¨ | TRANSITION REPORT PURSUANT TO SECTION 13 OR 15(d) OF THE SECURITIES EXCHANGE ACT OF 1934 |
For the transition period from to
Commission file number: 001-35355
_____________________________________________________________
MANNING & NAPIER, INC.
(Exact name of registrant as specified in its charter)
_____________________________________________________________
Delaware | 45-2609100 | |
(State or other jurisdiction of incorporation or organization) | (I.R.S. Employer Identification No.) | |
290 Woodcliff Drive Fairport, New York | 14450 | |
(Address of principal executive offices) | (Zip Code) | |
Registrant’s telephone number, including area code:
(585) 325-6880
_____________________________________________________________
Indicate by check mark whether the registrant (1) has filed all reports required to be filed by Section 13 or 15(d) of the Securities Exchange Act of 1934 during the preceding 12 months (or for such shorter period that the registrant was required to file such reports), and (2) has been subject to such filing requirements for the past 90 days. Yes x No ¨
Indicate by check mark whether the registrant has submitted electronically and posted on its corporate Web site, if any, every Interactive Data File required to be submitted and posted pursuant to Rule 405 of Regulation S-T during the preceding 12 months (or for such shorter period that the registrant was required to submit and post such files). Yes x No ¨
Indicate by check mark whether the registrant is a large accelerated filer, an accelerated filer, a non-accelerated filer, or a smaller reporting company. See the definitions of “large accelerated filer,” “accelerated filer” and “smaller reporting company” in Rule 12b-2 of the Exchange Act:
Large accelerated filer | ¨ | Accelerated filer | x | |||
Non-accelerated filer | ¨ (Do not check if a smaller reporting company) | Smaller reporting company | ¨ | |||
Indicate by check mark whether the registrant is a shell company (as defined in Rule 12b-2 of the Exchange Act). Yes ¨ No x
Indicate the number of shares outstanding of each of the registrant’s classes of common stock, as of the latest practicable date.
Class | Outstanding at May 3, 2016 | |
Class A common stock, $0.01 par value per share | 15,032,880 | |
Class B common stock, $0.01 par value per share | 1,000 | |
TABLE OF CONTENTS
Page | ||
Part I | ||
Item 1. | ||
Item 2. | ||
Item 3. | ||
Item 4. | ||
Part II | ||
Item 1A. | ||
Item 6. | ||
In this Quarterly Report on Form 10-Q, “we”, “our”, “us”, the “Company”, “Manning & Napier” and the “Registrant” refers to Manning & Napier, Inc. and, unless the context otherwise requires, its consolidated direct and indirect subsidiaries and predecessors. | ||
i
PART I—FINANCIAL INFORMATION
Item 1. Financial Statements
Manning & Napier, Inc.
Consolidated Statements of Financial Condition
(In thousands, except share data)
March 31, 2016 | December 31, 2015 | |||||||
(unaudited) | ||||||||
Assets | ||||||||
Cash and cash equivalents | $ | 126,970 | $ | 117,591 | ||||
Accounts receivable | 15,016 | 15,807 | ||||||
Accounts receivable—Manning & Napier Fund, Inc. | 7,356 | 8,473 | ||||||
Due from broker | — | 3,962 | ||||||
Due from broker - consolidated funds | — | 3,510 | ||||||
Investment securities | 19,983 | 21,460 | ||||||
Investment securities - consolidated funds | 981 | 1,107 | ||||||
Prepaid expenses and other assets | 4,260 | 4,638 | ||||||
Total current assets | 174,566 | 176,548 | ||||||
Property and equipment, net | 5,972 | 6,299 | ||||||
Net deferred tax assets, non-current | 45,755 | 46,649 | ||||||
Other long-term assets | 1,242 | 1,300 | ||||||
Total assets | $ | 227,535 | $ | 230,796 | ||||
Liabilities | ||||||||
Accounts payable | $ | 1,036 | $ | 1,141 | ||||
Accrued expenses and other liabilities | 28,000 | 42,480 | ||||||
Deferred revenue | 11,066 | 10,938 | ||||||
Total current liabilities | 40,102 | 54,559 | ||||||
Other long-term liabilities | 2,651 | 2,796 | ||||||
Amounts payable under tax receivable agreement, non-current | 38,679 | 38,661 | ||||||
Total liabilities | 81,432 | 96,016 | ||||||
Commitments and contingencies (Note 9) | ||||||||
Shareholders’ equity | ||||||||
Class A common stock, $0.01 par value; 300,000,000 shares authorized; 14,735,130 and 14,755,130 issued and outstanding at March 31, 2016 and December 31, 2015, respectively | 147 | 148 | ||||||
Class B common stock, $0.01 par value; 2,000 shares authorized, 1,000 shares issued and outstanding at March 31, 2016 and December 31, 2015 | — | — | ||||||
Additional paid-in capital | 205,974 | 205,760 | ||||||
Retained deficit | (37,080 | ) | (37,149 | ) | ||||
Accumulated other comprehensive income | — | (3 | ) | |||||
Total shareholders’ equity | 169,041 | 168,756 | ||||||
Noncontrolling interests | (22,938 | ) | (33,976 | ) | ||||
Total shareholders’ equity and noncontrolling interests | 146,103 | 134,780 | ||||||
Total liabilities, shareholders’ equity and noncontrolling interests | $ | 227,535 | $ | 230,796 | ||||
The accompanying notes are an integral part of these consolidated financial statements.
1
Manning & Napier, Inc.
Consolidated Statements of Operations
(In thousands, except share data)
(Unaudited)
Three months ended March 31, | ||||||||
2016 | 2015 | |||||||
Revenues | ||||||||
Investment management services revenue | $ | 64,538 | $ | 90,426 | ||||
Expenses | ||||||||
Compensation and related costs | 21,967 | 26,818 | ||||||
Distribution, servicing and custody expenses | 11,338 | 16,832 | ||||||
Other operating costs | 8,453 | 8,942 | ||||||
Total operating expenses | 41,758 | 52,592 | ||||||
Operating income | 22,780 | 37,834 | ||||||
Non-operating income (loss) | ||||||||
Interest expense | (106 | ) | (3 | ) | ||||
Interest and dividend income | 136 | 163 | ||||||
Change in liability under tax receivable agreement | (18 | ) | (17 | ) | ||||
Net gains (losses) on investments | 1,066 | 613 | ||||||
Total non-operating income (loss) | 1,078 | 756 | ||||||
Income before provision for income taxes | 23,858 | 38,590 | ||||||
Provision for income taxes | 1,674 | 2,479 | ||||||
Net income attributable to controlling and noncontrolling interests | 22,184 | 36,111 | ||||||
Less: net income attributable to noncontrolling interests | 19,766 | 32,802 | ||||||
Net income attributable to Manning & Napier, Inc. | $ | 2,418 | $ | 3,309 | ||||
Net income per share available to Class A common stock | ||||||||
Basic | $ | 0.16 | $ | 0.24 | ||||
Diluted | $ | 0.16 | $ | 0.24 | ||||
Weighted average shares of Class A common stock outstanding | ||||||||
Basic | 13,745,130 | 13,713,540 | ||||||
Diluted | 14,084,903 | 13,914,908 | ||||||
Cash dividends declared per share of Class A common stock | $ | 0.16 | $ | 0.16 | ||||
The accompanying notes are an integral part of these consolidated financial statements.
2
Manning & Napier, Inc.
Consolidated Statements of Comprehensive Income
(In thousands)
(Unaudited)
Three months ended March 31, | ||||||||
2016 | 2015 | |||||||
Net income attributable to controlling and noncontrolling interests | $ | 22,184 | $ | 36,111 | ||||
Net unrealized holding gain (loss) on investment securities, net of tax | 3 | (1 | ) | |||||
Comprehensive income | $ | 22,187 | $ | 36,110 | ||||
Less: Comprehensive income attributable to noncontrolling interests | 19,769 | 32,801 | ||||||
Comprehensive income attributable to Manning & Napier, Inc. | $ | 2,418 | $ | 3,309 | ||||
The accompanying notes are an integral part of these consolidated financial statements.
3
Manning & Napier, Inc.
Consolidated Statements of Shareholders’ Equity
(In thousands, except share data)
(Unaudited)
Common Stock – class A | Common Stock – class B | Additional Paid in Capital | Retained Deficit | Accumulated Other Comprehensive Income (Loss) | Non Controlling Interests | |||||||||||||||||||||||||||||
Shares | Amount | Shares | Amount | Total | ||||||||||||||||||||||||||||||
Balance—December 31, 2014 | 13,713,540 | $ | 137 | 1,000 | $ | — | $ | 209,284 | $ | (41,087 | ) | $ | — | $ | (19,623 | ) | $ | 148,711 | ||||||||||||||||
Net income | — | — | — | — | — | 3,309 | — | 32,802 | 36,111 | |||||||||||||||||||||||||
Distributions to noncontrolling interests | — | — | — | — | — | — | — | (26,787 | ) | (26,787 | ) | |||||||||||||||||||||||
Net changes in unrealized investment securities gains or losses | — | — | — | — | — | — | (1 | ) | — | (1 | ) | |||||||||||||||||||||||
Equity-based compensation | — | — | — | — | 85 | — | — | 502 | 587 | |||||||||||||||||||||||||
Dividends declared on Class A common stock - $0.16 per share | — | — | — | — | — | (2,194 | ) | — | — | (2,194 | ) | |||||||||||||||||||||||
Purchase of Class A units of Manning & Napier Group, LLC held by noncontrolling interests | — | — | — | — | (4,394 | ) | — | — | (33,326 | ) | (37,720 | ) | ||||||||||||||||||||||
Balance—March 31, 2015 | 13,713,540 | $ | 137 | 1,000 | $ | — | $ | 204,975 | $ | (39,972 | ) | $ | (1 | ) | $ | (46,432 | ) | $ | 118,707 | |||||||||||||||
Balance—December 31, 2015 | 14,755,130 | $ | 148 | 1,000 | $ | — | $ | 205,760 | $ | (37,149 | ) | $ | (3 | ) | $ | (33,976 | ) | $ | 134,780 | |||||||||||||||
Net income | — | — | — | — | — | 2,418 | — | 19,766 | 22,184 | |||||||||||||||||||||||||
Distributions to noncontrolling interests | — | — | — | — | — | — | — | (9,798 | ) | (9,798 | ) | |||||||||||||||||||||||
Net changes in unrealized investment securities gains or losses | — | — | — | — | — | — | 3 | — | 3 | |||||||||||||||||||||||||
Common stock issued under equity compensation plan, net of forfeitures | (20,000 | ) | (1 | ) | — | — | — | — | — | — | (1 | ) | ||||||||||||||||||||||
Equity-based compensation | — | — | — | — | 214 | — | — | 1,070 | 1,284 | |||||||||||||||||||||||||
Dividends declared on Class A common stock - $0.16 per share | — | — | — | — | — | (2,349 | ) | — | — | (2,349 | ) | |||||||||||||||||||||||
Balance—March 31, 2016 | 14,735,130 | $ | 147 | 1,000 | $ | — | $ | 205,974 | $ | (37,080 | ) | $ | — | $ | (22,938 | ) | $ | 146,103 | ||||||||||||||||
The accompanying notes are an integral part of these consolidated financial statements.
4
Manning & Napier, Inc.
Consolidated Statements of Cash Flows
(In thousands)
(Unaudited)
Three months ended March 31, | ||||||||
2016 | 2015 | |||||||
Cash flows from operating activities: | ||||||||
Net income | $ | 22,184 | $ | 36,111 | ||||
Adjustment to reconcile net income to net cash provided by operating activities: | ||||||||
Equity-based compensation | 1,284 | 587 | ||||||
Depreciation and amortization | 508 | 642 | ||||||
Change in amounts payable under tax receivable agreement | 18 | 17 | ||||||
Net gains on investment securities | (1,066 | ) | (613 | ) | ||||
Deferred income taxes | 893 | 720 | ||||||
Amortization of debt issuance costs | 39 | — | ||||||
(Increase) decrease in operating assets and increase (decrease) in operating liabilities: | ||||||||
Accounts receivable | 791 | 1,815 | ||||||
Accounts receivable—Manning & Napier Fund, Inc. | 1,117 | 2,334 | ||||||
Due from broker - consolidated funds | 3,795 | (5,000 | ) | |||||
Prepaid expenses and other assets | 350 | 1,387 | ||||||
Accounts payable | (105 | ) | (1,245 | ) | ||||
Accrued expenses and other liabilities | (14,448 | ) | (16,856 | ) | ||||
Deferred revenue | 128 | 683 | ||||||
Other long-term liabilities | (108 | ) | (71 | ) | ||||
Net cash provided by operating activities | 15,380 | 20,511 | ||||||
Cash flows from investing activities: | ||||||||
Purchase of property and equipment | (120 | ) | (374 | ) | ||||
Sale of investments | 3,541 | 3,765 | ||||||
Purchase of investments | (1,222 | ) | (1,998 | ) | ||||
Due from broker | 4,019 | — | ||||||
Net cash provided by investing activities | 6,218 | 1,393 | ||||||
Cash flows from financing activities: | ||||||||
Distributions to noncontrolling interests | (9,798 | ) | (26,787 | ) | ||||
Dividends paid on Class A common stock | (2,361 | ) | (3,291 | ) | ||||
Payment of shares withheld to satisfy withholding requirements | — | (64 | ) | |||||
Payment of capital lease obligations | (60 | ) | (51 | ) | ||||
Purchase of Class A units of Manning & Napier Group, LLC | — | (36,326 | ) | |||||
Net cash used in financing activities | (12,219 | ) | (66,519 | ) | ||||
Net increase (decrease) in cash and cash equivalents | 9,379 | (44,615 | ) | |||||
Cash and cash equivalents: | ||||||||
Beginning of period | 117,591 | 124,992 | ||||||
End of period | $ | 126,970 | $ | 80,377 | ||||
The accompanying notes are an integral part of these consolidated financial statements.
5
Manning & Napier, Inc.
Notes to Consolidated Financial Statements
Note 1—Organization and Nature of the Business
Manning & Napier, Inc. ("Manning & Napier", or the "Company") provides a broad range of investment solutions through separately managed accounts, mutual funds, and collective investment trusts, as well as a variety of consultative services that complement its investment process. Founded in 1970, the Company offers equity, fixed income and alternative strategies, as well as a range of blended asset portfolios, such as life cycle funds. Headquartered in Fairport, New York, the Company serves a diversified client base of high net worth individuals and institutions, including 401(k) plans, pension plans, Taft-Hartley plans, endowments and foundations.
The Company is the sole managing member of Manning & Napier Group, LLC and its subsidiaries ("Manning & Napier Group"), a holding company for the investment management businesses conducted by its operating subsidiaries. The diagram below depicts the Company's organization structure as of March 31, 2016.
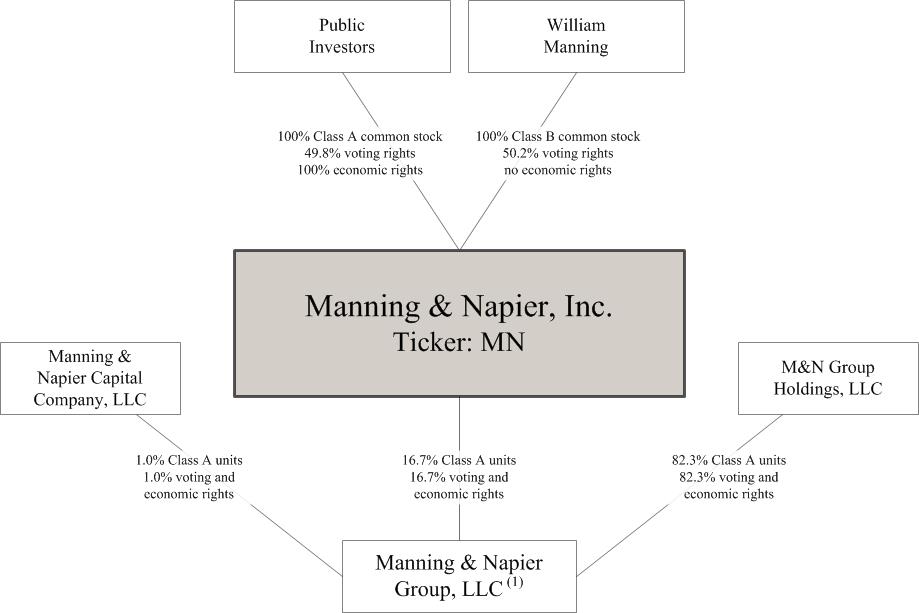
(1) | The operating subsidiaries of Manning & Napier Group include Manning & Napier Advisors, LLC ("MNA"), Manning & Napier Alternative Opportunities, LLC, Perspective Partners LLC, Manning & Napier Information Services, LLC, Manning & Napier Benefits, LLC, Manning & Napier Investor Services, Inc. and Exeter Trust Company. |
Note 2—Summary of Significant Accounting Policies
Critical Accounting Policies
There have been no significant changes in our critical accounting policies and estimates from those that were disclosed in our Annual Report on Form 10-K for the year ended December 31, 2015.
The Company believes that the disclosures herein are adequate so that the information presented is not misleading; however, these financial statements should be read in conjunction with the financial statements and the notes thereto in our Annual Report on Form 10-K for the year ended December 31, 2015. The financial data for the interim periods may not necessarily be indicative of results for future interim periods or for the full year.
6
Manning & Napier, Inc.
Notes to Consolidated Financial Statements (Continued)
Basis of Presentation
The accompanying unaudited consolidated financial statements were prepared in accordance with accounting principles generally accepted in the United States of America (“U.S. GAAP”) and related rules and regulations of the U.S. Securities and Exchange Commission (“SEC”) for interim financial reporting and include all adjustments, consisting only of normal recurring adjustments which are, in the opinion of management, necessary for a fair statement of the results for the interim period.
The preparation of financial statements in conformity with U.S. GAAP requires management to make estimates or assumptions that affect the reported amounts and disclosures in the consolidated financial statements. Actual results could differ from these estimates or assumptions.
Principles of Consolidation
As of March 31, 2016, Manning & Napier holds an economic interest of approximately 16.7% in Manning & Napier Group but, as managing member, controls all of the business and affairs of Manning & Napier Group. As a result, the Company consolidates the financial results of Manning & Napier Group and records a noncontrolling interest on its consolidated statements of financial condition with respect to the remaining economic interest in Manning & Napier Group held by Manning & Napier Group Holdings, LLC (“M&N Group Holdings”) and Manning & Napier Capital Company, LLC (“MNCC”).
All material intercompany transactions have been eliminated in consolidation.
In accordance with Accounting Standards Codification ("ASU") 2015-02, Consolidation (Topic 810) – Amendments to the Consolidation Analysis, the determination of whether a company is required to consolidate an entity is based on, among other things, an entity’s purpose and design, a company’s ability to direct the activities of the entity that most significantly impact the entity’s economic performance, and whether a company is obligated to absorb losses or receive benefits that could potentially be significant to the entity. The standard also requires ongoing assessments of whether a company is the primary beneficiary of a variable interest entity (“VIE”).
The Company provides seed capital to its investment teams to develop new products and services for its clients. The original seed investment may represent all or a majority of the equity investment in the new product. Pursuant to U.S. GAAP, the Company evaluates its seed investments on a regular basis and consolidates such investments for which it holds a controlling financial interest.
The Company serves as the investment adviser for Manning & Napier Fund, Inc. series of mutual funds (the “Fund”) and the Exeter Trust Company Collective Investment Trusts (“CIT”). The Fund and CIT are legal entities, the business and affairs of which are managed by their respective boards of directors. As a result, each of these entities is a voting interest entity (“VOE”). The Company holds, in limited cases, direct investments in a fund (which are made on the same terms as are available to other investors) and consolidates each of these entities where it has a controlling financial interest or a majority voting interest.
The Company is the General Partner of the MN Xenon Managed Futures Fund LP ("LP Fund"). The Company has determined that the LP Fund is not a VIE as (a) the entity has enough equity to finance its activities without additional financial support and (b) the limited partners, as a group, have the ability to remove the general partner ("kick-out rights") with a majority vote of partnership percentage. Under the voting interest model, the Company does not consolidate VOEs in which the presumption of control by the general partner is overcome by kick-out rights.
Cash and Cash Equivalents
The Company considers all highly liquid investments with original maturities of three months or less to be cash equivalents. Cash and cash equivalents are primarily held in operating accounts at major financial institutions and also in money market securities. Cash equivalents are stated at cost, which approximates market value due to the short-term maturity of these investments. The fair value of cash equivalents have been classified as Level 1 in accordance with the fair value hierarchy.
Investment Securities
Investment securities are classified as either trading or available-for-sale and are carried at fair value. Fair value is determined based on quoted market prices in active markets for identical or similar instruments.
Investment securities classified as trading consist of equity securities, fixed income securities, and investments in mutual funds and hedge funds for which the Company provides advisory services. Realized and unrealized gains and losses on trading securities are recorded in net gains (losses) on investments in the consolidated statements of operations. At March 31, 2016, trading securities consist solely of investments held by the Company to provide initial cash seeding for product development purposes.
7
Manning & Napier, Inc.
Notes to Consolidated Financial Statements (Continued)
Operating Segments
The Company operates in one segment, the investment management industry. The Company primarily provides investment management services to separately managed accounts, mutual funds and collective investment trust funds. Management assesses the financial performance of these vehicles on a combined basis.
Revenue
The majority of the Company’s revenues are based on fees charged to manage customers’ portfolios. Investment management fees are generally computed as a percentage of assets under management ("AUM") and recognized as earned. Fees for providing investment advisory services are computed and billed in accordance with the provisions of the applicable investment management agreements. For the Company’s separately managed accounts, clients either pay investment management fees in advance, typically for a semi-annual or quarterly period, or in arrears, typically for a monthly or quarterly period. When investment management fees are paid in advance, the Company defers the revenue and recognizes it over the applicable period. When investment management fees are paid in arrears, the Company estimates revenues based on AUM market values as of the most recent month end date, and adjusts to actual when billed. For mutual funds and collective investment trust vehicles, the Company’s fees are calculated and earned daily based on AUM.
The Company has agreements with third parties who provide distribution and administrative services for its mutual funds, collective investment trusts and certain separately managed accounts. Third party agreements are evaluated against Financial Accounting Standards Board ("FASB") ASC 605-45 Revenue Recognition - Principal Agent Considerations to determine whether revenue should be reported gross or net of payments to third-party service providers. In management's judgment there are various indicators that support gross revenue reporting, the most notable being the Company acts as primary obligor and therefore principal service provider. Based on this evaluation, investment management service revenue is recorded gross of distribution and administrative fees paid to third parties.
Advisory Agreements
The Company derives significant revenue from its role as advisor to the Fund and the CIT.
The Company's investments in the Fund amounted to approximately $1.3 million as of March 31, 2016 and $1.2 million as of December 31, 2015.
Fees earned for advisory related services provided to the Fund and CIT investment vehicles were approximately $28.1 million and $45.2 million for the three months ended March 31, 2016 and 2015, respectively. These amounts represent greater than 10% of the Company's revenue in each respective period.
Recent Accounting Pronouncements
In May 2014, the FASB issued ASU 2014-09, Revenue from Contracts with Customers, which supersedes existing accounting standards for revenue recognition and creates a single framework. The new guidance will be effective on January 1, 2018 and requires either a retrospective or a modified retrospective approach to adoption. Early application is permitted. The Company is currently evaluating its transition method and the potential impact on its consolidated financial statements.
In January 2016, the FASB issued ASU 2016-01, Recognition and Measurement of Financial Assets and Financial Liabilities, which requires all equity investments to be measured at fair value with changes in the fair value recognized through net income. ASU 2016-01 will be effective on January 1, 2018 and will result in a cumulative-effect adjustment to the balance sheet upon adoption. The Company is currently evaluating the impact that ASU 2016-01 will have on its consolidated financial statements.
In February 2016, the FASB issued ASU 2016-02, Leases (Topic 842), which is intended to increase transparency and comparability among organizations by recognizing all lease transactions (with terms in excess of 12 months) on the balance sheet as a lease liability and a right-of-use asset (as defined). The new guidance will be effective for fiscal years beginning after December 15, 2018, with earlier application permitted. Upon adoption, the lessee will apply the new standard retrospectively to all periods presented or retrospectively using a cumulative effect adjustment in the year of adoption. The Company is currently evaluating the impact that ASU 2016-02 will have on its consolidated financial statements.
In March 2016, the FASB issued ASU 2016-09, Stock Compensation (Topic 718), which is intended to simplify several aspects of the accounting for share-based payment award transactions. The guidance will be effective for the fiscal year beginning after December 15, 2016, including interim periods within that year. Early application is permitted. The Company is currently evaluating the impact that ASU 2016-09 will have on its consolidated financial statements.
8
Manning & Napier, Inc.
Notes to Consolidated Financial Statements (Continued)
Note 3—Noncontrolling Interests
Manning & Napier holds an economic interest of approximately 16.7% in Manning & Napier Group, but as managing member controls all of the business and affairs of Manning & Napier Group. As a result, the Company consolidates the financial results of Manning & Napier Group and records a noncontrolling interest on its consolidated statement of financial condition with respect to the remaining approximately 83.3% aggregate economic interest in Manning & Napier Group held by M&N Group Holdings and MNCC. Net income attributable to noncontrolling interests on the statements of operations represents the portion of earnings attributable to the economic interest in Manning & Napier Group held by the noncontrolling interests.
The following provides a reconciliation from “Income before provision for income taxes” to “Net income attributable to Manning & Napier, Inc.”:
Three months ended March 31, | ||||||||
2016 | 2015 | |||||||
(in thousands) | ||||||||
Income before provision for income taxes | $ | 23,858 | $ | 38,590 | ||||
Less: loss before provision for income taxes of Manning & Napier, Inc. (a) | (17 | ) | (18 | ) | ||||
Income before provision for income taxes, as adjusted | 23,875 | 38,608 | ||||||
Controlling interest percentage (b) | 16.7 | % | 14.5 | % | ||||
Net income attributable to controlling interest | 3,979 | 5,614 | ||||||
Plus: loss before provision for income taxes of Manning & Napier, Inc. (a) | (17 | ) | (18 | ) | ||||
Income before income taxes attributable to Manning & Napier, Inc. | 3,962 | 5,596 | ||||||
Less: provision for income taxes of Manning & Napier, Inc. (c) | 1,544 | 2,287 | ||||||
Net income attributable to Manning & Napier, Inc. | $ | 2,418 | $ | 3,309 | ||||
a) | Manning & Napier, Inc. incurs certain gains or expenses that are only attributable to it and are therefore excluded from the net income attributable to noncontrolling interests. |
b) | Income before provision for income taxes is allocated to the controlling interest based on the percentage of units of Manning & Napier Group held by Manning & Napier, Inc. The amount represents the Company's weighted ownership of Manning & Napier Group for the respective periods. |
c) | The consolidated provision for income taxes is equal to the sum of (i) the provision for income taxes for entities other than Manning & Napier, Inc. and (ii) the provision for income taxes of Manning & Napier, Inc. which includes all U.S. federal and state income taxes. The consolidated provision for income taxes was $1.7 million and $2.5 million for the three months ended March 31, 2016 and 2015, respectively. |
A total of 67,896,484 units of Manning & Napier Group are held by the noncontrolling interests as of March 31, 2016. Pursuant to the terms of the exchange agreement entered into at the time of the Company's initial public offering, such units may be exchangeable for shares of the Company's Class A common stock. For any units exchanged, the Company will (i) pay an amount of cash equal to the number of units exchanged multiplied by the value of one share of the Company's Class A common stock less a market discount and expected expenses, or, at the Company's election, (ii) issue shares of the Company's Class A common stock on a one-for-one basis, subject to customary adjustments. As the Company receives units of Manning & Napier Group that are exchanged, the Company's ownership of Manning & Napier Group will increase.
Approximately 34.6 million Class A units of Manning & Napier Group are eligible for exchange in fiscal 2016, of which approximately 31.1 million are held by William Manning. In the event that William Manning maximizes his participation, the amount eligible would increase to approximately 35.5 million to allow for other owners to participate in a similar proportion.
At March 31, 2016 and December 31, 2015, the Company had recorded a liability of $42.0 million and $41.9 million, respectively, representing the estimated payments due to the selling unit holders under the tax receivable agreement ("TRA") entered into between Manning & Napier and the holders of Manning & Group. Of these amounts, $3.3 million were included in accrued expenses and other liabilities at March 31, 2016 and December 31, 2015. The Company made no payments pursuant to the TRA during the three months ended March 31, 2016 and 2015.
9
Manning & Napier, Inc.
Notes to Consolidated Financial Statements (Continued)
Obligations pursuant to the TRA are obligations of Manning & Napier. They do not impact the noncontrolling interests. These obligations are not income tax obligations. Furthermore, the TRA has no impact on the allocation of the provision for income taxes to the Company’s net income.
Note 4—Investment Securities
The following represents the Company’s investment securities holdings as of March 31, 2016 and December 31, 2015:
March 31, 2016 | ||||||||||||||||
Cost | Unrealized Gains | Unrealized Losses | Fair Value | |||||||||||||
(in thousands) | ||||||||||||||||
Available-for-sale securities | ||||||||||||||||
U.S. Treasury notes (0.35%, 10/31/2016) | $ | 2,105 | $ | — | $ | (3 | ) | $ | 2,102 | |||||||
Trading securities | ||||||||||||||||
Equity securities | 7,044 | |||||||||||||||
Fixed income securities | 7,864 | |||||||||||||||
Mutual funds | 273 | |||||||||||||||
Mutual funds - consolidated funds | 981 | |||||||||||||||
Hedge funds | 2,700 | |||||||||||||||
18,862 | ||||||||||||||||
Total investment securities | $ | 20,964 | ||||||||||||||
December 31, 2015 | ||||||||||||||||
Cost | Unrealized Gains | Unrealized Losses | Fair Value | |||||||||||||
(in thousands) | ||||||||||||||||
Available-for-sale securities | ||||||||||||||||
U.S. Treasury notes (0.35%, 10/31/2016) | $ | 2,105 | $ | — | $ | (6 | ) | $ | 2,099 | |||||||
Trading securities | ||||||||||||||||
Equity securities | 8,967 | |||||||||||||||
Fixed income securities | 7,624 | |||||||||||||||
Mutual funds | 116 | |||||||||||||||
Mutual funds - consolidated funds | 1,107 | |||||||||||||||
Hedge funds | 2,654 | |||||||||||||||
20,468 | ||||||||||||||||
Total investment securities | $ | 22,567 | ||||||||||||||
Investment securities are classified as either trading or available-for-sale and are carried at fair value. Fair value is determined based on quoted market prices in active markets for identical or similar instruments.
Investment securities classified as trading consist of equity securities, fixed income securities and investments in mutual funds and hedge funds for which the Company provides advisory services. At March 31, 2016 and December 31, 2015, trading securities consist solely of investments held by the Company to provide initial cash seeding for product development purposes. The Company recognized approximately $1.0 million and $0.2 million of net unrealized gains related to investments classified as trading during the three months ended March 31, 2016 and 2015, respectively.
Investment securities classified as available-for-sale consist of U.S. Treasury notes for compliance with certain regulatory requirements. As of March 31, 2016 and December 31, 2015, $0.6 million of these securities was considered restricted. The Company periodically reviews each individual security position that has an unrealized loss, or impairment, to determine if that impairment is other-than-temporary. No other-than-temporary impairment charges have been recognized by the Company during the three months ended March 31, 2016 and 2015.
Note 5—Derivative Instruments
10
Manning & Napier, Inc.
Notes to Consolidated Financial Statements (Continued)
The Company enters into futures contracts for product development purposes. Futures are commitments either to purchase or sell a designated financial instrument, currency, commodity or an index at a specified future date for a specified price and may be settled in cash or another financial asset. Upon entering into a futures contract, the Company is required to pledge to the broker an amount of cash, which is reported in due from broker within the consolidated statements of financial condition. Futures contracts have little credit risk because the counterparties are futures exchanges. The Company does not hold any derivatives in a formal hedge relationship under ASC 815-10, Derivatives and Hedging.
As of March 31, 2016, the Company had no open futures contracts. The following table presents the notional value and fair value as of December 31, 2015 for derivative instruments not designated as hedging instruments:
December 31, 2015 | ||||||||||||
Fair Value | ||||||||||||
Notional Value | Asset Derivative | Liability Derivative | ||||||||||
(in thousands) | ||||||||||||
Interest rate futures | $ | 124,470 | $ | 169 | $ | (112 | ) | |||||
Index futures | 3,715 | 57 | (47 | ) | ||||||||
Commodity futures | 2,440 | 27 | (30 | ) | ||||||||
Currency futures | 6,921 | 35 | (43 | ) | ||||||||
Total derivatives | $ | 137,546 | $ | 288 | $ | (232 | ) | |||||
As of December 31, 2015, the derivative assets and liabilities were included in due from broker in the consolidated statements of financial condition. Derivative activity concluded on February 4, 2016 with a year to date average volume of derivative activity (measured in terms of notional value) of approximately $127.8 million. The average notional volume of derivative activity for the three months ended March 31, 2015 was approximately $199.9 million. The following table presents the gains (losses) recognized in net gains (losses) on investments in the consolidated statements of operations for the three months ended March 31, 2016 and 2015:
Three months ended March 31, | ||||||||
2016 | 2015 | |||||||
(in thousands) | ||||||||
Interest rate futures | $ | 494 | $ | 118 | ||||
Index futures | (37 | ) | 71 | |||||
Commodity futures | (13 | ) | 20 | |||||
Currency futures | (102 | ) | 294 | |||||
Gains (losses) recognized, net | $ | 342 | $ | 503 | ||||
The Company discloses information about offsetting and related arrangements to enable users of its financial statements to understand the effect of those arrangements on its financial position in accordance with ASU 2011-11, Disclosures about Offsetting Assets and Liabilities. The derivatives instruments are subject to a master netting agreement allowing for the netting of assets and liabilities on the consolidated statements of financial position.
The following table presents the offsetting of managed futures as of March 31, 2016 and December 31, 2015:
Gross Amounts of Recognized Liabilities | Gross Amounts Offset in the Statement of Financial Position | Net Amounts of Assets (Liabilities) Presented in the Statement of Financial Position | Financial Instruments | Cash Collateral Received (Pledged) | Net Amount | |||||||||||||||||||
(in thousands) | ||||||||||||||||||||||||
March 31, 2016 | $ | — | $ | — | $ | — | $ | — | $ | — | $ | — | ||||||||||||
December 31, 2015 | $ | (232 | ) | $ | 288 | $ | 56 | $ | — | $ | — | $ | 56 | |||||||||||
Note 6—Fair Value Measurements
Fair value is defined as the price that the Company would receive upon selling an investment in an orderly transaction to an independent buyer in the principal or most advantageous market of the investment. A fair value hierarchy is provided that
11
Manning & Napier, Inc.
Notes to Consolidated Financial Statements (Continued)
gives the highest priority to unadjusted quoted prices in active markets for identical assets and liabilities (Level 1) and the lowest priority to unobservable inputs (Level 3).
The following three-tier fair value hierarchy prioritizes the inputs used in measuring fair value:
•Level 1—observable inputs such as quoted prices in active markets for identical securities;
• | Level 2—other significant observable inputs (including but not limited to quoted prices for similar securities, interest rates, prepayment rates, credit risk, etc.); and |
• | Level 3—significant unobservable inputs (including the Company’s own assumptions in determining the fair value of investments). |
The following provides the hierarchy of inputs used to derive the fair value of the Company’s financial instruments as of March 31, 2016 and December 31, 2015:
March 31, 2016 | ||||||||||||||||
Level 1 | Level 2 | Level 3 | Totals | |||||||||||||
(in thousands) | ||||||||||||||||
Equity securities | $ | 7,044 | $ | — | $ | — | $ | 7,044 | ||||||||
Fixed income securities | 1,086 | 6,778 | — | 7,864 | ||||||||||||
Mutual funds | 273 | — | — | 273 | ||||||||||||
Mutual funds - consolidated funds | 981 | — | — | 981 | ||||||||||||
U.S. Treasury notes | — | 2,102 | — | 2,102 | ||||||||||||
Total assets at fair value | $ | 9,384 | $ | 8,880 | $ | — | $ | 18,264 | ||||||||
December 31, 2015 | ||||||||||||||||
Level 1 | Level 2 | Level 3 | Totals | |||||||||||||
(in thousands) | ||||||||||||||||
Equity securities | $ | 8,967 | $ | — | $ | — | $ | 8,967 | ||||||||
Fixed income securities | 1,008 | 6,616 | — | 7,624 | ||||||||||||
Mutual funds | 116 | — | — | 116 | ||||||||||||
Mutual funds - consolidated funds | 1,107 | — | — | 1,107 | ||||||||||||
U.S. Treasury notes | — | 2,099 | — | 2,099 | ||||||||||||
Derivatives | 288 | — | — | 288 | ||||||||||||
Total assets at fair value | $ | 11,486 | $ | 8,715 | $ | — | $ | 20,201 | ||||||||
Derivatives | 232 | — | — | 232 | ||||||||||||
Total liabilities at fair value | $ | 232 | $ | — | $ | — | $ | 232 | ||||||||
Valuations of investments in fixed income securities and U.S. Treasury notes can generally be obtained through independent pricing services. For most bond types, the pricing service utilizes matrix pricing, which considers one or more of the following factors: yield or price of bonds of comparable quality, coupon, maturity, current cash flows, type and current day trade information, as well as dealer supplied prices. These valuations are categorized as Level 2 in the hierarchy.
Certain hedge fund investments that are measured at fair value using the net asset value per share have not been categorized in the fair value hierarchy. The net asset values have been derived from the fair values of underlying futures contracts as of the respective reporting dates. As of March 31, 2016 and December 31, 2015 the fair value of these investments were $2.7 million.
There were no Level 3 securities held by the Company at March 31, 2016 or December 31, 2015.
The Company’s policy is to recognize transfers in and transfers out of the valuation levels as of the beginning of the reporting period. There were no transfers between Levels during the three months ended March 31, 2016.
12
Manning & Napier, Inc.
Notes to Consolidated Financial Statements (Continued)
Note 7—Accrued Expenses and Other Liabilities
Accrued expenses and other liabilities as of March 31, 2016 and December 31, 2015 consisted of the following:
March 31, 2016 | December 31, 2015 | |||||||
(in thousands) | ||||||||
Accrued bonus and sales commissions | $ | 11,688 | $ | 22,584 | ||||
Accrued payroll and benefits | 2,298 | 2,844 | ||||||
Accrued sub-transfer agent fees | 4,749 | 6,148 | ||||||
Dividends payable | 2,358 | 2,361 | ||||||
Amounts payable under tax receivable agreement | 3,278 | 3,278 | ||||||
Other accruals and liabilities | 3,629 | 5,265 | ||||||
$ | 28,000 | $ | 42,480 | |||||
Note 8—Borrowings
Revolving Credit Facility
On April 23, 2015, Manning & Napier, Inc., Manning & Napier Group and MNA (collectively, the "Borrowers") entered into an unsecured revolving credit agreement (the "Credit Agreement") with Wells Fargo Bank, National Association, as administrative agent, lender, swingline lender and issuing bank, Manufacturers and Traders Trust Company, as syndication agent and lender, and First Niagara Bank, The Bank of New York Mellon, and The Huntington National Bank, as lenders (collectively, the "Lenders") that has a four-year term (until April 23, 2019) and provides borrowing capacity of up to $100.0 million, with a feature providing for an increase in the line to $150.0 million on approval by the Lenders. The Credit Agreement also provides for a $5.0 million sub-limit for the issuance of standby letters of credit and a $5.0 million swingline facility. At March 31, 2016, there were no amounts outstanding under the Credit Agreement and the Company had the capacity to draw on the entire $100.0 million under the Credit Agreement.
Amounts outstanding under the Credit Agreement bear interest at an annual rate equal to, at the Company's option, either LIBOR (adjusted for reserves and not below 0.0%) for interest periods of one, two, three or six months or a base rate (as defined in the Credit Agreement), plus, in each case, an applicable margin. The applicable margins range from 1.50% to 2.50% in the case of LIBOR-based loans, and 0.50% to 1.50% in the case of base rate loans. Under the terms of the Credit Agreement, the Company is also required to pay certain fees, including among other things a one-time initial commitment fee, and a quarterly fee based on the average unused amount of the facility ranging from 0.25% to 0.45%.
The Credit Agreement contains customary covenants, including covenants that restrict (subject in certain instances to minimum thresholds or exceptions) the ability of the Company and certain of its subsidiaries to incur additional indebtedness, create liens, merge, dispose of assets, and make distributions, dividends, investments or capital expenditures, among other things. In addition, the Credit Agreement contains certain financial covenants, including: (i) a minimum interest coverage ratio (generally, adjusted EBITDA to interest expense as defined in and for the period specified in the Credit Agreement) of at least 4.00:1.00 and (ii) a leverage ratio (generally, total debt as of any date to adjusted EBITDA as defined in and for the period specified in the Credit Agreement) of no greater than 2.75:1.00. For purposes of the Credit Agreement, adjusted EBITDA generally means, for any period, net income of the Company before interest expense, income taxes, depreciation and amortization expense, non-cash stock-based compensation expense, and certain non-cash nonrecurring gains and losses as described in and specified under the Credit Agreement. At March 31, 2016, the Company was in compliance with all financial covenants under the Credit Agreement.
The Credit Agreement also contains customary provisions regarding events of default which could result in an acceleration of amounts due under the facility. Such events of default include the Company's failure to pay principal or interest when due, the Company's failure to satisfy or comply with covenants and a change of control.
Note 9—Commitments and Contingencies
The Company may from time to time enter into agreements that contain certain representations and warranties and which provide general indemnifications. The Company may also serve as a guarantor of such obligations of one or more of the Manning & Napier Group entities. The Company’s maximum exposure under these arrangements is unknown, as this would involve future claims that may be made against the Company that have not yet occurred. The Company expects any risk of liability associated with such guarantees to be remote.
13
Manning & Napier, Inc.
Notes to Consolidated Financial Statements (Continued)
Regulation
As an investment adviser to a variety of investment products, the Company and its affiliated broker-dealer are subject to routine reviews and inspections by the SEC, Financial Industry Regulatory Authority, Inc., National Futures Association and U.S. Commodity Futures Trading Commission. From time to time, the Company may also be subject to claims, be involved in various legal proceedings arising in the ordinary course of its business and be subject to other contingencies. The Company does not believe that the outcome of any of these reviews, inspections or other legal proceedings will have a material impact on its consolidated financial statements; however, litigation is subject to many uncertainties, and the outcome of individual litigated matters is difficult to predict. The Company will establish accruals for matters that are probable, can be reasonably estimated, and may take into account any related insurance recoveries to the extent of such recoveries. As of March 31, 2016 and December 31, 2015, the Company has not accrued for any such claims, legal proceedings, or other contingencies.
Note 10—Earnings per Common Share
Basic earnings per share (“basic EPS”) is computed using the two-class method to determine net income available to Class A common stock. The two-class method includes an earnings allocation formula that determines earnings per share for each participating security according to dividends declared and undistributed earnings for the period. The Company's restricted Class A common shares granted under the 2011 Equity Compensation Plan (the "Equity Plan") have non-forfeitable dividend rights during their vesting period and are therefore considered participating securities under the two-class method. Under the two-class method, the Company's net income available to Class A common stock is reduced by the amount allocated to the unvested restricted Class A common stock. Basic EPS is calculated by dividing net income available to Class A common stock by the weighted average number of common shares outstanding during the period.
Diluted earnings per share (“diluted EPS”) is computed under the more dilutive of either the treasury method or the two-class method. For the diluted calculation, the weighted average number of common shares outstanding during the period is increased by the assumed conversion into Class A common stock of the unvested equity awards and the exchangeable units of Manning & Napier Group, to the extent that such conversion would dilute earnings per share.
The following is a reconciliation of the income and share data used in the basic and diluted earnings per share computations for the three months ended March 31, 2016 and 2015 under the two-class method:
Three months ended March 31, | ||||||||
2016 | 2015 | |||||||
(in thousands, except share data) | ||||||||
Net income attributable to controlling and noncontrolling interests | $ | 22,184 | $ | 36,111 | ||||
Less: net income attributable to noncontrolling interests | 19,766 | 32,802 | ||||||
Net income attributable to Manning & Napier, Inc. | $ | 2,418 | $ | 3,309 | ||||
Less: allocation to participating securities | 162 | — | ||||||
Net income available to Class A common stock | $ | 2,256 | $ | 3,309 | ||||
Weighted average shares of Class A common stock outstanding - basic | 13,745,130 | 13,713,540 | ||||||
Dilutive effect from unvested equity awards | 339,773 | 201,368 | ||||||
Weighted average shares of Class A common stock outstanding - diluted | 14,084,903 | 13,914,908 | ||||||
Net income available to Class A common stock per share - basic | $ | 0.16 | $ | 0.24 | ||||
Net income available to Class A common stock per share - diluted | $ | 0.16 | $ | 0.24 | ||||
The Company’s Class B common stock represent voting interests and do not participate in the earnings of the Company. Accordingly, there is no basic or diluted EPS related to the Company’s Class B common stock.
For the three months ended March 31, 2016, 990,000 unvested restricted Class A common shares and 20,000 restricted stock units were excluded from the calculation of diluted earnings per common share because the effect would have been anti-dilutive. For the three months ended March 31, 2016 and 2015, 120,919 and 181,378, respectively, restricted stock units with performance conditions were excluded from the calculation of diluted earnings per common share because the performance conditions had not yet been satisfied.
At March 31, 2016 and 2015 there were 67,896,484 Class A Units of Manning & Napier Group outstanding which, subject to certain restrictions, may be exchangeable for up to an equivalent number of the Company's Class A common stock. These units were not included in the calculation of diluted earnings per common share for the three months ended March 31, 2016 and 2015 because the effect would have been anti-dilutive.
14
Manning & Napier, Inc.
Notes to Consolidated Financial Statements (Continued)
Note 11—Equity Based Compensation
The Equity Plan was adopted by the Company's board of directors and approved by the Company's stockholders prior to the consummation of the IPO. A total of 13,142,813 equity interests are authorized for issuance. The equity interests may be issued in the form of the Company's Class A common stock, restricted stock units, units of Manning & Napier Group, or certain classes of membership interests in the Company which may convert into units of Manning & Napier Group.
The following table summarizes the equity award activity for the three months ended March 31, 2016 under the Company's Equity Plan:
Restricted Stock Awards | Weighted Average Grant Date Fair Value | ||||||
Stock awards outstanding at January 1, 2016 | 2,031,629 | $ | 12.92 | ||||
Granted | — | $ | — | ||||
Vested | — | $ | — | ||||
Forfeited | (30,115 | ) | $ | 13.06 | |||
Stock awards outstanding at March 31, 2016 | 2,001,514 | $ | 12.91 | ||||
For the three months ended March 31, 2016 and 2015, the Company recorded approximately $1.3 million and $0.6 million, respectively, of compensation expense related to awards under the Equity Plan. As of March 31, 2016, there was unrecognized compensation expense related to Equity Plan awards of approximately $14.8 million, which the Company expects to recognize over a weighted average period of approximately 3.9 years.
Note 12—Income Taxes
The Company is comprised of entities that have elected to be treated as either a limited liability company ("LLC") or a “C-Corporation". As such, the entities functioning as LLC’s are not liable for or able to benefit from U.S. federal and most state income taxes on their earnings, and earnings (losses) will be included in the personal income tax returns of each entity’s unit holders. The entities functioning as C-Corporations are liable for or able to benefit from U.S. federal and state and local income taxes on their earnings and losses, respectively.
The Company’s income tax provision and effective tax rate were as follows:
Three months ended March 31, | ||||||||
2016 | 2015 | |||||||
(in thousands) | ||||||||
Earnings from continuing operations before income taxes | $ | 23,858 | $ | 38,590 | ||||
Effective tax rate | 7.0 | % | 6.4 | % | ||||
Provision for income taxes | 1,674 | 2,479 | ||||||
Provision for income taxes @ 35% | 8,350 | 13,507 | ||||||
Difference between tax at effective vs. statutory rate | $ | (6,676 | ) | $ | (11,028 | ) | ||
For the three months ended March 31, 2016 and 2015, the difference between the Company’s recorded provision and the provision that would result from applying the U.S. statutory rate of 35% is primarily attributable to the benefit resulting from the fact that a significant portion of the Company’s operations include a series of flow-through entities which are generally not subject to federal and most state income taxes. Accordingly, a portion of the Company’s earnings are not subject to corporate level taxes.
Note 13—Related Party Transactions
Transactions with noncontrolling members
From time to time, the Company may be asked to provide certain services, including accounting, legal and other administrative functions for the noncontrolling members of Manning & Napier Group. While immaterial, the Company has not received any reimbursement for such services.
The Company manages the personal funds of certain of the Company's executive officers, including William Manning. Pursuant to the respective investment management agreements, in some instances the Company waives or reduces its regular advisory fees for these accounts and personal funds utilized to incubate products. The aggregate value of the fees earned and fees waived was less than $0.1 million for the three months ended March 31, 2016.
Affiliate transactions - Manning & Napier Fund, Inc.
15
Manning & Napier, Inc.
Notes to Consolidated Financial Statements (Continued)
The Company has agreements to serve as the investment manager of Manning & Napier Fund, Inc., with which certain of its officers are affiliated. Under the terms of these agreements, which are generally reviewed and continued by the board of directors of Manning & Napier Fund, Inc. annually, the Company receives a fee based on an annual percentage of the average daily net assets of each series within the Manning & Napier Fund, Inc. The Company has contractually agreed to limit its fees and reimburse expenses to limit operating expenses incurred by certain of Manning & Napier Fund, Inc. series.
Note 14—Subsequent Events
Distributions and dividends
On April 26, 2016, the Board of Directors approved a distribution from Manning & Napier Group to Manning & Napier and the noncontrolling interests of Manning & Napier Group. The amount of the distribution to the members of Manning & Napier Group is approximately $12.5 million, of which approximately $10.4 million is expected to be payable to the noncontrolling interests. Concurrently, the Board of Directors declared a $0.16 per share dividend to the holders of Class A common stock. The dividend is payable on or about August 1, 2016 to shareholders of record as of July 15, 2016.
Exchange of Class A units of Manning & Napier Group
Pursuant to the terms of the exchange agreement entered into at the time of the Company's initial public offering, M&N Group Holdings and MNCC exchanged a total of 2,111,913 Class A units of Manning & Napier Group on April 27, 2016 for approximately $16.1 million in cash. Subsequent to the exchange, the Class A units were retired.
Acquisition of Rainier Investment Management, LLC
On April 30, 2016, the Company acquired a majority interest in Rainier Investment Management, LLC ("Rainier”), an active investment management firm. Rainier specializes in capitalization-based U.S. and non-U.S. equity strategies and fixed income products, is headquartered in Seattle, Washington, and had approximately $3.0 billion in assets under management at the closing of the transaction. Under the terms of the transaction, the Company acquired a 75% ownership interest in Rainier, with the remaining 25% ownership maintained by key professionals at Rainier. The consideration transferred includes an upfront cash payment on the transaction closing date of approximately $13.0 million from cash on hand, with additional payments of up to $32.5 million over a four year period, which are contingent upon Rainier’s achievement of certain annual financial targets.
The Company will account for the transaction as a business combination and apply the acquisition method under generally accepted accounting principles. Due to the limited time since the transaction closing date, an initial allocation of the purchase price based upon the respective fair values of the assets acquired and liabilities assumed as part of the transaction, including the fair value of the contingent consideration liability, is not practicable as of the issuance date of these financial statements.
16
Item 2. Management’s Discussion and Analysis of Financial Condition and Results of Operations.
This report contains forward-looking statements within the meaning of section 27A of the Securities Act of 1933 and Section 21E of the Securities Exchange Act of 1934, which reflect our views with respect to, among other things, our operations and financial performance. Words like "believes," "expects," "may," "estimates," "will," "should," "could," "intends," "likely," "plans," or "anticipates" or the negative thereof or other variations thereon or comparable terminology, are used to identify forward-looking statements, although not all forward-looking statements contain these words. Although we believe that we are basing our expectations and beliefs on reasonable assumptions within the bounds of what we currently know about our business and operations, there can be no assurance that our actual results will not differ materially from what we expect or believe. Some of the factors that could cause our actual results to differ materially from our expectations or beliefs are disclosed in the “Risk Factors” section, as well as other sections, of our Annual Report on Form 10-K which include, without limitation: changes in securities or financial markets or general economic conditions; a decline in the performance of our products; client sales and redemption activity; any loss of an executive officer or key personnel; changes in our business related to strategic acquisitions and other transactions; and changes of government policy or regulations. All forward-looking statements speak only as of the date on which they are made and we undertake no duty to update or revise any forward-looking statements, whether as a result of new information, future events or otherwise.
Overview
Business
We are an independent investment management firm that provides a broad range of investment solutions, as well as a variety of consultative services that complement our investment process. Founded in 1970, we offer equity, fixed income, and alternative strategies, as well as a range of blended asset portfolios, such as life cycle funds. We serve a diversified client base of high net worth individuals and institutions, including 401(k) plans, pension plans, Taft-Hartley plans, endowments and foundations. Our operations are based principally in the United States, with our headquarters located in Fairport, New York.
Our Products
We derive substantially all of our revenues from investment management fees earned from providing advisory services to separately managed accounts and mutual funds and collective investment trusts—including those offered by the Manning & Napier Fund, Inc. (the "Fund") and Exeter Trust Company.
Our separate accounts are primarily distributed through our Direct Channel, where our representatives form relationships with high net worth individuals, middle market institutions or large institutions that are working with a consultant. To a lesser extent, we also obtain a portion of our separate account distribution via third parties, either through our Intermediary Channel where national brokerage firm representatives or independent financial advisors select our separate account strategies for their clients, or through our Platform/Sub-Advisory Channel, where unaffiliated registered investment advisors approve our strategies for their product platforms. Our separate account products are a primary driver of our blended asset portfolios for high net worth and middle market institutional clients and financial intermediaries. In contrast, larger institutions and unaffiliated registered investment advisor platforms are a driver of our separate account equity portfolios.
Our mutual funds and collective investment trusts are distributed through financial intermediaries, including brokers, financial advisors, retirement plan advisors and platform relationships. We also obtain our mutual fund and collective investment trust distribution through our direct sales representatives, in particular within the defined contribution and institutional marketplace. Our mutual fund and collective investment trust products are an important driver of our blended asset class portfolios, in particular with 401(k) plan sponsors, advisors and recordkeepers that select our funds as default options for participants. In addition, financial intermediaries, mutual fund advisory programs and retail platforms are a driver of equity strategies within our mutual fund offerings.
Our assets under management (“AUM”) was $34.7 billion as of March 31, 2016. The composition of our AUM by vehicle and portfolio is illustrated in the table below.
March 31, 2016 | ||||||||||||||||
AUM - by investment vehicle and portfolio | Blended Asset | Equity | Fixed Income | Total | ||||||||||||
(in millions) | ||||||||||||||||
Separately managed accounts | $ | 11,659.6 | $ | 7,514.7 | $ | 1,114.9 | $ | 20,289.2 | ||||||||
Mutual funds and collective investment trusts | 10,376.6 | 3,957.5 | 73.1 | 14,407.2 | ||||||||||||
Total | $ | 22,036.2 | $ | 11,472.2 | $ | 1,188.0 | $ | 34,696.4 | ||||||||
17
The composition of our separately managed accounts as of March 31, 2016, by channel and portfolio, is set forth in the table below.
March 31, 2016 | ||||||||||||||||
Blended Asset | Equity | Fixed Income | Total | |||||||||||||
(dollars in millions) | ||||||||||||||||
Separate account AUM | ||||||||||||||||
Direct Channel | $ | 8,475.2 | $ | 5,543.0 | $ | 988.3 | $ | 15,006.5 | ||||||||
Intermediary Channel | 3,180.1 | 705.9 | 123.6 | 4,009.6 | ||||||||||||
Platform/Sub-advisor Channel | 4.3 | 1,265.8 | 3.0 | 1,273.1 | ||||||||||||
Total | $ | 11,659.6 | $ | 7,514.7 | $ | 1,114.9 | $ | 20,289.2 | ||||||||
Percentage of separate account AUM | ||||||||||||||||
Direct Channel | 42 | % | 27 | % | 5 | % | 74 | % | ||||||||
Intermediary Channel | 16 | % | 3 | % | 1 | % | 20 | % | ||||||||
Platform/Sub-advisor Channel | 0 | % | 6 | % | 0 | % | 6 | % | ||||||||
Total | 58 | % | 36 | % | 6 | % | 100 | % | ||||||||
Percentage of portfolio by channel | ||||||||||||||||
Direct Channel | 73 | % | 74 | % | 89 | % | 74 | % | ||||||||
Intermediary Channel | 27 | % | 9 | % | 11 | % | 20 | % | ||||||||
Platform/Sub-advisor Channel | 0 | % | 17 | % | 0 | % | 6 | % | ||||||||
Total | 100 | % | 100 | % | 100 | % | 100 | % | ||||||||
Percentage of channel by portfolio | ||||||||||||||||
Direct Channel | 56 | % | 37 | % | 7 | % | 100 | % | ||||||||
Intermediary Channel | 79 | % | 18 | % | 3 | % | 100 | % | ||||||||
Platform/Sub-advisor Channel | 0 | % | 100 | % | 0 | % | 100 | % | ||||||||
Our separate accounts contributed 28% of our total gross client inflows for the three months ended March 31, 2016 and represented 58% of our total AUM as of March 31, 2016.
Our separate account business has historically been driven primarily by our Direct Channel, where sales representatives form a relationship with high net worth investors, middle market institutions, and large institutional clients working in conjunction with a consultant. The Direct Channel contributed 62% of the total gross client inflows for our separate account business for the three months ended March 31, 2016 and represented 74% of our total separate account AUM as of March 31, 2016. We anticipate the Direct Channel to continue to be the largest driver of new separate account business going forward, given the Direct Channel’s high net worth and middle market institutional client-type focus.
During the three months ended March 31, 2016, blended asset portfolios represented 62% of the separate account gross client inflows from the Direct Channel, while equity and fixed income portfolios each accounted for 19%. As of March 31, 2016, blended asset and equity portfolios represented 56% and 37%, respectively, of total Direct Channel separate account AUM, while our fixed income portfolios were 7%. We expect our focus on individuals and middle market institutions to continue to drive interest in our blended asset class portfolios, where we provide a comprehensive portfolio of stocks and bonds managed to a client’s specific investment objectives. Our relationships with larger institutions may also be a driver of growth in separately managed account equity strategies, though many of these larger institutions may seek exposure to non-U.S. equity strategies through commingled vehicles rather than separately managed accounts to limit related custody expenses.
To a lesser extent, we also obtain separate account business from third parties, including financial advisors or unaffiliated registered investment advisor programs or platforms. During the three months ended March 31, 2016, 16% of the total gross client inflows for separate accounts came from financial advisor representatives (Intermediary Channel), and an additional 22% came from registered investment advisor platforms (Platform/Sub-advisor Channel). The Intermediary and Platform/Sub-advisor Channels represented 26% of our total separate account AUM as of March 31, 2016.
New separate account business through the Intermediary Channel flowed into both our blended asset and equity portfolios, driven by advisors’ needs to identify either a one-stop solution (blended asset portfolio) or to fill a mandate within a multi-strategy portfolio. During the three months ended March 31, 2016, blended asset and equity portfolios represented 68% and 23%, respectively, of the separate account gross client inflows from the Intermediary Channel, while fixed income portfolios represented 9%. As of March 31, 2016, 79% of our separate account AUM derived from financial advisors was
18
allocated to blended asset portfolios, with 18% allocated to equity and 3% allocated to fixed income. We expect that equity and fixed income portfolios may see additional interest from financial advisors over time as more and more advisors structure a multi-strategy portfolio for their clients.
In contrast, gross client inflows through the Platform/Sub-advisor Channel are primarily directed to our equity strategies, where we are filling a specific mandate within the investment program or platform product. During the three months ended March 31, 2016, 100% of our separate account gross client inflows from the Platform/Sub-advisory Channel were into equity portfolios.
Our annualized separate account retention rate across all channels was approximately 90% during the three months ended March 31, 2016, representing the strong relationship focus that is inherent in our direct sales model, which is the primary driver of our separate account business.
The composition of our mutual fund and collective investment trust AUM as of March 31, 2016, by portfolio, is set forth in the table below.
March 31, 2016 | ||||||||||||||||
Blended Asset | Equity | Fixed Income | Total | |||||||||||||
(in millions) | ||||||||||||||||
Mutual fund and collective investment trust AUM | $ | 10,376.6 | $ | 3,957.5 | $ | 73.1 | $ | 14,407.2 | ||||||||
Our mutual funds and collective investment trusts contributed 72% of our total gross client inflows for the three months ended March 31, 2016 and represented 42% of our total AUM as of March 31, 2016. As of March 31, 2016, our mutual fund and collective investment trust AUM consisted of 72% from blended asset portfolios and 27% from equity portfolios. During the three months ended March 31, 2016, 82% and 16% of the gross client inflows were attributable to blended assets and equity portfolios, respectively.
Our mutual fund and collective investment trust business is driven by financial intermediaries and to a lesser extent, our direct sales representatives. Intermediary distribution of our mutual fund and collective investment trust vehicles is achieved via financial advisors, brokers and retirement plan advisors. Through our Intermediary Channel, we are focused on our blended asset life cycle fund vehicles given our emphasis on advisors who work with retirement plans. Our blended asset portfolios are also used by advisors seeking a multi-asset class solution for their retail clients. In addition, we are focused on equity and fixed income portfolios within the Intermediary Channel for intermediaries who wish to use our mutual funds as a component of a larger portfolio.
Through our Platform/Sub-advisor Channel, we have relationships with consultants and manager research teams at platforms. We are focused on equity and fixed income portfolio assets in this channel through the selection of our funds within advisory programs, or through placement on platforms’ approved lists of funds. To facilitate our relationships with intermediaries, we currently have more than 290 dealer relationships. These relationships are important to our retail business as well as our 401(k) life cycle and institutional business.
Our Direct Sales Representatives distribute our equity portfolios to large institutional clients with which we have direct relationships and often, the client’s consultant. Through the Direct Channel, we also form relationships with middle market and large market defined contribution plan sponsors seeking to use our life cycle mutual funds and collective investment trusts as default options on their investment menu. We expect this channel to be focused on distributing blended asset and equity portfolio funds in the future.
Recent Developments
On April 30, 2016, we acquired a majority interest in Rainier Investment Management, LLC ("Rainier"), an active investment management firm with approximately $3.0 billion in assets under management at the closing of the transaction. Under the transaction terms of the purchase agreement, entered into in December 2015, the Company acquired a 75% ownership interest in Rainier for total consideration of up to $45.5 million, consisting of an upfront cash payment on the transaction closing date of $13.0 million from cash on hand, with additional payments of up to $32.5 million over a four-year period, which are contingent upon Rainier's achievement of certain annual financial targets. The remaining 25% ownership in Rainier has been maintained by key professionals at Rainier.
Results of Operations
Below is a discussion of our consolidated results of operations for the three months ended March 31, 2016 and 2015.
19
Key Components of Results of Operations
Overview
Changes to our operating results over time are largely driven by net client asset flows and changes to the market value of our AUM. The line item "market appreciation/(depreciation) and other" within our AUM tables throughout "Management's Discussion and Analysis of Financial Condition and Results of Operations" includes investment gains/(losses) on AUM, net flows from non-sales related activities including asset acquisitions and net reinvested dividends.
An important factor influencing inflows and outflows of our AUM is the investment performance of our various investment approaches. Our variety of stock selection strategies, absolute pricing discipline and active asset allocation management approach generally results in specific absolute and relative return characteristics in different market environments. For example, during a fundamental-driven bull market when prices are rising alongside improving fundamentals, we are likely to experience positive absolute returns and competitive relative returns. However, in a more momentum-driven bull market, when prices become disconnected from underlying fundamentals, or narrow market environment where a small handful of stocks outperform the average stock, we are likely to experience positive absolute returns but lagging relative returns. Similarly, during a valuation-driven bear market, when markets experience a period of price correction following a momentum-driven bull market, we are likely to experience negative absolute returns but strong relative returns. However, in a momentum-driven bear market, which is typically characterized by broad price declines in a highly correlated market, we are likely to experience negative absolute returns and potentially lagging relative returns. Essentially, our approach is likely to do well when markets are driven by fundamentals, but lag when markets are driven primarily by momentum.
Other components impacting our operating results include:
• | asset-based fee rates and changes in those rates; |
• | the composition of our AUM among various portfolios, vehicles and client types; |
• | changes in our variable costs, including incentive compensation and distribution, servicing and custody expenses, which are affected by our investment performance, level of our AUM and revenue; and |
• | fixed costs, including changes to base compensation, vendor-related costs and investment spending on new products. |
Assets Under Management and Investment Performance
The following tables reflect the indicated components of our AUM for our investment vehicles for the three months ended March 31, 2016 and 2015.
Separately managed accounts | Mutual funds and collective investment trusts | Total | Separately managed accounts | Mutual funds and collective investment trusts | Total | ||||||||||||||||
(in millions) | |||||||||||||||||||||
As of December 31, 2015 | $ | 20,735.4 | $ | 14,706.8 | $ | 35,442.2 | 59 | % | 41 | % | 100 | % | |||||||||
Gross client inflows | 384.8 | 968.1 | 1,352.9 | ||||||||||||||||||
Gross client outflows | (1,187.4 | ) | (1,542.2 | ) | (2,729.6 | ) | |||||||||||||||
Market appreciation/(depreciation) & other | 356.4 | 274.5 | 630.9 | ||||||||||||||||||
As of March 31, 2016 | $ | 20,289.2 | $ | 14,407.2 | $ | 34,696.4 | 58 | % | 42 | % | 100 | % | |||||||||
Average AUM for period | $ | 20,242.1 | $ | 14,014.8 | $ | 34,256.9 | |||||||||||||||
As of December 31, 2014 | $ | 25,408.7 | $ | 22,392.9 | $ | 47,801.6 | 53 | % | 47 | % | 100 | % | |||||||||
Gross client inflows | 691.4 | 1,275.9 | 1,967.3 | ||||||||||||||||||
Gross client outflows | (1,140.4 | ) | (3,434.7 | ) | (4,575.1 | ) | |||||||||||||||
Market appreciation/(depreciation) & other | 191.9 | 235.3 | 427.2 | ||||||||||||||||||
As of March 31, 2015 | $ | 25,151.6 | $ | 20,469.4 | $ | 45,621.0 | 55 | % | 45 | % | 100 | % | |||||||||
Average AUM for period | $ | 25,430.0 | $ | 21,675.7 | $ | 47,105.7 | |||||||||||||||
20
The following tables reflect the indicated components of our AUM for our portfolios for the three months ended March 31, 2016 and 2015.
Blended Asset | Equity | Fixed Income | Total | Blended Asset | Equity | Fixed Income | Total | |||||||||||||||||||||
(in millions) | ||||||||||||||||||||||||||||
As of December 31, 2015 | $ | 22,442.4 | $ | 11,828.4 | $ | 1,171.4 | $ | 35,442.2 | 64 | % | 33 | % | 3 | % | 100 | % | ||||||||||||
Gross client inflows | 938.8 | 346.1 | 68.0 | 1,352.9 | ||||||||||||||||||||||||
Gross client outflows | (1,655.5 | ) | (998.8 | ) | (75.3 | ) | (2,729.6 | ) | ||||||||||||||||||||
Market appreciation/(depreciation) & other | 310.5 | 296.5 | 23.9 | 630.9 | ||||||||||||||||||||||||
As of March 31, 2016 | $ | 22,036.2 | $ | 11,472.2 | $ | 1,188.0 | $ | 34,696.4 | 64 | % | 33 | % | 3 | % | 100 | % | ||||||||||||
Average AUM for period | $ | 21,796.8 | $ | 11,279.8 | $ | 1,180.3 | $ | 34,256.9 | ||||||||||||||||||||
As of December 31, 2014 | $ | 25,279.0 | $ | 21,284.1 | $ | 1,238.5 | $ | 47,801.6 | 53 | % | 44 | % | 3 | % | 100 | % | ||||||||||||
Gross client inflows | 1,308.6 | 606.1 | 52.6 | 1,967.3 | ||||||||||||||||||||||||
Gross client outflows | (1,312.2 | ) | (3,213.2 | ) | (49.7 | ) | (4,575.1 | ) | ||||||||||||||||||||
Market appreciation/(depreciation) & other | 138.0 | 280.4 | 8.8 | 427.2 | ||||||||||||||||||||||||
As of March 31, 2015 | $ | 25,413.4 | $ | 18,957.4 | $ | 1,250.2 | $ | 45,621.0 | 55 | % | 42 | % | 3 | % | 100 | % | ||||||||||||
Average AUM for period | $ | 25,374.6 | $ | 20,481.5 | $ | 1,249.6 | $ | 47,105.7 | ||||||||||||||||||||
21
The following table summarizes the annualized returns for our key investment strategies and the relative performance of the industry benchmark over the periods indicated. Since inception and over long-term periods, these strategies have earned attractive returns on both an absolute and relative basis. These strategies are used across separate account, mutual fund and collective investment trust vehicles, and represent approximately 79% of our AUM as of March 31, 2016.
Key Strategies | AUM as of March 31, 2016 (in millions) | Inception Date | Annualized Returns as of March 31, 2016 (3) | |||||||||||||
One Year | Three Year | Five Year | Ten Year | Market Cycle (1) | Inception | |||||||||||
Long-Term Growth 30%-80% Equity Exposure | $ | 9,748.8 | 1/1/1973 | (2.7)% | 4.4% | 5.5% | 5.2% | 6.2% | 9.6% | |||||||
Blended Benchmark: 55% S&P 500 Total Return / 45% Barclays Government/Credit Bond | 2.0% | 7.7% | 8.4% | 6.4% | 5.0% | 9.2% | ||||||||||
Growth with Reduced Volatility 20%-60% Equity Exposure | $ | 4,502.1 | 1/1/1973 | (2.0)% | 3.5% | 4.6% | 4.8% | 5.8% | 8.9% | |||||||
Blended Benchmark: 40% S&P 500 Total Return / 60% Barclays Government/Credit Bond | 2.0% | 6.3% | 7.2% | 6.1% | 5.2% | 8.8% | ||||||||||
Aggregate Fixed Income | $ | 515.6 | 1/1/1984 | 2.4% | 2.1% | 3.6% | 4.9% | 5.2% | 7.6% | |||||||
Benchmark: Barclays U.S. Aggregate Bond | 2.0% | 2.5% | 3.8% | 4.9% | 5.4% | 7.5% | ||||||||||
Equity-Oriented | $ | 2,960.9 | 1/1/1993 | (3.9)% | 5.7% | 5.9% | 5.2% | 6.4% | 9.7% | |||||||
Blended Benchmark: 65% Russell 3000® / 20% ACWIxUS / 15% Barclays U.S. Aggregate Bond | (1.7)% | 7.7% | 7.9% | 5.8% | 4.4% | 8.2% | ||||||||||
Core Equity (Unrestricted) 90%-100% Equity Exposure | $ | 1,176.1 | 1/1/1995 | (4.0)% | 7.1% | 7.2% | 6.1% | 7.0% | 10.8% | |||||||
Blended Benchmark: 80% Russell 3000® / 20% ACWIxUS | (2.1)% | 8.9% | 8.8% | 6.0% | 4.0% | 8.6% | ||||||||||
Core Non-U.S. Equity | $ | 7,273.2 | 10/1/1996 | (3.4)% | 0.4% | 0.4% | 3.0% | 5.4% | 7.4% | |||||||
Benchmark: ACWIxUS Index | (9.2)% | 0.3% | 0.3% | 1.9% | 2.6% | 4.5% | ||||||||||
Core U.S. Equity | $ | 1,216.4 | 7/1/2000 | (3.0)% | 8.4% | 7.7% | 6.1% | N/A (2) | 6.7% | |||||||
Benchmark: Russell 3000® Index | (0.3)% | 11.2% | 11.0% | 6.9% | 4.3% | 4.6% | ||||||||||
__________________________
(1) | The market cycle performance numbers are calculated from April 1, 2000 to March 31, 2016. We believe that a full market cycle time period should contain a wide range of market conditions and usually consists of a bear market, recovery and bull market stage. Our definition of the current market cycle includes the bear market that began with an abrupt decline in the technology sector (4/1/2000 - 9/30/2002), the subsequent failed recovery (10/1/2002 - 10/31/2007), the financial crisis bear market (11/1/2007 - 2/28/2009), and the current bull market (3/1/2009 - current). The period utilized in our current market cycle may differ from periods used by other investment managers. |
(2) | Market Cycle performance not available given the product's July 1, 2000 inception date. |
(3) | Key investment strategy returns are presented net of fees. Benchmark returns do not reflect any fees or expenses. |
Revenue
Our revenues primarily consist of investment management fees earned from managing our clients’ AUM. We earn our investment management fees as a percentage of our clients’ AUM either as of a specified date or on a daily basis. Our investment management fees can fluctuate based on the average fee rate for our investment management products, which are affected by the composition of our AUM among various portfolios and investment vehicles.
Manning & Napier Advisors, LLC ("MNA"), a subsidiary of Manning & Napier Group, serves as the investment advisor to the Fund and Exeter Trust Company. The Fund is a family of open-end mutual funds that offer no-load share classes designed to meet the needs of a range of institutional and other investors. Exeter Trust Company is an affiliated New Hampshire-chartered trust company that sponsors a family of collective investment trusts for qualified retirement plans, including 401(k) plans. These mutual funds and collective investment trusts comprised $14.4 billion, or 42%, of our AUM as of March 31, 2016, and investment management fees from these mutual funds and collective investment trusts were $28.1 million, or 44% of our revenues for the three months ended March 31, 2016. MNA also serves as the investment advisor to all of our
22
separately managed accounts, managing $20.3 billion, or 58%, of our AUM as of March 31, 2016, including assets managed as a sub-advisor to pooled investment vehicles and assets in client accounts invested in the Fund.
Operating Expenses
Our largest operating expenses are employee compensation and distribution, servicing and custody expenses, discussed further below, with a significant portion of these expenses varying in a direct relationship to our absolute and relative investment management performance, as well as AUM and revenues. We review our operating expenses in relation to the investment market environment and changes in our revenues. However, we are generally willing to make expenditures as necessary even when faced with declining rates of growth in revenues in order to support our investment products, our client service levels, strategic initiatives and our long-term value.
• | Compensation and related costs. Employee compensation and related costs represent our largest expense, including employee salaries and benefits, incentive compensation to investment and sales professionals and equity-based compensation issued under our equity compensation plan. These costs are affected by changes in the employee headcount, the mix of existing job descriptions, competitive factors, the addition of new skill sets, variations in the level of our AUM and revenues, changes in our stock price reflected in share-based compensation and/or the number of awards issued. In addition, incentive compensation for our research team considers the cumulative impact of both absolute and relative investment performance over the trailing one-, two- and three-year time periods, with more weight placed on the recent periods. As such, incentive compensation paid to our research team will vary based on absolute and relative investment performance. |
• | Distribution, servicing and custody expenses. Distribution, servicing and custody expense represent amounts paid to various platforms that distribute our mutual funds and collective trust funds, as well as costs for custodial services and 12b-1 distribution. These expenses generally increase or decrease in line with changes in our mutual fund and collective investment trust AUM or services performed by these intermediaries. |
• | Other operating expenses. Other operating expenses include fund fee waiver and/or expense reimbursement, professional fees, including accounting and legal fees, occupancy and facility costs, travel and entertainment expenses, insurance, market data service expenses and all other miscellaneous costs associated with managing the day-to-day operations of our business. |
Non-Operating Income (Loss)
Non-operating income (loss) includes interest expense, interest and dividend income, changes in liability under the tax receivable agreement and gains (losses) related to investment securities sales and changes in values of those investment securities designated as trading. Interest expense primarily relates to unused commitment fees and amortization of debt issuance costs. We expect the interest and investment components of non-operating income (loss) to fluctuate based on market conditions, the performance of our investments and the overall amount of our investments held by the Company to provide initial cash seeding for product development purposes as well as the timing and amounts (if any) outstanding under the revolving credit agreement.
Provision for Income Taxes
The Company is comprised of entities that have elected to be treated as either a limited liability company ("LLC") or a "C-Corporation". As such, the entities functioning as LLC's are not liable for or able to benefit from U.S. federal or most state and local income taxes on their earnings, and their earnings (losses) will be included in the personal income tax returns of each entity's unit holders. The entities functioning as C-Corporations are liable for or able to benefit from U.S. federal and state and local income taxes on their earnings and losses, respectively.
Noncontrolling Interests
Manning & Napier, Inc. holds an economic interest of approximately 16.7% in Manning & Napier Group as of March 31, 2016 but, as managing member, controls all of the business and affairs of Manning & Napier Group. As a result, the Company consolidates the financial results of Manning & Napier Group and records a noncontrolling interest in our consolidated financial statements. Net income attributable to noncontrolling interests on the consolidated statements of operations represents the portion of earnings attributable to the economic interest in Manning & Napier Group held by the noncontrolling interests.
Critical Accounting Policies and Estimates
There have been no significant changes in our critical accounting policies and estimates from those that were disclosed in our Annual Report on Form 10-K for the year ended December 31, 2015.
This management’s discussion and analysis should be read in conjunction with the Company’s Annual Report on Form 10-K for the year ended December 31, 2015 together with the consolidated financial statements and related notes and the other financial information that appear elsewhere in this report.
23
Revenue Recognition
Because the majority of our revenues are earned based on AUM that has been determined using fair value methods and since market appreciation/depreciation has a significant impact on our revenue, we have presented our AUM using the U.S. GAAP ("GAAP")) framework for measuring fair value. A fair value hierarchy is provided that gives the highest priority to unadjusted quoted prices in active markets for identical assets or liabilities (Level 1) and the lowest priority to unobservable inputs (Level 3). The following three-tier fair value hierarchy prioritizes the inputs used in measuring fair value:
Level 1—observable inputs such as quoted prices in active markets for identical securities;
Level 2—other significant observable inputs (including but not limited to quoted prices for similar securities, interest rates, prepayment rates, credit risk, etc.); and
Level 3—significant unobservable inputs (including the Company’s own assumptions in determining the fair value of investments).
The table below summarizes the approximate amount of AUM for the periods indicated for which fair value is measured based on Level 1, Level 2 and Level 3.
Level 1 | Level 2 | Level 3 | Total | |||||||||||||
(in millions) | ||||||||||||||||
March 31, 2016 | $ | 21,351 | $ | 13,345 | $ | — | $ | 34,696 | ||||||||
December 31, 2015 | $ | 21,188 | $ | 14,254 | $ | — | $ | 35,442 | ||||||||
As substantially all our AUM is valued by independent pricing services based upon observable market prices or inputs, we believe market risk is the most significant risk underlying valuation of our AUM, as discussed in this Form 10-Q under “Item 3. Quantitative and Qualitative Disclosures About Market Risk” and in “Part II. Item 1A. Risk Factors” of our Form 10-K for the year ended December 31, 2015.
Recent Accounting Pronouncements
See Note 2, "Summary of Significant Accounting Policies - Recent Accounting Pronouncements" to the Consolidated Financial Statements included in Item 1 of Part I of this Form 10-Q for additional information.
Three Months Ended March 31, 2016 Compared to Three Months Ended March 31, 2015
Assets Under Management
The following table reflects changes in our AUM for the three months ended March 31, 2016 and 2015:
24
Three months ended March 31, | Period-to-Period | ||||||||||||||
2016 | 2015 | $ | % | ||||||||||||
(in millions) | |||||||||||||||
Separately managed accounts | |||||||||||||||
Beginning assets under management | $ | 20,735.4 | $ | 25,408.7 | $ | (4,673.3 | ) | (18 | )% | ||||||
Gross client inflows | 384.8 | 691.4 | (306.6 | ) | (44 | )% | |||||||||
Gross client outflows | (1,187.4 | ) | (1,140.4 | ) | (47.0 | ) | 4 | % | |||||||
Market appreciation (depreciation) & other | 356.4 | 191.9 | 164.5 | 86 | % | ||||||||||
Ending assets under management | $ | 20,289.2 | $ | 25,151.6 | $ | (4,862.4 | ) | (19 | )% | ||||||
Mutual funds and collective investment trusts | |||||||||||||||
Beginning assets under management | $ | 14,706.8 | $ | 22,392.9 | $ | (7,686.1 | ) | (34 | )% | ||||||
Gross client inflows | 968.1 | 1,275.9 | (307.8 | ) | (24 | )% | |||||||||
Gross client outflows | (1,542.2 | ) | (3,434.7 | ) | 1,892.5 | (55 | )% | ||||||||
Market appreciation (depreciation) & other | 274.5 | 235.3 | 39.2 | 17 | % | ||||||||||
Ending assets under management | $ | 14,407.2 | $ | 20,469.4 | $ | (6,062.2 | ) | (30 | )% | ||||||
Total assets under management | |||||||||||||||
Beginning assets under management | $ | 35,442.2 | $ | 47,801.6 | $ | (12,359.4 | ) | (26 | )% | ||||||
Gross client inflows | 1,352.9 | 1,967.3 | (614.4 | ) | (31 | )% | |||||||||
Gross client outflows | (2,729.6 | ) | (4,575.1 | ) | 1,845.5 | (40 | )% | ||||||||
Market appreciation (depreciation) & other | 630.9 | 427.2 | 203.7 | 48 | % | ||||||||||
Ending assets under management | $ | 34,696.4 | $ | 45,621.0 | $ | (10,924.6 | ) | (24 | )% | ||||||
The total AUM decrease of $0.7 billion, or 2%, to $34.7 billion at March 31, 2016 from $35.4 billion at December 31, 2015 was attributable net client cash outflows of $1.4 billion partially offset by market appreciation of $0.6 billion. Our net client flows were comprised of separate accounts net client outflows of approximately $0.8 billion and mutual funds and collective investment trusts net client outflows of approximately $0.6 billion. The blended investment gain was 1.7% in separately managed accounts and 1.9% in mutual funds and collective investment trusts. While our relative investment performance improved over the first quarter of 2016, net client outflows during the three months ended March 31, 2016 were primarily driven by challenging near-term investment performance in a number of our key investment strategies. By portfolio, our AUM decreases were $0.4 billion or 3% in our equity portfolio and $0.4 billion or 2% in our blended asset portfolio. Our ability to improve cash flows going forward will likely depend in part on our ability to sustain the recently improved performance in future quarters, thus improving our one, three and five year track records across our key strategies.
Our total AUM decreased by $10.9 billion from $45.6 billion at March 31, 2015 to $34.7 billion at March 31, 2016. The decrease was attributable to net client outflows of $9.8 billion and market depreciation and other changes of $1.2 billion. Net client outflows consisted of approximately $4.3 billion of net outflows for separate accounts and $5.4 billion for mutual funds and collective investment trusts. The rates of change in AUM were most significant in our equity portfolios from March 31, 2015 to March 31, 2016, with a decrease of $7.5 billion, or 39%, while our blended asset portfolio and fixed income portfolios decreased by 13% and 5%, respectively.
As of March 31, 2016, the composition of our AUM was 58% in separate accounts and 42% in mutual funds and collective investment trusts, compared to 55% in separate accounts and 45% in mutual funds and collective investment trusts at March 31, 2015. The composition of our AUM across portfolios at March 31, 2016 was 64% in blended assets, 33% in equity, and 3% in fixed income, compared to 55% in blended assets, 42% in equity, and 3% in fixed income at March 31, 2015.
With regard to our separate accounts, gross client inflows of $0.4 billion were offset by approximately $1.2 billion of gross client outflows during the three months ended March 31, 2016. The $0.4 billion of gross client inflows included $0.2 billion into our blended asset portfolios and $0.2 billion into our U.S. Equity products. During the three months ended March 31, 2016, 62% of our separate account gross client inflows were derived from our Direct Channel with 49% representing contributions from existing Direct Channel relationships. With regard to gross client outflows, $0.6 billion, or 53%, of outflows resulted from withdrawals from existing accounts, particularly accounts invested in our blended asset portfolios. Our blended asset and equity portfolios experienced net client outflows of $0.5 billion and $0.3 billion, respectively. In light of challenging relative returns during the latter half of 2014 and 2015, our separate account clients redeemed assets at a rate of 13% during the quarter, compared to a 14% redemption rate over the trailing twelve months ended March 31, 2016. The annualized separate account retention rate was 90% for the three months ended March 31, 2016 compared to 88% for the rolling twelve months ended March 31, 2016.
25
Net client outflows of $0.6 billion from our mutual fund and collective investment trusts included gross client inflows of $1.0 billion offset by gross client outflows of $1.6 billion during the three months ended March 31, 2016. Gross client inflows into our blended asset life cycle vehicles, including both risk based and target date strategies, represented $0.8 billion, or 81%, of mutual fund and collective trust fund gross client inflows during the three months ended March 31, 2016. With regard to gross client outflows, $1.0 billion, or 65%, of mutual fund and collective investment trust gross client outflows were from blended asset mutual fund and collective trust products. The remaining net cash flow was concentrated in our Non U.S. Equity products including our World Opportunities Series and Overseas Series.
26
The following table sets forth our results of operations and related data for the three months ended March 31, 2016 and 2015:
Three months ended March 31, | Period-to-Period | ||||||||||||||
2016 | 2015 | $ | % | ||||||||||||
(in thousands, except share data) | |||||||||||||||
Revenues | |||||||||||||||
Investment management services revenue | $ | 64,538 | $ | 90,426 | $ | (25,888 | ) | (29 | )% | ||||||
Expenses | |||||||||||||||
Compensation and related costs | 21,967 | 26,818 | (4,851 | ) | (18 | )% | |||||||||
Distribution, servicing and custody expenses | 11,338 | 16,832 | (5,494 | ) | (33 | )% | |||||||||
Other operating costs | 8,453 | 8,942 | (489 | ) | (5 | )% | |||||||||
Total operating expenses | 41,758 | 52,592 | (10,834 | ) | (21 | )% | |||||||||
Operating income | 22,780 | 37,834 | (15,054 | ) | (40 | )% | |||||||||
Non-operating income (loss) | |||||||||||||||
Non-operating income (loss), net | 1,078 | 756 | 322 | 43 | % | ||||||||||
Income before provision for income taxes | 23,858 | 38,590 | (14,732 | ) | (38 | )% | |||||||||
Provision for income taxes | 1,674 | 2,479 | (805 | ) | (32 | )% | |||||||||
Net income attributable to controlling and noncontrolling interests | 22,184 | 36,111 | (13,927 | ) | (39 | )% | |||||||||
Less: net income attributable to noncontrolling interests | 19,766 | 32,802 | (13,036 | ) | (40 | )% | |||||||||
Net income attributable to Manning & Napier, Inc. | $ | 2,418 | $ | 3,309 | $ | (891 | ) | (27 | )% | ||||||
Per Share Data | |||||||||||||||
Net income per share available to Class A common stock | |||||||||||||||
Basic | $ | 0.16 | $ | 0.24 | |||||||||||
Diluted | $ | 0.16 | $ | 0.24 | |||||||||||
Weighted average shares of Class A common stock outstanding | |||||||||||||||
Basic | 13,745,130 | 13,713,540 | |||||||||||||
Diluted | 14,084,903 | 13,914,908 | |||||||||||||
Cash dividends declared per share of Class A common stock | $ | 0.16 | $ | 0.16 | |||||||||||
Other financial and operating data | |||||||||||||||
Economic net income (1) | $ | 15,031 | $ | 24,312 | $ | (9,281 | ) | (38 | )% | ||||||
Economic net income per adjusted share (1) | $ | 0.18 | $ | 0.28 | |||||||||||
Weighted average adjusted Class A common stock outstanding (1) | 83,659,012 | 88,078,806 | |||||||||||||
_______________________
(1) | See “Management’s Discussion and Analysis of Financial Condition and Results of Operations – Supplemental Non-GAAP Financial Information” for Manning & Napier’s reasons for including these non-GAAP measures in this report in addition to a reconciliation of non-GAAP financial measures to GAAP measures for the periods indicated. |
Revenues
Our investment management services revenue decreased by $25.9 million, or 29%, to $64.5 million for the three months ended March 31, 2016 from $90.4 million for the three months ended March 31, 2015. This decrease is driven primarily by a $12.8 billion, or 27%, decrease in our average AUM to $34.3 billion for the three months ended March 31, 2016 from $47.1 billion for the three months ended March 31, 2015. Average AUM decreased as a result of net client outflows of $9.8 billion and market depreciation and other changes of $1.2 billion the during the rolling twelve months ended March 31, 2016. By portfolio, our AUM decreases were concentrated in our equity portfolios, which decreased by 39% compared to March 31, 2015. The outflows were largely attributable to challenging portfolio performance relative to benchmarks.
27
Our average separately managed account fee for the three months ended March 31, 2016 was consistent with the three months ended March 31, 2015 at 63 basis points. For the three months ended March 31, 2016 and 2015, separately managed account standard fees ranged from 15 basis points to 125 basis points depending on investment objective and account size. As of March 31, 2016, the concentration of assets in our separately managed accounts was 58% blended assets, 36% equity and 6% fixed income, compared to 53% blended assets, 42% equity and 5% fixed income as of March 31, 2015.
Our average fee on mutual fund and collective investment trust products decreased to 81 basis points for the three months ended March 31, 2016 compared to 85 basis points for the three months ended March 31, 2015. This decrease was primarily due to a shift in the mix of our AUM from higher fee mutual funds and collective investment trusts to those with lower fees. The management fees earned on our mutual fund and collective investment trust management fees ranged from 24 basis points to 100 basis points, depending on investment strategy, for the three months ended March 31, 2016 and 2015. As of March 31, 2016 the concentration of assets in our mutual fund and collective investment trusts was 72% blended assets and 27% equity, compared to 59% blended assets and 41% equity of March 31, 2015.
Operating Expenses
Our operating expenses decreased by $10.8 million, or 21%, to $41.8 million for the three months ended March 31, 2016 from $52.6 million for the three months ended March 31, 2015.
Compensation and related costs decreased by $4.9 million, or 18%, to $22.0 million for the three months ended March 31, 2016 from $26.8 million for the three months ended March 31, 2015. The decrease was due to a lower overall workforce coupled with lower variable incentive costs. Included within compensation and related costs was $1.3 million and $0.6 million of equity-based compensation charges under our 2011 long-term incentive plan for the three months ended March 31, 2016 and 2015, respectively. This increase is primarily due to the 2015 purchase of unvested pre-IPO ownership interests that were subsequently reissued as Class A common stock with a six-year vesting period. When considered as a percentage of revenue, compensation and related costs for the three months ended March 31, 2016 was 34% compared to 30% for the three months ended March 31, 2015.
Distribution, servicing and custody expenses decreased by $5.5 million, or 33%, to $11.3 million for the three months ended March 31, 2016 from $16.8 million for the three months ended March 31, 2015. The decrease was generally driven by a 35% decrease in mutual funds and collective investment trusts average AUM for the three months ended March 31, 2016 compared to the three months ended March 31, 2015. As a percentage of mutual fund and collective investment trust revenue, distribution, servicing and custody expense was 40% for the three months ended March 31, 2016, compared to 37% for the three months ended March 31, 2015.
Other operating costs decreased by $0.5 million, or 5%, to $8.5 million for the three months ended March 31, 2016 from $8.9 million for the three months ended March 31, 2015. As a percentage of revenue, other operating costs for the three months ended March 31, 2016 was 13% compared to 10% for 2015.
Non-Operating Income (Loss)
Non-operating income for the three months ended March 31, 2016 was $1.1 million, compared to $0.8 million for the three months ended March 31, 2015. Included within non-operating income for the three months ended March 31, 2016 and 2015 was $1.1 million and $0.6 million, respectively, of net gains on investments held by the Company to provide initial cash seeding for product development purposes. In addition, interest expense increased by $0.1 million during the three months ended March 31, 2016 as compared to 2015 driven by the credit facility entered into during 2015.
Provision for Income Taxes
The Company’s tax provision decreased by $0.8 million, or 32%, to $1.7 million for the three months ended March 31, 2016 from $2.5 million for the three months ended March 31, 2015. The change is primarily driven by a decrease in taxable earnings as compared to the prior year.
Supplemental Non-GAAP Financial Information
To provide investors with greater insight, promote transparency and allow for a more comprehensive understanding of the information used by management in its financial and operational decision-making, we supplement our consolidated statements of operations presented on a GAAP basis with non-GAAP financial measures of earnings.
Management uses economic net income and economic net income per adjusted share as financial measures to evaluate the profitability and efficiency of its business. Economic net income and economic net income per adjusted share are not presented in accordance with GAAP.
28
Economic net income is a non-GAAP measure of after-tax operating performance and equals the Company’s income before provision for income taxes less adjusted income taxes. Adjusted income taxes are estimated assuming the exchange of all outstanding units of Manning & Napier Group into Class A common stock on a one-to-one basis. Therefore, all income of Manning & Napier Group allocated to the units of Manning & Napier Group is treated as if it were allocated to the Company and represents an estimate of income tax expense at an effective rate of 37% for the three months ended March 31, 2016 and 2015, reflecting assumed federal, state and local income taxes. Economic net income per adjusted share is equal to economic net income divided by the weighted average adjusted Class A common shares outstanding. The number of weighted average adjusted Class A common shares outstanding for all periods presented is determined by assuming the weighted average exchangeable units of Manning & Napier Group and unvested equity awards are converted into our outstanding Class A common stock as of the respective reporting date, on a one-to-one basis. The Company’s management uses economic net income, among other financial data, to determine the earnings available to distribute as dividends to holders of its Class A common stock and to the holders of the units of Manning & Napier Group.
Non-GAAP measures are not a substitute for financial measures prepared in accordance with GAAP. Additionally, the Company’s non-GAAP measures may differ from similar measures used by other companies, even if similar terms are used to identify such measures.
The following table sets forth our other financial and operating data for the three months ended March 31, 2016 and 2015:
Three months ended March 31, | ||||||||
2016 | 2015 | |||||||
(in thousands, except share data) | ||||||||
Income before provision for income taxes | $ | 23,858 | $ | 38,590 | ||||
Economic net income (Non-GAAP) | $ | 15,031 | $ | 24,312 | ||||
Economic net income per adjusted share (Non-GAAP) | $ | 0.18 | $ | 0.28 | ||||
Weighted average adjusted Class A common stock outstanding (Non-GAAP) | 83,659,012 | 88,078,806 | ||||||
29
The following table sets forth, for the periods indicated, a reconciliation of non-GAAP financial measures to GAAP measures:
Three months ended March 31, | ||||||||
2016 | 2015 | |||||||
(in thousands, except share data) | ||||||||
Net income attributable to Manning & Napier, Inc. | $ | 2,418 | $ | 3,309 | ||||
Add back: Net income attributable to noncontrolling interests | 19,766 | 32,802 | ||||||
Add back: Provision for income taxes | 1,674 | 2,479 | ||||||
Income before provision for income taxes | 23,858 | 38,590 | ||||||
Adjusted income taxes | 8,827 | 14,278 | ||||||
Economic net income (Non-GAAP) | $ | 15,031 | $ | 24,312 | ||||
Weighted average shares of Class A common stock outstanding - Basic | 13,745,130 | 13,713,540 | ||||||
Assumed vesting, conversion or exchange of: | ||||||||
Manning & Napier Group, LLC units outstanding (non-controlling interest) | 67,896,484 | 73,511,251 | ||||||
Unvested restricted share-based awards | 2,017,398 | 854,015 | ||||||
Weighted average adjusted shares (Non-GAAP) | 83,659,012 | 88,078,806 | ||||||
Economic net income per adjusted share (Non-GAAP) | $ | 0.18 | $ | 0.28 | ||||
Liquidity and Capital Resources
Historically, our cash and liquidity needs have been met primarily through cash generated by our operations. Our current financial condition is highly liquid, with a significant amount of our assets comprised of cash and cash equivalents, accounts receivable and investment securities held by us for the purpose of providing initial cash seeding for product development purposes.
The following table sets forth certain key financial data relating to our liquidity and capital resources as of March 31, 2016 and December 31, 2015.
March 31, 2016 | December 31, 2015 | |||||||
(in thousands) | ||||||||
Cash and cash equivalents | $ | 126,970 | $ | 117,591 | ||||
Accounts receivable | $ | 22,372 | $ | 24,280 | ||||
Due from broker | $ | — | $ | 3,962 | ||||
Due from broker - consolidated funds | $ | — | $ | 3,510 | ||||
Investment securities | $ | 19,983 | $ | 21,460 | ||||
Investment securities - consolidated funds | $ | 981 | $ | 1,107 | ||||
Amounts payable under tax receivable agreement (1) | $ | 41,957 | $ | 41,939 | ||||
________________________
(1) | In light of numerous factors affecting our obligation to make such payments, the timing and amounts of any such actual payments are based on our best estimate as of March 31, 2016 and December 31, 2015, including our ability to realize the expected tax benefits. Actual payments may significantly differ from estimated payments. |
In determining the sufficiency of liquidity and capital resources to fund our business, we regularly monitor our liquidity position, including among other things, cash, working capital, long-term liabilities, lease commitments and operating company distributions.
Our revolving credit agreement has a four-year term expiring in April 2019 and provides borrowing capacity of up to $100.0 million, with a feature providing for an increase in the line to $150.0 million on approval by the lending group. The Credit Agreement also provides for a $5.0 million sub-limit for the issuance of standby letters of credit and a $5.0 million
30
swingline facility. At March 31, 2016, there were no amounts outstanding under the revolving credit agreement and the Company had the capacity to draw on the entire $100.0 million.
Amounts outstanding under the revolving credit agreement bear interest at an annual rate equal to, at our option, either LIBOR (adjusted for reserves and not below 0.0%) for interest periods of one, two, three or six months or a base rate (as defined in the agreement), plus, in each case, an applicable margin. The applicable margins range from 1.50% to 2.50% in the case of LIBOR-based loans, and 0.50% to 1.50% in the case of base rate loans. Under the terms of the revolving credit agreement, we are also required to pay certain fees including a quarterly fee based on the average unused amount of the facility ranging from 0.25% to 0.45%.
The revolving credit agreement contains customary covenants, including covenants that restrict (subject in certain instances to minimum thresholds or exceptions) the ability of us to incur additional indebtedness, create liens, merge, sell or dispose of assets, and make distributions, dividends, investments or capital expenditures, among other things.
In addition, we are required to maintain compliance with certain financial covenants, including: (i) a minimum interest coverage ratio (generally, adjusted EBITDA to interest expense as defined in and for the period specified in the revolving credit agreement) of at least 4.00:1.00 and (ii) a leverage ratio (generally, total debt as of any date to adjusted EBITDA as defined in and for the period specified in the revolving credit agreement) of no greater than 2.75:1.00. For purposes of the revolving credit agreement, adjusted EBITDA generally means, for any period, net income before interest expense, income taxes, depreciation and amortization expense, non-cash stock-based compensation expense, and certain non-cash nonrecurring gains and losses as described in and specified under the revolving credit agreement. At March 31, 2016, the Company was in compliance with all financial covenants.
The revolving credit agreement also contains customary provisions regarding events of default which could result in an acceleration of amounts due under the facility. Such events of default include our failure to pay principal or interest when due, our failure to satisfy or comply with covenants and a change of control. See Note 8, "Borrowings" to the Consolidated Financial Statements included in Item 1 of this Form 10-Q for additional information.
We believe that cash on hand and cash generated from operations will be sufficient over the next twelve months to meet our working capital requirements, including the $13.0 million initial upfront cash payment for the acquisition of a majority interest in Rainier Investment Management, LLC and the $16.1 million purchase of Class A Units of Manning & Napier Group in April 2016. Further, we expect that cash on hand, cash generated by operations and availability under our revolving credit agreement will be sufficient to meet our liquidity needs for the foreseeable future.
Cash Flows
The following table sets forth our cash flows for the three months ended March 31, 2016 and 2015. Operating activities consist primarily of net income subject to adjustments for changes in operating assets and liabilities, equity-based compensation expense, changes in the liability under the tax receivable agreement, deferred income tax expense and depreciation and amortization. Investing activities consist primarily of the purchase and sale of investments for the purpose of providing initial cash seeding for product development purposes, as well as purchases of property and equipment. Financing activities consist primarily of distributions to noncontrolling interests, dividends paid on our Class A common stock, and purchases of Class A units held by noncontrolling interests of Manning & Napier Group.
Three months ended March 31, | ||||||||
2016 | 2015 | |||||||
(in thousands) | ||||||||
Net cash provided by operating activities | $ | 15,380 | $ | 20,511 | ||||
Net cash provided by investing activities | 6,218 | 1,393 | ||||||
Net cash used in financing activities | (12,219 | ) | (66,519 | ) | ||||
Net change in cash and cash equivalents | $ | 9,379 | $ | (44,615 | ) | |||
Three Months Ended March 31, 2016 Compared to Three Months Ended March 31, 2015
Operating Activities
Operating activities provided $15.4 million and $20.5 million of net cash for the three months ended March 31, 2016 and 2015, respectively. This overall $5.1 million decrease in net cash provided by operating activities for the three months ended March 31, 2016 compared to 2015 was due to a decrease in net income after adjustment for non-cash items of approximately $13.6 million driven by lower revenues resulting primarily from changes in our average AUM. The decrease was partially offset by $8.8 million of cash from consolidated funds due to the timing of trading activity.
31
Investing Activities
Investing activities provided $6.2 million and $1.4 million of net cash for the three months ended March 31, 2016 and 2015, respectively. The increase in cash provided by investing activities was driven by changes in investing activities of $4.6 million due to the Company's funding of and timing of activity within our investment securities designated as trading for the seeding of new products. In addition, property and equipment purchases decreased by $0.3 million for the three months ended March 31, 2016 compared to 2015.
Financing Activities
Financing activities used $12.2 million and $66.5 million of net cash for the three months ended March 31, 2016 and 2015, respectively. This overall $54.3 million decrease in net cash used in financing activities was primarily due to cash used of $36.3 million during the three months ended March 31, 2015 for the purchase of Class A units of Manning & Napier Group pursuant to the exchange agreement entered into at the time of the Company's initial public offering. There were no Class A units of Manning & Napier Group purchased during the three months ended March 31, 2016. This decrease in cash used in financing activities was also driven by a reduction in distributions to noncontrolling interests of $17.0 million for the three months ended March 31, 2016 compared to 2015 due to lower income after adjustment for non-cash items in 2016 compared to 2015.
Dividends
On November 2, 2015, the Board of Directors declared a $0.16 per share dividend to the holders of Class A common stock. The dividend was paid on February 1, 2016 to shareholders of record as of January 15, 2016.
On March 1, 2016, the Board of Directors declared a $0.16 per share dividend to the holders of Class A common stock. The dividend was paid on May 2, 2016 to shareholders of record as of April 15, 2016.
On April 26, 2016, the Board of Directors declared a $0.16 per share dividend to the holders of Class A common stock. The dividend is payable on or about August 1, 2016 to shareholders of record as of July 15, 2016.
We currently intend to pay quarterly cash dividends on our Class A common stock. We intend to fund such dividends from our portion of distributions made by Manning & Napier Group, from its available cash generated from operations. William Manning, as the holder of our Class B common stock, will not be entitled to any cash dividends in his capacity as a Class B stockholder, but will, in his capacity as an indirect holder of Class A units of Manning & Napier Group, generally participate on a pro rata basis in distributions by Manning & Napier Group.
The declaration and payment of all future dividends, if any, will be at the sole discretion of our board of directors. In determining the amount of any future dividends, our board of directors will take into account:
• | the financial results of Manning & Napier Group; |
• | our available cash, as well as anticipated cash requirements, including any debt servicing and payments required under the tax receivable agreement; |
• | our capital requirements and the capital requirements of our subsidiaries, including Manning & Napier Group; |
• | contractual, legal, tax and regulatory restrictions on, and implications of, the payment of dividends by us to our stockholders or distributions by Manning & Napier Group to us, including the obligation of Manning & Napier Group to make tax distributions to its unitholders, including us; |
• | general economic and business conditions; and |
• | any other factors that our board of directors may deem relevant. |
We have no material assets other than our ownership of Class A units of Manning & Napier Group and, accordingly, will depend on distributions from Manning & Napier Group to fund any dividends we may pay. As managing member of Manning & Napier Group, we will determine the timing and amount of any distributions to be paid to its members, other than mandatory tax distributions required under Manning & Napier Group's operating agreement. We intend to cause Manning & Napier Group to distribute cash to its members, including us, in an amount sufficient to cover dividends, if any, declared by us. If we do cause Manning & Napier Group to make such distributions, M&N Group Holdings, MNCC and any other holders of units of Manning & Napier Group will be entitled to receive equivalent distributions on a pari passu basis.
Contractual Obligations
There have been no material changes in our contractual obligations as set forth in our Annual Report on Form 10-K for the year ended December 31, 2015.
Off Balance Sheet Arrangements
32
We did not have any off-balance sheet arrangements as of March 31, 2016.
Item 3. Quantitative and Qualitative Disclosures About Market Risk
Market Risk
Our exposure to market risk is directly related to the role of our operating company as an investment advisor for the mutual funds and separate accounts it manages. Substantially all of our revenues are derived from investment management agreements with these funds and accounts. Under these agreements, the investment management fees we receive are based on the value of our AUM and our fee rates. Accordingly, our revenues and net income may decline as a result of our AUM decreasing due to depreciation of our investment portfolios. In addition, such a decline could cause our clients to withdraw their funds in favor of investments offering higher returns or lower risk, which would cause our revenues to decline further.
The value of our AUM was $34.7 billion as of March 31, 2016. Assuming a 10% increase or decrease in the value of our AUM and the change being proportionally distributed over all our products, the value would increase or decrease by approximately $3.5 billion, which would cause an annualized increase or decrease in revenues of approximately $26.4 million at our current weighted average fee rate of 0.76%.
We have not adopted a corporate-level risk management policy regarding client assets, nor have we attempted to hedge at the corporate level the market risks that would affect the value of our overall AUM and related revenues. Some of these risks (e.g., sector risks and currency risks) are inherent in certain strategies, and clients may invest in particular strategies to gain exposure to these risks.
We also are subject to market risk from a decline in the prices of investment securities that we own. These securities consist primarily of equity securities, fixed-income securities, investments in hedge funds and mutual funds, including the Fund for which MNA provides advisory services. The value of these investments was $21.0 million as of March 31, 2016 of which $18.9 million is investment securities classified as trading, and $2.1 million is investment securities classified as available-for-sale. Management regularly monitors the value of these investments; however, given their nature and relative size, we have not adopted a specific risk management policy to manage the associated market risk. Assuming a 10% increase or decrease in the values of these investment securities, the fair value would increase or decrease by approximately $2.1 million at March 31, 2016. Due to the nature of our business, we believe that we do not face any material risk from inflation.
Exchange Rate Risk
A substantial portion of the accounts that we advise, or sub-advise, hold investments that are denominated in currencies other than the U.S. dollar. Movements in the rate of exchange between the U.S. dollar and the underlying foreign currency affect the values of assets held in accounts we manage, thereby affecting the amount of revenues we earn. The value of the assets we manage was $34.7 billion as of March 31, 2016. As of March 31, 2016, approximately 16% of our AUM across our investment strategies was invested in securities denominated in currencies other than the U.S. dollar. To the extent our AUM are denominated in currencies other than the U.S. dollar, the value of those AUM would decrease, with an increase in the value of the U.S. dollar, or increase, with a decrease in the value of the U.S. dollar.
We monitor our exposure to exchange rate risk and make decisions on how to manage such risk accordingly; however, we have not adopted a corporate-level risk management policy to manage exchange rate risk. Assuming that 16% of our AUM is invested in securities denominated in currencies other than the U.S. dollar and excluding the impact of any hedging arrangements, a 10% increase or decrease in the value of the U.S. dollar would increase or decrease the fair value of our AUM by approximately $0.6 billion, which would cause an annualized increase or decrease in revenues of approximately $4.3 million at our current weighted average fee rate of 0.76%.
Interest Rate Risk
At March 31, 2016, the Company was exposed to interest-rate risk primarily due to our AUM that is invested in debt securities, as well as corporate assets that are invested in debt securities. Management considered a hypothetical 100 basis point fluctuation in interest rates and estimated the impact of such a fluctuation on these investments. Management determined there was no material impact as of March 31, 2016. Additionally, given the current level of income we earn from our cash and cash equivalent balances, interest rate changes would not have a material impact on us.
Borrowing under our revolving credit agreement bears interest as described under "Management's Discussion and Analysis of Financial Condition and Results of Operations-Liquidity and Capital Resources". Interest rate changes may affect the amount of our interest payments in connection with our revolving credit agreement, and thereby affect future earnings and cash flows. At March 31, 2016, there were no borrowings outstanding under the revolving credit agreement.
33
Item 4. Controls and Procedures
Disclosure Controls and Procedures
Our management, including our Chief Executive Officer and Chief Financial Officer, evaluated the effectiveness of our disclosure controls and procedures as of March 31, 2016 pursuant to Rule 13a-15 under the Exchange Act. Based on that evaluation, our Chief Executive Officer and Chief Financial Officer have concluded that, as of March 31, 2016, our disclosure controls and procedures (as defined in Rule 13a-15(e) under the Exchange Act) were effective to ensure that information we are required to disclose in reports that we file or submit under the Exchange Act is recorded, processed, summarized and reported within the time periods specified in SEC rules and forms, and that such information is accumulated and communicated to our management, including our Chief Executive Officer and Chief Financial Officer, as appropriate, to allow timely decisions regarding required disclosures.
Changes in Internal Control Over Financial Reporting
There were no changes in our internal control over financial reporting during the quarter ended March 31, 2016 that materially affected, or are reasonably likely to materially affect, our internal control over financial reporting.
34
PART II—OTHER INFORMATION
Item 1A. Risk Factors
We have set forth in Item 1A to our Annual Report on Form 10-K for the year ended December 31, 2015 risk factors relating to our business, our industry, our structure and our Class A common stock. Readers of this Quarterly Report on Form 10-Q are referred to such Item 1A for a more complete understanding of risks concerning our company. There have been no material changes in our risk factors since those published in such Form 10-K for the year ended December 31, 2015.
Item 6. Exhibits
Exhibit No. | Description | |
10.1 | Form of Redemption Agreement between M&N Group Holdings, LLC and Manning & Napier Group, LLC, dated April 27, 2016 (1) | |
10.2 | Form of Redemption Agreement between Manning & Napier Capital Company and Manning & Napier Group, LLC, dated April 27, 2016 (2) | |
10.3 | First Amendment to Credit Agreement, dated April 29, 2016, among Manning & Napier Group, LLC and Manning & Napier Advisors, LLC as borrowers, Manning & Napier, Inc., Wells Fargo Bank, National Association, as administrative agent, lender, swingline lender and issuing bank, Manufacturers and Traders Trust Company, as syndication agent and lender, and First Niagara Bank, The Bank of New York Mellon, and The Huntington National Bank, as lenders. | |
31.1 | Certification of the Company’s Chief Executive Officer pursuant to Exchange Act Rules 13a-14(a)/15d-14(a), as adopted pursuant to Section 302 of the Sarbanes-Oxley Act of 2002 | |
31.2 | Certification of the Company’s Chief Financial Officer pursuant to Exchange Act Rules 13a-14(a)/15d-14(a), as adopted pursuant to Section 302 of the Sarbanes-Oxley Act of 2002 | |
32.1 | Certification of the Company’s Chief Executive Officer pursuant to 18 U.S.C. Section 1350, as adopted pursuant to Section 906 of the Sarbanes-Oxley Act of 2002 | |
32.2 | Certification of the Company’s Chief Financial Officer pursuant to 18 U.S.C. Section 1350, as adopted pursuant to Section 906 of the Sarbanes-Oxley Act of 2002 | |
101 | Materials from the Manning & Napier, Inc. Quarterly Report on Form 10-Q for the quarter ended March 31, 2016, formatted in Extensible Business Reporting Language (XBRL): (i) Consolidated Statements of Financial Condition, (ii) Consolidated Statements of Operations, (iii) Consolidated Statements of Comprehensive Income, (iv) Consolidated Statement of Shareholders’ Equity, (v) Consolidated Statements of Cash Flows, and (vi) related Notes to the Unaudited Consolidated Financial Statements. | |
______________________
(1) | Incorporated by reference to exhibit 10.1 to the Company's Current Report on Form 8-K as filed with the Securities and Exchange Commission on May 2, 2016 |
(2) | Incorporated by reference to exhibit 10.2 to the Company's Current Report on Form 8-K as filed with the Securities and Exchange Commission on May 2, 2016 |
35
SIGNATURES
Pursuant to the requirements of the Securities Exchange Act of 1934, the registrant has duly caused this report to be signed on its behalf by the undersigned thereunto duly authorized.
MANNING & NAPIER, INC. | ||||
Dated: May 10, 2016 | By: | /s/ WILLIAM MANNING | ||
William Manning | ||||
Chief Executive Officer | ||||
(principal executive officer) | ||||
/s/ JAMES MIKOLAICHIK | ||||
James Mikolaichik | ||||
Chief Financial Officer | ||||
(principal financial and accounting officer) | ||||
36