Attached files
| file | filename |
|---|---|
| EX-24.1 - EXHIBIT 24.1 - SunOpta Inc. | exhibit24.htm |
| EX-21 - EXHIBIT 21 - SunOpta Inc. | exhibit21.htm |
| EX-32 - EXHIBIT 32 - SunOpta Inc. | exhibit32.htm |
| EX-31.1 - EXHIBIT 31.1 - SunOpta Inc. | exhibit31-1.htm |
| EX-10.3 - EXHIBIT 10.3 - SunOpta Inc. | exhibit10-3.htm |
| EX-31.2 - EXHIBIT 31.2 - SunOpta Inc. | exhibit31-2.htm |
| EX-23.1 - EXHIBIT 23.1 - SunOpta Inc. | exhibit23-1.htm |
UNITED STATES
SECURITIES AND EXCHANGE COMMISSION
WASHINGTON, D.C. 20549
FORM 10-K
(X) ANNUAL REPORT PURSUANT TO SECTION 13 or 15(d) OF THE SECURITIES EXCHANGE ACT OF 1934
For the fiscal year ended January 1, 2011
TRANSITION REPORT PURSUANT TO SECTION 13 OR 15(d) OF THE SECURITIES EXCHANGE ACT OF 1934
Commission File No. 001-34198
SUNOPTA INC.
(Exact name
of registrant as specified in its charter)
CANADA
(Jurisdiction of Incorporation)
Not Applicable
(I.R.S. Employer Identification No.)
2838 Bovaird Drive West
Brampton, Ontario L7A 0H2, Canada
(Address of Principle Executive Offices)
(905) 455-1990
(Registrant's telephone number, including
area code)
Securities registered pursuant to Section 12(b) of the Act:
| Title of each class: | Name of Each Exchange on Which Registered: |
| Common Shares, no par value | The NASDAQ Stock Market |
Securities registered pursuant Section to 12(g) of the Act: NONE
Indicate by check mark if the registrant is a well-known seasoned issuer, as defined in Rule 405 of the Securities Act.
Yes [ ] No [X]
Indicate by check mark if the registrant is not required to file reports pursuant to Section 13 or Section 15(d) of the Act.
Yes [ ] No [X]
Indicate by check mark whether the registrant (1) has filed all reports required to be filed by Section 13 or 15(d) of the Securities Exchange Act of 1934 during the preceding 12 months (or for such shorter period that the registrant was required to file such reports) and (2) has been subject to such filing requirements for the past 90 days.
Yes [X] No [ ]
Indicate by check mark whether the registrant has submitted electronically and posted on its corporate Web site, if any, every Interactive Data File required to be submitted and posted pursuant to Rule 405 of Regulation S-T (§ 232.405 of this chapter) during the preceding 12 months (or for such shorter period that the registrant was required to submit and post such files).
Yes [ ] No [ ]
Indicate by check mark if disclosure of delinquent filers pursuant to Item 405 of Regulation S-K is not contained herein, and will not be contained, to the best of the registrant’s knowledge, in definitive proxy or information statements incorporated by reference in Part III of this Form 10-K or any amendment to this Form 10-K. [ ]
Indicate by check mark whether the registrant is a large accelerated filer, an accelerated filer, a non-accelerated filer, or a smaller reporting company. See definitions of “large accelerated filer,” “accelerated filer” and “smaller reporting company” in Rule 12b-2 of the Exchange Act. Check one:
| Large accelerated filer [ ] | Accelerated filer [X] | Non-accelerated filer [ ] | Smaller reporting company [ ] |
Indicate by check mark whether the registrant is a shell company (as defined in Rule 12b-2 of the Exchange Act).
Yes [ ] No [X]
Aggregate market value of the common equity held by non-affiliates of the registrant, computed using the closing price as reported on the NASDAQ Global Select Market for the registrant’s common shares on July 2, 2010, the last business day of the registrant’s most recently completed second fiscal quarter, was $265,117,203. The registrant’s common shares trade on the NASDAQ Global Select Market under the symbol STKL and on the Toronto Stock Exchange under the symbol SOY.
The number of shares of the registrant’s common stock outstanding as of February 28, 2011 was 65,500,091.
Documents Incorporated by Reference: Portions of the SunOpta Inc. Definitive Proxy Statement for the 2011 Annual Meeting of Shareholders are incorporated by reference into Part III of this Annual Report on Form 10-K.
| SUNOPTA INC. | January 1, 2011 10-K |
SUNOPTA INC.
FORM 10-K
For the year ended
January 1, 2011
TABLE OF CONTENTS
| Currency and financial figure presentation | 3 | |
| Forward-looking statements | 3 | |
| PART I | ||
| Item 1 | Business | 5 |
| Item 1A | Risk Factors | 24 |
| Item 1B | Unresolved Staff Comments | 31 |
| Item 2 | Properties | 32 |
| Item 3 | Legal Proceedings | 34 |
| Item 4 | (Removed and Reserved) | 34 |
| PART II | ||
| Item 5 | Market for Registrant’s Common Equity, Related Stockholder Matters and Issuer Purchases of Equity Securities | 34 |
| Item 6 | Selected Financial Data | 37 |
| Item 7 | Management’s Discussion and Analysis of Financial Condition and Results of Operations | 38 |
| Item 7A | Quantitative and Qualitative Disclosures about Market Risk | 74 |
| Item 8 | Financial Statements and Supplementary Data | 75 |
| Item 9 | Changes in and Disagreements with Accountants on Accounting and Financial Disclosure | 76 |
| Item 9A | Controls and Procedures | 76 |
| Item 9B | Other Information | 78 |
| PART III | ||
| Item 10 | Directors, Executive Officers and Corporate Governance | 78 |
| Item 11 | Executive Compensation | 79 |
| Item 12 | Security Ownership of Certain Beneficial Owners and Management and Related Stockholder Matters | 79 |
| Item 13 | Certain Relationships and Related Transactions, and Director Independence | 79 |
| Item 14 | Principal Accounting Fees and Services | 79 |
| PART IV | ||
| Item 15 | Exhibits, Financial Statement Schedules | 79 |
| SUNOPTA INC. | 2 | January 1, 2011 10-K |
Currency and Financial Figure Presentation
All dollar amounts in this report are expressed in thousands of United States dollars. Amounts expressed in Canadian dollars are preceded by the symbol “Cdn$”, and amounts expressed in Euros are preceded by the symbol “€”. On February 28, 2011, the noon buying rate in New York City for cable transfers in Canadian dollars for customs purposes by the Federal Reserve Bank of New York was $1.0268 for Cdn $1.00. In 2010 (1) the rate of exchange for the Canadian dollar, expressed in U.S. dollars, in effect at the end of the year was 1.0054, (2) the average of exchange rates in effect on the last day of each month during the year was $0.9707, and (3) the high and low exchange rates during the year were $1.0054 and $0.9278, respectively.
Forward-Looking Statements
This annual report of SunOpta Inc. (the “Company”) for the period ended January 1, 2011 contains forward–looking statements which are based on our current expectations and assumptions and involve a number of risks and uncertainties. Generally, forward–looking statements do not relate strictly to historical or current facts and are typically accompanied by words such as “anticipate,” “estimate,” “intend,” “project,” “potential,” “continue,” “believe,” “expect,” “could,” “would,” “should,” “might,” “plan,” “will,” “may,” the negatives of such terms, and words and phrases of similar impact and include, but are not limited to references to possible operational consolidation, reduction of non–core assets and operations, business strategies, plant and production capacities, revenue generation potential and anticipated construction costs, competitive strengths, goals, capital expenditure plans, business and operational growth and expansion plans, anticipated operating margins and operating income increases, gains or losses associated with business transactions, cost reductions, rationalization and improved efficiency initiatives, proposed new product offerings, and references to the future growth of the business and global markets for the Company’s products. These forward–looking statements are made pursuant to the safe harbor provisions of the Private Securities Litigation Reform Act of 1995. These forward–looking statements are based on certain assumptions and analyses we make in light of our experience and our interpretation of current conditions, historical trends and expected future developments as well as other factors that we believe are appropriate in the circumstance.
Whether actual results and developments will agree with our expectations and predictions is subject to many risks and uncertainties. Accordingly, there are or will be important factors that could cause our actual results to differ materially from our expectations and predictions. We believe these factors include, but are not limited to, the following:
- our continuing indemnification obligations relating to our recent dispositions;
- restrictions in our credit agreement on how we may operate our business;
- our inability to meet the covenants of our credit facilities;
- our potential additional capital needs in order to maintain current growth rates, which may not be available on favourable terms or at all;
- our customers’ ability to choose not to buy products from us;
- changes in and difficulty in predicting consumer preferences for natural and organic food products;
- the highly competitive industry in which we operate;
- an interruption at one of our manufacturing facilities;
- the loss of service of our key management;
- the management of our supply chain;
- volatility in the prices of raw materials and energy;
- climate change legislation;
- dilution in the value of our common shares through the exercise of stock options, participation in our employee stock purchase plan and issuance of additional securities;
- impairment charges in goodwill or other intangible assets;
- technological innovation by our competitors;
- our ability to protect our intellectual property and proprietary rights;
- substantial environmental regulation and policies to which we are subject;
- significant food and health regulations to which SunOpta Foods is subject;
- agricultural policies that influence our operations;
- product liability suits, recalls and threatened market withdrawals that may be brought against our Company;
- litigation and regulatory enforcement concerning marketing and labeling of food products;
- our lack of management and operational control over Mascoma;
- loss of a key customer;
- fluctuations in exchange rates, interest rates and certain commodities;
| SUNOPTA INC. | 3 | January 1, 2011 10-K |
- our ability to effectively manage our growth and integrate acquired companies;
- adverse weather conditions, and
- the volatility of our operating results and share price.
Consequently all forward–looking statements made herein are
qualified by these cautionary statements and there can be no assurance that our
actual results or the developments we anticipate will be realized. The foregoing
factors should not be construed as exhaustive and should be read in conjunction
with the other cautionary statements that are included in this report. For a
more detailed discussion of the principal factors that could cause actual
results to be materially different, you should read our risk factors in Item 1A,
Risk Factors, included elsewhere in this annual report.
| SUNOPTA INC. | 4 | January 1, 2011 10-K |
PART I
Item 1. Business
Introduction
SunOpta Inc., a corporation organized under the laws of Canada in 1973, divides its operations into the following two industry segments:
-
SunOpta Foods, which accounted for approximately 91% of 2010 consolidated revenues.
-
Opta Minerals Inc. (“Opta Minerals”), which represented approximately 9% of 2010 consolidated revenues.
SunOpta Foods operates in the natural, organic and specialty foods and natural health product sectors. We believe these markets will continue to grow as consumers focus on health and wellness. SunOpta Foods is comprised of four separate operating groups:
-
Grains and Foods Group,
-
Ingredients Group,
-
Fruit Group, and
-
International Foods Group.
These groups use a combination of vertically integrated “seed to table” capabilities and preferred sourcing contracts combined with extensive processing and product development capabilities to serve the natural, organic and specialty foods and natural health product sectors.
Opta Minerals processes, sells and distributes silica-free loose abrasives and other specialty industrial minerals to the foundry, steel, loose abrasive cleaning, roofing shingle, construction and marine/bridge cleaning industries; sources specialty sands and garnets for the water filtration industry; and recycles inorganic materials under special permits from government authorities at both its Waterdown, Ontario and Norfolk, Virginia sites. The common shares of Opta Minerals are traded on the Toronto Stock Exchange (“TSX”), under the symbol “OPM.” We currently own 66.4% of its issued and outstanding common shares.
Segment Information
We report both of our industry segments - SunOpta Foods and Opta Minerals - as separate segments. Our assets, operations and employees are principally located in North America, and, to a lesser extent in Europe and other geographies due primarily to the 2007 acquisition of Newco a.s. (Slovak Republic) by Opta Minerals and the acquisitions in 2008 of The Organic Corporation B.V. (The Netherlands) by SunOpta Foods and MCP Mg-Serbien SAS (France) by Opta Minerals. Financial information for each segment describing revenues from external customers, a measure of profit or loss, and total assets for the last three fiscal years, as well as financial information about geographic areas for the last three fiscal years, is set forth in note 17 to the Consolidated Financial Statements.
Major Corporate Developments in 2010 and 2011
On December 20, 2010, we entered into a Sixth Amended and Restated Credit Agreement with a syndicate of financial institutions. The new credit facilities, which provide for asset-based, revolving credit facilities of up to $100,000 and Cdn $5,000 (subject to borrowing base availability), and non-revolving term credit facilities totaling $30,000, replaced the asset-based revolving and non-revolving term lines that existed in our previous credit facilities. The facilities mature on October 30, 2012.
On September 24, 2010, the Securities and Exchange Commission
(“SEC”) concluded their investigation in connection with the restatement of the
Company’s financial statements for each of the quarterly periods ended March 31,
2007, June 30, 2007 and September 30, 2007. The SEC reached a settlement with
the Company, Mr. Bromley, President and CEO, and Mr. Dietrich, the former CFO of
the Company. The settlement concluded the SEC’s inquiry.
| SUNOPTA INC. | 5 | January 1, 2011 10-K |
On September 1, 2010, we completed the sale of SunOpta BioProcess Inc. ("SBI") to Mascoma Canada Inc., a wholly-owned subsidiary of Mascoma Corporation ("Mascoma"). The combination of the two companies brings together SBI's fiber preparation and pretreatment technology with Mascoma's consolidated bioprocessing ("CBP") technology, to create a company with comprehensive capabilities for converting non–food cellulose (wood chips, energy crops and organic solid waste) into ethanol and high value co–products. As consideration for selling all of the outstanding common shares of SBI, we received a 19.61% ownership interest in Mascoma, which included a combination of preferred and common shares as well as warrants valued at $33,345, after settling the preferred share liability with the former SBI preferred shareholders. Before settling with the preferred shareholders, the transaction valued SBI at $50,925. Since the transaction, we have accounted for our ownership position in Mascoma on a cost basis and, as a result, have not included any of the financial results of Mascoma in our operational results. As at January 1, 2011, our ownership interest in Mascoma remains at 19.61%.
On July 7, 2010 we appointed Mr. Alan Murray to our Board of Directors. Mr. Murray brings strong business experience to the SunOpta Board of Directors with a background in manufacturing, business turn-around situations, business integration and profitable organic growth. Mr. Murray has lived and worked abroad including in Western and Eastern Europe and Africa. Most recently Mr. Murray served as President and CEO of Tetra Pak, North America.
On May 19, 2010 both the Ontario Superior Court of Justice and the United States District Court for the Southern District of New York approved an agreement to settle all claims raised in class action proceedings arising from our restatement of interim financial results for the first three quarters of 2007. The settlement became effective on June 17, 2010, upon expiry of the period for filing an appeal. In return for the dismissal of the class actions and releases from class members of settled claims against the Company and the named defendants, the settlement agreement provided for a total cash contribution of U.S. $11,250 (funded entirely by our insurer) to a settlement fund and the adoption of certain corporate governance enhancements. The settlement agreement contained no admission of wrongdoing by SunOpta or any of the other named defendants.
SUNOPTA FOODS
SunOpta Foods has been built through the acquisition of 23 business operations and through significant internal growth. It is a vertically integrated natural, organic and specialty foods and natural health products company, with global operations, serving domestic and international markets and representing approximately 91% of our consolidated revenues. Below is a summary listing of acquisitions and significant facilities that we have acquired since the inception of SunOpta Foods. The summary below does not include any acquisitions related to divestitures that occurred in 2010. See notes 2 and 3 of the Consolidated Financial Statements for further details of our most recent acquisitions and divestitures.
| Date of Acquisition | Business Operations Acquired |
| August 3, 1999 | Sunrich Inc (Grains and Foods Group) |
| August 15, 2000 | Certain assets of Hoffman Aseptic (Grains and Foods Group) |
| September 18, 2000 | Northern Food and Dairy, Inc. (Grains and Foods Group and Ingredients Group) |
| March 14, 2001 | First Light Foods Inc. (Grains and Foods Group) |
| December 4, 2002 | Opta Food Ingredients, Inc. (Ingredients Group) |
| May 8, 2003 | Kettle Valley Dried Fruit Ltd. (Fruit Group) |
| November 1, 2003 | SIGCO Sun Products, Inc (Grains and Foods Group) |
| December 1, 2003 | Sonne Labs, Inc. (Grains and Foods Group) |
| April 19, 2004 | Purchase of the assets of General Mills Bakeries & Foodservice oat fiber processing facility (Ingredients Group) |
| September 13, 2004 | 51% of the outstanding shares of Organic Ingredients, Inc. (The remaining 49% of the outstanding shares were acquired on April 5, 2005) (International Foods Group) |
| June 2, 2005 | Earthwise Processors, LLC (Grains and Foods Group) |
| June 20, 2005 | Cleugh’s Frozen Foods, Inc. (Fruit Group) |
| July 13, 2005 | Pacific Fruit Processors, Inc. (Fruit Group) |
| September 21, 2006 | Purity Life Health Products Limited (International Foods Group) |
| November 7, 2006 | Hess Food Group LLC (Fruit Group) |
| November 9, 2006 | Quest Brand of Vitamins (International Foods Group) |
| May 4, 2007 | Certain assets of Baja California Congelados, S.A. de C.V. (Fruit Group) |
| May 14, 2007 | Net operating assets of Congeladora del Rio, S.A. de C.V. and all of the outstanding shares of Global Trading Inc. (Fruit Group) |
| August 7, 2007 | Operating assets of a soymilk manufacturing facility in Heuvelton, New York (Grains and Foods Group) |
| December 6, 2007 | Neo-Nutritionals, Inc. (International Foods Group) |
| April 2, 2008 | The Organic Corporation (International Foods Group) |
| November 8, 2010 | Dahlgren & Company, Inc. (Grains and Foods Group) |
| December 14, 2010 | Assets of Edner of Nevada, Inc. (Fruit Group) |
| SUNOPTA INC. | 6 | January 1, 2011 10-K |
SunOpta Foods’ long-term strategy is to leverage the platform that has been developed via implementation of continuous improvement principles, new product development and a focus on value-added components of the business, and to continue to pursue selective acquisitions that align with the value-added components of our vertically integrated business model. We believe that the natural, organic and specialty foods and natural health products markets offer solid long-term growth opportunities as consumers focus on health and wellness and see diet as a key part of a healthy lifestyle. We also believe these markets remain fragmented with numerous players in North America and internationally.
Specific strategies of SunOpta Foods in the last several years have included the following.
-
Diversify the range of organic and non-genetically modified (“non-GMO”) grains-based and fruit-based products that we market, including via the acquisition of businesses that are vertically integrated from sourcing through ingredients and packaged products.
-
Develop value-added natural and organic fiber and food ingredient solutions to meet the demands of food manufacturers wanting to improve the healthfulness of their products or expand into the natural and organic markets.
-
Expand our ability to source and supply natural and organic food products worldwide.
-
Invest in healthy convenience and nutritious portable foods via both internal growth opportunities and acquisition, driven by our belief that this segment will continue to be a strong area of growth for natural and organic food products.
-
Expand the number of customer private label natural and organic programs including soy and alternative beverages, frozen fruit, fruit beverages and healthy convenience food categories.
-
Develop and expand our operations outside of North America via acquisitions or by entering into partnerships and strategic alliances with food producers internationally.
Major Developments in 2010 and 2011 in SunOpta Foods
We continue to improve our positioning in the natural, organic and specialty foods and natural health products sectors through internal growth and selective acquisitions. Achievements through February 28, 2011 include the following:
On December 14, 2010 we completed the acquisition of the assets and business of Edner of Nevada, Inc. ("Edner") for cash consideration and amounts payable for additional working capital of $4,458, plus an earnout based on pre-determined revenue targets over a five-year period. Edner produces a wide variety of nutritious portable foods such as nutrition bars and grains and fruit based snack bars serving the fast growing wholesome and convenient healthy snacks category from its 104,000 square foot facility, located in Carson City, Nevada. The completion of the acquisition of Edner should enable us to extend the breadth of our healthy snack offerings via the introduction of innovative new products utilizing the capabilities that exist within Edner.
On November 8, 2010 we completed the acquisition of 100% of the outstanding shares of Dahlgren & Company Inc. (“Dahlgren”) for cash consideration and amounts payable for additional working capital of $46,303, plus an earnout based on pre–determined earnings targets over a two–year period. Dahlgren is an integrated processor and global supplier of confection sunflower seed products including in–shell and kernel products, roasted sunflower and soy nuts, bird food, hybrid seed and other products. Dahlgren serves customers in the United States and Canada, as well as Europe, Asia, Australia and South America. The combination of the Dahlgren business with the Company’s existing confection sunflower business is expected to be synergistic and create one of the largest confection sunflower businesses in the world.
| SUNOPTA INC. | 7 | January 1, 2011 10-K |
On June 29, 2010 we entered into an exclusive agreement with Clearwater Country Foods of Genesee, Idaho, to market and distribute Clearwater's Garden Green Garbanzo™. Clearwater is a pioneer of sustainable green garbanzo bean production in the United States. Under the terms of the agreement, we are responsible for global sales and distribution of the Garden Green Garbanzo™ and Clearwater provides exclusive sourcing and supply services. Prior to signing the agreement we had been working with Clearwater for approximately eighteen months, performing extensive market analysis to assess the potential of the sustainable and healthy green garbanzo and hummus markets including applications for retail, food service and industrial customers.
On June 11, 2010 we completed the sale of our Canadian Food Distribution assets to UNFI Canada, Inc., a wholly-owned subsidiary of United Natural Foods, Inc., for cash consideration of $65,809 (Cdn $68,000). We realized a net gain on the sale of these assets, after tax, of $12,796. The divestiture of the Canadian Food Distribution assets was an important step in our strategy to focus on our core food manufacturing platform, further strengthening our balance sheet and positioning SunOpta for the future. The Canadian Food Distribution assets included in the sale formed part of the former SunOpta Distribution Group. Our Canadian based natural health products distribution and manufacturing assets which were also part of the SunOpta Distribution Group were not included in the sale.
On February 23, 2010, our Grains and Foods Group completed an upgrade and retrofit at our Alexandria, Minnesota aseptic processing and packaging facility and commenced the first production of natural broth and soup products for a major international packaged goods company. This upgrade gave us the capacity to produce approximately 250 million liters annually of natural and organic alternative beverages such as soy, rice, almond and others as well as broth and soup products and also expands our packaging size capabilities for these products for a variety of different formats. In tandem with the facility upgrade, the Grains and Foods Group entered into a three-year packaging agreement with a global consumer products company to produce aseptically processed and packaged natural broth products.
On January 27, 2010, we announced an environmentally responsible energy recovery project at our Cambridge, Minnesota oat fiber facility within our Ingredients Group. The project involves the extraction of methane from the digestion of waste-water resulting from the oat fiber production process, and subsequent conversion of that methane into pipeline quality natural gas used to help power the facility. This project was commissioned during the year and significantly reduced the amount of greenhouse gases and various waste materials emitted from the facility, as well as provided an acceptable return on invested capital as a result of lower utility expenses.
GRAINS AND FOODS GROUP
Operations and Product offerings – Grains and Foods Group
The Grains and Foods Group is headquartered in Minneapolis, Minnesota. It specializes in marketing organic, identity preserved (“IP”), and non-genetically modified organism (“GMO”) grains, ingredients, packaged goods and processing services with a core focus on soybean, sunflower and corn products. The Grains and Foods Group ensures that it provides its customers with high quality organic, non-GMO and IP specialty grains and seeds by serving as a grower’s supplier of seed, purchaser of the grower’s specialty crops and distributor of IP and organic specialty products. We believe this “seed to table” approach allows the Grains and Foods Group to meet the specific needs of domestic and foreign food manufacturers and processors by providing products in the varieties and quantities needed in a timely fashion; transporting products to meet customers’ needs by being able to package in containers, truck, rail or barge; providing product information and technical support during the growing, processing, and marketing phases; and offering complete product service including grading, formulation, processing, quality control and packaging.
The Grains and Foods Group’s products include:
| 1) |
A wide variety of IP, non-GMO and organic seeds and whole grains including soy, corn and sunflower for food applications offering premium varieties with superior food quality. The vertically integrated model results in control at every stage of production, from seed selection and growing to storage, processing and transportation. | |
|
| ||
| 2) |
Organic, non-GMO and IP grains based ingredients, including: |
-
Raw material sourcing and processing of soy based ingredients in liquid, spray-dried and roasted formats.
| SUNOPTA INC. | 8 | January 1, 2011 10-K |
-
Grain-based ingredients which utilize non-GMO and organic soy, corn, sunflower and rice; specialty organic functional ingredients including maltodextrins, tack blends, fiber products, flavor enhancing products including snack coatings, cheese powders and flavor systems, an innovative line of organic dairy ingredients and organic soy and sunflower oils.
| 3) |
A variety of packaged food products for retail and foodservice use, including: |
-
A wide variety of private label packaged products for a large number of retailers and consumer food companies, including aseptic and refrigerated soymilk, rice, almond and other alternate beverages; aseptic broths and soups; frozen edamame and vegetable blends; and roasted grain based snacks.
-
Branded food products under the Sunrich Naturals brand, including:
-
Alternative beverages – a variety of soy, rice, almond and sunflower based beverages for retail and foodservice.
-
Frozen vegetables – a variety of frozen edamame and vegetable blends for health food stores, foodservice operators and retail outlets.
-
Roasted grains-based snacks – specializing in providing healthy, natural and organic snacks to schools, daycare centers, retailers and healthcare facilities throughout North America. Products include in-shell sunflower and sunflower kernels, roasted corn and soy snacks.
| 4) |
A full range of bulk grain-based animal feed and pet food products. The premium feed products originate from select organic and non-GMO soy, corn, sunflower and other grains. |
The Grains and Foods Group also engages in processing and contract manufacturing services and offers a comprehensive range of services including basic grain cleaning, ingredient processing, custom roasting, and retail-ready packaging. With over 14 processing facilities throughout the United States plus a number of storage and office facilities, it can handle a range of order sizes, including barge lots, rail cars, bags, pallets, and retail packages. The Grains and Food Group services include:
-
Grain conditioning services for soy, corn and sunflower. The Grains and Foods Group’s advanced equipment and state-of-the-art technology for scalping and foreign matter removal is engineered to meet USDA Grain Standards for premium food grade seed and grain conditioning.
-
Grain milling for corn, oat and grain processing, with various granulations and batch sizing.
-
Ingredient processing expertise and equipment needed for extraction, separation and concentration of a wide variety of grains-based and dairy ingredients.
-
Liquid packaging through its aseptic packaging facilities, specializing in Tetra Pak equipment in a variety of pack sizes and offering a variety of opening types and extended shelf life options. The Grains and Foods group also partners with third party fillers to provide extended shelf life (ESL) refrigerated packaging formats to its customers.
-
Grains roasting and packaging through extensive facilities offering a wide range of consumer and bulk packaging.
Competition—Grains and Foods Group
The Grains and Foods Group competes with large grain suppliers for customers and competes with other companies active on the international commercial grain procurement market for supply. The Grains and Foods Group’s organic specialty grains compete in the smaller niche U.S. commercial organic grains market. Key to competing in these markets is access to transportation, supply and relationships with producers. The Grains and Foods Group’s aseptic and roasted packaged products facilities compete with a number of other regional manufacturers and ingredient offerings compete with a range of suppliers from small local companies through large multi-nationals.
| SUNOPTA INC. | 9 | January 1, 2011 10-K |
Distribution, Marketing, and Sales—Grains and Foods Group
The Grains and Foods Group has well established sales and marketing capabilities that have provided a base for its operations. As a leading provider of soy, corn, sunflower and grain-based food ingredients, it offers a comprehensive range of ingredients and services to the food industry. Distribution channels can vary greatly by product category, but the Grains and Foods Group enjoys a diverse ‘to market’ strategy in each product category. The Grains and Foods Group’s Organic, non-GMO and IP ingredients are sold to manufacturers worldwide. For specialty whole grain raw materials, approximately 50% of the customer base is international. Food ingredients are sold principally to customers in North America that range from major multi-nationals to smaller specialty innovative organic food makers, but is expanding geographically as the South African soy processing venture opens new international markets. The consumer goods distribution channels include private label and store brands, food service and also SunOpta-controlled brands. This wide array of sales and distribution avenues is expected to allow the Grains and Foods Group to maximize sales and margin while mitigating the risk of concentrating business in a single segment of the market.
Suppliers—Grains and Foods Group
The Grains and Foods Group has an extensive established IP, organic soy and corn grower network with approximately 2,500 producers, with many relationships existing for over 25 years, and relationships with approximately 1,000 sunflower farmers in the Midwest and southern U.S. Because weather conditions and other factors can limit the availability of certain grains in North America, our Grains and Foods Group is focused on expanding production and sourcing capabilities to other parts of the world in hand with the International Foods Group to ensure supply in years when local production is below normal levels. By diversifying supply, it also has the ability to divert available product based on market demand and customer requirements in order to maximize return.
INGREDIENTS GROUP
Operations and Product Offerings – Ingredients Group
The Ingredients Group is headquartered in Chelmsford, Massachusetts and operates from five processing facilities throughout the United States. It transforms both internally and externally sourced raw materials into value-added food ingredient solutions with a core focus on oat and soy fiber. The Ingredients Group is comprised of the previously acquired Northern Food & Dairy’s Fosston, Minnesota facility, Opta Food Ingredients, Inc., and the Cedar Rapids, Iowa oat fiber facility purchased in 2005 from General Mills. The Ingredients Group specializes in the technical processing of specialty food ingredients with a focus on non-GMO, natural, functional and organic offerings. It works closely with customers to identify product formulation, cost and productivity issues, and develops solutions to these problems based on proprietary, value-added, highly functional food ingredients and ingredient systems that use the Ingredients Group’s technical knowledge and manufacturing base.
The Ingredients Group is an innovator in the value-added food ingredients market with a technical selling and product applications focus. Based on our internal estimates, the Ingredients Group is the world’s largest supplier of oat fiber to the food industry, one of the largest producers of soy fiber in the United States and the largest producer of organic soy fiber in the United States. The Ingredients Group markets the Canadian Harvest ® Oat Fiber, SunOpta Soy Fibers, and SunOpta Pea Fiber brands of insoluble organic and conventional fiber products, Barley Balance™ soluble fiber, MultiFiber™ blends, SunOpta Soy Fiber blends, a number of value-added starch-based texturizers and proprietary stabilizer blends under the SunOpta Ingredient SystemsTM umbrella, and a number of custom processed ingredients including natural preservatives.
| SUNOPTA INC. | 10 | January 1, 2011 10-K |
The Ingredients Group continues to diversify its unique portfolio of products. Products are organized under three main technology platforms:
1) Fibers and Brans, including Canadian Harvest Oat Fibers and Stabilized Bran products as well as SunOpta Soy and Pea Fibers. Canadian Harvest Oat Fibers and SunOpta Soy and Pea Fibers are a family of insoluble fiber products derived from oat, soy and pea hulls. They are used commercially to increase the fiber content of cereals, breads, cookies and crackers to increase yield and enhance texture in ground meat products and to add strength and reduce breakage in products such as taco shells and ice cream cones. The Group also provides highly functional fiber blends for specific applications under the Multifiber™ brand name and a lineup of soy fiber blends. We also offer Canadian Harvest Stabilized Brans derived from oat, wheat and corn, as well as wheat germ. The Stabilized Brans are heat-treated to extend shelf life and ground to meet customer needs for appropriate particle size. One of our unique soy fibers is a protein and fiber rich by-product of soy concentrate manufacturing. This fiber is used to enrich protein and fiber for a variety of foods for human consumption plus animal feed and pet foods.
2) SunOptatm Ingredient Systems, including OptaGrade®, OptaMist®, and a portfolio of value added ingredient systems for the bakery, dairy, and meat industries. OptaGrade is a natural, starch-based texturizing agent that is used commercially in a variety of dairy products including natural, imitation, and processed cheeses, sour cream, cream cheese, and cottage cheese. OptaMist is also a starch-based texturizing agent that improves the taste, texture and appearance of dairy products, yogurt, cheese products, and salad dressings.
3) Custom ingredients and contract manufacturing services. We produce a number of unique functional food ingredients, and offer services to customers on a contract basis utilizing proprietary technologies.
We believe the Ingredients Group is well positioned to capitalize on the rapid growth of the health conscious natural and organic food markets, with its wide range of fiber, brans and starch-based products. Publications from both the American Dietetic Association and a Mayo Clinic Health letter note that fiber consumption is still below recommended levels in the U.S. The Canadian Harvest line of oat fibers and stabilized brans and SunOpta Soy and Pea Fibers and fiber blends are used in numerous products such as fiber-enriched breads and other baked goods, breakfast cereals and snack bars. These products can be used to increase total dietary fiber content of foods while minimizing negative effects on taste, texture and appearance. The Ingredients Group’s insoluble oat, soy and pea fibers enhance overall gastrointestinal health. Oat and soy fibers have become primary ingredients in breads, pastries, muffins, tacos and tortillas as food companies reformulate their products to include fiber-enriched ingredients. Recent innovations have expanded applications of fiber into dairy and meat products. Stabilized oat brans can be used as a source of soluble fiber (β-glucan) which is beneficial to cardiovascular health.
Our food ingredients are used by approximately 300 customers worldwide, including some of the largest U.S. consumer packaged food companies and quick service restaurant chains. The Ingredients Group’s product offering is sold internationally via approximately 25 distributors around the world.
Many of our starch-based texturizers and ingredient blends were originally developed for and are used in reduced fat versions of a variety of dairy products such as low fat or fat-free cottage cheese, sour cream, cream cheese, or processed cheeses. As discussed in “Taking the Fat Out of Food,” a publication of the United States Food and Drug Administration (“FDA”), reducing fat intake by consuming reduced fat versions of these products is an element of a healthier diet.
In addition to helping food manufacturers improve the healthfulness of their food products, the ingredients can be used to improve the overall quality of food products, reduce formulation costs, and meet specific processing requirements. We believe that all of our products are Generally Regarded As Safe (“GRAS”) under current FDA regulations (see “Regulation – SunOpta Foods”, below).
The Ingredients Group markets a portfolio of functional fibers including organic and conventional pea fiber via a distribution agreement with Best Cooking Pulses of Portage la Prairie, Canada. The production of pea fiber is highly sustainable, non-allergenic, non-GMO, and gluten free. It is approved by Health Canada as a novel fiber for inclusion in bakery and meat products.
The Ingredients Group also represents Polycell Technologies to market and sell Barley Balance™ beta-glucan concentrate. Barley Balance™ is the most concentrated source of barley beta-glucan soluble fiber produced by a natural and sustainable process. Barley Balance™ contains a minimum of 25% beta-glucan and over 35% dietary fiber adding excellent nutritional benefits and functional performance to food and beverage products.
| SUNOPTA INC. | 11 | January 1, 2011 10-K |
Over the last 18 months, the Ingredients Group has launched a line of new products under the MultiFiber™ brand name. Internally developed, MultiFiber™ products are highly functional blends of fibers that meet the needs of customers who are looking for a cost effective, easy-to-source fiber for fortification while meeting specific textural goals. All MultiFiber™ products deliver a concentrated source of dietary fiber with a smooth texture and bland flavor. These new and innovative ingredients are expected to provide value for food and beverage manufacturers who are looking for ratios of soluble and insoluble fibers similar to what occurs naturally in foods.
Competition—Ingredients Group
Food ingredients are considered unique niche items usually developed or processed for specific customers or industry segments. The Ingredients Group competes with other product developers and specialty processors for the specialty ingredient business.
The food ingredients industry is very competitive. Competitors include major companies with food ingredient divisions, other food ingredient and sourcing companies, other insoluble and soluble fiber processors and consumer food companies that also engage in the development and sale of food ingredients. Many of these competitors have financial and technical resources as well as production and marketing capabilities that are greater than ours.
Distribution, Marketing, and Sales—Ingredients Group
Sales and marketing is done through a technically oriented customer account team. We believe that the most effective way to solve each customer’s problem is to gain a thorough understanding of the customer at all levels, build solid working relationships throughout the customer’s organization, be knowledgeable of the market segment in which the customer competes, and have a detailed technical understanding of the customer’s needs as well as its preferred solution. We take a multidisciplinary approach to achieve this level of customer understanding and service. Members of the Ingredient Group’s direct sales force are teamed up with the appropriate technical personnel to work as “consultants” in defining and developing a range of potential solutions to our customer’s formulation and product development needs.
Suppliers—Ingredients Group
The Ingredients Group’s raw materials and packaging are sourced from approximately 65 suppliers with availability subject to world market conditions. There are a number of alternative sources of supply for all raw materials with critical supply relationships highlighted below. Oat and soy hulls are primarily sourced from major food companies or their brokers and there is adequate supply to meet current production requirements. Dairy ingredients are purchased primarily from dairy producer cooperatives. Products are purchased in the spot market with certain ingredients purchased under short-term supply contracts. Supply shortfalls would have an effect on availability and price and would be reflected in finished product pricing for the Ingredients Group. Certain other raw materials are supplied by processing customers and are not sourced directly from suppliers within SunOpta Foods.
FRUIT GROUP
Operations and Product Offerings – Fruit Group
The Fruit Group is headquartered in Buena Park, California and focuses on providing natural and organic fruit and vegetable-based products to the private label retail, food service and industrial markets. The Fruit Group comprises two separate operating divisions:
1) Fruit Specialties which includes our
frozen foods, fruit ingredients and brokerage operations, and
2) Healthy
Snacks which includes our healthy fruit snacks division and the assets of the
recently-acquired Edner of Nevada, Inc.
We believe the Fruit Group is well positioned in the natural and organic frozen fruit and vegetable and healthy fruit and nutritional snack markets. The business has adjusted to profitability pressures through the rationalization of operations, product mix and go-to-market strategies which has provided increased processing flexibility and a reduced cost base along with the implementation of internal cost improvement initiatives. Our global sourcing and production capabilities, coupled with extensive product development expertise is expected to provide a solid platform for future growth.
| SUNOPTA INC. | 12 | January 1, 2011 10-K |
We estimate that the Fruit Group is the largest supplier of organic individually quick-frozen fruit to the private label retail market in the United States, and the largest supplier of natural and organic private label fruit snacks in the United States, providing its customers with a wide range of products including bulk raw materials, value-added ingredients and retail solutions. It services over 500 customers, including food manufacturers, food service distributors, quick-service and casual dining restaurants and retail companies located principally in North America and Asia.
The Fruit Group’s two divisions are described below.
Fruit Specialties Division. The Fruit Specialties division consists of both fruit processing and fruit ingredient operations. The fruit processing operations consist of facilities with processing and packaging capabilities, as well as sourcing and trading capabilities provided by our food brokerage operation. This division processes strawberries, peaches, mangos and other fruits and vegetables, and packs natural and organic frozen fruits and vegetables for the private label retail, food service, and industrial ingredient markets. It sources fruits, berries, and vegetables from various growing regions throughout the United States, Mexico and other fruit growing regions around the world, and processes the material into individually quick-frozen, block frozen, strawberry sugar packs and purees to meet our customer’s technical specifications. Fruit Specialties supplies frozen fruit products to the private label retail, food service and industrial markets, including food manufacturers and quick service and casual dining restaurants. Our poly-bag packaging operations in Buena Park, California provide retail customers with a wide range of private label natural and organic frozen fruits and vegetables, including strawberries, blueberries, raspberries, blackberries, peaches, mangos, tropical fruit, green garbanzos and many other items. We operate three berry processing facilities located in Buena Park, California, and Rosarito and Irapuato, Mexico. We have ceased fresh strawberry processing at our Buena Park facility and are focusing efforts on our poly-bag operations for the retail market. We have idled our Mexican operations for 2011, and are assessing strategic options for these facilities.
Pacific Fruit Processors, located in South Gate, California produces a range of value-added fruit ingredients in aseptic and conventional formats for sale to food manufacturers, restaurants and food service operations.
Raw materials consist primarily of strawberries, peaches, pineapples, mangos, honeydew melons, cantaloupes, and other fruits. The Fruit Specialties division faces competition when securing the raw materials required to meet its needs; however, due to the location of our processing facilities, we are able to source raw materials from a number of growing regions and suppliers. We also source frozen fruits and vegetables from a number of domestic and worldwide growers, processors and traders, including our own International Foods Group.
Healthy Snacks Division. The Healthy Snacks division produces natural and organic fruit snacks and nutritional bars. It operates processing facilities in Omak, Washington and Carson City, Nevada. During 2007 and 2008, fruit snack operations were significantly expanded at the Omak facility by adding capacity for an additional 140 million units per year, doubling through-put. In late 2010 the Group acquired the assets of Edner of Nevada, a producer of a wide range of nutritious portable foods such as nutrition bars. The primary raw material, apple, is sourced from local growers and internationally from our own International Foods Group. Production capabilities include a variety of fruit-based bar, twist, rope and bite size shapes, as well as the ability to add a variety of ingredients including fiber, plus a range of baked and extruded nutrition bars using a wide variety of ingredients including grains, sweeteners and other ingredients. The Healthy Snacks division has internal research and development capabilities to introduce innovative products to the marketplace.
Competition—Fruit Group
The fruit processing operations compete with strawberry processors primarily in California and Mexico and frozen fruit imports from Mexico, South America, Europe and Asia. The competitive landscape includes companies with financial resources larger than ours. In many cases, Mexican, South American, European and Asian competitors are able to achieve greater cost efficiencies due to lower relative costs of living and costs of supply in these regions. The location of our processing facilities in Mexico and California provides us with a diversified supply base for our customers due to extended supply seasonality.
The fruit ingredient operations compete with regional and national food manufacturers, and face research and development competition from those same companies. A number of these competitors have production capabilities and financial resources that are greater than ours.
| SUNOPTA INC. | 13 | January 1, 2011 10-K |
The Healthy Snacks division has a smaller number of competitors, some of whom have production and technical capabilities and financial resources greater than ours. These competitors include independent fruit snack manufacturers, fruit snack divisions of larger food manufacturers and nutrition bar manufacturers.
Distribution, Marketing and Sales—Fruit Group
The fruit processing operations supply frozen fruit products to the private label retail, food service and industrial markets, including food manufacturers and quick service and casual dining restaurants.
The fruit ingredient operations supply natural and organic value-added fruit ingredients to the dairy, food service and beverage industries. It offers fruit bases and preps for customers seeking high-quality, custom formulations to meet their special flavor and texture profiles. Applications include fruit for yogurts, ice creams, cheeses, smoothies, shakes, frozen desserts, bakery fillings, health bars, various beverages, dressings, marinades, dips and sauces. The fruit ingredient operations’ research and development team is integral to its reputable product quality and customer service. Manufacturing capabilities include aseptic and conventional processing and packaging.
The Healthy Snacks division focuses on supplying natural and organic fruit snacks and nutrition bars to branded food companies and the private label retail markets and intends to expand distribution globally due to the portable nature of these products.
Suppliers—Fruit Group
The fruit processing operations source fresh and frozen fruits, berries, and vegetables from a large number of suppliers throughout California, Mexico and globally.
The fruit ingredient operations’ primary raw materials are sourced from processors and traders of frozen fruits and vegetables, including our own International Foods and fruit processing operations, major sweetener producers, and a number of regional and national flavor companies. Availability of supplies is subject to world market conditions, including quantity and quality of supply.
The Healthy Snacks division’s raw material suppliers include growers and traders of apples and apple concentrates and flavor companies, as well as processors and traders of fruit and grain products including our own International Foods Group. This division is subject to the availability of fruit and grains supply which is subject to conditions which may be beyond our control.
INTERNATIONAL FOODS GROUP
Operations and Product Offerings – International Foods Group
The International Foods Group operations are centred in Santa Cruz, California, Amsterdam, the Netherlands and Acton, Ontario, Canada. It is comprised of SunOpta Food Solutions, The Organic Corporation and Purity Life Health Products. SunOpta Food Solutions utilizes its extensive sourcing and product development expertise to produce a range of product solutions for the private label retail and food service markets. The Organic Corporation operates a factory in Dalian, China that supplies food grade organic soybeans and feed, organic sunflower kernels and other grains, sourcing and processing operations in Ethiopia for organic coffee and organic sesame seeds, plus a number of global sourcing and trading operations. The group’s natural health products operation, Purity Life Health Products, maintains processing and packaging facilities in Brantford, Ontario and Rockwood, Ontario and warehousing operations in Acton, Ontario and Vancouver, British Columbia.
The International Foods Group sources raw material ingredients from approximately 60 countries around the world, and, in our estimation, is the largest supplier of a wide range of organic commodities to the food industry in the European, North American and Asian markets.
| SUNOPTA INC. | 14 | January 1, 2011 10-K |
The International Foods Group provides organic food solutions to major global food manufacturers and distributors, and major U.S. supermarket chains with a variety of industrial and private label retail products. It sources or produces organic fruit and vegetable-based ingredients, sweeteners, cocoa, coffee, grains, nuts, seeds and pulses and other organic food products from virtually every continent and in both hemispheres to ensure quality of supply, minimize crop risk and provide contra-seasonal solutions to our customers. In many cases, we will enter into exclusive arrangements with growers and/or processors of key strategic commodities to control the reliability of our supply chain. Utilizing a number of strategic and/or exclusive co-pack relationships and an experienced research and development team, we are able to provide our retail customers, distributors and food service operators with organic private label turn-key solutions in a variety of product categories, including juices, frozen fruits and vegetables, specialty beverages, vitamin waters, electrolyte waters, energy drinks, soups and tomato products.
Our Canadian-based natural health products division distributes approximately 5,500 SKUs of natural vitamins, supplements and health and beauty aids, many of which are formulated, processed and packaged within our vertically integrated manufacturing operations and sold under company owned brands including Herbon™, Vivitas™, Nature’s Harmony™ and Quest™.
Competition—International Foods Group
The organic food industry is very competitive due primarily to the limited worldwide supply of organic raw materials. Our competitors in the supply of industrial ingredients include domestic and worldwide brokers, traders and food processors. In the private label retail market, competitors include major food manufacturing companies, some of which have production and technical capabilities more extensive than ours. Our natural health products division competes against much larger conventional distributors; however, we believe that we are Canada’s largest distributor of natural health products. We also compete with a handful of national distributors and a diverse group of much smaller regional distributors.
Distribution, Marketing and Sales—International Foods Group
The International Foods Group operates administrative, research and development offices in Santa Cruz, California, Amsterdam, The Netherlands and Acton, Ontario.
Sales and marketing is conducted through technically oriented sales teams strategically located close to specific geographic sourcing and/or sales regions. The International Foods Group maintains one of the largest global sourcing and supply networks in the world, working closely to manage global organic supply and link these supplies with diverse customer needs and also provides procurement support for other SunOpta operations. We believe our natural health products division is the largest distributor of natural health products in Canada.
Suppliers—International Foods Group
The International Foods Group’s raw material suppliers include growers, processors and traders of organic fruit and vegetable-based ingredients, sweeteners and other food products. Raw materials are sourced from growing regions worldwide, including North America, South America, Central America, Europe, Africa and Asia. Organic food suppliers are required to meet stringent organic certification requirements equivalent to the United States Department of Agriculture (“USDA”) National Organic Program, European Union standards or others. Our natural health products division sources product from approximately 175 suppliers, primarily in North America.
Regulation – SunOpta Foods
SunOpta Foods is affected by a wide range of governmental regulations and policies in various countries and regions where we operate, including the United States, Canada, the Netherlands, and throughout the rest of the European Union. These laws, regulations and policies are implemented, as applicable in each jurisdiction, on the national, federal, state, provincial and local levels. For example, SunOpta Foods is affected by laws and regulations related to: seed, fertilizer and pesticides; the purchasing, harvesting, transportation and warehousing of grain and other products; the processing, packaging and sale of food, including wholesale operations; and product labelling and marketing, food safety and food defence. SunOpta Foods is also affected by government-sponsored price supports, acreage set aside programs and a number of environmental regulations.
| SUNOPTA INC. | 15 | January 1, 2011 10-K |
U.S. Regulations
USDA National Organic Program and Similar Regulations
SunOpta Foods is involved in the sourcing, manufacturing, supplying, processing, marketing, selling and distribution of organic seed and food products and, as such, is subject to certain organic quality assurance standards. In December 2000, the USDA adopted regulations with respect to a national organic labelling and certification program which became fully effective in October 2002. These regulations, among other things, set forth the minimum standards producers must meet in order to have their products labelled as “certified organic.” We currently manufacture and distribute a number of organic products that are covered by these regulations. Additionally, our organic products may be subject to U.S. various state regulations. Applicable regulatory agencies in the United States include the USDA, which monitors both the organic process and agricultural grain business, and the FDA and Department of Homeland Security (“DHS”), which oversee the safety, security and efficacy of the food supply in the United States.
FDA GRAS
Certain food ingredients are regulated under the 1958 Food Additive Amendments to the Federal Food, Drug and Cosmetic Act of 1938 (“FDCA”) as administered by the FDA. Pre-marketing approval by the FDA is required for the sale of a food additive unless we believe the substance is generally regarded as safe (“GRAS”) under FDA standards. A food additive is a substance, “the intended use of which results or may reasonably be expected to result, directly or indirectly, either in their becoming a component of food or otherwise affecting the characteristics of food.” Such pre-marketing approval for ingredients that are not GRAS, which is issued in the form of formal regulation, requires demonstrating that both the food ingredient is safe under its intended conditions of use, and that it achieves the function for which it is intended.
Companies may establish GRAS status through “self-affirmation” whereby the producer determines on its own that the ingredient is GRAS, normally with the assistance of a panel of qualified experts. The producer may also voluntarily submit a “GRAS Notification” to the FDA that includes the products description, conditions of use, and the basis for GRAS determination, among other information. The FDA response, typically within 180 days, to a GRAS notice is not an approval and the product may be marketed while the FDA is reviewing the information.
A food ingredient is eligible for GRAS classification based on the “views of experts qualified by scientific training and experience to evaluate the safety” of the product. The expert’s views are either based on scientific procedures or through experience based on common use of the material prior to 1958. If based on scientific procedures they must use the same quantity and quality of scientific evidence as would be required for the FDA to issue a pre-market approval of the sale of a food additive. If a food ingredient is not entitled to GRAS status, pre-market approval must be sought through the filing of a Food Additive Petition.
Many of SunOpta Food’s products are being marketed pursuant to GRAS self-affirmation. We believe that a majority of products for which we have retained commercial rights are GRAS. However, such status cannot be determined until actual formulations and uses are finalized. Thereafter, we decide whether self-affirmation procedures and a GRAS notification will be appropriate. For those components that do not qualify for GRAS, we may be required to file a Food Additive Petition. In the event that a petition is required, we may elect to sell or license its rights to manufacture, market, and distribute the component to another party.
Other U.S. Environmental, Food Safety and Food Labelling Regulations
SunOpta Foods is also subject to various U.S., state and local environmental regulations. Some of the key environmental regulations in the U.S. include but are not limited to the following.
Air Quality Regulations. Air quality is regulated by the United States Environmental Protection Agency (“EPA”) and certain city/state air pollution control groups. Emission reports are filed annually.
Waste Treatment/Disposal Regulations. Solid waste is either disposed of by a third-party or, in some cases, we have a permit to haul and apply the sludge to land. Agreements exist with local city sewer districts to treat waste at specified levels of Biological Oxygen Demand (“BOD”), Total Suspended Solids (“TSS”) and other constituents. This can require weekly/monthly reporting as well as annual inspection. There are specific regulations governing the recycling of solid waste material regulated by the Ministry of Environment and Energy and the Commonwealth of Virginia, Department of Environmental Quality.
| SUNOPTA INC. | 16 | January 1, 2011 10-K |
Sewer Regulations. We have agreements with the local city sewer districts to treat waste at specified limits of BOD and TSS. This requires weekly/monthly reporting as well as annual inspection.
Hazardous Chemicals Regulations. Various reports are filed with local city/state emergency response agencies to identify potential hazardous chemicals being used in our facilities, including reports filed with the Department of Public Safety Emergency Response Commission in Minnesota and the Kentucky Emergency Response Commission.
Storm Water. All facilities are inspected annually and must comply with an approved storm water plan to protect water supplies.
Bioterrorism Compliance. We are currently subject to the four recognized and approved sections of the Bioterrorism Preparedness and Response Act of 2002.
SunOpta Foods is also subject to various other U.S., state and local food safety and food labeling regulations. Some of the key food safety and food labeling regulations in the U.S. include but are not limited to the following, in addition to those described above.
Food Safety and Food Defense. In 2011, the Food Safety Modernization Act (“FSMA”) became effective significantly expanding the authority of the FDA and imposing new regulation of food production, sales and imports. Much uncertainty remains concerning how FSMA will be implemented by FSDA. No rulemaking has yet occurred concerning any of the provisions in FSMA.
Food Labeling. We are subject to certain requirements for food labeling under the FDCA. Other state and local statutes and regulations may impose additional food labeling requirements. For instance, the California Safe Drinking Water and Toxic Enforcement Act of 1986 (commonly referred to as “Proposition 65”) requires, with a few exceptions, that a specific warning appear on any consumer product sold in the State of California that contains a substance, above certain levels, listed by that state as having been found to cause cancer or birth defects. This law exposes all food and beverage producers to the possibility of having to provide warnings on their products.
FTC Enforcement. The FTC retains jurisdiction over marketing and labeling of food products. For example, the FTC has recently released its revised Green Guides for the marketing of eco-friendly products.
Canadian and Other Non-U.S. Regulations
Countries other than the U.S. also regulate the sale of food ingredients or characterize food ingredients differently. Vitamin and minerals supplements in the U.S. are regulated pursuant to the Dietary Supplement Health and Education Act, which regulates these products as foods. Regulations vary substantially from country to country, and we take appropriate steps to comply with such regulations.
In Canada, the sale of food, natural health products (NHPs), drugs, and cosmetics are regulated under various federal and provincial laws, but are principally regulated federally under Canada’s Food and Drugs Act, Canada Agricultural Products Act, and the Canadian Environmental Protection Act, 1999 (“CEPA”) and supporting regulations. Some of the key regulations in Canada include but are not limited to the following:
Natural Health Products Regulations: Natural health products are regulated by Health Canada. In 2004, Health Canada published a compliance policy and guide which had the practical effect of temporarily relaxing enforcement of the NHP Regulations to assist regulated parties to become compliant. This relaxation of enforcement is expected to end some time during 2011. However, the Unprocessed Product Licence Applications Regulations (UPLAR) came into force in August 2011 and provides a legal framework for NHPs to obtain an exemption from the Natural Health Products Regulations while a product licence application is in process. UPLAR is set to be repealed in February 2013, by which time full compliance with the NHP Regulations will likely be required for all NHPs without any possibility of an exemption.
Food and Drug Regulations: Food and drugs are subject to specific regulatory requirements, which include without limitation, composition, (including without limitation food additives, fortification, and food standards), packaging, labelling, advertising and marketing, and licencing requirements.
| SUNOPTA INC. | 17 | January 1, 2011 10-K |
Cosmetic Regulations: Cosmetics are subject to composition and labelling requirements. We must also file cosmetic notification forms, a post-marketing requirement for those cosmetics manufactured in Canada and a pre-market requirement for those products imported into Canada. Health Canada also publishes a Hot List of cosmetic ingredients it deems unsafe in cosmetics.
Organic Products Regulations: As of June 30, 2009, the Organic Products Regulations require mandatory certification to the revised National Organic Standard for agricultural products to be represented as organic in international and interprovincial trade, or that bear the federal organic agricultural product legend (or federal logo). But for certain exceptions and conditions, there is currently a U.S.-Canadian equivalence arrangement, whereby agricultural product produced and processed in conformity with the United States Organic Foods Production Act and the National Organic Program Regulations is deemed to have been produced and processed in accordance with the Organic Products Regulations.
Waste Treatment/Disposal Regulations: There are specific regulations governing the recycling of solid waste material regulated by various Provincial regulatory agencies. Many of the Provinces operate stewardship programs for consumer product waste, as well as hazardous or special waste. These waste diversion programs require that the brand owner or a first importer of the designated materials to register, file reports on the materials it supplies for sale or use in the provincial market and remit fees under the stewardship program.
Substance Regulations: Various regulations under CEPA regulate the importation and use of certain substances in Canada. For example, prior to the importation and use in products, the importer must ensure that all ingredients are found on the Domestic Substances List (“DSL”) maintained by Environment Canada. In the event that an ingredient is not found on the DSL, then subject to the amount of the substance imported into Canada and used in products sold in Canada, a filing may become necessary under the New Substances Notification Regulations. In addition, the Canadian Government has undertaken a review of ingredients used in commerce for regulated products we sell, with a view of determining whether the use of certain ingredients in these products represent a risk to the environment. This could eventually lead to the removal of certain ingredients in Canada.
Canada Consumer Product Safety Act: This Act is expected to come into force on June 20, 2011. This Act and its regulations will provide greater oversight and regulation of consumer products with respect to manufacturers, importers, and retailers. It will include, without limitation, the ability to require product recalls, mandatory incident reporting, document retention requirements, increased fines and penalties, and packaging and labeling requirements. While the Canada Consumer Product Safety Act will not apply to food, drugs, or natural health products, it is expected that there will be similar amendments introduced to the Food and Drugs Act, to capture the essence of the regulatory oversight found in the Canada Consumer Product Safety Act.
All of SunOpta Food’s Canadian manufacturing facilities and warehouses are registered with the Canadian Food Inspection Agency (“CFIA”), which monitors food processing and safety in Canada, and/or Health Canada. All of SunOpta Food’s Canadian import sites for drug and natural health products are licenced with Health Canada to import such products (Site Licence for natural health products and Establishment Licence for drugs). All imported materials are shipped in compliance with the notification systems that alert the FDA, Health Canada, the CFIA and customs before the materials enter the country. We are confident that we have the necessary processes and controls in place that provide for an additional level of traceability of all raw materials from the supplier to the immediate subsequent recipient of the finished products. We also recognize and believe that we have the necessary programs to administer a product recall as may be required.
As a result of our acquisition of The Organic Corporation headquartered in the Netherlands, we are now subject to Dutch and European Commission (“EC”) regulations and policies. The Organic Corporation is involved in the sourcing, supplying, marketing, selling and distribution of organic food products and, as such, is subject to standards for production, labeling and inspection of organic products contained in EC Regulation 2092/91 (and its subsequent amendments). The Organic Corporation is certified by SKAL, the inspection body for the production of organic products in the Netherlands. Products certified as organic by a European Union recognized inspection body, such as SKAL, an organization that certifies organic products in the Netherlands, can be marketed within the entire European Union.
The Organic Corporation is also affected by general food legislation both at a European Union and Dutch level relating to product safety and hygiene, among others. The Organic Corporation is Hazard Analysis and Critical Control Point (“HACCP”) certified in the Netherlands and manages a fully computerized system that guarantees the traceability of each product. In addition, The Organic Corporation also considers and abides by European Union and local legislation with regard to packaging and packaging waste.
| SUNOPTA INC. | 18 | January 1, 2011 10-K |
Research and Development – SunOpta Foods
Research and development and new product innovation are key priorities of SunOpta Foods and initiatives are focused on continuous improvement of our existing product portfolios and production processes as well as the development of innovative new products. Innovation is a key pillar for us and a necessity in the natural and organic foods and natural health product categories.
SunOpta Food’s extensive applications and research and development expertise is organized around five key product categories:
- Grains and grain-based ingredients through finished packaged products;
- Value-added ingredients focused on fiber based applications;
- Fruit, juices and fruit-based ingredients through finished packaged products;
- Value-added nutritious healthy snacks and portable foods; and
- Natural health products sold via certain owned brands within Purity Life.
Our product development teams include highly trained and experienced food scientists and technologists that are dedicated to both the development of unique new product offerings plus addressing product development opportunities for our customers including new and custom formulations, innovations in packaging formats, and new production processes and applications. Applications and technical support provided by each of our operating groups to our customers include all aspects of product development from concept to commercial launch as well as ongoing manufacturing and processing support. Representatives from our operating groups also meet regularly to coordinate efforts to develop products which leverage the talents and product capabilities from across our organization.
SunOpta Foods continues to develop new products to maximize the capabilities of our aseptic packaging facilities in Modesto, California and Alexandria, Minnesota. In addition to new soy-based beverages, new products include beverages using alternative ingredients such as almonds and sunflower. These products address the growing consumer demand for non-dairy based beverages. In addition, we have developed products such as teas, broths, and soups. The expanding interest to incorporate soy and grain-based foods in consumers’ diets also creates numerous opportunities to develop ingredients that can be incorporated into food developers’ menu items.
In addition, SunOpta Foods continues to expand its product portfolio via the addition of new fiber offerings that can be used with its oat-derived ingredients to improve the nutritional content and functionality of a variety of foods. Demand for food fibers has continued to grow and we believe that this is a long-term trend due to an increased focus on healthy foods. Many of our ingredient solutions can be used in products that aid in satiety to respond to the growing epidemic of obesity in North America and elsewhere. Many of our ingredients can also be used in products which qualify for a “whole grain” claim by augmenting the insoluble and soluble fiber content of foods.
SunOpta Foods also continues to develop new fruit-based beverages, healthy fruit snacks as well as innovative fruit ingredient systems for the dairy, food service and beverage industries. We are also looking at using fiber and other ingredients in these fruit products to improve their ability to address satiety and lower glycemic indices.
More recently, we have focused resources on developing new life stage, gender specific natural health products which address the different nutritional needs of men, women, boys and girls at different stages of life as well as new portable snack foods to address continued demand for “on-the-go” nutritional products.
Intellectual Property – SunOpta Foods
The nature of a number of SunOpta Food’s products and processes requires that we create and maintain patents, trade secrets and trademarks. Our policy is to protect our technology, brands and trade names by, among other things, filing patent applications for technology relating to the development of our business in the U.S. and in selected foreign jurisdictions, and registering trademarks in the U.S., Canada and selected foreign jurisdictions where we sell products.
SunOpta Food’s success will depend, in part, on our ability to protect our products, trade names and technology under U.S. and international patent laws and other intellectual property laws. We believe that we own or have sufficient rights to use all of the proprietary technology, information and trademarks necessary to manufacture and market our products; however, there is always a risk that patent applications relating to our products or technologies will not result in patents being issued, or, if issued, will be later challenged by a third party, or that current or additional patents will not afford protection against competitors with similar technology.
| SUNOPTA INC. | 19 | January 1, 2011 10-K |
We also rely on trade secrets and proprietary know-how and confidentiality agreements to protect certain technologies and processes. Even with these steps taken, our outside partners and contract manufacturers could gain access to our proprietary technology and confidential information. All employees are required to adhere to internal policies which are intended to further protect our technologies, processes and trade secrets.
Employees – SunOpta Foods
SunOpta Foods has approximately 1,595 full-time employees as of January 1, 2011. Aside from unions at our Mexican facilities in the Fruit Group and the International Foods Group, there are no other unions within SunOpta Foods.
Properties – SunOpta Foods
SunOpta Foods operates 29 processing facilities (16 owned, 13 leased) in ten U.S. states as well as Canada, Mexico, China and Ethiopia. SunOpta Foods also owns and leases a number of office and distribution locations and also leases and utilizes public warehouses to satisfy its storage needs. For more details see Item 2. Properties, elsewhere in this report.
OPTA MINERALS
Opta Minerals, a majority-owned subsidiary, is a vertically integrated provider of custom process solutions and industrial minerals products for use primarily in the steel, foundry, loose abrasive cleaning, roof shingle granules and municipal water filtration industries. Experiencing solid growth since 1996, we believe Opta Minerals has become one of the leading suppliers of industrial minerals and silica-free loose abrasives in a number of select markets in North America and Eastern Europe.
We acquired Opta Minerals (formerly known as Barnes Environmental and Industrial) in 1995. Since then, Opta Minerals has grown steadily through a combination of internal growth and strategic acquisitions in eastern and central Canada, eastern, central and southeastern United States, France and Slovakia: George F. Pettinos (Canada) Limited (PECAL) and Temisca, Inc. were acquired in 2000; Virginia Materials Inc. and 51% of International Materials & Supplies Inc. were acquired in 2001, with the remaining 49% minority interest in International Materials & Supplies acquired in 2002; Distribution A&L was acquired in 2004; certain assets of the abrasive division of Hillcrest Industries Inc. were acquired in 2005; Magnesium Technologies Corporation and Bimac Inc. were acquired in October 2006; Newco was acquired in 2007; and 67% of MCP Mg-Serbien was acquired in 2008, with the remaining 33% interest acquired in 2009. During 2009 and 2010 two new loose abrasive processing operations in the United States were commissioned.
In February 2005, we sold approximately 29% of the outstanding common shares of Opta Minerals as part of an initial public offering. As part of our acquisition of Newco a.s. in 2007, Opta Minerals issued an additional 1,000,000 common shares which, when combined with the issuance of employee option grants, has reduced our equity ownership in Opta Minerals to approximately 66.4% . The common shares of Opta Minerals trade on the TSX under the symbol “OPM”.
Major Developments in 2010 and 2011 in Opta Minerals
During 2010, the global production of steel and the demand for metallurgical slag-based abrasive products increased compared to the prior year. As a result, Opta Minerals has steadily increased production at most of its facilities. Gross margins have improved largely as a result of the increased sales volumes and the impact of cost reduction measures implemented by management.
Opta Minerals has established abrasive processing operations in Texas and Florida in order to cost-effectively supply southern regions of the United States. The Texas facility has been fully operational since the fourth quarter of 2009, and the Florida facility became operational in the third quarter of 2010.
| SUNOPTA INC. | 20 | January 1, 2011 10-K |
Operations and Product Offerings – Opta Minerals
Opta Minerals competes primarily in the industrial minerals and silica free abrasives markets, focusing to date on select markets in the eastern, southern and central areas of North America and in Europe. It’s operating and distribution facilities are located in Indiana, Michigan, Virginia, Louisiana, South Carolina, Maryland, Texas, Florida, New York, Ontario, Quebec, the Slovak Republic and France. Its successful integration of its business acquisitions into its existing operations and financial management systems has created synergies that have increased revenues and profit margins. It has invested in improving plant equipment and infrastructure and has been able to reduce costs while growing production capabilities. As a result, we believe that Opta Minerals is currently well-positioned to expand current operations with modest capital expenditures.
Its principal product lines include the following: (i) blends of industrial minerals used primarily in heavy industrial applications; (ii) silica-free abrasives; and (iii) specialty sands, filtration media and other products and services.
Products
Opta Minerals produces, manufactures, distributes and recycles industrial minerals, silica-free abrasives and specialty sands and other products and services to the foundry, steel, loose abrasive cleaning, roofing granule, marine/bridge cleaning and municipal, recreational and industrial water filtration industries.
-
Industrial Minerals - Opta Minerals sells industrial mineral products primarily to the foundry and steel industries. Significant industrial minerals products produced by Opta Minerals include chromites, magnesium blends, lime, nozzle sands, clays, coated sands and a wide range of foundry pre-mixes.
-
Silica-Free Abrasives - Opta Minerals abrasive products are primarily sold into shipbuilding, ship repair, bridge cleaning and roofing granule markets. The abrasives produced are free of silica, making them a clean, efficient and recyclable alternative to traditional abrasives. Recycling operations are conducted at Waterdown, Ontario and Norfolk, Virginia. This is an important service that Opta Minerals provides to its customers which results in the reuse of materials that would otherwise be sent directly to landfills. Significant silica-free abrasive products produced by Opta Minerals include BlackBlast, Ultra Blast, EconoBlast, EbonyGrit, Powerblast, Garnet and other specialty abrasives.
-
Specialty Sands and Other Products and Services - Opta Minerals also generates revenues from the sale of specialty sands, filtration media and other products and technical services. The silica sands are not sold for use as an abrasive material. Significant specialty sands and other products and services of Opta Minerals include filtration and industrial sands, garnets for filtration and waterjet cutting, construction sands, golf bunker sand, silica (not sold for loose abrasive applications), colored sand and technical services.
Properties
Opta Minerals’ operations encompass and service much of North America, with production facilities located in Louisiana, South Carolina, Texas, Florida, Virginia, Maryland, New York, Michigan, Indiana, Ontario and Quebec, allowing us to maintain a strong customer base throughout North America by providing economic supply and timely delivery of products and services to our customers. In addition to our manufacturing facilities, we also own and operate distribution and packaging centers in Ontario and Quebec. Opta Minerals has built or acquired facilities at locations along the east and southern coasts of the United States where major shipbuilding, ship repair, bridge cleaning and roofing shingle production activities are concentrated. Multiple facilities allow for fast and economic service and have enabled us to broaden our product lines to supply wider markets and applications from these facilities.
Opta Minerals’ operations in Kosice, Slovakia and Romans-sur-Isere, France service major integrated steel mill customers as well as a variety of other industries in Europe and represent a platform for continued growth in European markets.
For more details, see Item 2. Properties, elsewhere in this report.
| SUNOPTA INC. | 21 | January 1, 2011 10-K |
Competition
Industrial Minerals
The industrial minerals industry
is characterized by a number of large public and private companies that service
the bulk of requirements for both the foundry and steel industry. These
companies include Foseco Steel, Stollberg Group, SKW Mettalurgie Gmbh, Magnesium
Elektron and Prince Minerals and tend to have broad product offerings that
service a range of customer requirements. The remaining market requirements are
fulfilled by small regionally based niche companies with limited product lines
that generally focus on local markets.
Silica-Free Abrasives
The silica-free abrasives
industry is characterized by a number of regionally-based companies with limited
product lines tending to focus on geographically adjacent markets. Our
competition varies by product line, customer classification and geographic
market. Opta Minerals conducts business throughout North America with a focus on
key regions including the Québec-Detroit corridor, New York, Virginia, Georgia,
Florida and Texas, all of which are areas of high volume ship repairs and bridge
cleaning activities.
Specialty Sands and Other Products and Services
Competition within the specialty sand and other niche markets serviced by
Opta Minerals is characterized by a number of small, regionally-based
competitors. Competition varies by product line, customer classification and
geographic market.
In both abrasive and industrial minerals markets, Opta Minerals competes through a combination of exceptional product quality and customer service combined with competitive pricing.
Distribution, Marketing and Sales
Opta Minerals has an active program to develop and acquire new products and services that expand our target markets while leveraging our existing infrastructure and expertise. We offer one of the broadest ranges of industrial minerals and abrasives in the industry and can provide customer product configurations solutions for almost every type of application. Opta Minerals conducts business throughout North America and key areas of Europe, via a direct sales force supported by strong technical and operational resources, with a focus on high volume industrial mineral consumption regions. Our facilities are strategically located near customers or raw material supplies to economically and efficiently distribute products.
Suppliers
As is customary in the industry, Opta Minerals does not have long-term contracts with its major suppliers. Although we believe that we have access to similar products from competing suppliers, any disruption in the source of supply, particularly of the most commonly used or exclusively sourced items, or any material fluctuation in the quality, quantity or cost of such supply, could have a material adverse effect on the results of operations and financial condition.
Opta Minerals obtains key abrasive raw materials such as magnesium, lime, coal slag, copper slag, nickel slag and garnet from a wide variety of global sources. Copper slag is supplied by both domestic and foreign mining and refining companies. Coal slag is supplied on an exclusive basis from U.S. power plants and other suppliers. Opta Minerals produces industrial garnet derived from a waste mining stream at its Keeseville, New York facility. In addition, we have agreements with multiple mines in China and suppliers in India to market their garnet in North and South America. We also purchase significant quantities of magnesium for our mill and foundry services operations from manufacturers located primarily in China, Eastern Europe and the Middle East.
Regulation
Opta Minerals’ business primarily involves the handling of inorganic and mineral-based materials. These types of materials are generally benign and are not expected to give rise to environmental issues. Almost all of our environmental regulation is standard to the industry with the exception of certain permits required in Ontario and Virginia to recycle various types of solid waste. The Ontario Ministry of Environment has the right to inspect the Waterdown, Ontario site and review the results of third party monitoring and perform its own testing. Similar rights of inspection by the EPA and state regulators exist at the facility in Norfolk, Virginia. At both locations, we are subject to monthly reporting and periodic audits as well as having a financial bond in place with the respective governments should there be a contamination.
| SUNOPTA INC. | 22 | January 1, 2011 10-K |
Since we acquired the business in 1995 (and, with respect to the businesses we have acquired, since the respective acquisition dates thereof), we believe Opta Minerals has been in material compliance with all applicable environmental legislation and has not been subject to any actions by regulatory authorities. Based on known existing conditions, all facilities are currently in material compliance with all environmental permitting requirements of the local authorities and are reviewed on an annual basis. These permits generally cover air and ground water at those facilities where applicable. Absent any currently unforeseen changes to applicable legislation, we anticipate that future costs relating to environmental compliance will not have a material adverse effect on our financial position.
Employees
Opta Minerals has been successful in identifying, attracting and retaining talented employees with relevant technical and industry expertise. In particular, we have assembled an experienced management team with a diverse and complementary set of skills and experience, both within and from outside of the industry.
As of January 1, 2011, Opta Minerals had 211 active employees, including 20 employees in sales and marketing, 27 in corporate administration and finance, 9 in customer service, 24 in engineering and plant management, 5 in research and development and quality control, 2 in purchasing and the remaining 124 in production.
CORPORATE SERVICES GROUP
The corporate office of SunOpta is located on owned premises in Brampton, Ontario. Centralized information technology and financial shared services groups are located in Minnesota. We employ 60 staff members in a variety of management, financial, information technology and administration roles.
Environmental Hazards
We believe, with respect to both our operations and real property, that we are in material compliance with environmental laws at all of our locations and specifically with the requirements of its Certificate of Approval issued by the Ontario Ministry of the Environment and Energy on the Opta Minerals property in Waterdown, Ontario.
Employees
As of January 1, 2011, we had a total of 1,866 employees broken out by segment below:
| Divisions | Number of Employees |
| SunOpta Foods | 1,595 |
| Opta Minerals | 211 |
| Corporate Services Group | 60 |
| Total | 1,866 |
We believe that our relations with both union and non-union employees are good.
Available Information
Our annual reports on Form 10-K, quarterly reports on Form 10-Q, current reports on Form 8-K, and amendments to those reports filed or furnished pursuant to Section 13(a) or 15(d) of the Securities Exchange Act of 1934 (the “Exchange Act”), are available free of charge on our website at www.sunopta.com as soon as reasonably practicable after we file such information electronically with, or furnish it to, the SEC and applicable Canadian securities regulatory authorities.
| SUNOPTA INC. | 23 | January 1, 2011 10-K |
Item 1A. Risk Factors
Our business, operations and financial condition are subject to various risks and uncertainties, including those described below and elsewhere in this report. We believe the most significant of these risks and uncertainties are described below, any of which could adversely affect our business, financial condition and results of operations and could cause actual results to differ materially from the results contemplated by the forward-looking statements contained in this report. In such case, the trading price of our common stock could decline, and you may lose all or part of your investment. There may be additional risks and uncertainties not presently known to us or that we currently consider immaterial. Consequently, you should not consider the following to be a complete discussion of all possible risks or uncertainties applicable to our business. These risk factors should be read in conjunction with the other information in this report and in the other documents that we file from time to time with the SEC and the OSC.
We have continuing indemnification obligations relating to our recent dispositions
On June 11, 2010, we sold our Canadian Food Distribution assets (the “CFD Transaction”) to UNFI Canada, Inc. (“UNFI”), and on September 1, 2010, we sold 100% of our ownership in SunOpta BioProcess Inc. (the “SBI Transaction”) to Mascoma Canada Inc. (“Mascoma”). Pursuant to the terms of the agreements governing the CFD Transaction and the SBI Transaction, we agreed to indemnify the purchasers for losses incurred due to breaches of specified representations, warranties and covenants and for certain other matters, subject to the limitations set forth in those agreements. With respect to the SBI Transaction, in support of our indemnification obligations, certain of the shares of common stock and preferred stock of Mascoma issued to us in connection with the SBI Transaction are being held in escrow to satisfy any indemnification claims made by Mascoma following the closing. If UNFI, Mascoma or their respective affiliates make indemnification claims against us and are successful in those indemnification claims, we may become liable for money damages to the indemnified parties, or we may lose our rights to our Mascoma shares (with respect to the SBI Transaction). Also, any indemnification claims could require us to incur substantial expense and our management may have to devote a substantial amount of time resolving or defending against such claims. Any such payment or expense relating to an indemnification claim could significantly reduce the benefits that we anticipated receiving from the applicable transaction and could adversely affect our business, financial condition and results of operations.
Our credit agreement restricts how we may operate our business, and our business may be materially and adversely affected if these restrictions prevent us from implementing our business plan
We have a credit agreement providing for various credit facilities including a primary facility with a syndicate of lenders. Our credit agreement contains covenants that limit the discretion of our management with respect to certain business matters. These covenants place restrictions on, among other things, our ability to incur additional indebtedness, to create other liens, to complete a merger, amalgamation or consolidation, to make certain distributions or make certain payments, investments and guarantees and to sell or otherwise dispose of certain assets. These restrictions may hinder our ability to execute on our growth strategy or prevent us from implementing parts of our business plan.
Our inability to meet the covenants of our credit facilities could materially and adversely affect our business
On December 20, 2010, we entered into a Sixth Amended and Restated Credit Agreement with a syndicate of lenders and Bank of Montreal as agent. The credit agreement provides for asset-based, revolving credit facilities of up to $100,000 and Cdn $5,000 (subject to borrowing base availability), and non-revolving term credit facilities totaling $30,000. The facilities mature on October 30, 2012.
Although we believe that we are well positioned to comply with the financial covenants under the credit agreement, compliance with these financial covenants will depend on the success of our business, our operating results, and our ability to achieve the financial forecasts set forth in the credit agreement. Various risks, uncertainties and events beyond our control could affect our ability to comply with the financial covenants and terms of the credit agreement. Failure to comply with our financial covenants and other terms could result in an event of default and the acceleration of amounts owing under the credit agreement, unless we were able to negotiate a waiver. The lenders could condition any such waiver on an amendment to the credit agreement on terms that may be unfavourable to us. If we are unable to negotiate a covenant waiver or replace or refinance our credit agreement on favourable terms or at all, our business will be adversely impacted.
| SUNOPTA INC. | 24 | January 1, 2011 10-K |
We may require additional capital to maintain current growth rates, which may not be available on favourable terms or at all
Over the last eleven years, we have grown via a combination of internal growth and acquisitions requiring available resources. Our ability to raise capital, through equity or debt financing, is directly related to our ability to both continue to grow and improve returns from our operations. Debt or equity financing may not be available to us on favourable terms or at all. In addition, an equity financing would dilute our current shareholders and may result in a decrease in our share price if we are unable to realize returns equal to or above our current rate of return. We will not be able to maintain our growth rate and our strategy as a consolidator within the natural and organic food industries without continued access to capital resources.
Our customers generally are not obligated to continue purchasing products from us
Many of our customers buy from us under purchase orders, and we generally do not have agreements with or commitments from these customers for the purchase of products. We cannot assure you that our customers will maintain or increase their sales volumes or orders for the products supplied by us or that we will be able to maintain or add to our existing customer base. Decreases in our customers’ sales volumes or orders for products supplied by us may have a material adverse effect on our business, financial condition or results of operations.
Consumer preferences for natural and organic food products are difficult to predict and may change
Approximately 91% of our 2010 revenues were derived from SunOpta Foods. Our success depends, in part, on our ability to offer products that anticipate the tastes and dietary habits of consumers and appeal to their preferences on a timely and affordable basis. A significant shift in consumer demand away from our products or products that utilize our integrated grains, ingredients, fruits and natural health products, or our failure to maintain our current market position, could reduce our sales and harm our business. Consumer trends change based on a number of possible factors, including nutritional values, a change in consumer preferences or general economic conditions. Additionally, there is as a growing movement among some consumers to buy local food products in an attempt to reduce the carbon footprint associated with transporting food products from longer distances, which could result in a decrease in the demand for food products and ingredients that we import from other countries or transport from warmer domestic growing regions. These changes could lead to, among other things, reduced demand and price decreases, which could have a material adverse effect on our business.
We operate in a highly competitive industry
We operate businesses in highly competitive product and geographic markets in the U.S., Canada and various international markets. The Grains and Foods Group, the Ingredients Group, the International Foods Group and the Fruit Group compete with various U.S. and international commercial grain procurement marketers, major companies with food ingredient divisions, other food ingredient companies, stabilizer companies, trading companies, consumer food companies that also engage in the development and sale of food ingredients and other food companies involved in natural and organic fruits. Our natural health products division of the International Foods Group competes against other companies that market and sell vitamins, supplements, natural health products, health and beauty aids that provide specialty or high end packaged products. These competitors may have financial resources and staff larger than ours and may be able to benefit from economies of scale, pricing advantages and greater resources to launch new products that compete with our offerings. We have little control over and cannot otherwise affect these competitive factors. If we are unable to effectively respond to these competitive factors or if the competition in any of our product markets results in price reductions or decreased demand for our products, our business, results of operations and financial condition may be materially impacted.
An interruption at one of our manufacturing facilities could negatively affect our business
We own or lease, manage and operate a number of manufacturing, processing and packaging facilities located throughout the U.S., Canada, Mexico, Europe, China and Ethiopia. As of January 1, 2011, SunOpta Foods operates 29 processing facilities located in ten U.S. states, Canada, Mexico, China and Ethiopia. Opta Minerals operates 14 facilities located in the United States, Canada and Eastern Europe.
An interruption in or the loss of operations at one or more of these facilities, or the failure to maintain our labor force at one or more of these facilities, could delay or postpone production of our products, which could have a material adverse effect on our business, results of operations and financial condition until we could secure an alternate source of supply.
| SUNOPTA INC. | 25 | January 1, 2011 10-K |
If we lose the services of our key management, our business could suffer
Our prospects depend to a significant extent on the continued service of our key executives, and our continued growth depends on our ability to identify, recruit and retain key management personnel. We are also dependent on our ability to continue to attract, retain and motivate our sourcing, production, distribution, sales, marketing and other personnel. We do not carry key person life insurance on any of our executive officers. If we lose the services of our key management or fail to identify, recruit and retain key personnel, our business, results of operations and financial condition may be materially and adversely impacted.
If we do not manage our supply chain effectively, our operating results may be adversely affected
Our supply chain is complex. We rely on suppliers for our raw materials and for the manufacturing, processing and distribution of many of our products. The inability of any of these suppliers to deliver or perform for us in a timely or cost-effective manner could cause our operating costs to rise and our margins to fall. Many of our products are perishable and require timely processing and transportation to our customers. Many of our products can only be stored for a limited amount of time before they spoil and cannot be sold. We must continuously monitor our inventory and product mix against forecasted demand or risk having inadequate supplies to meet consumer demand as well as having too much inventory that may reach its expiration date. If we are unable to manage our supply chain efficiently and ensure that our products are available to meet consumer demand, our operating costs could increase and our margins could fall.
Volatility in the prices of raw materials and energy could increase our cost of sales and reduce our gross margins
Raw materials used by SunOpta Foods and Opta Minerals represent a significant portion of our cost of sales. Our cost to purchase services and materials, such as grains, fruits and other commodities, processing aids, industrial minerals and natural gas, can fluctuate depending on many factors, including weather patterns, economic and political conditions and pricing volatility. In addition, we must compete for limited supplies of these raw materials and services with competitors having greater resources than us. If our cost of materials and services increases due to any of the above factors, we may not be able to pass along the increased costs to our customers.
SunOpta Foods enters into a number of exchange-traded commodity futures and options contracts to partially hedge its exposure to price fluctuations on grain transactions to the extent considered practicable for minimizing risk from market price fluctuations. Futures contracts used for hedging purposes are purchased and sold through regulated commodity exchanges. Inventories, however, may not be completely hedged, due in part to our assessment of exposure from expected price fluctuations and an inability to hedge all raw materials.
Exchange purchase and sales contracts may expose us to risks that a counter party to a transaction is unable to fulfill its contractual obligation. We may be unable to hedge 100% of the price risk of each transaction due to timing and availability of hedge contracts and third party credit risk. In addition, we have a risk of loss from hedge activity if a grower does not deliver the commodity as scheduled. We also monitor the prices of natural gas and will from time to time lock in a percentage of our natural gas needs based on current prices and expected trends.
An increase in our cost of sales resulting from an increase in the price of raw materials and energy would have an adverse impact on our financial condition and results of operations.
Climate change legislation could have an impact on our financial condition and consolidated results of operations
Legislative and regulatory authorities in the U.S., Canada and internationally will likely continue to consider numerous measures related to climate change and greenhouse gas emissions. In order to produce, manufacture and distribute our products, we and our suppliers, use fuels, electricity and various other inputs that result in the release of greenhouse gas emissions Concerns about the environmental impacts of greenhouse gas emissions and the global climate change may result in environmental taxes, charges, regulatory schemes, assessments or penalties, which could restrict or negatively impact our operations, as well as our suppliers, who would likely pass all or a portion of their costs along to us. We may not be able to pass any resulting cost increases along to our customers. Any enactment of laws or passage of regulations regarding greenhouse gas emissions or other climate change legislation by the U.S., Canada or any other international jurisdiction where we conduct business could adversely affect our financial condition and consolidated results of operations.
| SUNOPTA INC. | 26 | January 1, 2011 10-K |
Adverse weather conditions could impose costs on our business
Our various food products, from seeds and grains to ingredients, fruits, vegetables and other inputs, are vulnerable to adverse weather conditions, including windstorms, floods, droughts, fires and temperature extremes, which are quite common but difficult to predict. Additionally, severe weather conditions may occur with higher frequency or may be less predictable in the future due to the effects of climate change. Unfavourable growing conditions can reduce both crop size and crop quality. In extreme cases, entire harvests may be lost in some geographic areas. These factors can increase costs, decrease revenues and lead to additional charges to earnings, which may have a material adverse effect on our business, results of operations and financial condition.
The exercise of stock options, participation in our employee stock purchase plan and issuance of additional securities could dilute the value of our common shares
As of January 1, 2011, there were outstanding stock options to purchase 2,348,100 of our common shares, with exercise prices ranging from $0.91 to $13.75 per common share. The exercise of these stock options could result in dilution in the value of our common shares and the voting power represented thereby. Furthermore, to the extent common shares are issued pursuant to the exercise of stock options, the employee stock purchase plan or other issuances of common shares, our share price may decrease due to the additional amount of common shares available in the market. The subsequent sales of these shares could encourage short sales by our shareholders and others which could place further downward pressure on our share price. Moreover, the holders of our stock options may hedge their positions in our common shares by short selling our common shares, which could further adversely affect our stock price.
Impairment charges in goodwill or other intangible assets could adversely impact our financial condition and consolidated results of operations
As a result of our acquisitions, a portion of our total assets is comprised of intangible assets and goodwill. We are required to perform impairment tests of our goodwill and other intangible assets annually or at any time when events occur that could affect the value of our intangible assets. We have previously recorded impairment charges to our consolidated statements of operations. We expect to engage in additional acquisitions, which may result in our recognition of additional intangible assets and goodwill. A determination that impairment has occurred would require us to write-off the impaired portion of our goodwill or other intangible assets, resulting in a charge to our earnings. Such a write-off could adversely impact our financial condition and consolidated results of operations.
Technological innovation by our competitors could make our food products less competitive
Our competitors include major food ingredient and consumer food companies that also engage in the development and sale of food and food ingredients. Many of these companies are engaged in the development of food ingredients and other food products and frequently introduce new products into the market. Existing products or products under development by our competitors could prove to be more effective or less costly than our products.
We rely on protection of our intellectual property and proprietary rights
The success of SunOpta Foods depends in part on our ability to protect our intellectual property rights. We rely primarily on patent, copyright, trademark and trade secret laws to protect our proprietary technologies. Our policy is to protect our technology by, among other things, filing patent applications for technology relating to the development of our business in the United States and in selected foreign jurisdictions.
Our trademarks and brand names are registered in the U.S., Canada and other jurisdictions. We intend to keep these filings current and seek protection for new trademarks to the extent consistent with business needs. We also rely on trade secrets and proprietary know-how and confidentiality agreements to protect certain of the technologies and processes used by SunOpta Foods.
The failure of any patents, trademarks, trade secrets or other intellectual property rights to provide protection to our technologies would make it easier for our competitors to offer similar products, which could result in lower sales or gross margins.
| SUNOPTA INC. | 27 | January 1, 2011 10-K |
We are subject to substantial environmental regulation and policies
We are, and expect to continue to be, subject to substantial federal, state, provincial and local environmental regulation. Some of the key environmental regulations to which we are subject include air quality regulations of the EPA and certain city/state air pollution control groups, waste treatment/disposal regulations, including but not limited to specific regulations of the Ontario Ministry of Environment and Energy and the Commonwealth of Virginia, Department of Environmental Quality, sewer regulations under agreements with local city sewer districts, regulations governing hazardous substances, storm water regulations and bioterrorism regulations. For a more detailed summary of the environmental regulations and policies to which we are subject, see “Business – Regulation – SunOpta Foods” in Item 1 of this report. Our business also requires that we have certain permits from various state, provincial and local authorities related to air quality, storm water discharge, solid waste, land spreading and hazardous waste.
In the event that our safety procedures for handling and disposing of potentially hazardous materials in certain of our businesses were to fail, we could be held liable for any damages that result and any such liability could exceed our resources. We may be required to incur significant costs to comply with environmental laws and regulations in the future. In addition, changes to environmental regulations may require us to modify our existing plant and processing facilities and could significantly increase the cost of those operations.
The foregoing environmental regulations, as well as others common to the industries in which we participate, can present delays and costs that can adversely affect business development and growth. If we fail to comply with applicable laws and regulations, we may be subject to civil remedies, including fines, injunctions, recalls or seizures, as well as potential criminal sanctions, which could have a material adverse effect on our business, results of operations and financial condition. In addition, any changes to current regulations may impact the development, manufacturing and marketing of our products, and may have a negative impact on our future results.
SunOpta Foods is subject to significant food and health regulations
SunOpta Foods is affected by a wide range of governmental regulations in Canada, the United States, and several countries in Europe, among others. These laws and regulations are implemented at the national level (including, among others, federal laws and regulation in Canada and the United States) and by local subdivisions (including, among others, state laws in the United States and provincial laws in Canada). We are also subject to regulations of the European Union. We are also subject to the regulatory authority of regulatory agencies in several different countries. Examples of regulatory agencies influencing our operations include: the U.S. Department of Agriculture, the U.S. Food and Drug Administration, the U.S. Department of Homeland Security, the U.S. Environmental Protection Agency, the Canadian Food Inspection Agency and SKAL (a European agency based in The Netherlands responsible for the certification of organic products) among others.
Examples of laws and regulations that affect SunOpta Foods include laws and regulations applicable to:
- the use of seed, fertilizer and pesticides;
- the purchasing, harvesting, transportation and warehousing of grain and other products;
- the processing and sale of food, including wholesale operations; and
- the product labeling and marketing of food and food products, food safety and food defense.
These laws and regulations affect various aspects of our business. For example, as described in more detail under “Business – Regulation – SunOpta Foods” in Item 1 of this report, certain food ingredient products manufactured by SunOpta Foods are regulated under the 1958 Food Additive Amendments of FDCA, as administered by the FDA. Under the FDCA, pre-marketing approval by the FDA is required for the sale of a food ingredient which is a food additive unless the substance is generally regarded as safe, or GRAS, under the conditions of its intended use by qualified experts in food safety. We believe that most products for which we have retained commercial rights are GRAS. However, such status cannot be determined until actual formulations and uses are finalized. As a result, we may be adversely impacted if the FDA determines that our food ingredient products do not meet the criteria for GRAS. In addition, certain USDA regulations, set forth the minimum standards producers must meet in order to have their products labeled as “certified organic” and we currently manufacture and distribute a number of organic products that are covered by these regulations. While we believe our products and our supply chain are in compliance with these regulations, changes to food regulations may increase our costs to remain in compliance. We could lose our “organic” certification if a facility becomes contaminated with non-organic materials or if we do not use raw materials that are certified organic. The loss of our “organic” certifications could materially harm our business, results of operations and financial condition.
| SUNOPTA INC. | 28 | January 1, 2011 10-K |
As described in more detail under “Business – Regulation – SunOpta Foods” in Item 1of this report, certain of our natural health products are also subject to regulations under federal Canadian legislation, including the Food and Drug Act (Canada), the Pest Control Products Act (Canada), Natural Health Products Regulation (Canada) and the regulations made thereunder and the Environmental Protection Act (Canada).
Changes in any government laws and regulations applicable to our operations could increase our compliance costs, negatively affect our ability to sell certain products or otherwise adversely affect our results of operations. In addition, while we believe SunOpta Foods is in material compliance with all laws and regulations applicable to our operations, we cannot assure you that we have been, or will at all times be, in compliance with all food production and health requirements, or that we will not incur material costs or liabilities in connection with these requirements. Our failure to comply with any laws, regulations or policies applicable to our business could result in fines, lawsuits, enforcement actions, penalties or loss in the ability to sell certain products, any of which could adversely affect our business, results of operations and financial condition.
Our operations are influenced by agricultural policies
SunOpta Foods is affected by governmental agricultural policies such as price supports and acreage set aside programs and these types of policies may affect our business. The production levels, markets and prices of the grains and other raw products that we use in our business are materially affected by government programs, which include acreage control and price support programs of the USDA. Revisions in these programs, in the United States and elsewhere, could have an adverse affect on the results of our operations.
Product liability suits, recalls and threatened market withdrawals, could have a material adverse effect on our business
The sale of food products for human consumption involves the risk of injury or illness to consumers. Such injuries may result from inadvertent mislabeling, tampering by unauthorized third parties or product contamination or spoilage. Under certain circumstances, we may be required to recall or withdraw products, which may lead to a material adverse effect on our business. Even if a situation does not necessitate a recall or market withdrawal, product liability claims might be asserted against us. While we are subject to governmental inspection and regulations and believe our facilities and those of our co-packers comply in all material respects with all applicable laws and regulations, if the consumption of any of our products causes, or is alleged to have caused, a health-related illness in the future we may become subject to claims or lawsuits relating to such matters. Even if a product liability claim is unsuccessful or is not fully pursued, the negative publicity surrounding any assertion that our products caused illness or physical harm could adversely affect our reputation with existing and potential customers and consumers and our corporate and brand image. Moreover, claims or liabilities of this sort might not be covered by our insurance or by any rights of indemnity or contribution that we may have against others. We maintain product liability insurance in an amount that we believe to be adequate. However, we cannot be sure that we will not incur claims or liabilities for which we are not insured or that exceed the amount of our insurance coverage. A product liability judgment against us or a product recall could have a material adverse effect on our business, consolidated financial condition, results of operations or liquidity.
Litigation and regulatory enforcement concerning marketing and labeling of food products
The marketing and labeling of any food product in recent years has brought increased risk that consumers will bring putative class action lawsuits and that the FTC and/or state attorney generals will bring legal action concerning the truth and accuracy of the marketing and labeling of the product. Examples of causes of action that may be asserted in a putative consumer class action lawsuit include fraud, unfair trade practices, recession, and breach of state consumer protection statutes (such as Proposition 65 in California). FTC and/or state attorney generals may bring legal action that seeks removal of a product from the market-place, fines and penalties. Even when not merited, putative class claims, action by the FTC or state attorneys general enforcement actions can be expensive to defend and adversely affect our reputation with existing and potential customers and consumers and our corporate and brand image.
| SUNOPTA INC. | 29 | January 1, 2011 10-K |
Our lack of management and operational control over Mascoma may limit our ability to protect or increase the value of our interest in Mascoma
Following the SBI Transaction, we have a 19.61% ownership interest in Mascoma, through a combination of preferred and common shares. We do not have the ability to exercise day–to–day control over Mascoma. The management team of Mascoma could make business decisions that could impair the economic value of our interest in Mascoma. In addition, we have no ability to cause Mascoma to take actions that might be to our benefit, including but not limited to actions relating to a change of control of Mascoma and declarations of dividends to Mascoma’s stockholders. For the foregoing reasons, we may be unable to prevent actions that could have an adverse impact on our investment in Mascoma.
Loss of a key customer could materially reduce revenues and earnings
Although we had no customers that represented over 10% of revenues for the year ended January 1, 2011, the loss or cancellation of business with any of our larger customers could materially and adversely affect our business, financial condition or results of operations.
Fluctuations in exchange rates, interest rates and certain commodities could adversely affect our results of operations, financial condition and liquidity
We are exposed to foreign exchange rate fluctuations as our Canadian, Mexican and European operations are translated into United States dollars for financial reporting purposes. We are exposed to changes in interest rates as a portion of our debt bears interest at variable rates. We are exposed to price fluctuations on a number of commodities as we hold inventory and enter into transactions to buy and sell products in a number of markets. Additional qualitative and quantitative disclosures about these risks can be found in Item 7A of this report. As a result of these exposures, fluctuations in exchange rates, interest rates and certain commodities could adversely affect our liquidity, financial condition and results of operations.
We may not be able to effectively manage our growth and integrate acquired companies
From time to time we may pursue acquisition opportunities that are consistent with our overall growth strategy. Our ability to effectively integrate recent and future acquisitions, including our ability to realize potentially available marketing opportunities and cost savings in a timely and efficient manner will have a direct impact on our future results. We may encounter problems in connection with the integration of any new businesses, such as challenges relating to the following:
-
integration of an acquired company’s products into our product mix;
-
the amount of cost savings that may be realized as a result of our integration of an acquired product or business;
-
unanticipated quality and production issues with acquired products;
-
adverse effects on business relationships with our suppliers and customers;
-
diversion of management attention;
-
difficulty with personnel and loss of key employees;
-
implementation of an integrated enterprise wide accounting and information system and consolidation of back office accounting;
-
compatibility of financial control and information systems;
-
exchange rate risk with respect to our acquisitions outside the United States;
-
potential for patent and trademark claims or other litigation against or involving the acquired company; and
-
in the case of foreign acquisitions, uncertainty regarding foreign laws and regulations and difficulty integrating operations and systems as a result of cultural, systems and operational differences.
| SUNOPTA INC. | 30 | January 1, 2011 10-K |
Our operating results and share price are subject to significant volatility
Our net sales and operating results may vary significantly from period to period due to:
-
changes in our operating expenses;
-
management’s ability to execute our business strategies focused on improved operating earnings;
-
personnel changes;
-
legal and administrative cases (whether civil, such as environmental or product related, or criminal), settlements, judgments and investigations;
-
supply shortages; and
-
general economic conditions.
In addition, our share price may be highly volatile compared to larger public companies. Certain announcements could have a significant effect on our share price, including announcements regarding:
-
fluctuations in financial performance from period to period;
-
mergers, and acquisitions and/or divestitures;
-
changes in key personnel;
-
strategic partnerships or arrangements;
-
litigation and governmental inquiries;
-
changes in governmental regulation and policy;
-
patents or proprietary rights;
-
changes in consumer preferences and demand;
-
new financings; and
-
general market conditions.
Higher volatility increases the chance of larger than normal price swings which reduces predictability in the share value of our stock and could impair investment decisions. In addition, price and volume trading volatility in the stock markets can have a substantial effect on our share price, frequently for reasons other than our operating performance. These broad market fluctuations could adversely affect the market price of our common shares.
Item 1B. Unresolved Staff Comments – None.
| SUNOPTA INC. | 31 | January 1, 2011 10-K |
Item 2. Properties
Our primary facilities in each of our segments are as follows:
SunOpta Foods
As of January 1, 2011, SunOpta Foods operates from the following locations which are owned unless otherwise noted.
| Location | State/Province/Country | Group/Sub Group | Facility Description |
| Brampton | Ontario | Corporate Head Office | Corporate head office |
| Minnetonka (2 Leases) (1) | Minnesota | Corporate Services | IT Corporate and Grains and Foods office |
| Hope | Minnesota | Grains and Foods | Grains head office and grain processing |
| Alexandria | Minnesota | Grains and Foods | Aseptic packaging facility |
| Alexandria | Minnesota | Grains and Foods | Ingredient processing |
| Modesto (Lease) (2) | California | Grains and Foods | Soy processing and packaging plant |
| Wahpeton | North Dakota | Grains and Foods | Processing, warehouse and distribution |
| Wahpeton | North Dakota | Grains and Foods | Grain storage |
| Huevelton | New York | Grains and Foods | Soymilk processing plant |
| Blooming Prairie | Minnesota | Grains and Foods | Grain storage |
| Ellendale | Minnesota | Grains and Foods | Grain storage |
| Snover (Monthly Rent) | Michigan | Grains and Foods | Grains sales office |
| Cresco | Iowa | Grains and Foods | Milling facility |
| Breckenridge | Minnesota | Grains and Foods | Grain processing and distribution |
| Breckenridge (Lease) (3) | Minnesota | Grains and Foods | Grains sales Office |
| Goodland | Kansas | Grains and Foods | Grain processing and distribution |
| Edson (Land Lease) (4) | Kansas | Grains and Foods | Grain processing and distribution |
| Moorehead | Minnesota | Grains and Foods | Grain processing and distribution |
| Crookston | Minnesota | Grains and Foods | Processing, warehouse and distribution |
| Fargo | North Dakota | Grains and Foods | Processing, warehouse and distribution |
| Grace City | North Dakota | Grains and Foods | Grain Storage |
| Ipswich (Lease) (5) | South Dakota | Grains and Foods | Grain Storage |
| Chelmsford (Lease) (6) | Massachusetts | Ingredients | Ingredients head office and development centre |
| Louisville (Lease) (7) | Kentucky | Ingredients | Fiber processing facility |
| Cedar Rapids | Iowa | Ingredients | Fiber processing facility |
| Cambridge | Minnesota | Ingredients | Fiber processing facility |
| Fosston | Minnesota | Ingredients | Processing and drying |
| Galesburg | Illinois | Ingredients | Starch based production and ingredients blending |
| Buena Park (2 Leases) (8) | California | Fruit Group – Fruit Specialties | Processing, warehouse and distribution and Fruit Group head office |
| South Gate (Lease) (9) | California | Fruit Group – Fruit Specialties | Processing, warehouse and distribution |
| Salinas (Lease) (10) | California | Fruit Group – Fruit Specialties | Processing, warehouse and distribution |
| Rosarito (Lease) (11) | Mexico | Fruit Group – Fruit Specialties | Frozen fruit processing facility |
| Guanajuato | Mexico | Fruit Group – Fruit Specialties | Frozen fruit processing facility |
| Summerland (Lease) (12) | British Columbia | Fruit Group – Healthy Snacks Operations | Administrative office |
| Omak (Lease) (13) | Washington | Fruit Group – Healthy Snacks Operations | Processing, warehouse and distribution |
| SUNOPTA INC. | 32 | January 1, 2011 10-K |
| Brampton (Lease) (14) | Ontario | Fruit Group – Healthy Snacks Operations | Sales office |
| Carson City (Lease) (15) | Nevada | Fruit Group – Healthy Snacks Operations | Processing, warehouse and distribution |
| Santa Cruz (Lease) (16) | California | International Foods | Organic Ingredients office |
| Dalian (Lease) (17) | China | International Foods | Sales office, processing facilities |
| Amsterdam (Lease) (18) | The Netherlands | International Foods | Sales office |
| Syke (Lease) (19) | Germany | International Foods | Sales office |
| Shelton (Lease) (20) | Connecticut | International Foods | Sales office |
| Addis Ababa (Lease) (21) | Ethiopia | International Foods | Processing facility and warehouse |
| Acton (4 Leases) (22) | Ontario | International Foods | Office, distribution and warehousing and NHP packaging |
| Vancouver (Lease) (23) | British Columbia | International Foods | NHP Office, distribution and warehousing |
| Brantford (Lease) (24) | Ontario | International Foods | NHP Processing, warehouse and distribution |
| (1) | Leases have an expiry date of June 2012. | (2) | Lease has an expiry date of May 2019. |
| (3) | Lease has an expiry date of October 2011. | (4) | Lease has an expiry date of November 2023. |
| (5) | Lease has an expiry date of October 2015. | (6) | Lease has an expiry date of September 2013. |
| (7) | Lease has an expiry date of January 2013. | (8) | Leases have expiry dates of May 2015 and May 2015 respectively. |
| (9) | Lease has an expiry date of December 2016. | (10) | Lease has an expiry date of December 2011, and is currently under a sub- lease arrangement to a third party. |
| (11) | Lease has an expiry date of May 2012. | (12) | One lease has an expiry date of December 2016 and one lease is month- to-month. |
| (13) | Lease has an expiry date of May 2017. | (14) | Lease has an expiry date of November 2012. |
| (15) | Lease has an expiry date of December 2015. | (16) | Lease has an expiry date of December 2016. |
| (17) | Lease has an expiry date of September 2011. | (18) | Lease has an expiry date of April 2014. |
| (19) | Lease is month to month. | (20) | Lease has an expiry date of April 2012. |
| (21) | Lease is month to month. | (22) | All leases have an expiry date of December 2011. |
| (23) | Lease has an expiry date of August 2011. | (24) | Lease has an expiry date of November 2013. |
Opta Minerals
As of January 1, 2011, Opta Minerals operates from the following major locations which are owned unless otherwise noted.
| Location | State/Province/Country | Group | Description |
| Waterdown | Ontario | Opta Minerals | Group head office, processing and distribution |
| Brantford (Lease) (1) | Ontario | Opta Minerals | Distribution and packing center |
| Bruno de Guigues | Quebec | Opta Minerals | Specialty sands |
| New Orleans (Lease) (2) | Louisiana | Opta Minerals | Abrasives processing |
| Norfolk (Lease) (3) | Virginia | Opta Minerals | Abrasives processing and distribution |
| Keeseville (Lease) (4) | New York | Opta Minerals | Garnet processing and distribution |
| Baltimore (Lease) (5) | Maryland | Opta Minerals | Abrasives processing |
| Hardeeville | South Carolina | Opta Minerals | Abrasives processing |
| Laval (Lease) (6) | Quebec | Opta Minerals | Processing facility |
| Walkerton | Indiana | Opta Minerals | Processing facility |
| Kosice (Lease) (7) | Slovakia | Opta Minerals | Processing facility |
| Milan | Michigan | Opta Minerals | Processing facility |
| Freeport (Lease) (8) | Texas | Opta Minerals | Abrasives processing |
| Tampa (Lease) (9) | Florida | Opta Minerals | Abrasives processing |
(1) Lease has an expiry date of April 2015.
(2) Lease has
an expiry date of December 2011.
(3) Lease has an expiry date of October
2011 and an option to purchase up to expiry.
(4) Lease has an expiry date of
November 2011.
(5) Lease has an expiry date of December 2013.
(6) Lease
has an expiry date of February 2012.
| SUNOPTA INC. | 33 | January 1, 2011 10-K |
(7) Lease is month to month.
(8) Lease has an expiry date
of March 2014.
(9) Lease has an expiry date of January 2014.
Executive Offices
Our executive head office is located at 2838 Bovaird Drive West, Brampton, Ontario, a property we own.
Item 3. Legal Proceedings
From time to time, we are involved in litigation incident to the ordinary conduct of our business. For a discussion of certain legal proceedings, see “Note 16. Commitments and Contingencies” to our consolidated financial statements included elsewhere in this report. Although disposition of our pending litigation is currently not expected by management to have a material adverse effect on our business, results of operation or financial condition, these matters are subject to inherent uncertainties and management’s view of these matters may change in the future.
Item 4. (Removed and Reserved)
PART II
Item 5. Market for Registrant’s Common Equity, Related Stockholder Matters and Issuer Purchases Equity Securities
Our common shares trade in U.S. dollars on The NASDAQ Global Select Market under the symbol “STKL”, and in Canadian dollars on the TSX under the symbol “SOY”.
The following table indicates the high and low sales prices for our common shares for each quarterly period during the past two fiscal years as reported by NASDAQ. The prices shown are representative inter-dealer prices, do not include retail mark ups, markdowns or commissions and do not necessarily reflect actual transactions.
Sales Prices on NASDAQ (U.S. Dollars)
| 2010 | HIGH | LOW |
| First Quarter | 4.23 | 2.65 |
| Second Quarter | 5.27 | 3.80 |
| Third Quarter | 6.30 | 3.98 |
| Fourth Quarter | 8.83 | 5.81 |
| 2009 | HIGH | LOW |
| First Quarter | 3.88 | 0.79 |
| Second Quarter | 2.50 | 1.40 |
| Third Quarter | 4.20 | 2.00 |
| Fourth Quarter | 4.40 | 3.05 |
| SUNOPTA INC. | 34 | January 1, 2011 10-K |
The following table indicates the high and low sales prices for our common shares for each quarterly period during the past two fiscal years as reported by the TSX.
Sales Prices on TSX (Canadian Dollars)
| 2010 | HIGH | LOW |
| First Quarter | 4.30 | 2.81 |
| Second Quarter | 5.35 | 3.88 |
| Third Quarter | 6.43 | 4.09 |
| Fourth Quarter | 9.00 | 5.86 |
| 2009 | HIGH | LOW |
| First Quarter | 4.49 | 1.06 |
| Second Quarter | 2.84 | 1.66 |
| Third Quarter | 4.57 | 2.31 |
| Fourth Quarter | 4.67 | 3.25 |
At January 1, 2011, we had approximately 701 shareholders of record. We have never paid cash dividends on our common stock and do not anticipate paying dividends in the foreseeable future. Our future dividend policy will depend on our earnings, capital requirements and financial condition, requirements of the financial agreements to which we are then a party and other factors considered relevant by our Board of Directors. Additionally, the terms of our existing credit facility restrict our ability to pay dividends to shareholders. The receipt of cash dividends by U.S. shareholders from a Canadian corporation, such as we are, may be subject to Canadian withholding tax.
| SUNOPTA INC. | 35 | January 1, 2011 10-K |
Shareholder Return Performance Graph
This performance graph shall not be deemed “filed” for purposes of Section 18 of the Exchange Act or incorporated by reference into any filing of SunOpta Inc. under the Securities Act of 1933, as amended, or the Exchange Act, except as shall be expressly set forth by specific reference in such filing.
The following graph compares the five year cumulative shareholder return on our common shares to the cumulative total return of the S&P/TSX Composite and the NASDAQ Industrial Indices for the period which commenced December 31, 2005.
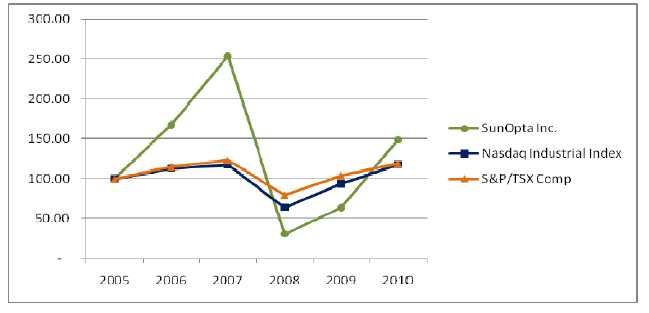
| 2005 | 2006 | 2007 | 2008 | 2009 | 2010 | |||||||||||||
| SunOpta Inc. | 100.00 | 167.30 | 253.80 | 29.85 | 63.88 | 148.67 | ||||||||||||
| Nasdaq Industrial Index | 100.00 | 112.39 | 117.14 | 63.99 | 93.96 | 117.43 | ||||||||||||
| S&P/TSX Composite | 100.00 | 114.51 | 122.72 | 79.73 | 104.20 | 119.26 |
Assumes that $100.00 was invested in our common shares and in each Index on December 31, 2005.
Issuance of unregistered securities
On February 5, 2010, the Company issued a Warrant to Purchase Common Shares to a financial advisor in connection with an Advisory Services Agreement (the “Warrant”). The Warrant was issued in connection with services to be performed under the Advisory Services Agreement and did not involve any public offering, general advertising or solicitation. Under the terms of the Warrant, upon exercise the warrant holder is entitled to purchase up to 250,000 common shares at an exercise price of $3.25. The Warrant may be exercised at any time on or before February 5, 2015. No consideration was received by the Company upon issuance of the Warrant. Based on certain facts and representations by the financial advisor, the Warrant was issued in reliance upon a claimed exemption from registration under the Securities Act of 1933, as amended, pursuant to the provisions of Regulation S promulgated under such Act.
On June 11, 2010, the Company issued a Warrant to Purchase Common Shares to a financial advisor in connection with an advisory services agreement (the “June Warrant”). The June Warrant was issued in connection with services to be performed under the advisory services agreement and did not involve any public offering, general advertising or solicitation. Under the terms of the June Warrant, upon exercise the warrant holder is entitled to purchase up to 600,000 common shares at an exercise price of $5.11. The June Warrant may be exercised at any time on or before June 11, 2015. No consideration was received by the Company upon issuance of the June Warrant. Based on certain facts and representations by the financial advisor, the June Warrant was issued in reliance upon a claimed exemption from registration under the Securities Act of 1933, as amended, pursuant to the provisions of Regulation S promulgated under the Securities Act of 1933, as amended.
| SUNOPTA INC. | 36 | January 1, 2011 10-K |
Item 6. Selected Financial Data
We have completed a number of acquisitions over the five fiscal periods presented below. For a listing of the acquisitions completed by SunOpta Foods and Opta Minerals, refer to Part I, Item 1 of this report entitled “Business”. In addition, the pro-forma revenues, pro forma earnings (loss) attributable to SunOpta Inc., and pro-forma basic and diluted earnings (loss) per share are presented in note 2 (c) of the Consolidated Financial Statements contained in Item 8 of this report.
The following information for the years 2008, 2009 and 2010 has been summarized from our Consolidated Financial Statements included elsewhere in this report. The information for 2006 and 2007 has been updated to reflect the dispositions of the Canadian Food Distribution assets and SunOpta BioProcess Inc. The information set forth below is not necessarily indicative of results of future operations, and should be read in conjunction with Item 7, “Management’s Discussion and Analysis of Financial Condition and Results of Operations,” and the Consolidated Financial Statements and related notes included in Item 8 of this report to fully understand the factors that may affect the comparability of the information presented below.
Summary (expressed in thousands of U.S. dollars, except per share amounts)
| 2010 | 2009 | 2008 | 2007 | 2006 | |||||||||||
| $ | $ | $ | $ | $ | |||||||||||
| Revenues | 898,931 | 819,040 | 874,445 | 647,100 | 476,046 | ||||||||||
| Earnings (loss) from
continuing operations |
12,685 |
(6,490 |
) |
(11,899 |
) |
42 |
7,270 |
||||||||
| Total assets | 609,684 | 551,290 | 581,047 | 569,440 | 404,730 | ||||||||||
| Long-term
debt (including current portion) |
64,982 |
87,189 |
111,527 |
98,714 |
77,827 |
||||||||||
| Long-term
liabilities (including current portion) |
7,213 |
3,443 |
6,379 |
4,611 |
5,343 |
||||||||||
| Basic earnings (loss) per
share from continuing operations |
0.20 |
(0.10 |
) |
(0.18 |
) |
0.00 |
0.13 |
||||||||
| Diluted earnings (loss) per
share from continuing operations |
0.19 |
(0.10 |
) |
(0.18 |
) |
0.00 |
0.13 |
||||||||
| Exchange rates (Cdn $ / U.S. $) | |||||||||||||||
| Period end | 0.9946 | 1.0510 | 1.2180 | 0.9913 | 1.1654 | ||||||||||
| Average | 1.0300 | 1.1415 | 1.0660 | 1.0740 | 1.1344 |
| SUNOPTA INC. | 37 | January 1, 2011 10-K |
Item 7. Management’s Discussion and Analysis of Financial Condition and Results of Operations
Forward-looking Financial Information
This Management’s Discussion and Analysis of Financial Condition and Results of Operations (“MD&A”) section provides analysis of our operations and financial position for the fiscal period ended January 1, 2011 and includes information available to February 28, 2011. It is supplementary information and should be read in conjunction with our 2010 Consolidated Financial Statements, including the accompanying notes, management’s report and the auditor’s report included elsewhere in this report.
Certain statements contained in this MD&A may constitute forward-looking statements as defined under securities laws. Forward-looking statements may relate to our future outlook and anticipated events or results and may include statements regarding our future financial position, business strategy, budgets, litigation, projected costs, capital expenditures, financial results, taxes, plans and objectives. In some cases, forward-looking statements can be identified by terms such as “may”, “will”, “should”, “expect”, “plan”, “anticipate”, “believe”, “intend”, “estimate”, “predict”, “potential”, “continue”, or other similar expressions concerning matters that are not historical facts.
To the extent any forward-looking statements contain future-oriented financial information or financial outlooks, such information is being provided to enable a reader to assess our financial condition, material changes in our financial condition and our results of operations, including liquidity and capital resources for the fiscal period ended January 1, 2011, compared with the fiscal period ended December 31, 2009. Readers are cautioned that this information may be not appropriate for any other purpose, including investment decisions.
Forward-looking statements contained in this MD&A are based on certain factors and assumptions regarding expected growth, results of operations, performance, and business prospects and opportunities. While we consider these assumptions to be reasonable, based on information currently available, they may prove to be incorrect.
Forward-looking statements are also subject to certain factors, including risks and uncertainties that could cause actual results to differ materially from what we currently expect. These factors are more fully described in the “Risk Factors” section at Item 1A of this Annual Report on Form 10-K.
Forward-looking statements contained in this commentary are based on our current estimates, expectations and projections, which we believe are reasonable as of the current date. You should not place undue importance on forward-looking statements and should not rely upon this information as of any other date. Other than as required under securities laws, we do not undertake to update any forward-looking information at any particular time.
Overview
The 2010 Consolidated Financial Statements include the results of our two principal industry segments:
-
SunOpta Foods, which accounts for approximately 91% of 2010 revenues, sources, processes, packages, markets and distributes a wide range of natural, organic, and specialty food products and ingredients with a focus on soy, corn, sunflower, fruit, fiber and other natural and organic foods and natural health products; and
-
Opta Minerals, which accounts for approximately 9% of 2010 revenues, processes, distributes and recycles silica- free loose abrasives, roofing granules, industrial minerals and specialty sands for the foundry, loose abrasives cleaning, steel, roofing shingles and bridge and ship-cleaning industries.
Both of our industry segments are growth oriented, ethical businesses, focused on environmental responsibility and the health and well being of the communities they serve. For a more detailed description of our operating groups and their businesses, please see the “Business” section at Item 1 of this Annual Report on Form 10-K.
The MD&A detailed below is presented in seven parts: Critical Accounting Estimates, Results of Operations for 2010 versus 2009 and 2009 versus 2008, Liquidity and Capital Resources, Cash Flows, Business and Financial Outlook, Off-balance Sheet Arrangements, and Contractual Obligations. This MD&A should be read in conjunction with our January 1, 2011 Consolidated Financial Statements and accompanying notes. Dollar amounts in this MD&A are presented in thousands of U.S. Dollars, unless otherwise noted.
| SUNOPTA INC. | 38 | January 1, 2011 10-K |
Critical Accounting Estimates
The preparation of financial statements in conformity with accounting principles generally accepted in the United States requires management to make certain estimates and assumptions that affect the reported amounts of assets and liabilities, related revenues and expenses, and disclosure of gain and loss contingencies at the date of the financial statements. The estimates and assumptions made require us to exercise our judgment and are based on historical experience and various other factors that we believe to be reasonable under the circumstances. We continually evaluate the information that forms the basis of our estimates and assumptions as our business and the business environment generally changes. The use of estimates is pervasive throughout our financial statements. The following are the accounting estimates which we believe to be most important to our business.
Revenue recognition
We recognize revenue at the time of delivery of the product or service and when all of the following have occurred: a sales agreement is in place, price is fixed or determinable, and collection is reasonably assured. Consideration given to customers such as value incentives, rebates, early payment discounts and other discounts are recorded as reductions to revenues at the time of sale.
Accounts receivable
Our accounts receivable primarily includes amounts due from our customers. The carrying value of each account is carefully monitored with a view to assessing the likelihood of collection. An allowance for doubtful accounts is provided for as an estimate of losses that could result from customers defaulting on their obligation to us. In assessing the amount of reserve required, a number of factors are considered including the age of the account, the credit-worthiness of the customer, payment terms, the customer’s historical payment history and general economic conditions. Because the amount of the reserve is an estimate, the actual amount collected could differ from the carrying value of the amount receivable. Note 4 of the 2010 Consolidated Financial Statements provides an analysis of the changes in the allowance for doubtful accounts.
Inventory
Inventory is our largest current asset. Our inventory consists primarily of raw materials and finished goods held for sale. Inventories are valued at the lower of cost, valued on a weighted average cost basis, or estimated net realizable value except certain grain inventories that are carried at market value. Depending on market conditions, the actual amount received on sale could differ from our estimated value of inventory when provisions to record inventory at market are necessary. In order to determine the value of inventory at the balance sheet date, we evaluate a number of factors to determine the adequacy of provisions for inventory. The factors include the age of inventory, the amount of inventory held by type, future demand for products and the expected future selling price we expect to realize by selling the inventory. Our estimates are judgmental in nature and are made at a point in time, using available information, expected business plans and expected market conditions. We perform a review of our inventory by reporting unit and product line on a quarterly basis. Note 5 of the 2010 Consolidated Financial Statements provides an analysis of the movements in inventory reserve.
Prepaid and other current assets
Prepaid and other current assets include amounts paid in cash and recorded as a current asset prior to consumption. The balance also includes advances to growers required to secure future delivery of product (net of provisions). An allowance against realizing these advances is recorded when it is determined that we will not recover the advances, due to default on scheduled repayment terms, or general economic or market conditions. Advances to growers are typically made at the start of the growing season. We monitor our advances to growers by monitoring adherence to agreed upon terms as well as evaluating general economic and market conditions, and assessing the status of the crops being grown in order to determine if the collection of the advance is at risk.
Impairment testing of goodwill
With the implementation of Financial Accounting Standards Board (“FASB”) Accounting Standards Codification (“ASC”) topic 350-20 (formerly Statement of Financial Accounting Standard No. 142, “Goodwill and Other Intangible Assets”), goodwill and intangible assets with an indefinite life are no longer amortized, but instead are tested at least annually for impairment. Any impairment loss is recognized in income.
| SUNOPTA INC. | 39 | January 1, 2011 10-K |
In accordance with ASC 350-20, we evaluate goodwill for impairment on a reporting unit basis. Reporting units are operating segments or components of operating segments for which discrete financial information is available. To evaluate goodwill, the fair value of each reporting unit is compared to its carrying value. Where the carrying value is greater than the fair value, the implied fair value of the reporting unit goodwill is determined by allocating the fair value of the reporting unit to all the assets and liabilities of the reporting unit with any remainder being allocated to goodwill. The implied fair value of the reporting unit goodwill is then compared to the carrying value of that goodwill to determine whether an impairment loss exists.
We measure the fair value of reporting units using discounted cash flows. Because the business is assumed to continue in perpetuity, the discounted future cash flow includes a terminal value. The first year or base year in the calculation of the discounted cash flow model is based on actual results in each component, adjusted for unusual and non-recurring items. Future years’ cash flows to perpetuity are forecasted based on projected revenue growth, and our planned business strategies in future periods that would impact actual cash flows reported in the base year. Examples of planned strategies would include a plant or line expansion at an existing facility, a reduction of working capital at a specific location, and price increases or cost reductions within business units. The revenue growth and planned business strategies for future periods incorporated into the discounted cash flow model reflect our long-term view of the market. The discount rate is based on a segment’s targeted weighted average cost of capital, which is not necessarily the same as our weighted average cost of capital. These assumptions are subject to change and are also impacted by our ability to achieve our forecasts and by economic conditions which may impact future results and result in projections not being attained. Each year we re-evaluate the assumptions used to reflect changes in the business environment.
During the third quarter of 2010, we determined that there were external market conditions and other circumstances that suggested the carrying value of the natural health products reporting unit, which is part of the International Foods segment, may exceed its fair value. These external market conditions and other circumstances included reduced sales levels, increased competition leading to price concessions and decreased market share, shift in product mix causing lower gross margins, and product de–listing at certain retailers. As a result of completing the test for goodwill impairment, we determined that the carrying value of goodwill in our natural health reporting unit exceeded its fair value, and recorded a non-cash goodwill impairment charge of $1,654.
The rest of the annual goodwill impairment test for the year ended January 1, 2011 indicated that the fair value of the Grains and Foods Group, the Ingredients Group and The Organic Corporation (a reporting unit within the International Foods Group) exceeded their carrying values, and as a result, no impairment charges were recorded.
During the year ended December 31, 2009, Opta Minerals determined that there were external market conditions and other circumstances that suggested the carrying value of certain reporting units in Opta Minerals may exceed their fair value. These external market conditions and other circumstances included continued operating losses and extended periods of facility under–utilization due to continued weakness in the steel, abrasives and foundry markets. As a result of completing a test for goodwill impairment, Opta Minerals determined that the carrying value of goodwill in certain of its mill and foundry and abrasive products reporting units exceeded their fair value, and recorded a non-cash impairment charge of $8,341. Also during the year ended December 31, 2009, we determined that the $500 increase in goodwill as a result of contingent consideration in the Fruit Group resulted in the carrying value of the group exceeding its fair value. As a result, we recorded a $500 charge to the consolidated statement of operations. Note 7 of the 2010 Consolidated Financial Statements provides a summary of the critical assumptions used in the 2010 annual impairment test.
Purchase price allocation
Business acquisitions are accounted for by the purchase method of accounting. Under this method, the purchase price is allocated to the assets acquired and the liabilities assumed based on the fair value at the time of the acquisition. Any excess purchase price over the fair value of identifiable assets and liabilities acquired is recorded as goodwill. The assumptions and estimates with respect to determining the fair value of intangible assets acquired generally requires the most judgment, and include estimates of future profitability, and/or customer and supplier based attrition, income tax rates and discount rates. Changes in any of the assumptions or estimates used in determining the fair value of the acquired assets and liabilities could impact the amounts assigned to assets, liabilities and goodwill in the purchase price allocation. Future net earnings can be affected as a result of changes in these estimates resulting in an asset or goodwill impairment. Further, amortization periods are subjective based on expected useful lives and chosen rates. In accordance with ASC 805, ‘Business Combinations’, all costs incurred related to the acquisitions completed during fiscal 2010 were charged to the consolidated statement of operations. Note 2 of the Consolidated Financial Statements provide information with respect to businesses acquired and note 7 outlines annual amortization expense relating to these intangibles.
| SUNOPTA INC. | 40 | January 1, 2011 10-K |
Accrued expenses and other assets
We make estimates of future payments and receipts which relate to current and future accounting periods. These estimates cover items such as accrued but unpaid wages and bonuses, estimates of taxes and estimates of amounts payable or receivable under legal suits. In establishing appropriate accruals and receivable balances, we must make judgments regarding the amount of the disbursement or receipts that will ultimately be incurred or received. In making such assessments, we use historical experience as well as any other special circumstances surrounding a particular item. The actual amount paid or received could differ from our estimates.
Income taxes
We are liable for income taxes in the United States, Canada, and other jurisdictions where we operate. Our effective tax rate differs from the statutory tax rate and will vary from year to year primarily as a result of numerous permanent differences, investment and other tax credits, the provision for income taxes at different rates in foreign and other provincial jurisdictions, enacted statutory tax rate increases or reductions in the year, the benefit of cross-jurisdictional financing structures, changes due to foreign exchange, changes in valuation allowance based on our recoverability assessments of deferred tax assets, and favourable or unfavourable resolution of various tax examinations.
In making an estimate of our income tax liability, we first assess which items of income and expense are taxable in a particular jurisdiction. This process involves a determination of the amount of taxes currently payable as well as the assessment of the effect of temporary timing differences resulting from different treatment of items for accounting and tax purposes. These differences in the timing of the recognition of income or the deductibility of expenses result in deferred income tax balances that are recorded as assets or liabilities as the case may be on our balance sheet. We also estimate the amount of valuations allowance to maintain relating to loss carry forwards and other balances that can be used to reduce future taxes payable. This judgment is based on forecasted results in the jurisdiction and certain tax planning strategies and as a result actual results may differ from forecasts. We assess the likelihood of the ultimate realization of these tax assets by looking at the relative size of the tax assets in relation to the profitability of the businesses and the jurisdiction to which they can be applied to, the number of years based on management’s estimate it will take to use the tax assets and any other special circumstances. If different judgments had been used, our income tax liability could have been different from the amount recorded. In addition, the taxing authorities of those jurisdictions upon audit may not agree with our assessment. Note 13 of the Consolidated Financial Statements provides an analysis of the changes in the valuation allowance and the components of our deferred tax assets.
In June 2006, the FASB issued ASC Topic 740 (formerly Interpretation No. 48, “Accounting for Uncertainty in Income Taxes – An Interpretation of FASB Statement No. 109”). ASC 740 clarifies the accounting for uncertainty in income taxes recognized in an enterprise’s financial statements and prescribes a recognition threshold and measurement attribute for the financial statement recognition and measurement of a tax position taken or expected to be taken in a tax return. This Interpretation also provides guidance on derecognition, classification, interest and penalties, accounting in interim periods, disclosure and transition. While we believe we have adequately provided for all tax positions, amounts asserted by taxing authorities could differ from accrued position. Accordingly, additional provisions on federal, provincial, state and foreign tax-related matters could be recorded in the future as revised estimates are made or the underlying matters are settled or otherwise resolved.
Stock compensation
We maintain a stock option plan under which incentive stock options may be granted to employees and non-employee directors. Effective January 1, 2006, ASC 718 (formerly SFAS No. 123(R) “Share-Based Payments”) requires that we record stock based compensation expenses within the consolidated statements of operations and comprehensive earnings (loss).
At each grant date, we are required to estimate a number of inputs, such as the estimated life of the option and the forfeiture rate used in the Black-Scholes model to determine a fair value for the options granted to employees or non-employee directors. Once determined at the grant date, fair value of the stock award is recorded over the vesting period of the options granted. Refer to note 11 of the 2010 Consolidated Financial Statements for disclosure of the inputs used to determine the fair value of stock based compensation granted in 2010, 2009 and 2008.
| SUNOPTA INC. | 41 | January 1, 2011 10-K |
Results of 2010 Operations Compared With Results of 2009
Operations
(Expressed in thousands of U.S dollars, except per share amount)
| January 1, 2011 | December 31, 2009 | Change | Change | |||||||||
| $ | $ | $ | % | |||||||||
| Revenue | ||||||||||||
| SunOpta Foods | 818,063 | 756,517 | 61,546 | 8.1% | ||||||||
| Opta Minerals | 80,868 | 62,523 | 18,345 | 29.3% | ||||||||
| Total Revenue | 898,931 | 819,040 | 79,891 | 9.8% | ||||||||
| Gross Profit | ||||||||||||
| SunOpta Foods | 124,407 | 95,978 | 28,429 | 29.6% | ||||||||
| Opta Minerals | 20,037 | 13,081 | 6,956 | 53.2% | ||||||||
| Total Gross Profit | 144,444 | 109,059 | 35,385 | 32.4% | ||||||||
| Operating Income | ||||||||||||
| SunOpta Foods | 44,837 | 17,660 | 27,177 | 153.9% | ||||||||
| Opta Minerals | 7,753 | 1,161 | 6,592 | 567.8% | ||||||||
| Corporate Services | (11,213 | ) | (6,614 | ) | (4,599 | ) | 69.5% | |||||
| Total Operating Income | 41,377 | 12,207 | 29,170 | 239.0% | ||||||||
| Other expense, net | 10,945 | 2,245 | 8,700 | 387.5% | ||||||||
| Goodwill impairment | 1,654 | 8,841 | (7,187 | ) | -81.3% | |||||||
| Interest expense, net | 9,749 | 13,839 | (4,090 | ) | -29.6% | |||||||
| Provision for (recovery
of) income taxes |
5,463 |
(3,201 |
) |
8,664 |
-270.7% |
|||||||
| Earnings from
continuing operations |
13,566 |
(9,517 |
) |
23,083 |
242.5% |
|||||||
| Earnings (loss) attributable
to non-controlling interests |
881 |
(3,027 |
) |
3,908 |
-129.1% |
|||||||
| Loss from
discontinued operations, net of taxes |
(14,569 |
) |
(273 |
) |
(14,296 |
) |
5236.6% |
|||||
| Gain on sale of
discontinued operations, net of taxes |
62,950 |
- |
62,950 |
n/m |
||||||||
| Earnings (loss) attributable
to SunOpta Inc. |
61,066 |
(6,763 |
) |
67,829 |
n/m |
(Operating Income is defined as “Earnings before the following” excluding the impact of “Other expense (income), net”, and "Goodwill impairment")
Revenues for the year ended January 1, 2011 increased by 9.8% to $898,931 from $819,040 for the year ended December 31, 2009. Revenues in SunOpta Foods increased by 8.1% to $818,063 and revenues in Opta Minerals increased by 29.3% to $80,868. The increased revenue is based on consolidated internal growth of 8.6% and acquisition revenues of $13,076. Internal growth includes growth on the base business plus growth on acquisitions from the date of acquisition over the previous year in addition to the impact of foreign exchange movements on the translation of foreign denominated revenue to U.S. dollars and commodity related price movements. Excluding the impact of foreign exchange and commodity related price movements, revenues increased approximately 10.6% over the prior year. The acquisition of Dahlgren & Company, Inc. and Edner of Nevada, Inc. added incremental acquisition revenues of $13,031 and $45, respectively. The increase in revenue was due primarily to the changes in sales volume and pricing described below in “Segmented Operations Information”.
| SUNOPTA INC. | 42 | January 1, 2011 10-K |
Gross profit increased $35,385, or 32.4%, for the year ended January 1, 2011 to $144,444 from $109,059 for the year ended December 31, 2009. As a percentage of revenues, gross profit for the year ended January 1, 2011 was 16.1% compared to 13.3% for the year ended December 31, 2009, an increase of 2.8% . For the year ended January 1, 2011, we experienced increased gross profit in all of our operating segments. Within SunOpta Foods, higher volumes of fiber, fruit ingredient products, grains, consumer products and plant efficiencies all contributed to the increased gross profit. Also contributing to the increase in gross profit was a rebound in the steel and abrasive markets for Opta Minerals. The improvement in gross profit was due primarily to a lower overall cost of goods sold, as a percentage of revenues, as a result of the variances described below under “Segmented Operations Information”.
Warehouse and Distribution (“W&D”) costs for the year ended January 1, 2011 were $3,703, a $520 decrease compared to $4,223 for the year ended December 31, 2009. These costs are solely related to the International Foods Group and specifically the Group’s Canadian based natural health products operation as warehousing and distribution costs for all other operations are considered part of cost of goods sold.
Selling, general and administrative costs (“SG&A”) including intangible asset amortization increased $7,864 to $101,016 for the year ended January 1, 2011 compared to $93,152 for the year ended December 31, 2009. The combination of a stronger Canadian dollar and a weaker Euro for the year ended January 1, 2011 led to a $3,049 increase in SG&A on foreign denominated costs. Additional SG&A costs of $6,844 relating to higher compensation costs, the acquisition of Dahlgren & Company, Inc., non-cash stock compensation, professional fees and general overhead expenses were offset by a $2,029 reduction in costs relating to brand re-launch initiatives at our natural health products operation and severance and facility rationalizations in our frozen foods operations. As a percentage of revenues, SG&A costs and intangible asset amortization costs were 11.2% for the year ended January 1, 2011 compared to 11.4% for the year ended December 31, 2009.
Foreign exchange gains were $1,652 for the year ended January 1, 2011 as compared to gains of $523 for the year ended December 31, 2009. The increase is primarily due to favourable exchange rate movements for the Euro and Canadian dollar relative to the U.S. dollar.
Operating income for the year ended January 1, 2011 increased by $29,170 to $41,377 compared to operating income of $12,207 for the year ended December 31, 2009 due to the factors noted above. As a percentage of revenue, operating income was 4.6% for the year ended January 1, 2011, compared to 1.5% for the year ended December 31, 2009. Further details on revenue, gross margins and operating income variances are provided below under “Segmented Operations Information”.
Other expense for the year ended January 1, 2011 of $10,945 reflects non-cash long-lived asset impairment charges recorded in the Fruit Group of $7,033 and $1,805 of severance and other period costs expensed as incurred due to rationalization efforts that began in fiscal 2009 and continued into 2010, as well as the rationalization efforts at our natural health products operation which began in the second quarter of 2010. In addition, there were other expenses relating to acquisition costs of $547, non-cash stock compensation expense of $435 at Opta Minerals, non-cash pension curtailment expense of $588 and other charges totalling $537 relating primarily to the Fruit Group. In 2009, other expense of $2,245 related to facility rationalization costs, the settlement of a labour related class action lawsuit, and the elimination of certain long-term liabilities at Opta Minerals.
Goodwill impairment of $1,654 reflects a non-cash impairment charge recorded as the Company determined that the carrying value of goodwill in the International Foods Group and specifically its natural health products reporting unit exceeded its fair value. In 2009, goodwill impairment charges were recorded for $8,341 at Opta Minerals and $500 in the Fruit Group.
Interest expense for the year ended January 1, 2011 was $9,749 compared to $13,839 for the year ended December 31, 2009, a $4,090 decrease. Borrowing costs were lower for the year ended January 1, 2011 due to lower debt levels, due in part to the proceeds received on the sale of the Canadian Food Distribution assets, lower LIBOR rates, improved positioning on our interest rate pricing grid due to stronger operating results, and as a result of $1,800 of non-cash interest charges incurred in 2009 related to the waiver and amendment of our credit facilities, which occurred on April 30, 2009.
Income tax provision for the year ended January 1, 2011 was $5,463 compared to a recovery of $3,201 for the year ended December 31, 2009, due to the higher consolidated earnings before tax in the current period.
Earnings from continuing operations for the year ended January 1, 2011 were $13,566 as compared to a loss of $9,517 for the year ended December 31, 2009, a $23,083 increase. Basic and diluted earnings per share from continuing operations was $0.20 and $0.19 respectively for the year ended January 1, 2011 compared to a loss of $0.10 and $0.10 respectively for the year ended December 31, 2009.
| SUNOPTA INC. | 43 | January 1, 2011 10-K |
Earnings attributable to non-controlling interest for the year ended January 1, 2011 were $881 compared to losses of $3,027 for the year ended December 31, 2009. The $3,908 increase is due to higher net earnings in our less than wholly-owned subsidiaries.
Losses from discontinued operations, net of income taxes, were $14,569 for the year ended January 1, 2011 compared to losses of $273 for the year ended December 31, 2009. The $14,296 increase in losses from discontinued operations is due to $15,280 relating to stock-based and other compensation costs that were realized upon the sale of SunOpta BioProcess, and costs of $1,289 incurred as a result of the sale of the Canadian Food Distribution assets including retention bonuses, severances and mandatory interest payments, offset by $2,273 of higher operating margins from discontinued operations.
Gain on the sale of discontinued operations of $62,950 represents the after tax gains realized on the dispositions of the Canadian Food Distribution assets and the shares of SunOpta BioProcess Inc.
On a consolidated basis, earnings and basic and diluted earnings per share were $61,066, $0.94 and $0.92 respectively, for the year ended January 1, 2011, compared to losses of $6,763, $0.10 and $0.10, respectively, for the year ended December 31, 2009.
| SUNOPTA INC. | 44 | January 1, 2011 10-K |
Adjusted Earnings from Operations
Following is a calculation of our Adjusted earnings from operations (1) and Adjusted net earnings per share (1) for the year ended January 1, 2011:
| Diluted Earnings | ||||||
| per Share (2) | ||||||
| Earnings attributable to SunOpta Inc. | $ | 61,066 | $ | 0.92 | ||
| Adjusted for: | ||||||
| Gain on sale of discontinued operations, net of taxes | (62,950 | ) | (0.95 | ) | ||
| Gain on dilution of SunOpta
BioProcess Inc.'s
ownership position in Xylitol Canada |
(1,242 |
) |
(0.02 |
) | ||
| Reversal of
tax valuation allowance at SunOpta Inc., net
of valuation allowance recorded at Opta Minerals |
(350 |
) |
(0.01 |
) | ||
| Costs included in
discontinued operations as a result of the
sale of the Canadian food distribution assets and SunOpta BioProcess Inc., net of taxes of $388 |
16,183 |
0.25 |
||||
| Impairment of long-lived assets and goodwill, net of taxes of $2,321 | 6,367 | 0.10 | ||||
| Severance and closure costs
at our natural health
products operation and our brokerage operation, net of taxes of $345 |
662 |
0.01 |
||||
| Non-cash pension curtailment expense | 588 | 0.01 | ||||
| Costs incurred to complete
acquisitions of Dahlgren &
Company Inc. and Edner of Nevada, Inc. |
547 |
0.01 |
||||
| Non-cash compensation costs
related to cancelled stock
options recorded at Opta Minerals, net of $146 allocated to non-controlling interests |
289 |
- |
||||
| Adjusted earnings from operations(1) | $ | 21,160 | $ | 0.32 |
Adjusted net earnings per share (1) for the year ended January 1, 2011 were $0.32 per diluted common share. During the year ended January 1, 2011, we recognized gains and recorded specific expenses against net earnings that we do not believe are reflective of normal business operations. As a result, we believe it is useful to eliminate these gains and expenses to compute an adjusted net earnings per share (1) amount for the year ended January 1, 2011 which we believe is more reflective of normal business operations.
During the year ended January 1, 2011, we recorded gains on the sales of the Canadian Food Distribution assets and the sale of SunOpta BioProcess Inc. (see note 3). Losses from discontinued operations, net of income taxes, include costs incurred as a result of the sales including stock-based and other compensation rewards that were triggered upon closing of the sales, severances and mandatory interest payments. We also executed a restructuring plan at our natural health products operation as a result of market conditions and the sale of the Canadian Food Distribution assets, which triggered severance costs. As a result of its dilution in ownership in an investment prior to being sold, SunOpta BioProcess recorded a non-taxable dilution gain in the second quarter of 2010. We also recorded asset write-downs relating to property, plant and equipment and intangible assets within the Fruit Group, recognized a goodwill impairment charge relating to our natural health products division, and reversed a tax valuation allowance relating to a tax position that is no longer uncertain. In addition, we incurred professional, legal and other costs related to our fourth quarter of 2010 acquisitions of Dahlgren & Company, Inc. and the assets of Edner of Nevada Inc., as well as non-cash compensation related to cancelled stock options at our less than wholly-owned subsidiary. We believe that earnings attributable to SunOpta Inc. is the performance measure calculated and presented in accordance with GAAP that is most directly comparable to Adjusted earnings from operations(1), and that earnings per share is the performance measure calculated and presented in accordance with GAAP that is most directly comparable to Adjusted net earnings per share (1).
The table above reconciles earnings attributable to SunOpta Inc. to Adjusted earnings from operations(1) and reconciles earnings per share to Adjusted net earnings per share (1), in each case for the year ended January 1, 2011.
(1) Adjusted net earnings per share
and Adjusted earnings from operations are non-GAAP financial
measures. We believe these non-GAAP measures, which have been adjusted for the
impact of the items listed in the table above, assist investors and analysts in
comparing our performance across reporting periods on a consistent basis by
excluding items that we do not believe are indicative of our core operating
performance. Adjusted net earnings per share and Adjusted earnings from
operations should not be considered in isolation or as a substitute for
performance measures calculated in accordance with GAAP.
(2) The Diluted weighted average number of shares
outstanding for the year ended January 1, 2011 is 66,028,278 (see note 12).
| SUNOPTA INC. | 45 | January 1, 2011 10-K |
Segmented Operations Information
| SunOpta Foods | ||||||||||||
| For the year ended | January 1, 2011 | December 31, 2009 | Change | % Change | ||||||||
| Revenue | 818,063 | 756,517 | 61,546 | 8.1% | ||||||||
| Gross Margin | 124,407 | 95,978 | 28,429 | 29.6% | ||||||||
| Gross Margin % | 15.2% | 12.7% | 2.5% | |||||||||
| Operating Income | 44,837 | 17,660 | 27,177 | 153.9% | ||||||||
| Operating Income % | 5.5% | 2.3% | 3.2% |
(Operating Income is defined as “Earnings before the following” excluding the impact of “Other expense (income), net”, and "Goodwill impairment")
SunOpta Foods contributed $818,063 or 91.0% of consolidated revenue for the year ended January 1, 2011 compared to $756,517 or 92.4% of consolidated revenues for the year ended December 31, 2009, an increase of $61,546. The increased revenue is based on SunOpta Foods internal growth of 6.9% and acquisition revenues of $13,076. Internal growth includes growth on the base business plus growth on acquisitions from the date of acquisition over the previous year in addition to the impact of foreign exchange movements on the translation of foreign denominated revenue to U.S. dollars and commodity related price movements. Excluding the impact of foreign exchange and commodity related price movements, revenues in SunOpta Foods increased approximately 9.1% over the prior year. The acquisition of Dahlgren and Company, Inc. and Edner of Nevada, Inc. added incremental acquisition revenues of $13,031 and $45, respectively. The table below explains the increase in revenue by group:
| SunOpta Foods Revenue Changes | |
| Revenue for the year ended December 31, 2009 | $756,517 |
| Increase in the Grains and Foods Group | 40,489 |
| Increase in the Ingredients Group | 3,706 |
| Increase in the Fruit Group | 4,135 |
| Increase in the International Foods Group | 13,216 |
| Revenue for the year ended January 1, 2011 | $818,063 |
Gross margin in SunOpta Foods increased by $28,429 for the year ended January 1, 2011 to $124,407, or 15.2% of revenues, compared to $95,978, or 12.7% of revenues for the year ended December 31, 2009. The table below explains the increase in gross margin by group:
| SunOpta Foods Gross Margin Changes | |
| Gross Margin for the year ended December 31, 2009 | $95,978 |
| Increase in the Grains and Foods Group | 10,054 |
| Increase in the Ingredients Group | 4,910 |
| Increase in the Fruit Group | 7,381 |
| Increase in the International Foods Group | 6,084 |
| Gross Margin for the year ended January 1, 2011 | $124,407 |
Operating income in SunOpta Foods increased by $27,177 for the year ended January 1, 2011 to $44,837 or 5.5% of revenues, compared to $17,660 or 2.3% of revenues for the year ended December 31, 2009. The table below explains the increase in operating income:
| SUNOPTA INC. | 46 | January 1, 2011 10-K |
| SunOpta Foods Operating Income Changes | |
| Operating Income for the year ended December 31, 2009 | $17,660 |
| Increase in gross margin, as noted above | 28,429 |
| Increase in foreign exchange gains | 805 |
| Increase in SG&A costs | (2,577) |
| Decrease in W&D costs | 520 |
| Operating Income for the year ended January 1, 2011 | $44,837 |
Further details on revenue, gross margin and operating income variances within SunOpta Foods are provided in the segmented operations information that follows.
| Grains and Foods Group | January 1, 2011 | December 31, 2009 | Change | % Change | ||||||||
| Revenue | 365,527 | 325,038 | 40,489 | 12.5% | ||||||||
| Gross Margin | 46,351 | 36,297 | 10,054 | 27.7% | ||||||||
| Gross Margin % | 12.7% | 11.2% | 1.5% | |||||||||
| Operating Income | 26,398 | 18,044 | 8,354 | 46.3% | ||||||||
| Operating Income % | 7.2% | 5.6% | 1.6% |
(Operating Income is defined as “Earnings before the following” excluding the impact of “Other expense (income), net”, and "Goodwill impairment")
The Grains and Foods Group contributed $365,527 in revenues for the year ended January 1, 2011, compared to $325,038 for the year ended December 31, 2009, a $40,489 or 12.5% increase. The table below explains the increase in revenue:
| Grains and Foods Group Revenue Changes | |
| Revenue for the year ended December 31, 2009 | $325,038 |
| Higher
volume of commodity grains and grain-based food ingredients and
incremental revenue generated from our South African soy base operation |
25,946 |
| Higher
soymilk and alternate beverage sales due to growth in volumes from
existing and new customer contracts and the commencement of aseptically packaged natural broth and soup products at our Alexandria, MN facility |
22,715 |
| Incremental revenue from the acquisition of Dahlgren on November 8, 2010 | 13,031 |
| Increased
specialty oil volume from the Colorado Mills vegetable oil operation
which commenced commercial operations near the end of 2009 |
613 |
| Increased
sunflower product sales as a result of higher bakery kernel and
by-product volume, offset by lower volume of in-shell products and by price declines due in part to the weakening Euro |
608 |
| Volume
increase at our roasted grain operation as a result of the launch of our
Sunrich Naturals brand roasted snack product |
597 |
| Decline
in price for commodity soy and corn as well as organic grains and
grain-based ingredients |
(14,076) |
| Loss
of significant customer for extended shelf life soy milk products in the
third quarter of 2009 |
(8,945) |
| Revenue for the year ended January 1, 2011 | $365,527 |
| SUNOPTA INC. | 47 | January 1, 2011 10-K |
Gross margin in the Grains and Foods Group increased by $10,054 to $46,351 for the year ended January 1, 2011 compared to $36,297 for the year ended December 31, 2009, and the gross margin percentage increased by 1.5% to 12.7% . The increase in gross margin as a percentage of revenue is primarily due to a favourable shift in sales mix, as soymilk and alternative beverages as well as sunflower products have higher inherent margins than our grain-based sales. Improved efficiencies at our West Coast aseptic packaging facility which was being commissioned during the first half of 2009 also helped to increase the gross margin rate. The table below explains the increase in gross margin:
| Grains and Foods Group Gross Margin Changes | |
| Gross Margin for the year ended December 31, 2009 | $36,297 |
| Higher volumes of soymilk, alternate beverages and broth products | 5,239 |
| Increased
volume for bakery kernel products combined with plant efficiencies
and improved in-shell pricing |
3,621 |
| Pre-opening
costs incurred in 2009 at our aseptic packaging facility in
Modesto, California which became operational late in the second quarter of 2009 |
2,464 |
| Incremental margin from the acquisition of Dahlgren on November 8, 2010 | 2,048 |
| Loss
of significant customer for extended shelf life soy milk products in the
third quarter of 2009 |
(1,994) |
| Business interruption insurance proceeds not received in 2010 | (577) |
| Inefficiencies
at our vegetable oil refinery operation due to equipment issues and
low plant throughput, offset by increased volumes in our roasted grain operation as a result of launch of Sunrich Naturals brand roasted product, and production efficiencies |
(428) |
| Unfavourable
pricing of our non-GMO and organic grains and grain-based foods due
to market pricing of specialty grains and crop quality, offset by increased volumes |
(319) |
| Gross Margin for the year ended January 1, 2011 | $46,351 |
Operating income in the Grains and Foods Group increased by $8,354 or 46.3% to $26,398 for the year ended January 1, 2011, compared to $18,044 for the year ended December 31, 2009. The table below explains the increase in operating income:
| Grains and Foods Group Operating Income Changes | |
| Operating Income for the year ended December 31, 2009 | $18,044 |
| Increase in gross margin, as explained above | 10,054 |
| Lower foreign exchange losses | 207 |
| Increased
professional fees and reserves as a result of the dispute with Colorado
Sun
Oil Processors, LLC |
(767) |
| Increased
office, travel, marketing and R&D costs due to facility expansions
and international strategy initiatives, partially offset by lower compensation costs |
(577) |
| Incremental SG&A from the acquisition of Dahlgren on November 8, 2010 | (563) |
| Operating Income for the year ended January 1, 2011 | $26,398 |
| SUNOPTA INC. | 48 | January 1, 2011 10-K |
Looking forward, we believe the acquisition of Dahlgren & Company, Inc. positions us as a global leader in the confection sunflower business with solid growth potential. We expect our aseptic packaging expansion on the West Coast to continue to enhance our capacity to manufacture aseptic soy and alternate beverages. We also intend to focus our efforts on growing our sunflower and IP grains business, expanding revenues from organic ingredients and continuing to focus on value-added ingredient and packaged product offerings. Additionally, the international expansion of our soy base sales via strategic relationships for procurement of product is expected to drive incremental sales volume. Our long-term expectation for this group is to achieve a segment operating margin of 6% to 8% which assumes we are able to secure consistent quantity and quality grains and sunflower stocks, improve product mix, and control costs. The statements in this paragraph are forward-looking statements. See “Forward-Looking Statements” above. Increased supply pressure in the commodity-based markets in which we operate, volume decreases or loss of customers, or our inability to secure quality inputs or achieve our product mix or cost reduction goals, along with the other factors described above under “Forward-Looking Statements,” could adversely impact our ability to meet these forward-looking expectations.
| Ingredients Group | January 1, 2011 | December 31, 2009 | Change | % Change | ||||||||
| Revenue | 68,363 | 64,657 | 3,706 | 5.7% | ||||||||
| Gross Margin | 21,106 | 16,196 | 4,910 | 30.3% | ||||||||
| Gross Margin % | 30.9% | 25.0% | 5.9% | |||||||||
| Operating Income | 13,172 | 8,691 | 4,481 | 51.6% | ||||||||
| Operating Income % | 19.3% | 13.4% | 5.9% |
(Operating Income is defined as “Earnings before the following” excluding the impact of “Other expense (income), net”, and "Goodwill impairment")
The Ingredients Group contributed $68,363 in revenues for the year ended January 1, 2011, compared to $64,657 for the year ended December 31, 2009, a $3,706 or 5.7% increase. The table below explains the increase in revenue:
| Ingredients Group Revenue Changes | |
| Revenue for the year ended December 31, 2009 | $64,657 |
| Increased
oat and soy fiber volumes due to customer demands, slightly offset by
price decreases |
3,567 |
| Improved pricing in contract manufacturing | 1,735 |
| Decrease
in blended food ingredients due to lower volume and the partial sale of
our
product portfolio during the fourth quarter of 2009, as well as lower pricing in the dairy blends market |
(1,256) |
| Decrease in bran sales due to lower volumes in corn as well as the overall bran market | (340) |
| Revenue for the year ended January 1, 2011 | $68,363 |
Gross margin in the Ingredients Group increased by $4,910 to $21,106 for the year ended January 1, 2011 compared to $16,196 for the year ended December 31, 2009, and the gross margin percentage increased by 5.9% to 30.9% . The increase in gross margin as a percentage of revenue is due to continued process improvements implemented in our manufacturing facilities and lower raw material costs coupled with higher fiber volumes. The table below explains the increase in gross margin:
| SUNOPTA INC. | 49 | January 1, 2011 10-K |
| Ingredients Group Gross Margin Changes | |
| Gross Margin for the year ended December 31, 2009 | $16,196 |
| Increase due to oat and soy fiber volume and plant efficiencies | 3,802 |
| Increase in volume and pricing in contract manufacturing | 1,158 |
| Lower
manufacturing costs in dairy blends and other blended products, partially
offset
by lower volumes |
288 |
| Decrease in starch and brans due primarily to lower volume | (338) |
| Gross Margin for the year ended January 1, 2011 | $21,106 |
Operating income in the Ingredients Group increased by $4,481, or 51.6%, to $13,172 for the year ended January 1, 2011, compared to $8,691 for the year ended December 31, 2009. The table below explains the increase in operating income:
| Ingredients Group Operating Income Changes | |
| Operating Income for the year ended December 31, 2009 | $8,691 |
| Increase in gross margin, as explained above | 4,910 |
| Decrease in bad debt expense | 321 |
| Increase in compensation costs | (477) |
| Higher
professional fees, increased travel expense and higher general office
costs
and corporate allocations, offset by a decrease in foreign exchange losses |
(273) |
| Operating Income for the year ended January 1, 2011 | $13,172 |
Looking forward, we will continue to concentrate on growing the Ingredients Group’s fiber portfolio and customer base through product innovation and diversification of both soluble and insoluble fiber applications. We will also focus on maintaining the continuous improvement culture of this group to further increase capacity utilization, reduce costs, and sustain margins. Our long-term expectation for the Ingredients Group is to maintain segment operating margins of 12% to 15%. The statements in this paragraph are forward-looking statements. See “Forward-Looking Statements” above. An unexpected increase in input costs or our inability to introduce new products to the market, or implement our strategies and goals relating to pricing, capacity utilization or cost reductions, along with the other factors described above under “Forward- Looking Statements,” could adversely impact our ability to meet these forward-looking expectations.
| Fruit Group | January 1, 2011 | December 31, 2009 | Change | % Change | ||||||||
| Revenue | 151,578 | 147,443 | 4,135 | 2.8% | ||||||||
| Gross Margin | 19,427 | 12,046 | 7,381 | 61.3% | ||||||||
| Gross Margin % | 12.8% | 8.2% | 4.6% | |||||||||
| Operating Income | 3,615 | (4,073 | ) | 7,688 | 188.8% | |||||||
| Operating Income % | 2.4% | -2.8% | 5.2% |
(Operating Income is defined as “Earnings before the following” excluding the impact of “Other expense (income), net”, and "Goodwill impairment")
The Fruit Group contributed $151,578 in revenues for the year ended January 1, 2011, compared to $147,443 for the year ended December 31, 2009, a $4,135 or 2.8% increase. The table below explains the increase in revenue:
| SUNOPTA INC. | 50 | January 1, 2011 10-K |
| Fruit Group Revenue Changes | |
| Revenue for the year ended December 31, 2009 | $147,443 |
| Higher
volume due to the increased demand at our fruit ingredient operations
for industrial and food service products and new product offerings as well as improved pricing |
6,910 |
| Higher
volume as a result of new customers and increased demand in our
healthy snacks operation, partially offset by reduced contract pricing to certain customers |
2,477 |
| Decrease in brokerage operations due to lower volumes and lost customers | (3,179) |
| Volume
declines on industrial and food service offerings along with retail
price decreases in the Frozen Fruit operation, partially offset by higher retail volumes and price increases for industrial products |
(2,073) |
| Revenue for the year ended January 1, 2011 | $151,578 |
Gross margins in the Fruit Group increased by $7,381 to $19,427 for the year ended January 1, 2011 compared to $12,046 for the year ended December 31, 2009, and the gross margin percentage increased by 4.6% to 12.8% . The increase in gross margin as a percentage of revenue is due to liquidation and rationalization costs incurred in 2009 that did not reoccur in 2010, as well as improved production efficiencies at our fruit ingredient and frozen foods operations, and cost benefits realized from process improvement initiatives implemented in our healthy snacks and fruit ingredients operations. The table below explains the increase in gross margin:
| Fruit Group Gross Margin Changes | |
| Gross Margin for the year ended December 31, 2009 | $12,046 |
| Costs
incurred in 2009 to liquidate inventories and rationalize product
offerings in
the frozen foods operation |
3,238 |
| Impact
of improved pricing and higher volumes in our fruit ingredient operations
which, in addition to process improvements, contributed to manufacturing efficiencies |
2,426 |
| Positive
impact of the elimination of fresh fruit processing at our Buena Park
facility
via reduced storage and less costly Mexican fruit, coupled with increased retail volumes and lower brokerage costs, slightly offset by higher transportation costs |
1,484 |
| Impact
of higher volumes, process improvement initiatives and cost
reductions implemented at our healthy snacks operations, offset by costs related to the consolidation of two manufacturing facilities |
1,265 |
| Decline in volume at our brokerage operations | (1,032) |
| Gross Margin for the year ended January 1, 2011 | $19,427 |
Operating income in the Fruit Group increased by $7,688, or 188.8%, to $3,615 for the year ended January 1, 2011, compared to a loss of $4,073 for the year ended December 31, 2009. The table below explains the increase in operating income:
| SUNOPTA INC. | 51 | January 1, 2011 10-K |
| Fruit Group Operating Income Changes | |
| Operating Loss for the year ended December 31, 2009 | ($4,073) |
| Increase in gross margin, as explained above | 7,381 |
| Decrease
in office costs including utilities, insurance, supplies, storage and
freight as
a result of various cost saving initiatives, as well as lower depreciation expense |
561 |
| Severance
and related costs incurred in the first quarter of 2009 associated with
the rationalization of a facility |
545 |
| Increase in professional fees related to ongoing legal matters | (471) |
| Increase
in marketing expense in support of new product offerings and expanded
sales efforts |
(158) |
| Increase in bad debt reserves | (122) |
| Increase in foreign exchange losses | (48) |
| Operating Income for the year ended January 1, 2011 | $3,615 |
Looking forward, we expect improvement in margins and operating income in the Fruit Group through the growth of our fruit ingredients and healthy snacks operations, and from our streamlined frozen foods division. The decision to idle operations at our Mexican frozen fruit processing facilities and increase our mix of value added retail offerings is expected to help enhance the margins of the group. We remain customer focused and continue to explore new ways to bring value added product offerings to market, such as the Garden Green Garbanzo™, as well as to continue to improve plant efficiencies. A new aseptic packaging line in our fruit ingredient division is expected to increase capacity and drive incremental volumes and cost savings when completed in 2011. Long term we expect 6% to 8% operating margins from the Fruit Group. The statements in this paragraph are forward-looking statements. See “Forward-Looking Statements” above. Unexpected declines in volumes, shifts in consumer preferences, inefficiencies in our manufacturing processes, lack of consumer product acceptance, or our inability to successfully implement the particular goals and strategies indicated above, along with the other factors described above under “Forward-Looking Statements,” could have an adverse impact on these forward-looking expectations.
| International Foods Group | ||||||||||||
| For the year ended | January 1, 2011 | December 31, 2009 | Change | % Change | ||||||||
| Revenue | 232,595 | 219,379 | 13,216 | 6.0% | ||||||||
| Gross Margin | 37,523 | 31,439 | 6,084 | 19.4% | ||||||||
| Gross Margin % | 16.1% | 14.3% | 1.8% | |||||||||
| Operating Income | 1,652 | (5,002 | ) | 6,654 | 133.0% | |||||||
| Operating Income % | 0.7% | -2.3% | 3.0% |
(Operating Income is defined as “Earnings before the following” excluding the impact of “Other expense (income), net”, and "Goodwill impairment")
The International Foods Group contributed $232,595 in revenues for the year ended January 1, 2011, compared to $219,379 for the year ended December 31, 2009, a $13,216 or a 6.0% increase. The table below explains the increase in revenue:
| SUNOPTA INC. | 52 | January 1, 2011 10-K |
| International Foods Group Revenue Changes | |
| Revenue for the year ended December 31, 2009 | $219,379 |
| Higher
customer demand for natural and organic commodities such as processed
fruits and vegetables, cocoa products, sweeteners, and coffee beans, partially offset by lower demand for feed ingredients |
12,606 |
| Improved
pricing for sweeteners, coffee beans and agave, and market pricing for
cocoa, which continues to trade at or near record pricing, partially offset by lower contract pricing on grains, seeds and frozen fruits and vegetables |
4,109 |
| Increased
volume at Consumer Product Solutions, primarily driven by new
products, including low-calorie lemonades and electrolyte water products |
4,379 |
| Decline
in volume of shipments of both branded and distributed natural health
products due to increased competition in the Canadian market and lower demand for health and beauty aids and health food products, slightly offset by increased demand in international markets for our natural health products |
(7,350) |
| Unfavourable
net impact on revenues due to the weakened Euro relative to the
U.S. dollar, partially offset by the stronger Canadian dollar relative to the U.S. dollar compared to the 2009 period |
(528) |
| Revenue for the year ended January 1, 2011 | $232,595 |
Gross margins in the International Foods Group increased by $6,084 to $37,523 for the year ended January 1, 2011 compared to $31,439 for the year ended December 31, 2009, and the gross margin percentage increased by 1.8% to 16.1% . The increase in margin rate was due to improved contract pricing on certain organic ingredients at The Organic Corporation, as well as the new higher margin product offerings at our Consumer Product Solutions operation. The table below explains the increase in gross margin:
| International Foods Group Gross Margin Changes | |
| Gross Margin for the year ended December 31, 2009 | $31,439 |
| Higher
volumes of natural and organic commodities, as well as improved
contract pricing on coffee beans, sweeteners, agave and cocoa |
6,159 |
| Reduced
spending on a brand re-launch initiative that was undertaken in 2009
in support of certain of our branded natural health products |
1,714 |
| Introduction
of new, high margin, products offerings at Consumer Product Solutions
in addition to improved pricing on existing products, as well as lower warehousing costs and a decrease in inventory reserves as a result of lower inventory levels |
1,491 |
| Favourable
net impact on gross margins due to the stronger Canadian dollar relative
to the U.S. dollar, partially offset by weakened Euro relative to the U.S. dollar versus the 2009 period |
619 |
| Lower
shipment volumes of both branded products and distributed products,
partially offset by improved pricing on distributed products and reduced trade spending in our natural health products operations |
(3,899) |
| Gross Margin for the year ended January 1, 2011 | $37,523 |
Operating income in the International Foods Group increased by $6,654, or 133.0%, to $1,652 for the year ended January 1, 2011, compared to a loss of $5,002 for the year ended December 31, 2009. The table below explains the increase in operating income:
| SUNOPTA INC. | 53 | January 1, 2011 10-K |
| International Foods Group Operating Income Changes | |
| Operating Loss for the year ended December 31, 2009 | ($5,002) |
| Improved gross margins, as noted above | 6,084 |
| Lower
marketing costs related to a brand re-launch initiative that was
undertaken in
2009 in support of certain of our branded natural health products |
1,484 |
| Lower
compensation costs as a result of a restructuring plan in our natural
health
products operation initiated in the second quarter of 2010 combined with a reduction in warehousing and distribution costs that are variable with lower branded and distributed revenues |
718 |
| Foreign
exchange gains on forward foreign exchange contracts entered into by
The Organic Corporation, mostly related to U.S. denominated contracts |
627 |
| Negative
impact on Canadian borne SG&A spending due to higher Canadian
dollar relative to the U.S., partially offset by Euro borne SG&A spending due to the lower Euro relative to the U.S. dollar as compared to the 2009 period |
(1,560) |
| Increase
in travel and related costs at The Organic Corporation to support higher
sales
and the sourcing of raw material products, as well as higher reserve for bad debt and an increase in management fees, partially offset by lower compensation related costs in our natural and health products operations due to headcount reductions in 2010 |
(699) |
| Operating Income for the year ended January 1, 2011 | $1,652 |
Looking forward, the International Foods Group is focused on leveraging its sourcing, supply and distribution expertise to grow its portfolio of organic ingredients as well as to expand its range of consumer and natural health product offerings. Long-term group operating margins are targeted at 5% to 6% of revenues which is expected to be achieved through a combination of sourcing, pricing and product development strategies. We will also strive to foster an environment of continuous improvement to help forward and backward integrate where opportunities exist, expand our processing expertise and increase our value-added capabilities. The statements in this paragraph are forward-looking statements. See “Forward-Looking Statements” above. Unfavourable fluctuations in foreign exchange, reduced demand for natural and organic ingredients and delayed synergies as well as our inability to realize our particular strategic expansion goals, along with the other factors described above under “Forward-Looking Statements,” could have an adverse impact on these forward-looking expectations.
| Opta Minerals | January 1, 2011 | December 31, 2009 | Change | % Change | ||||||||
| Revenue | 80,868 | 62,523 | 18,345 | 29.3% | ||||||||
| Gross Margin | 20,037 | 13,081 | 6,956 | 53.2% | ||||||||
| Gross Margin % | 24.8% | 20.9% | 3.9% | |||||||||
| Operating Income | 7,753 | 1,161 | 6,592 | 567.8% | ||||||||
| Operating Income % | 9.6% | 1.9% | 7.7% |
(Operating Income is defined as “Earnings before the following” excluding the impact of “Other expense (income), net”, and "Goodwill impairment")
Opta Minerals contributed $80,868 in revenues for the year ended January 1, 2011, compared to $62,523 for the year ended December 31, 2009, an $18,345 or 29.3% increase. The table below explains the increase in revenue:
| SUNOPTA INC. | 54 | January 1, 2011 10-K |
| Opta Minerals Revenue Changes | |
| Revenue for the year ended December 31, 2009 | $62,523 |
| Increased
volume as a result of a global increase in demand for steel and
related products |
11,568 |
| Higher
volume of abrasive products as a result of increased demand for abrasive
slag
in the Southern U.S. |
3,626 |
| Incremental
sales from new production facilities located in Freeport, Texas and
Tampa Bay, Florida which did not start to come online until the fourth quarter of 2009 |
3,151 |
| Revenue for the year ended January 1, 2011 | $80,868 |
Gross margin for Opta Minerals increased by $6,956 to $20,037 for the year ended January 1, 2011 compared to $13,081 for the year ended December 31, 2009, and the gross margin percentage increased by 3.9% to 24.8% . The table below explains the increase in gross margin:
| Opta Minerals Gross Margin Changes | |
| Gross Margin for the year ended December 31, 2009 | $13,081 |
| Increased
volume of steel and related products due to higher demand, combined
with cost reduction measures that were implemented during 2009 |
5,369 |
| Incremental
gross margin from new production facilities located in Freeport, Texas
and Tampa Bay, Florida which did not start to come online until the fourth quarter of 2009 |
821 |
| Higher
volume of abrasive products and lower costs due to cost reduction measures
that were implemented during 2009 |
766 |
| Gross Margin for the year ended January 1, 2011 | $20,037 |
Operating income for Opta Minerals increased by $6,592, or 567.8%, to $7,753 for the year ended January 1, 2011, compared to $1,161 for the year ended December 31, 2009. The table below explains the increase in operating income:
| Opta Minerals Operating Income Changes | |
| Operating Income for the year ended December 31, 2009 | $1,161 |
| Increase in gross margin, as explained above | 6,956 |
| Increase in foreign exchange gains | 805 |
| Decrease in depreciation and amortization | 170 |
| Decrease in professional fees due to fewer legal matters | 155 |
| Increase in compensation costs | (975) |
| Increase
in bad debt, office and occupancy costs, and storage and freight, offset
by
lower marketing and other SG&A costs |
(519) |
| Operating Income for the year ended January 1, 2011 | $7,753 |
| SUNOPTA INC. | 55 | January 1, 2011 10-K |
Opta Minerals continues to develop and introduce new products into the marketplace, and is focused on leveraging the global platform that has been put in place both to drive these new products and to improve efficiencies. Opta Minerals continues to expand in core North American and European markets and during 2009 restructured operations to address the economic downturn. As a result, we believe Opta Minerals is well positioned for continued future profitability as economic conditions improve. Opta Minerals recently expanded its abrasives processing operations in Texas and Florida to better serve the Southern U.S. markets. We own 66.4% of Opta Minerals and segment operating income is presented prior to minority interest expense. The statements in this paragraph are forward-looking statements. See “Forward-Looking Statements” above. An extended period of softness in the steel and foundry industries, slowdown in economic improvement, or delays in bringing new facilities completely online, along with the other factors described above under “Forward-Looking Statements,” could have an adverse impact on these forward-looking expectations.
| Corporate Services | January 1, 2011 | December 31, 2009 | Change | % Change | ||||||||
| Operating Loss | (11,213 | ) | (6,614 | ) | (4,599 | ) | -69.5% |
(Operating loss is defined as “Earnings before the following” excluding the impact of “Other expense (income), net”, and “Goodwill impairment”)
Operating loss at Corporate Services increased by $4,599 to $11,213 for the year ended January 1, 2011, from costs of $6,614 for the year ended December 31, 2009. The table below explains the increase in operating loss:
| Corporate Services Operating Loss Changes | |
| Operating Loss for the year ended December 31, 2009 | ($6,614) |
| Increased
compensation costs due to higher bonus accruals and increased
workers compensation expense |
(2,508) |
| Increase
in SG&A costs due to the strengthened Canadian dollar in 2010 on
translating Canadian borne expenses into U.S. dollars |
(1,489) |
| Higher
stock compensation expense as a result of warrants that were issued
pursuant
to an advisory services agreement with a financial advisory firm, as well as consulting costs |
(640) |
| Increase
in other corporate overhead costs mainly due to higher
insurance premiums, increased IT related communication and hosting expenses and increased bank charges under our asset based lending facility, offset by lower depreciation expense |
(613) |
| Decrease in foreign exchange gains | (410) |
| Increase
in corporate management fees that are allocated to SunOpta
operating groups |
683 |
| Decreased
professional fees primarily due to a reduction in legal costs related to
the restatement of financial statements for the three quarters of 2007 |
378 |
| Operating Loss for the year ended January 1, 2011 | ($11,213) |
Management fees mainly consist of salaries of corporate personnel who perform back office functions for divisions, as well as costs related to the enterprise resource management system used within several of the divisions. These expenses are allocated to the groups based on (1) specific identification of allocable costs that represent a service provided to each division and (2) a proportionate distribution of costs based on a weighting of factors such as revenue contribution and number of people employed within each division. As a result of the sale of the Canadian Food Distribution business and SunOpta BioProcess, a portion of the corporate management fees previously charged to these groups was reallocated as an expense of the Corporate Services operating segment. The operating loss for Corporate Services for the year ended December 31, 2009 has been adjusted to reflect this change.
| SUNOPTA INC. | 56 | January 1, 2011 10-K |
Results of 2009 Operations Compared with Results of 2008 Operations
| December 31, 2009 | December 31, 2008 | Change | % Change | |||||||||
| Revenue | ||||||||||||
| SunOpta Foods | 756,517 | 781,023 | (24,506 | ) | -3.1% | |||||||
| Opta Minerals | 62,523 | 93,422 | (30,899 | ) | -33.1% | |||||||
| Total Revenue | 819,040 | 874,445 | (55,405 | ) | -6.3% | |||||||
| Gross Profit | ||||||||||||
| SunOpta Foods | 95,978 | 93,861 | 2,117 | 2.3% | ||||||||
| Opta Minerals | 13,081 | 18,476 | (5,395 | ) | -29.2% | |||||||
| Total Gross Profit | 109,059 | 112,337 | (3,278 | ) | -2.9% | |||||||
| Operating Income | ||||||||||||
| SunOpta Foods | 17,660 | 17,071 | 589 | 3.5% | ||||||||
| Opta Minerals | 1,161 | 5,531 | (4,370 | ) | -79.0% | |||||||
| Corporate Services | (6,614 | ) | (11,247 | ) | 4,633 | -41.2% | ||||||
| Total Operating Income | 12,207 | 11,355 | 852 | 7.5% | ||||||||
| Other expense (income), net | 2,245 | (719 | ) | 2,964 | -412.2% | |||||||
| Goodwill impairment | 8,841 | 10,154 | (1,313 | ) | -12.9% | |||||||
| Interest expense, net | 13,839 | 14,607 | (768 | ) | -5.3% | |||||||
| Recovery of income taxes | (3,201 | ) | (1,699 | ) | (1,502 | ) | 88.4% | |||||
| Loss from
continuing operations |
(9,517 |
) |
(10,988 |
) |
1,471 |
-13.4% |
||||||
| (Loss) earnings attributable
to non-controlling interests |
(3,027 |
) |
911 |
(3,938 |
) |
-432.3% |
||||||
| (Loss) earnings
from discontinued operations, net of taxes |
(273 |
) |
963 |
(1,236 |
) |
-128.3% |
||||||
| Loss attributable
to SunOpta Inc. |
(6,763 |
) |
(10,936 |
) |
4,173 |
-38.2% |
(Operating Income is defined as “Earnings before the following” excluding the impact of “Other expense (income), net”, and "Goodwill impairment")
Revenues for the year ended December 31, 2009 decreased by 6.3% to $819,040 from $874,445 for the year ended December 31, 2008. Revenues in SunOpta Foods decreased by 3.1% to $756,517 and revenues in Opta Minerals decreased by 33.1% to $62,523. The decreased revenue reflects an internal revenue decline of 9.7% on a consolidated basis in 2009. Internal revenue decline includes growth or declines on the base business in addition to the impact of foreign exchange movements on the translation of foreign denominated revenue to U.S. dollars and the impact of changes in commodity related pricing. Excluding the impact of changes in foreign exchange and commodity related pricing, revenues decreased approximately 7.3% over the prior year. The decrease in revenue was due primarily to the changes in sales volume and pricing described below in “Segmented Operations Information”.
| SUNOPTA INC. | 57 | January 1, 2011 10-K |
Gross profit decreased $3,278, or 2.9%, for the year ended December 31, 2009 to $109,059 from $112,337 for the year ended December 31, 2008. As a percentage of revenues, gross profit for the year ended December 31, 2009 was 13.3% compared to 12.8% for the year ended December 31, 2008, an increase of 0.5% . Gross margin increased by $2,117 in SunOpta Foods driven by improved margins in the Grains and Foods, Ingredients and Fruit Groups, offset by a decline in International Foods due to costs associated with the phasing out and re-launch of branded natural health products, and lower demand for organic ingredients. Also contributing to the lower gross margin was a dramatic volume decline in the steel and foundry markets which impacted Opta Minerals in 2009. The decrease in gross profit was due primarily to a higher overall cost of goods sold, as a percentage of revenues, as a result of the variances described below under “Segmented Operations Information”.
W&D costs for the year ended December 31, 2009 were $4,223, a $573 decrease compared to $4,796 for the year ended December 31, 2008. These costs are solely related to the International Foods Group and specifically the Group’s Canadian based natural health products distribution operation as warehousing and distribution costs for all other operations are considered part of cost of goods sold.
SG&A costs, including intangible asset amortization decreased $7,495 to $93,152 for the year ended December 31, 2009 compared to $100,647 for the year ended December 31, 2008. The combination of a weaker Canadian dollar and Euro in 2009 led to a $2,748 decrease in SG&A on foreign denominated costs. Costs related to the internal investigation, class action lawsuits and other legal matters were $5,920 lower in 2009 compared to 2008. These decreases were offset by the acquisitions of The Organic Corporation and MCP Mg-Serbien as incremental SG&A from these companies increased SG&A by $2,682 in 2009. Severance costs associated with headcount reductions and closing costs related to the rationalization of various plants increased SG&A by $2,140. Marketing, listing fees and other costs associated with the re-launch of certain branded natural health products increased SG&A by $1,484. The remaining SG&A decrease of $5,133 is due to overall cost saving initiatives. SG&A as a percentage of sales was 11.4% in 2009 which is comparable to 11.5% in 2008.
Foreign exchange gains were $523 for the year ended December 31, 2009 as compared to gains of $4,461 for the year ended December 31, 2008. The decrease in foreign exchange gains was primarily due to less favourable exchange rate movements for the Euro and Canadian dollar relative to the U.S. dollar. In 2008, we entered into a number of Canadian and Euro forward contracts that were closed prior to reaching their maturity. Due to the volatility in these exchange rates in 2008, gains were realized.
Operating income for the year ended December 31, 2009 increased by $852 to $12,207 compared to operating income of $11,355 for the year ended December 31, 2008 due to the factors noted above. As a percentage of revenue, operating income was 1.5% for the year ended December 31, 2009, compared to 1.3% for the year ended December 31, 2008. Further details on revenue, gross margins and operating income variances are provided below under “Segmented Operations Information”.
Other expense was $2,245 in 2009 compared to other income of $719 in 2008. The increased expense in 2009 is due primarily to facility rationalization charges and the settlement of a labour related class action lawsuit, slightly offset by the elimination of certain long-term liabilities at Opta Minerals. The other income in 2008 related primarily to insurance proceeds received.
During 2009, Opta Minerals determined that the carrying value of certain goodwill in its mill and foundry and abrasive products reporting units exceeded its fair value. As a result, a non-cash impairment charge of $8,341 was recorded. During the fourth quarter of 2009, an additional impairment charge of $500 was recorded as a result of contingent consideration being earned by a division within the Fruit Group that also could not support its carrying value. Goodwill impairment charges recorded in 2008 were $8,198 relating to the Fruit Group and $1,956 relating to the International Foods Group.
Interest expense for the year ended December 31, 2009 was $13,839 compared to $14,607 for the year ended December 31, 2008, a $768 decrease. The decrease reflects lower LIBOR rates and lower borrowing levels in 2009 versus 2008, offset by higher costs related to waiver and amendment fees relating to our credit facilities that we negotiated with our lenders in 2009.
Income tax recovery for the year ended December 31, 2009 was $3,201 compared to a recovery of $1,699 for the year ended December 31, 2008. The increase in the recovery reflects a higher loss from continuing operations before tax and a decrease in the amount of allowance recorded against the value of deferred income taxes.
Loss from continuing operations for the year ended December 31, 2009 was $9,517 as compared to a loss of $10,988 for the year ended December 31, 2008, a $1,471 decrease. Basic and diluted loss per share from continuing operations was $0.10 and $0.10 respectively for the year ended December 31, 2009 compared to a loss of $0.18 and $0.18 respectively for the year ended December 31, 2008.
| SUNOPTA INC. | 58 | January 1, 2011 10-K |
Losses attributable to non-controlling interests for the year ended December 31, 2009 were $3,027 compared to earnings of $911 for the year ended December 31, 2008. The $3,938 decreased expense is due to lower net earnings in our less than wholly-owned subsidiaries.
Losses from discontinued operations, net of income taxes, were $273 for the year ended December 31, 2009 compared to earnings of $963 for the year ended December 31, 2008. The $1,236 decrease in earnings is due to lower net operating margins realized in the Canadian distribution business and SunOpta BioProcess.
On a consolidated basis, losses and basic and diluted losses per share were $6,763, $0.10 and $0.10 respectively, for the year ended December 31, 2009, compared to losses of $10,936, $0.17 and $0.17, respectively, for the year ended December 31, 2008.
Segmented Operations Information
(Note: Certain prior year figures have been adjusted to conform with current year presentation and segmented reporting.)
| SunOpta Foods | ||||||||||||
| for the year ended | December 31, 2009 | December 31, 2008 | Change | % Change | ||||||||
| Revenue | 756,517 | 781,023 | (24,506 | ) | -3.1% | |||||||
| Gross Margin | 95,978 | 93,861 | 2,117 | 2.3% | ||||||||
| Gross Margin % | 12.7% | 12.0% | 0.7% | |||||||||
| Operating Income | 17,660 | 17,071 | 589 | 3.5% | ||||||||
| Operating Income % | 2.3% | 2.2% | 0.1% |
(Operating Income is defined as “Earnings before the following” excluding the impact of “Other expense (income), net”, and "Goodwill impairment")
SunOpta Foods contributed $756,517 or 92.4% of consolidated revenue for the year ended December 31, 2009 compared to $781,023 or 89.3% of consolidated revenues for the year ended December 31, 2008, a $24,506 decrease. The decreased revenue reflects an internal revenue decline of 7.0% for SunOpta Foods in 2009. Internal revenue decline includes growth or declines on the base business in addition to the impact of foreign exchange movements on the translation of foreign denominated revenue to U.S. dollars and the impact of changes in commodity related pricing. Excluding the impact of changes in foreign exchange and commodity related pricing, revenue in SunOpta Foods decreased 4.3% over the prior year. The table below explains the decrease in revenue by group:
| SunOpta Foods Revenue Changes | |
| Revenue for the year ended December 31, 2008 | $781,023 |
| Decrease in the Grains and Foods Group | (2,269) |
| Decrease in the Ingredients Group | (613) |
| Decrease in the Fruit Group | (3,436) |
| Decrease in the International Foods Group | (18,188) |
| Revenue for the year ended December 31, 2009 | $756,517 |
Gross margin in SunOpta Foods increased by $2,117 for the year ended December 31, 2009 to $95,978, or 12.7% of revenues, compared to $93,861, or 12.0% of revenues for the year ended December 31, 2008. The table below explains the increase in gross margin by group:
| SUNOPTA INC. | 59 | January 1, 2011 10-K |
| SunOpta Foods Gross Margin Changes | |
| Gross Margin for the year ended December 31, 2008 | $93,861 |
| Increase in the Grains and Foods Group | 1,988 |
| Increase in the Ingredients Group | 5,651 |
| Increase in the Fruit Group | 4,697 |
| Decrease in the International Foods Group | (10,219) |
| Gross Margin for the year ended December 31, 2009 | $95,978 |
Operating income in SunOpta Foods increased by $589 for the year ended December 31, 2009 to $17,660 or 2.3% of revenues, compared to $17,071 or 2.2% of revenues for the year ended December 31, 2008. The table below explains the increase in operating income:
| SunOpta Foods Operating Income Changes | |
| Operating Income for the year ended December 31, 2008 | $17,071 |
| Increase in gross margin, as explained above | 2,117 |
| Increase in foreign exchange losses | (777) |
| Increase in SG&A costs | (1,324) |
| Decrease in W&D costs | 573 |
| Operating Income for the year ended December 31, 2009 | $17,660 |
Further details on revenue, gross margins and operating income variances within SunOpta Foods are provided in the segmented operations information that follows.
| Grains & Foods Group | ||||||||||||
| For the year ended | December 31, 2009 | December 31, 2008 | Change | % Change | ||||||||
| Revenue | 325,038 | 327,307 | (2,269 | ) | -0.7% | |||||||
| Gross Margin | 36,297 | 34,309 | 1,988 | 5.8% | ||||||||
| Gross Margin % | 11.2% | 10.5% | 0.7% | |||||||||
| Operating Income | 18,044 | 18,541 | (497 | ) | -2.7% | |||||||
| Operating Income % | 5.6% | 5.7% | -0.1% |
(Operating Income is defined as “Earnings before the following” excluding the impact of “Other expense (income), net”, and "Goodwill impairment")
The Grains and Foods Group contributed $325,038 in revenues for the year ended December 31, 2009, compared to $327,307 for the year ended December 31, 2008, a $2,269 or 0.7% decrease. The table below explains the decrease in revenue:
| SUNOPTA INC. | 60 | January 1, 2011 10-K |
| Grains and Foods Group Revenue Changes | |
| Revenue for the year ended December 31, 2008 | $327,307 |
| Decline
in volume and price of commodity soy and corn, as well as lower volumes
of organic grains and grain based food ingredients |
(28,676) |
| Higher
soymilk and alternate beverage sales due to continued growth in
volumes from existing customer contracts, a large food service contract which began shipping in late 2008 and a half year of operations at the Modesto, CA facility which opened late in the second quarter of 2009 |
14,455 |
| Increased
sunflower product sales as a result of higher in-shell demand,
particularly
in Europe, offset by lower volumes of bakery kernel and bi-products due to oversupply in these markets |
11,084 |
| Higher volumes of roasted grain and other products due primarily to new customers | 868 |
| Revenue for the year ended December 31, 2009 | $325,038 |
Gross margin in the Grains and Foods Group increased by $1,988 to $36,297 for the year ended December 31, 2009 compared to $34,309 for the year ended December 31, 2008, and the gross margin percentage increased by 0.7% to 11.2% . The increase in gross margin as a percentage of revenue is primarily due to a favourable shift in sales mix as soymilk and alternate beverage sales have higher inherent margins than our grains based sales. The table below explains the increase in gross margin:
| Grains and Foods Group Gross Margin Changes | |
| Gross Margin for the year ended December 31, 2008 | $34,309 |
| Increase due to higher volumes of soy milk and alternate beverages | 6,490 |
| Recovery
of an insurance settlement from a business interruption claim relating to
a
fire that occurred in 2008 |
577 |
| Higher sales volumes and improved plant efficiencies in our roasted grains operation | 553 |
| Decline
in sunflower product margins due primarily to pricing pressure brought on
by
a market over supply of bakery kernel and bird food products, volume declines in high oleic kernel, offset by increased volumes and prices of in-shell products as well as improved plant efficiencies |
(1,945) |
| Decline
in organic feed and grain-based food ingredients volumes and prices due
to increased international competition, offset by improved margins on soybean and corn products as a result of favourable pricing and ownership positions |
(1,926) |
| Preopening
costs associated with the Modesto plant and Colorado Mills vegetable
oil refinery start-up |
(1,761) |
| Gross Margin for the year ended December 31, 2009 | $36,297 |
Operating income in the Grains and Foods Group decreased by $497, or 2.7%, to $18,044 for the year ended December 31, 2009, compared to $18,541 for the year ended December 31, 2008. The table below explains the decrease in operating income:
| SUNOPTA INC. | 61 | January 1, 2011 10-K |
| Grains and Foods Group Operating Income Changes | |
| Operating Income for the year ended December 31, 2008 | $18,541 |
| Increase in gross margin, as explained above | 1,988 |
| Increase in corporate cost allocations | (1,434) |
| Increase in SG&A primarily due to higher compensation and professional fees | (727) |
| Increase in foreign exchange losses | (324) |
| Operating Income for the year ended December 31, 2009 | $18,044 |
| Ingredients Group | ||||||||||||
| For the year ended | December 31, 2009 | December 31, 2008 | Change | % Change | ||||||||
| Revenue | 64,657 | 65,270 | (613 | ) | -0.9% | |||||||
| Gross Margin | 16,196 | 10,545 | 5,651 | 53.6% | ||||||||
| Gross Margin % | 25.0% | 16.2% | 8.8% | |||||||||
| Operating Income | 8,691 | 3,392 | 5,299 | 156.2% | ||||||||
| Operating Income % | 13.4% | 5.2% | 8.2% |
(Operating Income is defined as “Earnings before the following” excluding the impact of “Other expense (income), net”, and "Goodwill impairment")
The Ingredients Group contributed $64,657 in revenues for the year ended December 31, 2009, compared to $65,270 for the year ended December 31, 2008, a $613 or 0.9% decrease. The table below explains the decrease in revenue:
| Ingredients Group Revenue Changes | |
| Revenue for the year ended December 31, 2008 | $65,270 |
| Lower demand for dairy blends due to depressed commodity prices in the dairy market | (1,550) |
| Decrease
in ingredient systems due to partial sale of plant operation during the
fourth quarter of 2009, combined with lower bran volumes due to quality issues that suppressed corn volume |
(1,534) |
| Increased oat and soy fiber volumes from existing and new customers | 2,471 |
| Revenue for the year ended December 31, 2009 | $64,657 |
The Ingredients Group gross margin increased by $5,651 to $16,196 for the year ended December 31, 2009 compared to $10,545 for the year ended December 31, 2008, and the gross margin percentage increased by 8.8% to 25.0% . Lower raw material input costs, improved pricing, and process improvements implemented in our manufacturing plants led to the significant increase in gross margin and margin rate versus prior year. The table below explains the increase in gross margin:
| Ingredients Group Gross Margin Changes | |
| Gross Margin for the year ended December 31, 2008 | $10,545 |
| Reduction
in raw material, chemical and utility costs as well as process
improvements
in our fiber manufacturing plants and improved volumes |
5,387 |
| Improved dairy blend margins due to improved product mix | 264 |
| Gross Margin for the year ended December 31, 2009 | $16,196 |
| SUNOPTA INC. | 62 | January 1, 2011 10-K |
Operating income in the Ingredients Group increased by $5,299, or 156.2%, to $8,691 for the year ended December 31, 2009, compared to $3,392 for the year ended December 31, 2008. The table below explains the increase in operating income:
| Ingredients Group Operating Income Changes | |
| Operating Income for the year ended December 31, 2008 | $3,392 |
| Increase in gross margin, as explained above | 5,651 |
| Increased
reserves for bad debt and compensation, partially offset by lower
utilities,
travel and other SG&A expenses as a result of various cost saving initiatives |
(235) |
| Increase in corporate cost allocations | (117) |
| Operating Income for the year ended December 31, 2009 | $8,691 |
| Fruit Group | ||||||||||||
| For the year ended | December 31, 2009 | December 31, 2008 | Change | % Change | ||||||||
| Revenue | 147,443 | 150,879 | (3,436 | ) | -2.3% | |||||||
| Gross Margin | 12,046 | 7,349 | 4,697 | 63.9% | ||||||||
| Gross Margin % | 8.2% | 4.9% | 3.3% | |||||||||
| Operating Income | (4,073 | ) | (10,219 | ) | 6,146 | 60.1% | ||||||
| Operating Income % | -2.8% | -6.8% | 4.0% |
(Operating Income is defined as “Earnings before the following” excluding the impact of “Other expense (income), net”, and "Goodwill impairment")
The Fruit Group contributed $147,443 in revenues for the year ended December 31, 2009, compared to $150,879 for the year ended December 31, 2008, a $3,436 or 2.3% decrease. The table below explains the decrease in revenue:
| Fruit Group Revenue Changes | |
| Revenue for the year ended December 31, 2008 | $150,879 |
| Decreased
revenues in the frozen fruit operation, mainly due to lower volumes
of industrial purees, as well as lower retail sales attributed to changing customer buying patterns |
(20,983) |
| Revenue
decline in the healthy snacks operation due to the loss of certain
private label customers and co-manufacturing sales, offset by volume increases from the divisions of larger retail customers |
(397) |
| New
customers and product offerings, as well as price increases in the fruit
ingredient operations |
13,617 |
| Increased
revenue in the brokerage operations as certain revenues were reported on a
net basis rather than gross basis during the first two quarters of 2008 |
4,327 |
| Revenue for the year ended December 31, 2009 | $147,443 |
Gross margins in the Fruit Group increased by $4,697 to $12,046 for the year ended December 31, 2009 compared to $7,349 for the year ended December 31, 2008, and the gross margin percentage increased by 3.3% to 8.2% . The increase in gross margin as a percentage of revenue is due to improved plant efficiencies in our healthy fruit snacks division as well as our fruit ingredient and frozen fruit operations which offset costs incurred to liquidate inventory and rationalize frozen food product offerings. The table below explains the increase in gross margin:
| SUNOPTA INC. | 63 | January 1, 2011 10-K |
| Fruit Group Gross Margin Changes | |
| Gross Margin for the year ended December 31, 2008 | $7,349 |
| Improved
margins in the fruit ingredient operations as a result of improved pricing and
higher volumes which contributed to manufacturing efficiencies, offset by higher freight and storage costs as a result of the volume increases |
4,097 |
| Higher
margins in the healthy fruit snacks division due primarily to
process improvements and efficiencies realized with the fruit bar line at the Omak, Washington facility |
4,026 |
| Margin
improvement in our frozen fruit operation due to plant efficiencies as a
result
of better production planning and lower storage costs from lower inventory levels offset by decreased volumes, net of lower variable brokerage expenses |
171 |
| Costs
incurred in 2009 to liquidate inventories and rationalize product
offerings in
the frozen fruit operation |
(3,238) |
| Lower
volumes in the brokerage operations and increased reserves for inventory
on disputed product |
(359) |
| Gross Margin for the year ended December 31, 2009 | $12,046 |
Operating losses in the Fruit Group decreased by $6,146, or 60.1%, to $4,073 for the year ended December 31, 2009, compared to a loss of $10,219 for the year ended December 31, 2008. The table below explains the decrease in operating loss:
| Fruit Group Operating Income Changes | |
| Operating Loss for the year ended December 31, 2008 | ($10,219) |
| Increase in gross margin, as explained above | 4,697 |
| Reduced
SG&A as a result of the closure of an administrative office in the
first quarter
of 2009 |
1,080 |
| Reduced
compensation, marketing, travel expenses and office costs as a result of
various cost saving initiatives |
835 |
| Decrease in corporate cost allocation | 135 |
| Severance
and related costs associated with the rationalization of two facilities in
the
first quarter of 2009 |
(545) |
| Increase in foreign exchange losses | (56) |
| Operating Loss for the year ended December 31, 2009 | ($4,073) |
| SUNOPTA INC. | 64 | January 1, 2011 10-K |
| International Foods Group | ||||||||||||
| For the year ended | December 31, 2009 | December 31, 2008 | Change | % Change | ||||||||
| Revenue | 219,379 | 237,567 | (18,188 | ) | -7.7% | |||||||
| Gross Margin | 31,439 | 41,658 | (10,219 | ) | -24.5% | |||||||
| Gross Margin % | 14.3% | 17.5% | -3.2% | |||||||||
| Operating Income | (5,002 | ) | 5,357 | (10,359 | ) | -193.4% | ||||||
| Operating Income % | -2.3% | 2.3% | -4.6% |
(Operating Income is defined as “Earnings before the following” excluding the impact of “Other expense (income), net”, and "Goodwill impairment")
The International Foods Group contributed $219,379 in revenues for the year ended December 31, 2009, compared to $237,567 for the year ended December 31, 2008, an $18,188 or 7.7% decrease. The table below explains the decrease in revenue:
| International Foods Group Revenue Changes | |
| Revenue for the year ended December 31, 2008 | $237,567 |
| Lower
volumes of organic cocoa, fruit, nuts and conventional seeds at The
Organic Corporation due primarily to reduced demand stemming from the global economic downturn that started in the latter half of 2008, offset by some price increases occurring in the second half of 2009 |
(27,774) |
| Lower
sales in our natural health products sector due mainly to a decline in
shipments
of branded products as a result of the phase-out and subsequent re-launch of three of our brands which occurred in the second and third quarter of 2009, as well as decreased demand for two significant distributed products |
(7,207) |
| Unfavourable
impact on translation due to the weakened Euro relative to the U.S.
dollar combined with unfavourable impact on translation due to the weakened CDN dollar relative to the U.S. dollar |
(7,004) |
| Decreased
volume of industrial and consumer products at SunOpta Global
Organic Ingredients (“SGOI”) such as apple, cranberry, acai, pear, orange, strawberry and raspberry, largely driven by a weakened economy and fluctuating commodity prices |
(6,018) |
| Revenue increase due to the acquisition of The Organic Corporation on April 2, 2008 | 25,452 |
| Increased
shipments of private label product due mainly to a large retail organic
orange juice contract that began in the first quarter of 2009 |
4,363 |
| Revenue for the year ended December 31, 2009 | $219,379 |
Gross margins in the International Foods Group decreased by $10,219 to $31,439 for the year ended December 31, 2009 compared to $41,658 for the year ended December 31, 2008, and the gross margin percentage decreased by 3.2% to 14.3% . The decrease in margin rate was due primarily to pricing pressure brought on by the weakened economy, proportionately less sales of higher margin private label products and costs related to branded product re-launches. The table below explains the decrease in gross margin:
| SUNOPTA INC. | 65 | January 1, 2011 10-K |
| International Foods Gross Margin Changes | |
| Gross Margin for the year ended December 31, 2008 | $41,658 |
| Decreased
volume in both branded and distributed natural health product lines
and increased inventory reserves associated with the decision to rationalization and reduce the number of SKU’s offered |
(5,306) |
| Decline
in volume and price and industrial products due the weakened economy and
in increased focus rationalizing older inventory at reduced margins to lower inventory levels at SGOI |
(1,989) |
| Customer
credit related to returns and de-listing of old format branded natural
health products, costs incurred to repackage returned product, and costs incurred to re-list product, all associated with the re-launch of three of our natural health brands |
(1,714) |
| Impact
of a weakened Euro relative to the U.S. dollar combined with weakened
CDN dollar relative to the U.S. dollar |
(1,349) |
| Increased
raw material, distribution and storage costs, coupled with lower pricing
in consumer products, offset by volume increases as a result of new private label programs in 2009 |
(1,010) |
| Lower
volumes and pricing pressure in the first half of 2009 in the organic
cocoa, grains, sweeteners, nuts, dried fruit and feed ingredient market at The Organic Corporation |
(664) |
| Gross
margin increase due to the acquisition of The Organic Corporation on April
2, 2008 |
1,813 |
| Gross Margin for the year ended December 31, 2009 | $31,439 |
Operating income in the International Foods Group decreased by $10,359, or 193.4%, to a loss of $5,002 for the year ended December 31, 2009, compared to income of $5,357 for the year ended December 31, 2008. The table below explains the decrease in operating income:
| SUNOPTA INC. | 66 | January 1, 2011 10-K |
| International Foods Group Operating Income Changes | |
| Operating Income for the year ended December 31, 2008 | $5,357 |
| Decrease in gross margin, as explained above | (10,219) |
| SG&A increase due to the acquisition of The Organic Corporation on April 2, 2008 | (2,316) |
| Increased
marketing costs incurred as a result of the three brand re-launches in the
natural health product sector |
(1,484) |
| Decrease
in net foreign exchange gains at The Organic Corporation and the natural
health products operation |
(418) |
| Impact
of a weaker CDN dollar and weakened Euro relative to the U.S. dollar on
SG&A expenses |
1,472 |
| Decrease
in SG&A as a result of various cost saving initiatives implemented
throughout the groups including headcount reductions, professional fees and decreased travel |
1,038 |
| Lower
bad debt expense due to the recovery of reserved balances and improved
collection efforts |
653 |
| Decrease
in intangible asset amortization related to the short term purchase and
sale commitments that were established upon acquisition of The Organic Corporation and had a one-year useful life |
496 |
| Lower
variable W&D costs as a result of overall lower sales volume for
natural
health products |
269 |
| Decrease in corporate cost allocation | 150 |
| Operating Loss for the year ended December 31, 2009 | ($5,002) |
| Opta Minerals | ||||||||||||
| For the year ended | December 31, 2009 | December 31, 2008 | Change | % Change | ||||||||
| Revenue | 62,523 | 93,422 | (30,899 | ) | -33.1% | |||||||
| Gross Margin | 13,081 | 18,476 | (5,395 | ) | -29.2% | |||||||
| Gross Margin % | 20.9% | 19.8% | 1.1% | |||||||||
| Operating Income | 1,161 | 5,531 | (4,370 | ) | -79.0% | |||||||
| Operating Income % | 1.9% | 5.9% | -4.0% |
(Operating Income is defined as “Earnings before the following” excluding the impact of “Other expense (income), net”, and "Goodwill impairment")
Opta Minerals contributed $62,523 in revenues for the year ended December 31, 2009, compared to $93,422 for the year ended December 31, 2008, a $30,899 or 33.1% decrease. The table below explains the decrease in revenue:
| SUNOPTA INC. | 67 | January 1, 2011 10-K |
| Opta Minerals Revenue Changes | |
| Revenue for the year ended December 31, 2008 | $93,422 |
| Decrease
in revenue in mill and foundry products due to the economic downturn
which lowered production volumes at steel mills and foundries around the world |
(31,011) |
| Decrease
in abrasive products manufacturing and distribution revenue as a result of
the impact of the economic climate on the demand for the products and services |
(1,008) |
| Increase in revenues due to the acquisition of MCP Mg-Serbien SAS on July 9, 2008 | 1,120 |
| Revenue for the year ended December 31, 2009 | $62,523 |
Gross margin for Opta Minerals decreased by $5,395 to $13,081 for the year ended December 31, 2009 compared to $18,476 for the year ended December 31, 2008, and the gross margin percentage increased by 1.1% to 20.9% . The increase in gross margin as a percentage of revenue is due primarily to cost reduction measures undertaken by management of Opta Minerals during fiscal 2009 and a decrease in inventory reserves. The table below explains the decrease in gross margin:
| Opta Minerals Gross Margin Changes | |
| Gross Margin for the year ended December 31, 2008 | $18,476 |
| Decrease
in gross margin due to the downturn in the steel industry and loss of
volume as explained above |
(8,131) |
| Impact
of the 2008 reserves recorded to reduce the value of magnesium inventory
to
net realizable value |
2,736 |
| Gross Margin for the year ended December 31, 2009 | $13,081 |
Operating income for Opta Minerals decreased by $4,370, or 79.0%, to $1,161 for the year ended December 31, 2009, compared to $5,531 for the year ended December 31, 2008. The table below explains the decrease in operating income:
| Opta Minerals Operating Income Changes | |
| Operating Income for the year ended December 31, 2008 | $5,531 |
| Decrease in gross margin, as explained above | (5,395) |
| Increase in SG&A due to the acquisition of MCP Mg-Serbien SAS on July 9, 2008 | (366) |
| Decrease in foreign exchange gains from Euro denominated operations | (359) |
| Decrease
in SG&A expenses related to a number of cost rationalization programs
leading to lower compensation costs and professional fees, net of associated severance costs |
1,750 |
| Operating Income for the year ended December 31, 2009 | $1,161 |
| SUNOPTA INC. | 68 | January 1, 2011 10-K |
| Corporate Services | ||||||||||||
| For the year ended | December 31, 2009 | December 31, 2008 | Change | % Change | ||||||||
| Operating Loss | (6,614 | ) | (11,247 | ) | 4,633 | 41.2% |
(Operating loss is defined as “Earnings before the following” excluding the impact of “Other expense (income), net”, and “Goodwill impairment”)
Operating loss at SunOpta Corporate Services decreased by $4,633 to $6,614 for the year ended December 31, 2009, from costs of $11,247 for the year ended December 31, 2008. The table below explains the decrease in operating loss:
| Corporate Services Operating Loss Changes | |
| Operating Loss for the year ended December 31, 2008 | ($11,247) |
| Decrease in professional fees related to the investigation into the 2007 restatement | 6,153 |
| Decrease
in SG&A costs due to the weakened Canadian dollar in 2009 on
translating Canadian borne expenses into U.S. dollars |
1,276 |
| Increase in corporate management fees that are allocated to SunOpta operating groups | 1,167 |
|
Decrease in foreign exchange gains in 2009 Foreign
exchange gains in the prior year were primarily a result of
favourable |
(2,874) |
| Increase
in other professional fees relating mainly to banking, tax and other
consulting activities |
(633) |
| Increase
in all other SG&A, primarily insurance due to increases in umbrella
insurance, property and marine insurance |
(456) |
| Operating Loss for the year ended December 31, 2009 | ($6,614) |
Management fees mainly consist of salaries of corporate personnel who perform back office functions for divisions, as well as costs related to the enterprise resource management system used within several of the divisions. These expenses are allocated to the groups based on (1) specific identification of allocable costs that represent a service provided to each divisions, and (2) a proportionate distribution of costs based on a weighting of factors such as revenue contribution and number of people employed within each division. As a result of the sale of the Canadian Food Distribution business and SunOpta BioProcess, a portion of the corporate management fees previously charged to these groups was reallocated as an expense of the Corporate Services operating segment. The operating loss for Corporate Services for the year ended December 31, 2009 and December 31, 2008 have been adjusted to reflect this change.
| SUNOPTA INC. | 69 | January 1, 2011 10-K |
Liquidity and Capital Resources
We obtain our short term financing through a combination of cash generated from operating activities, cash and cash equivalents, and available operating lines of credit. At January 1, 2011, we have availability under certain lines of credit of approximately $63,181 (December 31, 2009 – $69,817).
On December 20, 2010, we completed amendments to our syndicated banking facilities, which modified our Canadian and U.S. lines of credit, as well as our long-term debt. With respect to the line of credit facilities, availability under the Canadian line of credit was reduced from Cdn $20,000 to Cdn $5,000 to reflect the sale of the Canadian Food Distribution Assets noted above. Offsetting this decrease was an increase to our U.S. line of credit from $80,000 to $100,000 to reflect the concentration of syndicate operations currently located in the United States. In addition to the above changes, an accordion feature was added to the lines of credit for up to an additional $30,000 of total availability to support internal growth and acquisition, subject to credit approval by the existing syndicate bankers or a new bank. At January 1, 2011, we had not drawn on the accordion feature.
With respect to the long-term debt facility amendments, we repaid $33,716 that was outstanding on the term loan facility immediately prior to the amendments, and subsequently borrowed $30,000 in the form of two non-revolving term facilities of $13,000 and $17,000, respectively. The new non-revolving term facilities have a maturity date of October 30, 2012, which is consistent with the Canadian and U.S. line of credit facilities, and require quarterly repayments of approximately $1,067.
In addition to the overall increase in borrowing capacity under the operating lines, the amendments include a reduction in standby fees on unused funds, the elimination of two previous covenant restrictions, as well as a decrease in the interest rate premium charged on the operating lines and non-revolving facilities.
We have the following sources from which we can fund our operating cash requirements:
- Cash and cash equivalents (refer to note 20 of the Consolidated Financial Statements).
- Available operating lines of credit, including the $30,000 accordion feature noted above.
- Cash flows generated from operating activities.
- Cash flows generated from exercise of options which may be in-the-money during the year.
- Additional long term financing.
- Sale of non-core divisions, or assets.
In order to finance significant acquisitions that may arise in the future, we may need additional sources of cash that we could attempt to obtain through a combination of additional bank or subordinated financing, a private or public offering, or the issuance of common stock in relation to an acquisition or a divestiture. There can be no assurance that such financing would be available or, if so, on terms that are acceptable to us.
Included in cash and cash equivalents at January 1, 2011 is $495 (December 31, 2009 - $781) that is specific to Opta Minerals that cannot be utilized by the Company for general corporate purposes, and is maintained in separate bank accounts of Opta Minerals.
We intend to maintain a target long term debt to equity ratio of approximately 0.30 - 0.50 to 1.00 versus the current position at January 1, 2011 of 0.22 to 1.00 (December 31, 2009 – 0.37 to 1.00) and total debt to equity ratio of 0.50 - 0.70 to 1.00 versus our current position of 0.48 to 1.00 (December 31, 2009 – 0.65 to 1.00).
In the event that we require additional liquidity due to market conditions, unexpected actions by our lenders, changes to our growth strategy, or other factors, our ability to obtain any additional financing on favorable terms, if at all, could be limited.
Cash flows – Year Ended January 1, 2011 Compared to the Year Ended December 31, 2009
Net cash and cash equivalents increased by $891 during the year ended January 1, 2011 (year ended December 31, 2009 – decreased by $126) to $2,643 at January 1, 2011. The increase in cash and cash equivalents was primarily the result of net proceeds of $65,809 on the sale of the Canadian Food Distribution assets and cash provided by operating activities from continuing operations of $9,708, offset by cash used in the acquisitions of Dahlgren & Company, Inc. and Edner of Nevada, Inc. for $43,761, $19,662 of net capital expenditures, and $7,878 in net borrowings on our credit facilities.
| SUNOPTA INC. | 70 | January 1, 2011 10-K |
Cash provided by operating activities from continuing operations was $9,708 during fiscal 2010, a decrease of $47,320 compared to cash provided by operating activities from continuing operations of $57,028 during 2009. The primary reason for the decrease in cash provided by operating activities was due to a $74,804 increase in cash used to fund working capital in 2010, due mainly to a $68,155 increase in cash used to fund inventories, a $20,074 increase in cash used to fund accounts receivable, a $12,342 increase in cash used to fund prepaid expenses and other current assets, offset by a $22,749 increase in cash provided from a reduction in accounts payable and accrued liabilities.
Inventory levels increased year over year in the Grains and Foods Group due to higher quantities on hand to support new customer contracts, as well as an increase in the commodity price for corn and soybeans. Also, inventory in the International Foods Group increased year over year in response to increased demand expected for 2011, as well as higher commodity prices. In contrast to the $35,861 of cash used to build inventory levels in 2010, inventory reductions in 2009, as a result of lower volumes and economic uncertainty, provided cash of $32,294. The $20,074 increase in cash used to fund accounts receivable is due to higher sales volumes in the fourth quarter of 2010 compared to 2009, and increased collection times. The $12,342 increase in cash used to fund prepaid expenses and other current assets is primarily due to increased short-term derivative gains on forward grain contracts as well as higher levels of supplier advances to secure product in our International Foods Group. Offsetting these uses of cash is a $22,749 increase in cash provided from accounts payable and accrued liabilities due primarily to increased inventory purchases. Earnings from continuing operations for 2010 and items not affecting cash provided cash of $43,283 compared to $15,799 in 2009, an increase of $27,484, due to improved earnings from continuing operations of $23,083, non-cash movements of $4,103 in deferred income taxes, and an increase of $1,339 in stock based compensation, partially offset by $1,003 lower asset and goodwill impairments in 2010.
Cash used in investing activities of continuing operations was $65,145 in 2010, compared to $12,275 in 2009. The increase in cash used of $52,870 is primarily due to $43,761 of cash used in the acquisitions of Dahlgren & Company, Inc. and Edner of Nevada, Inc. and $19,698 used for purchases of property, plant and equipment compared to $11,538 in 2009. During 2010, spending on property, plant and equipment included the expansion of our fiber facility in Cedar Rapids to increase processing capacity, spending on our new aseptic packaging line at our fruit ingredient operation, a methane extraction project at our Cambridge oat fiber ingredient facility, and other plant–specific improvement projects and general maintenance spending across the organization. Cash provided by investing activities of discontinued operations of $52,298 in 2010 includes $65,809 of cash proceeds received on the sale of the Canadian Food Distribution assets, offset by $12,142 of cash sold in the divesture of SunOpta BioProcess Inc. as well as purchases of property, plant and equipment made within the discontinued operations. Cash used in investing activities of discontinued operations in 2009 related primarily to purchases of property, plant and equipment.
Financing activities used $6,806 in 2010 compared to $35,739 in 2009. In 2010, net debt repayments on our line of credit and long-term debt facilities were $7,878 compared to $34,363 in 2009, due to borrowings on our line of credit facilities to support the working capital increases noted above.
Cash flows – Year Ended December 31, 2009 Compared to the Year Ended December 31, 2008
Net cash and cash equivalents decreased by $126 during the year-ended December 31, 2009 (year ended December 31, 2008 – decreased by $3,206) to $1,752 at December 31, 2009. The decrease in cash and cash equivalents was primarily the result of $34,363 in net debt repayments, $10,462 of net capital expenditures, and $2,198 in deferred financing fees, offset by cash provided by operating activities from continuing operations of $57,028, of which $41,229 was generated from working capital.
| SUNOPTA INC. | 71 | January 1, 2011 10-K |
Cash provided by operating activities from continuing operations generated $57,028 during fiscal 2009, an improvement of $28,257 compared to cash generated of $28,771 during fiscal 2008. This improvement in cash provided by operating activities was due a $29,653 reduction in non-cash working capital in 2009. The primary area of improvement in cash used to fund working capital was a reduction of $31,779 in cash used to fund inventories. This was consistent with Company-wide objectives to reduce inventory levels, resulting in a decrease from $183,085 at December 31, 2008 to $155,882 at December 31, 2009. In particular, the International Foods Group saw a reduction of $19,694 or approximately 33% in inventory balances, as the group sold through the prior year’s harvests, and focused on reducing inventories on-hand and controlling the purchase of raw materials. In 2009, Opta Minerals reduced inventories by $5,042, through tighter purchasing and other initiatives implemented as a result of the continued economic downturn in the steel industry that the group faced throughout 2009. Offsetting the working capital cash flow improvements in 2009 compared to 2008 was a use of cash of $7,971 for accounts payable and accrued liabilities. Higher levels of accounts payable and accrued liabilities in 2009 compared to 2008 were due to higher purchasing volumes and accruals for professional fees. Loss from continuing operations for 2009 and items not affecting cash provided cash of $15,799 compared to $17,195 in 2008, a decrease of $1,396, due to a decrease in items not affecting cash of $2,867 partially offset by a lower loss from continuing operations of $1,471.
Investing activities used cash of $14,132 in fiscal 2009, compared to a use of $15,732 in fiscal 2008. The lower spending of $1,600 was the result of higher net capital expenditures in 2009 compared to 2008, offset by prior year spending on the acquisitions of The Organic Corporation B.V. (“TOC”) and MCP Mg-Serbien SAS (“MCP”), as well as lower payments of deferred purchase consideration and lower purchases of patents, trademarks and other intangible assets. There were no acquisitions in fiscal 2009. In addition to normal maintenance capital spending, capital expenditures in 2009 included spending to bring our aseptic soymilk manufacturing facility in California to the stage of commercial production, as well as spending on our natural and organic pressed oil refinery joint venture in Colorado, which became operational in the first quarter of 2010.
Financing activities used $35,739 in fiscal 2009 compared to $22,898 in fiscal 2008. In 2009, net debt repayments on our line of credit and long-term debt facilities were $34,363 compared to $24,251 in 2008. The increase in net debt repayment is due to borrowings of approximately $10,000 which occurred early in fiscal 2008 to fund the acquisition of TOC. The Company also incurred $2,198 in deferred financing fees in connection with the Fifth Amended and Restated Credit Agreement which was signed on October 30, 2009. There were no financing fees incurred in 2008.
Business and Financial Outlook
The purpose of this Business and Financial Outlook section is to provide shareholders, prospective investors and other readers of this Annual Report on Form 10-K with management's current plans and expectations with respect to currently anticipated revenues, net earnings, and future financial results from our operations for the period ending January 1, 2011. This Outlook has been prepared for this purpose only and readers are cautioned that it may not be appropriate for any other purpose. Readers are also cautioned that this Outlook is subject to the assumptions, risks and uncertainties discussed below and elsewhere in this Annual Report on Form 10-K, that actual results may vary from those presented and therefore they should not place undue reliance on it. This Outlook reflects our current expectations and judgments based on circumstances existing as of February 28, 2011. We disclaim any intention or obligation to update or revise this Business and Financial Outlook, whether as a result of new information, future events or otherwise, except as required by law. The statements in this Outlook are forward-looking statements. See “Forward-Looking Statements”.
Management believes that consumer demand for high quality natural and organic foods and natural health products has grown rapidly over the past decade as global awareness of the benefits of healthy eating continues to proliferate. The global market for organic foods is currently estimated by management to be in excess of $37 billion with historical growth rates between 10% and 20% depending on product line and country. Despite growth rates stalling during the most recent economic downturn, the long term trends for growth remain in place. While a large number of companies compete within specific segments of the market, we believe there are relatively few companies as well positioned as SunOpta to take advantage of this growing market. We believe that our vertically integrated “seed to table” business model built over the past eleven years has positioned SunOpta as a global leader in the natural and organic foods and natural health products markets.
For 2011 we believe we will realize revenue and unit growth compared to 2010, resulting from new product offerings, new and expanding customer relationships and incremental sales of confection sunflower products and nutritious portable foods as a result of our recent acquisitions of Dahlgren & Company, Inc. and Edner of Nevada, Inc. We believe that consumers will continue to focus on health conscious natural, organic and specialty foods and natural health products as concerns over disease, obesity and well-being are center of mind and we feel SunOpta is well positioned to meet the needs of these growing markets.
| SUNOPTA INC. | 72 | January 1, 2011 10-K |
We believe that our net earnings for 2011 will improve versus 2010 (excluding the positive impact of the sale of the Canadian Food Distribution assets and SunOpta BioProcess Inc. in 2010) as a result of improved volumes, pricing and product mix; increased capacity, cost reduction and rationalization initiatives, many of which have now been implemented; fixed cost leverage; and the avoidance of certain goodwill and asset impairment charges recorded in 2010 which are not expected to reoccur in 2011. Our primary focus for 2011 remains the improvement of operating margins and returns on assets employed. Consistent with 2010, as a direct result of continually changing world-wide macroeconomic conditions, we have decided to take a cautious and responsible approach with regard to providing guidance, and in doing so, will not provide specific revenue and net earnings guidance for 2011 at this time.
Our overall objective of realizing profitable growth through an effective balance of internal growth and acquisitions in support of our vertically integrated “seed to table” strategy remains unchanged. The acquisition side of our growth strategy is back on track following our fourth quarter acquisitions of Dahlgren & Company Inc. and Edner of Nevada, Inc. We continue to look for ways to exploit strategic synergies across SunOpta Foods, vertically integrating wherever possible. Initiatives to improve the productivity of operations include our performance excellence through people programs, product rationalization, plant and warehouse rationalization programs, continued training and development of employees, consolidated procurement, supply chain and internal services programs and consolidated information and accounting systems to provide better analysis and timely decision-making. A more fulsome discussion of key strategies is included in Item 1 of this report.
Maintaining liquidity and having available sources of cash will be imperative to continue our growth. At January 1, 2011 we had $2,643 in cash, of which $495 may only be used within Opta Minerals Inc. We also had approximately $63,181, in unused bank lines for a total of $65,824 in cash and borrowings available. Our remaining cash and unused lines plus cash generated from operations are expected to be sufficient to finance 2011 capital spending estimated to be $25,000 to $30,000, 2011 debt service of $22,247 and payment of the current portion of long-term liabilities of $571. We believe additional sources of cash could be obtained through a combination of additional bank or subordinated financing, a private or public offering, the issuance of shares or through a divestiture. However, there can be no assurance that such financing or transactions would be available or, if so, on terms that are acceptable to us.
Off – Balance Sheet Arrangements
There are currently no off-balance sheet arrangements that have or are reasonably likely to have a current or future material effect on our financial condition.
Contractual Obligations
The table(a) below sets out our contractual obligations with respect to long-term debt, operating and capital leases including interest costs, commitments to purchase grains, commodity and foreign exchange derivative contracts and long term liabilities, at January 1, 2011:
Contractual Obligations |
Total |
Payments due by Period | |||
| 2011 | 2012-2013 | 2014-2015 | Thereafter | ||
| Long-term debt obligations Capital lease obligations Grain purchase commitments Other commitments Operating leases Interest on long-term debt Commodity and foreign exchange contracts Long-term liabilities Interest rate swap |
64,898 84 49,337 10,188 36,969 6,856 7,680 7,213 891 |
22,220 27 49,337 10,188 8,970 2,919 7,674 571 - |
32,041 57 - - 13,787 2,472 6 6,642 891 |
5,698 - - - 9,261 1,133 - - - |
4,939 - - - 4,951 332 - - - |
| 184,116 | 101,906 | 55,896 | 16,092 | 10,222 | |
| (a) |
This table does not include certain contingent consideration related to acquisitions completed prior to December 31, 2008 that may become payable if predetermined profit targets are achieved. As a result of adopting ASC Topic 805 on Business Combinations, contingent consideration on the acquisitions completed in 2010 has been estimated as of the purchase date, and are reflected in the table above. |
| SUNOPTA INC. | 73 | January 1, 2011 10-K |
| (b) |
Interest is calculated based on scheduled repayments over the periods as indicated, using existing interest rates at January 1, 2011, as disclosed in note 10 to the Consolidated Financial Statements. |
Item 7A – Quantitative and Qualitative Disclosures about Market Risk
All financial numbers presented in this “Item 7A. Quantitative and Qualitative Disclosures about Market Risk” are expressed in thousands of U.S. dollars, unless otherwise noted.
Interest rate risk
The primary objective of our investment activities is to preserve principal and limit risk. To achieve this objective, we may invest in a variety of securities, including both government and corporate obligations and money market funds. These securities are generally classified as cash and cash equivalents or short-term investments and are recorded on the balance sheet at fair value with unrealized gains or losses reported on the consolidated statements of operations and comprehensive income. As at January 1, 2011 all of SunOpta’s excess funds were held in cash and cash equivalents with a maturity less than 90 days.
Debt in both fixed rate and floating rate interest carry different types of interest rate risk. Fixed rate debt may have its fair market value adversely affected by a decline in interest rates. In general, longer date debts are subject to greater interest rate risk than shorter dated securities. Floating rate term debt gives less predictability to cash flows as interest rates change. As at January 1, 2011, the weighted average interest rate of our fixed rate term debt was 4.5% (December 31, 2009 - 8.5%) and $61,669 (December 31, 2009 - $83,449) of the Company’s outstanding term debt is at fixed interest rates. Variable rate term debt of $3,313 (December 31, 2009 - $3,780) at an interest rate of 5.6% (December 31, 2009 - 5.8%) is partially hedged by variable rate cash equivalent investments. The Company looks at varying factors to determine the percentage of debt to hold at fixed rates including the interest rate spread between variable and fixed (swap rates), the Company’s view on interest rate trends, the percent of offset to variable rate debt through holding variable rate investments and the Company’s ability to manage with interest rate volatility and uncertainty. For every 1% increase (decrease) in interest rates on variable rate term debt the Company’s after tax earnings would (decrease) increase by approximately $25 (December 31, 2009 - $24).
Opta Minerals entered into a cash flow hedge in 2007. At inception, the fair value of the cash flow hedge was determined to be a loss of $254 using mark-to-market valuations which required an immediate expense of the ineffective portion. The cash flow hedge entered into exchanged a notional amount of Cdn $17,200 (U.S. - $17,293) from a floating rate to a fixed rate of 5.25% from August 2008 to August 2012. The fair value of the hedging derivative is estimated based on the standard swap valuation methodology. The estimated fair value of the interest rate swap at December 31, 2010 was a loss of $891 (December 31, 2009 - loss of $1,387). The incremental gain in fair value of $496, net of income taxes of $145, has been recorded in other comprehensive loss for the period.
Foreign currency risk
All U.S. subsidiaries use the U.S. dollar as their functional currency and the U.S. dollar is also our reporting currency. The functional currency of all operations located in Canada is the Canadian dollar, except for Opta Minerals, which uses the U.S. dollar as its functional currency. The functional currency of all operations located in Europe is the Euro. For these operations, all transaction gains or losses in relation to the U.S. dollar are recorded as foreign exchange gain (loss) in the consolidated statements of operations while gains (losses) on translation of net assets to U.S. dollars on consolidation are recorded in Accumulated Other Comprehensive Income within Shareholders’ Equity. The functional currency of the corporate head office is the U.S. dollar. For the Corporate office, transaction gains or losses as well as translation gains and losses on monetary assets and liabilities are recorded within foreign exchange on the consolidated statements of operations.
| SUNOPTA INC. | 74 | January 1, 2011 10-K |
We are exposed to foreign exchange rate fluctuations as the financial results of SunOpta and its Canadian and European subsidiaries are translated into U.S. dollars on consolidation. The Canadian dollar depreciated relative to the U.S. dollar in 2010, with closing rates moving from Cdn $1.0510 at December 31, 2009 to Cdn $0.9946 at January 1, 2011 for each U.S. dollar. The Euro depreciated against the U.S. dollar during 2010, with closing rates moving from $1.4316 at December 31, 2009 to $1.3391 at January 1, 2011. As a result of the depreciation of the Canadian dollar and the sale of Canadian denominated assets to UNFI, and the depreciation of the Euro against the U.S. dollar during 2010, we had a decrease of $4,111 (December 31, 2009 - a decrease of $12,623) in net Canadian assets and increase of €175 (December 31, 2009 – increase of €332) in net Euro. A 10% movement in the levels of foreign currency exchange rates in favour of (against) the Canadian dollar or Euro with all other variables held constant would result in an increase (decrease) in the fair value of our net assets by $2,616 (December 31, 2009 - $8,553) for a Canadian dollar exchange movement and $2,090 (December 31, 2009 - $2,134) for a Euro exchange movement.
SunOpta Foods’ operations based in the U.S. have limited exposure to other currencies since almost all sales and purchases are made in U.S. dollars. The Canadian based subsidiaries have significant transaction exposure as their sales are predominantly in Canadian dollars while a substantial portion of their purchases are in U.S. dollars. The European operations are also exposed to various currencies as they purchase product from a wide variety of countries in several currencies and primarily sell into the European market. It is the Company’s intention to hold excess funds in the currency in which the funds are likely to be used, which will from time to time potentially expose the Company to exchange rate fluctuations when converted into U.S. dollars.
We enter into forward foreign exchange contracts to reduce exposure to fluctuations in foreign currency exchange rates. Open forward foreign exchange contracts were marked-to-market at January 1, 2011, resulting in a gain of $569 (December 31, 2009 - gain of $392), which is included in foreign exchange on the consolidated statements of operations. In 2009, we began taking a more active role in an attempt to reduce exposure to foreign currency exchange rates by entering into forward foreign exchange contracts. The contracts entered into are primarily Canadian dollars and U.S. dollars as well as U.S. dollars and Euros. The net effect of all exchange based transactions including realized foreign exchange contracts, unrealized open contracts and all other foreign exchange transactions including the translation gains and losses related to our Corporate net monetary assets are recorded in foreign exchange on our consolidated statements of operations. For the year ended January 1, 2011, we recorded a gain of $1,652 (December 31, 2009 – a gain of $523).
Commodity risk
SunOpta Foods enters into exchange-traded commodity futures and options contracts to hedge its exposure to price fluctuations on grain and certain other commodity transactions to the extent considered practicable for minimizing risk from market price fluctuations. Futures contracts used for hedging purposes are purchased and sold through regulated commodity exchanges. Inventories, however, may not be completely hedged, due in part to the Company’s assessment of its exposure from expected price fluctuations. Exchange purchase and sales contracts may expose the Company to risk in the event that a counterparty to a transaction is unable to fulfill its contractual obligation. The Company manages its risk by entering into purchase contracts with pre-approved growers.
The Company has a risk of loss from hedge activity if a grower does not deliver as scheduled. Sales contracts are entered into with organizations of acceptable creditworthiness, as internally evaluated. All futures transactions are marked to market. Gains and losses on futures transactions related to grain inventories are included in cost of goods sold. At January 1, 2011 the Company owned 615,087 (December 31, 2009 - 425,282) bushels of corn with a weighted average price of $6.09 (December 31, 2009 - $4.02) and 878,413 (December 31, 2009 - 577,041) bushels of soy beans with a weighted average price of $13.87 (December 31, 2009 - $10.83). At January 1, 2011, the Company has a net long position on soy beans of 79,286 (December 31, 2009 - 20,834) and a net long position on corn of 101,979 (December 31, 2009 - 58,140) bushels. An increase/decrease in commodity prices of either soy or corn of 10% would result in an increase (decrease) in carrying value of these commodities by $172 (December 31, 2009 - $46). In addition, the International Foods Group hedges the purchase of cocoa to minimize price fluctuations. Other than noted above, there are no futures contracts in the other SunOpta Foods segments, Opta Minerals or related to Corporate office activities.
Item 8. Financial Statements and Supplementary Data
Our Consolidated Financial Statements required by this item are included on the pages immediately following the title page to our Consolidated Financial Statements appearing on page F-1.
| SUNOPTA INC. | 75 | January 1, 2011 10-K |
Item 9. Changes in and Disagreements with Accountants on Accounting and Financial Disclosure
None.
Item 9A - Controls and Procedures
Evaluation of Disclosure Controls and Procedures
Our management has established disclosure controls and procedures designed to ensure that information required to be disclosed by the Company in the reports that it files or submits under the Securities Exchange Act of 1934, as amended (the “Exchange Act”) is recorded, processed, summarized and reported within time periods specified in the Securities and Exchange Commission’s rules and forms. Such disclosure controls and procedures include, without limitation, controls and procedures designed to ensure that information required to be disclosed by the Company in the reports that it files or submits under the Exchange Act is accumulated and communicated to its management to allow timely decisions regarding required disclosure.
Under the supervision and with the participation of our management, including our Chief Executive Officer and Chief Financial Officer, we conducted an evaluation of our disclosure controls and procedures (as such term is defined under Rule 13a-15(e) promulgated under the Exchange Act) as of the end of the period covered by this annual report. Based on this evaluation, our Chief Executive Officer and our Chief Financial Officer concluded that our disclosure controls and procedures were effective as of January 1, 2011.
Management’s Annual Report on Internal Control over Financial Reporting
Our management is responsible for establishing and maintaining adequate internal control over financial reporting, as defined in Rule 13a-15(f) under the Exchange Act.
Our internal control framework and processes are designed to provide reasonable assurance to management and our Board of Directors regarding the reliability of financial reporting and the preparation of our Consolidated Financial Statements in accordance with accounting principles generally accepted in the United States of America.
Because of its inherent limitations, internal control over financial reporting may not prevent or detect misstatements. Projections of any evaluation of effectiveness to future periods are subject to the risk that controls may become inadequate because of changes in conditions, or that the degree of compliance with the policies or procedures may deteriorate.
Management assessed the effectiveness of our internal control over financial reporting as of January 1, 2011. In making this assessment, management used the criteria set forth by the Committee on Sponsoring Organizations of the Treadway Commission in Internal Control—Integrated Framework.
Management has excluded from its assessment Dahlgren & Company, Inc. which we acquired on November 8, 2010 and Edner of Nevada, Inc. which we acquired on December 14, 2010. Combined, these entities represented 12.7% of consolidated total assets, 18.6% of consolidated net assets, 1.5% of consolidated revenues and 2.2% of consolidated earnings of SunOpta Inc. as of January 1, 2011.
Based on its assessment, our management concluded that, as of January 1, 2011, our internal control over financial reporting is effective based on those criteria.
The effectiveness of our internal control over financial reporting as of January 1, 2011 has been audited by Deloitte & Touche LLP, an independent registered public accounting firm that also audited the Company’s Consolidated Financial Statements for the year ended January 1, 2011, as stated in their report attestation which appears herein.
Changes in Internal Control Over Financial Reporting
There were no changes in our internal control over financial reporting during the fourth quarter of 2010 that materially affected, or are reasonably likely to materially affect, our internal control over financial reporting.
| SUNOPTA INC. | 76 | January 1, 2011 10-K |
Report of Independent Registered Chartered Accountants
To the Board of Directors and Shareholders of SunOpta Inc.:
We have audited the internal control over financial reporting of SunOpta Inc. and subsidiaries (the "Company") as of January 1, 2011, based on criteria established in Internal Control — Integrated Framework issued by the Committee of Sponsoring Organizations of the Treadway Commission. As described in “Management’s Annual Report on Internal Control Over Financial Reporting”, management excluded from its assessment the internal controls over financial reporting at Dahlgren & Company, Inc. (“Dahlgren”), which was acquired on November 8, 2010 and at Edner of Nevada, Inc. (“Edner”), which was acquired December 14, 2010, and whose combined financial statements constitute 12.7% of consolidated total assets, 18.6% of consolidated net assets, 1.5% of consolidated revenues and 2.2% of consolidated earnings of the Company as of and for the year ended January 1, 2011. Accordingly, our audit did not include the internal control over financial reporting at both Dahlgren and Edner. The Company's management is responsible for maintaining effective internal control over financial reporting and for its assessment of the effectiveness of internal control over financial reporting, included in the accompanying “Management’s Annual Report on Internal Control Over Financial Reporting”. Our responsibility is to express an opinion on the Company's internal control over financial reporting based on our audit.
We conducted our audit in accordance with the standards of the Public Company Accounting Oversight Board (United States). Those standards require that we plan and perform the audit to obtain reasonable assurance about whether effective internal control over financial reporting was maintained in all material respects. Our audit included obtaining an understanding of internal control over financial reporting, assessing the risk that a material weakness exists, testing and evaluating the design and operating effectiveness of internal control based on the assessed risk, and performing such other procedures as we considered necessary in the circumstances. We believe that our audit provides a reasonable basis for our opinion.
A company's internal control over financial reporting is a process designed by, or under the supervision of, the company's principal executive and principal financial officers, or persons performing similar functions, and effected by the company's board of directors, management, and other personnel to provide reasonable assurance regarding the reliability of financial reporting and the preparation of financial statements for external purposes in accordance with generally accepted accounting principles. A company's internal control over financial reporting includes those policies and procedures that (1) pertain to the maintenance of records that, in reasonable detail, accurately and fairly reflect the transactions and dispositions of the assets of the company; (2) provide reasonable assurance that transactions are recorded as necessary to permit preparation of financial statements in accordance with generally accepted accounting principles, and that receipts and expenditures of the company are being made only in accordance with authorizations of management and directors of the company; and (3) provide reasonable assurance regarding prevention or timely detection of unauthorized acquisition, use, or disposition of the company's assets that could have a material effect on the financial statements.
Because of the inherent limitations of internal control over financial reporting, including the possibility of collusion or improper management override of controls, material misstatements due to error or fraud may not be prevented or detected on a timely basis. Also, projections of any evaluation of the effectiveness of the internal control over financial reporting to future periods are subject to the risk that the controls may become inadequate because of changes in conditions, or that the degree of compliance with the policies or procedures may deteriorate.
In our opinion, the Company maintained, in all material respects, effective internal control over financial reporting as of January 1, 2011, based on the criteria established in Internal Control — Integrated Framework issued by the Committee of Sponsoring Organizations of the Treadway Commission.
We have also audited, in accordance with the standards of the Public Company Accounting Oversight Board (United States), the consolidated financial statements as of and for the year ended January 1, 2011 of the Company and our report dated March 9, 2011 expressed an unqualified opinion on those financial statements.
"Deloitte & Touche LLP"
Independent Registered Chartered Accountants
Licensed
Public Accountants
Toronto, Canada
March 9, 2011
| SUNOPTA INC. | 77 | January 1, 2011 10-K |
Item 9B. Other Information
None.
PART III
Item 10. Directors, Executive Officers and Corporate Governance
(a) Directors, Corporate Governance and Other Matters
The information with respect to directors, corporate governance and other matters (other than information with respect to executive officers) required by this item is incorporated herein by reference to our Definitive Proxy Statement for the Annual Meeting of Shareholders to be filed with the Securities and Exchange Commission not later than 120 days after January 1, 2011 (the “2011 Proxy Statement”).
(b) Executive Officers
The following is information concerning our executive officers and other significant officers as of the date of this report.
| Name | Position with |
| Directors: | Company |
| Steven Bromley | Director, President and Chief Executive Officer, SunOpta Inc. |
| Allan Routh | Director, SunOpta Inc. and President of the SunOpta Grains and Foods Group |
| Tony Tavares | Vice President and Chief Operating Officer, SunOpta Inc. |
| Eric Davis | Vice President and Chief Financial Officer, SunOpta Inc. |
| John Dietrich | Vice President, Corporate Development |
Steven Bromley serves as President, Chief Executive Officer and a Director of SunOpta. Mr. Bromley joined SunOpta in June 2001 and has served in a number of key operating and financial roles since that time. Mr. Bromley served as Executive Vice President and Chief Financial Officer through September 2003 until his appointment as Chief Operating Officer. In addition to his role of Chief Operating Officer, Mr. Bromley was appointed President by the Board of Directors in January 2005 and subsequently as Director and Chief Executive Officer in February 2007. Prior to joining SunOpta, Mr. Bromley spent over 13 years in the Canadian dairy industry in a wide range of financial and operational roles with both Natrel Inc. and Ault Foods Limited. From 1977 to 1999 he served on the Board of Directors of Natrel, Inc. Mr. Bromley is a Director of all of our subsidiaries, and in July 2004, Mr. Bromley was elected to the Board of Directors of Opta Minerals (TSX: OPM). Mr. Bromley was appointed to the Board of Directors of SunOpta on January 26, 2007.
Allan Routh was elected to the Board of Directors in September 1999. Mr. Routh is President of our Grains and Foods Group and prior to March 2003 was President and Chief Executive Officer of the SunRich Food Group, Inc., a wholly-owned subsidiary of SunOpta. Mr. Routh has been involved in the soy industry and soy industry organizations since 1984. He is also a Director of other private companies. In the past 5 years, Mr. Routh has not served on any other reporting issuers’ Board of Directors.
Tony Tavares serves as Vice President and Chief Operating Officer of SunOpta. Mr. Tavares joined SunOpta in June 2008 and brings over 20 years of food industry experience to this role. Prior to joining SunOpta, Mr. Tavares was Chief Executive Officer of Maple Lodge Farms Inc., and has also held a number of senior positions in the Canadian food industry including President of Maple Leaf Poultry, a division of Maple Leaf Foods, and President of Tyson Canada. Mr. Tavares served on the Board of Directors of Opta Minerals Inc. (TSX: OPM) from June 2005 through June 2007. Mr. Tavares served on the Board of Directors of Opta Minerals Inc. from 2005 through June 2008.
Eric Davis serves as Vice President and Chief Financial Officer. Mr. Davis joined SunOpta in 2009 and brings over 25 years of diverse finance and accounting experience to this role. Prior to joining Sunopta, Mr. Davis was Chief Executive Officer for Grant Forest Products and has also held the Chief Financial Officer position with Johnson Electric Holdings, Ltd., and within The Coco Cola Company, as well as in the Asian-Pacific market. Mr. Davis has not served on any other reporting issuers’ Board of Directors.
| SUNOPTA INC. | 78 | January 1, 2011 10-K |
John Dietrich serves as Vice President of Corporate Development of SunOpta. Mr. Dietrich joined SunOpta in 2002 as Vice President and Treasurer and served in this role until his appointment as Vice President and Chief Financial Officer in September 2003. Mr. Dietrich transitioned to his current role in April 2009. From January 1995 until September 2001, Mr. Dietrich held finance roles at Natrel, Inc. as Director of Business Development, Paragaon Trade Brands (Canada) Inc. as Director of Finance and VP of Finance at Bridge2market Inc. Mr. Dietrich is a Chartered Accountant and Chartered Financial Analyst. Mr. Dietrich has not served on any other reporting issuer’s Board of Directors.
Item 11. Executive Compensation
The information required under this item is incorporated herein by reference from the 2011 Proxy Statement.
Item 12. Security Ownership of Certain Beneficial Owners and Management and Related Stockholder Matters
The information required under this item is incorporated herein by reference from the 2011 Proxy Statement.
Item 13. Certain Relationships and Related Transactions, and Director Independence
The information required under this item is incorporated herein by reference from the 2011 Proxy Statement.
Item 14. Principal Accounting Fees and Services
The information required under this item is incorporated herein by reference from the 2011 Proxy Statement.
PART IV
Item 15. Exhibits and Financial Statement Schedules
The following documents are being filed as part of this annual report.
1. Financial Statements. The following financial statements and notes are filed under Part II, Item 8 of this annual report.
| Page | |
| Consolidated Financial Statements | F-0 |
Independent Auditors’ Report |
F-1 |
| Consolidated Statements of
Operations For the Years ended January 1, 2011 and December 31, 2009 and 2008 |
F-2 |
| Consolidated Statements of Comprehensive
Earnings
(Loss) For the Years ended January 1, 2011 and December 31, 2009 and 2008 |
F-3 |
| Consolidated Balance
Sheets As at January 1, 2011 and December 31, 2009 |
F-4 |
| Consolidated Statements of Shareholders’
Equity For the Years ended January 1, 2011 and December 31, 2009 and 2008 |
F-5 |
| Consolidated Statements of Cash
Flows For the Years ended January 1, 2011 and December 31, 2009 and 2008 |
F-6 |
| Notes to Consolidated Financial
Statements For the Years ended January 1, 2011 and December 31, 2009 and 2008 |
F-7 – F-62 |
| 2. |
Financial Statement Schedules. All schedules for which provision is made in the applicable accounting requirements of the Securities and Exchange Commission are not required or the required information has been included within the financial statements or the notes thereto. |
|
| |
| 3. |
Exhibits. The list of exhibits in the Exhibit Index included in this annual report are incorporated herein by reference. |
| SUNOPTA INC. | 79 | January 1, 2011 10-K |
EXHIBIT INDEX
| Exhibits | Description |
|
2.1 |
Asset Purchase Agreement, dated as of May 10, 2010, by and among United Natural Foods, Inc., UNFI Canada, Inc., SunOpta Inc. and Drive Organics Corp. (incorporated herein by reference to Exhibit 2.1 to the Company’s Current Report on Form 8-K filed on May 12, 2010).* |
|
2.2 |
Amendment No. 1 to Asset Purchase Agreement, dated as of June 4, 2010, by and among United Natural Foods, Inc., UNFI Canada, Inc., SunOpta Inc. and Drive Organics Corp. (incorporated by reference to Exhibit 2.1 to the Company’s Current Report on Form 8-K filed on June 10, 2010).* |
|
2.3 |
Share Purchase Agreement, dated as of August 31, 2010, among SunOpta Inc., SunOpta BioProcess Inc., the Vendors (as defined therein), Mascoma Corporation, and Mascoma Canada, Inc. (incorporated by reference to Exhibit 2.1 to the Company’s Current Report on Form 8-K filed on September 7, 2010).* |
|
2.4 |
Purchase Agreement, dated as of November 8, 2010, by and among Sunrich LLC, Thomas Miller, Charles Considine and Timothy Egeland (incorporated by reference to Exhibit 2.1 to the Company’s Current Report on Form 8-K filed on November 10, 2010).* |
|
3.1 |
Amalgamation of Stake Technology Ltd. and 3754481 Canada Ltd. (formerly George F. Pettinos (Canada) Limited) (incorporated herein by reference to the Company’s Form 10-KSB for the year ended December 31, 2000). |
|
3.2 |
Certificate of Amendment dated October 31, 2003 to change the Company’s name from Stake Technology Ltd. to SunOpta Inc. (incorporated by reference to Exhibit 3i(b) to the Company’s Form 10-K for the year ended December 31, 2003). |
|
3.3 |
Articles of Amalgamation of SunOpta Inc. and Sunrich Valley Inc., Integrated Drying Systems Inc., Kettle Valley Dried Fruits Ltd., Pro Organics Marketing Inc., Pro Organics Marketing (East) Inc., 4157648 Canada Inc. and 4198000 Canada Ltd. dated January 1, 2004 (incorporated by reference to Exhibit 3i(c) to the Company’s Form 10-K for the year ended December 31, 2003). |
|
3.4 |
Articles of Amalgamation of SunOpta Inc. and 6319734 Canada Inc., 4157656 Canada Inc. Kofman-Barenholtz Foods Limited dated January 1, 2005 (incorporated herein by reference to Exhibit 3i(d) to the Company’s Form 10-K for the year ended December 31, 2004). |
|
3.5 |
Articles of Amalgamation of SunOpta Inc. and 4307623 Canada Inc., dated January 1, 2006 (incorporated herein by reference to Exhibit 3i(e) to the Company’s Form 10-K for the year ended December 31, 2005). |
|
3.6 |
Articles of Amalgamation of SunOpta Inc. and 4208862 SunOpta Food Ingredients Canada Ltd., 4406150 Canada Inc. and 4406168 Canada Inc. dated January 1, 2007 (incorporated herein by reference to Exhibit 3i(f) to the Company’s Form 10-K for the year ended December 31, 2007). |
|
3.7 |
Articles of Amalgamation of SunOpta Inc. and 4460596 Canada Inc. Dated January 1, 2008 (incorporated herein by reference to Exhibit 3i(g) to the Company’s Form 10-K for the year ended December 31, 2007). |
| SUNOPTA INC. | 80 | January 1, 2011 10-K |
| 3.8 | Amended and Restated By-law 14 dated May 27, 2010 (incorporated herein by reference to the Company’s Definitive Proxy Statement on Schedule 14A filed on April 29, 2010). |
| 10.1 | 2002 Stock Option Plan dated March 26, 2002, as amended and restated April 2007 (incorporated by reference to Exhibit 4.1 to the Company’s Form S-8 registration statement filed on July 24, 2007). |
| 10.2 | Employee Stock Purchase Plan amended May 7, 2009 (incorporated by reference to Exhibit 10.2 to the Company’s current report on Form 8-K filed on May 8, 2009). |
| 10.3 | Retiring Allowance Agreement dated March 8, 2011 between the Company and Jeremy Kendall which terminates and supercedes the Employment Agreement dated October 1, 2001 between the Company and Mr. Jeremy Kendall, as amended.** |
| 10.4 | Employment Agreement dated February 1, 2007 between the Company and Mr. Steven Bromley (incorporated by reference to Exhibit 10.5 to the Company’s Form 10-K for the year ended December 31, 2007). |
| 10.5 | Employment Agreement effective March 16, 2009 between the Company and Mr. Eric Davis (incorporated by reference to Exhibit 10.2 to the Company’s Form 10-Q for the quarter ended March 31, 2009). |
| 10.8 | Sixth Amended and Restated Credit Agreement, dated as of December 20, 2010, among SunOpta Inc. and SunOpta Food Group LLC, as Borrowers, and Each of the Financial Institutions and Other Entities from Time to Time Party Thereto, as Lenders, and Certain Affiliates of the Borrowers, as Obligors, and Bank of Montreal, as Agent (incorporated by reference to Exhibit 10.1 of the Company’s Current Report on Form 8-K filed on December 23, 2010). |
| 21 | List of subsidiaries. ** |
| 23.1 | Consent of Deloitte Touche LLP, Chartered Accountants. ** |
| 24.1 | Power of Attorney (included on signature page). ** |
| 31.1 | Certification by Steven Bromley, President and Chief Executive Officer, pursuant to Rule 13a – 14(a) under the Securities Exchange Act of 1934, as amended. ** |
| 31.2 | Certification by Eric Davis, Vice President and Chief Financial Officer, pursuant to Rule 13a – 14(a) under the Securities Exchange Act of 1934, as amended. ** |
| 32 | Certifications by Steven Bromley, President and Chief Executive Officer, and Eric Davis, Vice President and Chief Financial Officer, pursuant to 18 U.S.C. Section 1350. ** |
| * |
Exhibits and schedules to this exhibit have been omitted pursuant to Item 601(b)(2) of Regulation S-K. SunOpta will furnish copies of the omitted exhibits and schedules to the Securities and Exchange Commission upon its request. |
|
| |
| ** |
Filed herewith |
| SUNOPTA INC. | 81 | January 1, 2011 10-K |
SIGNATURES
Pursuant to the requirements of Section 13 and 15(d) of the Securities Exchange Act of 1934, the registrant has duly caused this report to be signed on its behalf by the undersigned hereunto duly authorized.
SUNOPTA INC.
/s/ Eric Davis
Eric Davis
Vice President and Chief Financial
Officer
Date: March 8, 2011
| SUNOPTA INC. | 82 | January 1, 2011 10-K |
KNOW ALL PERSONS BY THESE PRESENTS, that each of the undersigned hereby constitutes and appoints, jointly and severally, Steven R. Bromley and Eric Davis, and each of them, as the true and lawful attorney or attorneys-in-fact, with full power of substitution and resubstitution, for each of the undersigned and in the name, place and stead of each of the undersigned, to sign on behalf of each of the undersigned any and all amendments to this Annual Report on Form 10-K for the fiscal year ended January 1, 2011, and to file the same, with all exhibits thereto, and other documents in connection therewith with the Securities and Exchange Commission, granting to said attorney or attorneys-in-fact, and each of them, full power and authority to do so and perform each and every act and thing requisite and necessary to be done in and about the premises, as fully to all intents and purposes as the undersigned might or could do in person, hereby ratifying and confirming all that said attorney or attorneys-in-fact or any of them or their substitute or substitutes, may lawfully do or cause to be done by virtue hereof.
Pursuant to the requirements of the Securities Exchange Act of 1934, this report has been signed below by the following persons on behalf of the registrant and in the capacities and on the dates indicated.
| Signature | Title | Date |
| /s/ Steven R. Bromley
Steven R. Bromley |
President, Chief Executive Officer and
Director, (Principal Executive Officer) |
March 8, 2011 |
| /s/ Eric Davis Eric Davis |
Vice President and Chief Financial Officer
(Principal Financial and Accounting Officer) |
March 8, 2011 |
| /s/ Jeremy N. Kendall
Jeremy N. Kendall |
Chairman and Director |
March 8, 2011 |
| /s/ Cyril A. Ing Cyril A. Ing |
Director |
March 8, 2011 |
| /s/ Allan Routh Allan Routh |
Director |
March 8, 2011 |
| /s/ Katrina Houde Katrina Houde |
Director |
March 8, 2011 |
| /s/ Douglas Greene Douglas Greene |
Director |
March 8, 2011 |
| /s/ Victor Hepburn Victor Hepburn |
Director |
March 8, 2011 |
| /s/ Jay Amato Jay Amato |
Director |
March 8, 2011 |
| /s/ Alan Murray Alan Murray |
Director |
March 8, 2011
|
| SUNOPTA INC. | 83 | January 1, 2011 10-K |
SunOpta Inc.
Consolidated Financial Statements
For the years ended January 1, 2011, December 31, 2009 and December 31, 2008
(expressed in thousands of U.S. dollars, unless otherwise noted)
| SUNOPTA INC. | -F0- | January 1, 2011 10-K |
Report of Independent Registered Chartered Accountants
To the Board of Directors and Shareholders of SunOpta Inc.:
We have audited the accompanying consolidated balance sheets of SunOpta Inc. and subsidiaries (the "Company") as of January 1, 2011 and December 31, 2009, and the related consolidated statements of operations, comprehensive earnings (loss), shareholders' equity, and cash flows for the year ended January 1, 2011 and for each of the two years in the period ended December 31, 2009. These financial statements are the responsibility of the Company's management. Our responsibility is to express an opinion on these financial statements based on our audits.
We conducted our audits in accordance with the standards of the Public Company Accounting Oversight Board (United States). Those standards require that we plan and perform the audit to obtain reasonable assurance about whether the financial statements are free of material misstatement. An audit includes examining, on a test basis, evidence supporting the amounts and disclosures in the financial statements. An audit also includes assessing the accounting principles used and significant estimates made by management, as well as evaluating the overall financial statement presentation. We believe that our audits provide a reasonable basis for our opinion.
In our opinion, such consolidated financial statements present fairly, in all material respects, the financial position of SunOpta Inc. and subsidiaries as of January 1, 2011 and December 31, 2009, and the results of their operations and their cash flows for the year ended January 1, 2011 and each of the two years in the period ended December 31, 2009, in conformity with accounting principles generally accepted in the United States of America.
We have also audited, in accordance with the standards of the Public Company Accounting Oversight Board (United States), the Company's internal control over financial reporting as of January 1, 2011, based on the criteria established in Internal Control—Integrated Framework issued by the Committee of Sponsoring Organizations of the Treadway Commission and our report dated March 9, 2011 expressed an unqualified opinion on the Company's internal control over financial reporting.
"Deloitte & Touche LLP"
Independent Registered Chartered Accountants
Licensed
Public Accountants
Toronto, Canada
March 9, 2011
| SUNOPTA INC. | -F1- | January 1, 2011 10-K |
| SunOpta Inc. |
| Consolidated Statements of Operations |
| For the years ended January 1, 2011, December 31, 2009 and December 31, 2008 |
| (Expressed in thousands of U.S. dollars, except per share amounts) |
| January 1, 2011 | December 31, 2009 | December 31, 2008 | |||||||
| (see note 1 | ) | (see note 3 | ) | (see note 3 | ) | ||||
| Revenues | 898,931 | 819,040 | 874,445 | ||||||
| Cost of goods sold | 754,487 | 709,981 | 762,108 | ||||||
| Gross profit | 144,444 | 109,059 | 112,337 | ||||||
| Warehousing and distribution expenses | 3,703 | 4,223 | 4,796 | ||||||
| Selling, general and administrative expenses | 96,341 | 88,504 | 95,873 | ||||||
| Intangible asset amortization | 4,675 | 4,648 | 4,774 | ||||||
| Other expense (income), net (note 18) | 10,945 | 2,245 | (719 | ) | |||||
| Goodwill impairment (note 7) | 1,654 | 8,841 | 10,154 | ||||||
| Foreign exchange gain | (1,652 | ) | (523 | ) | (4,461 | ) | |||
| Earnings from continuing
operations before the following |
28,778 |
1,121 |
1,920 |
||||||
| Interest expense, net (note 10) | 9,749 | 13,839 | 14,607 | ||||||
| Earnings (loss) from continuing
operations before income taxes |
19,029 |
(12,718 |
) |
(12,687 |
) | ||||
| Provision for (recovery of) income taxes (note 13) | 5,463 | (3,201 | ) | (1,699 | ) | ||||
| Earnings (loss) from continuing operations | 13,566 | (9,517 | ) | (10,988 | ) | ||||
| Discontinued operations (note 3) | |||||||||
| (Loss) earnings from
discontinued
operations, net of income taxes |
(14,569 |
) |
(273 |
) |
963 |
||||
| Gain on sale of
discontinued
operations, net of income taxes |
62,950 |
- |
- |
||||||
| Earnings (loss) from discontinued
operations, net of taxes |
48,381 |
(273 |
) |
963 |
|||||
| Earnings (loss) | 61,947 | (9,790 | ) | (10,025 | ) | ||||
| Earnings (loss) attributable to
non-controlling interests |
881 |
(3,027 |
) |
911 |
|||||
| Earnings (loss) attributable to SunOpta Inc. | 61,066 | (6,763 | ) | (10,936 | ) | ||||
| Earnings (loss) per share – basic (note 12) | |||||||||
| -from continuing operations | 0.20 | (0.10 | ) | (0.18 | ) | ||||
| -from discontinued operations | 0.74 | - | 0.01 | ||||||
| 0.94 | (0.10 | ) | (0.17 | ) | |||||
| Earnings (loss) per share – diluted (note 12) | |||||||||
| -from continuing operations | 0.19 | (0.10 | ) | (0.18 | ) | ||||
| -from discontinued operations | 0.73 | - | 0.01 | ||||||
| 0.92 | (0.10 | ) | (0.17 | ) |
(See accompanying notes to consolidated financial statements)
| SUNOPTA INC. | -F2- | January 1, 2011 10-K |
| SunOpta Inc. |
| Consolidated Statements of Comprehensive Earnings (Loss) |
| For the years ended January 1, 2011, December 31, 2009 and December 31, 2008 |
| (Expressed in thousands of U.S. dollars, except per share amounts) |
| January 1, 2011 | December 31, 2009 | December 31, 2008 | |||||||
| (see note 1 | ) | (see note 3 | ) | (see note 3 | ) | ||||
| Earnings (loss) from continuing operations | 13,566 | (9,517 | ) | (10,988 | ) | ||||
| Earnings (loss) from discontinued
operations, net of income taxes |
48,381 |
(273 |
) |
963 |
|||||
| 61,947 | (9,790 | ) | (10,025 | ) | |||||
| Currency translation adjustment | (3,002 | ) | 10,442 | (17,767 | ) | ||||
| Change in fair value of interest rate
swap, net of income taxes of $145 |
351 |
415 |
(1,084 |
) | |||||
| Adjustments due to pensions | 588 | (78 | ) | (501 | ) | ||||
| Other comprehensive (loss)
earnings, net of income taxes |
(2,063 |
) |
10,779 |
(19,352 |
) | ||||
| Comprehensive earnings (loss) | 59,884 | 989 | (29,377 | ) | |||||
| Comprehensive earnings (loss)
attributable to non-controlling interests |
292 |
(3,061 |
) |
911 |
|||||
| Comprehensive earnings (loss)
attributable to SunOpta Inc. |
59,592 |
4,050 |
(30,288 |
) |
(See accompanying notes to consolidated financial statements)
| SUNOPTA INC. | -F3- | January 1, 2011 10-K |
| SunOpta Inc. |
| Consolidated Balance Sheets |
| As at January 1, 2011 and December 31, 2009 |
| (Expressed in thousands of U.S. dollars, except per share amounts) |
| January 1, 2011 | December 31, 2009 | |||||
| Assets | (see note 1 | ) | (see note 3 | ) | ||
| Current assets | ||||||
| Cash and cash equivalents (note 20) | $ | 2,643 | $ | 1,752 | ||
| Accounts receivable (note 4) | 98,875 | 78,483 | ||||
| Inventories (note 5) | 200,278 | 155,882 | ||||
| Prepaid expenses and other current assets (note 19) | 30,041 | 10,001 | ||||
| Current income taxes recoverable | - | 442 | ||||
| Deferred income taxes (note 13) | 870 | 5,457 | ||||
| Current assets held for sale (note 3) | - | 56,140 | ||||
| 332,707 | 308,157 | |||||
| Investments (note 3) | 33,345 | - | ||||
| Property, plant and equipment (note 6) | 120,055 | 105,220 | ||||
| Goodwill (note 7) | 48,558 | 31,431 | ||||
| Intangible assets (note 7) | 60,200 | 55,229 | ||||
| Deferred income taxes (note 13) | 11,889 | 15,257 | ||||
| Other assets | 2,930 | 2,876 | ||||
| Non-current assets held for sale (note 3) | - | 33,120 | ||||
| $ | 609,684 | $ | 551,290 | |||
| Liabilities | ||||||
| Current liabilities | ||||||
| Bank indebtedness (note 9) | $ | 75,910 | $ | 63,481 | ||
| Accounts payable and accrued liabilities (note 8) | 124,031 | 87,519 | ||||
| Customer and other deposits | 2,858 | 1,064 | ||||
| Income taxes payable | 973 | - | ||||
| Other current liabilities (note 19) | 7,674 | 1,566 | ||||
| Current portion of long-term debt (note 10) | 22,247 | 52,455 | ||||
| Current portion of long-term liabilities | 571 | 683 | ||||
| Current liabilities held for sale (note 3) | - | 19,135 | ||||
| 234,264 | 225,903 | |||||
| Long-term debt (note 10) | 42,735 | 34,734 | ||||
| Long-term liabilities | 6,642 | 2,760 | ||||
| Deferred income taxes (note 13) | 20,808 | 12,708 | ||||
| Non-current liabilities held for sale (note 3) | - | 487 | ||||
| 304,449 | 276,592 | |||||
| Preferred shares of a subsidiary company held for sale (note 3) | - | 28,187 | ||||
| Equity | ||||||
| SunOpta Inc. shareholders’ equity | ||||||
| Capital Stock (note 11) | 180,661 | 178,694 | ||||
| 65,500,091 common shares (December 31, 2009 - 64,982,968) | ||||||
| Additional paid in capital (note 11) | 12,336 | 7,934 | ||||
| Retained earnings | 95,212 | 34,146 | ||||
| Accumulated other comprehensive income | 2,833 | 12,079 | ||||
| 291,042 | 232,853 | |||||
| Non-controlling interest | 14,193 | 13,658 | ||||
| Total equity | 305,235 | 246,511 | ||||
| $ | 609,684 | $ | 551,290 | |||
| Commitments and contingencies (note 16) |
(See accompanying notes to consolidated financial statements)
| SUNOPTA INC. | -F4- | January 1, 2011 10-K |
| SunOpta Inc. |
| Consolidated Statements of Shareholders’ Equity |
| As at and for the years ended January 1, 2011, December 31, 2009 and December 31, 2008 |
| (Expressed in thousands of U.S. dollars, except per share amounts) |
| Accumulated | ||||||||||||||||||
| Additional | other | Non- | ||||||||||||||||
| Capital | paid in | Retained | comprehensive | controlling | ||||||||||||||
| stock | capital | earnings | income | interest | Total | |||||||||||||
| Balance at December 31, 2007 | 176,547 | 5,967 | 51,845 | 20,618 | 13,863 | 268,840 | ||||||||||||
| Options exercised | 559 | (295 | ) | - | - | - | 264 | |||||||||||
| Employee stock purchase plan
and compensation grants |
752 |
- |
- |
- |
- |
752 |
||||||||||||
| Stock-based compensation,
including tax benefit of $23 |
- |
1,106 |
- |
- |
- |
1,106 |
||||||||||||
| (Loss) earnings from
continuing operations |
- |
- |
(11,899 |
) |
- |
911 |
(10,988 |
) | ||||||||||
| Earnings from discontinued operations | - | - | 963 | - | - | 963 | ||||||||||||
| Currency translation adjustment | - | - | - | (17,767 | ) | - | (17,767 | ) | ||||||||||
| Non-controlling interest contributions | - | - | - | - | 328 | 328 | ||||||||||||
| Change in fair value of interest
rate swap, net of income taxes of $370 |
- |
- |
- |
(1,084 |
) |
- |
(1,084 |
) | ||||||||||
| Adjustment due to pensions | - | - | - | (501 | ) | - | (501 | ) | ||||||||||
| Balance at December 31, 2008 | 177,858 | 6,778 | 40,909 | 1,266 | 15,102 | 241,913 | ||||||||||||
| Employee stock purchase plan
and compensation grants |
836 |
- |
- |
- |
- |
836 |
||||||||||||
| Stock-based compensation,
including tax benefit of $6 |
- |
1,435 |
- |
- |
- |
1,435 |
||||||||||||
| Equity transaction (note 11) | - | (279 | ) | - | - | 279 | - | |||||||||||
| Loss from continuing operations | - | - | (6,490 | ) | - | (3,027 | ) | (9,517 | ) | |||||||||
| Loss from discontinued operations | - | - | (273 | ) | - | - | (273 | ) | ||||||||||
| Currency translation adjustment | - | - | - | 10,615 | (173 | ) | 10,442 | |||||||||||
| Non-controlling interest contributions | - | - | - | - | 1,338 | 1,338 | ||||||||||||
| Change in fair value of interest
rate swap, net of income taxes of $182 |
- |
- |
- |
276 |
139 |
415 |
||||||||||||
| Adjustment due to pensions | - | - | - | (78 | ) | - | (78 | ) | ||||||||||
| Balance at December 31, 2009 | 178,694 | 7,934 | 34,146 | 12,079 | 13,658 | 246,511 | ||||||||||||
| Employee stock purchase plan
and compensation grants |
760 |
- |
- |
- |
- |
760 |
||||||||||||
| Options exercised | 1,207 | (84 | ) | - | - | - | 1,123 | |||||||||||
| Issuance of warrants (note 11) | - | 2,163 | - | - | - | 2,163 | ||||||||||||
| Stock-based compensation,
including tax benefit of $42 |
- |
2,323 |
- |
- |
- |
2,323 |
||||||||||||
| Earnings from continuing operations | - | - | 12,685 | - | 881 | 13,566 | ||||||||||||
| Earnings from discontinued
operations, net of income taxes |
- |
- |
48,381 |
(7,772 |
) |
- |
40,609 |
|||||||||||
| Currency translation adjustment | - | - | - | (2,295 | ) | (707 | ) | (3,002 | ) | |||||||||
| Non-controlling interest contributions | - | - | - | - | 243 | 243 | ||||||||||||
| Change in fair value of interest
rate swap, net of income taxes of $145 |
- |
- |
- |
233 |
118 |
351 |
||||||||||||
| Adjustment due to pensions | - | - | - | 588 | - | 588 | ||||||||||||
| Balance at January 1, 2011 | 180,661 | 12,336 | 95,212 | 2,833 | 14,193 | 305,235 |
(See accompanying notes to consolidated financial statements)
| SUNOPTA INC. | -F5- | January 1, 2011 10-K |
| SunOpta Inc. |
| Consolidated Statements of Cash Flows |
| For the years ended January 1, 2011, December 31, 2009 and December 31, 2008 |
| (Expressed in thousands of U.S. dollars, except per share amounts) |
| January 1, 2011 | December 31, 2009 | December 31, 2008 | |||||||
| $ | $ | $ | |||||||
| (see note 1 | ) | (see note 3 | ) | (see note 3 | ) | ||||
| Cash provided by (used in) | |||||||||
| Operating activities | |||||||||
| Earnings (loss) | 61,947 | (9,790 | ) | (10,025 | ) | ||||
| Earnings (loss) from discontinued operations | 48,381 | (273 | ) | 963 | |||||
| Earnings (loss) from continuing operations | 13,566 | (9,517 | ) | (10,988 | ) | ||||
| Items not affecting cash | |||||||||
| Amortization | 17,859 | 17,030 | 17,208 | ||||||
| Unrealized gain on foreign exchange | (977 | ) | (1,022 | ) | (1,702 | ) | |||
| Deferred income taxes | 1,853 | (2,250 | ) | (942 | ) | ||||
| Stock-based compensation | 2,764 | 1,425 | 1,106 | ||||||
| Goodwill impairment (note 7) | 1,654 | 8,841 | 10,154 | ||||||
| Impairment of long-lived assets (note 18) | 7,984 | 1,800 | - | ||||||
| Other | (1,420 | ) | (508 | ) | 2,359 | ||||
| Changes in non-cash working
capital, net of businesses acquired (note 14) |
(33,575 |
) |
41,229 |
11,576 |
|||||
| Net cash flows from operations - continuing operations | 9,708 | 57,028 | 28,771 | ||||||
| Net cash flows from operations - discontinued operations | (8,400 | ) | (12,140 | ) | 4,914 | ||||
| 1,308 | 44,888 | 33,685 | |||||||
| Investing activities | |||||||||
| Acquisition of businesses, net of cash acquired (note 2) | (43,761 | ) | - | (5,267 | ) | ||||
| Purchases of property, plant and equipment | (19,698 | ) | (11,538 | ) | (8,236 | ) | |||
| Proceeds from the sale of long-lived assets | 36 | 1,076 | 2,005 | ||||||
| Purchases of patents, trademarks and
other intangible assets |
(662 |
) |
(216 |
) |
(564 |
) | |||
| Payment of deferred purchase consideration | (1,388 | ) | (1,856 | ) | (2,042 | ) | |||
| Other | 328 | 259 | (105 | ) | |||||
| Cash from investing activities - continuing operations | (65,145 | ) | (12,275 | ) | (14,209 | ) | |||
| Cash from investing activities - discontinued operations | 52,298 | (1,857 | ) | (1,523 | ) | ||||
| (12,847 | ) | (14,132 | ) | (15,732 | ) | ||||
| Financing activities | |||||||||
| Increase (decrease) in line of credit facilities | 14,328 | (5,644 | ) | (24,584 | ) | ||||
| Borrowings under long-term debt | 30,217 | 719 | 15,655 | ||||||
| Proceeds from the issuance of common shares | 1,883 | 836 | 1,016 | ||||||
| Repayment of long-term debt | (52,423 | ) | (29,438 | ) | (15,322 | ) | |||
| Deferred financing costs | (642 | ) | (2,198 | ) | - | ||||
| Other | (169 | ) | (14 | ) | 337 | ||||
| Cash from financing activities - continuing operations | (6,806 | ) | (35,739 | ) | (22,898 | ) | |||
| Cash from financing activities - discontinued operations | - | - | - | ||||||
| (6,806 | ) | (35,739 | ) | (22,898 | ) | ||||
| Foreign exchange gain (loss) on cash held
in a foreign currency |
265 |
951 |
(602 |
) | |||||
| Decrease in cash and cash
equivalents during the year |
(18,080 |
) |
(4,032 |
) |
(5,547 |
) | |||
| Discontinued operations cash activity included above: | |||||||||
| Add: Balance included at beginning of year | 18,971 | 22,877 | 25,218 | ||||||
| Less: Balance included at end of year | - | (18,971 | ) | (22,877 | ) | ||||
| Cash and cash equivalents - beginning of the year | 1,752 | 1,878 | 5,084 | ||||||
| Cash and cash equivalents - end of the year | 2,643 | 1,752 | 1,878 | ||||||
| Supplemental cash flow information (notes 14 and 20) |
(See accompanying notes to consolidated financial statements)
| SUNOPTA INC. | -F6- | January 1, 2011 10-K |
| SunOpta Inc. |
| Notes to Consolidated Financial Statements |
| For the years ended January 1, 2011, December 31, 2009 and December 31, 2008 |
| (Expressed in thousands of U.S. dollars, except per share amounts) |
| 1. | Description of business and significant accounting policies |
SunOpta Inc. (the “Company” or “SunOpta”) was incorporated under the laws of Canada on November 13, 1973. The Company operates businesses focused on a healthy products portfolio that promotes the health and well-being of its communities combined with environmental responsibility. The Company has two industry groups divided into six operating segments, the largest being SunOpta Foods, accounting for approximately 91% of 2010 consolidated revenues. SunOpta Foods operates in the natural, organic and specialty foods and natural health product sectors and utilizes a number of vertically integrated business models to bring cost-effective and quality products to market. In addition to SunOpta Foods, the Company owns approximately 66.4% of Opta Minerals Inc. (“Opta Minerals”). Opta Minerals, representing approximately 9% of consolidated revenues, is a vertically integrated provider of customer process solutions and industrial minerals products for use primarily in the steel, foundry, loose abrasive cleaning, roof shingle, construction and marine/bridge cleaning industries. The Company’s assets, operations and employees as at January 1, 2011 are primarily located in the United States, Canada, Europe, Mexico, China, Ethiopia and South Africa.
Basis of presentation
These consolidated financial statements have been prepared in accordance with accounting principles generally accepted in the United States of America. The consolidated statements include the accounts of the Company and all majority-owned subsidiaries, as well as Opta Minerals, which is 66.4% owned by SunOpta (December 31, 2009 - 66.4%). In addition, the accounts of all variable interest entities for which the Company has been determined to be the primary beneficiary are included in these consolidated financial statements from the date such determination was made. All significant intercompany accounts and transactions have been eliminated on consolidation.
The investment in Opta Minerals is controlled and therefore is consolidated. The non-controlling interest on the consolidated balance sheets and consolidated statements of operations and comprehensive earnings (loss) includes the non-controlling shareholders’ interest in Opta Minerals.
As a result of the discontinued operations described in note 3, comparative amounts shown in the notes to the Consolidated Financial Statements for the years ended December 31, 2009 and December 31, 2008 have been adjusted to exclude the carrying amounts of assets and liabilities classified as held for sale, and the revenues and expenses of the discontinued operations.
Fiscal year-end
On March 9, 2010, the Board of Directors of the Company approved a change to the Company’s fiscal year period from a fiscal year ending on December 31 to a floating year-end on the Saturday closest to December 31, based on a 52 week calendar, wherein every fiscal quarter (except for the first quarter which included two additional days) is comprised of 13 weeks or 91 days. This change is effective for fiscal 2010, resulting in a year-end of January 1, 2011 and the quarterly periods for fiscal 2010 ending on April 3, July 3 and October 2. The fiscal year of Opta Minerals Inc., which is 66.4% owned by the Company, ends on December 31, 2010, and its quarterly periods for fiscal 2010 end on March 31, June 30 and September 30. The consolidated statements of operations, cash flows and balance sheets for the Company in the current year include the results of Opta Minerals through December 31, 2010.
Variable interest entities
The Company accounts for its variable interest entities (“VIE’s”) in accordance with Accounting Standards Codification (“ASC”) Topic 810, “Consolidation” (formerly Statement of Financial Accounting Standards (“SFAS”) No. 167, “Variable Interest Entities”). The decision whether to consolidate a VIE begins with establishing that a VIE exists, and then requires an entity to perform a qualitative analysis to determine whether it holds a controlling financial interest (i.e. is a primary beneficiary) in the VIE. The analysis identifies the primary beneficiary of a VIE as the entity that has both the power to direct the activities of the VIE that most significantly impact the economic performance of the VIE and the obligation to absorb losses, or the right to receive benefits, that could potentially be significant to the VIE. The Company has determined it has a controlling interest in certain VIE’s. See note 21 for further discussion on the consolidation of these entities and the account balances they are included in.
| SUNOPTA INC. | -F7- | January 1, 2011 10-K |
| SunOpta Inc. |
| Notes to Consolidated Financial Statements |
| For the years ended January 1, 2011, December 31, 2009 and December 31, 2008 |
| (Expressed in thousands of U.S. dollars, except per share amounts) |
| 1. | Description of business and significant accounting policies, continued |
Cash and cash equivalents
Cash and cash equivalents consist of cash and short-term deposits with an original maturity of 90 days or less. Certain cash and cash equivalents can only be used by subsidiaries and are consolidated for financial reporting purposes due to the Company’s ownership (see note 20).
Accounts receivable
Trade receivables are recorded at the invoiced amount and do not bear interest. The allowance for doubtful accounts is an estimate of the amount of probable credit losses in our existing accounts receivable. Account balances are charged off against the allowance when the Company believes it is probable the receivable will not be recovered. As of January 1, 2011 and December 31, 2009, no customer’s balance represented 10% or more of the Company’s consolidated trade receivables balance.
Inventories
Raw materials inventory is valued at the lower of cost and replacement value. Finished goods (excluding commodity grains) are valued at the lower of cost and market (net realizable value). Cost is principally determined on a weighted average cost basis. Shipping and handling costs are included in cost of sales on the consolidated statements of operations and comprehensive earnings (loss).
Inventories of commodity grains, which includes amounts acquired under deferred pricing contracts traded on the Chicago Board of Trade (“CBoT”) are valued at net realizable value. Grain inventory quantities at year-end are multiplied by the quoted price on the CBoT to reflect the market value of the inventory. This market value is then adjusted for a basis factor which represents costs from the seller / buyer for freight, interest and other disposal costs to arrive at net realizable value. Changes in CBoT prices or the disposal costs are included in cost of goods sold on the consolidated statements of operations and comprehensive earnings (loss). The Company also has other grain inventories consisting of sunflowers and certain specialty and organic soybeans, which are valued at the lower of cost and estimated net realizable value.
SunOpta Foods economically hedges its commodity grain positions to protect gains and minimize losses due to market fluctuations. Futures contracts and purchase and sale contracts are adjusted to market price and resulting gains and losses from these transactions are included in cost of goods sold. The Company has a risk of loss from hedge activity if the grower does not deliver the grain as scheduled. These transactions do not qualify as hedges under accounting principles generally accepted in the United States of America and therefore changes in market value are recorded in the consolidated statements of operations.
Prepaid expenses and other current assets
Prepaid expenses and other current assets include amounts paid in cash and recorded by the Company as a current asset prior to consumption.
Property, plant and equipment
Property, plant and equipment are stated at cost, less accumulated amortization. Amortization is provided using the straight-line basis at rates reflecting the estimated useful lives of the assets.
|
Buildings |
20 – 40 years |
|
Machinery and equipment |
10 – 20 years |
|
Enterprise software |
5 years |
|
Office furniture and equipment |
3 – 7 years |
|
Vehicles |
5 years |
| SUNOPTA INC. | -F8- | January 1, 2011 10-K |
| SunOpta Inc. |
| Notes to Consolidated Financial Statements |
| For the years ended January 1, 2011, December 31, 2009 and December 31, 2008 |
| (Expressed in thousands of U.S. dollars, except per share amounts) |
| 1. | Description of business and significant accounting policies, continued |
Goodwill
Goodwill represents the excess of the purchase price over the assigned value of net assets acquired. Goodwill is not amortized but is instead tested for impairment annually. The impairment test is performed annually during the fourth quarter unless events or circumstances change between the annual impairment tests that would indicate the carrying amount of goodwill maybe impaired. If events or circumstances change, the goodwill impairment is performed between the annual impairment tests. Impairment is tested at the reporting unit level by comparing the reporting unit’s carrying amount to its fair value. If the carrying value exceeds the reporting unit’s fair value, there is a potential impairment in goodwill. Any impairment in goodwill is measured by allocating the fair value of the reporting unit in a manner similar to a purchase price allocation and comparing the notional goodwill from the fair value allocation to the carrying value of the goodwill.
Intangible assets
The Company’s finite-life intangible assets consist of customer and other relationships, patents and trademarks and other intangible assets. These intangible assets are amortized on a straight-line basis over their estimated useful lives as follows:
|
Customer and other relationships |
2 – 23 years |
|
Patents and trademarks |
8 – 20 years |
|
Other |
4 – 15 years |
Long-lived assets
The Company reviews its long-lived assets for impairment whenever events or changes in circumstances indicate that the carrying amounts of the assets may not be recoverable through undiscounted future cash flows. If impairment exists based on expected future undiscounted cash flows, a loss is recognized in income. The amount of the impairment loss is the excess of the carrying amount of the impaired asset over the fair value of the asset.
Other assets
Costs incurred in connection with obtaining financing are deferred and amortized over the term of the financing agreement, using the effective interest rate method.
Revenue recognition
The Company recognizes revenue at the time of delivery of the product or service and when all of the following have occurred: a sales agreement is in place, the price is fixed or determinable, and collection is reasonably assured. Details of specific recognition by industry group are as follows:
(a) SunOpta Foods
Grain revenues are recorded when title and possession of the product is transferred to the customer. Possession is transferred to the customer at the time of shipment from the Company’s facility or at the time of delivery to a specified destination depending on the terms of the sale. All other SunOpta Foods revenues are recognized when title is transferred upon the shipment of product or at the time the service is provided to the customer. Consideration given to customers such as value incentives, rebates, early payment discounts and other discounts are recorded as reductions to revenues at the time of sale.
(b) Opta Minerals
Revenues from the sale of silica-free loose abrasives, industrial minerals, specialty sands and related products are recognized upon the shipment to the customer of materials and transfer of title.
| SUNOPTA INC. | -F9- | January 1, 2011 10-K |
| SunOpta Inc. |
| Notes to Consolidated Financial Statements |
| For the years ended January 1, 2011, December 31, 2009 and December 31, 2008 |
| (Expressed in thousands of U.S. dollars, except per share amounts) |
| 1. | Description of business and significant accounting policies, continued |
Foreign currency translation
The functional currency of all operations located in the United States, as well the corporate head office which is located in Canada, is the United States dollar. The functional currency of all operations located in Canada is the Canadian dollar. The functional currency of all operations located in Europe and Mexico is the Euro and Mexican peso, respectively.
The assets and liabilities of the Company’s operations, as well as monetary assets of the corporate head office, are translated at exchange rates in effect at the dates of the consolidated balance sheets. Non-monetary assets of the corporate head office are translated at their historical rates. Revenues and expenses are translated at average exchange rates prevailing during the period. Unrealized gains or losses resulting from translating operations are accumulated and reported as a currency translation adjustment in shareholders’ equity and are disclosed as part of accumulated other comprehensive income. Gains and losses from foreign currency transactions are included in earnings of each period.
Pension plan
The Company has a defined benefit pension plan covering certain employees as a result of the business acquisition of The Organic Corporation B.V. in 2008. Net periodic benefit cost, which is included in selling, general and administrative expenses on the consolidated statements of earnings, represents the cost of benefits earned by employees as services are rendered. The cost reflects management’s best estimates of the pension plans’ expected investment returns, wage and salary escalation, mortality of members, terminations and the ages at which members will retire. Changes in these assumptions could impact future pension expense. The excess of the net actuarial gain (loss) over 10% of the greater of the benefit obligation and the fair value of plan assets at the beginning of the year is amortized over the average remaining service lives of the members. At January 1, 2011, the future service lives of participants expected to receive benefits in The Organic Corporation B.V. defined benefit plan was estimated to be 28 years. In 2010, a defined benefit plan, which was acquired through the acquisition of Global Trading Inc., was wound up.
Customer and other deposits
Customer and other deposits include prepayments by the Grains and Foods Group and the International Foods Group’s customers for merchandise inventory to be purchased at a future date.
Income taxes
The Company follows the asset and liability method of accounting for income taxes whereby deferred income tax assets are recognized for deductible temporary differences and operating loss carry-forwards, and deferred income tax liabilities are recognized for taxable temporary differences. Temporary differences are the differences between the amounts of assets and liabilities recorded for income tax and financial reporting purposes.
Deferred income tax assets are recognized only to the extent that management determines that it is more likely than not that the deferred income tax assets will be realized. Deferred income tax assets and liabilities are adjusted for the effects of changes in tax laws and rates on the date of enactment. The income tax expense or benefit is the income tax payable or recoverable for the year plus or minus the change in deferred income tax assets and liabilities during the year.
| SUNOPTA INC. | -F10- | January 1, 2011 10-K |
| SunOpta Inc. |
| Notes to Consolidated Financial Statements |
| For the years ended January 1, 2011, December 31, 2009 and December 31, 2008 |
| (Expressed in thousands of U.S. dollars, except per share amounts) |
| 1. | Description of business and significant accounting policies, continued |
The Company is subject to ongoing tax exposures, examinations and assessments in various jurisdictions. Accordingly, the Company may incur additional income tax expense based upon the outcomes of such matters. In addition, when applicable, the Company adjusts income tax expense to reflect the Company’s ongoing assessments of such matters, which requires judgment and can materially increase or decrease its effective rate as well as impact operating results. The Company provides for such exposures in accordance with Financial Accounting Standards Board (“FASB”) ASC Topic 740 (formerly Interpretation No. 48, “Accounting for Uncertainty in Income Taxes” (an Interpretation of FASB Statement No. 109) (“FIN48”)). ASC 740 prescribes a recognition threshold and measurement attribute for the financial statement recognition and measurement of a tax position taken or expected to be taken in a tax return. ASC 740 also provides accounting guidance on de-recognition, classification, interest and penalties, accounting in interim periods, disclosure and transition. The evaluation of tax positions under ASC 740 is a two-step process, whereby (1) the Company determines whether it is more likely than not that the tax positions will be sustained based on the technical merits of the position, and (2) for those tax positions that meet the more-likely-than-not recognition threshold, the Company would recognize the largest amount of tax benefit that has a greater than 50% likelihood of being realized upon ultimate settlement with the related tax authority.
Stock option plan
The Company maintains a stock option plan under which incentive stock options may be granted to employees and non-employee directors. Effective January 1, 2006, the Company adopted ASC Topic 718 (formerly SFAS 123(R), “Share-Based Payments”), using the modified prospective transition method, which required the Company to record stock-based compensation expenses within the consolidated statements of earnings. The fair value at grant date of stock options is estimated using the Black-Scholes option-pricing model. Compensation expense is recognized on a straight-line basis over the stock option vesting period of the entire award based on the estimated number of stock options that are expected to vest. When exercised, stock options are settled through the issuance of shares and are therefore treated as equity awards.
Derivative instruments
The Company is exposed to fluctuations in interest rates, commodities and foreign currency exchange. The Company utilizes certain derivative financial instruments to enhance its ability to manage these risks, including interest rate swaps, exchange-traded commodity futures, commodity forward purchase and sale contracts and forward foreign exchange contracts. Derivative instruments are entered into for periods consistent with related underlying exposures and do not constitute positions independent of those exposures. The Company does not enter into contracts for speculative purposes.
All derivative instruments are recognized on the consolidated balance sheets at fair value. Changes in the fair value of derivative instruments are recorded in operations or other comprehensive earnings (loss), based on whether the instrument is designated as part of a hedge transaction. Gains or losses on derivative instruments reported in accumulated other comprehensive income are reclassified to earnings in the period in which earnings are affected by the underlying hedged item. The ineffective portion of all hedges is recognized in earnings in the current period.
| (a) | Interest rate swaps |
Opta Minerals entered into a cash flow hedge in 2007 to manage its exposure to interest rate risks. The fair value of this contract is included in accounts payable and accrued liabilities. The changes in the fair value of this contract are included in accumulated other comprehensive income to the extent that the hedge continues to be effective. The amounts included in accumulated other comprehensive income amounts are allocated to earnings in the same period in which the hedged item affects earnings. To the extent that the cash flow hedge is not considered to be effective by completely offsetting the change in fair value of the hedged item, the ineffective portion of the hedging relationship is recorded immediately in earnings and is classified as interest expense on the consolidated statements of operations and comprehensive earnings (loss).
| SUNOPTA INC. | -F11- | January 1, 2011 10-K |
| SunOpta Inc. |
| Notes to Consolidated Financial Statements |
| For the years ended January 1, 2011, December 31, 2009 and December 31, 2008 |
| (Expressed in thousands of U.S. dollars, except per share amounts) |
| 1. | Description of business and significant accounting policies, continued |
| (b) | Exchange-traded commodity futures and forward contracts |
SunOpta Foods enters into exchange-traded commodity futures contracts to economically hedge its exposure to price fluctuations on grain and cocoa transactions to the extent considered practicable for minimizing risk from market price fluctuations. Futures contracts used for economical hedging purposes are purchased and sold through regulated commodity exchanges in the United States. Inventories, however, may not be completely hedged, due in part to the Company’s assessment of its exposure from expected price fluctuations. Forward purchase and sale contracts may expose the Company to risk in the event that a counterparty to a transaction is unable to fulfill its contractual obligation or if a grower does not deliver grain as scheduled. The Company manages its risk by entering into purchase contracts with pre-approved growers and sale contracts are entered into with organizations of acceptable creditworthiness, as internally evaluated. All futures and forward purchase and sale contracts are marked-to-market. Gains and losses on these transactions are included in cost of goods sold on the consolidated statements of earnings. For the years ended January 1, 2011, December 31, 2009 and December 31, 2008, the gains included in cost of sales were $7,838, $621 and $135, respectively.
| (c) | Forward foreign exchange contracts |
The Company enters into forward foreign exchange contracts to minimize exchange rate fluctuations relating to foreign currency denominated sales contracts and accounts receivable. All forward exchange contracts are marked-to-market. Gains and losses on these transactions are included in foreign exchange (gain) loss in the consolidated statements of operations and comprehensive earnings (loss).
Financial instruments
The Company’s financial instruments recognized in the consolidated balance sheets and included in working capital consist of cash and cash equivalents, accounts receivable, accounts payable and accrued liabilities and customer and other deposits. The fair values of these instruments approximate their carrying values due to their short-term maturities. The fair values of long-term debt and long-term liabilities as at January 1, 2011 are considered not to be materially different from the carrying amounts.
The Company’s financial instruments exposed to credit risk include cash and cash equivalents, and accounts receivable. The Company places its cash and cash equivalents with institutions of high creditworthiness. The Company’s trade accounts receivable are not subject to a high concentration of credit risk. The Company routinely assesses the financial strength of its customers and, as a consequence, believes that its accounts receivable credit risk exposure is limited. The Company maintains an allowance for losses based on the expected collectibility of the accounts.
Earnings per share
Basic earnings per share is computed by dividing the earnings available for common shareholders by the weighted average number of common shares outstanding during the year. Diluted earnings per share is computed using the treasury stock method whereby the weighted average number of common shares used in the basic earnings per share calculation is increased to include the number of additional common shares that would have been outstanding if the potential dilutive common shares had been issued at the beginning of the year.
Use of estimates
The preparation of financial statements in conformity with generally accepted accounting principles requires management to make certain estimates and assumptions that affect the reported amounts of assets and liabilities, related revenues and expenses, and disclosure of gain and loss contingencies at the date of the financial statements. The estimates and assumptions made require judgment on the part of management and are based on the Company’s historical experience and various other factors that are believed to be reasonable in the circumstances. Management continually evaluates the information that forms the basis of its estimates and assumptions as the business of the Company and the business environment generally changes.
| SUNOPTA INC. | -F12- | January 1, 2011 10-K |
| SunOpta Inc. |
| Notes to Consolidated Financial Statements |
| For the years ended January 1, 2011, December 31, 2009 and December 31, 2008 |
| (Expressed in thousands of U.S. dollars, except per share amounts) |
| 1. | Description of business and significant accounting policies, continued |
Recent accounting pronouncements
On July 1, 2009, the Company adopted ASC Topic 105-10 (formerly SFAS No. 168, “The FASB Accounting Standards Codification and Hierarchy of Generally Accepted Accounting Principles, a replacement of FASB Statement No. 162”). ASC 105-10 establishes the FASB ASC as the source of authoritative accounting principles recognized by the FASB to be applied in preparation of financial statements in conformity with accounting principles generally accepted in the United States of America. As a result of adopting this standard, all references to authoritative accounting literature have been updated based on the new GAAP codification.
On January 1, 2009, the Company adopted ASC Topic 805 (formerly SFAS No. 141R, “Business Combinations”). ASC 805 applies to all transactions or other events in which an entity obtains control of one or more businesses and requires that all assets and liabilities of an acquired business as well as any non-controlling interest in the acquiree be recorded at their fair values at the acquisition date. Contingent consideration arrangements are recognized at their acquisition date fair values, with subsequent changes in fair value generally reflected in earnings. Pre-acquisition contingencies are also typically recognized at their acquisition date fair values. In subsequent periods, contingent liabilities are measured at the higher of their acquisition date fair values or the estimated amounts to be realized. The adoption of ASC 805 did not have a significant impact on the Company’s consolidated financial statements in 2009, the year of adoption, as there were no acquisitions completed in that year. The Company has however applied the provisions of this standard to the two acquisitions completed during the current year (see note 2).
In February 2008, FASB issued ASC Topic 820-10-55 (formerly FASB Staff Position (“FSP”) 157-2/Statement No. 157, “Effective Date of FASB Statement No. 157”). ASC Topic 820-10-55 delayed the effective date for all non-financial assets and non-financial liabilities, except those that are recognized or disclosed at fair value in the financial statements on a recurring basis (at least annually). The adoption of the provisions of ASC 820-10-55 related to non-financial assets and non-financial liabilities disclosures effective January 1, 2009. See note 19 for enhanced note disclosures as a result of adopting this standard.
In December 2007, the FASB issued ASC Topic 810-10-65, “Consolidation”, regarding non-controlling interests (formerly SFAS No. 160, “Non-controlling Interests in Consolidated Financial Statements”). ASC 810-10-65 establishes accounting and reporting standards for ownership in subsidiaries held by parties other than the parent, the amount of consolidated earnings attributable to the parent and to the non-controlling interest, changes in a parent’s ownership interest, and the valuation of retained non-controlling equity investments when a subsidiary is deconsolidated. It clarifies that a non-controlling interest in a subsidiary is an ownership interest in the consolidated entity that should be reported as equity in the consolidated financial statements. The Company adopted ASC 810-10-65 effective January 1, 2009. As required by ASC 810-10-65, the Company has retrospectively applied the presentation to prior year balances and has added disclosures to its consolidated balance sheets, consolidated statements of shareholders’ equity and consolidated statements of cash flows, as well as creating a new consolidated statement of comprehensive earnings (loss), as a result of adopting this standard.
In March 2008, the FASB issued the disclosure requirements within ASC Topic 815, “Derivatives and Hedging” (formerly SFAS No. 161, “Disclosures about Derivative Instruments and Hedging Activities, an Amendment of FASB No. 133”). ASC 815 is intended to improve transparency in financial reporting by requiring enhanced disclosures of an entity’s derivative instruments and hedging activities and their effects on the entity’s financial position, financial performance, and cash flows. The disclosure requirements apply to all derivative instruments within the scope of ASC 815. The standard also applies to non-derivative hedging instruments and all hedged items designated and qualifying under ASC 815. This standard requires an entity with derivatives to disclose how and why it uses derivative instruments; how derivative instruments and related hedged items are accounted for under SFAS 133; and how derivative instruments and related hedged items affect the entity’s financial position, financial performance, and cash flows. Entities must provide tabular disclosures of the location, by line item, of amounts of gains and losses reported in the consolidated statements of operations. The Company adopted the disclosure requirements of ASC 815 on January 1, 2009. See note 19 for enhanced note disclosures as a result of adopting this standard.
| SUNOPTA INC. | -F13- | January 1, 2011 10-K |
| SunOpta Inc. |
| Notes to Consolidated Financial Statements |
| For the years ended January 1, 2011, December 31, 2009 and December 31, 2008 |
| (Expressed in thousands of U.S. dollars, except per share amounts) |
| 1. | Description of business and significant accounting policies, continued |
In May 2008, the FASB issued ASC Topic 350-30, “General Intangibles Other than Goodwill” (formerly FSP 142-3, “Determination of the Useful Life of Intangible Assets”). ASC 350-30 provides guidance on the renewal or extension assumptions used in the determination of useful life of a recognized intangible asset. The intent of ASC 350-30 is to better match the useful life of the recognized intangible asset to the period of expected cash flow used to measure its fair value. ASC 350-30 is effective for fiscal years beginning after December 15, 2008. The adoption of this standard did not have a significant impact on the Company’s consolidated financial statements.
In December 2008, the FASB issued ASC Topic 715-20, “Defined Benefit Plans” (formerly FASB FSP No. 132(R)-1, “Employers’ Disclosures about Postretirement Benefit Plan Assets,”). ASC 715-20 amends SFAS No. 132 to provide guidance on an employer’s disclosures about plan assets of a defined benefit pension or other postretirement plan. The additional required disclosures focus on fair value by category of plan assets. This ASC is effective for fiscal years ending after December 15, 2009. The adoption of this standard did not result in significant changes to the Company’s financial statements.
In April 2009, the FASB issued ASC Topic 320-10-65 (formerly FSP 115-2 and SFAS No. 124-2, Recognition and Presentation of Other-Than-Temporary Impairments). This standard is intended to bring greater consistency to the timing of impairment recognition, and provide greater clarify to investors about the credit and noncredit components of impaired debt securities that are not expected to be sold. This standard also required increased and more timely disclosure regarding expected cash flows and is to be applied prospectively. The adoption of this ASC did not have a significant impact on the consolidated financial statements.
In May 2009, the FASB issued ASC Topic 855-10-25 (formerly FASB Statement 165, “Subsequent Events”). ASC 855-10-25 provides guidance on management’s assessment of subsequent events and incorporates this guidance into accounting literature. ASC 855-10-25 is effective prospectively for interim and annual periods ending after June 15, 2009. The implementation of this standard did not have a material impact on the Company’s financial position and results of operations. The Company has adopted this standard, evaluating for subsequent events to the date these financial statements were issued.
In June 2009, the FASB issued ASC Topic 860-10-05 (formerly SFAS No. 166, “Accounting for Transfers of Financial Assets”). This standard prescribes the information that a reporting entity must provide in its financial reports about a transfer of financial assets; the effects of a transfer on its financial position, financial performance and cash flows; and a transferor’s continuing involvement in transferred financial assets. ASC 860-10-05 is effective for transfers of financial assets occurring on or after January 1, 2010. The Company will consider this standard when evaluating future transactions to which it would apply. The Company has not had any material transfers of financial assets, and accordingly, the adoption of this standard did not have a significant impact on the consolidated financial statements.
In June 2009, the FASB issued ASC Topic 810 (formerly SFAS No. 167, “Amendments to FASB Interpretation No. 46(R)”). This accounting standard is a revision to a previous FASB Interpretation and changes how a reporting entity evaluates whether an entity is a VIE and which entity is considered the primary beneficiary of a VIE and is therefore required to consolidate the VIE. This accounting standard will also require continuous reassessments of which party within the VIE is considered the primary beneficiary and will require a number of new disclosures related to the VIE’s. ASC 810 became effective January 1, 2010. As a result of adopting this standard, the Company reassessed its investments and did not change its position as the primary beneficiaries of its VIEs.
In January 2010, the FASB issued Accounting Standards Update (“ASU”) No. 2010-06, “Improving Disclosures about Fair Value Measurements”, which amends ASC Topic 820, “Fair Value Measures and Disclosures”. ASU No. 2010-06 amends the ASC to require disclosure of transfers into and out of Level 1 and Level 2 fair value measurements, and also requires more detailed disclosure about the activity within Level 3 fair value measurements. The Company adopted the guidance in ASU No. 2010-06 on January 1, 2010, except for the requirements related to Level 3 disclosures, which become effective for annual and interim reporting periods beginning after December 15, 2010 (January 2, 2011 for the Company). The adopted guidance required expanded disclosures only, and did not have any impact on the Company’s consolidated financial statements.
| SUNOPTA INC. | -F14- | January 1, 2011 10-K |
| SunOpta Inc. |
| Notes to Consolidated Financial Statements |
| For the years ended January 1, 2011, December 31, 2009 and December 31, 2008 |
| (Expressed in thousands of U.S. dollars, except per share amounts) |
| 1. | Description of business and significant accounting policies, continued |
In December 2010, the FASB issued ASU No. 2010-28, “Intangibles – Goodwill and Other”. This ASU modifies the first step of the goodwill impairment test to include reporting units with zero or negative carrying amounts. For these reporting units, the second step of the goodwill impairment test shall be performed to measure the amount of impairment loss, if any, when it is more likely than not that a goodwill impairment exists. This ASU is effective for annual and interim reporting periods beginning after December 15, 2010 (January 2, 2011 for the Company). The Company has evaluated the ASU and does not believe it will have a material impact on the consolidated financial statements.
In December 2010, the FASB issued ASU No. 2010-29, “Business Combinations”. This ASU specifies that if a company presents comparative financial statements, the company should disclose revenue and earnings of the combined entity as though the business combination that occurred during the year had occurred as of the beginning of the comparable prior annual reporting period only. The ASU also expands the supplemental pro forma disclosures under ASC Topic 805 to include a description of the nature and amount of material, non-recurring pro-forma adjustments directly attributable to the business combination included in the pro-forma revenue and earnings. This ASU is effective prospectively for business combinations for which the acquisition date is on or after the beginning of the first annual reporting period beginning on or after December 15, 2010 (January 2, 2011 for the Company). The Company will consider this standard when evaluating future transactions to which it would apply.
| 2. | Business acquisitions |
During the year ended January 1, 2011, the Company completed two acquisitions. These acquisitions have been accounted for using the purchase method and the consolidated financial statements include the results of operations from these businesses from the date of acquisition. These business combinations are subject to post-closing adjustments, in accordance with the respective purchase and sale and asset purchase agreements, which are expected to be finalized by December 2011.
|
|
Dahlgren & Company, Inc. |
Edner of Nevada, Inc. |
Total | ||||||
|
Net assets acquired |
|||||||||
|
|
|||||||||
|
Cash |
4,239 | - | 4,239 | ||||||
|
Current assets |
23,231 | 2,376 | 25,607 | ||||||
|
Property, plant and equipment |
12,402 | 1,418 | 13,820 | ||||||
|
Goodwill |
15,940 | 2,730 | 18,670 | ||||||
|
Intangible assets |
11,013 | 1,823 | 12,836 | ||||||
|
Other assets |
624 | - | 624 | ||||||
|
Current liabilities |
(12,288 | ) | (449 | ) | (12,737 | ) | |||
|
Deferred income taxes |
(7,670 | ) | - | (7,670 | ) | ||||
|
|
47,491 | 7,898 | 55,389 | ||||||
|
|
|||||||||
|
Consideration |
|||||||||
|
|
|||||||||
|
Cash consideration |
44,000 | 4,000 | 48,000 | ||||||
|
Due to former shareholders |
2,303 | 458 | 2,761 | ||||||
|
Contingent consideration |
1,188 | 3,440 | 4,628 | ||||||
|
|
47,491 | 7,898 | 55,389 | ||||||
| SUNOPTA INC. | -F15- | January 1, 2011 10-K |
| SunOpta Inc. |
| Notes to Consolidated Financial Statements |
| For the years ended January 1, 2011, December 31, 2009 and December 31, 2008 |
| (Expressed in thousands of U.S. dollars, except per share amounts) |
| 2. | Business acquisitions, continued |
| (a) | Dahlgren & Company, Inc. |
On November 8, 2010, a wholly-owned subsidiary of the Company acquired 100% of the outstanding shares of Dahlgren & Company, Inc. (“Dahlgren”) for total consideration of $47,491. Included as part of the total consideration was cash of $44,000, contingent consideration of $1,188 based on future earnings targets as defined in the purchase and sale agreement, and a working capital adjustment of $2,303 (included in accounts payable and accrued liabilities) as a result of working capital exceeding pre-determined targets at the acquisition date. The $2,303 working capital adjustment was paid in cash on January 3, 2011 to the former Dahlgren shareholders. The Company incurred acquisition costs of $428, which were charged to other expense (income), net on the consolidated statement of operations for the year ended January 1, 2011.
Intangible assets, consisting of a sales order backlog and customer relationships, acquired in this acquisition are not deductible for tax purposes and are being amortized over their estimated useful lives between one and twelve years, respectively. Dahlgren is an integrated processor and global supplier of confection sunflower seed products including in-shell and kernel products, roasted sunflower and soy nuts, bird food, hybrid seed and other products; and serves the snack food, bakery, food ingredients and bird feed industries. Dahlgren’s products are marketed internationally to customers in Europe, Asia, Australia, Canada and South America, as well as in the United States. This acquisition has been consolidated since its November 8, 2010 acquisition date, and is included in the Grains and Foods Group.
| (b) | Edner of Nevada, Inc. |
On December 14, 2010, a wholly-owned subsidiary of the Company acquired the operating assets of Edner of Nevada, Inc. (“Edner”) for total consideration of $7,898. Consideration included $4,000 of cash, contingent consideration of $3,440 based on future revenue targets in the asset purchase agreement and a working capital adjustment of $458 as a result of working capital exceeding pre-determined targets at the acquisition date. The Company incurred acquisition costs of $119, which were charged to other expense (income), net on the consolidated statement of operations for the year ended January 1, 2011.
Intangible assets, consisting of customer relationships acquired in this acquisition are deductible for tax purposes and are being amortized over their estimated useful lives of approximately 9 years. Goodwill acquired in this acquisition is deductible for tax purposes. Edner produces a variety of nutritious portable foods such as nutrition bars and grains and fruit based snack bars from its 104,000 square foot facility located in Carson City, Nevada. This acquisition has been consolidated since its December 14, 2010 acquisition date, and is included in the Fruit Group.
| (c) | Pro forma data (unaudited) |
There were two acquisitions completed in the year ended January 1, 2011 (December 31, 2009 – nil). The following condensed pro- forma consolidated statements of operations reflects the acquisitions completed in 2010 as if they had occurred on January 1, 2009, and the acquisitions of TOC and MCP (completed on April 2, 2008 and July 9, 2008, respectively) as if it had occurred on January 1, 2008:
|
|
January 1, 2011 | December 31, 2009 | December 31, 2008 | ||||||
|
|
$ | $ | $ | ||||||
|
Pro-forma revenue |
979,751 | 904,241 | 910,121 | ||||||
|
Pro-forma earnings (loss) attributable to SunOpta Inc. |
66,000 | (7,561 | ) | (7,307 | ) | ||||
|
Pro-forma earnings (loss) per share |
|||||||||
|
Basic |
1.01 | (0.12 | ) | (0.11 | ) | ||||
|
Diluted |
1.00 | (0.12 | ) | (0.11 | ) |
| SUNOPTA INC. | -F16- | January 1, 2011 10-K |
| SunOpta Inc. |
| Notes to Consolidated Financial Statements |
| For the years ended January 1, 2011, December 31, 2009 and December 31, 2008 |
| (Expressed in thousands of U.S. dollars, except per share amounts) |
| 2. | Business acquisitions, continued |
| (d) | Contingent consideration |
During the year ended January 1, 2011, the Company and its less than wholly owned subsidiary recorded contingent consideration of $667 as an increase in goodwill relating to business acquisitions that occurred prior to January 1, 2009, based on these companies achieving predetermined earnings or other operational results as defined in the respective purchase and sale agreements.
|
|
Contingent |
|
|
consideration |
|
|
recorded in 2010 |
|
|
$ |
|
Business acquisition: |
|
|
Bimac Corporation |
477 |
|
Sigco Sun Products Inc. |
190 |
|
|
667 |
As a result of acquisitions during the year ended January 1, 2011, contingent consideration of an estimated amount of $4,628 is included in current portion of long-term liabilities and long-term liabilities on the consolidated balance sheet. Future amounts paid that vary from this estimate will be recorded as a charge or credit to the consolidated statement of operations.
Additional contingent consideration of up to $4,000 may be payable to Purity Life Health Products Ltd., acquired in September 2006, based on achieving pre-determined annual earnings targets through December 31, 2011. The amounts will be recorded once the contingencies are resolved, and the amounts become payable.
| 3. | Discontinued operations |
| (a) | Divestiture of Canadian Food Distribution Business |
On May 10, 2010, the Company entered into an agreement to sell its Canadian Food Distribution assets (“CFD” or the “CFD Transaction”) to UNFI Canada Inc., a wholly-owned subsidiary of United Natural Foods Inc. The CFD Transaction closed on June 11, 2010 for cash consideration of Cdn $68,000 (U.S. - $65,809). The net proceeds are subject to post closing adjustments, in accordance with the asset purchase agreement, which are expected to be finalized by June 2011.
The following is a summary of the CFD Transaction:
|
Cash consideration |
$ | 65,809 | |
|
Transaction and related costs |
(4,937 | ) | |
|
Net proceeds |
60,872 | ||
|
Net assets sold |
(51,655 | ) | |
|
Accumulated other comprehensive income related to assets sold |
7,772 | ||
|
Pre-tax gain on sale |
16,989 | ||
|
Provision for income taxes |
(4,193 | ) | |
|
Gain on sale of discontinued operations |
$ | 12,796 |
The gain on sale of discontinued operations has been recorded in discontinued operations on the consolidated statements of operations.
| SUNOPTA INC. | -F17- | January 1, 2011 10-K |
| SunOpta Inc. |
| Notes to Consolidated Financial Statements |
| For the years ended January 1, 2011, December 31, 2009 and December 31, 2008 |
| (Expressed in thousands of U.S. dollars, except per share amounts) |
| 3. | Discontinued operations, continued |
The operating results of the CFD business are included within (loss) earnings from discontinued operations, net of income tax, on the consolidated statement of operations. The operating results for the year ended January 1, 2011 reflect the operating results from January 1, 2010 through to the date of the sale, June 11, 2010. The summary comparative financial results of discontinued operations related to the CFD business were as follows:
|
|
January 1, 2011 | December 31, 2009 | December 31, 2008 | ||||||
|
|
|||||||||
|
Revenues |
82,859 | 169,573 | 179,293 | ||||||
|
|
|||||||||
|
Earnings before taxes from
discontinued |
2,168 |
4,524 |
7,681 |
||||||
|
Costs allocated to
discontinued |
(1,289 |
) |
- |
- |
|||||
|
Earnings from
discontinued |
879 |
4,524 |
7,681 |
||||||
|
Provision for income taxes |
265 | 1,439 | 2,489 | ||||||
|
|
614 | 3,085 | 5,192 |
The assets sold in the CFD Transaction were part of the former Distribution Group segment.
| (b) | Divestiture of SunOpta BioProcess Inc. |
On August 31, 2010, the Company completed a transaction to sell its ownership interest in SunOpta BioProcess Inc. (“SBI” or the “SBI Transaction”) to Mascoma Canada Inc., a wholly-owned subsidiary of Mascoma Corporation (“Mascoma”). As consideration for selling all the outstanding common shares of SBI, the Company received non-cash consideration through a combination of preferred and common shares, as well as warrants, valued at $50,925. The non-cash consideration includes 11,268,868 series D preferred shares, 3,756,290 common shares and 1,000,000 warrants to purchase common shares of Mascoma. In conjunction with the sale, the Company settled the preferred share liability of SBI with the former SBI preferred shareholders, through the transfer of 4,688,000 of the series D preferred shares received. In addition, as a result of the change in control of SBI, the vesting of previously issued SBI stock options were accelerated, and the 800,000 restricted stock units (“RSU”) were settled in cash at a value of $4.49 per RSU. The fair value of consideration received, net of the settlement to the former SBI preferred shareholders, resulted in a $33,345 investment in Mascoma, which is presented as a non-current asset on the Company’s balance sheet. The investment in Mascoma will be accounted for under the cost method of accounting, based on the 19.61% ownership interest taken back, and the inability of the Company to exert significant influence over the operations of Mascoma. This transaction is subject to post closing adjustments, in accordance with the share purchase agreement, which are expected to be finalized by August 2011. At January 1, 2011, the Company’s ownership interest remained at 19.61% .
The following is a summary of the SBI Transaction:
|
Net fair value assigned to non-cash consideration applicable to SunOpta Inc. |
$ | 33,345 | |
|
Transaction and related costs |
(3,205 | ) | |
|
Net liabilities sold |
11,376 | ||
|
Release of additional paid in capital recorded from
accelerated vesting of |
11,025 |
||
|
Pre-tax gain on sale |
52,541 | ||
|
Provision for income taxes |
(2,387 | ) | |
|
Gain on sale of discontinued operations |
$ | 50,154 |
| SUNOPTA INC. | -F18- | January 1, 2011 10-K |
| SunOpta Inc. |
| Notes to Consolidated Financial Statements |
| For the years ended January 1, 2011, December 31, 2009 and December 31, 2008 |
| (Expressed in thousands of U.S. dollars, except per share amounts) |
| 3. | Discontinued operations, continued |
The gain on sale of discontinued operations has been recorded in discontinued operations on the consolidated statements of operations.
The operating results of SBI are included within (loss) earnings from discontinued operations, net of income tax, on the consolidated statement of operations. The operating results for the year ended January 1, 2011, reflect the operating results through to the date of sale, August 31, 2010. The summary comparative financial results of discontinued operations related to SBI were as follows:
|
|
January 1, 2011 | December 31, 2009 | December 31, 2008 | ||||||
|
|
|||||||||
|
Revenues |
4,005 | 519 | 1,435 | ||||||
|
|
|||||||||
|
Loss before taxes from
discontinued |
(14,916 |
) |
(3,358 |
) |
(4,229 |
) | |||
|
Costs allocated to
discontinued |
(267 |
) |
- |
- |
|||||
|
Loss from
discontinued |
(15,183 |
) |
(3,358 |
) |
(4,229 |
) | |||
|
Provision for income taxes |
- | - | - | ||||||
|
|
(15,183 | ) | (3,358 | ) | (4,229 | ) |
Included in loss before income taxes from discontinued operations up to the date of sale is $15,280 of stock-based and other compensation rewards that were triggered upon the change in control of SBI.
The business sold represented the former SunOpta BioProcess segment.
| SUNOPTA INC. | -F19- | January 1, 2011 10-K |
| SunOpta Inc. |
| Notes to Consolidated Financial Statements |
| For the years ended January 1, 2011, December 31, 2009 and December 31, 2008 |
| (Expressed in thousands of U.S. dollars, except per share amounts) |
| 3. | Discontinued operations, continued |
| (c) | Summary of assets held for sale |
The assets and liabilities related to the CFD Transaction and SBI Transaction have been reclassified as assets and liabilities held for sale on the Company's balance sheet at December 31, 2009, as follows:
|
|
CFD Transaction | SBI Transaction | Held for Sale | ||||||
|
|
$ | $ | $ | ||||||
|
|
|||||||||
|
Cash and cash equivalents |
17 | 18,954 | 18,971 | ||||||
|
Accounts receivable |
15,451 | 307 | 15,758 | ||||||
|
Inventories |
20,593 | 6 | 20,599 | ||||||
|
Prepaid expenses and other current assets |
713 | 99 | 812 | ||||||
|
Current assets held for sale |
36,774 | 19,366 | 56,140 | ||||||
|
|
|||||||||
|
Property, plant and equipment |
7,196 | 1,872 | 9,068 | ||||||
|
Goodwill |
18,286 | - | 18,286 | ||||||
|
Intangible assets |
5,344 | 422 | 5,766 | ||||||
|
Non-current assets held for sale |
30,826 | 2,294 | 33,120 | ||||||
|
|
|||||||||
|
Accounts payable and accrued liabilities |
17,852 | 882 | 18,734 | ||||||
|
Customer and other deposits |
23 | 349 | 372 | ||||||
|
Current portion of long-term liabilities |
29 | - | 29 | ||||||
|
Current liabilities held for sale |
17,904 | 1,231 | 19,135 | ||||||
|
|
|||||||||
|
Long-term liabilities |
487 | - | 487 | ||||||
|
Non-current liabilities held for sale |
487 | - | 487 | ||||||
|
|
|||||||||
|
Preferred shares of a subsidiary company held for sale |
- | 28,187 | 28,187 | ||||||
|
Preferred shares of a subsidiary company held for sale |
- | 28,187 | 28,187 |
Included in current assets held for sale at December 31, 2009 are cash and cash equivalents related to SBI of $18,954 that could not be used by the Company for general corporate purposes, and was maintained in separate bank accounts of SBI.
Pursuant to the terms of the agreements governing the CFD Transaction and the SBI Transaction, the Company agreed to indemnify the purchasers for losses incurred due to breaches of specified representations, warranties and covenants and for certain other matters, subject to the limitations set forth in those agreements. With respect to the SBI Transaction, in support of the Company's indemnification obligations, certain of the shares of common stock and preferred stock of Mascoma issued to the Company in connection with the SBI Transaction are being held in escrow to satisfy any indemnification claims made by Mascoma following the closing. If UNFI, Mascoma or their respective affiliates make indemnification claims against the Company and are successful in those indemnification claims, the Company may become liable for money damages to the indemnified parties, or it may lose its rights to the Mascoma shares (with respect to the SBI Transaction).
| 4. | Accounts receivable |
|
|
January 1, 2011 | December 31, 2009 | ||||
|
|
$ | $ | ||||
|
Trade receivables |
100,434 | 80,436 | ||||
|
Allowance for doubtful accounts |
(1,559 | ) | (1,953 | ) | ||
|
|
98,875 | 78,483 |
The change in the allowance for doubtful accounts provision for the years ended January 1, 2011 and December 31, 2009 is comprised as follows:
| SUNOPTA INC. | -F20- | January 1, 2011 10-K |
| SunOpta Inc. |
| Notes to Consolidated Financial Statements |
| For the years ended January 1, 2011, December 31, 2009 and December 31, 2008 |
| (Expressed in thousands of U.S. dollars, except per share amounts) |
| 4. | Accounts receivable, continued |
|
|
January 1, 2011 | December 31, 2009 | ||||
|
|
$ | $ | ||||
|
Balance, beginning of year |
1,953 | 1,304 | ||||
|
Net additions to provision |
985 | 737 | ||||
|
Effects of foreign exchange rate differences |
(198 | ) | 33 | |||
|
Accounts receivable written off, net of recoveries |
(1,181 | ) | (121 | ) | ||
|
Balance, end of year |
1,559 | 1,953 |
| 5. | Inventories |
|
|
January 1, 2011 | December 31, 2009 | ||||
|
|
$ | $ | ||||
|
Raw materials and work-in-process |
98,140 | 64,393 | ||||
|
Finished goods |
84,529 | 87,497 | ||||
|
Company-owned grain |
21,897 | 13,791 | ||||
|
Inventory reserve |
(4,288 | ) | (9,799 | ) | ||
|
|
200,278 | 155,882 |
The change in the inventory reserve for the years ended January 1, 2011 and December 31, 2009 is comprised as follows:
|
|
January 1, 2011 | December 31, 2009 | ||||
|
|
$ | $ | ||||
|
Balance, beginning of year |
9,799 | 9,558 | ||||
|
Additions to reserve during the year |
2,570 | 6,684 | ||||
|
Reserves applied and inventories written off during the year |
(8,062 | ) | (6,604 | ) | ||
|
Effect of foreign exchange rate differences |
(19 | ) | 161 | |||
|
Balance, end of year |
4,288 | 9,799 |
| 6. | Property, plant and equipment |
|
|
January 1, 2011 | ||||||||
|
|
Accumulated | ||||||||
|
|
Cost | Amortization | Net Book Value | ||||||
|
|
$ | $ | $ | ||||||
|
Land |
5,436 | - | 5,436 | ||||||
|
Buildings |
45,345 | 10,036 | 35,309 | ||||||
|
Machinery and equipment |
133,244 | 59,135 | 74,109 | ||||||
|
Enterprise software |
6,862 | 5,083 | 1,779 | ||||||
|
Office furniture and equipment |
7,100 | 5,082 | 2,018 | ||||||
|
Vehicles |
4,997 | 3,593 | 1,404 | ||||||
|
|
202,984 | 82,929 | 120,055 |
| SUNOPTA INC. | -F21- | January 1, 2011 10-K |
| SunOpta Inc. |
| Notes to Consolidated Financial Statements |
| For the years ended January 1, 2011, December 31, 2009 and December 31, 2008 |
| (Expressed in thousands of U.S. dollars, except per share amounts) |
| 6. | Property, plant and equipment, continued |
|
|
December 31, 2009 | ||||||||
|
|
Accumulated | ||||||||
|
|
Cost | Amortization | Net Book Value | ||||||
|
|
$ | $ | $ | ||||||
|
Land |
4,704 | - | 4,704 | ||||||
|
Buildings |
43,789 | 10,431 | 33,358 | ||||||
|
Machinery and equipment |
112,612 | 50,925 | 61,687 | ||||||
|
Enterprise software |
6,109 | 4,110 | 1,999 | ||||||
|
Office furniture and equipment |
6,357 | 4,711 | 1,646 | ||||||
|
Vehicles |
5,331 | 3,505 | 1,826 | ||||||
|
|
178,902 | 73,682 | 105,220 | ||||||
Included in machinery and equipment at January 1, 2011 is $4,281 (December 31, 2009 - $4,020) representing construction in process assets which were not being depreciated as they had not yet reached the stage of commercial viability. Also included in machinery and equipment is equipment under capital leases with a cost of $431 (December 31, 2009 - $479) and a net book value of $172 (December 31, 2009 - $208). In addition, machinery and equipment includes $2,477 (December 31, 2009 - $1,659) of spare parts inventory.
Total amortization expense included in cost of sales and selling, general and administrative expense on the consolidated statements of operations related to property, plant and equipment for the year ended January 1, 2011 was $13,184 (December 31, 2009 - $12,382, December 31, 2008 - $12,434).
| 7. | Goodwill and intangible assets |
|
|
January 1, 2011 | December 31, 2009 | ||||
|
|
$ | $ | ||||
|
|
||||||
|
Goodwill |
48,558 | 31,431 | ||||
|
|
||||||
|
Intangible assets with a finite life at
cost, less accumulated |
60,200 |
55,229 |
The following is a summary of changes in goodwill:
|
|
$ | ||
|
Balance at December 31, 2008 |
38,426 | ||
|
Additions during the year |
1,140 | ||
|
Goodwill impairment |
(8,841 | ) | |
|
Impact of foreign exchange |
706 | ||
|
Balance at December 31, 2009 |
31,431 | ||
|
|
|||
|
Acquisitions during the year |
18,670 | ||
|
Additions during the year |
667 | ||
|
Goodwill impairment |
(1,654 | ) | |
|
Impact of foreign exchange |
(556 | ) | |
|
Balance at January 1, 2011 |
48,558 |
| SUNOPTA INC. | -F22- | January 1, 2011 10-K |
| SunOpta Inc. |
| Notes to Consolidated Financial Statements |
| For the years ended January 1, 2011, December 31, 2009 and December 31, 2008 |
| (Expressed in thousands of U.S. dollars, except per share amounts) |
| 7. | Goodwill and intangible assets, continued |
The result of the annual goodwill impairment test for the year ended January 1, 2011 indicated that the fair value of the Grains and Foods Group, Ingredients Group and International Foods Group exceeded their carrying values, and as a result, no impairment was recorded.
During the quarter ended October 2, 2010, the Company determined that there were external market conditions and other circumstances that suggested the carrying value of the natural health products reporting unit, which is part of the International Foods segment, may exceed its fair value. These external market conditions and other circumstances included reduced sales levels, increased competition leading to price concessions and decreased market share, shift in product mix causing lower gross margins, and product de-listing at certain retailers. As a result of completing the test for goodwill impairment, the Company determined that the carrying value of goodwill in its natural health reporting unit exceeded its fair value, and recorded a non-cash goodwill impairment charge of $1,654.
The fair values calculated in these impairment tests are determined using discounted cash flow models involving various assumptions. The following table summarizes the critical assumptions that were used in estimating fair value for the natural health product reporting unit, for which goodwill was determined to be impaired in the quarter ended October 2, 2010:
|
|
|
|
Estimated cumulative average operating income growth (2011 - 2015) |
47.4% |
|
Projected long-term annual operating income growth (a) |
2.5% |
|
Weighted average discount rate (b) |
15.0% |
(a) Represents the operating income growth rate used to
determine terminal value.
(b) Represents the targeted weighted average
discount rate of 11% plus the impact of a specific reporting unit risk premium
to account for the estimated additional uncertainty associated with future cash
flows.
The result of the annual goodwill impairment test for the year ended December 31, 2009 indicated that the fair value of the Grains and Foods Group, the Ingredients Group and the International Foods Group exceeded their carrying values, and as a result, no impairment charge was recorded. After recording a $500 increase to goodwill as a result of contingent consideration earned at December 31, 2009, the Company tested the Fruit Group and determined that its carrying value exceeded its fair value. As a result, the $500 of goodwill added in 2009 was reduced to $nil through a charge to goodwill impairment.
During the quarter ended September 30, 2009, Opta Minerals determined that there were external market conditions and other circumstances that suggested the carrying value of certain reporting units in Opta Minerals may exceed their fair value. These external market conditions and other circumstances included continued operating losses and extended periods of facility under-utilization due to continued weakness in the steel, abrasives and foundry markets. As a result of completing a test for goodwill impairment, Opta Minerals determined that the carrying value of goodwill in certain of its mill and foundry and abrasive products reporting units exceeded their fair value, and recorded a non-cash impairment charge of $8,341. The Company recorded this charge in its Opta Minerals operating segment.
The following table summarizes the critical assumptions that were used in estimating fair value in the 2009 impairment tests for segments where an impairment was determined:
|
|
|
|
Estimated cumulative average operating income growth (2010 - 2014) |
5.0% |
|
Projected long-term annual operating income growth (a) |
2.0% - 7.0% |
|
Weighted average discount rate (b) |
15.0% |
(a) Represents the operating income growth rate used to
determine terminal value.
(b) Represents the targeted weighted average
discount rate of 9.9% plus the impact of a specific reporting unit risk premium
to account for the estimated additional uncertainty associated with future cash
flows.
| SUNOPTA INC. | -F23- | January 1, 2011 10-K |
| SunOpta Inc. |
| Notes to Consolidated Financial Statements |
| For the years ended January 1, 2011, December 31, 2009 and December 31, 2008 |
| (Expressed in thousands of U.S. dollars, except per share amounts) |
| 7. | Goodwill and intangible assets, continued |
The following is a summary of changes in intangible assets:
|
|
Customer and other | Patents and | ||||||||||
|
|
relationships | trademarks | Other | Total | ||||||||
|
|
$ | $ | $ | $ | ||||||||
|
|
||||||||||||
|
Balance at December 31, 2008 |
50,660 | 5,373 | 1,274 | 57,307 | ||||||||
|
Net additions |
- | 216 | 812 | 1,028 | ||||||||
|
Amortization |
(3,734 | ) | (633 | ) | (281 | ) | (4,648 | ) | ||||
|
Impact of foreign exchange |
607 | 664 | 271 | 1,542 | ||||||||
|
Balance at December 31, 2009 |
47,533 | 5,620 | 2,076 | 55,229 | ||||||||
|
|
||||||||||||
|
Business acquisitions |
12,592 | - | 244 | 12,836 | ||||||||
|
Net additions |
- | 101 | 561 | 662 | ||||||||
|
Impairments |
(2,808 | ) | (135 | ) | (24 | ) | (2,967 | ) | ||||
|
Amortization |
(3,642 | ) | (662 | ) | (371 | ) | (4,675 | ) | ||||
|
Impact of foreign exchange |
(1,316 | ) | 230 | 201 | (885 | ) | ||||||
|
Balance at January 1, 2011 |
52,359 | 5,154 | 2,687 | 60,200 |
For further information on the $2,967 impairments noted above, refer to note 18.
The Company estimates that the aggregate future amortization expense associated with finite-life intangible assets will be as follows:
|
|
$ | ||
|
2011 |
5,617 | ||
|
2012 |
5,248 | ||
|
2013 |
5,133 | ||
|
2014 |
4,921 | ||
|
2015 |
4,631 | ||
|
Thereafter |
34,650 | ||
|
|
60,200 |
| 8. | Accounts payable and accrued liabilities |
|
|
January 1, 2011 | December 31, 2009 | ||||
|
|
$ | $ | ||||
|
|
||||||
|
Accounts payable |
75,959 | 54,287 | ||||
|
Payroll and commissions |
14,782 | 13,996 | ||||
|
Accrued grain liabilities |
20,467 | 9,386 | ||||
|
Other accruals |
12,823 | 9,850 | ||||
|
|
124,031 | 87,519 |
| SUNOPTA INC. | -F24- | January 1, 2011 10-K |
| SunOpta Inc. |
| Notes to Consolidated Financial Statements |
| For the years ended January 1, 2011, December 31, 2009 and December 31, 2008 |
| (Expressed in thousands of U.S. dollars, except per share amounts) |
| 9. | Bank indebtedness |
|
|
January 1, 2011 | December 31, 2009 | ||||
|
|
$ | $ | ||||
|
Canadian line of credit facility (a) |
- | - | ||||
|
U.S. line of credit facility (b) |
41,790 | 44,130 | ||||
|
Opta Minerals Canadian line of credit facility (c) |
3,546 | 3,355 | ||||
|
TOC line of credit facilities (d) |
30,574 | 15,996 | ||||
|
|
75,910 | 63,481 |
On December 20, 2010, the Company completed amendments to its syndicated banking facilities. With respect to the line of credit facilities, availability under the Canadian line of credit has been reduced from Cdn $20,000 to Cdn $5,000 to reflect the sale of the Canadian Food Distribution assets (see note 3), and availability under the U.S. line of credit increased from $80,000 to $100,000 to reflect the concentration of syndicate operations currently located in the United States. The amendments to the line of credit facilities also decreases standby fees on unused availability, increases available letters of credit, and includes an accordion feature for up to an additional $30,000 of total availability under the Canadian and U.S. lines of credit to support internal growth and acquisitions, subject to credit approval by the existing syndicated lenders, or new lenders. Interest spreads and the maturity date of the lines of credit did not change.
| (a) | Canadian line of credit facility: |
The Company has a Canadian line of credit of Cdn $5,000 (U.S. – $5,027). As at January 1, 2011, nil (December 31, 2009 - nil) of this facility was utilized, and there were no amounts committed through letters of credit. Interest on borrowings under this facility accrues at the borrower’s option based on various reference rates including Canadian or U.S. bank prime, or Canadian bankers’ acceptances, plus a margin based on certain financial ratios. At January 1, 2011, the interest rate on this facility was 5.00% (December 31, 2009 – 4.75%), calculated as Canadian prime plus a premium of 2.00% . The maximum availability of this line is based on a borrowing base which includes certain accounts receivables and inventories of the Company’s Canadian business as defined in the Credit Agreement. At January 1, 2011, the borrowing base supported draws to $5,027. At January 1, 2011, 0.50% of undrawn balances on this facility are charged to the Company as standby fees, based on the Credit Agreement.
| (b) | U.S. line of credit facility: |
The Company has a U.S. line of credit of $100,000. As at January 1, 2011, $44,254 (December 31, 2009 - $45,754) of this facility was utilized, representing $2,464 (December 31, 2009 - $1,624) committed through letters of credit. During the second quarter of 2010, cash proceeds from the sale of the Canadian Food Distribution assets (see note 3), were used to repay the outstanding balance, and in the fourth quarter of 2010, the acquisition of Dahlgren and Edner (see note 2) increased borrowings on the line. Interest on borrowings under this facility accrues at the borrower’s option based on various reference rates including U.S. bank prime, or U.S. LIBOR, plus a margin based on certain financial ratios. At January 1, 2011, the weighted average interest rate on this facility was 3.26% (December 31, 2009 – 3.73%), based on LIBOR plus a premium of 3.00% . The maximum availability of this line is based on the borrowing base which includes certain accounts receivables and inventories of the Company’s U.S. business as defined in the Credit Agreement. At January 1, 2011, the borrowing base supported draws to $90,927. At January 1, 2011, 0.50% of undrawn balances on this facility are charged to the Company as standby fees, based on the Credit Agreement.
The Canadian and U.S. line of credit facilities above, as well as certain long-term debt balances (see note 10) are collateralized by a first priority security against substantially all of the Company’s assets in Canada, the United States and Mexico, excluding the assets of Opta Minerals and The Organic Corporation. The Canadian and U.S. line of credit facilities mature on October 30, 2012.
The Company has certain financial covenants that it is measured against on a quarterly basis. See note 10 for a discussion of the Company’s compliance with respect to these covenants.
| SUNOPTA INC. | -F25- | January 1, 2011 10-K |
| SunOpta Inc. |
| Notes to Consolidated Financial Statements |
| For the years ended January 1, 2011, December 31, 2009 and December 31, 2008 |
| (Expressed in thousands of U.S. dollars, except per share amounts) |
| 9. | Bank indebtedness, continued |
| (c) | Opta Minerals Canadian line of credit facility: |
Opta Minerals has a line of credit facility of Cdn $15,000 (U.S. – $14,997). At December 31, 2010, Cdn $4,713 (U.S. - $4,712) ((December 31, 2009 - Cdn $4,686 (U.S. – $4,459)) of this facility has been utilized, including letters of credit in the amount of Cdn $1,166 (U.S. - $1,166) (December 31, 2009 - Cdn $1,160 (U.S. – $1,104)). Interest on borrowings under this facility accrues at the borrower’s option based on various reference rates including prime, U.S. dollar base rate, bankers’ acceptances or LIBOR plus a margin based on certain financial ratios of the Company. At December 31, 2010, the weighted average interest rate on this facility was 6.93% (December 31, 2009 – 7.50%).
Opta Minerals’ line of credit facility, along with its unused portion of the revolving acquisition facility (note 10(c)), is subject to annual extensions, and were extended on July 15, 2010 to August 16, 2011.
| (d) | TOC line of credit facilities: |
The Organic Corporation (“TOC”) has a line of credit facility of €30,000 (U.S. - $40,173). At January 1, 2011, €22,589 (U.S. - $30,249) (December 31, 2009 - €12,746 (U.S. – $18,247)) of this facility had been utilized, including letters of credit in the amount of €181 (U.S. – $243) (December 31, 2009 - €2,119 (U.S. – $3,034)). Interest on borrowings under this facility accrues at the borrower’s option based on various reference rates including U.S. LIBOR and Euro LIBOR plus a premium of 1.85% . At January 1, 2011, the weighted average interest rate on this facility was 2.62% . The maximum availability of this line is based on a borrowing base which includes certain accounts receivables and inventories of TOC and its subsidiaries. At January 1, 2011, the borrowing base securing this facility supported draws to €22,938 (U.S. – $30,716) (December 31, 2009 - €17,019 (U.S. – $24,364)).
As at January 1, 2011, TOC was in compliance with its financial covenant that relates to the €30,000 line of credit.
A less-than-wholly owned subsidiary of TOC has line of credit facilities with availability of $1,297 (December 31, 2009 - $1,394) which are fully guaranteed by TOC. As at January 1, 2011, $568 (December 31, 2009 - $783) of these facilities had been used. Interest on borrowings under these facilities accrues at either a base rate of 0.4% plus a premium of 6.00%, or a fixed rate of 9.75% . At January 1, 2011, the weighted average interest rate on these facilities was 9.8% (December 31, 2009 -8.6%) and TOC is in compliance with all material requirements under this facility.
| 10. | Long-term debt |
|
|
January 1, 2011 | December 31, 2009 | ||||
|
|
||||||
|
Syndicated Lending Agreement: |
||||||
|
Term loan facility (a) |
- | 45,000 | ||||
|
Non-revolving real estate term facility (b) |
13,000 | - | ||||
|
Non-revolving machinery and equipment term facility (c) |
17,000 | - | ||||
|
|
||||||
|
Other Long-Term Debt: |
||||||
|
Opta Minerals term loan facility (d) |
7,766 | 8,830 | ||||
|
Opta Minerals revolving acquisition facility (e) |
11,419 | 12,362 | ||||
|
Subordinated debt to former shareholders of TOC (f) |
4,569 | 4,944 | ||||
|
Promissory notes (g) |
10,840 | 15,504 | ||||
|
Other long-term debt (h) |
264 | 380 | ||||
|
Term loans payable and capital lease obligations (i) |
124 | 169 | ||||
|
|
64,982 | 87,189 | ||||
|
Less: current portion |
22,247 | 52,455 | ||||
|
|
42,735 | 34,734 |
| SUNOPTA INC. | -F26- | January 1, 2011 10-K |
| SunOpta Inc. |
| Notes to Consolidated Financial Statements |
| For the years ended January 1, 2011, December 31, 2009 and December 31, 2008 |
| (Expressed in thousands of U.S. dollars, except per share amounts) |
| 10. | Long-term debt, continued |
On December 20, 2010, the Company completed amendments to its syndicated banking facilities. With respect to long-term debt, $33,716 was repaid to fully settle the term loan facility immediately prior to the amendments. The Company then borrowed $30,000 in the form of two non-revolving term facilities of $13,000 and $17,000, respectively. The amendments include a decrease in the interest rate premium charged on the facilities, a reduction in standby fees on unused funds, and a renewal date of October 30, 2012, which is consistent with the Canadian and U.S. line of credit facilities (note 9(a) and (b)).
Details of the Company’s long-term debt are as follows:
| (a) | Term loan facility: |
At January 1, 2011 the term loan facility was eliminated (December 31, 2009 - $45,000), after being refinanced on its December 20, 2010 maturity date into two non-revolving term facilities (see (b) and (c)). Interest on the term loan facility was payable at a fixed rate of 6.44% plus a margin of up to 360 basis points based on certain financial ratios of the Company. Prior to the refinancing, and as a result of the sale of the Canadian Food Distribution assets (see note 3), $11,284 was repaid on July 16, 2010 in accordance with the terms of the loan agreement.
| (b) | Non-revolving real estate term facility: |
The non-revolving real estate term facility has a maximum available borrowing amount of $13,000. This facility matures on October 31, 2012, is renewable at the option of the lender and the Company as at October 31, 2012, and has quarterly minimum repayments of approximately $217. At January 1, 2011, the term loan facility was fully drawn, and the weighted average interest rate on this facility was 3.76%, based on the level of borrowings, and a credit spread based on either U.S. prime or LIBOR rates.
| (c) | Non-revolving machinery and equipment term facility: |
The non-revolving machinery and equipment term facility has a maximum available borrowing amount of $17,000. This facility matures on October 31, 2012, is renewable at the option of the lender and the Company as at October 31, 2012, and has quarterly minimum repayments of approximately $850. At January 1, 2011, the term loan facility was fully drawn, and the weighted average interest rate on this facility was 3.76%, based on the level of borrowings, and a credit spread based on either U.S. prime or LIBOR rates.
The above term loan facilities, and the Canadian and U.S. line of credit facilities (see note 9 (a) and (b)), are collateralized by a first priority security against substantially all of the Company’s assets in Canada, the United States and Mexico, excluding the assets of Opta Minerals and TOC.
| (d) | Opta Minerals term loan facility: |
The term loan facility has a maximum available borrowing amount of Cdn $7,768 (U.S. - $7,766). This facility matures on August 30, 2012, is renewable at the option of the lender and Opta Minerals, and has quarterly principal repayments of Cdn $312 (U.S. - $312). At December 31, 2010, the term loan facility was fully drawn (2009 - $9,280 (U.S. - $8,830)). At December 31, 2010, the weighted average interest rate on this facility was 7.61% (December 31, 2009 – 7.50%).
| (e) | Opta Minerals revolving acquisition facility: |
The revolving acquisition facility has a maximum available borrowing amount of Cdn $14,043 (U.S. - $14,040) to finance future acquisitions and capital expenditures. Principal is payable quarterly equal to 1/40 of the drawdown amount. Any remaining outstanding principal under this facility is due upon maturity. The facility is revolving for one year, with a five year term out option. The outstanding balance on the revolving acquisition facility at December 31, 2010 was Cdn $11,421 (U.S. - $11,419) (2009 – Cdn $12,992 (U.S. - $12,362)). At December 31, 2010, the weighted average interest rate on this facility was 7.05% (2009 - 6.99%).
| SUNOPTA INC. | -F27- | January 1, 2011 10-K |
| SunOpta Inc. |
| Notes to Consolidated Financial Statements |
| For the years ended January 1, 2011, December 31, 2009 and December 31, 2008 |
| (Expressed in thousands of U.S. dollars, except per share amounts) |
| 10. | Long-term debt, continued |
The Opta Minerals’ credit facilities described above are collateralized by a first priority security against substantially all of the Opta Minerals assets in both Canada and the United States.
Opta Minerals entered into a cash flow hedge in 2007. The cash flow hedge entered into exchanged a notional amount of Cdn $17,200 (U.S. - $17,293) from a floating rate to a fixed rate of 5.25% from August 2008 to August 2012. The estimated fair value of the interest rate swap at December 31, 2010 was a loss of $891 (December 31, 2009 - loss of $1,387). The incremental gain in fair value of $496, net of income taxes of $145, has been recorded in other comprehensive loss for the period. The fair value liability is included in long-term liabilities on the consolidated balance sheets.
| (f) | Subordinated debt to former shareholders of TOC: |
In conjunction with the acquisition of TOC on April 2, 2008, its former shareholders provided a subordinated loan to TOC in the amount of €3,000 (U.S. - $4,017). The loan bears interest at 7% payable to the former shareholders on a semi-annual basis. The subordinated loan, as well as €453 (U.S. - $552) previously loaned to TOC, is repayable in full on March 31, 2011.
| (g) | Promissory Notes: |
Promissory notes consist of notes issued to former shareholders as a result of business acquisitions. As consideration in the acquisition of TOC, the Company issued a total of €9,000 (U.S. - $12,052) in promissory notes which are secured by a pledge of the common shares of TOC. Of the €9,000 (U.S. - $12,052) issued, €1,000 (U.S. - $1,436) was paid in cash on April 5, 2010, with the remaining €8,000 (U.S. - $10,713) due March 31, 2011. Due to TOC’s opening balance sheet not meeting pre-determined working capital targets, and an undisclosed liability that existed prior to the Company’s April 2, 2008 acquisition, €528 (U.S. - $707) of the promissory notes due March 31, 2011 will not be paid. Accordingly, the balance of the promissory notes at January 1, 2011 was €7,472 (U.S. - $10,006).
In addition, $834 remains owing to various former shareholders at a weighted average interest of 5.45% . Of the $10,840 in total promissory notes, $10,521 are due in the next 12 months, with the remaining balances due in varying installments through 2012.
| (h) | Other long-term debt: |
A less-than-wholly owned subsidiary of TOC has a maximum borrowing amount of 6,500 Ethiopia Birr (“ETB”) (U.S. - $453). The outstanding balance at January 1, 2011, was $264 (December 31, 2009 - $380). At January 1, 2011, the weighted average interest rate on borrowed funds was 10.3% (December 31, 2009 - 10.1%).
| (i) | Term loans payable and capital lease obligations: |
Term loans payable bear a weighted average interest rate of 5.3% (December 31, 2009 – 5.3%) due in varying installments through 2013 with principal payments of $14 due in the next 12 months.
Capital lease obligations are due in monthly payments, with a weighted average interest rate of 6.9% (December 31, 2009 – 7.1%).
| SUNOPTA INC. | -F28- | January 1, 2011 10-K |
| SunOpta Inc. |
| Notes to Consolidated Financial Statements |
| For the years ended January 1, 2011, December 31, 2009 and December 31, 2008 |
| (Expressed in thousands of U.S. dollars, except per share amounts) |
| 10. | Long-term debt, continued |
The long-term debt and capital leases described above have required repayment terms in the next five years ending as follows:
|
|
$ | ||
|
December 31, 2011 |
22,247 | ||
|
December 29, 2012 |
29,236 | ||
|
December 28, 2013 |
2,862 | ||
|
January 3, 2015 |
2,849 | ||
|
January 2, 2016 |
2,849 | ||
|
Thereafter |
4,939 | ||
|
|
64,982 |
Interest expense on long-term debt for the year ended January 1, 2011 was $5,438 (December 31, 2009 - $7,047, December 31, 2008 - $8,146). Interest on short-term borrowings and other debt was $4,294 (December 31, 2009 - $6,087, December 31, 2008 - $6,476).
Interest expense and interest income include:
|
|
January 1, 2011 | December 31, 2009 | December 31, 2008 | ||||||
|
|
$ | $ | $ | ||||||
|
Interest expense before accretion on TOC debt |
9,732 | 13,134 | 14,622 | ||||||
|
Accretion on long-term debt due to TOC acquisition |
218 | 875 | 620 | ||||||
|
Interest expense |
9,950 | 14,009 | 15,242 | ||||||
|
Interest income |
(201 | ) | (170 | ) | (635 | ) | |||
|
Interest expense, net |
9,749 | 13,839 | 14,607 |
At January 1, 2011, the Company was in compliance with its covenants, which relate to the Canadian line of credit facility, the U.S. line of credit facility (note 9(a) and (b)), as well as the non-revolving term loan facilities. In addition, Opta Minerals was in compliance with its financial covenants which relate to the Canadian line of credit facility (note 9(c)), as well as the term loan facility and revolving acquisition facility.
| SUNOPTA INC. | -F29- | January 1, 2011 10-K |
| SunOpta Inc. |
| Notes to Consolidated Financial Statements |
| For the years ended January 1, 2011, December 31, 2009 and December 31, 2008 |
| (Expressed in thousands of U.S. dollars, except per share amounts) |
| 11. | Capital stock |
The Company is authorized to issue an unlimited number of common shares without par value and an unlimited number of special shares without par value (of which none are outstanding).
The following is a summary of changes in the Company’s capital stock:
|
|
Warrants and rights | Common shares | Total | ||||||||||||
|
|
Number | $ | Number | $ | $ | ||||||||||
|
Balance at December 31, 2007 |
- | - | 64,149,593 | 176,547 | 176,547 | ||||||||||
|
|
|||||||||||||||
|
Options exercised (a) |
- | - | 65,580 | 559 | 559 | ||||||||||
|
Employee share purchase plan (b) |
- | - | 275,647 | 739 | 739 | ||||||||||
|
Treasury (c) |
- | - | 2,500 | 13 | 13 | ||||||||||
|
Balance at December 31, 2008 |
- | - | 64,493,320 | 177,858 | 177,858 | ||||||||||
|
|
|||||||||||||||
|
Employee share purchase plan (b) |
- | - | 487,148 | 823 | 823 | ||||||||||
|
Treasury (c) |
- | - | 2,500 | 13 | 13 | ||||||||||
|
Balance at December 31, 2009 |
- | - | 64,982,968 | 178,694 | 178,694 | ||||||||||
|
|
|||||||||||||||
|
Options exercised (a) |
- | - | 315,720 | 1,207 | 1,207 | ||||||||||
|
Employee share purchase plan (b) |
- | - | 198,903 | 747 | 747 | ||||||||||
|
Treasury (b) |
- | - | 2,500 | 13 | 13 | ||||||||||
|
Warrants issued (c) |
850,000 | 2,163 | - | - | 2,163 | ||||||||||
|
Balance at January 1, 2011 |
850,000 | 2,163 | 65,500,091 | 180,661 | 182,824 | ||||||||||
| (a) | Employee/director option plans |
Details of changes in employee/director stock options are as follows:
|
|
January 1, 2011 | December 31, 2009 | December 31, 2008 | ||||||
|
Outstanding options at beginning of year |
2,480,425 | 1,833,375 | 1,846,130 | ||||||
|
Options granted |
681,000 | 1,078,000 | 574,000 | ||||||
|
Options exercised |
(315,720 | ) | - | (65,580 | ) | ||||
|
Options forfeited or expired |
(497,605 | ) | (430,950 | ) | (521,175 | ) | |||
|
Options outstanding at end of year |
2,348,100 | 2,480,425 | 1,833,375 | ||||||
|
|
|||||||||
|
Exercisable options at end of year |
583,040 | 768,725 | 927,720 | ||||||
|
|
|||||||||
|
Weighted average fair value of options
granted |
$ |
2.79 |
$ |
1.05 |
$ |
3.25 |
The Company grants options to employees and directors from time to time under employee/director stock option plans. The Board of Directors of the Company has authorized and approved 5,000,000 (December 31, 2009 - 5,000,000) shares to be made available from the 2002 stock option plan. As at January 1, 2011, 823,480 (December 31, 2009 - 1,006,875) options are remaining to be granted under this plan.
| SUNOPTA INC. | -F30- | January 1, 2011 10-K |
| SunOpta Inc. |
| Notes to Consolidated Financial Statements |
| For the years ended January 1, 2011, December 31, 2009 and December 31, 2008 |
| (Expressed in thousands of U.S. dollars, except per share amounts) |
| 11. | Capital stock, continued |
The following is a summary of options granted during the year:
|
|
Number of vested | |||||||||||
|
Grant date |
Expiry date | Exercise price | Number of options | options | ||||||||
|
May 14, 2010 |
May 14, 2015 | $ | 4.45 | 664,000 | - | |||||||
|
August 10, 2010 |
August 10, 2015 | $ | 5.62 | 17,000 | - | |||||||
|
|
681,000 | - |
Employee/director stock options granted by the Company contain an exercise price, which is equal to the closing market price of the shares on the day prior to the grant date. Any consideration paid by employees/directors on exercise of stock options or purchase of stock is credited to capital stock.
During the year ended January 1, 2011, the Company granted 681,000 options which vest 136,200 per annum from 2011 to 2015. During the year ended January 1, 2011, 315,720 (December 31, 2009 - nil) options were exercised and the equivalent number of options shares was issued for net proceeds of $1,123 (December 31, 2009 - nil).
Earnings for the year ended January 1, 2011 includes $2,136 (December 31, 2009 - $1,435) of stock compensation expense related to the Company’s stock-based compensation arrangements, including $777 (December 31, 2009 - $285) in stock-based compensation for the options issued by Opta Minerals to its employees. The Company also realized a cash tax benefit of $42 (December 31, 2009 - $6) relating to options granted in prior years and exercised in the current year. The benefit was recorded as an increase in additional paid-in capital. Total compensation costs related to non-vested awards not yet recognized as an expense is $3,291 as at January 1, 2011. The weighted average period over which this is expected to be recognized is 2.1 years.
The weighted average assumptions used in the Black –Scholes option pricing model to determine the fair value of the options granted in the years ended January 1, 2011, December 31, 2009 and December 31, 2008 were as follows:
|
|
January 1, 2011 | December 31, 2009 | December 31, 2008 | ||||||
|
|
|||||||||
|
Dividend yield |
0% | 0% | 0% | ||||||
|
Weighted average expected volatility |
68.2% | 71.0% | 57.0% | ||||||
|
Weighted average risk-free interest rate |
2.3% | 2.0% | 3.0% | ||||||
|
Expected life of options (in years) |
6 | 6 | 6 |
The fair value of the options is based on estimates of the number of options that management expects to vest, which is estimated to be 85% of the granted amounts.
Details of employee/director stock options outstanding as at January 1, 2011 are as follows:
|
|
Vested | Weighted | Total | Weighted | |||||||||||
|
|
Exercise | outstanding | average price | outstanding | average price | ||||||||||
|
Expiry date |
price range | options | (vested) | options | (total) | ||||||||||
|
|
$ | $ | |||||||||||||
|
2012 |
$ | 5.36 to $10.00 | 76,600 | 9.53 | 76,600 | 9.53 | |||||||||
|
2013 |
$ | 10.86 to $13.75 | 208,400 | 11.98 | 308,000 | 12.07 | |||||||||
|
2014 |
$ | 5.12 to $13.75 | 157,000 | 6.10 | 436,300 | 6.04 | |||||||||
|
2015 |
$ | 0.91 to $1.92 | 141,040 | 1.63 | 861,200 | 1.64 | |||||||||
|
2016 |
$ | 4.45 to $5.62 | - | - | 666,000 | 4.48 | |||||||||
|
|
583,040 | 7.57 | 2,348,100 | 4.89 |
| SUNOPTA INC. | -F31- | January 1, 2011 10-K |
| SunOpta Inc. |
| Notes to Consolidated Financial Statements |
| For the years ended January 1, 2011, December 31, 2009 and December 31, 2008 |
| (Expressed in thousands of U.S. dollars, except per share amounts) |
| 11. | Capital stock, continued |
The weighted average remaining contractual life for vested outstanding options and total outstanding options is 3.6 and 4.7 years, respectively (December 31, 2009 - 1.8 and 4.0 years, respectively; December 31, 2008 - 1.6 and 3.3 years, respectively).
| (b) | Employee share purchase plan / compensation grants |
The Company maintains an employee share purchase plan whereby employees can purchase common shares through payroll deductions. In the year ended January 1, 2011, the Company’s employees purchased 198,903 (December 31, 2009 - 487,148, December 31, 2008 - 275,647) for total proceeds of $747 (December 31, 2009 - $823, December 31, 2008 - $739. As at January 1, 2011, 1,674,092 (December 31, 2009 - 1,872,995) common shares are remaining to be granted under this plan.
Based on the terms of his employment contracts, the Company’s President and Chief Executive Officer received an award of 10,000 common shares of the Company’s stock during 2007. The stock was granted 25% in 2007, with the remaining 75% to be granted in equal installments on the grant date anniversary for each of the next three years. Accordingly, 2,500 common shares were issued from treasury and the Company recognized stock-based compensation costs of $13 in 2010 (2009 - $13).
On January 3, 2011, 200,000 options were granted to the Company’s Chief Executive Officer. The options granted contain similar features as those granted in prior periods under the Company’s employee/director option plan.
| (c) | Warrants |
On February 5, 2010 (the “First Tranche”), and June 11, 2010 (the “Second Tranche”), the Company issued warrants pursuant to an Advisory Services Agreement. A fair value of $441 and $1,722, respectively, was assigned to these warrants, using the Black-Scholes option pricing model, and were expensed in full during the quarter of issuance with the offset recorded as an increase to additional paid in capital. The Second Tranche of warrants were issued following the consummation of the sale of the Canadian Food Distribution business (note 3 (a)) and the cost was included as part of the gain on sale of discontinued operations. As at January 1, 2011, the First Tranche and Second Tranche of warrants have not been exercised.
Inputs used in the Black-Scholes option pricing model for the warrants were as follows:
|
|
First Tranche | Second Tranche | ||||
|
|
February 5, 2010 | June 11, 2010 | ||||
|
Number of warrants issued |
250,000 | 600,000 | ||||
|
Exercise price |
$ | 3.25 | $ | 5.11 | ||
|
Expected volatility |
72.0% | 72.1% | ||||
|
Risk-free interest rate |
2.5% | 2.1% | ||||
|
Dividend yield |
0% | 0% | ||||
|
Expected life (in years) |
5 | 5 |
| (d) | Rights offering |
On October 6, 2008, the Company approved the Shareholder Rights Plan Agreement, which was issued to provide the Company sufficient time to develop and implement alternatives to maximize value for all shareholders in the event of an unsolicited bid for control of the Company, and to enhance the Company’s ability to prevent any unfair acquisition tactics. The Shareholder Rights Plan Agreement expired April 2, 2009, and is no longer of further force or effect.
| SUNOPTA INC. | -F32- | January 1, 2011 10-K |
| SunOpta Inc. |
| Notes to Consolidated Financial Statements |
| For the years ended January 1, 2011, December 31, 2009 and December 31, 2008 |
| (Expressed in thousands of U.S. dollars, except per share amounts) |
| 12. | Earnings (loss) per share |
The calculation of basic earnings per share is based on the weighted average number of shares outstanding. Diluted earnings per share reflect the dilutive effect of the exercise of warrants and options. The number of shares for the diluted earnings per share was calculated as follows:
|
|
January 1, 2011 | December 31, 2009 | December 31, 2008 | ||||||
|
|
|||||||||
|
Earnings (loss) from continuing
operations |
$12,685 |
($6,490 |
) |
($11,899 |
) | ||||
|
Earnings (loss) from
discontinued |
48,381 |
(273 |
) |
963 |
|||||
|
Earnings (loss) attributable to SunOpta Inc. |
$61,066 | ($6,763 | ) | ($10,936 | ) | ||||
|
|
|||||||||
|
Weighted average number of shares used
in |
65,179,067 |
64,770,614 |
64,255,250 |
||||||
|
Dilutive potential of the following: |
|||||||||
|
Employee/director stock options |
663,506 | - | - | ||||||
|
Warrants |
185,705 | - | - | ||||||
|
Diluted weighted average
number |
66,028,278 |
64,770,614 |
64,255,250 |
||||||
|
|
|||||||||
|
Earnings (loss) per share - basic: |
|||||||||
|
-from continuing operations |
$0.20 | ($0.10 | ) | ($0.18 | ) | ||||
|
-from discontinued operations |
$0.74 | - | $0.01 | ||||||
|
|
$0.94 | ($0.10 | ) | ($0.17 | ) | ||||
|
|
|||||||||
|
Earnings (loss) per share - diluted: |
|||||||||
|
-from continuing operations |
$0.19 | ($0.10 | ) | ($0.18 | ) | ||||
|
-from discontinued operations |
$0.73 | - | $0.01 | ||||||
|
|
$0.92 | ($0.10 | ) | ($0.17 | ) |
For the year ended January 1, 2011, options to purchase 837,900 common shares have been excluded from the calculations of diluted earnings per share due to their anti-dilutive effect. Due to the loss attributable to SunOpta Inc for the years ended December 31, 2009 and December 31, 2008, options to purchase 2,480,425 and 1,833,375 common shares, respectively, have been excluded from the calculation of diluted earnings per share due to their anti-dilutive effect.
| SUNOPTA INC. | -F33- | January 1, 2011 10-K |
| SunOpta Inc. |
| Notes to Consolidated Financial Statements |
| For the years ended January 1, 2011, December 31, 2009 and December 31, 2008 |
| (Expressed in thousands of U.S. dollars, except per share amounts) |
| 13. | Income taxes |
The provision for (recovery of) income taxes from continuing operations differs from the amount that would have resulted by applying the combined Canadian federal and provincial statutory income tax rate to earnings (loss) before income taxes due to the following:
|
|
January 1, 2011 | December 31, 2009 | December 31, 2008 | ||||||
|
|
$ | $ | $ | ||||||
|
Income tax provision (recovery) at
combined |
6,448 |
(4,066 |
) |
(4,542 |
) | ||||
|
|
|||||||||
|
Income (decrease) by the effects of: |
|||||||||
|
Impact of foreign exchange |
(138 | ) | (2,171 | ) | (1,314 | ) | |||
|
Change in valuation allowance |
(3,708 | ) | 2,123 | 3,062 | |||||
|
Foreign tax rate differential |
798 | (822 | ) | (1,347 | ) | ||||
|
Impact of enacted tax rates |
(298 | ) | 1,743 | 845 | |||||
|
Benefit of cross-jurisdictional financing structures |
(1,483 | ) | (3,126 | ) | (3,893 | ) | |||
|
Impact of capital gains and losses |
2,227 | (1,052 | ) | 266 | |||||
|
Impact of goodwill impairment |
264 | 2,625 | 3,833 | ||||||
|
Impact of FIN 48 on current year tax expense |
(549 | ) | (455 | ) | 3,639 | ||||
|
SRED and other ITC's carried forward in the year |
- | (456 | ) | - | |||||
|
Other |
1,902 | 2,456 | (2,248 | ) | |||||
|
Provision for (recovery of) income taxes |
5,463 | (3,201 | ) | (1,699 | ) |
The components of the provision (recovery) for Canada, the United States and other income taxes are shown below:
|
|
January 1, 2011 | December 31, 2009 | December 31, 2008 | ||||||
|
|
$ | $ | $ | ||||||
|
Current income tax provision: |
|||||||||
|
Canada |
2,546 | 3,568 | 1,530 | ||||||
|
United States |
1 | (705 | ) | 1,272 | |||||
|
Other |
1,103 | (884 | ) | 348 | |||||
|
|
3,650 | 1,979 | 3,150 | ||||||
|
|
|||||||||
|
Deferred income tax provision (recovery): |
|||||||||
|
Canada |
(4,730 | ) | (6,339 | ) | (3,124 | ) | |||
|
United States |
7,802 | (35 | ) | (1,489 | ) | ||||
|
Other |
(1,259 | ) | 1,194 | (236 | ) | ||||
|
|
1,813 | (5,180 | ) | (4,849 | ) | ||||
|
|
|||||||||
|
Provision for (recovery of) income taxes |
5,463 | (3,201 | ) | (1,699 | ) |
| SUNOPTA INC. | -F34- | January 1, 2011 10-K |
| SunOpta Inc. |
| Notes to Consolidated Financial Statements |
| For the years ended January 1, 2011, December 31, 2009 and December 31, 2008 |
| (Expressed in thousands of U.S. dollars, except per share amounts) |
| 13. | Income taxes, continued |
Deferred income taxes of the Company are comprised of the following:
|
|
January 1, 2011 | December 31, 2009 | December 31, 2008 | ||||||
|
|
$ | $ | $ | ||||||
|
Differences in property, plant and
equipment |
(30,998 |
) |
(25,082 |
) |
(24,142 |
) | |||
|
Capital and non-capital losses |
26,651 | 30,303 | 23,666 | ||||||
|
Tax benefit of scientific research expenditures |
3,513 | 3,575 | 2,439 | ||||||
|
Tax benefit of costs incurred during share issuances |
(2,072 | ) | 390 | 673 | |||||
|
Inventory basis differences and reserves |
3,020 | 4,530 | 4,065 | ||||||
|
Other accrued reserves |
(2,283 | ) | 1,468 | 493 | |||||
|
|
(2,169 | ) | 15,184 | 7,194 | |||||
|
Less: Valuation allowance |
5,880 | 7,178 | 4,153 | ||||||
|
Net deferred income tax (liability) asset |
(8,049 | ) | 8,006 | 3,041 |
The components of the deferred income tax asset (liability) for Canada, the United States and Other are shown below:
|
|
January 1, 2011 | December 31, 2009 | December 31, 2008 | ||||||
|
|
$ | $ | $ | ||||||
|
Canada |
(405 | ) | 12,107 | 5,907 | |||||
|
United States |
(7,366 | ) | (806 | ) | (827 | ) | |||
|
Other |
(278 | ) | (3,295 | ) | (2,039 | ) | |||
|
|
(8,049 | ) | 8,006 | 3,041 |
The components of the deferred income tax valuation allowance are as follows:
|
|
January 1, 2011 | December 31, 2009 | December 31, 2008 | ||||||
|
|
$ | $ | $ | ||||||
|
Balance, beginning of year |
7,178 | 4,153 | 1,446 | ||||||
|
(Decrease) increase in valuation allowance |
(3,708 | ) | 2,123 | 3,062 | |||||
|
Adjustments to valuation allowance as a
result of |
2,410 |
902 |
(355 |
) | |||||
|
Balance, end of year |
5,880 | 7,178 | 4,153 |
The Company has approximately $10,867 (December 31, 2009 - $10,284) in Canadian scientific research expenditures, which can be carried forward indefinitely to reduce future years’ taxable income. The Company also has approximately $1,026 and $657 (December 31, 2009 – $936 and $646) in Canadian and U.S. scientific research investment tax credits and $202 (December 31, 2009 - $243) in Massachusetts research and development tax credits, which will expire in varying amounts up to 2029.
The Company has Canadian and U.S. federal non-capital loss carry-forwards of approximately $29,598 and $31,598, respectively, as at January 1, 2011 (December 31, 2009 - $45,332 and $36,266). The Company also has state loss carry- forwards of approximately $15,872 as at January 1, 2011 (December 31, 2009 - $20,731). The amounts are available to reduce future federal and provincial/state income taxes. Non-capital loss carry-forwards attributable to Canada expire in varying amounts over the next 20 years while non-capital loss carry-forwards attributable to the United States expire in varying amounts over the next 20 years.
| SUNOPTA INC. | -F35- | January 1, 2011 10-K |
| SunOpta Inc. |
| Notes to Consolidated Financial Statements |
| For the years ended January 1, 2011, December 31, 2009 and December 31, 2008 |
| (Expressed in thousands of U.S. dollars, except per share amounts) |
| 13. | Income taxes, continued |
The Company has Canadian capital losses of approximately $370 as at January 1, 2011 (December 31, 2009 - $14,719) for which a full valuation allowance exists. These amounts are available to reduce future capital gains. Capital losses in Canada do not expire.
The Company records net deferred tax assets to the extent it believes these assets will more likely than not be realized. In making such determinations, the Company considers all available positive and negative evidence, including future reversals of existing temporary differences, projected future taxable income, tax planning strategies and recent financial operations. Based on this evaluation, a valuation allowance of $5,880 (December 31, 2009 - $7,178) has been recorded against certain assets to reduce the net benefit recorded in the consolidated financial statements.
The Company has not provided Canadian deferred taxes on cumulative earnings of non-Canadian affiliates and associated companies that have been reinvested indefinitely. Deferred taxes are provided for earnings of non-Canadian affiliates and associated companies when the Company determines that such earnings are no longer indefinitely reinvested.
In June 2006, the FASB issued ASC 740, which clarifies the accounting for uncertainty in income taxes recognized in an enterprise’s financial statements. This topic prescribes a recognition threshold and measurement attribute for the financial statement recognition and measurement of a tax position taken or expected to be taken in a tax return. This interpretation also provides guidance on derecognition, classification, interest and penalties, accounting in interim periods, disclosure, and transition. While the Company believes it has adequately examined its tax positions under ASC 740, amounts asserted by taxing authorities could differ from the Company’s position. Accordingly, additional provisions on federal, provincial, state and foreign tax-related matters could be recorded in the future as revised estimates are made or the underlying matters are settled or otherwise resolved.
A reconciliation of the beginning and ending amount of unrecognized tax benefits (excluding interest and penalties) is presented below.
|
|
$ | ||
|
Balance at December 31, 2009 |
3,117 | ||
|
Reductions resulting from lapse of applicable statute of limitations |
(549 | ) | |
|
Balance at January 1, 2011 |
2,568 |
The Company’s unrecognized tax benefits largely include a possible reduction to prior year losses for U.S. exposures relating to the deductibility of certain interest amount accrued. The Company believes that it is reasonably possible that a decrease of up to $875 in unrecognized tax benefits related to tax exposures in the United States may be necessary within the coming year.
Consistent with its historical financial reporting, the Company has classified interest and penalties related to income tax liabilities, when applicable, as part of interest expense in its consolidated statements of operations. The Company recognized $nil in potential interest and penalties associated with unrecognized tax benefits for the year ended January 1, 2011 (December 31, 2009 - $nil). The unrecognized tax benefits have been recorded as a reduction of long-term deferred tax assets. All of the unrecognized tax benefits could impact the Company's effective tax rate if recognized.
The number of years with open tax audits varies depending on the tax jurisdiction. The Company’s major taxing jurisdictions include Canada, the Province of Ontario and the United States (including multiple states). The Company’s 2007 through 2010 tax years (and any tax year for which available non-capital loss carry-forwards were generated up to the amount of non-capital loss carry-forward) remain subject to examination by the Internal Revenue Service for U.S. federal tax purposes, and the 2005 through 2010 tax years remain subject to examination by the appropriate governmental agencies for Canadian federal tax purposes. There are other ongoing audits in various other jurisdictions that are not considered material to the Company’s consolidated financial statements.
| SUNOPTA INC. | -F36- | January 1, 2011 10-K |
| SunOpta Inc. |
| Notes to Consolidated Financial Statements |
| For the years ended January 1, 2011, December 31, 2009 and December 31, 2008 |
| (Expressed in thousands of U.S. dollars, except per share amounts) |
| 14. | Supplemental cash flow information |
|
|
January 1, 2011 | December 31, 2009 | December 31, 2008 | ||||||
|
|
$ | $ | $ | ||||||
|
Changes in non-cash working capital, net of
|
|||||||||
|
Accounts receivable |
(8,562 | ) | 11,512 | 5,435 | |||||
|
Inventories |
(35,861 | ) | 32,294 | 515 | |||||
|
Income tax recoverable |
1,205 | 153 | 1,077 | ||||||
|
Prepaid expenses and other current assets |
(10,633 | ) | 1,709 | 974 | |||||
|
Accounts payable and accrued liabilities |
18,460 | (4,289 | ) | 3,682 | |||||
|
Customer and other deposits |
1,816 | (150 | ) | (107 | ) | ||||
|
|
(33,575 | ) | 41,229 | 11,576 | |||||
|
|
|||||||||
|
Cash paid for: |
|||||||||
|
Interest |
8,993 | 11,268 | 12,758 | ||||||
|
|
|||||||||
|
Income taxes |
2,105 | 1,240 | 1,646 |
| SUNOPTA INC. | -F37- | January 1, 2011 10-K |
| SunOpta Inc. |
| Notes to Consolidated Financial Statements |
| For the years ended January 1, 2011, December 31, 2009 and December 31, 2008 |
| (Expressed in thousands of U.S. dollars, except per share amounts) |
| 15. | Related party transactions and balances |
|
|
January 1, 2011 | December 31, 2009 | December 31, 2008 | ||||||
|
|
$ | $ | $ | ||||||
|
|
|||||||||
|
Purchases and sales at market rates |
|||||||||
|
(a) President of Grains and Foods Group - purchases |
502 | 494 | 128 | ||||||
|
(a) President of Grains and Foods Group - sales |
104 | 134 | 476 | ||||||
|
(b) Employees of Grains and Foods Group - purchases |
823 | 1,151 | 930 | ||||||
|
(b) Employees of Grains and Foods Group - sales |
217 | 308 | 364 | ||||||
|
(c) Minority partner at Trabocca B.V. |
381 | 237 | 83 | ||||||
|
|
|||||||||
|
Rent paid to former owners or shareholders |
|||||||||
|
(d) Production, packaging and warehouse facility |
- | - | 240 | ||||||
|
(e) Warehouses and administration facility |
472 | 426 | 467 | ||||||
|
(f) Production facility |
- | 155 | 157 | ||||||
|
(g) Production, warehouse and office facility |
430 | 439 | 375 | ||||||
|
|
|||||||||
|
Other transactions |
|||||||||
|
(h) Employment contract of former CEO |
380 | 343 | 231 | ||||||
|
(i) Payment of promissory note at Opta Minerals |
- | 1,500 | 3,000 | ||||||
|
(j) Contingent consideration at Opta Minerals |
447 | - | 514 | ||||||
|
(k) Amounts due to/from officers and directors |
2 | 2 | 9 | ||||||
|
(l) Interest on subordinated debt |
320 | 429 | 131 | ||||||
|
|
|||||||||
|
(m) Discontinued operations |
|||||||||
|
Warehouse and administration facility |
163 | 355 | 395 | ||||||
|
Warehouse and administration facility |
64 | 136 | 141 | ||||||
|
Sale of organic product |
- | 2,973 | 2,521 | ||||||
|
Rent at Opta Minerals from an affiliated company |
24 | 22 | - |
In addition to transactions disclosed elsewhere in these consolidated financial statements, the Company entered into the following related party transactions:
| (a) |
Represents purchases of agronomy products from the Company at market rates, as well as the sale of organic corn and soybeans at market rates to the Company during the years ended January 1, 2011, December 31, 2009 and December 31, 2008, which are included in revenues and cost of sales, respectively, on the consolidated statement of operations. |
|
| |
| (b) |
Represents purchases of agronomy products from the Company at market rates, as well as the sale of organic corn and soybeans at market rates to the Company during the years ended January 1, 2011, December 31, 2009 and December 31, 2008, which are included in revenues and cost of sales, respectively, on the consolidated statement of operations. |
|
| |
| (c) |
Represents the purchases of coffee beans, at market prices, from a company that is owned by the non-controlling shareholder of Trabocca B.V., a less than wholly owned subsidiary of The Organic Corporation. The purchases are included in cost of sales on the consolidated statement of operations for the years ended January 1, 2011, December 31, 2009 and December 31, 2008. |
| SUNOPTA INC. | -F38- | January 1, 2011 10-K |
| SunOpta Inc. |
| Notes to Consolidated Financial Statements |
| For the years ended January 1, 2011, December 31, 2009 and December 31, 2008 |
| (Expressed in thousands of U.S. dollars, except per share amounts) |
| 15. | Related party transactions and balances, continued |
| (d) |
Pursuant to the acquisition of a former subsidiary, the Company leased the Buena Park, California, production, packaging and warehouse facility from the former owners, one of whom was an employee of the Company to July 2008. The lease was at market rates at inception and was for a five-year term expiring in 2010. The lease payments are included in selling, general and administrative expenses on the consolidated statement of operations for the year ended December 31, 2008. |
|
| |
| (e) |
Pursuant to the acquisition of Purity Life, the Company leased Purity Life’s Acton, Ontario, warehouses and administration facilities from a company controlled by the former owners, one of whom remains in a senior management position within the International Foods Group. The lease was at market rates at inception and is for a 63-month term with a five-year renewal period expiring in 2011. The lease payments are included in selling, general and administrative expenses on the consolidated statement of operations for the years ended January 1, 2011, December 31, 2009 and December 31, 2008. |
|
| |
| (f) |
Pursuant to the acquisition of Neo-Nutritionals, Inc., the Company leased the Brantford, Ontario production facilities from a company controlled by a former owner, who was an employee of the Company to December 2009. The lease was at market rates and expired on November 30, 2010. The lease payments are included in selling, general and administrative expenses on the consolidated statement of operations for the years ended December 31, 2009 and December 31, 2008. |
|
| |
| (g) |
Pursuant to the acquisition of Pacific Fruit Processors, the Company leases a production, warehouse and office facility from a related party to the former President, who remains in a senior management position in the Fruit Group. The lease was at market rates at inception and is for a 60 month term with two five-year renewal periods expiring in June 2020. The lease payments are included in selling, general and administrative expenses on the consolidated statement of operations for the years ended January 1, 2011, December 31, 2009 and December 31, 2008. |
|
| |
| (h) |
Represents the amount owed to the Company’s former Chief Executive Officer (“former CEO”) under an employment contract included in long-term liabilities on the consolidated balance sheet. On February 1, 2007, the former CEO of the Company stepped down and remained Chairman of the Board at a reduced level of compensation subject to a contract expiring on February 26, 2020. The contract provides for consulting fees of $75 per year plus a bonus, (amended to $200 until December 31, 2010) declining to $25 per year, to be paid on a sliding scale over time until February 26, 2020. Subsequent to the year 2012, the former CEO is no longer required to provide services to the Company although payments will continue. In the event that the former CEO passes away before February 26, 2020, any remaining amount payable under the contract will be paid to his surviving spouse until February 26, 2020. |
|
| |
| (i) |
Represents long-term debt on the consolidated balance sheet to the former shareholders of Magnesium Technologies Corporation, which was a 2006 acquisition by Opta Minerals. The final $1,500 instalment related to this debt was paid in the fourth quarter of 2010. As a result of the appointment of a new director to Opta Minerals on May 12, 2008, the director received 26.5% of the total payments, based on his previous shareholdings. |
|
| |
| (j) |
Pursuant to Opta Minerals purchase of the outstanding shares of Bimac Inc. (“Bimac”), contingent consideration, not to exceed $3,850 may be payable to the former shareholders based on the achievement of certain pre-determined earnings targets to September 2016. Based on the earnings of Bimac for the year ended September 30, 2010, Opta Minerals recorded, and subsequently paid, $477 of contingent consideration to the former shareholders, with an offsetting increase to goodwill. For the year ended December 31, 2009, due to the downturn in the economy that led to the goodwill impairment charge at Opta Minerals (note 7), $1,110 of previously accrued contingent consideration was written off to other expense, net on the consolidated statement of operations, along with the goodwill related to the liability. As a result of the appointment of a director to Opta Minerals in May 12, 2008, the director received 61.7% of the contingent consideration payment, based on his previous shareholdings. |
|
| |
| (k) |
Represents amounts due to/from officers/directors of the Company included in accounts receivable on the consolidated balance sheet as at January 1, 2011. |
| SUNOPTA INC. | -F39- | January 1, 2011 10-K |
| SunOpta Inc. |
| Notes to Consolidated Financial Statements |
| For the years ended January 1, 2011, December 31, 2009 and December 31, 2008 |
| (Expressed in thousands of U.S. dollars, except per share amounts) |
| 15. | Related party transactions and balances, continued |
| (l) |
Represents interest payments on the subordinated debt paid to former shareholders of TOC on a semi-annual basis (note 10(f)). |
|
| |
| (m) |
Due to the sale of the Canadian Food Distribution assets and SunOpta BioProcess Inc. (note 3), the following related party transactions have been reclassified on the consolidated statement of operations to earnings (loss) from discontinued operations: |
-
Pursuant to the Pro Organics acquisition, the Company leased its Vancouver, British Columbia, Canada, warehouse and administration facility from a company controlled by a former owner. The lease was at market rates at inception and was for a five-year term with two five-year renewal periods, expiring in 2018.
-
Pursuant to the acquisition of Les Importations Cacheres Hahamovitch Inc., the Company leased its Montreal, Quebec, warehouse and administration facility from the former owner. The lease was at market rates at inception and was renewable annually for a 12 month term through 2014.
-
The former President of the Distribution Group (who was an employee until March 2009) sold organic product from his family farming operation, at market rates, to the former Distribution Group.
-
Opta Minerals rents a facility to SunOpta BioProcess Inc., a former affiliated company, and received rental revenue.
| 16. | Commitments and contingencies |
| (a) | Securities class action lawsuits |
The Company and certain officers (one of whom is a director) and a former director were named as defendants in proposed class action lawsuits in the United States District Court for the Southern District of New York and Ontario Superior Court of Justice (collectively, the “courts”) on behalf of shareholders who acquired securities of the Company from February 23, 2007 to January 27, 2008, inclusive. Cleugh’s Frozen Foods, Inc. and Pacific Fruit Processors, Inc. (each of which are now part of the merged subsidiary, SunOpta Fruit Group, Inc.) and Organic Ingredients, Inc. (which is now known as SunOpta Global Organic Ingredients, Inc.), were also named as defendant in the U.S. action.
On September 24, 2009 the Company announced that it entered into a tentative agreement to settle all claims raised in these class action proceedings. In return for the dismissal of the class actions and releases from proposed class members of settled claims against the Company and other named defendants, the settlement agreement provided for a total cash contribution of $11,250 to a settlement fund, the adoption of certain governance enhancements to the Company’s Audit Committee charter and Internal Audit Charter and the adoption of an enhanced information technology conversion policy. The settlement was entirely funded by the Company’s insurers.
The settlements were approved by the United States District Court for the Southern District of New York and Ontario Superior Court of Justice in May 2010 and as a result the terms of the settlement have become effective, including the dismissal of the U.S. and Ontario class actions and releases of settled claims against the Company and other named defendants.
| SUNOPTA INC. | -F40- | January 1, 2011 10-K |
| SunOpta Inc. |
| Notes to Consolidated Financial Statements |
| For the years ended January 1, 2011, December 31, 2009 and December 31, 2008 |
| (Expressed in thousands of U.S. dollars, except per share amounts) |
| 16. | Commitments and contingencies, continued |
| (b) | Formal investigation by the SEC |
In 2008 the Company received letters from the SEC requesting additional information in connection with the restatement of the Company’s filings for each of the quarterly periods ended March 31, 2007, June 30, 2007, and September 30, 2007. The SEC concluded their investigation in the quarter ended October 2, 2010 and came to a settlement with the Company, Mr. Bromley, President and CEO and Mr. Dietrich the former CFO of the Company. Under the settlement, the Company has agreed to an administrative order (“Order”) directing that the Company cease and desist from committing or causing any violations and any future violations of Sections 13(a), 13(b)(2)(A) and 13(b)(2)(B) of the Securities Exchange Act of 1934, as amended (the “Exchange Act”), and Rules 12b–20, 13a–11 and 13a–13 thereunder. The Order does not require the Company to make any payment. Mr. Bromley and Mr. Dietrich also have agreed to the Order, which directs that they cease and desist from committing and causing any violations and any future violations of Sections 13(a), 13(b)(2)(A) and 13(b)(2)(B) of the Exchange Act and Rules 12b–20, 13a–11, 13a–13 and 13a–14 thereunder and pay disgorgement of $46 and $7, respectively. Those amounts represent a portion of the proceeds that each of them received in connection with properly approved option exercises and sales of the Company’s common stock that occurred before the Company’s quarterly financial statements for 2007 were restated. The Company, Mr. Bromley and Mr. Dietrich each consented to the issuance of the Order without admitting or denying the Commission’s findings. The settlement concludes the Commission’s inquiry.
| (c) | Vargas Class Action |
In September 2008, a single plaintiff and a former employee filed a wage and hour dispute, against SunOpta Fruit Group, Inc., as a class action alleging various violations of California’s labour laws (the “Vargas Class Action”). A tentative settlement of all claims was reached at mediation on January 15, 2010 and the parties executed a settlement agreement resolving all claims of the class. On February 15, 2011, the terms of the proposed settlement were preliminarily approved by the court. As a result of the tentative settlement, $1,200 has been accrued at January 1, 2011 (December 31, 2009 - $1,200).
| (d) | Colorado Sun Oil Processors, LLC dispute |
Colorado Mills LLC (“Colorado Mills”) and SunOpta Grains and Foods Inc., (formally Sunrich LLC, herein “Grains and Foods”) a wholly–owned subsidiary of the Company, organized a joint venture in 2008 to construct and operate a vegetable oil refinery adjacent to Colorado Mills’ sunflower seed crush plant located in Lamar, Colorado. During the relationship, disputes arose between the parties concerning management of the joint venture, record–keeping practices, certain unauthorized expenses incurred on behalf of the joint venture by Colorado Mills, procurement of crude oil by Sunrich from Colorado Mills for processing at the joint venture refinery, and the contract price of crude oil offered for sale under the joint venture agreement.
The parties initiated a dispute resolution process as set forth in the joint venture agreement, which Colorado Mills aborted prematurely through the initiation of suit in Colorado State Court. Subsequent to the filing of that suit, Colorado Mills acted with an outside creditor of the joint venture to involuntarily place the joint venture into bankruptcy. The involuntary bankruptcy has been opposed by Grains and Foods. After a preliminary hearing on Grains and Foods’ motion to dismiss the involuntary bankruptcy, the bankruptcy court appointed a trustee to act on behalf of the joint venture. On February 3, 2011, Grains and Foods executed an Asset Purchase Agreement with the trustee to purchase certain of the assets of the joint venture and assume rights to an equipment lease. A separate arbitration proceeding is also pending between Grains and Foods and Colorado Mills to resolve direct claims each party has asserted against the other. Although management believes the claims asserted by Colorado Mills are baseless, management cannot conclude whether the prospect of an unfavourable outcome in this matter is probable, or estimate the loss, if any, that might arise from an unfavourable outcome. Accordingly, no accrual has been made at this time for this contingency.
| (e) | Other claims |
In addition, various claims and potential claims arising in the normal course of business are pending against the Company. It is the opinion of management that these claims or potential claims are without merit and the amount of potential liability, if any, to the Company is not determinable. Management believes the final determination of these claims or potential claims will not materially affect the financial position or results of the Company.
| SUNOPTA INC. | -F41- | January 1, 2011 10-K |
| SunOpta Inc. |
| Notes to Consolidated Financial Statements |
| For the years ended January 1, 2011, December 31, 2009 and December 31, 2008 |
| (Expressed in thousands of U.S. dollars, except per share amounts) |
| 16. | Commitments and contingencies, continued |
| (f) | Environmental laws |
The Company believes, with respect to both its operations and real property, that it is in material compliance with current environmental laws. Based on known existing conditions and the Company’s experience in complying with emerging environmental issues, the Company is of the view that future costs relating to environmental compliance will not have a material adverse effect on its consolidated financial position, but there can be no assurance that unforeseen changes in the laws or enforcement policies of relevant governmental bodies, the discovery of changed conditions on the Company’s real property or in its operations, or changes in the use of such properties and any related site restoration requirements, will not result in the incurrence of significant costs.
| (g) | Grain, sunflower and other commitments |
In the normal course of business, SunOpta Foods holds grain for the benefit of others. The Company is liable for any deficiencies of grade or shortage of quantity that may arise in connection with such grain. SunOpta Foods also has commitments to purchase $49,337 (December 31, 2009 - $47,110) of grains and sunflowers in the normal course of business. In addition, the Fruit Group has entered into a number of commitments in the amount of $10,188 (January 1, 2011 - $14,850) related to supplier and purchase commitments.
| (h) | Letters of credit |
The Company has outstanding letters of credit at January 1, 2011 totalling $3,873 (December 31, 2009 - $5,762).
| (i) | Real property lease commitments |
The Company has entered into various leasing arrangements, which have fixed monthly rents that are adjusted annually each year for inflation.
Minimum commitments under operating leases, principally for processing facilities, warehouse and distribution, and equipment for the next five years are as follows:
|
|
$ | ||
|
December 31, 2011 |
8,970 | ||
|
December 29, 2012 |
7,356 | ||
|
December 28, 2013 |
6,431 | ||
|
January 3, 2015 |
5,236 | ||
|
January 2, 2016 |
4,025 | ||
|
Thereafter |
4,951 | ||
|
|
36,969 |
In the years ended January 1, 2011, December 31, 2009 and December 31, 2008, net minimum rents, including contingent rents and sublease rental income, were $11,049, $9,006 and $5,982 respectively.
| SUNOPTA INC. | -F42- | January 1, 2011 10-K |
| SunOpta Inc. |
| Notes to Consolidated Financial Statements |
| For the years ended January 1, 2011, December 31, 2009 and December 31, 2008 |
| (Expressed in thousands of U.S. dollars, except per share amounts) |
| 17. | Segmented information |
The Company operates in two industries divided into six operating segments:
(a) SunOpta Foods sources, processes, packages, markets and distributes a wide range of natural, organic and specialty food products and ingredients with a focus on soy, corn, sunflower, fruit, fiber and other natural and organic food and natural health products. There are four operating segments within SunOpta Foods:
| i) |
Grains and Foods Group is focused on vertically integrated sourcing, processing, packaging and marketing of grains, grain-based ingredients and packaged products; |
|
| |
| ii) |
Ingredients Group is focused primarily on insoluble oat and soy fiber products and works closely with its customers to identify product formulation, cost and productivity opportunities aimed at transforming raw materials into value-added food ingredient solutions; |
|
| |
| iii) |
Fruit Group consists of berry processing and fruit ingredient operations that process natural and organic frozen fruits and vegetables into bulk, ingredients and packaged formats for the food service, private label retail and industrial ingredient markets. The group also includes the healthy snacks operations which produce natural and organic fruit snacks and nutritional bars; and |
|
| |
| iv) |
International Foods Group comprises non-U.S. based operations which source raw material ingredients, trade organic commodities and provide natural and organic food solutions to major global food manufacturers, distributors and supermarket chains with a variety of industrial and private label retail products. In addition, this group manufactures, packages and distributes retail natural health products, primarily in the Canadian marketplace. |
(b) Opta Minerals processes, distributes and recycles silica-free loose abrasives, roofing granules, industrial minerals and specialty sands for the foundry, steel, roofing shingles and bridge and ship-cleaning industries.
(c) Corporate Services provide a variety of management, financial, information technology, treasury and administration services to the operating segments from the head office in Ontario, Canada, and information and shared services offices in Minnesota, U.S.A.
Effective July 3, 2010, the former Distribution Group was eliminated as an operating segment due to the sale of the Canadian Food Distribution assets (see note 3 (a)). In addition, the Company merged its natural health products division with the former International Sourcing and Trading Group to create a new operating segment called the International Foods Group. This realignment of operating segments effectively merges our international operations into one reporting group. The segmented information for the year ended January 1, 2011 have been updated to reflect the current year’s segment presentation.
Effective August 31, 2010, the former SunOpta BioProcess operating segment was eliminated due to the sale of SunOpta BioProcess Inc. (see note 3 (b)). Because this was a stand-alone operating segment, no re-alignment was required for segmented information purposes.
The Company’s assets, operations and employees are principally located in the United States, Canada, Europe, Mexico, China and Africa. Revenues are allocated to the United States, Canada and Europe and other external markets based on the location of the customer. Other expense (income) net, interest expense, net, and provision for (recovery of) income taxes are not allocated to the segments.
| SUNOPTA INC. | -F43- | January 1, 2011 10-K |
| SunOpta Inc. |
| Notes to Consolidated Financial Statements |
| For the years ended January 1, 2011, December 31, 2009 and December 31, 2008 |
| (Expressed in thousands of U.S. dollars, except per share amounts) |
| 17. | Segmented information, continued |
The following segmented information relates to each of the Company’s segments for the year ended January 1, 2011:
|
|
January 1, 2011 | |||||||||||
|
|
SunOpta | Opta | Corporate | |||||||||
|
|
Foods | Minerals | Services | Consolidated | ||||||||
| $ | $ | $ | $ | |||||||||
|
External revenues by market: |
||||||||||||
|
United States |
583,570 | 54,713 | - | 638,283 | ||||||||
|
Canada |
86,395 | 14,867 | - | 101,262 | ||||||||
|
Europe and other |
148,098 | 11,288 | - | 159,386 | ||||||||
|
Total revenues from external customers |
818,063 | 80,868 | - | 898,931 | ||||||||
|
|
||||||||||||
|
Segment earnings (loss) from
continuing |
44,837 |
7,753 |
(11,213 |
) |
41,377 |
|||||||
|
|
||||||||||||
|
Other expense, net |
10,945 | |||||||||||
|
Goodwill impairment |
1,654 | |||||||||||
|
Interest expense, net |
9,749 | |||||||||||
|
Provision for income taxes |
5,463 | |||||||||||
|
Earnings from continuing operations |
13,566 | |||||||||||
|
|
||||||||||||
|
Identifiable assets |
472,857 | 87,853 | 48,974 | 609,684 | ||||||||
|
Amortization |
12,659 | 4,099 | 1,101 | 17,859 | ||||||||
|
Goodwill |
42,226 | 6,332 | - | 48,558 | ||||||||
|
Expenditures on property, plant and equipment |
15,540 | 1,580 | 856 | 17,976 | ||||||||
Other expense for the year ended January 1, 2011 includes $7,033 related to the impairment of long-lived assets in the Fruit Group (see note 18). The goodwill impairment charge of $1,654 for the year ended January 1, 2011 is related to the International Foods Group (see note 7).
| SUNOPTA INC. | -F44- | January 1, 2011 10-K |
| SunOpta Inc. |
| Notes to Consolidated Financial Statements |
| For the years ended January 1, 2011, December 31, 2009 and December 31, 2008 |
| (Expressed in thousands of U.S. dollars, except per share amounts) |
| 17. | Segmented information, continued |
SunOpta Foods has the following segmented reporting for the year ended January 1, 2011:
|
|
January 1, 2011 | ||||||||||||||
|
|
Grains and | Ingredients | Fruit | International | SunOpta | ||||||||||
|
|
Foods Group | Group | Group | Foods Group | Foods | ||||||||||
| $ | $ | $ | $ | $ | |||||||||||
|
External revenues by market: |
|||||||||||||||
|
United States |
302,695 | 56,579 | 147,348 | 76,948 | 583,570 | ||||||||||
|
Canada |
6,474 | 8,492 | 3,868 | 67,561 | 86,395 | ||||||||||
|
Europe and other |
56,358 | 3,292 | 362 | 88,086 | 148,098 | ||||||||||
|
|
365,527 |
68,363 |
151,578 |
232,595 |
818,063 |
||||||||||
|
|
|||||||||||||||
|
Segment earnings
from |
26,398 |
13,172 |
3,615 |
1,652 |
44,837 |
||||||||||
|
|
|||||||||||||||
|
Identifiable assets |
234,522 | 41,886 | 90,106 | 106,343 | 472,857 | ||||||||||
|
Amortization |
4,911 | 1,513 | 3,515 | 2,720 | 12,659 | ||||||||||
|
Goodwill |
19,066 | 12,030 | 2,730 | 8,400 | 42,226 | ||||||||||
|
Expenditures on
property, |
6,364 |
5,571 |
3,045 |
560 |
15,540 |
||||||||||
| SUNOPTA INC. | -F45- | January 1, 2011 10-K |
| SunOpta Inc. |
| Notes to Consolidated Financial Statements |
| For the years ended January 1, 2011, December 31, 2009 and December 31, 2008 |
| (Expressed in thousands of U.S. dollars, except per share amounts) |
| 17. | Segmented information, continued |
The following segmented information relates to each of the Company’s segments for the year ended December 31, 2009:
|
|
December 31, 2009 | |||||||||||
|
|
SunOpta | Opta | Corporate | |||||||||
|
|
Foods | Minerals | Services | Consolidated | ||||||||
| $ | $ | $ | $ | |||||||||
|
External revenues by market: |
||||||||||||
|
United States |
484,388 | 40,019 | - | 524,407 | ||||||||
|
Canada |
91,475 | 13,155 | - | 104,630 | ||||||||
|
Europe and other |
180,654 | 9,349 | - | 190,003 | ||||||||
|
|
756,517 |
62,523 |
- |
819,040 |
||||||||
|
|
||||||||||||
|
Segment earnings (loss)
from |
17,660 |
1,161 |
(6,614 |
) |
12,207 |
|||||||
|
|
||||||||||||
|
Other expense, net |
2,245 | |||||||||||
|
Goodwill impairment |
8,841 | |||||||||||
|
Interest expense, net |
13,839 | |||||||||||
|
Recovery of income taxes |
(3,201 | ) | ||||||||||
|
Loss from continuing operations |
(9,517 | ) | ||||||||||
|
|
||||||||||||
|
Identifiable assets |
350,284 | 85,998 | 25,748 | 462,030 | ||||||||
|
Amortization |
11,974 | 3,851 | 1,205 | 17,030 | ||||||||
|
Goodwill |
25,412 | 6,019 | - | 31,431 | ||||||||
|
Expenditures on
property, |
8,996 |
2,488 |
54 |
11,538 |
||||||||
Of the total goodwill impairment charge of $8,841, $8,341 related to the Opta Minerals segment and $500 related to the Fruit Group segment (note 7).
| SUNOPTA INC. | -F46- | January 1, 2011 10-K |
| SunOpta Inc. |
| Notes to Consolidated Financial Statements |
| For the years ended January 1, 2011, December 31, 2009 and December 31, 2008 |
| (Expressed in thousands of U.S. dollars, except per share amounts) |
| 17. | Segmented information, continued |
SunOpta Foods has the following segmented reporting for the year ended December 31, 2009:
|
|
December 31, 2009 | ||||||||||||||
|
|
Grains and | Ingredients | Fruit | International | SunOpta | ||||||||||
|
|
Foods Group | Group | Group | Foods Group | Foods | ||||||||||
| $ | $ | $ | $ | $ | |||||||||||
|
External revenues by market: |
|||||||||||||||
|
United States |
226,486 | 53,091 | 141,658 | 63,153 | 484,388 | ||||||||||
|
Canada |
10,805 | 7,508 | 4,859 | 68,303 | 91,475 | ||||||||||
|
Europe and other |
87,747 | 4,058 | 926 | 87,923 | 180,654 | ||||||||||
|
|
325,038 |
64,657 |
147,443 |
219,379 |
756,517 |
||||||||||
|
|
|||||||||||||||
|
Segment earnings
from |
18,044 |
8,691 |
(4,073 |
) |
(5,002 |
) |
17,660 |
||||||||
|
|
|||||||||||||||
|
Identifiable assets |
126,680 | 36,853 | 88,987 | 97,764 | 350,284 | ||||||||||
|
Amortization |
4,072 | 1,461 | 3,928 | 2,513 | 11,974 | ||||||||||
|
Goodwill |
2,936 | 12,030 | - | 10,446 | 25,412 | ||||||||||
|
Expenditures on
property, |
6,085 |
1,056 |
1,647 |
208 |
8,996 |
||||||||||
| SUNOPTA INC. | -F47- | January 1, 2011 10-K |
| SunOpta Inc. |
| Notes to Consolidated Financial Statements |
| For the years ended January 1, 2011, December 31, 2009 and December 31, 2008 |
| (Expressed in thousands of U.S. dollars, except per share amounts) |
| 17. | Segmented information, continued |
The following segmented information relates to each of the Company’s segments for the year ended December 31, 2008:
|
|
December 31, 2008 | |||||||||||
|
|
SunOpta | Opta | Corporate | |||||||||
|
|
Foods | Minerals | Services | Consolidated | ||||||||
| $ | $ | $ | $ | |||||||||
|
External revenues by market: |
||||||||||||
|
United States |
536,861 | 61,608 | - | 598,469 | ||||||||
|
Canada |
105,945 | 18,201 | - | 124,146 | ||||||||
|
Europe and other |
138,217 | 13,613 | - | 151,830 | ||||||||
|
|
781,023 |
93,422 |
- |
874,445 |
||||||||
|
|
||||||||||||
|
Segment earnings (loss)
from |
17,071 |
5,531 |
(11,247 |
) |
11,355 |
|||||||
|
|
||||||||||||
|
Other income, net |
(719 | ) | ||||||||||
|
Goodwill impairment |
10,154 | |||||||||||
|
Interest expense, net |
14,607 | |||||||||||
|
Recovery of income taxes |
(1,699 | ) | ||||||||||
|
Loss from continuing operations |
(10,988 | ) | ||||||||||
|
|
||||||||||||
|
Identifiable assets |
379,192 | 100,392 | 17,395 | 496,979 | ||||||||
|
Amortization |
11,608 | 4,351 | 1,114 | 17,073 | ||||||||
|
Goodwill |
24,266 | 14,160 | - | 38,426 | ||||||||
|
Expenditures on
property, |
6,190 |
1,376 |
671 |
8,237 |
||||||||
Of the total goodwill impairment charge of $10,154, $8,198 related to the Fruit Group segment and $1,956 related to the International Foods segment (note 7).
| SUNOPTA INC. | -F48- | January 1, 2011 10-K |
| SunOpta Inc. |
| Notes to Consolidated Financial Statements |
| For the years ended January 1, 2011, December 31, 2009 and December 31, 2008 |
| (Expressed in thousands of U.S. dollars, except per share amounts) |
| 17. | Segmented information, continued |
SunOpta Foods has the following segmented reporting for the year ended December 31, 2008:
|
|
December 31, 2008 | ||||||||||||||
|
|
Grains and | Ingredients | Fruit | International | SunOpta | ||||||||||
|
|
Foods Group | Group | Group | Foods Group | Foods | ||||||||||
| $ | $ | $ | $ | $ | |||||||||||
|
External revenues by market: |
|||||||||||||||
|
United States |
272,298 | 55,493 | 142,661 | 66,409 | 536,861 | ||||||||||
|
Canada |
12,441 | 6,084 | 5,509 | 81,911 | 105,945 | ||||||||||
|
Europe and other |
42,568 | 3,693 | 2,709 | 89,247 | 138,217 | ||||||||||
|
|
327,307 |
65,270 |
150,879 |
237,567 |
781,023 |
||||||||||
|
|
|||||||||||||||
|
Segment earnings (loss)
from |
18,541 |
3,392 |
(10,219 |
) |
5,357 |
17,071 |
|||||||||
|
|
|||||||||||||||
|
Identifiable assets |
127,971 | 38,259 | 97,647 | 115,315 | 379,192 | ||||||||||
|
Amortization |
3,937 | 1,353 | 3,920 | 2,398 | 11,608 | ||||||||||
|
Goodwill |
2,867 | 12,030 | - | 9,369 | 24,266 | ||||||||||
|
Expenditures on
property, |
3,308 |
913 |
1,198 |
771 |
6,190 |
||||||||||
Geographic segments
|
|
January 1, 2011 | |||||||||||
|
|
United States | Canada | Europe and Other | Total | ||||||||
|
|
$ | $ | $ | $ | ||||||||
|
Property, plant and equipment |
105,124 | 10,838 | 4,093 | 120,055 | ||||||||
|
|
||||||||||||
|
Goodwill |
40,158 | - | 8,400 | 48,558 | ||||||||
|
|
||||||||||||
|
Total assets |
247,774 | 270,666 | 91,244 | 609,684 | ||||||||
|
|
December 31, 2009 | |||||||||||
|
|
United States | Canada | Europe and Other | Total | ||||||||
|
|
$ | $ | $ | $ | ||||||||
|
Property, plant and equipment |
84,416 | 12,217 | 8,587 | 105,220 | ||||||||
|
|
||||||||||||
|
Goodwill |
20,812 | 1,622 | 8,997 | 31,431 | ||||||||
|
|
||||||||||||
|
Total assets |
173,690 | 114,872 | 173,468 | 462,030 | ||||||||
Other includes operations in Mexico as part of the Fruit Group, operations in Slovakia as part of Opta Minerals and Europe as part of the International Foods Group.
For the years ended January 1, 2011, December 31, 2009 and December 31, 2008, the Company did not have any customers that exceeded 10% of total revenues.
| SUNOPTA INC. | -F49- | January 1, 2011 10-K |
| SunOpta Inc. |
| Notes to Consolidated Financial Statements |
| For the years ended January 1, 2011, December 31, 2009 and December 31, 2008 |
| (Expressed in thousands of U.S. dollars, except per share amounts) |
| 18. | Other expense (income), net |
|
|
January 1, 2011 | December 31, 2009 | December 31, 2008 | ||||||
|
|
$ | $ | $ | ||||||
|
|
|||||||||
|
(a) Asset impairment in the Mexican Fruit operation |
3,524 | - | - | ||||||
|
(b) Asset impairment in the California
|
1,154 |
- |
- |
||||||
|
(c) Intangible asset impairment
in |
2,355 |
- |
- |
||||||
|
(d) Rationalizations |
1,805 | 1,182 | - | ||||||
|
(e) Wind-up of defined benefit pension plan |
588 | - | - | ||||||
|
(f) Acquisition costs |
547 | - | - | ||||||
|
(g) Lawsuits |
- | 1,425 | - | ||||||
|
(h) Insurance proceeds |
- | - | (784 | ) | |||||
|
(i) Other |
972 | (362 | ) | 65 | |||||
|
|
10,945 | 2,245 | (719 | ) |
| (a) | Asset impairment in the Mexican Fruit Operations |
During the third quarter of 2010, the Company tested its long-lived assets in the Mexican Fruit Operations for recoverability due to indications that the carrying value of the long-lived assets may not have been recoverable. The Company operates two fruit processing facilities in Mexico that process fresh fruit for the food service and industrial fruit markets. In response to the needs of the Fruit Group operations, lack of profitability in the food service and industrial channels of the Fruit Group, and upon completion of the 2011 business plan for the Fruit Group, management has decided to rationalize operations at both of these facilities. Accordingly, a non−cash impairment charge of $3,524 was required to write the carrying value of property, plant and equipment used at these facilities down to its fair value. The estimated the fair value of the remaining long-lived assets was based on an external market appraisal of the long-lived assets.
| (b) | Asset impairment in the California Fruit Operation |
During the third quarter of 2010, the Company tested its long-lived assets in the California Fruit Operation for recoverability due to indications that the carrying value of the long-lived assets may not have been recoverable. The Company tested equipment used to process fresh fruit located at our facility located in Buena Park, California upon completion of the 2011 business plan. Previously, the Company expected that use of the equipment would be suspended for one year, and then redeployed to a Mexican fruit processing facility. Based on the 2011 business plan, management no longer expects that this equipment will be put back to productive use and accordingly, a non−cash impairment charge of $700 was required to write the carrying value of the equipment down to its estimated fair value. The fair value of the equipment represents its expected salvage value. Following the same circumstances, a non−cash impairment charge of $454 was also required to write down the carrying value of a supplier relationship intangible asset to $nil, as these relationships no longer have value without fresh processing capabilities. As there is no future operating stream of cash flows associated with these long-lived assets, and management believes there is no market for these assets to be sold, their estimated fair value is zero.
| (c) | Intangible asset impairment in the Brokerage Operation |
During the third quarter of 2010, the Company tested long-lived assets in its brokerage operation for recoverability due to indications that the carrying value of the long-lived assets may not have been recoverable. These long-lived assets, which consisted principally of a customer relationship intangible asset, were tested upon completion of the 2011 business plan. Expectations of customer retention and revenue growth have not materialized, and the expected sales volumes for the operation are insufficient to cover its back-office sales costs. Based on the 2011 business plan of the brokerage operation, its estimated undiscounted cash flows were not sufficient to recover the carrying value of the long−lived assets. Accordingly, a non−cash impairment charge of $2,355 was required to write the carrying value of the customer relationship asset down to zero. The brokerage operation is included in the Fruit Group segment.
| SUNOPTA INC. | -F50- | January 1, 2011 10-K |
| SunOpta Inc. |
| Notes to Consolidated Financial Statements |
| For the years ended January 1, 2011, December 31, 2009 and December 31, 2008 |
| (Expressed in thousands of U.S. dollars, except per share amounts) |
| 18. | Other expense (income), net, continued |
| (d) | Rationalizations |
During the fourth quarter of 2009, the Company decided to consolidate manufacturing facilities in British Columbia, Canada to Omak, Washington. The consolidation was completed in the fourth quarter of 2010. The Company incurred severance and other closure costs which were recorded as incurred. The Company does not expect to incur costs into 2011 related to this consolidation.
Also in the fourth quarter of 2009, the Company decided to rationalize its fruit operations and cease processing fresh fruit at a leased facility in Buena Park, California. During the first quarter of 2010, the Company incurred costs to move assets from the Buena Park, California facility to another facility. In addition, the Company terminated a number of employees in the Fruit Group in the fourth quarter of 2010, which resulted in severance costs. The Company does not expect to incur costs into 2011 related to this rationalization.
In the second quarter of 2010, the Company approved a rationalization plan at a distribution facility in Acton, Ontario, Canada to reduce selling and administrative costs in response to market conditions, and the sale of the Canadian Food Distribution assets (note 3). The Company does not expect to incur costs into 2011 related to this rationalization.
In the fourth quarter of 2010, the Company decided to close its brokerage operation located in Chicago, Illinois. The Company incurred severance and other closure costs, in addition to a charge of $265 for remaining rental costs, net of sublease revenue. The Company does not expect to incur costs into 2011 related to this rationalization.
A summary of the costs incurred to date, as well as expected future costs with respect to each of the rationalizations, that has been included in other expense, is included in the table below.
|
|
Further costs | |||||||||||
|
|
Costs recognized in | Costs recognized in | expected to be | Total expected | ||||||||
|
|
2009 | 2010 | recognized in 2011 | rationalization costs | ||||||||
|
|
$ | $ | $ | $ | ||||||||
|
|
||||||||||||
|
British Columbia,
Canada |
287 |
516 |
- |
803 |
||||||||
|
California, cease
processing |
1,016 |
282 |
- |
1,298 |
||||||||
|
Acton, Canada
headcount |
- |
636 |
- |
636 |
||||||||
|
Chicago, Illinois
office |
- |
371 |
- |
371 |
||||||||
|
|
1,303 | 1,805 | - | 3,108 |
Rationalization costs recognized in other expense for the year ended January 1, 2011 include $1,083 for severance, $64 of period costs to transfer property, plant and equipment to another location, $265 for future net rent costs until the end of an office lease, and $393 of other closure costs recorded as incurred. Of the costs incurred, $1,169 related to the Fruit Group and $636 related to the International Foods Group.
As at January 1, 2011, there were $362 in accrued severances related to rationalization activities.
| (e) | Wind-up of defined benefit pension plan |
As a result of the wind-up of a defined benefit pension plan in the current year that was assumed through an acquisition in 2007 (see note 22(a)), the Company recognized a non-cash charge of $588 that was previously recorded in accumulated other comprehensive income on the consolidated balance sheet.
| SUNOPTA INC. | -F51- | January 1, 2011 10-K |
| SunOpta Inc. |
| Notes to Consolidated Financial Statements |
| For the years ended January 1, 2011, December 31, 2009 and December 31, 2008 |
| (Expressed in thousands of U.S. dollars, except per share amounts) |
| 18. | Other expense (income), net, continued |
| (f) | Acquisition costs |
Represents costs incurred related to the 2010 acquisitions of Dahlgren & Company, Inc. and Edner of Nevada, Inc. (note 2). Under ASC Topic 805, “Business Combinations”, costs related to acquisitions are expensed to the consolidated statement of operations in the period incurred.
| (g) | Lawsuits |
Subsequent to the 2009 year-end, the Company settled the Vargas class action lawsuit against the Company which alleged violations of California’s labor laws (note 16(c)). The settlement was for $1,200 and is pending approval from the courts. As the amount of the settlement was likely and determinable, the Company recorded the settlement amount in other expense (income), net for the year ended December 31, 2009. In addition, the Company settled a claim related to commissions with a former business partner for $225, which was paid in 2010.
| (h) | Insurance proceeds |
During the year ended December 31, 2008, the Company received total cash proceeds of $1,947, which was $784 above the carrying cost of assets destroyed in fires at facilities in the Grains and Foods Group. As a result, the gain on disposal of assets was recorded as other income on the consolidated statement of operations.
| 19. | Derivative financial instruments and fair value measurement |
Effective January 1, 2008, the Company adopted the provisions of ASC 820-10-55 (formerly FASB FSP 157-2/SFAS 157, “Effective Date of FASB Statement No. 157”) applicable to financial assets and liabilities and to certain non-financial assets and liabilities that are measured at fair value on a recurring basis. Additionally, the Company applies the provisions of this standard to financial and non-financial assets and liabilities. This standard defines fair value, establishes a consistent framework for measuring fair value and expands disclosure requirements about fair value measurements. In addition, this standard requires the Company to maximize the use of observable inputs and minimize the use of unobservable inputs when measuring fair value.
This standard also provides a hierarchy of valuation techniques based on whether the inputs to those valuation techniques are observable or unobservable. Observable inputs reflect market data obtained from independent sources, while unobservable inputs reflect the Company’s assumptions with respect to how market participants would price an asset or liability. These two inputs used to measure fair value fall into the following three different levels of the fair value hierarchy:
- Level 1: Quoted prices (unadjusted) for identical assets or liabilities in active markets that are observable
- Level 2: Quoted prices for similar assets or liabilities in active markets; quoted prices for identical or similar assets or liabilities that are non-active; inputs other than quoted prices that are observable and derived from or are corroborated by observable market data
- Level 3: Valuations derived from valuation techniques in which one or more significant inputs are unobservable due to little or no market activity
This hierarchy requires the use of observable market data when available.
| SUNOPTA INC. | -F52- | January 1, 2011 10-K |
| SunOpta Inc. |
| Notes to Consolidated Financial Statements |
| For the years ended January 1, 2011, December 31, 2009 and December 31, 2008 |
| (Expressed in thousands of U.S. dollars, except per share amounts) |
| 19. | Derivative financial instruments and fair value measurement, continued |
The following table presents for each of the fair value hierarchies, the assets and liabilities that are measured at fair value on a recurring basis as of January 1, 2011:
|
|
Fair Value | ||||||||
|
|
Asset (Liability) | Level 1 | Level 2 | ||||||
|
(a) Commodity futures and forward contracts (1) |
|||||||||
|
Unrealized short-term derivative gain |
9,093 | - | 9,093 | ||||||
|
Unrealized long-term derivative gain |
342 | - | 342 | ||||||
|
Unrealized short-term derivative loss |
(7,674 | ) | (6,083 | ) | (1,591 | ) | |||
|
Unrealized long-term derivative loss |
(6 | ) | - | (6 | ) | ||||
|
(b) Inventories carried at market (2) |
17,353 | - | 17,353 | ||||||
|
(c) Interest rate swap (3) |
(891 | ) | - | (891 | ) | ||||
|
(d) Forward foreign currency contracts (4) |
569 | - | 569 |
| (1) | On the consolidated balance sheet, unrealized short-term derivative gain is included in prepaid expenses and other current assets, unrealized long-term derivative gain is included in other assets, unrealized short-term derivative loss is included in other current liabilities and unrealized long-term derivative loss is included in long-term liabilities. |
| (2) | Inventories carried at market are included in inventories on the consolidated balance sheet. |
| (3) | The interest rate swap is included in long-term liabilities on the consolidated balance sheet. |
| (4) | The forward foreign currency contracts are included in accounts receivable on the consolidated balance sheet. |
(a) Commodity futures and forward contracts
The Company’s derivative contracts that are measured at fair
value include exchange-traded commodity futures and forward commodity purchase
and sale contracts. Exchange-traded futures are valued based on unadjusted
quotes for identical assets priced in active markets and are classified as level
1. Fair value for forward commodity purchase and sale contracts is estimated
based on exchange-quoted prices adjusted for differences in local markets. Local
market adjustments use observable inputs or market transactions for similar
assets or liabilities, and, as a result, are classified as level 2. Based on
historical experience with the Company’s suppliers and customers, the Company’s
own credit risk, and the Company’s knowledge of current market conditions, the
Company does not view non-performance risk to be a significant input to fair
value for the majority of its forward commodity purchase and sale contracts.
These exchange-traded commodity futures and forward commodity purchase and sale contracts are used as part of the Company’s risk management strategy, and represent economic hedges to limit risk related to fluctuations in the price of certain commodity grains, as well as the price of cocoa. These derivative instruments are not designated as hedges for accounting purposes. A $1,503 gain for the year ended January 1, 2011 has been recorded in cost of goods sold on the consolidated statements of operations related to changes in the fair value of these derivatives.
At January 1, 2011, the notional amounts of open commodity futures and forward purchase and sale contracts were as follows:
|
|
Number of bushels | |||||
|
|
Purchase (sale) | |||||
|
|
Corn | Soybeans | ||||
|
Forward commodity purchase contracts |
1,900 | 1,558 | ||||
|
Forward commodity sale contracts |
(587 | ) | (419 | ) | ||
|
Commodity futures contracts |
(1,826 | ) | (1,938 | ) |
| SUNOPTA INC. | -F53- | January 1, 2011 10-K |
| SunOpta Inc. |
| Notes to Consolidated Financial Statements |
| For the years ended January 1, 2011, December 31, 2009 and December 31, 2008 |
| (Expressed in thousands of U.S. dollars, except per share amounts) |
| 19. | Derivative financial instruments and fair value measurement, continued |
In addition to the notional corn and soybean open futures and forward purchase and sale contracts noted above, the Company also has open forward contracts to purchase 45 lots of cocoa at January 1, 2011.
(b) Inventories carried at market
Grains inventory carried at fair value is determined using
quoted market prices from the Chicago Board of Trade (“CBoT”). Estimated fair
market values for grains inventory quantities at period end are valued using the
quoted price on the CBoT adjusted for differences in local markets, and broker
or dealer quotes. These assets are placed in level 2 of the fair value
hierarchy, as there are observable quoted prices for similar assets in active
markets. Gains and losses on commodity grains inventory are included in cost of
sales on the consolidated statements of operations. At January 1, 2011, the
Company had 615 bushels of commodity corn and 878 bushels of commodity soybeans,
in inventories carried at market.
(c) Interest rate swap
Opta Minerals entered into an interest rate swap to minimize
its exposure to interest rate risk. A notional amount of Cdn $17,200 (U.S. -
$17,293) of floating rate debt was effectively converted to fixed rate debt at a
rate of 5.25% for the period August 2008 to August 2012. At each period end,
management calculates the mark-to-market fair value using a valuation technique
using quoted observable prices for similar instruments as the primary input.
Based on this valuation, the previously recorded fair value is adjusted to the
current mark-to-market position. The mark-to-market gain or loss is placed in
level 2 of the fair value hierarchy. The interest rate swap is designated as a
cash flow hedge for accounting purposes and accordingly, gains and losses on
changes in the fair value of the interest rate swap are included in other
comprehensive income on the consolidated statements of operations. A $496 gain,
net of income taxes of $145, has been recorded in other comprehensive earnings
due to the change in fair value for this derivative.
(d) Foreign forward currency contracts
As part of its risk management strategy, the Company enters
into forward foreign exchange contracts to reduce its exposure to fluctuations
in foreign currency exchange rates. For any open forward foreign exchange
contracts at period end, the contract rate is compared to the forward rate, and
a gain or loss is recorded. These contracts are placed in level 2 of the fair
value hierarchy, as the inputs used in making the fair value determination are
derived from and are corroborated by observable market data. These forward
foreign exchange contracts represent economic hedges and are not designated as
hedging instruments. At January 1, 2011 the Company had open forward foreign
exchange contracts with a notional value of €4,787, Cdn $1,514 and U.S. $11,045
that resulted in an unrealized gain of $569 which is included in foreign
exchange gain on the consolidated statements of operations.
| 20. | Cash and cash equivalents |
Included in cash and cash equivalents is $495 (December 31, 2009 - $781) that is specific to Opta Minerals that cannot be utilized by the Company for general corporate purposes, and is maintained in separate bank accounts of Opta Minerals.
| 21. | Variable interest entities |
| (a) |
The Company, through its Grains and Foods Group, holds an investment in a joint venture in the United States related to processing, marketing, supply and sale of vegetable and other specialty oils. The Company has the option of purchasing all of the output from the joint venture, and selling the product through existing sales and marketing channels. The Company holds 50% of the voting common shares and consolidates its variable interest in the joint venture, as it has been determined to be the primary beneficiary. |
|
| |
|
The liabilities of the variable interest entity (“VIE”) consolidated by the Company represent claims against the specific assets of the VIE, and not additional claims on the Company’s general assets. There is no recourse available to the creditors of the VIE against the Company. The impact of consolidating the investment in the joint venture on the consolidated balance sheet is as follows: |
| SUNOPTA INC. | -F54- | January 1, 2011 10-K |
| SunOpta Inc. |
| Notes to Consolidated Financial Statements |
| For the years ended January 1, 2011, December 31, 2009 and December 31, 2008 |
| (Expressed in thousands of U.S. dollars, except per share amounts) |
| 21. | Variable interest entities, continued |
|
|
January 1, 2011 | December 31, 2009 | ||||
|
|
$ | $ | ||||
|
Current assets |
426 | 13 | ||||
|
Property, plant and equipment |
1,049 | 740 | ||||
|
Current liabilities |
1,028 | 169 | ||||
|
Long-term debt |
250 | - | ||||
|
Non-controlling interest |
(618 | ) | 112 | |||
|
Net investment by the Company |
(815 | ) | (472 | ) |
| (b) |
TOC, a wholly-owned subsidiary of the Company, holds an investment in a joint venture in Ethiopia related to hulling of organic sesame seeds. TOC purchases all of the output from the joint venture, and sells the product through its existing sales and marketing channels. TOC holds 35% of the voting common shares and consolidates its variable interest in the joint venture, as it has been determined to be the primary beneficiary. |
|
| |
|
The liabilities of the variable interest entity consolidated by the Company represent claims against the specific assets of the VIE, and not additional claims on the Company’s general assets. There is no recourse available to the creditors of the VIE against the Company. The impact of consolidating the investment in the joint venture on the consolidated balance sheet is as follows: |
|
|
January 1, 2011 | December 31, 2009 | ||||
|
|
$ | $ | ||||
|
Current assets |
859 | 253 | ||||
|
Property, plant and equipment |
1,767 | 2,762 | ||||
|
Current liabilities |
1,221 | 1,097 | ||||
|
Long-term debt |
264 | 380 | ||||
|
Long-term liabilities |
178 | 303 | ||||
|
Non-controlling interest |
424 | 658 | ||||
|
Net investment by the Company |
(539 | ) | (577 | ) |
| 22. | Employee future benefits |
| (a) | Global Trading Inc. Defined Benefit Plan |
Through its acquisition of Congeladora del Rio S.A. de C.V. and Global Trading Inc., the Company assumed a defined benefit pension plan. Funding for the plan is based on a function of compensation levels, benefit formulas and years of service. The plan was terminated as of March 1, 2009, with its dissolution and final payout occurring on June 29, 2010. As a result of the termination, the measurement date used for the accounting valuation for the defined benefit plan was January 1, 2010. Information regarding the defined benefit plan for the years ended January 1, 2011, December 31, 2009 and December 31, 2008 is as follows:
|
|
January 1, 2011 | December 31, 2009 | December 31, 2008 | ||||||
|
|
$ | $ | $ | ||||||
|
Pension expense (income): |
|||||||||
|
Current service cost |
- | 4 | 30 | ||||||
|
Interest cost |
19 | 35 | 48 | ||||||
|
Settlements and curtailments |
588 | - | - | ||||||
|
Expected return on plan assets |
(11 | ) | (23 | ) | (44 | ) | |||
|
Net pension expense (income) |
596 | 16 | 34 |
| SUNOPTA INC. | -F55- | January 1, 2011 10-K |
| SunOpta Inc. |
| Notes to Consolidated Financial Statements |
| For the years ended January 1, 2011, December 31, 2009 and December 31, 2008 |
| (Expressed in thousands of U.S. dollars, except per share amounts) |
| 22. | Employee future benefits, continued |
Information with respect to the assets and liabilities in the defined benefit plan is as follows:
|
|
January 1, 2011 | December 31, 2009 | ||||
|
|
$ | $ | ||||
|
Pension assets: |
||||||
|
Fair value of plan assets, beginning of year |
804 | 781 | ||||
|
Actual return on plan assets |
- | 23 | ||||
|
Contributions made during the year |
25 | - | ||||
|
Settlements and curtailments |
(824 | ) | - | |||
|
Fair value of plan assets, end of year |
5 | 804 |
|
|
January 1, 2011 | December 31, 2009 | ||||
|
|
$ | $ | ||||
|
Pension liability: |
||||||
|
Accrued benefit obligation, beginning of year |
823 | 747 | ||||
|
Current service cost |
- | 4 | ||||
|
Interest cost |
19 | 35 | ||||
|
Actuarial (gain) loss |
(13 | ) | 37 | |||
|
Benefits paid during the year |
(824 | ) | - | |||
|
Accrued benefit obligation, end of year |
5 | 823 |
A reconciliation of the net pension (liability) asset is as follows:
| January 1, 2011 | December 31, 2009 | |||||
| $ | $ | |||||
| Fair value of plan assets, end of year | 5 | 804 | ||||
| Accrued benefit obligation, end of year | (5 | ) | (823 | ) | ||
| Net pension (liability) asset, end of year | - | (19 | ) |
The net pension liability at January 1, 2011 and December 31, 2009 is included in long-term liabilities on the consolidated balance sheet.
At January 1, 2011, this defined benefit plan has been wound up, with all liabilities settled and substantially all of the remaining net assets distributed to the plan holders. Prior to winding-up the plan, the weighted average actuarial assumptions in measuring the accrued benefit obligation for the years ended January 1, 2011, December 31, 2009 and December 31, 2008 were as follows:
|
|
January 1, 2011 | December 31, 2009 | December 31, 2008 | ||||||
|
|
$ | $ | $ | ||||||
|
Project benefit obligation |
|||||||||
|
Discount rate |
4.7% | 4.7% | 4.6% | ||||||
|
Expected long-term return on plan assets |
3.0% | 3.0% | 3.0% | ||||||
|
Rate of compensation increase |
0.0% | 0.0% | 0.0% |
| SUNOPTA INC. | -F56- | January 1, 2011 10-K |
| SunOpta Inc. |
| Notes to Consolidated Financial Statements |
| For the years ended January 1, 2011, December 31, 2009 and December 31, 2008 |
| (Expressed in thousands of U.S. dollars, except per share amounts) |
| 22. | Employee future benefits, continued |
| (b) | TOC Defined Benefit Plan |
Through its acquisition of TOC, the Company assumed a defined benefit pension plan. Funding for the plan is based on a function of compensation levels, benefit formulas and years of service. The measurement date used for the accounting valuation for the defined benefit plan was December 31, 2010. Information regarding the defined benefit plan for the years ended January 1, 2011 and December 31, 2009, and the period from April 2, 2008 to December 31, 2008 is as follows:
|
|
January 1, 2011 | December 31, 2009 | December 31, 2008 | ||||||
|
|
$ | $ | $ | ||||||
|
Pension expense (income): |
|||||||||
|
Current service cost |
168 | 205 | 193 | ||||||
|
Interest cost |
52 | 32 | 19 | ||||||
|
Expected return on plan assets |
(46 | ) | (28 | ) | (16 | ) | |||
|
Net pension expense (income) |
173 | 209 | 196 |
Information with respect to the assets and liabilities in the defined benefit plan is as follows:
|
|
January 1, 2011 | December 31, 2009 | ||||
|
|
$ | $ | ||||
|
Pension assets: |
||||||
|
Fair value of plan assets, beginning of year |
833 | 324 | ||||
|
Actual return on plan assets |
47 | 212 | ||||
|
Contributions received |
170 | 274 | ||||
|
Actuarial loss |
(446 | ) | - | |||
|
Impact of foreign exchange |
(54 | ) | 23 | |||
|
Fair value of plan assets, end of year |
550 | 833 |
|
|
January 1, 2011 | January 1, 2011 | ||||
|
|
$ | $ | ||||
|
Pension liability: |
||||||
|
Accrued benefit obligation, beginning of year |
1,105 | 513 | ||||
|
Current service cost |
170 | 205 | ||||
|
Interest cost |
52 | 32 | ||||
|
Actuarial (gain) loss |
(426 | ) | 223 | |||
|
Employee contributions |
114 | 103 | ||||
|
Impact of foreign exchange |
(71 | ) | 29 | |||
|
Accrued benefit obligation, end of year |
944 | 1,105 |
| SUNOPTA INC. | -F57- | January 1, 2011 10-K |
| SunOpta Inc. |
| Notes to Consolidated Financial Statements |
| For the years ended January 1, 2011, December 31, 2009 and December 31, 2008 |
| (Expressed in thousands of U.S. dollars, except per share amounts) |
| 22. | Employee future benefits, continued |
A reconciliation of the net pension liability is as follows:
|
|
January 1, 2011 | December 31, 2009 | ||||
|
|
$ | $ | ||||
|
Fair value of plan assets, end of year |
550 | 833 | ||||
|
Accrued benefit obligation, end of year |
(944 | ) | (1,105 | ) | ||
|
Net pension liability, end of year |
(394 | ) | (272 | ) |
The net pension liability at January 1, 2011 and December 31, 2009 is included in long-term liabilities on the consolidated balance sheets.
Pension fund assets are invested primarily in money market securities, equity or debt securities and is adjusted based on the expected life of the plan and the expected retirement age of the plan participants. Information with respect to the amounts and types of securities that are in the plan is as follows:
|
|
Percentage of total | |||||
|
|
Amount | plan | ||||
|
|
$ | % | ||||
|
Equity securities |
- | - | ||||
|
Debt securities |
- | - | ||||
|
Other |
550 | 100.0% | ||||
|
|
550 | 100.0% |
The weighted average actuarial assumptions in measuring the accrued benefit obligation for the years ended January 1, 2011, December 31, 2009 and the period from the date of acquisition to December 31, 2008 is as follows:
|
|
January 1, 2011 | December 31, 2009 | December 31, 2008 | ||||||
|
|
$ | $ | $ | ||||||
|
Project benefit obligation |
|||||||||
|
Discount rate |
5.18% | 5.00% | 5.60% | ||||||
|
Expected long-term return on plan assets |
5.18% | 5.00% | 5.60% | ||||||
|
Rate of compensation increase |
2.40% | 2.00% | 2.00% |
The following table shows the estimated future benefit payments expected to be paid from the plan:
|
|
$ | ||
|
2011 |
- | ||
|
2012 |
- | ||
|
2013 |
- | ||
|
2014 |
- | ||
|
2015 |
- | ||
|
2016-2020 |
4 |
The expected contribution to be made by TOC to the defined benefit plan for the year ended December 31, 2011 is $59.
| SUNOPTA INC. | -F58- | January 1, 2011 10-K |
Supplemental financial information (unaudited)
Summarized below is the Consolidated Statement of Operations for the quarters ended January 1, 2011, October 2, 2010, July 3, 2010 and April 3, 2010, as well as the fiscal 2009 quarterly comparatives.
|
|
Quarter ended | |||||
|
|
January 1, 2011 | December 31, 2009 | ||||
|
|
$ | $ | ||||
|
|
||||||
|
Revenues |
230,392 | 199,268 | ||||
|
Cost of goods sold |
193,766 | 171,122 | ||||
|
Gross profit |
36,626 | 28,146 | ||||
|
|
||||||
|
Warehousing and distribution expenses |
809 | 1,189 | ||||
|
Selling, general and administrative expenses |
24,909 | 23,671 | ||||
|
Intangible asset amortization |
1,201 | 1,071 | ||||
|
Other expense, net |
2,133 | 2,587 | ||||
|
Goodwill impairment |
- | 500 | ||||
|
Foreign exchange gain |
(158 | ) | (367 | ) | ||
|
|
||||||
|
Earnings (loss) from continuing operations before the following |
7,732 | (505 | ) | |||
|
|
||||||
|
Interest expense, net |
2,124 | 3,680 | ||||
|
|
||||||
|
Earnings (loss) from continuing operations before income taxes |
5,608 | (4,185 | ) | |||
|
|
||||||
|
Provision for (recovery of) income taxes |
2,791 | (1,995 | ) | |||
|
|
||||||
|
Earnings (loss) from continuing operations |
2,817 | (2,190 | ) | |||
|
|
||||||
|
Discontinued operations |
||||||
|
Loss from discontinued operations, net of taxes |
(726 | ) | (303 | ) | ||
|
|
||||||
|
Loss from discontinued operations, net of taxes |
(726 | ) | (303 | ) | ||
|
|
||||||
|
Earnings (loss) |
2,091 | (2,493 | ) | |||
|
|
||||||
|
Earnings (loss) attributable to non-controlling interests |
171 | (279 | ) | |||
|
|
||||||
|
Earnings (loss) attributable to SunOpta Inc. |
1,920 | (2,214 | ) | |||
|
|
||||||
|
Earnings (loss) per share - basic |
||||||
|
-from continuing operations |
0.04 | (0.02 | ) | |||
|
-from discontinued operations |
(0.01 | ) | (0.01 | ) | ||
|
|
0.03 | (0.03 | ) | |||
|
|
||||||
|
Earnings (loss) per share - diluted |
||||||
|
-from continuing operations |
0.04 | (0.02 | ) | |||
|
-from discontinued operations |
(0.01 | ) | (0.01 | ) | ||
|
|
0.03 | (0.03 | ) | |||
| SUNOPTA INC. | -F59- | January 1, 2011 10-K |
Supplemental financial information (unaudited) continued
|
|
Quarter ended | |||||
|
|
October 2, 2010 | September 30, 2009 | ||||
|
|
$ | $ | ||||
|
|
||||||
|
Revenues |
217,905 | 212,488 | ||||
|
Cost of goods sold |
184,698 | 183,949 | ||||
|
Gross profit |
33,207 | 28,539 | ||||
|
|
||||||
|
Warehousing and distribution expenses |
702 | 1,036 | ||||
|
Selling, general and administrative expenses |
21,412 | 21,747 | ||||
|
Intangible asset amortization |
1,155 | 1,300 | ||||
|
Other expense (income), net |
7,453 | (270 | ) | |||
|
Goodwill impairment |
1,654 | 8,341 | ||||
|
Foreign exchange gain |
(58 | ) | (639 | ) | ||
|
|
||||||
|
Earnings (loss) from continuing operations before the following |
889 | (2,976 | ) | |||
|
|
||||||
|
Interest expense, net |
2,036 | 3,883 | ||||
|
|
||||||
|
Earnings (loss) from continuing operations before income taxes |
(1,147 | ) | (6,859 | ) | ||
|
|
||||||
|
Recovery of income taxes |
(1,258 | ) | (145 | ) | ||
|
|
||||||
|
Earnings (loss) from continuing operations |
111 | (6,714 | ) | |||
|
|
||||||
|
Discontinued operations |
||||||
|
Earnings (loss) from discontinued operations, net of taxes |
(15,415 | ) | (150 | ) | ||
|
Gain on sale of discontinued operations, net of taxes |
49,867 | - | ||||
|
|
||||||
|
Earnings (loss) from discontinued operations, net of taxes |
34,452 | (150 | ) | |||
|
|
||||||
|
Earnings (loss) |
34,563 | (6,864 | ) | |||
|
|
||||||
|
Earnings (loss) attributable to non-controlling interests |
496 | (2,192 | ) | |||
|
|
||||||
|
Earnings (loss) attributable to SunOpta Inc. |
34,067 | (4,672 | ) | |||
|
|
||||||
|
Earnings (loss) per share - basic |
||||||
|
-from continuing operations |
(0.01 | ) | (0.07 | ) | ||
|
-from discontinued operations |
0.53 | - | ||||
|
|
0.52 | (0.07 | ) | |||
|
|
||||||
|
Earnings (loss) per share - diluted |
||||||
|
-from continuing operations |
- | (0.07 | ) | |||
|
-from discontinued operations |
0.52 | - | ||||
|
|
0.52 | (0.07 | ) | |||
| SUNOPTA INC. | -F60- | January 1, 2011 10-K |
Supplemental financial information (unaudited) continued
|
|
Quarter ended | |||||
|
|
July 3, 2010 | June 30, 2009 | ||||
|
|
$ | $ | ||||
|
|
||||||
|
Revenues |
233,887 | 216,099 | ||||
|
Cost of goods sold |
195,822 | 187,748 | ||||
|
Gross profit |
38,065 | 28,351 | ||||
|
|
||||||
|
Warehousing and distribution expenses |
1,122 | 974 | ||||
|
Selling, general and administrative expenses |
24,089 | 22,364 | ||||
|
Intangible asset amortization |
1,144 | 1,085 | ||||
|
Other (income) expense, net |
1,044 | 116 | ||||
|
Foreign exchange gain |
(319 | ) | (672 | ) | ||
|
|
||||||
|
Earnings from continuing operations before the following |
10,985 | 4,484 | ||||
|
|
||||||
|
Interest expense, net |
2,567 | 3,470 | ||||
|
|
||||||
|
Earnings from continuing operations before income taxes |
8,418 | 1,014 | ||||
|
|
||||||
|
Provision for income taxes |
1,895 | 388 | ||||
|
|
||||||
|
Earnings from continuing operations |
6,523 | 626 | ||||
|
|
||||||
|
Discontinued operations |
||||||
|
(Loss) earnings from discontinued operations, net of taxes |
320 | 920 | ||||
|
Gain on sale of discontinued operations, net of taxes |
13,809 | - | ||||
|
|
||||||
|
Earnings from discontinued operations, net of taxes |
14,129 | 920 | ||||
|
|
||||||
|
Earnings |
20,652 | 1,546 | ||||
|
|
||||||
|
Earnings (loss) attributable to non-controlling interests |
186 | (234 | ) | |||
|
|
||||||
|
Earnings attributable to SunOpta Inc. |
20,466 | 1,780 | ||||
|
|
||||||
|
Earnings per share - basic |
||||||
|
-from continuing operations |
0.10 | 0.01 | ||||
|
-from discontinued operations |
0.22 | 0.02 | ||||
|
|
0.32 | 0.03 | ||||
|
|
||||||
|
Earnings per share - diluted |
||||||
|
-from continuing operations |
0.09 | 0.01 | ||||
|
-from discontinued operations |
0.21 | 0.02 | ||||
|
|
0.30 | 0.03 | ||||
| SUNOPTA INC. | -F61- | January 1, 2011 10-K |
Supplemental financial information (unaudited) continued
|
|
Quarter ended | |||||
|
|
April 3, 2010 | March 31, 2009 | ||||
|
|
$ | $ | ||||
|
|
||||||
|
Revenues |
216,747 | 191,304 | ||||
|
Cost of goods sold |
180,201 | 167,117 | ||||
|
Gross profit |
36,546 | 24,187 | ||||
|
|
||||||
|
Warehousing and distribution expenses |
1,070 | 1,024 | ||||
|
Selling, general and administrative expenses |
25,931 | 21,685 | ||||
|
Intangible asset amortization |
1,175 | 1,195 | ||||
|
Other expense (income), net |
315 | (188 | ) | |||
|
Foreign exchange (gain) loss |
(1,117 | ) | 1,158 | |||
|
|
||||||
|
Earnings (loss) from continuing operations before the following |
9,172 | (687 | ) | |||
|
|
||||||
|
Interest expense, net |
3,022 | 2,818 | ||||
|
|
||||||
|
Earnings (loss) from continuing operations before income taxes |
6,150 | (3,505 | ) | |||
|
|
||||||
|
Provision for (recovery of) income taxes |
2,035 | (1,460 | ) | |||
|
|
||||||
|
Earnings (loss) from continuing operations |
4,115 | (2,045 | ) | |||
|
|
||||||
|
Earnings from discontinued operations, net of taxes |
526 | 66 | ||||
|
|
||||||
|
Earnings |
4,641 | (1,979 | ) | |||
|
|
||||||
|
Earnings (loss) attributable to non-controlling interests |
28 | (322 | ) | |||
|
|
||||||
|
Earnings attributable to SunOpta Inc. |
4,613 | (1,657 | ) | |||
|
|
||||||
|
Earnings per share - basic |
||||||
|
-from continuing operations |
0.06 | (0.03 | ) | |||
|
-from discontinued operations |
0.01 | - | ||||
|
|
0.07 | (0.03 | ) | |||
|
|
||||||
|
Earnings per share - diluted |
||||||
|
-from continuing operations |
0.06 | (0.03 | ) | |||
|
-from discontinued operations |
0.01 | - | ||||
|
|
0.07 | (0.03 | ) | |||
| SUNOPTA INC. | -F62- | January 1, 2011 10-K |