Attached files
| file | filename |
|---|---|
| EX-21 - EXHIBIT 21 - SunOpta Inc. | exhibit21.htm |
| EX-32 - EXHIBIT 32 - SunOpta Inc. | exhibit32.htm |
| EX-23.2 - EXHIBIT 23.1 - SunOpta Inc. | exhibit23-1.htm |
| EX-31.2 - EXHIBIT 31.2 - SunOpta Inc. | exhibit31-2.htm |
| EX-23.2 - EXHIBIT 23.2 - SunOpta Inc. | exhibit23-2.htm |
| EX-31.1 - EXHIBIT 31.1 - SunOpta Inc. | exhibit31-1.htm |
UNITED STATES
SECURITIES AND EXCHANGE COMMISSION
WASHINGTON, D.C. 20549
FORM 10-K
(X) ANNUAL REPORT PURSUANT TO SECTION 13 or 15(d) OF THE SECURITIES EXCHANGE ACT OF 1934
For the fiscal year ended December 31, 2009
TRANSITION REPORT PURSUANT TO SECTION 13 OR 15(d) OF THE SECURITIES EXCHANGE ACT OF 1934
Commission File No. 001-34198
SUNOPTA INC.
(Exact name of
registrant as specified in its charter)
CANADA
(Jurisdiction of Incorporation)
Not Applicable
(I.R.S. Employer Identification
No.)
2838 Bovaird Drive West
Brampton, Ontario L7A 0H2,
Canada
(Address of Principle Executive Offices)
(905) 455-1990
(Registrant's telephone number,
including area code)
| Securities registered pursuant to Section 12(b) of the Act: | Name of Each Exchange on Which Registered: |
| Common Shares, no par value | NASDAQ Global Select Market |
Securities registered pursuant Section to 12(g) of the Act: NONE
Indicate by check mark if the registrant is a well-known seasoned issuer, as defined in Rule 405 of the Securities Act.
Yes [ ] No [ x ]
Indicate by check mark if the registrant is not required to file reports pursuant to Section 13 or Section 15(d) of the Act.
Yes [ ] No [ x ]
Indicate by check mark whether the registrant (1) has filed all reports required to be filed by Section 13 or 15(d) of the Securities Exchange Act of 1934 during the preceding 12 months (or for such shorter period that the registrant was required to file such reports) and (2) has been subject to such filing requirements for the past 90 days.
Yes [ x ] No [ ]
Indicate by check mark whether the registrant has submitted electronically and posted on its corporate Web site, if any, every Interactive Data File required to be submitted and posted pursuant to Rule 405 of Regulation S-T (§ 232.405 of this chapter) during the preceding 12 months (or for such shorter period that the registrant was required to submit and post such files).
Yes [ ] No [ ]
Indicate by check mark if disclosure of delinquent filers pursuant to Item 405 of Regulation S-K is not contained herein and will not be contained, to the best of the registrant’s knowledge, in definitive proxy or information statements incorporated by reference in Part III of this Form 10-K or any amendment to this Form 10-K. [ x ]
Indicate by check mark whether the registrant is a large accelerated filer, an accelerated filer, a non-accelerated filer, or a smaller reporting company. See definition of “large accelerated filer”, “accelerated filer” and “smaller reporting company”) in Rule 12b-2 of the Act. Check one:
| Large accelerated filer [ ] | Accelerated filer [ x ] | Non-accelerated filer [ ] | Smaller Reporting Company [ ] |
Indicate by check mark whether the registrant is a shell company (as defined in Rule 12b-2 of the Exchange Act).
Yes [ ] No [ x ]
Aggregate market value of the common shares held by non-affiliates of the registrant, computed using the closing price of the NASDAQ Global Select Market for the registrant’s common stock on March 4, 2010 was $206,534,020. The registrant’s common shares trade on the NASDAQ Global Select Market under the symbol STKL and on the Toronto Stock Exchange under the symbol SOY.
The number of shares of the registrant’s common stock outstanding as of March 4, 2010 was 64,982,968.
| SunOpta Inc. | 1 | December 31, 2009 – 10-K |
SUNOPTA INC.
TABLE OF CONTENTS
FORM 10-K
| SunOpta Inc. | 2 | December 31, 2009 – 10-K |
Currency Presentation
All dollar amounts in this report are expressed in United States dollars. Amounts expressed in Canadian dollars are preceded by the symbol “Cdn$”. On March 4, 2010, the noon buying rate in New York City for cable transfers in Canadian dollars for customs purposes by the Federal Reserve Bank of New York was $0.9700 for Cdn $1.00. In 2009 (1) The rate of exchange for the Canadian dollar, expressed in U.S. dollars, in effect at the end of the year was 0.9515, (2) the average of exchange rates in effect on the last day of each month during the year was $0.8760, and (3) the high and low exchange rates during the year was $0.9755 and $0.7653, respectively.
Forward-Looking Statements
This report contains forward-looking statements which are based on our current expectations and assumptions and involve a number of risks and uncertainties. Generally, forward-looking statements do not relate strictly to historical or current facts and are typically accompanied by words such as “anticipate,” “believe,” “expect,” “could,” “might,” “plan,” “will,” and words and phrases of similar impact and include, but are not limited to references to proposed operational consolidation, business strategies, plant capacities, revenue generation potential and anticipated construction costs, competitive strengths, goals, capital expenditure plans, business and operational growth and expansion plans, anticipated operating margins and operating income increases, cost reductions, rationalization and improved efficiency initiatives, proposed new product offerings, and references to the future growth of the business and global markets for the Company’s products. These forward-looking statements are made pursuant to the safe harbor provisions of the Private Securities Litigation Reform Act of 1995. These forward-looking statements are based on certain assumptions and analyses we make in light of our experience and our interpretation of current conditions, historical trends and expected future developments as well as other factors that we believe are appropriate in the circumstance.
Whether actual results and developments will agree with our expectations and predictions is subject to many risks and uncertainties including, but not limited to, general economic, business, weather or market risk conditions; the achievement of business forecasts; the outcome of any pending litigation; competitive actions by other companies; changes in laws or regulations or policies of local governments in the regions where the Company operates; construction delays; and labour issues, many of which are beyond our control. Consequently all forward-looking statements made herein are qualified by these cautionary statements and there can be no assurance that our actual results or the developments we anticipate will be realized. For a fuller discussion of the risks facing us and our operations you should also refer to Item 1A, Risk Factors.
| SunOpta Inc. | 3 | December 31, 2009 – 10-K |
PART I
Item 1. Business
Introduction
SunOpta Inc., a corporation organized under the laws of Canada in 1973, divides its operations into the following three industry segments:
-
SunOpta Foods, which accounted for approximately 94% of 2009 consolidated revenues.
-
Opta Minerals Inc. (“Opta Minerals”), which represented approximately 6% of 2009 consolidated revenues.
-
SunOpta BioProcess Inc. (“SunOpta BioProcess”), which represented less than 0.1% of 2009 consolidated revenues.
SunOpta Foods operates in the natural, organic and specialty foods and natural health product sectors, markets, which we believe will continue to grow as consumers focus on health and wellness. SunOpta Foods is comprised of five separate operating groups:
-
Grains and Foods Group
-
Ingredients Group
-
Fruit Group
-
International Sourcing and Trading Group
-
Distribution Group
These groups use a combination of specific and vertically integrated seed to table capabilities and preferred sourcing contracts to serve the fast growing natural, organic and specialty foods and natural health product sectors.
Opta Minerals processes, sells and distributes silica-free loose abrasives and other specialty industrial minerals to the foundry, steel, roofing shingle and marine/bridge cleaning industries; sources specialty sands and garnets for the water filtration industry; and recycles inorganic materials under special permits from government authorities at both its Waterdown, Ontario and Norfolk, Virginia sites. Opta Minerals is traded on the Toronto Stock Exchange (“TSX”), under the symbol “OPM.” We currently own approximately 66.4% of its issued and outstanding common shares.
SunOpta BioProcess operates facilities in Brampton, Ontario and pilot plant facilities in Waterdown, Ontario. SunOpta BioProcess, provides equipment and process solutions for the biomass conversion industry, from process development and design through the sale of proprietary biomass processing technology with a current focus on applications in the production of cellulosic ethanol. SunOpta BioProcess offers extensive scientific and engineering capabilities, and holds a number of patents on its proprietary steam explosion technology and related processes. This technology has wide potential in cellulosic ethanol, pulp, and food ingredients processing and offers licensing and applications potential. The proprietary steam explosion technology uses high temperature and pressure rather than chemicals to process biomass which can then be used to produce various products for further processing.
| SunOpta Inc. | 4 | December 31, 2009 – 10-K |
Segment Information
Each of our industry segments - SunOpta Foods, Opta Minerals and SunOpta BioProcess - reports as a separate segment. Our assets, operations and employees are principally located in North America, and, more recently, in Europe as a result of the 2007 acquisition of Newco a.s. (Slovak Republic) by Opta Minerals and our acquisitions in 2008 of The Organic Corporation BV (The Netherlands) and MCP Mg-Serbien SAS (France). Financial information for each segment describing revenues from external customers, a measure of profit or loss, and total assets for the last three fiscal years as well as financial information about geographic areas for the last three fiscal years is set forth in Note 17 to the Consolidated Financial Statements.
Major Developments in 2009 and 2010
On September 24, 2009, we announced that we had entered into a tentative agreement to settle all claims raised in the securities class action proceedings arising from the restatement of our interim financial results for the first three quarters of 2007. In return for the dismissal of the class actions and the releases from proposed class action members of settled claims against us and the other named defendants, the settlement agreement provides for a total cash contribution of US $11,250,000 to a settlement fund. The settlement fund will be entirely funded by our insurer. The settlement is conditional upon the court’s approval and our option to terminate in the event that opt-outs by class action members exceed a pre-agreed threshold. See Item 3 “Legal Proceedings” for more information about the class action lawsuits and the proposed settlement agreement.
On October 30, 2009, we completed the conversion of our syndicated credit facilities supporting all operations excluding Opta Minerals, SunOpta BioProcess and non-North American food operations, to an Asset-Based Lending (“ABL”) arrangement. The ABL arrangement changes our credit facilities such that credit limits in both our Canadian and U.S. lines of credit are based on a borrowing base supported by our accounts receivable and inventories, determined on a monthly basis. In addition, our non-revolving and acquisition facilities were eliminated, and the existing balances refinanced using our U.S. line of credit. The conversion also decreased the interest rate premium charged on outstanding balances which are based on new financial ratios. Under the new ABL arrangement, the term of our syndicated credit facilities was extended to October 30, 2012.
During 2009 we implemented a number of cost-saving measures, including headcount reductions, in connection with our continuous improvement initiatives across the organization in response to the general economic conditions. We temporarily closed our Rosarito, Mexico fruit processing facility, negotiated a sub-lease for our Salinas, California facility, permanently closed a sales office within the Fruit Group operations in South Carolina and an International Sourcing and Trading sales office in Austria, significantly reduced operations at a fruit processing facility in California, and closed a soy concentrate processing facility and an ingredients drying operation. We expect further operational consolidations through the first half of 2010. Opta Minerals also executed a number of cost rationalization programs which included the sale of certain facilities, termination of certain lease obligations and extensive cost rationalization across the entire organization.
During 2009 we also continued to focus significant effort on working capital and debt reduction. These efforts have resulted in a year over year reduction in consolidated inventory levels of $22,549,000 or 11.2%. A corresponding year over year reduction in consolidated long-term debt and bank indebtedness of $28,112,000 or 15.7% was realized due to this reduction in inventories combined with efforts to maximize cash generated from operations.
We appointed Mr. Eric Davis as Vice President and Chief Financial Officer effective March 16, 2009. Mr. Davis is a Chartered Accountant and brings over 25 years of diverse global finance and accounting experience to this position. In this role, Mr. Davis assumed responsibility for financial reporting, tax, banking and treasury, investor relations and special projects.
| SunOpta Inc. | 5 | December 31, 2009 – 10-K |
SUNOPTA FOODS
SunOpta Foods has been built through the acquisition of 31 business operations and through significant internal growth. It is a vertically integrated natural, organic and specialty foods and natural health products company, with global operations, serving domestic and international markets and representing approximately 94% of our consolidated revenues. Below is a summary listing of acquisitions and significant facilities that we have acquired since the inception of the SunOpta Foods. No business acquisitions were made in 2009. See Note 2 of the consolidated financial statements for further details of our acquisition made in 2008.
| Date of Acquisition | Business Operations and Significant Facilities Acquired |
| August 3, 1999 |
Sunrich Inc (Grains and Foods Group) |
| August 15, 2000 |
Certain assets of Hoffman Aseptic (Grains and Foods Group) |
| September 18, 2000 |
Northern Food and Dairy, Inc. (Grains and Foods Group and Ingredients Group) |
| March 14, 2001 |
First Light Foods Inc. (Grains and Foods Group) |
| July 18, 2002 |
Certain assets of Organic Kitchen Inc. (Distribution Group) |
| November 1, 2002 |
Wild West Organic Harvest Co-operative (Distribution Group) |
| December 1, 2002 |
Simply Organic Co. Ltd. (Distribution Group) |
| December 4, 2002 |
Opta Food Ingredients, Inc. (Ingredients Group) |
| May 8, 2003 |
Kettle Valley Dried Fruit Ltd. (Fruit Group) |
| October 17, 2003 |
Pro Organics Marketing, Inc. (Distribution Group) |
| November 1, 2003 |
SIGCO Sun Products, Inc (Grains and Foods Group) |
| December 1, 2003 |
Sonne Labs, Inc. (Grains and Foods Group) |
| March 1, 2004 |
Distribue-Vie Fruits & Legumes Biologiques Inc. (Distribution Group) |
| April 19, 2004 |
Purchase of the assets of General Mills Bakeries & Foodservice oat fiber processing facility (Ingredients Group) |
| May 1, 2004 |
Supreme Foods Limited (Distribution Group) |
| May 31, 2004 |
Assets of Snapdragon Natural Foods Inc. (Distribution Group) |
| September 1, 2004 |
Kofman-Barenholtz Foods Limited (Distribution Group) |
| September 13, 2004 |
51% of the outstanding shares of Organic Ingredients, Inc. (The remaining 49% of the outstanding shares were acquired on April 5, 2005) (International Sourcing and Trading Group) |
| June 2, 2005 |
Earthwise Processors, LLC (Grains and Foods Group) |
| June 20, 2005 |
Cleugh’s Frozen Foods, Inc. (Fruit Group) |
| July 13, 2005 |
Pacific Fruit Processors, Inc. (Fruit Group) |
| December 22, 2005 |
Les Importations Cacheres Hahamovitch Inc. (Distribution Group) |
| September 21, 2006 |
Purity Life Health Products Limited (Distribution Group) |
| November 7, 2006 |
Hess Food Group LLC (Fruit Group) |
| November 9, 2006 |
Quest Vitamins Brand of vitamins (Distribution Group) |
| December 18, 2006 |
Aux Milles et une Saisons Inc. (Distribution Group) |
| May 4, 2007 |
Certain assets of Baja California Congelados, S.A. de C.V. (Fruit Group) |
| May 14, 2007 |
Net operating assets of Congeladora del Rio, S.A. de C.V. and all of the outstanding shares of Global Trading Inc. (Fruit Group) |
| August 7, 2007 |
Operating assets of a soymilk manufacturing facility in Heuvelton, New York (Grains and Foods Group) |
| December 6, 2007 |
Neo-Nutritionals, Inc. (Distribution Group) |
| April 2, 2008 |
The Organic Corporation (International Sourcing and Trading Group) |
SunOpta Foods’ long-term strategy is to leverage the platform it has developed via implementation of continuous improvement principles, new product development and a focus on value-added components of the business, and to continue to pursue selective acquisitions that align with the value-added components of its vertically integrated model. We believe that the natural organic and specialty foods and natural health products markets offer solid long-term growth opportunities as consumers focus on health and wellness and see diet as a key part of a healthy lifestyle. We also believe these markets remain fragmented with numerous players in North America and internationally.
| SunOpta Inc. | 6 | December 31, 2009 – 10-K |
Specific strategies of SunOpta Foods in the last several years have included the following.
-
Diversify the range of organic and non-genetically modified (“non-GMO”) grains-based and fruit-based products that we market, including via the acquisition of businesses that are vertically integrated through ingredients and packaged products.
-
Develop value-added natural and organic fiber and food ingredient solutions to meet demands of food manufacturers wanting to improve the healthfulness of their products or expand into the natural and organic markets.
-
Expand the Canadian natural and organic produce, grocery and natural health products distribution businesses to maintain our position as the leading coast-to-coast distributor in Canada.
-
Expand our ability to source and supply natural and organic products worldwide.
-
Invest in healthy convenience food businesses, which we believe will continue to be a strong area of growth for natural and organic food products.
-
Expand the number of customer private label natural and organic programs including the soy and rice beverage categories, frozen fruit and fruit beverages, and healthy convenience foods.
-
Develop and expand our operations outside of North America, including acquisitions and by entering into partnerships and strategic alliances with food producers from developing nations.
Major Developments in 2009 and 2010 in SunOpta Foods
We continue to increase our strength in the natural, organic and specialty foods and natural health products sectors through internal growth and selective acquisitions. Achievements through March 4, 2010 include the following:
Commercial production began June 8, 2009 at the Grains and Food Group’s new soy processing and aseptic packaging facility located in Modesto, California. This new facility significantly expands our capacity to produce aseptic soy and alternate beverages and other aseptically packaged products. The location of the new facility also improves our cost structure when servicing West coast customers. As a result of the successful commissioning of the Modesto facility, soy concentrate operations located in Afton, Wyoming were closed, production transferred to Modesto, and the Wyoming facility was sold.
On October 27, 2009, we announced that the Ingredients Group expanded its portfolio of fiber products to include MultiFiber™ blends, SunOpta™ Soy Fiber blends, and SunOpta™ Pea Fiber. These new and innovative ingredients are expected to provide value for food and beverage manufacturers who are looking for ratios of soluble and insoluble fibers similar to what occurs naturally in foods. At the same time, the Ingredients Group also announced that it had entered into a distribution agreement with Best Cooking Pulses of Portage la Prairie, Manitoba, Canada which will produce pea fiber under the SunOpta brand. Pea fiber is made from the hulls of field-dried peas and is a by-product of pea splitting. We believe this expansion of our healthy ingredient solutions will help the Ingredients Group meet growing demand for fiber fortified foods.
| SunOpta Inc. | 7 | December 31, 2009 – 10-K |
On November 19, 2009, we announced the completion of construction of the first natural and organic sesame hulling plant in Ethiopia, operated as Selet Hulling Plc. The operation is 35% owned by Tradin Organic Agriculture B.V., a division within our International Trading and Sourcing Group, and 65% owned by Kaleb Service Farmers House, an Ethiopian company. Located near Addis Ababa, Ethiopia, the plant was funded in part by a financial grant from the Government of The Netherlands and has the capacity to process 10,000 metric tons of sesame per year with the potential to generate revenues in excess of US $20,000,000 annually. Selet Hulling's natural and organic sesame products will be sold exclusively by Tradin Organic to export markets for use in the food ingredient and bakery industries. It will purchase sesame seeds from grower owned cooperatives representing over 1,500 farmers in Humera, a region situated to the north of Addis Ababa, Ethiopia. Selet Hulling has also developed a research and development operation in Humera and is working on methods to improve product quality and farm yields. When combined with an equitable payment structure, Selet Hulling is helping to create a platform for sustainable agriculture in Ethiopia that will provide better incomes for farmers, improve the well-being of their families and provide needed support for local schools and other community infrastructure.
On December 1, 2009, the Grains and Foods Group, through our wholly-owned subsidiary, SunOpta Africa, entered into a strategic alliance with Specialized Protein Products ("SPP") of South Africa, to manufacture and sell liquid and powdered soy ingredients and soymilk beverages in Africa and other international markets. The alliance provides the Grains and Foods Group with an increased supply of high quality soymilk products and improved logistics, which are expected to further expand our ability to compete effectively in world markets for natural and organic soy-based ingredients and packaged products. As part of the alliance, the Grains and Foods Group is consulting with SPP plant operations to improve both quality and production processes. In addition, we are working with local farmers in the Southern African region to implement programs to improve the quality of soybeans that the facility will ultimately use for manufacturing. In order to support operations, SunOpta Africa opened an office in Durban, South Africa for sales and technical support.
On January 27, 2010, we announced the commencement of an environmentally responsible energy recovery project at our Cambridge, Minnesota oat fiber facility within our Ingredients Group. The project involves the extraction of methane from the digestion of waste-water resulting from the oat fiber production process, and subsequent conversion of that methane into pipeline quality natural gas that will be used to help power the facility. When completed, this project will significantly reduce the amount of greenhouse gases and various waste materials emitted from the facility, as well as provide an acceptable return on invested capital as a result of significantly lower utility expense.
On February 23, 2010, we announced that the Grains and Foods Group has completed an upgrade and retrofit at its Alexandria, Minnesota aseptic processing and packaging facility and has commenced its first production of natural broth and soup products for a major international packaged goods company. This upgrade gives us the capacity to produce approximately 170 million liters annually of natural and organic alternative beverages such as soy, rice, almond and others as well as broth and soup products and also expands our packaging size capabilities for these products for a variety of different formats. In tandem with the facility upgrade, the Grains and Foods Group entered into a three-year packaging agreement with a global consumer products company to produce aseptically processed and packaged natural broth products.
| SunOpta Inc. | 8 | December 31, 2009 – 10-K |
GRAINS AND FOODS GROUP
Operations and product offerings – Grains and Foods Group
The Grains and Foods Group is headquartered in Minneapolis, Minnesota. It specializes in marketing organic, identity preserved (“IP”), and non-GMO grains, ingredients, packaged goods and processing services with a core focus on soybean, sunflower and corn products. The Grains and Foods Group ensures that it provides its customers with high quality organic, non-GMO and IP specialty grains and seeds, by serving as a grower’s supplier of seed, purchaser of the grower’s specialty crops and distributor of IP and organic specialty products. We believe the “seed to table” approach allows the Grains and Foods Group to satisfy the specific needs of domestic and foreign food manufacturers and processors by providing products in the varieties and quantities needed in a timely fashion; transporting products to meet customers’ needs by being able to package in containers, truck, rail or barge; providing product information and technical support during the growing, processing, and marketing phases; and offering complete product service including grading, formulation, processing, quality control and packaging.
The Grains and Foods Group’s products include:
| 1) |
A wide variety of IP, non-GMO and organic whole grains including soy, corn and sunflower for food applications offering premium varieties with superior food quality. The vertically integrated model results in control at every stage of production, from seed selection and growing to storage, processing and transportation. | |||
| 2) |
Organic, non-GMO and IP grains based ingredients, including: | |||
|
|
Raw material sourcing and processing of soy based ingredients in liquid, spray-dried and roasted formats. | |||
|
|
Grain-based ingredients which utilize non-GMO and organic soy, corn, sunflower and rice; specialty organic functional ingredients including maltodextrins, tack blends, fiber products, flavor enhancing products including snack coatings, cheese powders and flavor systems, an innovative line of organic dairy ingredients and organic soy and sunflower oils. | |||
| 3) |
A variety of packaged food products for retail and foodservice use, including: | |||
|
|
A wide variety of private label packaged products for a large number of retailers and consumer food companies, including aseptic and refrigerated soymilk, rice, almond and other alternate beverages; aseptic broths and soups; frozen edamame and vegetable blends; and roasted grain based snacks. | |||
|
|
Branded food products under the Sunrich Naturals brand, including: | |||
|
|
Alternative beverages – a variety of soy, rice and almond based beverages for retail and foodservice. | |||
|
|
Frozen vegetables – a variety of frozen edamame and vegetable blends for health food stores, foodservice operators and retail outlets. | |||
|
|
Roasted grains based snacks – specializing in providing healthy, natural and organic snacks to schools, daycare centers, retailers and healthcare facilities throughout North America, including military facilities. Products include sunflower kernels, roasted corn and soy snacks. | |||
| 4) |
A full range of bulk grain-based animal feed and pet food products. The premium feed products originate from select organic and non-GMO soy, corn, sunflower and other grains. | |||
| SunOpta Inc. | 9 | December 31, 2009 – 10-K |
The Grains and Foods Group also engages in processing and contract manufacturing services and offers a comprehensive range of services including basic grain cleaning, ingredient processing, custom roasting, and retail-ready packaging. With over ten processing facilities throughout the United States, it can handle a range of order sizes, including barge lots, rail cars, bags, pallets, and retail packages. The Grains and Food Group services include:
-
Grain conditioning services for soy, corn and sunflower. The Grains and Foods Group’s advanced equipment and state-of-the-art technology for scalping and foreign matter removal is engineered to meet USDA Grain Standards for premium food grade seed and grain conditioning.
-
Grain milling for corn, oat and grain processing, with various granulations and batch sizing.
-
Ingredient processing expertise and equipment needed for extraction, separation and concentration of a wide variety of grains based and dairy ingredients.
-
Packaging through its aseptic packaging facilities, specializing in Tetra Pak equipment in a variety of pack sizes and offering a variety of opening types and extended shelf life options. The Grains and Foods group also partners with third party fillers to provide extended shelf life (ESL) refrigerated packaging formats to its customers.
-
Roasting through a facility offering nitrogen-flushed pillow packs, pouches and bulk packaging.
Competition—Grains and Foods Group
The Grains and Foods Group competes with large grain suppliers for customers and competes with other companies active on the international commercial grain procurement market for supply. The Grains and Foods Group’s organic specialty grains compete in the smaller niche U.S. commercial organic grains market. Key to competing in these markets is access to transportation, supply and relationships with organic producers. The Grains and Foods Group’s aseptic packaged products facilities compete with a number of other regional manufacturers and ingredient offerings compete with a range of suppliers from small local companies through large multi-nationals.
Distribution, Marketing, and Sales—Grains and Foods Group
The Grains and Foods Group has well established sales and marketing capabilities that have provided a base for its operations. As a leading provider of soy, corn, sunflower and grain-based food ingredients, it offers a comprehensive range of ingredients and services to the food industry. Distribution channels can vary greatly by product category, but the Grains and Foods Group enjoys a diverse ‘to market’ strategy in each product category. The Grains and Foods Group’s Organic, non-GMO and IP ingredients are sold to manufacturers worldwide. For specialty whole grain raw materials, approximately 50% of the customer base is international. Food ingredients are sold principally to customers in North America that range from major multi-nationals to smaller specialty innovative organic food makers, but is expected to expand geographically with the new South African soy processing venture which is expected to open new international markets. The consumer goods distribution channels include private label and store brands, food service and also SunOpta-controlled brands. This wide array of sales and distribution avenues allows the Grains and Foods Group to maximize sales and margin while mitigating the risk of concentrating business in a single segment of the market.
| SunOpta Inc. | 10 | December 31, 2009 – 10-K |
Suppliers—Grains and Foods Group
The Grains and Foods Group has an extensive established IP, organic soy and corn grower network with approximately 2,500 producers, with many relationships existing for over 25 years, and relationships with approximately 500 sunflower farmers in the Midwest and southern U.S. Because weather conditions and other factors can limit the availability of certain grains in North America, our Grains and Foods group is focused on expanding production and sourcing capabilities to other parts of the world in hand with the International Sourcing and Trading Group to ensure supply in years when local production is below normal levels. By diversifying supply, it also has the ability to divert available product based on market demand and customer requirements in order to maximize return.
INGREDIENTS GROUP
Operations and Product Offerings – Ingredients Group
The Ingredients Group is headquartered in Chelmsford, Massachusetts and operates from five processing facilities throughout the United States. It transforms both internally and externally sourced raw materials into value-added food ingredient solutions with a core focus on oat and soy fiber. The Ingredients Group is comprised of the previously acquired Northern Food & Dairy’s Fosston, Minnesota facility, Opta Food Ingredients, Inc., and the Cedar Rapids, Iowa oat fiber facility purchased in 2005 from General Mills. The Ingredients Group specializes in the technical processing of specialty food ingredients with a focus on non-GMO, natural, functional and organic offerings. It works closely with customers to identify product formulation, and cost and productivity issues, and develops solutions to these problems based on proprietary, value-added, highly functional food ingredients and ingredient systems that use the Ingredients Group’s technical knowledge and manufacturing base.
The Ingredients Group is an innovator in the value-added food ingredients market with a technical selling and product applications focus. Based on our internal estimates, the Ingredients Group is the world’s largest supplier of oat fiber to the food industry, one of the largest producers of soy fiber in the United States and the largest producer of organic soy fiber in the United States. The Ingredients Group markets the Canadian Harvest ® Oat Fiber, SunOpta Soy Fibers, and SunOpta Pea Fiber brands of insoluble organic and conventional fiber products, Barley Balance™ soluble fiber, MultiFiber™ blends, SunOpta Soy Fiber blends, a number of value-added starch-based texturizers and proprietary stabilizer blends under the SunOpta Ingredient SystemsTM umbrella, and a number of custom processed ingredients including natural preservatives.
The Ingredients Group continues to diversify its unique portfolio of products. Products are organized under three main technology platforms:
1) Fibers and Brans, including Canadian Harvest Oat Fibers and Stabilized Bran products as well as SunOpta Soy and Pea Fibers. Canadian Harvest Oat Fibers and SunOpta Soy and Pea Fibers are a family of insoluble fiber products derived from oat, soy and pea hulls. They are used commercially to increase the fiber content of cereals, breads, cookies and crackers increase yield and enhance texture in ground meat products and to add strength and reduce breakage in products such as taco shells and ice cream cones. We also offer Canadian Harvest Stabilized Brans derived from oat, wheat and corn, as well as wheat germ. The Stabilized Brans are heat-treated to extend shelf life and ground to meet customer needs for appropriate particle size. One of our unique soy fibers is a protein and fiber rich by-product of soy concentrate manufacturing. This fiber is used to enrich protein and fiber for a variety of foods for human consumption plus animal feed and pet foods.
2) SunOptatm Ingredient Systems, including OptaGrade®, OptaMist®, and a portfolio of value added ingredient systems for the bakery, dairy, and meat industries. OptaGrade is a natural, starch based texturizing agent that is used commercially in a variety of dairy products including natural, imitation, and processed cheeses, sour cream, cream cheese, and cottage cheese. OptaMist is also a starch based texturizing agent that improves the taste, texture and appearance of dairy products, yogurt, cheese products, and salad dressings.
3) Custom ingredients and contract manufacturing services. We produce a number of unique functional food ingredients, and offers services to customers, on a contract basis utilizing proprietary technologies.
| SunOpta Inc. | 11 | December 31, 2009 – 10-K |
We believe the Ingredients Group is well positioned to capitalize on the rapid growth of the health conscious natural and organic food markets, with its wide range of fiber, brans and starch based products. Publications from both the American Dietetic Association and a Mayo Clinic Health letter note that fiber consumption is still below recommended levels in the U.S. The Canadian Harvest line of oat fibers and stabilized brans and SunOpta soy and pea fibers are used in numerous products such as fiber-enriched breads and other baked goods, breakfast cereals and snack bars. These products can be used to increase total dietary fiber content of foods while minimizing negative effects on taste, texture and appearance. The Ingredients Group’s insoluble oat, soy and pea fibers enhance overall gastrointestinal health. Oat and soy fibers have become primary ingredients in breads, pastries, muffins, tacos and tortillas as food companies reformulate their products to include fiber-enriched ingredients. Recent innovations have expanded applications of fiber into dairy and meat products. Stabilized oat brans can be used as a source of soluble fiber (ß-glucan) which is beneficial to cardiovascular health.
Our food ingredients are used by approximately 300 customers worldwide, including some of the largest U.S. consumer packaged food companies and quick service restaurant chains. The Ingredients Group’s product offering is sold internationally via approximately 25 distributors around the world.
Many of our starch-based texturizers and ingredient blends were originally developed for and are used in reduced fat versions of a variety of dairy products such as low fat or fat-free cottage cheese, sour cream, cream cheese, or processed cheeses. As discussed in “Taking the Fat Out of Food,” a publication of the United States Food and Drug Administration (“FDA”), reducing fat intake by consuming reduced fat versions of these products is an element of a healthier diet.
In addition to helping food manufacturers improve the healthfulness of their food products, the ingredients can be used to improve the overall quality of food products, reduce formulation costs, and meet specific processing requirements. We believe that all of our products are Generally Regarded As Safe (“GRAS”) under current FDA regulations (see “Regulation – SunOpta Foods”, below).
Recently, the Ingredients Group expanded its portfolio of functional fibers to include organic and conventional pea fiber by entering into a distribution agreement with Best Cooking Pulses of Portage la Prairie, Canada. The production of pea fiber is highly sustainable, non-allergenic, non-GMO, and gluten free. It is approved by Health Canada as a novel fiber for inclusion in bakery and meat products.
The Ingredients Group also represents Polycell Technologies to market and sell Barley Balance™ beta-glucan concentrate. Barley Balance™ is the most concentrated source of barley beta-glucan soluble fiber produced by a natural and sustainable process. Barley Balance™ contains a minimum of 25% beta-glucan and over 35% dietary fiber adding excellent nutritional benefits and functional performance to food and beverage products.
During 2009, the Ingredients Group launched a line of new products under the MultiFiber™ brand name. Internally developed, MultiFiber™ products are highly functional blends of fibers that meet the needs of customers who are looking for a cost efficient, easy-to-source fiber for fortification while meeting specific textural goals. All MultiFiber™ products deliver a concentrated source of dietary fiber with a smooth texture and bland flavor. These new and innovative ingredients are expected to provide value for food and beverage manufacturers who are looking for ratios of soluble and insoluble fibers similar to what occurs naturally in foods.
Also during 2009, the Ingredients Group launched a line of SunOpta Soy Fiber Blends, also internally developed, which provide a unique combination of functional fiber and protein that increases yield, moistness, and maintains desired firmness in meat products. In addition, the Ingredients Group launched four new oat fiber products; Canadian Harvest® oat fiber 211 is used for fiber enrichment of whole grain products, primarily breads; Canadian Harvest® oat fiber 320 is used specifically for the fiber enrichment of crunchy cookies and crackers; Canadian Harvest® oat fiber 680 helps reduce breakage in crunchy snacks; and Canadian Harvest® oat fiber 240 is for use in a variety of low moisture baked goods which require high levels of fiber fortification.
Competition—Ingredients Group
Food ingredients are considered unique niche items usually developed or processed for specific customers or industry segments. The Ingredients Group competes with other product developers and specialty processors for the specialty ingredient business.
| SunOpta Inc. | 12 | December 31, 2009 – 10-K |
The food ingredients industry is intensely competitive. Competitors include major companies with food ingredient divisions, other food ingredient and sourcing companies, other insoluble fiber processors and consumer food companies that also engage in the development and sale of food ingredients. Many of these competitors have financial and technical resources as well as production and marketing capabilities that are greater than ours.
Distribution, Marketing, and Sales—Ingredients Group
Sales and marketing is done through a technically oriented customer account team. We believe that the most effective way to solve each customer’s problem is to gain a thorough understanding of the customer at all levels, build solid working relationships throughout the customer’s organization, be knowledgeable of the market segment in which the customer competes, and have a detailed technical understanding of the customer’s need as well as its preferred solution. We take a multidisciplinary approach to achieve this level of customer understanding and service. Members of the Ingredient Group’s direct sales force are teamed up with the appropriate technical personnel to work as “consultants” in defining and developing a range of potential solutions to our customer’s formulation and product development needs.
Suppliers—Ingredients Group
The Ingredients Group’s raw materials and packaging are sourced from approximately 65 suppliers with availability subject to world market conditions. There are a number of alternative sources of supply for all raw materials with critical supply relationships highlighted below. Oat and soy hulls are primarily sourced from major food companies or their brokers and there is ample supply to meet production requirements. The supply for these ingredients is sufficient to meet current demand. Dairy ingredients are purchased primarily from dairy producer cooperatives. Products are purchased in the spot market with certain ingredients purchased under short-term supply contracts. Supply shortfalls would have an effect on availability and price and would be reflected in finished product pricing for the Ingredients Group. Certain other raw materials are supplied by processing customers and are not sourced directly from suppliers within SunOpta Foods.
FRUIT GROUP
Operations and product offerings – Fruit Group
The Fruit Group is headquartered in Buena Park, California and focuses on providing natural and organic fruit and vegetable based products to the private label retail, quick-service restaurant, food service and industrial markets. The Fruit Group comprises two separate operating divisions:
1) Fruit Specialties (comprised of the acquisitions of Cleugh’s Frozen Foods Inc., Pacific Fruit Processors Inc., Hess Food Group LLC, Baja California Congelados S.A. de C.V., and Congeladora del Rio S.A. de C.V.), and
2) Healthy Fruit Snacks (comprised of Kettle Valley Dried Fruit, Ltd.).
We believe the Fruit Group is well positioned in the natural and organic frozen fruit and vegetable and healthy fruit snack markets. It has adjusted to recent profitability pressures through rationalization of operations, which has provided increased processing flexibility and a reduced cost base along with the implementation of numerous internal cost improvement initiatives. Our global sourcing and production capabilities, coupled with extensive product development expertise will provide a solid platform for future growth.
We estimate that the Fruit Group is one of the largest suppliers of organic individually quick-frozen fruit to the private label retail market in the United States, providing its customers with a wide range of products including bulk raw materials and value-added ingredients and quick-service products to casual dining restaurant and retail solutions. It services over 500 customers, including food manufacturers, food service distributors, quick-service and casual dining restaurants and retail companies located principally in North America and Asia.
| SunOpta Inc. | 13 | December 31, 2009 – 10-K |
The Fruit Group’s two divisions are described below.
Fruit Specialties Division. The Fruit Specialties division consists of both berry processing and fruit base operations. The berry processing operations consist of fruit and berry processing facilities with value added processing capabilities, as well as sourcing and trading capabilities provided by the Hess Food brokerage operation. This division processes strawberries, peaches, mangos and other fruits and vegetables, and packs natural and organic frozen fruits and vegetables for the private label retail, food service, and industrial ingredient markets. It sources fruits, berries, and vegetables from various growing regions throughout California and Mexico and processes the fruit into individually quick-frozen, block frozen, strawberry sugar packs and purees to meet our customer’s technical specifications. Fruit Specialties supplies frozen fruit products to the private label retail, food service and industrial markets, including food manufacturers and quick service and casual dining restaurants. Our poly-bag packaging operations in Buena Park, California and Irapuato, Mexico provide retail customers with a wide range of private label natural and organic frozen fruits and vegetables, including strawberries, blueberries, raspberries, blackberries, peaches, mangos, tropical fruit and many other items. We operate three berry processing facilities located in Buena Park, California, and Rosarito and Irapuato, Mexico. As a result of the general economic environment, we have ceased fresh strawberry processing at our Buena Park facility and are focusing efforts on our poly-bag operations for the retail market. Additionally, we entered into a facility lease arrangement and supply agreement for individually quick frozen (“IQF”) strawberries from the Salinas, California facility.
Pacific Fruit Processors, located in South Gate, California produces a range of value-added fruit bases in aseptic and other packaging for sale to manufacturers and food service operations and restaurants.
Raw materials consist primarily of fresh strawberries sourced from growers in California and Mexico, and fresh peaches, pineapple, mangos, honeydew melons, cantaloupes, and other fruits from growers in Mexico. The Fruit Specialties division faces competition when securing the grower base required to meet its needs; however, due to the location of our processing facilities, we are able to source raw materials from a number of growing regions. We also source other frozen fruits and vegetables from a number of domestic and worldwide growers, processors and traders, including our own International Sourcing and Trading Group.
Healthy Fruit Snacks Division. The Healthy Fruit Snacks division produces natural and organic fruit snacks. It operates processing facilities in Summerland, British Columbia and in Omak, Washington. During 2007 and 2008, operations were significantly expanded at the Omak facility by adding capacity for an additional 140 million units per year, doubling through-put. The primary raw material, apple, is sourced from local growers and internationally from our own International Sourcing and Trading Group. Production capabilities include a variety of bar, twist, rope and bite sizes and shapes, as well as the ability to add a variety of ingredients including fiber. The Healthy Fruit Snacks division has internal research and development capabilities to introduce innovative products to the marketplace.
Competition—Fruit Group
The berry processing operations compete with strawberry processors primarily in California and Mexico and frozen fruit imports from Mexico, South America, Europe and Asia. The competitive landscape includes companies with financial resources larger than ours. In many cases, Mexican, South American, European and Asian competitors are able to achieve greater cost efficiencies due to lower relative costs of living and costs of supply in these regions. The location of our processing facilities in Mexico and California provides us with a diversified supply base for our customers due to extended supply seasonality.
The fruit base operations compete with regional and national food manufacturers, and face research and development competition from flavor companies. A number of these competitors have production capabilities and financial resources that are greater than ours.
The Healthy Fruit Snacks division has a small number of competitors, some of whom have production and technical capabilities and financial resources greater than ours. These competitors include independent fruit snack manufacturers and fruit snack divisions of larger food manufacturers.
| SunOpta Inc. | 14 | December 31, 2009 – 10-K |
Distribution, Marketing and Sales—Fruit Group
The berry processing operations supply frozen fruit products to the private label retail, food service and industrial markets, including food manufacturers and quick service and casual dining restaurants.
The fruit base operations supply natural and organic value-added fruit ingredients to the dairy, food service and beverage industries. It offers fruit bases and preps for customers seeking high-quality, custom formulations to meet their special flavor and texture profiles. Applications include fruit for yogurts, ice creams, cheeses, smoothies, shakes, frozen desserts, bakery fillings, health bars, various beverages, dressings, marinades, dips and sauces. The fruit base operations’ research and development team is integral to its reputable product quality and customer service. Manufacturing capabilities include aseptic and conventional processing and packaging.
The Healthy Fruit Snacks division focuses on supplying natural and organic fruit snacks to the private label Canadian and U.S. retail markets and intends to expand distribution globally due to the portable nature of these products.
Suppliers—Fruit Group
The berry processing operations source fresh and frozen fruits, berries, and vegetables from a large number of growers throughout California and Mexico.
The fruit base operations’ primary raw materials are sourced from processors and traders of frozen fruits and vegetables, including our own International Sourcing and Trading Group and berry processing operations, major sweetener producers, and a number of regional and national flavor companies. Availability of supplies is subject to world market conditions, including quantity and quality of supply.
The Healthy Fruit Snacks division’s raw material suppliers include growers and traders of apples and apple concentrates, flavor companies as well as processors and traders of fruit products including our own International Sourcing and Trading Group. This division is subject to the availability of apple-based supply which is subject to conditions beyond our control.
INTERNATIONAL SOURCING AND TRADING GROUP
Operations and product offerings – International Sourcing and Trading Group
The International Sourcing and Trading Group is headquartered in Aptos, California, and Amsterdam, the Netherlands. It is comprised of SunOpta Global Organic Ingredients Inc. and The Organic Corporation. It also operates a factory in Dalian, China that supplies food grade organic soybeans and feed, organic sunflower kernels and other grains. In addition, we have sourcing and processing operations for organic coffee and organic sesame seeds in Ethiopia. The International Sourcing and Trading Group sources raw material ingredients from approximately 60 countries around the world, and, in our estimation, is the largest supplier of a wide range of organic commodities to the food industry in the European, North American and Asian markets.
The International Sourcing and Trading Group provides organic food solutions to major global food manufacturers and distributors, and major U.S. supermarket chains with a variety of industrial and private label retail products. It sources or produces organic fruit and vegetable-based ingredients, sweeteners, cocoa, coffee, grains, nuts, seeds and pulses and other organic food products from virtually every continent and in both hemispheres to ensure quality of supply, minimize crop risk and provide contra-seasonal solutions to our customers. In many cases, we will enter into exclusive arrangements with growers and/or processors of key strategic commodities to control the reliability of our supply chain. Utilizing a number of strategic and/or exclusive co-pack relationships and an experienced research and development team, we are able to provide our retail customers and distributors with organic private label turn-key solutions in a variety of product categories, including juices, frozen fruits and vegetables, specialty beverages and tomato products.
| SunOpta Inc. | 15 | December 31, 2009 – 10-K |
Competition—International Sourcing and Trading Group
The organic food industry is intensively competitive due primarily to the limited worldwide supply of organic raw materials. Our competitors in the supply of industrial ingredients include domestic and worldwide brokers, traders and food processors. In the private label retail market, competitors include major food manufacturing companies, some of which have production and technical capabilities more extensive than ours.
Distribution, Marketing and Sales—International Sourcing and Trading Group
The International Sourcing and Trading Group operates administrative, research and development offices in Aptos, California and Amsterdam, The Netherlands, and sales and sourcing offices in Germany, France, Thailand, Ethiopia and the United States.
Sales and marketing is done through technically oriented sales teams strategically located close to specific geographic sourcing and sale regions. The International Sourcing and Trading Group maintains one of the largest global sourcing and supply networks in the world, working closely to manage global organic supply and link these supplies with diverse customer needs. The group also provides procurement support for other SunOpta operations.
Suppliers—International Sourcing and Trading Group
The International Sourcing and Trading Group’s raw material suppliers include growers, processors and traders of organic fruit and vegetable based ingredients, sweeteners and other food products. Raw materials are sourced from growing regions worldwide, including North America, South America, Central America, Europe, Africa and Asia. Organic food suppliers are required to meet stringent organic certification requirements equivalent to the United States Department of Agriculture (“USDA”) National Organic Program, European Union standards or others.
DISTRIBUTION GROUP
Operations and product offerings – Distribution Group
The Distribution Group, headquartered in Concord, Ontario, represents the final layer of our vertically integrated organic, natural and specialty foods and natural health products business model. We started to build a Canadian organic and natural food distribution system in late 2002 and since then have built what we believe is the largest distribution platform in Canada, serving natural, organic and specialty foods and natural health products and handling natural, organic, kosher and specialty food products; fresh organic produce, vitamins, supplements and other natural health products.
The Distribution Group operates from a series of warehousing and distribution centres located in British Columbia, Ontario and Quebec, and utilizes third party carriers to supplement core operations. In addition, the group’s natural health products operation maintains processing and packaging facilities in located in Brantford, Ontario and Rockwood, Ontario.
The Distribution Group’s major products include:
-
Fresh Organic Produce – a full line of certified organic fruits, vegetables and bulk foods.
-
Fresh Organic Dairy and Dairy Alternatives – numerous regional and national brands of organic liquid milk, butter, cheese, yogurt, tofu, soy cheese, soy beverages and other dairy alternatives.
-
Bulk Foods – a full range of organic bulk foods including grains, nuts, seeds, dried fruits, legumes, flours and healthy snacks.
-
Natural and Organic Grocery – approximately 8,000 natural and organic grocery items including dry, refrigerated and frozen categories from a broad range of North American and international suppliers.
-
Kosher and Specialty Foods Grocery – approximately 6,000 kosher and specialty grocery items including dry and refrigerated product offerings.
- Natural Health Products – approximately 7,000 branded and/or distributed SKUs of natural vitamins, supplements and health and beauty aids, many of which are formulated, processed and packaged within our vertically integrated manufacturing operations and sold under company brands such as Herbon, Vivitas, Nature’s Harmony and Quest.
| SunOpta Inc. | 16 | December 31, 2009 – 10-K |
Competition—Distribution Group
The Distribution Group competes against much larger conventional distributors; however, we believe that the Distribution Group is the largest national natural and organic foods and natural health products distributor in Canada. Competition in organic and natural grocery products is represented by a number of regional natural and organic food distributors that vary greatly in size. We believe that we are Canada’s largest distributor of natural health products. The Distribution Group also competes with a handful of national distributors and a diverse group of much smaller regional distributors.
Distribution, Marketing and Sales—Distribution Group
The Distribution Group’s primary direct-to-store distribution coverage includes central, eastern and western Canada. We primarily service independent natural and organic food retailers and supermarket chains. The customer mix also includes a growing component of large mass merchandisers and major drugstore chains. Core competencies include direct-to-store service, the breadth of its product line, and organic market and natural health product knowledge.
Suppliers—Distribution Group
The Distribution Group sources products from over 900 suppliers around the world. Generally, we believe our supply is sufficient; however, quality, price and availability of fresh produce can be affected by harsh weather conditions in growing regions, which can result in fluctuations and inconsistencies in our supply. With respect to fresh produce items, supply is controlled through spot pricing, with changes in supply reflected in prices to end customers.
Regulation – SunOpta Foods
SunOpta Foods is affected by a wide range of governmental regulations and policies in various countries and regions where we operate, including the United States, Canada, the Netherlands, and the European Union. These laws, regulations and policies are implemented, as applicable in each jurisdiction, on the national, federal, state, provincial and local levels. Examples of laws and regulations that affect SunOpta Foods include laws and regulations applicable to the use of seed, fertilizer and pesticides; the purchasing, harvesting, transportation and warehousing of grain and other products; the processing and sale of food, including wholesale operations; and the labelling and marketing of food and food products. Additionally, government-sponsored price supports and acreage set aside programs are two examples of policies that may also have an impact on us. In addition, our business activities are subject to a number of environmental regulations.
SunOpta Foods is involved in the sourcing, manufacturing, supplying, processing, marketing, selling and distribution of organic seed and food products and, as such, is subject to certain organic quality assurance standards. We believe we are currently in compliance with all state and federal fertilizer, pesticide, food processing, grain buying and warehousing, and wholesale food-handling regulations. Regulatory agencies include the USDA, which monitors both the organic process and agricultural grain business; the FDA, which oversees the safety, security and efficacy of the food supply in the United States; the Canadian Food Inspection Agency (“CFIA”) which monitors food processing and safety in Canada; and SKAL, an organization that certifies organic products in the Netherlands.
| SunOpta Inc. | 17 | December 31, 2009 – 10-K |
Certain food ingredients are regulated under the 1958 Food Additive Amendments to the Federal Food, Drug and Cosmetic Act of 1938 as administered by the FDA. Pre-marketing approval by the FDA is required for the sale of a food additive unless we believe the substance is generally regarded as safe (“GRAS”) under FDA standards. A food additive is a substance, “the intended use of which results or may reasonably be expected to result, directly or indirectly, either in their becoming a component of food or otherwise affecting the characteristics of food.” Such pre-marketing approval for ingredients that are not GRAS, which is issued in the form of formal regulation, requires demonstrating that both the food ingredient is safe under its intended conditions of use, and that it achieves the function for which it is intended.
Companies may establish GRAS status through “self-affirmation” whereby the producer determines on its own that the ingredient is GRAS, normally with the assistance of a panel of qualified experts. The producer may also voluntarily submit a “GRAS Notification” to the FDA that includes the products description, conditions of use, and the basis for GRAS determination, among other information. The FDA response, typically within 180 days, to a GRAS notice is not an approval and the product may be marketed while the FDA is reviewing the information.
A food ingredient is eligible for GRAS classification based on the “views of experts qualified by scientific training and experience to evaluate the safety” of the product. The expert’s views are either based on scientific procedures or through experience based on common use of the material prior to 1958. If based on scientific procedures they must use the same quantity and quality of scientific evidence as would be required for the FDA to issue a pre-market approval of the sale of a food additive. If a food ingredient is not entitled to GRAS status, pre-market approval must be sought through the filing of a Food Additive Petition.
Many of SunOpta Food’s products are being marketed pursuant to GRAS self-affirmation. We believe that a majority of products for which we have retained commercial rights are GRAS. However, such status cannot be determined until actual formulations and uses are finalized. Thereafter, we decide whether self-affirmation procedures and a GRAS notification will be appropriate. For those components that do not qualify for GRAS, we may be required to file a Food Additive Petition. In the event that a petition is required, we may elect to sell or license its rights to manufacture, market, and distribute the component to another party.
Countries other than the U.S. also regulate the sale of food ingredients or characterize food ingredients differently. Vitamin and minerals supplements in the U.S. are regulated pursuant to the Dietary Supplement Health and Education Act, which regulates these products as foods. In Canada most of these products are presently regulated as Natural Health Products (NHPs), a sub-category of drugs. Regulations vary substantially from country to country, and we take appropriate steps to comply with such regulations. In Canada, we have sales of NHPs, drugs, cosmetic, devices and pest control products. These may be regulated by various federal, provincial and municipal laws, but are principally regulated by the Canadian federal government pursuant to Canada’s Food and Drugs Act and supporting regulations, the Pest Control Products Act and supporting regulations and the Canada Environmental Protection Act, 1999, (“CEPA”) and supporting regulations. A substantial portion of these products, are classed in Canada as NHPs and are regulated pursuant to the provisions of the Food and Drugs Act and the Natural Health Product Regulations (“NHP Regulations”), enacted under Canada’s Food and Drugs Act.
As this regulatory framework is still considered to be relatively new (it became effective January 1, 2004), Health Canada has published a compliance policy and guide which have the practical effect of temporarily relaxing enforcement of the NHP Regulations, assisting regulated parties in becoming compliant with the NHP Regulations. Prior to the adoption of the NHP Regulations, many of the NHPs now regulated under the NHP Regulations were previously regulated as drugs pursuant to the Food and Drug Regulations. These products which had a drug identification number (“DIN”) had to transition to the NHP regulatory framework by December 31, 2009.
| SunOpta Inc. | 18 | December 31, 2009 – 10-K |
Full compliance with the NHP Regulations will likely be required by the end of 2010 or 2011, based on verbal representations made by the NHP Directorate to industry representatives. This extension of the compliance policy and guide is and likely will be dependent on the ability of the Natural Health Products Directorate’s ability to reduce the existing backlog to workload, i.e. reducing the time frame from submission to review of a pre-market application from the existing time frame to a time frame considered to be representative of performance criteria to be established for future operations of the NHPD. As such, our compliance with the NHP Regulations will at that point become mandatory, and any NHPs for which a market authorization has not been granted will have to be removed from the marketplace until the market authorization is issued. Failure to do so could see enforcement action taken by the Health Products and Food Branch Inspectorate, which could include the removal of non-compliant NHPs from the market place and possibly result in charges against us.
Health Canada is also re-evaluating how food-like NHPs are currently regulated in Canada. Food-like NHPs are products that meet the technical definition of an NHP under the NHP Regulation, but are in food format. Health Canada has outlined that it will likely propose amendments to the NHP Regulation and Food and Drug Regulations so that most of these products would be regulated as a food.
Stewardship Ontario’s Consolidated Municipal Hazardous or Special Waste (CMHSW) program will expand to include drugs and natural health products (except products in food format). This is a waste diversion program whereby a company that is resident in Ontario and is a brand owner or a first importer of any of the materials designated under the CMHSW program is obligated to register, file reports on the materials it supplies for sale or use in the Ontario market and remit fees to Stewardship Ontario. Registration is required by March 1, 2010, reports must be filed starting April 30, 2010, and fees must be paid starting July 31, 2010. The overall cost is a concern amongst industry members as the term “units” in the fee schedule does not refer to a container, but rather the number of pills, milliliters, or grams contained within a package. Stewardship Ontario has indicated to the industry that once the reporting period is over, it will reassess the fee schedule in light of a more comprehensive understanding of the market and advised that fees will be adjusted accordingly.
In addition to the NHPs and drugs that we sell, we also import and sell cosmetic products for which we file with Health Canada, cosmetic notification forms, a post-marketing requirement for those cosmetics manufactured in Canada and a pre-market requirement for those products imported into Canada. In light of the changes to the Cosmetic Regulations requiring ingredient disclosure on the cosmetic product labeling, we continue to work with our vendors to bring cosmetic labeling into compliance.
In addition, there is an ongoing review of ingredients used in regulated products, including those we sell, for compliance with CEPA. The Canadian Federal Government has undertaken a review of ingredients used in commerce for these regulated products with a view of determining whether the use of certain ingredients in these products represent a risk to the environment. This could eventually lead to the removal of the use of these ingredients in Canada. This would require us to re-formulate any of our products (if any) affected by such a determination.
On April 8, 2008, the Canadian Federal Government introduced two proposed pieces of legislation intended to overhaul the Food and Product Safety Laws in Canada. Bill C-51, legislation to amend the Food and Drugs Act, and Bill C-52, the Canada Consumer Product Safety Act.
Although Bill C-51 and Bill C-6 (formerly Bill C-52) died on the order paper, it is expected that the Parliament of Canada will reintroduce these proposed laws, most likely during the next session. Bill C-51 and Bill C-6 proposed amendments to the Food and Drugs Act as well as a new Canada Consumer Product Safety Act. The proposed changes include greater oversight of manufacturers, importers and retailers, including requiring holders of market authorizations to provide information and/or conduct tests to establish the benefits and risks associated with the sale of the product, which is intended to lead to:
- Increased public access to risk and benefits associated with products;
- Ability to disclose personal and confidential business information;
| SunOpta Inc. | 19 | December 31, 2009 – 10-K |
- A general prohibition against the manufacture, importation, advertisement or sale of consumer products that are a danger to human health or safety;
- A requirement of mandatory reporting by suppliers of serious product-related incidents including near- misses and defects, allowing for more targeted oversight.
- Substantially increased fines for violations, including imposing on directors and officers liability for the breaches committed by the corporate bodies.
- The power to order recalls of unsafe products, increased powers for inspectors, direct persons in control of consumer products to take actions or refrain from taking certain actions.
SunOpta Foods endeavours to comply in all material respects with applicable environmental regulations. Some of the key regulations in the U.S. include:
-
Air Quality – air quality is regulated by the United States Environmental Protection Agency (“EPA”) and certain city/state air pollution control groups. Emission reports are filed annually.
-
Waste Treatment/Disposal – solid waste is either disposed of by a third-party or, in some cases, we have a permit to haul and land apply. Agreements exist with local city sewer districts to treat waste at specified levels of Biological Oxygen Demand (“BOD”), Total Suspended Solids (“TSS”) and other constituents. This can require weekly/monthly reporting as well as annual inspection.
-
Sewer – agreements with the local city sewer districts to treat waste at specified limits of BOD and TSS. This requires weekly/monthly reporting as well as annual inspection.
-
Hazardous Chemicals – various reports are filed with local city/state emergency response agencies to identify potential hazardous chemicals being used in our facilities.
-
Storm Water – all facilities are inspected annually and must comply with an approved storm water plan to protect water supplies.
-
Bioterrorism Compliance – we are currently complying with the four recognized and approved sections of the Bioterrorism Preparedness and Response Act of 2002.
In Canada, the key regulatory framework is found in the regulations to the CEPA. Prior to the importation and use in products, the importer must ensure that all ingredients are found on the Domestic Substances List (“DSL”) maintained by Environment Canada. In the event that an ingredient is not found on the DSL, then subject to the amount of the substance imported into Canada and used in products sold in Canada, a filing may become necessary under the New Substances Notification Regulations.
All of SunOpta Food’s Canadian manufacturing facilities and warehouses are registered with the CFIA and/or Health Canada. All imported materials are shipped in compliance with the notification systems that alert FDA, Health Canada, the CFIA and customs before the materials enter the country. We have the necessary processes and controls in place that provide for an additional level of traceability of all raw materials from the supplier to the immediate subsequent recipient of the finished products. We also recognize and have the necessary programs that allow the applicable regulatory body the right to seize, voluntarily retain and or recall any regulated product if required by law and if the regulatory body has credible evidence that the sale of the product and its use may be a threat to the health and well-being of the intended recipient.
As a result of our acquisition of The Organic Corporation headquartered in the Netherlands, we are now subject to Dutch and European Commission (“EC”) regulations and policies. The Organic Corporation is involved in the sourcing, supplying, marketing, selling and distribution of organic food products and, as such, is subject to standards for production, labeling and inspection of organic products contained in EC Regulation 2092/91 (and its subsequent amendments). The Organic Corporation is certified by SKAL, the inspection body for the production of organic products in the Netherlands. Products certified as organic by a European Union recognized inspection body, such as SKAL, can be marketed within the entire European Union.
The Organic Corporation is also affected by general food legislation both at an European Union and Dutch level relating to product safety and hygiene, among others. The Organic Corporation is Hazard Analysis and Critical Control Point (“HACCP”) certified in the Netherlands and manages a fully computerized system that guarantees the traceability of each product. In addition, The Organic Corporation also considers and abides by European Union and local legislation with regard to packaging and packaging waste.
| SunOpta Inc. | 20 | December 31, 2009 – 10-K |
Research and Development – SunOpta Foods
Research and development and new product innovation are key priorities of SunOpta Foods and initiatives are focused on continuous improvement of our existing product portfolios and production processes as well as the development of innovative new products. Innovation is a key pillar for us and a necessity in the natural and organic foods and natural health categories.
SunOpta Food’s extensive applications and research and development expertise is organized around four key product categories:
- Grains and grain-based ingredients through finished packaged products;
- Value-added ingredients focused on fiber based applications;
- Fruit, juices and fruit-based ingredients through finished packaged products and healthy fruit snacks; and
- Natural health products sold via certain owned brands within Purity Life and other divisions within the Distribution Group.
Our product development teams include highly trained and experienced food scientists, technologists and engineers and are dedicated to both the development of unique new product offerings plus addressing product development opportunities for our customers including new and custom formulations, innovations in packaging formats, and new production processes and applications. Applications and technical support provided by each of our operating groups to our customers include all aspects of product development from concept to commercial launch as well as ongoing manufacturing and processing support. Representatives from our operating groups also meet regularly to coordinate efforts to develop products which leverage the talents and product capabilities from across our organization.
SunOpta Foods continues to develop new products to maximize the capabilities of our aseptic packaging facilities in Modesto and Alexandria. In addition to new soy based beverages, new products include beverages using alternative ingredients such as almonds, oat and hemp. These products address the growing consumer demand for non-dairy based beverages. In addition, we have developed products such as teas, broths, and soups. The expanding interest to incorporate soy and grain-based foods in consumers’ diets also creates numerous opportunities to develop ingredients that can be incorporated into food developers’ menu items.
In addition, SunOpta Foods continues to expand its product portfolio via the addition of new fiber offerings that can be used with its oat-derived ingredients to improve the nutritional content and functionality of a variety of foods. Demand for food fibers has continued to show significant growth and we believe that this is a long-term trend due to an increased focus on healthy foods. Many of our ingredient solutions can be used in products that aid in satiety to respond to the growing epidemic of obesity in North America and elsewhere. Many of our ingredients can also be used in products which qualify for a “whole grain” claim by augmenting the insoluble and soluble fiber content of foods.
SunOpta Foods also continues to develop new fruit-based beverages, healthy fruit snacks as well as innovative fruit ingredient systems for the dairy, food service and beverage industries. We are also looking at using fiber and other ingredients in these fruit products to improve their ability to address satiety and lower glycemic indices.
More recently, we have focused resources on developing new life stage, gender specific natural health products which address the different nutritional needs of men, women, boys and girls at different stages of life. Associated with these new product offerings, we have also introduced new award-winning packaging designs and formats.
Intellectual Property – SunOpta Foods
The nature of a number of SunOpta Food’s products and processes requires that we create and maintain patents, trade secrets and trademarks. Our policy is to protect our technology, brands and trade names by, among other things, filing patent applications for technology relating to the development of our business in the U.S. and in selected foreign jurisdictions, and registering trademarks in the U.S., Canada and selected foreign jurisdictions where we sell products.
| SunOpta Inc. | 21 | December 31, 2009 – 10-K |
SunOpta Food’s success will depend, in part, on our ability to protect our products, trade names and technology under U.S. and international patent laws and other intellectual property laws. We believe that we own or have sufficient rights to use all of the proprietary technology, information and trademarks necessary to manufacture and market our products; however, there is always a risk that patent applications relating to our products or technologies will not result in patents being issued, or, if issued, will not be later challenged by a third party, or that current or additional patents will not afford protection against competitors with similar technology.
We also rely on trade secrets and proprietary know-how and confidentiality agreements to protect certain technologies and processes. Even with these steps taken, our outside partners and contract manufacturers could gain access to our proprietary technology and confidential information. All employees are required to adhere to internal policies which are intended to further protect our technologies, processes and trade secrets.
Employees – SunOpta Foods
SunOpta Foods has approximately 2,060 full-time employees as of December 31, 2009. Aside from unions at our Mexican facilities in the Fruit Group and the International Sourcing and Trading Group, there are no other unions within SunOpta Foods.
Properties – SunOpta Foods
SunOpta Foods operates 25 processing facilities (13 owned, 12 leased) in eleven U.S. states, three Canadian provinces, Mexico, China and Ethiopia. SunOpta Foods also owns and leases a number of office and distribution locations and also leases and utilizes public warehouses to satisfy its storage needs. For more details see Item 2, Properties.
OPTA MINERALS
Opta Minerals, our majority-owned subsidiary, is a vertically integrated provider of custom process solutions and industrial minerals products for use primarily in the steel, foundry, loose abrasive cleaning, roof shingle granules and municipal water filtration industries. Experiencing solid growth since 1996, we believe Opta Minerals has become one of the leading suppliers of industrial minerals and silica-free loose abrasives in a number of select markets in North America and Eastern Europe.
We acquired Opta Minerals (formerly known as Barnes Environmental and Industrial) in 1995. Since then, Opta Minerals has grown steadily through a combination of internal growth and strategic acquisitions in eastern and central Canada, eastern, central and southeastern United States, France and Slovakia: George F. Pettinos (Canada) Limited (PECAL) and Temisca, Inc. were acquired in 2000; Virginia Materials Inc. and 51% of International Materials & Supplies Inc. were acquired in 2001, with the remaining 49% minority interest in International Materials & Supplies acquired in 2002; Distribution A&L was acquired in 2004; certain assets of the abrasive division of Hillcrest Industries Inc. were acquired in 2005; Magnesium Technologies Corporation and Bimac Inc. were acquired in October 2006; Newco was acquired in 2007; and 67% of MCP Mg-Serbien was acquired in 2008, with the remaining 33% interest acquired in 2009. See Note 2 to the Consolidated Financial Statements for further details of acquisitions during 2008 and 2009.
In February 2005, we sold approximately 29% of the outstanding common shares of Opta Minerals as part of an initial public offering, and it now trades on the TSX under the symbol “OPM.” As part of our acquisition of Newco a.s. in 2007, Opta Minerals issued an additional 1,000,000 common shares which, when combined with the issuance of employee option grants, has reduced our equity ownership in Opta Minerals to approximately 66.4%.
Major Developments in 2009 and 2010 in Opta Minerals
In early 2009, Opta Minerals entered into agreements to establish abrasive processing operations in Texas and Florida in order to cost-effectively supply southern regions of the United States. The Texas facility has been fully operational since the fourth quarter of 2009, and the Florida facility is expected to be operational in the second quarter of 2010.
| SunOpta Inc. | 22 | December 31, 2009 – 10-K |
On December 22, 2009, Opta Minerals fulfilled its obligation under statutory laws in France to increase the value of its shareholdings due to cumulative unconsolidated losses at MCP. At the same time the non-controlling interest declined to increase its pro-rata share of the shareholdings. As a result, the non-controlling interest’s shares were cancelled and for no consideration, Opta Minerals increased its ownership in MCP to 100%. The acquisition of the MCP Mg-Serbian operations in France has complemented Opta Mineral’s existing operations while expanding business its capabilities in Europe.
Commencing in the fourth quarter of 2008 Opta Minerals implemented a wide range of cost-saving measures to align operations with customer demand. In total, these restructuring efforts reduced operating costs approximately $6 million compared to the beginning of 2008. During the year, Opta Minerals discontinued operations in Attica, New York, and sold assets in the operation in exchange for a release of the Company’s obligations under an existing lease and service agreement, consolidated operations into one facility in Quebec, sold a Company-owned warehouse and renegotiated a lease termination agreement for another.
Operations and product offerings – Opta Minerals
Opta Minerals competes primarily in the industrial minerals and silica free abrasives markets, focusing to date on select markets in the eastern, southern and central areas of North America and in Europe, operating facilities in Louisiana, South Carolina, Maryland, western New York, Quebec, the Slovak Republic and France. Its successful integration of its business acquisitions into its existing operations and financial management systems has created synergies that have increased revenues and profit margins. It has invested in improving plant equipment and infrastructure and has been able to reduce costs while growing production capabilities. As a result, we believe that Opta Minerals is currently well-positioned to expand current operations with modest capital expenditures.
Its principal product lines include the following: (i) blends of industrial minerals used primarily in heavy industrial applications; (ii) silica-free abrasives; and (iii) specialty sands, filtration media and other products and services.
Products
Opta Minerals produces, manufactures, distributes and recycles industrial minerals, silica-free abrasives and specialty sands and other products and services to the foundry, steel, roofing granule, marine/bridge cleaning and municipal, recreational and industrial water filtration industries.
-
Industrial Minerals - Opta Minerals sells industrial mineral products primarily to the foundry and steel industries. Significant industrial minerals products produced by Opta Minerals include chromites, magnesium blends, lime, nozzle sands, clays, coated sands and a wide range of foundry pre-mixes.
-
Silica-Free Abrasives - Opta Minerals abrasive products are primarily sold into shipbuilding, ship repair, bridge cleaning and roofing granule markets. The abrasives produced are free of silica, making them a clean, efficient and recyclable alternative to traditional abrasives. Recycling operations are conducted at Waterdown, Ontario and Norfolk, Virginia. This is an important service that Opta Minerals provides to its customers which results in the reuse of materials that would otherwise be sent directly to landfills. Significant silica-free abrasive products produced by Opta Minerals include BlackBlast, Ultra Blast, EconoBlast, EbonyGrit, Powerblast, Garnet and other specialty abrasives.
-
Specialty Sands and Other Products and Services - Opta Minerals also generates revenues from the sale of specialty sands, filtration media and other products and technical services. Opta Minerals specialty sands include silica products which are sourced, processed and packaged from their quarries located in St. Bruno de Guigues, Québec. The silica sands produced are not sold for use as an abrasive material. Significant specialty sands and other products and services of Opta Minerals include filtration and industrial sands, garnets for filtration and waterjet cutting, construction sands, golf bunker sand, silica (not sold for loose abrasive applications), colored sand and technical services.
| SunOpta Inc. | 23 | December 31, 2009 – 10-K |
Properties
Opta Minerals’ operations encompass and service much of North America, with production facilities located in Louisiana, South Carolina, Texas, Virginia, Maryland, New York, Michigan, Indiana, Ontario and Quebec, allowing us to maintain a strong customer base throughout North America by providing economic supply and timely delivery of products and services to its customers. In addition to our manufacturing facilities, we also own and operate distribution and packaging centers in Ontario and Quebec. Opta Minerals has built or acquired facilities at locations along the east and southern coasts of the United States where major shipbuilding, ship repair, bridge cleaning and roofing shingle production activities are concentrated. Multiple facilities allow for fast and economic service and have enabled us to broaden our product lines to supply wider markets and applications from these facilities.
Opta Minerals’ operations in Kosice, Slovakia and Romans-sur-Isere, France service major integrated steel mill customers as well as a variety of other industries in Europe and represent a platform for continued growth in European markets.
The Temisca specialty sand operation located in St. Bruno de Guigues, Quebec provides Opta Minerals with an economic, high-quality source of specialty sands for non-abrasive applications including water filtration applications, golf course bunkers and other commercial applications. Due to an unusual natural deposit of silica sand (in St. Bruno de Guigues), strong quality control, extensive research and development and marketing efforts, we believe Opta Minerals is effectively positioned in the markets it serves as a high-quality producer of specialty silica sand products.
For more details, see Item 2, Properties.
Competition
Industrial Minerals
The industrial minerals industry is characterized by a number
of large public and private companies that service the bulk of requirements for
both the foundry and steel industry. These companies include Foseco Steel,
Stollberg Group, SKW Mettalurgie Gmbh, Magnesium Elektron, Prince Minerals and
RHI AG and tend to have broad product offerings that service a range of customer
requirements. The remaining market requirements are fulfilled by small
regionally based niche companies with limited product lines that generally focus
on local markets.
Silica-Free Abrasives
The silica-free abrasives industry is characterized by a number
of small, regionally-based niche companies with limited product lines tending to
focus on geographically adjacent markets. Our competition varies by product
line, customer classification and geographic market. Opta Minerals conducts
business throughout North America with a focus on key regions including the
Québec-Detroit corridor, New York, Virginia, Georgia, Florida and the Gulf of
Mexico region, all of which are areas of high volume ship repairs and bridge
cleaning activities.
Specialty Sands and Other Products and Services
Competition within the specialty sand and other niche markets
serviced by Opta Minerals is characterized by a number of small,
regionally-based competitors. Competition varies by product line, customer
classification and geographic market.
In both abrasive and industrial minerals markets, Opta Minerals competes through a combination of exceptional product quality and customer service combined with competitive pricing.
| SunOpta Inc. | 24 | December 31, 2009 – 10-K |
Distribution, Marketing and Sales
Opta Minerals has an active program to develop and acquire new products and services that expand our target markets while leveraging our existing infrastructure and expertise. We offer one of the broadest ranges of industrial minerals and abrasives in the industry and can provide customer product configurations solutions for every type of application. Opta Minerals conducts business throughout North America and key areas of Europe, via a direct sales force supported by strong technical and operational resources, with a focus on high volume industrial mineral consumption regions. Our facilities are strategically located near customers or raw material supplies to economically and efficiently distribute products.
Suppliers
As is customary in the industry, Opta Minerals does not have long-term contracts with its major suppliers. Although we believe that we have access to similar products from competing suppliers, any disruption in the source of supply, particularly of the most commonly used or exclusively sourced items, or any material fluctuation in the quality, quantity or cost of such supply, could have a material adverse effect on the results of operations and financial condition.
Opta Minerals obtains key abrasive raw materials such as magnesium, lime, coal slag, copper slag, nickel slag and garnet from a wide variety of global sources. Copper slag is supplied by both domestic and foreign mining and refining companies. Coal slag is supplied on an exclusive basis from U.S. power plants and other suppliers. Opta Minerals produces industrial garnet derived from a waste mining stream at its Keeseville, New York facility. In addition, we have agreements with multiple mines in China and suppliers in India to market their garnet in North and South America. We also purchase significant quantities of magnesium for our mill and foundry services operations from manufacturers located primarily in China, Eastern Europe and the Middle East.
Regulation
Opta Minerals’ business primarily involves the handling of inorganic and mineral-based materials. These types of materials are generally benign and are not expected to give rise to environmental issues. Almost all of our environmental regulation is standard to the industry with the exception of certain permits required in Ontario and Virginia to recycle various types of solid waste. The Ontario Ministry of Environment has the right to inspect the Waterdown, Ontario site and review the results of third party monitoring and perform its own testing. Similar rights of inspection by the U.S. Environmental Protection Agency and state regulators exist at the facility in Norfolk, Virginia. At both locations, we are subject to monthly reporting and periodic audits as well as having a financial bond in place with the respective governments should there be a contamination.
Since we acquired the business in 1995 (and, with respect to the businesses we have acquired, since the respective acquisition dates thereof), we believe Opta Minerals has been in material compliance with all applicable environmental legislation and has not been subject to any actions by regulatory authorities. Based on known existing conditions, all facilities are currently in material compliance with all environmental permitting requirements of the local authorities and are reviewed on an annual basis. These permits generally cover air and ground water at those facilities where applicable. Absent any currently unforeseen changes to applicable legislation, we anticipate that future costs relating to environmental compliance will not have a material adverse effect on our financial position.
Employees
Opta Minerals has been successful in identifying, attracting and retaining talented employees with relevant technical and industry expertise. In particular, we have assembled an experienced management team with a diverse and complementary set of skills and experience, both within and from outside of the industry.
As of December 31, 2009, Opta Minerals had 181 active employees, including 18 employees in sales and marketing, 25 in corporate administration and finance, 27 in customer service, 23 in engineering and plant management, 6 in research and development and quality control, 3 in purchasing and the remaining 79 in production.
| SunOpta Inc. | 25 | December 31, 2009 – 10-K |
SUNOPTA BIOPROCESS
Operations and product offerings
SunOpta BioProcess is focused on the commercialization of its internally developed steam explosion technology and related processes known as the “SunOpta BioProcess System” (formerly known as the “StakeTech System”) including process engineering and equipment supply. In addition, SunOpta BioProcess has taken several steps over the past few years towards development of downstream technologies beyond fiber pre-treatment and production of biomass-derived specialty products with a focus on cellulosic ethanol.
The SunOpta BioProcess System provides a method for the rapid and continuous autohydrolysis pre-treatment of biomass under high temperature and pressure. The SunOpta BioProcess System can also serve as a platform for other pre-treatment processes such as Dilute Acid Hydrolysis and Ammonia Fiber Explosion (AFEX). Raw materials can include wood chips, sugarcane bagasse, cereal straws, waste paper, and potentially many other agriculture residues and energy crops. In their natural state, these materials are not easily separated into their component parts. By continuous processing with the addition of high-temperature steam, the SunOpta BioProcess System breaks the chemical and physical bonds that exist between the components of these materials allowing their subsequent separation and processing into products and components that may have wide and diverse applications. SunOpta BioProcess has demonstrated its equipment and technology on a commercial scale in several applications.
This technology has been proven via application around the world and is currently focused by management on the treatment of biomass for cellulosic ethanol, food and pulping applications, with the primary focus being on the application of our technology in the cellulosic ethanol market. The market opportunity in this sector has increased significantly due to the high cost of energy, the increased demand and cost for commodity foods such as corn for use as biofuel feedstocks, energy security issues, increased availability of government grants and loans, and environmental issues related to competing technologies. We are executing a two-pronged strategy to pursue this opportunity: (1) sales of manufacturing equipment with associated license fees, and (2) direct investment by SunOpta BioProcess in cellulosic ethanol production capacity.
SunOpta BioProcess’s business is not affected by seasonality.
Major Developments in 2009 and 2010 in SunOpta BioProcess
In late 2007, SunOpta BioProcess entered into a letter of intent with Central Minnesota Ethanol Co-op (“CMEC”) of Little Falls, Minnesota to complete feasibility and engineering studies for a joint venture to build, own, and operate a 10 million gallon per year cellulosic ethanol plant. The proposed operation is to be located adjacent to CMEC’s existing 21.5 million gallon per year corn starch-to-ethanol plant and will utilize readily available wood chips. CMEC and SunOpta BioProcess, along with Bell Independent Power Corporation of Rochester, New York, formalized the joint venture in April 2008 to further study the feasibility for the cellulosic ethanol plant. The joint venture operates under the name Central Minnesota Cellulosic Ethanol Partners (CMCEP). The feasibility study was divided into two phases. The first phase was supported by a $100,000 grant from the Agricultural Utilization Research Institute (AURI) in Minnesota and was completed in late 2008. The second and final feasibility phase which involves detailed engineering, refinement of capital and operating cost estimates, determination of raw material availability, and evaluation of other parameters is expected to be complete in the first half of 2010. CMCEP was awarded a $910,000 NextGen grant from the Minnesota Department of Agriculture to support the completion of the feasibility study. Receipt of NextGen progress payments is contingent upon completion of a detailed work plan appended to the CMCEP contract with the NextGen Board of Directors. Under the work plan, deliverables are invoiced quarterly to the NextGen grant administrator. NextGen funding is also contingent upon matching in-kind and cash contributions from SunOpta BioProcess and its partners. A failure to complete work as scheduled or as required could result in an inability to claim the full NextGen funding.
| SunOpta Inc. | 26 | December 31, 2009 – 10-K |
China continues to be a major focus for cellulosic ethanol commercialization efforts due to its high demand for energy and its lack of food-based alternatives for feedstock. In 2006, we sold proprietary biomass conversion equipment to a customer in China which has been successfully installed, commissioned, and operated. Discussions continue with this customer regarding the potential supply of equipment and a technology license for a significantly scaled-up system. In November, 2009 negotiations with a major supplier of ethanol in China were completed and resulted in a $6,725,000 contract being awarded to SunOpta BioProcess to supply our proprietary fiber preparation and fiber pre-treatment equipment and processes for use in the production of cellulosic ethanol. The Chinese client is one of the largest operators in the corn biochemical processing and new energy sectors in China and is owned by a consortium of leading Chinese companies including one of the largest petrochemical companies in China. Our equipment will be installed in a planned cellulosic ethanol demonstration plant scheduled for completion in late 2010. The plant will be located adjacent to an existing starch-to-ethanol facility and will utilize local corn stover as feedstock. The development of cellulosic ethanol alternatives has taken a high profile in China as the Central Government has discouraged further development of corn to ethanol plants due to environmental and food supply issues.
A proprietary steam explosion system has also been installed in the first U.S.-based cellulosic ethanol demonstration facility. This facility came on-line in early 2009 with the mechanical warranty period on our equipment supply contract expiring shortly thereafter in mid-2009.
The U.S. and Chinese operating facilities are important to us, as they are the first commercial cellulosic ethanol demonstration plants in the world, and are expected to form the basis for potential future orders and the scale-up to larger commercial facilities.
SunOpta BioProcess expanded its pilot plant capabilities at a site in Ontario, Canada. Commissioning on the new pilot plant facility was completed in the second quarter of 2009. The pilot plant provides us with the ability to keep our technological programs moving forward, to test new equipment designs and processes, to serve as a demonstration and training site for its commercialization efforts, and to drive revenue by providing pilot-scale services to external parties.
In July 2009, SunOpta BioProcess was awarded a Cdn $810,000 research grant from the National Research Council of Canada to cover labour costs incurred in conjunction with our R&D activities through to January 2011. The grant has allowed us to accelerate completion of a number of our R&D initiatives.
In January 2010, SunOpta BioProcess was awarded Cdn $5,500,000 in funding from Sustainable Development Technology Canada (“SDTC”) to assist SunOpta BioProcess and its partners to design, build and operate an integrated cellulosic ethanol plant and co-located xylitol production facility to be located in the Greater Toronto area. Early in 2008, we formed a joint venture with Xylitol Canada with the goal of researching and co-developing a proprietary technology to produce xylitol using co-product streams from the production of cellulosic ethanol. These efforts resulted in the development of a viable xylitol production technology for use in tandem with cellulosic ethanol production. The next step in the development of this technology will provide the necessary technical and economic performance data to validate scale-up to commercial-scale production of both cellulosic ethanol and xylitol. The fabrication of valuable co-products is expected to allow biofuel producers to increase their profitability and competitiveness. SunOpta BioProcess and its partners have developed an integrated process that will produce both food grade xylitol, which is considered to be a healthy sugar substitute, and fuel-grade cellulosic ethanol, therefore increasing the economic and environmental sustainability of cellulosic ethanol production. Using wood chips as feedstock, the technology is projected to decrease process water consumption by up to 75% compared to producing corn ethanol while retaining all of the life-cycle carbon benefits inherent to cellulosic ethanol. The project involves the construction of a demonstration facility at a total cost of approximately Cdn $17,000,000, to be funded approximately 67% by the partners and 33% by the SDTC grant. The construction of the demonstration facility is not expected to have an impact on 2010 operating results. The facility is anticipated to produce up to a rated capacity of 620 tons of xylitol and two million liters of cellulosic ethanol per year. Operation of the facility is expected to commence December 2010 with process validation complete by December 2011. Thereafter the facility may be operated for process optimization, continuous improvement, and to test new innovations. Upon completion of the SDTC project, construction of a 10,000 metric ton commercial xylitol facility in connection with a minimum 40 million liter cellulosic ethanol facility is contemplated to commence in September 2011, with first xylitol production from this facility expected by December 2012.
| SunOpta Inc. | 27 | December 31, 2009 – 10-K |
In January 2010 SunOpta BioProcess obtained a Cdn $2,700,000 credit facility to fund working capital requirements and issue letters of credit as may be required from time to time on equipment supply contracts. Drawings on the credit facility are collateralized by our cash balance.
We previously commenced a lawsuit against Abengoa New Technologies Inc. (“Abengoa”) and one of our former employees alleging, among other things, theft of trade secrets and breach of contract relating to the dilute acid hydrolysis technology that we developed with Abengoa. The matter was referred to arbitration and the arbitration was held in July and October of 2009. On February 1, 2010, the arbitrator issued a ruling denying all monetary damage claims, but also holding that we could independently commercialize the technology, without payment of royalty or other obligation to Abengoa. See Item 3, Legal Proceedings and Note 16 to the Consolidated Financial Statements for more information about the Abengoa lawsuit and arbitration award.
Competition
We believe the ability of the SunOpta BioProcess System to operate continuously at high pressure presents advantages in terms of reducing chemical requirements, handling a wide variety of feedstocks, improving biomass conversion to fermentable sugars and value-added components and providing significant cost and environmental advantages within the industry that the technology is being marketed.
Our success in marketing to the industry will depend on the extent to which the SunOpta BioProcess System can be shown to have advantages over the technology of competing suppliers. These competing suppliers include Ahlstrom, Kvaerner, Metso, Iogen and Andritz. We are aware of other groups that are attempting to develop and market new biomass conversion systems.
It is anticipated that competition from suppliers of alternative systems and equipment in targeted markets will be strong and that the potential advantages for the SunOpta BioProcess System will have to be continually demonstrated and improved upon through further research and development.
Distribution, Marketing and Sales
SunOpta BioProcess has several commercial personnel dedicated to the sales, marketing and licensing of its proprietary solutions and process equipment. The commercial personnel are supported by SunOpta BioProcess’ research and engineering teams, and benefit from our participation in and sponsorship of select trade events to promote our products and services. SunOpta BioProcess also maintains a website through which numerous enquiries are generated from the major target markets of Europe, North America, and Asia. Commercial personnel work with clients during every step of the development process including the initial concept, proposal development, contract negotiation, and project execution. At the current state of technology development, each proposal and solution is typically custom in nature. Optimal execution requires a significant level of sales, engineering, and project management resources and interaction with customers. Given the highly specialized and custom nature of our equipment, we manage all aspects of fabrication, packing and delivery of SunOpta BioProcess products to its customers utilizing common carriers and other vendors.
Suppliers
Waste biomass such as straw and fast-growing tree species such as poplar and aspen is currently available in abundant supply in many parts of the world. If other economic uses for waste biomass increase, the supply of such raw materials could be reduced, which could have a material adverse effect on the business of SunOpta BioProcess. The wide variety of raw materials that can be used as feedstocks in the SunOpta BioProcess System helps to mitigate this risk.
In respect to the manufacturing of the customized SunOpta BioProcess System, we provide equipment fabricators with detailed drawings and equipment specifications. All major equipment components have at least two alternate suppliers.
| SunOpta Inc. | 28 | December 31, 2009 – 10-K |
Regulation
SunOpta BioProcess technology may use chemicals in addition to steam to treat fibrous material. This technology does not generally produce appreciable pollutants and we believe our existing facilities are in compliance with applicable laws concerning the environment. To date, we have not found it necessary to spend significant resources to comply with applicable environmental laws. It is anticipated that future sales or licenses of our technology will be made wherein the SunOpta BioProcess System is but one part of a larger process, as for example in the manufacture of cellulosic ethanol or pulp. In these instances, the overall project may be subject to federal, state or local provisions regulating the discharge of materials into the environment and these will be the responsibility of the company utilizing the system. Compliance with such provisions may result in significant increases in the costs associated with the overall project.
Proprietary Technology
We recognize that others may attempt to copy our proprietary SunOpta BioProcess System or misappropriate the technology. To mitigate this risk, we require, as a normal business practice, signed confidentiality agreements with all parties to whom confidential information is supplied, including all customers and licensees. We hold several patents on equipment and process technology and in recent years have filed several additional patent applications pertaining to a number of advanced process technologies.
Financial Exposure Related to Bonding and Guarantees
On large projects we often have to provide substantial performance guarantees in the form of process guarantees and equipment guarantees. These guarantees normally need to be backed by bank guarantees or surety bonds. We endeavour to reduce the risks associated with these commitments; however, there will always be a possibility that guarantees or bonds could be called, rightfully or wrongfully and that the equipment supplied fails to meet the guarantees and warranties provided, resulting in potential financial losses.
Research and Development
During 2009, research and development activities were focused on the production of cellulosic ethanol and food applications, development of process improvements and novel processes, and enhancement of our intellectual property including technical know-how, trade secrets and patentable inventions.
Employees
SunOpta BioProcess has 27 full time employees, engaged in engineering, technical support, systems design, and research and development, as well as sales and marketing. We also utilize external resources, such as certain contract employees and consulting engineers, to meet our manpower needs while effectively managing operating costs. We expect to hire additional employees in 2010 as the SunOpta BioProcess System becomes more widely accepted and as demand for commercial-scale facilities increases.
In conjunction with the private placement of SunOpta BioProcess convertible preferred shares in 2007, 800 Restricted Stock Units (“RSUs”) and 800 stock options (with an exercise price of $20 per share) were granted to certain employees of SunOpta BioProcess. The RSUs allow for a cash payment or the grant of shares to the certain employees equal to the issuance price in a future initial public offering (to a maximum of $20 per share). The RSUs and the stock options granted only vest if a change of control of SunOpta BioProcess occurs or SunOpta BioProcess completes a qualified initial public offering. Unless terminated earlier in accordance with SunOpta BioProcess stock option plan, the stock options shall expire on the seventh anniversary of the closing date (i.e. June 7, 2014). If SunOpta BioProcess completes a qualified initial public offering (defined in the preferred share agreement as greater than $50,000,000), the RSUs would automatically be converted into common shares of SunOpta BioProcess upon closing of the transaction.
| SunOpta Inc. | 29 | December 31, 2009 – 10-K |
CORPORATE SERVICES GROUP
The corporate office of SunOpta is located on owned premises in Brampton, Ontario. Centralized information technology and financial shared services groups are located in Minnesota. We employ 59 staff members in a variety of management, financial, information technology and administration roles.
Environmental Hazards
We believe, with respect to both our operations and real property, that we are in material compliance with environmental laws at all of our locations and specifically with the requirements of its Certificate of Approval issued by the Ontario Ministry of the Environment and Energy on the Opta Minerals property in Waterdown, Ontario.
Employees
As of December 31, 2009, we had 2,327 employees broken out by segment below:
| Divisions | Number of Employees |
| SunOpta Foods | 2,060 |
| Opta Minerals | 181 |
| SunOpta BioProcess | 27 |
| Corporate Services Group | 59 |
| Total | 2,327 |
We believe that our relations with both union and non-union employees are good.
Available Information
Our annual reports on Form 10-K, quarterly reports on Form 10-Q, current reports on Form 8-K, and amendments to those reports filed or furnished pursuant to Section 13(a) or 15(d) of the Securities Exchange Act of 1934 (the “Exchange Act”), are available free of charge on our website at www.sunopta.com as soon as reasonably practicable after we file such information electronically with the SEC. The information found on our website is not part of this or any other report we file or furnish to the SEC. The public may read and copy any materials that we file with the SEC at the SEC’s Public Reference Room at 100 F Street, N.E., Room 1580, Washington, D.C. 20549. The public may obtain information on the operation of the Public Reference Room by calling the SEC at 1-800-SEC-0330. The SEC maintains an Internet site that contains reports, proxy and information statements, and other information regarding issuers that file electronically with the SEC at www.sec.gov.
Item 1A. Risk Factors
The following risk factors, as well as the other information contained in this report, should be considered carefully. These risk factors could materially and adversely affect our future operating results and could cause actual events to differ materially from those described in forward-looking statements in this report.
The recent disruption in the overall economy and the financial markets will impact our business
The industries in which we operate have been affected by recent economic factors, including the deterioration of global economic conditions, reduction in credit availability, declines in employment levels, and shifts in consumer spending patterns. Although the food industry will likely be more resilient to the impact compared to other industries, natural, organic and specialty foods and natural health products growth rates have slowed and may be negatively impacted should consumers convert to lower priced alternatives or exit the healthy foods category. If these conditions worsen, deteriorating financial performance could affect the financial ratios and covenants under our credit agreement, which, in turn, could affect our ability to borrow, increase our cost of borrowing or result in accelerated payment of outstanding loans.
| SunOpta Inc. | 30 | December 31, 2009 – 10-K |
We face risks related to the restatement of our 2007 quarterly financial statements
We restated our consolidated statements of earnings, balance sheets, statements of cash flows and statements of equity for each of the quarterly periods ended March 31, 2007, June 30, 2007, and September 30, 2007. On September 24, 2009, we announced that we entered into a proposed settlement agreement in connection with the securities class actions filed against us in the U.S. and Canada as a result of the restatements. Under the settlement agreement, $11,250,000 (funded entirely out of insurance proceeds) will be contributed to a settlement fund to be allocated to the class members. The settlement agreement remains subject to final approval by the courts and our right to terminate the agreement if a pre-agreed threshold of class members opt-out of the settlement.
In addition, we received letters from the SEC and the Ontario Securities Commission (OSC) requesting information related to the write-down of inventory and the restatement of our 2007 quarterly financial results, and we received a request from the OSC requesting information regarding our stock opting granting process. While the OSC completed its formal investigation without enforcement action against us or any of our officers, we continue to cooperate with the SEC in connection with its formal investigation.
As a result of these matters, we have incurred a significant amount in costs and legal fees and our management team has devoted considerable effort and attention away from our normal business operations. If the proposed class action settlement agreement is not finalized or there is an enforcement action by the SEC, it would result in additional expense to us, further divert the efforts and attention of our management team from our normal business operations, and we could face monetary judgments, penalties or other sanctions that could adversely affect our financial condition and could cause our stock price to decline.
Our credit agreements restrict how we may operate our business, and our business may be materially and adversely affected if these restrictions prevent us from implementing our business plan
We have various credit facilities including a primary facility with a syndicate of lenders. Our credit facilities contain covenants that limit the discretion of our management with respect to certain business matters. These covenants place restrictions on, among other things, our ability to incur additional indebtedness, to create other security interests, to complete a liquidation, dissolution, merger, amalgamation or reorganization, to make certain distributions or make certain payments, investments, loans and guarantees and to sell or otherwise dispose of certain assets. These restrictions may hinder our ability to execute on our growth strategy or prevent us from implementing parts of our business plan.
Our inability to meet the covenants of our credit facilities could materially and adversely affect our business
Due to the large inventory write-down and related professional fees, the restatement of our quarterly financial statements in 2007, and the delay in filing our financial statements for fiscal year 2007 and the first fiscal quarter of 2008, we have previously requested and received various amendments to and waivers of the financial covenants for our primary credit facility.
On October 30, 2009, we entered into a Fifth Amended and Restated Credit Agreement with a syndicate of lenders and Bank of Montreal as the agent. The new credit facility, which provides for asset-based, revolving credit facilities of up to $80,000,000 and Cdn $20,000,000 respectively (subject to borrowing base availability), replaces the revolving and non-revolving acquisition lines that existed in our previous credit facilities. The new facility matures on October 30, 2012 and provides borrowing capacity equal to amounts that existed under our previous credit facility.
| SunOpta Inc. | 31 | December 31, 2009 – 10-K |
Although we believe that we will be better positioned to achieve our financial covenants under the new credit facility, compliance with these new financial covenants will depend on the success of our business, our operating results, and our ability to achieve the financial forecasts set forth in the new credit facility. Various risks, uncertainties and events beyond our control could affect our ability to comply with the financial covenants and terms of the new facility. Failure to comply with our financial covenants and other terms could result in an event of default and the acceleration of all amounts owing under the new credit facility, unless we were able to negotiate a waiver. The lenders could condition any such waiver on an amendment to the new credit facility on terms that may be unfavourable to us. If we are unable to negotiate a covenant waiver or replace or refinance our new credit facility on favourable terms or at all, our business would be adversely impacted.
Our business may be materially and adversely affected if we are unable to refinance our term debt when it comes due in 2010
Under our new credit facility, $45,000,000 of term debt will come due on December 20, 2010. The debt is subject to renewal at the option of the lenders. We may be unable to renew the term debt with the current lenders or to find another lender willing to refinance the debt, and in either case the terms of such debt may be less favourable than our current terms or the amount available may be substantially less. If we have reduced borrowing capacity or are forced to repay all or any part of the term debt, or if the terms less favourable to us, it may result in our inability to finance certain of our operations, require us to scale back our operations, or force us to use our working capital to pay down the term debt. Any of these results would have a direct impact on our profitability and operating flexibility and could materially and adversely affect our financial condition and the price of our common shares.
We may require additional capital to maintain current growth rates, which may not be available on favourable terms or at all
Over the last ten years, we had a compounded annual revenue growth rate of 35.6%. Our ability to raise capital, through equity or debt financing, is directly related to our ability to both continue to grow and improve returns from our operations. An equity financing would dilute our current shareholders and may result in a decrease in our share price if we are unable to realize returns equal to or above our current rate of return. Debt financing may not be available to us on favourable terms or at all. We will not be able to maintain our growth rate and our strategy as a consolidator within the natural and organic food industries without continued access to capital.
Consumer preferences for natural and organic food products are difficult to predict and may change
Approximately 94% of our 2009 revenues were derived from SunOpta Foods. Our success depends, in part, on our ability to offer products that anticipate the tastes and dietary habits of consumers and appeal to their preferences on a timely and affordable basis. A significant shift in consumer demand away from our products or products that utilize our integrated grains, ingredients, fruits and natural health products, or our failure to maintain our current market position, could reduce our sales and harm our business. Consumer trends change based on a number of possible factors, including nutritional values, a change in consumer preferences or general economic conditions. Additionally, there is as a growing movement among some consumers to buy local food products in an attempt to reduce the carbon footprint associated with transporting food products from longer distances, and this could result in a decrease in the demand for food products and ingredients that we import from other countries or transport from warmer domestic growing regions. These changes could lead to, among other things, reduced demand and price decreases, which could have a material adverse effect on our business.
| SunOpta Inc. | 32 | December 31, 2009 – 10-K |
We operate in a highly competitive industry
We operate businesses in highly competitive product and geographic markets in the U.S., Canada and various international markets. The Grains and Foods Group, the Ingredients Group, the International Sourcing and Trading Group and the Fruit Group compete with various U.S. and international commercial grain procurement marketers, major companies with food ingredient divisions, other food ingredient companies, stabilizer companies, trading companies, consumer food companies that also engage in the development and sale of food ingredients and other food companies involved in natural and organic fruits. The Distribution Group competes against other organic and natural food distributors and other companies that market and sell vitamins, supplements, natural health products, health and beauty aids and conventional food distributors that provide specialty or high end packaged products. These competitors may have financial resources and staff larger than ours and may be able to benefit from economies of scale, pricing advantages and greater resources to launch new products that compete with our offerings. We have little control over and cannot otherwise affect these competitive factors. If we are unable to effectively respond to these competitive factors or if the competition in any of our product markets results in price reductions or decreased demand for our products, our business, results of operations and financial condition may be materially impacted.
An interruption at one of our manufacturing facilities could negatively affect our business
We own or lease, manage and operate a number of manufacturing, processing and packaging facilities located throughout the U.S., Canada, Mexico, Europe, China and Ethiopia. As of December 31, 2009, SunOpta Foods operates from 25 processing facilities (13 owned and 12 leased). Opta Minerals operates from 14 locations (five owned and nine leased) located in the United States, Canada and Eastern Europe. SunOpta BioProcess operates its facilities at our corporate location in Brampton, Ontario and its pilot plant in Waterdown, Ontario.
An interruption in or the loss of operations at one or more of these facilities, or the failure to maintain our labor force at one or more of these facilities, could delay or postpone production of our products, which could have a material adverse effect on our business, results of operations and financial condition until we could secure an alternate source of supply.
If we lose the services of our key management, our business could suffer
Our prospects depend to a significant extent on the continued service of our key executives, and our continued growth depends on our ability to identify, recruit and retain key management personnel. The competition for such employees is intense. We are also dependent on our ability to continue to attract, retain and motivate our sourcing, production, distribution, sales, marketing and other personnel. We do not carry key person life insurance on any of our executive officers.
If we do not manage our supply chain effectively, our operating results may be adversely affected
Our supply chain is complex. We rely on suppliers for our raw materials and for the manufacturing, processing and distribution of many of our products. The inability of any of these suppliers to deliver or perform for us in a timely or cost-effective manner could cause our operating costs to rise and our margins to fall. Many of our products are perishable and require timely processing and transportation to our customers. Many of our products can only be stored for a limited amount of time before they spoil and cannot be sold. We must continuously monitor our inventory and product mix against forecasted demand or risk having inadequate supplies to meet consumer demand as well as having too much inventory that may reach its expiration date. If we are unable to manage our supply chain efficiently and ensure that our products are available to meet consumer demand, our operating costs could increase and our margins could fall.
| SunOpta Inc. | 33 | December 31, 2009 – 10-K |
Volatility in the prices of raw materials and energy could increase our cost of sales and reduce our gross margin
Raw materials used by SunOpta Foods and Opta Minerals represent a significant portion of our cost of sales. Our cost to purchase services and materials, such as grains, fruits and other commodities, industrial minerals and natural gas, from our suppliers can fluctuate depending on many factors, including weather patterns, economic and political conditions and pricing volatility. In addition, we must compete for limited supplies of these raw materials and services with competitors having greater resources than us. If the cost of these materials and services increases due to any of the above factors, we may not be able to pass along the increased costs to our customers.
SunOpta Foods enters into a number of exchange-traded commodity futures and options contracts to partially hedge its exposure to price fluctuations on grain transactions to the extent considered practicable for minimizing risk from market price fluctuations. Futures contracts used for hedging purposes are purchased and sold through regulated commodity exchanges. Inventories, however, may not be completely hedged, due in part to our assessment of exposure from expected price fluctuations and an inability to hedge all raw materials.
Exchange purchase and sales contracts may expose us to risk in the event that a counter party to a transaction is unable to fulfill its contractual obligation. We are unable to hedge 100% of the price risk of each transaction due to timing, availability of hedge contracts and third party credit risk. In addition, we have a risk of loss from hedge activity if a grower does not deliver the commodity as scheduled. We also monitor the prices of natural gas and will from time to time lock in a percentage of our natural gas needs based on current prices and expected trends.
Climate change legislation could have an impact on our financial conditions and consolidated results of operations
Legislative and regulatory authorities in the U.S., Canada and internationally have considered, and will likely continue to consider, numerous measures related to climate change and greenhouse gas emissions. In order to produce, manufacture and distribute our products, we as well as our suppliers, use fuels, electricity and various other inputs, including agricultural and mining inputs, that release greenhouse gas emissions Concerns about the environmental impacts of greenhouse gas emissions and the global climate change may result in environmental taxes, charges, regulatory schemes, assessments or penalties, which could restrict or negatively impact our operations, as well as our suppliers, who would likely pass all or a portion of their costs along to us. We may not be able to pass any resulting cost increases along to our customers. Any enactment of laws or passage of regulations regarding greenhouse gas emissions or other climate change legislation by the U.S., Canada or any other international jurisdiction where we conduct business could adversely affect our financial condition and consolidated results of operations.
The exercise of stock options, participation in our employee stock purchase plan and issuance of additional securities could dilute the value of our common shares
As of December 31, 2009, there were 2,480,425 stock options outstanding to purchase Common Shares, with exercise prices ranging from $0.91 to $13.75 per common share. The exercise of these stock options could result in dilution in the value of our Common Shares and the voting power represented thereby. Furthermore, to the extent the holders of our stock options exercise such securities and then sell the Common Shares they receive upon exercise or upon the sale of Common Shares received as part of the employee stock purchase plan or the issuance of additional securities, our share price may decrease due to the additional amount of Common Shares available in the market. The subsequent sales of these shares could encourage short sales by our shareholders and others which could place further downward pressure on our share price. Moreover, the holders of our stock options may hedge their positions in our Common Shares by short selling our Common Shares, which could further adversely affect our stock price.
| SunOpta Inc. | 34 | December 31, 2009 – 10-K |
Impairment charges in goodwill or other intangible assets could adversely impact our financial condition and consolidated results of operations
As a result of our acquisitions, a portion of our total assets is comprised of intangible assets and goodwill. We are required to perform impairment tests of on our goodwill and other intangible assets annually or at any time when events occur that could affect the value of our business segments. We have previously recorded impairment charges to our consolidated statements of operations. We expect to engage in additional acquisitions, which may result in our recognition of additional intangible assets and goodwill. A determination that impairment has occurred would require us to write-off the impaired portion of our goodwill or other intangible assets, resulting in a charge to our earnings. Such a write-off could adversely impact our financial condition and consolidated results of operations.
Technological innovation by our competitors could make our food products less competitive
Competitors include major food ingredient and consumer food companies that also engage in the development and sale of food and food ingredients. Many of these companies are engaged in the development of food ingredients and other food products and continually introduce a number of products into the market. Existing products or products under development by our competitors could prove to be more effective or less costly than any products which have been or are being developed by us.
We rely on protection of our intellectual property and proprietary rights
Our success, and in particular, the success of SunOpta Foods and SunOpta BioProcess, depends in part on our ability to protect intellectual property rights. We rely primarily on patent, copyright, trademark and trade secret laws to protect our proprietary technologies. The failure of any patents or other intellectual property rights to provide protection to our technologies would make it easier for our competitors to offer similar products, which could result in lower sales or gross margins.
SunOpta Foods has developed a number of new ingredients and alternatives to accommodate new product adaptations of these and other ingredients into various food items. A number of our products and processes require us to create and maintain a number of patents and trade secrets. Our policy is to protect our technology by, among other things, filing patent applications for technology relating to the development of our business in the United States and in selected foreign jurisdictions.
Our trademarks and brand names are registered in the U.S., Canada and other jurisdictions and we intend to keep these filings current and seek protection for new trademarks to the extent consistent with business needs. We rely on trade secrets and proprietary know-how and confidentiality agreements to protect certain of the technologies and processes used by SunOpta Foods.
In addition, SunOpta BioProcess holds a number of existing patents and recently filed patent applications on its proprietary steam explosion technology and related processes. We recognize that there exists a threat of others attempting to copy our proprietary steam explosion technology. To mitigate this risk, the normal business practice of SunOpta BioProcess includes the signing of confidentiality agreements with all parties to which confidential information is supplied including all customers and licensees. We also hold several patents on our equipment and process technologies and alleviate risk by developing new patents.
We are subject to substantial environmental regulation and policies
We are, and expect to continue to be, subject to substantial federal, state, provincial and local environmental regulation. There are specific regulations governing the recycling of solid waste material regulated by the Ontario Ministry of Environment and Energy and the Commonwealth of Virginia, Department of Environment Quality.
Some of the key regulations include:
- Air Quality – is regulated by the EPA and certain city/state air pollution control groups. Emission reports are filed annually;
| SunOpta Inc. | 35 | December 31, 2009 – 10-K |
-
Waste Treatment/Disposal – solid waste is either disposed of by a third-party or in some cases we have a permit to haul and apply the sludge to land. Agreements exist with local city sewer districts to treat waste at specified levels of BOD and TSS;
-
Sewer – agreements with the local city sewer districts to treat waste as specified limits of BOD and TSS, which requires weekly/monthly reporting as well as annual inspection; and
-
Hazardous Chemicals – various reports are filed with local city/state emergency response agencies to identify potential hazardous toxic chemicals being used, including reports filed with the Department of Public Safety Emergency Response Commission in Minnesota and the Kentucky Emergency Response Commission.
Permits are required from various state, provincial and local authorities related to air quality, storm water discharge, solid waste, land spreading and hazardous waste.
In the event that our safety procedures for handling and disposing of potentially hazardous materials in certain of our businesses were to fail, we could be held liable for any damages that result and any such liability could exceed our resources. We may be required to incur significant costs to comply with environmental laws and regulations in the future. In addition, changes to environmental regulations may require us to modify our existing plant and processing facilities and could significantly increase the cost of those operations.
The foregoing environmental regulations, as well as others common to the industries in which we participate, can present delays and costs that can adversely affect business development and growth. If we fail to comply with applicable laws and regulations, we may be subject to civil remedies, including fines, injunctions, recalls or seizures, as well as potential criminal sanctions, which could have a material adverse effect on our business, results of operations and financial condition. In addition, any changes to current regulations may impact the development, manufacturing and marketing of our products, and may have a negative impact on our future results.
SunOpta Foods is subject to significant food and health regulations
SunOpta Foods is affected by a wide range of governmental regulations in Canada, the United States, as well as several countries in Europe, among others. These laws and regulations are implemented at the national level (including, among others, federal laws and regulation in Canada and United States) and by local subdivisions (including, among others, state laws in the United States and provincial laws in Canada). We are also subject to regulations of the European Union. Examples of laws and regulations that affect SunOpta Foods include laws and regulations applicable to:
- the use of seed, fertilizer and pesticides;
- the purchasing, harvesting, transportation and warehousing of grain and other products;
- the processing and sale of food, including wholesale operations; and
- the labeling and marketing of food and food products.
We are also subject to the regulatory authority of regulatory agencies in several different countries. Examples of regulatory agencies influencing our operations include: the USDA, the FDA, the EPA, the CFIA and SKAL (a European agency based in The Netherlands responsible for the certification of organic products) among others.
Changes in government laws and regulations applicable to our operations could adversely affect our results of operations. While we believe that SunOpta Foods is in compliance with all laws and regulations applicable to our operations, we cannot assure you that we have been, or will at all times be, in compliance with all food production and health requirements, or that we will not incur material costs or liabilities in connection with these requirements. Our failure to comply with such regulations could adversely affect our business and our results of operations.
| SunOpta Inc. | 36 | December 31, 2009 – 10-K |
Certain food ingredient products manufactured by SunOpta Foods are regulated under the 1958 Food Additive Amendments of FDCA, as administered by the FDA. Under the FDCA, pre-marketing approval by the FDA is required for the sale of a food ingredient which is a food additive unless the substance is GRAS under the conditions of its intended use by qualified experts in food safety. We believe that most products for which we have retained commercial rights are GRAS. However, such status cannot be determined until actual formulations and uses are finalized. As a result, we may be adversely impacted if the FDA determines that our food ingredient products do not meet the criteria for GRAS.
Because SunOpta Foods is involved in the manufacture, supply, processing and marketing of organic seed and food products, it is voluntarily subject to certain organic quality assurance standards. In December 2000, the USDA adopted regulations with respect to a national organic labeling and certification program which became fully effective in October 2002. These regulations, among other things, set forth the minimum standards producers must meet in order to have their products labeled as “certified organic.” We currently manufacture and distribute a number of organic products that are covered by these new regulations. Additionally, our organic products may be subject to U.S. state regulation. Our organic products are also subject to organic regulations outside of the U.S such as SRAL, JAS and others. While we believe our products and our supply chain are in compliance with these regulations, changes to food regulations may increase our costs to remain in compliance. We could lose our “organic” certification if a facility becomes contaminated with non-organic materials or if we do not use raw materials that are certified organic. The loss of our “organic” certifications could materially harm our business, results of operations and financial condition.
Amendments to Canada’s Organic Products regulations as administered by the Canada Organic Office of the Canadian Food Inspection Agency became effective in December 2008. Future developments in the regulation of labeling of organic foods could require us to further modify the labeling of our products, which could affect the sales of our products and thus harm our business.
Certain of our natural health products are also subject to regulations under federal Canadian legislation, including the Food and Drug Act (Canada), the Pest Control Products Act (Canada), Natural Health Products Regulation (Canada) and the regulations made thereunder and the Environmental Protection Act (Canada). While we believe we are in material compliance with all statutes and regulations governing these businesses, any breach of these statutes and regulations could result in fines, penalties or a loss in the ability to sell certain products which could have an adverse affect on our business.
Our operations are influenced by agricultural policies
SunOpta Foods is affected by Government agricultural policies such as price supports and acreage set aside programs and these types of policies may affect our business. The production levels, markets and prices of the grains and other raw products that we use in our business are materially affected by government programs, which include acreage control and price support programs of the USDA. Revisions in these programs, in the United States and elsewhere, could have an adverse affect on the results of our operations.
Product liability suits, if brought, could have a material adverse effect on our business
As a manufacturer and marketer of natural and organic food products, environmental mineral products and bioprocess conversion technology, we are subject to the risk of claims for product liability. If a product liability claim exceeding our insurance coverage were to be successfully asserted against us, it could materially harm our business.
The commercial scale viability of SunOpta BioProcess steam explosion technology may not be realized
SunOpta BioProcess’ proprietary steam explosion technology has yet to gain wide-spread acceptance within a number of industries and, consequently, earnings can fluctuate from quarter to quarter. Its patented steam technology, while proven, has yet to develop a broad customer base. The success of SunOpta BioProcess will depend upon its ability to promote commercial acceptance of its proprietary steam explosion technology and related biomass process solutions.
| SunOpta Inc. | 37 | December 31, 2009 – 10-K |
Construction or operational delays within SunOpta BioProcess could materially and adversely affect our revenues
Projects in construction under announced and anticipated collaborative agreements may experience delays in regulatory, engineering and construction phases, which may consequently affect delays in expected project revenue. The projects could also be subject to unanticipated interruptions in operations which could have a material adverse effect on our financial condition. Such delays or interruptions could be caused by, among other factors: construction and other cost overruns; weather conditions affecting the construction process; delays in the regulatory approval process; contractor delays or errors; breakdown or failure of equipment or processes; disruption or difficulty in procuring the supply of raw materials; energy and other inputs; or catastrophic events such as fire or storms.
The repeal or modification of government statutes and programs could materially and adversely affect the sales and profitability of SunOpta BioProcess
SunOpta BioProcess’ ability to realize projected cash flows and deploy processes and projects is significantly impacted by governmental regulations and subsidies. The repeal or modification of various statutes and fiscal incentives favouring the use of cellulosic ethanol could reduce demand and cause SunOpta BioProcess’ sales and profitability to decline. Examples of such changes could include the elimination of the federal ethanol tax incentives, ethanol tariffs, or changes in the renewable fuel standards (minimum levels of renewable fuels in gasoline).
Failure of future growth in ethanol demand could have a material adverse effect on the business of SunOpta BioProcess
The Energy Independence and Security Act of 2007 (“EISA”) was signed into law December 19, 2007 and amends the Renewable Fuels Standard (RFS) originally created by the Energy Policy Act of 2005. EISA mandates 36 Billion gallons of annual renewable biofuel production by 2022 – including 21 billion gallons per year in “Advanced Biofuels” which is inclusive of at least 16 billion gallons per year of “Cellulosic Biofuel”. Corn starch ethanol, currently produced at approximately 10 billion gallons per year according to the Renewable Fuels Association, is capped by the RFS at a maximum 15 billion gallons per year. Cellulosic ethanol, currently not being produced commercially, is mandated at 100 million gallons per year by 2010, with increasing mandated production levels each year to 2022. Because demand for cellulosic ethanol is mandated by law a reversal or waiver of government-mandated cellulosic ethanol requirements would have a materially adverse effect on SunOpta BioProcess’ business. Failure of continued growth of worldwide ethanol demand, changes in renewable fuel mandates worldwide or the failure to be able to produce commercially reasonable quantities of ethanol from cellulose-based materials would have a material adverse effect on SunOpta BioProcess’ business.
We are subject to financial exposure related to bonding and guarantees
For SunOpta BioProcess to enter certain markets, we have to provide substantial performance guarantees in the form of process guarantees and equipment guarantees. These guarantees need to be backed by bank guarantees or surety bonds. We endeavor to reduce the associated risks, however there will always remain a possibility that our guarantees or bonds could be called, rightfully or wrongfully and/or that the equipment supplied fails to meet the guarantees and warranties provided, resulting in potential financial losses.
Loss of a key customer could materially reduce revenues and earnings
We had no customers that represented over 10% of revenues for the year ended December 31, 2009. However, the loss or cancellation of business with any of our larger customers could materially and adversely affect our business, financial condition or results of operations.
| SunOpta Inc. | 38 | December 31, 2009 – 10-K |
Fluctuations in exchange rates, interest rates and certain commodities could adversely affect our results of operations, financial condition and liquidity
We are exposed to foreign exchange rate fluctuations as our Canadian subsidiaries and our European operations are translated into United States dollars for financial reporting purposes. We are exposed to changes in interest rates as a portion of our debt bears interest at variable rates. We are exposed to price fluctuations on a number of commodities as we hold inventory and enter into transactions to buy and sell products in a number of markets. Additional qualitative and quantitative disclosures about these risks can be found in Item 7A of this Form 10-K.
We may not be able to effectively manage our growth and integrate acquired companies
Our growth strategy inherently assumes that we will be able to identify suitable acquisition candidates on terms acceptable to us and that these acquisitions, if pursued and completed, will be integrated successfully. Our ability to effectively integrate current and future acquisitions, including our ability to realize potentially available marketing opportunities and cost savings in a timely and efficient manner will have a direct impact on our future results. We may encounter problems in connection with the integration of any new businesses, such as:
-
integration of an acquired company’s products into our product mix;
-
amount of cost savings that may be realized as a result of our integration of an acquired product or business;
-
unanticipated quality and production issues with acquired products;
-
adverse effects on business relationships with our suppliers and customers;
-
diversion of management attention;
-
difficulty with personnel and loss of key employees;
-
implementation of an integrated enterprise wide accounting and information system and consolidation of back office accounting;
-
compatibility of financial control and information systems;
-
exchange rate risk with respect to our acquisitions outside the United States;
-
potential for patent and trademark claims or other litigation against or involving the acquired company; and
-
in the case of foreign acquisitions, uncertainty regarding foreign laws and regulations and difficulty integrating operations and systems as a result of cultural, systems and operational differences.
Adverse weather conditions could impose costs on our business
Our various food products, from seeds and grains to ingredients, fruits, vegetables and other inputs, are vulnerable to adverse weather conditions, including windstorms, floods, drought, fires and temperature extremes, which are quite common but difficult to predict. Additionally, severe weather conditions may occur with higher frequency or may be less predictable in the future due to the effects of climate change. Unfavourable growing conditions can reduce both crop size and crop quality. In extreme cases, entire harvests may be lost in some geographic areas. These factors can increase costs, decrease revenues and lead to additional charges to earnings, which may have a material adverse effect on our business, results of operations and financial condition.
| SunOpta Inc. | 39 | December 31, 2009 – 10-K |
Our operating results and share price are subject to significant volatility
Our net sales and operating results may vary significantly from period to period due to:
-
changes in our operating expenses;
-
management’s ability to execute our business strategies focused on improved operations earnings;
-
personnel changes;
-
supply shortages;
-
general economic conditions.
In addition, our share price is more volatile than other larger public companies. Announcements regarding:
-
fluctuations in financial performance from period to period;
-
mergers, and acquisitions and/or divestitures;
-
changes in key personnel;
-
strategic partnerships or arrangements;
-
litigation and governmental inquiries;
-
changes in governmental regulation and policy;
-
patents or proprietary rights;
-
changes in consumer preferences and demand;
-
new financings; and
-
general market conditions,
may have a significant impact on our share price. Higher volatility increases the chance of larger than normal price swings which reduces predictability in the share value of our stock and could impair investment decisions. In addition, price and volume trading volatility in the stock markets can have a substantial effect on our share price, frequently for reasons other than our operating performance. These broad market fluctuations could adversely affect the market price of our common shares.
Item 1B. Unresolved Staff Comments – None.
| SunOpta Inc. | 40 | December 31, 2009 – 10-K |
Item 2. Properties
SunOpta Foods
As of December 31, 2009, SunOpta Foods operates from the following locations which are owned unless otherwise noted.
| Location | State/Province | Group/Sub Group | Facility Description |
| Brampton |
Ontario |
Corporate Head Office/BioProcess |
Corporate head office and BioProcess facilities |
| Minnetonka (2 Leases) (1) | Minnesota | Corporate Services | IT Corporate and Grains and Foods office |
| Hope | Minnesota | Grains and Foods | Grains head office and grain processing |
| Alexandria | Minnesota | Grains and Foods | Aseptic packaging facility |
| Alexandria | Minnesota | Grains and Foods | Ingredient processing |
| Modesto (Lease) (2) | California | Grains and Foods | Soy processing and packaging plant |
| Wahpeton | North Dakota | Grains and Foods | Processing, warehouse and distribution |
| Wahpeton | North Dakota | Grains and Foods | Grain storage |
| Huevelton | New York | Grains and Foods | Soymilk processing plant |
| Blooming Prairie | Minnesota | Grains and Foods | Grain storage |
| Ellendale | Minnesota | Grains and Foods | Grain storage |
| Snover (Monthly Rent) | Michigan | Grains and Foods | Grains sales office |
| Cresco | Iowa | Grains and Foods | Milling facility |
| Breckenridge | Minnesota | Grains and Foods | Grain processing and distribution |
| Breckenridge (Lease) (3) | Minnesota | Grains and Foods | Grains sales Office |
| Goodland | Kansas | Grains and Foods | Grain processing and distribution |
| Edson (Land Lease) (4) | Kansas | Grains and Foods | Grain processing and distribution |
| Moorehead | Minnesota | Grains and Foods | Grain processing and distribution |
| Chelmsford (Lease) (5) |
Massachusetts |
Ingredients |
Ingredients head office and development centre |
| Louisville (Lease) (6) | Kentucky | Ingredients | Fiber processing facility |
| Cedar Rapids | Iowa | Ingredients | Fiber processing facility |
| Cambridge | Minnesota | Ingredients | Fiber processing facility |
| Fosston | Minnesota | Ingredients | Processing and drying |
| Galesburg | Illinois | Ingredients | Starch based production and ingredients blending |
| Buena Park (2 Leases) (7) |
California |
Fruit Group – Fruit Specialties |
Processing, warehouse and distribution and Fruit Group head office |
| South Gate (Lease) (8) | California | Fruit Group – Fruit Specialties | Processing, warehouse and distribution |
| Salinas (Lease) (9) | California | Fruit Group – Fruit Specialties | Processing, warehouse and distribution |
| Libertyville (Lease) (10) | Illinois | Fruit Group – Fruit Specialties | Hess Food Group office |
| Rosarito (Lease) (11) | Mexico | Fruit Group – Fruit Specialties | Frozen fruit processing facility |
| Guanajuato | Mexico | Fruit Group – Fruit Specialties | Frozen fruit processing facility |
| Summerland (2 Leases) (12) |
British Columbia |
Fruit Group – Healthy Fruit Snacks Operations |
Processing facilities |
| Omak (Lease) (13) |
Washington |
Fruit Group – Healthy Fruit Snacks Operations |
Processing, warehouse and distribution
|
| Brampton (Lease) (14) |
Brampton |
Fruit Group – Healthy Fruit Snacks Operations |
Sales office |
| Aptos (Lease) (15) |
California |
International Sourcing and Trading |
Organic Ingredients office |
| Dalian (Lease) (16) |
China |
International Sourcing and Trading |
Sales office, processing facilities |
| Amsterdam (Lease) (17) |
The Netherlands |
International Sourcing and Trading |
Sales office |
| Syke (Lease) (18) | Germany | International Sourcing and Trading |
Sales office |
| SunOpta Inc. | 41 | December 31, 2009 – 10-K |
| Shelton (Lease) (19) |
Connecticut |
International Sourcing and Trading |
Sales office |
| Addis Ababa (Lease) (20) |
Ethiopia |
International Sourcing and Trading |
Processing facility and warehouse |
| Richmond (Lease) (21) |
British Columbia |
Distribution Group |
Distribution Group head office, distribution and warehousing |
| Toronto (Lease) (22) | Ontario | Distribution Group | Office, distribution and warehousing |
| Toronto (Lease) (23) | Ontario | Distribution Group | Office, distribution and warehousing |
| Burnaby (Lease) (24) | British Columbia | Distribution Group | Office, distribution and warehousing |
| St. Laurent (Lease) (25) | Quebec | Distribution Group | Office, distribution and warehousing |
| Acton (4 Leases) (26) |
Ontario |
Distribution Group |
Office, distribution and warehousing and NHP packaging |
| Vancouver (Lease) (27) | British Columbia | Distribution Group | Office, distribution and warehousing |
| Scotstown | Quebec | Distribution Group | Office, distribution and warehousing |
| Brantford (Lease) (28) |
Ontario |
Distribution Group |
NHP Processing, warehouse and distribution |
| (1) Leases have an expiry date of June 2012. | (2) Lease has an expiry date of May 2019. |
| (3) Lease has an expiry date of October 2011 | (4) Lease has an expiry date of November 2023. |
| (5) Lease has an expiry date of September 2013. | (6) Lease has an expiry date of July 2011. |
| (7) Leases have an expiry date of May 2011 and May 2010 respectively. | (8) Lease has an expiry date of December 2016. |
| (9) Lease has an expiry date of December 2011, and is currently under a sub-lease arrangement to a third party. | (10) Lease has an expiry date of March 2014. |
| (11) Lease has an expiry date of May 2012. | (12) One lease has an expiry date of December 2016 and one lease is month to month. |
| (13) Lease has an expiry date of May 2017. | (14) Lease has an expiry date of November 2012. |
| (15) Lease has an expiry date of December 2010. | (16) Lease has an expiry date of September 2011. |
| (17) Lease has an expiry date of April 2013. | (18) Lease is month to month. |
| (19) Lease has an expiry date of April 2012. | (20) Lease is month to month. |
| (21) Lease has an expiry date of August 2022. | (22) Lease has an expiry date of January 2010. |
| (23) Lease has an expiry date of December 2014 | (24) Lease has an expiry date of October 2013. |
| (25) Lease has an expiry date of June 2010. | (26) All leases have an expiry date of December 2011. |
| (27) Lease has an expiry date of August 2011. | (28) Lease has an expiry date of November 2010. |
Opta Minerals
As of December 31, 2009, Opta Minerals operates from the following major locations which are owned unless otherwise noted.
| Location | State/Province | Group | Description |
| Waterdown | Ontario | Opta Minerals | Group head office, processing and distribution |
| Brantford (Lease) (1) | Ontario | Opta Minerals | Distribution and packing center |
| Bruno de Guigues | Quebec | Opta Minerals | Specialty sands |
| New Orleans (Lease) (2) | Louisiana | Opta Minerals | Abrasives processing |
| Norfolk (Lease) (3) | Virginia | Opta Minerals | Processing and distribution |
| Keeseville (Lease) (4) | New York | Opta Minerals | Garnet processing and distribution |
| Baltimore (Lease) (5) | Maryland | Opta Minerals | Abrasives processing |
| Hardeeville | South Carolina | Opta Minerals | Processing facility |
| Laval (Lease) (6) | Quebec | Opta Minerals | Processing facility |
| Walkerton | Indiana | Opta Minerals | Abrasives processing |
| Kosice (Lease) (7) | Slovakia | Opta Minerals | Processing facility |
| Milan | Michigan | Opta Minerals | Abrasives processing |
| Freeport (Lease) (8) | Texas | Opta Minerals | Abrasives processing |
| Tampa (Lease) (9) | Florida | Opta Minerals | Abrasives processing |
| SunOpta Inc. | 42 | December 31, 2009 – 10-K |
| (1) |
Lease has an expiry date of April 2010. |
| (2) |
Lease has an expiry date of December 2011. |
| (3) |
Lease has an expiry date of October 2010 and an option to purchase up to expiry. |
| (4) |
Lease has an expiry date of November 2011. |
| (5) |
Lease has an expiry date of December 2013. |
| (6) |
Lease has an expiry date of February 2012. |
| (7) |
Lease is month to month. |
| (8) |
Lease has an expiry date of March 2014. |
| (9) |
Lease has an expiry date of January 2014. |
SunOpta BioProcess and Executive Offices
Our executive head office and SunOpta BioProcess office are each located at 2838 Bovaird Drive West, Brampton, Ontario, a property we own. SunOpta BioProcess has also entered into a lease for pilot plant facilities in Waterdown, Ontario. The Waterdown pilot operation is located on premised owned by Opta Minerals.
| SunOpta Inc. | 43 | December 31, 2009 – 10-K |
Item 3. Legal Proceedings
Class Action Lawsuits (US and Canada)
After we downgraded previously issued earnings expectations for 2007 and announced the restatement of prior 2007 quarterly financial statements due to a significant write-down and other adjustments, SunOpta and certain officers (one of whom is a director) and a former director were named as defendants in several proposed class action lawsuits filed in the United States District Court for the Southern District of New York on behalf of shareholders who acquired securities of SunOpta between May 8, 2007 and January 25, 2008. We are alleged to have violated Section 10(b) of the Securities Exchange Act of 1934 and Rule 10b-5 promulgated thereunder by the SEC. Additionally, the named officers and directors (one of whom is a former director) were alleged to have violated Section 20(a) of the Securities Exchange Act of 1934. The complaints alleged different proposed class periods and were consolidated into one class action with two lead plaintiffs. On January 28, 2009, the Court appointed Western Washington Laborers-Employers Pension Trust and Operating Engineers Construction Industry and Miscellaneous Pension Fund as the lead plaintiffs in one consolidated class action aggregating the various class action lawsuits. On April 14, 2009, the lead plaintiffs filed their consolidated and amended complaint in the U.S. District Court in the Southern District of New York. The new complaint includes, new allegations under Sections 11, 12 and 15 of the Securities Act of 1933 as well as four new individual defendants, two of whom are former senior management employees (one also a former director and officer), one is a current director and chairman and one is currently a senior employee. The new complaint also added three corporate defendants, namely, Cleugh’s Frozen Foods, Inc. and Pacific Fruit Processors, Inc. (each of which are now part of the merged entity, SunOpta Fruit Group, Inc.) and Organic Ingredients, Inc. (which is now SunOpta Global Organic Ingredients, Inc.).
Similarly, one proposed class action lawsuit has also been filed in Canada in the Ontario Superior Court of Justice on behalf of shareholders who acquired securities of SunOpta between May 8, 2007 and January 25, 2008 against us and certain of our officers (one of whom is a director), alleging misrepresentation and proposing to seek leave from the Ontario court to bring statutory misrepresentation civil liability claims under the Ontario Securities Act. On August 29, 2008, the plaintiff filed a motion to amend the claims against us to include additional allegations. The Canadian plaintiffs claim compensatory damages of Cdn $100,000,000 and punitive damages of Cdn $10,000,000 and other monetary relief.
On September 24, 2009, we announced that we entered into a tentative agreement to settle all claims raised in these proposed class action proceedings. In return for the dismissal of the class actions and releases from proposed class members of settled claims against us and other named defendants, the settlement agreement provides for a total cash contribution of $11,250,000 to a settlement fund, the adoption of certain governance enhancements to our Audit Committee charter and Internal Audit Charter and the adoption of an enhanced information technology conversion policy. The settlement fund will be entirely funded by our insurers. The settlement is conditional upon the courts’ approval and subject to our option to terminate it in the event of valid opt-outs by proposed class members that exceed a pre-agreed threshold.
The Ontario Superior Court and U.S. District Court have each granted preliminary approval of the settlement agreement and, for the purposes of the settlement only, have certified the lawsuits as class actions. The courts have scheduled hearings on May 3, 2010 (Canada) and May 17, 2010 (US) to determine whether they will grant final approval of the proposed settlement agreement. According to the notice of proposed settlement sent to class members on or about February 10, 2010, class members have until April 12, 2010 to opt out of the settlement.
In the event the proposed settlement agreement is not approved by the courts or we elect to terminate it if there is a high number of opt-outs by class members, the settlement agreement will be void and our intention is to vigorously defend these actions. Given the current status of the class actions, it is not possible to determine the probability of liability, if any, or estimate the loss, if any, that might arise from these lawsuits. Accordingly, no accrual has been made at this time for these contingencies.
| SunOpta Inc. | 44 | December 31, 2009 – 10-K |
SEC and OSC Investigations
In 2008 we received letters from the SEC requesting additional information in connection with the restatement of our filings for each of the quarterly periods ended March 31, 2007, June 30, 2007, and September 30, 2007. Additionally, the SEC has conducted interviews with certain current and past employees, current and former members of our Audit Committee, as well as our previous external auditors. We continue to cooperate with the requests from the SEC in connection with its investigation.
We have also received letters from the Ontario Securities Commission (“OSC”) requesting information related to restatement of our filings for each of the quarterly periods ended March 31, 2007, June 30, 2007, and September 30, 2007 and regarding our stock option granting process, a comprehensive response to which was provided in September 2008. The OSC has indicated it has no further comments on our write-down and restatement or on their investigation regarding our stock option granting process.
An enforcement action by the SEC could result in an expense in the form of sanctions, fines or other levies against both the Company and certain executive officers and employees. We cannot conclude whether the prospect of an unfavourable outcome in this matter is probable, or estimate the loss, if any, that might arise from any enforcement action taken against us or our officers. Accordingly, no accrual has been made at this time for this contingency.
SunOpta BioProcess lawsuit against Abengoa New Technologies
We commenced a suit on January 17, 2008, against Abengoa New Technologies Inc. (“Abengoa”) and one of our former employees alleging theft of trade secrets, breach of contract, tortious interference with contract and civil conspiracy, and filed motions for expedited discovery and a preliminary injunction. Abengoa filed a counterclaim alleging breach of contract, misappropriation of trade secrets and other contractual violations. The United States District Court, Eastern District of Missouri, referred the core claims to arbitration and stayed the other claims pending the outcome of the arbitration. The arbitration was held during the period of July 20 to July 24 inclusive and October 19 to October 23 inclusive, in St. Louis, Missouri before a single arbitrator. The arbitrator issued a ruling on February 1, 2010 denying all monetary damage claims, but also holding that we could independently commercialize, without payment of royalty or other obligation to Abengoa, the dilute acid hydrolysis technology we developed with Abengoa and implemented at Abengoa’s cellulosic ethanol facility in Salamanca, Spain. Prior to the arbitrator’s ruling, Abengoa had exclusive use, and rights to exploit, the jointly developed technology in the field of fermentable sugars and cellulosic ethanol production.
Arbitration with Abener Energia
In January 2008, a customer of ours, Abener Energia S.A. (an affiliate of Abengoa), terminated a contract valued at approximately $7,000,000 for the delivery of equipment and related services, forcing the matter into arbitration under its provisions. In December, the arbitrator rendered his final decision partially allowing Abener’s claim and awarded Abener approximately $1,903,000 (€1,329,000) in damages. Abener’s Canadian counsel brought an application in Ontario for the enforcement of the award, and a decision was rendered in support of the enforcement of the award. We satisfied the Canadian judgment, and the Spanish arbitration award, by payment early in 2010.
Vargas Class Action
In September 2008, a single plaintiff and a former employee, Mr. Vargas, filed a wage and hour dispute against SunOpta Fruit Group, Inc., as a class action alleging various violations of California’s labor laws. On July 16, 2009, the parties attended mediation in San Francisco, and no settlement was reached. A second mediation was held on January 15, 2010. A tentative settlement of all claims was reached at mediation, subject to agreement on final terms of the settlement, including a plan of distribution, including reversion features in our favour in the event claimants do not come forward with claims, and approval of the settlement by the court. As a result of the tentative settlement, we have accrued a liability of $1,200,000 in our financial statements for the period ending December 31, 2009.
In addition, various claims and potential claims arising in the normal course of business are pending against us, and by us with third parties. Management believes the final determination of these claims or potential claims will not materially affect our financial position or results.
| SunOpta Inc. | 45 | December 31, 2009 – 10-K |
Item 4. Reserved
| SunOpta Inc. | 46 | December 31, 2009 – 10-K |
PART II
Item 5. Market for Registrant’s Common Equity, Related Stockholder Matters and Issuer Purchases Equity Securities
Our common shares trade in U.S. dollars on The NASDAQ Global Select Market under the symbol STKL, and in Canadian dollars on the Toronto Stock Exchange (“TSX”) under the symbol SOY. The following table indicates the high and low bid prices for our common shares for each quarterly period during the past two years as reported by NASDAQ. The prices shown are representative inter-dealer prices, do not include retail mark ups, markdowns or commissions and do not necessarily reflect actual transactions.
Trade Prices on NASDAQ (U.S. Dollars)
| 2009 | HIGH | LOW |
| First Quarter | $3.88 | $0.79 |
| Second Quarter | $2.50 | $1.40 |
| Third Quarter | $4.20 | $2.00 |
| Fourth Quarter | $4.40 | $3.05 |
| 2008 | HIGH | LOW |
| First Quarter | $13.25 | $4.56 |
| Second Quarter | $7.72 | $4.73 |
| Third Quarter | $7.15 | $4.87 |
| Fourth Quarter | $6.61 | $1.15 |
The following table indicates the high and low bid prices for our common shares for each quarterly period during the past two years as reported by the TSX.
Trade Prices on TSX (Canadian Dollars)
| 2009 | HIGH | LOW |
| First Quarter | $4.49 | $1.06 |
| Second Quarter | $2.84 | $1.66 |
| Third Quarter | $4.57 | $2.31 |
| Fourth Quarter | $4.67 | $3.25 |
| 2008 | HIGH | LOW |
| First Quarter | $13.14 | $4.57 |
| Second Quarter | $7.92 | $4.79 |
| Third Quarter | $7.63 | $4.96 |
| Fourth Quarter | $7.00 | $1.46 |
At December 31, 2009, we had approximately 747 shareholders of record. We have never paid cash dividends on our common stock and do not anticipate paying dividends for the foreseeable future. The receipt of cash dividends by U.S. shareholders from a Canadian corporation, such as we are, may be subject to Canadian withholding tax.
| SunOpta Inc. | 47 | December 31, 2009 – 10-K |
Equity Compensation Plan Information
Securities authorized for issuance under equity compensation plans are described in the table below.
| Number of securities | |||||||||
| remaining available | |||||||||
| for future | |||||||||
| Weighted- | issuance under | ||||||||
| Number of securities | average | equity compensation | |||||||
| to be issued upon | exercise price | plans (excluding | |||||||
| exercise of | of outstanding | securities reflected | |||||||
| outstanding options, | options | in column (a)) | |||||||
| Plan category | (a) | (b) | (c) | ||||||
| Equity compensation plans approved by
security holders |
|||||||||
| Stock option plan | 2,480,425 | 5.16 | 1,546,035 | ||||||
| Employee stock purchase plan | n/a | n/a | 1,872,995 | ||||||
| Equity compensation plans not approved by
security holders |
- |
- |
- |
||||||
| Total | 2,480,425 | 5.16 | 3,419,030 |
Shareholder return performance graph
This performance graph shall not be deemed “filed” for purposes of Section 18 of the Securities Exchange Act of 1934, as amended (the Exchange Act), or incorporated by reference into any filing of SunOpta Inc. under the Securities Act of 1933, as amended, or the Exchange Act, except as shall be expressly set forth by specific reference in such filing.
The following graph compares the five year cumulative shareholder return on our common shares to the cumulative total return of the S&P/TSX Composite and the NASDAQ Industrial Indices for the period which commenced December 31, 2004.
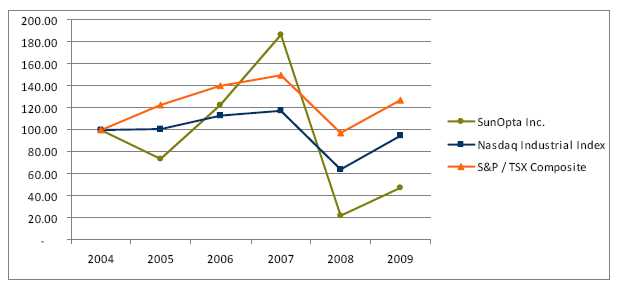
| 2004 | 2005 | 2006 | 2007 | 2008 | 2009 | |||||||||||||
| SunOpta Inc. | 100.00 | 73.26 | 122.56 | 185.93 | 21.87 | 46.80 | ||||||||||||
| Nasdaq Industrial Index | 100.00 | 100.12 | 112.52 | 117.27 | 64.06 | 94.07 | ||||||||||||
| S&P/TSX Composite | 100.00 | 121.91 | 139.60 | 149.60 | 97.20 | 127.03 |
Assumes that $100.00 was invested in our common shares and in each Index on December 31, 2004.
| SunOpta Inc. | 48 | December 31, 2009 – 10-K |
Issuance of unregistered securities
Equity Offering in 2007 / 2008
On February 13, 2007, we completed a public offering and raised gross proceeds of approximately $53,820, including an over-allotment option, and before deducting underwriters’ commissions and other expenses. The offering, including the over-allotment, was for 5,175 common shares at a price of $10.40 per share. We incurred share issuance costs of $1,938, net of a $920 tax benefit, for net proceeds of $51,882.
The offering was completed through a syndicate of underwriters led by Canaccord Adams Inc. in the United States and Canaccord Capital Corporation in Canada and including in Canada, BMO Nesbitt Burns Inc., National Bank Financial Inc., Desjardins Securities Inc. and Octagon Capital Corporation.
Options and warrants exercised during the year
During the year ended December 31, 2009, employees and directors exercised nil (2008 – 65,580) common share options and an equal number of common shares were issued for net proceeds of $nil (2008 - $264).
Use of Proceeds
The funds raised as a result of the equity offering and through the exercise of warrants and employee stock were used for general business purposes including the reduction of bank indebtedness, working capital requirements, internal expansion projects and for acquisitions.
Item 6. Selected Financial Data
We have completed a number of acquisitions over the five fiscal periods presented. For a listing of the acquisitions completed by SunOpta Foods and Opta Minerals, refer to Part I, Item 1 of this report entitled “Business”. In addition, the pro-forma revenues, pro forma (loss) earnings attributable to SunOpta Inc., and pro-forma basic and diluted (loss) earnings per share are presented in Note 2(c) of the Consolidated Financial Statements contained in Part IV of this report.
The following information has been summarized from our 2009 Consolidated Financial Statements.
Summary (expressed in thousands of U.S. dollars, except per share amounts)
| 2009 | 2008 | 2007 | 2006 | 2005 | |||||||||||
| Revenues | 989,132 | 1,055,173 | 802,494 | 598,026 | 426,101 | ||||||||||
| (Loss) earnings for the year, attributable to SunOpta Inc. | (6,763 | ) | (10,936 | ) | 407 | 10,959 | 13,558 | ||||||||
| Total assets | 551,290 | 581,047 | 569,440 | 404,730 | 302,863 | ||||||||||
| Long-term debt (including current portion) | 87,189 | 111,527 | 98,714 | 77,827 | 59,056 | ||||||||||
| Other long-term liabilities (including current portion) | 3,959 | 6,379 | 4,611 | 5,343 | 1,195 | ||||||||||
| Basic (loss) earnings per share | ($0.10 | ) | ($0.17 | ) | $ | 0.01 | $ | 0.19 | $ | 0.24 | |||||
| Diluted (loss) earnings per share | ($0.10 | ) | ($0.17 | ) | $ | 0.01 | $ | 0.19 | $ | 0.24 | |||||
| Cash dividends | - | - | - | - | - | ||||||||||
| Exchange rates (Cdn $ / U.S. $) | |||||||||||||||
| Period end | 1.0510 | 1.2180 | 0.9913 | 1.1654 | 1.1630 | ||||||||||
| Average rate | 1.1415 | 1.0660 | 1.0740 | 1.1344 | 1.2114 |
| SunOpta Inc. | 49 | December 31, 2009 – 10-K |
Item 7. Management’s Discussion and Analysis of Financial Conditions and Results of Operations
Forward-looking Financial Information
The Management Discussion and Analysis (MD&A) section provides analysis of our operations and financial position for the fiscal period ended December 31, 2009 and includes information available to March 4, 2010. It is supplementary information and should be read in conjunction with our 2009 Consolidated Financial Statements, including the accompanying notes, management’s report and the auditor’s report available on our website at www.sunopta.com.
Certain statements contained in this MD&A may constitute forward-looking statements as defined under securities laws. Forward-looking statements may relate to our future outlook and anticipated events or results and may include statements regarding our future financial position, business strategy, budgets, litigation, projected costs, capital expenditures, financial results, taxes, plans and objectives. In some cases, forward-looking statements can be identified by terms such as “may”, “will”, “should”, “expect”, “plan”, “anticipate”, “believe”, “intend”, “estimate”, “predict”, “potential”, “continue”, or other similar expressions concerning matters that are not historical facts.
To the extent any forward-looking statements contain future-oriented financial information or financial outlooks, such information is being provided to enable a reader to assess our financial condition, material changes in our financial condition and our results of operations, including liquidity and capital resources for the fiscal period ended December 31, 2009, compared with the fiscal period ended December 31, 2008. Readers are cautioned that this information may be not appropriate for any other purpose, including investment decisions.
Forward-looking statements contained in this MD&A are based on certain factors and assumptions regarding expected growth, results of operations, performance, and business prospects and opportunities. While we consider these assumptions to be reasonable, based on information currently available, they may prove to be incorrect.
Forward-looking statements are also subject to certain factors, including risks and uncertainties that could cause actual results to differ materially from what we currently expect. These factors are more fully described in the “Risk Factors” section at Item 1A of this Annual Report on Form 10-K.
Forward-looking statements contained in this commentary are based on our current estimates, expectations and projections, which we believe are reasonable as of the current date. You should not place undue importance on forward-looking statements and should not rely upon this information as of any other date. Other than as required under securities laws, we do not undertake to update any forward-looking information at any particular time.
Overview
Our 2009 Consolidated Financial Statements include the results of the organization’s three principal industry segments:
- SunOpta Foods, which accounts for approximately 94% of 2009 revenues, sources, processes, packages, markets and distributes a wide range of natural, organic, kosher and specialty food products and ingredients with a focus on soy, corn, sunflower, fruit, fiber and other natural and organic foods and natural health products;
- Opta Minerals, which accounts for approximately 6% of 2009 revenues, processes, distributes and recycles silica-free loose abrasives, roofing granules, industrial minerals and specialty sands for the foundry, steel, roofing shingles and bridge and ship-cleaning industries; and
- SunOpta BioProcess, which accounts for less than 0.1% of 2009 revenues, provides a wide range of research and development and engineering services and owns a number of patents on its proprietary steam explosion technology. It designs and subcontracts the manufacture of these systems, which are used for processing biomass for use in the biofuel, paper and food industries.
Each of our industry segments are growth oriented, ethical businesses, focused on environmental responsibility and the health and well being of the communities they serve. For a more detailed description of our operating groups and their businesses, please see the “Business” section at Item 1 of this Annual Report on Form 10-K.
| SunOpta Inc. | 50 | December 31, 2009 – 10-K |
The MD&A detailed below is presented in five parts: Critical Accounting Estimates, Results of Operations for 2009 versus 2008 and 2008 versus 2007, Recent Accounting Developments, Liquidity and Capital Resources, Business and Financial Outlook and Risks and Uncertainties. This MD&A should be read in conjunction with our December 31, 2009 Consolidated Financial Statements and accompanying notes. Dollar amounts in this MD&A are presented in thousands of U.S. Dollars, unless otherwise notes.
Critical Accounting Estimates
The preparation of financial statements in conformity with accounting principles generally accepted in the United States requires management to make certain estimates and assumptions that affect the reported amounts of assets and liabilities, related revenues and expenses, and disclosure of gain and loss contingencies at the date of the financial statements. The estimates and assumptions made require us to exercise our judgment and are based on historical experience and various other factors that we believe to be reasonable under the circumstances. We continually evaluate the information that forms the basis of our estimates and assumptions as our business and the business environment generally changes. The use of estimates is pervasive throughout our financial statements. The following are the accounting estimates which we believe to be most important to our business.
Revenue recognition
We recognize revenue at the time of delivery of the product or service and when all of the following have occurred: a sales agreement is in place, price is fixed or determinable, and collection is reasonably assured. Consideration given to customers such as value incentives, rebates, early payment discounts and other discounts are recorded as reductions to revenues at the time of sale. In the SunOpta BioProcess segment, the percentage of completion method is used to account for significant contracts. The amounts of revenue and profit recognized each year are based on either the ratio of hours incurred to the total expected hours or costs incurred to the total expected costs. Costs incurred on long-term contracts include labor, material, other direct costs and overheads. Losses, if any, on long-term contracts are recognized during the period they are determined. Total expected hours on a project are based on our estimates during the progression of a project, including meeting specific criteria under the contract, testing during certain phases, and ensuring overall functionality. We update the total expected hours to be incurred as new information becomes known. Significant differences between actual and the estimated hours to complete a project could result in changes in the amount of revenues recorded and their related costs being realized, which could also impact gross margins in a particular period.
Accounts receivable
Our accounts receivable primarily includes amounts due from our customers. The carrying value of each account is carefully monitored with a view to assessing the likelihood of collection. An allowance for doubtful accounts is provided for as an estimate of losses that could result from customers defaulting on their obligation to us. In assessing the amount of reserve required, a number of factors are considered including the age of the account, the credit worthiness of the customer, payment terms, the customer’s historical payment history and general economic conditions. Because the amount of the reserve is an estimate, the actual amount collected could differ from the carrying value of the amount receivable. Note 3 of the 2009 Consolidated Financial Statements provides an analysis of the changes in the allowance for doubtful accounts.
Inventory
Inventory is our largest current asset. Our inventory consists primarily of raw materials and finished goods held for sale. Inventories are valued at the lower of cost, valued on a weighted average cost basis, or estimated net realizable value except certain grain inventories that are carried at market value. Depending on market conditions, the actual amount received on sale could differ from our estimated value of inventory when provisions to record inventory at market are necessary. In order to determine the value of inventory at the balance sheet date, we evaluate a number of factors to determine the adequacy of provisions for inventory. The factors include the age of inventory, the amount of inventory held by type, future demand for products and the expected future selling price we expect to realize by selling the inventory. Our estimates are judgmental in nature and are made at a point in time, using available information, expected business plans and expected market conditions. We perform a review of our inventory by reporting unit and product line on a quarterly basis. Note 4 of the 2009 Consolidated Financial Statements provides an analysis of the movements in inventory reserve.
| SunOpta Inc. | 51 | December 31, 2009 – 10-K |
Prepaid and other current assets
Prepaid and other current assets include amounts paid in cash and recorded as a current asset prior to consumption. The balance also includes advances to growers required to secure future delivery of product (net of provisions). An allowance against realizing these advances is recorded when it is determined that we will not recover the advances, due to default on scheduled repayment terms, or general economic or market conditions. Advances to growers are typically made at the start of the growing season. We monitor our advances to growers by monitoring adherence to agreed upon terms as well as evaluating general economic and market conditions, and assessing the status of the crops being grown in order to determine if the collection of the advance is at risk.
Our judgment is required to assess whether allowances against growers advances are necessary including assessing the relationships with the growers and expected crop. At the end of the growing season, we re-evaluate any existing advances and provide fully for any advances relating to the previous season. Due to assumptions relating to the quality of the grower and expected crop additional provisions may be necessary compared to initial estimates.
Impairment testing of goodwill
With the implementation of Financial Accounting Standards Board (“FASB”) Accounting Standards Codification (“ASC”) topic 350-20 (formerly Statement of Financial Accounting Standard No. 142, “Goodwill and Other Intangible Assets”), goodwill and intangible assets with an indefinite life are no longer amortized, but instead are tested at least annually for impairment. Any impairment loss is recognized in income.
In accordance with ASC 350-20, we evaluate goodwill for impairment on a reporting unit basis. Reporting units are operating segments or components of operating segments for which discrete financial information is available. To evaluate goodwill, the fair value of each reporting unit is compared to its carrying value. Where the carrying value is greater than the fair value, the implied fair value of the reporting unit goodwill is determined by allocating the fair value of the reporting unit to all the assets and liabilities of the reporting unit with any remainder being allocated to goodwill. The implied fair value of the reporting unit goodwill is then compared to the carrying value of that goodwill to determine whether an impairment loss exists.
We measure the fair value of reporting units using discounted cash flows. Because the business is assumed to continue in perpetuity, the discounted future cash flow includes a terminal value. The first year or base year in the calculation of the discounted cash flow model is based on actual results in each component, adjusted for unusual and non-recurring items. Future years’ cash flows to perpetuity are forecasted based on projected revenue growth, and our planned business strategies in future periods that would impact actual cash flows reported in the base year. Examples of planned strategies would include a plant or line expansion at an existing facility, a reduction of working capital at a specific location, and price increases or cost reductions within business units. The revenue growth and planned business strategies for future periods incorporated into the discounted cash flow model reflect our long-term view of the market. The discount rate is based on a segment’s targeted weighted average cost of capital, which is not necessarily the same as our weighted average cost of capital. These assumptions are subject to change and are also impacted by our ability to achieve our forecasts and by economic conditions which may impact future results and result in projections not being attained. Each year we re-evaluate the assumptions used to reflect changes in the business environment. During the third quarter of 2009, for Opta Minerals, we determined that there were external market conditions and other circumstances that suggested the carrying value of certain reporting units at Opta Minerals may exceed their fair values. These external market conditions and other circumstances included continued operating losses and extended periods of facility under-utilization due to continued weakness in the steel, foundry and abrasives markets. Based on the goodwill impairment test, we determined that the carrying value of goodwill at certain reporting units in Opta Minerals exceeded its fair value and, as a result, we recorded an impairment charge of $8,341 to the consolidated statements of operations. As part of the annual impairment test in the fourth quarter, we determined that the $500 increase in goodwill as a result of contingent consideration in the Fruit Group resulted in the carrying value of the group exceeding its fair value. As a result, we recorded a $500 charge to the consolidated statement of operations. For the year ended December 31, 2008, we determined that the carrying value of goodwill in the Fruit Group and part of the International Sourcing and Trading Group exceeded its fair value and, as a result, we recorded an impairment charge of $10,154. Note 6 of the 2009 Consolidated Financial Statements provides a summary of the critical assumptions used in the 2009 annual impairment test.
| SunOpta Inc. | 52 | December 31, 2009 – 10-K |
Purchase price allocation
Business acquisitions are accounted for by the purchase method of accounting. Under this method, the purchase price is allocated to the assets acquired and the liabilities assumed based on the fair value at the time of the acquisition. Any excess purchase price over the fair value of identifiable assets and liabilities acquired is recorded as goodwill. The assumptions and estimates with respect to determining the fair value of intangible assets acquired generally requires the most judgment, and include estimates of future profitability, and/or customer and supplier based attrition, income tax rates and discount rates. Changes in any of the assumptions or estimates used in determining the fair value of the acquired assets and liabilities could impact the amounts assigned to assets, liabilities and goodwill in the purchase price allocation. Future net earnings can be affected as a result of changes in these estimates resulting in an asset or goodwill impairment. Further, amortization periods are subjective based on expected useful lives and chosen rates. Note 2 of the consolidated financial statements provide information with respect to businesses acquired and Note 6 outlines annual amortization expense relating to these intangibles.
Accrued expenses and other assets
We make estimates of future payments and receipts which relate to current and future accounting periods. These estimates cover items such as accrued but unpaid wages and bonuses, estimates of taxes and estimates of amounts payable or receivable under legal suits. In establishing appropriate accruals and receivable balances, we must make judgments regarding the amount of the disbursement or receipts that will ultimately be incurred or received. In making such assessments, we use historical experience as well as any other special circumstances surrounding a particular item. The actual amount paid or received could differ from our estimates.
Income taxes
We are liable for income taxes in the United States, Canada, and other jurisdictions where we operate. Our effective tax rate differs from the statutory tax rate and will vary from year to year primarily as a result of numerous permanent differences, investment and other tax credits, the provision for income taxes at different rates in foreign and other provincial jurisdictions, enacted statutory tax rate increases or reductions in the year, the benefit of cross-jurisdictional financing structures, changes due to foreign exchange, changes in valuation allowance based on our recoverability assessments of deferred tax assets, and favourable or unfavourable resolution of various tax examinations.
In making an estimate of our income tax liability, we first assess which items of income and expense are taxable in a particular jurisdiction. This process involves a determination of the amount of taxes currently payable as well as the assessment of the effect of temporary timing differences resulting from different treatment of items for accounting and tax purposes. These differences in the timing of the recognition of income or the deductibility of expenses result in deferred income tax balances that are recorded as assets or liabilities as the case may be on our balance sheet. We also estimate the amount of valuations allowance to maintain relating to loss carry forwards and other balances that can be used to reduce future taxes payable. This judgment is based on forecasted results in the jurisdiction and certain tax planning strategies and as a result actual results may differ from forecasts. We assess the likelihood of the ultimate realization of these tax assets by looking at the relative size of the tax assets in relation to the profitability of the businesses and the jurisdiction to which they can be applied to, the number of years based on management’s estimate it will take to use the tax assets and any other special circumstances. If different judgments had been used, our income tax liability could have been different from the amount recorded. In addition, the taxing authorities of those jurisdictions upon audit may not agree with our assessment. Note 13 of the consolidated financial statements provides an analysis of the changes in the valuation allowance and the components of our deferred tax assets.
| SunOpta Inc. | 53 | December 31, 2009 – 10-K |
In June 2006, the FASB issued Accounting Standards Codification (“ASC”) Topic 740 (formerly Interpretation No. 48, “Accounting for Uncertainty in Income Taxes – An Interpretation of FASB Statement No. 109”). ASC 740 clarifies the accounting for uncertainty in income taxes recognized in an enterprise’s financial statements and prescribes a recognition threshold and measurement attribute for the financial statement recognition and measurement of a tax position taken or expected to be taken in a tax return. This Interpretation also provides guidance on derecognition, classification, interest and penalties, accounting in interim periods, disclosure and transition. While we believe we have adequately provided for all tax positions, amounts asserted by taxing authorities could differ from accrued position. Accordingly, additional provisions on federal, provincial, state and foreign tax-related matters could be recorded in the future as revised estimates are made or the underlying matters are settled or otherwise resolved.
Stock compensation
We maintain a stock option plan under which incentive stock options may be granted to employees and non-employee directors. Effective January 1, 2006, ASC 718 (formerly SFAS No. 123(R) “Share-Based Payments”) requires that we record stock based compensation expenses within the consolidated statements of operations and comprehensive earnings (loss).
At each grant date, we are required to estimate a number of inputs, such as the estimated life of the option and the forfeiture rate used in the Black-Scholes model to determine a fair value for the options granted to employees or non-employee directors. Once determined at the grant date, fair value of the stock award is recorded over the vesting period of the options granted. Refer to Note 11 of the 2009 consolidated financial statements for disclosure of the inputs used to determine the fair value of stock based compensation granted in 2009, 2008 and 2007.
| SunOpta Inc. | 54 | December 31, 2009 – 10-K |
Results of Operations
2009 Operations Compared With 2008 Operations Expressed in thousands of U.S dollars, except per share amount
| Dec 31, 2009 | Dec 31, 2008 | Change | Change | |||||||||
| Consolidated | $ | $ | $ | % | ||||||||
| Revenue | ||||||||||||
| SunOpta Foods | 926,090 | 960,316 | (34,226 | ) | (3.6% | ) | ||||||
| Opta Minerals | 62,523 | 93,422 | (30,899 | ) | (33.1% | ) | ||||||
| SunOpta BioProcess | 519 | 1,435 | (916 | ) | (63.8% | ) | ||||||
| Total Revenue | 989,132 | 1,055,173 | (66,041 | ) | (6.3% | ) | ||||||
| Gross Margin | ||||||||||||
| SunOpta Foods | 135,566 | 138,172 | (2,606 | ) | (1.9% | ) | ||||||
| Opta Minerals | 13,081 | 18,476 | (5,395 | ) | (29.2% | ) | ||||||
| SunOpta BioProcess | 223 | (553 | ) | 776 | 140.3% | |||||||
| Total Gross Margin | 148,870 | 156,095 | (7,225 | ) | (4.6% | ) | ||||||
| Operating Income | ||||||||||||
| SunOpta Foods | 20,882 | 22,833 | (1,951 | ) | (8.5% | ) | ||||||
| Opta Minerals | 1,161 | 5,531 | (4,370 | ) | (79.0% | ) | ||||||
| SunOpta BioProcess | (3,287 | ) | (3,286 | ) | (1 | ) | 0% | |||||
| Corporate Services | (4,852 | ) | (8,875 | ) | 4,023 | 45.3% | ||||||
| Total Operating Income | 13,904 | 16,203 | (2,299 | ) | (14.2% | ) | ||||||
| Other Expense, net | 2,587 | 1,003 | 1,584 | 157.9% | ||||||||
| Goodwill Impairment | 8,841 | 10,154 | (1,313 | ) | (12.9% | ) | ||||||
| Interest Expense | 14,028 | 14,281 | (253 | ) | (1.8% | ) | ||||||
| Income Tax Provision | (1,762 | ) | 790 | (2,552 | ) | (323.0% | ) | |||||
| Non-Controlling Interest | (3,027 | ) | 911 | (3,938 | ) | (432.3% | ) | |||||
| Net loss | (6,763 | ) | (10,936 | ) | 4,173 | 38.2% |
(Operating Income is defined as “Loss before the following” excluding the impact of “Other expenses, net” and “Goodwill impairment”)
Revenues for the year decreased by 6.3% to $989,132 based on consolidated internal revenue decline of 9.4%. Internal revenue decline includes growth or declines on the base business plus growth or declines on acquisitions from the date of acquisition over the previous year in addition to the impact of foreign exchange movements and its effects on translations to U.S dollars and the effect of changes in commodity costs. Excluding unfavourable movements in foreign exchange, internal revenue decline was 7.1% in 2009. Revenues in SunOpta Foods decreased by $34,226 due in part to the impact of a weakened Euro and Canadian dollar on the revenues of the International Sourcing and Trading and the Distribution Group.
Gross margins decreased $7,225, or 4.6%, in 2009 to $148,870 from $156,095 in 2008. As a percentage of revenues, the consolidated gross margin rate increased 0.3% to 15.1% compared to 14.8% in 2008. Gross margin declined $2,606 in SunOpta Foods driven primarily by the Distribution Group wherein a decline in the value of the Canadian dollar, the phasing out and re-launch of branded natural health products, and higher inventory spoilage costs negatively impacted margins in the current year. The International Sourcing and Trading Group had lower gross margins over prior year due to lower demand. These decreases were offset by improved gross margins in all other SunOpta Foods operating groups. Also contributing to the lower gross margin was a dramatic volume decline in the steel and foundry markets which impacted Opta Minerals in 2009.
| SunOpta Inc. | 55 | December 31, 2009 – 10-K |
Warehouse and distribution (“W&D”) costs for 2009 were 18,856, a decrease of $2,184 compared to the same period in 2008. The decrease is mainly attributed to the impact of a weaker Canadian dollar on the translation of the Distribution Group's costs into U.S. currency in addition to reduced variable costs on lower sales volume. These costs are solely related to the Distribution Group as warehousing and distribution costs for other groups are considered part of cost of goods sold. W&D costs as a percentage of Distribution Group revenues remained comparable at 7.9% in 2009 versus 8.1% in 2008. For further details see the Distribution Group analysis included within.
Selling, general and administrative (“SG&A”) expenses including intangible asset amortization decreased $6,535 to $117,152 for the year ended December 31, 2009 compared to 2008. The weaker Euro and Canadian dollar in 2009 led to a $3,951 decrease in SG&A on Canadian and Euro borne expenses compared to 2008. Costs related to the internal investigation, class action lawsuits and other legal matters were $5,920 lower in 2009 compared to 2008. These decreases were offset by the acquisitions of The Organic Corporation and MCP Mg-Serbien as incremental SG&A from these companies increased SG&A by $2,682 in 2009. Severance costs associated with headcount reductions and closing costs related to the rationalization of various plants increased SG&A by $2,140. Marketing, listing fees and other costs associated with the re-launch of certain branded natural health products increased SG&A by $2,551. The remaining SG&A decrease of $4,037 is due to overall cost saving initiatives. SG&A as a percentage of sales was 11.3% in 2009 which is comparable to 11.2% in 2008.
A foreign exchange gain of $1,042 was recorded in 2009, as compared to a gain of $4,835 in 2008. The decrease is mainly due to less favourable movements in the Canadian dollar and Euro compared to the U.S. dollar. In 2008, we entered into a number of Canadian and Euro forward contracts that were closed prior to reaching their maturity. Due to the volatility in these exchange rates in 2008, gains were realized.
Operating income decreased by $2,299, or 14.2% to $13,904 compared to the year ended 2008 due to the factors noted above. Further details on revenue, gross margins and operating income are provided by operating group in the sections that follow.
During 2009, Opta Minerals determined that the carrying value of certain goodwill in its mill and foundry and abrasive products reporting units exceeded its fair value. As a result, a non-cash impairment charge of $8,341 was recorded. During the fourth quarter of 2009, an additional impairment charge of $500 was recorded as a result of contingent consideration being earned by a division within the Fruit Group that also could not support its carrying value.
Other expenses were $2,587 in 2009 compared to $1,003 in 2008. The increase in 2009 is due primarily to facility rationalization charges and the settlement of a labour related class action lawsuit, slightly offset by the elimination of certain long-term payables at Opta Minerals.
Interest expense was $14,028 in 2009 compared to $14,281 in 2008, a decrease of $253 or 1.8%. The decrease reflects lower LIBOR rates and lower borrowing levels in 2009 versus 2008, offset by higher costs related to waiver and amendment fees relating to our credit facilities that we negotiated with our lenders in 2009.
Income tax recovery for 2009 was $1,762 compared to a provision for income tax of $790 in 2008. The increase in the recovery reflects a higher loss before tax and a decrease in the amount of allowance recorded against the value of deferred income taxes.
Losses attributable to non-controlling interest for 2009 were $3,027 compared to income attribution of $911 in 2008, mainly due to losses generated by Opta Minerals in 2009 primarily due to the goodwill impairment. We owned approximately 66.4% of Opta Minerals as of December 31, 2009.
Net loss for the year ended December 31, 2009 was $6,763 as compared to a net loss of $10,936 in 2008, a decrease in losses of $4,173. Basic and diluted loss per share was $0.10 for the year ended December 31, 2009 compared to a loss per share of $0.17 for the same period in 2008.
| SunOpta Inc. | 56 | December 31, 2009 – 10-K |
Adjusted Earnings
Adjusted net earnings(1) for 2009 were $0.20 per diluted common share, compared to adjusted earnings(1) for 2008 of $0.17 per diluted common share.
During 2009, we incurred costs related to legal matters (securities class action lawsuits, the arbitration process at SunOpta BioProcess and other legal matters), non-cash goodwill charges, severance, closure and inventory rationalization costs, and costs to re-launch three branded products in our natural health products division. Although legal related costs continued in 2009, once these matters are finalized they are not expected to re-occur. As these costs negatively impact earnings and are not related to our normal operations, we feel it is appropriate to add back these specific items to arrive at adjusted net earnings(1) for the year ended December 31, 2009. The table below reconciles the loss of $0.10 per diluted common share as reported in our 2009 financial statements to adjusted earnings(1) of $0.20:
| Loss per diluted share for the year ended December 31, 2009 | ($0.10 | ) | ||
| Adjusted for: | ||||
| Non-cash goodwill and other impairment charges | 0.11 | |||
| Brand re-launch and other start-up costs | 0.06 | |||
| Professional fees related to the class action, internal investigation, and other legal matters | 0.05 | |||
| Severance, closure and inventory rationalization costs | 0.05 | |||
| Non-cash income tax valuation allowance | 0.01 | |||
| Interest costs to obtain waiver to credit facilities | 0.02 | |||
| Adjusted net earnings per diluted common share (1) | 0.20 |
During the year-ended December 31, 2008, we incurred professional fees related to the securities class action lawsuits and OSC and SEC investigations, as well as non-cash goodwill impairment charges and a non-cash valuation allowance. In addition, the arbitration decision in SunOpta BioProcess was announced, which negatively impacted earnings. As these allowances and charges are not expected to be recurring, we feel it is appropriate to add back these specific items to arrive at adjusted net earnings(1) for the year ended December 31, 2008. The table below reconciles the loss of $0.17 per diluted common share as reported in our 2008 financial statements to adjusted earnings(1) of $0.17:
| Loss per diluted share for the year ended December 31, 2008 | ($0.17 | ) | ||
| Adjusted for: | ||||
| Professional fees, severance and related costs incurred in relation to the internal investigation | 0.10 | |||
| Non-cash goodwill impairment charges | 0.16 | |||
| Non-cash income tax valuation allowance | 0.05 | |||
| Arbitration decision in SunOpta BioProcess | 0.03 | |||
| Adjusted net earnings per diluted common share (1) | 0.17 |
(1) Adjusted net earnings per diluted common share is a non-GAAP measure. We believe adjusted net earnings (adjusted for the impact of non-cash goodwill and other impairment charges, brand re-launch and other start-up costs, professional fees incurred in relation to the securities class actions and internal investigation, severance, closure and other rationalization costs, income tax valuation allowance, interest costs to obtain waiver to credit facilities, business interruption proceeds received, the arbitration decision in SunOpta BioProcess and costs incurred to settle certain legal matters) provides useful information to understand the underlying performance of the business and as a result these items have been adjusted.
| SunOpta Inc. | 57 | December 31, 2009 – 10-K |
Segmented Operations Information
| SunOpta Foods | Dec 31, 2009 | Dec 31, 2008 | Change | % Change | ||||||||
| Revenue | ||||||||||||
| Grains and Foods Group | 325,038 | 327,307 | (2,269 | ) | (0.7% | ) | ||||||
| Ingredients Group | 64,657 | 65,270 | (613 | ) | (0.9% | ) | ||||||
| Fruit Group | 147,443 | 150,879 | (3,436 | ) | (2.3% | ) | ||||||
| International Sourcing and Trading Group | 151,698 | 157,814 | (6,116 | ) | (3.9% | ) | ||||||
| Distribution Group | 237,254 | 259,046 | (21,792 | ) | (8.4% | ) | ||||||
| SunOpta Foods Revenue | 926,090 | 960,316 | (34,226 | ) | (3.6% | ) | ||||||
| Gross Margin | ||||||||||||
| Grains and Foods Group | 36,297 | 34,309 | 1,988 | 5.8% | ||||||||
| Ingredients Group | 16,196 | 10,545 | 5,651 | 53.6% | ||||||||
| Fruit Group | 12,046 | 7,349 | 4,697 | 63.9% | ||||||||
| International Sourcing and Trading Group | 15,045 | 17,021 | (1,976 | ) | (11.6% | ) | ||||||
| Distribution Group | 55,982 | 68,948 | (12,966 | ) | (18.8% | ) | ||||||
| SunOpta Foods Gross Margin | 135,566 | 138,172 | (2,606 | ) | (1.9% | ) | ||||||
| SunOpta Foods Gross Margin % | 14.6% | 14.4% | 0.2% | |||||||||
| Operating Income | ||||||||||||
| Grains and Foods Group | 18,044 | 18,541 | (497 | ) | (2.7% | ) | ||||||
| Ingredients Group | 8,691 | 3,392 | 5,299 | 156.2% | ||||||||
| Fruit Group | (4,073 | ) | (10,219 | ) | 6,146 | 60.1% | ||||||
| International Sourcing and Trading Group | (1,153 | ) | 1,333 | (2,486 | ) | (186.5% | ) | |||||
| Distribution Group | (627 | ) | 9,786 | (10,413 | ) | (106.4% | ) | |||||
| SunOpta Foods Operating Income | 20,882 | 22,833 | (1,951 | ) | (8.5% | ) | ||||||
| SunOpta Foods Margin % | 2.3% | 2.4% |
(0.1% |
) |
(Operating Income is defined as “Earnings before the following” excluding the impact of “Other expenses, net” and “Goodwill impairment”. Operating income % is calculated as operating income divided by revenues.)
SunOpta Foods contributed $926,090 or 93.6% of consolidated revenue in 2009, compared to $960,316, or 91.0%, of consolidated revenues in 2008. This $34,226 decrease in revenue was based on incremental acquisition revenues net of an internal revenue decline of 6.7%. Internal revenue decline includes unfavourable movements related to foreign exchange and certain commodity prices. Excluding the impact of foreign exchange and commodity price declines, revenues for the year ended December 31, 2009 decreased 4.3% when compared to the same period in 2008.
The acquisition of The Organic Corporation, offset by the impact of a declining Euro and lower sales of industrial products in the base business decreased revenues by $6,116 within the International Sourcing and Trading Group. Lower volume due to soybean, corn and organic feed, offset by higher soymilk and inshell sunflower volumes, lowered overall sales in the Grains and Foods Group by $2,269 compared to the year ended 2008. The Distribution Group had lower revenues over prior year of $21,792 due primarily to the weakening of the Canadian dollar versus the U.S. dollar and reduced demand in the Canadian market during 2009. Lower volumes of dairy blends and co-manufactured products in the Ingredients Group led to a decrease in revenues of $613 as compared to 2008. Lower volumes of fruit purees and organic private label frozen fruit volume within the Fruit Group decreased Food Group revenues by $3,436, largely due to unfavourable market conditions.
| SunOpta Inc. | 58 | December 31, 2009 – 10-K |
Gross profit in SunOpta Foods decreased $2,606 for the year ended December 31, 2009 to $135,566, or 14.6% of revenues, compared to $138,172, or 14.4% of revenues in the comparable period in 2008. The ongoing turnaround in the Fruit Group margins contributed $4,697 in incremental gross profit. Lower raw material, chemical, and utility costs combined with process improvements in fiber manufacturing in the Ingredients Group improved margins by $5,651. The remaining margin increase of $1,988 is due to increased soymilk margins due to higher volumes offset by pre-opening costs of the Modesto, CA facility and lower margins in the vegetable oil and kernel market in the Grains and Foods Group. These variances were offset by decreased margins of $12,966 in the Distribution Group due to the impact of a weaker Canadian dollar, costs related to the re-launch of certain branded health products as well as lower branded health products volumes and increased spoilage of certain grocery products. Margins in the International Sourcing and Trading Group decreased $1,976 due to the impact of the weaker Euro, reduced demand for industrial ingredients in addition to higher product costs not passed onto customers.
The gross profit rate increased 0.2% for 2009 to 14.6% of revenues compared to 14.4% of revenues in 2008. Unfavourably impacting the margin rate was the full year impact of The Organic Corporation which has a lower inherent margin rate in addition to higher sourcing costs within the International Sourcing and Trading Group, that were not passed to customers. In addition, costs related to the re-launch of certain branded health products and inventory spoilage within the Distribution Group had a decrease in gross margin rate of 3.0%, to 23.6% in 2009 from 26.6% in 2008. These decreases were partially offset by the continued turnaround within the Fruit Group which recorded a gross margin rate of 8.2% in 2009 compared to a gross margin rate of 4.9% in the same period in 2008. The Ingredients Group also had a significant increase in gross margin rate over the same period last year realizing 25.0% in 2009 versus 16.2% in 2008. The Grains and Foods Group also realized an increase in gross margin rate to 11.2% in 2009 versus 10.5% in the prior year due in part to higher volumes of soymilk and alternative beverages and improved processing efficiencies.
Segment operating income in SunOpta Foods decreased by 8.5% to $20,882 for the year ended 2009, from $22,833 in the comparable period in 2008. The net unfavourable impact of a weakened Canadian dollar, operational inefficiencies and increased marketing costs to support branded products in the Distribution Group decreased operating income by $10,413. The International Sourcing and Trading Group realized $2,486 in lower operating income compared to the year ended December 31, 2008 mainly due to volume declines and higher input costs for organic products that were not passed to the customer. These operating losses were offset by the continued turnaround in the Fruit Group which improved operating income by $6,146 due primarily to margin improvement over prior year. The Ingredients Group reported an improvement of $5,299 in operating income primarily as a result of lower input costs and improved operating efficiencies. The remaining unfavourable operating income variance of $497 was driven by the Grains and Foods Group as a result of increased corporate allocations and higher compensation costs.
| Grains and Foods Group | Dec 31, 2009 | Dec 31, 2008 | Change | % Change | ||||||||
| Revenue | 325,038 | 327,307 | (2,269 | ) | (0.7% | ) | ||||||
| Gross Margin | 36,297 | 34,309 | 1,988 | 5.8% | ||||||||
| Gross Margin % | 11.2% | 10.5% | 0.7% | |||||||||
| Operating Income | 18,044 | 18,541 | (497 | ) | (2.7% | ) | ||||||
| Operating Income % | 5.6% | 5.7% | (0.1% | ) |
(Operating Income is defined as “Earnings before the following” excluding the impact of “Other expenses, net” and “Goodwill impairment”. Operating income % is calculated as operating income divided by revenues.)
| SunOpta Inc. | 59 | December 31, 2009 – 10-K |
The Grains and Foods Group contributed $325,038 in revenues in 2009 compared to $327,307 in 2008, a $2,269 or 0.7% decrease. The table below explains the decrease in revenue:
| Grains and Foods Group Revenue Changes | $ |
| Revenue for the year ended December 31, 2008 | 327,307 |
| Decline
in volume and price of commodity soy and corn, as well as lower volumes
of organic grains and grain based food ingredients |
(28,676) |
| Higher
soymilk and alternate beverage sales due to continued growth in
volumes from existing customer contracts, a large food service contract which began shipping in late 2008 and a half year of operations at the Modesto, CA facility which opened late in the second quarter of 2009 |
14,455 |
| Increased
sunflower product sales as a result of higher in-shell demand,
particularly
in Europe, offset by lower volumes of bakery kernel and bi-products due to oversupply in these markets |
11,084 |
| Higher volumes of roasted grain and other products due primarily to new customers | 868 |
| Revenue for the year ended December 31, 2009 | 325,038 |
Gross margin in the Grains and Foods Group increased by $1,988 to $36,297 in 2009 compared to $34,309 in 2008, and the gross margin percentage increased 0.7% to 11.2% over the same period. The increase in gross margin as a percentage of revenue is primarily due to a favourable shift in sales mix as soymilk and alternate beverage sales have higher inherent margins than our grains based sales. The table below explains the increase in gross margin:
| Grains and Foods Group Gross Margin Changes | $ |
| Gross Margin for the year ended December 31, 2008 | 34,309 |
| Increase due to higher volumes of soy milk and alternate beverages | 6,490 |
| Recovery
of an insurance settlement from a business interruption claim relating to
a
fire that occurred in 2008 |
577 |
| Higher sales volumes and improved plant efficiencies in our roasted grains operation | 553 |
| Decline
in sunflower product margins due primarily to pricing pressure brought on
by
a market over supply of bakery kernel and bird food products, volume declines in high oleic kernel, offset by increased volumes and prices of in-shell products as well as improved plant efficiencies |
(1,945) |
| Decline
in organic feed and grain based food ingredients volumes and prices due
to increased international competition, offset by improved margins on soybean and corn products as a result of favourable pricing and ownership positions |
(1,926) |
| Preopening
costs associated with the Modesto plant and Colorado Mills vegetable
oil refinery start-up |
(1,761) |
| Gross Margin for the year ended December 31, 2009 | 36,297 |
| SunOpta Inc. | 60 | December 31, 2009 – 10-K |
Operating income in the Grains and Foods Group decreased by $497 or 2.7% to $18,044 in 2009, compared to $18,541 in 2008. The table below explains the decrease in operating income:
| Grains and Foods Group Operating Income Changes | $ |
| Operating Income for the year ended December 31, 2008 | 18,541 |
| Increase in gross margin, as explained above | 1,988 |
| Increase in corporate cost allocations | (1,434) |
| Increase in SG&A primarily due to higher compensation and professional fees | (727) |
| Increase in foreign exchange losses | (324) |
| Operating Income for the year ended December 31, 2009 | 18,044 |
Looking forward, our new West coast aseptic packaging facility has expanded our capacity to manufacture aseptic soy and alternate beverages. We also intend to expand our soy base sales internationally via strategic relationships for procurement of product. We also intend to focus our efforts on growing our IP soybean business, expanding revenues from organic ingredients and increasing our participation in the specialty oils markets. Our long-term expectation for this group is to achieve a segment operating margin of 6% to 8% which assumes we are able to secure consistent quantity and quality grains and sunflower stocks, improve product mix, and control costs. The statements in this paragraph are forward-looking statements. See “Forward-Looking Statements” above. Increased supply pressure in the commodity-based markets in which we operate, volume decreases or loss of customers, or our inability to secure quality inputs or achieve our product mix or cost reduction goals could adversely impact our ability to meet these forward-looking expectations.
| Ingredients Group | Dec 31, 2009 | Dec 31, 2008 | Change | % Change | ||||||||
| Revenue | 64,657 | 65,270 | (613 | ) | (0.9% | ) | ||||||
| Gross Margin | 16,196 | 10,545 | 5,651 | 53.6% | ||||||||
| Gross Margin % | 25.0% | 16.2% |
8.8% |
|||||||||
| Operating Income | 8,691 | 3,392 | 5,299 | 156.2% | ||||||||
| Operating Income % | 13.4% | 5.2% | 8.2% |
(Operating Income is defined as “Earnings before the following” excluding the impact of “Other expenses, net” and “Goodwill impairment”. Operating income % is calculated as operating income divided by revenues.)
The Ingredients Group contributed revenues of $64,657 in 2009 compared to $65,270 in 2008, a $613 or 0.9% decrease. The table below explains the decrease in revenue:
| Ingredients Group Revenue Changes | $ |
| Revenue for the year ended December 31, 2008 | 65,270 |
| Lower demand for dairy blends due to depressed commodity prices in the dairy market | (1,550) |
| Decrease
in ingredient systems due to partial sale of plant operation during the
fourth quarter of 2009, combined with lower bran volumes due to quality issues that suppressed corn volume |
(1,534) |
| Increased oat and soy fiber volumes from existing and new customers | 2,471 |
| Revenue for the year ended December 31, 2009 | 64,657 |
| SunOpta Inc. | 61 | December 31, 2009 – 10-K |
Gross margin in the Ingredients Group increased by $5,651 to $16,196 in 2009 compared to $10,545 in 2008. As a percentage of revenue, gross margins increased from 16.2% for the year ended 2008 to 25.0% in 2009. Lower raw material input costs, improved pricing, and process improvements implemented in our manufacturing plants led to the significant increase in gross margin and margin rate versus prior year. The table below explains the increase in gross margins:
| Ingredients Group Gross Margin Changes | $ |
| Gross Margin for the year ended December 31, 2008 | 10,545 |
| Reduction
in raw material, chemical and utility costs as well as process
improvements
in our fiber manufacturing plants and improved volumes |
5,387 |
| Improved dairy blend margins due to improved product mix | 264 |
| Gross Margin for the year ended December 31, 2009 | 16,196 |
Operating income in the Ingredients Group increased by $5,299 or 156.2% to $8,691 in 2009, compared to $3,392 in 2008. The table below explains the increase in operating income:
| Ingredients Group Operating Income Changes | $ |
| Operating Income for the year ended December 31, 2008 | 3,392 |
| Increase in gross margin, as explained above | 5,651 |
| Increased
reserves for bad debt and compensation, partially offset by lower
utilities, travel and other SG&A expenses as a result of various cost saving initiatives |
(235) |
| Increase in corporate cost allocations | (117) |
| Operating Income for the year ended December 31, 2009 | 8,691 |
Looking forward, we will continue to concentrate on growing the Ingredients Group’s fiber portfolio and customer base. Lower input costs combined with the benefit of process improvements and price increases implemented late in 2008 are expected to continue to provide solid margins in our various fiber, ingredient and contract manufacturing solutions. Product innovation and diversification of both soluble and insoluble fiber applications, as well as contract manufacturing where acceptable margins can be realized, continue to be areas of focus. We will also plan to turn attention to product diversification, through a combination of new product introductions, joint ventures, and distribution partnerships. Our long-term objective is to maintain the Ingredients Group’s operating income percentage to 12% to 15% of revenues on an ongoing basis through selective pricing strategies, growth of higher margin products, increased capacity utilization and cost reduction programs. The statements in this paragraph are forward-looking statements. See “Forward-Looking Statements” above. An unexpected increase in input costs or our inability to introduce new products to the market, or implement our strategies and goals relating to pricing, capacity utilization or cost reductions could adversely impact our ability to meet these forward-looking expectations.
| Fruit Group | Dec 31, 2009 | Dec 31, 2008 | Change | % Change | ||||||||
| Revenue | 147,443 | 150,879 | (3,436 | ) | (2.3% | ) | ||||||
| Gross Margin | 12,046 | 7,349 | 4,697 | 63.9% | ||||||||
| Gross Margin % | 8.2% | 4.9% | 3.3% | |||||||||
| Operating Income (Loss) | (4,073 | ) | (10,219 | ) | 6,146 | 60.1% | ||||||
| Operating Income (Loss) % | (2.8% | ) | (6.8% | ) | 4.0% |
(Operating Income is defined as “Earnings before the following” excluding the impact of “Other expenses, net” and “Goodwill impairment”. Operating income % is calculated as operating income divided by revenues.)
| SunOpta Inc. | 62 | December 31, 2009 – 10-K |
The Fruit Group contributed revenues of $147,443 in 2009 compared to $150,879 in 2008, a 2.3%, or $3,436 decrease. The table below explains the decrease in revenue:
| Fruit Group Revenue Changes | $ |
| Revenue for the year ended December 31, 2008 | 150,879 |
| Decreased
revenues in the Frozen Fruit operation, mainly due to lower
volumes of industrial purees, as well as lower retail sales attributed to changing customer buying patterns |
(20,983) |
| Revenue
decline in the Healthy Fruit Snacks operation due to the loss of
certain private label customers and co-manufacturing sales, offset by volume increases from the divisions of larger retail customers |
(397) |
| New
customers and product offerings, as well as price increases in the Fruit
Base operations |
13,617 |
| Increased
revenue in the brokerage operations as certain revenues were reported on
a net basis rather than gross basis during the first two quarters of 2008 |
4,327 |
| Segment Revenue for the year ended December 31, 2009 | 147,443 |
Gross margins in the Fruit Group increased by $4,697 in 2009 to $12,046, or 8.2% of revenue, compared to a gross margin of 4.9% of revenue in 2008. The overall 3.3% improvement in margin rate in 2009 is due to improved plant efficiencies in our healthy fruit snacks division as well as our fruit base and frozen fruit operations which offset costs incurred to liquidate inventory and rationalize frozen food product offerings. The table below explains the increase in gross margins:
| Fruit Group Gross Margin Changes | $ |
| Gross Margin for the year ended December 31, 2008 | 7,349 |
| Improved
margins in the fruit base operations as a result of improved pricing and
higher volumes which contributed to manufacturing efficiencies, offset by higher freight and storage costs as a result of the volume increases |
4,097 |
| Higher
margins in the healthy fruit snacks division due primarily to
process improvements and efficiencies realized with the fruit bar line at the Omak, Washington facility |
4,026 |
| Margin
improvement in our frozen fruit operation due to plant efficiencies as a
result
of better production planning and, lower storage costs from lower inventory levels offset by decreased volumes, net of lower variable brokerage expenses |
171 |
| Costs
incurred in 2009 to liquidate inventories and rationalize product
offerings in
the frozen fruit operation |
(3,238) |
| Lower
volumes in the brokerage operations and increased reserves for inventory
on disputed product |
(359) |
| Gross Margin for the year ended December 31, 2009 | 12,046 |
| SunOpta Inc. | 63 | December 31, 2009 – 10-K |
Operating income in the Fruit Group increased by $6,146 to a loss of $4,073 in 2009 compared to a loss of $10,219 in the same period of 2008. The table below explains the improvement in operating income:
| Fruit Group Operating Income Changes | $ |
| Operating Income for the year ended December 31, 2008 | (10,219) |
| Increase in gross margin, as explained above | 4,697 |
| Reduced
SG&A as a result of the closure of an administrative office in the
first quarter
of 2009 |
1,080 |
| Reduced
compensation, marketing, travel expenses and office costs as a result of
various cost saving initiatives |
835 |
| Decrease in corporate cost allocation | 135 |
| Severance
and related costs associated with the rationalization of two facilities in
the
first quarter of 2009 |
(545) |
| Increase in foreign exchange losses | (56) |
| Operating Income for the year ended December 31, 2009 | (4,073) |
Looking forward, we remain cautious about market conditions for 2010. Our frozen foods operation has made substantial headway into rationalizing its operations and positioning itself for future growth as a result of a streamlined product portfolio creating a more favourable sales mix and improved plant efficiencies. Our healthy fruit snacks division and fruit base operations remain customer focused and continue to explore ways to bring new value added product offerings to market, as well as to continue to improve plant efficiencies. Long term we expect 6% to 8% operating margins from the Fruit Group. The statements in this paragraph are forward-looking statements. See “Forward-Looking Statements” above. Unexpected declines in volumes, shifts in consumer preferences, inefficiencies in our manufacturing processes, or our inability to successfully implement the particular goals and strategies indicated above could have an adverse impact on these forward-looking statements.
| International Sourcing and Trading Group | Dec 31, 2009 | Dec 31, 2008 | Change | % Change | ||||||||
| Revenue | 151,698 | 157,814 | (6,116 | ) | (3.9% | ) | ||||||
| Gross Margin | 15,045 | 17,021 | (1,976 | ) | (11.6% | ) | ||||||
| Gross Margin % | 9.9% | 10.8% | (0.9% | ) | ||||||||
| Operating Income (Loss) | (1,153 | ) | 1,333 | (2,486 | ) | (186.5% | ) | |||||
| Operating Income (Loss) % | (0.8% | ) | 0.8% | (1.6% | ) |
(Operating Income is defined as “Earnings before the following” excluding the impact of “Other expenses, net” and “Goodwill impairment”. Operating income % is calculated as operating income divided by revenues.)
| SunOpta Inc. | 64 | December 31, 2009 – 10-K |
The International Sourcing and Trading Group contributed revenues of $151,698 in 2009 compared to $157,814 in 2008, or a decrease of $6,116, or 3.9%. The table below explains the decrease in revenue:
| International Sourcing and Trading Group Revenue Changes | $ |
| Revenue for the year ended December 31, 2008 | 157,814 |
| Lower
volumes of organic cocoa, fruit, nuts and conventional seeds at The
Organic Corporation due primarily to reduced demand stemming from the global economic downturn that started in the latter half of 2008, offset by some price increases occurring in the second half of 2009 |
(27,774) |
| Decreased
volume of industrial and consumer products at SunOpta Global
Organic Ingredients (“SGOI”) such as apple, cranberry, acai, pear, orange, strawberry and raspberry; largely driven by a weakened economy and fluctuating commodity prices |
(6,018) |
| Unfavourable impact on translation due to the weakened Euro relative to the U.S. dollar | (2,139) |
| Revenue increase due to the acquisition of The Organic Corporation on April 2, 2008 | 25,452 |
| Increased
shipments of private label product due mainly to a large retail organic
orange juice contract that began in the first quarter of 2009 |
4,363 |
| Revenue for the year ended December 31, 2009 | 151,698 |
Gross margins in the International Sourcing and Trading Group decreased by $1,976 or 11.6% to $15,045 in 2009, compared to $17,021 in 2008. Margin rates decreased by 0.9% from 10.8% in 2008 to 9.9% in 2009. The decrease in margin rate is mainly due to pricing pressure brought on by the weakened economy as well as a greater proportion of International Sourcing and Trading volume coming from The Organic Corporation which generally realizes lower margins than SGOI as it more closely resembles a traditional trading operation, compared to the value added private label co-pack operations of SGOI. The table below explains the decrease in gross margin:
| International Sourcing and Trading Group Gross Margin Changes | $ |
| Gross Margin for the year ended December 31, 2008 | 17,021 |
| Decline
in volume and price of industrial products due to the weakened economy and
an increased focus rationalizing older inventory at reduced margins to lower inventory levels at SGOI |
(1,989) |
| Increased
raw material, distribution and storage costs, coupled with lower pricing
in consumer products, offset by volume increases as a result of new private label programs in 2009 |
(1,010) |
| Lower
volumes and pricing pressure in the first half of 2009 in the organic
cocoa,
grains, sweeteners, nuts, dried fruit and feed ingredient markets at The Organic Corporation |
(664) |
| Impact of a weakened Euro relative to the U.S. dollar | (126) |
| Gross
margin increase due to the acquisition of The Organic Corporation on April
2, 2008 |
1,813 |
| Gross Margin for the year ended December 31, 2009 | 15,045 |
| SunOpta Inc. | 65 | December 31, 2009 – 10-K |
Operating income in the International Sourcing and Trading Group decreased by $2,486 or 186.5% to a loss of $1,153 in 2009, compared to operating income of $1,333 in 2008. The table below explains the decrease in operating income:
| International Sourcing and Trading Group Operating Income Changes | $ |
| Operating Income for the year ended December 31, 2008 | 1,333 |
| Decrease in gross margin, as explained above | (1,976) |
| SG&A increase due to the acquisition of The Organic Corporation on April 2, 2008 | (2,316) |
| Decrease in foreign exchange gains at The Organic Corporation | (431) |
| Decrease
in SG&A as a result of various cost saving initiatives implemented
throughout the group including headcount reductions and decreased travel |
753 |
| Lower
bad debt expense due to the recovery of reserved balances and
improved collection efforts |
653 |
| Decrease
in intangible asset amortization related to short term purchase and
sale commitments that were established upon acquisition of The Organic Corporation and had a one-year useful life |
496 |
| Decrease in corporate cost allocation | 220 |
| Impact of a weakened Euro relative to the U.S. dollar on SG&A expenses | 115 |
| Operating Income for the year ended December 31, 2009 | (1,153) |
Looking forward, International Sourcing and Trading is focused on continuing to leverage its sourcing and supply expertise, while at the same time managing its inventory levels and SG&A, especially given the uncertainties in the current economic climate. The Organic Corporation is expected to significantly expand the supply channel and product offerings available to International Sourcing and Trading as well as drive synergies and new product offerings within the group. SGOI is expected to expand its range of consumer product offerings leveraging the Group’s supply side capabilities. Long-term group operating margins are targeted at 4 to 5% of revenues which is expected to be achieved through a combination of sourcing, pricing and product development strategies. On an ongoing basis we will also look to forward and backward integrate where opportunities exist to expand our processing expertise and increase our value-added capabilities. The statements in this paragraph are forward-looking statements. See “Forward-Looking Statements” above. Unfavourable fluctuations in foreign exchange, reduced demand for natural and organic ingredients and delayed synergies as well as our inability to realize our particular strategic expansion goals could have an adverse impact on these forward-looking statements.
| Distribution Group | Dec 31, 2009 | Dec 31, 2008 | Change | % Change | ||||||||
| Revenue | 237,254 | 259,046 | (21,792 | ) | (8.4% | ) | ||||||
| Gross Margin | 55,982 | 68,948 | (12,966 | ) | (18.8% | ) | ||||||
| Gross Margin % | 23.6% | 26.6% | (3.0% | ) | ||||||||
| Operating Income | (627 | ) | 9,786 | (10,413 | ) | (106.4% | ) | |||||
| Operating Income % | (0.3% | ) | 3.8% | (4.1% | ) |
(Operating Income is defined as “Earnings before the following” excluding the impact of “Other expenses, net” and “Goodwill impairment”. Operating income % is calculated as operating income divided by revenues.)
| SunOpta Inc. | 66 | December 31, 2009 – 10-K |
The Distribution Group contributed revenues of $237,254 in 2009, compared to $259,046 in 2008, a decrease of $21,792, or 8.4%. The table below explains the decrease in revenue:
| Distribution Group Revenue Changes | $ |
| Revenue for the year ended December 31, 2008 | 259,046 |
| Unfavourable translation impact of a weakened Canadian dollar versus the U.S. dollar | (17,328) |
| Lower
sales in our natural health products sector due to mainly to a decline
in shipments of branded products as a result of the phase-out and subsequent re-launch of three of our brands which occurred in the second and third quarter of 2009, as well as decreased demand for two significant distributed products |
(7,207) |
| Decreased
produce sales due to the loss of a key customer and increased
competitive pressures mainly in Central Canada |
(4,232) |
| Increase
in natural and organic grocery sales as a result of new product listings
and improved pricing in Western and Eastern Canada as well as the finalization of a primary customer agreement in Central Canada |
6,975 |
| Revenue for the year ended December 31, 2009 | 237,254 |
Gross margin in the Distribution Group decreased by $12,966 or 18.8% in 2009 to $55,982, compared to $68,948 in 2008. As a percentage of revenues, gross margin was 23.6% in 2009 compared to 26.6% in 2008, a decline of 3.0%. Higher spoilage levels, more expensive U.S. sourced products in 2009 due to the depreciation of the Canadian dollar, and costs related to branded product relaunches are the primary reasons for the decline in margin rate. The table below explains the decrease in gross margin:
| Distribution Group Gross Margin Changes | $ |
| Gross Margin for the year ended December 31, 2008 | 68,948 |
| Decrease
volume in both branded and distributed natural health product lines
and increased inventory reserves associated with the decision to rationalization and reduce the number of SKU’s offered |
(6,373) |
| Unfavourable translation impact of a weakened Canadian dollar versus the U.S. dollar | (4,118) |
| Higher
inventory spoilage costs in the current year in grocery operations and
higher
costs of U.S. sourced products which have become more expensive in the current year due to the depreciation of the Canadian dollar, and were not passed along to the retailers in a timely fashion as well as lower sales volumes |
(1,828) |
| Customer
credit related to returns and de-listing of old format branded natural
health products as well as costs incurred to repackage returned product, all associated with the re-launch of three of our natural health brands |
(647) |
| Gross Margin for the year ended December 31, 2009 | 55,982 |
| SunOpta Inc. | 67 | December 31, 2009 – 10-K |
Operating income in the Distribution Group decreased $10,413 to a loss of $627 in 2009, compared to operating income of $9,786 in 2008. The table below explains the decrease in operating income:
| Distribution Group Operating Income Changes | $ |
| Operating Income for the year ended December 31, 2008 | 9,786 |
| Decrease in gross margin, as explained above | (12,966) |
| Increased
marketing and listing costs incurred as a result of the three brand
re-launches
in the natural health product sector |
(2,551) |
| Increase in SG&A expenses due to headcount and severance | (650) |
| Favourable
translation impact of a weakened Canadian dollar versus the U.S. dollar
on SG&A and W&D costs |
3,836 |
| Lower variable W&D costs as a result of overall lower sales volume as noted above | 828 |
| Increase in foreign exchange gains | 766 |
| Decrease in corporate cost allocation | 324 |
| Operating Income for the year ended December 31, 2009 | (627) |
Looking forward, the Distribution Group will continue to focus on growing its customer base and improving margins while reducing its overall fixed cost base, both domestically and internationally, the expansion of exclusive distributed product lines, reduced spoilage and working capital, and the continued rollout of enterprise distribution and warehousing software to its locations. Our brand re-launch efforts are now substantially complete, and gross margins and revenues on these branded products are expected to improve in future quarters. Long term segment operating margins are targeted at 5% of revenues which is expected to be achieved through a combination of a higher mix of branded product sales, selective pricing, SKU rationalization and efficiency strategies. The statements in this paragraph are forward-looking statements. See “Forward-Looking Statements” above. Poor customer acceptance of re-launched branded products, unfavourable movements in foreign exchange and spoilage, as well as inability to realize our strategies and goals indicated above could have an adverse impact on these forward-looking statements.
| Opta Minerals | Dec 31, 2009 | Dec 31, 2008 | Change | % Change | ||||||||
| Revenue | 62,523 | 93,422 | (30,899 | ) | (33.1% | ) | ||||||
| Gross Margin | 13,081 | 18,476 | (5,395 | ) | (29.2% | ) | ||||||
| Gross Margin % | 20.9% | 19.8% | 1.1% | |||||||||
| Operating Income | 1,161 | 5,531 | (4,370 | ) | (79.0% | ) | ||||||
| Operating Income % | 1.9% | 5.9% | (4.0% | ) |
(Operating Income is defined as “Earnings before the following” excluding the impact of “Other expenses, net” and “Goodwill impairment”. Operating income % is calculated as operating income divided by revenues.)
| SunOpta Inc. | 68 | December 31, 2009 – 10-K |
Opta Minerals contributed $62,523, or 6.3% of consolidated revenue, for 2009 compared to $93,422, or 8.9%, for 2008. The decrease in revenues of $30,899 was mainly attributable to lower volumes at steel mills primarily due to the economic downturn. The table below explains the decrease in revenue:
| Opta Minerals Revenue Changes | $ |
| Revenue for the year ended December 31, 2008 | 93,422 |
| Decrease
in revenue in mill and foundry products due to the economic downturn
which has lowered production volumes at steel mills and foundries around the world |
(31,011) |
| Decrease
in abrasive products manufacturing and distribution revenue as a result of
the impact of the economic climate in the demand for the products and services |
(1,008) |
| Increase in revenues due to the acquisition of MCP Mg-Serbien SAS on July 9, 2008 | 1,120 |
| Revenue for the year ended December 31, 2009 | 62,523 |
Gross profit decreased by $5,395 to $13,081, or 20.9% of revenues, compared to $18,476, or 19.8% of revenues, in 2008; however, the margin rate improved by 1.1%. The table below explains the decrease in gross margin:
| Opta Minerals Margin Changes | $ |
| Gross Margin for the year ended December 31, 2008 | 18,476 |
| Decrease
in gross margin due to the downturn in the steel industry and loss of
volume
as explained above |
(8,131) |
| Impact
of the 2008 reserves recorded to reduce the value of magnesium inventory
to
net realizable value |
2,736 |
| Gross Margin for the year ended December 31, 2009 | 13,081 |
Operating income in Opta Minerals decreased $4,370 to $1,161 in 2009 from $5,531 in 2008. The table below explains the decrease in operating income:
| Opta Minerals Operating Income Changes | $ |
| Operating Income for the year ended December 31, 2008 | 5,531 |
| Decrease in gross margin as explained above | (5,395) |
| Increase in SG&A due to the acquisition of MCP Mg-Serbien SAS on July 9, 2008 | (366) |
| Decrease in foreign exchange gains from Euro denominated operations | (359) |
| Decrease
in SG&A expenses related to a number of cost rationalization
programs leading to lower compensation costs and professional fees, net of associated severance costs |
1,750 |
| Operating Income for the year ended December 31, 2009 | 1,161 |
Opta Minerals continues to develop and introduce new products into the marketplace, and is focused on leveraging the global platform that has been put in place to both drive these new products and improve efficiencies. Opta Minerals continues to expand in core North American and European markets and has taken action to restructure operations to address the current economic downturn. Opta Minerals is currently expanding abrasives processing operations in Texas and Florida to better serve the Southern U.S. markets. We own 66.4% of Opta Minerals and segment operating income is presented prior to minority interest expense. The statements in this paragraph are forward-looking statements. See “Forward-Looking Statements” above. An extended softness in the steel and foundry industries could have an adverse impact on these forward-looking expectations.
| SunOpta Inc. | 69 | December 31, 2009 – 10-K |
| SunOpta BioProcess | Dec 31, 2009 | Dec 31, 2008 | Change | % Change | ||||||||
| Revenue | 519 | 1,435 | (916 | ) | (63.8% | ) | ||||||
| Gross Margin | 223 | (553 | ) | 776 | 140.3% | |||||||
| Gross Margin % | 43.0% | (38.5% | ) | 81.5% | ||||||||
| Operating Income (Loss) | (3,287 | ) | (3,286 | ) | (1 | ) | 0.0% | |||||
| Operating Income % | (633.3% | ) | (229.0% | ) | (404.3% | ) |
(Operating Income is defined as “Earnings before the following” excluding the impact of “Other expenses, net” and “Goodwill impairment”. Operating income % is calculated as operating income divided by revenues.)
SunOpta BioProcess contributed $519 in revenues for 2009 compared to $1,435 in 2008. Revenues in 2009 were primarily generated from an equipment supply contract with a customer in China to perform cellulosic ethanol services. Revenues in 2008 were derived from research and development projects and the substantial completion of a separate equipment supply contract. The table below explains the decrease in revenue:
| SunOpta BioProcess Revenue Changes | $ |
| Revenue for the year ended December 31, 2008 | 1,435 |
| Decreased
due to Xylitol and other R&D programs completed in 2008 with no
further revenues incurred in 2009 |
(952) |
| Effect
of equipment supply contract and ancillary revenue with cellulosic
ethanol producer substantially completed in 2008, offset by revenue recognized on Chinese equipment supply contract |
(8) |
| Increase
due to feedstock trials following completion of pilot plant and spare
part sales |
44 |
| Revenue for the year ended December 31, 2009 | 519 |
Gross margin in SunOpta BioProcess was $223 in 2009 versus a loss of $553 in 2008. The improvement in margin over prior year mainly reflects the negative margins incurred in 2008 due to additional onsite commissioning costs that did not reoccur in 2009. We are still in the process of attempting to recover up to $600 of these costs from a supplier who performed work on behalf of SunOpta BioProcess. The table below explains the increase in gross margin:
| SunOpta BioProcess Gross Margin Changes | $ |
| Gross Margin for the year ended December 31, 2008 | (553) |
| Negative
margins incurred on equipment supply contract with cellulosic ethanol
producer in 2008 due to additional on-site commissioning costs |
920 |
| Increase
due to project costs savings from 2008 on Abener contract to
build demonstration plant in Spain as well as positive margins on feedstock analysis and spare parts |
49 |
| Decrease in margin due to Xylitol and other R&D work not performed in 2009 | (193) |
| Gross Margin for the year ended December 31, 2009 | 223 |
| SunOpta Inc. | 70 | December 31, 2009 – 10-K |
Operating losses in SunOpta BioProcess increased by $1 to $3,287 in 2009, from $3,286 in 2008. The table below explains the increase in operating loss:
| SunOpta BioProcess Operating Income Changes | $ |
| Operating Loss for the year ended December 31, 2008 | (3,286) |
| Increase in gross margin in the period, as explained above | 776 |
| Decrease
in foreign exchange gains due to the revaluation of Euro and
Canadian denominated liabilities |
(611) |
| Increased
research and development (R&D) spending in relation to the
CMCEP feasibility study as well as other internal R&D initiatives, offset by increased allocation of in house labour to open capital projects and government grant programs |
(310) |
| Higher professional fees attributed to litigation matters and strategic alliance projects | (192) |
| Decrease in corporate cost allocations | 336 |
| Operating Loss for the year ended December 31, 2009 | (3,287) |
SunOpta BioProcess continues to focus on building its business and technology portfolio and establishing strategic partnerships with companies in the energy, petrochemical and biomass sectors, while also seeking government support to further advance the commercialization of cellulosic ethanol. Interest in cellulosic ethanol continues to increase as many countries become more responsive to environmental concerns and desire to reduce their dependence on fossil fuels. The statements in this paragraph are forward-looking statements. See “Forward-looking Financial Information” above. A decline in demand for cellulosic ethanol, inability to establish strategic partnerships, and the repeal or modification of government programs could have an adverse impact on these forward-looking statements.
| SunOpta Corporate Services | Dec 31, 2009 | Dec 31, 2008 | Change | % Change | ||||||||
| Operating Income (Loss) | (4,852 | ) | (8,875 | ) | 4,023 | 45.3% |
(Operating Income is defined as “Earnings before the following” excluding the impact of “Other expenses, net” and “Goodwill impairment”. Operating income % is calculated as operating income divided by revenues.)
| SunOpta Inc. | 71 | December 31, 2009 – 10-K |
Operating costs in SunOpta Corporate Services decreased by $4,023 to $4,852 in 2009, from costs of $8,875 in 2008. The table below explains the decrease in operating loss:
| SunOpta Corporate Services Operating Income Changes | $ |
| Operating Loss for the year ended December 31, 2008 | (8,875) |
| Decrease in professional fees related to the investigation into the 2007 restatement | 6,153 |
| Decrease
in SG&A costs due to the weakened Canadian dollar in 2009 on
translating Canadian borne expenses into U.S. dollars |
1,276 |
| Increase in corporate management fees that are allocated to SunOpta operating groups | 557 |
| Decrease
in foreign exchange gains in
2009 Foreign
exchange gains in the prior year were primarily a result of favourable
movements |
(2,874) |
| Increase
in other professional fees relating mainly to banking, tax and other
consulting activities |
(633) |
| Increase
in all other SG&A, primarily insurance due to increases in umbrella
insurance, property insurance and marine insurance |
(456) |
| Operating Loss for the year ended December 31, 2009 | (4,852) |
Management fees mainly consist of salaries of corporate personnel who perform back office functions for our operating groups, as well as costs related to the enterprise resource management system used within several of our divisions. These expenses are allocated to the groups based on (1) specific identification of allocable costs that represent a service provided to each divisions, and (2) a proportionate distribution of costs based on a weighting of factors such as revenue contribution and number of people employed within each division.
| SunOpta Inc. | 72 | December 31, 2009 – 10-K |
Results of Operations
2008 Operations Compared With 2007 Operations
| Dec 31, 2008 | Dec 31, 2007 | Change | Change | |||||||||
| Consolidated | $ | $ | $ | % | ||||||||
| Revenue | ||||||||||||
| SunOpta Foods | 960,316 | 725,290 | 235,026 | 32.4% | ||||||||
| Opta Minerals | 93,422 | 75,365 | 18,057 | 24.0% | ||||||||
| SunOpta BioProcess | 1,435 | 1,839 | (404 | ) | (22.0% | ) | ||||||
| Total Revenue | 1,055,173 | 802,494 | 252,679 | 31.5% | ||||||||
|
Gross Margin |
||||||||||||
|
SunOpta Foods |
138,172 |
109,476 |
28,696 | 26.2% | ||||||||
| Opta Minerals | 18,476 |
17,776 |
700 | 3.9% | ||||||||
| SunOpta BioProcess | (553 |
) |
(1,118 |
) |
565 | 50.5% | ||||||
| Total Gross Margin | 156,095 |
126,134 |
29,961 | 23.8% | ||||||||
| Operating Income | ||||||||||||
| SunOpta Foods | 22,833 | 12,348 | 10,485 | 84.9% | ||||||||
| Opta Minerals | 5,531 | 6,668 | (1,137 | ) | (17.1% | ) | ||||||
| SunOpta BioProcess | (3,286 | ) | (5,985 | ) | 2,699 | 45.1% | ||||||
| Corporate Services | (8,875 | ) | (7,369 | ) | (1,506 | ) | (20.4% | ) | ||||
| Total Operating Income | 16,203 | 5,662 | 10,541 | 186.2% | ||||||||
| Other Expense, net | 1,003 | 1,187 | (184 | ) | (15.5% | ) | ||||||
| Dilution Gain | - | 693 | (693 | ) | (100.0% | ) | ||||||
| Goodwill Impairment | 10,154 | 996 | 9,158 | 919.5% | ||||||||
| Interest Expense | 14,281 | 8,823 | 5,458 | 61.9% | ||||||||
| Income Tax Provision | 790 | (6,101 | ) | 6,891 | 112.9% | |||||||
| Non-Controlling Interest | 911 | 1,043 | (132 | ) | (12.7% | ) | ||||||
| Net earnings | (10,936 | ) | 407 | (11,343 | ) | (2,787.0% | ) |
1(Operating Income is defined as “Earnings before the following” excluding the impact of “Other expenses, net” and “Goodwill impairment”)
Revenues for the year increased by 31.5% to $1,055,173 based on consolidated internal growth of 15.5% and acquisition revenues of $111,035. Internal growth includes growth on the base business plus growth on acquisitions from the date of acquisition over the previous year in addition to the impact of foreign exchange movements and its effects on translations to U.S dollars. Without the movements in foreign exchange, internal growth was 14.5%. Revenue growth continued to be led by SunOpta Foods as revenues increased $235,026 mainly due to the acquisition of The Organic Corporation, which contributed incremental revenues of $106,698, and strong internal growth from the Grains and Foods Group and Distribution Group.
Gross margins increased $29,961, or 23.8%, in 2008 to $156,095 from $126,134. As a percentage of revenues, consolidated gross margins decreased 0.9%. Higher raw material and freight costs beyond what could be passed along to customers, plant inefficiencies from expansion projects and inventory management initiatives, pre-opening costs for our Modesto facility and the acquisition of The Organic Corporation, which operates at lower margins, all unfavourably impacted SunOpta Food’s margin rate. This was slightly offset by the favourable turnaround in the Fruit Group’s Fruit Specialties division. Also contributing to the lower gross margin rate were inventory reserves to mark-to-market the raw magnesium inventory, and a decline in steel and foundry market which impacted Opta Minerals in the fourth quarter.
W&D costs for the year ended December 31, 2008 were $21,040, an increase of $141 compared to the same period in 2007. These costs are solely related to the Distribution Group as warehousing and distribution costs for other groups are considered part of Cost of Goods Sold. W&D costs as a percentage of Distribution Group revenues decreased 1.4% to 8.1% in 2008 due to leveraging existing warehouse infrastructure while increasing volume. For further details see the Distribution Group analysis included within.
| SunOpta Inc. | 73 | December 31, 2009 – 10-K |
SG&A costs including intangible asset amortization, increased $23,575 to $123,687 for the year ended December 31, 2008 compared to the same period in 2007. Of this increase, $7,772 was related to one-time professional fees incurred as a result of the 2007 financial restatement and investigation process. The acquisitions of The Organic Corporation, Newco, MCP Mg-Serbien SAS, the Mexican Berry Operations and Neo-Nutritionals increased SG&A by $11,028. Higher compensation costs associated with increased headcount to support expanded business operations combined with increased variable costs due to the increase in revenue were the main drivers behind the remaining SG&A increase of $4,775. SG&A as a percentage of sales was 11.7% in 2008 compared to 12.5% in 2007. The rate difference is primarily due to the impact of a weaker Canadian dollar on Canadian denominated costs, in addition to the acquisition of The Organic Corporation which operated with an SG&A rate of 7.9% of revenues.
Foreign Exchange gains increased to $4,835 in 2008 compared to a gain of $539. The increase is mainly due to favourable movements from the Canadian dollar and the Euro to the U.S dollar in the second and third quarter of 2008. We entered into a number of Canadian dollar and Euro forward contracts that, due to the volatility of exchange rates in these currencies, were closed prior to reaching their maturity.
Operating income increased by $10,541, or 186.2%, over the twelve months ended December 31, 2007 due to the factors noted above. Further details on revenue, gross margins corporate cost allocations and operating income are provided below by operating group.
Other expenses decreased $184 to $1,003 in 2008. Other expenses in 2008 mainly relate to the legal judgment in favour of one of SunOpta BioProcess’s customers offset by gains from certain insurance proceeds. In 2007, other expenses mainly related to legal fees and restructuring costs related to the consolidation of warehouses within the Distribution Group.
Based on our annual test for impairment, we determined that the carrying value of goodwill in the Fruit Group and International Sourcing and Trading Group, excluding The Organic Corporation, exceeded its fair value, and, as a result, we recorded an impairment charge of $10,154 (2007 - $996).
Compared to the twelve months ended December 31, 2007, interest expense increased by $5,458 due to increased long-term debt and operating lines net of cash on hand. The increase in debt was primarily related to acquisitions completed and higher working capital levels throughout the year due to internal growth. In addition, we experienced increased premiums over LIBOR due to certain financial ratios increasing.
The income tax expense in 2008 was $790 compared to a recovery of $6,101 in 2007. The expense in 2008, in comparison to a recovery in 2007 reflects of higher earnings before income tax and an allowance related to income tax valuation.
Non-controlling interest in 2008 was $911 compared to $1,043 in 2007, mainly reflecting the non-controlling interest component of Opta Minerals as we owned approximately 66.2% at the end of 2008.
Net losses for the year were $10,936 as compared to net income of $407 in 2007, a difference of $11,343 due in most part to the reasons described in the preceding paragraphs. Basic and diluted loss per share was $0.17 in 2008 compared to earnings per share of $0.01 for 2007.
| SunOpta Inc. | 74 | December 31, 2009 – 10-K |
Segmented Operations Information
| SunOpta Foods | Dec 31,2008 | Dec 31, 2007 | Change | % Change | ||||||||
| Revenue | ||||||||||||
| Grains and Foods Group | 327,307 | 248,021 | 79,286 | 32.0% | ||||||||
| Ingredients Group | 65,270 | 70,315 | (5,045 | ) | (7.2% | ) | ||||||
| Fruit Group | 150,879 | 133,645 | 17,234 | 12.9% | ||||||||
| International Sourcing and Trading Group | 157,814 | 53,039 | 104,775 | 197.5% | ||||||||
| Distribution Group | 259,046 | 220,270 | 38,776 | 17.6% | ||||||||
| SunOpta Foods Revenue | 960,316 | 725,290 | 235,026 | 32.4% | ||||||||
| Gross Margin | ||||||||||||
| Grains and Foods Group | 34,309 | 31,539 | 2,770 | 8.8% | ||||||||
| Ingredients Group | 10,545 | 12,625 | (2,080 | ) | (16.5% | ) | ||||||
| Fruit Group | 7,349 | (4,358 | ) | 11,707 | 268.6% | |||||||
| International Sourcing and Trading Group | 17,021 | 8,650 | 8,371 | 96.8% | ||||||||
| Distribution Group | 68,948 | 61,020 | 7,928 | 13.0% | ||||||||
| SunOpta Foods Gross Margin | 138,172 | 109,476 | 28,696 | 26.2% | ||||||||
| SunOpta Foods Gross Margin % | 14.4% | 15.1% |
(0.7% |
) | ||||||||
| Operating Income | ||||||||||||
| Grains and Foods Group | 18,541 | 16,155 | 2,386 | 14.8% | ||||||||
| Ingredients Group | 3,392 | 4,432 | (1,040 | ) | (23.5% | ) | ||||||
| Fruit Group | (10,219 | ) | (18,679 | ) | 8,460 | 45.3% | ||||||
| International Sourcing and Trading Group | 1,333 | 997 | 336 | 33.7% | ||||||||
| Distribution Group | 9,786 | 9,443 | 343 | 3.6% | ||||||||
| SunOpta Foods Operating Income | 22,833 | 12,348 | 10,485 | 84.9% | ||||||||
| SunOpta Foods Operating Margin % | 2.4% | 1.7% |
0.7% |
(Operating Income is defined as “Earnings before the following” excluding the impact of “Other expenses, net” and “Goodwill impairment”. Operating income % is calculated as operating income divided by revenues.)
SunOpta Foods contributed $960,316, or 91.0% of consolidated revenue, in 2008 compared to $725,290, or 90.4%, of consolidated revenues in 2007. This was based on internal growth of 16.3% and acquisition revenues of $100,348. Internal growth included movements related to foreign exchange and commodity grain prices. In base currencies, internal growth was 15.2%. Acquisition revenues resulted primarily from the acquisition of The Organic Corporation within the International Sourcing and Trading Group where the Group contributed incremental revenues of $104,775. Continued strength in soybean, corn, sunflower and soymilk revenues in the Grains and Foods Group contributed $79,286 of higher SunOpta Foods sales. These increases were also impacted by generally higher commodity prices. Revenue growth of $38,776 within the Distribution Group was due to improved sales in grocery and natural health products. Favourable sales of $17,234 from the Fruit Group was mainly due to the acquisition of the Mexican Berry Operations in 2007 in addition to higher volumes of healthy fruit snacks from the new bar forming equipment. This was offset by $5,045 in lower revenues in the Ingredients Group due to the weakness in the dairy blending operations and lower contract manufacturing volumes.
| SunOpta Inc. | 75 | December 31, 2009 – 10-K |
Gross Profit in SunOpta Foods increased $28,696 in 2008 to $138,172, or 14.4% of revenues, compared to $109,476, or 15.1% of revenues, in 2007. The turnaround in the Fruit Group contributed $11,707 in incremental margins. Higher volumes within the Grains and Foods Group and Distribution Group improved margins by $10,698. Improved margins of $8,371 was due to the acquisition of The Organic Corporation within the International Sourcing and Trading operations. This was offset by lower margins from the Ingredients Group of $2,080 due to unfavourable volumes and plant efficiencies related to the Midwest flooding in 2008. The gross profit rate decreased 0.7% in 2008 to 14.4% of revenues. Excluding The Organic Corporation, which has a lower inherent margin rate, the SunOpta Food’s margin rate was 15.1%, which is comparable to 2007. Higher commodity prices, plant inefficiencies and pre-opening costs associated with plant expansions in our Grains and Foods Group negatively impacted the overall SunOpta Foods margin percentage. Also unfavourably impacting the SunOpta Foods margin were higher sourcing, freight and storage costs as customer pricing often lagged cost increases and was further compounded by the depreciation in the Canadian dollar compared to the U.S. dollar. Plant throughput suffered as we strategically reduced production to reduce inventory levels. Higher inventory reserves and mark-to-market adjustments, especially in the fourth quarter, also contributed to the year over year reduction in gross margin rates. These declines were partially offset by the continued turnaround in the Fruit Group, which recorded a gross margin rate of 4.9% in 2008 compared to a margin loss of 3.3% in 2007.
Operating income in SunOpta Foods increased by 84.9% to $22,833 in 2008 from $12,348 in 2007. The continued turnaround in the Fruit Specialties division of the Fruit Group improved income by $8,460. Strong volumes of grains and grains-based ingredients in the Grains and Foods Group increased SunOpta Foods income by $2,386. The International Sourcing and Trading operations' acquisition of The Organic Corporation and the continued strength in the Distribution Group due to improved grocery and natural health products improved operating income by a combined $679. Offsetting these improvements were reduced operating income of $1,040 in the Ingredients Group due to higher supply costs beyond what was passed through in increased customer pricing, in addition to plant inefficiencies related to the flooding in the Midwestern United States. The SunOpta Foods’ results include the impact of higher corporate cost allocations of $2,132. A more comprehensive discussion on group results and corporate cost allocations is included below with the various groups that make up SunOpta Foods.
Effective January 1, 2008, two divisions previously reported within the Ingredients Group were transferred, one to the Grains and Foods Group and the other to the Distribution Group. The impact of these transfers on 2007 financial results is as follows:
| Grains and | Ingredients | Distribution | SunOpta | |||||||||
| Foods Group | Group | Group | Foods | |||||||||
| $ | $ | $ | $ | |||||||||
| Revenue | 1,629 | (4,389 | ) | 760 | (2,000 | ) | ||||||
| Gross Margin | 1,162 | (1,770 | ) | (1,392 | ) | (2,000 | ) | |||||
| Operating Income | 1,162 | (1,576 | ) | 414 | - |
(Operating Income is defined as “Earnings before the following” excluding the impact of “Other expenses, net” and “Goodwill impairment”. Operating income % is calculated as operating income divided by revenues.)
The Organic Corporation and Organic Ingredients were removed from the Fruit Group and combined to create a new group called International Sourcing and Trading Group because this reflects how our chief decision makers review and assess these reporting units.
| SunOpta Inc. | 76 | December 31, 2009 – 10-K |
| Grains and Foods Group | Dec 31, 2008 | Dec 31, 2007 | Change | % Change | ||||||||
| Revenue | 327,307 | 248,021 | 79,286 | 32.0% | ||||||||
| Gross Margin | 34,309 | 31,539 | 2,770 | 8.8% | ||||||||
| Gross Margin % | 10.5% | 12.7% | (2.2% | ) | ||||||||
| Operating Income | 18,541 | 16,155 | 2,386 | 14.8% | ||||||||
| Operating Income % | 5.7% | 6.5% | (0.8% | ) |
(Operating Income is defined as “Earnings before the following” excluding the impact of “Other expenses, net” and “Goodwill impairment”. Operating income % is calculated as operating income divided by revenues.)
The Grains and Foods Group contributed $327,307 in revenues in 2008 compared to $248,021 in 2007, a 32.0% increase. This increase was attributed entirely to internal growth and a significant rise in commodity prices on soy, corn and sunflower products. The table below explains the increase in revenue compared to prior year:
| Grains and Foods Group Revenue Changes | $ |
| Revenue for the year ended December 31, 2007 | 248,021 |
| Increase
due to higher demand and commodity prices for non-GMO and organic
grains and grains based food ingredients, including organic oils, sweeteners and dairy products |
54,790 |
| Increase
in aseptic and extended shelf life (ESL) soy and alternative beverage
sales
due to growth in volumes from existing contracts and the addition of a large contract late in the year with a major food service restaurant operator |
18,364 |
| Favourable
sunflower based business sales due to increased demand for
in-shell and bakery kernel sunflower products |
6,695 |
| Decrease
in roasted products snack food revenues due to the loss of a
significant customer contract |
(563) |
| Revenue for the year ended December 31, 2008 | 327,307 |
Gross margin in the Grains and Foods Group increased by $2,770 in 2008 compared to 2007. The gross margin percentage decreased 2.2% to 10.5% over the same period mainly as a result of higher commodity prices, in addition to plant inefficiencies stemming from our plant expansions, pre-opening expenses and higher inventory reserves. The table below explains the increase in gross margin compared to prior year:
| Grains and Foods Gross Margin Changes | $ |
| Gross Margin for the year ended December 31, 2007 | 31,539 |
| Higher sales volumes, commodity prices and plant efficiencies | 4,410 |
| Higher
sunflower margins due to improved volumes and pricing on bird food
products, oil, conoil and chips |
1,353 |
| Lower
margins on soymilk and roasted grain products due to increased raw
material costs and plant inefficiencies related to existing plant expansions |
(2,018) |
| Pre-opening expense relating to the west coast production facility | (975) |
| Gross Margin for the year ended December 31, 2008 | 34,309 |
| SunOpta Inc. | 77 | December 31, 2009 – 10-K |
Operating income in the Grains and Foods Group increased by $2,386, or 14.8% to $18.541 from $16,155 in 2007. The table below explains the increase in operating income compared to prior year:
| Grains and Foods Group Operating Income Changes | $ |
| Operating Income for the year ended December 31, 2007 | 16,155 |
| Increase in gross margin, as explained above | 2,770 |
| Increase
in foreign exchange gains related to forward contracts within the
sunflower business for sales realized in Euros |
250 |
| Decrease in SG&A costs | 56 |
| Higher corporate cost allocations | (690) |
| Operating Income for the year ended December 31, 2008 | 18,541 |
| Ingredients Group | Dec 31, 2008 | Dec 31, 2007 | Change | % Change | ||||||||
| Revenue | 65,270 | 70,315 | (5,045 | ) | (7.2% | ) | ||||||
| Gross Margin | 10,545 | 12,625 | (2,080 | ) | (16.5% | ) | ||||||
| Gross Margin % | 16.2% | 18.0% | (1.8% | ) | ||||||||
| Operating Income | 3,392 | 4,432 | (1,040 | ) | (23.5% | ) | ||||||
| Operating Income % | 5.2% | 6.3% | (1.1% | ) |
(Operating Income is defined as “Earnings before the following” excluding the impact of “Other expenses, net” and “Goodwill impairment”. Operating income % is calculated as operating income divided by revenues.)
The Ingredients Group contributed revenues of $65,270 in 2008 compared to $70,315 in 2007, a 7.2% decrease. The table below explains the decrease in revenue compared to prior year:
| Ingredients Revenue Changes | $ |
| Revenue for the year ended December 31, 2007 | 70,315 |
| Decreased
dairy blending volumes and prices due to inherent declines in the price
of raw materials |
(5,357) |
| Decreased technical processing of starch and other ingredients products | (1,128) |
| Lower volumes in contract manufacturing | (924) |
| Increased oat and soy fiber sales | 2,364 |
| Revenue for the year ended December 31, 2008 | 65,270 |
| SunOpta Inc. | 78 | December 31, 2009 – 10-K |
Gross margins in the Ingredients Group decreased by $2,080 and the margin rate decreased from 18.0% to 16.2% of revenue. Weaker demand and lower prices for dairy blend products had a negative impact on the group's margin rate as well as higher raw material, energy and transportation costs related to oat and soy fiber products which preceded pricing taken during the year. The table below explains the decrease in gross margin compared to prior year:
| Ingredients Group Gross Margin Changes | $ |
| Gross Margin for the year ended December 31, 2007 | 12,625 |
| Increases
in raw material, energy and transportation costs related to oat and soy
fiber products which preceded pricing taken during the year |
(1,256) |
| Inefficiencies
resulting from plant shutdowns and subsequent start-up following the
series of floods that affected the midwestern United States during 2008 |
(489) |
| Weaker demand and lower prices on dairy blend products | (335) |
| Gross Margin for the year ended December 31, 2008 | 10,545 |
Operating income in the Ingredients Group decreased $1,040 to $3,392 in 2008 compared to 2007. The table below explains the decrease in operating income compared to prior year:
| Ingredients Group Operating Income Changes | $ |
| Operating Income for the year ended December 31, 2007 | 4,432 |
| Decrease in gross margin, as explained above | (2,080) |
| Increased foreign exchange losses | (42) |
| Lower compensation, travel and consulting costs as a result of cost saving initiatives | 688 |
| Lower corporate cost allocations | 394 |
| Operating Income for the year ended December 31, 2008 | 3,392 |
| Fruit Group | Dec 31, 2008 | Dec 31, 2007 | Change | % Change | ||||||||
| Revenue | 150,879 | 133,645 | 17,234 | 12.9% | ||||||||
| Gross Margin | 7,349 | (4,358 | ) | 11,707 | 268.6% | |||||||
| Gross Margin % | 4.9% | (3.3% | ) | 8.2% | ||||||||
| Operating Income (Loss) | (10,219 | ) | (18,679 | ) | 8,460 | 45.3% | ||||||
| Operating Income (Loss) % | (6.8% | ) | (14.0% | ) | 7.2% |
(Operating Income is defined as “Earnings before the following” excluding the impact of “Other expenses, net” and “Goodwill impairment”. Operating income % is calculated as operating income divided by revenues.)
| SunOpta Inc. | 79 | December 31, 2009 – 10-K |
The Fruit Group contributed revenues of $150,879 in 2008 compared to $133,645 in 2007, a 12.9%, or $17,234, increase. Year over year internal growth within the group was 7.7%. The table below explains the increase in revenue compared to prior year:
| Fruit Group Revenue Changes | $ |
| Revenue for the year ended December 31, 2007 | 133,645 |
| Increased
Healthy Fruit Snacks Sales as a result of additional customers
and significantly increased capacity made available by the new bar forming equipment that was brought online late in the fourth quarter of 2007 in the division’s Omak, Washington facility |
11,805 |
| Increase due to the acquisition of the Mexican Berry Operations in May 2007 | 5,970 |
| Increase
in revenues relating to our brokerage operations due mainly to a
change in business circumstances during the third quarter of 2008 that led to reporting certain revenue on a gross basis, rather than on a net margin basis |
3,788 |
| Lower
volumes in our frozen fruit and fruit toppings operations mainly due to
lower industrial and private label volumes of organic fruit and fruit purees as the business was repositioned for future profitability partially offset by increased sales due to expanded fruit topping product offering |
(4,329) |
| Revenue for the year ended December 31, 2008 | 150,879 |
Gross margins in the Fruit Group increased by $11,707 in 2008 to $7,349, or 4.9% of revenue, compared to a margin loss of 3.3% of revenue in 2007. The overall 8.2% improvement in margin rate in 2008 reflects close to breakeven margins in our frozen fruit operation as we spent most of the year selling through a large portion of inventory that was already written down to net realizable value. As a result of the delay in filing our Form 10-K for the year ended December 31, 2007, provisions established to reduce certain inventory to its net realizable value were prepared using the most current pricing knowledge available. Note that the reserves established at December 31, 2007 were not intended to cover yet to be incurred period costs such as third party storage costs and utility costs. The table below explains the increase in gross margin compared to prior year:
| Fruit Group Gross Margin Changes | $ |
| Gross Margin for the year ended December 31, 2007 | (4,358) |
| During
2007, the frozen fruit operation recorded a provision to reduce the
carrying
value of inventory to its net realizable value |
6,552 |
| Improved
customer pricing in the frozen fruit operation, offset slightly by a
decline
in volume |
3,604 |
| During
2008, the frozen fruit operation sold through inventory that was
written down to net realizable value in the prior year |
3,009 |
| Gross
margin improved in our Healthy Fruit Snacks, Brokerage and Fruit
Toppings operations primarily due to increased volumes partially due to expanded product offerings |
1,444 |
| In
an effort to reduce storage and other period costs associated with holding
inventory, during 2008 we undertook extensive efforts to sell through a large portion of inventory that existed at December 31, 2007. These efforts, combined with improved production planning, resulted in favourable absorption efficiencies compared to prior year |
1,332 |
| Increase due to the acquisition of the Mexican Berry Operations in May 2007 | 804 |
| Storage
and utilities cost as a result of higher inventory levels during much of
2008 compared to 2007 |
(5,038) |
| Gross Margin for the year ended December 31, 2008 | 7,349 |
| SunOpta Inc. | 80 | December 31, 2009 – 10-K |
Operating income in the Fruit Group increased by $8,460 to a loss of $10,219 in 2008 compared to a loss of $18,679 in the same period of 2007. The table below explains the increase in operating income compared to prior year:
| Fruit Group Operating Income Changes | $ |
| Operating Income for the year ended December 31, 2007 | (18,679) |
| Increase in gross margin, as explained above | 11,707 |
| Decrease in bad debt expense | 392 |
| Increased
foreign exchange gains, which are derived from Mexican and
Canadian operations within the Fruit Group |
304 |
| Increased
compensation and other costs due to increased headcount to
support expanded business development and improved controls, new industrial product programs, severance and various other initiatives to improve internal processes |
(2,850) |
| Increase due to the acquisition of the Mexican Berry Operations in May 2007 | (624) |
| Increased corporate allocations | (469) |
| Operating Income for the year ended December 31, 2008 | (10,219) |
| International Sourcing and Trading Group | Dec 31, 2008 | Dec 31, 2007 | Change | % Change | ||||||||
| Revenue | 157,814 | 53,039 | 104,775 | 197.5% | ||||||||
| Gross Margin | 17,021 | 8,650 | 8,371 | 96.8% | ||||||||
| Gross Margin % | 10.8% | 16.3% | (5.5% | ) | ||||||||
| Operating Income (Loss) | 1,333 | 997 | 336 | 33.7% | ||||||||
| Operating Income (Loss) % | 0.8% | 1.9% | (1.1% | ) |
(Operating Income is defined as “Earnings before the following” excluding the impact of “Other expenses, net” and “Goodwill impairment”. Operating income % is calculated as operating income divided by revenues.)
The International Sourcing and Trading Group contributed revenues of $157,814 in 2008 compared to $53,039 in 2007, a $104,775, or 197.5%, increase. Internal growth within the group was 9.6% which included internal growth on The Organic Corporation's base business and changes in foreign exchange rates. The table below explains the increase in revenue compared to prior year:
| International Sourcing and Trading Group Revenue Changes | $ |
| Revenue for the year ended December 31, 2007 | 53,039 |
| Increase due to the acquisition of The Organic Corporation in April 2008 | 106,698 |
| Lower industrial sales volume at SGOI | (1,923) |
| Revenue for the year ended December 31, 2008 | 157,814 |
| SunOpta Inc. | 81 | December 31, 2009 – 10-K |
Gross margins in the International Sourcing and Trading Group increased $8,371 to $17,021 in 2008 compared to $8,650 in 2007. The table below explains the increase in gross margin compared to prior year:
| International Sourcing and Trading Gross Margin Changes | $ |
| Gross Margin for the year ended December 31, 2007 | 8,650 |
| Increase due to the acquisition of The Organic Corporation in April 2008 | 9,671 |
| Decrease
in gross margin at SGOI due to inventory reserves to reduce certain key
raw materials to net realizable value in addition to higher raw material, distribution and storage costs beyond what was passed on in pricing to customers during the year |
(1,300) |
| Gross Margin for the year ended December 31, 2008 | 17,021 |
Margins rates within the base business prior to the acquisition of The Organic Corporation were 14.4% compared to 16.3% in 2007. Gross margin rates within The Organic Corporation were 9.1%, which are consistent with historical margins for this business. Generally, The Organic Corporation realizes lower margins than SGOI as it closely resembles a traditional trading operation, compared to the value added private label co-pack operations of SGOI.
Operating income in the International Sourcing and Trading Group increased by $336 to $1,333 in 2008 over 2007, an increase of 33.7%. Overall, operating income from The Organic Corporation offset weakness experienced within SGOI, specifically a softening in sales of organic industrial products, primarily in the fourth quarter, due to the economic downturn. This downturn also precipitated the need to take additional inventory reserves for certain products as noted above. The table below explains the increase in operating income compared to prior year:
| International Sourcing and Trading Group Operating Income Changes | $ |
| Operating Income for the year ended December 31, 2007 | 997 |
| Increase in gross margin, as explained above | 8,371 |
| Increased foreign exchange gains relating to The Organic Corporation acquisition | 463 |
| Increase in SG&A costs due to the acquisition of The Organic Corporation in April 2008 | (8,400) |
| Higher SG&A costs primarily due to increased corporate cost allocations | (98) |
| Operating Income for the year ended December 31, 2008 | 1,333 |
| Distribution Group | Dec 31, 2008 | Dec 31, 2007 | Change | % Change | ||||||||
| Revenue | 259,046 | 220,270 | 38,776 | 17.6% | ||||||||
| Gross Margin | 68,948 | 61,020 | 7,928 | 13.0% | ||||||||
| Gross Margin % | 26.6% | 27.7% | (1.1% | ) | ||||||||
| Operating Income | 9,786 | 9,443 | 343 | 3.6% | ||||||||
| Operating Income % | 3.8% | 4.3% | (0.5% | ) |
(Operating Income is defined as “Earnings before the following” excluding the impact of “Other expenses, net” and “Goodwill impairment”. Operating income % is calculated as operating income divided by revenues.)
| SunOpta Inc. | 82 | December 31, 2009 – 10-K |
The Distribution Group contributed revenues of $259,046 in 2008, an increase of $38,776, or 17.6%, over 2007. Internal growth within the group was 16.1%. The table below explains the increase in revenue compared to prior year:
| Distribution Group Revenue Changes | $ |
| Revenue for the year ended December 31, 2007 | 220,270 |
| Increased
natural and organic grocery sales as a result of new listings at a major
retailer in Eastern Canada and increased warehouse capacity in Western Canada |
24,182 |
| Increased
revenue in the natural health sector due to continued strength from
new listings, new product lines and further market penetration into Western Canada |
9,290 |
| Increase due to the acquisition of Neo-Nutritionals Inc. in December 2007 | 3,754 |
| Increased
revenues in the produce segment mainly as a result of new locations
at existing Western Canada retailers partly offset by decreases in the Eastern region due to increased competitive pressures |
1,550 |
| Revenue for the year ended December 31, 2008 | 259,046 |
Gross margin in the Distribution Group increased by $7,928 in 2008 to $68,948, or 26.6% of revenues. As a percentage of revenues, gross margin decreased by 1.1% due mainly to product mix in our natural and health operations as a higher proportion of distributed products with lower margins were sold versus higher margin branded products. Additionally, the weakening of the Canadian dollar coupled with the inability to pass along exchange based price increases to retailers negatively impacted margins, especially in the fourth quarter. The table below explains the increase in gross margin compared to prior year:
| Distribution Group Gross Margin Changes | $ |
| Gross Margin for the year ended December 31, 2007 | 61,020 |
| Higher
natural and organic grocery volumes, offset by a decrease in produce
volume
due to competition, and delays in passing along foreign exchange driven cost increases via pricing to retailers |
3,956 |
| Increased
volume of distributed natural health products offset by lower volumes in
our higher margin branded products |
2,642 |
| Increase due to the acquisition of Neo-Nutritionals Inc. in December 2007 | 1,330 |
| Gross Margin for the year ended December 31, 2008 | 68,948 |
| SunOpta Inc. | 83 | December 31, 2009 – 10-K |
Operating income in the Distribution Group increased by $343 or 3.6% to $9,786 in 2008 compared to $9,443 in 2007. Combined SG&A and W&D increased by $6,797 to $58,869 compared to 2007. As a percentage of revenues, these expenses decreased to 22.7% versus 23.6% in 2007 primarily due to volume efficiencies. The table below explains the increase in operating income compared to prior year:
| Distribution Group Operating Income Changes | $ |
| Operating Income for the year ended December 31, 2007 | 9,443 |
| Increase in gross margin, as explained above | 7,928 |
| Increased
variable freight and warehousing costs due to increased revenues, offset
by volume efficiencies as a result of the 2007 warehouse expansion in Western Canada |
(5,815) |
| Higher
SG&A costs due to the acquisition of Neo-Nutritionals Inc. in
December 2007 |
(881) |
| Increased
foreign exchange losses due to the decline in the Canadian dollar versus
the U.S. dollar, mainly in the fourth quarter of 2008 |
(788) |
| Higher corporate cost allocations | (101) |
| Operating Income for the year ended December 31, 2008 | 9,786 |
| Opta Minerals | Dec 31, 2008 | Dec 31, 2007 | Change | % Change | ||||||||
| Revenue | 93,422 | 75,365 | 18,057 | 24.0% | ||||||||
| Gross Margin | 18,476 | 17,776 | 700 | 3.9% | ||||||||
| Gross Margin % | 19.8% | 23.6% | (3.8% | ) | ||||||||
| Operating Income | 5,531 | 6,668 | (1,137 | ) | (17.1% | ) | ||||||
| Operating Income % | 5.9% | 8.8% | (2.9% | ) |
(Operating Income is defined as “Earnings before the following” excluding the impact of “Other expenses, net” and “Goodwill impairment”. Operating income % is calculated as operating income divided by revenues.)
Opta Minerals contributed $93,422, or 8.9% of consolidated revenue, for 2008 compared to $75,365, or 9.4%, for 2007. The table below explains the increase in revenue compared to prior year:
| Opta Minerals Revenue Changes | $ |
| Revenue for the year ended December 31, 2007 | 75,365 |
| Increase
due to the acquisitions of MCP Mg-Serbien SAS in July 2008 and Newco
in July 2007 |
9,637 |
| Higher demand and prices for chromite and magnesium based products | 9,362 |
| Lower abrasive sales, offset by favourable mill and foundry volumes | (942) |
| Revenue for the year ended December 31, 2008 | 93,422 |
| SunOpta Inc. | 84 | December 31, 2009 – 10-K |
Gross profit increased by $700 to $18,476, or 19.8% of revenues, compared to $17,776, or 23.6% of revenues, in 2007. The 3.8% decline in margin rate was primarily due to significant reserves that were established to reduce the value of raw magnesium inventory to its net realizable value, as well as the unprecedented downturn in the U.S. steel industry which unfavourably impacted demand for our products and thus the margins realized. The table below explains the increase in gross margin compared to prior year:
| Opta Minerals Gross Margin Changes | $ |
| Gross Margin for the year ended December 31, 2007 | 17,776 |
| Increased volume for chromite and magnesium as well as mill and foundry products | 1,376 |
| Increase
due to the acquisitions of MCP Mg-Serbien SAS in July 2008 and Newco
in July 2007 |
2,060 |
| Reserves taken to reduce the value of raw magnesium inventory to net realizable value | (2,736) |
| Gross Margin for the year ended December 31, 2008 | 18,476 |
Opta Minerals operating income decreased by $1,137 or 17.1% to $5,531 in 2008 compared to $6,668 in 2007. The table below explains the decrease in operating income compared to prior year:
| Opta Minerals Operating Income Changes | $ |
| Operating Income for the year ended December 31, 2007 | 6,668 |
| Increase in gross margin, as explained above | 700 |
| Increased
professional services, travel, and advertising costs incurred primarily
to organize and promote our new European subsidiaries |
(1,225) |
| Increased
SG&A due to the acquisitions of MCP Mg-Serbien SAS in July 2008
and Newco in July 2007 |
(399) |
| Foreign
exchange losses on a Slovak Koruna denominated promissory note due to
the former owner of Newco |
(213) |
| Operating Income for the year ended December 31, 2008 | 5,531 |
| SunOpta BioProcess | Dec 31, 2008 | Dec 31, 2007 | Change | % Change | ||||||||
| Revenue | 1,435 | 1,839 | (404 | ) | (22.0% | ) | ||||||
| Gross Margin | (553 | ) | (1,118 | ) | 565 | 50.5% | ||||||
| Gross Margin % | (38.5% | ) | (60.8% | ) | 22.3% | |||||||
| Operating Income (Loss) | (3,286 | ) | (5,985 | ) | 2,699 | 45.1% | ||||||
| Operating Income % | (229.0% | ) | (325.4% | ) | 96.4% |
(Operating Income is defined as “Earnings before the following” excluding the impact of “Other expenses, net” and “Goodwill impairment”. Operating income % is calculated as operating income divided by revenues.)
| SunOpta Inc. | 85 | December 31, 2009 – 10-K |
SunOpta BioProcess revenues for the year ending December 31, 2008 were $1,435 versus $1,839 in 2007. The table below explains the decrease in revenue compared to prior year:
| SunOpta BioProcess Revenue Changes | $ |
| Revenue for the year ended December 31, 2007 | 1,839 |
| Decrease
in revenue from equipment supply contracts as projects were completed in
the year for customers in Europe and the United States |
(1,590) |
| Increase
in revenue from research and development projects related to initial
feasibility work on the planned commercial scale cellulosic ethanol plant in Minnesota and related work on the production of commercial grade xylitol from wood-based biomass |
942 |
| Increase in revenue from consulting services, spare part sales and pilot plant trials | 244 |
| Revenue for the year ended December 31, 2008 | 1,435 |
Gross margin losses in SunOpta BioProcess were $553 in 2008 versus a loss of $1,118 in 2007. The table below explains the decrease in gross margin losses compared to prior year:
| SunOpta BioProcess Gross Margin Changes | $ |
| Gross Margin for the year ended December 31, 2007 | (1,118) |
| Contract losses incurred on equipment supply contract that was completed in 2007 | 805 |
| Positive
margins realized on research and development projects that were
commenced and completed in 2008 |
184 |
| Increased
margins generated from consulting services, spare part sales and pilot
plant trials |
30 |
| Additional
commissioning costs incurred during the final phase of start-up on
an equipment supply contract that was substantially completed in 2008 resulting in a project loss of $823 in 2008 reduced by the project loss of $369 incurred in 2007 |
(454) |
| Gross Margin for the year ended December 31, 2008 | (553) |
Operating losses in SunOpta BioProcess decreased by $2,699 to $3,286 in 2008, compared to operating losses of $5,985 in 2007. The table below explains the decrease in operating losses compared to prior year:
| SunOpta BioProcess Operating Income Changes | $ |
| Operating Income for the year ended December 31, 2007 | (5,985) |
| Reserve
for outstanding amounts owing on an equipment supply contract recorded
in 2007 (no additional reserves were required in 2008) |
2,634 |
| Increase in gross margin, as explained above | 565 |
| Increase
in foreign gains due to the revaluation of Euro and Canadian
denominated liabilities |
330 |
| Lower
compensation costs as a greater amount of in-house labour was dedicated to
open projects, offset by increased research and development costs |
110 |
| Increased
professional fees primarily relating to legal costs related to an
existing equipment supply contract |
(940) |
| Operating Income for the year ended December 31, 2008 | (3,286) |
| SunOpta Inc. | 86 | December 31, 2009 – 10-K |
In December 2008, SunOpta BioProcess was ordered to pay a settlement of €1,329, or approximately U.S. $1,900 on a European contract with Abener Energia S.A. The settlement amount was charged to Other Income and Expense.
| SunOpta Corporate Services | Dec 31, 2008 | Dec 31, 2007 | Change | % Change | ||||||||
| Operating Income (Loss) | (8,875 | ) | (7,369 | ) | (1,506 | ) | (20.4% | ) |
(Operating Income is defined as “Earnings before the following” excluding the impact of “Other expenses, net” and “Goodwill impairment”. Operating income % is calculated as operating income divided by revenues.)
Operating costs in SunOpta Corporate Services increased by $1,506 to $8,875 in 2008, compared to operating costs of $7,369 in 2007. The table below explains the increase in operating losses compared to prior year:
| SunOpta Corporate Services Operating Income Changes | $ |
| Operating Income (Loss) for the year ended December 31, 2007 | (7,369) |
| Increased
professional fees relating to the restatement of 2007 quarterly
financial statements |
(7,772) |
| Increased
foreign exchange gains primarily due to favourable movements in the
exchange rate between Canada and the U.S. We were able to close certain forward foreign exchange contracts during the year earlier than their maturity date and consequently realize foreign exchange gains as a result of the volatility of the foreign exchange market. Additionally, unrealized gains were recorded on Euro denominated debt related to the acquisition of The Organic Corporation |
3,992 |
| Higher corporate management fees offset by net $8 other increase in SG&A costs | 2,274 |
| Operating Income (Loss) for the year ended December 31, 2008 | (8,875) |
| SunOpta Inc. | 87 | December 31, 2009 – 10-K |
Liquidity and Capital Resources
We obtain our short term financing through a combination of cash generated from operating activities, cash and cash equivalents, and available operating lines of credit. At December 31, 2009, we have availability under certain lines of credit of approximately $69,817 (2008 – $55,942). As a result of amendments to our credit facilities (Note 8), previously available revolving acquisition lines were eliminated.
On April 30, 2009, we negotiated certain amendments to our syndicated banking facilities. The agreement included a waiver to certain financial covenants at March 31, 2009, and amended covenants for June 30, 2009, September 30, 2009 and December 31, 2009. The amendments included a reduction in the maximum availability under the Canadian line of credit facility from Cdn $25,000 to Cdn $20,000, the cancellation of the revolving portion of the revolving acquisition facility, an increase in the interest rate premium charged on outstanding balances, which is based on certain financial ratios, as well as certain other changes related to capital expenditures and permitted investments. For further details on these operating lines and long-term debt please refer to Note 8 and Note 9 of the Consolidated Financial Statements.
On July 30, 2009, Opta Minerals and its lenders negotiated certain amendments to its banking facilities. The amendments included adjustments to certain financial covenant thresholds, a reduction in the maximum availability under the revolving acquisition facility to Cdn $14,043, and an increase in the interest rate premium charged on outstanding balances, which is based on certain financial ratios. For further details on the banking facilities of Opta Minerals please refer to note 8 and note 9 of the Consolidated Financial Statements.
On October 30, 2009, we completed the conversion of our syndicated credit facilities to an Asset-Based Lending (“ABL”) arrangement, which superseded the amendments from April 30, 2009. The ABL arrangement changes our credit facilities such that credit limits in both the Canadian and U.S. line of credit facilities are based on a borrowing base supported by our accounts receivable and inventories, determined on a monthly basis. In addition, the non-revolving and acquisition facilities (notes 9(b) and (c) to the Consolidated Financial Statements) were eliminated, and the existing balances refinanced using the U.S. line of credit facility. The conversion also decreases the interest rate premium charged on outstanding balances which are based on new financial ratios. Under the new ABL arrangement, the term of the syndicated credit facilities were extended to October 30, 2012.
We have the following sources from which we can fund our operating cash requirements:
- Cash and cash equivalents (refer to note 21 of the consolidated financial statements).
- Available operating lines of credit.
- Cash flows generated from operating activities.
- Cash flows generated from exercise of options which may be in-the-money during the year.
- Additional long term financing.
- Sale of non-core divisions, or assets.
In order to finance significant acquisitions that may arise in the future, we may need additional sources of cash which it could attempt to obtain through a combination of additional bank or subordinated financing, a private or public offering, or the issuance of common stock in relation to an acquisition or a divestiture.
Included in cash and cash equivalents is $18,954 (2008 - $22,077) of cash relating to SunOpta BioProcess that was raised as a result of the preferred share issuance. These funds are specific to SunOpta BioProcess and can only be used by SunOpta BioProcess, which will use these funds for working capital purposes, continued development of biomass conversion technologies and to build and operate commercial scale facilities for the conversion of cellulosic biomass to ethanol. The cash balance on hand is funding losses incurred since the preferred share issuance, as well as potential future losses of SunOpta BioProcess. Also included in cash and cash equivalents are funds of $781 (2008 - $1,377) that are specific to Opta Minerals. These funds cannot be used for general corporate purposes and can only be used within these entities.
We intend to maintain a target long term debt to equity ratio of approximately 0.30 - 0.50 to 1.00 versus the current position at December 31, 2009 of 0.37 to 1.00 (2008 – 0.49 to 1.00) and total debt ratio of 0.50 - 0.70 to 1.00 versus our current position of 0.65 to 1.00 (2008 – 0.79 to 1.00).
| SunOpta Inc. | 88 | December 31, 2009 – 10-K |
Cash Flows – 2009 compared to 2008
Net cash and cash equivalents decreased $4,032 during fiscal 2009 (2008 – decreased by $5,547) to $20,723 at December 31, 2009. The decrease in cash and cash equivalents was primarily the result of $34,363 in net debt repayments, $12,161 of net capital expenditures, and $2,198 in deferred financing fees, offset by cash provided by operating activities of $44,888, of which $27,296 was generated from working capital.
Operating activities generated $44,888 during fiscal 2009, an improvement of $11,203 compared to cash generated of $33,685 during fiscal 2008. This improvement in cash provided by operating activities was due a $13,927 reduction in cash used to fund working capital in 2009 compared to 2008. The primary area of improvement in cash used to fund working capital was a reduction of $27,478 in cash used to fund inventories. This is consistent with Company-wide objectives to reduce inventory levels, resulting in a decrease from $200,869 at December 31, 2008 to $178,140 at December 31, 2009, which has seen a reduction in raw materials and work in progress and finished goods of $18,763 and $6,164, respectively. In particular, the International Sourcing and Trading Group has seen a reduction of $18,306 or approximately 40% in inventory balances, as the group sells through the prior year’s harvests, and focuses on reducing inventories on-hand and controlling the purchase of raw materials. Opta Minerals has also reduced inventories by $5,042, through tighter purchasing and other initiatives implemented as a result of the continued economic downturn in the steel industry that the group faced throughout 2009. Offsetting the working capital cash flow improvements in 2009 compared to 2008 was a use of cash of $14,973 for accounts payable and accrued liabilities. Higher levels of accounts payable and accrued liabilities in 2009 compared to 2008 were due to higher purchasing volumes and accruals for professional fees. Loss for 2009, after adding back items not affecting cash decreased by $2,724 compared to 2008. The changes in fiscal 2009, compared to the same period in 2008, in items not affecting cash are a $680 unrealized loss on foreign exchange due to movements in the foreign exchange rates, offset by non-cash movements of $1,914 in deferred income taxes, and a $1,110 reduction in long-term liability at a subsidiary of Opta Minerals.
Investing activities used cash of $14,132 in fiscal 2009, compared to a use of $15,732 in fiscal 2008. The lower spending of $1,600 is the result of higher net capital expenditures in 2009 compared to 2008, offset by prior year spending on the acquisitions of TOC and MCP, as well as lower payments of deferred purchase consideration and lower purchases of patents, trademarks and other intangible assets. There were no acquisitions in fiscal 2009. In addition to normal maintenance capital spending, capital expenditures in 2009 include spending to bring our aseptic soymilk manufacturing facility in California to the stage of commercial production, as well as spending on our organic pressed oil refinery joint venture in Colorado, which is expected to be fully operational in the first quarter of 2010.
Financing activities used $35,739 in fiscal 2009 compared to $22,898 in fiscal 2008. In 2009, net debt repayments on our line of credit and long-term debt facilities were $34,363 compared to $24,251 in 2008. The increase in net debt repayment is due to borrowings of approximately $10,000 which occurred early in fiscal 2008 to fund the acquisition of TOC. The Company also incurred $2,198 in deferred financing fees in connection with the Fifth Amended and Restated Credit Facility Agreement which was signed on October 30, 2009. There were no financing fees incurred in 2008.
Cash flows – 2008 compared to 2007
Net cash and cash equivalents decreased $5,547 during 2008 (2007 – increased by $29,348) to $24,755 as at December 31, 2008 (2007 - $30,302). Overall, the decrease in cash and cash equivalents was primarily the result of repayments of line of credit facilities, long-term debt and current year purchases of property, plant and equipment, offset by cash provided by a reduction in working capital levels from the prior year.
| SunOpta Inc. | 89 | December 31, 2009 – 10-K |
Operating activities generated cash of $33,685 in 2008, an improvement of $68,762 as compared to a use of cash of $35,077 in 2007. The majority of the improvement in cash provided by operating activities was due to a $60,756 reduction in cash used to fund working capital. Of the total decrease in cash used to fund working capital, $46,451 was the result of a reduction in inventories, consistent with our 2008 objective of reducing inventory levels across all operating segments. Specifically, we lowered production volumes and undertook efforts to sell through a large portion of inventory that existed at December 31, 2007 within the Fruit Specialties division. Additionally, a decrease in accounts receivable, year over year generated $11,897 of cash flows, as days sales outstanding (DSO) decreased from 36.6 days at December 31, 2007 to 31.6 days at December 31, 2008, due to increased collection efforts. In addition to the increase in cash flow due to working capital reductions was a $8,006 increase to items not affecting cash, due mainly to higher goodwill impairment charges of $9,158, an increase in the non-cash impact that amortization and changes to deferred tax balances, offset by a decrease in earnings of $11,343.
Investing activities used $15,732 of cash in 2008, compared to a use of $56,259 in 2007. This $40,527 improvement in cash flows was due in part to a decrease in cash used to acquire companies of $16,052. We completed two acquisitions in 2008, versus four in 2007. Purchases of property, plant and equipment decreased by $20,036 in 2008 compared to 2007 as a result of a curtailment of capital spending to baseline maintenance levels, as well as the completion of the bar forming capital project in our healthy fruit snacks operation in early 2008. In addition, purchase of patents, trademarks and other intangible assets decreased by $1,132; as $1,200 incurred to acquire a trade name in 2007 was not incurred in 2008. We generated cash of $2,005 the majority of which related to insurance proceeds of $1,947 in the Grains and Foods Group related to fires that occurred in late 2007 and early 2008.
Financing activities used cash of $22,898 in 2008, compared to $120,187 of cash provided in 2007. In 2007, we generated cash of $51,882 net of costs as a result of an equity offering in February 2007, and $27,954 in cash was raised in June 2007 as a result of the preference shares issued by SunOpta BioProcess. No such private or public offerings took place during 2008. Additionally, in 2007, we borrowed $18,011 on our line of credit facilities to fund working capital increases mainly in the Fruit Specialties division and the Grains and Foods Groups. In 2008, we paid down the line of credit facilities by $24,584 (net of the line of credit facilities acquired as part of The Organic Corporation acquisition. In 2008 long-term debt increased by $333 compared to borrowings of $12,089 in 2007.
Business and Financial Outlook
The purpose of this Business and Financial Outlook section is to provide shareholders, prospective investors and other readers of this Annual Report Form 10-K with management's current plans and expectations with respect to currently anticipated revenues, net earnings, future financial results from our operations for the period ending December 31, 2010. This Outlook has been prepared for this purpose only and readers are cautioned that it may not be appropriate for any other purpose. Readers are also cautioned that this Outlook is subject to the assumptions, risks and uncertainties discussed below and elsewhere in this Annual Report Form 10-K, that actual results may vary from those presented and therefore they should not place undue reliance on it. This Outlook reflects our current expectations and judgments based on circumstances existing as of March 4, 2010. We disclaim any intention or obligation to update or revise this Business and Financial Outlook, whether as a result of new information, future events or otherwise, except as required by law. The statements in this Outlook are forward-looking statements. See “Forward-Looking Statements”.
Management believes that consumer demand for high quality natural and organic foods and natural health products has grown rapidly over the past decade as global awareness of the benefits of healthy eating continues to proliferate. The global market for organic foods is currently estimated by management to be in excess of $37 billion with historical growth rates between 10% and 20% depending on product line and country. While growth rates slowed during the current economic downturn the long term trends for growth remain in place. While a large number of companies compete within specific segments of the market, we believe there are relatively few companies as well positioned as SunOpta to take advantage of this growing market. We believe that our vertically integrated seed to table business model built over the past ten years has positioned SunOpta as a global leader in the natural and organic foods and natural health products markets.
| SunOpta Inc. | 90 | December 31, 2009 – 10-K |
For 2010 we expect to realize revenue and unit growth compared to 2009, resulting from new product offerings, new and expanding customer relationships and expanded processing capabilities including our new soy processing and packaging operation in Modesto, California which became operational in the second quarter of 2009. The incremental revenues are expected to be offset somewhat by reduced Canadian and European revenues resulting from the decline in these currencies as compared to the U.S. dollar and a decline in certain commodity prices which are ultimately reflected in selling prices. We believe that customers will continue to focus on health conscious natural, organic and specialty foods and natural health products as concerns over disease, obesity and well-being are center of mind and we feel SunOpta is well positioned to meet the needs of these growing markets.
We expect that our net earnings for 2010 will improve versus 2009 as a result of improved volumes, pricing and product mix; the impact of capacity our expansion, cost reduction and rationalization initiatives, many of which have now been implemented; fixed cost leverage; and the avoidance of certain professional fees and severance costs incurred in 2009 which are not expected to reoccur in 2010. Our primary focus for 2010 remains the improvement of operating margins and returns on assets employed.
As a direct result of continually changing world-wide macroeconomic conditions, we have decided to take a cautious and responsible approach with regards to providing guidance, and in doing so, will not provide specific revenue and net earnings guidance at this time.
Recent events are expected to delay, but not cease, our acquisition-based growth strategy. Increased focus on margin improvement, improved internal controls and centralization of key services were key initiatives in 2009 and continue in 2010. Management will continue to be heavily focused on executing working capital reductions, which is expected to increase available cash resources and alleviate some of the interest burden we incur on our existing debt facilities. In 2008, management added key experienced operational personnel in both the Fruit Group and at the corporate level to help drive these initiatives. Our overall strategy remains intact and the goal of profitable growth through an effective balance of internal growth and acquisitions in support of our vertically integrated seed to table strategy has not changed. We continue to look for ways to improve the strategic synergies across our SunOpta Foods operations, vertically integrating wherever possible. Initiatives to improve the productivity of the operations include our performance excellent through people programs, product rationalization, plant and warehouse rationalization programs, continued training and development of employees, consolidated procurement, supply chain and internal services programs and consolidated information and accounting systems to provide better analysis and timely decision-making. A more fulsome discussion of key strategies is included in Item 1 of this report.
Maintaining liquidity and having available sources of cash will be imperative to continue our growth. At December 31, 2009 we had $20,723 in cash, of which $18,954 may only be used within SunOpta BioProcess and $781 within Opta Minerals Inc. We also had approximately $69,817 in unused bank lines for a total of $70,805 in cash and borrowings available. Our remaining cash and unused lines plus cash generated from operations are sufficient to finance 2010 capital spending estimated at $20 to $25 million, annual debt service of $52,455 and payment of the remaining current portion of long-term liabilities of $712. Additional sources of cash could be obtained through a combination of additional bank or subordinated financing, a private or public offering, the issuance of shares or through a divestiture. The $45,000 term loan within our syndicated banking facilities matures on December 20, 2010 and we expect to either re-finance this debt with existing or new lenders, or settle the obligation using a combination of cash generated from operations and availability under other facilities.
Off – Balance Sheet Arrangements
There are currently no off-balance sheet arrangements that have or are reasonably likely to have a current or future material effect on our financial condition.
| SunOpta Inc. | 91 | December 31, 2009 – 10-K |
Contractual Obligations
The table(a) below sets out our obligation under long-term debt, operating and capital leases including interest costs, commitments to purchase grains, commodity and foreign exchange derivative contracts and long term liabilities, at December 31, 2009:
| 2010 | 2011 | 2012 | 2013 | 2014 | Thereafter | Total | |||||||||||||||
| Long term debt and
capital leases |
52,455 |
18,761 |
2,972 |
2,748 |
2,732 |
7,521 |
87,189 |
||||||||||||||
| Grain purchase commitments | 46,710 | 400 | - | - | - | - | 47,110 | ||||||||||||||
| Other commitments | 14,850 | 9,291 | - | - | - | - | 24,141 | ||||||||||||||
| Operating leases | 9,918 | 8,128 | 6,615 | 5,969 | 4,555 | 9,836 | 45,021 | ||||||||||||||
| Interest on long-term debt (b) | 7,075 | 1,790 | 1,042 | 837 | 640 | 764 | 12,148 | ||||||||||||||
| Commodity and foreign exchange contracts |
1,566 |
6 |
- |
- |
- |
- |
1,572 |
||||||||||||||
| Long-term liabilities | 712 | 3,247 | - | - | - | - | 3,959 | ||||||||||||||
| Interest rate swap | - | - | 1,387 | - | - | - | 1,387 | ||||||||||||||
| Total | 133,286 | 41,623 | 10,629 | 10,941 | 7,927 | 18,121 | 222,527 |
| (a) |
This table does not include certain contingent consideration related to acquisitions that may become payable if predetermined profit targets are achieved. Also, in the event that a qualified initial public offering does not occur by June 7, 2014, the preferred shares issued in conjunction with the SunOpta BioProcess private placement would represent a liability to BioProcess Inc. of $30,000 at that time. |
| (b) |
Interest is calculated based on scheduled repayments over the periods as indicated, using existing interest rates at December 31, 2009 as disclosed in note 9 to the consolidated financial statements. |
Item 7A – Quantitative and Qualitative Disclosures about Market Risk
Interest rate risk
The primary objective of our investment activities is to preserve principal and limit risk. To achieve this objective, we may invest excess cash in a variety of securities, including both government and corporate obligations and money market funds. These securities are generally classified as cash and cash equivalents or short-term investments and are recorded on the balance sheet at fair value with unrealized gains or losses reported on the consolidated statements of operations and comprehensive earnings (loss). As at December 31, 2009 all of our excess funds were held in cash and cash equivalents with a maturity less than 90 days.
Debt in both fixed rate and floating rate interest carry different types of interest rate risk. Fixed rate debt may have their fair market value adversely affected by a decline in interest rates. In general, longer term debts are subject to greater interest rate risk than shorter term securities. Floating rate term debt gives less predictability to cash flows as interest rates change. As at December 31, 2009, the weighted average interest rate of the fixed rate term debt was 8.5% (2008 – 7.4%) and $83,449 (2008 - $87,481) of our outstanding term debt is at fixed interest rates. At December 31, 2009, variable rate term debt of $3,740 (2008 - $24,046) carried a weighted average interest rate of 5.8% (2008 – 4.7%). We look at various factors to determine the percentage of debt to hold at fixed rates, including the interest rate spread between variable and fixed (swap rates), our view on interest rate trends, the percent of offset to variable rate debt through holding variable rate investments and our ability to manage with interest rate volatility and uncertainty. For every 1% increase (decrease) in interest rates our after tax earnings would increase (decrease) by approximately $24 (2008 – $147).
| SunOpta Inc. | 92 | December 31, 2009 – 10-K |
Opta Minerals entered into a cash flow hedge in 2007. At inception, the fair value of the cash flow hedge was determined to be a loss of $254 using mark-to-market valuations which required an immediate expense of the ineffective portion. The cash flow hedge entered into exchanged a notional amount of Cdn $17,200 (US -$16,365) from a floating rate to a fixed rate of 5.25% from August 2008 to August 2012. The fair value of the hedging derivative is estimated based on the standard swap valuation methodology. The estimated fair value of the interest rate swap at December 31, 2009 was a loss of $1,387 (2008 - $1,984), resulting in a $415 gain for the year, net of income taxes of $182 (2008 – loss of $1,084, net of an income tax recovery of $370).
Foreign currency risk
All of our U.S. subsidiaries use the U.S. dollar as their functional currency and the U.S. dollar is also our reporting currency. The functional currency of all our operations located in Canada is the Canadian dollar, except for SunOpta BioProcess and Opta Minerals, where the functional currency is the U.S. dollar. The functional currency of all operations located in Europe is the Euro except for Opta Minerals where the functional currency is the U.S. dollar. For these operations, all transaction gains or losses in relation to the U.S. dollar are recorded as foreign exchange gain (loss) in the consolidated statements of operations and comprehensive (loss) income while gains (losses) on translation of net assets to U.S. dollars on consolidation are recorded in Accumulated Other Comprehensive Income within Shareholders' Equity. The functional currency of the corporate head office is the U.S. dollar. For the Corporate office transaction gains or losses as well as translation gains and losses on monetary assets and liabilities are recorded within foreign exchange on the consolidated statements of operations and comprehensive earnings (loss).
We are exposed to foreign exchange rate fluctuations as the financial results of SunOpta and its Canadian and European subsidiaries are translated into U.S. dollars on consolidation. During 2009, the Canadian dollar appreciated significantly against the U.S. dollar with closing rates moving from Cdn $1.2180 at December 31, 2008 to Cdn $1.0510 at December 31, 2009 for each U.S. dollar. During 2009, the Euro also appreciated against the U.S. dollar with closing rates moving from $1.3951 at December 31, 2008 to $1.4316 at December 31, 2009 for each Euro. During 2009, we had a decrease of Cdn $12,623 (2008 – an increase of Cdn $14,718) in net Canadian assets and an increase of €332 (2008 - €3,305) in net Euro based assets. A 10% movement in the levels of foreign currency exchange rates in favour of (against) the Canadian dollar or Euro with all other variables held constant would result in an increase (decrease) in the fair value of our net assets by $8,553 (2008 - $8,679) for a Canadian dollar exchange movement and $2,134 (2008 - $2,060) for a Euro exchange movement.
U.S.-based SunOpta Foods operations have limited exposure to other currencies since almost all sales and purchases are made in U.S. dollars. The Canadian based subsidiaries have significant transaction exposure as their sales are predominantly in Canadian dollars while a substantial portion of their purchases are in U.S dollars. The European operations are also exposed to various currencies as they purchase product from a wide variety of countries in several currencies and primarily sell into the European market.
We enter into forward foreign exchange contracts to reduce our exposure to fluctuations in foreign currency exchange rates. Open forward foreign exchange contracts were marked-to-market at December 31, 2009 resulting in a gain of $392 (2008 – a loss of $2,534); which is included in foreign exchange on the consolidated statements of operations. The contracts entered into are primarily U.S. dollars and Euros. The net effect of all exchange based transactions including realized foreign exchange contracts, unrealized open contracts and all other foreign exchange transactions including the translation gains and losses related to our corporate net monetary assets are recorded in foreign exchange on our consolidated statements of operations. For the year ended December 31, 2009, we recorded a gain of $1,042 (2008 – $4,835).
Commodity risk
SunOpta Foods enters into exchange-traded commodity futures and options contracts to hedge its exposure to price fluctuations on grain transactions to the extent considered practicable for minimizing risk from market price fluctuations. Futures contracts used for hedging purposes are purchased and sold through regulated commodity exchanges. Inventories, however, may not be completely hedged, due in part to our assessment of its exposure from expected price fluctuations. Exchange purchase and sales contracts may expose us to risk in the event that a counter-party to a transaction is unable to fulfill its contractual obligation. We manage risk by entering into purchase contracts with pre-approved producers.
| SunOpta Inc. | 93 | December 31, 2009 – 10-K |
We have a risk of loss from hedge activity if a grower does not deliver the grain as scheduled. Sales contracts are entered into with organizations of acceptable creditworthiness, as internally evaluated. All futures transactions are marked to market as they do not qualify as hedges for accounting purposes. Gains and losses on futures transactions related to grain inventories are included in cost of goods sold. At December 31, 2009 we owned 425,282 (2008 – 195,219) bushels of corn with a weighted average price of $4.02 (2008 - $3.91) and 577,041 (2008 – 387,531) bushels of soy beans with a weighted average price of $10.83 (2008 - $11.28). At December 31, 2009, we had a net long position on soy beans of 20,834 (2008 – 28,465) and a net long/ (short) position on corn of 58,140 (2008 – (38,602)) bushels. An increase (decrease) in the commodity prices of either soy and corn of 10% would result in an increase/decrease in carrying value of these commodities by $46 (2008 - $17). There are no futures contracts in the other SunOpta Foods segments, Opta Minerals, SunOpta BioProcess or related to corporate office activities.
Item 8. Financial Statements and Supplementary Data
Financial statements are set forth on pages F-1 through F-62 of this Report and are incorporated herein by reference.
Item 9. Changes In and Disagreements with Accountants on Accounting and Financial Disclosure
None
Item 9A. Controls and Procedures
Evaluation of Disclosure Controls and Procedures
Our management has evaluated, under the supervision and with the participation of our Chief Executive Officer (CEO) and Chief Financial Officer (CFO), the effectiveness of our disclosure controls and procedures as defined in Rule 13a-15(e) and 15d-15(e) under the Securities Exchange Act of 1934 (the “Exchange Act”). Based on that evaluation, our CEO and CFO concluded that as of December 31, 2009 our disclosure controls and procedures were effective in ensuring that information required to be disclosed in our Exchange Act reports are recorded, processed, summarized and reported within the time periods specified in the SEC’s rules and forms, and accumulated and communicated to our management, including our CEO and CFO, as appropriate to allow timely decisions regarding required disclosure.
Management’s Annual Report on Internal Control over Financial Reporting
Our management is responsible for establishing and maintaining adequate internal control over financial reporting, as defined in Rule 13a-15(f) under the Exchange Act.
Under the supervision and with the participation of our management, we assessed the effectiveness of our internal control over financial reporting as of December 31, 2009. In making this assessment, we used the framework set forth in the Internal Control – Integrated Framework issued by the Committee of Sponsoring Organizations of the Treadway Commission. Based on our assessment, we determined that as of December 31, 2009, our internal control over financial reporting is effective.
The effectiveness of our internal control over financial reporting as of December 31, 2009 has been audited by Deloitte & Touche LLP, an independent registered public accounting firm that also audited the Company’s Consolidated Financial Statements for the year ended December 31, 2009, as stated in their report which appears herein.
Changes in Internal Control over Financial Reporting
There were no changes in our internal control over financial reporting in the fiscal quarter ended December 31, 2009 that materially affected, or are reasonably likely to materially affect, our internal control over financial reporting.
| SunOpta Inc. | 94 | December 31, 2009 – 10-K |
Report of Independent Registered Chartered Accountants
The Board of Directors and Shareholders of SunOpta Inc.:
We have audited the internal control over financial reporting of SunOpta Inc. and subsidiaries (the “Company”) as of December 31, 2009, based on criteria established in “Internal Control — Integrated Framework” issued by the Committee of Sponsoring Organizations of the Treadway Commission. The Company’s management is responsible for maintaining effective internal control over financial reporting and for its assessment of the effectiveness of internal control over financial reporting, included in the accompanying “Management’s Annual Report on Internal Control over Financial Reporting”. Our responsibility is to express an opinion on the Company’s internal control over financial reporting based on our audit.
We conducted our audit in accordance with the standards of the Public Company Accounting Oversight Board (United States). Those standards require that we plan and perform the audit to obtain reasonable assurance about whether effective internal control over financial reporting was maintained in all material respects. Our audit included obtaining an understanding of internal control over financial reporting, assessing the risk that a material weakness exists, testing and evaluating the design and operating effectiveness of internal control based on the assessed risk, and performing such other procedures as we considered necessary in the circumstances. We believe that our audit provides a reasonable basis for our opinion.
A company’s internal control over financial reporting is a process designed by, or under the supervision of, the company’s principal executive and principal financial officers, or persons performing similar functions, and effected by the company’s board of directors, management, and other personnel to provide reasonable assurance regarding the reliability of financial reporting and the preparation of financial statements for external purposes in accordance with generally accepted accounting principles. A company’s internal control over financial reporting includes those policies and procedures that (1) pertain to the maintenance of records that, in reasonable detail, accurately and fairly reflect the transactions and dispositions of the assets of the company; (2) provide reasonable assurance that transactions are recorded as necessary to permit preparation of financial statements in accordance with generally accepted accounting principles, and that receipts and expenditures of the company are being made only in accordance with authorizations of management and directors of the company; and (3) provide reasonable assurance regarding prevention or timely detection of unauthorized acquisition, use, or disposition of the company’s assets that could have a material effect on the financial statements.
Because of the inherent limitations of internal control over financial reporting, including the possibility of collusion or improper management override of controls, material misstatements due to error or fraud may not be prevented or detected on a timely basis. Also, projections of any evaluation of the effectiveness of internal control over financial reporting to future periods are subject to the risk that the controls may become inadequate because of changes in conditions, or that the degree of compliance with the policies or procedures may deteriorate.
In our opinion, the Company maintained, in all material respects, effective internal control over financial reporting as of December 31, 2009, based on criteria established in Internal Control —Integrated Framework issued by the Committee of Sponsoring Organizations of the Treadway Commission.
We also have audited, in accordance with the standards of the Public Company Accounting Oversight Board (United States), the consolidated financial statements as of and for the year ended December 31, 2009 of the Company and our report dated March 10, 2010 expressed an unqualified opinion on those financial statements.
“Deloitte & Touche LLP”
Independent Registered Chartered Accountants
Licensed
Public Accountants
Toronto, Canada
March 10, 2010
| SunOpta Inc. | 95 | December 31, 2009 – 10-K |
Item 9B. Other Information - None
Item 10. Directors, Executive Officers and Corporate Governance
| (a) | Directors |
The information with respect to directors required by this item is incorporated herein by reference to our definitive Proxy Statement for the Annual Meeting of Shareholders to be filed with the Securities and Exchange Commission not later than April 30, 2010 (the “2010 Proxy Statement”).
| (b) | Executive Officers |
The following table lists our executive officers and other significant officers as of December 31, 2009.
| Name Directors: |
Position with Company |
| Steven Bromley | Director, President and Chief Executive Officer, SunOpta Inc. |
| Allan Routh | Director, SunOpta Inc. and President of the SunOpta Grains and Foods Group |
| Tony Tavares | Vice President and Chief Operating Officer, SunOpta Inc. |
| Eric Davis | Vice President and Chief Financial Officer, SunOpta Inc. |
| John Dietrich | Vice President, Corporate Development |
Steven Bromley serves as President, Chief Executive Officer and a Director of SunOpta. Mr. Bromley joined SunOpta in June 2001 and has served in a number of key operating and financial roles since that time. Mr. Bromley served as Executive Vice President and Chief Financial Officer through September 2003 until his appointment as Chief Operating Officer. In addition to his role of Chief Operating Officer, Mr. Bromley was appointed President by the Board of Directors in January 2005 and subsequently as Director and Chief Executive Officer in February 2007. Prior to joining SunOpta, Mr. Bromley spent over 13 years in the Canadian dairy industry in a wide range of financial and operational roles with both Natrel Inc. and Ault Foods Limited. From 1977 to 1999 he served on the Board of Directors of Natrel, Inc. Mr. Bromley is a Director of all of our subsidiaries, and in July 2004, Mr. Bromley was elected to the Board of Directors of Opta Minerals (TSX: OPM). Mr. Bromley was appointed to the Board of Directors of SunOpta on January 26, 2007.
Allan Routh was elected to the Board of Directors in September 1999. Mr. Routh is President of our Grains and Foods Group and prior to March 2003 was President and Chief Executive Officer of the SunRich Food Group, Inc., a wholly-owned subsidiary of SunOpta. Mr. Routh has been involved in the soy industry and soy industry organizations since 1984. He is also a Director of other private companies. In the past 5 years, Mr. Routh has not served on any other reporting issuers’ Board of Directors.
Tony Tavares serves as Vice President and Chief Operating Officer of SunOpta. Mr. Tavares joined SunOpta in June 2008 and brings over 20 years of food industry experience to this role. Prior to joining SunOpta, Mr. Tavares was Chief Executive Officer of Maple Lodge Farms Inc., and has also held a number of senior positions in the Canadian food industry including President of Maple Leaf Poultry, a division of Maple Leaf Foods, and President of Tyson Canada. Mr. Tavares served on the Board of Directors of Opta Minerals Inc. (TSX: OPM) from June 2005 through June 2007. Mr. Tavares served on the Board of Directors of Opta Minerals Inc. from 2005 through June 2008.
Eric Davis serves as Vice President and Chief Financial Officer. Mr. Davis joined SunOpta in 2009 and brings over 25 years of diverse finance and accounting experience to this role. Prior to joining Sunopta, Mr. Davis was Chief Executive Officer for Grant Forest Products and has also held the Chief Financial Officer position with Johnson Electric Holdings, Ltd., and within The Coco Cola Company, as well as in the Asian-Pacific market. Mr. Davis has not served on any other reporting issuers’ Board of Directors.
| SunOpta Inc. | 96 | December 31, 2009 – 10-K |
John Dietrich serves as Vice President of Corporate Development of SunOpta. Mr. Dietrich joined SunOpta in 2002 as Vice President and Treasurer and served in this role until his appointment as Vice President and Chief Financial Officer in September 2003. Mr. Dietrich transitioned to his current role in April 2009. From January 1995 until September 2001, Mr. Dietrich held finance roles at Natrel, Inc. as Director of Business Development, Paragaon Trade Brands (Canada) Inc. as Director of Finance and VP of Finance at Bridge2market Inc. Mr. Dietrich is a Chartered Accountant and Chartered Financial Analyst. Mr. Dietrich has not served on any other reporting issuer’s Board of Directors.
Item 11. Executive Compensation
The information required under this item is incorporated herein by reference from the 2009 Proxy Statement.
Item 12. Security Ownership of Certain Beneficial Owners and Management and Related Stockholder Matters.
Information setting forth the security ownership of certain beneficial owners and managers is incorporated herein by reference from the 2009 Proxy Statement.
Information regarding our equity compensation plans is included in Item 5 of this report.
Item 13. Certain Relationships and Related Transactions, Director Independence
The information required under this item is incorporated herein by reference from the 2009 Proxy Statement.
Item 14. Principal Accountant Fees and Services
The information required under this item is incorporated herein by reference from the 2009 Proxy Statement.
Item 15. Exhibits and Financial Statement Schedules.
| SunOpta Inc. | 97 | December 31, 2009 – 10-K |
Exhibits
| 3.1 |
Amalgamation of Stake Technology Ltd. and 3754481 Canada Ltd. (formerly George F. Pettinos (Canada) Limited) (incorporated herein by reference to the Company’s Form 10-KSB for the year ended December 31, 2000). |
| 3.2 |
Certificate of Amendment dated October 31, 2003 to change the Company’s name from Stake Technology Ltd. to SunOpta Inc. (incorporated by reference to the Company’s Form 10-K for the year ended December 31, 2003). |
| 3.3 |
Articles of Amalgamation of SunOpta Inc. and Sunrich Valley Inc., Integrated Drying Systems Inc., Kettle Valley Dried Fruits Ltd., Pro Organics Marketing Inc., Pro Organics Marketing (East) Inc., 4157648 Canada Inc. and 4198000 Canada Ltd. dated January 1, 2004 (incorporated by reference to the Company’s Form 10- K for the year ended December 31, 2003). |
| 3.4 |
Articles of Amalgamation of SunOpta Inc. and 6319734 Canada Inc., 4157656 Canada Inc. Kofman-Barenholtz Foods Limited dated January 1, 2005 (incorporated herein by reference to the Company’s Form 10-K for the year ended December 31, 2004). |
| 3.5 |
Articles of Amalgamation of SunOpta Inc. and 4307623 Canada Inc., dated January 1, 2006 (incorporated herein by reference to the Company’s Form 10-K for the year ended December 31, 2005). |
| 3.6 |
Articles of Amalgamation of SunOpta Inc. and 4208862 SunOpta Food Ingredients Canada Ltd., 4406150 Canada Inc. and 4406168 Canada Inc. dated January 1, 2007 (incorporated herein by reference to the Company’s Form 10-K for the year ended December 31, 2007). |
| 3.7 |
Articles of Amalgamation of SunOpta Inc. and 4460596 Canada Inc. Dated January 1, 2008 (incorporated herein by reference to the Company’s Form 10-K for the year ended December 31, 2007). |
| 3.8 |
Bylaw No. 14 approved by shareholders – June 17, 1997 (incorporated herein by reference to the Company’s Form 10-KSB for the year ended December 31 1997). |
| 10.1 |
2002 Stock Option Plan dated March 26, 2002, as amended and restated April 2007 (incorporated by reference to Form S-8 filed on July 24, 2007). |
| 10.2 |
Employee Stock Purchase Plan dated March (incorporated by reference to the Company report on Form S-8 filed on September 1, 2009). |
| 10.3 |
Employment Agreement dated October 1, 2001 between the Company and Mr. Jeremy Kendall, as amended pursuant to the Addendum to Employment Agreement dated June 9, 2009 (incorporated by reference to the Company’s Form 10-K / A No. 3 for the year ended December 31, 2002 and Exhibit 10.1 to Form 8- K filed on June 12, 2009, respectively). |
| 10.4 |
Employment Agreement dated February 1, 2007 between the Company and Mr. Steven Bromley (incorporated by reference to the Company’s Form 10-K for the year ended December 31, 2007). |
| 10.5 |
Employment Agreement effective March 16, 2009 between the Company and Mr. Eric Davis (incorporated by reference to Exhibit 10.2 to the Company’s Form 10-Q for the quarter ended March 31, 2009). |
| SunOpta Inc. | 98 | December 31, 2009 – 10-K |
| 10.6 | Asset Purchase Agreement, dated June 7, 2007 by and between SunOpta BioProcess and SunOpta, Inc. (incorporated by reference to the Company’s Current Report on Form 8-K filed on June 7, 2007). |
| 10.7 | Securities Purchase Agreement, dated June 7, 2007 by and between SunOpta BioProcess, SunOpta, Inc., and purchaser listed thereto (incorporated by reference to the Company’s Current Report on Form 8-K filed on June 7, 2007). |
| 10.8 | Fifth Amended and Restated Credit Agreement dated October 30, 2009 among SunOpta Inc. (the “Company”), Bank of Montreal as Agent and other Lenders within the lending group (incorporated by reference to the Company’s Current Report on Form 8-K, filed on November 3, 2009). |
| 21 | |
| 23.1 | Consent of PricewaterhouseCoopers LLP, Chartered Accountants. ** |
| 23.2 | |
| 24.1 | |
| 31.1 | |
| 31.2 | |
| 32 |
| ** | Filed herewith |
Pursuant to the requirements of Section 13 or 15(d) of the Securities Exchange Act of 1934, the registrant has duly caused this report to be signed on its behalf by the undersigned, thereunto duly authorized.
SUNOPTA INC.
/s/ ERIC DAVIS
Eric Davis
Vice President and Chief Financial
Officer
Date: March 10, 2010
| SunOpta Inc. | 99 | December 31, 2009 – 10-K |
KNOW ALL PERSONS BY THESE PRESENTS, that each of the undersigned hereby constitutes and appoints, jointly and severally, Steven R. Bromley and Eric Davis, and each of them, as the true and lawful attorney or attorneys-in-fact, with full power of substitution and resubstitution, for each of the undersigned and in the name, place and stead of each of the undersigned, to sign on behalf of each of the undersigned any and all amendments to this Annual Report on Form 10-K for the fiscal year ended December 31, 2009, and to file the same, with all exhibits thereto, and other documents in connection therewith with the Securities and Exchange Commission, granting to said attorney or attorneys-in-fact, and each of them, full power and authority to do so and perform each and every act and thing requisite and necessary to be done in and about the premises, as fully to all intents and purposes as the undersigned might or could do in person, hereby ratifying and confirming all that said attorney or attorneys-in-fact or any of them or their substitute or substitutes, may lawfully do or cause to be done by virtue hereof.
Pursuant to the requirements of the Securities Exchange Act of 1934, this report has been signed below by the following persons on behalf of the registrant and in the capacities and on the dates indicated.
| Signature | Title | Date |
| /s/ Jeremy N.
Kendall Jeremy N. Kendall |
Chairman and Director |
March 10, 2010 |
| /s/ Steven R.
Bromley Steven R. Bromley |
President, Chief Executive Officer and
Director, (Principal Executive Officer) |
March 10, 2010 |
| /s/ Eric Davis
Eric Davis |
Vice President and Chief Financial Officer |
March 10, 2010 |
| /s/ Cyril A.
Ing Cyril A. Ing |
Director |
March 10, 2010 |
| /s/ Allan Routh
Allan Routh |
Director |
March 10, 2010 |
| /s/ Katrina
Houde Katrina Houde |
Director |
March 10, 2010 |
| /s/ Douglas
Greene Douglas Greene |
Director |
March 10, 2010 |
| /s/ Victor
Hepburn Victor Hepburn |
Director |
March 10, 2010 |
| /s/ Jay Amato
Jay Amato |
Director |
March 10, 2010
|
| SunOpta Inc. |
100 |
December 31, 2009 – 10-K |
SunOpta Inc.
Consolidated Financial Statements
For the years ended December 31, 2009, 2008 and
2007
(expressed in thousands of U.S. dollars)
- F1 -
Report of Independent Registered Chartered Accountants
The Board of Directors and Shareholders of
SunOpta Inc.:
We have audited the accompanying consolidated balance sheets of SunOpta Inc. and subsidiaries (the “Company”) as of December 31, 2009 and 2008, and the related consolidated statements of operations, comprehensive earnings (loss), shareholders’ equity, and cash flows for each of the two years in the period ended December 31, 2009. These financial statements are the responsibility of the Company’s management. Our responsibility is to express an opinion on the financial statements based on our audits. The consolidated financial statements of the Company for the year ended December 31, 2007, before the effects of the retrospective adjustments to the disclosures for a change in the composition of reportable segments discussed in Note 17 to the consolidated financial statements, and before the effects of the retrospective changes to the consolidated financial statements on the adoption of ASC Topic 810-10-65, Consolidations, regarding the non-controlling interests (formerly Statement of Financial Accounting Standards No. 160, “Non-controlling interest in Consolidated Financial Statements”), as discussed in Note 1 to the consolidated financial statements, were audited by other auditors whose report, dated July 17, 2008, expressed an unqualified opinion on those statements.
We conducted our audits in accordance with the standards of the Public Company Accounting Oversight Board (United States). Those standards require that we plan and perform the audit to obtain reasonable assurance about whether the financial statements are free of material misstatement. An audit includes examining, on a test basis, evidence supporting the amounts and disclosures in the financial statements. An audit also includes assessing the accounting principles used and significant estimates made by management, as well as evaluating the overall financial statement presentation. We believe that our audits provide a reasonable basis for our opinion.
In our opinion, such 2009 and 2008 consolidated financial statements present fairly, in all material respects, the financial position of SunOpta Inc. and subsidiaries as of December 31, 2009 and 2008, and the results of their operations and their cash flows for each of the two years in the period ended December 31, 2009, in conformity with accounting principles generally accepted in the United States of America.
We also have audited the adjustments to the 2007 consolidated financial statements to retrospectively adjust the disclosures for (1) a change in the composition of reportable segments in 2008, as discussed in Note 17 to the consolidated financial statements, and (2) a change on January 1, 2009 on the adoption of ASC Topic 810-10-65, Consolidations, regarding the non-controlling interests (formerly Statement of Financial Accounting Standards No. 160, “Non-controlling interest in Consolidated Financial Statements”), as discussed in Note 1 to the consolidated financial statements. With respect to the change in the composition of the reportable segments, our procedures included: comparing the adjustment amounts of segment revenues, earnings (loss), identifiable assets, amortization, goodwill, and expenditures on property, plant and equipment to the Company's underlying analysis and also testing the mathematical accuracy of the reconciliations of segment amounts to the consolidated financial statements. With respect to the adoption of ASC Topic 810-10-65, our procedures included: comparing the amount previously classified as minority interest to the amount classified as (loss) earnings for the year attributable to non-controlling interests in the statements of operations and comprehensive earnings (loss), comparing the changes in non-controlling interest disclosed in the consolidated statement of shareholders’ equity to the Company’s underlying analysis, and testing the mathematical accuracy of the underlying amounts. In our opinion, such retrospective adjustments are appropriate and have been properly applied. However, we were not engaged to audit, review, or apply any procedures to the 2007 consolidated financial statements of the Company other than with respect to the retrospective adjustments and, accordingly, we do not express an opinion or any other form of assurance on the 2007 consolidated financial statements taken as a whole.
We have also audited, in accordance with the standards of the Public Company Accounting Oversight Board (United States), the Company’s internal control over financial reporting as of December 31, 2009, based on the criteria established in Internal Control - Integrated Framework issued by the Committee of Sponsoring Organizations of the Treadway Commission and our report dated March 10, 2010 expressed an unqualified opinion on the Company’s internal control over financial reporting.
“Deloitte & Touche LLP”
Independent
Registered Chartered Accountants
Licensed Public Accountants
Toronto,
Canada
March 10, 2010
- F2 -
Report of Independent Registered Public Accounting Firm
To the Board of Directors and Shareholders
SunOpta Inc.:
In our opinion, the consolidated statements of operations, comprehensive earnings (loss), shareholders’ equity and cash flows for the year ended December 31, 2007, before the effects of the adjustments to retrospectively reflect the change in the composition of reportable segments as described in Note 17, and the adoption of ASC 820-10-65, “Consolidations” as described in Note 1, present fairly, in all material respects, the results of operations of SunOpta Inc and its cash flows for the year ended December 31, 2007, in conformity with accounting principles generally accepted in the United States of America (the 2007 financial statements before the effects of the adjustments discussed in Notes 1 and 17 are not presented herein). These financial statements are the responsibility of the Company's management. Our responsibility is to express an opinion on these financial statements based on our audit. We conducted our audit, before the effects of the adjustments described above, of these statements in accordance with the standards of the Public Company Accounting Oversight Board (United States). Those standards require that we plan and perform the audit to obtain reasonable assurance about whether the financial statements are free of material misstatement. An audit includes examining, on a test basis, evidence supporting the amounts and disclosures in the financial statements, assessing the accounting principles used and significant estimates made by management, and evaluating the overall financial statement presentation. We believe that our audit provides a reasonable basis for our opinion.
We were not engaged to audit, review, or apply any procedures to the adjustments to retrospectively reflect the change in the composition of reportable segments as described in Note 17 and the adoption of ASC 820-10-65 as described in Note 1 and accordingly, we do not express an opinion or any other form of assurance about whether such adjustments are appropriate and have been properly applied. Those adjustments were audited by other auditors.
/s/PricewaterhouseCoopers LLP
Chartered Accountants,
Licensed Public Accountants
Toronto, Canada
July 17, 2008
- F3 -
| SunOpta Inc. |
| Consolidated Statements of Operations |
| For the years ended December 31, 2009, 2008 and 2007 |
| (Expressed in thousands of U.S. dollars, except per share amounts) |
| 2009 | 2008 | 2007 | |||||||
| $ | $ | $ | |||||||
| Revenues | 989,132 | 1,055,173 | 802,494 | ||||||
| Cost of goods sold | 840,262 | 899,078 | 676,360 | ||||||
| Gross profit | 148,870 | 156,095 | 126,134 | ||||||
| Warehousing and distribution expenses | 18,856 | 21,040 | 20,899 | ||||||
| Selling, general and administrative expenses | 111,475 | 117,808 | 95,911 | ||||||
| Intangible asset amortization | 5,677 | 5,879 | 4,201 | ||||||
| Other expenses, net (note 18) | 2,587 | 1,003 | 1,187 | ||||||
| Goodwill impairment (note 6) | 8,841 | 10,154 | 996 | ||||||
| Foreign exchange gain | (1,042 | ) | (4,835 | ) | (539 | ) | |||
| Earnings before the following | 2,476 | 5,046 | 3,479 | ||||||
| Dilution gain (note 20) | - | - | 693 | ||||||
| Interest expense, net (note 9) | 14,028 | 14,281 | 8,823 | ||||||
| Loss before income taxes | (11,552 | ) | (9,235 | ) | (4,651 | ) | |||
| (Recovery of) provision for income taxes (note 13) | (1,762 | ) | 790 | (6,101 | ) | ||||
| (Loss) earnings for the year | (9,790 | ) | (10,025 | ) | 1,450 | ||||
| (Loss) earnings for the year attributable to non-controlling interests | (3,027 | ) | 911 | 1,043 | |||||
| (Loss) earnings for the year attributable to SunOpta Inc. | (6,763 | ) | (10,936 | ) | 407 | ||||
| (Loss) earnings per share (note 12) | |||||||||
| Basic | (0.10 | ) | (0.17 | ) | 0.01 | ||||
| Diluted | (0.10 | ) | (0.17 | ) | 0.01 |
(See accompanying notes to consolidated financial statements.)
- F4 -
| SunOpta Inc. |
| Consolidated Statements of Comprehensive Earnings (Loss) |
| For the years ended December 31, 2009, 2008 and 2007 |
| (Expressed in thousands of U.S. dollars, except per share amounts) |
|
|
December 31, | December 31, | December 31, | ||||||
|
|
2009 | 2008 | 2007 | ||||||
|
|
$ | $ | $ | ||||||
|
|
|||||||||
|
|
|||||||||
|
(Loss) earnings for the year |
(9,790 | ) | (10,025 | ) | 1,450 | ||||
|
|
|||||||||
|
Currency translation adjustment |
10,615 | (17,767 | ) | 12,044 | |||||
|
Change in fair value of interest rate swap, net of tax |
276 | (1,084 | ) | (285 | ) | ||||
|
Adjustments due to pensions |
(78 | ) | (501 | ) | - | ||||
|
|
|||||||||
|
Other comprehensive earnings (loss) for the year, net of tax |
10,813 | (19,352 | ) | 11,759 | |||||
|
|
|||||||||
|
Comprehensive earnings (loss) for the year |
1,023 | (29,377 | ) | 13,209 | |||||
|
|
|||||||||
|
Comprehensive (loss) earnings for the year attributable to non- controlling interest |
(3,027 | ) | 911 | 1,043 | |||||
|
|
|||||||||
|
Comprehensive earnings (loss) for the year attributable to SunOpta Inc. |
4,050 | (30,288 | ) | 12,166 |
(See accompanying notes to condensed consolidated financial statements)
- F5 -
| SunOpta Inc. |
| Consolidated Balance Sheets |
| As at December 31, 2009 and 2008 |
| (Expressed in thousands of U.S. dollars) |
| 2009 | 2008 | |||||
| $ | $ | |||||
| Assets (note 9) | ||||||
| Current assets | ||||||
| Cash and cash equivalents (note 21) | 20,723 | 24,755 | ||||
| Accounts receivable (note 3) | 94,241 | 95,129 | ||||
| Inventories (note 4) | 178,140 | 200,689 | ||||
| Prepaid expenses and other current assets | 10,813 | 14,448 | ||||
| Current income taxes recoverable | 442 | 595 | ||||
| Deferred income taxes (note 13) | 5,457 | 493 | ||||
| 309,816 | 336,109 | |||||
| Property, plant and equipment (note 5) | 113,245 | 110,641 | ||||
| Goodwill (note 6) | 49,717 | 54,022 | ||||
| Intangible assets (note 6) | 60,902 | 63,161 | ||||
| Deferred income taxes (note 13) | 14,734 | 16,160 | ||||
| Other assets | 2,876 | 954 | ||||
| 551,290 | 581,047 | |||||
| Liabilities | ||||||
| Current liabilities | ||||||
| Bank indebtedness (note 8) | 63,481 | 67,164 | ||||
| Accounts payable and accrued liabilities (note 7) | 106,253 | 106,989 | ||||
| Customer and other deposits | 1,436 | 1,228 | ||||
| Other current liabilities | 1,566 | 4,437 | ||||
| Current portion of long-term debt (note 9) | 52,455 | 12,174 | ||||
| Current portion of long-term liabilities | 712 | 1,362 | ||||
| 225,903 | 193,354 | |||||
| Long-term debt (note 9) | 34,734 | 99,353 | ||||
| Long-term liabilities | 3,247 | 5,017 | ||||
| Deferred income taxes (note 13) | 12,708 | 13,614 | ||||
| 276,592 | 311,338 | |||||
| Preferred shares of subsidiary company (note 10) | 28,187 | 27,796 | ||||
| Equity | ||||||
| SunOpta’s shareholder’s equity | ||||||
| Capital stock (note 11) | 178,694 | 177,858 | ||||
| 64,982,968 common shares (December 31, 2008 – 64,493,320) | ||||||
| Additional paid in capital | 7,934 | 6,778 | ||||
| Retained earnings | 34,146 | 40,909 | ||||
| Accumulated other comprehensive income | 12,079 | 1,266 | ||||
| 232,853 | 226,811 | |||||
| Non-controlling interest | 13,658 | 15,102 | ||||
| 246,511 | 241,913 | |||||
| Total equity | 551,290 | 581,047 | ||||
| Commitments and contingencies (note 16) |
(See accompanying notes to consolidated financial statements.)
- F6 -
| SunOpta Inc. |
| Consolidated Statements of Shareholders’ Equity |
| As at and for the years ended December 31, 2009, 2008 and 2007 |
| (Expressed in thousands of U.S. dollars) |
|
|
Accumulated | Non- | ||||||||||||||||
|
|
Additional | other | controlling | |||||||||||||||
|
|
Capital | paid in | Retained | comprehensive | interest | |||||||||||||
|
|
stock | capital | earnings | income | (note 1 | ) | Total | |||||||||||
|
|
$ | $ | $ | $ | $ | $ | ||||||||||||
|
|
||||||||||||||||||
|
Balance at December 31, 2006 |
112,318 | 4,188 | 51,338 | 8,859 | 10,230 | 186,933 | ||||||||||||
|
|
||||||||||||||||||
|
Warrants issued and exercised |
8,263 | - | - | - | - | 8,263 | ||||||||||||
|
Options exercised |
3,201 | - | - | - | - | 3,201 | ||||||||||||
|
Employee stock purchase plan and compensation grants |
883 | - | - | - | - | 883 | ||||||||||||
|
Equity offering (note 11(d)) |
51,882 | - | - | - | - | 51,882 | ||||||||||||
|
Stock-based compensation, including tax benefit of $912 |
- | 1,779 | - | - | - | 1,779 | ||||||||||||
|
Adoption of new accounting policy (note 13) |
- | - | 100 | - | - | 100 | ||||||||||||
|
Earnings for the year |
- | - | 407 | - | 1,043 | 1,450 | ||||||||||||
|
Subsidiary equity issued (note 20) |
- | - | - | - | 2,590 | 2,590 | ||||||||||||
|
Currency translation adjustment |
- | - | - | 12,044 | - | 12,044 | ||||||||||||
|
Change in fair value of interest rate swap, net of income tax of $184 |
- | - | - | (285 | ) | - | (285 | ) | ||||||||||
|
|
||||||||||||||||||
|
Balance at December 31, 2007 |
176,547 | 5,967 | 51,845 | 20,618 | 13,863 | 268,840 | ||||||||||||
|
|
||||||||||||||||||
|
Options exercised |
559 | (295 | ) | - | - | - | 264 | |||||||||||
|
Employee stock purchase plan and compensation grants |
752 | - | - | - | - | 752 | ||||||||||||
|
Stock-based compensation, including tax benefit of $23 |
- | 1,106 | - | - | - | 1,106 | ||||||||||||
|
(Loss) for the year |
- | - | (10,936 | ) | - | 911 | (10,025 | ) | ||||||||||
|
Currency translation adjustment |
- | - | - | (17,767 | ) | - | (17,767 | ) | ||||||||||
|
Non-controlling interest contributions |
- | - | - | - | 328 | 328 | ||||||||||||
|
Change in fair value of interest rate swap, net of income tax of $370 |
- | - | - | (1,084 | ) | - | (1,084 | ) | ||||||||||
|
Adjustments due to pensions |
- | - | - | (501 | ) | - | (501 | ) | ||||||||||
|
|
||||||||||||||||||
|
Balance at December 31, 2008 |
177,858 | 6,778 | 40,909 | 1,266 | 15,102 | 241,913 | ||||||||||||
|
|
||||||||||||||||||
|
Employee stock purchase plan and compensation grants |
836 | - | - | - | - | 836 | ||||||||||||
|
Stock-based compensation, including tax benefit of $6 |
- | 1,435 | - | - | - | 1,435 | ||||||||||||
|
Equity transaction (note 2) |
- | (279 | ) | - | - | 279 | - | |||||||||||
|
Loss for the year |
- | - | (6,763 | ) | - | (3,027 | ) | (9,790 | ) | |||||||||
|
Currency translation adjustment |
- | - | - | 10,615 | (173 | ) | 10,442 | |||||||||||
|
Non-controlling interest contributions |
- | - | - | - | 1,338 | 1,338 | ||||||||||||
|
Change in fair value of interest rate swap, net of income tax of $182 |
- | - | - | 276 | 139 | 415 | ||||||||||||
|
Adjustments due to pensions |
- | - | - | (78 | ) | - | (78 | ) | ||||||||||
|
|
||||||||||||||||||
|
Balance at December 31, 2009 |
178,694 | 7,934 | 34,146 | 12,079 | 13,658 | 246,511 |
(See accompanying notes to consolidated financial statements.)
- F7 -
| SunOpta Inc. |
| Consolidated Statements of Cash Flows |
| For the years ended December 31, 2009, 2008 and 2007 |
| (Expressed in thousands of U.S. dollars) |
| 2009 | 2008 | 2007 | |||||||
| $ | $ | $ | |||||||
| Cash provided by (used in) Operating activities | |||||||||
| (Loss) earnings for the year | (9,790 | ) | (10,025 | ) | 1,450 | ||||
| Items not affecting cash | |||||||||
| Amortization | 19,370 | 19,364 | 15,058 | ||||||
| Goodwill impairment (note 6) | 8,841 | 10,154 | 996 | ||||||
| Impairment of property, plant and equipment (note 18) | 2,149 | - | 1,005 | ||||||
| Unrealized gain on foreign exchange | (1,022 | ) | (1,702 | ) | - | ||||
| Stock-based compensation | 1,435 | 1,106 | 867 | ||||||
| Non-cash interest accretion | 1,266 | 1,009 | 217 | ||||||
| (Gain) loss on disposal of property, plant and equipment | (302 | ) | (417 | ) | 663 | ||||
| Deferred income taxes | (3,030 | ) | (1,116 | ) | (8,752 | ) | |||
| Write-off of legal receivable | - | - | 501 | ||||||
| Dilution gain (note 20) | - | - | (693 | ) | |||||
| Other | (1,325 | ) | 1,943 | 998 | |||||
|
Changes in non-cash working capital, net of businesses acquired (note 14) |
27,296 | 13,369 | (47,387 | ) | |||||
| 44,888 | 33,685 | (35,077 | ) | ||||||
| Investing activities | |||||||||
| Acquisition of businesses, net of cash acquired (note 2) | - | (5,267 | ) | (21,319 | ) | ||||
| Purchases of property, plant and equipment | (13,237 | ) | (9,650 | ) | (29,686 | ) | |||
| Proceeds from sale of long-lived assets | 1,076 | 2,005 | 65 | ||||||
| Payment of deferred purchase consideration | (1,856 | ) | (2,042 | ) | (2,156 | ) | |||
| Purchase of patents, trademarks and other intangible assets | (374 | ) | (673 | ) | (1,805 | ) | |||
| Increase in other assets | - | - | (1,076 | ) | |||||
| Other | 259 | (105 | ) | (282 | ) | ||||
| (14,132 | ) | (15,732 | ) | (56,259 | ) | ||||
| Financing activities | |||||||||
| (Decrease) increase in line of credit facilities | (5,644 | ) | (24,584 | ) | 18,011 | ||||
| Proceeds from issuance of preferred shares by subsidiary (note 10) | - | - | 27,954 | ||||||
| Borrowings under long-term debt | 719 | 15,655 | 33,216 | ||||||
| Repayment of long-term debt | (29,438 | ) | (15,322 | ) | (21,127 | ) | |||
| Proceeds from issuance of common shares, net of issuance costs | 836 | 1,016 | 54,989 | ||||||
| Deferred financing costs | (2,198 | ) | - | (459 | ) | ||||
| Proceeds from exercise of warrants | - | - | 7,501 | ||||||
| Other | (14 | ) | 337 | 102 | |||||
| (35,739 | ) | (22,898 | ) | 120,187 | |||||
| Foreign exchange gain (loss) on cash held in foreign currency | 951 | (602 | ) | 497 | |||||
| (Decrease) increase in cash and cash equivalents during the year | (4,032 | ) | (5,547 | ) | 29,348 | ||||
| Cash and cash equivalents - beginning of year | 24,755 | 30,302 | 954 | ||||||
| Cash and cash equivalents - end of year | 20,723 | 24,755 | 30,302 |
Supplemental cash flow information (notes 14 and 21)
(See accompanying notes to consolidated financial statements.)
- F8 -
| SunOpta Inc. |
| Notes to Consolidated Financial Statements |
| For the years ended December 31, 2009, 2008 and 2007 |
| (Expressed in thousands of U.S. dollars, except per share amounts) |
1. Description of business and significant accounting policies
SunOpta Inc. (the “Company” or “SunOpta”) was incorporated under the laws of Canada on November 13, 1973. The Company operates businesses focused on a healthy products portfolio that promotes the health and well-being of its communities combined with environmental responsibility. The Company has three industry groups divided into eight operating segments, the largest being SunOpta Foods, accounting for approximately 93.6% of 2009 consolidated revenues. SunOpta Foods operates in the natural, organic, kosher and specialty foods and natural health product sectors via its operations throughout North America, which utilize a number of vertically integrated business models to bring cost-effective and quality products to market. In addition to SunOpta Foods, the Company owns approximately 66.4% of Opta Minerals Inc. (“Opta Minerals”). Opta Minerals, representing approximately 6.3% of consolidated revenues, is a vertically integrated provider of customer process solutions and industrial minerals products for use primarily in the steel, foundry, loose abrasive cleaning, roof shingle granule and water filtration industries. SunOpta BioProcess Group (“SunOpta BioProcess”), representing less than 0.1% of 2009 consolidated revenues, provides equipment and process solutions for the biomass conversion industry, from process development and design through the sale of proprietary biomass processing technology and the planned investment in cellulosic ethanol production. The Company’s assets, operations and employees as at December 31, 2009 are primarily located in the United States, Canada and Europe.
Basis of presentation
These consolidated financial statements have been prepared in accordance with accounting principles generally accepted in the United States of America. The consolidated financial statements include the accounts of the Company and its subsidiaries, all of which are wholly owned except for Opta Minerals, which is 66.4% owned (2008 – 66.5%). All significant intercompany accounts and transactions have been eliminated on consolidation.
The investment in Opta Minerals is controlled and therefore is consolidated. The non-controlling interest on the consolidated balance sheets and consolidated statements of operations and comprehensive earnings (loss) includes the non-controlling shareholders’ interest in Opta Minerals.
SunOpta BioProcess is a wholly owned subsidiary and is consolidated with the results of the Company. On June 7, 2007, SunOpta BioProcess completed a private placement preferred share issuance for gross proceeds of $30,000, and the Company transferred certain net assets to SunOpta BioProcess, which commenced operations on that date. See note 10 for additional information on SunOpta BioProcess’s preferred share issuance.
Variable interest entities
The Company consolidates investments that are variable in nature for which the Company is determined to be the primary beneficiary, under ASC Topic 810 (formerly FIN 46(R)). The Company consolidates as the primary beneficiary when it has been determined to create or absorb variability due to ownership and operational considerations regarding the investment in the variable interest entity.
Cash and cash equivalents
Cash and cash equivalents consist of cash and short-term deposits with an original maturity of 90 days or less. Certain cash and cash equivalents can only be used by subsidiaries and are consolidated for financial reporting purposes due to the Company’s ownership (see note 21).
Inventories
Raw materials inventory is valued at the lower of cost and replacement value. Finished goods (excluding commodity grains) are valued at the lower of cost and market (net realizable value). Cost is principally determined on a weighted average cost basis. Shipping and handling costs are included in cost of sales on the consolidated statements of operations and comprehensive earnings (loss).
- F9 -
| SunOpta Inc. |
| Notes to Consolidated Financial Statements |
| For the years ended December 31, 2009, 2008 and 2007 |
| (Expressed in thousands of U.S. dollars, except per share amounts) |
1. Description of business and significant accounting policies continued
Inventories of commodity grains, which includes amounts acquired under deferred pricing contracts traded on the Chicago Board of Trade (“CBoT”) are valued at net realizable value. Grain inventory quantities at year-end are multiplied by the quoted price on the CBoT to reflect the market value of the inventory. This market value is then adjusted for a basis factor which represents costs from the seller / buyer for freight, interest and other disposal costs to arrive at net realizable value. Changes in CBoT prices or the disposal costs are included in cost of goods sold on the consolidated statements of operations and comprehensive earnings (loss). The Company also has other grain inventories consisting of sunflowers and certain specialty and organic soybeans, which are valued at the lower of cost and estimated net realizable value.
SunOpta Foods economically hedges its commodity grain positions to protect gains and minimize losses due to market fluctuations. Futures contracts and purchase and sale contracts are adjusted to market price and resulting gains and losses from these transactions are included in cost of goods sold. The Company has a risk of loss from hedge activity if the grower does not deliver the grain as scheduled. These transactions do not qualify as hedges under accounting principles generally accepted in the United States of America and therefore changes in market value are recorded in the consolidated statements of operations.
Prepaid expenses and other current assets
Prepaid expenses and other current assets include amounts paid in cash and recorded by the Company as a current asset prior to consumption.
Property, plant and equipment
Property, plant and equipment are stated at cost, less accumulated amortization. Amortization is provided using the straight-line basis at rates reflecting the estimated useful lives of the assets.
| Buildings | 20 – 40 years |
| Machinery and equipment | 10 – 20 years |
| Enterprise software | 5 years |
| Office furniture and equipment | 3 – 7 years |
| Vehicles | 5 years |
Goodwill
Goodwill represents the excess of the purchase price over the assigned value of net assets acquired. Goodwill is not amortized but is instead tested for impairment annually, or more frequently if events or changes in circumstances indicate that the carrying amount may not be recoverable. The impairment test is performed annually during the fourth quarter unless events or circumstances change between the annual impairment tests that would indicate the carrying amount of goodwill is impaired. If events or circumstances change, the goodwill impairment is performed between the annual impairment tests. Impairment is tested at the reporting unit level by comparing the reporting unit’s carrying amount to its fair value. If the carrying value exceeds the reporting unit’s fair value, there is a potential impairment in goodwill. Any impairment in goodwill is measured by allocating the fair value of the reporting unit in a manner similar to a purchase price allocation and comparing the notional goodwill from the fair value allocation to the carrying value of the goodwill.
- F10 -
| SunOpta Inc. |
| Notes to Consolidated Financial Statements |
| For the years ended December 31, 2009, 2008 and 2007 |
| (Expressed in thousands of U.S. dollars, except per share amounts) |
1. Description of business and significant accounting policies continued
Intangible assets
The Company’s finite-life intangible assets consist of customer and other relationships, patents and trademarks and other intangible assets. These intangible assets are amortized on a straight-line basis over their estimated useful lives as follows:
| Customer and other relationships | 2 – 23 years |
| Patents and trademarks | 8 – 20 years |
| Other | 4 – 15 years |
Long-lived assets
The Company reviews its long-lived assets for impairment whenever events or changes in circumstances indicate that the carrying amounts of the assets may not be recoverable through undiscounted future cash flows. If impairment exists based on expected future undiscounted cash flows, a loss is recognized in income. The amount of the impairment loss is the excess of the carrying amount of the impaired asset over the fair value of the asset.
Other assets
Costs incurred in connection with obtaining financing are deferred and amortized over the term of the financing agreement, using the effective interest rate method.
Revenue recognition
The Company recognizes revenue at the time of delivery of the product or service and when all of the following have occurred: a sales agreement is in place, the price is fixed or determinable, and collection is reasonably assured. Details of specific recognition by industry group are as follows:
(a) SunOpta Foods
Grain revenues are recorded when title and possession of the product is transferred to the customer. Possession is transferred to the customer at the time of shipment from the Company’s facility or at the time of delivery to a specified destination depending on the terms of the sale. All other SunOpta Foods revenues are recognized when title is transferred upon the shipment of product or at the time the service is provided to the customer. Consideration given to customers such as value incentives, rebates, early payment discounts and other discounts are recorded as reductions to revenues at the time of sale.
(b) Opta Minerals
Revenues from the sale of silica-free loose abrasives, industrial minerals, specialty sands and related products are recognized upon the shipment to the customer of materials and transfer of title.
(c) SunOpta BioProcess
The percentage of completion method is used to account for significant long-term contracts. The amounts of revenue and profit recognized each year are based on either the ratio of hours incurred to the total expected hours or the ratio of costs incurred to the total expected costs. Costs incurred on long-term contracts include labour, material, other direct costs and overheads. Losses, if any, on long-term contracts are recognized during the period in which they are determined.
- F11 -
| SunOpta Inc. |
| Notes to Consolidated Financial Statements |
| For the years ended December 31, 2009, 2008 and 2007 |
| (Expressed in thousands of U.S. dollars, except per share amounts) |
1. Description of business and significant accounting policies continued
Foreign currency translation
The functional currency of all operations located in the United States, as well as SunOpta BioProcess, and the corporate head office is the United States dollar. The functional currency of all operations located in Canada is the Canadian dollar except for SunOpta BioProcess, where the functional currency is the U.S. dollar. The functional currency of all operations located in Europe and Mexico is the Euro and Mexican peso, respectively.
The assets and liabilities of the Company’s operations, as well as monetary assets of the corporate head office, are translated at exchange rates in effect at the dates of the consolidated balance sheets. Non-monetary assets of the corporate head office are translated at their historical rates. Revenues and expenses are translated at average exchange rates prevailing during the period. Unrealized gains or losses resulting from translating operations are accumulated and reported as a currency translation adjustment in shareholders’ equity and are disclosed as part of accumulated other comprehensive income. Gains and losses from foreign currency transactions are included in earnings of each period.
Pension plan
The Company has two defined benefit pension plans covering certain employees as a result of the business acquisition of Global Trading Inc. in 2007 and The Organic Corporation B.V. in 2008. Net periodic benefit cost, which is included in selling, general and administrative expenses on the consolidated statements of earnings, represents the cost of benefits earned by employees as services are rendered. The cost reflects management’s best estimates of the pension plans’ expected investment returns, wage and salary escalation, mortality of members, terminations and the ages at which members will retire. Changes in these assumptions could impact future pension expense. The excess of the net actuarial gain (loss) over 10% of the greater of the benefit obligation and the fair value of plan assets at the beginning of the year is amortized over the average remaining service lives of the members. At December 31, 2009, the future service lives of participants expected to receive benefits in the Global Trading Inc. and The Organic Corporation B.V. defined benefit plans were estimated to be 1 and 22 years, respectively.
Customer and other deposits
Customer and other deposits include prepayments by the Grains and Foods Group and the International Sourcing and Trading Group’s customers for merchandise inventory to be purchased at a future date.
Income taxes
The Company follows the asset and liability method of accounting for income taxes whereby deferred income tax assets are recognized for deductible temporary differences and operating loss carry-forwards, and deferred income tax liabilities are recognized for taxable temporary differences. Temporary differences are the differences between the amounts of assets and liabilities recorded for income tax and financial reporting purposes.
Deferred income tax assets are recognized only to the extent that management determines that it is more likely than not that the deferred income tax assets will be realized. Deferred income tax assets and liabilities are adjusted for the effects of changes in tax laws and rates on the date of enactment. The income tax expense or benefit is the income tax payable or recoverable for the year plus or minus the change in deferred income tax assets and liabilities during the year.
- F12 -
| SunOpta Inc. |
| Notes to Consolidated Financial Statements |
| For the years ended December 31, 2009, 2008 and 2007 |
| (Expressed in thousands of U.S. dollars, except per share amounts) |
1. Description of business and significant accounting policies continued
The Company is subject to ongoing tax exposures, examinations and assessments in various jurisdictions. Accordingly, the Company may incur additional income tax expense based upon the outcomes of such matters. In addition, when applicable, the Company adjusts income tax expense to reflect the Company’s ongoing assessments of such matters, which requires judgment and can materially increase or decrease its effective rate as well as impact operating results. The Company provides for such exposures in accordance with Financial Accounting Standards Board (“FASB”) Accounting Standards Codification (“ASC”) Topic 740 (formerly Interpretation No. 48, “Accounting for Uncertainty in Income Taxes” (an Interpretation of FASB Statement No. 109) (“FIN48”)). ASC 740 prescribes a recognition threshold and measurement attribute for the financial statement recognition and measurement of a tax position taken or expected to be taken in a tax return. ASC 740 also provides accounting guidance on de-recognition, classification, interest and penalties, accounting in interim periods, disclosure and transition. The evaluation of tax positions under ASC 740 is a two-step process, whereby (1) the Company determines whether it is more likely than not that the tax positions will be sustained based on the technical merits of the position, and (2) for those tax positions that meet the more-likely-than-not recognition threshold, the Company would recognize the largest amount of tax benefit that has a greater than 50% likelihood of being realized upon ultimate settlement with the related tax authority.
Stock option plan
The Company maintains a stock option plan under which incentive stock options may be granted to employees and non-employee directors. Effective January 1, 2006, the Company adopted ASC Topic 718 (formerly Statement of Financial Accounting Standard (“SFAS”). 123(R), “Share-Based Payments”), using the modified prospective transition method, which required the Company to record stock-based compensation expenses within the consolidated statements of earnings. The fair value at grant date of stock options is estimated using the Black-Scholes option-pricing model. Compensation expense is recognized on a straight-line basis over the stock option vesting period of the entire award based on the estimated number of stock options that are expected to vest. When exercised, stock options are settled through the issuance of shares and are therefore treated as equity awards.
Derivative instruments
The Company is exposed to fluctuations in interest rates, commodities and foreign currency exchange. The Company utilizes certain derivative financial instruments to enhance its ability to manage these risks, including interest rate swaps, exchange-traded commodity futures, commodity forward purchase and sale contracts and forward foreign exchange contracts. Derivative instruments are entered into for periods consistent with related underlying exposures and do not constitute positions independent of those exposures. The Company does not enter into contracts for speculative purposes.
All derivative instruments are recognized on the consolidated balance sheets at fair value. Changes in the fair value of derivative instruments are recorded in operations or other comprehensive earnings (loss), based on whether the instrument is designated as part of a hedge transaction. Gains or losses on derivative instruments reported in accumulated other comprehensive income are reclassified to earnings in the period in which earnings are affected by the underlying hedged item. The ineffective portion of all hedges is recognized in earnings in the current period.
(a) Interest rate swaps
Opta Minerals entered into a cash flow hedge in 2007 to manage its exposure to interest rate risks. The fair value of this contract is included in accounts payable and accrued liabilities. The changes in the fair value of this contract is included in accumulated other comprehensive income to the extent that the hedge continues to be effective. The amounts included in accumulated other comprehensive income amounts are allocated to earnings in the same period in which the hedged item affects earnings. To the extent that the cash flow hedge is not considered to be effective by completely offsetting the change in fair value of the hedged item, the ineffective portion of the hedging relationship is recorded immediately in earnings and is classified as interest expense on the consolidated statements of operations and comprehensive earnings (loss).
- F13 -
| SunOpta Inc. |
| Notes to Consolidated Financial Statements |
| For the years ended December 31, 2009, 2008 and 2007 |
| (Expressed in thousands of U.S. dollars, except per share amounts) |
1. Description of business and significant accounting policies continued
(b) Exchange-traded commodity futures
SunOpta Foods enters into exchange-traded commodity futures contracts to economically hedge its exposure to price fluctuations on grain and cocoa transactions to the extent considered practicable for minimizing risk from market price fluctuations. Futures contracts used for economical hedging purposes are purchased and sold through regulated commodity exchanges in the United States. Inventories, however, may not be completely hedged, due in part to the Company’s assessment of its exposure from expected price fluctuations. Forward purchase and sale contracts may expose the Company to risk in the event that a counterparty to a transaction is unable to fulfil its contractual obligation or if a grower does not deliver the grain as scheduled. The Company manages its risk by entering into purchase contracts with pre-approved growers and sale contracts are entered into with organizations of acceptable creditworthiness, as internally evaluated. All futures and forward purchase and sale contracts are marked-to-market. Gains and losses on these transactions are included in cost of goods sold on the consolidated statements of earnings. For the years ended December 31, 2009, 2008 and 2007 the gain included in cost of sales was $621, $135 and $185, respectively.
(c) Forward foreign exchange contracts
SunOpta Foods enters into forward foreign exchange contracts to minimize exchange rate fluctuations relating to Euro-denominated sales contracts and accounts receivable. All forward exchange contracts are marked-to-market. In addition, the Corporate Services Group enters into foreign forward currency contracts to minimize exchange rate fluctuations related to balance sheet movements. Gains and losses on these transactions are included in foreign exchange (gain) loss in the consolidated statements of operations and comprehensive (loss) income.
Financial instruments
The Company’s financial instruments recognized in the consolidated balance sheets and included in working capital consist of cash and cash equivalents, accounts receivable, accounts payable and accrued liabilities and customer and other deposits. The fair values of these instruments approximate their carrying values due to their short-term maturities. The fair values of long- term debt and long-term liabilities as at December 31, 2009 is considered not to be materially different from the carrying amounts, except for the term loan facility disclosed in note 9(a).
The Company’s financial instruments exposed to credit risk include cash and cash equivalents, and accounts receivable. The Company places its cash and cash equivalents with institutions of high creditworthiness. The Company’s trade accounts receivable are not subject to a high concentration of credit risk. The Company routinely assesses the financial strength of its customers and, as a consequence, believes that its accounts receivable credit risk exposure is limited. The Company maintains an allowance for losses based on the expected collectibility of the accounts.
Earnings per share
Basic earnings per share is computed by dividing the earnings available for common shareholders by the weighted average number of common shares outstanding during the year. Diluted earnings per share is computed using the treasury stock method whereby the weighted average number of common shares used in the basic earnings per share calculation is increased to include the number of additional common shares that would have been outstanding if the potential dilutive common shares had been issued at the beginning of the year.
- F14 -
| SunOpta Inc. |
| Notes to Consolidated Financial Statements |
| For the years ended December 31, 2009, 2008 and 2007 |
| (Expressed in thousands of U.S. dollars, except per share amounts) |
1. Description of business and significant accounting policies continued
Use of estimates
The preparation of financial statements in conformity with generally accepted accounting principles requires management to make certain estimates and assumptions that affect the reported amounts of assets and liabilities, related revenues and expenses, and disclosure of gain and loss contingencies at the date of the financial statements. The estimates and assumptions made require judgment on the part of management and are based on the Company’s historical experience and various other factors that are believed to be reasonable in the circumstances. Management continually evaluates the information that forms the basis of its estimates and assumptions as the business of the Company and the business environment generally changes.
Recent accounting pronouncements
In February 2007, the FASB issued ASC Topic 825-10 (formerly SFAS Statement No. 159, “The Fair Value Option for Financial Assets and Liabilities” (“SFAS No. 159”). ASC 825-10 allows companies to voluntarily choose, at specific election dates, to measure certain financial assets and liabilities, as well as certain non-financial instruments that are similar to financial instruments, at the fair value (the “fair value option”). The election is made on an instrument-by-instrument basis and is irrevocable. If the fair value option is elected for an instrument, ASC 825-10 specifies that all subsequent changes in fair value for that instrument be reported in income. The provisions of ASC 825-10 are effective for fiscal years beginning after November 15, 2007. The adoption of ASC 825-10 did not have a material impact on the Company’s consolidated financial statements.
On July 1, 2009, the Company adopted ASC Topic 105-10 (formerly SFAS No. 168, “The FASB Accounting Standards Codification and Hierarchy of Generally Accepted Accounting Principles, a replacement of FASB Statement No. 162”). ASC 105-10 establishes the FASB ASC as the source of authoritative accounting principles recognized by the FASB to be applied in preparation of financial statements in conformity with accounting principles generally accepted in the United States of America. As a result of adopting this standard, all references to authoritative accounting literature have been updated based on the new GAAP codification.
On January 1, 2009, the Company adopted ASC Topic 805 (formerly SFAS No. 141R, “Business Combinations”). ASC 805 applies to all transactions or other events in which an entity obtains control of one or more businesses and requires that all assets and liabilities of an acquired business as well as any non-controlling interest in the acquiree be recorded at their fair values at the acquisition date. Contingent consideration arrangements are recognized at their acquisition date fair values, with subsequent changes in fair value generally reflected in earnings. Pre-acquisition contingencies are also typically recognized at their acquisition date fair values. In subsequent periods, contingent liabilities are measured at the higher of their acquisition date fair values or the estimated amounts to be realized. The adoption of ASC 805 did not have a significant impact on the Company’s consolidated financial statements.
In February 2008, FASB issued ASC Topic 820-10-55 (formerly FASB Staff Position (“FSP) 157-2/Statement No. 157, “Effective Date of FASB Statement No. 157”). ASC Topic 820-10-55 delayed the effective date for all non-financial assets and non-financial liabilities, except those that are recognized or disclosed at fair value in the financial statements on a recurring basis (at least annually). The adoption of the provisions of ASC 820-10-55 related to non-financial assets and non-financial liabilities disclosures effective January 1, 2009. See Note 19 for enhanced note disclosures as a result of adopting this standard.
- F15 -
| SunOpta Inc. |
| Notes to Consolidated Financial Statements |
| For the years ended December 31, 2009, 2008 and 2007 |
| (Expressed in thousands of U.S. dollars, except per share amounts) |
1. Description of business and significant accounting policies continued
In December 2007, the FASB issued ASC Topic 810-10-65, “Consolidation”, regarding non-controlling interests (formerly SFAS No. 160, “Non-controlling Interests in Consolidated Financial Statements”). ASC 810-10-65 establishes accounting and reporting standards for ownership in subsidiaries held by parties other than the parent, the amount of consolidated earnings attributable to the parent and to the non-controlling interest, changes in a parent’s ownership interest, and the valuation of retained non-controlling equity investments when a subsidiary is deconsolidated. It clarifies that a non-controlling interest in a subsidiary is an ownership interest in the consolidated entity that should be reported as equity in the consolidated financial statements. The Company adopted ASC 810-10-65 effective January 1, 2009. As required by ASC 810-10-65, the Company has retrospectively applied the presentation to prior year balances and has added disclosures to its consolidated balance sheets, consolidated statements of shareholders’ equity and consolidated statements of cash flows, as well as creating a new consolidated statement of comprehensive earnings (loss), as a result of adopting this standard.
In March 2008, the FASB issued the disclosure requirements within ASC Topic 815, “Derivatives and Hedging” (formerly SFAS No. 161, “Disclosures about Derivative Instruments and Hedging Activities, an Amendment of FASB No. 133”). ASC 815 is intended to improve transparency in financial reporting by requiring enhanced disclosures of an entity’s derivative instruments and hedging activities and their effects on the entity’s financial position, financial performance, and cash flows. The disclosure requirements apply to all derivative instruments within the scope of ASC 815. The standard also applies to non-derivative hedging instruments and all hedged items designated and qualifying under ASC 815. This standard requires an entity with derivatives to disclose how and why it uses derivative instruments; how derivative instruments and related hedged items are accounted for under SFAS 133; and how derivative instruments and related hedged items affect the entity’s financial position, financial performance, and cash flows. Entities must provide tabular disclosures of the location, by line item, of amounts of gains and losses reported in the consolidated statements of operations. The Company adopted the disclosure requirements of ASC 815 on January 1, 2009. See note 19 for enhanced note disclosures as a result of adopting this standard.
In May 2008, the FASB issued ASC Topic 350-30, “General Intangibles Other than Goodwill” (formerly FSP 142-3, “Determination of the Useful Life of Intangible Assets”). ASC 350-30 provides guidance on the renewal or extension assumptions used in the determination of useful life of a recognized intangible asset. The intent of ASC 350-30 is to better match the useful life of the recognized intangible asset to the period of expected cash flow used to measure its fair value. ASC 350-30 is effective for fiscal years beginning after December 15, 2008. The adoption of this standard did not have a significant impact on the Company’s consolidated financial statements.
In December 2008, the FASB issued ASC Topic 715-20, “Defined Benefit Plans” (formerly FASB FSP No. 132(R)-1, “Employers’ Disclosures about Postretirement Benefit Plan Assets,”). ASC 715-20 amends SFAS No. 132 to provide guidance on an employer’s disclosures about plan assets of a defined benefit pension or other postretirement plan. The additional required disclosures focus on fair value by category of plan assets. This ASC is effective for fiscal years ending after December 15, 2009. The adoption of this standard did not result in significant changes to the Company’s financial statements.
In April 2009, the FASB issued ASC Topic 825-10, “Financial Instruments” (formerly FSP 107-1 and Accounting Practice Bulletin 28-1, “Interim Disclosures about Fair Value of Financial Instruments”). ASC 825 requires disclosures about fair value of financial instruments for interim reporting periods of publicly traded companies as well as in annual financial statements. This standard is effective for interim and annual periods ending after June 15, 2009, and is to be applied prospectively. The Company added disclosures to note 9 regarding the fair value of its term debt.
In April 2009, the FASB issued ASC Topic 320-10-65 (formerly FSP 115-2 and SFAS No. 124-2, Recognition and Presentation of Other-Than-Temporary Impairments). This standard is intended to bring greater consistency to the timing of impairment recognition, and provide greater clarify to investors about the credit and noncredit components of impaired debt securities that are not expected to be sold. This standard also required increased and more timely disclosure regarding expected cash flows and is to be applied prospectively. The Company does not expect any material financial statement implications relating to the adoption of this ASC.
- F16 -
| SunOpta Inc. |
| Notes to Consolidated Financial Statements |
| For the years ended December 31, 2009, 2008 and 2007 |
| (Expressed in thousands of U.S. dollars, except per share amounts) |
1. Description of business and significant accounting policies continued
In May 2009, the FASB issued ASC Topic 855-10-25 (formerly FASB Statement 165, “Subsequent Events”). ASC 855-10-25 provides guidance on management’s assessment of subsequent events and incorporates this guidance into accounting literature. ASC 855-10-25 is effective prospectively for interim and annual periods ending after June 15, 2009. The implementation of this standard did not have a material impact on the Company’s financial position and results of operations. The Company has adopted this standard, evaluating for subsequent events to the date these financial statements were issued.
In June 2009, the FASB issued ASC Topic 860-10-05 (formerly SFAS No. 166, “Accounting for Transfers of Financial Assets”). This standard prescribes the information that a reporting entity must provide in its financial reports about a transfer of financial assets; the effects of a transfer on its financial position, financial performance and cash flows; and a transferor’s continuing involvement in transferred financial assets. ASC 860-10-05 is effective for transfers of financial assets occurring on or after January 1, 2010. The Company will consider this standard when evaluating future transactions to which it would apply. Historically, the Company has not had any material transfers of financial assets.
In June 2009, the FASB issued ASC Topic 810 (formerly SFAS No. 167, “Amendments to FASB Interpretation No. 46(R)”). This accounting standard is a revision to a previous FASB Interpretation and changes how a reporting entity evaluates whether an entity is a VIE and which entity is considered the primary beneficiary of a VIE and is therefore required to consolidate the VIE. This accounting standard will also require continuous reassessments of which party within the VIE is considered the primary beneficiary and will require a number of new disclosures related to the VIE’s. ASC 810 becomes effective January 1, 2010. The Company does not expect any material financial statement implications, other than disclosure items, related to the adoption of this ASC.
- F17 -
| SunOpta Inc. |
| Notes to Consolidated Financial Statements |
| For the years ended December 31, 2009, 2008 and 2007 |
| (Expressed in thousands of U.S. dollars, except per share amounts) |
2. Business acquisitions
There were no acquisitions completed during the year ended December 31, 2009.
During the year ended December 31, 2008, the Company and its less than wholly owned subsidiary completed two acquisitions. These acquisitions have been accounted for using the purchase method and the consolidated financial statements include the results of operations for these businesses from the date of acquisition.
|
|
|
MCP Mg-Serbien |
|
|
|
TOC |
SAS |
|
|
|
(a) |
(b) |
Total |
|
Net assets acquired |
|
|
|
|
|
|
|
|
|
Cash |
1,205 |
297 |
1,502 |
|
Current assets |
49,494 |
1,463 |
50,957 |
|
Property, plant and equipment |
1,167 |
325 |
1,492 |
|
Goodwill |
9,734 |
4,594 |
14,328 |
|
Intangible assets |
9,251 |
- |
9,251 |
|
Other long-term assets |
359 |
57 |
416 |
|
Current liabilities |
(44,854) |
(5,434) |
(50,288) |
|
Deferred income tax liability |
(2,687) |
- |
(2,687) |
|
Other long-term liabilities |
(216) |
- |
(216) |
|
Long-term debt |
(1,502) |
- |
(1,502) |
|
|
21,951 |
1,302 |
23,253 |
|
|
|
|
|
|
Consideration |
|
|
|
|
|
|
|
|
|
Cash consideration including transaction costs |
5,467 |
1,302 |
6,769 |
|
Due to former shareholders |
1,562 |
- |
1,562 |
|
Subordinated debt payable to former shareholders |
4,685 |
- |
4,685 |
|
Deferred consideration |
10,237 |
- |
10,237 |
|
|
21,951 |
1,302 |
23,253 |
(a) The Organic Corporation B.V.
On April 2, 2008, the Company acquired 100% of the outstanding common shares of The Organic Corporation B.V., operating as Tradin Organic Agriculture B.V. (“TOC”) for total consideration of €14,055 (U.S - $21,951), including acquisition costs of €500 (U.S - $781). At closing, the Company paid €6,000 (U.S - $9,371) in cash and concurrently received €3,000 (U.S – $4,685) by way of subordinated debt payable to the former shareholders. A promissory note for €1,000 (U.S - $1,562) was also issued bearing interest at 7.0% which is payable March 31, 2010 (note 9(g)). The remaining cash consideration of €8,000 (U.S. - $12,494) is payable on March 31, 2011. As security pending payment of the promissory note and additional consideration, the Company pledged 100% of the outstanding common shares of TOC to the former shareholders. Due to its non-contingent nature, the present value of the deferred consideration has been included in the total consideration. As a result of TOC’s opening balance sheet not meeting pre-determined working capital targets, the consideration owing on March 31, 2011 has been reduced by €403 (U.S. - $576).
The intangible assets, consisting of a customer relationships, customer order backlog and non-compete agreements, acquired in this acquisition are not deductible for income tax purposes and are being amortized over their estimated useful lives between one and twelve years. The acquisition served as an entry point for the Company into the European and other global markets from both the supply and sales side of our sourcing and trading operations, and accordingly, $9,734 of goodwill has been included in the net assets acquired. Goodwill acquired in this acquisition is not deductible for tax purposes.
- F18 -
| SunOpta Inc. |
| Notes to Consolidated Financial Statements |
| For the years ended December 31, 2009, 2008 and 2007 |
| (Expressed in thousands of U.S. dollars, except per share amounts) |
2. Business acquisitions continued
Headquartered in Amsterdam, the Netherlands, TOC is a provider of globally sourced organic food ingredients and a key supplier of a wide variety of organic products including frozen fruits and vegetables, dried fruits, coffee, cocoa, cereals, rice, soy, beans and more. This acquisition has been consolidated since its April 2, 2008 acquisition date and is included in the International Sourcing and Trading Group.
(b) MCP Mg-Serbien SAS
On July 9, 2008, Opta Minerals acquired 67% of the outstanding common shares of MCP Mg-Serbien SAS (“MCP”) of France for total consideration of $1,302, including acquisition costs of $152. The acquisition continues to expand Opta Mineral’s business capabilities into Europe and complemented existing operations which supply a wide range of magnesium based desulphurization products. As a result, $4,594 of goodwill was included in the net assets acquired. In the third quarter of 2009, the full amount of this goodwill was written off as part of goodwill impairment tests performed by Opta Minerals (note 6).
Subsequent to the acquisition of MCP, the cumulative unconsolidated losses triggered a statutory requirement in France for the shareholders to increase the capital stock. On December 22, 2009, Opta Minerals fulfilled its obligation to increase the value of its shareholdings and, at the same time, the non-controlling interest declined to increase its pro-rata share of the shareholdings. As a result, the non-controlling interest’s shares were cancelled and for no additional consideration, Opta Minerals increased its ownership in MCP to 100%. The non-controlling interest of $279 has been credited with an offsetting reduction recorded in additional paid in capital.
MCP operates a production facility in Romans-sur-Isere, France, producing and selling ground magnesium products. This acquisition has been consolidated since its July 9, 2008 acquisition date, and is included in the Opta Minerals segment.
(c) Pro forma data (unaudited)
There were no acquisitions completed during the year ended December 31, 2009.
The condensed pro forma consolidated statements of operations, reflects all acquisitions completed in 2008, as if they had occurred on January 1, 2008 and 2007, respectively, and all acquisitions completed in 2007 as if they had occurred on January 1, 2007 is as follows:
|
|
2009 |
2008 |
2007 |
|
|
$ |
$ |
$ |
|
Pro forma revenue |
989,132 |
1,090,849 |
940,925 |
|
Pro forma (loss) earnings attributable to SunOpta Inc. |
(6,763) |
(10,786) |
1,363 |
|
Pro forma (loss) earnings per share |
|
|
|
|
Basic |
(0.10) |
(0.17) |
0.02 |
|
Diluted |
(0.10) |
(0.17) |
0.02 |
- F19 -
| SunOpta Inc. |
| Notes to Consolidated Financial Statements |
| For the years ended December 31, 2009, 2008 and 2007 |
| (Expressed in thousands of U.S. dollars, except per share amounts) |
2. Business acquisitions continued
(d) Contingent consideration on companies acquired prior to 2009
During the year ended December 31, 2009, the Company recorded contingent consideration of $975 as an increase in goodwill ($500 of which was immediately impaired and charged to the consolidated statement of operations, see note 6) relating to business acquisitions that occurred prior to 2009, based on these companies achieving predetermined earnings or other operational results as defined in the respective purchase and sale agreements.
|
|
Contingent |
|
|
consideration |
|
|
recorded in 2009 |
|
|
$ |
|
Business acquisition |
|
|
Hess Food Group |
500 |
|
Neo-Nutritionals Inc. |
263 |
|
Aux Mille et une Saisons Inc. |
212 |
|
|
975 |
As a result of prior acquisitions, the Company is committed to pay contingent consideration as per the purchase and sales agreements entered into. Included in current portion of long-term liabilities at December 31, 2009 is $712 owed to former shareholders in deferred consideration. Additional contingent consideration of up to $4,000 may be payable to Purity Life Health Products Ltd., acquired in 2006, based on achieving pre-determined annual earnings targets through December 31, 2011. The amounts will be recorded once the contingencies are resolved and the amounts become payable.
3. Accounts receivable
|
|
2009 |
2008 |
|
|
$ |
$ |
|
Trade receivables |
96,749 |
96,888 |
|
Allowance for doubtful accounts |
(2,508) |
(1,759) |
|
|
94,241 |
95,129 |
The change in the allowance for doubtful accounts provision for the years ended December 31, 2009 and 2008 is comprised as follows:
|
|
2009 |
2008 |
|
|
$ |
$ |
|
Balance, beginning of year |
1,759 |
6,418 |
|
Net additions to provision |
845 |
630 |
|
Effect of foreign exchange rate differences |
107 |
(1,516) |
|
Accounts receivable written off, net of recoveries |
(203) |
(3,773) |
|
Balance, end of year |
2,508 |
1,759 |
Included in allowance for doubtful accounts at December 31, 2007 is an amount relating to SunOpta BioProcess of $2,640. This allowance reduced the carrying value of the accounts receivable from a specific customer to its estimated net realizable value, as a result of a dispute resulting in the uncertainty of collection of amounts owing under an existing long-term contract. This provision, as well as the carrying value of the receivable were written-off in 2008.
- F20 -
| SunOpta Inc. |
| Notes to Consolidated Financial Statements |
| For the years ended December 31, 2009, 2008 and 2007 |
| (Expressed in thousands of U.S. dollars, except per share amounts) |
4. Inventories
|
|
2009 |
2008 |
|
|
$ |
$ |
|
Raw materials and work-in-process |
66,058 |
84,821 |
|
Finished goods |
108,623 |
114,787 |
|
Company-owned grain |
13,791 |
10,936 |
|
Inventory reserve |
(10,332) |
(9,855) |
|
|
178,140 |
200,689 |
The change in the inventory reserve for the years ended December 31, 2009 and 2008 is comprised as follows:
|
|
2009 |
2008 |
|
|
$ |
$ |
|
Balance, beginning of year |
9,855 |
10,859 |
|
Additions to reserve |
4,481 |
1,200 |
|
Effect of foreign exchange rate differences |
226 |
(240) |
|
Inventories written-off |
(4,230) |
(1,964) |
|
Balance, end of year |
10,332 |
9,855 |
5. Property, plant and equipment
|
2009 |
|||
|
|
|
Accumulated |
|
|
|
Cost |
amortization |
Net book |
|
|
$ |
$ |
value |
|
|
|
|
$ |
|
Land |
4,723 |
- |
4,723 |
|
Buildings |
47,704 |
11,247 |
36,457 |
|
Machinery and equipment |
117,668 |
52,793 |
64,875 |
|
Enterprise software |
7,501 |
4,484 |
3,017 |
|
Office furniture and equipment |
8,307 |
6,240 |
2,067 |
|
Vehicles |
5,919 |
3,813 |
2,106 |
|
|
191,822 |
78,577 |
113,245 |
|
2008 |
|||
|
|
|
Accumulated |
|
|
|
Cost |
amortization |
Net book |
|
|
$ |
$ |
value |
|
|
|
|
$ |
|
Land |
4,465 |
- |
4,465 |
|
Buildings |
44,716 |
9,740 |
34,976 |
|
Machinery and equipment |
107,648 |
43,273 |
64,375 |
|
Enterprise software |
5,815 |
2,775 |
3,040 |
|
Office furniture and equipment |
7,692 |
5,483 |
2,209 |
|
Vehicles |
5,194 |
3,618 |
1,576 |
|
|
175,530 |
64,889 |
110,641 |
Included in machinery and equipment above at December 31, 2009 is $7,857 (2008 - $1,631) representing construction in process assets which were not being depreciated as they had not yet reached the stage of commercial viability. Also included in machinery and equipment is equipment under capital leases with a cost of $833 (2008 -$784) and net book value of $387 (2008 - $441).
- F21 -
| SunOpta Inc. |
| Notes to Consolidated Financial Statements |
| For the years ended December 31, 2009, 2008 and 2007 |
| (Expressed in thousands of U.S. dollars, except per share amounts) |
5. Property, plant and equipment continued
Total depreciation expense included in cost of sales and selling, general and administrative expense on the consolidated statements of operations related to property, plant and equipment for the year ended December 31, 2009 was $13,693 (2008 - $13,485; 2007 - $10,857).
6. Goodwill and intangible assets
|
|
2009 |
2008 |
|
|
$ |
$ |
|
Goodwill |
49,717 |
54,022 |
|
Intangible assets with a finite life at cost, less accumulated amortization of $22,008 (2008 - $14,131) |
60,902 |
63,161 |
The following is a summary of changes in goodwill:
|
|
$ |
|
Balance at December 31, 2007 |
55,503 |
|
Additions and acquisitions during the year |
14,657 |
|
Goodwill impairment |
(10,154) |
|
Impact of foreign exchange |
(5,984) |
|
|
|
|
Balance at December 31, 2008 |
54,022 |
|
Additions during the year |
1,257 |
|
Goodwill impairment |
(8,841) |
|
Impact of foreign exchange |
3,279 |
|
Balance at December 31, 2009 |
49,717 |
During the third quarter of 2009, Opta Minerals determined that there were external market conditions and other circumstances that suggested the carrying value of certain reporting units in Opta Minerals may exceed their fair value. These external market conditions and other circumstances included continued operating losses and extended periods of facility under-utilization due to continued weakness in the steel, abrasives and foundry markets. As a result of completing a test for goodwill impairment, Opta Minerals determined that the carrying value of goodwill in certain of its mill and foundry and abrasive products reporting units exceeded their fair value, and recorded a non-cash impairment charge of $8,341. The Company has recorded this charge in its Opta Minerals operating segment.
The result of the annual goodwill impairment test for the year ended December 31, 2009 indicated that the fair value of the Grains and Foods Group, the Ingredients Group, and the Distribution Group exceeded its carrying value, and as a result, no impairment charge was recorded. After recording a $500 increase to goodwill as a result of contingent consideration earned at December 31, 2009 (note 2), the Company tested the Fruit Group and determined that its carrying value exceeded its fair value. As a result, the $500 of goodwill added in 2009 was reduced to $nil through a charge to goodwill impairment.
- F22 -
| SunOpta Inc. |
| Notes to Consolidated Financial Statements |
| For the years ended December 31, 2009, 2008 and 2007 |
| (Expressed in thousands of U.S. dollars, except per share amounts) |
6. Goodwill and intangible assets continued
The fair values calculated in these impairment tests are determined using discounted cash flow models involving various assumptions. The following table summarizes the critical assumptions that were used in estimating fair value for our 2009 annual impairment test in the segments where an impairment was determined:
|
|
|
|
Estimated cumulative average operating income growth (2010-2014) |
5% |
|
Projected long-term annual operating income growth (a) |
2% - 7% |
|
Weighted average discount rate (b) |
15% |
| (a) |
Represents the operating income growth rate used to determine terminal value. | |
| (b) |
Represents the targeted weighted average discount rate of 9.9% plus the impact of a specific reporting unit risk premium to account for the estimated additional uncertainty associated with future cash flows. |
After completing the annual impairment test for its reporting units for the year ended December 31, 2008, the Company determined that there was impairment in goodwill related to reporting units within the Fruit Group of $8,198 (2007 - $996) and within the International Sourcing and Trading Group of $1,956.
The following is a summary of changes in intangible assets:
|
|
Customer and other |
Patents and |
|
|
|
|
relationships |
trademarks |
Other |
Total |
|
|
$ |
$ |
$ |
$ |
|
Net book value, December 31, 2007 |
53,420 |
6,809 |
1,847 |
62,076 |
|
Business acquisitions |
8,627 |
- |
624 |
9,251 |
|
Net additions |
334 |
339 |
- |
673 |
|
Amortization |
(5,310) |
(161) |
(408) |
(5,879) |
|
Foreign exchange |
(780) |
(1,448) |
(732) |
(2,960) |
|
|
|
|
|
|
|
Net book value, December 31, 2008 |
56,291 |
5,539 |
1,331 |
63,161 |
|
Business acquisitions |
- |
- |
- |
- |
|
Net additions |
- |
374 |
812 |
1,186 |
|
Impairments |
(130) |
- |
- |
(130) |
|
Amortization |
(4,747) |
(645) |
(285) |
(5,677) |
|
Foreign exchange |
1,419 |
664 |
279 |
2,362 |
|
Net book value, December 31, 2009 |
52,833 |
5,932 |
2,137 |
60,902 |
The Company estimates that the aggregate future amortization expense associated with finite-life intangible assets will be as follows:
|
|
$ |
|
2010 |
5,799 |
|
2011 |
5,708 |
|
2012 |
5,583 |
|
2013 |
5,335 |
|
2014 |
4,880 |
|
Thereafter |
33,597 |
|
|
60,902 |
- F23 -
| SunOpta Inc. |
| Notes to Consolidated Financial Statements |
| For the years ended December 31, 2009, 2008 and 2007 |
| (Expressed in thousands of U.S. dollars, except per share amounts) |
7. Accounts payable and accrued liabilities
|
|
2009 |
2008 |
|
|
$ |
$ |
|
Accounts payable |
71,469 |
74,913 |
|
Payroll and commissions |
14,887 |
6,567 |
|
Accrued grain liabilities |
9,386 |
13,664 |
|
Other accruals |
10,511 |
11,845 |
|
|
106,253 |
106,989 |
8. Bank indebtedness
|
|
2009 |
2008 |
|
|
$ |
$ |
|
Canadian line of credit facility (a) |
- |
134 |
|
U.S. line of credit facility (b) |
44,130 |
28,344 |
|
Opta Minerals Canadian line of credit facility (c) |
3,355 |
7,797 |
|
TOC line of credit facilities (d) |
15,996 |
30,889 |
|
|
63,481 |
67,164 |
On April 30, 2009, the Company negotiated certain amendments to its syndicated banking facilities. The amendments included a reduction in the maximum availability under the Canadian line of credit facility from Cdn $25,000 to Cdn $20,000, as well as an increase in the interest rate premium charged on outstanding balances, which is based on certain financial ratios of the Company. In addition, the Canadian and U.S. line of credit facilities were extended from June 30, 2009 to December 31, 2009.
On October 30, 2009, the Company completed the conversion of its syndicated banking facilities to an Asset-Based Lending Agreement (“ABL Agreement”). The ABL arrangement changes the Company’s banking facilities such that credit limits in both the Canadian and U.S. line of credit facilities are based on a borrowing base supported by the accounts receivable and inventories of the Company, determined on a monthly basis. In addition, the non-revolving and acquisition facilities (notes 9(b) and (c)) were eliminated, and the existing balances were refinanced using the U.S. line of credit facility. The conversion decreases the interest rate premium charged on outstanding balances which are based on new financial ratios. Under the new ABL arrangement, the term of the syndicated banking facilities were extended to October 30, 2012.
The Company has certain financial covenants that are calculated monthly and quarterly. See note 9 for discussion of the Company’s compliance with respect to these financial covenants.
(a) Canadian line of credit facility
The Company has a Canadian line of credit of Cdn $20,000 (US $19,029). As at December 31, 2009, $nil (2008 - $134) of this facility was utilized, with $nil (2008 - $nil) committed through letters of credit. Interest on borrowings under this facility accrues at the borrower’s option based on various reference rates including Canadian or U.S. bank prime, or Canadian banker’s acceptances, plus a margin based on certain financial ratios. At December 31, 2009, the interest rate on this facility was 4.75% calculated as Canadian prime plus a premium of 2.50%. The maximum availability of this line is based on a borrowing base that includes certain accounts receivable and inventories of the Company’s Canadian business as defined in the ABL Agreement. At December 31, 2009, the borrowing base supported draws to the maximum line of credit.
- F24 -
| SunOpta Inc. |
| Notes to Consolidated Financial Statements |
| For the years ended December 31, 2009, 2008 and 2007 |
| (Expressed in thousands of U.S. dollars, except per share amounts) |
8. Bank indebtedness continued
(b) U.S. line of credit facility
The Company has a U.S. line of credit of $80,000. As at December 31, 2009, $45,754 (2008 - $28,377) of this facility was utilized, including $1,624 (2008 - $33) committed through letters of credit. Interest on borrowings under this facility accrues at the borrower’s option based on various reference rates including U.S. bank prime or U.S. LIBOR, plus a margin based on certain financial ratios. At December 31, 2009, the weighted average interest rate on this facility was 3.73%, based on U.S. LIBOR loans plus a premium of 3.50%. The maximum availability of this line is based on the borrowing base that includes certain accounts receivable and inventories of the Company’s U.S. business as defined in the credit agreement. At December 31, 2009, the borrowing base supported the maximum line of credit of $65,903.
The Canadian and U.S. line of credit facilities were extended to October 30, 2012 as part of the Fifth Amended and Restated Credit Agreement on October 30, 2009.
The above facilities and certain long-term loans (note 9) are collateralized by a first priority security against substantially all of the Company’s assets in both Canada and the United States, excluding the assets of Opta Minerals, SunOpta BioProcess and TOC.
(c) Opta Minerals Canadian line of credit facility
Opta Minerals has a line of credit facility of Cdn $15,000 (U.S. - $14,272). At December 31, 2009, Cdn $4,686 (U.S. - $4,459) (2008 – Cdn $10,569 (U.S. $8,677)) of this facility has been utilized, including letters of credit in the amount of Cdn $1,160 (U.S. - $1,104) (2008 – Cdn $1,072; U.S. - $880). Interest on borrowings under this facility accrues at the borrower’s option based on various reference rates including Canadian prime, U.S. dollar base rate, banker’s acceptances or LIBOR, plus a margin based on certain financial ratios of the Company. At December 31, 2009, the interest rate on this facility was 7.50% (2008 – 7.00%).
Opta Minerals’ line of credit facility, along with its unused portion of the revolving acquisition facility (note 9(e)), is subject to annual extensions, and were extended on July 30, 2009 to August 17, 2010.
(d) TOC line of credit facilities:
TOC has a line of credit facility of €30,000 (US - $42,948) that was acquired as part of the TOC acquisition (note 2). At December 31, 2009, €12,746 (U.S. - $18,247) (2008 - €22,904 (U.S. - $31,953)) of this facility had been utilized, including letters of credit in the amount of €2,119 (U.S. $3,034) (2008 - €763 (U.S. - $1,064)). Interest on borrowings under this facility accrues at the borrower’s option based on various reference rates including U.S. LIBOR, Euro LIBOR plus a premium of 1.85%. At December 31, 2009, the weighted average interest rate on this facility was 2.30%. The maximum availability of this line is based on a borrowing base which includes certain accounts receivables and inventories of TOC and its subsidiaries. At December 31, 2009, the borrowing base securing this facility, supported draws to €17,019 (U.S. – $24,364).
During 2008 a Chinese subsidiary of TOC had a line of credit facility denominated in Chinese Renminbi (“RMB”). During the fourth quarter of 2008, this facility was terminated.
A less-than-wholly owned subsidiary of TOC has line of credit facilities with availability of $1,394 which are fully guaranteed by TOC. As at December 31, 2009, $783 (2008 - $nil) of these facilities had been utilized to purchase inventories. Interest on borrowings under these facilities accrue at a base rate of 0.45% plus a premium of 6.00%, and a fixed rate of 9.75%. At December 31, 2009, the weighted average interest rate on these facilities was 8.6%.
- F25 -
| SunOpta Inc. |
| Notes to Consolidated Financial Statements |
| For the years ended December 31, 2009, 2008 and 2007 |
| (Expressed in thousands of U.S. dollars, except per share amounts) |
9. Long-term debt
|
|
2009 |
2008 |
|
|
$ |
$ |
|
Syndicated lending agreement |
|
|
|
Term loan facility (a) |
45,000 |
45,000 |
|
Non-revolving acquisition facility (b) |
- |
6,300 |
|
Revolving acquisition facility (c) |
- |
15,600 |
|
|
|
|
|
Other long-term debt |
|
|
|
Opta Minerals term loan facility (d) |
8,830 |
8,980 |
|
Opta Minerals revolving acquisition facility (e) |
12,362 |
11,835 |
|
Subordinated debt to former shareholders of TOC (f) |
4,944 |
4,643 |
|
Promissory notes (g) |
15,504 |
18,722 |
|
Other long-term debt (h) |
380 |
- |
|
Term loans payable (i) |
52 |
273 |
|
Capital lease obligations (j) |
117 |
174 |
|
|
87,189 |
111,527 |
|
Less: Current portion |
52,455 |
12,174 |
|
|
34,734 |
99,353 |
On April 30, 2009, the Company negotiated certain amendments to its syndicated banking facilities. The amendments included a permanent waiver to certain financial covenants at March 31, 2009, amended covenants for June 30, 2009, September 30, 2009 and December 31, 2009, the cancellation of the revolving portion of the revolving acquisition facility, as well as an increase in the interest rate premium charged on outstanding balances, which is based on certain financial ratios of the Company.
On July 30, 2009, Opta Minerals and its lenders negotiated certain amendments to its banking facilities. The amendments included adjustments to certain financial covenant thresholds, a reduction in the maximum availability under the revolving acquisition facility (note 9(e)) to Cdn $14,043 (U.S. - $13,362), and an increase in the interest rate premium charged on outstanding balances, which is based on certain financial ratios of the Company.
On October 30, 2009, the Company completed the conversion of its syndicated banking facilities to an Asset-Based Lending Agreement (“ABL Agreement”). The ABL arrangement changes the Company’s banking facilities such that credit limits in both the Canadian and U.S. line of credit facilities (note 8(a) and 8(b)) are based on a borrowing base supported by the accounts receivable and inventories of the Company, determined on a monthly basis. In addition, the non-revolving and acquisition facilities were eliminated, and the existing balances were refinanced using the U.S. line of credit facility (note 8(b)). The conversion decreases the interest rate premium charged on outstanding balances which are based on new financial ratios.
Details of the Company’s long-term debt are as follows:
(a) Term loan facility
The term loan facility balance at December 31, 2009 was $45,000 (2008 - $45,000). The entire loan principal is due December 20, 2010 and, at that time, is renewable at the option of the lender and the Company. Interest on the term loan facility is payable at a fixed rate of 6.44% plus a margin of up to 360 basis points based on certain financial ratios of the Company. As at December 31, 2009, the interest rate was 9.74% (2008 – 8.94%). The fair value of the term loan facility at December 31, 2009 was approximately $43,000.
- F26 -
| SunOpta Inc. |
| Notes to Consolidated Financial Statements |
| For the years ended December 31, 2009, 2008 and 2007 |
| (Expressed in thousands of U.S. dollars, except per share amounts) |
9. Long-term debt continued
(b) Non-revolving acquisition facility
The non-revolving acquisition facility balance at December 31, 2009 was $nil (2008 - $6,300). Minimum quarterly repayment amounts in 2009 and 2010 were $300, with the remaining principal balance due in May 2010. On October 30, 2009, the Company entered into the Fifth Amended and Restated Credit Facilities, and as a result, the non-revolving acquisition facility was refinanced using the U.S. line of credit facility (note 8).
(c) Revolving acquisition facility
The revolving acquisition facility balance at December 31, 2009 was $nil (2008 - $15,600). Principal payments on this facility were payable quarterly equal to the greater of (a) 1/20 of the initial drawdown amount of the facility or (b) 1/20 of the outstanding principal amount as of the date of the last draw. On October 30, 2009, the Company entered into the Fifth Amended and Restated Credit Facilities, and as a result, the revolving acquisition facility was refinanced using the U.S. line of credit facility (note 8).
The above term loan facility and the Canadian and U.S. line of credit facilities (notes 8(a) and (b)) are collateralized by a first priority security against substantially all of the Company’s assets in Canada, the United States and Mexico, excluding the assets of Opta Minerals, SunOpta BioProcess and TOC.
(d) Opta Minerals term loan facility
The term loan facility has a maximum available borrowing amount of Cdn $9,280 (U.S. - $8,830). This facility matures on August 20, 2012, is renewable at the option of the lender and Opta Minerals, and has quarterly principal repayments of Cdn $312 (US - $297). The outstanding balance on the term loan facility at December 31, 2009 was Cdn $9,280 (U.S. – $8,830) (2008 – Cdn $10,938 (U.S. - $8,980)). At December 31, 2009, the weighted average interest rate on this facility was 7.50% (2008 – 5.11%).
(e) Opta Minerals revolving acquisition facility
The revolving acquisition facility, which was renegotiated on July 30 2009, has a maximum available borrowing amount of Cdn $14,043 (U.S. - $13,362) to finance future acquisitions and capital expenditures. The facility is subject to certain draw restrictions. Principal is payable quarterly equal to 1/40 of the drawdown amount. Any remaining outstanding principal under this facility is due upon maturity. The facility is revolving for one year, with a five year term-out option. The outstanding balance on the revolving acquisition facility at December 31, 2009 was Cdn $12,992 (U.S. - $12,362) (2008 – Cdn $14,415 (U.S. - $11,835)). Interest on borrowings under this facility accrues at the borrowers’ option based on various rates including prime, U.S. dollar base rate, banker’s acceptances or LIBOR plus a margin based on certain financial ratios of Opta Minerals. At December 31, 2009, the weighted average interest rate on this facility was 6.99% (2008 – 4.75%).
The unused portion of the term loan facility is subject to an annual extension and was extended on July 30, 2009 to August 17, 2010. The credit facilities described above are collateralized by a first priority security against substantially all of the Opta Minerals assets in both Canada and the United States.
Opta Minerals entered into a cash flow hedge in 2007. The cash flow hedge entered into exchanged a notional amount of Cdn $17,200 (US - $16,365) from a floating rate to a fixed rate of 5.25% plus a margin based upon certain financial realities of the Company, from August 2008 to August 2012. The estimated fair value of the interest rate swap at December 31, 2009 was a loss of $1,387 (December 31, 2008 – loss of $1,984). The unrealized gain of $415, net of income taxes of $182, has been recorded in other comprehensive loss for the period. The $1,387 (2008 - $1,984) liability is included in long-term liabilities on the consolidated balance sheets.
- F27 -
| SunOpta Inc. |
| Notes to Consolidated Financial Statements |
| For the years ended December 31, 2009, 2008 and 2007 |
| (Expressed in thousands of U.S. dollars, except per share amounts) |
9. Long-term debt continued
(f) Subordinated debt to former shareholders of TOC:
In conjunction with the acquisition of TOC on April 2, 2008 (note 2), its former shareholders provided a subordinated debt to TOC in the amount of €3,000 (U.S. - $4,295). The loan bears interest at 7% payable to the former shareholders on a semi-annual basis. The subordinated loan, as well as €453 (U.S. - $649) previously loaned to TOC, is repayable in full on March 31, 2011. A promissory note owed to a related party of the former shareholders in the amount of €500 (U.S. - $716) was repaid in full in December 2009.
(g) Promissory notes:
Promissory notes consist of notes issued to former shareholders as a result of business acquisitions. As consideration in the acquisition of TOC, the Company issued a total of €9,000 (U.S. - $12,885) in promissory notes, which are secured by a pledge of the common shares of TOC. Of the €9,000 (U.S. - $12,885) issued, €1,000 (U.S. - $1,432) bears interest at a rate of 7.0% and is payable on March 31, 2010. As a result of TOC not meeting pre-determined EBITDA (as defined in the purchase and sale agreement) targets, the repayment of the remaining €8,000 (U.S. - $11,453) is extended to March 31, 2011. Due to TOC’s opening balance sheet not meeting pre-determined working capital targets, and an undisclosed liability that existed prior to the Company’s April 2, 2008 acquisition, €654 (U.S. - $936) of the promissory notes due on March 31, 2011 will not be paid.
In addition, $3,579 remains owing to various former shareholders at a weighted average interest of 5.4%. Of the $15,504 in total promissory notes, $4,527 are due in the next 12 months, with the remaining balances due in varying installments through 2012.
(h) Other long-term debt
A less-than-wholly-owned subsidiary of TOC has a maximum borrowing amount of 6,500 Ethiopian Birr (“ETB”) (U.S. - $512). In 2009, $380 was borrowed to fund the building of a facility. At December 31, 2009, the weighted average interest rate on borrowed funds was 10.1%.
(i) Term loans payable
Term loans payable bear a weighted average interest rate of 5.3% (2008 – 4.7%) due in varying installments through 2013 with principal payments of $13 due in the next 12 months.
(j) Capital lease obligations
Capital lease obligations due in monthly payments, with a weighted average interest rate of 7.1% (2008 – 7.0%).
The long-term debt and capital leases described above have required repayment terms in the next five years ending December 31 as follows:
|
|
$ |
|
2010 |
52,455 |
|
2011 |
18,761 |
|
2012 |
2,972 |
|
2013 |
2,748 |
|
2014 |
2,732 |
|
Thereafter |
7,521 |
|
|
87,189 |
Interest expense on long-term debt for the year ended December 31, 2009 was $7,047 (2008 - $8,146; 2007 -$5,499). Interest on short-term borrowings and other debt was $6,087 (2008 - $6,476; 2007 - $4,090).
- F28 -
| SunOpta Inc. |
| Notes to Consolidated Financial Statements |
| For the years ended December 31, 2009, 2008 and 2007 |
| (Expressed in thousands of U.S. dollars, except per share amounts) |
9. Long-term debt continued
Interest expense and interest income include:
|
|
2009 |
2008 |
2007 |
|
|
$ |
$ |
$ |
|
Interest expense before the following |
13,134 |
14,622 |
9,589 |
|
Accretion of preferred shares issued by SunOpta BioProcess |
391 |
387 |
217 |
|
Accretion on long-term debt due to TOC acquisition |
875 |
620 |
- |
|
Loss on fair value of interest rate swap at inception (note (9(e)) |
- |
- |
254 |
|
Interest expense |
14,400 |
15,629 |
10,060 |
|
Interest capitalized (a) |
- |
- |
(268) |
|
Interest income |
(372) |
(1,348) |
(969) |
|
Interest expense, net |
14,028 |
14,281 |
8,823 |
(a) Interest capitalized in 2007 relates to the installation of new bar-forming equipment in the Fruit Group’s Healthy Fruit Snack division.
At December 31, 2009, the Company was in compliance with its financial covenants, which relate to the Canadian line of credit facility, the U.S. line of credit facility (notes 8(a) and (b)), as well as the term loan facilities.
10. Preferred shares of subsidiary company
On June 7, 2007, the Company’s subsidiary, SunOpta BioProcess, completed a private placement for the sale of 1,500,000 non-dividend bearing, convertible preferred shares of SunOpta BioProcess for gross proceeds of $30,000. SunOpta BioProcess incurred issuance costs of approximately $2,808 in relation to this preferred share offering, including the fair value (non-cash) of $762 assigned to warrants of SunOpta granted to investors as part of the financing. These issuance costs have been offset against the carrying value of the preferred shares. The preferred shares do not bear any dividend and contain a conversion feature that allows the holders to convert the preferred shares to common shares of SunOpta BioProcess at any time on a one-for-one basis. At any time following the seventh anniversary of the closing date (June 7, 2014) or upon the occurrence of a change in control, holders of the majority of preferred shares will have the right to require SunOpta BioProcess to redeem all of the preferred shares for a cash payment equal to the original issue price ($20 per share, in aggregate $30,000). Should SunOpta BioProcess complete a qualified initial public offering (defined in the preferred share agreement as greater than $50,000), the preferred shares would automatically be converted into common shares of SunOpta BioProcess upon closing of the transaction, resulting in a dilution of SunOpta’s interest from 100% to approximately 86%. Should the restricted stock units (“RSU”) and stock options, described below, be converted along with the preferred shares upon completion of a qualified initial public offering, the Company’s ownership in SunOpta BioProcess would be diluted to 75%. In the event that a qualified initial public offering does not occur by June 7, 2014, the preferred shareholders would have the option to redeem their shares for a cash payment equal to the original issue price of $20 per share. The preferred shares are classified on the consolidated balance sheet as mezzanine equity as they have a mandatory redemption feature after seven years if a qualified initial public offering does not take place.
Included in the issuance costs discussed above is the fair value of $762 attributed to warrants to purchase 648,300 common shares of SunOpta Inc. at a price of $11.57 (exercisable within six months of the date of closing) that were granted to the SunOpta BioProcess preferred share investors upon the closing of the transaction.
The fair value of these warrants was determined using the Black-Scholes option pricing model (using an expected volatility of 40.2%, a risk-free interest rate of 4.99% and an estimated useful life of six months). During the fourth quarter of 2007, the warrant holders exercised their warrants, resulting in cash proceeds to SunOpta of $7,501 (note 11(a)).
- F29 -
| SunOpta Inc. |
| Notes to Consolidated Financial Statements |
| For the years ended December 31, 2009, 2008 and 2007 |
| (Expressed in thousands of U.S. dollars, except per share amounts) |
10. Preferred shares of subsidiary company continued
The preferred shares are presented net of issuance costs (with no associated tax benefit) and the value of the preferred shares is being accreted to the $30,000 redemption value over a seven-year period using the effective interest method. Included in interest expense during the year ended December 31, 2009 is $391 (2008 - $387) of accretion expense.
In conjunction with the private placement, SunOpta BioProcess granted 800,000 restricted stock units and 800,000 stock options (with an exercise price of $20 per share) in SunOpta BioProcess common shares to certain employees of SunOpta BioProcess. The RSUs allow for a cash payment or the grant of shares to certain employees equal to the issuance price in a future initial public offering (to a maximum of $20 per share). The RSUs and the stock options granted only vest if a change of control of SunOpta BioProcess occurs, or SunOpta BioProcess completes a qualified initial public offering and, as such, these units are considered performance-based awards under ASC topic 718 (formerly SFAS No. 123R)). Accordingly, no expense is recorded in the consolidated financial statements until the contingent element of the award has been resolved. The RSUs expire 10 days after vesting whereas, unless terminated earlier in accordance with SunOpta BioProcess’ stock option plan, the stock options expire on the seventh anniversary of the closing date (i.e. June 7, 2014). Should SunOpta BioProcess complete an initial public offering, the RSUs and stock options could be converted into common shares of SunOpta BioProcess upon closing of the transaction, resulting in a dilution of SunOpta Inc.’s wholly owned interests in SunOpta BioProcess to 85%.
At the date of the grant, the Company has estimated that the fair value associated with the stock option grant is $11,025 and RSUs is $14,400. The fair value of the options was calculated using the Black-Scholes option pricing model with the assumptions of a dividend yield of 0%, an expected volatility based on industry peers of 81.25%, a risk-free interest rate of 5.11% and an estimated useful life of up to 7 years. The fair value is based on estimates of the number of options that management expects to vest, estimated to be 90%. The fair value of the RSUs is calculated using the maximum $20 per share that could be paid. Given that no market exists for SunOpta BioProcess’s common shares, there exists significant measurement uncertainty in assessing the fair values of the RSUs and stock options.
- F30 -
| SunOpta Inc. |
| Notes to Consolidated Financial Statements |
| For the years ended December 31, 2009, 2008 and 2007 |
| (Expressed in thousands of U.S. dollars, except per share amounts) |
11. Capital stock
The Company is authorized to issue an unlimited number of common shares without par value and an unlimited number of special shares without par value (of which none are outstanding).
The following is a summary of changes in the Company’s capital stock:
|
|
Warrants and rights |
Common shares |
Total |
||
|
|
Number |
$ |
Number |
$ |
$ |
|
Balance at December 31, 2006 |
- |
- |
57,672,053 |
112,318 |
112,318 |
|
|
|
|
|
|
|
|
Warrants issued (a) |
648,300 |
762 |
- |
- |
762 |
|
Warrants exercised (a) |
(648,300) |
(762) |
648,300 |
8,263 |
7,501 |
|
Options exercised (b) |
- |
- |
570,455 |
3,201 |
3,201 |
|
Employee share purchase plan and |
|
|
|
|
|
|
Equity offering (d) |
- |
- |
5,175,000 |
51,882 |
51,882 |
|
Balance at December 31, 2007 |
- |
- |
64,149,593 |
176,547 |
176,547 |
|
|
|
|
|
|
|
|
Options exercised (b) |
- |
- |
65,580 |
559 |
559 |
|
Employee share purchase plan (c) |
- |
- |
275,647 |
739 |
739 |
|
Treasury (c) |
- |
- |
2,500 |
13 |
13 |
|
Balance at December 31, 2008 |
- |
- |
64,493,320 |
177,858 |
177,858 |
|
|
|
|
|
|
|
|
Employee share purchase plan (c) |
- |
- |
487,148 |
823 |
823 |
|
Treasury (c) |
- |
- |
2,500 |
13 |
13 |
|
Balance at December 31, 2009 |
- |
- |
64,982,968 |
178,694 |
178,694 |
(a) Warrants exercised
In conjunction with the preferred shares issued by a subsidiary (note 10), 648,300 warrants to purchase common shares of the Company were issued. A non-cash fair value of $762 was assigned to these warrants, using the Black-Scholes option pricing model (note 10). In the fourth quarter of 2007, all 648,300 warrants were exercised at a share price of $11.57, resulting in net proceeds of $7,501 to the Company.
(b) Employee/director option plans
Details of changes in employee/director stock options are as follows:
|
|
2009 |
2008 |
2007 |
|
Outstanding options at beginning of year |
1,833,375 |
1,846,130 |
2,005,885 |
|
Options granted |
1,078,000 |
574,000 |
528,000 |
|
Options exercised |
- |
(65,580) |
(570,455) |
|
Options forfeited or expired |
(430,950) |
(521,175) |
(117,300) |
|
Outstanding options at end of year |
2,480,425 |
1,833,375 |
1,846,130 |
|
|
|
|
|
|
Exercisable options at end of year |
768,725 |
927,720 |
1,279,520 |
|
Weighted average fair value of options granted
|
|
|
|
- F31 -
| SunOpta Inc. |
| Notes to Consolidated Financial Statements |
| For the years ended December 31, 2009, 2008 and 2007 |
| (Expressed in thousands of U.S. dollars, except per share amounts) |
11. Capital stock continued
The Company grants options to employees and directors from time to time under employee/director stock option plans. The Board of Directors of the Company has authorized and approved 5,000,000 (2008 – 5,000,000) shares to be made available from the 2002 stock option plan. As at December 31, 2009, 1,006,875 (2008 – 1,653,835) options are remaining to be granted under this plan.
The following is a summary of options granted during the year.
|
|
|
|
|
Number of vested |
|
Grant date |
Expiry date |
Exercise price |
Number of options |
options |
|
March 5, 2009 |
March 5, 2015 |
$0.95 |
5,000 |
- |
|
March 11, 2009 |
March 11, 2015 |
$0.91 |
10,000 |
- |
|
March 16, 2009 |
March 16, 2015 |
$0.97 |
25,000 |
- |
|
May 7, 2009 |
May 7, 2015 |
$1.92 |
150,000 |
- |
|
May 14, 2009 |
May 14, 2015 |
$1.64 |
888,000 |
- |
|
Total |
|
|
1,078,000 |
|
Employee/director stock options granted by the Company contain an exercise price, which is equal to the closing market price of the shares on the day prior to the grant date. Any consideration paid by employees on exercise of stock options or purchase of stock is credited to capital stock.
During the year, the Company granted 1,078,000 options which vest 215,600 per annum from 2010 to 2014. During 2009, nil (2008 – 65,580) options were exercised and the equivalent number of common shares was issued for net proceeds of $nil (2008 - $264).
Loss for the year ended December 31, 2009 includes $1,435 (2008 - $1,106) of compensation expense related to the Company’s stock-based compensation arrangements, including $285 (2008 - $301) in stock-based compensation for the options issued by Opta Minerals to its employees. The Company also realized a cash tax benefit of $6 (2008 - $23) relating to options granted in prior years and exercised in the current year. The benefit was recorded as an increase to additional paid-in capital. Total compensation costs related to non-vested awards not yet recognized as an expense is $3,211 as at December 31, 2009. The weighted average period over which this is expected to be recognized is 2.1 years.
The assumptions used in determining the fair value of the options granted in 2009, 2008 and 2007 were as follows:
|
|
2009 |
2008 |
2007 |
|
Dividend yield |
0% |
0% |
0% |
|
Expected volatility |
71% |
57% |
54% |
|
Risk-free interest rate |
2% |
3% |
4% |
|
Expected life of options (in years) |
6 |
6 |
6 |
The fair value of the options is based on estimates of the number of options that management expects to vest, which was estimated to be 85% of the granted amount.
- F32 -
| SunOpta Inc. |
| Notes to Consolidated Financial Statements |
| For the years ended December 31, 2009, 2008 and 2007 |
| (Expressed in thousands of U.S. dollars, except per share amounts) |
11. Capital stock continued
Details of employee/director stock options outstanding as at December 31, 2009 are as follows:
|
|
|
Vested |
Weighted |
Total |
Weighted |
|
|
Exercise price |
outstanding |
average price |
outstanding |
average price |
|
Expiry date |
range |
options |
(vested) |
options |
(total) |
|
2010 |
$4.52 to $6.81 |
404,225 |
$5.75 |
404,225 |
$5.75 |
|
2011 |
$5.14 to $10.00 |
70,200 |
$9.40 |
89,600 |
$9.39 |
|
2012 |
$10.86 to $11.66 |
94,800 |
$11.28 |
158,000 |
$11.28 |
|
2013 |
$12.31 to $13.75 |
93,600 |
$12.50 |
234,000 |
$12.50 |
|
2014 |
$4.06 to $13.35 |
105,900 |
$5.97 |
529,500 |
$5.97 |
|
2015 |
$0.91 to $1.92 |
- |
- |
1,065,100 |
$1.65 |
|
|
|
768,725 |
|
2,480,425 |
|
The weighted average remaining contractual life for vested outstanding options and total outstanding options is 1.8 and 4.0 years, respectively (2008 – 1.6 and 3.3 years, respectively; 2007 – 2.0 and 2.9 years, respectively).
(c)
Employee share purchase plan/compensation grants
The Company maintains an employee share purchase plan whereby employees can purchase common shares through payroll deductions. In 2009, the Company’s employees purchased 487,148 common shares (2008 –275,647; 2007 – 78,785) for total proceeds of $834 (2008 - $739; 2007 - $826). As at December 31, 2009, 1,872,995 (2008 – 360,143) common shares are remaining to be granted under this plan, after an additional 2,000,000 common shares were approved to be added to the plan during 2009.
Based on the terms of his employment contracts, the Company’s President and Chief Executive Officer received an award of 10,000 shares of the Company’s stock during 2007. The stock was granted 25% in 2007, with the remaining 75% to be granted in equal installments on the grant date anniversary for each of the next three years. Accordingly, 2,500 shares were issued from treasury and the Company recognized stock-based compensation costs of $13 in 2009 (2008 - $13).
(d)
Equity offering
On February 13, 2007, the Company issued 5,175,000 common shares at a price of $10.40 per common share in respect of a public offering, for gross proceeds of $53,820. The Company incurred share issuance costs of $1,938, net of a $920 tax benefit, for net proceeds of $51,882.
(e)
Rights offering
On October 6, 2008, the Company approved the Shareholder Rights Plan Agreement, which was issued to provide the Company sufficient time to develop and implement alternatives to maximize value for all shareholders in the event of an unsolicited bid for control of the Company, and to enhance the Company’s ability to prevent any unfair acquisition tactics. The Shareholder Rights Plan Agreement expired on April 2, 2009, and is no longer of further force or effect.
- F33 -
| SunOpta Inc. |
| Notes to Consolidated Financial Statements |
| For the years ended December 31, 2009, 2008 and 2007 |
| (Expressed in thousands of U.S. dollars, except per share amounts) |
12. (Loss) earnings per share
The calculation of basic earnings per share is based on the weighted average number of shares outstanding. Diluted earnings per share reflects the dilutive effect of the potential exercise of warrants and options. The number of shares for the diluted earnings per share was calculated as follows:
|
|
2009 |
2008 |
2007 |
|
Weighted average number of shares used in
|
|
|
|
|
Dilutive potential of the following: |
|
|
|
|
Employee/director stock options |
- |
- |
619,341 |
|
Weighted average number of shares used in
|
|
|
|
|
|
|
|
|
|
(Loss) earnings for the year attributable to SunOpta Inc. |
($6,763) |
($10,936) |
$407 |
|
|
|
|
|
|
(Loss) earnings per share |
|
|
|
|
Basic |
($0.10) |
($0.17) |
$0.01 |
|
Diluted |
($0.10) |
($0.17) |
$0.01 |
Due to the net loss in 2009 and 2008, options to purchase 2,480,425 and 1,833,375, respectively, have been excluded from the calculation of diluted earnings per share due to their anti-dilutive effect. During 2007, options to purchase 278,000 common shares were excluded due to their anti-dilutive effect.
13. Income taxes
The (recovery of) provision for income taxes from continuing operations differs from the amount that would have resulted by applying the combined Canadian federal and provincial statutory income tax rate to (loss) earnings before income taxes due to the following:
|
|
2009 |
2008 |
2007 |
|
|
$ |
$ |
$ |
|
Income tax (recovery) provision at combined statutory rate |
(3,652) |
(2,976) |
(1,633) |
|
|
|
|
|
|
Increase (decrease) by the effects of: |
|
|
|
|
Impact of foreign exchange |
(2,171) |
(1,314) |
(127) |
|
Change in valuation allowance |
3,149 |
3,985 |
- |
|
Foreign tax rate differential |
(822) |
(1,347) |
(596) |
|
Impact of enacted tax rates |
1,743 |
845 |
453 |
|
Benefit of cross-jurisdictional financing structures |
(3,126) |
(3,893) |
(2,968) |
|
Impact of non-deductible (non-taxable) gains and losses |
(1,051) |
266 |
(243) |
|
Impact of goodwill impairment |
2,625 |
3,833 |
- |
|
SRED and other ITC’s carried forward in the year |
(456) |
- |
- |
|
Impact of FIN 48 on current year tax expense |
(455) |
3,639 |
- |
|
Other |
2,454 |
(2,248) |
(987) |
|
(Recovery of) provision for income taxes |
(1,762) |
790 |
(6,101) |
- F34 -
| SunOpta Inc. |
| Notes to Consolidated Financial Statements |
| For the years ended December 31, 2009, 2008 and 2007 |
| (Expressed in thousands of U.S. dollars, except per share amounts) |
13. Income taxes continued
The components of the provision (recovery) for Canada, the United States and other income taxes are shown below:
|
|
2009 |
2008 |
2007 |
|
|
$ |
$ |
$ |
|
Current income tax provision: |
|
|
|
|
Canada |
3,045 |
1,530 |
872 |
|
United States |
(703) |
1,272 |
1,742 |
|
Other |
(885) |
348 |
37 |
|
|
1,457 |
3,150 |
2,651 |
|
|
|
|
|
|
Deferred income tax (recovery) provision: |
|
|
|
|
Canada |
(4,376) |
(635) |
(1,679) |
|
United States |
(37) |
(1,489) |
(7,073) |
|
Other |
1,194 |
(236) |
- |
|
|
(3,219) |
(2,360) |
(8,752) |
|
(Recovery of) provision for income taxes |
(1,762) |
790 |
(6,101) |
Deferred income taxes of the Company are comprised of the following:
|
|
2009 |
2008 |
2007 |
|
|
$ |
$ |
$ |
|
Differences in property, plant and equipment and intangible assets |
(25,413) |
(24,174) |
(22,715) |
|
Capital and non-capital losses |
31,040 |
24,325 |
16,007 |
|
Tax benefit of scientific research expenditures |
5,088 |
3,088 |
4,104 |
|
Tax benefit of costs incurred during share issuances |
613 |
1,036 |
1,698 |
|
Inventory basis differences and reserves |
4,530 |
4,065 |
5,663 |
|
Other accrued reserves |
1,468 |
491 |
1,834 |
|
|
17,326 |
8,831 |
6,591 |
|
Less: Valuation allowance |
9,843 |
5,792 |
2,162 |
|
Net deferred income tax asset |
7,483 |
3,039 |
4,429 |
The components of the deferred income tax asset (liability) for Canada, the United States and other are shown below:
|
|
2009 |
2008 |
2007 |
|
|
$ |
$ |
$ |
|
Canada |
11,584 |
5,907 |
6,776 |
|
United States |
(806) |
(827) |
(2,347) |
|
Other |
(3,295) |
(2,041) |
- |
|
|
7,483 |
3,039 |
4,429 |
- F35 -
| SunOpta Inc. |
| Notes to Consolidated Financial Statements |
| For the years ended December 31, 2009, 2008 and 2007 |
| (Expressed in thousands of U.S. dollars, except per share amounts) |
13. Income taxes continued
The components of the deferred income tax valuation allowance are as follows:
|
|
2009 |
2008 |
2007 |
|
|
$ |
$ |
$ |
|
Balance, beginning of year |
5,792 |
2,162 |
434 |
|
Adjustments to valuation allowance as a result of |
|
|
|
|
acquisitions and foreign exchange |
902 |
(355) |
29 |
|
Increase in valuation allowance |
3,149 |
3,985 |
1,699 |
|
Balance, end of year |
9,843 |
5,792 |
2,162 |
The Company has approximately $13,692 (2008 - $8,685) in Canadian scientific research expenditures, which can be carried forward indefinitely to reduce future years’ taxable income. The Company also has approximately $1,818 and $646 (2008 – $752 and $561) in Canadian and U.S. scientific research investment tax credits and $243 (2008 - $243) in Massachusetts research and development tax credits, which will expire in varying amounts up to 2029.
The Company has Canadian and U.S. federal non-capital loss carry-forwards of approximately $50,370 and $36,266, respectively, as at December 31, 2009 (2008 - $29,827 and $46,268). The Company also has state loss carry- forwards of approximately $20,731 as at December 31, 2009 (2008 - $22,028). The amounts are available to reduce future federal and provincial/state income taxes. Non-capital loss carry-forwards attributable to Canada expire in varying amounts over the next 20 years while non-capital loss carry-forwards attributable to the United States expire in varying amounts over the next 20 years.
The Company has Canadian capital losses of approximately $14,719 as at December 31, 2009 (2008 - $5,714) for which a full valuation allowance exists. These amounts are available to reduce future capital gains. Capital losses in Canada do not expire.
The Company records net deferred tax assets to the extent it believes these assets will more likely than not be realized. In making such determinations, the Company considers all available positive and negative evidence, including future reversals of existing temporary differences, projected future taxable income, tax planning strategies and recent financial operations. Based on this evaluation, a valuation allowance of $9,843 (2008 - $5,792) has been recorded against certain assets to reduce the net benefit recorded in the consolidated financial statements.
The Company has not provided Canadian deferred taxes on cumulative earnings of non-Canadian affiliates and associated companies that have been reinvested indefinitely. Deferred taxes are provided for earnings of non-Canadian affiliates and associated companies when the Company determines that such earnings are no longer indefinitely reinvested.
In June 2006, the FASB issued ASC 740, which clarifies the accounting for uncertainty in income taxes recognized in an enterprise’s financial statements. This topic prescribes a recognition threshold and measurement attribute for the financial statement recognition and measurement of a tax position taken or expected to be taken in a tax return. This interpretation also provides guidance on derecognition, classification, interest and penalties, accounting in interim periods, disclosure, and transition. As a result of adopting ASC 740, the Company recognized a decrease in the liability for unrecognized tax benefits of approximately $100, which was accounted for as an increase in opening retained earnings on January 1, 2007. While the Company believes it has adequately examined its tax positions under ASC 740, amounts asserted by taxing authorities could differ from the Company’s position. Accordingly, additional provisions on federal, provincial, state and foreign tax-related matters could be recorded in the future as revised estimates are made or the underlying matters are settled or otherwise resolved.
- F36 -
| SunOpta Inc. |
| Notes to Consolidated Financial Statements |
| For the years ended December 31, 2009, 2008 and 2007 |
| (Expressed in thousands of U.S. dollars, except per share amounts) |
13. Income taxes continued
A reconciliation of the beginning and ending amount of unrecognized tax benefits (excluding interest and penalties) is as follows:
|
Balance at December 31, 2008 |
3,639 |
|
Additions based on tax positions related to the current year |
247 |
|
Reductions resulting from lapse of applicable statute of limitations |
(769) |
|
Balance at December 31, 2009 |
3,117 |
The Company’s unrecognized tax benefits largely include a possible reduction to prior year losses for U.S. exposures relating to the deductibility of certain interest amount accrued. The Company believes that it is reasonably possible that a decrease of up to $549 in unrecognized tax benefits related to tax exposures in the United States may be necessary within the coming year.
Consistent with its historical financial reporting, the Company has classified interest and penalties related to income tax liabilities, when applicable, as part of interest expense in its consolidated statements of operations. The Company recognized $nil in potential interest and penalties associated with unrecognized tax benefits for the year ended December 31, 2009 (2008 - $nil). The unrecognized tax benefits have been recorded as a reduction of long-term deferred tax assets. All of the unrecognized tax benefits could impact the Company's effective tax rate if recognized.
The number of years with open tax audits varies depending on the tax jurisdiction. The Company’s major taxing jurisdictions include Canada, the Province of Ontario and the United States (including multiple states). The Company’s 2006 through 2009 tax years (and any tax year for which available non-capital loss carry-forwards were generated up to the amount of non-capital loss carry-forward) remain subject to examination by the Internal Revenue Service for U.S. federal tax purposes, and the 2003 through 2009 tax years remain subject to examination by the appropriate governmental agencies for Canadian federal tax purposes. There are other ongoing audits in various other jurisdictions that are not considered material to the Company’s consolidated financial statements.
14. Supplemental cash flow information
|
|
2009 |
2008 |
2007 |
|
|
$ |
$ |
$ |
|
Changes in non-cash working capital, net of businesses |
|
|
|
|
acquired: |
|
|
|
|
Accounts receivable |
4,912 |
3,261 |
(8,636) |
|
Inventories |
26,725 |
(753) |
(47,204) |
|
Prepaid expenses and other current assets |
1,907 |
1,489 |
(1,720) |
|
Income taxes recoverable |
153 |
1,077 |
501 |
|
Accounts payable and accrued liabilities |
(6,612) |
8,361 |
9,302 |
|
Customer and other deposits |
211 |
(66) |
370 |
|
|
27,296 |
13,369 |
(47,387) |
|
|
|
|
|
|
Cash paid for |
|
|
|
|
Interest |
11,268 |
12,758 |
10,058 |
|
|
|
|
|
|
Income taxes |
1,240 |
1,646 |
259 |
- F37 -
| SunOpta Inc. |
| Notes to Consolidated Financial Statements |
| For the years ended December 31, 2009, 2008 and 2007 |
| (Expressed in thousands of U.S. dollars, except per share amounts) |
15. Related party transactions and balances
In addition to transactions disclosed elsewhere in these consolidated financial statements, the Company entered into the following related party transactions:
| (a) |
Pursuant to the Pro Organics acquisition, the Company leased its Pro Organics Vancouver, British Columbia, Canada, warehouse and administration facility from a company controlled by a former owner who remains a senior manager within the Distribution Group. The lease was at market rates at inception and is for a five- year term with two five-year renewal periods, expiring in 2018. The total amount paid during 2009 was $355 (2008 - $395; 2007 - $363). |
|
(b) |
The former President of the Distribution Group (who was an employee until March 2009) sold $2,973 (2008- $2,521; 2007 - $1,491) of organic product from his family farming operation, at market rates, to theDistribution Group during 2009 and was owed $nil (2008 – $53) by the Company as at December 31, 2009. |
| (c) |
The President of the Grains and Foods Group purchased $494 (2008 - $128; 2007 - $99) of agronomy products from the group during 2009 at market rates and had a balance payable to the Company as at December 31, 2009 of $nil (2008 - $146). In addition, the President of the Grains and Foods Group sold through a family farming business $134 (2008 - $476; 2007 - $341) of soybeans and corn to the Grains and Foods Group at market rates. |
| (d) |
Other senior level managers of the Grains and Foods Group purchased $1,151 (2008 - $930; 2007 - $651) of agronomy products from the group during 2009 at market rates and had a balance payable to the Company as at December 31, 2009 of $30 (2008 - $168). In addition, the other senior level managers of the Grains and Foods Group sold $308 (2008 - $364; 2007 - $251) of soybeans and corn to the Grains and Foods Group at market rates. |
| (e) |
Pursuant to the acquisition of Les Importations Cacheres Hahamovitch Inc., the Company leased Les Importations Cacheres Hahamovitch Montreal, Quebec, warehouse and administration facility from the former owner who remains a senior manager within Distribution Group. The lease was at market rates at inception and is renewable annually for a 12 month term for each of the next five years. During 2009, the Company paid $136 (2008 - $141; 2007 - $136) to the former owner. |
| (f) |
Pursuant to the acquisition of Cleugh’s Frozen Foods Inc. (Cleugh’s) the Company leased Cleugh’s Buena Park, California, production, packaging and warehouse facility from the former owners, one of whom was an employee of the Company to July 2008. The lease was at market rates at inception and is for a five-year term expiring in 2010. During 2008, the Company paid $240 (2007 - $240) to the former employees. |
|
(g) |
Pursuant to the acquisition of Purity Life, the Company leased Purity Life’s Acton, Ontario, warehouses and administration facilities from a company controlled by the former owners, one of whom remains in a senior management position within the Distribution Group. The lease was at market rates at inception and is for a 63-month term with a five-year renewal period expiring in 2011. During 2009, the Company paid $426 (2008 - $467; 2007 - $452) to the former owners. |
| (h) |
Pursuant to the acquisition of Neo-Nutritionals, Inc. in December 2007, the Company leased the Brantford, Ontario production facilities from a company controlled by a former owner, who was an employee of the Company to December 2009. The lease was at market rates expiring on November 30, 2010, with two three- year renewal periods. During 2009, the Company paid $155 (2008 - $157; 2007 - $14) to the former owner. |
| (i) |
Pursuant to the acquisition of Pacific Fruit Processors, the Company leases a production, warehouse and office facility from a related party to the former President, who remains in a senior management position in the Fruit Group. The lease was at market rates at inception and is for a 60 month term with two five-year renewal periods expiring in June 2020. During 2009, the Company paid $439 (2008 - $375; 2007 - $360) to the former owner. |
- F38 -
| SunOpta Inc. |
| Notes to Consolidated Financial Statements |
| For the years ended December 31, 2009, 2008 and 2007 |
| (Expressed in thousands of U.S. dollars, except per share amounts) |
15. Related party transactions and balances continued
| (j) |
On February 1, 2007, the Chief Executive Officer (“former CEO”) of the Company stepped down and remained Chairman of the Board at a reduced level of compensation subject to a contract expiring on February 26, 2020. The contract provides for consulting fees of $75 per year plus a bonus, (amended to $200 until March 31, 2010) declining to $25 per year, to be paid on a sliding scale over time until February 26, 2020. Subsequent to the year 2012, the former CEO is no longer required to provide services to the Company although payments will continue. In the event that the former CEO passes away before February 26, 2020, any remaining amount payable under the contract will be paid to his surviving spouse until February 26, 2020. Included in long-term liabilities is $343 related to this agreement. |
| (k) |
Pursuant to the appointment of a new director to Opta Minerals on May 12, 2008, the following transactions and balances are classified as related party: |
|
Included in long-term debt is a promissory note in the amount of $1,500 (2008 - $3,000) with annual instalments of $1,500 plus interest at 5.6%. The promissory note and accrued interest are payable to the former shareholders of Magtech (a 2006 Opta Minerals acquisition). As a result of the previous shareholdings, the director receives 26.5% of the total payment. | |
|
Pursuant to the Opta Minerals acquisition of Bimac, additional consideration, not to exceed $3,850, may be payable based on the achievement of certain pre-determined earnings targets to September 2016. As a result of the previous shareholdings, the director receives 61.7% of any additional consideration payments. Due to the downturn in the economy that led to the goodwill impairment charge at Opta Minerals (note 6), $1,110 of contingent consideration was written-off in 2009 to other expense, net, along with the goodwill related to the liability. | |
|
Opta Minerals rents a facility to SunOpta BioProcess Inc., an affiliated company, and received rent revenue in the amount of $22 during the year ended December 31, 2009 (2008 - $nil). | |
| (l) |
Other amounts due to/from officers/directors of the Company included in accounts receivable as at December 31, 2009 were $2 (2008 - $9). |
16. Commitments and contingencies
(a) Securities class action lawsuits
The Company and certain officers (one of whom is a director) and a former director were named as defendants in proposed class action lawsuits in the United States. These lawsuits were filed between January 28, 2008 and March 19, 2008 in the United States District Court for the Southern District of New York. These actions were also filed against two Company Officers, one of whom is a director, as well as a former director who was named in certain actions. The Company was alleged to have violated Section 10(b) of the Securities Exchange Act of 1934 and Rule 10b-5 promulgated thereunder by the United States Securities and Exchange Commission (“SEC”). Additionally, the named officers and directors (one of whom is a former director) were alleged to have violated Section 20(a) of the Securities Exchange Act of 1934. The complaints alleged different proposed class periods. They have now been consolidated into one class action with lead plaintiffs. On January 28, 2009, the Court appointed Western Washington Laborers-Employers Pension Trust and Operating Engineers Construction Industry and Miscellaneous Pension Fund (the “Pension Funds”) as the lead plaintiffs in one consolidated class action aggregating the various class action lawsuits. On April 14, 2009, the lead plaintiffs filed their consolidated and amended complaint in the US District Court in the Southern District of New York. The new complaint includes new allegations under Sections 11, 12 and 15 of the Securities Act of 1933 as well as four new individual defendants, two of whom are former senior management employees (one also a former director and officer), one is a current director and chairman and one is currently a senior employee. The new complaint also added three corporate defendants namely, Cleugh’s Frozen Foods, Inc. and Pacific Fruit Processors, Inc. (each of which are now part of the merged subsidiary, SunOpta Fruit Group, Inc.) and Organic Ingredients, Inc. (which is now known as SunOpta Global Organic Ingredients, Inc.).
- F39 -
| SunOpta Inc. |
| Notes to Consolidated Financial Statements |
| For the years ended December 31, 2009, 2008 and 2007 |
| (Expressed in thousands of U.S. dollars, except per share amounts) |
16. Commitments and contingencies continued
Similarly, one proposed class action lawsuit has also been filed in Canada in the Ontario Superior Court of Justice on behalf of shareholders who acquired securities of the Company between May 8, 2007 and January 25, 2008 (and further amended to cover the period from February 23, 2007 and to January 27, 2008) against the Company and certain officers (one of whom is a director), alleging misrepresentation and proposing to seek leave from the Ontario court to bring statutory misrepresentation civil liability claims under the Ontario Securities Act. On August 29, 2008, the plaintiff filed a motion to amend the claims against the Company to include additional allegations. The Canadian plaintiffs claim compensatory damages of Cdn $100,000 and punitive damages of Cdn $10,000 and other monetary relief.
On September 24, 2009 the Company announced that it entered into a tentative agreement to settle all claims raised in these proposed class action proceedings. In return for the dismissal of the class actions and releases from proposed class members of settled claims against the Company and other named defendants, the settlement agreement provides for a total cash contribution of $11,250 to a settlement fund, the adoption of certain governance enhancements to the Company’s Audit Committee charter and Internal Audit Charter and the adoption of an enhanced information technology conversion policy. The settlement fund will be entirely funded by the Company’s insurers. The settlement is conditional upon the Courts’ approval and subject to SunOpta’s option to terminate it in the event of valid opt-outs by proposed class members that exceed a pre-agreed threshold.
The Ontario Superior Court and U.S. District Court have each granted preliminary approval of the settlement agreement and, for the purposes of the settlement only, have certified the lawsuits as class actions. The courts have scheduled hearings on May 3, 2010 (Canada) and May 17, 2010 (US) to determine whether they will grant final approval of the proposed settlement agreement. According to the notice of proposed settlement sent to class members on or about February 10, 2010, class members have until April 12, 2010 to opt out of the settlement.
In the event the proposed settlement agreement is not approved by the courts or SunOpta elects to terminate it if there is a high number of opt-outs by class members, the settlement agreement will be void and management’s intention is to vigorously defend these actions. Given the current status of the class actions it is not possible to determine the probability of liability, if any, or estimate the loss, if any, that might arise from these lawsuits. Accordingly, no accrual has been made at this time for these contingencies.
(b) Formal investigation by the SEC
In 2008 the Company received letters from the SEC requesting additional information in connection with the restatement of the Company’s filings for each of the quarterly periods ended March 31, 2007, June 30, 2007, and September 30, 2007. Additionally, the SEC has conducted interviews with certain current and past employees, current and former members of the Company’s Audit Committee, as well as the Company’s previous external auditors. The Company continues to cooperate with the requests from the SEC in connection with its formal investigation. An enforcement action by the SEC could result in expense in the form of sanctions, fines or other levies. Management cannot conclude whether the prospect of an unfavourable outcome in this matter is probable, or estimate the loss, if any, that might arise from any enforcement action taken against the Company or its officers. Accordingly, no accrual has been made at this time for this contingency.
- F40 -
| SunOpta Inc. |
| Notes to Consolidated Financial Statements |
| For the years ended December 31, 2009, 2008 and 2007 |
| (Expressed in thousands of U.S. dollars, except per share amounts) |
16. Commitments and contingencies continued
(c) SunOpta BioProcess lawsuit against Abengoa and Abener arbitration
The Company commenced a suit on January 17, 2008, against Abengoa New Technologies Inc. (“Abengoa”) and a former employee of the Company alleging theft of trade secrets, breach of contract, tortious interference with contract and civil conspiracy, and filed motions for expedited discovery and a preliminary injunction. Abengoa filed a counterclaim alleging breach of contract, misappropriation of trade secrets and other contractual violations. The United States District Court, Eastern District of Missouri, referred the core claims to arbitration and stayed the other claims pending the outcome of the arbitration. The arbitration was held during the period of July 20 to July 24 and October 19 to October 23 inclusive, in St. Louis before a single arbitrator. The arbitrator issued a ruling on February 1, 2010 denying all monetary damage claims, but also holding that the Company could independently commercialize, without payment of royalty or other obligation to Abengoa, the dilute acid hydrolysis technology the Company developed with Abengoa and implemented at Abengoa’s cellulosic ethanol facility in Salamanca, Spain. Prior to the arbitrator’s ruling, Abengoa had exclusive use, and rights to exploit, the jointly developed technology in the field of fermentable sugars and cellulosic ethanol production.
In January 2008, a customer of the Company, Abener Energia S.A. (an affiliate of Abengoa), terminated a contract valued at approximately $7,000 for the delivery of equipment and related services, forcing the matter into arbitration under its provisions. In December 2008, the arbitrator rendered his final decision partially allowing Abener’s claim and awarded Abener approximately €1,329 (U.S. - $1,903) in damages. Abener’s Canadian counsel brought an application in Ontario for the enforcement of the award and a decision was rendered in support of the enforcement of the award. Subsequent to year-end, the Company satisfied the Canadian judgment, and the Spanish arbitration award, by payment.
(d) Vargas Class Action
In September 2008, a single plaintiff and a former employee, Mr. Vargas, filed a wage and hour dispute, against SunOpta Fruit Group, Inc., as a class action alleging various violations of California’s labour laws (the “Vargas Class Action”). On July 16, 2009, the parties attended a mediation in San Francisco, and no settlement was reached. A second mediation was held on January 15, 2010. A tentative settlement of all claims was reached at mediation, subject to agreement on final terms of the settlement, including a plan of distribution, and approval of the settlement by the court. As a result of the tentative settlement, the Company has accrued a liability of $1,200 as at December 31, 2009.
(e) Other claims
In addition, various claims and potential claims arising in the normal course of business are pending against the Company. It is the opinion of management that these claims, or potential claims, are without merit and that the amount of potential liability, if any, to the Company is not determinable. Management believes the final determination of these claims or potential claims will not materially affect the financial position or results of the Company.
(f) Environmental laws
The Company believes, with respect to both its operations and real property, that it is in material compliance with current environmental laws. Based on known existing conditions and the Company’s experience in complying with emerging environmental issues, the Company is of the view that future costs relating to environmental compliance will not have a material adverse effect on its consolidated financial position, but there can be no assurance that unforeseen changes in the laws or enforcement policies of relevant governmental bodies, the discovery of changed conditions on the Company’s real property or in its operations, or changes in the use of such properties and any related site restoration requirements, will not result in the incurrence of significant costs.
- F41 -
| SunOpta Inc. |
| Notes to Consolidated Financial Statements |
| For the years ended December 31, 2009, 2008 and 2007 |
| (Expressed in thousands of U.S. dollars, except per share amounts) |
16. Commitments and contingencies continued
(g) Grain, sunflower and other commitments
In the normal course of business, the SunOpta Foods holds grain for the benefit of others. The Company is liable for any deficiencies of grade or shortage of quantity that may arise in connection with such grain. SunOpta Foods also has commitments to purchase $47,110 (2008 - $51,505) of grains and sunflowers in the normal course of business. In addition, the Fruit Group has entered into a number of commitments in the amount of $14,850 related to supplier and purchase commitments.
(h) Letters of credit
The Company has outstanding letters of credit at December 31, 2009 totalling $5,762 (2008 - $1,977).
(i) Real property lease commitments
The Company has entered into various leasing arrangements, which have fixed monthly rents that are adjusted annually each year for inflation.
Minimum commitments under operating leases, principally for distribution centres, warehouse and equipment, are as follows:
|
|
$ |
|
2010 |
9,918 |
|
2011 |
8,126 |
|
2012 |
6,615 |
|
2013 |
5,969 |
|
2014 |
4,555 |
|
Thereafter |
9,836 |
|
|
45,019 |
In the years 2009, 2008 and 2007, net minimum rents, including contingent rents and sublease rental income, were $11,886, $8,913 and $8,199 and respectively.
- F42 -
| SunOpta Inc. |
| Notes to Consolidated Financial Statements |
| For the years ended December 31, 2009, 2008 and 2007 |
| (Expressed in thousands of U.S. dollars, except per share amounts) |
17. Segmented information
The Company operates in three industries divided into eight operating segments:
(a)
SunOpta Foods sources, processes, packages, markets and distributes a wide range of natural, organic, kosher and specialty food products and ingredients with a focus on soy, corn, sunflower, fruit, fiber and other natural and organic food and natural health products. There are five operating segments within SunOpta Foods:
| i) |
Grains and Foods Group is focused on vertically integrated sourcing, processing, packaging and marketing of grains, grain-based ingredients and packaged products; | |
| ii) |
Ingredients Group is focused on insoluble oat and soy fiber products and works closely with its customers to identify product formulation, cost and productivity opportunities aimed at transforming raw materials into value-added food ingredient solutions; | |
| iii) |
Fruit Group consists of berry processing and fruit base operations that process natural and organic frozen strawberries, peaches, mangos and other fruits and vegetables into bulk, ingredients and packaged formats for the food service, private label retail and industrial ingredient markets. The Group also includes the Healthy Fruit Snacks operations which produce natural and organic apple-based fruit snacks; | |
| iv) |
International Sourcing and Trading Group (IST) sources raw material ingredients, as well as trades organic commodities. In addition, IST provides natural and organic food solutions to major global food manufacturers, distributors and supermarket chains with a variety of industrial and private label retail products; and | |
| v) |
Distribution Group represents the final layer of the Company’s vertically integrated natural and organic foods business model. This group operates a national natural, organic and specialty foods and natural health products distribution network in Canada and also processes and packages retail natural health products. |
(b)
Opta Minerals processes, distributes and recycles silica-free loose abrasives, roofing granules, industrial minerals and specialty sands for the foundry, steel, roofing shingles and bridge and ship-cleaning industries.
(c)
SunOpta BioProcess provides a wide range of research and development and engineering services and owns a number of patents on its proprietary steam explosion technology. It designs and subcontracts the manufacture of these systems, which are used for processing biomass for use in the biofuel, paper and food industries.
(d)
Corporate Services provide a variety of management, financial, information technology, treasury and administration services to the operating segments from the head office in Ontario, Canada, and information and shared services offices in Minnesota, U.S.A.
Effective January 1, 2008, two divisions previously included within the Ingredients Group have been transferred, one to the Grains and Foods Group and the other to the Distribution Group. The segmented information for the comparative year ended December 31, 2007 has been updated to reflect this change in presentation.
Effective July 1, 2008, the Company removed TOC and SunOpta Global Organic Ingredients from the Fruit Group and created a new segment called International Sourcing and Trading. These segments reflect how the Company manages the business, and distinguishes between the processing of fresh fruit and vegetables primarily in the southern United Sates and Mexico, and the sourcing and processing of organic products from outside North America. The segmented information for the comparative year ended December 31, 2007 has been updated to reflect this change in presentation.
- F43 -
| SunOpta Inc. |
| Notes to Consolidated Financial Statements |
| For the years ended December 31, 2009, 2008 and 2007 |
| (Expressed in thousands of U.S. dollars, except per share amounts) |
17. Segmented information continued
Also effective July 1, 2008, the Company allocated the former SunOpta BioProcess and Corporate Group into two segments: SunOpta BioProcess and Corporate Services. In previous years the Company had combined these two segments, as revenues of SunOpta BioProcess were less than 1% of consolidated revenues. The segmented information for the comparative year ended December 31, 2007 has been updated to reflect this change in presentation.
The Company’s assets, operations and employees are principally located in Canada, the United States, Mexico, Europe, China and Africa. Revenues are allocated to the United States, Canada and Europe and other external markets based on the location of the customer. Other expense, net, goodwill impairment, interest expense, net, and provision for (recovery of) income taxes are not allocated to the segments.
|
2009 |
|||||
|
|
SunOpta |
Opta |
SunOpta |
Corporate |
|
|
|
Foods |
Minerals |
BioProcess |
Services |
Consolidated |
|
|
$ |
$ |
$ |
$ |
$ |
|
External revenues by market: |
|
|
|
|
|
|
United States |
484,388 |
40,019 |
102 |
- |
524,509 |
|
Canada |
261,048 |
13,155 |
- |
- |
274,203 |
|
Europe and Other |
180,654 |
9,349 |
417 |
- |
190,420 |
|
Total revenues from external customers |
926,090 |
62,523 |
519 |
- |
989,132 |
|
|
|
|
|
|
|
|
Segment earnings (loss) before the following: |
20,882 |
1,161 |
(3,287) |
(4,852) |
13,904 |
|
|
|
|
|
|
|
|
Other expenses, net (note 18) |
|
|
|
|
2,587 |
|
Goodwill impairment |
|
|
|
|
8,841 |
|
Interest expense, net |
|
|
|
|
14,028 |
|
Recovery of income taxes |
|
|
|
|
(1,762) |
|
Loss for the year |
|
|
|
|
(9,790) |
|
|
|
|
|
|
|
|
Identifiable assets |
417,884 |
85,998 |
22,183 |
25,225 |
551,290 |
|
Amortization |
14,063 |
3,851 |
251 |
1,205 |
19,370 |
|
Goodwill |
43,698 |
6,019 |
- |
- |
49,717 |
|
Expenditures on property, plant |
|
|
|
|
|
Of the total goodwill impairment of $8,841, $8,341 related to the Opta Minerals segment and $500 related to the Fruit Group segment (note 6).
- F44 -
| SunOpta Inc. |
| Notes to Consolidated Financial Statements |
| For the years ended December 31, 2009, 2008 and 2007 |
| (Expressed in thousands of U.S. dollars, except per share amounts) |
17. Segmented information continued
SunOpta Foods has the following segmented reporting:
|
2009 |
||||||
|
|
Grains and |
|
|
|
|
|
|
|
Foods |
Ingredients |
Fruit |
|
Distribution |
Food |
|
|
Group |
Group |
Group |
IST |
Group |
Group |
|
|
$ |
$ |
$ |
$ |
$ |
$ |
|
External revenues by market: |
|
|
|
|
|
|
|
United States |
226,486 |
53,091 |
141,658 |
60,831 |
2,322 |
484,388 |
|
Canada |
10,805 |
7,508 |
4,859 |
4,106 |
233,770 |
261,048 |
|
Europe and Other |
87,747 |
4,058 |
926 |
86,761 |
1,162 |
180,654 |
|
Total revenues from external customers |
325,038 |
64,657 |
147,443 |
151,698 |
237,254 |
926,090 |
|
|
|
|
|
|
|
|
|
Segment earnings (loss) before |
|
|
|
|
|
|
|
the following: |
18,044 |
8,691 |
(4,073) |
(1,153) |
(627) |
20,882 |
|
|
|
|
|
|
|
|
|
Identifiable assets |
126,680 |
36,853 |
88,987 |
66,608 |
98,756 |
417,884 |
|
Amortization |
4,072 |
1,461 |
3,928 |
1,402 |
3,200 |
14,063 |
|
Goodwill |
2,936 |
12,030 |
- |
8,824 |
19,908 |
43,698 |
|
Expenditures on property, plant |
|
|
|
|
|
|
|
2008 |
|||||
|
|
SunOpta |
Opta |
SunOpta |
Corporate |
|
|
|
Foods |
Minerals |
BioProcess |
Services |
Consolidated |
|
|
$ |
$ |
$ |
$ |
$ |
|
External revenues by market: |
|
|
|
|
|
|
United States |
536,861 |
61,608 |
715 |
- |
599,184 |
|
Canada |
285,238 |
18,201 |
720 |
- |
304,159 |
|
Europe and Other |
138,217 |
13,613 |
- |
- |
151,830 |
|
Total revenues from external customers |
960,316 |
93,422 |
1,435 |
- |
1,055,173 |
|
|
|
|
|
|
|
|
Segment earnings (loss) before the following: |
22,833 |
5,531 |
(3,286) |
(8,875) |
16,203 |
|
|
|
|
|
|
|
|
Other expense, net |
|
|
|
|
1,003 |
|
Goodwill impairment |
|
|
|
|
10,154 |
|
Interest expense, net |
|
|
|
|
14,281 |
|
Provision for income taxes |
|
|
|
|
790 |
|
Loss for the year |
|
|
|
|
(10,025) |
|
|
|
|
|
|
|
|
Identifiable assets |
438,261 |
100,392 |
24,999 |
17,395 |
581,047 |
|
Amortization |
13,773 |
4,351 |
126 |
1,114 |
19,364 |
|
Goodwill |
39,862 |
14,160 |
- |
- |
54,022 |
|
Expenditures on property, plant |
|
|
|
|
|
Of the total goodwill impairment of $10,154, $8,198 related to the Fruit Group segment and $1,956 related to the IST segment (note 6).
- F45 -
| SunOpta Inc. |
| Notes to Consolidated Financial Statements |
| For the years ended December 31, 2009, 2008 and 2007 |
| (Expressed in thousands of U.S. dollars, except per share amounts) |
17. Segmented information continued
SunOpta Foods has the following segmented reporting:
|
2008 |
||||||
|
|
Grains and |
|
|
|
|
|
|
|
Foods |
Ingredients |
Fruit |
|
Distribution |
Food |
|
|
Group |
Group |
Group |
IST |
Group |
Group |
|
|
$ |
$ |
$ |
$ |
$ |
$ |
|
External revenues by market: |
|
|
|
|
|
|
|
United States |
272,298 |
55,493 |
142,661 |
65,545 |
864 |
536,861 |
|
Canada |
12,441 |
6,084 |
5,509 |
3,190 |
258,014 |
285,238 |
|
Europe and Other |
42,568 |
3,693 |
2,709 |
89,079 |
168 |
138,217 |
|
Total revenues from external customers |
327,307 |
65,270 |
150,879 |
157,814 |
259,046 |
960,316 |
|
Segment earnings (loss) before |
|
|
|
|
|
|
|
|
|
|
|
|
|
|
|
Identifiable assets |
127,971 |
38,259 |
97,647 |
85,153 |
89,231 |
438,261 |
|
Amortization |
3,937 |
1,353 |
3,920 |
1,212 |
3,351 |
13,773 |
|
Goodwill |
2,867 |
12,030 |
- |
8,223 |
16,742 |
39,862 |
|
Expenditures on property, plant |
3,308 |
913 |
1,198 |
404 |
1,032 |
6,855 |
|
2007 |
|||||
|
|
SunOpta |
Opta |
SunOpta |
Corporate |
|
|
|
Foods |
Minerals |
BioProcess |
Services |
Consolidated |
|
|
$ |
$ |
$ |
$ |
$ |
|
External revenues by market |
|
|
|
|
|
|
United States |
448,292 |
53,638 |
1,077 |
- |
503,007 |
|
Canada |
236,582 |
18,283 |
- |
- |
254,865 |
|
Europe and Other |
40,416 |
3,444 |
762 |
- |
44,622 |
|
Total revenues from external customers |
725,290 |
75,365 |
1,839 |
- |
802,494 |
|
|
|
|
|
|
|
|
Segment earnings (loss) before the following: |
12,348 |
6,668 |
(5,985) |
(7,369) |
5,662 |
|
|
|
|
|
|
|
|
Other expense, net |
|
|
|
|
1,187 |
|
Dilution gain |
|
|
|
|
693 |
|
Goodwill impairment |
|
|
|
|
996 |
|
Interest expense, net |
|
|
|
|
8,823 |
|
Recovery of income taxes |
|
|
|
|
(6,101) |
|
Earnings for the year |
|
|
|
|
1,450 |
|
|
|
|
|
|
|
|
Identifiable assets |
420,845 |
97,782 |
28,824 |
21,989 |
569,440 |
|
Amortization |
10,603 |
3,395 |
124 |
936 |
15,058 |
|
Goodwill |
44,897 |
10,606 |
- |
- |
55,503 |
|
Expenditures on property, |
26,301 |
1,834 |
249 |
1,302 |
29,686 |
The goodwill impairment of $996 related to the Fruit Group segment.
- F46 -
| SunOpta Inc. |
| Notes to Consolidated Financial Statements |
| For the years ended December 31, 2009, 2008 and 2007 |
| (Expressed in thousands of U.S. dollars, except per share amounts) |
17. Segmented information continued
SunOpta Foods has the following segmented reporting:
|
2007 |
||||||
|
|
Grains |
|
|
|
|
|
|
|
and Foods |
Ingredients |
Fruit |
|
Distribution |
Food |
|
|
Group |
Group |
Group |
IST |
Group |
Group |
|
|
$ |
$ |
$ |
$ |
$ |
$ |
|
External revenues by market: |
|
|
|
|
|
|
|
United States |
205,220 |
64,343 |
127,328 |
50,387 |
1,014 |
448,292 |
|
Canada |
8,141 |
2,984 |
5,140 |
1,061 |
219,256 |
236,582 |
|
Europe and Other |
34,660 |
2,988 |
1,177 |
1,591 |
- |
40,416 |
|
Total revenues from external customers |
248,021 |
70,315 |
133,645 |
53,039 |
220,270 |
725,290 |
|
|
|
|
|
|
|
|
|
Segment earnings (loss) before |
|
|
|
|
|
|
|
|
|
|
|
|
|
|
|
Identifiable assets |
123,919 |
44,824 |
123,344 |
23,612 |
105,146 |
420,845 |
|
Amortization |
3,821 |
1,297 |
2,360 |
229 |
2,896 |
10,603 |
|
Goodwill |
2,590 |
12,030 |
8,288 |
1,918 |
20,071 |
44,897 |
|
Expenditures on property, plant |
5,788 |
1,022 |
13,550 |
102 |
5,839 |
26,301 |
Geographic segments
|
2009 |
||||
|
|
United |
|
Europe and |
|
|
|
States |
Canada |
Other |
Total |
|
|
$ |
$ |
$ |
$ |
|
|
|
|
|
|
|
Property, plant and equipment |
84,416 |
20,242 |
8,587 |
113,245 |
|
|
|
|
|
|
|
Goodwill |
20,821 |
19,907 |
8,989 |
49,717 |
|
|
|
|
|
|
|
Total assets |
173,690 |
204,132 |
173,468 |
551,290 |
|
2008 |
||||
|
|
United |
|
Europe and |
|
|
|
States |
Canada |
Other |
Total |
|
|
$ |
$ |
$ |
$ |
|
|
|
|
|
|
|
Property, plant and equipment |
86,523 |
19,098 |
5,020 |
110,641 |
|
|
|
|
|
|
|
Goodwill |
21,294 |
20,290 |
12,438 |
54,022 |
|
|
|
|
|
|
|
Total assets |
348,346 |
132,498 |
100,203 |
581,047 |
Other includes operations in Mexico as part of the Fruit Group, operations in Slovakia as part of Opta Minerals and Europe as part of the International Sourcing and Trading Group.
- F47 -
| SunOpta Inc. |
| Notes to Consolidated Financial Statements |
| For the years ended December 31, 2009, 2008 and 2007 |
| (Expressed in thousands of U.S. dollars, except per share amounts) |
17. Segmented information continued
The Company had no customers in 2009, 2008 or 2007 for which sales exceeded 10% of the Company’s total revenues.
18. Other expenses, net
|
|
2009 |
2008 |
2007 |
|
|
$ |
$ |
$ |
|
Facility rationalizations (a) |
1,530 |
- |
551 |
|
Lawsuits (b) |
1,425 |
- |
501 |
|
Abener arbitration (c) |
- |
1,729 |
- |
|
Insurance proceeds (d) |
- |
(784) |
- |
|
Other |
(368) |
58 |
135 |
|
|
2,587 |
1,003 |
1,187 |
(a) Facility rationalizations
During the fourth quarter of 2009, the Board of Directors of the Company approved the decision to permanently close a distribution center in Toronto, Canada, consolidate manufacturing facilities from British Columbia, Canada and Omak, Washington, and cease processing of fresh fruit at a leased facility in Buena Park, California.
The Company plans to close a distribution center in Toronto, Canada in the first quarter of 2010, and expects to incur additional severance, lease cancellation and other costs in 2010. In addition, the consolidation of the British Columbia manufacturing facility will occur by the end of June 2010, and additional severance, lease termination and property, plant and equipment dismantling, moving and installation costs are expected to be incurred. Future costs related to involuntary severance, lease termination costs and other associated costs will be recorded at the communication date with employees, the cease-use date for leased facilities and as incurred for other associated costs. The Company has ceased production plans for fresh fruit processing at one of its leased California facilities.
A summary of the expected total costs, and costs incurred to date with respect to each of the rationalizations, is included below:
|
|
Costs |
Costs to be |
Total Rationalization |
|
|
Recognized in 2009 |
Recognized in 2010 |
Costs |
|
|
$ |
$ |
$ |
|
Toronto, Canada closure |
348 |
300 |
648 |
|
British Columbia, Canada consolidation |
287 |
1,200 |
1,487 |
|
California, cease fresh processing |
1,016 |
- |
1,016 |
|
|
1,651 |
1,500 |
3,151 |
As a result of the rationalization efforts noted above, the Company tested the related property, plant and equipment for impairment. After determining that the undiscounted cash flows were lower than the carrying value of the property, plant and equipment, the Company used a discounted cash flow approach to determine that an impairment charge of $990 was required to reduce the carrying value of the property, plant and equipment to its net realizable value. There were no impairment charges in the years ending December 31, 2008 or December 31, 2007. Of the total non-cash impairment charge of $990, $771 relates to the Fruit Group and $219 relates to the Distribution Group. In addition to the property, plant and equipment impairment charge, a $129 impairment charge was recorded against intangible assets in the Distribution Group where the carrying value exceeded the fair value, as calculated on an undiscounted basis. Total closure costs recognized includes $121 in write-off of inventory packaging, which has been recognized in cost of sales on the consolidated statement of earnings (loss). Of the $1,651 in total costs recognized, $348 relates to the Distribution Group and $1,303 relates to the Fruit Group.
- F48 -
| SunOpta Inc. |
| Notes to Consolidated Financial Statements |
| For the years ended December 31, 2009, 2008 and 2007 |
| (Expressed in thousands of U.S. dollars, except per share amounts) |
18. Other expenses, net, continued
The decision to cease production of fresh fruit processing in California resulted in a permanent reduction in salaried and hourly employees. Total severance charges related to both facilities was $411, which was paid in full at December 31, 2009 to the employees who were involuntarily terminated. These cash severance charges related to the Fruit Group.
As at December 31, 2009, there are no accruals related to the facility rationalizations.
During 2007, the Company closed two distribution warehouses within the Distribution Group in Canada, and as a result, incurred $551 in costs related to severance, closure costs and the disposal of certain property, plant and equipment.
(b) Lawsuit
Subsequent to year-end, the Company settled the Vargas class action against the Company which alleged violations of California’s labour laws (note 16(d)). The settlement was for $1,200 and is pending approval from the courts. As the amount of the settlement is likely and determinable, the Company recorded the settlement amount in other expense for the year ended December 31, 2009. In addition, subsequent to year-end, the Company settled a claim related to commissions with a former business partner for $225. The amount was paid subsequent to year-end.
The Company previously had a receivable for legal fees relating to a judgment awarded in favour of the Company in 2004. As a result of a court ruling in 2007, the Company recorded a charge of $501 for the remaining uncovered legal fees.
(c) Abener arbitration
In December of 2008, an arbitrator rendered a decision in favour of Abener’s claim against the Company, and awarded Abener €1,329 (U.S. - $1,903) in damages. As at December 31, 2009, the $1,903 liability was recorded in accounts payable and accrued liabilities on the consolidated balance sheet. Subsequent to year-end, this liability was settled in cash.
(d) Insurance proceeds
In 2008, the Company received total cash proceeds of $1,947, which was $784 above the carrying cost of assets destroyed in fires at facilities in the Grains and Foods Group. As a result, the gain on disposal of assets has been recorded as other income on the consolidated statements of operations.
19. Fair values
Effective January 1, 2008, the Company adopted the provisions of ASC 820-10-55 (formerly FASB FSP 157-2/SFAS 157, “Effective Date of FASB Statement No. 157”) applicable to financial assets and liabilities and to certain non-financial assets and liabilities that are measured at fair value on a recurring basis. Additionally, the Company applies the provisions of this standard to financial and non-financial assets and liabilities. This standard defines fair value, establishes a consistent framework for measuring fair value and expands disclosure requirements about fair value measurements. In addition, this standard requires the Company to maximize the use of observable inputs and minimize the use of unobservable inputs when measuring fair value.
- F49 -
| SunOpta Inc. |
| Notes to Consolidated Financial Statements |
| For the years ended December 31, 2009, 2008 and 2007 |
| (Expressed in thousands of U.S. dollars, except per share amounts) |
19. Fair values continued
This standard also provides a hierarchy of valuation techniques based on whether the inputs to those valuation techniques are observable or unobservable. Observable inputs reflect market data obtained from independent sources, while unobservable inputs reflect the Company’s assumptions with respect to how market participants would price an asset or liability. These two inputs used to measure fair value fall into the following three different levels of the fair value hierarchy:
- Level 1: Quoted prices (unadjusted) for identical assets or liabilities in active markets that are observable
- Level 2: Quoted prices for similar assets or liabilities in active markets; quoted prices for identical or similar assets or liabilities that are non-active; inputs other than quoted prices that are observable and derived from or are corroborated by observable market data
- Level 3: Valuations derived from valuation techniques in which one or more significant inputs are unobservable due to little or no market activity
This hierarchy requires the use of observable market data when available.
The following table presents for each of the fair value hierarchies, the assets and liabilities that are measured at fair value on a recurring basis as of December 31, 2009:
|
|
Fair Value |
|
|
|
|
Asset |
|
|
|
|
(Liability) |
Level 1 |
Level 2 |
|
|
$ |
$ |
$ |
|
(a) Commodity futures and forward contracts |
|
|
|
|
Unrealized short-term derivative gain |
1,668 |
(370) |
2,038 |
|
Unrealized long-term derivative gain |
155 |
- |
155 |
|
Unrealized short-term derivative loss |
(1,566) |
- |
(1,566) |
|
Unrealized long-term derivative loss |
(6) |
- |
(6) |
|
(b) Inventories carried at market |
8,577 |
- |
8,577 |
|
(c) Interest rate swap |
(1,387) |
- |
(1,387) |
|
(d) Forward foreign currency contracts |
392 |
- |
392 |
| (a) |
On the consolidated balance sheet, unrealized short-term derivative gain is included in prepaid expenses and other current assets, unrealized long-term derivative gain is included in other assets, unrealized short-term derivative loss is included in other current liabilities and unrealized long-term derivative loss is included in long-term liabilities. |
| (b) |
Inventories carried at market are included in inventories on the consolidated balance sheet. |
| (c) |
The interest rate swap is included in long-term liabilities on the consolidated balance sheet. |
| (d) |
The forward foreign currency contracts are included in accounts payable and accrued liabilities on the consolidated balance sheet. |
(a)
Commodity futures and forward contracts
The Company’s
derivative contracts that are measured at fair value include exchange-traded
commodity futures and forward commodity purchase and sale contracts.
Exchange-traded futures are valued based on unadjusted quotes for identical
assets priced in active markets and are classified as level 1. Fair value for
forward commodity purchase and sale contracts is estimated based on
exchange-quoted prices adjusted for differences in local markets. Based on
historical experience with the Company’s suppliers and customers, the Company’s
own credit risk, and the Company’s knowledge of current market conditions, the
Company does not view non-performance risk to be a significant input to fair
value for the majority of its forward commodity purchase and sale contracts.
Local market adjustments use observable inputs or market transactions for
identical assets or liabilities, and, as a result, are classified as level 2.
- F50 -
| SunOpta Inc. |
| Notes to Consolidated Financial Statements |
| For the years ended December 31, 2009, 2008 and 2007 |
| (Expressed in thousands of U.S. dollars, except per share amounts) |
19. Fair values continued
These exchange-traded commodity futures and forward commodity purchase and sale contracts are used as part of the Company’s risk management strategy, and represent economic hedges to limit risk related to fluctuations in the price of certain commodity grains. These derivative instruments are not designated as hedging instruments. A gain of $3,445 for the year ended December 31, 2009 has been recorded in cost of goods sold on the consolidated statements of operations related to changes in the fair value of these derivatives.
At December 31, 2009, the notional amounts of open commodity futures and forward purchase and sale contracts were as follows:
|
|
|
Number of bushels |
|
(in 000’s of bushels) |
|
Purchase (Sale) |
|
|
Corn |
Soybeans |
|
Forward commodity purchase contracts |
1,166 |
1,410 |
|
Forward commodity sale contracts |
(1,098) |
(827) |
|
Commodity futures contracts |
(435) |
(1,139) |
(b)
Inventories carried at market
Grains inventory carried
at fair value is determined using quoted market prices from the Chicago Board of
Trade (“CBoT”). Estimated fair market values for grains inventory quantities at
period end are valued using the quoted price on the CBoT, adjusted for
differences in local markets, and broker or dealer quotes. These assets are
placed in level 2 of the fair value hierarchy, as there are observable quoted
prices for similar assets in active markets. Gains and losses on commodity
grains inventory are included in cost of sales on the consolidated statements of
operations. At December 31, 2009, the Company had 425 and 577 bushels of
commodity corn and soybeans, respectively, in inventories carried at market.
(c)
Interest rate swap
Opta Minerals entered into an
interest rate swap to minimize its exposure to interest rate risk. A notional
amount of Cdn $17,200 (U.S. - $16,365) of floating rate debt was effectively
converted to fixed rate debt at a rate of 5.25% for the period August 2008 to
August 2012. At each period end, management calculates the mark-to-market fair
value using a valuation technique using quoted observable prices for similar
instruments as the primary input. Based on this valuation, the previously
recorded fair value is adjusted to the current mark-to-market position. The
mark-to-market gain or loss is placed in level 2 of the fair value hierarchy.
The interest rate swap is designated as a cash flow hedge for accounting
purposes, and accordingly, gains and losses on changes in the fair value of the
interest rate swap are included in other comprehensive income on the
consolidated statements of operations. A gain of $415 (net of income taxes of
$182) for the year ended December 31, 2009 has been recorded in other
comprehensive income due to the change in fair value for this derivative.
(d)
Foreign forward currency contracts
As part of its risk
management strategy, the Company enters into forward foreign exchange contracts
to reduce its exposure to fluctuations in foreign currency exchange rates. For
any open forward foreign exchange contracts at period end, the contract rate is
compared to the forward rate, and a gain or loss is recorded. These contracts
are placed in level 2 of the fair value hierarchy, as there are quoted prices in
active markets to observe the fair value determination. These forward foreign
exchange contracts represent economic hedges and are not designated as hedging
instruments. At December 31, 2009 the Company had open forward foreign exchange
contracts with a notional value of €12,968 that resulted in an unrealized gain
of $392 which is included in foreign exchange loss (gain) on the consolidated
statements of operations for the year ended December 31, 2009.
- F51 -
| SunOpta Inc. |
| Notes to Consolidated Financial Statements |
| For the years ended December 31, 2009, 2008 and 2007 |
| (Expressed in thousands of U.S. dollars, except per share amounts) |
20. Dilution gain
On July 30, 2007, Opta Minerals, the Company’s subsidiary, acquired 100% of the outstanding shares of Newco a.s. As part of the consideration for the purchase, Opta Minerals issued one million common shares. As a result of the issuance of common shares, the Company recorded a non-taxable dilution gain of $693 and the percentage of common shares of Opta Minerals held by the Company was reduced from approximately 70.4% to 66.6%.
21. Cash and cash equivalents
Included in cash and cash equivalents is $18,954 (2008 - $22,077) of cash relating to SunOpta BioProcess that was raised as a result of the preferred share issuance (note 10). These funds are specific to SunOpta BioProcess and can only be used by SunOpta BioProcess, who will use these funds for working capital purposes, continued development of biomass conversion technologies and to build and operate commercial-scale facilities for the conversion of cellulosic biomass to ethanol. The cash balance on hand is funding losses since the preferred share issuance, as well as potential future losses of BioProcess. Also included in cash and cash equivalents are funds of $781 (2008 - $1,377) that are only available for use by Opta Minerals.
These funds of $19,735 (2008 - $23,454) are consolidated for financial statement reporting purposes due to the Company’s ownership; however, these funds cannot be utilized by the Company for general corporate purposes and are maintained in separate bank accounts of the legal entities.
At December 31, 2009 and 2008 there were no cash equivalents on the consolidated balance sheets.
22. Variable interest entities
(a)
The Company, through its Grains and Foods Group, holds an investment in a joint venture in the United States related to processing marketing, supply and sale of vegetable and other specialty oils. The Company has the option of purchasing all of the output from the joint venture, and selling the product through existing sales and marketing channels. The Company holds 50% of the voting common shares and consolidates its variable interest in the joint venture, as it has been determined to be the primary beneficiary.
The liabilities of the variable interest entity (“VIE”) consolidated by the Company represent claims against the specific assets of the VIE, and not additional claims on the Company’s general assets. There is no recourse available to the creditors of the VIE against the Company. The impact of consolidating the investment in the joint venture on the consolidated balance sheet is as follows:
|
|
December 31, 2009 |
December 31, 2008 |
|
|
$ |
$ |
|
Current assets |
13 |
7 |
|
Property, plant and equipment |
740 |
498 |
|
Current liabilities |
169 |
30 |
|
Non-controlling interest |
112 |
243 |
|
Net investment by the Company |
(472) |
(232) |
(b) TOC, a wholly-owned subsidiary of the Company, holds an investment in a joint venture in Ethiopia related to hulling of organic sesame seeds. TOC purchases all of the output from the joint venture, and sells the product through its existing sales and marketing channels. TOC holds 35% of the voting common shares and consolidates its variable interest in the joint venture, as it has been determined to be the primary beneficiary.
- F52 -
| SunOpta Inc. |
| Notes to Consolidated Financial Statements |
| For the years ended December 31, 2009, 2008 and 2007 |
| (Expressed in thousands of U.S. dollars, except per share amounts) |
22. Variable interest entities continued
The liabilities of the VIE consolidated by the Company represent claims against the specific assets of the VIE, and not additional claims on the Company’s general assets. There is no recourse available to the creditors of the VIE against the Company. The impact of consolidating the investment in the joint venture on the consolidated balance sheet is as follows:
|
|
December 31, 2009 |
|
|
$ |
|
Current assets |
253 |
|
Property, plant and equipment |
2,762 |
|
Current liabilities |
1,097 |
|
Long-term debt |
380 |
|
Long-term liabilities |
303 |
|
Non-controlling interest |
658 |
|
Net investment by the Company |
(577) |
23. Employee future benefits
(a) Global Trading Inc. Defined Benefit Plan
Through its acquisition of Congeladora del Rio S.A. de C.V. and Global Trading Inc., the Company assumed a defined benefit pension plan. Funding for the plan is based on a function of compensation levels, benefit formulas and years of service. The measurement date used for the accounting valuation for the defined benefit plan was December 31, 2009. Information about the defined benefit plan for the years ended December 31, 2009 and 2008 is as follows:
|
|
2009 |
2008 |
|
|
$ |
$ |
|
Pension expense (income) |
|
|
|
Current service cost |
4 |
30 |
|
Interest cost |
35 |
48 |
|
Expected return on plan assets |
(23) |
(44) |
|
Net pension expense (income) |
16 |
34 |
Information with respect to the assets and liabilities in the defined benefit plan is as follows:
|
|
2009 |
2008 |
|
|
$ |
$ |
|
Pension assets |
|
|
|
Fair value of plan assets, beginning of year |
781 |
2,450 |
|
Actual return on plan assets |
23 |
(411) |
|
Benefits paid during the year |
- |
(1,258) |
|
Fair value of plan assets, end of year |
804 |
781 |
- F53 -
| SunOpta Inc. |
| Notes to Consolidated Financial Statements |
| For the years ended December 31, 2009, 2008 and 2007 |
| (Expressed in thousands of U.S. dollars, except per share amounts) |
23. Employee future benefits continued
|
|
2009 |
2008 |
|
|
$ |
$ |
|
Pension liability |
|
|
|
Accrued benefit obligation, beginning of year |
747 |
1,829 |
|
Current service cost |
4 |
30 |
|
Interest cost |
35 |
48 |
|
Actuarial gain |
37 |
98 |
|
Benefits paid during the year |
- |
(1,258) |
|
Accrued benefit obligation, end of year |
823 |
747 |
A reconciliation of the net pension (liability) asset is as follows:
|
|
2009 |
2008 |
|
|
$ |
$ |
|
Fair value of plan assets, end of year |
804 |
781 |
|
Accrued benefit obligation, end of year |
(823) |
(747) |
|
Net pension (liability) asset, end of year |
(19) |
34 |
The net pension (liability) in 2009 is included in accounts payable and accrued liabilities on the consolidated balance sheet. The net pension asset in 2008 is included in other assets on the consolidated balance sheet.
At December 31, 2009 all funds were invested in cash and money market securities. Asset allocation is adjusted based on the expected life of the plan and the expected retirement age of the 5 plan participants. Information with respect to the amounts and types of securities that are in the plan is as follows:
|
|
Amount |
Percentage of total plan |
|
|
$ |
% |
|
Equity securities |
- |
0% |
|
Debt securities |
- |
0% |
|
Cash and money market |
804 |
100% |
|
|
804 |
100% |
The weighted average actuarial assumptions in measuring the accrued benefit obligation for the years ended December 31, 2009 and 2008 is as follows:
|
|
2009 |
2008 |
|
Projected benefit obligation |
|
|
|
Discount rate |
4.7% |
4.6% |
|
Expected long-term return on plan assets |
3.0% |
3.0% |
|
Rate of compensation increase |
0% |
0% |
The following table shows the estimated future benefit payments expected to be paid from the plan:
|
|
$ |
|
2010 |
823 |
|
2011 |
- |
|
2012 |
- |
|
2013 |
- |
|
2014 |
- |
|
2015-2020 |
- |
- F54 -
| SunOpta Inc. |
| Notes to Consolidated Financial Statements |
| For the years ended December 31, 2009, 2008 and 2007 |
| (Expressed in thousands of U.S. dollars, except per share amounts) |
23. Employee future benefits continued
(b) TOC Defined Benefit Plan
Through its acquisition of TOC (note 2), the Company assumed a defined benefit pension plan. Funding for the plan is based on a function of compensation levels, benefit formulas and years of service. The measurement date used for the accounting valuation for the defined benefit plan was December 31, 2009. Information about the defined benefit plan for the year ended December 31, 2009 and the period from its April 2, 2008 acquisition through December 31, 2008 is as follows:
|
|
2009 |
2008 |
|
|
$ |
$ |
|
Pension expense (income) |
|
|
|
Current service cost |
205 |
193 |
|
Interest cost |
32 |
19 |
|
Expected return on plan assets |
(28) |
(16) |
|
Net pension expense |
209 |
196 |
Information with respect to the assets and liabilities in the defined benefit plan is as follows:
|
|
2009 |
2008 |
|
|
$ |
$ |
|
Pension assets |
|
|
|
Fair value of plan assets, beginning of period |
324 |
290 |
|
Actual return on plan assets |
212 |
(81) |
|
Contributions received |
274 |
148 |
|
Impact of foreign exchange |
23 |
(33) |
|
Fair value of plan assets, end of year |
833 |
324 |
|
|
2009 |
2008 |
|
|
$ |
$ |
|
Pension liability |
|
|
|
Accrued benefit obligation, beginning of period |
513 |
506 |
|
Current service cost |
205 |
193 |
|
Interest cost |
32 |
19 |
|
Actuarial loss (gain) |
223 |
(147) |
|
Employee contributions |
103 |
- |
|
Impact of foreign exchange |
29 |
(58) |
|
Accrued benefit obligation, end of year |
1,105 |
513 |
A reconciliation of the net pension liability is as follows:
|
|
2009 |
2008 |
|
|
$ |
$ |
|
Fair value of plan assets, end of year |
833 |
324 |
|
Accrued benefit obligation, end of year |
(1,105) |
(513) |
|
Net pension liability, end of year |
(272) |
(189) |
- F55 -
| SunOpta Inc. |
| Notes to Consolidated Financial Statements |
| For the years ended December 31, 2009, 2008 and 2007 |
| (Expressed in thousands of U.S. dollars, except per share amounts) |
23. Employee future benefits continued
The pension liability is included in long-term liabilities on the consolidated balance sheets.
Pension fund assets are invested primarily in money market securities, equity or debt securities and is adjusted based on the expected life of the plan and the expected retirement age of the plan participants. Information with respect to the amounts and types of securities that are in the plan is as follows:
|
|
Amount |
Percentage of total plan |
|
|
$ |
% |
|
Equity securities |
- |
- |
|
Debt securities |
- |
- |
|
Other |
833 |
100% |
|
|
833 |
100% |
The weighted average actuarial assumptions in measuring the accrued benefit obligation for the year ended December 31, 2009 and for the period from the date of acquisition to December 31, 2008 is as follows:
|
|
2009 |
2008 |
|
Projected benefit obligation |
|
|
|
Discount rate |
5.0% |
5.6% |
|
Expected long-term return on plan assets |
5.0% |
5.6% |
|
Rate of compensation increase |
2.0% |
2.0% |
The following table shows the estimated future benefit payments expected to be paid from the plan:
|
|
$ |
|
2010 |
- |
|
2011 |
- |
|
2012 |
- |
|
2013 |
- |
|
2014 |
- |
|
2015-2019 |
6 |
The expected contribution to be made by TOC to the defined benefit plan for the year ended December 31, 2010 is $203.
- F56 -
| SunOpta Inc. |
| Notes to Consolidated Financial Statements |
| For the years ended December 31, 2009, 2008 and 2007 |
| (Expressed in thousands of U.S. dollars, except per share amounts) |
Supplemental financial information (unaudited)
Summarized below is the Consolidated Statement of Operations for the quarters ended December 31, 2009, September 30, 2009, June 30, 2009 and March 31, 2009, as well as the 2008 quarterly comparatives.
|
Quarter ended December 31, |
||
|
|
2009 |
2008 |
|
|
$ |
$ |
|
|
|
|
|
Revenues |
245,521 |
245,037 |
|
Cost of goods sold |
206,581 |
216,319 |
|
Gross profit |
38,940 |
28,718 |
|
|
|
|
|
Warehousing and distribution expenses |
5,165 |
4,858 |
|
Selling, general and administrative expenses |
29,910 |
25,852 |
|
Intangible asset amortization |
1,347 |
1,627 |
|
Other expense, net |
2,935 |
1,003 |
|
Goodwill impairment |
500 |
10,154 |
|
Foreign exchange (gain) loss |
(460) |
501 |
|
|
|
|
|
Loss before the following |
(457) |
(15,277) |
|
|
|
|
|
Interest expense, net |
3,762 |
3,797 |
|
|
|
|
|
Loss before income taxes |
(4,219) |
(19,074) |
|
|
|
|
|
Recovery of income taxes |
(1,726) |
(1,375) |
|
|
|
|
|
Loss for the period |
(2,493) |
(17,699) |
|
|
|
|
|
Loss for the period attributable to non-controlling |
|
|
|
|
|
|
|
Loss for the period attributable to SunOpta Inc. |
(2,214) |
(17,045) |
|
|
|
|
|
Loss per share for the period |
|
|
|
Basic |
(0.03) |
(0.27) |
|
Diluted |
(0.03) |
(0.27) |
- F57 -
| SunOpta Inc. |
| Notes to Consolidated Financial Statements |
| For the years ended December 31, 2009, 2008 and 2007 |
| (Expressed in thousands of U.S. dollars, except per share amounts) |
Supplemental financial information (unaudited) continued
|
Quarter ended September 30, |
||
|
|
2009 |
2008 |
|
|
$ |
$ |
|
|
|
|
|
|
|
|
|
Revenues |
253,812 |
287,747 |
|
Cost of goods sold |
215,610 |
246,439 |
|
Gross profit |
38,202 |
41,308 |
|
|
|
|
|
Warehousing and distribution expenses |
4,736 |
5,288 |
|
Selling, general and administrative expenses |
27,434 |
29,445 |
|
Intangible asset amortization |
1,567 |
1,486 |
|
Other income, net |
(271) |
- |
|
Goodwill impairment |
8,341 |
- |
|
Foreign exchange gain |
(863) |
(4,345) |
|
|
|
|
|
(Loss) earnings before the following |
(2,742) |
9,434 |
|
|
|
|
|
Interest expense, net |
3,925 |
3,983 |
|
|
|
|
|
(Loss) earnings before income taxes |
(6,667) |
5,451 |
|
|
|
|
|
Provision for income taxes |
197 |
1,043 |
|
|
|
|
|
(Loss) earnings for the period |
(6,864) |
4,408 |
|
|
|
|
|
(Loss) earnings for the period attributable to non-controlling
|
|
|
|
|
|
|
|
(Loss) earnings for the period attributable to SunOpta Inc. |
(4,672) |
3,904 |
|
|
|
|
|
(Loss) earnings per share for the period |
|
|
|
Basic |
(0.07) |
0.06 |
|
Diluted |
(0.07) |
0.06 |
- F58 -
| SunOpta Inc. |
| Notes to Consolidated Financial Statements |
| For the years ended December 31, 2009, 2008 and 2007 |
| (Expressed in thousands of U.S. dollars, except per share amounts) |
Supplemental financial information (unaudited) continued
|
Quarter ended June 30, |
||
|
|
2009 |
2008 |
|
|
$ |
$ |
|
|
|
|
|
Revenues |
257,725 |
291,945 |
|
Cost of goods sold |
219,644 |
246,077 |
|
Gross profit |
38,081 |
45,868 |
|
|
|
|
|
Warehousing and distribution expenses |
4,494 |
5,448 |
|
Selling, general and administrative expenses |
27,279 |
34,700 |
|
Intangible asset amortization |
1,332 |
1,508 |
|
Other expense, net |
109 |
- |
|
Foreign exchange gain |
(982) |
(1,279) |
|
|
|
|
|
Earnings before the following |
5,849 |
5,491 |
|
|
|
|
|
Interest expense, net |
3,470 |
3,601 |
|
|
|
|
|
Earnings before income taxes |
2,379 |
1,890 |
|
|
|
|
|
Provision for income taxes |
833 |
473 |
|
|
|
|
|
Earnings for the period |
1,546 |
1,417 |
|
|
|
|
|
(Loss) earnings for the period attributable to non- |
|
|
|
|
|
|
|
Earnings for the period attributable to SunOpta Inc. |
1,780 |
719 |
|
|
|
|
|
Earnings per share for the period |
|
|
|
Basic |
0.03 |
0.01 |
|
Diluted |
0.03 |
0.01 |
- F59 -
| SunOpta Inc. |
| Notes to Consolidated Financial Statements |
| For the years ended December 31, 2009, 2008 and 2007 |
| (Expressed in thousands of U.S. dollars, except per share amounts) |
Supplemental financial information (unaudited) continued
|
Quarter ended March 31, |
||
|
|
2009 |
2008 |
|
|
$ |
$ |
|
|
|
|
|
Revenues |
232,074 |
230,444 |
|
Cost of goods sold |
198,427 |
190,243 |
|
Gross profit |
33,647 |
40,201 |
|
|
|
|
|
Warehousing and distribution expenses |
4,461 |
5,446 |
|
Selling, general and administrative expenses |
26,852 |
27,811 |
|
Intangible asset amortization |
1,431 |
1,258 |
|
Other expense, net |
(186) |
- |
|
Foreign exchange loss |
1,263 |
288 |
|
|
|
|
|
(Loss) earnings before the following |
(174) |
5,398 |
|
|
|
|
|
Interest expense, net |
2,871 |
2,900 |
|
|
|
|
|
(Loss) earnings before income taxes |
(3,045) |
2,498 |
|
|
|
|
|
(Recovery of) provision for income taxes |
(1,066) |
649 |
|
|
|
|
|
(Loss) earnings for the period |
(1,979) |
1,849 |
|
|
|
|
|
(Loss) earnings for the period attributable to non- |
|
|
|
|
|
|
|
(Loss) earnings for the period attributable to SunOpta Inc. |
(1,657) |
1,486 |
|
|
|
|
|
(Loss) earnings per share for the period |
|
|
|
Basic |
(0.03) |
0.02 |
|
Diluted |
(0.03) |
0.02 |
- F60 -
| SunOpta Inc. |
| Notes to Consolidated Financial Statements |
| For the years ended December 31, 2009, 2008 and 2007 |
| (Expressed in thousands of U.S. dollars, except per share amounts) |
PART I - FINANCIAL INFORMATION
SIGNATURES
Pursuant to the requirements of the Securities Exchange Act of 1934, the registrant has duly caused this report to be signed on its behalf by the undersigned hereunto duly authorized.
| SUNOPTA INC. | |
|
/s/ Eric Davis | |
| Date: March 10, 2010 | |
| SunOpta Inc. | |
| By Eric Davis | |
| Vice President and Chief Financial Officer |
- F61 -